0001296445ora:PerformanceStockUnitsPSUMemberora:The2018IncentiveCompensationPlanMember2022-01-012022-12-31
Table of Contents
UNITED STATES SECURITIES AND EXCHANGE COMMISSION
Washington,D.C. 20549
Form10-K
☑ | ANNUAL REPORTAnnual Report PURSUANT TO SECTION 13 OR 15(d) OF THE SECURITIES EXCHANGE ACT OF 1934
|
| For the fiscal year ended December 31, 2020 |
OrFor the fiscal year ended December 31, 2023
or
☐ | TRANSITION REPORT PURSUANT TO SECTION 13 OR 15(d) OF THE SECURITIES EXCHANGE ACT OF 1934 |
Commission file number: 001-32347
ORMAT TECHNOLOGIES, INC.
(Exact name of registrant as specified in its charter)
Delaware | 88-0326081 |
(State or other jurisdiction of incorporation or organization) | (I.R.S. Employer Identification Number) |
6140 Plumas Street, Reno, Nevada | 89519-6075 |
(Address of principal executive offices) | (Zip Code) |
(775)356-9029
(Registrant’sRegistrant’s telephone number, including area code)
Securities Registered Pursuant to Section12(b) of the Act:
Title of Each Class | Trading Symbol(s) | Name of Each Exchange on Which Registered |
Common Stock $0.001 Par Value | ORA | New York Stock Exchange |
Securities Registered Pursuant to Section12(g) of the Act:
None
Indicate by check mark if the registrant is a well-known seasoned issuer, as defined in Rule 405 of the Securities Act. Yes ☑ No ☐
Indicate by check mark if the registrant is not required to file reports pursuant to Section 13 or Section 15(d) of the Exchange Act. Yes ☐ No ☑
Indicate by check mark whether the registrant (1) has filed all reports required to be filed by Section 13 or 15(d) of the Securities Exchange Act of 1934 during the preceding 12 months (or for such shorter period that the registrant was required to file such reports), and (2) has been subject to such filing requirements for the past 90 days. Yes ☑ No ☐
Indicate by check mark whether the registrant has submitted electronically every Interactive Data File required to be submitted pursuant to Rule 405 of Regulation S-T (§ 232.405 of this chapter) during the preceding 12 months (or for such shorter period that the registrant was required to submit such files). Yes ☑ No ☐
Indicate by check mark whether the registrant is a large accelerated filer, an accelerated filer, a non-accelerated filer, a smaller reporting company, or an emerging growth company. See the definitions of “large accelerated filer,” “accelerated filer,” “smaller reporting company,” and “emerging growth company” in Rule 12b-2 of the Exchange Act. (Check one):
Large accelerated filer ☑ | Accelerated filer ☐ | Non-accelerated filer ☐ | Smaller reporting company ☐ | Emerging growth company ☐ |
If an emerging growth company, indicate by check mark if the registrant has elected not to use the extended transition period for complying with any new or revised financial accounting standards provided pursuant to Section 13(a) of the Exchange Act. ☐
Indicate by check mark whether the registrant has filed a report on and attestation to its management’s assessment of the effectiveness of its internal control over financial reporting under Section 404(b) of the Sarbanes-Oxley Act (15 U.S.C. 7262(b)) by the registered public accounting firm that prepared or issued its audit report. ☑
If securities are registered pursuant to Section 12(b) of the Act, indicate by check mark whether the financial statements of the registrant included in the filing reflect the correction of an error to previously issued financial statements. ☐
Indicate by check mark whether any of those error corrections are restatements that required a recovery analysis of incentive-based compensation received by any of the registrant’s executive officers during the relevant recovery period pursuant to §240.10D-1(b). ☐
Indicate by check mark whether the registrant is a shell company (as defined in Rule 12b-2 of the Exchange Act). Yes ☐ No ☑
As of June 30, 20202023 the aggregate market value of the registrant’s common stock held by non-affiliates was $2,544,589,505.$4,311,389,318. As of February 24, 2021,20, 2024, the number of outstanding shares of common stock, par value $0.001 per share was 55,983,259.60,358,887.
Portions of the registrant's definitive proxy statement for its 20212023 Annual Meeting of Stockholders are incorporated by reference into Part III of this Form 10-K..10-K.
ORMAT TECHNOLOGIES, INC.
FORM 10-K FOR THE YEAR ENDED DECEMBER 31, 20202023
TABLE OF CONTENTS
Glossary of Terms To be updated close to filing
Unless the context otherwise requires, all references in this annual reportAnnual Report on Form 10-K (this “Annual Report”) to “Ormat”, “the Company”, “we”, “us”, “our company”, “Ormat Technologies”, or “our” refer to Ormat Technologies, Inc. and its consolidated subsidiaries. A glossary of certain terms and abbreviations used in this annual report appears at the beginning of this report.Annual Report. When the following terms and abbreviations appear in the text of this report, they have the meanings indicated below:
Term | Definition |
AC | Alternating Current |
ACC | Air Cooled Condenser |
ACUA | Atlantic County Utilities Authority |
Amatitlan Loan | $42,000,000 in initial aggregate principal amount borrowed by our subsidiary Ortitlan Limitada from Banco Industrial S.A. and Westrust Bank (International) Limited. |
AMM | Administrador del Mercado Mayorista (administrator of the wholesale market — Guatemala) |
ARRA | American Recovery and Reinvestment Act of 2009 |
Auxiliary Power | The power needed to operate a geothermal power plant’s auxiliary equipment such as pumps and cooling towers |
Availability | The ratio of the time a power plant is ready to be in service, or is in service, to the total time interval under consideration, expressed as a percentage, independent of fuel supply (heat or geothermal) or transmission accessibility |
BESS | Battery Energy Storage Systems |
BLM | Bureau of Land Management of the U.S. Department of the Interior |
BOT | Build, operate and transfer |
BPP | PLN's existing average cost of generation |
CAISO | California Independent System Operator |
CalGEM | California Geologic Energy Management |
Capacity | The maximum load that a power plant can carry under existing conditions, less auxiliary power |
Capacity Factor | The ratio of the actual MWh generated and the generating capacity times 8760 hours expressed inas a percentage |
CARES | Coronavirus Aid, Relief, and Economic Security Act |
CCA | Community Choice Aggregator |
CDC | Caisse des Dépôts et Consignations, a French state-owned financial organization |
CEO | Chief Executive Officer |
CFO | Chief Financial Officer |
C&I | Refers to the Commercial and Industrial sectors, excluding residential |
CNEE | National Electric Energy Commission of Guatemala |
COD | Commercial Operation Date |
Company | Ormat Technologies, Inc., a Delaware corporation, and its consolidated subsidiaries |
CPA | Clean Power Alliance |
CPI | Consumer Price Index |
CPUC | California Public Utilities Commission |
DEG | Deutsche Investitions-und Entwicklungsgesellschaft mbH |
CREE | The Regulatory Commission of Electric Power in Honduras |
DFC | U.S. International Development Finance Corporation (formerly OPIC) |
DOE | U.S. Department of Energy |
DOGGR
| California Division of Oil, Gas, and Geothermal Resources
|
DSCR | Debt Service Coverage Ratio |
EBITDA | Earnings before interest, taxes, depreciation, amortization and amortizationaccretion |
EDF | Electricite de France S.A. |
EGS | Enhanced Geothermal Systems |
EIB | European Investment Bank |
Eligible Green Projects | Allocations made by the Company or any of its subsidiaries to any of the projects defined below in the 24 months prior to or 24 months following the issuance date of the bonds. Eligible Green Projects include the following (for illustrative purposes only): (i) renewable energy (new geothermal energy generation facilities with GHG emissions less than 100g CO2d/KWh; upgrades to existing geothermal energy generation facilities to increase efficiency, resiliency and reliability; energy storage systems; or solar PV systems); and (ii) eco-efficient and/or circular economy adapted products. |
EMRA | Energy Market Regulatory Authority in Turkey |
ENEE | Empresa Nacional de Energía Eléctrica |
Enthalpy | The total energy content of a fluid; the heat plus the mechanical energy content of a fluid (such as a geothermal brine), which, for example, can be partially converted to mechanical energy in an Organic Rankine Cycle. |
EPA | U.S. Environmental Protection Agency |
EPC | Engineering, procurement and construction |
ERCOT | Electric Reliability Council of Texas, Inc. |
EPRA | Energy and Petroleum Regulatory Authority of Kenya |
EWGEU | European Union |
EWG | Exempt Wholesale Generators |
Exchange Act | U.S. Securities Exchange Act of 1934, as amended |
FASB | Financial Accounting Standards Board |
FERC | U.S. Federal Energy Regulatory Commission |
FIT | Feed-in Tariff |
FPA | U.S. Federal Power Act, as amended |
GAAP | Generally accepted accounting principles |
GCCU | Geothermal Combined Cycle Unit |
GDC | Geothermal Development Company |
Geothermal Power Plant | The power generation facility and the geothermal field |
Geothermal Steam Act | U.S. Geothermal Steam Act of 1970, as amended |
GERD | Grand Ethiopian Renaissance Dam |
GHG | Greenhouse gas |
GIS | Geographic Information Systems |
Green bonds or green convertible bonds | Bonds, which the proceeds from, are used to finance and/or refinance, in whole or in part, new or on-going projects in accordance with the Ormat Green Finance Framework. |
GW | Giga wattGigawatt
|
GWh | Giga wattGigawatt hour
|
HELCO | Hawaii Electric Light Company |
IDWR | Idaho Department of Water |
| IESO | The Independent Electricity System Operator |
IFM | In Front of the Meter |
IGA | International Geothermal Association |
IID | Imperial Irrigation District |
INDE | Instituto Nacional de Electrification |
IOUs | Investor-Owned Utilities |
| IPCC | Intergovernmental Panel on Climate Change |
IPPs | Independent Power Producers |
IESOIRA
| The Independent Electricity System Operator (IESO) works at the heartInflation Reduction Act of Ontario's power system.2022
|
ISO | International Organization for StandardizationIndependent System Operator
|
ISONE | ISO New England |
ITC | Investment Tax Credit |
JBIC | Japan Bank for International Cooperation |
JOGMEC | Japan state-owned resources agency |
John Hancock | John Hancock Life Insurance Company (U.S.A.) |
JPM | J.P. Morgan Capital Corporation |
KenGen | Kenya Electricity Generating Company Ltd. |
Kenyan Energy Act | Kenyan Energy Act, 2006 |
KETRACO | Kenya Electricity Transmission Company Limited |
KGRA | Known Geothermal Resource Area |
KLP | Kapoho Land Partnership |
KPLC | Kenya Power and Lighting Co. Ltd. |
KRA | Kenya Revenue Authority |
kW | Kilowatt - A unit of electrical power that is equal to 1,000 watts |
kWh | Kilowatt hour(s), a measure of power produced |
LCOE | Levelized Costs of Energy |
Mammoth Pacific | Mammoth-Pacific, L.P. |
MEMR | The Indonesian Minister of Energy and Mineral Resources |
MW | Megawatt - One MW is equal to 1,000 kW or one million watts |
MWh | Megawatt hour(s), a measure of energy produced |
NIS | New Israeli Shekel |
NOA | Notice of Assessments |
| Notes | Convertible notes from 2022 |
NV Energy | NV Energy, Inc. |
NYSE | New York Stock Exchange |
NYISO | New York Independent System Operator, Inc. |
OEC | Ormat Energy Converter |
OFC | Ormat Funding Corp., a wholly owned subsidiary of the Company |
OFC 2 | OFC 2 LLC, a wholly owned subsidiary of the Company |
OFC 2 Senior Secured Notes | Up to $350,000,000 Senior Secured Notes, due 2034 issued by OFC 2 |
Opal Geo | Opal Geo LLC |
OPC | OPC LLC, a consolidated subsidiary of the Company |
OrCal | OrCal Geothermal Inc., a wholly owned subsidiary of the Company |
ORC | Organic Rankine Cycle - A process in which an organic fluid such as a hydrocarbon or fluorocarbon (but not water) is boiled in an evaporator to generate high pressure vapor. The vapor powers a turbine to generate mechanical power. After the expansion in the turbine, the low-pressure vapor is cooled and condensed back to liquid in a condenser. A cycle pump is then used to pump the liquid back to the vaporizer to complete the cycle. The cycle is illustrated in the figure below: 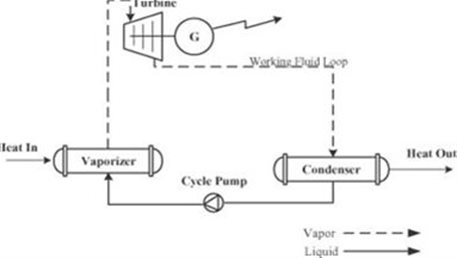
|
Ormat International | Ormat International Inc., a wholly owned subsidiary of the Company |
Ormat Nevada | Ormat Nevada Inc., a wholly owned subsidiary of the Company |
Ormat Systems | Ormat Systems Ltd., a wholly owned subsidiary of the Company |
Ormat Green Finance Framework | A framework developed in alignment with the Green Bond Principles (2021), as published by the International Capital Markets Association, by which the proceeds of green bonds are used to finance and/or refinance, in whole or in part, one or more Eligible Green Projects. |
ORIX | ORIX Corporation |
ORPD | ORPD LLC, a holding company subsidiary of the Company in which Northleaf Geothermal Holdings, LLC holds a 36.75% equity interest |
OrPower 4 | OrPower 4 Inc., a wholly owned subsidiary of the Company |
Ortitlan | Ortitlan Limitada, a wholly owned subsidiary of the Company |
ORTP | ORTP, LLC, a consolidated subsidiary of the Company |
Orzunil | Orzunil I de Electricidad, Limitada, a wholly owned subsidiary of the Company |
PEC | Portfolio Energy Credits |
PG&E | Pacific Gas and Electric Company |
PGV | Puna Geothermal Venture, a wholly owned subsidiary of the Company |
PJM | PJM Interconnection, LLC |
PLN | PT Perusahaan Listrik Negara |
Power plant equipment | Interconnection equipment, cooling towers for water cooled power plant, etc., including the generating units |
PPA | Power purchase agreement |
PTC | Production Tax Credit |
PUC | Public Utilities Commission |
PUCH | Public Utilities Commission of Hawaii |
PUCN | Public Utilities Commission of Nevada |
PUHCA | U.S. Public Utility Holding Company Act of 1935 |
PUHCA 2005 | U.S. Public Utility Holding Company Act of 2005 |
PURPA | U.S. Public Utility Regulatory Policies Act of 1978 |
Qualifying Facility(ies) | Certain small power production facilities are eligible to be “Qualifying Facilities” under PURPA, provided that they meet certain power and thermal energy production requirements and efficiency standards. Qualifying Facility status provides an exemption from PUHCA 2005 and grants certain other benefits to the Qualifying Facility |
RCEA | Redwood Coast Energy Authority |
REC | Renewable Energy Credit |
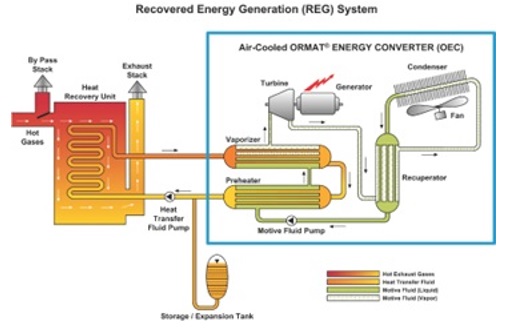
REG | Recovered Energy Generation |
RER | Renewable Energy Resource certificate |
RPS | Renewable Portfolio Standards |
RTO | Regional Transmission Organization |
SCE | Southern California Edison |
SCPPA | Southern California Public Power Authority |
SDG&E | San Diego Gas and Electric |
SEC | U.S. Securities and Exchange Commission |
Securities Act | U.S. Securities Act of 1933, as amended |
SOL | Sarulla Operations Ltd. |
solarSolar PV
| solar photovoltaic |
SOX Act | Sarbanes-Oxley Act of 2002 |
SRAC | Short Run Avoided Costs |
TASE | Tel Aviv Stock Exchange |
Tax Act | Tax Cuts and Jobs Act |
UIC | Underground Injection Control |
UN | United Nation |
Union Bank | Union Bank, N.A. |
U.S. | United States of America |
U.S. Treasury | U.S. Department of the Treasury |
USG | U.S. Geothermal Inc. |
VAT | Value Added Tax |
VCE | Valley Clean Energy |
Viridity | Viridity Energy Solutions Inc., a wholly owned subsidiary of the Company |
YTL | Turkish Lira |
Cautionary Note Regarding Forward-Looking Statements and Risk Factor Summary
This annual reportAnnual Report includes “forward-looking statements” within the meaning of the Private Securities Litigation Reform Act of 1995. All statements, other than statements of historical facts, included in this report that address activities, events or developments that we expect or anticipate will or may occur in the future, including such matters as our projections of annual revenues, expenses and debt service coverage with respect to our debt securities, future capital expenditures, business strategy, competitive strengths, goals, development or operation of generation assets, market and industry developments and the growth of our business and operations, are forward-looking statements. When used in this annual report,Annual Report, the words “may”, “will”, “could”, “should”, “expects”, “plans”, “anticipates”, “believes”, “estimates”, “predicts”, “projects”, “potential”, “target”, “goal”, or “contemplate” or the negative of these terms or other comparable terminology are intended to identify forward-looking statements, although not all forward-looking statements contain such words or expressions. The forward-looking statements in this annual reportAnnual Report are primarily located in the material set forth under the headings Item 1 — “Business” contained in Part I of this annual report,Annual Report, Item 1A — “Risk Factors” contained in Part I of this annual report,Annual Report, Item 7 — “Management’s Discussion and Analysis of Financial Condition and Results of Operations” contained in Part II of this annual report,Annual Report, and “Notes to Financial Statements” contained in Item 8 — “Financial Statements and Supplementary Data” contained in Part II of this annual report,Annual Report, but are found in other locations as well. These forward-looking statements generally relate to our plans, objectives and expectations for future operations and are based upon management’s current estimates and projections of future results or trends. Although we believe that our plans and objectives reflected in or suggested by these forward-looking statements are reasonable, we may not achieve these plans or objectives. You should read this annual reportAnnual Report completely and with the understanding that actual future results and developments may be materially different from what we expect attributable to a number of risks and uncertainties, many of which are beyond our control.
SummaryThese forward-looking statements are made only as of the date hereof, and, except as legally required, we undertake no obligation to update or revise the forward-looking statements, whether as a result of new information, future events or otherwise.
A summary of the risks that mightmay cause actual results to differ from our expectations include, but are not limited to the following:
Risks Related to the Company’sCompany’s Business and Operation
| | ●•
| Our financial performance depends on the successful operation of our geothermal, and REG, Solar PV power plants under the Electricity segment as well as, our energy storage facilities, which are subject to various operational risks. |
| | ●•
| Our exploration, development, and operation of geothermal energy resources are subject to geological risks and uncertainties, which may result in insufficient prospects to support our growth, decreased performance or increased costs for our power plants. |
| | ●
| We may experience a cyber incident, cyber security breach, severe natural event or physical attack on our operational networks and information technology systems.
|
| ●•
| We may decide not to implement, or may not be successful in implementing, one or more elements of our multi-year strategic plan, and the plan may not achieve its goal of enhancing shareholder value. |
| | ●•
| Our investments in BESS technology involves new technologies and expected advanced technologies with relatively limited history with respect to reliability and performance and may not perform as expected. In addition, our investments and profitability may be negatively affected by a number of factors, including increases in storage costs, risk of fire and volatility in merchant prices. |
| • | Concentration of customers, specific projects and regions may expose us to heightened financial exposure. |
| | ●•
| Our international operations expose us to risks related to the application of foreign laws and regulations, political or economic instability and major hostilities or acts of terrorism.regulations. |
| | ●•
| Political, economic and other conditions in the emerging economies where we operate, including Israel, may subject us to greater risk than in the developed U.S. economy. |
| | ●•
| Conditions in and around Israel, where the majority of our senior management and our main production and manufacturing facilities are located, including the ongoing military conflicts on the borders of Israel, may adversely affect our operations and may limit our ability to produce and sell our products, or manageand support our power plants.Electricity segment. |
| | ●•
| Continued reductionResponses in various countries where we have business operations to Israel’s ongoing military conflicts on some of its borders or future similar conflicts may adversely affect our operations and may limit our ability to produce and sell our products.
|
| • | Reduction in our Products segment backlog may affect our ability to fully utilize our main production and manufacturing facilities. |
| | ●•
| Some of our leases will terminate if we do not extract geothermal resources in “commercial quantities”, or if we fail to comply with the terms or stipulations of such leases or any of the provisions of the Geothermal Steam Act or if the lessor under any such lease defaults on any debt secured by the relevant property, thus requiring us to enter into new leases or secure rights to alternate geothermal resources, none of which may be available on terms as favorable to us as any such terminated lease, if at all. |
| | ●
| Our BLM leases may be terminated if we fail to comply with any of the provisions of the Geothermal Steam Act or if we fail to comply with the terms or stipulations of such leases.
|
| ●
| Some of our leases (or subleases) could terminate if the lessor (or sublessor) under any such lease (or sublease) defaults on any debt secured by the relevant property, thus terminating our rights to access the underlying geothermal resources at that location.
|
| ●
| Reduced levels of recovered energy required for the operation of our REG power plants may result in decreased performance of such power plants.
|
| ●•
| Our business development activities may not be successful and our projects under construction or facilities undergoing enhancement and repowering may not commence operation as scheduled.encounter delays. |
| | ●•
| Our future growth depends, in part, on the successful enhancement of a number of our existing facilities. |
| | ●•
| We rely on power transmission facilities that we do not own or control. |
| | ●•
| Our use of joint ventures may limit our flexibility with jointly owned investments. |
| | ●•
| Our operations could be adversely impacted by climate change. |
| | ●•
| Geothermal projects that we planWe could be negatively impacted by regulatory and other responses to develop in the future, may operate as "merchant" facilities without long-term PPAs and therefore such projects will be exposed to market fluctuations.climate change.
|
| | ●
| Storage projects that we are operating, currently developing or plan to develop in the future, may operate as "merchant" facilities without long-term power services agreements for some or all of their generating capacity and output and therefore such projects will be exposed to market fluctuations.
|
| ●•
| We may not be able to successfully conclude the transactions,complete acquisitions, and we may not be able to successfully integrate, or realize anticipated synergies from, companies whichthat we have acquired and may acquire in the future. |
| | ●•
| TheWe encounter intense competition from electric utilities, other power generation industry is characterized by intense competition.producers, power marketers, developers and third-party investors.
|
| | ●
| We face increasing competition from other companies engaged in energy storage and the combination of solar and energy storage.
|
| ●•
| Changes in costs and technology may significantly impact our business by making our power plants and products less competitive, resulting in our inability to sign new or recontracted PPAs for our Electricity segment and new supply and EPC contracts for our Products segment. |
| | ●•
| Our intellectual property rights may not be adequate to protect our business. |
| | ●•
| We may experience difficulties implementing and maintaining our new enterprise resource planning system. |
| • | We may experience a cyber-incident, cyber security breach, severe natural event or physical attack on our operational networks and information technology systems. |
Risks Related to Governmental Regulations, Laws and Taxation
| | ●•
| Our financial performance could be adversely affected by changes in the legal and regulatory environment affecting our operations. |
| | ●•
| Pursuant to the terms of some of our PPAs with investor-owned electric utilities and publicly-owned electric utilities in states that have renewable portfolio standards, the failure to supply the contracted capacity and energy thereunder may result in the imposition of penalties. |
| | ●•
| If any of our domestic power plants loses itslose their current Qualifying Facility status under PURPA, or if amendments to PURPA are enacted that substantially reduce the benefits currently afforded to Qualifying Facilities, our domestic operations could be adversely affected. |
| | ●•
| We may experience aThe reduction, elimination or elimination ofinability to monetize government incentives.incentives could adversely affect our business, financial condition, future results and cash flows.
|
| | ●•
| We are a holding company and our cash depends substantially on the performance of our subsidiaries and the power plants they operate, most of which are subject to restrictions and taxation on dividends and distributions. |
| | ●•
| The costs of compliance with federal, state, local and foreign environmental laws and our ability in obtainingto obtain and maintainingmaintain environmental permits and governmental approvals required for development, construction and/or operation may result in liabilities, costs and delays in construction (as well as any fines or penalties that may be imposed upon us in the event of any non-compliance or delays with such laws or regulations). |
| | ●•
| We could be exposed to significant liability for violations of hazardous substances laws because of the use or presence of such substances at our power plants. |
| | ●
| Current and future urbanizing activities and related residential, commercial, and industrial developments may encroach on or limit geothermal or solar PV activities in the areas of our power plants, thereby affecting our ability to utilize access, inject and/or transport geothermal resources on or underneath the affected surface areas.
|
| ●•
| U.S. federal, state and foreign country income tax reform could adversely affect us. |
Risks Related to Economic and Financial Conditions
| | ●•
| We may be unable to obtain the financing we need on favorable terms to pursue our growth strategy.strategy and any future financing we receive may be less favorable to us than our current financing arrangements. |
| | ●•
| We have incurred substantial indebtedness that may decrease our business flexibility, access to capital, and/or increase our borrowing costs, and we may still incur substantially more debt, which may adversely affect our operations and financial results. |
| • | Our debt obligations may adversely affect our ability to raise additional capital and will be a burden on our future cash resources, particularly if we elect to settle these obligations in cash upon conversion or upon maturity or required repurchase. |
| • | The capped call transactions, into which we entered in connection with the issuance of June 2022 convertible notes, (the "Notes") may affect the value of the Notes and our common stock and we are subject to counterparty risk with respect to the capped call transactions. |
| • | Our foreign power plants and foreign manufacturing operations expose us to risks related to fluctuations in currency rates, which may reduce our profits from such power plants and operations. |
| | ●•
| Our power plants have generally been financed through a combination of our corporate funds and limited or non-recourse project finance debt and lease financing. If our project subsidiaries default on their obligations under such limited or non-recourse debt or lease financing, we may be required to make certain payments to the relevant debt holders, and if the collateral supporting such leveraged financing structures is foreclosed upon, we may lose certain of our power plants. |
| | ●•
| We may experience fluctuations in the cost of construction, raw materials, commodities and drilling. |
| | ●•
| Our commodity derivative activity may limit potential gains, increase potential losses, result in earnings volatility and involve other risks. |
| • | We are exposed to swap counterparty credit risk. |
| ●
| We may not be able to obtain sufficient insurance coverage to cover damages resulting from any damages to our assets and profitability including, but not limited to, natural disasters such as volcanic eruptions, lava flows, wind and earthquakes.risk
|
Risks Related to Force Majeure
| | ●
| The global spread of a public health crisis, including the COVID-19 pandemic may have an adverse impact on our business.
|
| ●•
| The existence of a prolonged force majeure event or a forced outage affecting a power plant, or the transmission systems could reduce our net income. |
| • | Threats of terrorism may impact our operations in unpredictable ways and could adversely affect our business, financial condition, future results and cash flow. |
Risks Related to Our StocOwnership of our Common Stockk
| | ●•
| Future equity issuances, including through our current or any future equity compensation plans, could result in dilution, which could cause the price of our shares of common stock to decline. |
| • | A substantial percentage of our common stock is held by stockholders whose interests may conflict with the interests of our other stockholders. |
| | ●•
| The price of our common stock may fluctuate substantially, and your investment may decline in value. |
| • | We may issue additional shares of our common stock in connection with conversions of the Notes, and thereby dilute our existing stockholders and potentially adversely affect the market price of our common stock. |
| • | The fundamental change provisions of the Notes may delay or prevent an otherwise beneficial takeover attempt of us. |
Market and Industry Data
This Annual Report includes market and industry data and forecasts that we have derived from publicly available information, various industry publications, other published industry sources and internal data and estimates. Industry publications and other published industry sources generally indicate that the information contained therein was obtained from sources believed to be reliable. Internal data and estimates are based upon information obtained from trade and business organizations and other contacts in the markets in which we operate and our management’s understanding of industry conditions. Any estimates underlying such market-derived information and other factors could cause actual results to differ materially from those expressed in the independent parties’ estimates and in our estimates.
Company Contact and Sources of Information
Our website is www.ormat.com. Information contained on or accessible via our website, including our Sustainability Reports, is not part of or otherwise incorporated by reference into this Annual Report. Information that we furnish to or file with the SEC,U.S. Securities and Exchange Commission (the “SEC”), including our annual reportsAnnual Reports on Form 10-K, quarterly reports on Form 10-Q, current reports on Form 8-K and any amendments to, or exhibits included in, these reports are made available for download, free of charge, through our website.website as soon as reasonably practicable. Our SEC filings, including exhibits filed therewith, are also available directly on the SEC’s website at www.sec.gov.
YouWe may requestuse our website as a copydistribution channel of material company information. Financial and other important information regarding the Company is routinely posted on and accessible through our website at www.ormat.com. Accordingly, investors should monitor this channel, in addition to following our press releases, SEC filings at no cost to you, by writing to the Company address appearing on the cover page of this annual report or by calling us at (775) 356-9029.and public conference calls and webcasts.
PART I
ITEM 1. BUSINESS
Overview
We are a leading vertically integrated company that is primarily engaged in the geothermal and recovered energy power businesses.business. We leveragedleverage our core capabilities and global presence to expand our activity in recovered energy generation and into different energy storage services and solar photovoltaic (PV)PV (including hybrid geothermal and solar PV as well as energy storageSolar plus Solar PV)Energy Storage). Our objective is to become a leading global provider of renewable energy and wehelp to mitigate climate change by providing a replacement to carbon-intensive energy sources. We have adopted a strategic plan to focus on several key initiatives to expand our business.
We currently conduct our business activities in three business segments:
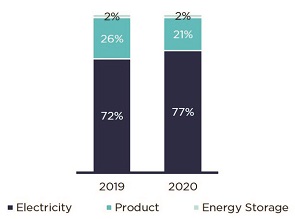
| | • | Electricity Segment. In the Electricity segment, which contributed 76.8% of our total revenues in 2020, we develop, build, own and operate geothermal, solar PV and recovered energy-based power plants in the United States and geothermal power plants in other countries around the world and sell the electricity they generate. In 2020,2023 we derived 63.1%commenced or expanded commercial operation of our Electricity segment revenues from our operations44 MW of geothermal power plants including the new 25MW North Valley power plant in the San Emidio complex, the 6MW expansion to the Dixie Valley power plant and the10MW addition to the Heber Complex, all in the U.S. and 36.9% fromIn addition, we commenced or expanded commercial operation of 13MW of Solar PV projects, including the restnew 6MW Brady solar power plant as well as the addition of 7MW added to the world.Steamboat Complex. |
| | • | Product Segment. In the Product segment, which contributed 21.0% of our total revenues in 2020, we design, manufacture and sell equipment for geothermal and recovered energy-based electricity generation and remote power units and provide services relating to the engineering, procurement and construction of geothermal and recovered energy-based power plants. In 2020,Since the beginning of 2023, we derived 3.9%signed new contracts that were added to our backlog and secured $157.0 million of our Product segment revenues from our operations into be recognized over the United States and 96.1% from the rest of the world.next two years. |
| | • | Energy Storage SegmenSegmentt.. In the Energy Storage segment, we own and operate grid connected In Front of the Meter (IFM) BESS facilities, which contributed 2.2% of our total revenues in 2020,provide capacity, energy and ancillary services directly to the electric grid. In 2023, we mainly providecommissioned five energy storage related services as well as services relating to the engineering, procurement, construction, operationfacilities with a total capacity of 82MW/102 MWh in California, New Jersey, Texas and maintenance of energy storage units. In 2020, we derived all of our Energy Storage segment revenues from our operations in the United States.Ohio. |
The charts below show the relative contributions
The following chart sets forth a breakdown of our revenues for each of the years ended December 31, 20192022 and 2020:
2023:
The following chart sets forth the geographical breakdown of revenues attributable to our Electricity Product and Energy StorageProduct segments for each of the years ended December 31, 20192022 and 2020:
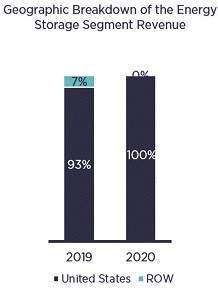
The revenues attributable to our Energy Storage segment for each of the years ended December 31, 2022 and 2023 were 100% generated in the United States.
Technology and products we use in our operations include geothermal, recovered energy, solar PV and energy storage.Our Power Generation Business (Electricity Segment)
Our owned geothermalCompany-owned power plants include both power plants that we have built and power plants that we have acquired. The substantial majority of the power plants that we currently own or operate produce electricity from geothermal energy sources. Geothermal energy is a clean, renewable and generally sustainable form of energy derived from the natural heat of the earth. Unlike electricity produced by burning fossil fuels, electricity produced from geothermal energy sources is produced without emissions of certain pollutants such as nitrogen oxide, and with far lower emissions of other pollutants such as carbon dioxide. As a result, electricity produced from geothermal energy sources contributes significantly less to global warmingclimate change and local and regional incidences of acid rain than energy produced by burning fossil fuels. In addition, compared to power plants that utilize other renewable energy sources, such as wind or solar, geothermal power plants are generally available all year-long and all day-long and can therefore provide base-load electricity services. Geothermal power plants can also be custom built to provide a range of electricity services such as baseload, voltage regulation, reserve and flexible capacity. Geothermal energy is also an attractive alternative to other sources of energy and can support a diversification strategy to avoid dependence on any one energy source or politically sensitive supply sources.
We own and operate a geothermal and solar PV hybrid projectprojects and have similar projects currently under construction, in which the electricity generated from a solar PV power plant is used to offset the equipment’s energy use at the geothermal facility, thus increasing the renewablegeothermal energy delivered by the project to the grid.
In addition to our geothermal energy business, we manufacture and sell products that produce electricity from recovered energy or so-called “waste heat”. We also construct, own, and operate 53MW of recovered energy-based power plants. We have built all of the recovered energy-based plants that we operate. Recovered energy comes from residual heat that is generated as a by-product of gas turbine-driven compressor stations, solar thermal units and a variety of industrial processes, such as cement manufacturing. Such residual heat, which would otherwise be wasted, may be captured in the recovery process and used by recovered energy power plants to generate electricity without burning additional fuel and without additional emissions.
In our Energy Storage segment, we commissioned three energy storage facilities with a total of 42 MW in New Jersey and Vermont, a 10 MW facility in Texas and acquired a 20 MW facility in California. We plan to accelerate long-term growth in the Energy Storage segment market to establish a leading position in the U.S..
Our Power Generation Business (Electricity Segment)
Each of our current geothermal power plants sells substantially all of its output pursuant to long-term, and in most of the cases, fixed price PPAs to various counterparties denominated in or linked to the USU.S. dollar or Euro. These contracts had a total weighted average remaining term, based on contributions to segment revenue, of approximately 1615 years at December 31, 2020.2023. In addition, the counterparties to our PPAs in the United States had a credit rating of between Aa3Aa1 to Baa2B1 (Stable) by Moody's and BB-AA+ to AB- by S&P. The purchasers of electricity from our foreign power plants are mainly state-owned entities in countries with below investment grade rating.
Power Plants in Operation
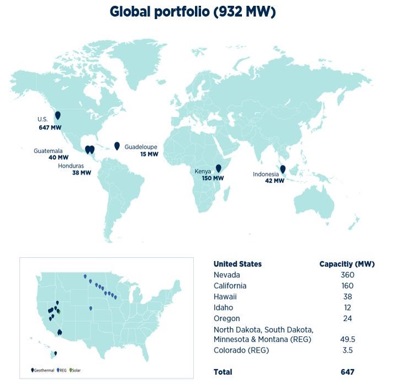
We own and operate 25 geothermal, REG and solar sites32 power plant complexes globally with an aggregate generating capacity of 9321,215 MW. They include geothermal, REG and solar sites. Geothermal comprises 94%comprised 92% of our generating capacity. In 2020,2023, our geothermal and REG power plants generated at a capacity factor of 87%84% and 59%38%, respectively, which is much higher than typicalthe 20%-30% capacity factors forfactor typically generated in wind and solar producers that are usually at 20% to 30%.projects.
The table below summarizes certain key non-financial information relating to our power plants and complexes as of February 24, 2021.23, 2024. The generating capacity of certain of our power plants and complexes listed below has been updated from our 20192021 disclosure to reflect changes in the resource temperature and other factors that impact resource capabilities:
Type | Region | Plant | Ownership(1) | Generating capacity (MW) (2) | PPA Tenor | Capacity Factor | Region | Plant | Ownership(1) | Generating capacity (MW) (2) | PPA Tenor | Capacity Factor |
Geothermal | California | Ormesa Complex | 100% | 36 | 23 | | California | Ormesa Complex | 100% | 36 | 19 | |
| | | | Heber Complex | 100% | 91 | 10 | 81% |
| | | | Mammoth Complex | 100% | 65 | 13 | |
| | | | Brawley | 100% | 7 | 8 | |
| | | West Nevada | Steamboat Complex | 100% | 79(4) | 19 | 83% |
| | | | Brady Complex | 100% | 24(5) | 26 | |
| | | Heber Complex | 100% | 81 | 14 | | East Nevada | Tuscarora | 100% | 17(3) | 9 | |
| | | Mammoth Complex | 100% | 30 | 13 | 80% | | Jersey Valley | 100% | 8 | 9 | |
| | | Brawley | 100% | 13 | 12 | | | McGinness Hills | 100% | 146 | 15 | |
| | West Nevada | Steamboat Complex | 100% | 84(3) | 18 | 82% | | Don A. Campbell | 100.0% | 30(3) | 12 | 91% |
| | | Brady Complex | 100% | 26 | 16 | | | Tungsten Mountain | 100% | 41(6)(3) | 20 | |
| | East Nevada | Tuscarora | 100% | 18 | 13 | | | Dixie Valley | 100% | 64 | 15 | |
| | | Jersey Valley | 100% | 8 | 13 | | | Beowawe | 100% | 14 | 31 | |
| | | McGinness Hills | 100% | 145 | 19 | 93% | North West Region | Neal Hot Springs(7) | 60% | 22(3) | 15 | |
| | | Don A. Campbell | 63.3% | 32 | 16 | | | Raft River | 100% | 12 | 9 | |
| | | Tungsten Mountain(4) | 100% | 29 | 24 | | | San Emidio(8) | 100% | 39 | 15 | 90%(10) |
| | North West Region | Neal Hot Springs | 60% | 24(5) | 19 | | | Still Water Complex(9) | 100% | 12 | 6 | |
| | | Raft River | 100% | 12 | 13 | 90% | | Salt Wells(9) | 100% | 9 | 6 | |
| | | San Emidio | 100% | 11 | 19 | | Hawaii | Puna | 63.3% | 38(11) | 29 | 58% |
| | Hawaii | Puna | 63.3% | 38 | 33 | NA%(6) | Utah | Cove Fort(9) | 100.0% | 18 | 10 | NA |
| | International | Amatitlan (Guatemala) | 100% | 20 | 9 | 88%(8) | International | Amatitlan (Guatemala) | 100% | 20 | 5 | |
| | | Zunil (Guatemala) | 97% | 20(7) | 15 | | | Zunil (Guatemala) | 97% | 20 | 11 | |
| | | Olkaria III Complex (Kenya) | 100% | 150 | 15 | | | Olkaria III Complex (Kenya) | 100% | 150 | 11 | 75%(12) |
| | | Bouillante (Guadeloupe Island, France) | 63.75%(9) | 15 | 11 | | | Bouillante (Guadeloupe, France) | 63.75%(13) | 15 | 7 | |
| | | Platanares (Honduras) | 100% | 38 | 13 | | | Platanares (Honduras) | 100% | 33 | 9 | |
| | | | | | | | | | | | | |
Total Consolidated Geothermal | | | | 831 | | 87%(8,10) | | | | 1010 | | 84% |
| | | | | | | | | | | | | |
REG | | OREG 1 | 63.3% | 22 | 12 | | | OREG 1 | 100.0% | 22 | 8 | |
| | | OREG 2 | 63.3% | 22 | 15 | | | OREG 2 | 100.0% | 22 | 11 | |
| | | OREG 3 | 63.3% | 5.5 | 10 | | | OREG 3 | 100.0% | 5.5 | 6 | |
| | | OREG 4 | 100% | 3.5(11) | 10 | | | OREG 4 | 100% | 3.5 | 6 | |
Total REG | | | | 53 | | 59% | | | | 53 | | 38%(14) |
| | | | | | | | | | | | | |
solar | | Tungsten Mountain | 100% | 7 | 24 | | |
Solar | | | Tungsten Mountain | 100% | 12 | 20 | |
| | | | | | | | | Wister | 100% | 20 | 19 | |
Total solar | | | | 7 | | | |
| | | | Steamboat Solar | 100% | 12 | 20 | |
| | | | Still Water Solar PV(9) | 100% | 40 | 6 | |
| | | | Woods Hill(9) | 100% | 20 | 15 | |
| | | | Brady | 100% | 6 | 20 | |
Total Solar | | | | | 110 | | |
| | | | | | | | | | | | | |
Unconsolidated Geothermal | Indonesia | Sarulla Complex | 12.75% | 42 | 28 | | Indonesia | Sarulla Complex | 12.75% | 42 | 24 | |
| | | | | | | | | | | | | |
Total Unconsolidated Geothermal | | | | 42 | | | | | | 42 | | |
| | | | | | | | | | | | | |
Total | | | | 932 | | | | | | 1,215 | | |
| | 1. | We indirectly ownhave a controlling interest and we operate all of our power plants, although financialexcept for Sarulla. Financial institutions hold equity interests in threesix of our subsidiaries: (i) Opal Geo subsidiaries, which own the McGinness Hills Phases 1 and 2 geothermal power plants, the Tuscarora and Jersey Valley power plants and the second phase of the Don A. Campbell power plant, all located in Nevada; (ii) ORNI 41, which owns the McGinness Hills Phase 3 located in Nevada; and (iii) ORNI 43, which owns the Tungsten Mountain geothermal power plant located in Nevada; (iv) Steamboat Hills, LLC, which owns the Steamboat Hills power plant located in Nevada; (v) CD4 partnership that owns the CD4 power plant, under Mammoth Complex, in California; (v) ORNI 36, which owns North Valley power plant, under San Emidio complex, located in Nevada. In the table above, we list these power plants as being 100% owned because all of the generating capacity is owned by these subsidiaries and we control the operation of the power plants. The nature of the equity interests held by the financial institution is described below in Item 8 — “Financial Statements and Supplementary Data”Data" under Note 13.12. |
Notwithstanding ourWe own a 63.75% equity interest in the Bouillante power plant, a 60% equity interest in the Neal Hot Spring power plant and a 63.25% direct equity interest in the Puna plant, the first phase of Don A. Campbell, OREG 1, OREG 2 and OREG 3 power plants as well as the indirect interest in the second phase of the Don A. Campbell complex owned by our subsidiary, ORPD, weplant. We list 100% of the generating capacity of the Bouillante power plant, the Neal Hot Springs power plant and the Puna power plants in the ORPD portfolioplant in the table above because we control their operations. We list our 12.75% share of the generating capacity of the Sarulla complex as we own a 12.75% minority interest. Revenues from the Sarulla complex are not consolidated and are presented under “Equity in earnings (losses) of investees, net” in our consolidated financial statements.
| | 2. | References to generating capacity generally refer to gross generating capacity less auxiliary power. We determine the generating capacity of these power plants by taking into account resource and power plant capabilities. In any given year, the actual power generation of a particular power plant may differ from that power plant’s generating capacity due to variations in ambient temperature, the availability of the geothermal resource, and operational issues affecting performance during that year. In 2023 the capacity factors of Olkaria, Puna, and Sarulla complexes were significantly impacted by operational and resource issues, as discussed further under "Description of our power plants". |
| | 3. | The Steamboat complex includesGenerating capacity reduced to reflect cooling we are experiencing in the Steamboat Hills enhancement that commenced commercial operation in June, 2020. resource.
|
| | 4. | Steamboat complex is a hybrid geothermal and solar power plant that uses the solar energy for geothermal power plant auxiliary power. The Solar PV facilities are presented separately in the table above. |
| 5. | Brady power plant under Brady complex is a hybrid geothermal and solar power plant that use the solar energy for geothermal power plant auxiliary power. The Solar PV facility is presented separately in the table above. |
| 6. | Tungsten Mountain is a hybrid geothermal and solar power plant that uses the solar energy for geothermal power plant auxiliary power. The solar power plant generates 7 MW and isSolar PV facilities are presented separately in the table above. |
| | 5.7.
| We own 60% and Enbridge owns 40% of the Neal Hot Springs power plant. |
| | 6.8.
| The San Emidio complex includes 25MW from North Valley that commenced commercial operation in May 2023. |
| 9. | The Still Water complex and the Salt Wells geothermal power plants located in Nevada, the Cove Fort geothermal power plant located in Utah, the Still Water Solar PV facilities, located in Nevada and the Woods Hill Solar PV power plant located in Connecticut were acquired and added to our portfolio in January 2024. |
| 10. | Capacity factor excludes Still Water complex and Salt Wells power plant as they were added to our portfolio in January 2024. |
| 11. | The Puna geothermal power plant has been shut down sinceon May 3, 2018 when the Kilauea volcano located in close proximity to it erupted following a significant increase in seismic activity in the area. InThe Puna power plant resumed operations in November 2020 Puna resumed operations and currently it is operatingduring 2023 operated at a generating capacitylevel of approximately 13MW .26 MW. In addition, we signed an amended PPA to extend its duration and expand its contract capacitythe Fourth quarter 2023 the power plant generated above 30MW. |
| 12. | Capacity factor was mainly impacted by the lower performance of the Olkaria complex, as describedfurther discussed below in Item 7 — “Management’s Discussion and Analysisunder "Description of Financial Condition and Results of Operations” under the headings "Recent Development"our Power plants". |
| | 7.
| In Zunil, power plant revenues used to be calculated based on 24 MW of generating capacity and was unrelated to the performance of the reservoir. In 2019 and onward, revenues are calculated based on the actual generation of the power plant, therefore the generating capacity was updated to reflect the current generating capacity.
|
| 8.
| Capacity factor for Olkaria adds back the curtailed MWh.
|
| 9.13.
| We own 63.75%, CDC owns 21.25% and Sageos owns 15.0% of the Bouillante power plant. |
| | 10.14. | The total availability of the geothermalOREG power plants excludes the Puna power plant that is not in operation, as discussed above. |
| 11. | The OREG 4 power plant isare not operating at full capacity due to low run time of the compressor stationstations that serves as the power plant’splants heat source. This has resulted in lower power generation. |
New Power Plants
We are currently in various stages of construction of new power plants and expansion of existing power plants. OurWe have released for construction and expansion plans include 92 MW inprojects with generating capacity of 162 MW from geothermal and solar PV power plants in the United States.worldwide. In addition, we have several geothermal and solar PV projects in various stages of development. These projects are primarily located in the United States, Indonesia, Guatemala and Guadeloupe that are either under initial stages of construction or under different stages of development with an aggregate capacity of between 98 MW and 108 MW.States.
We havehold substantial land positions across 3133 prospects in the United States and 109 prospects in Ethiopia, Guatemala, Honduras Indonesia and New ZealandIndonesia that we expect will support future geothermal development and on which we have started or plan to start exploration activity.development. These land positions are comprised of various leases, exploration concessions for geothermal resources, and an optionoptions to enter into leases. We have started or plan to start exploration activity on many of these prospects.
We expect addingto add between 250335 MW to 270355 MW of Geothermalbetween 2024 and Solar PV2026 and to reach by the end of 2023.2026 a total generating capacity of approximately 1.5 GW in the Electricity Segment by that time.
Our Product Business (Product Segment)Segment
We design, manufacture and sell products for electricity generation and provide the related services described below. In addition, we recently started to provide cementing services for well drilling to third parties. We primarily manufacture products to fill customer orders, but in some situations, we manufacture products as inventory for future projects that we will own andor for future third party projects.
Power Units for Geothermal Power Plants
We design, manufacture and sell power units for geothermal electricity generation, which we refer to as OECs. In geothermal power plants using OECs, geothermal fluid (either hot water, also called water/brine, or steam, or both) is extracted from the underground reservoir and flows from the wellhead to a vaporizer that heats a secondary working fluid, which is vaporized and used to drive the turbine. The secondary fluid is then condensed in a condenser, which may be cooled directly by air through an air cooling system or by water from a cooling tower and sent back to the vaporizer. The cooled geothermal fluid is then reinjected back into the reservoir. Our customers include contractors, geothermal power plant developers, owners and operators.
Power Units for Recovered Energy-Based Power Generation
We design, manufacture and sell power units used to generate electricity from recovered energy, or so-called “waste heat”. This heat is generated as a residual by-product of gas turbine-driven compressor stations, solar thermal units, biomass facilities and a variety of industrial processes, such as cement manufacturing, and is not otherwise used for any purpose. Our existing and target customers include interstate natural gas pipeline owners and operators, gas processing plant owners and operators, cement plant owners and operators, and other companies engaged in other energy-intensive industrial processes.
EPC of Power Plants
We serve as an EPC contractor for geothermal and recovered energy power plants on a turnkey basis, using power units we design and manufacture. Our customers are geothermal power plant owners as well as our target customers for the sale of our recovered energy-based power units as described above.units. Unlike many other companies that provide EPC services, we believe that our competitive advantage is in using equipment that we manufacture, allowingwhich allows us better quality in and control over the timing and delivery of required equipment and its related costs.
Remote Power Units and Other Generators
We design, manufacture and sell fossil fuel powered turbo-generators with capacities ranging from 200 watts to 5,000 watts, which operate unattended in extreme hot or cold climate conditions. Our customers include contractors who install gas pipelines in remote areas and offshore platform operators and contractors. In addition, we design, manufacture, and sell generators, including heavy duty direct-current generators, for various other uses.
Our Energy Storage Segment
Our energy storageEnergy Storage segment has grown consistently insince 2019 and 2020 and we expect continuous and even strongerstrong growth overin the coming years, while we targetyears. We have targeted the sectorEnergy Storage segment as one of our major segments for further investment and growth.
In 2023, we successfully brought on line five new Ormat-owned BESS projects; the 20 MW/20 MWh Andover project and the 7 MW/7 MWh Howell project, both located in New Jersey; the 12 MW/12 MWh Bowling Green project in Ohio; the 23 MW/23 MWh Upton project in Texas; and the 20 MW/40 MWh Pomona 2 project in California. These new additions to the portfolio have increased our operating portfolio to 170 MW / 298 MWh at the end of 2023. Our portfolio of projects are regionally diversified, with footprints across 4 different RTOs or ISOs; CAISO, PJM Interconnect, ERCOT and ISONE.
In 2020, we successfully brought on line one new Ormat-owned BESS project, the 10 MW/10 MWh Rabbit Hill project in Georgetown, Texas. We also acquired the operating 20 MW / 80 MWh Pomona BESS project in southern California, that has been in commercial operation since December 2016 under a 10-year resource adequacy agreement with Southern California Edison. These activities brought our total operating portfolio at the end of 2020 to approximately 73 MW / 136 MWh within the footprint of 4 RTOs or ISOs: CAISO, PJM Interconnect, ERCOT and ISONE.
We are currently in the final commissioning stage of our 10 MW / 40 MWh Vallecito project in southern California, for which we secured a 20-year resource adequacy agreement with Southern California Edison. We are also in the process of constructing 7 additional energy storage projects with a 5total capacity of 355 MW / 201,060 MWh Tierra Buena project in northern California, which we expect to reach commercial operation by the end of 2021 and our Andover 20 MW project in NJ, which we expect to reach commercial operation in the first quarter of 2022 and Howel 7 MW project in NJ, which we expect to reach commercial operation in the second quarter of 2022. We acquired rights in a project under development, in Upton County, Texas and plan to start the construction of a 25 MW / 25 MWh BESS project there before the end of 2021. New Jersey.
WeIn addition, we have a approximately 1.2 GWan approximate 3.6GW/13.1GWh pipeline of additional potential projects, in different stages of development across the United States that we believe we will be ablesupport our target to commissionreach an energy storage portfolio of between 200 MW and 300 MW700 to 800 MW/ 1,900-2,300 MWh by 2023.the end of 2026. The development of such projects is dependent, inter alia, on site permitting, interconnection agreement, supply of Lithium- Ion batteries and economic viability, which are not certain. We plan to continue leveraging our experience in project development and finance, as well as our engineering, procurement and construction know-how and our relationships with utilities and other market participants, to develop additional BESS projects.
Business Strategy
Our business strategy reiterates and supports our position that climate change is among the most important issues of our time. A large part of our business involves bringing low-carbon baseload energy to parts of the world that lack access to affordable baseload renewable energy. Our Company recognizes the importance of the fight against climate change and the imperative of lowering global greenhouse gas emissions, and our core business actively works to counteract these existential threats. We are focused on helping to create a sustainable energy infrastructure, and further developing a geographically balanced portfolio of geothermal,an alternative energy storage, solar (PV)future, where greenhouse gas emissions are reduced and recovered energy assetsthe ability to access and store renewable sourced power will enable electricity grids to become more responsive, more stable, and more environmentally friendly.
Business Goals
Our goals include continuing our leading position in the geothermal energy market with the objective ofand becoming a leading global provider of renewable energy. Our strategy focuses on three main elements:
| | • | Developing our corelow carbon renewable geothermal business in the United States as well asand globally; |
| | • | establishing a strongGrowing our market position in the IFM energy storage market; and
|
| | • | exploringExploring opportunities in new areas by looking for synergistic growth opportunities utilizing our core competence,competencies, strong market reputation, as a successful company and new market opportunities focused upon environmental solutions.environmentally responsible solutions in the energy sector.
|
We intend to implement this strategy through:
| | • | Development and Construction of New Geothermal Power Plants — continuously seeking out- identifying new commercially exploitableviable renewable geothermal resources, to accelerate the development and construction of new zero emission geothermal power plants by either entering into long-term PPAs providing stable and sustainable cash flows or selling in the "merchant" market in jurisdictions where the regulatory, tax and business environments encourage or provide incentives for such development; flows. |
| | • | Expanding our Geographical Reach — increasing our business development activities in an effort to grow our business in the global markets in all business segments. While we continue to evaluate global opportunities, we currently see the U.S.,United States, Indonesia, Central America and EthiopiaNew Zealand as attractive markets for our Electricity segment andSegment. We see New Zealand, Philippines, Turkey, Chile, Indonesia, The United States and China as attractive markets for our Product segment.Segment. We are actively looking at ways to expand our presence in those countries;these countries to offer and provide replacement to carbon-intensive power alternatives. |
| | • | Accelerating the Development and Construction of New Energy Storage Assets - increasing our business development activities seeking potential sites for development and construction of energy storage facilities (including hybrid storage and solar PV facilities) in an effort to significantly grow our energy storage market; market and provide efficient solutions to the grid, while combining both long term fixed price PPA’s, known as tolling agreements, together with merchant expo. |
| | • | Acquisition of New Geothermal Assets - — expanding and accelerating growth through acquisition activities globally, aiming to acquire additional geothermal assets with long term PPAs or without a PPA as well as operating and development assets that can support our geothermal business;business. |
| | • | Acquisition of Energy Storage Projects and Assets – expanding and accelerating growth through acquisition activities of operating assets, shovel ready projects and projects in various stages of development ;development. |
| | • | Using Our Operational Capabilities to Increase Output from our Existing Geothermal Power Plants —- increasing output from our existing geothermal power plants by adding additional generating capacity, upgrading plant technology, and improving geothermal reservoir operations, including improving methods of heat source supply and delivery;delivery. |
| | • | Creating Cost Savings throughThrough Increased Operating Efficiency -— increasing efficiencies in our operating power plants and manufacturing facility including procurement by adding new technologies, restructuring of management control, automating part of our manufacturing work and centralizing our operating power plants;plants. |
| | • | Diversifying our Customer Base —- evaluating a number of strategies for expanding our customer base to the CCA and C&ICCA's markets. In the near term, however, we expect that the substantial majority of our revenues will continue to be generated from our traditional electrical utility customer base for the Electricity segment;segment. |
| | • | Maintaining a Prudent and Flexible Capital Structure -— we have various financing structures in place, including non-recourse project financings, green convertible bonds, the sale of differential membership interests and equity interests in certain subsidiaries, as well as revolving credit facilities and term loans. We believe our cash flow profile, the long-term nature of our contracts, and our ability to raise capital provide greater flexibility for optimizing our capital structure;structure. |
| | • | Improving our Technological Capabilities —investing in research and development of renewable energy technologies and leveraging our technological expertise to continuously improve power plant components, reduce operations and maintenance costs, develop competitive, eco-efficient and environmentally friendlylow-carbon products for electricity generation and target new service opportunities. In addition, we are expanding our core geothermal competencies to provide high efficiency solutions for high enthalpy applications by utilizing our binary enhanced cycle and technology;technology. |
| | • | Manufacturing and Providing Products and EPC Services Related to Renewable Energy —- designing, manufacturing and contracting power plants for our own use and selling to third parties power units and other generation equipment for geothermal and recovered energy-based electricity generation;generation. |
| | • | Expanding into New Technologies - leveraging our technological capabilities over a variety of renewable energy platforms, including solar power generation, energy storage and recovered energy storage. We may acquiregeneration. Involvement in continuous innovation by research and development efforts aimed at enhancing the efficiency of our operations. In addition, we recognize the importance of Corporate Venture Capital (CVC) in acquiring or investing in companies with integration and technological capabilities that we do not currently have, or developcomplement our existing expertise. Moreover, developing new technology ourselves,technologies internally, where we can effectively leverage our expertisenecessary, to implement this part offill gaps and capitalize on market opportunities in alignment with our strategic plan. |
The map below shows our worldwide portfolio of operating geothermal, solar PV and recovered energy power plants as of February 25, 2021.21, 2024.
* In the Sarulla complex, we include our 12.75% share only.
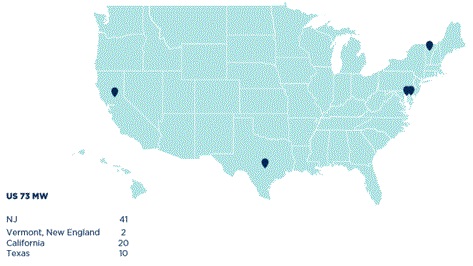
The map below shows our portfolio of operating storage facilities as of February 25, 2021. 21, 2024.
Industry BackgroundSustainability Strategy
We are committed to engaging with stakeholders on, and strengthening our commitment to, sustainability issues, including environmental, social and governance (“ESG”) matters. We endorse external initiatives and partner with national and international associations that we believe assist us in adhering to our ESG values, in particular, relating to geothermal, energy, health and safety issues and human rights issues. We strive to provide up-to-date, credible and comparable data to ESG agencies while engaging institutional investors and investor advocacy organizations around ESG issues.
As a renewable energy solution provider, we are motivated to identify opportunities and risks with respect to climate change and take efforts to reduce our GHG emissions and improve our energy efficiency. In addition to meeting our regulatory requirements, we report our annual GHG emissions to several organizations, including the Carbon Disclosure Project and the Israeli Ministry of Environmental Protection’s voluntary business reporting initiative.
We report our progress on environmental goals and commitments annually in our sustainability reports, including, but not limited to, our climate change mitigation measures, biodiversity conservation, and water management efforts. A copy of our most recent Sustainability Report is accessible, free-of-charge, on our website at https://www.ormat.com/en/company/engagement. The contents of our website, including the sustainability reports, are not part of or otherwise incorporated by reference into this Form 10-K.
Geothermal Energy
There are several different sources or methods of obtaining geothermal energy, which are described below.
Hydrothermal geothermal-electricity generation — Hydrothermal geothermal energy is derived from naturally occurring hydrothermal reservoirs that are formed when water comes sufficiently close to hot rock to heat the water to temperatures of 300 degrees Fahrenheit or more. The heated water then ascends toward the surface of the earth where, if geological conditions are suitable for its commercial extraction, it can be extracted by drilling geothermal wells. Geothermal production wells are normally located within several miles of the power plant, as it is not economically viable to transport geothermal fluids over longer distances due to heat and pressure loss. The geothermal reservoir is a renewable source of energy if: (i) natural ground water sources and reinjection of extracted geothermal fluids are adequate over the long-term to replenish the geothermal reservoir following the withdrawal of geothermal fluids and (ii) the well field is properly operated. Geothermal energy power plants typically have higher capital costs (primarily because of the costs attributable to well field development) but tend to have significantly lower variable operating costs (principally consisting of maintenance expenditures) than fossil fuel-fired power plants that require ongoing fuel expenses.
EGS — An EGS is a subsurface system that may be artificially created to extract heat from hot rock where the permeability and aquifers required for a hydrothermal system are insufficient or non-existent. A geothermal power plant that uses EGS techniques recovers the thermal energy from the subsurface rocks by creating or accessing a system of open fractures in the rock through which water can be injected, heated through contact with the hot rock, returned to the surface in production wells and transferred to a power unit.
Co-produced geothermal from oil and gas fields, geo-pressurized resources — Another source of geothermal energy is hot water produced as a by-product of oil and gas extraction. When oil and gas wells are deep, the extracted fluids are often at high temperatures and if the water volume associated with the extracted fluids is significant, the hot water can be used for power generation in equipment similar to a geothermal power plant.
Geothermal Power Plant Technologies
Geothermal power plants generally employ either binary systems or conventional flash design systems, as briefly described below. In our geothermal power plants, we also employ our proprietary technology of combined geothermal cycle systems.
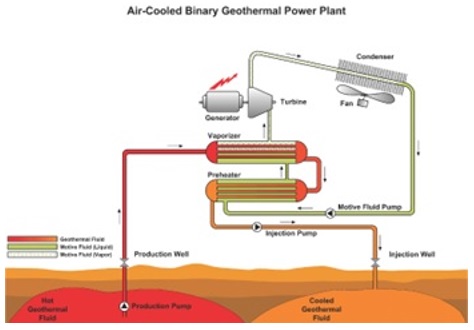
Binary System
In a geothermal power plant using a binary system, geothermal fluid (either hot water (also called brine) or steam or both) is extracted from the underground reservoir and flows from the wellhead through a gathering system of insulated steel pipelines to a vaporizer that heats a secondary working fluid. This is typically an organic fluid, such as pentane or butane, which is vaporized and is used to drive the turbine. The organic fluid is then condensed in a condenser, which may be cooled directly by air or by water from a cooling tower and sent back to the vaporizer through a pump. The cooled geothermal fluid is then reinjected back into the reservoir. The operation of our air-cooled binary geothermal power plant is depicted in the diagram below.
Flash Design System
In a geothermal power plant using flash design, geothermal fluid is extracted from the underground reservoir and flows from the wellhead through a gathering system of insulated steel pipelines to flash tanks and/or separators. There, the steam is separated from the brine and is sent to a demister, where any remaining water droplets are removed. This produces a stream of dry saturated steam, which drives a steam turbine generator to produce electricity. In some cases, the brine at the outlet of the separator is flashed a second time (dual flash), providing additional steam at lower pressure used in the low-pressure section of the steam turbine to produce additional electricity. Steam exhausted from the steam turbine is condensed in a surface or direct contact condenser cooled by cold water from a cooling tower. The non-condensable gases (such as carbon dioxide) are removed by means of a vacuum system in order to maintain the performance of the steam condenser. The resulting condensate is used to provide make-up water for the cooling tower. The hot brine remaining after separation of steam is injected (either directly or after passing through a binary plant to produce additional power from the residual heat remaining in the brine) back into the geothermal resource through a series of injection wells. The flash technology is depicted in the diagram below.
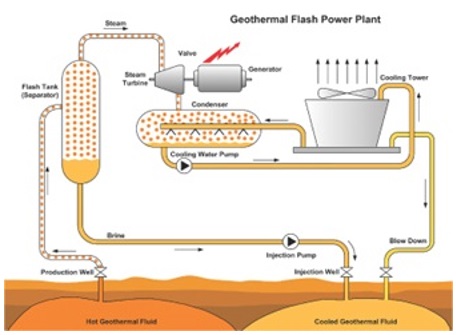
In some instances, the wells directly produce dry steam and the steam is fed directly to the steam turbine with the rest of the system similar to the flash technology described above.
Our Proprietary Technology
Our proprietary technology involves original designs of turbines, pumps, and heat exchangers, as well as formulation of organic motive fluids (all of which are non-ozone-depleting substances) and may be used either in power plants operating according to the ORC alone or in combination with various other commonly used thermodynamic technologies that convert heat to mechanical power, such as gas and steam turbines. It can be used with a variety of thermal energy sources, such as geothermal, recovered energy, biomass, solar energy and fossil fuels. Specifically, our technology involves original designs of turbines, pumps, and heat exchangers, as well as formulation of organic motive fluids (all of which are non-ozone-depleting substances). By using advanced computational fluid dynamics techniques and other computer aided design software as well as our test facilities, we continuously seek to improve power plant components, reduce operations and maintenance costs, and increase the range of our equipment and applications. We are always examiningexamine ways to increase the output of our plants by utilizing evaporative cooling, cold reinjection, configuration optimization, and topping turbines.
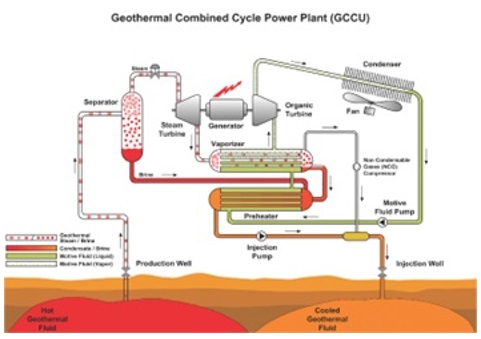
We also developed, patented and constructed GCCU power plants in which the steam first produces power in a backpressure steam turbine and is subsequently condensed in a vaporizer of a binary plant, which produces additional power. Our Geothermal Combined Cycle technology, that we have deployed in previous years, is depicted in the diagram below.

In the conversion of geothermal energy into electricity, our technology has a number of advantages over conventional geothermal steam turbine plants. A conventional geothermal steam turbine plant consumes significant quantities of water, causing depletion of the aquifer and requiring cooling water treatment with chemicals and consequently a need for the disposal of such chemicals. A conventional geothermal steam turbine plant also creates a significant visual impact in the form of an emitted plume from the cooling towers, especially during cold weather. By contrast, our binary and combined cycle geothermal power plants have a low profile with minimal visual impact and do not emit a plume when they use air-cooled condensers. Our binary and combined cycle geothermal power plants reinject all of the geothermal fluids utilized in the respective processes into the geothermal reservoir. Consequently, such processes generally have no emissions.
Other advantages of our technology include simplicity of operation and maintenance and higher yearly availability. For instance, the OEC employs a low speed and high efficiency organic vapor turbine directly coupled to the generator, eliminating the need for reduction gear. In addition, with our binary design, there is no contact between the turbine blade and geothermal fluids, which can often be very erosive and corrosive. Instead, the geothermal fluids pass through a heat exchanger, which is less susceptible to erosion and can adapt much better to corrosive fluids. In addition, with the organic vapor condensed above atmospheric pressure, no vacuum system is required.
We use the same elements of our technology in our recovered energy products. The heat source may be exhaust gases from a Brayton cycle gas turbine, low-pressure steam, or medium temperature liquid found in the process industries such as oil refining and cement manufacturing. In most cases, we attach an additional heat exchanger in which we circulate thermal oil or water to transfer the heat into the OEC’s own vaporizer in order to provide greater operational flexibility and control. Once this stage of each recovery is completed, the rest of the operation is identical to that of the OECs used in our geothermal power plants and enjoys the same advantages of using the ORC. In addition, our technology allows for better load following than conventional steam turbines, requires no water treatment (since it is air cooled and organic fluid motivated), and does not require the continuous presence of a licensed steam boiler operator on site.
Our REG technology is depicted in the diagram below.

Patents
As of February 24, 2021,December 31, 2023, we have 62 issued U.S.192 patents and onepatent applications worldwide, including 58 patents issued in the U.S. and 39 pending U.S. patent application.applications. These patents and patent applications cover our products (mainly power units based on the ORC) and systems (mainly geothermal power plants and industrial waste heat recovery plants for electricity production). The product-related patents cover components that include turbines, heat exchangers, air coolers, seals and controls as well as control of operation of geothermal production well pumps. The system-related patents cover not only particular components but also the overall energy conversion system from the “fuel supply” (e.g., geothermal fluid, waste heat, biomass or solar) to electricity production.
The system-related patents also cover subjects such as waste heat recovery related to gas pipeline compressors and industrial waste heat, solar power systems, disposal of non-condensable gases present in geothermal fluids, reinjection of other geothermal fluids ensuring geothermal resource sustainability, power plants for very high-pressure geothermal resources, two-phase fluids, low temperature geothermal brine as well as processes related to EGS. 55Fifty-five of our patents cover combined cycle geothermal power plants, in which the steam first produces power in a backpressure steam turbine and is subsequently condensed in a vaporizer of a binary plant, which produces additional power. The remaining terms of our issued patents range from one year to 16 years. The loss of any single patent would not have a material effect on our business or results of operations.
Research and Development
We conduct research and development activities intended to improve plant performance, reduce costs, and increase the breadth of our product offerings. The primary focus of our research and development efforts is targeting power plant conceptual thermodynamic cycle and major equipment including continued performance, cost and land usage improvements to our condensing equipment, and development of new higher efficiency and higher power output turbines.turbines and brine production pumps. New realms for innovation include implementation of predictive maintenance software and automation of power plants performance analysis.
Energy Storage Technologyour continuous development, we developed and patented the extraction ORC, developed extraction and injection turbines that allow bleed or injection of motive fluid between stages from or to the organic turbine. As the ACC is a significant piece of equipment involved in the ORC process, we focus our efforts on improving ACC performance, such as the wind guiding vanes (WGV), inclined ACC and more.
In theWe also devote resources to research and development related to our energy storage segment, oursegment. Our engineering and R&D efforts include:
(a) developing optimization algorithmsteams are working to optimize the dispatch strategy of a battery energy storage system (BESS) so asBESS, develop and deploy capabilities to optimize between potential market revenuesself-integrate BESS and expected battery wear and tear;
(b) running an R&D laboratory to assesstest different battery cell technologies and their optimization with different energy markets in which we operate. We are testing different batteriesinverter technologies under simulated operating criteria of various energy markets. Various inverter technologies are also assessedmarkets to identify deficiencies or synergies with the battery cells.
(c) developing self-integrated BESS, leveraging Ormat’s decades of experience in system integration so we canallow us to bring to market cost-effective BESS more rapidly and more optimized to the specific use cases and target revenue streams.
Additionally, we are continuinghold patents in other energy storage solutions, including a mechanical energy storage system. A preliminary trial of this system in a small-scale unit is scheduled for 2024. We continue to evaluate investment opportunities in companies with innovative technology or product offerings for renewable energy and energy storage solutions.
Market Opportunities
Geothermal Market Opportunities
Renewable energy in general providesoffers a sustainable alternative to the existing solutionssolution to two major global issues: climate change and diminishing fossil fuel reserves. Renewable energy is sustainable, clean and decarbonizes the grid. Theseunpredictable commodity costs. Due to its environmental benefits, have led majormany countries to focus their efforts onare now prioritizing the development of clean, decarbonized baseload renewable sources. There is also a particular interest in geothermal energy sources in general and geothermal specifically.production.
Based onAt the IGA, asend of January 2021, geothermal power is generated in 29 countries with a2023, the total installed geothermal power generation capacity stood at 16,335 MW, an increase of 15,600 MW at the end of 2020.207MW since 2022. The leading countries are the U.S.,United States, Indonesia, the Philippines, Turkey, Mexico, and New Zealand.Zealand are the leading countries in geothermal power generation. The IGA estimates an additional 4,000 MW will be added by 2025.U.S. saw the largest growth in 2023, adding 106 MW.
Having realized the importance of renewable energy including geothermal alternatives, variousMany governments have beenrecognized the need for alternatives to fossil fuels. As a result, they have implemented or are preparing regulatory frameworks and policies that are necessary to achieve emission reduction targets. These policies also provide growth incentives and providing incentivesaim to developmaximize the sector.use of renewable energy resources. This creates job opportunities and improves energy security.
United States
United StatesFederal
Interest in geothermal energy in the United States remains strongcontinues to grow based on supportive legislation and regulation at the local, state, and federal levels. Policymakers and regulators are increasingly aware of the comparatively high value of geothermal energy in contrast to intermittent renewable technology. Renewable portfolio standards (RPS) are now accounting for numerous reasons, including legislative support, RPS goals (as described below),more baseload energy than ever before, as coal, natural gas, and nuclear power plant retirements, and an increasing awareness of the positive value of geothermal characteristics when compared to intermittent renewable technologies.plants are being retired.
Today, electricity generation from geothermal resourcesGeothermal power is concentrated mainlycurrently generated in several states across the U.S., including California, Nevada, Hawaii, Idaho, Oregon, and Utah, and we believeUtah. Ormat believes there are opportunities for geothermal expansion in other western states, such as New Mexico due to the potential of its geothermal resources and recentColorado. New Mexico recently passed legislation that has increasedincreasing its renewable energy goals to 100% by 2045 for investor-owned utilities.utilities, and Colorado is introducing regulation for streamlined geothermal permitting.
The IRA offers several tax incentives to promote climate change mitigation. This spurred interest and growth in clean energy, electric vehicles, and battery and energy storage manufacturing and purchase. Some highlights of the IRA include PTCs or ITCs for wind and solar projects (including geothermal and hydropower) starting construction before January 1, 2025. It also made eligible for ITCs BESS projects placed in service after December 31, 2022. The PTCs and ITCs, as amended by the IRA, apply to facilities placed in service after December 31, 2022, and enables Ormat to transfer credits earned to unrelated third parties or enter tax equity transactions to fund a higher percentage of its investment. This should reduce capital needs and increase project economics.
Geothermal energy provides numerous benefits to the U.S. grid and economy. Geothermal development and operation bringcan produce economic benefits in the form of taxesby providing tax incentives and long termlong-term high-paying jobs, and according to the U.S. Energy Information Administration - EIA - Independent Statistics and Analysis, it currently has one of the lowest LCOE of all power sources in the United States, according to the U.S. Energy Information Administration's report published in February 2019.States. Additionally, improvements in geothermal production make it possible to provide ancillary and on-demand services. This helps load servingload-serving entities avoid additional costs from purchasing and thenby balancing intermittent resources with storage or new transmission.
AtState legislation
Many state governments have implemented a Renewable Portfolio Standard (RPS) program, which requires utilities to incorporate renewable energy sources into their energy generation portfolio. The participating states set targets for generating energy from renewable sources within specific deadlines. Renewable energy generation under the end of 2020, the United States Congress passed one of its most significant energy legislation in over a decade as part of the omnibus spending and coronavirus relief package. The legislation includes a budget for the Geothermal Technology Office to support geothermal research and development, a one-year extension ofRPS program is monitored through the production tax credit, and specific languageof Renewable Energy Certificates (RECs). Load-serving entities track these RECs to improve permitting efforts for renewable projects on federal land.ensure that they are meeting RPS mandates.
State level legislation
Many state governments have enacted an RPS program under which utilities are required to include renewable energy sources as part of their energy generation. Under an RPS, participating states have set targets for the production of their energy from renewable sources by specified dates. Renewable energy generation under RPS programs are tracked through the production of RECs. Load serving entities track the RECs to ensure they are meeting the mandate prescribed by the RPS.
Currently, in the United States, 42 states plus the District of Colombia and four territories have enacted an RPS, renewable portfolio goals, or similar laws or incentives (such as clean energy standards or goals) requiring or encouraging load servingload-serving entities in such states to generate or buy a certain percentage of their electricity from renewable energy or recovered heat sources. The vast majority of Ormat’s geothermal projects can be foundare in California, Nevada, and Hawaii, all of which have some of the most stringent RPS programs in the country.
We see Ormat sees the impact of RPS and climate legislation as the mosta significant driver for us to expandexpanding existing power plants and to buildbuilding new renewable projects.
Below are RPS targets in the states in which we are operating:
State | RPS Target | Year | Remarks |
California | 60 | % | 2030 | RPS targets set for future years: 44% – 2024, 52% – 2027, and 60% – 2030. 100% zero carbon by 2045. |
| | | | | |
Nevada | 50 | % | 2030 | RPS target of 50% by 2030 and 100% zero carbon by 2050.
The state has a credit multiplier for photovoltaic and on peak energy savings. |
| | | | | |
Hawaii | 100 | % | 2045 | RPS targets set for future years: 30% by 2020, 40% by 2030, 70% by 2040 and 100% by 2045 |
| | | | | |
Oregon | 25 | % | 2025 | Increased RPS of 50% by 2040 applies to IOUs who have a share of more than 3% of the state’s load; for utilities with a load-share of 1.5% – 3%, requirement is 10% in 2025, and for utilities with a load share of less than 1.5%, it is 5% in 2025 |
States also provide incentives to geothermal energy producers. Nevada provides a property tax abatement of up to 55% for real and tangible personal property used to generate electricity from geothermal sources. TheThis abatement may extend up to twenty years if certain job creation requirements are met. In Idaho, geothermal energy producers are exempt from property tax and, in lieu, pay a 3% tax on gross energy earnings. The California Energy Commission provides favorable grants and loans to promote the development of new or existing geothermal resources and technologies within the state. Also, in California, the CPUC has required Electric Load Service Entities (LSEs) to procure 11.5 GW of new clean electricity by 2028, 1 GW of this procurement must deliver firm power with an 80% capacity factor, produce zero on-site emissions, and be weather independent. In Idaho,2023, the CPUC ordered utilities to procure 4GW of clean electricity in addition to the 11.5GW required under the original bill. With a high-capacity factor and firm and flexible generation, geothermal energy producers are exempt from property taxaddresses these requirements and in lieu, pay a tax of 3% of gross energy earnings.is the natural replacement for baseload fossil fuels and nuclear generation.
Global
We believe the global markets continue to present growth and expansion opportunities in both established and emerging markets.
Operations outside of the United States may be subject to and/or benefit from increasing efforts by governments and businesses around the world to fight climate change and move towards a low carbon, resilient and sustainable future. According to a recent report by the International Renewable Energy Agency entitled Toward 100% Renewable Energy, in 2019, a total of 61 countries had set a 100% renewable energy target in at least one end-use sector, up from 60 countries in 2018.
We believe that several global Climate Change initiatives willare likely to create business expansion opportunities for us and support the global growth of the renewable sector. Onesector, such initiative isas the historic Paris Agreement that was approved by the Twenty-first Conference of the Parties to the United NationsUN Framework Convention on Climate Change on December 12, 2015. The Paris Agreement, for(2015) and subsequent UN Climate Change Conferences which reaffirmed the first time, created a commitment by parties to this agreement to setting nationally determined efforts with the view to strengthening the global response to the threatcommitments of climate change and reporting on their progress. Following this agreement, the EIB and other multilateral institutions have committed to provide $100 billion of new financing for climate action projects over the next five years to assist countries in reaching their targets. Although former President Donald J. Trump officially withdrew the United States from the Paris Agreement in 2020, President Joe Biden signed an executive order to recommit the United States to the Paris Agreement. The Paris Agreement will enter into force for the United States on February 19, 2021.
In addition, in 2015, a group of 20 countries, including the United States, United Kingdom, France, China and India, pledged to double their respective budgets for renewable energy technology over five years as part of a separate initiative called Mission Innovation. Mission Innovation celebrated its fifth year in 2020, and has since grown to 24 countries and the European Commission. Over the past five years members have raised the profile of clean energy innovation and increased investments by $4.9 billion annually.
Also in 2015, the Breakthrough Energy Coalition was launched by a group of 28 private investors with the objective of bringing companies with the potential to deliver affordable, reliable and carbon free power from the research lab to the market. In the same vein, in 2020, several global organizations joined the Rockefeller Foundation to form a coalition aimed at providing sustainable energy for one billion people by 2030. Joining this call to action include the African Development Bank, CDC Group plc (the UK’s development finance institution), European Investment Bank, International Energy Agency, IRENA, United Nations Development Programme (UNDP), U.S. International Development Finance Corporation and U.S. Agency for International Development (USAID). The coalition aims to unleash the full potential of distributed renewable and sustainable energy systems, including technologies such as mini-grids, grid-connected local generation and storage, renewable power solutions for industrial and commercial clusters, and stand-alone commercial appliances.
We believe that as a general matter these developments and governmental plans will create growth and expansion opportunities for us internationally.
Outside of the United States, the majority of power generating capacity has historically been owned and controlled by governments. Since the early 1990s, however, many foreign governments have privatized their power generation industries through sales to third parties encouraging new capacity development and/or refurbishment of existing assets by independent power developers. These foreign governments have taken a variety of approaches to encourage the development of competitive power markets, including awarding long-term contracts for energy and capacity to independent power generators and creating competitive wholesale markets for selling and trading energy, capacity, and related products. Some foreign regions and countries have also adopted active government programs designed to encourage clean renewable energy power generation such as the following countries in which we operate, sell products and/or are conducting business development activities:
Europe
Europe
Europe has the fourth largest geothermal power capacity, the majority of which stems from Italy and Turkey.Turkey and recently small-scale projects in Germany. A significant part of our European operations is in Turkey. We are looking for opportunities to expand in Europe.Europe, primarily in our Product segment.
Turkey
Until recently,Turkey was the fastest growing geothermal market worldwide with the theoretical potential for 31 GWA significant part of geothermal capacity and with a proven geothermal capacity of 4.5 GW, according to the Turkish Mineral Technical Exploration Agency. Due to the economic situationour European operations is in Turkey, there has been a slowdown.
Sinceand since 2004, we have established strong business relationships in the Turkish geothermal market and provided our wide range of solutions including our binary systems, to over 40 geothermal power plants with a total capacity of over 950 MW, of which one power plant is currently under construction.
The incentive plan and regulation for renewable energy generation in Turkey was renewed at900 MW. We believe the beginning of February 2021 for another 5 years. The updated FIT is lower than the previous one and the structure of the incentivized local manufactured items is not published yet, but will also change, to increase locally made parts. The structure of adjusting the exchange rate of the USD to the YTL has changed dramatically, both with applying the adjustment only once every three months, and by having an adjustment mechanism that takes into consideration changes not only on the USD / YTL rate, but also local indexes and the Euro exchange. Turkey’s external debt and economic status also create big burden on any project financing process. Until things improve, we estimate that the slowdown in development of new sites will continue.
The potential for geothermal growth in Turkey is still high, specifically in center-south and east areas of the country. In addition, there iscountry, however, due to the ongoing economic crisis in Turkey, new projects and investments are at a standstill.
We are also experiencing growing interest and believe there are opportunities in waste heat utilization to generate electricity.Greece, Croatia and Hungary.
Latin America
Several Latin American countries have renewable energy programs and pursue thehave pursued development ofin the geothermal market. We currently operate in some countries in Latin America and are looking for opportunities in others.
Guatemala
In Guatemala, where our Zunil and Amatitlan power plants are located, the government approved and adopted the Energy Policy 2013-2027 that secure,secures, among other things, a supply of electricity at competitive prices by diversifying the energy mix with an 80% renewable energy share target for 2027.
Honduras
In Honduras, where we operate our Platanares power plant, the government set a target to reach at least 80% renewable energy production by 2034.
Caribbean
Many island nations in general and specifically the Caribbean nations, depend almost entirely on petroleum to meet their electricity needs. Caribbean nations have quite significant renewable energy potential, yet most have relatively small demand. Other than in Guadeloupe, where the geothermal power plant that we acquired has been operating since 1985, there are no other operating geothermal projects in the Caribbean region. Although few, we believe there are geothermal opportunities for us in the Caribbean islands of St. Kitts, Nevis, St. Lucia, Dominica, and Montserrat.
New Zealand
In New Zealand, where we have been actively providing geothermal power plant solutions since 1988, the government’s policies to fight climate change include a net zero GHG emissions reduction target by 2050 and a renewable electricity generation target of 90% of New Zealand’s total electricity generation by 2035. We continue selling power plants and products to our New Zealand customers secured two projects in the last two years and intensified our cooperationcooperate with other potential customers for adding more geothermal power generation capacity within the coming years. In 2023, we signed an EPC contract to build the Ngatamariki 58 MW following the 59MW Tehuka 3 geothermal project contract signed in 2022. In 2023, we have also announced the development of TOPP2 a 50 MW geothermal power plant.
Asia
Indonesia
In Indonesia
Indonesia where we hold a 12.75% equity interesthas 23 GW of geothermal potential, the largest in the Sarulla complex,world and has just utilized about 2.4 GW (10% of the potential). The Government of Indonesia (“GOI”) has made a Nationally Determined Contribution of 43.2% GHG emission reduction and achieve net zero emission by 2060. To meet this target, GOI has planned to increase renewable energy utilization, with geothermal energy planned to have a 3 GW increase by 2030. To further accelerate renewable energy development, Presidential Regulation No 112 was established in 2022, outlining renewable energy investment incentives and setting more lucrative electricity tariffs for renewables. We are currently constructing the 34 MW Ijen Power Plant (joint development with Medco Power Indonesia) and we are currently conducting exploration activitymaking intensive efforts to extend our power plant portfolio in Indonesia, adding more megawatts to the Ijen geothermal power plan in East Java, in which we own a 49% equity interest and whose first phase we plan to commission by the end of 2023. The government intends to increase the share of renewable energy sources in the energy mix, aiming to meet a target of 23% of domestic energy demand by 2025, and announced its intention to reduce the country’s carbon dioxide emissions by 26% by 2020. Under the current local regulation, the tariff policy for geothermal PPAs is mainly determined based on the location of the relevantalready operating 330 MW Sarulla power plant.
We consider Indonesia an important geothermal market, where potential for future development is significant along with an active geothermal industry that is supported by regulatory incentives and commitment fromIn the local government.
In addition to project development,product segment, we are also pursuing various supply opportunitiesseeing an increase in Indonesia, and in other countries in Southeast Asia, including several optimization projects.
China
In China, where we supplied our equipment to one of our clients’ geothermal projects, the National Energy Administration will adopt the 14th Renewable Energy Development Five Year Planbinary power plants for low-medium enthalpy resources, either by March 2021 that establishes targets for renewable energy deployment until 2025. Key objectives under the plan include, among others, to increase the share of non-fossil fuel energy in total primary energy consumption to 20%utilizing existing drilled wells or by 2030.utilizing unused brine from existing power plants.
Japan
The installed capacity of Japan places ninth in the world, the potential output of 23,470 MW is third in the world after the United States and Indonesia. In 2018, the Japanese government established as its goal a target of 22% to 24% renewable energy of the Japanese energy installed base by 2030. This outlook expects new geothermal plant installation in the range of 380 MW to 850 MW - 1,000 MW. State-owned resources agency JOGMEC will conduct test bores as part of the financially risky early phase of development on behalf of potential developers starting in the fiscal year from April 2020. Japan's Ministry of Economy, Trade and Industry (METI) determined 24 successful applicants for the full year 2019 Research Project for Developing Resources for Geothermal Power Generation managed by State-owned resources agency JOGMEC.
East Africa
In East Africa the geothermal potential along the Rift Valley is estimated at several thousand MW. The different countries along the Rift Valley are at different stages of development of their respective geothermal potential.
Kenya
In Kenya, there are already several geothermal power plants, including our 150 MW Olkaria III complex. The Kenyan government has identified the country's untapped geothermal potential as the most suitable indigenous source of electricity, and it aspires to reach 5 GW of geothermal power generation by 2030.electricity.
The Kenyan government is aiming to reach 10 GW of power generating capacity by 2037, underpursuant to the Least-Cost Power Development Plan 2017-37, withwhich had a target of 62% of such capacity generated from renewable energy sources (including large hydro and solar).
Other Countries
The governments of Djibouti, Eritrea, Ethiopia, Tanzania, Uganda, Rwanda and Zambia are exploring ways to develop geothermal resources in their countries, mostly through the help of international development organizations such as the World Bank.
Ethiopia electrification targets for 2025 require additional investment in generation capacities. Such growth in demand was expected to be principally met with the GERD. However, IPP’s are encouraged to participate directly in the renewable development in order to meet expected local growth. Moreover, the current government sees electricity export to neighboring countries as a strategic asset. The country recently completed an interconnection with Kenya and plans to further increase connections to Djibouti, Sudan, South Sudan, Rwanda, Burundi. These exports will improve foreign exchange reserves in Ethiopia . We hold rights for four geothermal concessions in Ethiopia, for which we have completed initial exploration studies.
In January 2014, energy ministers and delegates from 19 countries committed to the creation of the Africa Clean Energy Corridor Initiative (Corridor), at a meeting in Abu Dhabi convened by the International Renewable Energy Agency. The Corridor will boost the deployment of renewable energy and aims to help meet Africa’s rising energy demand with clean, indigenous, cost-effective power from sources including hydro, geothermal, biomass, wind and solar.
Energy Storage
Globally, there is a continued increase in the use of renewable energy. In the United States and Europe, this increase is placing strains on the electric grid as adding wind and solar PV power creates situations where a significant amount of power plant capacity must be available to ramp up and down to accommodate wind and mostly solar PV daily output cycles and variations due to atmospheric conditions. Furthermore, the output from wind and solar PV power plants can change significantly over short periods of time due to environmental conditions like cloud movement and fog burn off and cause instability on the electric grid. As a result, energy storage is becoming a key component of the future grid.
Energy storage systems utilize surplus, available electricity that enables utilities and grid operators to optimize the operation of the grid, run generators closer to full capacity for longer periods, and operate the grid more efficiently and effectively. As penetration of wind and solar resources increases, so does the need for services that energy storage systems can provide to “balance the grid”, such as local capacity, frequency regulation, ramping, reactive power, black start and movement of energy from times of excess supply to times of high demand. Common applications for energy storage systems include ancillary services, wind/solar smoothing, energy trading, peaker replacement, and transmission and distribution deferral.
We beleive that the impacts from the war in Ukraine and the instability in the Middle East continue bolstering demand for renewable energy as a way of reaching energy security. These and other factors, are currently outweighing headwinds that renewable energy is currently facing, in the form of a high interest rate environment and declining fossil fuel prices. The IEA estimates, in its 2023 World Energy Outlook 2023, that global additional Solar PV deployment between 2023 and 2030 will be 500GW. This and other renewable energy additions to the grid will place a strain on the electric grid as adding intermittent renewables such as wind and solar can create situations where a significant amount of capacity must be available to ramp up and down to accommodate these resource’s daily output cycles and variations due to weather conditions. Furthermore, the output from wind and solar PV power plants can change significantly over short periods of time due to environmental conditions like cloud movement and fog burn off and can cause instability on the electric grid. As a result, the IEA estimates that 100 GW of energy storage will be added by 2030. If a more aggressive Net Zero scenario occurs, the IEA estimates that 800 GW of solar and 180 GW of energy storage will be deployed by 2030.
In general, the energy storage market is impacted by battery prices that are linked to volatile lithium prices. In the U.S., the Energy Storage Market and our Energy Storage segment currently enjoy tail winds as a result of declining Lithium prices and the fact that the IRA provides large Investment Tax Credits to Energy Storage facilities. Also, various battery suppliers are preparing to manufacture batteries in the U.S., which is expected to result in additional tax benefits for our projects in the U.S. that will use local batteries. We also expect to see our Energy Storage segment benefit from the incentives available to other renewable energy technologies, which we believe will increase the need for energy storage.
According to Wood Mackenzie's (formerly GTM Research) Energy Storage Monitor for Q3 2020, approximately 3.3 GWh of newQ4 2023, the U.S. energy storage projectsmarket added 2,354 MW and 7,322 MWh across all segments in Q3, a new quarterly record. Most of these additions - 2,158 MW/6,848 MWh - were installed ingrid-scale storage facilities which our energy storage segment focuses on. This segment’s installation capacity rose by 37% quarter over quarter, Wood Mackenzie is forecasting that cumulative energy storage deployments will grow to 63GW by 2027, of which the United States in 2020 and this numberlions share is expected to grow more than seven times to approximately 24.4 GWh in 2025.
2020 saw record growth in BESS deployment in the United States, despite the challenges presented by COVID-19, and significant growth in BESS deployment is expected to continue primarily for grid-connected (also referred to as “in front of the meter”) applications, but also for “behind the meter” applications, where end-users, such as small municipal utilities, electric cooperative, educational and health facilities, commercial and industrial customers, benefit from savings through demand charge reductions and create revenues through active market participation. Many power systems are also undergoing significant challenges and changes such as grid aging, grid congestion, retirement of aging generators, implementation of greenhouse gas emission reduction rules and increasing penetration of variable renewable energy resources.be grid-scale installations.
We own and operate several grid-connectedgrid-scale BESS facilities, where revenues comeare derived from selling energy, capacity and/or ancillary services in merchant markets like PJM Interconnect, ISO New England, the ERCOT and the CAISO. We are pursuing the development of additional grid-connected BESS projects in multiple regions, with expected revenues coming from providing energy, capacity and/or ancillary services on a merchant basis,or through long term bilateral contracts with load serving entities, e.g. investor owned utilities, publicly owned utilities and community choice aggregators. We are also pursuing the development and in construction of storage plus Solar PV facilities. We put in place financial instruments, where appropriate, to hedge some of the merchant risk.
C&I and Community BESS
The electricity industry continues to shift from a purely centralized topology where electricity flows only in one direction from centralized power plants to consumers, into a more distributed architecture, that includes distributed energy resources and consumers selling excess electricity generated on-site to the grid. Many C&I companies, campuses, and communities (e.g. electric cooperatives and small municipal utilities) are motivated to purchase renewable energy to meet sustainability goals and reduce costs. While the C&I industry could be a natural expansion of our customer base, our current focus is on the much larger and rapidly growing utility-scale front-of-the-meter applications, as well as on utility-scale behind the meter applications. The opportunity is mainly with municipal utilities and electric cooperatives, such as our Hinesburg project with Vermont Electric Cooperative, where one of the revenue streams our BESS generates comes from selling peak load contribution reduction services to the local utility, which allows it to reduce the demand charges paid to the local RTO/ISO.
Solar PV
The solar PV market continues to grow, drivenand is benefited by constant decline in equipment prices and an increasingthe IRA as well as the general desire to replace conventional generation with renewable resources that are commonly supported by favorable regulatory policies.resources. We are monitoring market drivers with the potential to develop solar PV power plants in locations where we can offer competitively priced power generation. Our current focus is in adding solar PV systems in some of our operating geothermal power plants to reduce internal consumption loads, as well as developing standalone solar PV and BESS projects in targeted regions where economics are favorable as well as developing combined solar PV and BESS projects. Infavorable. Since 2019, we successfully placed in service aone 20MW stand-alone Solar PV project and an additional 30MW of solar PV augmentation system at our Tungsten Mountainsystems adjacent to operating geothermal power plantplants in Churchill County,Nevada. In addition we recently acquired one 20MW stand alone project and 40MW of solar PV augmentation systems adjacent to operating geothermal power plants in Nevada. We are also currently constructing the 20 MW(AC) Wister solar PV project in Imperial County, California, for which a power purchase agreement with San Diego Gas & Electric is in effect and we are currently targeting commercial operation in 2021. Additional potentialdeveloping similar projects are undergoing feasibility analysis, and some are in earlier phases of development.totaling 72MW.
Other Opportunities
Recovered Energy Generation
In addition to our geothermal power generation, activities, we are pursuing recovered energy-based power generationRecovered Energy Generation (REG) opportunities in the United States and worldwide. We believe recovered energy-based power generation will ultimately benefit from the efforts to reduce GHG emissions. WeTo date, we have built 23 power plants in North America which generate electricity utilizing “waste heat”from waste heat from gas turbine-driven compressor stations located along interstate natural gas pipelines, from midstream and gas processing facilities, and from other industrial applications.
SeveralThe passage of the IRA extended ITC for waste energy projects in the United States started before December 31, 2024. As such, twenty states and to some extent the federal government have recognizedrecognize the environmental benefits of recovered energy-based power generation. For example, 18 states currently allow electric utilities to include recovered energy-based power generation in calculating such utilities' compliance with their mandatory or voluntary RPS and/or Energy Efficient Resources Standards. In addition, California modified the Self Generation Incentive Program to allow recovered energy-based power generation to qualify for a per watt incentive. REG power.
AtThe EU aims to become the end of 2020,world’s first climate-neutral continent by 2050, and the United States Congress passed legislation including a provision that makes recovered energy generation property eligible forEuropean Commission set targets to reduce greenhouse gas emissions by 55% by 2030 when compared with 1990 IPCC levels. To meet this goal, it is imperative to decarbonize the energy investment tax credit. Recoveredsector and increase renewables in the energy property that begins construction in 2021 or 2022 is eligible for a 26 percent tax credit,portfolio. We believe this requires diversifying the energy mix and property that begins construction in 2023 is eligible for a 22 percent tax credit.localizing enhanced energy efficiency via integrated energy systems.
In Europe,We believe these policies, incentives, and specifically in Turkey, we see increasing interest in waste heat utilization to generate electricity.
In 2016, the Canadian government ratified its commitments in the Paris Agreement, which features a commitment to reduce emissions by 30% from 2005 levels by 2030. Pursuant to the Greenhouse Gas Pollution Pricing Act, Canadian provinces must have an emission reduction plan in place or be subject to a federal carbon tax in 2018.
This comprehensive climate policy, once fully implemented,ambitious targets will encourage the development of renewable energy technologies, including waste heat recovery,REG, throughout Canada. We believe that Europethe U.S. and other markets worldwide may offer similar opportunities in recovered energy-based power generation.EU and across global markets.
In summary, the market for the recovery of waste heat converted into electricityREG sector exists either when alreadywhere available electricity is expensive or where the regulatory environment facilitates construction and marketing of power generated from recovered waste heat. However, suchthese projects tend to be smallergenerally produce less than 9 MW andso we expect any growth to be relatively slow and geographically scattered.dispersed.
Operations of our Electricity Segment
How We Own Our Power Plants
We customarily establish a separate subsidiary to own interests in each of our power plants. This ensures that the power plant, and the revenues generated by it, will be the only source for repaying indebtedness, if any, incurred to finance the construction or the acquisition (or to refinance the construction or acquisition) of the relevant power plant. If we do not own all of the interest in a power plant, we enter into a shareholders’ agreement or a partnership agreement that governs the management of the specific subsidiary and our relationship with our partner in connection with the specific power plant. Our ability to transfer or sell our interests in certain power plants may be restricted by certain purchase options or rights of first refusal in favor of our power plant partners or the power plant’s power purchasers and/or certain change of control and assignment restrictions in the underlying power plant and financing documents. AllWith certain limited exceptions most of our domestic geothermal and REG power plants are Qualifying Facilities under the PURPA and are eligible for regulatory exemptions from most provisions of the FPA and certain state laws and regulations.
How We Explore and Evaluate Geothermal Resources
Since 2006, we have expanded ourWe conduct exploration activities initially in the United States and in the last few years with an increasing focus internationally.globally. It generally takes two to threefive years from the time we start active exploration of a particular geothermal resource to the time we have an operating production well, assuming we concluderesource confirmation through drilling and testing. This timeframe assumes the resource is commercially viable and determinethere is an intention to pursue its development. Exploration activities generally involve the phases described below.
Initial Evaluation
We identify and evaluate potential geothermal resources by sampling and studying new areas combined with information available fromthrough field investigations using a robust geoscience program identified through both public and private data sources. We generally adhere to the following process, although our process can vary from site to site depending on geological circumstances and prior evaluation:
| •
| We evaluate historic, geologic and geothermal information available from public and private databases, including geothermal, mining, petroleum and academic sources.
|
| •
| We visit sites, sampling fluids for chemistry if necessary, to evaluate geologic conditions.
|
| •
| We evaluate available data, and rank prospects in a database according to estimated size and perceived risk. For example, pre-drilled sites with extensive data are considered lower risk than “green field” sites. Both prospect types are considered critical for our continued growth.
|
| •
| We generally create a digital, spatial geographic information systems (GIS) database and 3D geologic model containing all pertinent information, including thermal water temperature gradients derived from historic drilling, geologic mapping information (e.g., formations, structure, alteration, and topography), and any available archival information about the geophysical properties of the potential resource.
|
| •
| We assess other relevant information, such as infrastructure (e.g., roads and electric transmission lines), natural features (e.g., springs and lakes), and man-made features (e.g., old mines and wells).
|
| •
| We estimate potential generation capacity using several methods and based on analogous producing geothermal fields. This assessment is refined throughout the exploration process.
|
Our initial evaluation is usually conducted by our own staff,internal exploration team, although we might engage outside service providers for some tasks from time to time. The costs associated with an initial evaluation vary from site to site, based on various factors, including the acreage involved and the costs, if any, of obtaining information from private databases or other sources. On average, our expenses for an initial evaluation range from approximately $10,000 (mainly in the U.S.) to $50,000 (mainly in the international prospects) including travel, chemical analyses, and data acquisition.
If we conclude, based on the information considered in the initial evaluation, that the geothermal resource couldhas potential to support a commercially viable power plant, taking into accountconsidering various factors described below, we proceed to land rights acquisition.
Land Acquisition
We acquire land rights to any geothermal resources our initial evaluation indicates could potentially support a commercially viable power plant. For domestic power plants, we either lease or own the sites on which our power plants are located. For our foreign power plants, our lease rights for the power plant site are generally contained in the terms of a concession agreement or other contract with the host government or an agency thereof. In certain cases, we also enter into one or more geothermal resource leases (or subleases) or, a concession, or an option agreement or other agreement granting us the exclusive right to extract geothermal resources from specified areas of land, with the owners (or sublessors) of such land. In some cases, we first obtain the exploration license and once certain investment requirements are met, we can obtain the geothermal exploitation rights. This usually gives us the right to explore, develop, operate, and maintain the geothermal field, including, among other things, the right to drill wells (and if there are existing wells in the area, to alter them) and build pipelines for transmitting geothermal fluid. In certain cases, the holder of rights in the geothermal resource is a governmental entity and in other cases a private entity. Usually the duration of the lease (or sublease) and concession agreement corresponds to the duration of the relevant PPA, if any. In certain other cases, we own the land where the geothermal resource is located, in which case there are no restrictions on its utilization. The BLM and the Minerals Management Service regulate leasehold interests in federal land in the United States. These agencies have rules governing the geothermal leasing process as discussed below under “Description of Our Leases and Lands”.
For most of our current exploration sites in the United States, we acquire rights to use the geothermal resource through land leases with the BLM (which regulates leasehold interests in U.S. federal land), with various states, or through private leases. Under these leases, we typically pay an up-front non-refundable bonus payment, which is a component of the competitive lease process. In addition, we undertake to pay nominal, fixed annual rent payments for the period from the commencement of the lease through the completion of construction. Upon the commencement of power generation, we begin to pay to the lessors long-term royalty payments based on the use of the geothermal resources as defined in the respective agreements. These payments are contingent on the power plant’s revenues. A summary of our typical lease terms is provided below under “Description of our Leases and Lands”. The up-front bonus and royalty payments vary from site to site and are based on, among other things, current market conditions.
Surveys
We conduct geological, geochemical, and/or geophysical surveys on the sitesites we acquire. Following the acquisition of land rights for a potential geothermal resource, we conduct additional surface water analysis, soil surveys, and geologic mapping to determine proximity to possible heat flow anomalies and up-flow/permeable zones. We augment our digital database with the results of those analysis and create conceptual and digital geologic models to describe geothermal system controls. We then initiate a suite of geophysical surveys (e.g., gravity, magnetics, resistivity, magnetotellurics, reflection seismic, LiDAR, and spectral surveys) to assess surface and sub-surface structure (e.g., faults and fractures) and improve the geologic model of fluid-flow conduits and permeability controls. All pertinent geological and geophysical data are used to create three-dimensional geologic models to identify drill locations. These surveys are conducted incrementally considering relative impactvalue and cost, and the geologic model is updated continuously.from progressively.
We make a further determination of the commercial viability of the potential geothermal resource based on the results of this process, particularly the results of the geochemical surveys estimating temperature and the overall geologic model, including potential resource size. If the results from the geochemical surveys are poor (i.e., low derived resource temperatures or poor permeability) or the geologic model indicates small or deep resource,unlikely chance of finding a hydrothermal system, we re-evaluate the commercial viability of the geothermal resource and may not proceed to exploratory drilling. We generally only move forward with those sites that we believe have a moderate to high probability of successful development.
Exploratory Drilling & Testing
We drill one or more exploratory wells on the high priority, relatively low risk sites to confirm and/or define thea geothermal resource. If we proceed to exploratory drilling, we generally use outside contractors to create access roads to drilling sites and related activities. We have continued efforts to reduce exploration costs and therefore, after obtaining drilling permits, we generally drill temperature gradient holes and/or core holes that are lower cost than slim holes (used in the past) using either our own drilling equipment, whenever possible, or outside contractors. If the obtained data supports a conclusion that the geothermal resource can support a commercially viable power plant, it will be used as an observation well to monitor and define the geothermal resource. If the core hole indicates low temperatures or does not support the geologic model of anticipated permeability, it may be plugged, and the area reclaimed. In undrilled sites, we typically step up from shallow (500-1000 feet) to deeper (2000-4000 feet) wells as confidence improves. Following proven temperature in core wells, we typically move to slim and/or full- size wells to quantify permeability.
Each year we determine and approve an exploration budget for the entire exploration activity in such year. We prioritize budget allocation between the various geothermal sites based on commercial, business, and geologicalportfolio management factors. The costs we incur for exploratory drilling vary from site to site based on various factors, including the accessibility of the drill site, the geologyexploration strategy, and conceptual model of the site,resource. The type of exploratory drilling performed varies and can range from shallow temperature gradient wells to medium depth core drilling to full-size exploration wells. The exploration program typically focuses on the depth oflowest cost option to de-risk the resource.prospect such as temperature gradient wells to delineate a thermal anomaly and further de-risk targets with larger diameter wells. However, on average, exploration costs, prior to drilling of a full-size well, are approximately $1.0 million to $3.0$5.0 million for each site, not including land acquisition. We only reach such spending levels for sites that proved to be successfulacquisition, and depending on the success we see in the early stages of exploration. Outside the U.S. exploration costs can be higher.
Pending successful results, a full-size drilling campaign is recommended. Larger diameter wells are required to produce and inject at rates that can evaluate commercial viability of individual wells and the resource. The goal of a full-size exploration campaign is to confirm commercial production and injection zones and allow for a long-term test of the resource.
At various points during our exploration activities, we re-assess whether the geothermal resource involved will support a commercially viable power plant based on information available at that time. Among other things,For example, once we considerhave successful exploration wells, we then test the following factors:resource for up to several months to study long-term viability with temporary surface equipment. Well testing data informs the resource numerical model and supports decisions such as power plant capacity and specifications.
| •
| New data and interpretations obtained concerning the geothermal resource as our exploration activities proceed, and particularly the expected MW capacity power plant the resource can be expected to support. The MW capacity can be estimated using analogous systems and/or quantitative heat in place estimates until results from drilling and flow tests quantify temperature, permeability, and resulting resource size.
|
| •
| Current and expected market conditions and rates for contracted and merchant electric power in the market(s) to be serviced.
|
| •
| Availability of transmission capacity.
|
| •
| Anticipated costs associated with further exploration activities and the relative risk of failure.
|
| •
| Anticipated costs for design and construction of a power plant at the site.
|
| •
| Anticipated costs for operation of a power plant at the site, particularly taking into account the ability to share certain types of costs (such as control rooms) with one or more other power plants that are, or are expected to be, operating near the site.
|
If we conclude that thea geothermal resource involved will support a commercially viable power plant, we proceedmove to the phase of constructing a power plant at the site. Additional wells may be drilled during the plant construction phase to meet the design point criteria.
How We Construct Our Power Plants.
The principal phases involved in constructing one of our geothermal power plants are as follows:
| | • | Drilling production and injection wells. We consider completing the drilling of the first production well to be the beginning of our construction phase for a power plant. However, this is not always sufficient for a full release of a project for construction. The number of production wells varies from plant to plant depending on, among other things, the geothermal resource, the projected capacity of the power plant, the power generation equipment to be used and the way geothermal fluids will be re-injected through injection wells to maintain the geothermal resource and surface conditions. We generally drill the wells ourselves although in some cases we use outside contractors. The cost for each production and injection well varies depending on, among other things, the depth and size of the well and market conditions affecting the supply and demand for drilling equipment, labor and operators. In the last five years, our typical cost for each production and injection well ranged between $1.0 million to $13.0 million. An average cost for a domestic well was approximately $3.5 million and $8.0 million for international wells. |
| | • | Designing the well field, power plant, equipment, controls, and transmission facilities. We usually use our own employees to design the well field and the power plant, including equipment that we manufacture and that will be needed for the power plant. In some cases, depending on complexity and location, we use third parties to help us with the design. The designs vary based on various factors, including local laws, required permits, the geothermal resource, the expected capacity of the power plant and the way geothermal fluids will be re-injected to maintain the geothermal resource and surface conditions. |
| | • | Obtaining any required permits, electrical interconnection and transmission agreements.We use our own employees and from time to time, depending on complexity and location, outside consultants to obtain any required permits and licenses for our power plants that are not already covered by the terms of our site leases. The permits and licenses required vary from site to site and are described below under “Environmental Permits”. |
| | • | Manufacturing (or in the case of equipment we do not manufacture ourselves, purchasing) the equipment required for the power plant.Generally, we manufacture most of the power generating unit equipment we use at our power plants. Multiple sources of supply are typically available for all other equipment we do not manufacture. |
| | • | Assembling and constructing the well field, power plant, transmission facilities, and related facilities.We use our own employees to manage construction work. The construction and installation works (such as site grading, civil, structural, mechanical, insulation, electrical, control and communication works) are normally subcontracted. Construction materials (such as concrete, rebar etc.), construction equipment (cranes, forklifts etc.) and tools are provided by us to the subcontractors in some cases or provided by the subcontractors. |
In recent years, it has taken usapproximately two to three years from the time we drill a production well until thea power plant becomes operational.
Drilling Production and Injection Wells
We consider completing the drilling of the first production well to be the beginning of our construction phase for a power plant. However, this is not always sufficient for a full release of a project for construction. The number of production wells varies from plant to plant depending on, among other things, the geothermal resource, the projected capacity of the power plant, the power generation equipment to be used and the way geothermal fluids will be re-injected through injection wells to maintain the geothermal resource and surface conditions. We generally drill the wells ourselves although in some cases we use outside contractors.
The cost for each production and injection well varies depending on, among other things, the depth and size of the well and market conditions affecting the supply and demand for drilling equipment, labor and operators. In the last five years, our typical cost for each production and injection well is approximately $3.3 million with a range of $1.0 million to $8.5 million.
Design
We usually use our own employees to design the well field and the power plant, including equipment that we manufacture and that will be needed for the power plant. In some cases, depending on complexity and location, we use third parties to help us with the design. The designs vary based on various factors, including local laws, required permits, the geothermal resource, the expected capacity of the power plant and the way geothermal fluids will be re-injected to maintain the geothermal resource and surface conditions.
Permits
We use our own employees and from time to time, depending on complexity and location, outside consultants to obtain any required permits and licenses for our power plants that are not already covered by the terms of our site leases. The permits and licenses required vary from site to site and are described below under “Environmental Permits”.
Manufacturing
Generally, we manufacture most of the power generating unit equipment we use at our power plants. Multiple sources of supply are generally available for all other equipment we do not manufacture.
Construction
We use our own employees to manage the construction work. For site grading, civil, mechanical, and electrical work we use subcontractors.
During 2020,2023, in the Electricity segment, we focused on the commencement of operations at North Valley, Dixie Valley upgrade and Steamboat Hills Repower2-3 Repowering in Nevada, as well as Heber-1 Repowering and Mammoth G2 upgrade in California. In addition, we commenced operations at Brady Solar and Steamboat 2-3 Solar in Nevada. We also beganfocused on construction of CD4, Dixie Meadows and Tungsten Mountain enhancementthe Beowawe repower as well as with enhancement work in some other of our operating power plants worldwide. We also commenced construction of the Guadeloupe enhancement, Beowawe and the North Valley Solar PV projects to supply power to the auxiliary loads of our power plants.
When deciding whether to continue holding lease rights and/or to pursue exploration activity, we diligently prioritize our prospective investments, taking into account resource and probability assessments in order to make informed decisions about whether a particular project will support commercial operation. As a result, during fiscal year 2020 we decided to discontinue our holding in one site in Nevada.
After conducting exploratory studies at those sites, we concluded
We may conclude that the respectivea prospective geothermal resources wouldresource will not support commercial operations. CostsIn such case, costs associated with exploration activities at these sites werewill be expensed accordingly (see “Write-offunder the Write-off of Unsuccessful Exploration Activities” under Item 7 — “Management’s Discussion and AnalysisActivities line item in the consolidated statements of Financial Condition and Results of Operations”).
We added tooperations in our exploration inventory two prospective sites in 2020.financial statements.
How We Operate and Maintain Our Power Plants
Our operations and maintenance practices are designed to minimize operating costs without compromising safety or environmental standards while maximizing plant flexibility and maintaining high reliability. Our operations and maintenance practices for geothermal power plants seek to preserve the sustainable characteristics of the geothermal resources we use to produce electricity and maintain steady-state operations within the constraints of those resources reflected in our relevant geologic and hydrologic studies. Our approach to plant management emphasizes the operational autonomy of our individual plant or complex managers and staff to identify and resolve operations and maintenance issues at their respective power plants; however, each power plant or complex draws upon our available collective resources and experience, and that of our subsidiaries. We have organized our operations such that inventories, maintenance, backup, and other operational functions are pooled within each power plant complex and provided by one operation and maintenance provider. This approach enables us to realize cost savings and enhances our ability to meet our power plant availability goals.
Safety is a key area of concern to us. We believe that the most efficient and profitable performance of our power plants can only be accomplished within a safe working environment for our employees. Our compensation and incentive program includeincludes safety as a factor in evaluating our employees, and we have a well-developed reporting system to track safety and environmental incidents, if any, at our power plants.
How We Sell Electricity
In the United States, theour purchasers of power from our power plants are typically investor-owned electric utility companies or electric cooperatives including public owned utilities, and more recently, we signed a PPA with CCAs. Outside of the United States, our purchasers are either state-owned utilities or privately-owned-entities and weprivately-owned-entities. We typically operate our facilities under rights granted to us by a governmental agency pursuant to a concession agreement. In each case, we enter into long-term contracts (typically, PPAs) for the sale of electricity or the conversion of geothermal resources into electricity. Although previously our power plants’ revenues under a PPA generally consisted of two payments, energy payments and capacity payments, our recent PPAs provide for energy payments only. Energy payments are normally based on a power plant’s electrical output actually delivered to the purchaser measured in kWh, with payment rates either fixed or indexed to the power purchaser’s “avoided” power costs (i.e., the costs the power purchaser would have incurred itself had it produced the power it is purchasing from third parties) or rates that escalate at a predetermined percentage each year. Capacity payments are normally calculated based on the generating capacity or the declared capacity of a power plant available for delivery to the purchaser, regardless of the amount of electrical output actually produced or delivered. In addition, we have sixone domestic power plants located in California, Nevada and Hawaii that areis eligible for capacity bonus payments under the respective PPAs upon reaching certain levels of generation, or subject to a capacity payment reduction if certain levels of generation are not reached.
How We Finance Our Power Plants
Historically weWe have funded our power plants with different sources of liquidity such as a non-recourse or limited recourse debt, lease financing, tax monetization transactions, internally generated cash, which includes funds from operation,operations, as well as proceeds from loans under corporate credit facilities, green convertibles corporate bonds public debt and equity offerings, senior unsecured corporate bonds, project financing and the sale of equity interests and other securities. Such leveragedOur debt financing permits the development of power plants with a limited amount of equity contributions, but also increases the risk that a reduction in revenuescashflow could adversely affect a particular power plant’s ability to meet its debt obligations. Leveraged financing also means that distributions of dividends or other distributions by our power plant subsidiaries to us are contingent on compliance with financial and other covenants contained in the applicable financingfinance documents.
Non-recourse debt or lease financing refers to debt or lease arrangements involving debt repayments or lease payments that are made solely from the power plant’s revenues (rather thanIn 2023, we raised several corporate and project finance loans, we raised equity, commercial papers and expanded and renewed our revenues or revenues of any other power plant) and generally are secured by the power plant’s physical assets, major contracts and agreements, cash accounts and, in many cases, our ownership interest in our affiliate that owns that power plant. These forms of financing are referred to as “project financing”.
In the event of a foreclosure after a default, our affiliate that owns the power plant would only retain an interest in the power plant assets, if any, remaining after all debts and obligations have been paid in full. In addition, incurrence of debt by a power plant may reduce the liquidity of our equity interest in that power plant because the equity interest is typically subject both to a pledge in favor of the power plant’s lenders securing the power plant’s debt and to transfer and change of control restrictions set forth in the relevant financing agreements.
Limited recourse debt refers to project financing as described above with the addition of our agreement to undertake limited financial support for our affiliate that owns the power plant in the form of certain limited obligations and contingent liabilities. These obligations and contingent liabilities may take the form of guarantees of certain specified obligations, indemnities, capital infusions and agreements to pay certain debt service deficiencies. Creditors of a project financing of a particular power plant may have direct recourse to us to the extent of these limited recourse obligations.
In 2020, we completed an equity offering, issued senior unsecured corporate bonds and raised corporaterevolving credit facilities to support our geothermal and storage growth.
We In addition, we have used financing structures to monetize PTCs and tax depreciation such as our tax equity partnership transaction involving McGinness Hills phase 3, Tungsten,for the North Valley power plant and an operating lease arrangement relating to our Puna complex power plantswe sold ITCs and PTCs that was recently retired in 2019.can be transferred for the first time.
We have also used a sale
How We Mitigate International Political Risk.
We generally, but not always, purchase insurance policies to cover our portion of our book equity exposure to certain political risks involved in operating in developing countries, as described below under “Insurance”. However, insurance may not cover all political risks or coverage amounts may not be sufficient.
Description of Our Leases and Lands
We have domestic leases on approximately 338,123377,780 acres of federal, state, and private land in California, Hawaii, Nevada, New Mexico, Utah, Idaho and Oregon. The approximate breakdown between federal, state and private leases and owned land is as follows:
| | • | 78%~80% of the acreage under our control is leased from the U.S. government, acting mainly through the BLM;
|
| | • | 18%~16% is leased or subleased from private landowners and/or leaseholders;
|
| | • | ~2% is leased from various states. |
Each of the leases within each of the categories abovelease has standard terms and requirements, as summarized below. Internationally, our land position includes approximately 60,90359,154 acres.
BLM Geothermal Leases
Certain of our domestic project subsidiaries have entered into geothermal resourcesresource leases with the U.S. government, pursuant to which they have obtained the right to conduct their geothermal development and operations on federally-owned land. These leases are made pursuant to the Geothermal Steam Act and theAct. The lessor under such leases is the U.S. government, acting through the BLM.
BLM geothermal leases grant the geothermal lessee the right and privilege to drill for, extract, produce, remove, utilize, sell, and dispose of geothermal resources on certain lands, together with the right to build and maintain necessary improvements thereon. The actual ownership of the geothermal resources and other minerals beneath the land is retained in the federal mineral estate. The geothermal lease does not grant to the geothermal lessee the exclusive right to develop the lands, although the geothermal lessee does hold the exclusive right to develop geothermal resources within the lands. Since BLM leases do not grant to the geothermal lessee the exclusive right to use the surface of the land, BLM may grant rights to others for activities that do not unreasonably interfere with the geothermal lessee’s uses of the same land, including use, off-road vehicles, and/or wind or solar energy developments.
Typical BLM leases issued to geothermal lessees before August 8, 2005 have a primary term of ten years and will renew so long as geothermal resources are being produced or utilized in commercial quantities but cannot exceed a period of forty years after the end of the primary term. If at the end of the forty-year period geothermal steam is still being produced or utilized in commercial quantities and the lands are not needed for other purposes, the geothermal lessee will have a preferential right to renew the lease for a second forty-year term, under terms and conditions as the BLM deems appropriate.
BLM leases issued after August 8, 2005 have a primary term of ten years. If the geothermal lessee does not reach commercial production within the primary term, the BLM may grant two five-year extensions. If the lessee is drilling a well for the purposes of commercial production, the lease may be extended for five years and thereafter, as long as steam is being produced and used in commercial quantities, the lease may be extended for up to thirty-five years. If, at the end of the extended thirty-five-year term, geothermal steam is still being produced or utilized in commercial quantities and the lands are not needed for other purposes, the geothermal lessee will have a preferential right to renew the lease under terms and conditions as the BLM deems appropriate.
For BLM leases issued before August 8, 2005, the geothermal lessee is required to pay an annual rental fee (on a per acre basis), which escalates according to a schedule described therein, until production of geothermal steam in commercial quantities has commenced. After such production has commenced, the geothermal lessee is required to pay royalties (on a monthly basis) on the amount or value of (i) steam, (ii) by-products derived from production, and (iii) commercially de-mineralized water sold or utilized by the project (or reasonably susceptible to such sale or use).
For BLM leases issued after August 8, 2005, (i) a geothermal lessee who has obtained a lease through a non-competitive bidding process will pay an annual rental fee equal to $1.00 per acre for the first ten years and $5.00 per acre each year thereafter; and (ii) a geothermal lessee who has obtained a lease through a competitive process will pay a rental equal to $2.00 per acre for the first year, $3.00 per acre for the second through tenth year and $5.00 per acre each year thereafter. Rental fees paid before the first day of the year for which the rental is owed will be credited towards royalty payments for that year. For BLM leases issued, effective, or pending on August 5, 2005 or thereafter, royalty rates are fixed between 1.0-2.5% of the gross proceeds from the sale of electricity during the first ten years of production under the lease. The royalty rate set by the BLM for geothermal resources produced for the commercial generation of electricity but not sold in an arm’s length transaction is 1.75% for the first ten years of production and 3.5% thereafter. The royalty rate for geothermal resources sold by the geothermal lessee or an affiliate in an arm’s length transaction is 10.0% of the gross proceeds from the arm’s length sale.
In the event of a default under any BLM lease, or the failure to comply with any of the provisions of the Geothermal Steam Act or regulations issued under the Geothermal Steam Act or the terms or stipulations of the lease, the BLM may, 30 days after notice of default is provided to the relevant project, (i) suspend operations until the requested action is taken, or (ii) cancel the lease.
Private Geothermal Leases
Certain of our domestic project subsidiaries have entered into geothermal resources leases with private parties, pursuant to which they have obtained the right to conduct their geothermal development and operations on privately owned land. In many cases, the lessor under these private geothermal leases owns only the geothermal resource and not the surface of the land.
Typically, the leases grant our project subsidiaries the exclusive right and privilege to drill for, produce, extract, take and remove from the leased land water, brine, steam, steam power, minerals (other than oil), salts, chemicals, gases (other than gases associated with oil), and other products produced or extracted by such project subsidiary. The project subsidiaries are also granted certain non-exclusive rights pertaining to the construction and operation of plants, structures, and facilities on the leased land. Additionally, the project subsidiaries are granted the right to dispose geothermal fluid as well as the right to re-inject into the leased land water, brine, steam, and gases in a well or wells for the purpose of maintaining or restoring pressure in the productive zones beneath the leased land or other land in the vicinity. Because the private geothermal leases do not grant to the lessee the exclusive right to use the surface of the land, the lessor reserves the right to conduct other activities on the leased land in a manner that does not unreasonably interfere with the geothermal lessee’s uses of the same land, which other activities may include agricultural use (farming or grazing), recreational use and hunting, and/or wind or solar energy developments.
The leases provide for a term consisting of a primary term in the range of five to 30 years, depending on the lease, and so long thereafter as lease products are being produced or the project subsidiary is engaged in drilling, extraction, processing, or reworking operations on the leased land.
As consideration under most of our project subsidiaries’ private leases, the project subsidiary must pay to the lessor a certain specified percentage of the value “at the well” (which is not attributable to the enhanced value of electricity generation), gross proceeds, or gross revenues of all lease products produced, saved, and sold on a monthly basis. In certain of our project subsidiaries’ private leases, royalties payable to the lessor by the project subsidiary are based on the gross revenues received by the lessee from the sale or use of the geothermal substances, either from electricity production or the value of the geothermal resource “at the well”.
In addition, pursuant to the leases, the project subsidiary typically agrees to commence drilling, extraction or processing operations on the leased land within the primary term, and to conduct such operations with reasonable diligence until lease products have been found, extracted and processed in quantities deemed “paying quantities” by the project subsidiary, or until further operations would, in such project subsidiary’s judgment, be unprofitable or impracticable. The project subsidiary has the right at any time within the primary term to terminate the lease and surrender the relevant land. If the project subsidiary has not commenced any such operations on said land (or on the unit area, if the lease has been unitized), or terminated the lease within the primary term, the project subsidiary must pay to the lessor, in order to maintain its lease position, annually in advance, a rental fee until operations are commenced on the leased land.
If the project subsidiary fails to pay any installment of royalty or rental when due and if such default continues for a period of fifteen days specified in the lease, for example, after its receipt of written notice thereof from the lessor, then at the option of the lessor, the lease will terminate as to the portion or portions thereof as to which the project subsidiary is in default. If the project subsidiary defaults in the performance of any obligations under the lease, other than a payment default, and if, for a period of 90 days after written notice is given to it by the lessor of such default, the project subsidiary fails to commence and thereafter diligently and in good faith take remedial measures to remedy such default, the lessor may terminate the lease.
We do not regard any property that we lease as material unless and until we begin construction of a power plant on the property, that is, until we drill a production well on the property.
Description of Our Power Plants
Domestic Operating Power Plants
The following descriptions summarize certain industry metrics for our domestic operating power plants:
Power plants in the United States
Project Name | | Size (MW) | | Technology | | Resource Cooling | | Customer | | PPA Expiration | Size (MW) | Technology | Resource Cooling | Customer | PPA Expiration |
| | | | | | | | | | | | |
Brawley | | 13 | | Geothermal water-cooled binary system | | Depends on the mix of used production wells | | SCE | | 2031 | 7 | Geothermal water-cooled binary system | Depends on the mix of used production wells , with current decline rate around 1°F per year | SCE | 2031 |
| | | | | | | | | | | | | | | |
Brady Complex | | 26 | | Geothermal air and water-cooled binary system | | Brady - 2.6°F per year Desert Peak 2 - 2°F per year | | | | Brady — 2022
Desert Peak 2 — 2027 | 24 | Geothermal air and water-cooled binary system | Brady and Desert Peak 2 - less than 3°F per year | Brady - SCPPA DP2 - NV Energy | Brady — 2043 Desert Peak 2 — 2027 |
| | | | | | | | | | | | | | | |
Don A. Campbell Complex (1)(2) | | 32 | | Geothermal air cooled binary system | | Testing is in process to develop a plan to mitigate temperature decline | | SCPPA | | Phase 1 - 2034
Phase 2 - 2036 | |
Brady Solar | | 6 | Solar PV System | NA | Internal use (11) | NA |
| | | | | | |
Don A. Campbell Complex (1) | | 30 | Geothermal air cooled binary system | 4°F to 5°F per year | SCPPA | Phase 1 - 2034 Phase 2 - 2036 |
| | | | | | | | | | | | | | | |
Heber Complex (3) | | 81 | | Geothermal dual flash and binary systems using a water cooled system | | 1°F per year | | SCPPA | | Heber 1 — 2025
Heber 2 — 2023
Heber South — 2031(13) | 91 | Geothermal dual flash and binary systems using a water cooled system | 1°F to 2°per year | SCPPA and Peninsula Clean Energy (PCE), CPA | Heber 1 — 2025 Heber 2 — 2037 Heber South — 2031 |
| | | | | | | | | | | | | | | |
Jersey Valley | | 8 | | Geothermal air cooled binary system | | 3°F per year | | Nevada Power Company | | 2032 | 8 | Geothermal air cooled binary system | Under 2°F per year | Nevada Power Company | 2032 |
| | | | | | |
Mammoth Complex | | 65 | Geothermal air cooled binary system | Less than 2°F per year | PG&E and Southern California Edison. Monterey Bay, SCPPA and SVCE | G-1 and G-3 - 2034 CD4 - 2047 G-2 plant - 2027 |
| | | | | | |
McGinness Hills Complex | | 146 | Geothermal air cooled binary system | About 5.5°F per year | Nevada Power Company and SCPPA. | Phases 1 and 2 - 2033 Phase 3 - 2043. |
| | | | | | |
Neal Hot Springs (5) | | 22 | Geothermal air cooled binary system | 1.5°F over the past year | Idaho Power Company | 2038 |
Mammoth Complex | | 30 | | Geothermal air cooled binary system | | Less than 0.5°F per year | | PG&E and Southern California Edison. | | G-1 and G-3 - 2034
G-2 plant - 2027 |
| | | | | | | | | | | |
McGinness Hills Complex | | 145 | | Geothermal air cooled binary system | | Initial declined of 3°F observed in the past two years | | Nevada Power Company and SCPPA. | | Phases 1 and 2 - 2033
Phase 3 - 2043. |
| | | | | | | | | | | |
Neal Hot Springs (4) | | 24 | | Geothermal air cooled binary system | | 1°F over the past year | | Idaho Power Company | | 2038 |
| | | | | | | | | | | |
OREG 1 (2) | | 22 | | Geothermal air cooled binary system | | NA | | Basin Electric Power Cooperative | | 2031 |
| | | | | | | | | | | |
OREG 2 (2) | | 22 | | Geothermal air cooled binary system | | NA | | Basin Electric Power Cooperative | | 2034 |
| | | | | | | | | | | |
OREG 3 (2) | | 5.5 | | Geothermal air cooled binary system | | NA | | Great River Energy. | | 2029 |
| | | | | | | | | | | |
OREG 4 | | 3.5 | | Geothermal air cooled binary system | | NA | | Highline Electric Association. | | 2029 |
| | | | | | | | | | | |
Ormesa Complex (5) | | 36 | | Geothermal water-cooled binary system and water-cooled flash system. | | Less than 1°F per year | | SCPPA under a single PPA. | | 2042 |
| | | | | | | | | | | |
Puna Complex (2),(6) | | 38 | | Geothermal combined cycle and air cooled binary system | | The resource temperature was stable prior to the volcano eruption. The shut- down of the power plant resulted in some increase in temperature, and reservoir studies are underway to quantify any changes | | HELCO | | 2027 |
| | | | | | | | | | | |
Raft River | | 12 | | Geothermal water-cooled binary system | | No cooling. Temperatures remain stable. | | Idaho Power Company. | | 2032 |
| | | | | | | | | | | |
San Emidio | | 11 | | Geothermal- water-cooled binary system | | In 2020, the average brine inlet temperature reduced by 1oF | | NV Energy. | | 2038 |
| | | | | | | | | | | |
Steamboat Complex (7) | | 84 | | Geothermal air and water-cooled binary system and a single flash system | | Lower Steamboat - between 2°F to 3°F per year
Steamboat Hills 4°F per year | | * Steamboat 2 & 3- Sierra Pacific Power Company
* Galena1 & 3- Nevada Power Company
* Galena 2 & Steamboat Hills- SCPPA | | Steamboat 2 and 3- 2022
Galena1- 2026
Steamboat Hills and Galena 2 - 2043
Galena 3- 2028 |
OREG 1 | 22 | Geothermal air cooled binary system | NA | Basin Electric Power Cooperative | 2031 |
| | | | | | |
OREG 2 | 22 | Geothermal air cooled binary system | NA | Basin Electric Power Cooperative | 2034 |
| | | | | | |
OREG 3 | 5.5 | Geothermal air cooled binary system | NA | Great River Energy. | 2029 |
| | | | | | |
OREG 4 | 3.5 | Geothermal air cooled binary system | NA | Highline Electric Association. | 2029 |
| | | | | | |
Ormesa Complex | 34 | Geothermal water-cooled binary system and water-cooled flash system. | Less than 1.5°F per year | SCPPA under a single PPA. | 2042 |
| | | | | | |
Puna Complex (2),(6) | 38 | Geothermal combined cycle and air cooled binary system | The resource temperature is stable | HELCO | 2027 |
| | | | | | |
Raft River | 12 | Geothermal water-cooled binary system | The resource temperature is stable | Idaho Power Company. | 2032 |
| | | | | | |
San Emidio Complex | 39 | Geothermal- water-cooled binary system | 3°F to 4°per year | NV Energy. | 2038/2048 |
| | | | | | |
Steamboat Complex | 79 | Geothermal air and water-cooled binary system and a single flash system | Total field declining at 2 to 3°F per year | * Steamboat 2 & 3- SCPPA * Galena1 & 3- Nevada Power Company * Galena 2 & Steamboat Hills- SCPPA | Steamboat 2 and 3- 2043 Galena1- 2026 Steamboat Hills and Galena 2 - 2043 Galena 3- 2028 |
| | | | | | |
Steamboat Complex Solar | 12 | Solar PV System | NA | Internal use (11) | NA |
| | | | | | |
Tungsten Mountain Geothermal | 40 | Geothermal air and water-cooled binary system | About 3°F per year | SCPPA | 2043 |
| | | | | | |
Tungsten Mountain Solar | 12 | Solar PV System | NA | Internal use (11) | NA |
| | | | | | |
Tuscarora | 17 | Geothermal water-cooled binary system | Temperature decline is currently at about 2°F per year | Nevada Power Company. | 2032 |
| | | | | | |
Dixie Valley | 64 | Geothermal air-cooled binary system and water-cooled flash system. | The resource temperature is stable | SCE | 2038 |
Tungsten Mountain Geothermal (8) | | 29 | | Geothermal air and water-cooled binary system | | 1°F to 2°F per year | | SCPPA | | 2043 |
| | | | | | | | | | | |
Tungsten Mountain solar | | 7 | | solar PV System | | NA | | SCPPA | | 2043 |
| | | | | | | | | | | |
Tuscarora | | 18 | | Geothermal water-cooled binary system | | We expect continued gradual decline in the cooling rate from less than 3°F per year to less than 1°F per year over the long term | | Nevada Power Company. | | 2032 |
Beowawe | 14 | Flash System and Binary | 1°F per year | NV Energy | 2025 |
| | | | | | |
Wister | 20 | Solar PV System | NA | San Diego Gas & Electric | 2042 |
| | | | | | |
Still Water Complex | 12 | Geothermal air cooled binary system | 1°F per year | NV Energy | 2029 |
| | | | | | |
Still Water Solar PV | 40 | Solar PV System | NA | Internal use (11) | NA |
| | | | | | |
Salt Wells | 10 | Geothermal air cooled binary system | Less than 1°F per year | NV Energy | 2029 |
| | | | | | |
Cove Fort | 18 | Geothermal air cooled binary system | Stable | Salt River Project | 2033 |
| | | | | | |
Woods Hill | 20 | Solar PV System | NA | Seven different off-takers in Connecticut | 2038 |
Foreign Power plants in Rest of the World
Project Name | | Size (MW) | | Technology | | Resource Cooling | | Customer | | PPA Expiration |
| | | | | | | | | | | |
Amatitlan (Guatemala) (8) | | 20 | | Geothermal air cooled binary system and a small back pressure steam turbine (one MW) | | Stable | | INDE and another local purchaser. | | 2028 |
| | | | | | | | | | | |
Bouillante (France) (9) | | 15 | | Geothermal direct steam turbines. | | Stable | | EDF pursuant to a PPA. | | 2030 |
| | | | | | | | | | | |
Olkaria III Complex (Kenya) (12) | | 150 | | Geothermal air cooled binary system | | Less than 1°F per year | | KPLC | | Plant 2 - 2033
Plant 1&3 - 2034
Plant 4 - 2036 |
| | | | | | | | | | | |
Platanares (Honduras) (10) | | 38 | | Geothermal air cooled binary system | | 2°F per year | | ENEE pursuant to a PPA. | | 2047 |
| | | | | | | | | | | |
Sarulla Complex - (Indonesia) (11) | | 330 (our share is 42) | | Geothermal Combined Cycle steam and binary systems | | Stable | | PLN | | 2047 |
| | | | | | | | | | | |
Zunil (Guatemala) | | 20 | | Geothermal air cooled binary system | | Stable | | INDE | | 2034 |
Project Name | Size (MW) | Technology | Resource Cooling | Customer | PPA Expiration |
Amatitlan (Guatemala) | 20 | Geothermal air cooled binary system and a small back pressure steam turbine (one MW) | Declining at about 2°F per year | INDE and another local purchaser. | 2028 |
| | | | | | |
Bouillante (France) (7) | 15 | Geothermal direct steam turbines. | The resource temperature is stable | EDF pursuant to a PPA. | 2030 |
| | | | | | |
Olkaria III Complex (Kenya) (8) | 150 | Geothermal air cooled binary system | Declining at 2°F to 2°F per year | KPLC | Plant 2 - 2033 Plant 1&3 - 2034 Plant 4 - 2036 |
| | | | | | |
Platanares (Honduras) (9) | 33 | Geothermal air cooled binary system | Decline rate has increased and is at 6° to 7°F per year | ENEE | 2047 |
| | | | | | |
Sarulla Complex - (Indonesia) (10) | 330 (our share is 42) | Geothermal Combined Cycle steam and binary systems | Declining at about 3°F per year and SIL is decling at about 1°F per year | PLN | 2047 |
| | | | | | |
Zunil (Guatemala) | 20 | Geothermal air cooled binary system | The resource temperature is stable | INDE | 2034 |
(1) Don A. Campbell is experiencing cooling since mid-2016, thatwith 4°F to 5°F in the last year, which is reducing its generating capacity. Injection testsTemperature mitigation program is ongoing. New and tracer studies, along with reservoir modeling have been usedhotter production well was added in late 2023 and we expect to develop a plan to mitigate temperature declinebegin using new injection wells in 2024.
(2) Indirectly36.75% indirectly owned 36.75% by Northleaf.
(3) We are currently incompleted the processenhancement of enhancing the Heber 1complex and Heber 2 power plants as discussed below.
(4)Owned 40%generating capacity increased by Enbridge Inc. Upgrades to the power plant were completed in 2020.10 MW.
(5)We successfully replaced old equipment at the Ormesa power plant.40% owned by Enbridge Inc.
(6)On May 3, 2018, the Kilauea volcano located in close proximity to our Puna 38 MW geothermal power plant in the Puna district of Hawaii's Big Island erupted following a significant increase in seismic activity in the area. The Puna power plant was shut down immediately and resumed partial operationoperations in November 2020. We plan to continue drilling2020 and workovers and get back to full operation by mid-2021.in October 2023 reached at a level of 30 MW. In 2019, we reached an agreement with HELCO and signedrecently, following a new PPA that was filed withfew amendments, received the local PUC for approval.final approval of the PUC. The new PPA extends the current termPPA until 2052 and increases the current contract capacity by 8 MW to 46MW.a 46MW maximum with 30MW minimum. In addition, the new PPA has a fixed price with no escalation, regardless of changes to fossil fuel pricing, which impacts the majority of our current pricing under the existing PPA. The existing PPA remains in effect until the new units will commence operation, expected to be three years from PUC approval (which was granted in January 2024).
(7)In June 2020, we completed the enhancement of Steamboat Hills and added 19MW to the Steamboat complex.
(8)Planning 2021 workover to maintain production.
(9)85% of the Bouillante power plant is jointly owned jointly by Ormat and CDC, with 75% allocated 75% to Ormat and 25% to CDC.
(10)(8) The Olkaria complex experienced lower performance of the wellfield since 2021 and is currently generating 126 MW.
(9)We hold the Platanares assets, including the project’s wells, land, permits and a PPA, under a BOT structure for 15 years from the date the Platanares plant commenced commercial operation on September 26, 2017. A portion of the land on which the project is located is held by us through a lease from a local municipality.
(11)(10) The Sarulla complex is experiencing a reduction in generation primarily due to well fieldwellfield issues at one of its power plants, as well as equipment failures which resulted in a decrease in profitability. In the NILsecond quarter of 2022, Sarulla agreed with its banks on a framework to perform remediation works that are aimed to restore the power plants.plants' performance. The outcome of the first phase of the recovery plan is under evaluation after which we will make a decision regarding the implementation of the second phase. As we determined that the current situation and circumstances related to our equity method investment in Sarulla are temporary, no impairment testing was required for the period.
(12) (11)The Olkaria complex experienced significant curtailments fromTungsten, Brady Steamboat Solar and Still Water power plants generate energy that is used for the local off-taker that reduced generation in 2020.
(13) Underauxiliary power of the Heber South contract the parties have six months notice termination right.geothermal power plants
Future Projects
Projects Released for Construction
We have several projects in various stages of construction, including six11 projects that we have fully released for construction with a total capacity of 162 MW and one project with capacity of 10 MW to 15 MW that is in the early stagestages of construction. In 2020, due to COVID-19 and other factors, we saw continuous delays in getting all relevant permits and as a result we are seeing continuous delays in the expected COD.
These projects are expected to have a total geothermal generating capacity of between 82 MW and 87104 MW (representing our interest) and one solar PV projects with a total capacity of 2058 MW .
Project Name | Location | Expected Size (MW) | | Technology | | Customer | | Expected COD | | Current Condition |
| | | | | | | | | | | |
Heber ComplexBeowawe Repower
| Nevada, U.S. | 116
| | Geothermal air-cooled binary system | | SCE and SCPPAQ3 2024
| | H1 2022
| | Permitting, engineering and procurement ongoing. Manufacturing and construction commenced.Construction progressing
|
| | | | | | | | | | |
CD4Zunil
| Guatemala | 305
| | Geothermal air-cooled binary system | INDE | SCPPA - 16 MW
Silicon Valley Clean Energy - 7 MW
Monterey Bay Community Power - 7 MWQ4 2024
| | Q1 2022
| | Engineering and procurement commencedConstruction near completion
|
| | | | | | | | | | |
McGinness Hills ExpansionIjen1
| Indonesia | 815
| | Geothermal air-cooled binary system | PLN | SCPPAQ4 2024
| | H1 2021
| | Major Equipment shipped. Construction is in progress |
| | | | | | | | | | |
Dixie MeadowsBouillante
| Guadeloupe | 1210
| | Geothermal air-cooled binary system | EDF | SCPPAQ4 2025
| | End 2021
| | Engineering and procurement are ongoing. Delays due to permitting
|
| | | | | | | | | | |
Tungsten Mountain 2
| | 11
| | Geothermal air-cooled binary system
| | SCPPA
| | H2 2022
| | Engineering and procurement have commenced
|
| | | | | | | | | | |
Wister solar
| | 20 AC
| | solar PV
| | SDG&E
| | H2 2021
| | Engineering and procurement ongoing |
Topp 2 | New Zealand | 50 | Geothermal | EGL | Q4 2025 | Engineering, Procurement and Manufacturing ongoing |
Dominica | Dominica | 10 | Geothermal | DOMLEC | Q4 2025 | |
Puna expansion | Hawaii, U.S. | 8 | Geothermal | PUC | H2 2026 | |
Steamboat Hills Solar | Nevada, U.S. | 4 | Solar PV System | Internal use | Q1 2024 | Construction near completion |
North Valley Solar | Nevada, U.S. | 6 | Nevada, U.S. | Internal use | Q2 2024 | Construction ongoing |
Beowawe Solar | Beowawe Solar | 6 | Nevada, U.S. | Internal use | Q2 2024 | Waiting on building permit |
Arrowleaf Solar | California, U.S. | 42 | Solar PV System | SDCP | H1 2025 | |
Carson Lake | Nevada, U.S. | 10 - 15 | | Geothermal air-cooled binary system | | No PPA | | TBD | | Early stage of construction
On Hold |
(1) Represents Ormat’s 49% equity share in the project
Projects under Various Stages of Development that were not Released for Construction
We also have projects under various stages of development in the United States that we estimate will increase the generating capacity of our geothermal projects by approximately 39 MW (representing our interest) and Guadeloupe.a Solar PV project with a total of 14 MW. We expect to continue to explore these and other opportunities for expansion so long as they continue to meet our business objectives and investment criteria.
The following is a description of the projects currently under various stages of development and for which we are able to estimate their expected generating capacity. Upon completion of these projects, the generating capacity of our geothermal projects would increase by approximately between 68 MW to 73 MW (representing our interest) and solar PV projects with a total of 20 MW . However, we prioritize our investments based on their readiness for continued construction and expected economics and therefore we are not planning to invest in all of such projects in 2021.2024.
Project | | Location | | Technology | | Size (MW) | | Customer | | Expected COD |
| | | | | | | | | | | |
Bouillante power plant | | Guadeloupe | | Geothermal | | 10 | | Under discussion with EDF | | 2023 |
| | | | | | | | | | | |
Steamboat solar | | Nevada, U.S. | | solar PV | | 10 AC | | SCPPA | | 2022/2023 |
| | | | | | | | | | | |
North Valley | | Nevada, U.S. | | Geothermal | | 30 | | TBD | | 2022 |
| | | | | | | | | | | |
Puna Expansion | | Hawaii, U.S. | | Geothermal | | 8 | | HELCO | | 2022 |
| | | | | | | | | | | |
Ijen | | Indonesia | | Geothermal | | 15-20 (1) | | PLN | | 2023 |
| | | | | | | | | | | |
Zunil | | Guatemala | | Geothermal | | 5 | | ENEE | | 2022 |
| | | | | | | | | | | |
Tungsten Solar 2 | | Nevada, U.S. | | solar PV | | 4 AC | | SCPPA | | 2022 |
| | | | | | | | | | | |
Brady Solar | | Nevada, U.S. | | solar PV | | 6 AC | | SCPPA | | 2022 |
Project | Location | Technology | Size (MW) | Customer | Expected COD | Current Condition |
North Valley 2 | Nevada, U.S. | Geothermal | 10 | NV Energy | H2 2026 | |
McGinness Solar | Nevada, U.S. | Solar PV | 14 | SCPPA | 2025 | |
Dixie Meadows | Nevada, U.S. | Geothermal | 12 | SCPPA | On Hold | On hold. |
Cove Fort | Utah, U.S. | Geothermal | 7 | Salt River Project | End 2025 | |
Still Water | NV, U.S | Geothermal | 5 | NV Energy | End 2025 | |
Salt Wells | NV, U.S | Geothermal | 5 | NV Energy | End 2025 | |
(1) The size of the project reflects Ormat's 49% interest share in the project
Future Prospects
We have a substantial land position that is expected to support future development and on which we have started or plan to start exploration activity. When deciding whether to continue holding lease rights and/or to pursue exploration activity, we diligently prioritize our prospective investments, taking into account resource and probability assessments in order to make informed decisions about whether a particular project will support commercial operation.
During fiscal year 2020, we discontinued holding a lease at one prospect at Mary's River, Nevada and we moved one prospect to construction (Tungsten Mountain 2) and one prospect (North Valley) to development. In 2019 we discontinued holding two prospects at Glamis, California and at Lake View, Oregon. We added three new prospects in 2020, in the United States and Indonesia.
Our current land position is comprised of various leases, concessions and private land for geothermal resources of approximately 254,000 acres in 4142 prospects includingacross the following:
Nevada (21)
western United States, Latin America and Africa. In the United States we hold 33 prospects:
| 1•
| Alum22 prospects in Nevada
|
| • | Under exploration drilling;4 prospects in California
|
| • | Under exploration drilling;4 in Utah
|
| 3•
| Colado
| Exploration studies1 in progress;
|
4
| Comstock
| Exploration studies in progress;
|
5
| Crescent Valley
| Exploration studies in progress;
|
6
| Dixie Meadows 2
| Exploration studies in progress;
|
7
| Lone Mountain (formerly Emigrant)
| Exploration studies in progress;
|
8
| Gerlach
| Exploration studies in progress;
|
9
| Whirlwind (formerly Horsehaven)
| Exploration studies in progress;
|
10 | Juniper (Formerly North Valley)
| Exploration studies in progress;
|
11 | Lee Hot Springs
| Exploration studies in progress;
|
12 | Mason
| Exploration studies in progress;
|
13 | McGee
| Exploration studies in progress;
|
14 | New York Canyon | Under exploration drilling;
|
15 | Pearl Hot Springs
| Exploration studies in progress;
|
16 | Pinto Hot Springs
| Exploration studies in progress;
|
17 | Rawhide
| Exploration studies in progress;
|
18 | Rhodes Marsh
| Exploration studies in progress;
|
19 | South Brady
| Lease aquired but no further actions has been taken yet
|
20 | Tuscarora 2
| Assessment for future expansion; and
|
21 | Twin Buttes
| Under exploration studies.Mexico
|
California (4)
Outside the U.S. we hold 9 prospects:
| 1•
| Geysers
| Exploration studies2 prospects in progress;
|
2
| Rhyolite Plateau
| Exploration studies in progress;
|
3
| Sandpiper
| Exploration studies in progress; and
|
4
| Truckhaven
| Exploration studies in progress.Indonesia
|
Oregon (2)
| 1•
| Crump Geysers
| Exploration studies in progress; and
|
2
| Vale
| Exploration studies in progress.4 prospects Ethiopia
|
New Mexico (1)
| 1.•
| Rincon
| Exploration studies2 prospects in progress.Guatemala
|
Utah (2)
| 1•
| Baily Mountain (Formerly Roosevelt Hot Springs)
| Exploration studies1 prospect in progress; and
|
2
| Pavant
| Exploration studies in progress.Honduras
|
Guatemala (2)
1.
| Amatitlan Phase II
| Exploration studies in progress; and
|
2.
| Tecumburu
| Exploration studies in progress.
|
New Zealand (1)
1.
| Tikitere
| Signed BOT agreement; exploration activity is on hold.
|
Honduras (1)
1.
| San Ignacio (12 Tribes)
| Exploration studies in progress.
|
Madagascar (1)
1. | Antsirabe | Exploration studies in progress. |
Indonesia (2)
1.
| Bitung
| Under exploration drilling; and
|
2.
| Wapsalit
| Under Exploration drilling.
|
Ethiopia (4)
1.
| Boku
| Under exploration studies;
|
2.
| Dofan
| Under exploration studies;
|
3.
| Dugumo Fango
| Under exploration studies; and
|
4.
| Shashamane
| Under exploration studies.
|
Operations of our Product Segment
Power Units for Geothermal Power Plants
We design, manufacture, and sell power units for geothermal electricity generation, which we refer to as OECs. Our customers include contractors and geothermal plant owners and operators.
The power units are usually paid for in installments, in accordance with milestones set forth in the supply agreement. We also provide the purchaser with spare parts (either upon their request or our recommendation). We provide the purchaser with at least a 12-month warranty for such products. We provide the purchaser with performance guarantees (usually in the form of standby letters of credit), which partially terminates upon delivery of the equipment to the site and terminates in full at the end of the warranty period.
Power Units for Recovered Energy-Based Power Generation
We design, manufacture, and sell power units used to generate electricity from recovered energy or so-called “waste heat”. Our existing and target customers include interstate natural gas pipeline owners and operators, gas processing plant owners and operators, cement plant owners and operators, and other companies engaged in other energy-intensive industrial processes. We manufacture and sell the power units for recovered energy-based power generation to third parties for use in “inside-the-fence” installations or otherwise. Our customers include gas processing plant owners and operators, cement plant owners and operators and companies in the process industry.
Remote Power Units and other Generators
We design, manufacture and sell fossil fuel powered turbo-generators with capacities ranging from 200 watts to 5,000 watts, which operate unattended in extreme hot or cold climate conditions. The remote power units supply energy to remote unmanned installations and along communications lines and provide cathodic protection along gas and oil pipelines. Our customers include contractors installing gas pipelines in remote areas. In addition, we manufacture and sell generators, including heavy duty direct current generators, for various other uses. The terms for sale of the turbo-generators are similar to those for the power units we produce for power plants.
EPC of Power Plants
We engineer, procure and construct, as an EPC contractor, geothermal and recovered energy power plants on a turnkey basis, using power units we design and manufacture. Our customers are geothermal power plant owners as well as our target customers for the sale of our recovered-energy based power units described above. Unlike many other companies that provide EPC services, we believe that our advantage is in using our own manufactured equipment and thus have better quality and control over the timing and delivery of equipment and related costs. The consideration for such services is usually paid in installments, in accordance with milestones set forth in the EPC contract and related documents. We provide performance guarantees (usually in the form of standby letters of credit) securing our obligations under the contract.
In connection with the sale of our power units for geothermal power plants, power units for recovered energy-based power generation, remote power units and other generators, we enter into sales agreements, from time to time, with sales representatives for the marketing and sale of such products pursuant to which we are obligated to pay commissions to such representatives upon the sale of our products in the relevant territory covered by such agreements by such representatives or, in some cases, by other representatives in such territory.
Our manufacturing operations and products are certified ISO 9001, ISO 14001, American Society of Mechanical Engineers, and TÜV, and we are an approved supplier to many electric utilities around the world.
Backlog
We have a product backlog of approximately $33.4 million as of February 24, 2021, which includes revenues for the period between January 1, 2021 and February 24, 2021, compared to $141.9 million as of February 25, 2020, which included revenues for the period between January 1, 2020 and February 25, 2020. The reduction in 2021 backlog is mainly related to the impact of COVID 19 on our business as described in Item 7 of this Annual Report on Form 10-K.
The following is a breakdown of the Product segment backlog amount (in $ millions) by countries as of February 24, 2021:
Country | Backlog Amount | Percentage of Backlog |
Germany | 10.3 | | 30.8 | % |
Guatemala | 8.0 | | 24.0 | % |
New Zealand | 5.9 | | 17.7 | % |
Chile | 6.8 | | 20.4 | % |
Israel | 0.9 | | 2.7 | % |
Turkey | 0.4 | | 1.2 | % |
Others | 1.1 | | 3.3 | % |
Total | 33.4 | | 100 | % |
The following is a breakdown of the Product segment backlog by technology as of February 24, 2021:
| | % of Total Backlog | Latest Expected Completion |
Geothermal | 96.00% | 2021 |
Recovered Energy | 0.2% | 2021 |
Generators | 1.9% | 2021 |
Other | 1.9% | 2021 |
Operations of our Energy Storage Segment
Storage Projects
In addition to our Geothermal activity, we own and operate as well as working to develop energy storage projects in the United States including the following:
Under operation
Project Name | Customer | Location | Size (MW) | Duration (hours) | Type of contract |
ACUA | PJM | NJ | 1 | 1 | Merchant |
Plumsted | PJM | NJ | 20 | 1 | Merchant |
Stryker | PJM | NJ | 20 | 1 | Merchant |
Hinesburg | ISONE | VT | 2 | 2.5 | Merchant |
Rabbit Hill | ERCOT | TX | 10 | 1.0 | Merchant |
Pomona | SCE/CAISO | CA | 20 | 4.0 | Capacity PPA and Merchant |
Total | | | 73 | | |
Under construction and development
Project Name | Customer | Location | Size (MW) | Duration (hours) | Type of contract | Expected COD |
Vallecito | CAISO and SCE | CA | 10 | 4 | Capacity PPA and Merchant | Q2 2021 |
Tierra Buena | CAISO, RCEA and VCE | CA | 5 | 4 | Capacity PPA and Merchant | Q4 2021 |
Upton | ERCOT | TX | 25 | 1 | Merchant | Q4 2021 |
Andover | PJM | NJ | 20 | 1 | Merchant | Q1 2022 |
Howell | PJM | NJ | 7 | 1 | Merchant | Q2 2022 |
Energy Storage Pipeline
For an energy storage prospect to move into the EPC phase, it requires site control, an executed interconnection agreement, permits from all authorities and a viable financial model. We have a substantial pipeline of approximately 1.2 GW of projects in different stages of development for future development in the United States that we expect to commission between 200 MW and 300 MW by 2023.
Competition
Electricity Segment
In our Ormat’s Electricity segment, we face competition fromSegment competes with geothermal power plant owners and developers as well asoperators, other renewable energy providers, and other geothermal developers.
Competition in The competition occurs both at the Electricity segment occurs in the very early stagestages of development and in advanced stages when obtaining a PPA. The earlyPower Purchase Agreement (PPA). In the development stage, is primarily obtainingthe Company must acquire the rights to the resource for development of future projects or acquiringpurchase a site that is already in a more advanced stage of development. From time to time and in different jurisdictions competingthe planning, permitting, or construction phase. Occasionally, other geothermal developers may become our customers of Ormat in the Product segment.Segment.
Our main competitors in the geothermal sector in the United States areincludes CalEnergy, Calpine Corporation, Terra-Gen Power LLC, Enel Green Power S.p.A., Cyrq Energy Inc., and other smaller pure playpure-play developers. Outside the United States, in many casesInternationally, our competitors are companies that are gaining experience from developing geothermal projects in their ownhome countries, such as Mercury (formerly Mighty River Power) and Contact Energy in New Zealand, Energy Development Corporation fromin the Philippines, Storenergy and Meridian in France, and Enel Green Power in Italy. In Indonesia, Ormat experiences competition from Italy. SomeKaishan, PT Pertamina Geothermal Energy, PT Star Energy, and in a recent tender from Chevron (who teamed with Pertimina) to compete for land. Impex remains active in the Japanese geothermal sector, though Ormat has not experienced any direct competition yet. Turkish developers are also focusing on the international market.market expansion. Additionally, we faceOrmat faces competition from country-specific companiessmaller pure-play geothermal developers and smaller pure play geothermal developers.local providers.
In obtainingWhen Ormat seeks to obtain a new PPAs, we also facePower Purchase Agreement (PPA), it mainly faces competition from companies engaged in the power generation business from other renewable energy sources such as wind, power, biomass, solar, power and hydroelectric power. In the United States, weOrmat primarily compete againstcompetes with solar power generation combined with energy storage. WeOrmat also face competition fromcompetes with existing geothermal power plants as they are re-contracted.
As a geothermal company, we are focusedOrmat focuses on niche markets where ourits vertical integration proves advantageous for the development of competitive baseload and flexibility advantages can allow us to develop competitive projects.
Product Segment
In our Product segment, we face competition from power plant equipment manufacturers and system integrators as well as engineering or project management companies.
Our competitors among power plant equipment suppliers are divided by technology, steam turbines and binary power plant manufacturers. Our main steam turbine competitors are industrial steam turbine manufacturers such as Mitsubishi Heavy Industries, Fuji Electric Co., Ltd. and Toshiba Corporation of Japan, GE/Nuovo Pignone and Ansaldo Energia of Italy.
Our binary technology competitors are binary systems manufacturers using the ORC technology such as Fuji Electric Co., Ltd of Japan, Mitsubishi Heavy Industries through Turboden, TICA, a Chinese air conditioning company that acquired Italian Exergy, Egesim, a Turkish electrical contractor who is collaborating with Atlas Copco mainly in the Turkish market and internationally, and Kaishan, a compressor manufacturer from China who also develops its own projects.projects and Fuji Electric Co., Ltd of Japan. While we believe that we have a distinct competitive advantage based on our accumulated experience, and current worldwide share of installed binary generation capacity (which is approximately 82%), an increase in competition, which we are currently experiencing, has started to affect our ability to secure new purchase orders from potential customers. The increased competition led to a reduction in the prices that we are able to charge for our binary equipment,operating margins, which in turn impacted our profitability.
In the REG business, our competitors are other ORC manufacturers, (such as GE, mainly Mitsubishi/Turboden and TICA/Exergy, and Mitsubishi/Turboden),which dominate binary waste heat recovery market installations. Other manufacturers that use Kalina technology (such as Geothermal Energy Research & Development Co., Ltd in Japan), other manufacturers ofare conventional steam turbines and small developers of small scale ORCs.
Currently, none of our competitors competes with us in both the Electricity and the Product segments.ORC suppliers.
In the case of proposed EPC projects we also compete with other service suppliers, such as project/engineering companies or EPC contractors.
Energy Storage Segment
In ourthe Energy Storage segment, we face significant competition from companies that have already have established businesses in those technologies and markets as well asthe sector, companies that are seeking to acquire established businesses to gain a foothold in the sector, and other new market entrants like us.
In the demand response markets, our Viridity business competes primarily with specialized demand management providers and traditional curtailment service providers. Viridity differentiates itself from its competitors by its proprietary software and analytical strengths, wider use cases, customer base, business model, and market presence.entrants.
The energy storage space is comprised of manya multitude of companies divided intowith different verticals and sub verticals likebusiness strategies, such as project developers, independent power producers, project developers, system integrators, EPC contractors, , component suppliers (e.g. batteries, inverters, control software, and balance of plant), and scheduling coordinators, etc. Our proprietary software, analytical operational platform and experience inamong others. The energy storage operation and integration with electricity markets,space is experiencing consolidation as well as our engineeringother dynamics in the supply chain (e.g. pure developers turning into IPPs). Thus, the number of IPPs in the market remains high and system integration capabilities, allow us to provide multiple value streams (commonly referred to as value stacking) from a single storage installation. competition is intense.
We have continued and plan to continue to growdevelop greenfield projects with great emphasis on the quality of the location and other characteristics that will make for highly profitable projects as well as targeting strategic acquisitions of development assets or platforms. Additionally, we believe that our participation and expertise in various parts of the value chain, such as engineering, procurement, construction, project development, operation and maintenance, and asset management and market participation, together with our relatively long experience in commercial operations gives us a competitive advantage in the market of utility scale energy storage business in these markets.storage.
Customers
All of our revenues from the sale of Electricity in the year ended December 31, 20202023 were derived from fully-contracted energy and/or capacity payments under long-term PPAs with governmental, public or private utility entities. The percentage of total revenues above 5% is detailed in the table below:
Utility | | % of total revenues for the year ended | |
| | | December 31, 20202023 | |
SCPPA (U.S.) | 20.6%
| | 21.2 | % |
NV Energy (U.S.) | 17.5%
| | 14.1 | % |
KPLC (Kenya) | 16.4%
| | 13.2 | % |
Based on publicly available information, as of December 31, 2020,2023, the credit ratings of our rated electric utility customers are as set forth below:
Issuer | Standard & Poor’sPoor’s Ratings Services | Moody’sMoody’s Investors Service Inc.
|
Southern California Edison | BBB (Negative)(Stable) | Baa2Baa1 (Stable)
|
HELCO | BBB- (Positive)B- (Negative watch))
| Ratings withdrawnBa3 (Stable)
|
Sierra Pacific Power Company | AA- (Stable)
| Baa1 (Stable) |
Nevada Power Company | AA- (Stable)
| Baa1 (Stable) |
SCPPA | BBB+AA+ (Stable)
| (Stable)B1 (Positive)
|
PG&E | BB- (Negative)(Positive) | B1 (Stable)(Positive) |
EDF | BBB+BB- (Stable)
| A3 (Negative)Baa3 (Stable)
|
The credit ratings of any power purchaser may change from time to time. There is no publicly available information with respect to the credit rating or stability of the power purchasers under the PPAs for our foreign power plants other than EDF (France).
While we have historically been able to collect on substantially all of our receivable balances, we have received late payments and have amounts overdue from KPLC in Kenya related to our Olkaria III Complex and from ENEE in Honduras related to our Platanares power plant. We believe we will be able to collect all past due amounts.
Our revenues from the Product segment are derived from contractors, owners, or operators of power plants, process companies, and pipelines.
Our revenues from the Energy Storage segment isare derived from selling energy, capacity services under long term capacity contracts and/or ancillary services in merchant markets like PJM, ISO New England, ERCOT and CAISO. We recently signed a long-term tolling agreement we believe that will secure fixed revenues for our Bottleneck 80MW/320MWh project in California. In addition, we are pursuing the projects that will serve entities, such as investor owned utilities, publicly owned utilities and community choice aggregators.
Raw Materials, Suppliers and SubcontractorsHuman Capital Resources
In connectionOur Team
As a global renewable energy company, we are proud to employ and work closely with the communities we serve, knowing we have the ability to contribute to local economies and social well-being. The promise of renewable energy that we deliver to our customers and stakeholders goes hand in hand with our manufacturing activities,commitment to local employment and skill development wherever we use raw materials such as steelwork.
Our success largely depends on our ability to recruit, train, develop and aluminum.retain a productive and engaged workforce. Accordingly, investing in our employees, focusing on safety, offering competitive compensation and benefits, promoting a diverse workforce, adopting forward thinking human capital management practices and community outreach are critical elements of our corporate strategy.
As of December 31, 2023, we employed 1,576 employees, of whom 548 were in Israel, 763 were in the United States, and 265 were in other countries and 138 employees who are temporary or contracted. Any future material growth in our employee headcount will be attributable to purchasing or developing new power plants and energy storage facilities.
Workforce Health and Safety
The health and safety of our employees, subcontractors, the public, and the environment is our overarching priority. We do not relymanage risks by identifying, assessing and managing risks in the facilities and offices that we own and operate. In addition, we promote safety awareness and values. Our goal is to report, analyze, learn and improve performance to reduce the number of incidents. We seek to continuously improve our safety performance and instill a workplace safety culture. We also periodically conduct quality, environmental, health, and safety audits of our plants and facilities.
Ormat has an Integrated Quality, Environment, Health, and Safety Policy ("QEHS") that sets out our general commitments towards health and safety principles at our sites and for all our stakeholders. The policy is publicly available on any one supplierOrmat's website and outlines our responsibilities to provide high quality products, conduct our business with care for the raw materials usedenvironment, and integrate our QEHS system into our business strategy and work processes. In addition, our Human Rights and Labor Policy, also available publicly on our website, outlines our commitments to ensuring that essential health and safety standards and practices are enforced in our manufacturing activities, as all of these raw materials are readily available from various suppliers.
We use subcontractors for some of the manufacturing activities with respect to our products componentsworkplace, developing risk awareness, and for construction activities with respect to our power plants, which allows us to expand our constructionencouraging responsible health and development capacity on an as-needed basis. We are not dependent on any one subcontractor and expect to be able to replace any subcontractor or assume such manufacturing and construction activities ourselves, if necessary or desirable, without adverse effect to our operations.safety behavior among employees.
EmployeesIn addition, we have an outreach plan to support communities where we do business such as addressing the reduced availability of food to vulnerable populations and providing medical and personal protective equipment to local healthcare workers across the globe.
Diversity Initiatives
We strive to provide a diverse and inclusive working environment where people are respected and feel a sense of belonging regardless of race, nationality, gender, age, religion or sexual orientation. Our offices, manufacturing plants and power plants are in multiple jurisdictions and our global workforce operates across many different beliefs. We are committed to local employment at all our operational and manufacturing locations. While our first and foremost consideration of a potential candidate is professional skills and overall qualifications for the position, we work with several organizations in the U.S. to help us present opportunities to ethnic minorities and veterans for open positions. Furthermore, we are committed to eliminating discrimination in our hiring and employment termination practices and ensuring that all employees are adequately accommodated and treated equally.
We actively seek opportunities to hire and promote female employees and managers across our Company, including our various operations worldwide.
Competitive Compensation and Benefits
We strive to ensure that all eligible employees receive fair and competitive compensation and benefits, including, paid maternity or paternity leave, sponsorship of learning opportunities, health care insurance, short-term and long-term disability, among others. Our global employees are entitled to retirement and pension benefits at or beyond the legally required level of employer contribution in the relevant country of operation, including access to 401(k) plans in the U.S. We fully cover retirement and pension plan liabilities in relevant countries of operation with our available resources. In addition, all our current employees in Israel are entitled to benefits in the event of termination or retirement following the Israeli Government’s sponsorship of programs that provide limited non-pension benefits.
Employee Investment
We focus on creating opportunities for employee education, development and training and we strive to ensure that employees are fulfilling their professional and personal goals. Our training opportunities include technical and soft skills to help our employees improve their performance and management training sessions to help employees expand their horizons. We have annual performance reviews for most of our employees. We also have a tuition reimbursement program and provide access to reskilling or upskilling training to employees transitioning to another position at the Company or another workforce. Our Human Resources department and various business units work together on initiatives to create a sense of community and togetherness. We offer employees options to improve their work-life balance, including community events, holiday and team milestone celebrations, volunteering opportunities and fitness support.
Collective Bargaining Agreements & Employee Unions
As of December 31, 2020, we employed 1,402 employees, of whom 572 were located in Israel, 585 were located in the United States and 245 were located in other countries. We expect that any material future growth in the number of our employees will be generally attributable to the purchase or development of new power plants and energy storage facilities.
As of December 31, 2020,2023, the only employees that arecurrently represented by a labor union are the employees of our acquired Bouillante power plant located in Guadeloupe. The employees in Guadeloupe are represented by the Confédération Générale du Travail de Guadeloupe.
In addition, in 2023, our battery storage operations and maintenance employees in Philadelphia voted for representation by the IBEW Local 777. We have never experienced anyobjected to the outcome of the election and the matter is currently pending at the National Labor Relations Board in Washington, D.C. There is no threatened labor dispute strike or work stoppage. We believe that our relations with our employees are positive.at this time.
We have no collective bargaining agreements with respect tofor our Israeli employees. However, by order of the Israeli Ministry of Economy and Industry, the provisions of a collective bargaining agreement between the Histadrut (the General Federation of Labor in Israel) and the Coordination Bureau of Economic Organizations (which includes the Industrialists Association) may apply to some of our Israeli non-managerial, finance and administrative, and sales and marketing personnel. This collective bargaining agreement principally concerns the cost of living pay increases, length of the workday, minimum wages and insurance for work-related accidents, annual and other vacation, sick pay, and determination of severance pay, pension contributions, and other conditions of employment. We currently provide such employees with benefits and working conditions, which are at least as favorable as the conditions specified in the collective bargaining agreement.
We believe that our success depends in large part on our ability to recruit, develop and retain a productive and engaged workforce. Accordingly, investing in our employees, focusing on safety, offering competitive compensation and benefits, promoting a diverse workforce, adopting forward thinking human capital management practices and community outreach are critical elements of our corporate strategy.
| ●
| Investing in our Employees. We strive to provide employees at all levels with benefits that express our level of appreciation and care for employee well-being.
|
| ●
| Safety. The health and safety of our employees, subcontractors, the public and the environment is an overarching priority for us. We manage risks by identifying, assessing and managing risks in our facilities and offices that we own and operate. We promote safety awareness and values and our goal is to report, analyze, learn and improve performance in order to reduce the number of incidents. We also work to continuously improve our safety performance and to instill a workplace safety culture. We also conduct quality, environment, health and safety audits of our plants and facilities on a periodic basis.
|
| ●
| Competitive Compensation and Benefits. We strive to ensure that our employees receive fair and competitive compensation and benefits, including, for most of our employees, paid maternity or paternity leave, sponsorship of learning opportunities, health care insurance, sick leave benefits and coverage in the event of disability and/or infirmity, among others. At times, benefits are made available to part-time and temporary employees as well. All our global employees are entitled to retirement and pension benefits at or beyond the legally required level of employer contribution in the relevant country of operation, including access to 401(k) plans in the U.S. We fully cover retirement and pension plan liabilities in relevant countries of operation with our general resources. All current employees in Israel who are entitled to benefits in the event of termination or retirement in accordance with the Israeli Government sponsored programs are provided with limited non-pension benefits.
|
| ●
| Diversity Initiatives. We strive to provide a diverse and inclusive working environment, where people are respected and feel a sense of belonging regardless of their race, nationality, gender, age, religion or sexual orientation. Our offices, manufacturing plants and power plants are in multiple jurisdictions and our global workforce operates across many different beliefs. We are committed to local employment at all our operational and manufacturing locations. While our first and foremost consideration of a potential candidate is professional skills and overall qualifications for the position, we work with several organizations in the U.S. to help us present opportunities to ethnic minorities and veterans for open positions. Furthermore, we are committed to eliminating any form of discrimination in our hiring and employment termination practices and ensuring that all employees are adequately accommodated and treated equally.
|
| ●
| Employee Development. We focus on creating opportunities for employee education, development and training. Our training opportunities include relevant professional as well as soft skills to help our employees improve their performance and expand their horizons. We have annual performance reviews for most of our employees.
|
| ●
| Response to the COVID-19 Pandemic. In response to the COVID-19 pandemic, we acted quickly to put social distancing mechanisms in place to protect our employees while maintaining and enhancing business activity during this global crisis. We did not lay off any employees due the Covid-19 Pandemic, except for in the ordinary course of business. We also launched an outreach plan to support communities where we do business such as addressing the reduced availability of food to vulnerable populations and providing medical and personal protective equipment to local communities’ healthcare workers across the globe. Throughout this global pandemic, we will continue following stringent protective measures necessary to safeguard the health, and safety of our employees. This includes adhering to all government regulations and maintaining clear, comprehensive plans and protective measures for employees who work in our energy plants, manufacturing facilities, offices and elsewhere.
|
We maintain good relations with our employees and have not encountered any labor relations issues such as labor disputes, strikes, or work stoppages. We seek to continue to maximize a positive work environment for all our employees.
Insurance
We maintain partial physical damage and business interruption insurance, including the perils of flood, volcanic eruption, earthquake and windstorm, cyber coverage, general and excess liability, pollution legal liability, control of well, drilling rigs, construction risks, as well as customary worker’s compensation and automobile, marine transportation insurance and such other commercially available insurance as is generally carried by companies engaged in similar businesses and owning similar properties in the same general areas as us. Such insurance covering our properties extends to Ormat and/or our owned, controlled, direct or indirect affiliated or associated companies, subsidiary companies or corporations in amounts generally based upon the estimated replacement value and maximum foreseeable loss of our facilities (provided that certain perils including earthquake, volcanic eruption and flood coverage may beare subject to sublimit and/or annual aggregate limits depending on the type and location of the facility) and business interruption insurance coverage in an amount that also varies from location to location.
We purchase, when available, certain insurance policies to cover a portion of our book equity exposureinvestment to specified political risks involved in operating in developing countries. We hold a global political risk insurance program covering the significant political risks at certain of our locations. This program is issued by the global insurers in the private sector. Such insurance policies generally cover, subject to the limitations and restrictions contained therein, losses derived from a specified governmental act, such as expropriation, political violence, and the inability to convert local currency into hard currency and, in certain cases, the breach of agreements with governmental entities, in approximately 90%70% of our book net equity investment.
Regulation of the Electric Utility Industry in the United States
The following is a summary overview of the electric utility industry and applicable federal and state regulations and should not be considered a full statement of the law or all issues pertaining thereto.
PURPA
PURPA and FERC's regulations thereunder exempt owners of small power production Qualifying Facilities that use geothermal resources as their primary source and other Qualifying Facilities that are 30 MW or under in size from regulation under the PUHCA 2005, from many provisions of the FPA and from state laws relating to the financial, organization and rate regulation of electric utilities.
PURPA provides the owners of power plants certain benefits described below if a power plant is a “Qualifying Facility.” A small power production facility is a Qualifying Facility if: (i) the facility does not exceed 80 MW; (ii) the primary energy source of the facility is biomass, waste, geothermal, or renewable resources, or any combination thereof, and at least 75% of the total energy input of the facility is from these sources, and fossil fuel input is limited to specified uses; and (iii) the facility, if larger than one megawatt, has filed with FERC a notice of self-certification of qualifying status, or has been certified as a Qualifying Facility by FERC. The 80 MW size limitation, however, does not apply to a facility if (i) it produces electric energy solely by the use, as a primary energy input, of solar, wind, waste or geothermal resources; and (ii) an application for certification or a notice of self-certification of qualifying status of the facility was submitted to not later than December 31, 1994, and construction of the facility commenced not later than December 31, 1999.
With respect to the FPA, FERC's regulations under PURPA do not exempt from the rate provisions of the FPA sales of energy or capacity from Qualifying Facilities larger than 20 MW in size that are made (a) pursuant to a contract executed after March 17, 2006 or (b) not pursuant to a state regulatory authority’s implementation of PURPA. The practical effect of these regulations is to require owners of Qualifying Facilities that are larger than 20 MW in size to obtain market-based rate authority from FERC if they seek to sell energy or capacity other than pursuant to a contract executed on or before March 17, 2006 or pursuant to a state regulatory authority’s implementation of PURPA. A sale to a public utility under PURPA at state approved avoided cost rates is generally exempt from FERC rate regulation.
In addition, provided that the purchasing electric utility has not been relieved from its mandatory purchase obligation, PURPA and FERC’s regulations under PURPA obligate electric utilities to purchase energy and capacity from Qualifying Facilities at either the electric utility’s avoided cost or a negotiated rate. FERC's regulations under PURPA allow FERC, upon request of a utility, to terminate a utility’s obligation to purchase energy from Qualifying Facilities upon a finding that Qualifying Facilities have nondiscriminatory access to: (i) independently administered, auction-based day ahead, and real time markets for electric energy and wholesale markets for long-term sales of capacity and electric energy; (ii) transmission and interconnection services provided by a FERC-approved regional transmission entity and administered under an open-access transmission tariff that affords nondiscriminatory treatment to all customers, and competitive wholesale markets that provide a meaningful opportunity to sell capacity, including long-term and short-term sales, and electric energy, including long-term, short-term, and real-time sales, to buyers other than the utility to which the Qualifying Facility is interconnected; or (iii) wholesale markets for the sale of capacity and electric energy that are at a minimum of comparable competitive quality as markets described in (i) and (ii) above. FERC regulations protect a Qualifying Facility’s rights under any contract or obligation involving purchases or sales that are entered into before FERC has determined that the contracting utility is entitled to relief from the mandatory purchase obligation. FERC has granted the request of California investor-owned utilities for a waiver of the mandatory purchase obligation for Qualifying Facilities larger than 20 MW in size. In addition, FERC recently amended its PURPA regulations to reduce the rebuttable presumption that small power production facilities in organized markets have nondiscriminatory access to markets from 520 MW to 205 MW. Therefore, the California investor-owned utilities may have a basis to further reduce their mandatory purchase obligation.
We expect that our power plants in the U.S will continue to meet all of the criteria required for Qualifying Facility status under PURPA. However, since the Heberif any of our domestic power plants have PPAs with Southern California Edison that require Qualifying Facility statuswere to be maintained, maintaining Qualifying Facility status remains a key obligation. If any of the Heber power plants loseslose its Qualifying Facility status, our operationssuch power plant could be adversely affected. Lossbecome subject to the full scope of Qualifying Facility status would eliminate the Heber power plants’ exemption from the FPA and thus, amongapplicable state regulation. The application of the FPA and other things, the rates charged by the Heber power plants in the PPAs with Southern California Edison and SCPPA would become subjectapplicable state regulation to FERC regulation. Further, it is possible that the utilities that purchase power from theour domestic power plants could successfully obtain a waiver of the mandatory-purchase obligation in their service territories. For example, the three California investor-owned utilities have received such a waiver from FERC for projects larger than 20 MW. If a waiver of the mandatory purchase obligation is obtained, or if FERC reduces the 20 MW threshold or eliminates the mandatory purchase obligation, the power plants’ existing PPAs will notrequire our operations to comply with an increasingly complex regulatory regime that may be affected, but the utilities will not be obligated under PURPA to renew or extend these PPAs or execute new PPAs upon the existing PPAs’ expiration.costly and greatly reduce our operational flexibility.
PUHCA
Under PUHCA 2005, the books and records of a utility holding company, its affiliates, associate companies, and subsidiaries are subject to FERC and state commission review with respect to transactions that are subject to the jurisdiction of either FERC or the state commission or costs incurred by a jurisdictional utility in the same holding company system. However, if a company is a utility holding company solely with respect to Qualifying Facilities, exempt wholesale generators, or foreign utility companies, it will not be subject to review of books and records by FERC under PUHCA 2005. Qualifying Facilities or exempt wholesale generators that make only wholesale sales of electricity are not subject to state commissions’ rate regulations and, therefore, in all likelihood would not be subject to any review of their books and records by state commissions pursuant to PUHCA 2005 as long as the Qualifying Facility is not part of a holding company system that includes a utility subject to regulation in that state. Additionally, most or all of our power plants and storage projects qualify as exempt wholesale generators, exempting them from PUHCA requirements as well.
FPA
Pursuant to the FPA, FERC has exclusive jurisdiction over the rates for most wholesale sales of electricity and transmission of electricity in interstate commerce. These rates may be based on a cost of service approach or may be determined on a market basis through competitive bidding or negotiation. FERC can accept, reject or suspend rates. The rates can be suspended for up to five months, at which point the rates become effective subject to refund. FERC can order refunds for rates that are found to be “unjust and unreasonable” or “unduly discriminatory or preferential.”
Moreover, the loss of the Qualifying Facility status of any of our power plants selling energy to Southern California Edison couldmight also permit Southern California Edison,the off-taker, pursuant to the terms of its PPA, to cease taking and paying for electricity from the relevant power plant and to seek refunds for past amounts paid and/or a reduction in future payments.
Additionally, FERC possesses civil penalty authority, up to approximately $1.3$1.5 million per violation of the FPA per day. FERC can also require the disgorgement of unjust profits earned in connection with such violations of the FPA and revoke the right of the power plants to make sales at market-based rates.
Under the Energy Policy Act of 2005, the FPA was supplemented to empower FERC to ensure the reliability of the bulk electric system. Such authority required that FERC assume both oversight and enforcement roles. Pursuant to its new directive, FERC certified the North American Electric Reliability Corporation as the nation’s Electric Reliability Organization (ERO) to develop and enforce mandatory reliability standards to address medium and long-term reliability concerns. Today, enforcement of the mandatory reliability standards, including the protection of critical energy infrastructure, is a substantial function of the ERO and of FERC, which may impose penalties of up to approximately $1.3$1.5 million a day for violating mandatory reliability standards. We examine our projects’ compliance with NERC standards on an ongoing basis and begin work on the process of NERC registration as new projects approach the threshold at which NERC standards become applicable.
Thus, if any of the power plants were to lose Qualifying Facility status, the application of the FPA and other applicable state regulations to such power plants could require compliance with an increasingly complex regulatory regime that may be costly and greatly reduce our operational flexibility. Even if a power plant does not lose Qualifying Facility status, the owner of a Qualifying Facility/power plant in excess of 20 MW will become subject to rate regulation under the FPA for sales of energy or capacity pursuant to a contract executed after March 17, 2006 or not pursuant to a state regulatory authority’s implementation of PURPA. A decrease in existing rates or being ordered by FERC to pay refunds for rates found to be “unjust and unreasonable” or “unduly discriminatory or preferential” would likely result in a decrease in our future revenues.
State Regulation
Our power plants in California, Nevada, Oregon, and Idaho, by virtue of being Qualifying Facilities that make only wholesale sales of electricity, are not subject to rate, financial and organizational regulations applicable to electric utilities in those states. The power plants each sell or will sell their electrical output under PPAs to electric utilities (Sierra Pacific Power Company, Nevada Power Company, Southern California Edison,Peninsula Clean Energy, SCPPA and Idaho Power Company). All of the utilities except SCPPA are regulated by their respective state public utilities commissions. Sierra Pacific Power Company and Nevada Power Company, which merged and are doing business as NV Energy, are regulated by the PUCN. Southern California EdisonPeninsula Clean Energy is regulated by the CPUC.
Under Hawaiian law, non-fossil generators are not subject to regulation as public utilities. Hawaiian law provides that a geothermal power producer is to negotiate the rate for its output with the public utility purchaser. If such rate cannot be determined by mutual accord, the PUCH will set a just and reasonable rate. If a non-fossil generator in Hawaii is a Qualifying Facility, federal law applies to such Qualifying Facility and the utility is required to purchase the energy and capacity at its avoided cost. The rates for our power plant in Hawaii are established under a long-term PPA with HELCO.
Environmental Permits
U.S. environmental permitting regimes with respect to geothermal projects center upon several general areas of focus. The first involves land use approvals. These may take the form of Special Use Permits or Conditional Use Permits from local planning authorities or a series of developmentoperation and utilization plan approvals and right of way approvals where the geothermal facility is entirely or partly on BLM or United States Forest Service lands. Certain federal approvals require a review of environmental impacts in conformance with the federal National Environmental Policy Act. In California, some local permit approvals require a similar review of environmental impacts under a state statute known as the California Environmental Quality Act. These federal and local land use approvals typically impose conditions and restrictions on the construction, scope and operation of geothermal projects.
The second category of permitting focuses on the installation and use of the geothermal wells themselves. Geothermal projects typically have threefour types of wells: (i) explorationresource confirmation wells designed to define and verify the geothermal resource, (ii) production wells to extract the hot geothermal liquids (also known as brine) for the power plant, and (iii) injection wells to inject the brine back into the subsurface resource, and (iv) monitoring wells to monitor the geothermal resource. For example, on BLM lands in Nevada, California, Oregon, Utah, and Idaho, the well permits take the form of geothermal drilling permits for well installation. Approvals are also required to modify wells, including for use as production or injection wells. For all wells drilled in Nevada, a geothermal drilling permit must also be obtained from the Nevada Division of Minerals. Those wells in Nevada to be used for injection will also require UICUnderground Injection Control (UIC) permits from the Nevada Division of Environmental Protection, and Bureau of Water Pollution Control. All geothermal wells drilled in Oregon (except on tribal lands) require a geothermal well drilling permit from the Oregon Department of Geology and Mineral Industries. All geothermal wells drilled in Idaho require a well construction permit from the IDWRIdaho Department of Water Resources (IDWR) and injection wells also require UIC permitting through IDWR. Geothermal wells in Utah require permits from the Utah Division of Water Rights, and injection wells require a permit from the Utah Department of Environmental Quality. Geothermal wells on private lands in California require drilling permits from the California Department of Conservation’s DOGGR.Geologic Energy Management Division (CalGEM). The eventual designation of these installed wells as individual production or injection wells and the ultimate closure of any wells is also reviewed and approved by DOGGR pursuant to a DOGGR-approved Geothermal Injection Program.CalGEM.
A third category of permits involves the regulation of potential air emissions associated with the construction and operation of wells and power plants and surface water discharges associated with construction and operations activities. Generally, each well and plant requires a preconstruction air permit and storm water discharge permit before earthwork can commence. In addition, in some jurisdictions the wells that are to be used for production require, and those used for injection may require air emissions permits to operate. Internal combustion engines and other air pollutant emissions sources at the projects may also require air emissions permits.permits, including managing fugitive dust emissions during construction. For our projects, these permits are typically issued at the state or county level. Permits are also required to manage storm water during project construction and to manage drilling mud from well construction, as well as to manage certain discharges to surface impoundment, if any.
A fourth category of permits, required in Nevada, California, Oregon, Utah, and Idaho, includes ministerial permits such as building permits, hazardous materials storage and management permits, and pressure vessel operating permits. We are also required to obtain water rights permits in Nevada if water cooling is being used at the power plant. In addition to permits, there are various regulatory plans and programs that are required, including risk management plans (federal and state programs) and hazardous materials management plans (in California).
In some cases, our projects may also require permits, issued by the applicable federal agencies or authorized state agencies, regarding threatened or endangered species, permits to impact wetlands or other waters and notices of construction of structures which may have an impact on airspace. Environmental laws and regulations may change in the future that may modify the time to receive such permits and associated costs of compliance.
Our BESSBattery Energy Storage System (BESS) projects are subject to similar permitting and regulatory compliance requirements. All of our current BESS projects are located on privately owned land and may require ministerial permits from local agencies as described above or undergo a state environmental permitting process (e.g., under the California Environmental Quality Act) with the city or county as the lead permitting agency. Storage projects are also required to comply with all applicable federal, state, and local laws and regulations, and similar to geothermal projects, storage projects may require various regulatory plans and programs including emergency action plans and fire response plans.
As of the date of this report, all of the material environmental permits and approvals currently required for our operating power plants and BESS projects have been obtained. We sometimes experience regulatory delays in obtaining various environmental permits and approvals required for projects in development and construction. These delays may lead to increases in the time and cost to complete these projects. Our operations are designed and conducted to comply with applicable environmental permit and approval requirements. Non-compliance with any such requirements could result in fines and penalties and could also affect our ability to operate the affected project.
Environmental Laws and Regulations
Our facilities and operations are subject to a number of federal, state, local and foreign environmental laws and regulations relating to development, construction and operation. In the U.S, these may include the Clean Air Act, the Clean Water Act, the Emergency Planning and Community Right-to-Know Act, the Endangered Species Act, the National Environmental Policy Act, the Resource Conservation and Recovery Act, and related state laws and regulations.
Our geothermal operations involve significant quantities of brine (substantially, all of which we reinject into the subsurface) and scale, both of which can contain materials (such as arsenic, antimony, lead, and naturally occurring radioactive materials) in concentrations that exceed regulatory limits used to define hazardous waste. We also use various substances, including isopentane and industrial lubricants that could become potential contaminants and are generally flammable. As a result, our projects are subject to domestic and foreign federal, state and local statutory and regulatory requirements regarding the generation, handling, transportation, use, storage, treatment, fugitive emissions, and disposal of hazardous substances. The cost of investigation and removal or remediation activities associated with a spill or release of such materials could be significant. Hazardous materials are also used in our equipment manufacturing operations in Israel.
Although we are not aware of any mismanagement of these materials, including any mismanagement prior to the acquisition of some of our power plants that has materially impaired any of the power plant sites, any disposal or release of these materials onto the power plant sites, other than by means of permitted injection wells, could lead to contamination of the environment and result in material cleanup requirements or other responsive obligations under applicable environmental laws.
Regulation Related to the Energy storage activityStorage Segment
Our participation in the energy storage space and in energy management and demand response requirerequires us to obtain and maintain certain additional authorizations and approvals. These include (1) authorization from FERC to make wholesale sales of energy, capacity, and ancillary services at market-based rates, and (2) membership status with eligibility to serve designated contractual functions in the ISO/RTOs of PJM, NYISO, CAISO, ISO-NE, and ERCOT. Among other requirements, our market-based rate sellers are subject to certain market behavior and anti-market manipulation rules and, if any of our subsidiaries were deemed to have violated any one of those rules, such subsidiary could be subject to potential disgorgement of profits associated with the violation and/or suspension or revocation of market-based rate authority, as well as criminal and civil penalties. If the market-based rate authority for one (or more) of our subsidiaries was revoked or it was not able to obtain market-based rate authority when necessary, and it was required to sell energy on a cost-of-service basis, it could become subject to the full accounting, record keeping and reporting requirements of FERC. In the future, we may need to obtain and maintain similar membership and eligibility status with other ISO/RTOs in order to offer such services in their respective areas.
Regulation of the Electric Utility Industry in our Foreign Countries of Operation
The following is a summary overview of certain aspects of the electric industry in the foreign countries in which we have an operating geothermal power plant. As such, it should not be considered a full statement of the laws in such countries or all of the issues pertaining thereto.
Guatemala
The General Electricity Law of 1996, Decree 93-96, created a wholesale electricity market in Guatemala and established a new regulatory framework for the electricity sector. The law created a new regulatory commission, the CNEE, and a new Independent System Operator and wholesale power market administrator, the AMM, for the operation and administration of the sector. The AMM is a private not-for-profit entity. The CNEE functions as an independent agency under the Ministry of Energy and Mines and is in charge of regulating, supervising, and controlling compliance with the electricity law, overseeing the market and setting rates for transmission services, and distribution to medium and small customers. All distribution companies must supply electricity to such customers, and need power purchase agreements with independent power producers to cover that demand pursuant to long-term contracts with electricity generators. Large customers can contract directly with the distribution companies, electricity generators or power marketers, or buy energy in the spot market. Guatemala has approved a Law of Incentives for the Development of Renewable Energy Power plants, Decree 52-2003, in order to promote the development of renewable energy power plants in Guatemala. This law provides certain benefits to companies utilizing renewable energy, including a 10-year exemption from corporate income tax and VAT on imports and customs duties.duties for new generation equipment. . On September 16, 2008,August 25,2, 20214 CNEE issued a resolution that approved the Technical Norms for the Connection, Operation, Control and Commercialization of the Renewable Distributed Generation and Self-producers Users with Exceeding Amounts of Energy. This Technical Norm was created to regulate all aspects of generation, connection, operation, control and commercialization of electric energy produced with renewable sources to promote and facilitate the installation of new generation plants, and to promote the connection of existing generation plants which have excess amounts of electric energy for commercialization. It is applicable to projects with acommercialization, provided the capacity of up todoes not exceed 5 MW. At present, the General Electricity Law and the Law of Incentives for the Development or Renewable Energy Power Plants are still in force.
Kenya
The electric power sector in Kenya is regulated by the Kenyan Energy Act. Among other things, the Kenyan Energy Act provides for the licensing of electricity power producers and public electricity suppliers or distributors. KPLC is the major licensed public electricity supplier and has a virtual monopoly in the distribution of electricity in the country with the exception of a few off-grid, which have recently been licensed by the EPRA. The Kenyan Energy Act permits IPPs to install power generators and sell electricity to KPLC, which is owned by various private and government entities, and which currently purchases energy and capacity from other IPPs in addition to our Olkaria III complex. The electricity sector is regulated by the EPRA under the Kenyan Energy Act. KPLC’s retail electricity rates are subject to approval by the EPRA. The EPRA has an expanded mandate to regulate not just the electric power sector but the entire energy sector in Kenya. Transmission of electricity is now undertaken by KETRACO while another company, GDC, is responsible for geothermal assessment, drilling of wells and sale of steam for electricity operations to IPPs and KenGen. Both KETRACO and GDC are wholly owned by the government of Kenya. Renewable energy dominated by geothermal, wind and, presently at a lower level, solar is one of the key energy sub-sectors in Kenya contributing significantly to the overall energy mix as a result of the implementation of the feed-in- tariff policy by the Ministry of Energy. The implementation of the Renewable Energy Auctions Policy by the Ministry of Energy, which was expected to replace the feed-in-tariff policy with respect to solar, wind and other renewable energy projects exceeding 20MW, has yet to be implemented. Under the national constitution enacted in August 2010, formulation of energy policy (including electricity) and energy regulation are functions of the national government. However, the constitution lists the planning and development of electricity and energy regulation as a function of the county governments (i.e. the regional or local level where an individual power plant is or is intended to be located).
Indonesia
The 2009 Electricity Law (as amended byNo. 32 of 2009 (in conjunction with Government Regulation In Lieu of Law No. 2 of 2022 on Job Creation*/Omnibus Law) is the Indonesian Omnibus Lawprincipal regulation for the electricity industry in 2020)Indonesia which divides the power businessindustry into two broad categories: (i) activities that supply(1) electrical power both public supply and captive supply (own use), such as electricalprovision, covering electric power generation, electrical power transmission, electrical power distribution and the sale of electrical powersales, and (ii) the activities involved in(2) electrical power support such as services businesses (consulting, construction, installation, operation & maintenance, certification & training, testing etc.) and industry businesses (power tools &manufacture (tools, power plant equipment, supply electricitycables, electrical equipment, etc.). Electrical power supporting businesses). Currently, power generationprovision business is dominated by PLN (state owned company)(a state-owned enterprise), which controls around 70% of generating assets in Indonesia. Private sector participation is allowed through an IPP scheme. IPP appointment mostly is done through tenders although IPPs can also be directly appointed or selected. The 2009 Electricity Law, as amended, provides PLN priority rights to conduct the electricity power business nationwide. As the sole owner of transmission and distribution assets PLN remainsand 91%** of the only business entity involvedpower generation assets as per 2022. Private sector participation in transmitting and distributing, although the 2009 Electricity Law,power generation is allowed through an IPP scheme, mostly done through tenders or direct appointment for some power sources such as amended, allows private participation.geothermal. Geothermal power is regulated by The Geothermal Law issued in 2014 (as(Law No 21 of 2014, as also amended by the Indonesian Omnibus Law in 2020)2022), that endorses private participation as geothermal IPP. The Central government conducts tenders for geothermal IPP appointment is done through tender held byfields, awarding Geothermal Business License for the Central Government. The central government will also award the tender winner awinner. Geothermal Business License (IPB). Accordingly, the Geothermal License holderholders can conduct exploration and feasibility studies within five years and subject to two times one-year extensions, conduct well development and power plant construction and sell the electricity generated to PLN for a maximum of 30 years. Prior to the expiration of the Geothermal License, the IPP can propose to extend the license for an additional 20 years. Starting in 2017,In 2021, Presidential Regulation No. 112 was enacted with the regulatory framework with respect to tariffs is based on PLN's existing average costaim of generation (known by its Indonesian acronym, BPP) with respect toaccelerating Renewable Energy. This regulation replaces the relevant local grid cost of generation, excluding transmission and distribution costs. The Indonesian Minister of Energy and Mineral Resources ("MEMR") releases each year a list of local BPPs for each region and a national BPP (which is an averagebasis of the local BPPs). The BPPsrenewable energy tariff from the average electricity generation basic cost to ceiling price. In this scheme, the tariff is negotiated between IPP and PLN and must not be higher than the ceiling tariff set for a particular year aretype of renewable energy power plant, which then is multiplied by a factor based on PLN's previous year audited generation costs. In 2019, the MEMR published BPP figures of year 2018. The national BPP was set at Rp 983/kWh (equivalent to US$ cent 7.39/kWh at Rp 13,307/US$) based on 86 US$ per kWh. The MEMR did not publish PLN's 2016 audited generation costs.location.
For* The Law No. 11 of 2020 on Job Creation is changed by the regulation was not clearGovernment Regulation In Lieu of Law No. 2 of 2022 on Job Creation, thus the latter is the Omnibus Law
** Based on the Annual Report of PLN for 2022, it is stated that PLN operate 6,928 power generator units, of which 6,314 units belong to PLN (Page 62 and has been revoked, but the general interpretation174 of 2022 Annual Report. The Annual Report is that for geothermal projectsmade in Sumatera, Javabilingual format and Bali islands, the tariff will be determined based on mutual agreement between PLN and the IPP, regardless of the BPP figuresavailable in those regions. The central government is currently assessing preparing a draft presidential regulation that is expected to amend the tariff mechanism for renewable IPPs, including geothermal. The latest plan to adopt a Feed in Tariff scheme for Geothermal and Renewable Energy IPP is to revert to the previous geographically based ceiling tariff regime, with an added dimension of the timing of achieving commercial operation date.https://web.pln.co.id/bki/laporan-tahunan)
Guadeloupe
EDF is the transmission and distribution utility in Guadeloupe and also operates a significant portion of Guadeloupe’s fossil fuel energy generation. There are also a number of IPPs in Guadeloupe, primarily producing renewable electricity. The electricity sector in Guadeloupe is regulated by the Commission Regulation of Energy (CRE), which also regulates EDF’s operationsthe French electricity and gas markets in mainland France and its other overseas territories. The electricity sector in Guadeloupe is characterized by both enabling features and obstacles with respect to renewable energy. One of the most influential enabling features is a French law requiring the utility to purchase power from any interconnected renewable generator. The major obstacle preventing further uptake of renewable electricity generation is the cap on variable generation at 30% of instantaneous system load. According to the multi-annual energy program (PPE) for Guadeloupe, the island aims to reach total energy independence by 2030. The program outlines the development schedule with an emphasis on solar, wind and geothermal growth for the years 2023-2026. The PPE also predict a geothermal installed capacity of 78MW for the yearby 2028.
Honduras
In 2014, Honduras approved its new Law of Electrical Industry, (Decree 404-2013, and its Regulation, published in the Official Newspaper on November 18, 2015; and by Executive Accord 07-2015), which provides the legal framework for the electricity sector and replaces the previous Electricity Subsector Framework Law (Decree 158 of 1994, regulated by Accord 934 of 1997).Law. The Law establishes technology-specific auctions for renewable energy. It creates the Regulatory Commission of Electric Power (CREE) as the entity in charge of supervising the bidding processes and the awarding of PPAs. The CREE is also responsible for granting study permits for the construction of generation projects that use renewable natural resources. Permits will have a maximum duration of two years, and will be revoked if no studies have been initiated within a period of six months and the reports required by the CREE have not been submitted. The new Law also establishes that all new capacity must be contracted through auctions and that the government can set a minimum quota for renewables in each auction. With respect to metering, after previous regulation applied legal incentives to renewable energy metering, the new law mandates utilities to buy excess power and credit it towards monthly bills and to install bi-directional meters.
Among others, the objectives of the law are to adapt the electricity sector’s legislation to the Framework Treaty for the Central American Electricity Market, which Honduras is a party to, and update the operating rules in the country’s electricity industry by incorporating structures and modern practices to increase the sector’s efficiency and competency in the production and marketing of electricity services.
With the passage of this new law, Honduras is movinghas moved into a new and open market. Under this legislation, all aspects of the market have been opened to private parties. This legislation is still being implemented within the market.
Honduras has also approved a Law of Incentives for Renewable Energy Projects, Decree 70-2007, further amended by Decree 138-2013, with additional incentives to solar PV projects, etc. The purpose, as in other countries of the region, is to promote the development of renewable energy power plants. Laws provide certain benefits to companies that generate power through renewable sources, including a 10-year exemption from corporate income tax and VAT on imports and customs duties, a fast track process for certain permits and a Sovereign Guaranty by the Central Government for the payments of the off-taker, the Public Utility Company, ENEE. At present, the Law of the Electrical Industry and the Laws of Incentives for Renewable Energy Projects are still in force.
Operations of our Product Segment
Power Units for Geothermal Power Plants
We design, manufacture, and sell power units for geothermal electricity generation, which we refer to as OECs. Our customers include contractors and geothermal plant owners and operators.
The power units are usually paid for in installments, in accordance with milestones set forth in the supply agreement. We also provide the purchaser with spare parts (either upon their request or our recommendation). We provide the purchaser with at least a 12-month warranty for such products. We provide the purchaser with performance guarantees (usually in the form of standby letters of credit), which partially terminates upon delivery of the equipment to the site and terminates in full at the end of the warranty period.
Power Units for Recovered Energy-Based Power Generation
We design, manufacture, and sell power units used to generate electricity from recovered energy or so-called “waste heat”. Our existing and target customers include interstate natural gas pipeline owners and operators, gas processing plant owners and operators, cement plant owners and operators, biomass facilities owners and operators and all other companies engaged in energy-intensive industrial processes such as glass, steel and other. We manufacture and sell the power units for recovered energy-based power generation to third parties for use in “inside-the-fence” installations or otherwise.
EPC of Power Plants
We engineer, procure and construct, as an EPC contractor, geothermal and recovered energy power plants on a turnkey basis, using power units we design and manufacture. Our customers are geothermal power plant owners as well as our target customers for the sale of our recovered-energy based power units described above. Unlike many other companies that provide EPC services, we believe that our advantage is in using our own manufactured equipment and thus have better quality and control over the quality, timing and delivery of equipment and related costs. The consideration for such services is usually paid in installments, in accordance with milestones set forth in the EPC contract and related documents. We provide performance guarantees securing our obligations under the contract.
In connection with the sale of our power units for geothermal power plants, power units for recovered energy-based power generation, we enter into agreements, from time to time, with sales representatives for the marketing and sale of such products pursuant to which we are obligated to pay commissions to such representatives upon the sale of our products in the relevant territory.
Our manufacturing operations and products are certified ISO 9001, ISO 14001, American Society of Mechanical Engineers (ASME), Pressure Equipment Directive and TÜV, and we are an approved supplier to many electric utilities around the world.
Backlog
We have a product backlog of approximately $152.0 million as of February 21, 2024, which includes revenues for the period between January 1, 2024 and February 21, 2024, compared to $148.1 million as of February 22, 2023, which included revenues for the period between January 1, 2023 and February 16, 2023. The increase in the 2023 backlog is mainly related to the continued recovery and the signing of a new large EPC contract in New Zealand during 2023 and the Ijen project.
The following is a breakdown of the Product segment backlog amount (in $ millions) by countries as of February 22, 2024:
Country | Backlog Amount | Percentage of Backlog |
New Zealand | 115.0 | 75.8% |
Indonesia | 8.1 | 5.3% |
Guatemala | 8.1 | 5.3% |
Turkey | 6.7 | 4.4% |
U.S. | 5.6 | 3.7% |
Israel | 2.7 | 1.8% |
Taiwan | 2.5 | 1.6% |
Others | 3.0 | 2.0% |
Total | 151.7 | 100% |
The following is a breakdown of the Product segment backlog by technology as of February 21, 2024:
| | % of Total Backlog | Latest Expected Completion |
Geothermal | 93.0% | 2025 |
Recovered Energy | 5% | 2024 |
Pumps | 2.0% | 2025 |
Operations of our Energy Storage Segment
Storage Projects
In addition to our Geothermal activity, we own, operate and develop energy storage projects in the United States including the following:
Under operation
Project Name | Customer | Location | Size (MW) | MWh | Type of contract |
ACUA | PJM | NJ | 1 | 1 | Merchant |
Plumsted | PJM | NJ | 20 | 20 | Merchant |
Stryker | PJM | NJ | 20 | 20 | Merchant |
Hinesburg | ISONE | VT | 2.0 | 5.0 | Merchant |
Rabbit Hill | ERCOT | TX | 10.0 | 10.0 | Merchant |
Pomona | SCE/CAISO | CA | 20.0 | 80.0 | Capacity PPA and Merchant |
Vallecito | CAISO and SCE | CA | 10.0 | 40.0 | Capacity PPA and Merchant |
Tierra Buena | CAISO, RCEA and VCE | CA | 5.0 | 20.0 | Capacity PPA and Merchant |
Upton | ERCOT | TX | 23.0 | 23.0 | Merchant |
Andover | PJM | NJ | 20.0 | 20.0 | Merchant |
Howell | PJM | NJ | 7.0 | 7.0 | Merchant |
Bowling Green | PJM | OH | 12.0 | 12.0 | Capacity and Merchant |
Pomona 2 | SCE/CAISO | CA | 20.0 | 40.0 | Full Tolling |
Total | | | 170.0 | 298.0 | |
Under construction and development
Project Name | Customer | Location | Size (MW) | MWh | Type of contract | Expected COD |
Bottleneck | CAISO | CA | 80 | 320 | Full Tolling | Q2 2024 |
East Flemington | PJM | NJ | 20 | 20 | Merchant | Q1 2024 |
Montague | PJM | NJ | 20 | 20 | Merchant | Q1 2025 |
Arrowleaf | SDCP | CA | 35 | 140 | Full tolling | H1 2025 |
Lower Rio | ERCOT | TX | 60 | 120 | Merchant/Tolling under negotiation | H1 2025 |
Bird Dog | ERCOT | TX | 60 | 120 | Merchant | H2 2025 |
Shirk | CAISO | CA | 80 | 320 | RA under negotiation | H2 2025 |
Total | | | 355.0 | 1,060.0 | | |
Energy Storage Pipeline
For an energy storage prospect to move into the EPC phase, it requires site control, an executed interconnection agreement, permits from all authorities and a viable financial model. We have a substantial pipeline of approximately 2.9GW/9.9GWh of projects in different stages of development for future development in the United States that will support our target to reach an energy storage portfolio of between 700 to 800 MW/ 1,900-2,300 MWh by the end of 2026.
ITEM 1A. RISK FACTORS
The following risk factors should be read carefully in connection with evaluating us and this Annual Report on Form 10-K.Report. Certain statements in “Risk Factor” are forward-looking statements. See “Cautionary Note Regarding Forward-Looking Statements” elsewhere in the report.this Annual Report.
Risks Related to the Company’sCompany’s Business and Operation
Our financial performance depends on the successful operation of our geothermal, REG and REGSolar PV power plants under the Electricity segment, as well as our Energy Storage facilities, which are subject to various operational risks.
Our financial performance depends on the successful operation of our geothermal REG and REGSolar PV power plants. In connection with such operations, we derived 76.8%80.4% of our total revenues for the year ended December 31, 20202023 from the sale of electricity. The cost of operation and maintenance and the operating performance of our geothermal power, REG and REGSolar PV power plants may be adversely affected by a variety of factors, including the following:including:
| | • | regular and unexpected maintenance and replacement expenditures; |
| | • | shutdowns due to the breakdown or failure of our equipment or thethird party equipment of the transmission serving utility; |
| | • | the presence of hazardous materials on our power plant sites; |
| | • | continued availability of cooling water supply; |
| | • | catastrophic events such as fires, explosions, earthquakes, volcanic activity, landslides, floods, releases of hazardous materials, severe weather storms or other weather events (including weather conditions associated with climate change),change, or similar occurrences affecting our power plants or any of the power purchasers or other third parties providing services to our power plants, such as the 2018 volcanic eruption that occurred in Hawaii's Big Island that impacted our Puna project, as discussed elsewhere in this Annual Report; |
| | • | the aging of power plants (which may reduce their availability and increase the cost of their maintenance); |
| • | unsuccessful augmentation of batteries or other necessary equipment; and |
| | • | cyber attackscyber-attacks that may interrupt the operation of our power plants.
|
Our exploration, development, and operation of geothermal energy resources are subject to geological risks and uncertainties, which may result in insufficient prospects to support our growth, decreased performance or increased costs for our power plants.
Our primary business involves the exploration, development, and operation of geothermal energy resources. These activities are subject to uncertainties that, in certain respects, are similar to those typically associated with oil and gas exploration, development, and exploitation, such as dry holes, uncontrolled releases, and pressure and temperature decline. Any of these uncertainties may increase our capital expenditures and our operating costs or reduce the efficiency of our power plants. We may not find geothermal resources capable of supporting a commercially viable power plant at exploration sites where we have conducted tests, acquired land rights, and drilled test wells, which would adversely affect our development of geothermal power plants.plants and as a result would adversely affect our growth plans. Further, since the commencement of their operations, several of our power plants have experienced geothermal resource cooling, uncontrolled flow and/or reservoir pressure decline in the normal course of operations. Because geothermal reservoirs are complex geological structures, we can only estimate their geographic area and sustainable output. The viability of geothermal power plants depends on different factors directly related to the geothermal resource (such as the temperature, pressure, storage capacity, transmissivity, and recharge) as well as operational factors relating to the extraction or reinjection of geothermal fluids. Our geothermal energy power plants may also suffer an unexpected decline in the capacity of their respective geothermal wells and are exposed to a risk of geothermal reservoirs not being sufficient for sustained generation of the electrical power capacity desired over time. A recent example is the SarullaOlkaria complex, which experienced a reduction in generation due to well fieldlower performance of the wellfield. We are working to increase the capacity back. Also, in the Sarulla complex, we experienced a reduction in generation primarily due to wellfield issues at one of its power plants, as well as equipment failures which resulted in a decrease in profitability. In the NILsecond quarter of 2022, Sarulla agreed with its banks on a framework to perform remediation works that are aimed to restore the power plant.plants' performance. The outcome of the first phase of the recovery plan is under evaluation after which we will make a decision regarding the implementation of the second phase. As we determined that the current situation and circumstances related to our equity method investment in Sarulla complexare temporary, no impairment testing was required for the period. For example, in the fourth quarter 2022 we recorded a non-cash impairment loss of $30.5 million related to our Brawley power plant in California that has been generating electricity that is currently developing a remediation plan with a targetlower than its generating capacity of 13MW due to increase generation back to previous levelscontinuous wellfield issues which resulted in higher than expected operating costs and welower than expected electricity revenues. We are following the remediation plans as well as assessing the accounting impact and its implication on our financial statements and our investment in the Sarulla complex.
Another aspect of geothermal operations is the management and stabilization of subsurface impacts caused by fluid injection pressures of production and injection fluids to mitigate ground subsidence or inflation. Inflation and subsidence, if not controlled, can adversely affect farming operations and other infrastructure at or near the land surface.
Additionally, active geothermal areas, such as the areas in which our power plants are located, may be subject to frequent low-level seismic disturbances. Serious seismic disturbances, volcanic eruptions and lava flows are possible and could result in damage to our power plants (or transmission lines used by customers who buy electricity from us) or equipment or degrade the quality of our geothermal resources to such an extent that we could not perform under the PPA for the affected power plant, which in turn could reduce our net income and materially and adversely affect our business, financial condition, future results and cash flow. If we suffer a serious seismic disturbance, volcanic eruptions and lava flows, our business interruption and property damage insurance may not be adequate to cover all losses sustained as a result thereof. In addition, insurance coverage may not continue to be available in the future in amounts adequate to insure against such seismic disturbances, volcanic eruptions and lava flows.
Furthermore, absent additional geologic/hydrologic studies, any increase in power generation from our geothermal power plants, failure to reinject the geothermal fluid or improper maintenance of the hydrological balance may affect the operational duration of the geothermal resource and cause it to decline in value over time and may adversely affect our ability to generate power from the relevant power plant.
We may decide not to implement, or may not be successful in implementing, one or more elements of our multi-year strategic plan, and the plan as implemented may not achieve its goal of enhancing shareholder value through the long-term growth of our Company
We are implementing a multi-year strategic plan to:
| | • | strengthen our core geothermal business in the United States as well as globally; |
| | • | establishing a strong market position in the IFM energy storage market; and |
| | • | exploring opportunities in new areas by looking for synergistic growth opportunities utilizing our core competence, market reputation as a successful company and new market opportunities focused upon environmental solutions. |
There are uncertainties and risks associated with our strategic plan, including with respect to implementation and outcome. We may decide to change, or to not implement, one or more elements of the plan over time or we may not be successful in implementing one or more elements of the plan, in each case for a number of reasons. For example, we may face significant challenges and risks expanding into the energy storage market (or expanding our core geothermal business), including:
| | • | our ability to compete with the large number of other companies pursuing similar business opportunities in energy storage and solar PV power generation, many of which already have established businesses in these areas and/or have greater financial, strategic, technological or other resources than we have; |
| | • | our ability to obtain financing on terms we consider acceptable, or at all, which we may need, for example, to develop new projects, to obtain any technology, personnel, intellectual property, or to acquire one or more existing businesses as a platform for our expansion, or to fund internal research and development, for energy storage and solar PV electric power generation products and services; |
| | • | our ability to provide energy storage or solar power generation products or services that keep pace with rapidly changing technology, customer preferences, equipment costs, increasing raw materials and transportation costs, market conditions and other factors that are unknown to us now that will impact these markets; |
| | • | Ourour ability to manage the risks and uncertainties associated with our operating storage facilities and future development of storage and geothermal projects which may operate as "merchant" facilities without long-term sales agreements, including the variability of revenues and profitability of such projects;
|
| | • | our ability to devote the amount of management time and other resources required to implement this plan, while continuing to grow our core geothermal and recovered energy businesses; and |
| | • | our ability to recruit appropriate employees.employees and labor market challenges. |
Strengthening our core geothermal business to new customers and geographical areas will have many of the same risks and uncertainties as those outlined above.
Implementing the plan may also involve various costs, including, among other things:
| | • | opportunity costs associated with foregone alternative uses of our resources; |
| | • | various expense items that will impact our current financial results; and |
| | • | asset revaluations (for example, businesses or other assets acquired for new energy storage or solar PV power generation products or services may suffer impairment charges, as a result of rapidly changing technology, market conditions or otherwise). |
These costs may not be recovered, in whole or in part, if one or more elements of the plan are not successfully implemented. These costs, or the failure to implement successfully one or more elements of the plan, could adversely affect our reputation and the reputation of our subsidiaries and could materially and adversely affect our business, financial condition, future results and cash flow.
Apart from the risks associated with implementing the plan, the plan itself will expose us to other risks and uncertainties once implemented. Expanding our customer base may expose us to customers with different credit profiles than our current customers. Expanding our geographic base will subject us to risks associated with doing business in new foreign countries in which we will have to learn the business and political environment. In addition, expanding into new technologies will expose us to new risks and uncertainties that are unknown to us now in addition to the risks and uncertainties that may be similar to those we now face. The success of the plan, once implemented, will depend, among other things, on our ability to manage these risks effectively.
The trading price of our common stock could decline if securities, industry analysts or our investors disagree with our strategic plan or the way we implement it. Accordingly, there is no assurance that the plan will enhance shareholder value through long-term growth of the Company to the extent currently anticipated by our management or at all.
Our investments in battery energy storage system (BESS) technology involves new technologies and new advanced technologies with relatively limited history with respect to reliability and performance and may not perform as expected. In addition, our investments and profitability may be negatively affected by a number of factors, including increases in storage costs, risk of fire and volatility in merchant prices.
We devote resources to research and development related to our energy storage segment, and the ability of these BESS facilities to meet our performance expectations is subject to the risks inherent in newly constructed facilities, including, but not limited to, system failures, outages and design and/or construction flaws, latent defects and degradation of equipment in excess of our expectations. Battery storage facilities utilize new technologies with a relatively limited history with respect to reliability and performance. We will need to innovate in order to keep pace with industry developments and customer expectations, and there is no guarantee that such new technologies will perform as expected. If any of our battery energy storage services contains manufacturing defects or any undetected defects, errors or bugs in hardware or software, our business and financial results could be adversely affected.
In addition, our investments in BESS facilities may be negatively affected by increases in storage costs, and the industry has recently experienced, and it is still facing, challenges in the development of new energy storage projects due to global supply chain constraints and inflation, which has caused an increase in prices and a shortage of core components of energy storage projects, specifically batteries. Our projects under development have experienced delays as a result of these challenges.
The revenues from our BESS facilities fluctuate over time since a large portion of such revenues are generated in the merchant markets, where price volatility is inherent. This volatility in merchant prices may adverse affect our Energy Storage profitability. Developments in alternative technologies may materially and also adversely affect demand for battery energy storage.
Our BESS projects are also subject to current permitting and regulatory compliance requirements and an evolving regulatory landscape at both the federal and state level. Our projects under development have experienced delays and] may in the future experience delays as a result of these requirements. In addition, we may be required by local governmental agencies to restrict our battery charging services, and in February 2021, as a result of the power crisis in Texas, we incurred $9.1 million in losses associated with our Rabbit Hill facility because ERCOT restricted us from providing battery charging services from February 16, 2021 to February 19, 2021.
Any of these events could significantly increase the expenses incurred by our BESS facilities or could significantly reduce or entirely eliminate the revenues generated by one or more of our BESS facilities plants, which in turn would reduce our net income and could materially and adversely affect our business, financial condition, future results and cash flows.
Concentration of customers, specific projects and regions may expose us to heightened financial exposure.
Our businesses often rely on a single customer to purchase all or a significant portion of a facility’s output. The financial performance of these facilities depends on suchthe ability of each customer continuing to perform its obligations under a long-term agreement between the parties. A facility’s financial results could be materially and adversely affected if any of our customers fail to fulfill its contractual obligations and we are unable to find other customers in the marketplace to purchase at the same level of profitability. We cannot assure that such performance failures by our customers will not occur, or that if they do occur, such failures will not adversely affect the cash flows or profitability of our businesses. Our business relies significantlyMoreover, there can be no assurance that we will be able to enter into replacement agreements on the performancefavorable terms or at all.
While we have historically been able to collect on substantially all of our two largest projects, the McGinness Hills complex in East Nevadareceivable balances, we have received late payments and Olkaria III Complex in Kenya, which together accounted for more than 30% of the total generating capacityhave amounts overdue from certain of our Electricity segment in 2020. These two facilities accounted for 30% of our total revenues for the year ended December 31, 2020. Any disruption to the operation of these facilities would have a disproportionately adverse effect on our revenues and on our profitability.
For example, insignificant customers. In the Electricity segment, we are exposed to the credit and financial condition of KPLC that buys the power generated from our Olkaria III complex in Kenya. In 2020,2023, KPLC accounted for 16.4%13.2% of our total revenues. There has been a deterioration in the collection from KPLC that became slower than in the past, and as of December 31, 2020,2023, the amount overdue from KPLC in Kenya was $48.9$62.8 million of which $16.2$32.2 million was paid in January and February of 2021.2024. In addition, KPLC recently requested more favorable rates on existing PPAs with it. Any change in KPLC'sKPLC’s financial condition or the terms of our agreement with KPLC, may adversely affect us. Another example, we
In Honduras, as of December 31, 2023, the total amount overdue from ENEE was $15.7 million of which $2.5 million was collected in January and February of 2024. In addition, due to the financial situation in Honduras, the Company may experience additional delays in collection. The Company believes it will be able to collect all past due amounts in Honduras.
We are also exposed to the credit and financial condition of SCPPA and its municipal utility members that account for 20.6%21.2% of our total revenues, as customers that buy the output from seven of our geothermal power plants. Because our contracts with SCPPA are long-term, we may be adversely affected if the credit quality of any of these customers were to decline or if their respective financial conditions were to deteriorate or if they are otherwise unable to perform their obligations under our long-term contracts.
In the Product segment, 9.3% and 44.2%addition, we generate a significant portion of our 2019revenue from our two largest projects, the McGinness Hills complex in East Nevada and the Olkaria III Complex in Kenya, which together accounted for approximately 27.6% of the total generating capacity of our Electricity segment in 2023. These two facilities accounted for 25.6% of our total revenues and Products segment revenue, respectively, were derived from our operations in Turkey and we rely onfor the continued geothermal development growth and government support for geothermal development in the country. Our revenue exposureyear ended December 31, 2023. Any disruption to the Turkish market was significant in 2019operation of these facilities would have a disproportionately adverse effect on our revenues and was reduced in 2020, due to the slowdown in project development in the Turkish market resulting from the COVID 19 pandemic and uncertainty with respect to a local incentive regulation extension that was ultimately extended in January 2021. Adverse political developments in the relationship between Turkey and the U.S., adverse economic developments in this region including the 2018 failed coup, devaluation of the Turkish Lira, a general slowdown in the Turkish economy and an inability to obtain project and bank financing or a decline in government support for the development of geothermal power in the country could materially and adversely affect regional demand for the geothermal equipment and services we provide in the Turkish market or the prices we may charge for such equipment and services, which in turn could materially and adversely affecton our Product segment profit margins and, consequently, our business, financial condition, future results and cash flows.profitability.
Ormat established a facility in Turkey in order to locally produce several power plant components that entitle our customer to increased incentives under the renewable energy laws. The use of local equipment in renewable energy based generating facilities in Turkey entitles such facilities to significant benefits under Turkish law, provided such facilities have obtained an RER Certificate from EMRA, which requires the issuance of a local certificate. If we do not obtain the local certificate, then some of our customers under the relevant supply agreements in Turkey may not be issued a RER Certificate based on the equipment we supply to them, and we will be required to make a payment to such customers equal to the amount of the expected lost benefit.
Our internationalglobal operations expose us to risks related to the application of foreigninternational laws and regulations, any of which may adversely affect our business, financial condition, future results and cash flows.
Our foreignglobal operations in countries including Kenya, Turkey, Guadeloupe, Guatemala, Honduras, Indonesia and other countries are subjectothers require us to regulation bycomply with the laws and regulations of various foreign governments and regulatory authorities outside the United States in addition to legal and are subject toregulatory requirements in the application of foreign laws.United States. Such foreign laws or regulations may not provide the same type of legal certainty, and rights, in connectionor judicial processes with respect to our contractual relationships in such countries, as are afforded to our operations in the United States, whichStates. A failure to receive adequate judicial or enforcement protection of our contractual rights abroad may adversely affect our ability to receivefulfill our contracts successfully and generate revenues or enforce our rightstherefrom. In particular, the legal and regulatory systems in connection with ourthe foreign operations. The systems of some of these countriesjurisdictions where we operate can be characterized by:
by one or more of the following:
| | ●•
| selectiveSelective or inconsistent enforcement of laws or regulations, sometimes in ways that have been perceived as being motivated by political or financial considerations;
|
| | ●• | aA perceived lack of judicial and prosecutorial independence from political, social and commercial forces;
|
| | ●• | aA high degree of discretion on the part of the judiciary and governmental authorities;
|
| | ●• | legalLegal and bureaucratic obstacles and corruption; and
|
| | ●• | rapid evolution ofRapidly evolving legal systems in ways thatwhose systems may not always coincide with market developments.
|
These characteristics give rise to investment risks that do not exist in countries with more established legal systems in more developed economies.
We face additional risks inherent in conducting business internationally, including compliance with laws and regulations of many jurisdictions that apply to our international operations. These laws and regulations may apply to us, our subsidiaries, individual directors, officers, employees and agents, and may restrict our operations, trade practices, investment or acquisition decisions or partnership opportunities. These requirements include, but are not limited to, data privacy requirements, labor relations laws, tax laws, competition regulations, import and trade restrictions, economic sanctions, and export requirements,requirements.
In particular, our international operations are subject to United States and foreign anti-corruption laws and regulations, such as the Foreign Corrupt Practices Act of 1977, as amended (the “FCPA”) and other local laws that prohibit corrupt payments to governmental officials or certain payments or remunerations to customers. The FCPA prohibits United States companies and their officers, directors, employees and agents acting on their behalf from corruptly offering, promising, authorizing or providing anything of value to foreign officials for the purposes of influencing official decisions or obtaining or retaining business or otherwise obtaining favorable treatment. The FCPA also requires companies to make and keep books, records and accounts that accurately and fairly reflect transactions and dispositions of assets and to maintain a system of adequate internal accounting controls. As part of our business, we deal with state-owned business enterprises, the employees and representatives of which may be considered foreign officials for purposes of the FCPA. As a result, business dealings between our employees and any such foreign official could expose us to the risk of violating anti-corruption laws even if such business practices may be customary or are not otherwise prohibited between us and a private third party. Violations of these legal requirements are punishable by criminal fines and imprisonment, civil penalties, disgorgement of profits, injunctions, debarment from government contracts as well as other remedial measures.
Given the high level of complexity of these laws, there is a risk that some provisions may be breached by us, for example through fraudulent or negligent behavior of individual employees (or third parties acting on our behalf), our failure to comply with certain formal documentation requirements, or otherwise. Violations of these laws and regulations could result in fines, criminal sanctions against us, our officers or our employees, requirements to obtain export licenses, cessation of business activities in sanctioned countries, implementation of compliance programs and prohibitions on the conduct of our business. Any such violation could include prohibitions on our ability to offer our products in one or more countries and could materially damage our reputation, our brand, our ability to attract and retain employees, our business, our financial condition and our results of operations.
Furthermore, existing laws or regulations may be amended or repealed, and new laws or regulations may be enacted or issued. In addition, the laws and regulations of some countries may limit our ability to hold a majority interest in some of the power plants that we may develop or acquire, thus limiting our ability to control the development, construction and operation of such power plants, or our ability to import our products into such countries.
Political, economic and other conditions in the emerging economies where we operate, including Israel, may subject us to greater risk than in the developed U.S. economy, which may have a materially adverse effect on our business.
We have substantial operations outside of the United States, both in our Electricity segment and our Product segment. In 2020, 48.5%2023, 38.5% of our total revenues were derived from international operations, and our Electricity segment international operations were significantly more profitablehad higher gross profit than our U.S. operations. AIn 2023 a substantial portion of international revenues came from Kenya and Turkey and, to a lesser extent, from Honduras, Guatemala, Guadeloupe and other countries. Thus, disturbances to and challenges facing our foreign operations, especially in Kenya, and Turkey, could have impacts on our business ranging from moderate to severe. Our foreign operations and our exposure to foreign customers that are in most cases, government owned utilities, subject us to significant political, economic and financial risks, which vary by country, and include:
| | ●•
| changes in government policies or personnel; |
| | ●•
| changes in general economic conditions; |
| | ●•
| restrictions on currency transfer or convertibility; |
| | ●• | the adoption or expansion of trade restrictions, the occurrence or escalation of a “trade war,” or other governmental action related to tariffs or trade agreements or policies among the governments of the United States and countries where we operate; |
| | ●• | reduced protection for intellectual property rights in some countries; |
| | ●•
| changes in labor relations; |
| | ●•
| political instability and civil unrest, and risk of war; |
| | ●•
| terrorist acts or other similar events; |
| • | changes in the local electricity and/or geothermal markets; |
| | ●•
| difficulties enforcing our rights against a governmental agency because of the doctrine of sovereign immunity and foreign sovereignty over international operations; |
| | ●•
| breach or repudiation of important contractual undertakings by governmental entities; and |
| | ●•
| expropriation and confiscation of assets and facilities, including without adequate compensation. |
Electricity Segment. In 2020,2023, the international operations of the Electricity segment accounted for 28%23% of our total revenues, but accounted for 51%44% of our gross profit, 70%63% of our net income and 45%36% of our EBITDA. A substantial portion of Electricity segment international revenues came from Kenya (which also contributed disproportionately to our gross profit and net income) and, to a lesser extent, from Guadeloupe, Guatemala and Honduras. In Kenya, any break-up or potential privatization of KPLC, the power purchasepurchaser for our power plants located in Kenya, may adversely affect our Olkaria III complex and our overall results of operations. Additionally, in Guatemala the electricity sector was partially privatized, and it is currently unclear whether further privatization will occur in the future. Such developments may affect our Amatitlan and Zunil power plants if, for example, they result in changes to the prevailing tariff regime or in the identity and creditworthiness of our power purchasers.
Product Segment. With respect to our Product segment, 96%94% of our Product segment revenues in 20202023 came from international sales, primarily Turkey.New Zealand. Since we primarily engage in sales in those markets where there is a geothermal reservoir, any such change might adversely affect geothermal developers in those markets and, subsequently, the ability of such developers to purchase our products.
Generally. Outbreaks of civil and political unrest and acts of terrorism have also occurred in several countries in Africa, the Middle East and Latin America, where we have significant operations, such as Kenya and Turkey. For instance,Honduras. Kenya experienced numerous terrorist attacks in 2014 and 2015, and has experienced an upsurge in attacks in more recent years, including in early 2019, from extremist groups. Continued or escalated civil and political unrest and acts of terrorism in the countries in which we operate could result in our curtailing operations. In the event that countries in which we operate experience civil or political unrest or acts of terrorism, especially in events where such unrest leads to an unseating of the established government, our operations in such countries could be materially impaired. Although
As a result of these risks, we generally obtainpurchase certain types of political risk insurance in connectionpolicies for selected countries where we operate and which are exposed to political turmoil, geopolitical issues or political uncertainty. While such policies are designed to offer assistance with our foreign power plants, suchrespect to some political risk insuranceincidents that could give rise to financial liability, it does not mitigate all of the above-mentioned risks. In addition, insurance proceeds received pursuant to our political risk insurance policies, where applicable, may not be adequate to cover all losses sustained as a result of any covered risks and may at times be pledged in favor of the power plant lenders as collateral. Also, insurance may not be available in the future with the scope of coverage and in amounts of coverage adequate to insure against such risks and disturbances. Any or all of the changes discussed above could materially and adversely affect our business, financial condition, future results and cash flow.
Conditions in and around Israel, where the majority of our senior management and our main production and manufacturing facilities are located, including the ongoing military conflicts in Israel's borders, may adversely affect our operations and may limit our ability to produce and sell our products, or manageand support our power plants.Electricity segment.
TheWe are a multinational company and do not derive a majority of our revenues from Israel, however, the majority of our senior management and our main production and manufacturing facilities are located in Israel, approximately 26 miles from the border with the Gaza Strip. As such, political, economic and security conditions in Israel and the Middle East region directly affect our operations.
On October 7, 2023, Hamas terrorists and members of other terrorist organizations infiltrated Israel’s southern border from the Gaza Strip and conducted a series of attacks on civilian and military targets, including widespread killings and kidnappings. They also launched extensive rocket attacks on the Israeli civilian population. Shortly following the attack, Israel declared war against Hamas, and several hundred thousand Israeli reservists were drafted to perform immediate military service.
The political instabilityintensity and civil unrestduration of Israel’s current war against Hamas and military conflicts at some of its borders are difficult to predict, as are its economic implications on the Company’s business and operations in Israel and on Israel’s economy in general. As of the date of this report, approximately six percent of our workforce in Israel (approximately two percent of our total global workforce), the vast majority of whom work in our Product segment, have been called up for military service, and may be absent for an extended period. Operations in our Product segment (which accounted for approximately 16.1% of our total consolidated revenues and $48.5 million in intersegment revenues for 2023, have been, and may continue to be, disrupted by such absences, which could materially and adversely affect our business and operating results. Clashes between Israel and Hezbollah around the Lebanon-Israel border are also ongoing and may escalate in the Middle East and North Africa (including the ongoing civil warfuture into a greater regional conflict.
Our facilities in Syria)Israel, as well as the increased tension between IranPort of Ashdod via which we receive supplies for and Israel have raised new concerns regarding securityship products for our Product segment, are within the range of rockets fired from the Gaza Strip in the regionwar and are close to Gaza’s coastline, and some rockets have landed near our facilities in the potentialongoing war. More recently, the Houthi movement, which controls parts of Yemen, launched a number of attacks on marine vessels in the Red Sea. The Red Sea is an important maritime route for armed conflictinternational trade. As a result of such disruptions, we have experienced, and may continue to experience, extended lead times, delays in supplier deliveries, increased transportation and component costs, and increased costs for expedited shipments. These supply chain disruptions have resulted, and may continue to result in, delayed deliveries of several key components used in the manufacturing of our products and could impact our ability to timely deliver products to our customers in our Product Segment. This has also resulted in an increase in insurance premium costs for shipments into and out of the port. In anticipation of possible operational delays in our Product segment, we have issued force majeure notices preemptively to several customers. If, due to the current war or otherfuture similar hostilities, involving Israel. Weour facilities in Israel are damaged or their operations disrupted, or our access to the Port of Ashdod (or alternative ports at Hifa or Eilat) is impaired, our ability to perform on our contractual obligations to our Product segment customers or to continue growing that business could be impacted. The conflict could additionally result in parties with whom we have agreements involving performance in Israel claiming that they are not obligated to perform their commitments under those agreements pursuant to force majeure provisions in such agreements. In addition, new customers may be reluctant to do business with us, and existing customers may be reluctant to renew their agreements with us, due to their uncertainty regarding our ability to perform under our commitments while the war is ongoing. Limitations on travel to Israel from abroad could make it harder for us to secure contracts in the Product segment with new business partners. We have shelter-in-place and work-from-home measures, government-imposed restrictions on movement and travel and other precautions taken to address the ongoing conflict and which may temporarily disrupt our management and employees’ ability to effectively perform their daily tasks. All of the foregoing factors could negatively affect operations within our Product segment or delay growth in our Electricity segment.
Finally, political conditions within Israel could affect our operations or negatively impact the business environment in Israel due to reluctance of foreign investors to invest or conduct business in Israel, increased currency fluctuations, downgrades in credit rating, increased interest rates, increased volatility in securities markets, adverse impacts on the labor market, and other related changes in macroeconomic conditions. We cannot be certain whether this will adversely affectedimpact the perception of our business and our share price, or impact our business operations in Israel.
Responses in various countries where we have business operations to Israel’s ongoing military conflicts on some of its borders or future similar conflicts may adversely affect our operations and may limit our ability to produce and sell our products.
Although we are a multinational company and we do not derive a majority of our revenues from Israel, we have known ties to Israel through the presence of our senior management and a significant portion of our Product segment there. The perception that we are an Israeli company could impair our business and results of operations due to the international response to Israel’s ongoing military conflicts in its boarders or future similar conflicts. Our business could be substantially harmed by any such hostilities, the interruption or curtailment of trade between Israel and its trading partners or a significant downturn in the economic or financial conditionuse of Israel. In addition, the sale of products manufactured in Israel may be adversely affected in certain countries by restrictive laws, policies or practices directed toward Israel or companies having operations in Israel.
In addition, some of These restrictions may limit materially our employeesability to obtain raw materials from these countries or to sell our products to companies and customers in Israel are subject to being called upon to perform military servicethese countries. Deterioration in political relations between Israel and their absenceother countries, and/or violence from popular movements or terrorist activities in countries where we do business motivated by anti-Israel sentiment, such as Turkey or Indonesia, could impact our ability to secure new contracts, renew existing contracts and/or carry on business in those countries. Moreover, there have been increased efforts by activists to cause companies and consumers to boycott Israeli companies. Such efforts, particularly if they become more widespread, may have an adverse effect upon our operations.
These events and conditions could disrupt our operations in Israel, which could materially and adversely affectimpact our business, financial condition, future results, and cash flow.ability to sell our products outside of Israel.
Continued reduction in our Products backlog may affect our ability to fully utilize our main production and manufacturing facilities and may have a materially adverse effect on our business.
In our Product segment, the economic downturn as a result of the recent Covid-19 pandemic has adversely impacted customers’ purchasing decisions and travel restrictions have adversely impacted our sales and marketing efforts and we experienced a decrease in our backlog. Continued reduction in our backlog may affect our ability to fully utilize our manufacturing facility and we may incur higher costs that our Product segment revenues may not be able to cover or increase capital costs to develop our own power plants, which could materially and adversely affect our business, financial condition, future results, and cash flow.
We have significant operations globally, including in countries that may be adversely affected by political or economic instability, major hostilities or acts
Some of our leases will terminate if we do not extract geothermal resources in “commercial quantities”“commercial quantities”, if we fail to comply with the terms or stipulations of such leases or any of the provisions of the Geothermal Steam Act or if the lessor under any such lease defaults on any debt secured by the relevant property, thus requiring us to enter into new leases or secure rights to alternate geothermal resources, none of which may be available on terms as favorable to us as any such terminated lease, if at all.
Most of our geothermal resource leases are for a fixed primary term, and then continue for so long as geothermal resources are extracted in “commercial quantities” or pursuant to other terms of extension. The land covered by some of our leases (approximately 293,000200,000 acres in the U.S. and approximately 15,000 acres elsewhere) is undeveloped and has not yet produced geothermal resources in commercial quantities. Leases that cover land which remains undeveloped and does not produce, or does not continue to produce, geothermal resources in commercial quantities and leases that we allow to expire, may terminate. In the event that a lease is terminated and we determine that we will need that lease once the applicable power plant is operating, we would need to enter into one or more new leases with the owner(s) of the premises that are the subject of the terminated lease(s) in order to develop geothermal resources from, or inject geothermal resources into, such premises or secure rights to alternate geothermal resources or lands suitable for injection. We may not be able to do this or may not be able to do so without incurring increased costs, which could materially and adversely affect our business, financial condition, future results and cash flow.
Our BLM leases may be terminated if we fail to comply with any of the provisions of the Geothermal Steam Act or if we fail to comply with the terms or stipulations of such leases, which could materially and adversely affect our business, financial condition, future results and cash flow.
PursuantAdditionally, pursuant to the terms of our BLM leases, we are required to conduct our operations on BLM-leased land in a workmanlike manner and in accordance with all applicable laws and BLM directives and to take all mitigating actions required by the BLM to protect the surface of and the environment surrounding the relevant land. Additionally, certainCertain BLM leases contain additional requirements, some of which relate to the mitigation or avoidance of disturbance of any antiquities, cultural values or threatened or endangered plant, wildlife and species. In the event of a default under any BLM lease, or the failure to comply with such requirements, or any non-compliance with any of the provisions of the Geothermal Steam Act or regulations issued thereunder, the BLM may, 30 days after notice of default is provided to our relevant project subsidiary, suspend our operations until the requested action is taken or terminate the lease, either of which could materially and adversely affect our business, financial condition, future results and cash flow.
Some of our leases (or subleases) could terminate if the lessor (or sublessor) under any such lease (or sublease) defaults on any debt secured by the relevant property, thus terminating our rights to access the underlying geothermal resources at that location.
The fee interest in the land which is the subject of some of our leases (or subleases) may currently be or may become subject to encumbrances securing loans from third-party lenders to the lessor (or sublessor). Our rights as lessee (or sublessee) under such leases (or subleases) are or may be subject and subordinate to the rights of any such lender. Accordingly, a default by the lessor (or sublessor) under any such loan could result in a foreclosure on the underlying fee interest in the property and thereby terminate our leasehold interest and result in the shutdown of the power plant located on the relevant property and/or terminate our right of access to the underlying geothermal resources required for our operations.
Reduced levels of recovered energy required for the operation of our REG power plants may result in decreased performance of such power plants.
Our REG power plants generate electricity from recovered energy or so-called “waste heat” that is generated as a residual by-product of gas turbine-driven compressor stations and a variety of industrial processes. Any interruption in the supply of the recovered energy source, such as a result of reduced gas flows in the pipelines or reduced level of operation at the compressor stations, or in the output levels of the various industrial processes, may cause an unexpected decline in the capacity and performance of our recovered energy power plants.
Our business development activities may not be successful and our projects under construction or facilities undergoing enhancement and repowering may not commence operation as scheduled.encounter delays, which may impact our future growth.
We are in the process of developing and constructing a number of new power plants. Our success in developing a project is contingent upon, among other things, negotiation of satisfactory engineering and construction agreements and obtaining PPAs and transmission services agreements, receipt of required governmental permits (including environmental permits), obtaining adequate financing, and the timely implementation and satisfactory completion of field development, testing and power plant construction and commissioning. We may be unsuccessful in accomplishing any of these matters or doing so on a timely basis.basis such in cases where we have to handle legal proceedings with respect to environmental permits. Although we may attempt to minimize the financial risks attributable to the development of a project by securing a favorable PPA and applicable transmission services agreements, obtaining all required governmental permits and approvals and arranging, in certain cases, adequate financing prior to the commencement of construction, the development of a power project may require us to incur significant expenses for preliminary engineering, permitting and legal and other expenses before we can determine whether a project is feasible, economically attractive or capable of being financed.
Currently, we have geothermal projects and prospects under exploration, development or construction in the United States, as well as in Indonesia, Ethiopia, Guadeloupe Guatemala, Honduras, Indonesia and New Zealand,Guatemala, and we intend to pursue the expansion of some of our existing plants and the development of other new plants. In addition, our current growth plans include enhancement and repowering of a number of our operating facilities, including the Zunil, Beowawe, Ijen and Puna power plants and involve replacement of old equipment and optimization of the geothermal field, including repair and enhancement of existing wells and drilling of new wells. Our completion of these facilitiesfacilities’ development and/or enhancement is subject to substantial risks, including:
| | ●•
| inability to secure a PPA; |
| | ●•
| inability to secure transmission services agreements; |
| | ●•
| inability to secure the required financing; |
| | ●•
| cost increases and delays due to unanticipated shortages of adequate resources to execute the project such as equipment, material and labor; |
| | |
| | ●•
| work stoppages resulting from force majeure events including riots, strikes and weather conditions; |
| | ●•
| inability to obtainor delays in obtaining permits, licenses and other regulatory approvals; |
| | • | inability to satisfactorily complete field development and testing; |
| | ●•
| failure to secure sufficient land positions for the wellfield, power plant and rights of way; |
| | ●•
| failure by key contractors and vendors to timely and properly perform, including where we use equipment manufactured by others; |
| | ●•
| inability to secure or delays in securing the required transmission line and/or capacity; |
| | ●•
| adverse environmental and geological conditions (including, but not limited to, discoveries of contamination, protected plant or animal species or habitat, archaeological or cultural resources, or inclement weather conditions); |
| | ●•
| adverse local business law; |
| | ●•
| our attention to other projects and activities, including those in the solar energy and energy storage sectors; and |
| | |
| | ●•
| changes in laws that mandate, incentivize or otherwise favor renewable energy sources. |
Any one of these could give rise to delays, cost overruns, the termination of the plant expansion, construction or development or the loss (total or partial) of our interest in the project under development, construction, or expansion.
OurIn addition, we enter into various types of arrangements with communities and joint venture partners, including in some cases, Indigenous peoples, for the development of projects. In some circumstances, we may be required to notify, consult, or obtain the consent of certain stakeholders, such as Indigenous peoples, landowners, and/or municipalities. In some jurisdictions where we have greenfield power projects, it may be possible to claim Indigenous rights to land and the existence or declaration of Indigenous title may affect the existing or future growth depends,activities of our projects and impact our business, financial condition and results of operations. Certain of these communities and partners may have or may develop interests or objectives which are different from or even in part,conflict with our objectives. Any such differences could have a negative impact on the successful enhancement of a numbersuccess of our existing facilities.
Our current growth plans include enhancement and repowering of a number of our operating facilities, including the Heber and Puna complexes and involve replacement of old equipment and optimization of the geothermal field, including repair and enhancement of existing wells and drilling of new wells. Such enhancement and repowering are subject to geological risks and uncertainties and satisfactory completion of field development, testing, permitting and power plant construction and commissioning, which may result in delays and cost overruns.projects.
We rely on power transmission facilities that we do not own or control.
We depend on transmission facilities owned and operated by others to deliver the power we sell from our power plants to our customers. If transmission is disrupted, or if the transmission capacity infrastructure is inadequate, ofor if there is a failure that requires long shutdown for repair, or if curtailment is required due to load system inefficiency, our ability to sell and deliver power to our customers may be adversely impacted and we may either incur additional costs or forego revenues. In addition, lack of access to new transmission capacity may affect our ability to develop new projects. Existing congestion of transmission capacity, as well as expansion of transmission systems and competition from other developers seeking access to expanded systems, could also affect our performance.
Our use of joint ventures may limit our flexibility with jointly owned investments.
We have partners in several of our plants and we may continue in the future to develop and/or acquire and/or hold properties in joint ventures with other entities when circumstances warrant the use of these structures. OwnershipThese arrangements are often driven by the magnitude of capital required to complete acquisitions of generating assets, strategic partnering arrangements to access operating expertise, and other geothermal and energy industry wide trends that we presume will continue in the future. Where we hold a minority interest in a joint venture or share control or management with another party in a joint venture (such as in the case of our plant in Guadeloupe), our ability to influence joint venture operations may be limited. As such, our ownership of assets in joint ventures is subject to risks that may not be present with other methods of ownership, including:
| | ●•
| we could experience an impasse on certain decisions because we do not have sole decision-making authority, which could require us to expend additional resources on resolving such impasses or potential disputes, including arbitration or litigation; |
| | ●•
| our joint venture partners could have investment goals that are not consistent with our investment objectives, including the timing, terms and strategies for any investments in the projects that are owned by the joint ventures, which could affect decisions about future capital expenditures, major operational expenditures and retirement of assets, among other things; |
| | ●•
| our ability to transfer our interest in a joint venture to a third party may be restricted and the market for our interest may be limited; |
| | ●•
| our joint venture partners may be structured differently than us for tax purposes, and this could impact our ability to fully take advantage of federal tax incentives available for renewable energy projects; |
| | |
| | ●•
| our joint venture partners might become bankrupt, fail to fund their share of required capital contributions or fail to fulfill their obligations as a joint venture partner, which may require us to infuse our own capital into the venture on behalf of the partner despite other competing uses for such capital; and |
| | ●•
| our joint venture partners may have competing interests in our markets and investments in companies that compete directly or indirectly with us that could create conflict of interest issues. |
For example, we hold a 12.75% minority interest in the Sarulla complex and, as a result, cannot control the development of its remediation plan, pace of exploration or development or major drilling decisions. Because we may, in some instances, have a reduced level of influence over our joint ventures, we may not be able to realize some or all of the benefits that we believe will be created from our involvement. If any of the foregoing were to occur, our business, financial condition and results of operations could suffer as a result.
Our operations could be adversely impacted by climate change.
We are susceptible to losses and interruptions caused by extreme weather conditions such as droughts, hurricanes, tsunamis, floods, wildfires, and water or other natural resource shortages, occurrences of which may increase in frequency and severity as a result of climate change. Climate change may also produce general changes in weather or other environmental conditions, including temperature or precipitation levels, and thus may impact consumer demand for electricity. Daily and seasonal fluctuations in temperature generally have a more significant impact on the generating capacity of geothermal energy plants than conventional power plants. Some of our power plants experience reduced generation in warm periods due to the lower heat differential between geothermal fluid and the ambient surroundings. While we generally account for the projected impact seasonal fluctuations in temperature based on our historic experience, the impact of climate change on traditional weather patterns has become more pronounced. This has reduced the certainty of our modelling efforts. For example, in 2019, we experienced prolonged elevated temperatures in the Western United States which impacted generating capacity at our facilities and adversely impacted our revenues in the fourth quarter of the year. To the extent weather conditions continue to be impacted by climate change, the generating capacity of certain of our facilities may be adversely impacted in a manner that we could not predict which may in turn adversely impact our results of operations. In addition, the potential physical effects of climate change, such as increased frequency and severity of storms, floods, and other climatic events, could disrupt our operations and cause us to incur significant costs to prepare for or respond to these effects. If we experience physical damage to our equipment and infrastructure due to climate-related natural disasters, it could lead to the suspension of our operations, additional costs to restore service and repair facilities, and delays in power generation resulting in lost revenue and potential exposure to legal claims. Such events could also impact our ability to obtain insurance coverage and we may experience rising costs of insurance coverage resulting from any damages to our assets, which could have an impact on our profitability.
Climate change could also affect the availability of a secure and economical supply of water, whether due to an increase in water restrictions, an impact on our ability to obtain water permits, or otherwise. Water is essential for the continued operation of certain of our power plants that use water cooling systems. Ormat monitors water risk carefully. If it is determined that a water supply risk exists that could impact projected generation levels at any plant, risk mitigation efforts are identified and evaluated for implementation.
Geothermal projects that we planWe could be negatively impacted by regulatory and other responses to develop in the future, may operate as "merchant" facilities without long-term PPAs and therefore such projects will be exposed to market fluctuations.climate change.
Geothermal projects thatAs a renewable energy solution provider, we planare motivated to developidentify our opportunities and risks with respect to climate change and take efforts to reduce our GHG emissions and improve our energy efficiency. While we generally view this as an opportunity, uncertainty regarding nascent regulation in this area could also adversely affect us. In the United States, as partwhere we have a significant portion of our growth plans may operateoperations, no comprehensive climate change legislation has been implemented federally. The U.S. Environmental Protection Agency (the “EPA”) has adopted rules that, among other things, establish construction and operating permit reviews for GHG emissions from certain large stationary sources, require the monitoring and reporting of GHG emissions from certain sources and implement standards directing the reduction of methane from certain facilities in the oil and gas sector. Additionally, various states have adopted or are considering adopting legislation and regulation focused on GHG cap-and-trade programs, carbon taxes, reporting and tracking programs and emissions limits. Uncertainty associated with these regulations, our inability to meet the demands of these regulations or our failure to predict accurately the impact of our response to these regulations could adversely affect our business and prospects. We could also face an increase in competition as "merchant" facilities and sell electricity without long-term PPAs for some or all of their generating capacity and output. Such projects are exposed to market fluctuations. Without the benefit of long-term PPAs for these assets, we cannot be sure that we will be able to sell any or alla result of the power generated by these facilities at commercially attractive rates energy transition, as new entrants of disruptive technologies and/or that these facilities will be ablecompetitors, including in the solar, wind, and storage sectors, could adversely impact our ability to operate profitably. This could lead to future impairments of our property, plant and equipment resulting in economic losses and liabilities, which could have a material adverse effect on our results of operations, financial conditionrenew existing PPAs or cash flows.sign new contracts.
In addition, the SEC proposed rules in March 2022 that would require public companies to include extensive climate-related disclosures in their SEC filings. Among other things, the proposed SEC rules, if adopted as written, would mandate disclosures on (i) GHG emissions, including Scope 3 emissions if material or part of a company's emissions goal, (ii) financial impact and expenditure metrics relating to severe weather and climate change and (iii) a company's use of scenario analysis and climate targets. Although the SEC has not finalized these rules, we would expect to incur substantial additional compliance costs to the extent these or similar rules are adopted. Such compliance costs could in turn adversely effect on our business or results of operations. We publish an annual Sustainability Report, which describes, among other things, the measurement of our greenhouse gas emissions and our efforts to reduce emissions. In addition, our Sustainability Report provides highlights of how we are supporting our workforce, including our efforts to promote diversity, equity, inclusion and belonging. Our disclosures on these matters, or a failure to meet evolving stakeholder expectations for ESG practices and reporting, may potentially harm our reputation and customer relationships.
In addition to legal and regulatory requirements, growing stakeholder engagement with respect to sustainability matters could cause us to alter our business operations, which could require them to incur substantial expense. Any failure to comply with stakeholder requests, in particular, the ability to meet customer requirements or sustainability targets, could adversely impact the demand of our services and subject us to significant costs and liabilities and reputational risks, any of which could adversely affect our business, financial condition and results of operations.
We may not be able to successfully conclude the transactions,integrate companies, which we acquired and may acquire in the future, which could materially and adversely affect our business, financial condition, future results and cash flow.
Our strategy is to continue to expand in the future, including through acquisitions.acquisitions to enhance our geothermal portfolio and accelerate growth in our Electricity segment. Integrating acquisitions is often costly, and we may not be able to successfully integrate our acquired companies with our existing operations without substantial costs, delays or other adverse operational or financial consequences. Completion of M&A transactions may be subject to fulfilling conditions and receiving regulatory approval. Integrating our acquired companies involves a number of risks that could materially and adversely affect our business, including:
| | ●•
| failure of the acquired companies to achieve the results we expect; |
| | ●•
| inability to retain key personnel of the acquired companies; |
| | ●•
| risks associated with unanticipated events or liabilities; and |
| | ●•
| the difficulty of establishing and maintaining uniform standards, controls, procedures and policies, including accounting controls and procedures. |
If any of our acquired companies suffers customer dissatisfaction or performance problems, this could adversely affect the reputation of our group of companies and could materially and adversely affect our business, financial condition, future results and cash flow.
The power generation industry is characterized byWe encounter intense competition, and we encounter competition from electric utilities, other power producers, and power marketers that could materially and adversely affect our business, financial condition, future results and cash flow.
The power generation industry is characterized by intense competition from electric utilities, other power producers and power marketers. In recent years, there has been increasing competition in the sale of electricity, in part due to excess capacity in a number of United States markets and an emphasis on short-term or “spot” markets, and competition has contributed to a reduction in electricity prices. For the most part, we expect that power purchasers interested in long-term arrangements will engage in “competitive bid” solicitations to satisfy new capacity demands. This competition could adversely affect our ability to obtain and/or renew long-term PPAs and the price paid for electricity by the relevant power purchasers. There is also increasing competition between electric utilities. This competition has put pressure on electric utilities to lower their costs, including the cost of purchased electricity, and increasing competition in the future will put further pressure on power purchasers to reduce the prices at which they purchase electricity from us.
We face increasing competition from other companies engaged energy storage.storage market.
We are experiencing intense competition in the energy storage market from independent power producers, developers, and third-party investors. If we are unable, as a result of increased competition, to grow our energy storage portfolio while meeting our profitability goals, our business, financial condition, future results and cash flow could be materially and adversely affected.
Changes in costs and technology may significantly impact our business by making our power plants and products less competitive resulting in the inability to sign new PPAs for our Electricity segment and new supply and EPC contracts for our Products segment.
A basic premise of our business model is that generating baseload power at geothermal power plants produces electricity at a competitive price. However, traditional coal-fired systems and gas-fired systems may under certain economic conditions produce electricity at lower average prices than our geothermal plants. In addition, there are other technologies that can produce electricity such as hydroelectric systems, fuel cells, microturbines, wind turbines, energy storage systems and solar PV systems. Some of these alternative technologies currently produce electricity at higher average prices than our geothermal plants while others produce electricity at lower average prices. It is possible that technological advances and economies of scale will further reduce the cost of alternate methods of power generation. It is also possible that energy technologies will compete with our basic premise of a firm (non-intermittent) renewable baseload power source by combining renewable technologies with energy storage to provide an alternative to firm baseload energy. If this were to happen, the competitive advantage of our power plants may be significantly impaired and will cause reduction and/or inability to sign new PPAs for our Electricity segment and new supply and EPC contracts for our Products segment.
Our intellectual property rights may not be adequate to protect our business.
Our existing intellectual property rights including those we acquired in connection with the acquisition of our Viridity business, may not be adequate to protect our business. We occasionally file patent applications.applications which cover our products (mainly power units based on the ORC) and systems (mainly geothermal power plants and industrial waste heat recovery plants for electricity production). However, the patent application process is expensive, time-consuming and complex and we may not be able to prepare, file, prosecute, maintain and enforce all necessary or desirable patent applications at a reasonable cost or in a timely manner. Patents may be invalidated and patents may not be issued on the basis of our patent applications. Additionally, the scope of patent protection can be reinterpreted after issuance. Even if our patent applications do issue as patents, they may not issue in a form that is sufficiently broad to protect our technology, prevent competitors or other third parties from competing with us or otherwise provide us with any competitive advantage. In addition, any patents issued to us or for which we have use rights may be challenged, narrowed, invalidated or circumvented. Third parties may initiate opposition, interference, re-examination, post-grant review, inter partes review, nullification or derivation actions, or similar proceedings challenging the inventorship, validity, enforceability or scope of our patents. An adverse determination in any such proceeding or litigation could reduce the scope of, or invalidate our patent rights, allow third parties to commercialize our technology and compete directly with us, without payment to us, or result in our inability to commercialize our technology without infringing third-party patent rights. Such proceedings also may result in substantial cost and require significant time from our management, even if the eventual outcome is favorable to us. Our competitors or other third parties may also be able to circumvent our patents by developing similar or alternative technologies in a non-infringing manner. Consequently, we do not know whether any of our technology will be protectable or remain protected by valid and enforceable patents.
In order to safeguard our unpatented proprietary know-how, trade secrets and technology, we rely on a combination of trade secret protection and non-disclosure provisions in agreements with employees and third parties having access to confidential or proprietary information. These measures may not adequately protect us from disclosure, use, reverse engineering, infringement, misappropriation or other violation of our proprietary information and other intellectual property rights by third parties. Furthermore, non-disclosure provisions can be difficult to enforce and, even if successfully enforced, may not be entirely effective. In addition, we cannot guarantee that we have entered into non-disclosure agreements with all employees and third parties that have or may have had access to our trade secrets and other confidential or proprietary information.
Even if we adequately protect our intellectual property rights, litigation may be necessary to enforce these rights, which could result in substantial costs to us and a substantial diversion of management attention. Furthermore, attempts to enforce our intellectual property rights against third parties could also provoke these third parties to assert their own intellectual property or other rights against us, or result in a holding that invalidates or narrows the scope of our rights, in whole or in part. Our success and ability to compete also depends in part on our ability to operate without infringing, misappropriating or otherwise violating the intellectual or proprietary rights of third parties. While we have attempted to ensure that our technology and the operation of our business does not infringe other parties’parties' patents and other intellectual property or proprietary rights, our competitors or other third parties may assert that certain aspects of our business or technology infringe upon, misappropriate or otherwise violate their intellectual property or proprietary rights. In addition, former employers of our current, former or future employees may assert claims that such employees have improperly disclosed to us the confidential or proprietary information of these former employers. Infringement, misappropriation or other intellectual property violation claims, regardless of merit or ultimate outcome, can be expensive, hard to predict and time-consuming and can divert management’s attention from our core business. An assertion of an intellectual property infringement, misappropriation or other violation claim against us may result in adverse judgments, settlements on unfavorable terms or cause us to pay significant money damages, lose significant revenues, be prohibited from using the relevant technology or other intellectual property, or incur significant license, royalty or technology development expenses. Future litigation may also involve non-practicing entities or other intellectual property owners who have no relevant product offerings or revenue and against whom our own intellectual property may therefore provide little or no deterrence or protection.
We may experience difficulties implementing and maintaining our new enterprise resource planning system
We purchased and in early 2023 implemented a new enterprise resource planning (“ERP”) system and are currently in the initial phases of implementing the new system. ERP implementations are complex and time-consuming, and involve substantial expenditures on system software and implementation activities.time-consuming. The ERP system will beis critical to our ability to provide important information to our management, obtain and deliver products, provide services and customer support, send invoices and track payments, fulfill contractual obligations, accurately maintain books and records, provide accurate, timely and reliable reports on our financial and operating results or otherwise file our financial statements with the SEC and operate our business. ERP implementations also require transformation of business and financial processes in order to reap the benefits of the ERP system; any such transformation involves risks inherent in the conversion to a new computer system, including loss of information and potential disruption to our normal operations. The implementation and maintenance of the new ERP system has required, and will continue to require, the investment of significant financial and human resources and the implementation may be subject to delays and cost overruns. In addition, we may not be able to successfully complete the implementation of the new ERP system without experiencing difficulties. Anyany disruptions, delays or deficiencies in the design and implementation or the ongoing maintenance of the new ERP system could adversely affect our ability to process orders, ship products, provide services and customer support, send invoices and track payments, fulfill contractual obligations, accurately maintain books and records, provide accurate, timely and reliable reports on our financial and operating results, or otherwise file our financial statements with the SEC and operate our business. Additionally, if we do not effectively implement the ERP system as planned or thenew system does not operate as intended, the effectiveness of our internal control over financial reporting could be adversely affected or our ability to assess it adequately could be delayed.
A cyber-incident, cyber security breach, severe natural event or physical attack on our operational networks and information technology systems could have a material adverse effect on our financial condition, results of operations, liquidity and cash flows.
We rely on information technology systems that allow us to create, store, retain, transmit and otherwise process proprietary and sensitive or confidential information, including our business and financial information, and personal information regarding our employees and third-parties. We also rely on our operational technology systems to manufacture equipment for our energy projects, operate our power plants and provide our services. In addition, we often rely on third-party vendors to host, maintain, modify and update our systems.
Our and our third-party vendors’ technology systems can be damaged by malicious events such as cyber and physical attacks, computer viruses, malicious and destructive code, phishing attacks, denial of service or information, as well as security breaches, natural disasters, fire, power loss, telecommunications failures, employee misconduct, human error, and third parties such as traditional computer hackers, persons involved with organized crime or foreign state or foreign state-supported actors. Furthermore, our disaster recovery planning may not be sufficient for all situations. Any failure, disruptions to or decrease in the functionality of our or our third-party vendors’ operational and information technology networks could impact our ability to maintain effective internal controls over financial reporting, cause harm to the environment, the public or our employees, and significantly disrupt and damage our assets and operations or those of third parties.
We and our third-party vendors have been, and may in the future be, subject to breaches and attempts to gain unauthorized access to our information technology systems or sensitive or confidential data, or to disrupt our operations. To date, none of these breaches or attempts has, individually or in the aggregate, resulted in a security incident with a material effect on our operations or our financial condition, results of operations, liquidity, or cash flows. Despite implementation of security and control measures, we and our third-party vendors have not always been able to, and there can be no assurance that we or our third-party vendors will be able to in the future, anticipate or prevent unauthorized access to our or our third-party vendors’ operational technology networks, information technology systems or data, or the disruption of our or our third-party vendors’ operations. The techniques used to obtain unauthorized access to our and our third-party vendors’ operational technology networks, information technology systems or data are constantly evolving and have become increasingly complex and sophisticated. Furthermore, such techniques change frequently and are often not detected until after they have been launched against a target. Therefore, we may be unable to anticipate these techniques and may not become aware in a timely manner of such a security breach, which could exacerbate any damage we experience. Such events could cause interruptions in the operation of our business, damage our operational technology networks and information technology systems, subject us to significant expenses, remediation costs, litigation, disputes, claims by third parties and regulatory actions or investigations that could result in damages, material fines and penalties, and harm to our reputation, any of which could have a material adverse effect on our financial condition, results of operations, liquidity, and cash flows. We may maintain cyber liability insurance that covers certain damages caused by cyber incidents. However, there is no guarantee that adequate insurance will continue to be available at rates that we believe are reasonable or that the costs of responding to and recovering from a cyber incident will be covered by insurance or recoverable in rates.
In addition, we are subject to various legislation, regulations, directives and guidelines from federal, state, local and foreign agencies, such as FERC, that are intended to strengthen cybersecurity measures required for information and operational technology and critical energy infrastructure and that apply to the collection, use, retention, protection, disclosure, transfer and other processing of personal information. In California, for example, the California Consumer Privacy Act (the “CCPA”) imposes obligations on businesses to be transparent with their data privacy practices and vests consumers with rights to access and delete the personal information held by businesses. These requirements will become even more robust under the California Privacy Rights Act (the “CPRA”) which amends the CCPA to, among other things, extend consumer rights and business obligations to employees, and will become effective on January 1, 2023. These cybersecurity, data protection and privacy law regimes continue to evolve and may result in ever-increasing public scrutiny and escalating levels of capital expenditures, regulatory enforcement, sanctions and fines and increased costs for compliance. FailureWe have instituted security measures and safeguards to protect our operational systems and information technology assets, including certain safeguards required by FERC. Despite our implementation of security measures and safeguards, any failure to comply with FERC or any of these lawslegal requirements could result in enforcement action against us, including fines, imprisonment of company officials and public censure, any of which could harm our reputation and have a material adverse effect on our financial condition, results of operations, liquidity, and cash flows.
Risks Related to Governmental Regulations, Laws and Taxation
Our financial performance could be adversely affected by changes in the legal and regulatory environment affecting our operations.
All of our power plants are subject to extensive regulation, and therefore changes in applicable laws or regulations, or interpretations of those laws and regulations, could result in increased compliance costs, the need for additional capital expenditures or the reduction of certain benefits currently available to our power plants. The structure of domestic and foreign energy regulation currently is, and may continue to be, subject to challenges, modifications, the imposition of additional regulatory requirements, and restructuring proposals. We or our power purchasers may not be able to obtain all regulatory approvals that may be required in the future, or any necessary modifications to existing regulatory approvals, or maintain all required regulatory approvals. In addition, the cost of operation and maintenance and the operating performance of geothermal power plants may be adversely affected by changes in certain laws and regulations, including tax laws.
Any changes to applicable laws and regulations or interpretations of those laws and regulations could significantly increase the regulatory-related compliance, tax and other expenses incurred by the power plants and could significantly reduce or entirely eliminate the revenues generated by one or more of the power plants, which in turn would reduce our net income and could materially and adversely affect our business, financial condition, future results and cash flow. A recent example is the assessment letters we received from the KRA with respect to our operation in Kenya in relation to the 2013 to 2017 tax years in which the KRA demanded we pay approximately $200.0 million including interest and penalties . We recently entered into settlement agreements and concluded these tax assessments.
Pursuant to the terms of some of our PPAs with investor-owned electric utilities and publicly-owned electric utilities in states that have renewable portfolio standards, the failure to supply the contracted capacity and energy thereunder may result in the imposition of penalties.
Pursuant to the terms of certain of our PPAs, we may be required to make payments to the relevant power purchaser under certain conditions, such as shortfall in delivery of renewable energy and energy credits, and not meeting certain performance threshold requirements, as defined in the relevant PPA. The amount of payment required is dependent upon the level of shortfall in delivery or performance requirements and is recorded in the period the shortfall occurs. In addition, if we do not meet certain minimum performance requirements, the capacity of the relevant power plant may be permanently reduced. Any or all of these considerations could materially and adversely affect our business, financial condition, future results and cash flow.
If any of our domestic power plants loses its current Qualifying Facility status under PURPA, or if amendments to PURPA are enacted that substantially reduce the benefits currently afforded to Qualifying Facilities, our domestic operations could be adversely affected.
Most of our domestic power plants are Qualifying Facilities pursuant to PURPA, which largely exempts the power plants from the FPA, and certain state and local laws and regulations regarding rates and financial and organizational requirements for electric utilities.
If any of our domestic power plants were to lose its Qualifying Facility status, such power plant could become subject to the full scope of the FPA and applicable state regulation. The application of the FPA and other applicable state regulation to our domestic power plants could require our operations to comply with an increasingly complex regulatory regime that may be costly and greatly reduce our operational flexibility.
If a domestic power plant were to lose its Qualifying Facility status, it would become subject to full regulation as a public utility under the FPA, and the rates charged by such power plant pursuant to its PPAs may be subject to the review and approval of FERC. FERC, upon such review, may determine that the rates currently set forth in such PPAs are not appropriate and may set rates that are lower than the rates currently charged. In addition, FERC may require that the affected domestic power plant refund amounts previously paid by the relevant power purchaser to such power plant. Even if a power plant does not lose its Qualifying Facility status, pursuant to regulations issued by FERC for Qualifying Facility power plants above 20 MW, if a power plant’s PPA is terminated or otherwise expires, and the subsequent sales are not made pursuant to a state’s implementation of PURPA, that power plant will become subject to FERC’s ratemaking jurisdiction under the FPA. Moreover, a loss of Qualifying Facility status also could permit the power purchaser, pursuant to the terms of the particular PPA, to cease taking and paying for electricity from the relevant power plant or, consistent with FERC precedent, to seek refunds of past amounts paid. This could cause the loss of some or all of our revenues payable pursuant to the related PPAs, result in significant liability for refunds of past amounts paid, or otherwise impair the value of our power plants. If a power purchaser were to cease taking and paying for electricity or seek to obtain refunds of past amounts paid, there can be no assurance that the costs incurred in connection with the power plant could be recovered through sales to other purchasers or that we would have sufficient funds to make such payments. In addition, the loss of Qualifying Facility status would be an event of default under the financing arrangements currently in place for some of our power plants, which would enable the lenders to exercise their remedies and enforce the liens on the relevant power plant.
Pursuant to the Energy Policy Act of 2005, FERC also has the authority to prospectively lift the mandatory obligation of a utility under PURPA to offer to purchase the electricity from a Qualifying Facility if the utility operates in a workably competitive market. Our existing PPAs between a Qualifying Facility and a utility are not affected. If, in addition to the California utilities’ waiver of the mandatory purchase obligation for QF projects that exceed 20 MW described in the risk factor above, the utilities in the other regions in which our domestic power plants operate were to be relieved of the mandatory purchase obligation, they would not be required to purchase energy from the power plant in the region under Federal law upon termination of the existing PPA or with respect to new power plants, which could materially and adversely affect our business, financial condition, future results and cash flow. Moreover, FERC has the authority to modify its regulations relating to the utility’s mandatory purchase obligation under PURPA, which could result in the reduction in the purchase obligation of California and other utilities to a level below 205 MW, or the elimination of the purchase obligation. If that were to occur it could materially and adversely affect our business, financial condition, future results and cash flow.
The PURPA and QF described risks identified above are not likely to affect our Nevada based facilities that entered into PPAs with NV Energy as the off-taker after Nevada initially adopted its RPS in 2001. Those PPAs and the related rates agreed to for such facilities by the off-taker were not based upon PURPA or a QF mandated rate but were instead adopted as a result of a competitive bidding process and approved as part of the off-taker’s integrated resource planning process and in order for the off-taker to comply with Nevada’s RPS. While those PPAS were initially required to file for QF or EWG status with the FERC, the PPAs and their related prices for the term of the PPA were not approved by the FERC pursuant to PURPA. The PURPA and QF risks described above also are not likely to affect our Nevada and California based projects that have their PPAs with the SCPPA because SCPPA is not a regulated public utility under PURPA.
The reduction, elimination or elimination ofinability to monetize government incentives could adversely affect our business, financial condition, future results and cash flows.
Construction and operation of our geothermal power plants and recovered energy-based power plants has benefited, and may benefit in the future, from public policies and government incentives that support renewable energy and enhance the economic feasibility of these projects in regions and countries where we operate. Such policiesOn August 16, 2022, the US President signed into law the Inflation Reduction Act (IRA), which contains tax incentives and other provisions that incentivize investment, development and deployment of renewable energy sources and technologies. We expect that the construction and operations of our geothermal power plants, recovered energy-based power plants, battery energy storage systems and solar PV will benefit in the future from the IRA and enhance the economic feasibility of projects in the United States. There are additional public policy and government incentives includethat currently benefit and that we expect will benefit the Company in the future in countries outside of the United States as well as States within the United States. For example, these projects may generate PTCs (that are applicable for projects that begin construction by the end of 2020) and ITCs (for projects that begin construction by the end of 2021),we may use to offset our tax liabilities or that we may monetize.The incentives in these jurisdictions include accelerated depreciation tax benefits, renewable portfolio standards, carbon trading mechanisms, rebates, and mandated feed-in-tariffs, and may include similar or other incentives to end users, distributors, system integrators and manufacturers of geothermal, solarfeed-in tariffs and other power products. Some of these measures have been implemented at the federal level, while others have been implemented by different states within the United States or countries outside the United States where we operate. In particular, the current U.S. presidential administration has made public statements that indicate that the administration may be supportive of various renewable energy programs. For example, an Executive Order titled "Tackling the Climate Crisis at Home and Abroad" signed by President Biden on January 27, 2021 directs the Secretary of the Interior to, among other actions, review siting and permitting processes on public lands and in offshore waters as part of an effort to increase renewable energy production on those lands and in those waters.similar incentives.
The availability and continuation of these public policies and government incentives have a significant effect on the economics and viability of our development program and continued construction of new geothermal, recovered energy-based, solar PV facilities and, recently, energy storage projects. Any changes to such public policies, or any reduction in or elimination or expiration of such government incentives, could affect us in different ways. For example, any reduction in, termination or expiration of renewable portfolio standards may result in less demand for generation from our geothermal and recovered energy-based, power plants. Any reductions in, termination or expiration of other government incentives could reduce the economic viability of, and cause us to reduce, the construction of new geothermal, recovered energy-based, solar PV or any other power plants. Policies supporting or deregulating the exploration, production and use of fossil fuels may create regulatory uncertainty in the renewable energy industry. Similarly, any such changes that affect the geothermal energy industry in a manner that is different from other sources of renewable energy, such as wind or solar, may put us at a competitive disadvantage compared to businesses engaged in the development, construction and operation of renewable power projects using such other resources. AnyIn addition, although we may have the legal ability to monetize ITCs and PTCs, our ability to do so is subject to market prices and demand, which may be lower than we anticipate.Any of the foregoing outcomes could have a material adverse effect on our business, financial condition, future results, and cash flows.
We are a holding company and our cash depends substantially on the performance of our subsidiaries and the power plants they operate, most of which isare subject to restrictions and taxation on dividends and distributions.
We are a holding company whose primary assets are our ownership of the equity interests in our subsidiaries. We conduct no other business and, as a result, we depend entirely upon our subsidiaries’ earnings and cash flow.
The agreements pursuant to which some of our subsidiaries have incurred debt restrict the ability of these subsidiaries to pay dividends, make distributions or otherwise transfer funds to us prior to the satisfaction of other obligations, including the payment of operating expenses, debt service and replenishment or maintenance of cash reserves. In the case of some of our power plants that are owned jointly with other partners, there may be certain additional restrictions on dividend distributions pursuant to our agreements with those partners. In all of the foreign countries where our existing power plants are located, dividend payments to us may also be subject to withholding taxes. Each of the events described above may reduce or eliminate the aggregate amount of cash we can receive from our subsidiaries.
The costs of compliance with federal, state, local and foreign environmental laws and our ability in obtainingto obtain and maintainingmaintain environmental permits and governmental approvals required for development, construction and/or operation may result in liabilities, costs and delays in construction (as well as any fines or penalties that may be imposed upon us in the event of any non-compliance or delays with such laws or regulations) that could materially and adversely affect our business, financial condition, future results and cash flow and these liabilities and costs may increase in the future.
Our operations are subject to extensive environmental laws, ordinances and regulations, which may cause us to incur significant costs and liabilities. These laws, ordinances and regulations can be subject to change and such change could result in increased compliance costs, the need for additional capital expenditures, or otherwise adversely affect us. In addition, our power plants are required to comply with numerous federal, state, local and foreign statutory and regulatory environmental standards and to maintain numerous environmental permits and governmental approvals required for development, construction and/or operation. We may not be able to renew, maintain or obtain all environmental permits and governmental approvals required for the continued operation or further development and construction of the power plants. We have not yet obtained certain permits and government approvals required for the completion and successful operation of power plants under development, construction or enhancement. Our failure to renew, maintain or obtain required permits or governmental approvals, including the permits and approvals necessary for operating power plants under development, construction or enhancement, could cause our operations to be limited or suspended. Finally,suspended resulting in fines under the PPA.
We may also be subject to litigation seeking to rescind or delay our receipt of environmental permits and governmental approvals. For example, a lawsuit was filed by the Center for Biological Diversity and Fallon Paiute-Shoshone Tribe in 2021 that sought to revoke the BLM’s approval of the development of our Dixie Meadows geothermal power plant in Nevada. While the proceeding has been administratively closed without prejudice to reopening upon a motion by either party, there can be no assurance that the Company will be able to obtain the necessary approvals to develop Dixie Meadows as originally intended, or at all. See also, “Litigation, legal proceedings, regulatory investigations or other administrative proceedings could expose us to significant liabilities and reputational damage that could have a material adverse effect on us” for additional information.
In addition, some of the environmental permits and governmental approvals that have been issued to the power plants contain conditions and restrictions, including restrictions or limits on emissions and discharges of pollutants and contaminants, or may have limited terms. If we fail to satisfy these conditions or comply with these restrictions, or with any statutory or regulatory environmental standards, we may become subject to regulatory enforcement action and the operation of the power plants could be adversely affected or be subject to fines, penalties or additional costs or other sanctions, including the imposition of investigatory or remedial obligations of the issuance of orders limiting or prohibiting our operations.
We could be exposed to significant liability for violations of hazardous substances laws because of the use or presence of such substances at our power plants.
Our power plants are subject to numerous domestic and foreign federal, regional, state and local statutory and regulatory standards relating to the generation, handling, transportation, use, storage, treatment and disposal of hazardous substances. We use butane, pentane, industrial lubricants, and other substances at our power plants which are or could become classified as hazardous substances. If any hazardous substances are found to have been released into the environment at or by the power plants in concentrations that exceed regulatory limits, we could become liable for the investigation and removal of those substances, regardless of their source and time of release. If we fail to comply with these laws, ordinances or regulations (or any change thereto), we could be subject to civil or criminal liability, the imposition of liens or fines, and cessation of operations, large expenditures to bring the power plants into compliance or other sanctions. Furthermore, under certain federal and states laws in the United States, we can be held liable for the cleanup of releases of hazardous substances at any of our current or former facilities or at any other locations where we arranged for disposal of those substances, even if we did not cause the release at that location or if the release complied with applicable law at the time it occurred. Liability under these laws can be joint and several. The cost of any remediation activities in connection with a spill or other release of such substances could be significant and could expose us to significant liability.
Current and future urbanizing activities and related residential, commercial, and industrial developments may encroach on or limit geothermal or solar PV activities in the areas of our power plants, thereby affecting our ability to utilize access, inject and/or transport geothermal resources on or underneath the affected surface areas.
Current and future urbanizing activities and related residential, commercial and industrial development may encroach on or limit geothermal activities in the areas of our power plants or construction and operation of solar PV facilities, thereby affecting our ability to utilize, access, inject, and/or transport geothermal resources on or underneath the affected surface areas or build solar PV facilities, which require large areas of relatively flat land. In particular, the Heber power plants rely on an area, which we refer to as the Heber Known Geothermal Resource Area, or Heber KGRA, for the geothermal resource necessary to generate electricity at the Heber power plants. Imperial County has adopted a “specific plan area” that covers the Heber KGRA, which we refer to as the “Heber Specific Plan Area”. The Heber Specific Plan Area allows commercial, residential, industrial and other employment-oriented development in a mixed-use orientation, which currently includes geothermal uses. Several of the landowners from whom we hold geothermal leases have expressed an interest in developing their land for residential, commercial, industrial or other surface uses in accordance with the parameters of the Heber Specific Plan Area. Currently, Imperial County’s Heber Specific Plan Area is coordinated with the cities of El Centro and Calexico. There has been ongoing underlying interest since the early 1990s to incorporate the community of Heber. While any incorporation process would likely take several years, if Heber were to be incorporated, the City of Heber could replace Imperial County as the governing land use authority, which, depending on its policies, could have a significant effect on land use and availability of geothermal resources.
Current and future development proposals within Imperial County and the City of Calexico, applications for annexations to the City of Calexico, and plans to expand public infrastructure may affect surface areas within the Heber KGRA, thereby limiting our ability to utilize, access, inject and/or transport the geothermal resource on or underneath the affected surface area that is necessary for the operation of our Heber power plants, which could adversely affect our operations and reduce our revenues.
Current construction works and urban developments in the vicinity of our Steamboat complex of power plants in Nevada may also affect future permitting for geothermal operations relating to those power plants. Such works and developments include plans for the construction of a new casino hotel and other commercial or industrial developments on land in the vicinity of our Steamboat complex.
U.S. federal, state and international income tax law changes could adversely affect us
The Company continuously monitors and examines the impact of USU.S. and international tax law changes, such as the Tax Act, CARES and similar tax law changes internationally, in order to determine the impact it may have on our business. The overall impact of the global tax law changes is uncertain, and our business, financial condition, future results and cash flow, as well as our stock price, could be adversely affected.
The Organization for Economic Co-operation and Development (OECD) has a framework to implement a global minimum corporate tax of 15% for companies with global revenues and profits above certain thresholds (referred to as Pillar 2), with certain aspects of Pillar 2 effective January 1, 2024 and other aspects effective January 1, 2025. At this time, the Company does not meet the revenue threshold requirements. The Company does anticipate being subject to Pillar 2 in future years based off anticipated growth projections. We will continue to evaluate the impact of proposed and enacted legislative changes to our effective tax rate and cash flows as new guidance becomes available.
Litigation, legal proceedings, regulatory investigations or other administrative proceedings could expose us to significant liabilities and reputational damage that could have a material adverse effect on us.
We are involved in the ordinary course of business and otherwise in a number of lawsuits involving, among other matters, employment, commercial, and environmental issues, and other claims for injuries and damages. We evaluate litigation claims and legal proceedings to assess the likelihood of unfavorable outcomes and to estimate, if possible, the amount of potential losses. Based on these evaluations and estimates, when required by applicable accounting rules, we establish reserves and disclose the relevant litigation claims or legal proceedings, as appropriate. These evaluations and estimates are based on the information available to management at the time and involve a significant amount of judgment. Actual outcomes or losses may differ materially from current evaluations and estimates. The settlement or resolution of such claims or proceedings may have a material adverse effect on us. We use appropriate means to contest litigation threatened or filed against us, but the litigation environment poses a significant business risk.
We are also involved in the ordinary course of business in regulatory investigations and other administrative proceedings, and we are exposed to the risk that we become the subject of additional regulatory investigations or administrative proceedings. For example, we are providing information to the SEC and Department of Justice ("DOJ") related to their investigation into certain claims made in a report published by a short seller regarding the Company’s compliance with anti-corruption laws and formed a Special Committee of independent directors, which worked with outside legal counsel to investigate the claims made.
Risks Related to Economic and Financial Conditions
We may be unable to obtain the additional financing we need to pursue our growth strategy and any future financing we receive may be less favorable to us than our current financing arrangements, either of which may adversely affect our ability to expand our operations.
MostSome of our geothermal power plants generally have been financed using leveraged financing structures, consisting of non-recourse or limited recourse debt obligations. Each of our projects under development or construction and those projects and businesses we may seek to acquire, or construct will require substantial capital investment. Our continued access to capital on acceptable or favorable terms to us is necessary for the success of our growth strategy.strategy, particularly in enhancing our portfolio through M&A activities. Our attempts to obtain future financings may not be successful or on favorable terms.
In recent years, we have also increased our corporate recourse debt at the holding company level due to our ability to obtain improved economic terms, and in June 2022 we issued, $431.25 million aggregate principal amount of 2.50% convertible senior notes due 2027, which we refer to as the “Notes”. Our existing and any future indebtedness may make it more difficult for us to refinance or borrow additional funds in the future, limiting our ability to pursue our growth strategy.
Market conditions and other factors may not permit future project and acquisition financings on terms similar to those our subsidiaries have previously received. Our ability to arrange for financing on a substantially non-recourse or limited recourse basis, and the costs of such financing, are dependent on numerous factors, including general economic conditions, conditions in the global capital and credit markets, investor confidence, the continued success of current power plants, the credit quality of the power plants being financed, the political situation in the country where the power plant is located, and the continued existence of tax and securities laws which are conducive to raising capital. If we are not able to obtain financing for our power plants on a substantially non-recourse or limited recourse basis, we may have to finance them using recourse capital such as direct equity investments or the incurrence of additional debt by us.
Also, in the absence of favorable financing options, we may decide not to build new plants or acquire facilities from third parties. Any of these alternatives could have a material adverse effect on our growth prospects.
We may also need additional financing to implement our strategic plan. For example, our cash flow from operations and existing liquidity facilities may not be adequate to finance any acquisitions we may want to pursue or new technologies we may want to develop or acquire. Financing for acquisitions or technology development activities may not be available on the non-recourse or limited recourse basis we have historically used for our business, or on other terms we find acceptable.
Our debt obligations may adversely affect our ability to raise additional capital and will be a burden on our future cash resources, particularly if we elect to settle these obligations in cash upon conversion or upon maturity or required repurchase.
Our ability to meet our payment obligations under the Note, depends on our future cash flow performance. This, to some extent, is subject to general economic, financial, competitive, legislative and regulatory factors, as well as other factors that may be beyond our control. There can be no assurance that our business will generate positive cash flow from operations, or that additional capital will be available to us, in an amount sufficient to enable us to meet our debt payment obligations and to fund other liquidity needs. If we are unable to generate sufficient cash flow to service our debt obligations, we may need to refinance or restructure our debt, sell assets, reduce or delay capital investments, or seek to raise additional capital. Our ability to refinance our indebtedness will depend on the capital markets and our financial condition at such time. We may not be able to engage in any of these activities or engage in these activities on desirable terms, which could result in a default on our debt obligations. As a result, we may be more vulnerable to economic downturns, less able to withstand competitive pressures and less flexible in responding to changing business and economic conditions.
Our foreign power plants and foreign manufacturing operations expose us to risks related to fluctuations in currency rates, which may reduce our profits from such power plants and operations.
Risks attributable to fluctuations in currency exchange rates can arise when any of our foreign subsidiaries incur operating or other expenses in one type of currency but receive revenues in another. In such cases, an adverse change in exchange rates can reduce such subsidiary’s ability to meet its debt service obligations, reduce the amount of cash and income we receive from such foreign subsidiary or increase such subsidiary’s overall expenses. In addition, the imposition by foreign governments of restrictions on the transfer of foreign currency abroad, or restrictions on the conversion of local currency into foreign currency, would have an adverse effect on the operations of our foreign power plants and foreign manufacturing operations, and may limit or diminish the amount of cash and income that we receive from such foreign power plants and operations.
Our power plants have generally been financed through a combination of our corporate funds and limited or non-recourse project finance debt and lease financing. If our project subsidiaries default on their obligations under such limited or non-recourse debt or lease financing, we may be required to make certain payments to the relevant debt holders, and if the collateral supporting such leveraged financing structures is foreclosed upon, we may lose certain of our power plants.
Our power plants have generally been financed using a combination of our corporate funds and limited or non-recourse project finance debt or lease financing. Limited recourse project finance debt refers to our additional agreement, as part of the financing of a power plant, to provide limited financial support for the power plant subsidiary in the form of limited guarantees, indemnities, capital contributions and agreements to pay certain debt service deficiencies. Non-recourse project finance debt or lease financing refers to financing arrangements that are repaid solely from the power plant’s revenues and are secured by the power plant’s physical assets, major contracts, cash accounts and, in many cases, our ownership interest in the project subsidiary. If our project subsidiaries default on their obligations under the relevant debt documents, creditors of a limited recourse project financing will have direct recourse to us, to the extent of our limited recourse obligations, which may require us to use distributions received by us from other power plants, as well as other sources of cash available to us, in order to satisfy such obligations. In addition, if our project subsidiaries default on their obligations under the relevant debt documents (or a default under such debt documents arises as a result of a cross-default to the debt documents of some of our other power plants) and the creditors foreclose on the relevant collateral, we may lose our ownership interest in the relevant project subsidiary or our project subsidiary owning the power plant would only retain an interest in the physical assets, if any, remaining after all debts and obligations were paid in full.
Possible fluctuations in the cost of construction, raw materials, commodities and drilling may materially and adversely affect our business, financial condition, future results, and cash flow.
Our manufacturing operations are dependent on the supply of various raw materials, including primarily steel and aluminum, commodities, vessels and industrial equipment components that we use. We currently obtain all such raw materials, commodities and equipment at prevailing market prices. We are not dependent on any one supplier and do not have any long-term agreements with any of our suppliers. Global events, such as the ongoing Covid-19 outbreak that began in 2020 hasmilitary conflicts at some of Israel's borders have also resulted in the extended shutdown of certain businesses in the certain regions and may result in delays in supply and increased costs. See also, “Conditions in and around Israel, where the majority of our senior management and our main production and manufacturing facilities are located, including the ongoing military conflicts at some of Israel's borders, may adversely affect our operations and may limit our ability to produce and sell our products, and support our Electricity segment.”Our development activity is also impacted by the supply delay and cost increase of raw materialsstorage batteries and components that we purchase for our equipment manufacturing, which may lead to cost increases. FutureSolar PV panels. Further cost increases of such raw materials, commodities and equipment to the extent not otherwise passed along to our customers, could adversely affect our profit margins.
Our commodity derivative activity may limit potential gains, increase potential losses, result in earnings volatility and involve other risks.
We enter, from time to time, into commodity derivative contracts to manage our price exposure to our energy storage segment revenue. While these transactions are intended to limit our exposure to the adverse effects of fluctuations of storage services prices, they may also limit our ability to benefit from favorable changes in market conditions, and may subject us to periodic earnings volatility in the instances where we do not seek hedge accounting for these transactions or if the correlation between the hedge and the actual performance of the asset will be lower. Also, in connection with such derivative transactions, we may be required to make cash payments to maintain margin accounts and to settle the contracts at their value upon termination.
Finally, this activity exposes us to potential risk of counterparties to our derivative contracts failing to perform under the contracts. As a result, the effectiveness of our risk management could have an impact on our business, results of operations and cash flows.
We have incurred substantial indebtedness that may decrease our business flexibility, access to capital, and/or increase our borrowing costs, and we may still incur substantially more debt, which may adversely affect our operations and financial results.
In June 2022, we issued $431.25 million aggregate principal amount of 2.50% convertible senior notes due 2027, which we refer to as the Notes. As of December 31, 2023, we had $431.3 million outstanding aggregate principal amount of Notes. Our indebtedness may limit our ability to borrow additional funds for working capital, capital expenditures, acquisitions or other general business purposes, limit our ability to use our cash flow or obtain additional financing for future working capital, capital expenditures, acquisitions or other general business purposes, require us to use a substantial portion of our cash flow from operations to make debt service payments, limit our flexibility to plan for, or react to, changes in our business and industry, place us at a competitive disadvantage compared to our less leveraged competitors and increase our vulnerability to the impact of adverse economic and industry conditions.
We may issue additional shares of our common stock in connection with conversions of the Notes, and thereby dilute our existing stockholders and potentially adversely affect the market price of our common stock.
In the event that the Notes are converted and the conversion value exceeds $1,000 per $1,000 principal amount of Notes, the ownership interests of existing stockholders will be diluted, and any sales in the public market of any shares of our common stock issuable upon such conversion could adversely affect the prevailing market price of our common stock. In addition, the anticipated conversion of the Notes could depress the market price of our common stock.
The fundamental change provisions of the Notes may delay or prevent an otherwise beneficial takeover attempt of us.
If the Company undergoes a “fundamental change”, subject to certain conditions, holders may require the Company to repurchase for cash all or part of their Notes at a fundamental change repurchase price equal to 100% of the principal amount of the Notes to be repurchased, plus accrued and unpaid interest to, but excluding, the fundamental change repurchase date. In addition, if such fundamental change also constitutes a “make-whole fundamental change”, the conversion rate for the Notes may be increased upon conversion of the Notes in connection with such “make-whole fundamental change”. Any increase in the conversion rate will be determined based on the date on which the “make-whole fundamental change” occurs or becomes effective and the price paid (or deemed paid) per share of our common stock in such transaction. Any such increase will be dilutive to our existing stockholders. Our obligation to repurchase the Notes or increase the conversion rate upon the occurrence of a make-whole fundamental change may, in certain circumstances, delay or prevent a takeover of us that might otherwise be beneficial to our stockholders.
The Capped Call Transactions may affect the value of the Notes and our common stock.
In connection with the issuance of the Notes, we entered into Capped Call Transactions with certain financial institutions. The Capped Call Transactions are expected generally to reduce or offset the potential dilution upon conversion of the Notes and/or offset any cash payments we are required to make in excess of the principal amount of converted Notes, as the case may be, with such reduction and/or offset subject to a cap.
From time to time, certain financial institutions (with which we entered into the Capped Call Transactions) or their respective affiliates may modify their hedge positions by entering into or unwinding various derivatives with respect to our common stock and/or purchasing or selling our common stock or other securities of ours in secondary market transactions prior to the maturity of the Notes. This activity could also cause or avoid an increase or a decrease in the market price of our common stock.
The potential effect, if any, of these transactions and activities on the price of our common stock or Notes will depend in part on market conditions and cannot be ascertained at this time. Any of these activities could adversely affect the value of our common stock.
We are subject to counterparty risk with respect to the Capped Call Transactions.
All or some of the financial institutions (which are counterparties to the capped call transactions) might default under the Capped Call Transactions. Our exposure to the credit risk of the counterparties will not be secured by any collateral. Past global economic conditions have resulted in the actual or perceived failure or financial difficulties of many financial institutions. If an option counterparty becomes subject to insolvency proceedings, we will become an unsecured creditor in those proceedings with a claim equal to our exposure at the time under the capped call transactions with such option counterparty. Our exposure will depend on many factors but, generally, an increase in our exposure will be correlated to an increase in the market price and in the volatility of our common stock. In addition, upon a default by an option counterparty, we may suffer adverse tax consequences and more dilution than we currently anticipate with respect to our common stock. We can provide no assurance as to the financial stability or viability of the option counterparties.
We are exposed to swap counterparty credit risk that could materially and adversely affect our business, operating results, and financial condition.
We rely on cross-currency swap contracts to effectively manage our currency risk related to our Senior Unsecured Bonds - Series 4 issued in July 2020. Failure of any of our counterparties to perform under derivatives contracts could disrupt our hedging operations if the counterparties do not fulfill their obligations under the agreements, particularly if we were entitled to a termination payment under the terms of the contract that we did not receive, if we had to make a termination payment upon default of the counterparty, or if we were unable to reposition the swap with a new counterparty.
We may not be able to obtain sufficient insurance coverage to cover damages resulting from any damages to our assets and profitability including but not limited to natural disasters such as volcanic eruptions, lava flows, wind and earthquake, which could materially and adversely affect our business, operating results, and financial condition.
OurWe maintain physical damage and business interruption insurance however, our business interruption and property damage insurance coverage may not be sufficient to cover all losses sustained as a result of natural disasters such as flood, volcanic eruptions, lava flows, wind and earthquake or any other insurable risk. WeIn addition, insurance coverage may not continue to be available in the future at rates that we believe are reasonable or in amounts of coverage or with scope of coverage adequate to insure against future natural disasters. Following the May 2018 eruption of the Kilauea volcano in Hawaii, the full amount of our insurance claim for damages to our Puna power plant was denied and we experienced increased costs and difficulties in obtaining sufficient insurance coverage for natural disasters for our Puna power plant in Hawaii following the May 2018 eruption of the Kilauea volcano.disasters. Before the eruption in 2018, we obtained natural disasters business interruption and property damage insurance coverage of up to approximately $100 million compared to $30 million, that waswith portions of the risk self-insured, secured in 2020.2022 and 2023. An inability to obtain sufficient and adequate insurance to cover all book net equity may cause us to self-insure some or all of a particular location and losses, causing us to experience higher than expected insurance costs.
If insurance premiums or deductibles were to increase in the future, if certain types of insurance coverage were to become unavailable or cost prohibitive, if we were to have to increase the percentage of our self-insured insurance coverage or if we were to experience losses in excess of, or outside the scope of, our insurance coverage, such additional costs could have a material adverse effect on our business, financial condition, results of operations and cash flows.
Risks Related to Force Majeure
The global spread of the COVID-19 pandemic may have an adverse impact and could adversely affect our financial results.
The COVID-19 pandemic and efforts to control its spread have significantly curtailed the movement of people, goods and services worldwide. Governments around the world have ordered companies to limit or suspend non-essential operations and imposed operational and travel restrictions resulting in a decline in global economic activity and an increase in market volatility. We have implemented significant measures both to comply with government requirements and to preserve the health and safety of our employees. These measures include working remotely where possible and operating separate shifts in our power plants, manufacturing facilities and other locations while trying to continue operations as close to full capacity in all locations.
While we did not experience any material impact on our results of operations during the first quarter of 2020, we have started to experience impacts in the second, third and fourth quarters of 2020 which varied among our business segments, as described below:
| •
| In our Electricity segment, our future growth in the electricity segment is and would be adversely impacted by delays we are experiencing in receiving the required development and construction permits, as well as by the implications of global and local restrictions on our ability to procure raw material and ship our products.
|
| •
| In our Product segment, the economic downturn has adversely impacted customers’ purchasing decisions and travel restrictions have adversely impacted our sales and marketing efforts. We experienced a decrease in our backlog that we believe was due to the impact of the COVID-19 pandemic. We may face similar challenges in future periods in the event of a prolonged shutdown.
|
| •
| Our Energy Storage segment generates revenues mainly from participating in the energy and ancillary services markets, run by regional transmission operators and independent system operators in the various markets where our assets operate. Therefore, the revenues these assets generate are directly impacted by the prevailing market prices for energy and/or ancillary services.
|
| •
| In addition, we have experienced and continue to experience delays and increased costs related to permitting and construction for new projects in all business segments.
|
The extent to which the COVID-19 pandemic ultimately impacts our business, operations, financial results and financial condition will depend on numerous evolving factors, which are currently uncertain and cannot be predicted, including:
| •
| the duration and scope of the pandemic;
|
| •
| governmental, business and individuals’ actions taken in response;
|
| •
| the effect on our customers and customers’ demand for our services and products;
|
| •
| the effect on our suppliers and disruptions to the global supply chain;
|
| •
| our ability to sell and provide our services and products, including as a result of travel restrictions and people working from home;
|
| •
| disruptions to our operations resulting from the illness of any of our employees;
|
| •
| our ability to oversee remote operations due to travel restrictions;
|
| •
| restrictions or disruptions to transportation, including reduced availability of ground or air transport; and
|
| •
| decrease in electricity demand and the ability of our customers to pay for our services and products.
|
In addition, the impact of COVID-19 on macroeconomic conditions may impact the proper functioning of financial and capital markets, foreign currency exchange rates, commodity and interest rates. Any of the events described above could amplify the other risks and uncertainties described in this report and could materially adversely affect our business, financial condition, results of operations and/or stock price.
The existence of a prolonged force majeure event or a forced outage affecting a power plant, or the transmission systems could reduce our net income and materially and adversely affect our business, financial condition, future results and cash flow.
The operation of our subsidiaries’ geothermal power plants is subject to a variety of risks, including public health issues, such as epidemics, pandemics, and other outbreaks, as well events such as fires, explosions, earthquakes, landslides, floods, severe storms, volcanic eruptions, lava flow or other similar events. Any of these events could result in a shutdown of certain of our businesses, such as the COVID-19 epidemic, which resulted in a shutdown of our business at the beginning of the outbreak. If a power plant experiences an occurrence resulting in a force majeure event, although our subsidiary that owns that power plant would be excused from its obligations under the relevant PPA, the relevant power purchaser may not be required to make any capacity and/or energy payments with respect to the affected power plant for as long as the force majeure event continues and, pursuant to certain of our PPAs, will have the right to prematurely terminate the PPA. Additionally, to the extent that a forced outage has occurred, and if as a result the power plant fails to attain certain performance requirements under certain of our PPAs, the power purchaser may have the right to permanently reduce the contract capacity (and correspondingly, the amount of capacity payments due pursuant to such agreements in the future), seek refunds of certain past capacity payments, and/or prematurely terminate the PPA. As a consequence, we may not receive any net revenues from the affected power plant other than the proceeds from any business interruption insurance that applies to the force majeure event or forced outage after the relevant waiting period and may incur significant liabilities in respect of past amounts required to be refunded.
On May 3, 2018, the Kilauea volcano located in close proximity to our Puna 38 MW geothermal power plant in the Puna district of Hawaii's Big Island erupted following a significant increase in seismic activity in the area. The lava ultimately covered the wellheads of three geothermal wells, monitoring wells and the substation of the Puna complex and an adjacent warehouse that stored a drilling rig that was also consumed by the lava. We recently resumed operations and the Puna power plant is operating at approximately 13 MW. Further details on the status of the power plant is described under "Recent Development" below. The Company continues to assess the accounting implications of this event on its balance sheet and whether an impairment will be required.
In addition to our power plant in Puna, Hawaii, our power plant in Amatitlan, Guatemala is located in proximity to an active volcano. As a result of recent events impacting our Puna facility, we cannot be certain how investors will assess the risks to which our facilities are subject and whether this assessment will adversely impact perceptions of our business and our share price.
Threats of terrorism natural catastrophes or public health crises and other catastrophic events may impact our operations in unpredictable ways and could adversely affect our business, financial condition, future results and cash flow.
We are subject to the potentially adverse operatingOur operations and financial effects of terrorist acts and threats, natural disasters, public health crises, fire, power loss and telecommunication failures, as well as cyber-attacks, including, among others, malware, computer viruses and attachments to e-mails, phishing attacks, denial of service or information, remote interruption to the operation offacilities, in particular, our power plants and other disruptive activities of individuals or groups, including traditional computer hackers, persons involved with organized crime or foreign state or foreign state-supported actors. Our generation and transmission facilities, information technology systems and other infrastructure facilities, systems and physical assets including our Viridity business’s VPowerTM software platform,that we acquire, construct or develop, as well as the information technology systemsthose of third parties on which we rely, may be targets of terrorist acts and threats, as well as events occurring in response to or in connection with them, that could cause environmental repercussions, result in full or partial disruption of our operations. These operations and facilities are also subject to natural disasters, public health crises, fire, power loss and telecommunication failures. Any of our assets or those of third-party vendors could be directly or indirectly affected by such events or activities.
We operate Any such terrorist acts, environmental repercussions or disruptions or natural disasters could result in a highly regulated industry that requires the continued operation of sophisticated information technology systems and network infrastructure. Despite our implementation of security measures, all of our and our third-party vendors’ technology systems (and any programssignificant decrease in revenues or data stored thereonsignificant reconstruction or therein) are vulnerable to security breaches, disruptions, failures, data leakage or unauthorized access due to such activities. Those breaches and events may result from acts of our employees, contractors or third parties. If our technology systems were to fail or be breached and we were unable to recover in a timely way, we would be unable to fulfill critical business functions, and sensitive confidential and other dataremediation costs, beyond what could be compromised,recovered through insurance policies, which could adversely affect ourhave a material adverse effect on the business, financial condition, future results of operations and cash flow. In addition, such events or activities could require significant management attention and resources and could adversely affect our reputation among customers and the public. The implementation of security guidelines and measures and maintenance of insurance, to the extent available, addressing such events or activities could significantly increase our costs. Furthermore, there is no guarantee that such security guidelines and measures will adequately anticipate or prevent such events or activities and our insurance may not cover any or all losses arising out of such events or activities.flows.
A disruption
Risks Related to Ownership of Our Common Stock
Future equity issuances, including through our current or any future equity compensation plans, could result in dilution, which could cause the price of our shares of common stock to decline.
We may issue additional shares of our common stock in the future pursuant to current or future equity compensation plans, upon conversions of preferred stock or debt, including the Notes, or in connection with future acquisitions or financings. We may also seek to raise additional funds, finance acquisitions or develop strategic relationships by issuing additional shares of our common stock. If we choose to raise capital by selling shares of our common stock, or securities convertible into shares of our common stock, or additional shares are issued for the reasons described above or otherwise, the issuance could have a dilutive effect on the holders of our common stock and could have a material negative effect on the market price of our common stock.
A substantial percentage of our common stock is held by stockholders whose interests may conflict with the interests of our other stockholders.
On July 26, 2017, ORIX purchased approximately 22%As of our shares of common stock outstanding and following Ormat's recent equity public offering, in November 2020,December 31, 2023, ORIX holds 19.7%11.06% of our shares of common stock outstanding. Pursuant to the Governance Agreement between us and ORIX entered into in connection with this stock purchase transaction, based on its current level of ownership of our shares, ORIX has the right to designate three directorsone director to our Board for as long as ORIX and its affiliates collectively hold at least 18%5% of the voting power of all of our outstanding voting securities, the right to representation on certain committees of our Board as well as preemptive rights pursuant to the Governance Agreement. In addition, the Governance Agreement provides ORIX preemptive rights in the event we issue common stock or other securities that entitle the holder to vote for the election of directors. ORIX may also exercise certain registration rights pursuant to the Registration Rights Agreement, as amended, between us and ORIX.
As a result of these rights and ORIX’s beneficial ownership of our common stock, ORIX could exert influence through its Board representation on our and our subsidiaries’ business, operations and management, including our strategic plans, or, as a significant stockholder, on matters submitted to a vote of our stockholders, including mergers, consolidations and the sale of all or substantially all of our assets. This concentration of ownership of our common stock could delay or prevent proxy contests, mergers, tender offers, or other purchases of our common stock that might otherwise give our stockholders the opportunity to realize a premium over the then-prevailing market price for our shares. If ORIX exercises its registration rights to requirerequires us to register for sale the common stock held by ORIX or ORIX otherwise sells its common stock in the public markets, the price of our common stock may decline. This concentration of ownership may also adversely affect the liquidity of our common stock.
The price of our common stock may fluctuate substantially, and your investment may decline in value.
The market price of our common stock may be highly volatile and may fluctuate substantially due to many factors, including:
| | ●•
| actual or anticipated fluctuations in our results of operations including as a result of seasonal variations in our Electricity segment-based revenues or variations from year-to-year in our Product segment-based revenues; |
| | ●•
| variance in our financial performance from the expectations of market analysts; |
| | ●•
| conditions and trends in the end markets we serve, and changes in the estimation of the size and growth rate of these markets; |
| | ●•
| our ability to integrate acquisitions; |
| | ●•
| announcements of significant contracts by us or our competitors; |
| | ●•
| changes in our pricing policies or the pricing policies of our competitors; |
| | ●•
| restatements of historical financial results and changes in financial forecasts; |
| | ●•
| loss of one or more of our significant customers; |
| | ●•
| changes in market valuation or earnings of our competitors; |
| | ●•
| the trading volume of our common stock; |
| | ●•
| the trading of our common stock on multiple trading markets, which takes place in different currencies and at different times; and |
| | |
| | ●•
| general economic conditions. |
In addition, the stock market in general, and the NYSE and the market for energy companies in particular, have experienced extreme price and volume fluctuations that have often been unrelated or disproportionate to the operating performance of particular companies affected. These broad market and industry factors may materially harm the market price of our common stock, regardless of our operating performance. In the past, following periods of volatility in the market price of a company’s securities, securities class-action litigation has often been instituted against that company. Such litigation, if instituted against us such as the recent class action filed on June 2018 by Mac Costas and discussed elsewhere in this report, could result in substantial costs and a diversion of management’s attention and resources, which could materially harm our business, financial condition, future results and cash flow.
lawsuits. While a certain amount of insurance coverage is available for expenses or losses associated with these lawsuits, this coverage may not be sufficient for certain litigation. For information on our recently dismissed and ongoing securities class actions, see “Commitments and Contingencies” in Note 21 to the consolidated financial statements contained in Item 8 of this Annual Report.
ITEM 1B. UNRESOLVED STAFF COMMENTS
None.
ITEM 1C. CYBERSECURITY
Risk management and strategy
We prioritize the management of cybersecurity risk and the protection of information across our enterprise by embedding data protection and cybersecurity risk management in our operations. Our processes for assessing, identifying, and managing material risks from cybersecurity threats have been integrated into our overall risk management system and processes.
As a foundation of this approach, our privacy and security policies govern our business lines and subsidiaries. We monitor the privacy and security regulations applicable to us in the regions where we do business as well as proposed privacy and security regulations and emerging risks.
We conduct internal and external penetration testing and risk assessments on a regular basis, and have engaged consultants, auditors and other relevant third parties to assist us with cybersecurity risk management processes. Our operations rely on the secure processing, storage and transmission of confidential and other information in our computer systems and networks. Computer viruses, hackers, and employee or vendor misconduct, and other external hazards could expose our data systems and those of our vendors to security breaches, cybersecurity incidents or other disruptions, any of which could materially and adversely affect our ability to conduct our business. While we have experienced cybersecurity incidents, to date, we are not aware that we have experienced a material cybersecurity incident. The sophistication of cybersecurity threats continues to increase, and the controls and preventative actions we take to reduce the risk of cybersecurity incidents and protect our systems, including the regular testing of our cybersecurity incident response plan, may be insufficient. In addition, new technology that could result in greater operational efficiency may further expose our computer systems to the risk of cybersecurity incidents. For more information, see Part I of this Annual Report, Item 1A “Risk Factors—Risks Related to the Company’s Business and Operation—A cyber-incident, cyber security breach, severe natural event or physical attack on our operational networks and information technology systems could have a material adverse effect on our financial condition, results of operations, liquidity and cash flows.”
Governance
As part of our overall risk management approach, we prioritize the management of cybersecurity risk at several levels, including Board oversight, executive commitment and employee training. Our Audit Committee, comprised fully of independent directors from our Board, oversees the Board’s responsibilities relating to cybersecurity risks. Our Audit Committee is informed of such risks through reports from our Chief Information Officer (“CIO”) on at least an annual basis.
Our Chief Information Security Officer (“CISO”), who has been a chief information security officer at Ormat for six years, is certified by the International Information System Security Certification Consortium as an Information Systems Security Management Professional (“ISSMP”), as an Information Systems Security Architecture Professional (“ISSAP”), and as a Certified Information Systems Security Professional (“CISSP”). Our CISO oversees compliance of our information security (“IS”) standards and mitigation of IS risks. We also have the following internal bodies to support our processes to assess and manage cybersecurity risk as follows:
| • | The Crisis Incident Management Team, which includes members of the executive management team, the CIO, CISO, and other senior executives across the Company, is alerted as appropriate to cybersecurity incidents, as well as other crises, such as natural disasters and outages. This team also periodically oversees tabletop drills on various cybersecurity incidents. |
| • | The Cyber Risk Disclosure Committee brings together senior management, including the CEO, CFO, General Counsel and other relevant functions to review the materiality of cyber incidents for disclosure purposes. The Cyber Risk Disclosure Committee members are also part of the Crisis Incident Management team. |
| • | The IT leadership team, led by our Chief Information Officer, oversees IT initiatives while considering cybersecurity risk mitigation with respect to these initiatives. The team provides periodic presentations to senior management and the Board on cybersecurity risk and mitigation. |
| • | The VP of Technical and Maintenance chairs monthly cybersecurity meetings to review cyber risks or threats related to the operations of our geothermal projects. |
At the level of the general employee population, we hold trainings on privacy and information security, records and information management, and information security regulatory compliance, conduct phishing tests and generally seek to promote awareness of cybersecurity risk through broad communication and educational initiatives, depending on the employee’s level, role and exposure to sensitive systems and the associated cybersecurity risk profile. We also contract with an external vendor to monitor alerts in real time on cybersecurity incidents.
ITEM 2. PROPERTIES
We currently leaseown our corporate offices at 6140 Plumas streetStreet and 6140 Sierra Center Drive in Reno, Nevada 89519 to which we moved in the second quarter of 2018.89519. We also occupy an approximately 807,000 square foot office and manufacturing facility located in the Industrial Park of Yavne, Israel, which we lease from the Israel Land Administration. See Item 13 — “Certain Relationships and Related Transactions”. In Turkey, we established and leased a facility to locally produce power plant components to our local customers.
We believe that our current offices and manufacturing facilities will be adequate for our operations as currently conducted.
Each of our power plants is located on property leased or owned by us or one of our subsidiaries or is a property that is subject to a concession agreement.
Information and descriptions of our plants and properties are included in Item 1 — “Business”, of this annual report.Annual Report.
ITEM 3. LEGAL PROCEEDINGS
The information required with respect to this item can be found under “Commitments and Contingencies” in Note 2120 of notes to the consolidated financial statements contained in Item 8 of this annual reportAnnual Report and is incorporated by reference into this Item 8.herein.
ITEM 4. MINE SAFETY DISCLOSURES
Not applicable.
PART II
ITEM5.MARKET FOR REGISTRANT’SREGISTRANT’S COMMON EQUITY, RELATED STOCKHOLDERMATTERS AND ISSUER PURCHASES OF EQUITY SECURITIES
Market for Our Common Stock
Our common stock has traded on the NYSE under the symbol “ORA” since November 11, 2004. Prior to November 11, 2004, there was no public market for our common stock. Effective on February 10, 2015, our common stock also began trading on the TASE under the same symbol.
Record Holders
As of February 24, 2021,21, 2024, there were 1316 record holders of our common stock. On February 24, 2021,stock, including Cede & Co., the closing pricenominee of the Depository Trust Company. The number of record holders may not be representative of the number of beneficial owners of our common stock, as reported on the NYSE was $103.96 per share.whose shares are held in street name by banks, brokers and other nominees.
Dividend Policy
We have adopted a dividend policy pursuant to which we currently expect to distribute at least 20% of our annual profits available for distribution by way of quarterly dividends. In determining whether there are profits available for distribution, our Board will take into account our business plan and current and expected obligations, and no distribution will be made that in the judgment of our Board would prevent us from meeting such business plan or obligations.
Stock Performance Graph
The following performance graph represents the cumulative total shareholder return for the period December 30, 20152018 through December 31, 20202023 for our common stock, compared to the Standard and Poor’s Composite 500 Index, S&P Global Clean Energy Index and two peer groups.PBW - Invesco WilderHill Clean Energy ETF. The chart shows the cumulative return for the period December 31, 2018 through December 31, 2023. The stock price performance on the following graph is not necessarily indicative of future stock price performance. On February 21, 2024, the closing price of our common stock as reported on the NYSE was $67.22 per share.
Comparison of Cumulative Returns (%) for the Period December 31, 20152018 through December 31, 20202023
| | | 2015 | | | 2016 | | | 2017 | | | 2018 | | | 2019 | | | 2020 | |
Ormat Technologies Inc. | | | 34.2 | % | | | 47.0 | % | | | 75.4 | % | | | 43.4 | % | | | 104.3 | % | | | 147.5 | % |
Standard & Poor's Composite 500 Index | | | -0.7 | % | | | 9.5 | % | | | 30.8 | % | | | 22.6 | % | | | 58.1 | % | | | 83.8 | % |
PBW - Invesco WilderHill Clean Energy ETF | | | 0.2 | % | | | -19.0 | % | | | -4.2 | % | | | -15.1 | % | | | 20.1 | % | | | 186.2 | % |
IPP Peers* | | | -38.8 | % | | | 8.8 | % | | | 54.7 | % | | | 91.4 | % | | | 113.8 | % | | | 116.5 | % |
Renewable Peers* | | 20.4 | | | -9.1 | % | | | -9.1 | % | | | -1.6 | % | | | -6.2 | % | | | 31.9 | % |
* IPP Peers are The AES Corporation, NRG Energy Inc. and Covanta Holding Corp.
** Renewable Energy (Renewable) Peers are Acciona S.A., Nextera Energy, Inc., TransAlta Renewables Inc. and SunPower Corporation.
The above Stock Performance Graph shall not be deemed to be soliciting material or to be filed with the SEC under the Securities Act and the Exchange Act except to the extent that we specifically request that such information be treated as soliciting material or specifically incorporate it by reference into a filing under the Securities Act or the Exchange Act.
| | 2018 | 2019 | 2020 | 2021 | 2022 |
Ormat Technologies Inc | 42.50 | 72.60 | 51.60 | 65.40 | 44.90 |
Standard & Poor's Composite 500 Index | 28.90 | 49.80 | 90.10 | 53.20 | 90.30 |
PBW - Invesco WilderHill Clean Energy ETF | 59.20 | 380.90 | 232.20 | 78.30 | 38.20 |
S&P Global Clean Energy Index | 41.50 | 236.90 | 154.80 | 139.40 | 88.10 |
Equity Compensation Plan Information
For information on our equity compensation plan, refer to Part III of this Annual Report Item 12 — “Security Ownership of Certain Beneficial Owners and Management and Related Stockholder Matters”.
Issuer Purchases of Equity Securities
None.
Sales of Unregistered Equity Securities
None.
ITEM 6. SELECTED FINANCIAL DATA[RESERVED]
We complied with the Securities and Exchange Commission's amendments to Regulation S-K from November 19, 2020 specifically eliminating the requirement for Selected Financial Data under this Item
ITEM 7. MANAGEMENT’SMANAGEMENT’S DISCUSSION AND ANALYSIS OF FINANCIAL CONDITION ANDRESULTS OF OPERATIONS
You should read the following discussion and analysis of our results of operations, financial condition and liquidity in conjunction with our consolidated financial statements and the related notes. Some of the information contained in this discussion and analysis or set forth elsewhere in this annual reportAnnual Report including information with respect to our plans and strategies for our business, statements regarding the industry outlook, our expectations regarding the future performance of our business, and the other non-historical statements contained herein are forward-looking statements. See “Cautionary“Cautionary Note Regarding Forward-Looking Statements.” You should also review Item 1A — “Risk Factors”“Risk Factors” for a discussion of important factors that could cause actual results to differ materially from the results described herein or implied by such forward-looking statements.
General
Overview of Fiscal Year 2020 Revenues
For the year ended December 31, 2020, our total revenues decreased by 5.5% (from $746.0 million to $705.3 million) over the previous year driven by lower revenues in the Product segment.
For the year ended December 31, 2020, Electricity segment revenues were $541.4 million, compared to $540.3 million for the year ended December 31, 2019, an increase of 0.2%. Product segment revenues for the year ended December 31, 2020 were $148.1 million, compared to $191.0 million for the year ended December 31, 2019, a decrease of 22.5%. Energy Storage segment revenues for the year ended December 31, 2020 were $15.8 million, compared to $14.7 million for the year ended December 31, 2019 an increase of 7.6%.
During the years ended December 31, 2020 and 2019, our consolidated power plants generated 6,043,993 MWh and 6,238,272 MWh, respectively, decreased of 3.1%. The average prices during the years ended December 31, 2020 and 2019 were $89.6 and $86.6 per MWh, respectively.
For the year ended December 31, 2020, our Electricity segment generated 76.8% of our total revenues (72.4% in 2019), while our Product segment generated 21.0% of our total revenues (25.6% in 2019), and our Energy Storage segment generated 2.2% of our total revenues (2.0% in 2019).
For the year ended December 31, 2020, approximately 98.2% of our Electricity segment revenues were from PPAs with fixed energy rates which are not affected by fluctuations in energy commodity prices. We have variable price PPAs in California and Hawaii, which provide for payments based on the local utilities’ avoided cost, which is the incremental cost that the power purchaser avoids by not having to generate such electrical energy itself or purchase it from others, as follows:
| ●
| The energy rates under the PPAs in California for each Heber 2 power plant in the Heber Complex and the G2 power plant in the Mammoth Complex, a total of between 30 to 40 MW, change primarily based on fluctuations in natural gas prices.
|
| ●
| The prices paid for electricity pursuant to the 25 MW PPA for the Puna Complex in Hawaii change primarily as a result of variations in the price of oil as well as other commodities. In 2019, we signed a new PPA related to Puna with fixed prices, increased capacity and extended the term until 2052.
|
To comply with obligations under their respective PPAs, certain of our project subsidiaries are structured as special purpose, bankruptcy remote entities and their assets and liabilities are ring-fenced. Such assets are not generally available to pay our debt, other than debt at the respective project subsidiary level. However, these project subsidiaries are allowed to pay dividends and make distributions of cash flows generated by their assets to us, subject in some cases to restrictions in debt instruments, as described below.
Electricity segment revenues are also subject to seasonal variations and are affected by higher-than-average ambient temperatures, as described below under “Seasonality”.
Revenues attributable to our Product segment are based on the sale of equipment, EPC contracts and the provision of various services to our customers. Product segment revenues may vary from period to period because of the timing of our receipt of purchase orders and the progress of our equipment manufacturing and execution of the relevant project.
Revenues attributable to our Energy Storage segment are generated by several grid-connected BESS facilities that we own and operate from selling energy, capacity and/or ancillary services in merchant markets like PJM Interconnect, ISO New England, the ERCOT and CAISO. The revenues fluctuate over time since a large portion of such revenues are generated in the merchant markets where price volatility is inherent.
Our management assesses the performance of our operating segments differently. In the case of our Electricity segment, when making decisions about potential acquisitions or the development of new projects, management typically focuses on the internal rate of return of the relevant investment, technical and geological matters and other business considerations. Management evaluates our operating power plants based on revenues, expenses, and EBITDA, and our projects that are under development based on costs attributable to each such project. Management evaluates the performance of our Product segment based on the timely delivery of our products, performance quality of our products, revenues and costs actually incurred to complete customer orders compared to the costs originally budgeted for such orders. We evaluate Energy Storage segment performance similar to the Electricity segment with respect to projects that we own and operate and similar to the Product segment when we provide services to third parties.
Recent Developments
The most significant recent developments for our companyCompany and business during 20192023 and 20202024 to date are described below.
| | • | AsIn February 12, 2024, we announced that the Hawai‘i Public Utilities Commission (HPUC) approved two final amendments to the PPA between its subsidiary, PGV, and Hawaiian Electric. This decision enables PGV to contribute up to an additional 8 megawatts of February 2021,clean, dispatchable renewable power to Hawai`i Island, elevating the contract maximum capacity to 46 MW, with a minimum contracted capacity set at 30 MW. The approval follows PGV’s completion and submission of its final EIS for operations in Puna, Hawai’i. The EIS was a condition set by the HPUC for approval of an amended and restated PPA that was submitted to the HPUC in December 2019.
|
| • | In January 4, 2024 we announced the closing of the acquisition of a portfolio of geothermal and solar assets from Enel Green Power North America (EGPNA), a subsidiary of Enel SpA (ENEL.MI, LLC), that was announced in October 2023. Under the agreement, Ormat paid $272 million for 100% of the equity interest in the portfolio assets. The acquired portfolio includes two contracted operating geothermal power plants and one triple hybrid geothermal, solar PV and solar thermal power plant that was shut down following the Kilauea volcano eruption in May 2018, has resumed operationwith a total geothermal capacity of approximately 40 MW and currently is operating at approximately 13 MW. On the field side, the Company connected one new production well to the power plantSolar PV of 20MW, two Solar assets with a total nameplate capacity of 40 MW, and the Company continues its field recovery work, which includes drilling new wells and expects a gradual increase in generation to full capacity by the middle of 2021, assuming field recovery is successfully achieved.two greenfield development assets. |
| | • | In December 2020,12, 2023, we announced that we completed the acquisitionsigning of a shovel-ready15-year Energy Storage Service Agreement (ESSA) with San Diego Community Power (SDCP), California’s second largest community choice aggregator, for the 20MW/40MWh Pomona 2 Battery Energy Storage System (BESS) located in Los Angeles County, California that has been operational since July 2023. This agreement marks the second tolling agreement in Ormat’s expanding portfolio, following the 2022 Bottleneck contract. These agreements contribute to the growth of a stable, profitable and predictable revenue stream for Ormat’s energy storage asset in Upton County, Texas. We acquired the asset from Con Edison Development. Ormat’s wholly owned subsidiary will design, build, own and operate a 25 MW BESS project at the site. Ormat is targeting commercial operationsegment, with over 40% of the BESS beforesegment’s revenue expected to be contracted starting the endsecond half of 2021. 2024. |
| | • | In December Ormat6, 2023, we announced several departures and appointmentsthe signing of a 25-year Power Purchase Agreement (PPA) with Dominica Electricity Services Ltd. (DOMLEC) for the development of a 10 MW binary geothermal power plant in its executive management team: |
| ◦
| Zvi Krieger announced that hethe Caribbean country of Dominica. The project is expected to be operational by the end of 2025. This agreement follows the Government of the Commonwealth of Dominica’s successful development of the geothermal reservoir in the Roseau Valley. At the end of the agreement term, ownership of the power plant will step down from his role as Executive Vice President—Electricity Segment on March 31, 2021 and will continue to perform certain duties until his June 30, 2022 retirement date.
|
| ◦
| Shimon Hatzir was appointedbe transferred to the roleGovernment of Executive Vice President—Electricity Segment, effective April 1, 2021.
|
| ◦
| Shlomi Argas, Executive Vice President—Operations and Productsthe Commonwealth of Dominica. Ormat was appointedintends to serve asfinance the development through the issuance of concessional long-term debt with a President of Ormat, effective January 1, 2021.below market interest rate.
|
| | • | In October 2023, we entered into a partnership agreement with a private investor, under which the private investor acquired membership interests in the North Valley Geothermal power plant for an initial purchase price of approximately $43.1 million and Decemberfor which it will pay additional installments that are expected to amount to approximately $6.1 million. The Company will continue to operate and maintain the power plant and will receive substantially all the attributable cash flow generated by the power plant, and the private investor will receive substantially all of 2020,the tax attributes of the project. |
| • | In September 2023, we have signed new contracts with Mercury NZ Limited for the supply and Engineering, Procurement and Construction (EPC) of a new 56 MW (gross) geothermal power plant at Ngatamariki, New Zealand. Under the agreement with Mercury, the project will be an expansion of the existing 96 MW Ngatamariki geothermal power plant currently in operation, which was also built by the Company entered into two settlement agreementsin 2012. The new power plant will be built on the same platform as the existing power plant and once in operation with the KRA in relation to three the NoAs which were previously issued by the KRA, totaling approximately $200 million, including interest and penalties. The settlement agreements covered tax years from 2013 through 2019, included deferralnew Ormat Energy Converter (OEC), it will have a total output of tax benefits to be utilized in years subsequent to 2019 in an amount of approximately $28 million and resulted in a tax payment of approximately $29.5 million, including interest and penalties which was made in 2020. This concluded all open audits and NoAs with the KRA. over 150 MW (gross). |
| | • | In November 2020,September 2023, we secured a new multi-year contract in partnership with Gotion High-Tech to supply batteries in support of our upcoming Energy Storage projects. Under this supply contract, Gotion will provide us with batteries at a capacity of up to 750MWh, with a variable pricing structure, partly linked to Lithium Carbonate prices. In addition to the signed agreement, we are discussing additional supply contracts and expansions to the existing signed agreement to provide the Company with U.S. domestic manufactured batteries from Gotion’s planned battery plant in Manteno, Illinois, which will allow us to benefit from higher Investment Tax Credits. |
| • | In July 2023, we successfully commenced commercial operations of the Pomona project, a 20MW/40MWh Battery Energy Storage System (BESS) located in California, which provides capacity to Southern California Edison and ancillary services to the California Independent System Operator (CAISO) to support the electric grid in times of scarcity. |
| • | In July 2023, we requested the Bureau of Land Management (BLM) to begin a supplemental National Environmental Policy Act (NEPA) review for the Company’s Dixie Meadows Geothermal Project. The Company has determined that its resources are more efficiently dedicated to Endangered Species Act (ESA) consultation within the context of additional review under NEPA. |
| • | In July 2023, we signed a power purchase agreement with San Diego Community Power (SDCP) for the Arrowleaf Solar and Storage Facility. The Arrowleaf Solar and Storage Facility is located in Imperial County, California, adjacent to the Company’s operational Brawley geothermal facility and within the Imperial Irrigation District service territory. The project’s storage component will provide 35 MW/140 MWh of capacity and the solar component of the project will contribute 42 MW of clean energy to the grid. Under the terms of the 20-year power purchase agreement, the Company will provide SDCP with sustainable electricity generated by the Arrowleaf Solar and Storage Facility at predictable rates for customers. |
| • | In June 2023, we successfully commenced commercial operations for two new battery storage facilities, adding a cumulative capacity of 43MW/43MWh. The projects include the Upton project, a 23MW/23MWh Battery Energy Storage System (BESS) located in Texas, which provides energy and ancillary services to the Electricity Reliability Council of Texas (ERCOT) and supports the electric grid in times of scarcity, and the Andover BESS project, a 20MW/20MWh located in New Jersey, which provides ancillary services to PJM. |
| • | In June 2023, we signed agreements with Eastland Generation Limited (EGL) to build a 50MW power plant in New Zealand. EGL is a subsidiary of Eastland Group Limited and a regional infrastructure company. Under the terms of the agreement, the Company will design, build, commission and own the power plant. EGL will operate and maintain the power plant under a separate services arrangement. As part of the development agreement with EGL, the Company has granted EGL a contractual option to purchase the power plant at an agreed purchase price, subject to certain conditions. |
| • | In May 2023, we successfully resumed operations at the Heber 1 power plant in California. This achievement comes after the plant temporarily shut down due to a fire incident that occurred in February 2022. The Heber complex, which includes Heber 1 and the repowered Heber 2, is generating now approximately 91MW. |
| • | In May 2023, we completed a 6MW upgrade to the Dixie Valley power plant in Nevada, which allows the Company to maximize its favorable long-term power purchase agreement. The upgrade involved the replacement of pre-acquisition equipment with the Company’s state-of-the-art energy converters. In addition, we completed the 6 MW Brady solar facility that supply the auxiliary needs of the Brady geothermal power plant and thereby increasing the net geothermal power sold to the grid. |
| • | In April and May of 2023, we commenced the commercial operation of two energy storage facilities, Howell and Bowling Green. The Howell BESS project, located in New Jersey, and the Bowling Green BESS project, located in Ohio, will add 7MW and 12MW of capacity respectively, and will be providing ancillary services to PJM. |
| • | In April 2023, we commenced commercial operation of the North Valley geothermal power plant. The North Valley power plant provides 25 MW of geothermal power to NV Energy under a 25-year power purchase agreement to help meet NV Energy’s renewable targets and support increased customer demand for around-the-clock clean energy. |
| • | In March 2023, we announced that we closed a public offering of 4,150,0003,600,000 shares of our common stock at a price of $74.00$82.60 per share and fullyshare. In addition, the underwriters' exercised the underwriters'their option to purchase an additional 622,500540,000 shares of common stock at the same price. We intend to use the $341.7 million net proceeds from the offering for general corporate purposes, including working capital and capital expenditures, and for potential acquisitions, including complementary businesses, technologies or assets. |
| | • | In October 2020,January 2023, we, announcedtogether with PT Medco Power Indonesia (“Medco Power”), signed a Financing Agreement with PT Sarana Multi Infrastruktur (Persero) (“SMI”) for the signingdevelopment of two Resource Adequacy Agreements, each for 50% of our 5 MW / 20 MWh Tierra Buena battery energy storage project currently under development in Sutter County, northern California.the Ijen Geothermal Power Plant. The agreements were signed with two Community Choice Aggregators, Redwood Coast Energy Authority and Valley Clean Energy. |
| •
| In September 2020, we announced that ENEE, our customer for our Platanares geothermalIjen power plant in Honduras, had paid the $20 million overdue payment that was outstanding from prior years.
|
| •
| In July 2020, we completed the acquisition of the Pomona energy storage asset in California from Alta Gas for a total net consideration of $43.3 million. The Pomona energy storage facility has been in commercial operation since December 31, 2016 under a 10-year energy storage resource adequacy agreement with Southern California Edison Company. It also participates in the energy and ancillary services markets run by the California Independent System Operator.
|
| •
| In July 2020, we issued approximately $290.0 million of bonds (the "Bonds") that were issued in New Israeli Shekels and were converted to U.S. Dollars using a cross-currency swap transaction (the “Swap”) at an effective fixed interest rate of 4.34%. The $290 million of bonds will mature in June 2031 and bear, prior to the Swap, a fixed interest rate of 3.35% per annum, payable semi-annually starting December 2020. The Bonds will be repaiddeveloped in 10 equal installments starting June 2022, unless prepaid earlier by Ormat pursuant tostages and the terms and conditionsfirst phase of the trust instrument that will govern the Bonds. The Bonds received a rating of ilAA- from Maloot S&P in Israel with a stable outlook. In April and May 2020, we also raised approximately $130 million of new corporate debt from existing lenders.
|
| •
| In June 2020, we completed the enhancement of our Steamboat Hills complex and increased its generating capacity by 19MW to a total of 84MW. Enhancement work included the replacement of all old generating unit equipment with new, state-of-the-art equipment and resource modifications. The new equipment will increase the productivity and efficiency of the power plant anddevelopment is expected to reduce maintenance costs per kWh. The Steamboat Hills power plant continues to sell its electricity under the current 25-year long term portfolio power purchase agreement with SCPPA, with 100% of the capacity going to the Los Angeles Department of Watergenerate 34 MW in 2025. MCG, a jointly owned company between Medco Power (51% equity share) and Power.
|
| •
| In April 2020, we announced the commercial operation of the Rabbit Hill Battery Energy Storage System ("BESS") facility, providing required ancillary servicesus (49% equity share), will develop and energy optimization to the wholesale markets managed by ERCOT. The facility is located in the City of Georgetown, Texas, and it is sized to provide approximately 10 MW of fast responding capacity to the ERCOT market.
|
| •
| In February 2020, we announced a transition of our senior management. Mr. Isaac Angel retired from his position as Chief Executive Officer a in July 1, 2020, after six years of service and became a member of Ormat’s Board of Directors and its chairman. Ormat’s Board of Directors has appointed Mr. Blachar as the Company’s Chief Executive Officer and Mr. Assaf Ginzburg as the Chief Financial Officer.
|
| •
| In January 2020, we signed two similar PPAs with Silicon Valley Clean Energy ("SVCE") and Monterey Bay Community Power ("MBCP"). Under the PPAs, SVCE and MBCP will each purchase 7 MW (for a total of 14 MW) of power generated by the expected 30 MW Casa Diablo-IV ("CD4") geothermal project located in Mammoth Lakes, California that is under construction. The PPAs are for a term of 10 years and have a fixed MWh price, which includes energy, capacity, environmental attributes, and all other ancillary benefits. The remaining 16 MW of generating capacity will be sold under an additional PPA with SCPPA, which was signed in early 2019. The CD4 power plant is expected to be on-line in Q1 2022, and will beoperate the first geothermal power plant built withinin East Java. We also signed a contract as a key contractor for the CAISO balancing authority in the last 30 yearsOrmat Energy Converter (“OEC") supply for this project and will be the first in Ormat’s portfolio that will sell its output to a Community Choice Aggregator.
|
COVID 19 Update
In March 2020, the World Health Organization declared the outbreak of the novel coronavirus ("COVID-19") a pandemic.
The Company implemented significant measures both to comply with government requirements and to preserve the health and safety of its employees. These measures include working remotely where possible and operating separate shifts in its power plants, manufacturing facilities and other locations while trying to continue operations as close to full capacity in all locations. During the year and subsequently, the Company's power plants, manufacturing facility and storage facilities have been operating at close to full capacity and there has been no material impact on our operations as a result of these measures. With respect to our employees, we have not laid-off or furloughed any employees due to the COVID-19 and continued to pay full salaries.
We experienced the following impacts on our segment operations:
| •
| In our Electricity segment, almost allsecured $32.1 million of our revenues in 2020 were generated under long term contracts and the majority have a fixed energy rate. As a result, despite logistical and other challenges, we experienced limited impact of COVID-19 on our Electricity segment. Nevertheless, we received two notices declaring a force majeure event in Kenya from KPLC and in Honduras from ENEE, both had an immaterial impact on our revenues and removed. In addition, we experienced a higher rate of curtailments during the first half of 2020 by KPLC in the Olkaria complex that was reduced in the second half of 2020. The impact of the curtailments is limited because of the structure of the PPA which secures the vast majority of our revenues with fixed capacity payments and is unrelated to the electricity actually generated (in 2019 and 2020, capacity payments represented 70.1% and 74.4% of our revenues, respectively). ENEE has initiated discussions with several IPPs, including Ormat, on potential changes in their existing PPAs. However, our Platanares geothermal power plant has one of the lowest rates of renewable energy in the country, and we expect this fact to have positive implications for our discussions with ENEE. In addition, our future growth in the Electricity segment is and would be adversely impacted by delays we are experiencing in receiving the required development and construction permits, as well as by the implications of global and local restrictions on our ability to procure raw materials and ship to our products. Furthermore, our future growth in the Electricity segment might be adversely impacted by a lack of funding for projects, a decrease in demand for electricity, delays in permitting and the implications of global and local restrictions on our ability to procure raw material and ship our products.
|
| •
| Our Product segment revenues are generated from sales of products and services pursuant to contracts, under which we have a right to payment for any product that was produced for the customer. Recognition of revenue under these contracts is impacted by delays in the progress of the third-party projects into which our products and services are incorporated. We experienced delays and significant cost increases in one of the projects in the Product segment that adversely impacted our results of operations during 2020. We had a product backlog of $33.4 million as of February 24, 2020, which includes revenues for the period between January 1, 2021 and February 24, 2020, compared to $141.9 million as of February 25, 2020. We believe that the decline in backlog resulted mainly from the impact of COVID-19 and the unwillingness of potential customers to enter into new commitments at this time. Nevertheless, for the reasons set out above, restrictions on travel and because our customers are deferring their decision to purchase, we expect that 2021 product segment revenues will be significantly lower than revenues of 2020.
|
| •
| Our Energy Storage segment generates revenues mainly from participating in the energy and ancillary services markets, run by regional transmission operators and independent system operators in the various markets where our assets operate. Therefore, the revenues these assets generate is directly impacted by the prevailing market prices for energy and/or ancillary services.
|
| •
| In addition, we experience delays in the permitting for new projects in all segments that may create penalties and cause a delay in those projects.
|
Despite our efforts to provide insight into the performance of our business and the trends affecting it, as of the date of this filing, significant uncertainty exists concerning the magnitude of the impact and duration of the COVID-19 pandemic. We may continue to become subject to any of the following impacts:
| •
| limitations on the ability of our suppliers to obtain raw materials that are required for the manufacturing of the products we either sell to third parties or build for ourselves or to meet delivery requirements and commitments that may result in penalty payments;
|
| •
| impact on our efforts to sign new contracts for our Product segment due to operational and travel restrictions and availability of our customers and their willingness to enter into new agreements;
|
| •
| limitations on the ability of our customers to pay us on a timely basis;
|
| •
| additional declarations of COVID-19 as force majeure by our customers and suppliers;
|
| •
| a reduction in the demand for electricity and for our products;
|
| •
| change in regulations, taxes and levies that may affect our operations and cost structure;
|
| •
| risk of infection among employees that may impact the day-to-day operations;
|
| •
| delays in obtaining the required permits that may create penalties and impact our ability to implement our growth plan;
|
| •
| limited ability to oversee remote operation due to travel restrictions.backlog.
|
Opportunities, Trends and Uncertainties
Different trends, factors and uncertainties may impact our operations and financial condition, including many that we do not or cannot foresee. However, we believe that our results of operations and financial condition for the foreseeable future will be primarily affected by the following trends, factors and uncertainties that are from time to time also subject to market cycles:
| | • | There has been increased demand for energy generated from geothermal and other renewable resources in the United States as costs for electricity generated from renewable resources have become more competitive. Much of this is attributable to legislative and regulatory requirements and incentives, such as state RPS and federal tax credits such as PTCs or ITCs (which are discussed in more detail in the section entitled “Government Grants and Tax Benefits” below). We believe that future demand for energy generated from geothermal and other renewable resources in the United States will be driven primarily by further commitment to, and implementation of, state RPS and greenhouse gas reduction initiatives. |
| | • | The U.S. federal government has taken, and we expect it to continue to take, certain actions which are supportive of the industry for climate solutions. In August 2022, the President of the United States signed into law the IRA of 2022. The IRA includes several tax incentives to promote climate change mitigation and clean energy, electric vehicles, battery and energy storage manufacture or purchase. The U.S. presidential administration has taken immediate steps at the federal level which we believe signify support for climate solutions, including, but not limited to, rejoining the Paris Climate Accords and re-establishing a social price on carbon used in cost/benefit analysis for policy making. We expect this new administration, combined with a closely divided Congress, will usher in additional regulations supportive of the markets in which we invest. |
| • | We expect that a variety of local governmental initiatives will create new opportunities for the development of new projects with the potential to realize higher returns on our equity as well as to create additional markets for our products. These initiatives include the award of long-term contracts to independent power generators, the creation of competitive wholesale markets for selling and trading energy, capacity and related energy products and the adoption of programs designed to encourage “clean” renewable and sustainable energy sources. |
| •
| In the Electricity segment, we expect intense domestic competition from the solar, hybrid solar and energy storage and wind power generation industries to continue and increase as well as increased competition from the solar combined with storage projects. While we believe the expected demand for renewable energy will be large enough to accommodate increased competition, any such increase in competition, including increasing amounts of renewable energy under contract as well as any further decline in natural gas prices attributable to increased production and reduction in energy storage costs are contributing to a reduction in electricity prices. However, despite increased competition from the solar and wind power generation industries, we believe that firm and flexible, base-load electricity, such as geothermal-based energy, will continue to be an important source of renewable energy in areas with commercially viable geothermal resources.
|
| | • | In the Product segment, we see new opportunities for business in New Zealand, Turkey, the U.S., Asia Pacific and Central and South America. In addition, a new tariff structure was recently introduced in Turkey, which we expect should increase demand for new development. The new tariff includes incentives for local manufacturing and we are currently evaluating the tariff and implication on us. We have experienced increased competition from binary power plant equipment suppliers including the major steam turbine manufacturers. While we believe that we have a distinct competitive advantage based on our technology, accumulated experience and current worldwide share of installed binary generation capacity, an increase in competition may impact our ability to secure new purchase orders from potential customers. The increased competition may also lead to further reductions in the prices that we are able to charge for our binary equipmentequipment. |
| • | In the markets in which we operate, particularly in the U.S, there have been higher rates of inflation over the last two years. While our U.S. contracts are not indexed to inflation, most of our international-based contracts are indexed to inflation. If inflation continues to increase in our markets, it may increase our expenses such that our profit margins could be adversely impacted. It may also increase the costs of some of our development projects that could negatively impact their competitiveness. |
| • | Macroeconomic trends may result in adverse impacts on our business, and we continue to monitor these potential impacts, including potential economic recession, changes in the Federal Reserve’s monetary policy, as well as geopolitical risks, including the Ukraine-Russia and Israel-Hamas wars and further escalations thereof. Such scenarios and uncertainties may affect, among others, our operations and may limit our ability to produce and sell our products, and support our Electricity segment. |
| | • | The average price per MWh, which is one of the metrics some investorsInterest rate increases for both short-term and long-term debt have increased sharply. Although our outstanding debt bears fixed interest rates, as we refinance it, or borrow additional amounts, we may use to evaluate power plant revenues, can fluctuate from period to period. Based on our Electricity segment, we earned, on average, $89.6 and $86.6 per MWh in 2020 and 2019, respectively. Oil and natural gas prices, together with other factors that affect our Electricity segment revenues, could cause changes in our average price per MWh in the future.incur additional interest expense versus expiring loans.
|
| •
| Turkey’s geothermal market is one of the fastest growing markets in the geothermal industry worldwide, mainly due to governmental and regulatory support. Turkey is ranked fourth globally with an installed geothermal capacity of over 1,600 MW. In 2020 we had less revenue exposure to the Turkish market, due to a slowdown in project development in that market, with further impacts from the COVID-19 outbreak. The continued deterioration in that Turkish economy, devaluation in the Turkish Lira and increase in local interest rates or a decline in government support for the development of geothermal power in the country could affect local demand for the geothermal equipment and services we provide, collection from our customers or the prices we may charge for such equipment and services. In February 2021, the incentive plan and regulation for renewable energy generation in Turkey was renewed and the updated FIT is lower than the previous one. This recent update and the economic status of the country lead us to estimate that the slowdown in development of new sites will continue. In addition, the impact of threatened or actual U.S. sanctions on the Turkish economy and the straining of U.S.-Turkey diplomatic relations may harm regional demand or price competitiveness for the geothermal equipment and services we provide in the Turkish market, in turn decreasing our Product segment profit margins, cash flows and financial condition. For the year ended December 31, 2020, we derived 9% and 44% of our Total revenues and Product revenues, respectively, from our Turkish operations. We are monitoring any change in the political and business environments that may affect our future business and operations in the country.
|
| •
| Ormat established a manufacturing facility in Turkey in order to locally produce several power plant components that entitle our customers to increased incentives under the renewable energy laws. The use of local equipment in renewable energy based generating facilities in Turkey entitles such facilities to significant benefits under Turkish law, provided such facilities have obtained an RER Certificate from EMRA, which requires the issuance of a local certificate. If we do not obtain the local certificate, then some of our customers under the relevant supply agreements in Turkey may not be issued a RER Certificate based on the equipment we supply to them, and we will be required to make a payment to such customers equal to the amount of the expected lost benefit.
|
Revenues
Sources of Revenues
We generate our revenues from the sale of electricity from our geothermal and recovered energy-based power plants; the design, manufacture and sale of equipment for electricity generation; the construction, installation and engineering of power plant equipment; and the sale of energy storage services and electricity from our operating energy storage facilities .facilities.
Electricity Segment. Revenues attributable to our Electricity segment are derived from the sale of electricity from our power plants pursuant to long-term PPAs. While approximately 98.2%87.9% of our Electricity revenues for the year ended December 31, 20202023 were derived from PPAs with fixed price components, and the balance fromwe have variable price PPAs in CaliforniaHawaii, which provide for payments based on the local utilities’ avoided cost. The avoided cost is the incremental cost that the power purchaser avoids by not having to generate such electrical energy itself or purchase it from others. In Hawaii, the prices paid for electricity pursuant to the 25 MW PPA for the Puna Complex in Hawaii change primarily as a result of variations in the price of oil as well as other commodities. In 2019, we signed a new PPA related to Puna with fixed prices, increased capacity and Hawaii. extended the term until 2052 that was approved recently by the PUC.
Accordingly, our revenues from thosethis power plantsplant may fluctuate.
Our Electricity segment revenues are also subject to seasonal variations, as more fully described in “Seasonality” below.
Our PPAs generally provide for energy payments alone, or energy and capacity payments. Generally, capacity payments are payments calculated based on the amount of time and capacity that our power plants are available to generate electricity. Some of our PPAs provide for bonus payments in the event that we are able to exceed certain capacity target levels and the potential forfeiture of payments if we fail to meet certain minimum capacity target levels. Energy payments, on the other hand, are payments calculated based on the amount of electrical energy delivered to the relevant power purchaser at a designated delivery point. Our moremost recent PPAs generally provide for energy payments alone with an obligation to compensate the off-taker for its incremental costs as a result of shortfalls in our supply.
Product Segment.Revenues attributable to our Product segment are based on the sale of equipment, engineering, procurement and construction contracts and the provision of various services to our customers. Product segment revenues fluctuate between periods, primarily based on our ability to receive customer orders, the status and timing of such orders, delivery of raw materials and the completion of manufacturing. Larger customer orders for our products are typically the result of our sales efforts, our participation in, and winning tenders or requests for proposals issued by potential customers in connection with projects they are developing and orders by returning customers. Such projects often take a significant amount of time to design and develop and are subject to various contingencies, such as the customer’s ability to raise the necessary financing for a project. Consequently, we are generally unable to predict the timing of such orders for our products and may not be able to replace existing orders that we have completed with new ones. As a result, revenues from our Product segment fluctuate (sometimes extensively) from period to period.
Energy Storage Segment.Revenues attributable to our Energy Storage segment are generated by several grid-connected BESS facilities that we own and operate from selling energy, capacity and/or ancillary services in merchant markets like PJM Interconnect, ISO New England, ERCOT and CAISO. The revenues fluctuate over time since a large portion of such revenues are generated in the merchant markets, where price volatility is inherent. We recently signed a second long-term tolling agreement that will secure fixed revenues for our Pomona 2 20MW/40MWh project that follows similar contracts for the Bottleneck 80MW/320MWh project, both in California.
We are pursuing the development of additional grid-connected BESS projects in multiple regions, with expected revenues coming from providing energy, capacity and/or ancillary services on a merchant basis, and/or through bilateral fixed contracts with load serving entities, investor owned utilities, publicly owned utilities and community choice aggregators. We alsoaim to balance merchant risk with long term tolling agreements and we may pursue financial instruments, where appropriate, to hedge some of the merchant risk.risk
our operating segments differently. In the case of our Electricity segment, when making decisions about potential acquisitions or the development of new projects, management typically focuses on the internal rate of return of the relevant investment, technical and geological matters and other business considerations. Management evaluates our operating power plants based on revenues, expenses, and EBITDA, and our projects that are under development based on costs attributable to each such project. Management evaluates the performance of our Product segment based on the timely delivery of our products, performance quality of our products, and revenues and costs actually incurred to complete customer orders compared to the costs originally budgeted for such orders. We evaluate Energy Storage segment performance similar to the Electricity segment with respect to projects that we own and operate.
The following table sets forth a breakdown of our revenues for the years indicated:
| | | Revenues | | % of Revenues for Period Indicated | | | Revenues | | | % of Revenues for Period Indicated | |
| | | Year Ended December 31, | | Year Ended December 31, | | | Year Ended December 31, | | Year Ended December 31, | |
| | | 2020 | | | 2019 | | | 2018 | | | 2020 | | | 2019 | | | 2018 | | | 2023 | | | 2022 | | | 2021 | | | 2023 | | | 2022 | | | 2021 | |
| | (Dollars in thousands) | | | | | | | | | | | | | | (Dollars in thousands) | | | | | | | | | | | | |
| Revenues: | | | | | | | | | | | | | | | | | | | | | | |
Electricity | | $ | 541,393 | | | $ | 540,333 | | | $ | 509,879 | | | 76.8 | % | | 72.4 | % | | 70.9 | % | | $ | 666,767 | | | $ | 631,727 | | | $ | 585,771 | | | 80.4 | % | | 86.0 | % | | 88.3 | % |
Product | | 148,125 | | | 191,009 | | | 201,743 | | | 21.0 | | | 25.6 | | | 28.0 | | | 133,763 | | | 71,414 | | | 46,920 | | | 16.1 | | | 9.7 | | | 7.1 | |
Energy Storage | | | 15,824 | | | | 14,702 | | | | 7,645 | | | | 2.2 | | | | 2.0 | | | | 1.1 | | | | 28,894 | | | | 31,018 | | | | 30,393 | | | | 3.5 | | | | 4.2 | | | | 4.6 | |
Total revenues | | $ | 705,342 | | | $ | 746,044 | | | $ | 719,267 | | | | 100.0 | % | | | 100.0 | % | | | 100.0 | % | | $ | 829,424 | | | $ | 734,159 | | | $ | 663,084 | | | | 100.0 | % | | | 100.0 | % | | | 100.0 | % |
Geographic Breakdown of Results of Operations
The following table sets forth the geographic breakdown of the revenues attributable to our Electricity, Product and Energy Storage segments for the years indicated:
| | | Revenues | | % of Revenues for Period Indicated | | | Revenues | | | % of Revenues for Period Indicated | |
| | | Year Ended December 31, | | Year Ended December 31, | | | Year Ended December 31, | | | Year Ended December 31, | |
| | | 2020 | | | 2019 | | | 2018 | | | 2020 | | | 2019 | | | 2018 | | | 2023 | | | 2022 | | | 2021 | | | 2023 | | | 2022 | | | 2021 | |
| | (Dollars in thousands) | | | | | | | | | | | | | | (Dollars in thousands) | | | | | | | | | | | | |
| Electricity Segment: | | | | | | | | | | | | | | | | | | | | | | | | | | | | | | | | | | | | | | | | | | |
United States | | $ | 341,399 | | | $ | 333,797 | | | $ | 305,962 | | | 63.1 | % | | 61.8 | % | | 60.0 | % | | $ | 473,323 | | | $ | 446,000 | | | $ | 404,303 | | | 71.0 | % | | 70.6 | % | | 69.0 | % |
International | | | 199,994 | | | | 206,536 | | | | 203,917 | | | | 36.9 | | | | 38.2 | | | | 40.0 | | | | 193,444 | | | | 185,727 | | | | 181,468 | | | | 29.0 | | | | 29.4 | | | | 31.0 | |
Total | | $ | 541,393 | | | $ | 540,333 | | | $ | 509,879 | | | | 100.0 | % | | | 100.0 | % | | | 100.0 | % | | $ | 666,767 | | | $ | 631,727 | | | $ | 585,771 | | | | 100.0 | % | | | 100.0 | % | | | 100.0 | % |
| | | |
Product Segment: | | | | | | | | | | | | | | |
United States | | $ | 5,800 | | | $ | 30,562 | | | $ | 14,999 | | | 3.9 | % | | 16.0 | % | | 7.4 | % | | $ | 7,610 | | | $ | 7,037 | | | $ | 5,414 | | | 5.7 | % | | 9.9 | % | | 11.5 | % |
International | | | 142,325 | | | | 160,447 | | | | 186,744 | | | | 96.1 | | | | 84.0 | | | | 92.6 | | | | 126,153 | | | | 64,377 | | | | 41,506 | | | | 94.3 | | | | 90.1 | | | | 88.5 | |
Total | | $ | 148,125 | | | $ | 191,009 | | | $ | 201,743 | | | | 100.0 | % | | | 100.0 | % | | | 100.0 | % | | $ | 133,763 | | | $ | 71,414 | | | $ | 46,920 | | | | 100.0 | % | | | 100.0 | % | | | 100.0 | % |
| | | |
Energy Storage Segment: | | | | | | | | | | | | | | |
United States | | $ | 15,824 | | | $ | 13,597 | | | $ | 7,645 | | | 100.0 | % | | 92.5 | % | | 100.0 | % | | $ | 28,894 | | | $ | 31,018 | | | $ | 30,393 | | | 100.0 | % | | 100.0 | % | | 100.0 | % |
International | | | — | | | | 1,105 | | | | — | | | | 0.0 | | | | 7.5 | | | | 0.0 | | | | — | | | | — | | | | — | | | | — | | | | — | | | | — | |
Total | | $ | 15,824 | | | $ | 14,702 | | | $ | 7,645 | | | | 100.0 | % | | | 100.0 | % | | | 100.0 | % | | $ | 28,894 | | | $ | 31,018 | | | $ | 30,393 | | | | 100.0 | % | | | 100.0 | % | | | 100.0 | % |
In 2020, 20192023, 2022 and 2018, 49%2021, 39%, 49%34% and 54%34% of our total revenues were derived from international operations of all 3 segments combined,foreign locations, respectively, and our internationalforeign operations were more profitablehad higher gross margins than our U.S. operations in each of those years. A substantial portion of international revenues came from Kenya and Turkey and, to a lesser extent, from Honduras, Guadeloupe, Guatemala and other countries. Our operations in Kenya contributed disproportionately to gross profit and net income. The contribution to combined pre-tax income of our domestic and foreign operations within our Electricity segment and Product segment differ in a number of ways.
Electricity Segment. Our Electricity segment domestic revenues were approximately 63%71%, 62%71% and 60%69% of our total Electricity segment for the years ended December 31, 2020, 20192023, 2022 and 2018,2021, respectively. However, domestic operations in our Electricity segment have higher costs of revenues and expenses than theour foreign operations in our Electricity segment.operations. Our foreign power plants are located in lower-cost regions, like Kenya, Guatemala, Honduras and Guadeloupe, which favorably impact payroll, and maintenance expenses among other items. TheyOur power plants in foreign locations are also newer than most of our domestic power plants and therefore tend to have lower maintenance costs and higher availability factors than our domestic power plants. Consequently, in 20202023 and 2022, the international operations of the segment accounted for 51%44% and 43% of our total gross profits, 70%63% and 72% of our net income (assuming the majority of corporate operating expenses and 45%financing are recorded under domestic jurisdiction) and 36% and 36% of our EBITDA. However, financing costs related to the international projects are higher than financing costs related to our domestic activity.EBITDA, respectively.
Product Segment. Our Product segment foreign revenues were 96%94%, 84%90% and 93%88% of our total Product segment revenues for the years ended December 31, 2020, 20192023, 2022 and 2018,2021, respectively.
Energy Storage Segment. Our Product segment foreign activity also benefits from lower costs of revenues and expenses than ProductEnergy Storage segment domestic activity such as laborrevenues were 100.0% of our total Energy storage segment revenues for years ended December 31, 2023, 2022 and transportation costs. Accordingly, our Product segment foreign activity contributes more than our Product segment domestic activity to our pre-tax income from operations.2021, respectively.
Seasonality
Electricity generation from some of our geothermal power plants is subject to seasonal variations; in the winter, our power plants produce more energy primarily attributable to the lower ambient temperature, which has a favorable impact on the energy component of our Electricity segment revenues andas the prices under many of our contracts are fixed throughout the year with no time-of-use impact. The prices paid for electricity under the PPAs for the Heber 2 power plant in the Heber Complex, the Mammoth Complex and the North Brawley power plant in California, the Raft River power plant in Idaho, and the Neal Hot Springs power plant in Oregon and the recently acquired Dixie Valley power plant in Nevada, are higher in the months of June through September. The higher payments payable under these PPAs in the summer months partially offset the negative impact on our revenues from lower generation in the summer attributable to a higher ambient temperature. As a result, we expect the revenues and gross profit in the winter months to be higher than the revenues and gross profit in the summer months.months and in general we expect the first and fourth quarters to generate higher revenues than the second and third quarters.
Breakdown of Cost of Revenues
Electricity Segment
The principal cost of revenues attributable to our operating power plants are operation and maintenance expenses comprised of salaries and related employee benefits, equipment expenses, costs of parts and chemicals, costs related to third-party services, lease expenses, royalties, startup and auxiliary electricity purchases, property taxes, insurance, depreciation and amortization and, for some of our projects, purchases of make-up water for use in our cooling towers. In our California power plants, our principal cost of revenues also includes transmission charges and scheduling charges. In some of our Nevada power plants we also incur transmission and wheeling charges. Some of these expenses, such as parts, third-party services and major maintenance, are not incurred on a regular basis. This results in fluctuations in our expenses and our results of operations for individual power plants from quarter to quarter. Payments made to government agencies and private entities on account of site leases where power plants are located are included in cost of revenues. Royalty payments, included in cost of revenues, are made as compensation for the right to use certain geothermal resources and are paid as a percentage of the revenues derived from the associated geothermal rights. Royalties constituted approximately 3.8%4.6% and 4.1%4.8% of Electricity segment revenues for the years ended December 31, 20202023 and 2019,2022, respectively.
Product Segment
The principal cost of revenues attributable to our Product segment are materials, salaries and related employee benefits, expenses related to subcontracting activities, and transportation expenses. Sales commissions to sales representatives are included in selling and marketing expenses. Some of the principal expenses attributable to our Product segment, such as a portion of the costs related to labor, utilities and other support services are fixed, while others, such as materials, construction, transportation and sales commissions, are variable and may fluctuate significantly, depending on market conditions. As a result, the cost of revenues attributable to our Product segment, expressed as a percentage of total revenues, fluctuates. Another reason for such fluctuation is that in responding to bids for our products, we price our products and services in relation to existing competition and other prevailing market conditions, which may vary substantially from order to order.
Energy Storage Segment
The principal cost of revenues attributable to our Energy Storage segment are direct costs attributable to providing services to our customers, direct costs associated with software development andof the direct cost of BESS that we own. Direct costs include labor costs of our network operations center, the labor of software development effort and the labor associated with operations and maintenance of owned BESS. Cost of revenues attributable to our Energy Storage segment also include cost of equipment sold to customers in delivering our automated demand response and software services at a customer’s location.
Critical Accounting Estimates and Assumptions
Our significant accounting policies are more fully described in Note 1 to our consolidated financial statements set forth in Item 8 of this annual report.Annual Report. However, certain of our accounting policies are particularly important to an understanding of our financial position and results of operations. In applying these critical accounting estimates and assumptions, our management uses its judgment to determine the appropriate assumptions to be used in making certain estimates. Such estimates are based on management’s historical experience, the terms of existing contracts, management’s observance of trends in the geothermal industry, information provided by our customers and information available to management from other outside sources, as appropriate. Such estimates are subject to an inherent degree of uncertainty and, as a result, actual results could differ from our estimates. Our critical accounting policies include:
| | • | Revenues and Cost of Revenues. Revenues generated from the construction of geothermal and recovered energy-based power plant equipment and other equipment on behalf of third parties (Product revenues) are recognized using the percentage of completion method, which requires estimates of future costs over the full term of product delivery. Such cost estimates are made by management based on prior operations and specific project characteristics and designs. If management’s estimates of total estimated costs with respect to our Product segment are inaccurate, then the percentage of completion is inaccurate resulting in an over- or under-estimate of revenue and gross margins.margin. As a result, we review and update our cost estimates on significant contracts on a quarterly basis, and at least on an annual basis for all others, or when circumstances change and warrant a modification to a previous estimate. Changes in job performance, job conditions, and estimated profitability, including those arising from the application of penalty provisions in relevant contracts and final contract settlements, may result in revisions to costs and revenues and are recognized in the period in which the revisions are determined. Provisions for estimated losses relating to contracts are made in the period in which such losses are determined. Revenues generated from engineering and operating services and sales of products and parts are recorded once the service is provided or product delivery is made,delivered as the customer obtains control of the asset, as applicable. |
| | • | Property, Plant and Equipment. We capitalize all costs associated with the acquisition, development and construction of power plant facilities. Major improvements are capitalized and repairs and maintenance (including major maintenance) costs are expensed. We estimate the useful life of our power plants to range between 2515 and 30 years. Such estimates are made by management based on factors such as prior operations, the terms of the underlying PPAs, geothermal resources, the location of the assets and specific power plant characteristics and designs. Changes in such estimates could result in useful lives which are either longer or shorter than the depreciable lives of such assets. We periodically re-evaluate the estimated useful life of our power plants and revise the remaining depreciable life on a prospective basis. |
We capitalize costs incurred in connection with the exploration and development of geothermal resources beginning when we acquire land rights to the potential geothermal resource. Prior to acquiring land rights, we make an initial assessment that an economically feasible geothermal reservoir is probable on that land using available data and external assessments vetted through our exploration department and occasionally outside service providers. Costs incurred prior to acquiring land rights are expensed. It normally takes two to three years from the time we start active exploration of a particular geothermal resource to the time we have an operating production well, assuming we conclude the resource is commercially viable.
In most cases, we obtain the right to conduct our geothermal development and operations on land owned by the BLM, various states or with private parties. In consideration for certain of these leases, we may pay an up-front non-refundable bonus payment which is a component of the competitive lease process. This payment and other related costs are capitalized and included in construction-in-process. Once we acquire land rights to the potential geothermal resource, we perform additional activities to assess the commercial viability of the resource. Such activities include, among others, conducting surveys and other analysis, obtaining drilling permits, creating access roads to drilling sites, and exploratory drilling which may include temperature gradient holes and/or slim holes. Such costs are capitalized and included in construction-in-process. Once our exploration activities are complete, we finalize our assessment as to the commercial viability of the geothermal resource and either proceed to the construction phase for a power plant or abandon the site. If we decide to abandon a site, all previously capitalized costs associated with the exploration project are written off.
Our assessment of economic viability of an exploration project involves significant management judgment and uncertainties as to whether a commercially viable resource exists at the time we acquire land rights and begin to capitalize such costs. As a result, it is possible that our initial assessment of a geothermal resource may be incorrect and we will have to write off costs associated with the project that were previously capitalized. Due to the uncertainties inherent in geothermal exploration, historical impairments may not be indicative of future impairments. Included in construction-in-process are costs related to projects in exploration and development of $51.5$162.5 million and $84.6$95.3 million at December 31, 20202023 and 2019,2022, respectively. Included in these amounts at December 31, 2020 and 2019, respectively, are $5.3 million and $17.0 million, respectively, which relate to up-front bonus payments.
| | • | Impairment of Long-Lived Assets and Long-Lived Assets to be Disposed of. We evaluate long-lived assets, such as property, plant and equipment and construction-in-process for impairment whenever events or changes in circumstances indicate that the carrying amount of an asset may not be recoverable. Factors which could trigger an impairment include, among others, significant underperformance relative to historical or projected future operating results, significant changes in our use of assets or our overall business strategy, negative industry or economic trends, a determination that an exploration project will not support commercial operations, a determination that a suspended project is not likely to be completed, a significant increase in costs necessary to complete a project, legal factors relating to our business or when we conclude that it is more likely than not that an asset will be disposed of or sold. |
We test our operating plants that are operated together as a complex for impairment at the complex level because the cash flows of such plants result from significant shared operating activities. For example, the operating power plants in a complex are managed under a combined operation management generally with one central control room that controls all of the power plants in a complex and one maintenance group that services all of the power plants in a complex. As a result, the cash flows from individual plants within a complex are not largely independent of the cash flows of other plants within the complex. We test for impairment of our operating plants which are not operated as a complex, as well as our projects under exploration, development or construction that are not part of an existing complex, at the plant or project level. To the extent an operating plant becomes part of a complex in the future, we will test for impairment at the complex level.
Recoverability of assets to be held and used is measured by a comparison of the carrying amount of an asset to the estimated future net undiscounted cash flows expected to be generated by the asset. The significant assumptions that we use in estimating our undiscounted future cash flows include (i) projected generating capacity of the power plant and rates to be received under the respective PPA and (ii) projected operating expenses of the relevant power plant. Estimates of future cash flows used to test recoverability of a long-lived asset under development also include cash flows associated with all future expenditures necessary to develop the asset. If future cash flows are actually less than the assumptions wethose used in such estimates, we may incur impairment losses in the future that could be material to our financial condition and/or results of operations.
If our assets are considered to be impaired, the impairment to be recognized is the amount by which the carrying amount of the assets exceeds their fair value. Assets to be disposed of are reported at the lower of the carrying amount or fair value less costs to sell. We believe that for the year ended December 31, 2020,2023, no impairment exists for any of our long-lived assets; however, estimates as to the recoverability of such assets may change based on revised circumstances. Estimates of the fair value of assets require estimating useful lives and selecting a discount rate that reflects the risk inherent in future cash flows.
| | • | Goodwill. Goodwill represents the excess of the fair value of consideration transferred in the business combination transactions over the fair value of tangible and intangible assets acquired, net of the fair value of liabilities assumed and the fair value of any noncontrolling interest in the acquisitions. Goodwill is not amortized but rather subject to a periodic impairment testing on an annual basis, (onwhich the Company performs on December 31 of each year)year, or if an event occurs or circumstances change that would more likely than not reduce the fair value of the reporting unit below its carrying amount. Additionally, we areit is permitted to first assess qualitative factors to determine whether a quantitative goodwill impairment test is necessary. Further testing is only required if the entity determines, based on the qualitative assessment, that it is more likely than not that a reporting unit’s fair value is less than its carrying amount. Otherwise, no further impairment testing is required. An entity has the option to bypass the qualitative assessment for any reporting unit in any period and proceed directly to step one of the quantitative goodwill impairment test. This would not preclude the entity from performing the qualitative assessment in any subsequent period. The first stepquantitative assessment compares the fair value of the reporting unit to its carrying value, including goodwill. In January 2017, the FASB issuedUnder ASU 2017-04, Intangibles – Goodwill and Other (Topic 350), which was adopted by us in 2018, under which step two of the goodwill impairment test was eliminated. Step two measured a goodwill impairment test by comparing the implied fair value of the reporting unit’s goodwill with the carrying amount of that goodwill. Under ASU 2017-04, Intangibles – Goodwill and Other, an entity should recognize an impairment charge for the amount by which the carrying amount of the reporting unit exceeds its fair value as calculated under step one described above.value. However, the loss recognized should not exceed the total amount of goodwill allocated to that reporting unit. |
| | • | Obligations Associated with the Retirement of Long-Lived Assets. We record the fair market value of legal liabilities related to the retirement of our assets in the period in which such liabilities are incurred. These liabilities include our obligation to plug wells upon termination of our operating activities, the dismantling of our power plants upon cessation of our operations, and the performance of certain remedial measures related to the land on which such operations were conducted. When a new liability for an asset retirement obligation is recorded, we capitalize the costs of such liability by increasing the carrying amount of the related long-lived asset. Such liability is accreted to its present value each period and the capitalized cost is depreciated over the useful life of the related asset. At retirement, we either settle the obligation for its recorded amount or report either a gain or a loss with respect thereto. Estimates of the costs associated with asset retirement obligations are based on factors such as prior operations, the location of the assets and specific power plant characteristics. We review and update our cost estimates periodically and adjust our asset retirement obligations in the period in which the revisions are determined. If actual results are not consistent with our assumptions used in estimating our asset retirement obligations, we may incur additional losses that could be material to our financial condition or results of operations. |
| | • | Accounting for Income Taxes.Taxes. Significant estimates are required to arrive at our consolidated income tax provision. This process requires us to estimate our actual current tax exposure and to make an assessment of temporary differences resulting from differingdifferent treatments of items for tax and accounting purposes. Such differences result in deferred tax assets and liabilities which are included in our consolidated balance sheets. For those jurisdictions where the projected operating results indicate that realization of our net deferred tax assets is not more likely than not, a valuation allowance is recorded. |
We evaluate our ability to utilize the deferred tax assets quarterly and assess the need for a valuation allowance. In assessing the need for a valuation allowance, we estimate future taxable income, including the impacts of the enacted tax law, the feasibility of ongoing tax planning strategies and the realizability of tax credits and tax loss carryforwards. Valuation allowances related to deferred tax assets can be affected by changes in tax laws, statutory tax rates, and future taxable income. We have recorded a partial valuation allowance related to our U.S. deferred tax assets. In the future, if there is sufficientinsufficient evidence that we will be able to generate sufficient future taxable income in the United States, we may be required to reduce thisrecord a valuation allowance, resulting in income tax benefitsloss in our consolidated statementConsolidated Statement of operations.Operations.
In the ordinary course of business, there can be inherent uncertainty in quantifying our income tax positions. We assess our income tax positions and record tax benefits for all years subject to examination based upon management’s evaluation of the facts, circumstances and information available at the reporting date. For those tax positions where it is more likely than not that a tax benefit will be sustained, which is greater than 50% likelihood of being realized upon ultimate settlement with a taxing authority that has full knowledge of all relevant information, we recognize between 0 to 100% of the tax benefit. For those income tax positions where it is not more likely than not that a tax benefit will be sustained, we do not recognize any tax benefit in the consolidated financial statements. Resolution of uncertainties in a manner inconsistent with our expectations could have a material impact on our financial condition or results of operations.
New Accounting Pronouncements
See Note 1 to our consolidated financial statements set forth in Item 8 of this annual reportAnnual Report for information regarding new accounting pronouncements.
Results of Operations
Our historical operating results in dollars and as a percentage of total revenues are presented below.
| | | Year Ended December 31, | | | Year Ended December 31, | |
| | | 2020 | | | 2019 | | | 2018 | | | 2023 | | | 2022 | | | 2021 | |
| | | (Dollars in thousands, except per share data) | | | (Dollars in thousands, except earnings per share data) | |
Revenues: | | | | | | | | | | | | | | | | | | |
Electricity | | $ | 541,393 | | | $ | 540,333 | | | $ | 509,879 | | | $ | 666,767 | | | $ | 631,727 | | | $ | 585,771 | |
Product | | 148,125 | | | 191,009 | | | 201,743 | | | 133,763 | | | 71,414 | | | 46,920 | |
Energy storage | | | 15,824 | | | | 14,702 | | | | 7,645 | | | | 28,894 | | | | 31,018 | | | | 30,393 | |
Total revenues | | | 705,342 | | | | 746,044 | | | | 719,267 | | | | 829,424 | | | | 734,159 | | | | 663,084 | |
Cost of revenues: | | | | | | | | | | | | | | | | | | |
Electricity | | 300,059 | | | 312,835 | | | 298,255 | | | 422,549 | | | 380,361 | | | 337,019 | |
Product | | 114,948 | | | 145,974 | | | 140,697 | | | 115,802 | | | 60,479 | | | 41,374 | |
Energy storage | | | 14,060 | | | | 17,912 | | | | 9,880 | | | | 27,055 | | | | 24,495 | | | | 20,353 | |
Total cost of revenues | | | 429,067 | | | | 476,721 | | | | 448,832 | | | | 565,406 | | | | 465,335 | | | | 398,746 | |
Gross profit (loss) | | | | | | | | | | | | | | | | | | |
Electricity | | 241,334 | | | 227,498 | | | 211,624 | | | 244,218 | | | 251,366 | | | 248,752 | |
Product | | 33,177 | | | 45,035 | | | 61,046 | | | 17,961 | | | 10,935 | | | 5,546 | |
Energy storage | | | 1,764 | | | | (3,210 | ) | | | (2,235 | ) | | | 1,839 | | | | 6,523 | | | | 10,040 | |
Total gross profit | | 276,275 | | | 269,323 | | | 270,435 | | | 264,018 | | | 268,824 | | | 264,338 | |
Operating expenses: | | | | | | | | | | | | | | | | | | |
Research and development expenses | | 5,395 | | | 4,647 | | | 4,183 | | | 7,215 | | | 5,078 | | | 4,129 | |
Selling and marketing expenses | | 17,384 | | | 15,047 | | | 19,802 | | | 18,306 | | | 16,193 | | | 15,199 | |
General and administrative expenses | | 60,226 | | | 55,833 | | | 47,750 | | | 68,179 | | | 61,274 | | | 75,901 | |
Impairment charge | | — | | | — | | | 13,464 | | |
Impairment of long-lived assets | | | — | | | 32,648 | | | — | |
Write-off of unsuccessful exploration activities | | — | | | — | | | 126 | | | 3,733 | | | 828 | | | — | |
Business interruption insurance income | | | (20,743 | ) | | | — | | | | — | | | | — | | | | — | | | | (248 | ) |
Operating income | | 214,013 | | | 193,796 | | | 185,110 | | | 166,585 | | | 152,803 | | | 169,357 | |
Other income (expense): | | | | | | | | | | | | | | | | | | |
Interest income | | 1,717 | | | 1,515 | | | 974 | | | 11,983 | | | 3,417 | | | 2,124 | |
Interest expense, net | | (77,953 | ) | | (80,384 | ) | | (70,924 | ) | | (98,881 | ) | | (87,743 | ) | | (82,658 | ) |
Derivatives and foreign currency transaction gains (losses) | | 3,802 | | | 624 | | | (4,761 | ) | | (3,278 | ) | | (6,044 | ) | | (14,720 | ) |
Income attributable to sale of tax benefits | | 25,720 | | | 20,872 | | | 19,003 | | | 61,157 | | | 33,885 | | | 29,582 | |
Other non-operating income (expense), net | | | 1,418 | | | | 880 | | | | 7,779 | | | | 1,519 | | | | (709 | ) | | | (134 | ) |
Income from operations before income tax and equity in earnings (losses) of investees | | 168,717 | | | 137,303 | | | 137,181 | | | 139,085 | | | 95,609 | | | 103,551 | |
Income tax (provision) benefit | | (67,003 | ) | | (45,613 | ) | | (34,733 | ) | | (5,983 | ) | | (14,742 | ) | | (24,850 | ) |
Equity in earnings (losses) of investees, net | | | 92 | | | | 1,853 | | | | 7,663 | | |
Equity in earnings (losses) of investees | | | | 35 | | | | (3,072 | ) | | | (2,624 | ) |
Net Income | | 101,806 | | | 93,543 | | | 110,111 | | | 133,137 | | | 77,795 | | | 76,077 | |
Net income attributable to noncontrolling interest | | | (16,350 | ) | | | (5,448 | ) | | | (12,145 | ) | | | (8,738 | ) | | | (11,954 | ) | | | (13,985 | ) |
Net income attributable to the Company's stockholders | | $ | 85,456 | | | $ | 88,095 | | | $ | 97,966 | | | $ | 124,399 | | | $ | 65,841 | | | $ | 62,092 | |
Earnings per share attributable to the Company's stockholders: | | | | | | | | |
Basic: | | $ | 1.66 | | | $ | 1.73 | | | $ | 1.93 | | | $ | 2.09 | | | $ | 1.17 | | | $ | 1.11 | |
Diluted: | | $ | 1.65 | | | $ | 1.72 | | | $ | 1.92 | | | $ | 2.08 | | | $ | 1.17 | | | $ | 1.10 | |
Weighted average number of shares used in computation of earnings per share attributable to the Company's stockholders: | | | | | | | | |
Basic | | | 51,567 | | | | 50,867 | | | | 50,643 | | | | 59,424 | | | | 56,063 | | | | 56,004 | |
Diluted | | | 51,937 | | | | 51,227 | | | | 50,969 | | | | 59,762 | | | | 56,503 | | | | 56,402 | |
Results as a percentage of revenues
| | | Year Ended December 31, | | | Year Ended December 31, | |
| | | 2020 | | | 2019 | | | 2018 | | | 2023 | | | 2022 | | | 2021 | |
Revenues: | | | | | | | | | | | | | | | | | | |
Electricity | | 76.8 | % | | 72.4 | % | | 70.9 | % | | 80.4 | % | | 86.0 | % | | 88.3 | % |
Product | | 21.0 | | | 25.6 | | | 28.0 | | | 16.1 | | | 9.7 | | | 7.1 | |
Energy storage | | | 2.2 | | | | 2.0 | | | | 1.1 | | | | 3.5 | | | | 4.2 | | | | 4.6 | |
Total revenues | | | 100.0 | | | | 100.0 | | | | 100.0 | | | | 100.0 | | | | 100.0 | | | | 100.0 | |
Cost of revenues: | | | | | | | | | | | | | | | | | | |
Electricity | | 55.4 | | | 57.9 | | | 58.5 | | | 63.4 | | | 60.2 | | | 57.5 | |
Product | | 77.6 | | | 76.4 | | | 69.7 | | | 86.6 | | | 84.7 | | | 88.2 | |
Energy storage | | | 88.9 | | | | 121.8 | | | | 129.2 | | | | 93.6 | | | | 79.0 | | | | 67.0 | |
Total cost of revenues | | | 60.8 | | | | 63.9 | | | | 62.4 | | | | 68.2 | | | | 63.4 | | | | 60.1 | |
Gross profit (loss) | | | | | | | | | | | | | | | | | | |
Electricity | | 44.6 | | | 42.1 | | | 41.5 | | | 36.6 | | | 39.8 | | | 42.5 | |
Product | | 22.4 | | | 23.6 | | | 30.3 | | | 13.4 | | | 15.3 | | | 11.8 | |
Energy storage | | | 11.1 | | | | (21.8 | ) | | | (29.2 | ) | | | 6.4 | | | | 21.0 | | | | 33.0 | |
Total gross profit | | 39.2 | | | 36.1 | | | 37.6 | | | 31.8 | | | 36.6 | | | 39.9 | |
Operating expenses: | | | | | | | | | | | | | | | | | | |
Research and development expenses | | 0.8 | | | 0.6 | | | 0.6 | | | 0.9 | | | 0.7 | | | 0.6 | |
Selling and marketing expenses | | 2.5 | | | 2.0 | | | 2.8 | | | 2.2 | | | 2.2 | | | 2.3 | |
General and administrative expenses | | 8.5 | | | 7.5 | | | 6.6 | | | 8.2 | | | 8.3 | | | 11.4 | |
Impairment charge | | 0.0 | | | 0.0 | | | 1.9 | | | 0.0 | | | 4.4 | | | 0.0 | |
Write-off of unsuccessful exploration activities | | | 0.5 | | | 0.1 | | | 0.0 | |
Business interruption insurance income | | | (2.9 | ) | | | 0.0 | | | | 0.0 | | | | 0.0 | | | | 0.0 | | | | 0.0 | |
Operating income | | 30.3 | | | 26.0 | | | 25.7 | | | 20.1 | | 20.8 | | | 25.5 | |
Other income (expense): | | | | | | | | | | | | | | | | | | |
Interest income | | 0.2 | | | 0.2 | | | 0.1 | | | 1.4 | | | 0.5 | | | 0.3 | |
Interest expense, net | | (11.1 | ) | | (10.8 | ) | | (9.9 | ) | | (11.9 | ) | | (12.0 | ) | | (12.5 | ) |
Derivatives and foreign currency transaction gains (losses) | | 0.5 | | | 0.1 | | | (0.7 | ) | | (0.4 | ) | | (0.8 | ) | | (2.2 | ) |
Income attributable to sale of tax benefits | | 3.6 | | | 2.8 | | | 2.6 | | | 7.4 | | | 4.6 | | | 4.5 | |
Other non-operating income (expense), net | | | 0.2 | | | | 0.1 | | | | 1.1 | | | | 0.2 | | | | (0.1 | ) | | | — | |
Income from continuing operations before income tax and equity in earnings (losses) of investees | | 23.9 | | | 18.4 | | | 19.1 | | | 16.8 | | | 13.0 | | | 15.6 | |
Income tax (provision) benefit | | (9.5 | ) | | (6.1 | ) | | (4.8 | ) | | (0.7 | ) | | (2.0 | ) | | (3.7 | ) |
Equity in earnings (losses) of investees, net | | | 0.0 | | | | 0.2 | | | | 1.1 | | |
Equity in earnings (losses) of investees | | | | 0.0 | | | | (0.4 | ) | | | (0.4 | ) |
Net Income | | 14.4 | | | 12.5 | | | 15.3 | | | 16.1 | | | 10.6 | | | 11.5 | |
Net income attributable to noncontrolling interest | | | (2.3 | ) | | | (0.7 | ) | | | (1.7 | ) | | | (1.1 | ) | | | (1.6 | ) | | | (2.1 | ) |
Net income attributable to the Company's stockholders | | | 12.1 | % | | | 11.8 | % | | | 13.6 | % | | | 15.0 | % | | | 9.0 | % | | | 9.4 | % |
Comparison of the year ended December 31, 2022 and the year ended December 31, 2021
A discussion of changes in our results of operations in 2022 compared to 2021 has been omitted from this Form10-K, but may be found in “Item 7. Management's Discussion and Analysis of Financial Condition and Results of Operations” of our Form 10-K for the fiscal year ended December 31, 2022, filed with the SEC on February 24, 2023, which is incorporated by reference herein. This Form 10-K for the fiscal year ended December 31, 2022 is available free of charge on the SECs website at www.sec.gov and at www.Ormat.com, by clicking “Investors” located at the top of the home page.
Comparison of the Year Ended December 31, 20202023 and the Year Ended December 31, 20192022
Total Revenues
| | | Year Ended December 31, 2020 | | | Year Ended December 31, 2019 | | | Increase (Decrease) | | | Year Ended December 31, 2023 | | | Year Ended December 31, 2022 | | | Increase (Decrease) | |
| | | (Dollars in millions) | | | | | | (Dollars in millions) | | | | |
Electricity segment revenues | | $ | 541.4 | | | $ | 540.3 | | | $ | 1.1 | | | 0.2 | % | | $ | 666.8 | | | $ | 631.7 | | | $ | 35.0 | | | 5.5 | % |
Product segment revenues | | 148.1 | | | 191.0 | | | (42.9 | ) | | (22.5 | ) | | 133.8 | | | 71.4 | | | 62.3 | | | 87.3 | |
Energy Storage segment revenues | | | 15.8 | | | | 14.7 | | | | 1.1 | | | | 7.6 | | | | 28.9 | | | | 31.0 | | | | (2.1 | ) | | | (6.8 | ) |
Total Revenues | | $ | 705.3 | | | $ | 746.0 | | | $ | (40.7 | ) | | | (5.5 | )% | | $ | 829.4 | | | $ | 734.2 | | | $ | 95.2 | | | | 13.0 | % |
Total revenues forFor the year ended December 31, 2020 were $705.32023, our total revenues increased by 13.0% from $734.2 million comparedin 2022 to $746.0$829.4 million for the year ended December 31, 2019, which represented a 5% decrease from the prior year period. This decrease was attributable to a $42.9 million or 22% decrease in our Product segment revenues compared to the corresponding period in 2019, as discussed below. The decrease was partially offset by a slight increase in our Electricity segment revenues and Energy Storage segment revenues.2023.
Electricity Segment
Revenues attributable to our Electricity segment for the year ended December 31, 20202023 were $541.4$666.8 million, compared to $540.3$631.7 million for the year ended December 31, 2019,2022, representing a 0.2%5.5% increase. This increase fromwas mainly due to (i) $8.9 million related to the prior period.CD4 power plant which started commercial operation in July 2022; (ii) $8.8 million related to the North Valley power plant which started commercial operations in April 2023; (iii) $9.4 million related to the Heber 1 power plant which resumed operations in May 2023 after a temporary shutdown due to a fire incident that occurred in February 2022; (iv) $3.8 million related to the Tungsten 2 power plant which started commercial operation in April 2022, and (v) $8.6 million related to higher generation in Kenya and Guadeloupe. This increase was partially offset by $9.4 million related to lower revenues at the Puna power plant due to lower electricity prices and generation.
During the years ended December 31, 2023 and 2022, our consolidated power plants generated 7,196,440 MWh and 6,661,775 MWh, respectively, an increase of 8.0%. The average prices during the years ended December 31, 2023 and 2022 were $92.7 and $94.8 per MWh, respectively.
Power generation in our power plants decreased by 3.1% from 6,238,272 MWh forFor the year ended December 31, 20192023, our Electricity segment generated 80.4% of our total revenues, compared to 6,043,993 MWh86.0% in the previous year, ended December 31, 2020, due to the lower generation at somewhile our Product segment generated 16.1% of our power plants, includingtotal revenues, compared to 9.7% in the previous year, and our OREG facilities and Olkaria complex that were impacted by lower demand due to COVID-19. However, revenues remained unchanged due to higher average energy rate per MWhEnergy Storage segment generated 3.5% of our entire portfolio.total revenues, compared to 4.2% in the previous year.
Product Segment
Revenues attributable to our Product segment for the year ended December 31, 20202023 were $148.1$133.8 million, compared to $191.0$71.4 million for the year ended December 31, 2019,2022, representing a 22.5% decrease from the prior period.87.3% increase. The decreaseincrease in our Product segment revenues was mainlyprimarily due to two projects in Turkey and the U.S., which were completed in 2019 and accounted for $75.9 million in revenues in the year ended December 31, 2019. The decrease was partially offset by other projects in Turkey, New Zealand and Chile,one in Indonesia for which startedwe recorded higher revenues in 2019, and provided $98.3 million in revenue recognized during the year ended December 31, 20202023 compared to $86.6 million for the year ended December 31, 2019, and other projects in mainly in Turkey, which started in 2020 and provided $29.6 million for the year ended December 31, 2020. The overall decrease in Product revenues is also attributable to the impact of COVID-19 which resulted in delays in the progress of the third-party projects as well as unwillingness of potential customers to enter into new commitments.2022.
Energy Storage Segment
Revenues attributable to our Energy Storage segment for the year ended December 31, 20202023 were $15.8$28.9 million compared to $14.7$31.0 million for the year ended December 31, 2019,2022, representing a 7.6% increase. The increase6.8% decrease. This decrease was mainly drivenattributable to lower revenues at PJM and CAISO facilities due to lower merchant rates in 2023 compared to 2022, offset by $4.8 million of revenues from the acquisition of the Pomonanew energy storage asset as well as the commissioning of Rabitt Hill in Texas, offset by $2.8 million in revenues from a one-time EPC project in the year ended December 31, 2019.facilities which commenced commercial operation during 2023.
Total Cost of Revenues
| | | Year Ended December 31, 2020 | | | Year Ended December 31, 2019 | | | Increase (Decrease) | |
| | | (Dollars in millions) | | | | | |
Electricity segment cost of revenues | | $ | 300.1 | | | $ | 312.8 | | | $ | (12.8 | ) | | | (4.1 | )% |
Product segment cost of revenues | | | 114.9 | | | | 146.0 | | | | (31.0 | ) | | | (21.3 | ) |
Energy Storage segment cost of revenues | | | 14.1 | | | | 17.9 | | | | (3.9 | ) | | | (21.5 | ) |
Total Cost of Revenues | | $ | 429.1 | | | $ | 476.7 | | | $ | (47.7 | ) | | | (10.0 | )% |
Total cost of revenues for the year ended December 31, 2020 was $429.1 million compared to $476.7 million for the year ended December 31, 2019, which represented a 10.0% decrease. This decrease was attributable to a decrease of $12.8 million, or 4.1%, in cost of revenues from our Electricity segment, a decrease of $31.0 million, or 21.3%, in cost of revenues from our Product segment and a decrease of $3.9 million, or 21.5%, in cost of revenues from our Energy Storage segment, all as discussed above. As a percentage of total revenues, our total cost of revenues for the year ended December 31, 2020 decreased to 60.8% from 63.9% for the year ended December 31, 2019.
| | | Year Ended December 31, 2023 | | | Year Ended December 31, 2022 | | | Increase (Decrease) | |
| | | (Dollars in millions) | | | | | |
Electricity segment cost of revenues | | $ | 422.5 | | | $ | 380.4 | | | $ | 42.2 | | | | 11.1 | % |
Product segment cost of revenues | | | 115.8 | | | | 60.5 | | | | 55.3 | | | | 91.5 | |
Energy Storage segment cost of revenues | | | 27.1 | | | | 24.5 | | | | 2.6 | | | | 10.5 | |
Total Cost of Revenues | | $ | 565.4 | | | $ | 465.4 | | | $ | 100.1 | | | | 21.5 | % |
Electricity Segment
Total cost of revenues attributable to our Electricity segment for the year ended December 31, 20202023 was $300.1$422.5 million, compared to $312.8$380.4 million for the year ended December 31, 2019,2022, representing a 4.1% decrease from the prior period.an 11.1% increase. This decreaseincrease was primarily attributable to: (i) the start of commercial operation of the CD4 power plant in July 2022, the North Valley power plant in April 2023, the Dixie Valley power plant upgrade in May 2023, and the Tungsten 2 power plant in April 2022; (ii) the Heber 1 power plant which resumed operations in May 2023 after a temporary shutdown due to a decreasefire incident that occurred in costFebruary 2022, and; (iii) business interruption insurance income of revenues at our Puna power plant that was shut down immediately following the Kilauea volcanic eruption on May 3, 2018, as the cost of revenues at our Puna power plant for the year ended December 31, 2020 includes a decrease in lease expense of $5.4$15.6 million due to the termination of the lease transaction. The decrease was also due to lower operational costs in some of our power plantsrecorded in the year ended December 31, 20202022, compared to the year ended December 31, 2019. Cost of revenues at our Puna power plant included business interruption recovery of $7.8only $6.3 million recorded in the year ended December 31, 2020, compared to $9.3 million in the year ended December 31, 2019. 2023.
As a percentage of total Electricity revenues, the total cost of revenues attributable to our Electricity segment for the year ended December 31, 20202023 was 55.4%63.4%, compared to 57.9%60.2% for the year ended December 31, 2019.2022. This increase was primarily attributable to higher operational costs in some of our power plants as well as the impact of business interruption insurance income as described above. The cost of revenues attributable to our international power plants was 21.5%18% of our Electricity segment cost of revenues for the year ended December 31, 2020.2023.
Product Segment
Total cost of revenues attributable to our Product segment for the year ended December 31, 20202023 was $114.9$115.8 million, compared to $146.0$60.5 million for the year ended December 31, 2019,2022, representing a 21.3% decrease91.5% increase from the prior period.year. This decreaseincrease was primarily attributable to the decreaseincrease in Product segment revenues, different product scope and different margins in the various sales contracts we entered into mainly in Turkey, New Zealand and Chile for the Product segment during these periods.as discussed above. As a percentage of total Product segment revenues, our total cost of revenues attributable to our Product segment for the year ended December 31, 20202023 was 77.6%86.6%, compared to 76.4%84.7% for the year ended December 31, 2019. This increase is mainly related2022, which represents a lower gross profit on projects in 2023 compared to the higher cost2022.
Energy Storage Segment
Cost of revenues attributable to our Energy Storage segment for the year ended December 31, 20202023 were $14.1$27.1 million as compared to $17.9$24.5 million in the year ended December 31, 2019. The decrease2022. This increase was mainly driven by costdue to the addition of revenues from a one-time EPC project in the amount of $2.2 million in the year ended December 31, 2019, and a decrease in payroll, professional fees and consulting, offset partially by $3.1 million in cost of revenues from the acquisition of the Pomonanew energy storage asset. The Energy Storage segment includes cost of revenues relatedsystems to the delivery of energy storage services.our commercially operating facilities in 2023.
Research and Development Expenses
Research and development expenses for the year ended December 31, 20202023 were $5.4$7.2 million, compared to $4.6$5.1 million for the year ended December 31, 2019.2022, represent a 42.1% increase. The increase is mainly dueattributable to the timing of new development projects that took place during the year ended December 31, 2020.2023 compared to 2022.
Selling and Marketing Expenses
Selling and marketing expenses for the year ended December 31, 20202023 were $17.4$18.3 million, compared to $15.0$16.2 million for the year ended December 31, 2019.2022, representing a 13.0% increase. The increase was mainly due to anthe corresponding increase in sales commissions due to different product mix and increase in marketing activities.Product segment revenues. Selling and marketing expenses constituted 2.5%2.2% of total revenues for the yearyears ended December 31, 2020, compared to 2.0%, for the year ended December 31, 2019.2023 and 2022.
General and Administrative Expenses
General and administrative expenses for the year ended December 31, 20202023 were $60.2$68.2 million, compared to $55.8$61.3 million for the year ended December 31, 2019.2022, representing an 11.3% increase. The increase was primarily attributable toto: (i) an increase in professional fees,stock-based compensation of $3.6 million; (ii) an increase in tax services of $2.5 million primarily related to tax planning and $1.3 million in costs associated with one of our legal claims, partially offset by a $1.3 million gain fromservices related to the sale of tax benefits transactions; (iii) an increase in legal consulting of $1.7 million related to ongoing legal matters, including merger and acquisition related costs of $0.6 million, primarily related to the Enel Green Power North America business combination as further detailed under Note 22 to the consolidated financial statements, and; (iv) a concessionreversal of a contingent liability in one2022 of $1.8 million related to our foreign locations. Guadeloupe power plant acquisition.
General and administrative expenses for the year ended December 31, 20202023 constituted 8.5%8.2% of total revenues for such period, compared to 7.5%8.3%, excluding the earn out adjustment, for the year ended December 31, 2019.2022.
Business Interruption Insurance IncomeImpairment of long-lived assets
Business interruption insurance incomeImpairment of long-lived assets for the year ended December 31, 20202022 of $32.6 million is attributableprimarily related to business interruption recoveries relatinga non-cash impairment charge of our Brawley power plant as further described under Note 1 to the Puna power plant. Forconsolidated financial statement. There was no such impairment during the year ended December 31, 2020,2023.
Write-off of Unsuccessful Exploration Activities
Write-offs of unsuccessful exploration activities for year ended December 31, 2023 were $3.7 million compared to $0.8 million for the year ended December 31, 2022. These write-offs are primarily related to geothermal exploration projects that the Company recognized business insurance income of $28.6decided to no longer pursue as well as costs related to a small storage facility that the Company decided to no longer develop.
Interest Income
Interest Income for the year ended December 31, 2023 was $12.0 million, which was includedcompared to $3.4 million for the year ended December 31, 2022. This increase is primarily related to higher interest rates as well as cash and cash equivalents balances in cost of revenues up2023 compared to the amount covering the related costs and the remainder, totaling $20.7 million, was included as a business interruption insurance income under operating expenses in the consolidated statements of operations and comprehensive income.2022.
Interest Expense, Net
Interest expense, net, for the year ended December 31, 20202023 was $78.0$98.9 million, compared to $80.4$87.7 million for the year ended December 31, 2019,2022, representing a 3.0% decrease from the prior period.12.7% increase. This decreaseincrease was primarily due to (i) $2$5.4 million decrease in interest related to the sale of tax benefits;Hapoalim 2023 Loan entered into in February 2023; (ii) $5.2 million related to the Convertible Senior Notes entered into in June 2022; (iii) $1.9 million related to the short-term commercial paper and (ii) $7the Mizrahi 2023 loan entered into in October 2023 and November 2023, respectively; (iv) $2.3 million increaserelated to the Idaho Refinancing Note which closed in November 2022; (v) $1.6 million in lower interest capitalizedcapitalization on projects under construction in 2023, compared to projects. The decrease2022; and; (vi) higher guarantee fees in 2023, compared to 2022. This increase was partially offset by $4.7 million related to the prepayment of Series 3 Bonds in June 2022, and lower interest expense from: (i) $79.4 millionexpenses on other long-term loans as a result of proceeds from a senior unsecured bonds series 3 received in April and May 2020; (ii) $50.0 millionscheduled principal payments.
Derivatives and Foreign Currency Transaction Gains (Losses)
Derivatives and foreign currency transaction gainslosses for the year ended December 31, 2020 were $3.82023 was $3.3 million, compared to $0.6$6.0 million for the year ended December 31, 2019.2022. Derivatives and foreign currency transaction gains for the year ended December 31, 2020 were attributablelosses primarily to gainsincludes losses from foreign currency forward contracts which were not accounted for as hedge transactions.transactions and which were higher in 2023 than in 2022.
Income Attributable to Sale of Tax Benefits
Income attributable to the sale of tax benefits for the year ended December 31, 20202023 was $25.7$61.2 million, compared to $20.9$33.9 million for the year ended December 31, 2019. Tax equity is a form of financing used for renewable energy projects.2022. This income primarily represents the value of PTCs and taxable income or loss generated by certain of our power plants allocated to investors under tax equity transactions. This increase of $27.3 million is primarily related to the CD 4 tax equity transaction entered into in December 2022, the North Valley tax equity transaction entered into in October 2023, and the income related to the expected sale of transferable production tax credits of $10.8 million, which was recorded in 2023 under the new IRA regulations and of which $3.3 million was received in cash under a tax credit purchase agreement entered into with a third party in December 2023.
Other Non-Operating Income (Expense), Net
Other non-operating income (expense), net for the year ended December 31, 20202023 was $1.4a income of $1.5 million, compared to $0.9an expense of $0.7 million for the year ended December 31, 2019.2022. Other non-operating income for the year ended December 31, 2020 mainly includes income of $0.62023 is primarily attributable to $1.2 million for property damage recovery related to the Puna power plant.a settlement and release transaction with a third party entered into in December 2023. Other non-operating income(expense), net for the year ended December 31, 2019 mainly includes income2022 is primarily related to the payment of $1.0the make-whole premium of $1.1 million from the prepayment of Series 3 Bonds in the second quarter of 2022, as further discussed under Note 11 to the consolidated financial statements, net of gain from a sale of PG&E receivables relatingcertain equipment to the January 2019 monthly invoice which was not paid as it occurred before PG&E filed for reorganization under Chapter 11 bankruptcy.a third party.
Income from operations, before income taxes and equity in earnings of investeesTaxes
Income from operations, before income taxes and equity in earnings of investees for the year ended December 31, 2020 was $168.7 million, compared to $137.3 million for the year ended December 31, 2019, representing an 22.9% increase from the prior period. This increase was mainly driven by business interruption insurance income of $20.7 million, as described above.
Income Taxes
Income tax provision for the year ended December 31, 2020,2023, was $67.0$6.0 million, an increasea decrease of $21.4$8.8 million compared to an income tax provision of $45.6$14.7 million for the year ended December 31, 2019.2022. Our effective tax rate for the year ended December 31, 20202023 and 2019,2022, was 39.7%4.3% and 33.2%15.4%, respectively. The effective rate differs from the federal statutory rate of 21% for the year ended December 31, 20202023 due to: (i)to the generation of investment tax credits, a net benefit associated with the statutory tax rate change in Kenya resulting from the Finance Act, and the jurisdictional mix of business in various countries with higher statutoryearnings at differing tax rates thanfrom the federal statutory tax rate, and (ii) a net increase in the valuation allowance on deferred tax assets related to U.S. tax attributes, offset by the release of uncertain tax positions in foreign jurisdictions.rate.
Equity in Earnings (losses) of investees, net
Equity in earnings (losses)losses of investees, net in the year ended December 31, 20202023, was $0.1$0.0 million, compared to $1.9$3.1 million in the year ended December 31, 2019.2022. Equity in earnings (losses) of investees, net is primarilymainly derived from our 12.75% share in the earnings or losses in the Sarulla complex and indirect costs related to our 49% ownership interestshare in the earnings or losses in the Ijen project, both located in Indonesia.geothermal project. The decrease was mainly attributable to a lower resultin equity in losses of operations due to well-field issues in the NIL power plant which resulted in lower generation. Sarullainvestees, net is currently developing a remediation plan with a targetprimarily related to increase generation in net income generated by the near-term. We are followingIjen project starting in 2023. During the second quarter of 2022, Sarulla agreed with its banks on a framework that will enable it to perform remediation work that is aimed to improve the plant’s performance. The outcome of the first phase of the recovery plan is under evaluation towards the decision regarding the implementation of the second phase. However, as part of the remediation plansworks involves drilling activities, uncertainty remains regarding Sarulla’s ability to meet the plan and the Company is evaluating periodically the impact of the plan on future performance. As the Company determined that the current situation and circumstances related to its equity investment in Sarulla as well as the potential accounting impact on our financial statements in respect of our investment in Sarulla.are temporary, no impairment testing was required at year-end.
Net Income attributable to the Company’sCompany’s Stockholders
Net income attributable to the Company’s stockholders for the year ended December 31, 20202023 was $85.5$124.4 million, compared to $88.1$65.8 million for the year ended December 31, 2019,2022, which represents a decreasean increase of $2.6$58.6 million. This decreaseincrease was attributable to the increase of $55.3 million in net income which was affected by the factors described above, as well as a $10.9decrease in expenses of $3.2 million in net income attributable to noncontrolling interest, which increased mainlyprimarily due to the business interruption recovery of thelower performance by our Puna power plant, in Hawaii, offset partially by an increase in net income of $8.3 million, all as discussed above.year over year.
Comparison
Liquidity and Capital Resources
Our principal sources of liquidity have been derived from cash flows from operations, proceeds from third party debt such as borrowings under our credit facilities private offerings and issuances of debt securities, equity offerings, project financing and tax monetization transactions, short term borrowing under our lines of credit, and proceeds from the sale of equity interests in one or more of our projects. We have utilized this cash to develop and construct power plants, fund our acquisitions, pay down existing outstanding indebtedness, and meet our other cash and liquidity needs.
Based on current conditions, we believe that we have sufficient financial resources to fund our activities and execute our business plans. However, the cost of obtaining financing for our project needs may increase significantly or such financing may be difficult to obtain.
As of December 31, 2020,2023, we had access to: (i) $448.3$195.8 million in cash and cash equivalents, of which $42.4$57.5 million was held by our foreign subsidiaries; and (ii) $389.4$307.8 million of unused corporate borrowing capacity under existing committed lines for credit and letters of credit with different commercial banks.
As of December 31, 2023, $302.8 million in the aggregate was outstanding under credit agreements with several banks as detailed below under “Letters of Credits under the Credit Agreements”.
Our estimated capital needs for 20212024 include approximately $445$550.0 million for capital expenditures on new projects under development or construction including storage projects, exploration activity and maintenance capital expenditures for our existing projects. In addition, we expect $78.6$179.0 million for long-term debt repayments.
AsOur capital expenditures primarily relate to the enhancement of our existing power plants and the construction of new power plants. We have budgeted approximately $572.0 million in capital expenditures for construction of new projects and enhancements to our existing power plants, of which we had invested $111.0 million as of December 31, 2020, $190.3 million in the aggregate was outstanding under credit agreements with several banks as detailed below under “Letters of Credits under the Credit Agreements”.
2023. We expect to finance these requirements with: (i)invest approximately $184.0 million in 2024 and the sources of liquidity described above; (ii) positive cash flows from our operations; and (iii) future project financings and re-financings (including construction loans and tax equity). Management believes that, basedremaining approximately $277.0 million on the current stage of implementation of our strategic plan, the sources of liquidity and capital resources described above will address our anticipated liquidity,thereafter.
In addition, we estimate approximately $365.0 million in additional capital expenditures in 2024 to be allocated as follows: (i) approximately $89.0 million for the exploration, drilling and other investment requirements.development of new projects and enhancements of existing power plants that are not yet released for full construction; (ii) approximately $66.0 million for maintenance of capital expenditures to our Electricity segment operating power plants; (iii) approximately $187.0 million for the construction and development of storage projects; and (iv) approximately $23.0 million for enhancements to our production facilities.
During 2019, we have revised our assertion to no longer indefinitely reinvest foreign funds held by our foreign subsidiaries, with the exception of a certain balance held in Israel and have accrued the incremental foreign withholding taxes. As a result, we have further liquidity to move funds freely.
Letters of Credits under the Credit Agreements
Some of our customers require our project subsidiaries to post letters of credit in order to guarantee their respective performance under relevant contracts. We are also required to post letters of credit to secure our obligations under various leases and licenses and may, from time to time, decide to post letters of credit in lieu of cash deposits in reserve accounts under certain financing arrangements. In addition, our subsidiary, Ormat Systems, is required from time to time to post performance letters of credit in favor of our customers with respect to orders of products.
Credit Agreements | | Issued Amount | | | Issued and Outstanding as of | | Termination
Date |
| | | | | | | December 31, 2020 | | |
| | | (Dollars in millions) | | |
Committed lines for credit and letters of credit | | $ | 478.0 | | | $ | 113.6 | | April 2021-July 2022 |
Committed lines for letters of credit | | | 145.0 | | | | 66.6 | | April 2021-December 2021 |
Non-committed lines | | | - | | | | 10.1 | | December 2021 |
Total | | $ | 623.0 | | | $ | 190.3 | | |
The table below describes our committed and non-committed lines:
Credit Agreements | | Amount Issued | | | Issued and Outstanding as of | | Termination Date |
| | | | | | | December 31, 2023 | | |
| | | (Dollars in millions) | | |
Committed lines for credit and letters of credit | | $ | 453.0 | | | $ | 145.2 | | March 2024 - August 2025 |
Committed lines for letters of credit | | | 155.0 | | | | 81.9 | | April 2024 - August 2025 |
Non-committed lines | | | - | | | | 75.7 | | October 2024 |
Total | | $ | 608.0 | | | $ | 302.8 | | |
Restrictive covenants
Our obligations under the credit agreements, the loan agreements, and the trust instrument governing the bonds described above, are unsecured, but we are subject to a negative pledge in favor of the banks and the other lenders and certain other restrictive covenants. These include, among other things, a prohibition on: (i) creating any floating charge or any permanent pledge, charge or lien over our assets without obtaining the prior written approval of the lender; (ii) guaranteeing the liabilities of any third party without obtaining the prior written approval of the lender; and (iii) selling, assigning, transferring, conveying or disposing of all or substantially all of our assets, or a change of control in our ownership structure. Some of the credit agreements, the term loan agreements, and the trust instrument contain cross-default provisions with respect to other material indebtedness owed by us to any third party. In some cases, we have agreed to maintain certain financial ratios, which are measured quarterly, such as: (i) equity of at least $750 million and in no event less than 25% of total assets; and (ii) 12-month debt, net of cash, cash equivalents, and short-term bank deposits to Adjusted EBITDA ratio not to exceed 6.0; and (iii) dividend distributions not to exceed 50% of net income in any calendar year.6. As of December 31, 2020:2023: (i) total equity was $1,941.4$2,441.0 million and the actual equity to total assets ratio was 49.9%46.9%; and (ii) the 12-month debt, net of cash and cash equivalents to Adjusted EBITDA ratio was 2.36.3.74. During the year ended December 31, 2020,2023, we distributed interim dividends in an aggregate amount of $22.5$28.4 million. The failure to perform or observe any of the covenants set forth in such agreements, subject to various cure periods, would result in the occurrence of an event of default and would enable the lenders to accelerate all amounts due under each such agreement.
As described above, we are currently in compliance with our covenants with respect to the credit agreements, the loan agreements (except as described below) and the trust instrument, and believe that the restrictive covenants, financial ratios and other terms of any of our full-recourse bank credit agreements will not materially impact our business plan or operations.
As of December 31, 2023, we did not meet the dividend distribution criteria related to the DAC 1 Senior Secured Notes, which resulted in certain equity distribution restrictions from this related subsidiary.
Credit Agreements
Credit Agreement with MUFG Union Bank
Ormat Nevada has a credit agreement with MUFG Union Bank under which it has an aggregate available credit of up to $60.0 million as of December 31, 2023.The credit termination date is June 30, 2024.
The facility is limited to the issuance, extension, modification or amendment of letters of credit. Union Bank is currently the sole lender and issuing bank under the credit agreement, but is also designated as an administrative agent on behalf of banks that may, from time to time in the future, join the credit agreement as lenders. In connection with this transaction, the Company entered into a guarantee in favor of the administrative agent for the benefit of the banks, pursuant to which the Company agreed to guarantee Ormat Nevada’s obligations under the credit agreement. Ormat Nevada’s obligations under the credit agreement are otherwise unsecured. There are various restrictive covenants under the credit agreement, which include a requirement to comply with the following financial ratios, which are measured quarterly: (i) a 12-month debt to EBITDA ratio not to exceed 4.5; (ii) 12-month DSCR of not less than 1.35; and (iii) distribution leverage ratio not to exceed 2.0. As of December 31,2023: (i) the actual 12-month debt to EBITDA ratio was 1.24; (ii) the 12-month DSCR was 5.75; and (iii) the distribution leverage ratio was 0.7. In addition, there are restrictions on dividend distributions in the event of a payment default or noncompliance with such ratios, and subject to specified carve-outs and exceptions, a negative pledge on the assets of Ormat Nevada in favor of Union Bank. As of December 31, 2023, the covenants have been met. As of December 31, 2023, letters of credit in the aggregate amount of $59.3 million were issued and outstanding under this credit agreement.
Credit Agreement with HSBC Bank USA N.A.
Ormat Nevada has a credit agreement with HSBC Bank USA, N.A for one year with annual renewals. The current expiration date of the facility under this credit agreement is October 31, 2024. On December 31, 2023, the aggregate amount available under the credit agreement was $35.0 million. This credit line is limited to the issuance, extension, modification or amendment of letters of credit. In addition, Ormat Nevada has an uncommitted discretionary demand line of credit in the aggregate amount of $65.0 million available for letters of credit including up to $20 million of credit. In connection with this transaction, the Company entered into a guarantee in favor of the administrative agent for the benefit of the banks, pursuant to which the Company agreed to guarantee Ormat Nevada’s obligations under the credit agreement. Ormat Nevada’s obligations under the credit agreement are otherwise unsecured.
There are various restrictive covenants under the credit agreement, including a requirement to comply with the following financial ratios, which are measured quarterly: (i) a 12-month debt to EBITDA ratio not to exceed 4.5; (ii) 12-month DSCR of not less than 1.35; and (iii) distribution leverage ratio not to exceed 2.0. As of December 31, 2023: (i) the actual 12-month debt to EBITDA ratio was 1.24; (ii) the 12-month DSCR was 5.75; and (iii) the distribution leverage ratio was 0.7. In addition, there are restrictions on dividend distributions in the event of a payment default or noncompliance with such ratios, and subject to specified carve-outs and exceptions, a negative pledge on the assets of Ormat Nevada in favor of HSBC. As of December 31, 2023, the covenants have been met.
As of December 31, 2023, letters of credit in the aggregate amount of $34.3 million were issued and outstanding under the committed portion of this credit agreement and $36.3 million under the uncommitted portion of the agreement.
Future minimum payments
Future minimum payments under long-term obligations excluding revolving credit lines with commercial banks, as of December 31, 2020,2023, are detailed under the caption Contractual Obligations and Commercial Commitments, below.
Third-Party Debt
Our third-party debt consists of (i) non-recourse and limited-recourse project finance debt or acquisition financing that we or our subsidiaries have obtained for the purpose of developing and constructing, refinancing or acquiring our various projects andprojects; (ii) full-recourse debt incurred by us or our subsidiaries for general corporate purposes.purposes; (iii) convertible senior notes issued in June 2022; (iv) commercial paper; (iv) financing liability assumed as part of the TG Geothermal Portfolio, LLC acquisition; and (v) short term revolving credit lines with banks. Further details related to our third party debt are provided under Note 11 to the consolidated financial statements.
Non-recourse debt refers to debt involving debt repayments that are made solely from the power plant’s revenues (rather than our revenues or revenues of any other power plant) and generally are secured by the power plant’s physical assets, major contracts and agreements, cash accounts and, in many cases, our ownership interest in our affiliate that owns that power plant. These forms of financing are referred to as “project financing”.
In the event of a foreclosure after a default, our affiliate that owns the power plant would only retain an interest in the power plant assets, if any, remaining after all debts and obligations have been paid in full. In addition, incurrence of debt by a power plant may reduce the liquidity of our equity interest in that power plant because the equity interest is typically subject both to a pledge in favor of the power plant’s lenders securing the power plant’s debt and to transfer and change of control restrictions set forth in the relevant financing agreements.
Limited recourse debt refers to project financing as described above with the addition of our agreement to undertake limited financial support for our affiliate that owns the power plant in the form of certain limited obligations and contingent liabilities. These obligations and contingent liabilities may take the form of guarantees of certain specified obligations, indemnities, capital infusions and agreements to pay certain debt service deficiencies. Creditors of a project financing of a particular power plant may have direct recourse to us to the extent of these limited recourse obligations.
Non-Recourse and Limited-Recourse Third-Party Debt
Loan | | Line of Credit | | Amount Outstanding as of | | Interest
Rate | | Maturity
Date | | Related Projects | Location | | Amount Issued | | Amount Outstanding as of | | Interest Rate | | Maturity Date | Related Projects | Location |
| | | | | | | December 31, 2020 | | | | | | | | | | | | | | December 31, 2023 | | | | | | | |
| | | (Dollars in millions) | | | | | | | | | (Dollars in millions) | | | | | | |
OFC 2 Senior Secured Notes – Series A | | $ | 151.7 | | | $ | 86.9 | | | 4.69% | | | 2032 | | McGinness Hills
phase 1 and
Tuscarora | United States | | $ | 151.7 | | | $ | 63.9 | | | 4.69 | % | December, 2032 | McGinness Hills phase 1 and Tuscarora | United States |
OFC 2 Senior Secured Notes – Series B | | 140.0 | | | 101.3 | | | 4.61% | | | 2032 | | McGinness Hills
phase 2 | United States | | 140.0 | | | 78.6 | | | 4.61 | % | December, 2032 | McGinness Hills phase 2 | United States |
Olkaria III Financing Agreement with DFC – Tranche 1 | | 85.0 | | | 47.2 | | | 6.34% | | | 2030 | | Olkaria III Complex | Kenya | | 85.0 | | | 33.0 | | | 6.34 | % | December, 2030 | Olkaria III Complex | Kenya |
Olkaria III Financing Agreement with DFC – Tranche 2 | | 180.0 | | | 100.6 | | | 6.29% | | | 2030 | | Olkaria III Complex | Kenya | | 180.0 | | | 68.8 | | | 6.29 | % | June, 2030 | Olkaria III Complex | Kenya |
Olkaria III Financing Agreement with DFC – Tranche 3 | | 45.0 | | | 26.9 | | | 6.12% | | | 2030 | | Olkaria III Complex | Kenya | | 45.0 | | | 18.8 | | | 6.12 | % | December, 2030 | Olkaria III Complex | Kenya |
Amatitlan Financing (1) | | 42.0 | | | 22.8 | | | LIBOR+4.35% | | | 2027 | | Amatitlan | Guatemala | |
Don A. Campbell Senior Secured Notes | | 92.5 | | | 73.1 | | | 4.03% | | | 2033 | | Don A. Campbell Complex | United States | | 92.5 | | | 57.4 | | | 4.03 | % | September, 2033 | Don A. Campbell Complex | United States |
Prudential Capital Group Idaho Loan (2) | | 20.0 | | | 17.5 | | | 5.8% | | | 2023 | | Neal Hot Springs and Raft River | United States | |
U.S. Department of Energy loan (3) | | 96.8 | | | 42.0 | | | 2.61% | | | 2035 | | Neal Hot Springs | United States | |
Idaho Refinancing Note (1) | | | 61.6 | | | 58.9 | | | 6.26 | % | March, 2038 | Neal Hot Springs and Raft River | United States |
U.S. Department of Energy loan (2) | | | 96.8 | | | 30.2 | | | 2.61 | % | February, 2035 | Neal Hot Springs | United States |
Prudential Capital Group Nevada Loan | | 30.7 | | | 26.3 | | | 6.75% | | | 2037 | | San Emidio | United States | | 30.7 | | | 23.9 | | | 6.75 | % | December, 2037 | San Emidio | United States |
Platanares Loan with DFC | | 114.7 | | | 96.3 | | | 7.02% | | | 2032 | | Platanares | Honduras | | 114.7 | | | 71.7 | | | 7.02 | % | September, 2032 | Platanares | Honduras |
Viridity - Plumstriker | | 23.5 | | | 18.1 | | | LIBOR+3.5% | | | 2026 | | Plumsted+Striker | United States | |
Geothermie Bouillante (4) | | 8.9 | | | 7.8 | | | 1.52% | | | 2026 | | Geothermie Bouillante | Guadeloupe | |
Geothermie Bouillante (4) | | | 8.9 | | | | 9.8 | | | 1.93% | | | 2026 | | Geothermie Bouillante | Guadeloupe | |
Geothermie Bouillante (3) | | | 8.9 | | | 3.5 | | | 1.52 | % | March, 2026 | Geothermie Bouillante | Guadeloupe |
Geothermie Bouillante (3) | | | | 8.9 | | | | 4.2 | | | 1.93 | % | April, 2026 | Geothermie Bouillante | Guadeloupe |
Total | | $ | 1,039.7 | | | $ | 676.6 | | | | | | | | | | $ | 1,015.8 | | | $ | 512.9 | | | | | | | |
(1)LIBOR Rate cannot be lower than 1.25%. Margin of 4.35% as long as the Company’s guaranty of the loan is outstanding (current situation) or 4.75% otherwise. Current interest is 5.6%.
(2) Secured by equity interest.
(3)(2) Secured by the assets.
(4)(3) Loan in Euros and issued amount is EUR 8.0 million
Full-Recourse Third-Party Debt
Loan | | Amount Issued | | Amount Outstanding as of | | Interest
Rate | | Maturity
Date | | Amount Issued | | Amount Outstanding as of | | Interest Rate | | Maturity Date |
| | | | | | | December 31, 2020 | | | | | | | | | | | December 31, 2023 | | | | | | |
| | | (Dollars in millions) | | | | | | (Dollars in millions) | | | | | |
Senior Unsecured Bonds Series 3 | | $ | 218.0 | | | 218.0 | | | 4.45% | | September 2022 | |
Mizrahi Loan | | | $ | 75.0 | | | $ | 60.9 | | | 4.10 | % | April 2030 |
Mizrahi Loan 2023 | | | 50.0 | | | 50.0 | | | 7.15 | % | October 2031 |
Hapoalim Loan | | | 125.0 | | | 80.4 | | | 3.45 | % | June 2028 |
Hapoalim 2023 Loan | | | 100.0 | | | 95.0 | | | 6.45 | % | February 2033 |
HSBC Loan | | | 50.0 | | | 35.7 | | | 3.45 | % | July 2028 |
Discount Loan | | | 100.0 | | | 75.0 | | | 2.90 | % | September 2029 |
Senior Unsecured Bonds Series 4 (1) | | $ | 289.8 | | | 311.0 | | | 3.35% | | June 2031 | | 289.8 | | | 220.6 | | | 3.35 | % | June 2031 |
Senior Unsecured Loan 1 | | 100.0 | | | 100.0 | | | 4.80% | | March 2029 | | 100.0 | | | 79.0 | | | 4.80 | % | March 2029 |
Senior Unsecured Loan 2 | | 50.0 | | | 50.0 | | | 4.60% | | March 2029 | | 50.0 | | | 39.5 | | | 4.60 | % | March 2029 |
Senior Unsecured Loan 3 | | 50.0 | | | 50.0 | | | 5.44% | | March 2029 | | 50.0 | | | 39.5 | | | 5.44 | % | March 2029 |
DEG Loan 2 | | 50.0 | | | 37.5 | | | 6.28% | | June 2028 | | 50.0 | | | 22.5 | | | 6.28 | % | June 2028 |
DEG Loan 3 | | | 41.5 | | | | 32.8 | | | 6.04% | | June 2028 | | | 41.5 | | | | 19.7 | | | 6.04 | % | June 2028 |
Total | | $ | 799.3 | | | $ | 799.3 | | | | | | | $ | 1,081.3 | | | $ | 817.8 | | | | | | |
(1) Bonds issued in total aggregate principal amount of NIS 1.0 billion.
Other Third-Party Debt
| | | Amount Outstanding as of | | | Annual | | | Maturity | |
Loan | | December 31, 2023 | | | Interest Rate | | | Date | |
| | | (Dollar in millions) | | | | | | | | | |
Financing Liability - Dixie Valley (1) | | $ | 225.8 | | | | 6.12 | % | | June 2038 | |
Convertible Senior Notes (2) | | | 431.3 | | | | 2.50 | % | | July 2027 | |
Commercial Paper (3) | | | 100.0 | | | | * (3) | | | | * (3) | |
Revolving credit lines with commercial banks | | 20.0 | | | | 7.75 | % | | | * (4) | |
(1) Final maturity date of the financing liability is assuming execution of the buy-out option in June 2038. |
(2) The Notes mature in July 2027, unless earlier converted, redeemed or repurchased. |
(3) The Commercial Paper was issued for a period of 90 days and extends automatically for additional 90 day periods for up to five years, unless the Company notifies the participants otherwise or a notice of termination is provided by the participants in accordance with the provisions of the Commercial Paper Agreement. The Commercial Paper bears an annual interest of three months SOFR +1.1% which will be paid at the end of each 90 day period. Base rate was 5.3%. |
(4) Credit lines were fully prepaid in January 2024. |
For additional description of our long term debt, see Note 11, Long-term Debt, Credit Agreements and Commercial PaperFinancial Liability to our consolidated financial statements.statements, set forth in Item 8 of this Annual Report.
In January 2024, we have entered into a definitive loan agreement with Hapoalim Bank for a loan in the aggregate principal amount of $75 million. The loan bears an annual interest of 6.6% and matures in 2032. Additionally, in January 2024, we have entered into a definitive loan agreement with HSBC Bank for a loan in the aggregate principal amount of $125 million. This loan bears interest of 3-month SOFR+2.25% and matures in 2028. For additional description of our long term debt entered into subsequent to December 31, 2023, see Note 22 - Subsequent events, to our consolidated financial statements, set forth in Item 8 of this Annual Report.
Liquidity Impact of Uncertain Tax Positions
As discussed in Note 1716 - Income Taxes, to our consolidated financial statements set forth in Item 8 of this annual report,Annual Report, we have a liability associated with unrecognized tax benefits and related interest and penalties in the amount of approximately $2.0$8.7 million as of December 31, 2020.2023. This liability is included in long-term liabilities in our consolidated balance sheet, because we generally do not anticipate that settlement of the liability will require payment of cash within the next 12 months. We are not able to reasonably estimate when we will make any cash payments required to settle this liability.
Dividends
We have adopted a dividend policy pursuant to which we currently expect to distribute at least 20% of our annual profits available for distribution by way of quarterly dividends. In determining whether there are profits available for distribution, our Board will take into account our business plan and current and expected obligations, and no distribution will be made that in the judgment of our Board would prevent us from meeting such business plan or obligations.
The following are the dividends declared by us during the past two years:years, as of December 31, 2023:
Date Declared | | Dividend
Amount per
Share | | Record Date | Payment Date |
February 26, 2019 | | $ | 0.11 | | March 14, 2019 | March 28, 2019 |
May 6, 2019 | | $ | 0.11 | | May 20, 2019 | May 28, 2019 |
August 7, 2019 | | $ | 0.11 | | August 20, 2019 | August 27, 2019 |
November 6, 2019 | | $ | 0.11 | | November 20, 2019 | December 4, 2019 |
February 25, 2020 | | $ | 0.11 | | March 12, 2020 | March 26, 2020 |
May 8, 2020 | | $ | 0.11 | | May 21, 2020 | June 2, 2020 |
August 4, 2020 | | $ | 0.11 | | August 18, 2020 | September 1, 2020 |
November 4, 2020 | | $ | 0.11 | | November 18, 2020 | December 2, 2020 |
February 24, 2021 | | $ | 0.12 | | March 11, 2021 | March 11, 2021 |
Date Declared | | Dividend Amount per Share | | Record Date | Payment Date |
February 23, 2022 | | $ | 0.12 | | March 9, 2022 | March 23, 2022 |
May 2, 2022 | | $ | 0.12 | | May 16, 2022 | May 31, 2022 |
August 3, 2022 | | $ | 0.12 | | August 17, 2022 | August 31, 2022 |
November 2, 2022 | | $ | 0.12 | | November 16, 2022 | November 30, 2022 |
February 22, 2023 | | $ | 0.12 | | March 8, 2023 | March 22, 2023 |
May 9, 2023 | | $ | 0.12 | | May 23, 2023 | June 6, 2023 |
August 2, 2023 | | $ | 0.12 | | August 16, 2023 | August 30, 2023 |
November 8, 2023 | | $ | 0.12 | | November 22, 2023 | December 6, 2023 |
February 21, 2024 | | $ | 0.12 | | March 6, 2024 | March 20, 2024 |
Historical Cash Flows
The following table sets forth the components of our cash flows for the relevant periods indicated:
| | | Year Ended December 31, | | | Year Ended December 31, | |
| | | 2020 | | | 2019 | | | 2018 | | | 2023 | | | 2022 | | | 2021 | |
| | | (Dollars in thousands) | | | (Dollars in thousands) | |
Net cash provided by operating activities | | $ | 265,005 | | | $ | 236,493 | | | $ | 145,822 | | | $ | 309,401 | | | $ | 280,974 | | | $ | 258,822 | |
Net cash used in investing activities | | (385,969 | ) | | (254,538 | ) | | (342,434 | ) | | (628,343 | ) | | (523,406 | ) | | (638,193 | ) |
Net cash provided by (used in) financing activities | | 503,478 | | | (5,765 | ) | | 251,131 | | | 379,964 | | | 126,273 | | | 186,385 | |
Translation adjustments on cash and cash equivalents | | | 1,154 | | | | (575 | ) | | | (660 | ) | | | 72 | | | | (609 | ) | | | (348 | ) |
Net change in cash and cash equivalents and restricted cash and cash equivalents | | $ | 383,668 | | | $ | (24,385 | ) | | $ | 53,859 | | | $ | 61,094 | | | $ | (116,768 | ) | | $ | (193,334 | ) |
For the Year Ended December 31, 20202023
Net cash provided by operating activities for the year ended December 31, 20202023 was $265.0$309.4 million, compared to $236.5$281.0 million for the year ended December 31, 2019. This2022. The net increase of $28.5$28.4 million resultedis primarily fromattributable to an increase in net income of $55.3 million in 2023 compared to 2022, adjusted for certain non-cash items such as: (i) an increase in depreciation and amortization of $26.0 million; (ii) an increase in income attributable to the sale of tax benefits, net of interest expenses of $10.3 million; (iii) a decrease in impairment of long-lived assets of $32.6 million, and; (iv) the change in deferred income tax provision of $13.0 million. Additional contributors to the increase in net cash provided by operating activities were: (i) an increase in the change in accounts payable and accrued expenses of $70.6 million, mainly due to timing of payments to our supplier, (ii) an increase in other long-term liabilities of $12.8 million, primarily related to a prepayment made by one of our customers, and; (iii) a net increase in the change of costs and estimated earnings in excess of billing on uncompleted contracts netand billing in excess of $22.2costs and estimated earnings on uncompleted contracts, of $15.1 million, in the year ended December 31, 2020, compared to an increase of $11.9 million in the year ended December 31, 2019, as a result of timing of billing to our customers; (ii) a decrease of $3.5 millioncustomers. The net increase was offset by: (i) an increase in the change in receivables in the year ended December 31, 2020 comparedof $77.7 million primarily due to an increase of $15.1 million in the year ended December 31, 2019 because of timing of collections from our customers.customers, and specifically in Kenya; (ii) a net increase in inventories of $27.8 million, related to the timing of allocating costs to projects under construction; (iii) a withholding tax payment of approximately $8 millionan increase in the year ended December 31, 2020change in prepaid expenses and other of $8.1 million, and; (iv) an increase in deposits and other of $10.5 million, primarily due to higher cash deposits made in 2023 compared to $14 million in the year ended December 31, 2019, because of a distribution from OSL.2022.
Net cash used in investing activities for the year ended December 31, 20202023 was $386.0$628.3 million, compared to $254.5$523.4 million for the year ended December 31, 2019.2022. The principal factors that affected the increase in our net cash used in investing activities during the year ended December 31, 20202023 were: (i) capital expenditures of $320.7$618.4 million in 2023 compared to $563.5 million in 2022, primarily for our facilities under construction that support our growth plan;plan and (ii) cash paid forprovided from the acquisitionpurchase, maturities and sale and of the Pomona energy storage assetmarketable securities of $42.8 million in California from Alta Gas for a total net consideration of $43.4 million; and (iii) an investment2022 compared none in an unconsolidated company of $21.0 million.2023.
Net cash provided by financing activities for the year ended December 31, 20202023 was $503.5$380.0 million, compared to $5.8$126.3 million used in financing activities for the year ended December 31, 2019.2022. The principal factors that affected the increase in net cash provided by financing activities during the year ended December 31, 2020 were: (i) Proceeds$149.8 million proceeds from long-term loans from banks in 2023 compared to $135.3 million in 2022; (ii) $341.7 million proceeds from issuance of common stock, net of stock issuance costs of $339.5 million; (ii) $289.9in 2023; (iii) $100.0 million ofand $20.0 million proceeds from bonds series 4; (iii) $79.4issuance of commercial paper and draw from revolving credit lines with banks, respectively, in 2023; (iv) purchase of treasury stock and capped call instruments of $18.0 million and $24.5 million, respectively, in 2022; and (v) prepayments of proceeds from a senior unsecured bonds series 3;commercial paper and (iv) $50.0long-term debt of $219.1 million of proceeds from a senior unsecured loan,in 2022. This increase was partially offset by: (i) the repayment of commercial paper debt of $50.0 million; (ii) net payment of $40.6 million from our revolving credit lines with commercial banks which were withdrawn primarily to secure cash in hand in order to meet our capital needs in light of the uncertainty related to the COVID-19 pandemic, (iii) the repaymenta transaction with noncontrolling interest of $30.0 million in 2023; (ii) higher scheduled payments of long-term debt in the amount2023 compared to 2022 of $135.4 million; (iv) a $22.5$21.9 million, cash dividend payment and (v) $9.7proceeds from issuance of convertible notes, net of $419.7 million cash paid to a noncontrolling interest.in 2022.
For the Year Ended December 31, 20192022
A discussion of changes in our cash flows in 20192022 compared to 20182021 has been omitted from this Form10-K, but may be found in “Item 7. Management's Discussion and Analysis of Financial Condition and Results of Operations” of our Form 10-K for the fiscal year ended December 31, 2019,2022, filed with the SEC on March 2, 2020,February 24, 2023, which is incorporated by reference herein. This Form 10-K is available free of charge on the SECs website at www.sec.gov and at www.Ormat.com,, by clicking “Investors” located at the top of the home page.
Total EBITDA and Adjusted EBITDA
We calculate EBITDA as net income before interest, taxes, depreciation, amortization and amortization.accretion. We calculate Adjusted EBITDA as net income before interest, taxes, depreciation, amortization and amortization,accretion, adjusted for (i) termination fees, (ii) impairment of long-lived assets, (iii) write-off of unsuccessful exploration activities, (iv) any mark-to-market gains or losses from accounting for derivatives (v)not designated as hedging instruments; (ii) stock-based compensation; (iii) merger and acquisition transaction costs, (vi) stock-based compensation, (vii)costs; (iv) gain or loss from extinguishment of liabilities,liabilities; (v) cost related to a settlement agreement; (vi) non-cash impairment charges; (vii) write-off of unsuccessful exploration activities; and (viii) gain or loss on sale of subsidiary and property, plant and equipment and (ix) other unusual or non-recurring items. We adjust for these factors as they may be non-cash, unusual in nature and/or are not factors used by management for evaluating operating performance. We believe that presentation of these measures will enhance an investor’s ability to evaluate our financial and operating performance. EBITDA and Adjusted EBITDA are not measurements of financial performance or liquidity under accounting principles generally accepted in the United States, or U.S. GAAP, and should not be considered as an alternative to cash flow from operating activities or as a measure of liquidity or an alternative to net earnings as indicators of our operating performance or any other measures of performance derived in accordance with U.S. GAAP. Our Board of Directors and senior management use EBITDA and Adjusted EBITDA to evaluate our financial performance. However, other companies in our industry may calculate EBITDA and Adjusted EBITDA differently than we do.
Starting in the fourth quarter of 2022, we include accretion expenses related to asset retirement obligation in the adjustments to net income when calculating EBITDA and adjusted EBITDA. The presentation of EBITDA and adjusted EBITDA includes accretion expenses adjustment for the fiscal years ended December 31, 2023 and 2022, however, 2021 has not been recast to include accretion expenses as the amounts were immaterial.
This information should not be considered in isolation from, or as a substitute for, or superior to, measures of financial performance prepared in accordance with GAAP or other non-GAAP financial measures.
Net income for the year ended December 31, 20202023 was $101.8$133.1 million, compared to $93.5$77.8 million for the year ended December 31, 20192022 and $110.1$76.1 million for the year ended December 31, 2018.2021.
Adjusted EBITDA for the year ended December 31, 2023 was $481.7 million, compared to $435.5 million for the year ended December 31, 2022 and $401.4 million for the year ended December 31, 2021.
The following table reconciles net income to EBITDA and Adjusted EBITDA for the years ended December 31, 2023, 2022 and 2021:
| | | Year Ended December 31, | |
| | | 2023 | | | 2022 | | | 2021 | |
| | | (Dollars in thousands) | |
| | | | | | | | | | | | | |
Net income | | $ | 133,137 | | | $ | 77,795 | | | $ | 76,077 | |
Adjusted for: | | | | | | | | | | | | |
Interest expense, net (including amortization of deferred financing costs) | | | 86,898 | | | | 84,326 | | | | 80,534 | |
Income tax provision (benefit) | | | 5,983 | | | | 14,742 | | | | 24,850 | |
Adjustment to investment in unconsolidated companies: our proportionate share in interest expense, tax and depreciation and amortization in Sarulla and Ijen | | | 16,069 | | | | 13,199 | | | | 14,680 | |
Depreciation, amortization and accretion | | | 221,415 | | | | 198,603 | | | | 177,930 | |
| | | | | | | | | | | | | |
EBITDA | | | 463,502 | | | | 388,665 | | | | 374,071 | |
Mark-to-market on derivative instruments | | | (2,206 | ) | | | 1,613 | | | | 741 | |
Stock-based compensation | | | 15,478 | | | | 11,646 | | | | 9,168 | |
Make-whole premium related to long-term debt prepayment | | | — | | | | 1,102 | | | | — | |
Reversal of a contingent liability related to a business combination transaction | | | — | | | | (1,829 | ) | | | (418 | ) |
Allowance for bad debts related to February power crisis in Texas | | | — | | | | 115 | | | | 2,980 | |
Hedge losses resulting from February power crisis in Texas | | | — | | | | — | | | | 9,133 | |
Impairment of long-lived assets | | | — | | | | 32,648 | | | | — | |
Write-off of unsuccessful exploration activities | | | 3,733 | | | | 828 | | | | — | |
Merger and acquisition transaction costs | | | 1,234 | | | | 675 | | | | 5,635 | |
Tender-related deposits write-off | | | — | | | | — | | | | 134 | |
Adjusted EBITDA | | $ | 481,741 | | | $ | 435,463 | | | $ | 401,444 | |
Adjusted EBITDA for thefiscal year ended December 31, 2020 was $420.2 million,2023 increased by 10.6% compared to $384.3 million for thefiscal year ended December 31, 2019 and $368.0 million for the year ended December 31, 2018.
The following table reconciles net2022, primarily due to an increase in operating income together with an increase in income attributable to EBITDA and adjusted EBITDA for the years ended December 31, 2020, 2019 and 2018:sale of tax benefits.
| | | Year Ended December 31, | |
| | | 2020 | | | 2019 | | | 2018 | |
| | | (Dollars in thousands) | |
| | | | | | | | | | | | | |
Net income | | $ | 101,806 | | | $ | 93,543 | | | $ | 110,111 | |
Adjusted for: | | | | | | | | | | | | |
Interest expense, net (including amortization of deferred financing costs) | | | 76,236 | | | | 78,869 | | | | 69,950 | |
Income tax provision (benefit) | | | 67,003 | | | | 45,613 | | | | 34,733 | |
Adjustment to investment in an unconsolidated company: our proportionate share in interest expense, tax and depreciation and amortization in Sarulla complex | | | 11,549 | | | | 13,089 | | | | 9,184 | |
Depreciation and amortization | | | 151,371 | | | | 143,242 | | | | 127,732 | |
| | | | | | | | | | | | | |
EBITDA | | | 407,965 | | | | 374,356 | | | | 351,710 | |
Mark-to-market on derivative instruments | | | (1,192 | ) | | | (1,402 | ) | | | 2,032 | |
Stock-based compensation | | | 9,830 | | | | 9,358 | | | | 10,218 | |
Insurance proceeds in excess of assets carrying value | | | — | | | | — | | | | (7,150 | ) |
Termination fee | | | — | | | | — | | | | 4,973 | |
Impairment of goodwill, net of reversal of a contingent liability | | | — | | | | — | | | | 3,142 | |
Loss from extinguishment of liability | | | — | | | | 468 | | | | — | |
Merger and acquisition transaction costs | | | 2,279 | | | | 1,483 | | | | 2,910 | |
Settlement expenses | | | 1,277 | | | | — | | | | — | |
Write-off of unsuccessful exploration activities | | | — | | | | — | | | | 126 | |
Adjusted EBITDA | | $ | 420,159 | | | $ | 384,263 | | | $ | 367,961 | |
EBITDA includes theand Adjusted EBITDA include our proportionate share (12.75%) of net depreciation, interestSarulla's EBITDA and tax expenses from our unconsolidated investment in the Sarulla complex that is accounted for under the equity method.
Adjusted EBITDA, respectively. On May 2014, the Sarulla consortium (“SOL”) closed $1,170 million in financing. As of December 31, 2020,2023, the credit facility has an outstanding balance of $1,010.0$796.5 million. Our proportionate share in the SOL credit facility is $128.8$101.6 million. In October 2020, Sarulla has not met its debt service coverage ratio underSee Note 5, investment in unconsolidated companies to the credit facility agreement and is undergoing negotiations with its lendersconsolidated financial statements for a waiver covering this non-compliance as well as a remediation plan aimingfurther information relating to achieve complianceour investment in the future.Sarulla consortium.
Capital Expenditures
Our capital expenditures primarily relate to the enhancement of our existing power plants and the exploration, development and construction of new power plants.
We have budgeted approximately $454 million in capital expenditures for construction of new projects and enhancements to our existing power plants, of which we had invested $177 million as of December 31, 2020. We expect to invest approximately $200 million in 2021 and the remaining approximately $77 million on thereafter.
In addition, we estimate approximately $245 million in additional capital expenditures in 2021 to be allocated as follows: (i) approximately $150 million for the exploration and development of new projects and enhancements of existing power plants that are not yet released for full construction; (ii) approximately $40 million for maintenance of capital expenditures to our operating power plants including drilling in our Puna power plant; (iii) approximately $45 million for the construction and development of storage projects; and (iv) approximately $10.0 million for enhancements to our production facilities.
In the aggregate, we estimate our total capital expenditures for 2021 to be approximately $445 million.
Exposure to Market Risks
Based on current conditions, we believe that we have sufficient financial resources to fund our activities and execute our business plans. However, the cost of obtaining financing for our project needs may increase significantly or such financing may be difficult to obtain.
We, like other power plant operators, are exposed to electricity price volatility risk. Our exposure to such market risk is currently limited because many of our long-term PPAs (except for the 25 MW PPA for the Puna Complex andcomplex) because the between 30 MW and 40 MWmajority of our long-term PPAs in the aggregate for the Heber 2 power plant in the Heber Complex and the G2 power plant in the Mammoth Complex) have fixed or escalating rate provisions that limit our exposure to changes in electricity prices. Our energy storage projects sell primarily on a "merchant" basis and are exposed to changes in the electricity market prices.The energy payments under the PPAs of the Heber 2 power plant in the Heber Complex and the G2 power plant in the Mammoth Complex are determined by reference to the relevant power purchaser’s SRAC. A decline in the price of natural gas will result in a decrease in the incremental cost that the power purchaser avoids by not generating its electrical energy needs from natural gas, or by reducing the price of purchasing its electrical energy needs from natural gas power plants, which in turn will reduce the energy payments that we may charge under the relevant PPA for these power plants.prices. The Puna Complex is currently benefiting from energy prices which are higher than the floor under the 25 MW PPA for the Puna Complex.Complex as a result of higher fuel costs that impact HELCO's avoided cost. We signed a new PPA for Puna that was recently approved by the PUC, that fixes the energy rate and de-links it from oil prices, as discussed above.
As of December 31, 2020, 97.2%2023, 100.0% of our consolidated long-term debt was at fixed interest rate debt and therefore was not subject to interest rate volatility risk and 2.8%risk. Our short-term commercial paper, which was issued on October 23, 2023, bears an annual interest of our long-term debt was floating rate debt, exposing usthree months SOFR +1.1%, therefore presents an exposure to interest rate risk in connection therewith. Asvolatility. The outstanding amount of the short-term commercial paper as of December 31, 2020, $40.8 million of our long-term debt remained2023 was $100.0 million.
Our cash equivalents are subject to interest rate risk.
We currently maintain our surplus cash in short-term, interest-bearing bank deposits, money market funds, corporate bonds and debt securities and commercial paper withavailable for sale (with a minimum investment grade rating of AAA+ by Standard & Poor’s Ratings Services.Services).
Our cash equivalents are subject to interest rate risk. Fixed rate securities may have their market value adversely impacted by a rise in interest rates, while floating rate securities may produce less income than expected if interest rates fall. As a result
We are also exposed to foreign currency exchange risk, in particular the fluctuation of the U.S. dollar versus the NISNew Israeli Shekels ("NIS") in Israel and the Euro. Risks attributable to fluctuations in currency exchange rates can arise when we or any of our foreign subsidiaries borrow funds or incur operating or other expenses in one type of currency but receive revenues in another. In such cases, an adverse change in exchange rates can reduce such subsidiary’s ability to meet its debt service obligations, reduce the amount of cash and income we receive from such foreign subsidiary, or increase such subsidiary’s overall expenses. In Kenya, the tax related asset isand liability are recorded in KES similar to the tax liability, howeverKenyan Shillings ("KES"), therefore, any change in the exchange rate in the KES versus the USDU.S. dollar has an impact on our financial results. Risks attributable to fluctuations in the foreign currency exchange rates can also arise when the currency denomination of a particular contract is not the U.S. dollar. Substantially all of our PPAs in the international markets are either U.S. dollar-denominated or linked to the U.S. dollar except for our operations on Guadeloupe, where we own and operate the BoullianteBouillante power plant which sells its power under a Euro-denominated PPA with Électricité de France S.A. Our construction contracts from time to time contemplate costs which are incurred in local currencies. The way we often mitigate such risk is to receive part of the proceeds from the contract in the currency in which the expenses are incurred. Currently, we have forward and cross-currency swap contracts in place to reduce our NIS/DollarU.S. dollar currency exposure and expect to continue to use currency exchange and other derivative instruments to the extent we deem such instruments to be the appropriate tool for managing such exposure.
On July 1, 2020, we concluded an auction tender and accepted subscriptions for senior unsecured bonds comprised of NIS 1.0 billion aggregate principal amount (the “Senior Unsecured Bonds - Series 4”). The Senior Unsecured Bonds - Series 4 were issued in New Israeli Shekels and converted to approximately $290 million using a cross-currency swap transaction shortly after the completion of such issuance.Weissuance. In June 2022, we issued $431.3 million aggregate principal amount of our 2.5% convertible senior notes due in 2027. The Notes bear annual interest of 2.5%, payable semiannually in arrears, and mature on July 15, 2027, unless earlier converted, redeemed or repurchased.
We performed a sensitivity analysis on the fair values of our long-term debt obligations, commercial paper, and foreign currency exchange forward contracts. The foreign currency exchange forward contracts listed below principally relate to trading activities. The sensitivity analysis involved increasing and decreasing forward rates at December 31, 20202023 and 20192022 by a hypothetical 10% and calculating the resulting change in the fair values.
At this time, the development of our strategic plan has not exposed us to any additional market risk. However, as the implementation of the plan progresses, we may be exposed to additional or different market risks.
The results of the sensitivity analysis calculations as of December 31, 20202023 and 20192022 are presented below:
| | | Assuming a 10%
Increase in Rates | | Assuming a 10% Decrease in Rates | | | | Assuming a 10% Increase in Rates | | Assuming a 10% Decrease in Rates | | |
| | | As of December 31, | | As of December 31, | | | | As of December 31, | | As of December 31, | | |
Risk | | 2020 | | 2019 | | 2020 | | 2019 | | Change in the Fair Value of | | 2023 | | 2022 | | 2023 | | 2022 | | Change in the Fair Value of |
| | | (In thousands) | | | (In thousands) | | |
Foreign Currency | | $ | (1,996 | ) | | $ | (4,198 | ) | | $ | 2,439 | | | $ | 5,131 | | Foreign Currency Forward Contracts | | $ | (3,191 | ) | | $ | (5,093 | ) | | $ | 3,901 | | | $ | 6,220 | | Foreign Currency Forward Contracts |
Interest Rate | | $ | (3,025 | ) | | $ | (4,574 | ) | | $ | 3,090 | | | $ | 4,723 | | OFC 2 Senior Secured Notes | | (754 | ) | | (946 | ) | | 769 | | | 965 | | Mizrachi Loan |
Interest Rate | | $ | (3,193 | ) | | $ | (4,647 | ) | | $ | 3,273 | | | $ | 4,812 | | DFC Loan | | (1,090 | ) | | — | | | 1,127 | | | — | | Mizrahi Loan 2023 |
Interest Rate | | $ | (311 | ) | | $ | (516 | ) | | $ | 318 | | �� | $ | 534 | | Amatitlan loan | | (1,080 | ) | | (1,493 | ) | | 1,105 | | | 1,531 | | Hapoalim Loan |
Interest Rate | | $ | (4,278 | ) | | $ | (1,797 | ) | | $ | 4,313 | | | $ | 1,822 | | Senior Unsecured Bonds | | (2,142 | ) | | — | | | 2,216 | | | — | | Hapoalim 2023 Loan |
Interest Rate | | $ | (586 | ) | | $ | (905 | ) | | $ | 599 | | | $ | 934 | | DEG 2 Loan | | (462 | ) | | (631 | ) | | 473 | | | 648 | | HSBC Loan |
Interest Rate | | $ | (1,266 | ) | | $ | (1,835 | ) | | $ | 1,299 | | | $ | 1,906 | | DAC 1 Senior Secured Notes | | (1,067 | ) | | (1,378 | ) | | 1,093 | | | 1,416 | | Discount Loan |
Interest Rate | | $ | (3,194 | ) | | $ | (3,272 | ) | | $ | 3,270 | | | $ | 3,363 | | Migdal Loan and the Additional Migdal Loan and the Second Addendum Migdal Loan | | (3,292 | ) | | (4,096 | ) | | 3,401 | | | 4,232 | | Financing Liability - Dixie Valley |
Interest Rate | | $ | (941 | ) | | $ | (1,141 | ) | | $ | 983 | | | $ | 1,207 | | San Emidio Loan | | (3,158 | ) | | (3,693 | ) | | 3,271 | | | 3,832 | | OFC 2 LLC Senior Secured Notes ("OFC 2") |
Interest Rate | | $ | (444 | ) | | $ | (776 | ) | | $ | 450 | | | $ | 797 | | DOE Loan | | (2,532 | ) | | (3,178 | ) | | 2,617 | | | 3,295 | | Olkaria III Loan - DFC |
Interest Rate | | $ | (151 | ) | | $ | (281 | ) | | $ | 153 | | | $ | 286 | | Idaho Holdings Loan | | — | | | (259 | ) | | — | | | 268 | | Amatitlan Loan |
Interest Rate | | $ | (2,146 | ) | | $ | (2,978 | ) | | $ | 2,209 | | | $ | 3,099 | | Platanares DFC Loan | | (4,593 | ) | | (5,701 | ) | | 4,762 | | | 5,925 | | Senior Unsecured Bonds |
Interest Rate | | $ | (452 | ) | | $ | (728 | ) | | $ | 461 | | | $ | 749 | | DEG 3 Loan | | (379 | ) | | (527 | ) | | 390 | | | 544 | | Olkaria III plant 4 - DEG 2 |
Interest Rate | | $ | (179 | ) | | $ | (342 | ) | | $ | 181 | | | $ | 350 | | Plumstriker Loan | | (1,334 | ) | | (1,528 | ) | | 1,392 | | | 1,597 | | Don A. Campbell 1 Senior Secured Notes ("DAC 1") |
Interest Rate | | $ | — | | | $ | (295 | ) | | $ | — | | | $ | 298 | | Commercial Paper | | (3,230 | ) | | (3,902 | ) | | 3,337 | | | 4,045 | | Senior Unsecured Loan |
Interest Rate | | $ | (107 | ) | | $ | (201 | ) | | $ | 108 | | | $ | 204 | | Other long-term loans | | (913 | ) | | (986 | ) | | 971 | | | 1,051 | | USG Prudential - NV |
Interest Rate | | | (667 | ) | | (748 | ) | | 691 | | | 775 | | USG DOE |
Interest Rate | | | (2,239 | ) | | (2,430 | ) | | 2,399 | | | 2,606 | | USG Prudential - ID Refinancing |
Interest Rate | | | (1,854 | ) | | (2,198 | ) | | 1,929 | | | 2,293 | | Platanares Loan - DFC Loan |
Interest Rate | | | (313 | ) | | (435 | ) | | 321 | | | 448 | | Olkaria III plant 1 - DEG 3 |
Interest Rate | | | — | | | (155 | ) | | — | | | 158 | | Plumstriker Loan |
Interest Rate | | | (151 | ) | | — | | | 152 | | | — | | Commercial paper |
Interest Rate | | | (54 | ) | | (96 | ) | | 55 | | | 97 | | Other long-term loans |
In July 2019, the United Kingdom’s Financial Conduct Authority, which regulates LIBOR (London Interbank Offered Rate), announced that it intends to phase out LIBOR by the end
We have evaluated the impact of the transition from LIBOR, and currently believe that the transition will not have a material impact on our consolidated financial statements.
Effect of Inflation
We expect thatare seeing an increase in overall operating and other costs as the result of higher inflation will not be a significant riskrates, in particular in the near term, given the current global economic conditions, however, that could changeUnited States. In addition, we are experiencing an increase in raw material cost and supply chain delays, which may put pressure on our operating margins in the future.Product segment and increases our cost to build our own power plants and energy storage assets. To address the possibility of rising inflation, some of our contracts include certain provisions that mitigate inflation risk.
In connection with the Electricity segment, none of our U.S. PPAs, including the SCPPA Portfolio PPA, are directly linked to the CPI.Consumer Price Index ("CPI"). Inflation may directly impact an expense we incur for the operation of our projects, thereby increasing our overall operating costs and reducing our profit and gross margin. The negative impact of inflation would be partially offset by price adjustments built into some of our PPAs that could be triggered upon such occurrences. TheIn addition to the Puna rates that are impacted by higher commodity prices, the energy payments pursuant to our PPAs for some of our power plants such as the Brady power plant, the Steamboat 2 and 3 power plants and the McGinness Complex increase every year through the end of the relevant terms of such agreements, although such increases are not directly linked to the CPI or any other inflationary index. Lease payments are generally fixed, while royalty payments are generally calculated as a percentage of revenues and therefore are not significantly impacted by inflation. In our Product segment, inflation may directly impact fixed and variable costs incurred in the construction of ourthird party power plants, thereby increasinglowering our operating costs inprofit margins at the Product segment. We are more likely to be able to offset long term, all or part of this inflationary impact through our project pricing. With respect to power plants that we build for our own electricity production, inflationary pricing may impact our operating costs which may be partially offset in the pricing of the new long-term PPAs that we negotiate.
Interest rate increases for both short-term and long-term debt have increased sharply. Although our outstanding debt bears fixed interest rates, as we refinance it, or borrow additional amounts, we may incur additional interest expense versus expiring loans.
In recent months, we see a slowdown in inflation rates and increases in raw materials costs that we believe have returned to normal levels.
Contractual Obligations and Commercial Commitments
The following tables set forth our material contractual obligations as of December 31, 20202023 (in thousands):
| | | Payments Due by Period | | | Payments Due by Period | |
| | | Remaining
Total | | 2021 | | 2022 | | 2023 | | 2024 | | 2025 | | Thereafter | | | Remaining Total | | 2024 | | 2025 | | 2026 | | 2027 | | 2028 | | Thereafter | |
Long-term liabilities principal | | $ | 1,475,853 | | | $ | 78,602 | | | $ | 337,166 | | | $ | 134,549 | | | $ | 118,395 | | | $ | 118,831 | | | $ | 688,310 | | |
Interest on long-term liabilities (1) | | 381,869 | | | 71,771 | | | 66,687 | | | 46,759 | | | 44,196 | | | 38,279 | | | 114,177 | | |
Long-term debt and financing liability - principal | | | $ | 1,989,557 | | | $ | 178,954 | | | $ | 178,982 | | | $ | 182,654 | | | $ | 612,045 | | | $ | 167,848 | | | $ | 669,074 | |
Interest on long-term debt and financing liability (1) | | | 468,018 | | | 84,616 | | | 77,623 | | | 69,159 | | | 55,536 | | | 41,160 | | | 139,924 | |
Finance lease obligations | | 16,723 | | | 4,177 | | | 4,116 | | | 3,015 | | | 1,156 | | | 565 | | | 3,694 | | | 3,796 | | | 1,456 | | | 1,291 | | | 913 | | | 136 | | | — | | | — | |
Operating lease obligations | | 20,320 | | | 3,255 | | | 2,539 | | | 1,902 | | | 1,625 | | | 1,440 | | | 9,559 | | | 34,505 | | | 3,908 | | | 3,246 | | | 2,471 | | | 2,224 | | | 1,900 | | | 20,756 | |
Benefits upon retirement (2) | | 20,454 | | | 4,968 | | | 1,910 | | | 148 | | | 686 | | | 1,160 | | | 11,582 | | | 10,212 | | | 2,396 | | | 291 | | | 525 | | | 1,461 | | | 723 | | | 4,816 | |
Asset retirement obligation | | 63,457 | | | — | | | — | | | — | | | — | | | — | | | 63,457 | | | 114,370 | | | — | | | — | | | — | | | — | | | — | | | 114,370 | |
Purchase commitments (3) | | | 159,850 | | | 159,850 | | | — | | | — | | | — | | | — | | | — | | | 419,753 | | | 419,753 | | | — | | | — | | | — | | | — | | | — | |
| Short term revolving credit lines with banks (4) | | | 20,000 | | | 20,000 | | | — | | | — | | | — | | | — | | | — | |
| Commercial paper (5) | | | | 100,000 | | | | 100,000 | | | — | | | — | | | — | | | — | | | — | |
| | | $ | 2,138,526 | | | $ | 322,623 | | | $ | 412,418 | | | $ | 186,373 | | | $ | 166,058 | | | $ | 160,275 | | | $ | 890,779 | | | $ | 3,160,210 | | | $ | 811,083 | | | $ | 261,433 | | | $ | 255,722 | | | $ | 671,402 | | | $ | 211,631 | | | $ | 948,939 | |
| | (1) | See interest rates and maturity dates under Liquidity and Capital Resources section above. |
| | (2) | The above amounts were determined based on employees’ current salary rates and the number of years’ service that will have been accumulated at their expected retirement date. These amounts do not include amounts that might be paid to employees that will cease working with us before reaching their expected retirement age. |
| | (3) | We purchase raw materials for inventories, construction-in-process and services from a variety of vendors. During the normal course of business, in order to manage manufacturing lead times and help assure adequate supply, we enter into agreements with contract manufacturers and suppliers that either allow them to procure goods and services based upon specifications defined by us, or that establish parameters defining our requirements. At December 31, 2020,2023, total obligations related to such supplier agreements were approximately $159.9$419.8 million (approximately $77.8$251.3 million of which relate to construction-in-process). All such obligations are payable in 2021.2024. |
| | |
| (4) | Credit lines were fully prepaid in January 2024. |
| | |
| (5) | The Commercial Paper was issued for a period of 90 days and extends automatically for additional 90 day periods for up to five years, unless the Company notifies the participants otherwise or a notice of termination is provided by the participants in accordance with the provisions of the Commercial Paper Agreement. The Commercial Paper bears an annual interest of three months SOFR +1.1% which will be paid at the end of each 90 day period. Base rate was 5.3%. |
The table above does not reflect unrecognized tax benefits of $2.0$8.7 million, the timing of which is uncertain. Refer to Note 1716 to our consolidated financial statements set forth in Item 8 of this annual reportAnnual Report for additional discussion of unrecognized tax benefits. The above table also does not reflect a liability associated with the sale of tax benefits of $111.5$184.6 million, the timing of which is uncertain and other long-term liabilities of $6.2$22.1 million, primarily related to a prepayment from once of our customers, that are deemed immaterial. Refer to Note 1312 to our consolidated financial statements as set forth in Item 8 of this annual reportAnnual Report for additional discussion of our liability associated with the sale of tax benefits.
Concentration of Credit Risk
Our credit risk is currently concentrated with the following major customers: Sierra Pacific Power Company and Nevada Power Company (subsidiaries of NV Energy), KPLCSCPPA and SCPPA.KPLC. If any of these electric utilities fail to make payments under its PPAs with us, such failure would have a material adverse impact on our financial condition.condition. Also, by implementing our multi-year strategic plan we may be exposed, by expanding our customer base, to different credit profile customers than our current customers.
The Company's revenues from its primary customers as a percentage of total revenues are as follows:
| | | Year Ended December 31, | | | Year Ended December 31, | |
| | | 2020 | | | 2019 | | | 2018 | | | 2023 | | | 2022 | | | 2021 | |
| Southern California Public Power Authority (“SCPPA”) | | 20.6 | | | 17.9 | | | 15.2 | | | 21.2 | % | | 21.5 | % | | 23.7 | % |
Sierra Pacific Power Company and Nevada Power Company | | 17.5 | % | | 16.8 | % | | 16.1 | % | | 14.1 | | | 16.9 | | | 18.6 | |
Kenya Power and Lighting Co. Ltd. ("KPLC") | | 16.4 | | | 16.3 | | | 16.6 | | | 13.2 | | | 14.4 | | | 15.5 | |
We have historically been able to collect on substantially all of our receivable balances. As of December 31, 2020,2023, the amount overdue from KPLC in Kenya was $48.9$62.8 million of which $16.2$32.2 million was paid in January and February of 2021. These2024 The Company believes it will be able to collect all past due amounts are an averagein Kenya. This belief is supported by the fact that in addition to KPLC's obligations under its power purchase agreement, the Company holds a support letter from the Government of 78 days overdue. Kenya that covers certain cases of KPLC non-payment (such as where caused by government actions and/or political events).
In Honduras, as of December 31, 2023, the Company successfullytotal amount overdue from ENEE was $15.7 million of which $2.5 million was collected during the year an overdue debt from Empresa Nacional de Energía Eléctrica ("ENEE")in January and February of $20.1 million that was related2024. In addition, due to the period from October 2018 to April 2019. However, due to continuing restrictive measures related to the COVID-19 pandemicfinancial situation in Honduras, the Company may experience additional delays in collection. As of December 31, 2020, the total amount overdue from ENEE of $2.9 million was collectedThe Company believes it will be able to collect all past due amounts in January 2021. In addition, on April 30, 2020, the Company also received from ENEE a notice declaring a force majeure event in Honduras due to the impact of COVID-19 that was ultimately withdrawn.Honduras.
Government Grants and Tax Benefits
On August 16, 2022, the President of the United States signed into law the Inflation Reduction Act of 2022 (the “IRA"), which is effective for taxable years beginning after December 31, 2022. The U.S. federal government encourages productionIRA includes several tax incentives to promote climate change mitigation and clean energy, electric vehicles, battery and energy storage manufacture or purchase. Some of electricity from geothermal resourcesthese measures may materially affect our consolidated financial statements, and we are in the process of evaluating the IRA and identifying potential effects of the IRA as more guidance is issued. Furthermore, the IRA introduces the following: (i) a new corporate alternative minimum tax of 15% on adjusted financial statement income of corporations with profits greater than $1 billion over a three-year period; and (ii) an excise tax of 1% of the fair market value of any stock which is repurchased, reduced by any stock issued during the taxable year. The IRA also includes significant tax incentives for energy and climate initiatives related to Production Tax Credits (“PTC”) and Investment Tax Credits (“ITC”), including extending ITC to energy storage projects for assets placed in service after December 31, 2022 and the ability to transfer or solar energy through certain tax subsidies:sell PTCs to other taxpayers.
| •
| PTC - the PTC rules provide an income tax credit for each kWh of electricity produced from certain renewable energy sources, including geothermal, and sold to an unrelated person during a taxable year. The PTC was first introduced in 1992 and has since been revised a number of times. The PTC, which in 2020 was 2.5 cents per kWh, is adjusted annually for inflation and may be claimed for 10 years on the net electricity output sold to third parties after the project is first placed in service. The tax extender package signed into law in December 2020 provides that any qualifying project that starts construction by December 31, 2021 would be eligible for PTC. The qualifying project must ordinarily be placed in service within four years after the end of the year in which construction started or show continued construction to qualify for PTC. The PTC is not available for power produced from geothermal resources for projects that started construction on or after January 1, 2022.
|
| •
| The ITC rules have been amended a number of times. A qualified new geothermal power plant in the United States that starts construction by the end of 2021 would be eligible to claim an ITC of 30% of the project eligible cost. New solar projects that were under construction by December 31, 2019 will qualify for a 30% ITC. The credit will phase down to 26% for solar PV projects starting construction by the end of 2022 and to 22% for solar PV projects starting construction in 2023. Projects that were under construction before these deadlines must be placed in service by December 31, 2025 to qualify for the ITC at these rates. Solar projects placed in service after December 31, 2025 will only qualify for a 10% ITC. Under current tax rules, any unused tax credit has a one-year carry back and a twenty-year carry forward.
|
We are also permitted to depreciate most of the cost of a new geothermal power plant. In cases where we claim the one-time 30% (or 10%) ITC, our tax basis in the plant that is eligible for depreciation is reduced by one-half of the ITC amount. In cases where we claim the PTC, there is no reduction in the tax basis for depreciation. Projects that were placed in service in 2016 and 2017 were eligible for “bonus” depreciation of 50% of the cost of that equipment in the year the power plant was placed in service. Following the Tax Act,IRA, projects that were or will be placed in service after September 27, 2017, could qualify for a 100% bonus depreciation with respect to its qualifying assets. After applying any depreciation bonus that is available, we can depreciate the remainder of our tax basis in the plant, if any, mostly over five years on an accelerated basis, meaning that more of the cost may be deducted in the first few years than during the remainder of the depreciation period. We will continue to analyze this new provision under the ActIRA and determine if an election is appropriate as it relates to our business needs.
Ormat Systems received “Benefited Enterprise” status under Israel’s Law for Encouragement of Capital Investments, 1959 (the Investment Law), with respect to two of its investment programs through 2011. In January 2011, new legislation amending the Investment Law was enacted. Under the new legislation, a uniform rate of corporate tax will apply to all qualified income of certain industrial companies, as opposed to the previous law’s incentives that are limited to income from a “Benefited Enterprise” during their benefits period. As a result, we now pay a uniform corporate tax rate of 16% with respect to that qualified income. In January 2021, Ormat Systems received an approval from the Israeli Innovation Authority that it owns an "Innovation Promoting Enterprise" and therefore is eligible for a reduced corporate tax rate of 12% on its "Preferred Technological Income" for the tax years 2019 and 2020 (effective tax rate of approximately 13% for 2019 and 2020). This impact will be recorded in the first quarterThe tax benefit of 2021. See Note 24 to our consolidated financial statements set forth in Item 8 of this annual report for further information.
Kenyalower effective tax audit
The Company was audited by the Kenya Revenue Authority ("KRA") for income tax years 2013 to 2017 for which it had received during 2019 and 2020 three separate Notices of Assessments ("NoA") detailing different issues relating to certain findings in respect of the KRA review of such years.
On October 19, 2020, the Company entered into a settlement agreement in relation to the second NoA that was issued by the KRA on December 4, 2019 totaling approximately $190 million of proposed adjustments, including interest and penalties. The settlement agreement extended the audit period for the issues addressed within the assessment, to cover the period from 2013 through 2019 and resulted in a total settlement payment of approximately $28 million, including interest and penalties, related to late payment in respect of 2019 taxable income. Additionally, the settlement included a deferral of tax benefits to be utilized in years subsequent to 2019 in an amount of approximately $28 million. The assessment was paid on October 27, 2020.
On December 21, 2020, the Company entered into a settlement agreement with the KRA in relation to the first and third NoA's that were issued by the KRA on June 28, 2019 and May 12, 2020, respectively, totaling approximately $9 million, including interest and penalties. The total settlement amountrate is reflected in the agreement was $1.5 million, which was paid on December 28, 2020. This concluded all open audits and NoAs with the KRA.2021 net income.
ITEM 7A. QUANTITATIVE AND QUALITATIVE DISCLOSURES ABOUT MARKET RISK
Information responding to Item 7A is included in Item 7 — “Management’s Discussion and Analysis of Financial Condition and Results of Operations” of this annual report.Annual Report.
ITEM 8.FINANCIAL STATEMENTS AND SUPPLEMENTARY DATA
Index to Consolidated Financial Statements of Ormat Technologies, Inc. and Subsidiaries
Consolidated Financial Statements as of December 31, 2020 and 2019 and for Each of the Three Years in the Period Ended December 31, 2020:
Statements:
REPORT OF INDEPENDENT REGISTERED PUBLIC ACCOUNTING FIRMReport of Independent Registered Public Accounting Firm
To the Board of Directors and Stockholders of Ormat Technologies, Inc.:
Opinions on the Financial Statements and Internal Control over Financial Reporting
We have audited the accompanying consolidatedbalance sheets of Ormat Technologies, Inc. and its subsidiaries (the "Company"“Company”) as of December 31, 20202023 and 2019,2022, and the related consolidated statements of operations and comprehensive income (loss), of equity and of cash flows foreach of the three years in the period ended December 31, 2020,2023, including the related notes (collectively referred to as the “consolidated financial statements”).We also have audited the Company's internal control over financial reporting as of December 31, 2020,2023, based on criteria established in Internal Control - Integrated Framework (2013) issued by the Committee of Sponsoring Organizations of the Treadway Commission (COSO).
In our opinion, the consolidatedfinancial statements referred to above present fairly, in all material respects, the financial position of the Company as of December 31, 20202023 and 2019,2022, and the results of its operations and its cash flows for each of the three years in the period ended December 31, 20202023 in conformity with accounting principles generally accepted in the United States of America. Also in our opinion, the Company maintained, in all material respects, effective internal control over financial reporting as of December 31, 2020,2023, based on criteria established in Internal Control - Integrated Framework (2013) issued by the COSO.
Basis for Opinions
The Company's management is responsible for these consolidated financial statements, for maintaining effective internal control over financial reporting, and for its assessment of the effectiveness of internal control over financial reporting, included in Management's Report on Internal Control over Financial Reporting appearing under Item 9A. Our responsibility is to express opinions on the Company’s consolidated financial statements and on the Company's internal control over financial reporting based on our audits. We are a public accounting firm registered with the Public Company Accounting Oversight Board (United States) (PCAOB) and are required to be independent with respect to the Company in accordance with the U.S. federal securities laws and the applicable rules and regulations of the Securities and Exchange Commission and the PCAOB.
We conducted our audits in accordance with the standards of the PCAOB. Those standards require that we plan and perform the audits to obtain reasonable assurance about whether the consolidatedfinancial statements are free of material misstatement, whether due to error or fraud, and whether effective internal control over financial reporting was maintained in all material respects.
Our audits of the consolidated financial statements included performing procedures to assess the risks of material misstatement of the consolidated financial statements, whether due to error or fraud, and performing procedures that respond to those risks. Such procedures included examining, on a test basis, evidence regarding the amounts and disclosures in the consolidated financial statements. Our audits also included evaluating the accounting principles used and significant estimates made by management, as well as evaluating the overall presentation of the consolidated financial statements. Our audit of internal control over financial reporting included obtaining an understanding of internal control over financial reporting, assessing the risk that a material weakness exists, and testing and evaluating the design and operating effectiveness of internal control based on the assessed risk. Our audits also included performing such other procedures as we considered necessary in the circumstances. We believe that our audits provide a reasonable basis for our opinions.
Definition and Limitations of Internal Control over Financial Reporting
A company’s internal control over financial reporting is a process designed to provide reasonable assurance regarding the reliability of financial reporting and the preparation of financial statements for external purposes in accordance with generally accepted accounting principles. A company’s internal control over financial reporting includes those policies and procedures that (i) pertain to the maintenance of records that, in reasonable detail, accurately and fairly reflect the transactions and dispositions of the assets of the company; (ii) provide reasonable assurance that transactions are recorded as necessary to permit preparation of financial statements in accordance with generally accepted accounting principles, and that receipts and expenditures of the company are being made only in accordance with authorizations of management and directors of the company; and (iii) provide reasonable assurance regarding prevention or timely detection of unauthorized acquisition, use, or disposition of the company’s assets that could have a material effect on the financial statements.
Because of its inherent limitations, internal control over financial reporting may not prevent or detect misstatements. Also, projections of any evaluation of effectiveness to future periods are subject to the risk that controls may become inadequate because of changes in conditions, or that the degree of compliance with the policies or procedures may deteriorate.
Critical Audit Matters
The critical audit mattersmatter communicated below are mattersis a matter arising from the current period audit of the consolidated financial statements that werewas communicated or required to be communicated to the audit committee and that (i) relaterelates to accounts or disclosures that are material to the consolidated financial statements and (ii) involved our especially challenging, subjective, or complex judgments. The communication of critical audit matters does not alter in any way our opinion on the consolidated financial statements, taken as a whole, and we are not, by communicating the critical audit mattersmatter below, providing a separate opinionsopinion on the critical audit mattersmatter or on the accounts or disclosures to which they relate.it relates.
PercentageEstimates of Completion EstimatesFuture Costs in Product Revenue Recognition
As described in Note 1817 to the consolidated financial statements, $148$133.8 million of the Company's total revenuerevenues for the year ended December 31, 20202023 was generated from product revenue.revenues, the majority of which related to long-term contracts. For the Company’s long-term contracts, control transfers over time and revenue is recognized based on the extent of progress in each period towards completion of the performance obligation. The selection of the measure of progress towards completion requires management judgment and is based on the nature of the products or services to be provided. As disclosed by management, product revenue is recognized usingthe Company generally uses the percentage of completion method which requires estimating future costs over the full term of product delivery. The percentage of completion method is usedto measure progress for its contracts because management believes that measure best depicts the transfer of control to the customer, which occurs as the Company incurs costs on therelated to those contracts. Under the percentage of completion method, the extent of progress towards completion is based on the ratio of costs incurred to date compared to the total estimated costs at completion of the performance obligation. Revenue isobligation, which includes both the actual costs already incurred and the estimated costs to complete. Revenues are recognized proportionately as costs are incurred. Such estimates of future costs are made by management based on prior historical contracts that have been completed and specific project characteristics. Due to the nature of the work required to be performed to deliveron the products,performance obligation, management’s estimation of future costs to completion is complex and requires significant judgment. Management has disclosed that there are factors that can affect the accuracy of cost estimates, including, but not limited to, the ability to properly execute the engineering and design phases consistent with customer expectations, the availability and costs of labor and materials resources, and productivity.
The principal consideration for our determination that performing procedures relating to percentage offuture costs to completion estimates in product revenue recognition is a critical audit matter isare that there was significant judgment by management when developing the estimates of future costs to complete projects. This in turn led to significant auditor judgment and effort in performing procedures to evaluate management's estimates of future costs to complete projects.projects, including the assessment of management’s judgment about the Company’s ability to properly execute the engineering and design phases consistent with customer expectations and significant assumptions related to estimated expected labor costs.
Addressing the matter involved performing procedures and evaluating audit evidence in connection with forming our overall opinion on the consolidated financial statements. These procedures included testing the effectiveness of controls relating to the revenue recognition process, including controls over the determination of estimates of future costs to complete projects. These procedures also included, among others, evaluating and testing management’s process for determining the estimates of future costs for a sample of projects. Evaluating the reasonableness of significant assumptions used involved evaluating management’s ability to estimate future costs to complete projects by (i) performing a comparison of the originally estimated and actual costs incurred on similar completed projects; (ii) evaluating the timely identification of circumstances that may warrantwarranted a modification to estimated costs to complete projects, including changes in job performance, job conditions, and estimated profitability; and (iii) testing management’s process for evaluating the Company’s ability to execute the specific contract characteristics.
Realizability of Deferred Tax Assets
As described in Note 17 to the consolidated financial statements, the Company's deferred tax asset balance as of December 31, 2020 is $119 million. As disclosed by management, significant estimates are required to calculate the consolidated income tax provision and tax balances. Management calculates temporary differences resulting from differing treatments of items for tax and accounting purposes, which can result in the creation of deferred tax assets or liabilities. For those jurisdictions where the realization of net deferred tax assets is not more likely than not, a valuation allowance is recorded. In assessing the need for a valuation allowance, management estimates future taxable income by jurisdiction while also considering the feasibility of ongoing tax planning strategies and the realization of tax credits and net operating loss carryforwards. Significant estimates are required in estimating future taxable income by jurisdiction, leading to significant judgment from management.
The principal consideration for our determination that performing procedures relating to the realizability of deferred tax assets is a critical auditor matter is that there was significant judgment by management in estimating future taxable income by jurisdiction. This in turn led to significant auditor judgment and effort in performing procedures to evaluate management's estimates of future taxable income.
Addressing the matter involved performing procedures and evaluating audit evidence in connection with forming our overall opinion on the consolidated financial statements. These procedures included testing the effectiveness of controls relating to the income tax process, including controls over estimating future taxable income by jurisdiction in order to assess the realizability of deferred tax assets. These procedures also included, among others, testing management’s process for assessing the realizability of deferred tax assets, testing the completeness and accuracy of underlying data used in management’s assessment and evaluating the reasonableness of management’s assumptions related to estimating future taxable income. Evaluating management’s assumptions related to estimating future taxable income involved evaluating whether the assumptions used by management were reasonable considering (i) the current and past performance of the Company; (ii) the consistency with external market and industry data; and (iii) the consistency of the assumptions with evidence obtained in other areas of the audit.
/s/ Kesselman & Kesselman
Certified Public Accountants (Isr.)
A member firm of PricewaterhouseCoopers International Limited
Tel Aviv,
| |
Tel-Aviv, Israel February 26, 2021
| /s/ Kesselman & Kesselman |
February 23, 2024 | Certified Public Accountants (Isr.) |
| A member firm of PricewaterhouseCoopers International Limited |
| |
We have served as the Company’s auditor since 2018.
ORMAT TECHNOLOGIES, INC. AND SUBSIDIARIES
CONSOLIDATED BALANCE SHEETS
| | | December 31, | | | December 31, | |
| | | 2020 | | | 2019 | | | 2023 | | | 2022 | |
| | | (Dollars in thousands) | | | (Dollars in thousands) | |
ASSETS | ASSETS | | ASSETS | |
Current assets: | | | | | | |
Cash and cash equivalents | | $ | 448,252 | | | $ | 71,173 | | | $ | 195,808 | | | $ | 95,872 | |
Restricted cash and cash equivalents (primarily related to VIEs) | | 88,526 | | | 81,937 | | | 91,962 | | | 130,804 | |
Receivables: | | | | | | |
Trade less allowance for credit losses of $597 and $0, respectively (primarily related to VIEs) | | 149,170 | | | 154,525 | | |
Trade less allowance for credit losses of $90 and $90, respectively (primarily related to VIEs) | | | 208,704 | | | 128,818 | |
Other | | 17,987 | | | 22,048 | | | 44,530 | | | 32,415 | |
Inventories | | 35,321 | | | 34,949 | | | 45,037 | | | 22,832 | |
Costs and estimated earnings in excess of billings on uncompleted contracts | | 24,544 | | | 38,365 | | | 18,367 | | | 16,405 | |
Prepaid expenses and other | | | 15,354 | | | | 12,667 | | | | 41,595 | | | | 29,571 | |
Total current assets | | 779,154 | | | 415,664 | | | 646,003 | | | 456,717 | |
Investment in unconsolidated companies | | 98,217 | | | 81,140 | | | 125,439 | | | 115,693 | |
Deposits and other | | 66,989 | | | 38,284 | | | 44,631 | | | 39,762 | |
Deferred income taxes | | 119,299 | | | 129,510 | | | 152,570 | | | 161,365 | |
Property, plant and equipment, net ($1,978,220 and $1,880,547 related to VIEs, respectively) | | 2,099,046 | | | 1,971,415 | | |
Construction-in-process ($198,812 and $149,830 related to VIEs, respectively) | | 479,315 | | | 376,555 | | |
Operating leases right of use ($4,721 and $4,688 related to VIEs, respectively) | | 16,347 | | | 17,405 | | |
Finance leases right of use ($7,001 and $8,479 related to VIEs, respectively) | | 11,633 | | | 14,161 | | |
Property, plant and equipment, net ($2,802,920 and $2,326,491 related to VIEs, respectively) | | | 2,998,949 | | | 2,493,457 | |
Construction-in-process ($376,602 and $360,508 related to VIEs, respectively) | | | 814,967 | | | 893,198 | |
Operating leases right of use ($9,326 and $9,662 related to VIEs, respectively) | | | 24,057 | | | 23,411 | |
| Finance leases right of use ($0 and $75 related to VIEs, respectively) | | | 3,510 | | | 3,806 | |
Intangible assets, net | | 194,421 | | | 186,220 | | | 307,609 | | | 333,845 | |
Goodwill | | | 24,566 | | | | 20,140 | | | | 90,544 | | | | 90,325 | |
Total assets | | $ | 3,888,987 | | | $ | 3,250,494 | | | $ | 5,208,279 | | | $ | 4,611,579 | |
LIABILITIES AND EQUITY | LIABILITIES AND EQUITY | | LIABILITIES AND EQUITY | |
Current liabilities: | | | | | | |
Accounts payable and accrued expenses | | $ | 152,763 | | | $ | 141,857 | | | $ | 214,518 | | | $ | 149,423 | |
Short term revolving credit lines with banks (full recourse) | | 0 | | | 40,550 | | | 20,000 | | | — | |
Commercial paper | | 0 | | | 50,000 | | |
Commercial paper (less deferred financing costs of $29) | | | 99,971 | | | — | |
Billings in excess of costs and estimated earnings on uncompleted contracts | | 11,179 | | | 2,755 | | | 18,669 | | | 8,785 | |
Current portion of long-term debt: | | | | | | |
Limited and non-recourse (primarily related to VIEs): | | | | | | | 57,207 | | | 64,044 | |
Senior secured notes | | 24,949 | | | 24,473 | | |
Other loans | | 35,897 | | | 34,458 | | |
Full recourse | | 17,768 | | | 76,572 | | | 116,864 | | | 101,460 | |
Financing liability | | | 5,141 | | | 16,270 | |
Operating lease liabilities | | 2,922 | | | 2,743 | | | 3,329 | | | 2,347 | |
Finance lease liabilities | | | 3,169 | | | | 3,068 | | | | 1,313 | | | | 1,581 | |
Total current liabilities | | 248,647 | | | 376,476 | | | 537,012 | | | 343,910 | |
Long-term debt, net of current portion: | | | | | | |
Limited and non-recourse (primarily related to VIEs): | | | | | | |
Senior secured notes (less deferred financing costs of $5,318 and $6,317, respectively) | | 315,195 | | | 339,336 | | |
Other loans (less deferred financing costs of $8,557 and $10,482, respectively) | | 284,928 | | | 317,395 | | |
Full recourse: | | | | | | |
Senior unsecured bonds (less deferred financing costs of $2,086 and $675, respectively) | | 717,534 | | | 286,453 | | |
Other loans (less deferred financing costs of $1,340 and $1,519, respectively) | | 59,556 | | | 68,747 | | |
Limited and non-recourse (primarily related to VIEs and less deferred financing costs of $7,889 and $10,272, respectively) | | | 447,389 | | | 521,885 | |
Full recourse (less deferred financing costs of $3,056 and $2,995, respectively) | | | 698,187 | | | 676,512 | |
Convertible senior notes (less deferred financing costs of $8,146 and $10,445, respectively) | | | 423,104 | | | 420,805 | |
Financing liability | | | 220,619 | | | 225,759 | |
Operating lease liabilities | | 12,897 | | | 14,008 | | | 19,790 | | | 19,788 | |
Finance lease liabilities | | 9,104 | | | 11,209 | | | 2,238 | | | 2,262 | |
Liability associated with sale of tax benefits | | 111,476 | | | 123,468 | | | 184,612 | | | 166,259 | |
Deferred income taxes | | 87,972 | | | 97,126 | | | 66,748 | | | 83,465 | |
Liability for unrecognized tax benefits | | 1,970 | | | 14,643 | | | 8,673 | | | 6,559 | |
Liabilities for severance pay | | 18,749 | | | 18,751 | | | 11,844 | | | 12,833 | |
Asset retirement obligation | | 63,457 | | | 50,183 | | | 114,370 | | | 97,660 | |
Other long-term liabilities | | | 6,235 | | | | 8,039 | | | | 22,107 | | | | 3,317 | |
Total liabilities | | $ | 1,937,720 | | | $ | 1,725,834 | | | $ | 2,756,693 | | | $ | 2,581,014 | |
| | | |
Commitments and contingencies (Note 21) | | | | | | |
Commitments and contingencies (Note 20) | | | | | | |
| | | |
Redeemable noncontrolling interest | | | 9,830 | | | | 9,250 | | | | 10,599 | | | | 9,590 | |
| | | |
Equity: | | | | | | |
The Company's stockholders' equity: | | | | | | |
Common stock, par value $0.001 per share; 200,000,000 shares authorized; 55,983,259 and 51,031,652 issued and outstanding as of December 31, 2020 and December 31, 2019, respectively | | 56 | | | 51 | | |
Common stock, par value $0.001 per share; 200,000,000 shares authorized; 60,358,887 and 56,095,918 issued and outstanding as of December 31, 2023 and December 31, 2022, respectively | | | 60 | | | 56 | |
Additional paid-in capital | | 1,262,446 | | | 913,150 | | | 1,614,769 | | | 1,259,072 | |
Treasury stock, at cost (258,667 shares held as of December 31, 2023 and 2022, respectively) | | | (17,964 | ) | | (17,964 | ) |
Retained earnings | | 550,103 | | | 487,873 | | | 719,894 | | | 623,907 | |
Accumulated other comprehensive loss | | | (6,620 | ) | | | (8,654 | ) | |
Accumulated other comprehensive gain (loss) | | | | (1,332 | ) | | | 2,500 | |
Total stockholders' equity attributable to Company's stockholders | | 1,805,985 | | | 1,392,420 | | | 2,315,427 | | | 1,867,571 | |
Noncontrolling interest | | | 135,452 | | | | 122,990 | | | | 125,560 | | | | 153,404 | |
Total equity | | | 1,941,437 | | | | 1,515,410 | | | | 2,440,987 | | | | 2,020,975 | |
Total liabilities, redeemable noncontrolling interest and equity | | $ | 3,888,987 | | | $ | 3,250,494 | | | $ | 5,208,279 | | | $ | 4,611,579 | |
The accompanying notes are an integral part of the consolidated financial statements.
CONSOLIDATED STATEMENTS OF OPERATIONS AND COMPREHENSIVE INCOME (LOSS)
| | | Year Ended December 31, | | | Year Ended December 31, | |
| | | 2020 | | | 2019 | | | 2018 | | | 2023 | | | 2022 | | | 2021 | |
| | | (Dollars in thousands, except per share data) | | | (Dollars in thousands, except earnings per share data) | |
Revenues: | | | | | | | | |
Electricity | | $ | 541,393 | | | $ | 540,333 | | | $ | 509,879 | | | $ | 666,767 | | | $ | 631,727 | | | $ | 585,771 | |
Product | | 148,125 | | | 191,009 | | | 201,743 | | | 133,763 | | | 71,414 | | | 46,920 | |
Energy storage | | | 15,824 | | | | 14,702 | | | | 7,645 | | | | 28,894 | | | | 31,018 | | | | 30,393 | |
Total revenues | | | 705,342 | | | | 746,044 | | | | 719,267 | | | | 829,424 | | | | 734,159 | | | | 663,084 | |
Cost of revenues: | | | | | | | | |
Electricity | | 300,059 | | | 312,835 | | | 298,255 | | | 422,549 | | | 380,361 | | | 337,019 | |
Product | | 114,948 | | | 145,974 | | | 140,697 | | | 115,802 | | | 60,479 | | | 41,374 | |
Energy storage | | | 14,060 | | | | 17,912 | | | | 9,880 | | | | 27,055 | | | | 24,495 | | | | 20,353 | |
Total cost of revenues | | | 429,067 | | | | 476,721 | | | | 448,832 | | | | 565,406 | | | | 465,335 | | | | 398,746 | |
Gross profit | | 276,275 | | | 269,323 | | | 270,435 | | | 264,018 | | | 268,824 | | | 264,338 | |
Operating expenses: | | | | | | | | |
Research and development expenses | | 5,395 | | | 4,647 | | | 4,183 | | | 7,215 | | | 5,078 | | | 4,129 | |
Selling and marketing expenses | | 17,384 | | | 15,047 | | | 19,802 | | | 18,306 | | | 16,193 | | | 15,199 | |
General and administrative expenses | | 60,226 | | | 55,833 | | | 47,750 | | | 68,179 | | | 61,274 | | | 75,901 | |
Impairment charge | | 0 | | | 0 | | | 13,464 | | |
Impairment of long-lived assets | | | — | | | 32,648 | | | — | |
Write-off of unsuccessful exploration activities | | 0 | | | 0 | | | 126 | | | 3,733 | | | 828 | | | — | |
Business interruption insurance income | | | (20,743 | ) | | | 0 | | | | 0 | | | | — | | | | — | | | | (248 | ) |
Operating income | | 214,013 | | | 193,796 | | | 185,110 | | | 166,585 | | | 152,803 | | | 169,357 | |
Other income (expense): | | | | | | | | |
Interest income | | 1,717 | | | 1,515 | | | 974 | | | 11,983 | | | 3,417 | | | 2,124 | |
Interest expense, net | | (77,953 | ) | | (80,384 | ) | | (70,924 | ) | | (98,881 | ) | | (87,743 | ) | | (82,658 | ) |
Derivatives and foreign currency transaction gains (losses) | | 3,802 | | | 624 | | | (4,761 | ) | | (3,278 | ) | | (6,044 | ) | | (14,720 | ) |
Income attributable to sale of tax benefits | | 25,720 | | | 20,872 | | | 19,003 | | | 61,157 | | | 33,885 | | | 29,582 | |
Other non-operating income (expense), net | | | 1,418 | | | | 880 | | | | 7,779 | | | | 1,519 | | | | (709 | ) | | | (134 | ) |
Income from operations before income tax and equity in earnings (losses) of investees | | 168,717 | | | 137,303 | | | 137,181 | | | 139,085 | | | 95,609 | | | 103,551 | |
Income tax (provision) benefit | | (67,003 | ) | | (45,613 | ) | | (34,733 | ) | | (5,983 | ) | | (14,742 | ) | | (24,850 | ) |
Equity in earnings (losses) of investees, net | | | 92 | | | | 1,853 | | | | 7,663 | | |
Equity in earnings (losses) of investees | | | | 35 | | | | (3,072 | ) | | | (2,624 | ) |
Net income | | 101,806 | | | 93,543 | | | 110,111 | | | 133,137 | | | 77,795 | | | 76,077 | |
Net income attributable to noncontrolling interest | | | (16,350 | ) | | | (5,448 | ) | | | (12,145 | ) | | | (8,738 | ) | | | (11,954 | ) | | | (13,985 | ) |
Net income attributable to the Company's stockholders | | $ | 85,456 | | | $ | 88,095 | | | $ | 97,966 | | | | 124,399 | | | $ | 65,841 | | | $ | 62,092 | |
Comprehensive income: | | | | | | | | |
Net income | | 101,806 | | | 93,543 | | | 110,111 | | | 133,137 | | | 77,795 | | | 76,077 | |
Other comprehensive income (loss), net of related taxes: | | | | | | | | |
Change in foreign currency translation adjustments | | 3,813 | | | (1,810 | ) | | (1,831 | ) | | 1,257 | | | (2,486 | ) | | (3,236 | ) |
Change in unrealized gains or losses in respect of the Company's share in derivatives instruments of unconsolidated investment | | (3,975 | ) | | (3,417 | ) | | 2,235 | | |
Change in unrealized gains or losses in respect of a cross currency swap derivative instrument that qualifies as a cash flow hedge | | 3,366 | | | 0 | | | 0 | | |
Change in unrealized gains or losses in respect of the Company's share in derivatives instruments of unconsolidated investment that qualifies as a cash flow hedge | | | (470 | ) | | 8,370 | | | 3,892 | |
Change in unrealized gains or losses in respect of a cross currency swap derivative instrument that qualifies as a cash flow hedge (net of related tax of $1,511 and $464, respectively) | | | (4,237 | ) | | (1,825 | ) | | 2,379 | |
Change in unrealized gains or losses on marketable securities available-for-sale (net of related tax of $0) | | | — | | | 40 | | | (40 | ) |
Other changes in comprehensive income | | | 274 | | | | 44 | | | | 24 | | | | 53 | | | | 59 | | | | 228 | |
Comprehensive income | | 105,284 | | | 88,360 | | | 110,539 | | | $ | 129,740 | | | 81,953 | | | 79,300 | |
Comprehensive income attributable to noncontrolling interest | | | (17,794 | ) | | | (5,120 | ) | | | (11,666 | ) | | | (9,173 | ) | | | (11,421 | ) | | | (12,779 | ) |
Comprehensive income attributable to the Company's stockholders | | $ | 87,490 | | | $ | 83,240 | | | $ | 98,873 | | | $ | 120,567 | | | $ | 70,532 | | | $ | 66,521 | |
Earnings per share attributable to the Company's stockholders: | | | | | | | | |
Basic: | | $ | 1.66 | | | $ | 1.73 | | | $ | 1.93 | | | $ | 2.09 | | | $ | 1.17 | | | $ | 1.11 | |
Diluted: | | $ | 1.65 | | | $ | 1.72 | | | $ | 1.92 | | | $ | 2.08 | | | $ | 1.17 | | | $ | 1.10 | |
Weighted average number of shares used in computation of earnings per share attributable to the Company's stockholders: | | | | | | | | |
Basic | | | 51,567 | | | | 50,867 | | | | 50,643 | | | | 59,424 | | | | 56,063 | | | | 56,004 | |
Diluted | | | 51,937 | | | | 51,227 | | | | 50,969 | | | | 59,762 | | | | 56,503 | | | | 56,402 | |
The accompanying notes are an integral part of the consolidated financial statements. |
ORMAT TECHNOLOGIES, INC. AND SUBSIDIARIES
CONSOLIDATED STATEMENTS OF EQUITY
| | | The Company's Stockholders' Equity | | | | | | | | | |
| | | | | | | | | | | | | | | | | | | | | | | Accumulated | | | | | | | | | | | | | |
| | | | | | | | | | | Additional | | | | | | | | | | | Other | | | | | | | | | | | | | |
| | | Common Stock | | | Paid-in | | | Treasury | | | Retained | | | Comprehensive | | | | | | | Noncontrolling | | | Total | |
| | | Shares | | | Amount | | | Capital | | | Stock | | | Earnings | | | Income (Loss) | | | Total | | | Interest | | | Equity | |
| | | (Dollars in thousands, except per share data) | |
Balance at December 31, 2020 | | | 55,983 | | | $ | 56 | | | $ | 1,262,446 | | | $ | — | | | $ | 550,103 | | | $ | (6,620 | ) | | $ | 1,805,985 | | | $ | 135,452 | | | $ | 1,941,437 | |
Stock-based compensation | | | — | | | | — | | | | 9,168 | | | | — | | | | — | | | | — | | | | 9,168 | | | | — | | | | 9,168 | |
Exercise of options by employees and directors (*) | | | 73 | | | | — | | | | — | | | | — | | | | — | | | | — | | | | — | | | | — | | | | — | |
Cash paid to noncontrolling interest | | | — | | | | — | | | | — | | | | — | | | | — | | | | — | | | | — | | | | (5,507 | ) | | | (5,507 | ) |
Cash dividend declared, $0.48 per share | | | — | | | | — | | | | — | | | | — | | | | (26,986 | ) | | | — | | | | (26,986 | ) | | | — | | | | (26,986 | ) |
Stock issuance costs reimbursement | | | — | | | | — | | | | 311 | | | | — | | | | — | | | | — | | | | 311 | | | | — | | | | 311 | |
Increase in noncontrolling interest in Steamboat Hills | | | — | | | | — | | | | — | | | | — | | | | — | | | | — | | | | — | | | | 1,357 | | | | 1,357 | |
Net income | | | — | | | | — | | | | — | | | | — | | | | 62,092 | | | | — | | | | 62,092 | | | | 13,366 | | | | 75,458 | |
Other comprehensive income (loss), net of related taxes: | | | | | | | | | | | | | | | | | | | | | | | | | | | | | | | | | | | | |
Change in foreign currency translation adjustments | | | — | | | | — | | | | — | | | | — | | | | — | | | | (2,030 | ) | | | (2,030 | ) | | | (1,206 | ) | | | (3,236 | ) |
Change in unrealized gains or losses in respect of the Company's share in derivative instruments of unconsolidated investment that qualifies as a cash flow hedge | | | — | | | | — | | | | — | | | | — | | | | — | | | | 3,892 | | | | 3,892 | | | | — | | | | 3,892 | |
Change in unrealized gains or losses in respect of a cross currency swap derivative instrument that qualifies as a cash flow hedge (net of related tax of $817) | | | — | | | | — | | | | — | | | | — | | | | — | | | | 2,379 | | | | 2,379 | | | | — | | | | 2,379 | |
Change in unrealized gains or losses on marketable securities available-for-sale | | | — | | | | — | | | | — | | | | — | | | | — | | | | (40 | ) | | | (40 | ) | | | — | | | | (40 | ) |
Other | | | — | | | | — | | | | — | | | | — | | | | — | | | | 228 | | | | 228 | | | | — | | | | 228 | |
Balance at December 31, 2021 | | | 56,056 | | | | 56 | | | | 1,271,925 | | | | — | | | | 585,209 | | | | (2,191 | ) | | | 1,854,999 | | | | 143,462 | | | | 1,998,461 | |
Stock-based compensation | | | — | | | | — | | | | 11,646 | | | | — | | | | — | | | | — | | | | 11,646 | | | | — | | | | 11,646 | |
Exercise of options by employees and directors (*) | | | 299 | | | | — | | | | 39 | | | | — | | | | — | | | | — | | | | 39 | | | | — | | | | 39 | |
Purchase of treasury stock | | | (259 | ) | | | — | | | | — | | | | (17,964 | ) | | | — | | | | — | | | | (17,964 | ) | | | — | | | | (17,964 | ) |
Purchase of capped call transactions | | | — | | | | — | | | | (24,538 | ) | | | — | | | | — | | | | — | | | | (24,538 | ) | | | — | | | | (24,538 | ) |
Cash paid to noncontrolling interest | | | — | | | | — | | | | — | | | | — | | | | — | | | | — | | | | — | | | | (4,811 | ) | | | (4,811 | ) |
Cash dividend declared, $0.48 per share | | | — | | | | — | | | | — | | | | — | | | | (27,143 | ) | | | — | | | | (27,143 | ) | | | — | | | | (27,143 | ) |
Increase in noncontrolling interest in CD4 | | | — | | | | — | | | | — | | | | — | | | | — | | | | — | | | | — | | | | 3,970 | | | | 3,970 | |
Net income | | | — | | | | — | | | | — | | | | — | | | | 65,841 | | | | — | | | | 65,841 | | | | 11,316 | | | | 77,157 | |
Other comprehensive income (loss), net of related taxes: | | | | | | | | | | | | | | | | | | | | | | | | | | | | | | | | | | | | |
Foreign currency translation adjustments | | | — | | | | — | | | | — | | | | — | | | | — | | | | (1,953 | ) | | | (1,953 | ) | | | (533 | ) | | | (2,486 | ) |
Change in unrealized gains or losses in respect of the Company's share in derivative instruments of unconsolidated investment | | | — | | | | — | | | | — | | | | — | | | | — | | | | 8,370 | | | | 8,370 | | | | — | | | | 8,370 | |
Change in unrealized gains or losses in respect of a cross currency swap derivative instrument that qualifies as a cash flow hedge (net of related tax of $464) | | | — | | | | — | | | | — | | | | — | | | | — | | | | (1,825 | ) | | | (1,825 | ) | | | — | | | | (1,825 | ) |
Change in unrealized gains or losses on marketable securities available-for-sale | | | — | | | | — | | | | — | | | | — | | | | — | | | | 40 | | | | 40 | | | | — | | | | 40 | |
Other | | | — | | | | — | | | | — | | | | — | | | | — | | | | 59 | | | | 59 | | | | — | | | | 59 | |
Balance at December 31, 2022 | | | 56,096 | | | | 56 | | | | 1,259,072 | | | | (17,964 | ) | | | 623,907 | | | | 2,500 | | | | 1,867,571 | | | | 153,404 | | | | 2,020,975 | |
Stock-based compensation | | | — | | | | — | | | | 15,478 | | | | — | | | | — | | | | — | | | | 15,478 | | | | — | | | | 15,478 | |
Exercise of stock-based awards by employees and directors (*) | | | 123 | | | | — | | | | 314 | | | | — | | | | — | | | | — | | | | 314 | | | | — | | | | 314 | |
Issuance of common stock | | | 4,140 | | | | 4 | | | | 341,667 | | | | — | | | | — | | | | — | | | | 341,671 | | | | — | | | | 341,671 | |
Cash paid to noncontrolling interest | | | — | | | | — | | | | — | | | | — | | | | — | | | | — | | | | — | | | | (7,648 | ) | | | (7,648 | ) |
Change in noncontrolling interest rights (net if related tax of $338) | | | — | | | | — | | | | 901 | | | | — | | | | — | | | | — | | | | 901 | | | | (2,038 | ) | | | (1,137 | ) |
Cash dividend declared, $0.48 per share | | | — | | | | — | | | | — | | | | — | | | | (28,412 | ) | | | — | | | | (28,412 | ) | | | — | | | | (28,412 | ) |
Transaction with noncontrolling interest | | | — | | | | — | | | | (2,663 | ) | | | — | | | | — | | | | — | | | | (2,663 | ) | | | (26,392 | ) | | | (29,055 | ) |
Net income | | | — | | | | — | | | | — | | | | — | | | | 124,399 | | | | — | | | | 124,399 | | | | 7,799 | | | | 132,198 | |
Other comprehensive income (loss), net of related taxes: | | | | | | | | | | | | | | | | | | | | | | | | | | | | | | | | | | | | |
Foreign currency translation adjustments | | | — | | | | — | | | | — | | | | — | | | | — | | | | 822 | | | | 822 | | | | 435 | | | | 1,257 | |
Change in unrealized gains or losses in respect of the Company's share in derivative instruments of unconsolidated investment that qualifies as a cash flow hedge | | | — | | | | — | | | | — | | | | — | | | | — | | | | (470 | ) | | | (470 | ) | | | — | | | | (470 | ) |
Change in unrealized gains or losses in respect of a cross currency swap derivative instrument that qualifies as a cash flow hedge (net of related tax of $1,511) | | | — | | | | — | | | | — | | | | — | | | | — | | | | (4,237 | ) | | | (4,237 | ) | | | — | | | | (4,237 | ) |
Other | | | — | | | | — | | | | — | | | | — | | | | — | | | | 53 | | | | 53 | | | | — | | | | 53 | |
Balance at December 31, 2023 | | | 60,359 | | | | 60 | | | | 1,614,769 | | | | (17,964 | ) | | | 719,894 | | | | (1,332 | ) | | | 2,315,427 | | | | 125,560 | | | | 2,440,987 | |
(*) Resulted in an amount lower than $1 thousand.
The accompanying notes are an integral part of the consolidated financial statements. |
ORMAT TECHNOLOGIES, INC. AND SUBSIDIARIES
CONSOLIDATED STATEMENTS OF EQUITYCASH FLOWS
| | | The Company's Stockholders' Equity | | | | | |
| | | | | | | | | | | | | | | Retained | | | Accumulated | | | | | | | | | | | | | |
| | | | | | | | | | | Additional | | | Earnings | | | Other | | | | | | | | | | | | | |
| | | Common Stock | | | Paid-in | | | (Accumulated | | | Comprehensive | | | | | | | Noncontrolling | | | Total | |
| | | Shares | | | Amount | | | Capital | | | Deficit) | | | Income (Loss) | | | Total | | | Interest | | | Equity | |
| | | (Dollars in thousands, except per share data) | |
Balance at January 1, 2018 | | | 50,609 | | | $ | 51 | | | $ | 888,778 | | | $ | 351,090 | | | $ | (4,706 | ) | | $ | 1,235,213 | | | $ | 84,322 | | | $ | 1,319,535 | |
Stock-based compensation | | | — | | | | 0 | | | | 10,218 | | | | 0 | | | | 0 | | | | 10,218 | | | | 0 | | | | 10,218 | |
Exercise of options by employees and directors | | | 91 | | | | 0 | | | | 0 | | | | 0 | | | | 0 | | | | 0 | | | | 0 | | | | 0 | |
Cash paid to noncontrolling interest | | | — | | | | 0 | | | | 0 | | | | 0 | | | | 0 | | | | 0 | | | | (10,972 | ) | | | (10,972 | ) |
Cash dividend declared, $0.53 per share | | | — | | | | 0 | | | | 0 | | | | (26,834 | ) | | | 0 | | | | (26,834 | ) | | | 0 | | | | (26,834 | ) |
Increase in noncontrolling interest in Guadeloupe | | | — | | | | 0 | | | | 0 | | | | 0 | | | | 0 | | | | 0 | | | | 5,339 | | | | 5,339 | |
Increase in noncontrolling interest related to the Tungsten transaction | | | — | | | | 0 | | | | 0 | | | | 0 | | | | 0 | | | | 0 | | | | 996 | | | | 996 | |
Tax effect of partnership interest buyout | | | — | | | | 0 | | | | 2,367 | | | | 0 | | | | 0 | | | | 2,367 | | | | 0 | | | | 2,367 | |
Purchase of U.S. Geothermal | | | — | | | | 0 | | | | 0 | | | | 0 | | | | 0 | | | | 0 | | | | 34,898 | | | | 34,898 | |
Net income | | | — | | | | 0 | | | | 0 | | | | 97,966 | | | | 0 | | | | 97,966 | | | | 11,155 | | | | 109,121 | |
Other comprehensive income (loss), net of related taxes: | | | | | | | | | | | | | | | | | | | | | | | | | | | | | | | | |
Foreign currency translation adjustments | | | — | | | | 0 | | | | 0 | | | | 0 | | | | (1,352 | ) | | | (1,352 | ) | | | (479 | ) | | | (1,831 | ) |
Change in respect of derivative instruments designated for cash flow hedge (net of related tax of $24) | | | — | | | | 0 | | | | 0 | | | | 0 | | | | 81 | | | | 81 | | | | 0 | | | | 81 | |
Change in unrealized gains or losses in respect of the Company's share in derivative instruments of unconsolidated investment (net of related tax of $0) | | | — | | | | 0 | | | | 0 | | | | 0 | | | | 2,235 | | | | 2,235 | | | | 0 | | | | 2,235 | |
Amortization of unrealized gains in respect of derivative instruments designated for cash flow hedge (net of related tax of $18) | | | — | | | | 0 | | | | 0 | | | | 0 | | | | (57 | ) | | | (57 | ) | | | 0 | | | | (57 | ) |
Balance at December 31, 2018 | | | 50,700 | | | | 51 | | | | 901,363 | | | | 422,222 | | | | (3,799 | ) | | | 1,319,837 | | | | 125,259 | | | | 1,445,096 | |
Cumulative effect of changes in accounting principles | | | — | | | | 0 | | | | 0 | | | | (58 | ) | | | 0 | | | | (58 | ) | | | 0 | | | | (58 | ) |
Adjusted balance as of the beginning of the year | | | 50,700 | | | | 51 | | | | 901,363 | | | | 422,164 | | | | (3,799 | ) | | | 1,319,779 | | | | 125,259 | | | | 1,445,038 | |
Stock-based compensation | | | — | | | | 0 | | | | 9,358 | | | | 0 | | | | 0 | | | | 9,358 | | | | 0 | | | | 9,358 | |
Exercise of options by employees and directors | | | 332 | | | | 0 | | | | 2,429 | | | | 0 | | | | 0 | | | | 2,429 | | | | 0 | | | | 2,429 | |
Cash paid to noncontrolling interest | | | — | | | | 0 | | | | 0 | | | | 0 | | | | 0 | | | | 0 | | | | (8,329 | ) | | | (8,329 | ) |
Cash dividend declared, $0.44 per share | | | — | | | | 0 | | | | 0 | | | | (22,386 | ) | | | 0 | | | | (22,386 | ) | | | 0 | | | | (22,386 | ) |
Increase in noncontrolling interest in McGinness Hills 3 | | | — | | | | 0 | | | | 0 | | | | 0 | | | | 0 | | | | 0 | | | | 2,072 | | | | 2,072 | |
Net income | | | — | | | | 0 | | | | 0 | | | | 88,095 | | | | 0 | | | | 88,095 | | | | 4,316 | | | | 92,411 | |
Other comprehensive income (loss), net of related taxes: | | | | | | | | | | | | | | | | | | | | | | | | | | | | | | | | |
Foreign currency translation adjustments | | | — | | | | 0 | | | | 0 | | | | 0 | | | | (1,482 | ) | | | (1,482 | ) | | | (328 | ) | | | (1,810 | ) |
Change in respect of derivative instruments designated for cash flow hedge | | | — | | | | 0 | | | | 0 | | | | 0 | | | | 75 | | | | 75 | | | | 0 | | | | 75 | |
Change in unrealized gains or losses in respect of the Company's share in derivative instruments of unconsolidated investment | | | — | | | | 0 | | | | 0 | | | | 0 | | | | (3,417 | ) | | | (3,417 | ) | | | 0 | | | | (3,417 | ) |
Amortization of unrealized gains in respect of derivative instruments designated for cash flow hedge | | | — | | | | 0 | | | | 0 | | | | 0 | | | | (31 | ) | | | (31 | ) | | | 0 | | | | (31 | ) |
Balance at December 31, 2019 | | | 51,032 | | | | 51 | | | | 913,150 | | | | 487,873 | | | | (8,654 | ) | | | 1,392,420 | | | | 122,990 | | | | 1,515,410 | |
Cumulative effect of changes in accounting principles | | | — | | | | 0 | | | | 0 | | | | (755 | ) | | | 0 | | | | (755 | ) | | | 0 | | | | (755 | ) |
Adjusted balance as of the beginning of the year | | | 51,032 | | | | 51 | | | | 913,150 | | | | 487,118 | | | | (8,654 | ) | | | 1,391,665 | | | | 122,990 | | | | 1,514,655 | |
Stock-based compensation | | | — | | | | 0 | | | | 9,830 | | | | 0 | | | | 0 | | | | 9,830 | | | | 0 | | | | 9,830 | |
Exercise of stock-based awards by employees and directors | | | 178 | | | | 0 | | | | 0 | | | | 0 | | | | 0 | | | | 0 | | | | 0 | | | | 0 | |
Common stock issuance | | | 4,773 | | | | 5 | | | | 339,466 | | | | 0 | | | | 0 | | | | 339,471 | | | | 0 | | | | 339,471 | |
Cash paid to noncontrolling interest | | | — | | | | 0 | | | | 0 | | | | 0 | | | | 0 | | | | 0 | | | | (6,756 | ) | | | (6,756 | ) |
Cash dividend declared, $0.44 per share | | | — | | | | 0 | | | | 0 | | | | (22,471 | ) | | | 0 | | | | (22,471 | ) | | | 0 | | | | (22,471 | ) |
Increase in noncontrolling interest | | | — | | | | 0 | | | | 0 | | | | 0 | | | | 0 | | | | 0 | | | | 2,754 | | | | 2,754 | |
Net income | | | — | | | | 0 | | | | 0 | | | | 85,456 | | | | 0 | | | | 85,456 | | | | 15,020 | | | | 100,476 | |
Other comprehensive income (loss), net of related taxes: | | | | | | | | | | | | | | | | | | | | | | | | | | | | | | | | |
Foreign currency translation adjustments | | | — | | | | 0 | | | | 0 | | | | 0 | | | | 2,369 | | | | 2,369 | | | | 1,444 | | | | 3,813 | |
Change in unrealized gains or losses in respect of the Company's share in derivative instruments of unconsolidated investment (net of related tax of $0) | | | — | | | | 0 | | | | 0 | | | | 0 | | | | (3,975 | ) | | | (3,975 | ) | | | 0 | | | | (3,975 | ) |
Change in unrealized gains or losses in respect of a cross currency swap derivative instrument that qualifies as a cash flow hedge (net of related tax of $1,095) | | | — | | | | 0 | | | | 0 | | | | 0 | | | | 3,366 | | | | 3,366 | | | | 0 | | | | 3,366 | |
Other comprehensive income | | | — | | | | 0 | | | | 0 | | | | 0 | | | | 274 | | | | 274 | | | | 0 | | | | 274 | |
Balance at December 31, 2020 | | | 55,983 | | | | 56 | | | | 1,262,446 | | | | 550,103 | | | | (6,620 | ) | | | 1,805,985 | | | | 135,452 | | | | 1,941,437 | |
| | | Year Ended December 31, | |
| | | 2023 | | | 2022 | | | 2021 | |
| | | (Dollars in thousands) | |
Cash flows from operating activities: | | | | | | | | | | | | |
Net income | | $ | 133,137 | | | $ | 77,795 | | | $ | 76,077 | |
Adjustments to reconcile net income to net cash provided by operating activities: | | | | | | | | | | | | |
Depreciation and amortization | | | 224,797 | | | | 198,792 | | | | 182,972 | |
Accretion of asset retirement obligation | | | 6,164 | | | | 5,257 | | | | 3,977 | |
Stock-based compensation | | | 15,478 | | | | 11,646 | | | | 9,168 | |
Income attributable to sale of tax benefits, net of interest expense | | | (23,462 | ) | | | (13,153 | ) | | | (12,201 | ) |
Equity in losses (earnings) of investees, net | | | (35 | ) | | | 3,072 | | | | 2,624 | |
Mark-to-market of derivative instruments | | | (2,206 | ) | | | 1,613 | | | | 741 | |
Loss (gain) on disposal of property, plant and equipment | | | 35 | | | | (89 | ) | | | — | |
Write-off of unsuccessful exploration activities | | | 3,733 | | | | 828 | | | | — | |
Impairment of long-lived assets | | | — | | | | 32,648 | | | | — | |
Loss from prepayment of a long-term loan | | | — | | | | 1,102 | | | | — | |
Loss (gain) on severance pay fund asset | | | 154 | | | | 1,019 | | | | (1,335 | ) |
Deferred income tax provision | | | (6,017 | ) | | | (18,979 | ) | | | (3,115 | ) |
Liability for unrecognized tax benefits | | | 2,114 | | | | 829 | | | | 3,760 | |
Other | | | — | | | | 575 | | | | 526 | |
Changes in operating assets and liabilities, net of businesses acquired: | | | | | | | | | | | | |
Receivables | | | (97,640 | ) | | | (19,929 | ) | | | 26,738 | |
Costs and estimated earnings in excess of billings on uncompleted contracts | | | (1,962 | ) | | | (6,713 | ) | | | 14,852 | |
Inventories | | | (22,205 | ) | | | 5,613 | | | | 4,127 | |
Prepaid expenses and other | | | (3,248 | ) | | | 4,888 | | | | (19,105 | ) |
Change in operating lease right of use asset | | | 3,761 | | | | 2,717 | | | | 3,010 | |
Deposits and other | | | (7,900 | ) | | | 2,571 | | | | (4,154 | ) |
Accounts payable and accrued expenses | | | 68,590 | | | | (2,045 | ) | | | (21,936 | ) |
Billings in excess of costs and estimated earnings on uncompleted contracts | | | 9,884 | | | | (463 | ) | | | (1,931 | ) |
Liabilities for severance pay | | | (989 | ) | | | (2,861 | ) | | | (3,055 | ) |
Change in operating lease liabilities | | | (3,435 | ) | | | (3,581 | ) | | | (2,816 | ) |
Other liabilities, net | | | 10,653 | | | | (2,178 | ) | | | (102 | ) |
Net cash provided by operating activities | | | 309,401 | | | | 280,974 | | | | 258,822 | |
Cash flows from investing activities: | | | | | | | | | | | | |
Purchase of marketable securities | | | — | | | | (19,192 | ) | | | (60,070 | ) |
Maturities of marketable securities | | | — | | | | 32,645 | | | | 16,272 | |
Sale of marketable securities | | | — | | | | 29,355 | | | | — | |
Capital expenditures | | | (618,383 | ) | | | (563,476 | ) | | | (419,272 | ) |
Cash received from insurance recoveries | | | — | | | | 600 | | | | — | |
Investment in unconsolidated companies | | | (10,181 | ) | | | (4,509 | ) | | | (6,401 | ) |
Cash paid for acquisition of a business, net of cash acquired | | | — | | | | — | | | | (171,000 | ) |
Decrease (increase) in severance pay fund asset, net of payments made to retired employees | | | 221 | | | | 1,171 | | | | 3,189 | |
Other investing activities | | | — | | | | — | | | | (911 | ) |
Net cash used in investing activities | | | (628,343 | ) | | | (523,406 | ) | | | (638,193 | ) |
Cash flows from financing activities: | | | | | | | | | | | | |
Proceeds from long-term loans, net of transaction costs | | | 149,837 | | | | 135,259 | | | | 275,000 | |
Proceeds from exercise of options by employees | | | 314 | | | | 39 | | | | — | |
Proceeds from issuance of common stock, net of stock issuance costs | | | 341,671 | | | | — | | | | 311 | |
Proceeds from issuance of convertible notes, net of transaction costs | | | — | | | | 419,698 | | | | — | |
Purchase of capped call instruments | | | — | | | | (24,538 | ) | | | — | |
Purchase of treasury stock | | | — | | | | (17,964 | ) | | | — | |
Proceeds from the sale of limited liability company interest, net of transaction costs | | | 42,329 | | | | 50,330 | | | | 37,141 | |
Repayments of commercial paper and prepayments of long-term debt | | | — | | | | (219,126 | ) | | | — | |
Proceeds from issuance of commercial paper, net of transaction costs | | | 99,971 | | | | — | | | | — | |
Proceeds from revolving credit lines with banks | | | 55,000 | | | | — | | | | — | |
Repayment of revolving credit lines with banks | | | (35,000 | ) | | | — | | | | — | |
Cash received from noncontrolling interest | | | 7,341 | | | | 5,443 | | | | 5,390 | |
Transaction with noncontrolling interest | | | (30,000 | ) | | | — | | | | — | |
Repayments of long-term debt and financing liability | | | (207,039 | ) | | | (185,163 | ) | | | (93,046 | ) |
Cash paid to noncontrolling interest | | | (9,856 | ) | | | (5,880 | ) | | | (6,903 | ) |
Payments under finance lease obligations | | | (1,963 | ) | | | (2,983 | ) | | | (3,181 | ) |
Deferred debt issuance costs | | | (4,229 | ) | | | (1,699 | ) | | | (1,341 | ) |
Cash dividends paid | | | (28,412 | ) | | | (27,143 | ) | | | (26,986 | ) |
Net cash provided by (used in) financing activities | | | 379,964 | | | | 126,273 | | | | 186,385 | |
Effect of exchange rate changes on cash and cash equivalents and restricted cash and cash equivalents | | | 72 | | | | (609 | ) | | | (348 | ) |
Net change in cash and cash equivalents and restricted cash and cash equivalents | | $ | 61,094 | | | $ | (116,768 | ) | | $ | (193,334 | ) |
Cash and cash equivalents and restricted cash and cash equivalents at beginning of period | | | 226,676 | | | | 343,444 | | | | 536,778 | |
Cash and cash equivalents and restricted cash and cash equivalents at end of period | | $ | 287,770 | | | $ | 226,676 | | | $ | 343,444 | |
Supplemental disclosure of cash flow information: | | | | | | | | | | | | |
Cash paid during the year for: | | | | | | | | | | | | |
Interest, net of interest capitalized | | $ | 72,236 | | | $ | 69,132 | | | $ | 66,627 | |
Income taxes, net | | $ | 26,250 | | | $ | 29,004 | | | $ | 34,357 | |
Supplemental non-cash investing and financing activities: | | | | | | | | | | | | |
Increase (decrease) in accounts payable related to purchases of property, plant and equipment | | $ | (12,417 | ) | | $ | 4,764 | | | $ | 7,976 | |
Right of use assets obtained in exchange for new lease liabilities | | $ | 6,402 | | | $ | 8,759 | | | $ | 6,175 | |
Increase in asset retirement cost and asset retirement obligation | | $ | 10,546 | | | $ | 7,512 | | | $ | 12,153 | |
The accompanying notes are an integral part of the consolidated financial statements. |
ORMAT TECHNOLOGIES, INC. AND SUBSIDIARIES
CONSOLIDATED STATEMENTS OF CASH FLOWS| | | Year Ended December 31, | |
| | | 2020 | | | 2019 | | | 2018 | |
| | | (Dollars in thousands) | |
Cash flows from operating activities: | | | | | | | | | | | | |
Net income | | $ | 101,806 | | | $ | 93,543 | | | $ | 110,111 | |
Adjustments to reconcile net income to net cash provided by operating activities: | | | | | | | | | | | | |
Depreciation and amortization | | | 156,612 | | | | 148,761 | | | | 132,233 | |
Accretion of asset retirement obligation | | | 3,232 | | | | 2,709 | | | | 2,474 | |
Stock-based compensation | | | 9,830 | | | | 9,358 | | | | 10,218 | |
Amortization of deferred lease income | | | 0 | | | | (2,685 | ) | | | (2,685 | ) |
Income attributable to sale of tax benefits, net of interest expense | | | (12,090 | ) | | | (10,084 | ) | | | (8,609 | ) |
Equity in losses (earnings) of investees, net | | | (92 | ) | | | (1,853 | ) | | | (7,663 | ) |
Mark-to-market of derivative instruments | | | (1,192 | ) | | | (1,402 | ) | | | 2,032 | |
Write-off of unsuccessful exploration activities | | | 0 | | | | 0 | | | | 126 | |
Impairment charge | | | 0 | | | | 0 | | | | 13,464 | |
Loss (gain) on severance pay fund asset | | | (893 | ) | | | (1,016 | ) | | | 1,186 | |
Deferred income tax provision | | | 5,102 | | | | 27,896 | | | | 19,360 | |
Liability for unrecognized tax benefits | | | (12,673 | ) | | | 2,874 | | | | 2,879 | |
Deferred lease revenues | | | 0 | | | | (574 | ) | | | (402 | ) |
Gain from insurance recoveries | | | 0 | | | | 0 | | | | (4,463 | ) |
Other | | | 338 | | | | 914 | | | | 100 | |
Changes in operating assets and liabilities, net of businesses acquired: | | | | | | | | | | | | |
Receivables | | | 3,520 | | | | (15,133 | ) | | | (29,928 | ) |
Costs and estimated earnings in excess of billings on uncompleted contracts | | | 13,821 | | | | 3,765 | | | | (1,185 | ) |
Inventories | | | 178 | | | | 5,500 | | | | (9,318 | ) |
Prepaid expenses and other | | | (2,687 | ) | | | 3,452 | | | | (11,172 | ) |
Change in operating lease right of use asset | | | 3,825 | | | | 8,167 | | | | 0 | |
Deposits and other | | | (893 | ) | | | (22,525 | ) | | | 18 | |
Accounts payable and accrued expenses | | | (5,373 | ) | | | 8,738 | | | | (56,724 | ) |
Billings in excess of costs and estimated earnings on uncompleted contracts | | | 8,424 | | | | (15,647 | ) | | | (1,839 | ) |
Liabilities for severance pay | | | (2 | ) | | | 757 | | | | (3,147 | ) |
Change in operating lease liabilities | | | (3,765 | ) | | | (8,405 | ) | | | 0 | |
Other liabilities, net | | | (2,023 | ) | | | (617 | ) | | | (11,244 | ) |
Net cash provided by operating activities | | | 265,005 | | | | 236,493 | | | | 145,822 | |
Cash flows from investing activities: | | | | | | | | | | | | |
Capital expenditures | | | (320,738 | ) | | | (279,986 | ) | | | (258,521 | ) |
Cash received from insurance recoveries | | | 4,700 | | | | 35,435 | | | | 10,427 | |
Investment in unconsolidated companies | | | (20,960 | ) | | | (10,674 | ) | | | (3,800 | ) |
Buyout of Class B membership in OPC | | | 0 | | | | 0 | | | | 2,367 | |
Cash paid for acquisition of a business, net of cash acquired | | | (43,397 | ) | | | 0 | | | | (95,093 | ) |
Decrease (increase) in severance pay fund asset, net of payments made to retired employees | | | 845 | | | | 687 | | | | 2,186 | |
Other investing activities | | | (6,419 | ) | | | 0 | | | | 0 | |
Net cash used in investing activities | | | (385,969 | ) | | | (254,538 | ) | | | (342,434 | ) |
Cash flows from financing activities: | | | | | | | | | | | | |
Proceeds from sale of membership interests to noncontrolling interest, net of transaction costs | | | 0 | | | | 0 | | | | 3,174 | |
Proceeds from long-term loans, net of transaction costs | | | 419,262 | | | | 132,847 | | | | 214,700 | |
Proceeds from exercise of options by employees | | | 0 | | | | 2,429 | | | | 0 | |
Proceeds from issuance of common stock, net of stock issuance costs | | | 339,471 | | | | 0 | | | | 0 | |
Proceeds from the sale of limited liability company interest, net of transaction costs | | | 0 | | | | 58,289 | | | | 32,175 | |
Repayments of commercial paper and prepayments of long-term debt | | | (50,000 | ) | | | (21,073 | ) | | | 0 | |
Proceeds from issuance of commercial paper | | | 0 | | | | 50,000 | | | | 0 | |
Proceeds from revolving credit lines with banks | | | 1,249,400 | | | | 1,450,850 | | | | 4,097,000 | |
Repayment of revolving credit lines with banks | | | (1,289,950 | ) | | | (1,569,300 | ) | | | (3,989,500 | ) |
Cash received from noncontrolling interest | | | 7,577 | | | | 3,346 | | | | 4,134 | |
Repayments of long-term debt | | | (135,384 | ) | | | (72,708 | ) | | | (62,774 | ) |
Cash paid to noncontrolling interest | | | (9,739 | ) | | | (9,730 | ) | | | (13,106 | ) |
Payments under finance lease obligations | | | (2,890 | ) | | | (3,164 | ) | | | (2,551 | ) |
Deferred debt issuance costs | | | (1,798 | ) | | | (5,165 | ) | | | (5,287 | ) |
Cash dividends paid | | | (22,471 | ) | | | (22,386 | ) | | | (26,834 | ) |
Net cash provided by (used in) financing activities | | | 503,478 | | | | (5,765 | ) | | | 251,131 | |
Effect of exchange rate changes | | | 1,154 | | | | (575 | ) | | | (660 | ) |
Net change in cash and cash equivalents and restricted cash and cash equivalents | | | 383,668 | | | | (24,385 | ) | | | 53,859 | |
Restricted cash and cash equivalents acquired in a business combination | | | 0 | | | | 0 | | | | 26,993 | |
Cash and cash equivalents and restricted cash and cash equivalents at beginning of period | | | 153,110 | | | | 177,495 | | | | 96,643 | |
Cash and cash equivalents and restricted cash and cash equivalents at end of period | | $ | 536,778 | | | $ | 153,110 | | | $ | 177,495 | |
Supplemental disclosure of cash flow information: | | | | | | | | | | | | |
Cash paid during the year for: | | | | | | | | | | | | |
Interest, net of interest capitalized | | $ | 60,830 | | | $ | 61,628 | | | $ | 53,864 | |
Income taxes, net | | $ | 64,795 | | | $ | 1,649 | | | $ | 18,028 | |
Supplemental non-cash investing and financing activities: | | | | | | | | | | | | |
Increase (decrease) in accounts payable related to purchases of property, plant and equipment | | $ | 3,148 | | | $ | 9,423 | | | $ | (6,878 | ) |
Right of use assets obtained in exchange for new lease liabilities | | $ | 3,642 | | | $ | 11,626 | | | $ | 8,584 | |
Increase in asset retirement cost and asset retirement obligation | | $ | 8,963 | | | $ | 8,334 | | | $ | 881 | |
The accompanying notes are an integral part of the consolidated financial statements.
|
ORMAT TECHNOLOGIES, INC. AND SUBSIDIARIES
NOTES TO CONSOLIDATED FINANCIAL STATEMENTS
NOTE 1 — BUSINESS AND SIGNIFICANT ACCOUNTING POLICIES
Business
The Company is primarily engaged in the geothermal and recovered energy business and primarily designs, develops, builds, sells, owns and operates clean, environmentally friendly geothermal and recovered energy-based power plants, usually using equipment that it designs and manufactures. The Company owns and operates geothermal and recovered energy-based power plants in various countries, including the United States, Kenya, Guatemala, Guadeloupe and Honduras. The Company’s equipment manufacturing operations are primarily located in Israel. Additionally, the Company owns and operates independent storage facilities in the United States providing energy storage and related services.
Most of the Company’s domestic power plant facilities are Qualifying Facilities under the PURPA. The Power Purchase Agreements ("PPAs") for certain of such facilities are dependent upon their maintaining Qualifying Facility status.
Rounding
Dollar amounts, except per share data, in the notes to these financial statements are rounded to the closest $1,000, unless otherwise indicated.
Basis of presentation
The consolidated financial statements are prepared in accordance with accounting principles generally accepted in the United States of America (“U.S. GAAP”) and include the accounts of the Company and of all majority-owned subsidiaries in which the Company exercises control over operating and financial policies, and variable interest entities in which the Company has an interest and is the primary beneficiary. Intercompany accounts and transactions have been eliminated in consolidation.
Investments in less-than-majority-owned entities or other entities in which the Company exercises significant influence over operating and financial policies are accounted for using the equity method of accounting or consolidated if they are a variable interest entity in which the Company has an interest and is the primary beneficiary. Under the equity method, original investments are recorded at cost and adjusted by the Company’s share of undistributed earnings or losses of such companies. The Company’s earnings or losses in investments accounted for under the equity method have been reflected as “equity in earnings (losses) of investees, net” on the Company’s consolidated statements of operations and comprehensive income (loss).
Use of estimates in preparation of financial statements
The preparation of financial statements in conformity with U.S. GAAP requires management to make estimates and assumptions that affect the reported amounts of assets and liabilities and the disclosure of contingent assets and liabilities at the dates of such financial statements and the reported amounts of revenues and expenses during the reporting periods. Actual results could differ from those estimates. The most significant estimates with regard to the Company’s consolidated financial statements relate to the useful lives of property, plant and equipment, impairment of goodwill and long-lived assets, including intangible assets, revenue recognition of product sales using the percentage of completion method, asset retirement obligations, and the provision for income taxes.
Cash and cash equivalents
The Company considers all highly liquid instruments, with an original maturity of three months or less, to be cash equivalents.
Restricted cash, cash equivalents, and marketable securities
Under the terms of certain long-term debt agreements, the Company is required to maintain certain debt service reserves, including principal and interest, cash collateral and operating fund accounts, including for future wells drilling, that have been classified as restricted cash and cash equivalents. Funds that will be used to satisfy obligations due during the next 12 months are classified as current restricted cash and cash equivalents, with the remainder classified as non-current restricted cash and cash equivalents.equivalents, if applicable. Such amounts wereare invested primarily in money market accounts and commercial paper with a minimum investment grade of “A”.
ORMAT TECHNOLOGIES, INC. AND SUBSIDIARIES
NOTES TO CONSOLIDATED FINANCIAL STATEMENTS
Reconciliation of cash and cash equivalents and restricted cash and cash equivalents
The following table provides a reconciliation of cash and cash equivalents and restricted cash and cash equivalents reported on the balance sheetsheets that sum to the total of the same amounts shown on the statement of cash flows:
| | | December 31, | | | December 31, | |
| | | 2020 | | | 2019 | | | 2018 | | | 2023 | | 2022 | | 2021 | |
| | | (Dollars in thousands) | | | (Dollars in thousands) | |
Cash and cash equivalents | | $ | 448,252 | | | $ | 71,173 | | | $ | 98,802 | | | $ | 195,808 | | | $ | 95,872 | | | $ | 239,278 | |
Restricted cash and cash equivalents | | | 88,526 | | | | 81,937 | | | | 78,693 | | | | 91,962 | | | | 130,804 | | | | 104,166 | |
Total cash and cash equivalents and restricted cash and cash equivalents | | $ | 536,778 | | | $ | 153,110 | | | $ | 177,495 | | | $ | 287,770 | | | $ | 226,676 | | | $ | 343,444 | |
Marketable securities
The Company’s investments in marketable securities consisted of debt securities with maturity of up to one year and a high credit rating. The investments in marketable securities were classified as available-for-sale ("AFS") and thus measured at fair value based on quoted market prices. Unrealized gains and losses from AFS debt securities were excluded from earnings and reported net of the related tax effect in "Accumulated other comprehensive income (loss)". Realized gains and losses from sale of marketable securities, as determined on a specific identification basis, as well as interest income earned, were included in earnings. The Company considered available evidence in evaluating potential impairments of its investments, including credit market conditions, credit ratings of the security as well as the extent to which fair value is less than amortized cost. The Company estimated the lifetime expected credit losses for all AFS debt securities in an unrealized loss position under its allowance for credit losses model. The Company assessed the security’s credit indicators, including credit ratings when estimating a security’s probability of default. If the assessment indicated that an expected credit loss existed, the Company determined the portion of the unrealized loss attributable to credit deterioration and records an allowance for the expected credit loss in earnings. Unrealized gains and losses attributable to non-credit factors were recorded in "Accumulated other comprehensive income (loss)", net of tax. Marketable debt securities with original maturities of three months or less that are readily convertible into a known amount of cash are presented under "Cash and cash equivalents" in the consolidated balance sheets. The Company sold all of its investments in marketable securities during the second quarter of 2022.
Concentration of credit risk
Financial instruments which potentially subject the Company to concentration of credit risk consist principally of temporary cash investments, accounts receivable and accounts receivable.the cross-currency swap transaction.
The Company places its temporary cash investments with high credit quality financial institutions located in the U.S. and in foreign countries. At December 31, 20202023 and 2019,2022, the Company had deposits totaling $18.9$43.2 million and $12.9$10.0 million, respectively, in ten United States financial institutions that were federally insured up to $250,000 per account. At December 31, 20202023 and 2019,2022, the Company’s deposits in foreign countries of approximately $72.4$57.5 million and $84.8$64.3 million, respectively, were not insured.
At December 31, 20202023 and 2019,2022, accounts receivable related to operations in foreign countries amounted to approximately $111.3$152.2 million and $118.8$78.9 million, respectively. At December 31, 20202023 and 2019,2022, accounts receivable from the Company’s major customers (see Note 1817) amounted to approximately 65%57% and 58%60%, respectively, of the Company’s accounts receivable. The aggregate amount of notes receivable exceeding 10% of total receivables for the year ended December 31, 2023 and 2022 is $161.0 million and $89.8 million, respectively.
The Company has historically been able to collect substantially all of its receivable balances. As of December 31, 2020,2023, the amount overdue from KPLC in Kenya was $48.9$62.8 million of which $16.2$32.2 million was paid in January and February of 2021.2024. These amounts represent an average of 78 days overdue. The Company believes it will be able to collect all past due amounts in Kenya. This belief is supported by the fact that in addition to KPLC's obligations under its power purchase agreement, the Company holds a support letter from the Government of Kenya that covers certain cases of KPLC non-payment (such as where caused by government actions/actions and/or political events). Additionally, on April 17, 2020, the company received from KPLC a notice declaring a force majeure event in Kenya due to the impact of COVID-19 that was withdrawn by KPLC in early September 2020. In addition, the Company experienced a higher rate of curtailments in the second quarter of 2020 by KPLC in the Olkaria complex that was later reduced in the third quarter of 2020. The impact of the curtailments is limited as the structure of the PPA secures the vast majority of the Company's revenues with fixed capacity payments unrelated to the electricity actually generated.
In Honduras, as of December 31, 2023, the Company successfullytotal amount overdue from ENEE was $15.7 million of which $2.5 million was collected during the year an overdue debt from Empresa Nacional de Energía Eléctrica ("ENEE") in January and February of $20.1 million that was related2024. In addition, due to the period from October 2018 to April 2019. However, due to continuing restrictive measures related to the COVID-19 pandemicfinancial situation in Honduras, the Company may experience additional delays in collection. AsThe Company believes it will be able to collect all past due amounts in Honduras.
ORMAT TECHNOLOGIES, INC. AND SUBSIDIARIES
NOTES TO CONSOLIDATED FINANCIAL STATEMENTS
Additionally, the Company considers the counterparty credit risk related to the cross-currency swap, as further described in note 11 to the consolidated financial statements, when assessing the hedge effectiveness, noting such risk to be low as of December 31, 2020, 2023.the total amount overdue from ENEE of $2.9 million was collected in January 2021. In addition, on April 30, 2020, the Company also received from ENEE a notice declaring a force majeure event in Honduras due to the impact of COVID-19 that was ultimately withdrawn.
The Company may experience delays in collection in other locations due to the restrictive measures related to the COVID-19 pandemic which were imposed globally to different extents.
Inventories
Inventories consist primarily of raw material parts and sub-assemblies for power units and are stated at the lower of cost or net realizable value, using the weighted-average cost method. Inventories are reduced by a provision for slow-moving and obsolete inventories. This provision was not material at December 31, 20202023 and 2019.2022.
ORMAT TECHNOLOGIES, INC. AND SUBSIDIARIES
NOTES TO CONSOLIDATED FINANCIAL STATEMENTS
Deposits and other
Deposits and other consist primarily of performance bonds for construction and storage projects, long-term insurance contract funds and receivables, certain deferred costs and derivative instruments.instrument receivables, as applicable.
Property, plant and equipment, net
Property, plant and equipment are stated at cost. All costs associated with the acquisition, development and construction of power plants operated by the Company are capitalized. Major improvements are capitalized and repairs and maintenance (including major maintenance) costs are expensed. Power plants operated by the Company, which include geothermal wells and exploration and resource development costs, are depreciated using the straight-line method over their estimated useful lives, which range from 15 to 30 years. The other assets are depreciated using the straight-line method over the following estimated useful lives of the assets:
| | | Years | | Years |
Buildings | | | 25 | | | 25 |
Leasehold improvements | | 15 | - | 30 | | 15 | | 30 |
Machinery and equipment — manufacturing and drilling | | | 10 | | | 10 |
Machinery and equipment — computers | | 3 | - | 5 | | 3 | | 5 |
Energy storage equipment | | | 15 | | | 15 |
Solar facility equipment | | | 30 |
Office equipment — furniture and fixtures | | 5 | - | 15 | | 5 | | 15 |
Office equipment — other | | 5 | - | 10 | | 5 | | 10 |
Vehicles | | 5 | - | 7 | | 5 | | 7 |
The cost and accumulated depreciation of items sold or retired are removed from the accounts. Any resulting gain or loss is recognized currently and recorded in the accompanying statements of operations.
The Company capitalizes interest costs as part of constructing power plant facilities. Such capitalized interest is recorded as part of the asset to which it relates and is amortized over the asset’s estimated useful life. Capitalized interest costs amounted to $10.4$17.3 million, $3.3$18.7 million, and $3.7$14.6 million for the years ended December 31, 2020,2023, 20192022 and 2018,2021, respectively.
During the fourth quarter of 2022, the Company recorded a non-cash impairment charge, primarily related to its Brawley power plant as further detailed below under the caption "Impairment of long-lived assets"
Exploration and development costs
The Company capitalizes costs incurred in connection with the exploration and development of geothermal resources once it acquires land rights to the potential geothermal resource. Prior to acquiring land rights, the Company makes an initial assessment that an economically feasible geothermal reservoir is probable on that land. The Company determines the economic feasibility of potential geothermal resources internally, with all available data and external assessments vetted through the exploration department and occasionally using outside service providers. Costs associated with the initial assessment are expensed and included in cost of electricity revenues in the consolidated statements of operations and comprehensive income (loss). Such costs were immaterial during the years ended December 31, 2020,2023, 20192022 and 2018.2021. It normally takes two to three years from the time active exploration of a particular geothermal resource begins to the time a production well is in operation, assuming the resource is commercially viable. However, in certain sites the process may take longer due to permitting delays, transmission constraints or any other commercial milestones that are required to be reached in order to pursue the development process.
ORMAT TECHNOLOGIES, INC. AND SUBSIDIARIES
NOTES TO CONSOLIDATED FINANCIAL STATEMENTS
In most cases, the Company obtains the right to conduct the geothermal development and operations on land owned by the Bureau of Land Management ("BLM"), various states or with private parties. The up-front bonus payments and other related costs, such as legal fees, are capitalized and included in construction-in-process. The annual land lease payments made during the exploration, development and construction phase are accounted under lease accounting as further described under the caption Leases below and reflected as expenses in “electricityunder “Electricity cost of revenues” in the consolidated statements of operations and comprehensive income (loss). Upon commencement of power generation on the leased land, the Company begins to pay the lessor’s long-term royalty payments based on the utilization of the geothermal resources as defined in the respective agreements. Such payments are expensed when the related revenues are earned and included in “electricity“Electricity cost of revenues” in the consolidated statements of operations and comprehensive income (loss).
ORMAT TECHNOLOGIES, INC. AND SUBSIDIARIES
NOTES TO CONSOLIDATED FINANCIAL STATEMENTS
Following the acquisition of land rights to the potential geothermal resource, the Company conducts further studies and surveys, including water and soil analyses, among others, and augments its database with the results of these studies. The Company then initiates a suite of geophysical surveys to assess the resource and determine drilling locations. If the results of these activities support the initial assessment of the feasibility of the geothermal resource, the Company then proceeds to exploratory drilling and other related activities which may include drilling of temperature gradient holes, drilling of slim holes, building access roads to drilling locations, drilling full size production and/or injection wells and flow tests. If the slim hole supports a conclusion that the geothermal resource will support a commercially viable power plant, it may be converted to a full-size commercial well, used either for extraction or re-injection of geothermal fluids, or be used as an observation well to monitor and define the geothermal resource. Costs associated with these activities and other directly attributable costs, including interest once physical exploration activities begin and permitting costs are capitalized and included in “construction-in-process”“Construction-in-process”. If the Company concludes that a geothermal resource will not support commercial operations, capitalized costs are expensed in the period such determination is made.
When deciding whether to continue holding lease rights and/or to pursue exploration activity, the Company diligently prioritizes prospective investments, taking into account resource and probability assessments in order to make informed decisions about whether a particular project will support commercial operation. As a result, write-off of unsuccessful activities forDuring the years ended December 31, 2020,2023 2019and 20182022, was $0.0 million, $0.0the Company wrote-off $3.7 million and $0.1$0.8 million respectively.of unsuccessful exploration activities, respectively, that the Company decided to no longer pursue. There were no write-offs of unsuccessful exploration activities in 2021.
All exploration and development costs that are being capitalized will be depreciated over their estimated useful lives when the related geothermal power plant is substantially complete and ready for use. A geothermal power plant is substantially complete and ready for use when electricity generation commences.
Asset retirement obligation
The Company records the fair value of a legal liability for an asset retirement obligation in the period in which it is incurred. The Company’s legal liabilities include plugging wells and post-closure costs of power producing and storage sites. When a new liability for asset retirement obligations is recorded, the Company capitalizes the costs of the liability by increasing the carrying amount of the related long-lived asset. The liability is accreted to its present value each period, and the capitalized cost is depreciated over the useful life of the related asset. The Company periodically reassesses the assumptions used to estimate the expected cash flows required to settle the asset retirement obligation, including changes in estimated probabilities, amounts, and timing of the settlement of the asset retirement obligation, as well as changes in the legal requirements of an obligation and revises the previously recorded asset retirement obligation accordingly. At retirement, the obligation is settled for its recorded amount at a gain or loss.
Deferred financing costs
Deferred financing costs are presented as a direct deduction from the carrying value of the associated debt liability or under "Deposits and other" if associated with lines of credit. Such deferred costs are amortized over the term of the related obligation using the effective interest method or ratably, as applicable. Amortization of deferred financing costs is presented as interest expense in the consolidated statements of operations and comprehensive income (loss). Amortization expense for the years ended December 31, 2020,2023, 20192022 and 20182021 amounted to $3.5$5.9 million, $5.4$4.2 million, and $4.6$3.2 million, respectively. During the years ended December 31, 2020,2023, 20192022 and 2018,2021, no material amounts were written-off as a result of extinguishment of liabilities.
Goodwill
Goodwill represents the excess of the fair value of consideration transferred in the business combination transactions over the fair value of tangible and intangible assets acquired, net of the fair value of liabilities assumed and the fair value of any noncontrolling interest in the acquisitions. Goodwill is not amortized but rather subject to a periodic impairment testing on an annual basis, which the Company performs on December 31 of each year, or if an event occurs or circumstances change that would more likely than not reduce the fair value of the reporting unit below its carrying amount. Additionally, an entityit is permitted to first assess qualitative factors to determine whether a quantitative goodwill impairment test is necessary. Further testing is only required if the entity determines, based on the qualitative assessment, that it is more likely than not that a reporting unit’s fair value is less than its carrying amount. Otherwise, no further impairment testing is required. An entity has the option to bypass the qualitative assessment for any reporting unit in any period and proceed directly to the quantitative goodwill impairment test. This would not preclude the entity from performing the qualitative assessment in any subsequent period. The quantitative assessment compares the fair value of the reporting unit to its carrying value, including goodwill. Under ASU 2017-04, Intangibles – Goodwill and Other (Topic 350), which was adopted by the Company in 2018,an entity should recognize an impairment charge for the amount by which the carrying amount of the reporting unit exceeds its fair value as calculated under step one described above.value. However, the loss recognized should not exceed the total amount of goodwill allocated to that reporting unit. For further information relating to goodwill see Note 9 - Intangible Assets and Goodwill to the consolidated financial statements.
ORMAT TECHNOLOGIES, INC. AND SUBSIDIARIES
NOTES TO CONSOLIDATED FINANCIAL STATEMENTS
Intangible assets
Intangible assets consist of allocated acquisition costs of PPAs, which are amortized using the straight-line method over the 156 to 29-year19-year terms of the agreements (see Note 9) as well as acquisition costs allocation related to the Company's Energy Storage segment activities that are amortized over a period of between approximately 6 and 19 years. Intangible assets are tested for recoverability whenever events or changes in circumstances indicate that their carrying amount may not be recoverable. In case there are no such events or change in circumstances, there is no need to perform thean impairment testing. The recoverability is tested by comparing the net carrying value of the intangible assets to the undiscounted net cash flows to be generated from the use and eventual disposition of these assets. If the carrying amount of a long-lived asset (or asset group) is not recoverable, the fair value of the asset (asset group) is measured and if the carrying amount exceeds the fair value, an impairment loss is recognized.
Impairment of long-lived assets and long-lived assets to be disposed of
The Company evaluates long-lived assets, such as property, plant and equipment and construction-in-process for impairment whenever events or changes in circumstances indicate that the carrying amount of an asset may not be recoverable. Factors which could trigger an impairment include, among others, significant underperformance relative to historical or projected future operating results, significant changes in the Company’s use of assets or its overall business strategy, negative industry or economic trends, a determination that an exploration project will not support commercial operations, a determination that a suspended project is not likely to be completed, a significant increase in costs necessary to complete a project, legal factors relating to its business or when it concludes that it is more likely than not that an asset will be disposed of or sold.
The Company tests its operating plants that are operated together as a complex for impairment at the complex level because the cash flows of such plants result from significant shared operating activities. For example, the operating power plants in a complex are managed under a combined operation management generally with one central control room that controls all of the power plants in a complex and one maintenance group that services all of the power plants in a complex. As a result, the cash flows from individual plants within a complex are not largely independent of the cash flows of other plants within the complex. The Company tests for impairment of its operating plants which are not operated as a complex as well as its projects under exploration, development or construction that are not part of an existing complex at the plant or project level. To the extent an operating plant becomes part of a complex, the Company will test for impairment at the complex level.
Recoverability of assets to be held and used is measured by a comparison of the carrying amount of an asset to the estimated future net undiscounted cash flows expected to be generated by the asset. The significant assumptions that the Company uses in estimating its undiscounted future cash flows include: (i) projected generating capacity of the complex or power plant and rates to be received under the respective PPAs and expected market rates thereafter and (ii) projected operating expenses of the relevant complex or power plant. Estimates of future cash flows used to test recoverability of a long-lived asset under development also include cash flows associated with all future expenditures necessary to develop the asset.
If the assets are considered to be impaired, the impairment to be recognized is measured by the amount by which the carrying amount of the assets exceeds their fair value. Assets to be disposed of are reported at the lower of the carrying amount or fair value less costs to sell. Management believes that 0as of December 31, 2023, no impairment exists for long-lived assets;assets, however, estimates as to the recoverability of such assets may change based on revised circumstances. If actual cash flows differ significantly from the Company’s current estimates, a material impairment charge may be required in the future.
During the fourth quarter of 2022, the Company recorded a non-cash impairment charge of $30.5 million relating to its Brawley power plant. Further information relating to this impairment charge is disclosed under Note 8 - Property, Plant and Equipment to the consolidated financial statements.
Derivative instruments
Derivative instruments (including certain derivative instruments embedded in other contracts) are measured at their fair value and recorded as either assets or liabilities unless exempted from derivative treatment as a normal purchase and sale. Changes in the fair value of derivatives not designated as hedging instruments are recognized in earnings. Changes in the fair value of derivatives designated as cash flow hedging instruments are initially recorded in "Other comprehensive income (loss)" and a corresponding amount is reclassified out of "Accumulated other comprehensive income (loss)" tointo earnings to offset the remeasurementimpact of the underlying hedge transaction which also impactswhen it affects earnings under the same line item in the consolidated statements of operations and comprehensive income.
ORMAT TECHNOLOGIES, INC. AND SUBSIDIARIES
NOTES TO CONSOLIDATED FINANCIAL STATEMENTS
The Company maintains a risk management strategy that may incorporate the use of swap contracts, put options, forward exchange contracts, interest rate swaps, and cross-currency swaps to minimize significant fluctuation in cash flows and/or earnings that are caused by oil and natural gas prices, exchange rate or interest rate volatility.
Foreign currency translation
The U.S. dollar is the functional currency for all of the Company’s consolidated operations and those of its equity affiliates except for the Guadeloupe power plant and the Company's operations under the Product segment in New Zealand. For those entities, all gains and losses from currency translations are included within the line itemunder “Derivatives and foreign currency transaction gains (losses)” withinin the consolidated statements of operations and comprehensive income (loss). The Euro and New Zealand Dollar are the functional currencies of the Guadeloupe power plant and the Company's operations in Guadeloupe and New Zealand, respectively, and thus the impact from currency translation adjustments in those locations areis included as currency translation adjustments in Accumulated"Accumulated other comprehensive incomeincome" in the consolidated statements of equity and in comprehensive income. The accumulated currency translation adjustments amounted to $(0.9)a debit of $2.3 million and $1.5a debit of $3.1 million as of December 31, 20202023 and 2019,2022, respectively.
ORMAT TECHNOLOGIES, INC. AND SUBSIDIARIES
NOTES TO CONSOLIDATED FINANCIAL STATEMENTS
Comprehensive income (loss) reporting
Comprehensive income (loss) includes net income or loss plus other comprehensive income (loss), which for the Company consists primarily of changes in foreign currency translation adjustments, changes in unrealized gains or losses in respect of the Company’s share in derivatives instruments of an unconsolidated investment foreign currency translation adjustments andthat qualifies as a cash flow hedge, changes in respect of derivative instruments designated as a cash flow hedge.hedge and changes in unrealized gains or losses on marketable securities available-for-sale. The changes in foreign currency translation adjustments included under other comprehensive income (loss) during the years ended December 31, 2020,2023, 20192022 and 20182021 were immaterialamounted to $1.3 million, $(2.5) million and the$(3.2) million, respectively. The changes in the Company’s share in derivative instruments of an unconsolidated investment and gains or losses in respect of derivative instruments designated as a cash flow hedge are disclosed under Note 5 – Investment in unconsolidated companies and Note 7 - Fair value of financial instruments, respectively, to the consolidated financial statements.
Power purchase agreements
Substantially all of the Company’s Electricity revenues are recognized pursuant to PPAs in the United States and in various foreign countries, including Kenya, Guatemala, Guadeloupe and Honduras. These PPAs generally provide for the payment of energy payments or both energy and capacity payments through their respective terms which expire in varying periods from 20222025 to 2047. Generally, capacity payments are calculated based on the amount of time that the power plants are available to generate electricity. The energy payments are calculated based on the amount of electrical energy delivered at a designated delivery point. The price terms are customary in the industry and include, among others, a fixed price, SRAC (the incremental cost that the power purchaser avoids by not having to generate such electrical energy itself or purchase it from others), and a fixed price with an escalation clause that includes the value for environmental attributes, known as renewable energy credits. Certain of the PPAs provide for bonus payments in the event that the Company is able to exceed certain target levels and potential payments by the Company if it fails to meet minimum target levels. The Company has PPAs that give the power purchaser or its designee a right of first refusal or a right of first offer to acquire the geothermal power plants at fair market value as negotiated between the parties. One of the Company’s subsidiaries in Guatemala sells power at an agreed upon price subject to terms of a “take or pay” PPA.
Pursuant to the terms of certain of the PPAs, the Company may be required to make payments to the relevant power purchaser under certain conditions, such as shortfall in delivery of renewable energy and energy credits, and not meeting certain performance threshold requirements, as defined in the relevant PPA. The amount of payment required is dependent upon the level of shortfall in delivery or performance requirements and is recorded in the period the shortfall occurs. In addition, if the Company does not meet certain minimum performance requirements, the capacity of the power plant may be permanently reduced.
Revenues and cost of revenues
Upon adoption of ASU 2014-09, Revenue from Contracts with Customers (Topic 606) on January 1, 2018, revenuesRevenues from contracts with customers are recognized in connection with the transfer of goods or services to customers in an amount that reflects the consideration to which the entity expects to be entitled in exchange for those goods or services. Specifically, the Company is required to apply each of the following steps: (1) identify the contract(s) with the customer; (2) identify the performance obligations in the contracts; (3) determine the transaction price; (4) allocate the transaction price to the performance obligations in the contract; and (5) recognize revenue when (or as) the entity satisfies a performance obligation.
ORMAT TECHNOLOGIES, INC. AND SUBSIDIARIES
NOTES TO CONSOLIDATED FINANCIAL STATEMENTS
Revenues are primarily related to: (i) sale of electricity from geothermal and recovered energy-based power plants owned and operated by the Company; (ii) geothermal and recovered energy-based power plant equipment engineering, sale, construction and installation, and operating services and (iii) Energy storage services as well as services relating to the engineering, procurement, construction, operation and maintenance of energy storage units.related services.
Electricity segment revenues: Revenues related to the sale of electricity from geothermal and recovered energy-based power plants and capacity payments are recorded based upon output delivered and capacity provided at rates specified under relevant contract terms. The Company assesses whether PPAs entered into, modified, or acquired in business combinations contain a lease element requiring lease accounting. Revenue from such PPAs are accounted for in electricity revenues. In the Electricity segment, revenues for all but fiveeight power plants are accounted as operating leases, and therefore equipment related to geothermal and recovered energy generation power plants as described in Note 8 is considered held for leasing. For power plants in the scope of ASC 606, the Company identified electricity as a separate performance obligation. Performance obligations identified were evaluated and determined to be satisfied over time and qualified for the invoicing practical expedient since the invoiced amounts reasonably represents the value to customers of performance obligations fulfilled to date. The transaction price is determined based on the price per actual mega-watt output or available capacity as agreed to in the respective PPA. Customers are generally billed on a monthly basis and payment is typically due within 30 to 60 days after the issuance of the invoice.
ORMAT TECHNOLOGIES, INC. AND SUBSIDIARIES
NOTES TO CONSOLIDATED FINANCIAL STATEMENTS
Product segment revenues: Revenues from engineering, operating services, and parts and product sales are recorded upon providing the service or delivery of the products and parts and when collectability is reasonably assured. Revenues from the supply and/or construction of geothermal and recovered energy-based power plant equipment and other equipment to third parties are recognized over time since control is transferred continuously to the Company's customers. The majority of the Company's contracts include a single performance obligation which is essentially the promise to transfer the individual goods or services that are not separately identifiable from other promises in the contracts and therefore deemed as not distinct. Performance obligations are satisfied over-time if the customer receives the benefits as we perform work, if the customer controls the asset as it is being constructed, or if the product being produced for the customer has no alternative use and the Company has a contractual right to payment. In the Company's Product segment, revenues are spread over a period of one to two years and are recognized over time based on the cost incurred to date in ratio to total estimated costs which represents the input method that best depicts the transfer of control over the performance obligation to the customer. Costs include direct material, labor, and indirect costs. Provisions for estimated losses on uncompleted contracts are made in the period in which such losses are determined.
In contracts for which the Company determines that control is not transferred continuously to the customer, the Company recognizes revenues at the point in time when the customer obtains control of the asset. Revenues for such contracts are recorded upon delivery and acceptance by the customer. This generally is the case for the sale of spare parts, generators or similar products.
Accounting for product contracts that are satisfied over time includes use of several estimates such as variable consideration related to bonuses and penalties and total estimated cost for completing the contract. The estimated amount of variable consideration will be included in the transaction price only to the extent that it is probable that a significant reversal in the amount of cumulative revenue recognized will not occur when the uncertainty associated with the variable consideration is subsequently resolved. These estimates are based on historical experience, anticipated performance and the Company's best judgment at the time.
The nature of the Company's product contracts give rise to several modifications or change requests by its customers. Substantially all of the modifications are treated as cumulative catch-ups to revenues since the additional goods are not distinct from those already provided. The Company includes the additional revenues related to the modifications in its transaction price when both parties to the contract approved the modification. As a significant change in one or more of these estimates could affect the profitability of the Company's contracts, the Company reviews and updates its contract-related estimates regularly. If at any time the estimate of contract profitability indicates an anticipated loss on the contract, the Company recognizes the total loss in the period in which it is identified.
Energy Storage segment revenues: Battery energy storage systems as a service demand-response and energy management related services revenues are recorded based on energy management of load curtailment capacity delivered or service provided at rates specified under the relevant contract terms. The Company determined that such revenues are in the scope of ASC 606 and identified energy management services as a separate performance obligation. Performance obligations are satisfied once the Company provides verification to the electric power grid operator or utility of its ability to meet the committed capacity, the power curtailment requirements or the ancillary services and thus entitled to cash proceeds. Such verification may be provided by the Company bi-weekly, monthly or under any other frequency as set by the related program and are typically followed by a payment shortly after. Performance obligations identified were evaluated and determined to be satisfied over time and qualified for the invoicing practical expedient since the amounts included in the verification document reasonably represent the value of performance obligations fulfilled to date. The transaction price is determined based on mechanisms specified in the contract with the customer.
ORMAT TECHNOLOGIES, INC. AND SUBSIDIARIES
NOTES TO CONSOLIDATED FINANCIAL STATEMENTS
Contract assets related to the Company's Product segment reflect revenues recognized and performance obligations satisfied in advance of customer billing. Contract liabilities related to the Company's Product segment reflect payments receivedcustomer billing in advance of the satisfaction of performance under the contract. The Company receives payments from customers based on the terms established in the contracts. Total contract assets and contract liabilities as of December 31, 20202023 and 20192022 are as follows:
| | | December 31, | | December 31, | | | December 31, | | December 31, | |
| | | 2020 | | | 2019 | | | 2023 | | | 2022 | |
| | | (Dollars in thousands) | | | (Dollars in thousands) | |
Contract assets (*) | | $ | 24,544 | | | $ | 38,365 | | | $ | 18,367 | | | $ | 16,405 | |
Contract liabilities (*) | | $ | (11,179 | ) | | $ | (2,755 | ) | | $ | (18,669 | ) | | $ | (8,785 | ) |
(*) Contract assets and contract liabilities are presented as "Costs and estimated earnings in excess of billings on uncompleted contracts" and "Billings in excess of costs and estimated earnings on uncompleted contracts", respectively, on the consolidated balance sheets. The contract liabilities balance at the beginning of the year was fully recognized as product revenues during the yearsyear ended December 31, 20202023 and 2019as a result of performance obligations that were partially satisfied.
ORMAT TECHNOLOGIES, INC. AND SUBSIDIARIES
NOTES TO CONSOLIDATED FINANCIAL STATEMENTS
The following table presents the significant changes in the contract assets and contract liabilities for the years ended December 31, 20202023 and 2019:2022:
| | | Years Ended December 31, | | | Years Ended December 31, | |
| | | 2020 | | 2019 | | | 2023 | | 2022 | |
| | | Contract assets | | Contract liabilities | | Contract assets | | Contract liabilities | | | Contract assets | | Contract liabilities | | Contract assets | | Contract liabilities | |
| | | (Dollars in thousands) | | | (Dollars in thousands) | |
Recognition of contract liabilities as revenue as a result of performance obligations satisfied | | $ | — | | | $ | 5,336 | | | $ | — | | | $ | 12,675 | | | $ | — | | | $ | 6,883 | | | $ | — | | | $ | — | |
Cash received in advance for which revenues have not yet recognized, net of expenditures made | | — | | | (11,177 | ) | | — | | | (3,323 | ) | | — | | | (16,766 | ) | | — | | | (2,604 | ) |
Reduction of contract assets as a result of rights to consideration becoming unconditional | | (145,548 | ) | | — | | | (130,918 | ) | | — | | | (4,094 | ) | | — | | | (23,000 | ) | | — | |
Contract assets recognized, net of recognized receivables | | | 129,144 | | | — | | | | 133,448 | | | — | | | | 6,056 | | | — | | | | 32,780 | | | — | |
Net change in contract assets and contract liabilities | | $ | (16,404 | ) | | $ | (5,841 | ) | | $ | 2,530 | | | $ | 9,352 | | | $ | 1,962 | | | $ | (9,883 | ) | | $ | 9,780 | | | $ | (2,604 | ) |
The timing of revenue recognition, billings and cash collections resultsresult in accounts receivable, contract assets and contract liabilities on the consolidated balance sheet. In the Company's Products segment, amounts are billed as work progresses in accordance with agreed-upon contractual terms, or upon achievement of contractual milestones. Generally, billing occurs subsequent to the recognition of revenue, resulting in contract assets. However, the Company sometimes receives advances or deposits from its customers before revenue can be recognized, resulting in contract liabilities. These assets and liabilities are reported on the consolidated balance sheet on a contract-by-contract basis at the end of each reporting period. The timing of billing its customers and receiving advance payments vary from contract to contract. The majority of payments are received no later than the completion of the project and satisfaction of the Company's performance obligation.
On December 31, 2020,2023, the Company had approximately $33.4$150.8 million of remaining performance obligations not yet satisfied or partly satisfied related to its Product segment. The Company expects to recognize approximately 100% of this amount as Product revenues during the next 24 months.
The following schedule reconciles revenues accounted under lease accounting and under ASC 606, Revenues from Contracts with Customers, to total consolidated revenues for the threeyears ended December 31, 20202023, 2022and 2019:2021:
| | | Year Ended December 31, | | | Year Ended December 31, | |
| | | 2020 | | | 2019 | | | 2023 | | | 2022 | | | 2021 | |
| | | (Dollars in thousands) | | | (Dollars in thousands) | |
Electricity revenues accounted under lease accounting | | $ | 473,260 | | | $ | 479,059 | | | $ | 542,065 | | | $ | 529,264 | | | $ | 502,355 | |
Electricity, Product and Energy Storage revenues accounted under ASC 606 | | | 232,082 | | | | 266,985 | | | | 287,359 | | | | 204,895 | | | | 160,729 | |
Total consolidated revenues | | $ | 705,342 | | | $ | 746,044 | | | $ | 829,424 | | | $ | 734,159 | | | $ | 663,084 | |
ORMAT TECHNOLOGIES, INC. AND SUBSIDIARIES
NOTES TO CONSOLIDATED FINANCIAL STATEMENTS
Disaggregated revenues from contracts with customers for the years ended December 31, 20202023, 2022and 20192021 are disclosed under Note 1817 - Business Segments, to the consolidated financial statements.
Allowance for credit losses
ORMAT TECHNOLOGIES, INC. AND SUBSIDIARIES
NOTES TO CONSOLIDATED FINANCIAL STATEMENTSThe Company performs an analysis of potential credit losses related to its financial instruments that are within the scope of ASU 2018-19, Codification Improvements to Topic 325, Financial Instruments – Credit Losses. Such instruments are primarily cash and cash equivalents, restricted cash and cash equivalents, receivables (excluding those accounted under lease accounting) and costs and estimated earnings in excess of billings on uncompleted contracts, based on class of financing receivables which share the same or similar risk characteristics such as customer type and geographic location, among others. The Company estimates the expected credit losses for each class of financing receivables by applying the related corporate default rate which corresponds to the credit rating of the specific customer or class of financing receivables. For trade receivables, the Company applied this methodology using aging schedules reflecting how long the receivables have been outstanding. The Company has also considered the existence of credit enhancement arrangements that may mitigate the credit risk of its financial receivables in estimating the applicable corporate default rate. The Company considered the current and expected future economic and market conditions related to inflation and rising interest rates and determined that the estimate of credit losses was not significantly impacted.
The following table describes the changes in the allowance for expected credit losses for the years ended December 31, 2023 and 2022 (all related to trade receivables):
| | | Years Ended December 31, | |
| | | 2023 | | | 2022 | |
| | | (Dollars in thousands) | |
Beginning balance of the allowance for expected credit losses | | $ | 90 | | | $ | 90 | |
Change in the provision for expected credit losses for the period | | | — | | | | — | |
Ending balance of the allowance for expected credit losses | | $ | 90 | | | $ | 90 | |
Leases
Leases
In February 2016, the FASB issued ASU 2016-02, Leases (Topic 842). This standard introduced a number of changes and simplified previous guidance, primarily the recognition of lease assets and lease liabilities by lessees for those leases classified as operating leases. The standard retained the distinction between finance leases and operating leases and the classification criteria between the two types remains substantially similar. Also, lessor accounting remained largely unchanged from previous guidance. However, key aspects of the new standard were aligned with the revenue recognition guidance in Topic 606. Additionally, the standard defined, defines a lease as a contract, or part of a contract, that conveys the right to control the use of an identified asset for a period of time in exchange for consideration. Control over the use of the identified asset means that the customer has both (a) the right to obtain substantially all of the economic benefits from the use of the asset, and (b) the right to direct the use of the asset. The Company adopted this new standard as of January 1, 2019 using the modified retrospective approach and accordingly recognized a cumulative-effect adjustment to the opening balance of retained earnings, which was an immaterial amount, with no restatement of comparative information.
The Company is a lessee in operating lease transactions primarily consisting of land leases for its exploration and development activities. Additionally, the Company is a lessee in finance lease transactions primarily consistingrelated to fleet vehicles. As further described under Note 2 - Business Acquisitions to the consolidated financial statements, one of fleet vehiclesthe Company's power plant assets is subject to a sale and office rentals. Asleaseback transaction that is accounted as a "failed" sale and leaseback. Additionally, as further described above under Revenues and cost of revenues, the Company acts as a lessor in PPAs that are accounted under ASC 842, Leases.
In accordance with the newlease standard, for agreements in which the Company is the lessee, the Company applies a unified accounting model by which it recognizes a right-of-use asset ("ROU") and a lease liability at the commencement date of the lease contract for all the leases in which the Company has a right to control identified assets for a specified period of time. The classification of the lease as a finance lease or an operating lease determines the subsequent accounting for the lease arrangement.
Upon the adoption of the new standard theThe Company, both as a lessee and as a lessor, chose to applyapplies the following permitted practical expedients:
| | 1. | Not reassess whether any existing contracts are or contain a lease; |
| | 2. | Not reassess the classification of leases that commenced before the effective date (for example, all existing leases that were classified as operating leases in accordance with Topic 840 continued to be classified as operating leases, and all existing leases that were classified as capital leases in accordance with Topic 840 continued to be classified as finance leases);
|
| 3. | Exclude initial direct costs from measurement of the ROU asset at the date of initial application; |
| 4.
| Applying the practical expedient (forfor a lessor)lessee to not separate non-lease components accounted for under Topic 606 from lease components and, instead, to account for each separate lease component and the non-lease components associated with that lease as a single component. If the non-lease components are the predominant components, the Company will account for the combined component as a single performance obligation entirely in accordance with Topic 606. Otherwise, the combined component will be accounted as an operating lease entirely in accordance with the new standard. |
| | 5.3.
| Applying the practical expedient (for a lessee) regarding the recognition and measurement of short-term leases, for leases for a period of up to 12 months from the commencement date. Instead, the Company continued to recognize the lease payments for those leases in profit or loss on a straight-line basis over the lease term. |
ORMAT TECHNOLOGIES, INC. AND SUBSIDIARIES
NOTES TO CONSOLIDATED FINANCIAL STATEMENTS
SinceThe Company applies the Company elected to apply the practical expedients above, it applied the new standard to all contracts entered into before January 1, 2019 and identified as leases in accordance with Topic 840.
The newfollowing significant accounting policies regarding leases that were applied as fromit enters into following the adoption of the lease guidance on January 1, 2019 2019: :following the application of the new standard are as follows:
| | 1. | Determining whether an arrangement contains a lease |
Onlease: on the inception date of the lease, the Company determines whether the arrangement is a lease or contains a lease, while examining if it conveys the right to control the use of an identified asset for a period of time in exchange for consideration.
| | 2. | The Company as a lesseelessee: |
| | a. | Lease classification:at the commencement date, a lease is a finance lease if it meets any one of the criteria below; otherwise the lease is an operating lease: |
At the commencement date, a lease is a finance lease if it meets any one of the criteria below; otherwise the lease is an operating lease:
| | • | The lease transfers ownership of the underlying asset to the lessee by the end of the lease term.term; |
| | • | The lease grants the lessee an option to purchase the underlying asset that the lessee is reasonably certain to exercise.exercise; |
| | • | The lease term is for the major part of the remaining economic life of the underlying asset.asset; |
| | • | The present value of the sum of the lease payments and any residual value guaranteed by the lessee that is not already reflected in the lease payments equals or exceeds substantially all of the fair value of the underlying asset.asset; |
| | • | The underlying asset is of such a specialized nature that it is expected to have no alternative use to the lessor at the end of lease term. |
ORMAT TECHNOLOGIES, INC. AND SUBSIDIARIES
NOTES TO CONSOLIDATED FINANCIAL STATEMENTS
| | b. | Leased assets and lease liabilities - initial recognition: upon initial recognition, the Company recognizes a liability at the present value of the lease payments to be made over the lease term, and concurrently recognizes a ROU asset at the same amount of the liability, adjusted for any prepaid or accrued lease payments, plus initial direct costs incurred in respect of the lease. Since the interest rate implicit in the lease is not readily determinable, the incremental borrowing rate of the Company is used. The subsequent measurement depends on whether the lease is classified as a finance lease or an operating lease. |
Upon initial recognition, the Company recognizes a liability at the present value of thec. The lease payments to be made over term: the lease term, and concurrently recognizes a ROU asset at the same amount of the liability, adjusted for any prepaid or accrued lease payments, plus initial direct costs incurred in respect of the lease. Since the interest rate implicit in the lease is not readily determinable, the incremental borrowing rate of the Company is used. The subsequent measurement depends on whether the lease is classified as a finance lease or an operating lease.
The lease term is the non-cancellable period of the lease plus periods covered by an extension or termination option if it is reasonably certain that the Company will exercise the option.
| | d. | Subsequent measurement of operating leases |
After lease commencement, the Company measures the lease liability at the present value of the remaining lease payments using the discount rate determined at lease commencement (as long as the discount rate has not been updated as a result of a reassessment event).
The Company subsequently measures the ROU asset at the present value of the remaining lease payments, adjusted for the remaining balance of any lease incentives received, any cumulative prepaid or accrued rent if the lease payments are uneven throughout the lease term and any unamortized initial direct costs.
Further, the Company will recognizeleases: after lease commencement, the Company measures the lease liability at the present value of the remaining lease payments using the discount rate determined at lease commencement (as long as the discount rate has not been updated as a result of a reassessment event). The Company subsequently measures the ROU asset at the present value of the remaining lease payments, adjusted for the remaining balance of any lease incentives received, any cumulative prepaid or accrued rent if the lease payments are uneven throughout the lease term and any unamortized initial direct costs. Further, the Company recognizes lease expense on a straight-line basis over the lease term.
| | e. | Subsequent measurement of finance leases |
After lease commencement, the Company measures the lease liability by increasing the carrying amount to reflect interest on the lease liability and reducing the carrying amount to reflect the lease payments made during the period. The Company shall determineleases: after lease commencement, the Company measures the lease liability by increasing the carrying amount to reflect interest on the lease liability and reducing the carrying amount to reflect lease payments made during the period. The Company determines the interest on the lease liability in each period during the lease term as the amount that produces a constant periodic discount rate on the remaining balance of the liability, taking into consideration the reassessment requirements.
After lease commencement, the Company measures the ROU assets at cost less any accumulated amortization and any accumulated impairment losses, taking into consideration the reassessment requirements. The Company amortizes the ROU asset on a straight-line basis, unless another systematic basis better represents the pattern in which the Company expects to consume the ROU asset’s future economic benefits. The ROU asset is amortized over the shorter of the lease term or the useful life of the ROU asset as follows:
| | (in years)
| |
Vehicles
| | 5 | |
Building
| | 15 | |
each period during the lease term as the amount that produces a constant periodic discount rate on the remaining balance of the liability, taking into consideration the reassessment requirements. After lease commencement, the Company measures the ROU assets at cost less any accumulated amortization and any accumulated impairment losses, taking into consideration the reassessment requirements. The Company amortizes the ROU asset on a straight-line basis, unless another systematic basis better represents the pattern in which the Company expects to consume the ROU asset’s future economic benefits. The ROU asset is amortized over the shorter of the lease term or the useful life of the ROU asset. The amortization period related to the finance lease transactions on fleet vehicles is 3-4 years. The total periodic expense (the sum of interest and amortization expense) of a finance lease is typically higher in the early periods and lower in the later periods.
| | f. | Variable lease payments: |
• Variable lease payments that depend on an index or a raterate:
Onon the commencement date, the lease payments may include variability and depend on an index or a rate (such as the Consumer Price Index or a market interest rate). The Company does not remeasure the lease liability for changes in future lease payments arising from changes in an index or rate unless the lease liability is remeasured for another reason. Therefore, after initial recognition, such variable lease payments are recognized in profit or loss as they are incurred.
ORMAT TECHNOLOGIES, INC. AND SUBSIDIARIES
NOTES TO CONSOLIDATED FINANCIAL STATEMENTS
• Other variable lease payments:
Variablevariable payments that depend on performance or use of the underlying asset are not included in the lease payments. Such variable payments are recognized in profit or loss in the period in which the event or condition that triggers the payment occurs.
ORMAT TECHNOLOGIES, INC. AND SUBSIDIARIES
NOTES TO CONSOLIDATED FINANCIAL STATEMENTS
| | 1.3.
| The Company as a lessor |
At lease commencement, the Company as a lessor classifies leases as either finance or operating leases. Finance leases are further classified as a sales-type lease or as a direct financing lease.
lease, however, the Company has no such leases as a lessor. Under an operating lease, the Company recognizes the lease payment as income over the lease term, generally as earned or on a straight-line basis or as earned.basis.
| 2.
| Impact of the new standard
|
| a)
| The effects of the initial application of the new standard on the Company's consolidated balance sheet as of January 1, 2019 are as follows:
|
| | | According to
the previous
accounting
policy | | | The change | | | As presented
according to
Topic 842 | |
| | | (Dollars in thousands) | |
As of January 1, 2019: | | | | | | | | | | | | |
| | | | | | | | | | | | | |
Prepaid expenses and other | | $ | 51,441 | | | $ | (35,385 | ) | | $ | 16,056 | |
Deferred financing and lease costs, net | | | 3,242 | | | | (1,659 | ) | | | 1,583 | |
Property, plant and equipment, net | | | 1,959,578 | | | | (12,855 | ) | | | 1,946,723 | |
Operating leases right of use | | | 0 | | | | 62,244 | | | | 62,244 | |
Finance leases right of use | | | 0 | | | | 13,476 | | | | 13,476 | |
| | | | | | | | | | | | | |
Accounts payable and accrued expenses | | | 116,362 | | | | (2,860 | ) | | | 113,502 | |
Current maturity of operating lease liabilities | | | 0 | | | | 7,532 | | | | 7,532 | |
Current maturity of finance lease liabilities | | | 0 | | | | 2,841 | | | | 2,841 | |
| | | | | | | | | | | | | |
Other long-term liabilities | | | 16,087 | | | | (9,970 | ) | | | 6,117 | |
Long term portion of operating lease liabilities | | | 0 | | | | 17,668 | | | | 17,668 | |
Long term portion of finance lease liabilities | | | 0 | | | | 10,668 | | | | 10,668 | |
| | | | | | | | | | | | | |
Retained earnings | | | 422,222 | | | | (58 | ) | | | 422,164 | |
The operating leases right of use is higher than the related lease liabilities as a result of prepayments of leases, including the Puna lease and deferred financing lease costs.
| a)
| A weighted-average nominal incremental interest rate of 5% and 5% was used to discount future lease payments in the calculation of the lease liabilities in respect of operating leases and in respect of finance leases, respectively.
|
Termination fee
Fees to terminate PPAs are recognized in the period incurred as selling and marketing expenses. During 2018, the Company signed a termination agreement with NV Energy, Inc. for the Galena 2 PPA under which it agreed to pay a termination fee of approximately $5 million which was recorded under Selling and marketing expenses in 2018. In 2020 and 2019, 0No termination fees were incurred.incurred during 2023,2022 and 2021.
Warranty on products sold
The Company generally provides a one to two year warranty against defects in workmanship and materials related to the sale of products for electricity generation. The Company considers the warranty to be an assurance type warranty since the warranty provides the customer the assurance that the product complies with agreed-upon specifications. Estimated future warranty obligations are included in operating expenses in the period in which the related revenue is recognized. Such charges are immaterial for the years ended December 31, 2020,2023, 20192022 and 2018.2021.
ORMAT TECHNOLOGIES, INC. AND SUBSIDIARIES
NOTES TO CONSOLIDATED FINANCIAL STATEMENTS
Research and development
Research and development costs incurred by the Company for the development of technologies related to its existing and new geothermal and recovered energy power plants as well as storage related technologiesfacilities are expensed as incurred.
Stock-based compensation
The Company accounts for stock-based compensation using the fair value method whereby compensation cost is measured at the grant date, based on the calculated fair value of the award, and is recognized as an expense over the requisite employee service period (generally the vesting period of the grant). The Company uses the Complex Lattice, Three-based Option Pricing model to calculate the fair value of the stock-based compensation awards.
Tax monetization Transactions
The Company has threesix tax monetization transactions, Opal Geo, Tungsten, and McGinness Hills 3, Steamboat Hills, CD4 and North Valley as further described under Note 1312 – Tax monetization transactions to the consolidated financial statements.Monetization Transactions. The purpose of these transactions is to form tax partnerships, whereby investors provide cash in exchange for equity interests that provide the holder a right to the majority of tax benefits associated with a renewable energy project. The Company accounts for a portion of the proceeds from the transaction as debt under ASC 470. Given that a portion of these transactions is structured as a purchase of an equity interest the Company also classifies a portion as noncontrolling interest consistent with guidance in ASC 810. The portion recorded to noncontrolling interest is initially measured asat the fair value of the discounted tax attributes and cash distributions which represents the partner's residual economic interest. The residual proceeds are recognized as the initial carrying value of the debt which is classified as a liability"Liability associated with the sale of tax benefits.benefits". The Company applies the effective interest rate method to the liability associated with the tax monetization transaction component as described by ASC 835 and CON 7. The tax benefits and cash distributions realized by the partner each period are treated as the debt servicing amounts, with the tax benefit amounts giving rise to income attributable to the sale of tax benefits. The deferred transaction costs are capitalized and amortized using the effective interest method.
Income taxes
Income taxes are accounted for using the asset and liability approach, which requires the recognition of taxes payable or refundable for the current year and deferred tax assets and liabilities for the future tax consequences of events that have been recognized in the Company’s financial statements or tax returns. The measurement of current and deferred tax assets and liabilities are based on provisions of the enacted tax law. The Company accounts for investment tax credits and production tax credits as a reduction to income taxes in the year in which the credit arises. The measurement of deferred tax assets is reduced, if necessary, by the amount of any tax benefits that, based on available evidence, are more likely than not expected to be realized. A partial valuation allowance has been established to offset the Company’s U.S. deferred tax assets. Tax benefits from uncertain tax positions are recognized only if it is more likely than not that the tax position will be sustained on examination by the taxing authorities, based on the technical merits of the position. Interest and penalties assessed by taxing authorities on an underpayment of income taxes are included as a component of income tax provision in the consolidated statements of operations and comprehensive income.
The FASB released guidance Staff Q&A, Topic
740,123No.5, that states a company can make an accounting policy election to either recognize deferred taxes related to GILTI or to provide for the GILTI tax expense in the year the tax is incurred as a period cost. The Company has elected to treat any GILTI inclusions as a period cost. The Company has elected and applied the tax law ordering approach when considering GILTI as part
ORMAT TECHNOLOGIES, INC. AND SUBSIDIARIES
NOTES TO CONSOLIDATED FINANCIAL STATEMENTS
Earnings per share
Basic earnings per share attributable to the Company’s stockholders (“earnings per share”) is computed by dividing net income or loss attributable to the Company’s stockholders by the weighted average number of shares of common stock outstanding for the period.period, net of treasury shares. The Company does not have any equity instruments that are dilutive, except for stock-based awards.awards and convertible senior notes.
The table below shows the reconciliation of the number of shares used in the computation of basic and diluted earnings per share:
| | | Year Ended December 31, | | | Year Ended December 31, | |
| | | 2020 | | 2019 | | 2018 | | | 2023 | | 2022 | | 2021 | |
| | | (In thousands) | | | (In thousands) | |
Weighted average number of shares used in computation of basic earnings per share | | 51,567 | | | 50,867 | | | 50,643 | | | 59,424 | | | 56,063 | | | 56,004 | |
Add: | | | | | | | | |
Additional shares from the assumed exercise of employee stock options | | | 370 | | | 360 | | | 326 | | |
Additional shares from the assumed exercise of employee stock-based awards | | | | 338 | | | 440 | | | 398 | |
Weighted average number of shares used in computation of diluted earnings per share | | | 51,937 | | | 51,227 | | | 50,969 | | | | 59,762 | | | 56,503 | | | 56,402 | |
The number of stock-based awards that could potentially dilute future earnings per share andwhich were not included in the computation of diluted earnings per share because to do so would have been anti-dilutive was 369.782.5 thousand, 360.529.2 thousand, and 176.4142.4 thousand, respectively, for the years ended December 31, 2020,2023, 20192022 and 2018.2021.
ORMAT TECHNOLOGIES, INC. AND SUBSIDIARIES
NOTES TO CONSOLIDATED FINANCIAL STATEMENTSthe Company's common stock did not exceed the per share conversion price of its convertible senior notes (the "Notes") of $90.27, and other requirements for the Notes to be convertible were not met, and as such, there was no dilutive effect from the Notes in respect with the aforementioned periods. Further information on the Notes is detailed under Note 11 to the consolidated financial statements.
Use of estimates in preparation of financial statements
The preparation of financial statements in conformity with U.S. GAAP requires management to make estimates and assumptions that affect the reported amounts of assets and liabilities and the disclosure of contingent assets and liabilities at the dates of such financial statements and the reported amounts of revenues and expenses during the reporting periods. Actual results could differ from those estimates. The most significant estimates with regard to the Company’s consolidated financial statements relate to the useful lives of property, plant and equipment, impairment of goodwill and long-lived assets, including intangible assets, revenue recognition of product sales using the percentage of completion method, asset retirement obligations, and the provision for income taxes.
Redeemable noncontrolling interest
Redeemable noncontrolling interest is currently redeemable and relates to a certain noncontrolling shareholder in a subsidiary having an option to sell its equity interest to the Company. The carrying value of the redeemable noncontrolling interest balance as of December 31, 2023 and 2022 approximates the redemption price of such interests. Changes in the carrying amount of the Company's Redeemable noncontrolling interest were as follows:
| | | 2020 | | 2019 | | | 2023 | | | 2022 | |
| | | (Dollars in thousands) | | | (Dollars in thousands) | |
Redeemable noncontrolling interest as of January 1, | | $ | 9,250 | | | $ | 8,603 | | | $ | 9,590 | | | $ | 9,329 | |
Redeemable noncontrolling interest in results of operation of a consolidated subsidiary | | 1,330 | | | 1,132 | | | 939 | | | 638 | |
Cash paid to noncontrolling interest | | (1,779 | ) | | (252 | ) | | (246 | ) | | — | |
Currency translation adjustments | | | 1,029 | | | (233 | ) | | | 316 | | | | (377 | ) |
Redeemable noncontrolling interest as of December 31, | | $ | 9,830 | | | $ | 9,250 | | | $ | 10,599 | | | $ | 9,590 | |
Cash dividends
During the years ended December 31, 2020,2023, 20192022 and 2018,2021, the Company’s Board of Directors (the “Board”) declared, approved, and authorized the payment of cash dividends in the aggregate amount of $22.5$28.4 million ($0.440.48 per share), $22.4$27.1 million ($0.440.48 per share), and $26.8$27.0 million ($0.530.48 per share), respectively. Such dividends were paid in the years declared.
ORMAT TECHNOLOGIES, INC. AND SUBSIDIARIES
NOTES TO CONSOLIDATED FINANCIAL STATEMENTS
Equity OfferinStockholders' equity offeringg
On November 18, 2020,March 14, 2023, the Company entered into an underwriting agreement with J.P. Morgan SecuritiesGoldman Sachs & Co. LLC, and BofA Securities, Inc., as representatives of the several underwriters listed thereinsole underwriter (the “Underwriters”“Underwriter”), in connection with a public offering, pursuant to which the Company agreed to issue and sell 4,150,0003,600,000 shares of common stock, par value $0.001 per share, and the Underwriter agreed to purchase these shares at a public offering price of $74.00$82.60 per share. In addition, the Company granted the UnderwritersUnderwriter a 30-day option to purchase up to an additional 622,500540,000 shares of common stock at the public offeringsame price of $74.00 per share, which was fully exercised by the Underwriters on November 30, 2020.April 3, 2023. The total net proceeds from the offering, including the option, were approximately $339.5$341.7 million, after deducting underwriting discounts, commissions and offering expenses.
COVID-19 consideration
In March 2020, the World Health Organization declared the outbreak of the novel coronavirus ("COVID-19") a pandemic. The Company has implemented significant measures in order to meet government requirements and preserve the health and safety of its employees, including by working remotely and adopting separate shifts in its power plants, manufacturing facilities and other locations while at the same time trying to continue operations at close to full capacity in all locations. In addition, the Company focused efforts to adjusting its operations to mitigate the impact of COVID-19 including managing its global supply chain risks and enhancing its liquidity profile. The Company took prompt steps to manage its expenses including responsible cost cutting measures and in addition, in order to support its capital expenditure and growth plans, the Company raised more than $400 million through long term loans as further described under Note 11, Long-term Debt to the consolidated financial statements and common stock issuance of approximately $339.5 million as further described above. As most of the Company's Electricity revenues are generated under long term contracts, the majority of which are under a fixed energy rate, the impact of COVID-19 on Electricity revenues was limited. Nevertheless, the Company received notices declaring a force majeure event in Kenya from KPLC and in Honduras from ENEE, both of which had an immaterial impact and were ultimately removed during the year. In addition, the Company experienced a higher rate of curtailments during the first half of 2020 from KPLC in respect of its Olkaria complex that were reduced in the second half of 2020. In the Product segment, the company experienced delays and significant cost increases in one of the projects which adversely impacted its results of operations in 2020. In addition, the Company experienced a decline in product backlog, which it believes resulted mainly due to the impact of COVID-19 and the unwillingness of potential customers to enter into new commitments at this time. In the Energy Storage segment, revenues are generated primarily from participating in the energy and ancillary services markets and therefore are directly impacted by the prevailing energy prices in those markets.
ORMAT TECHNOLOGIES, INC. AND SUBSIDIARIES
NOTES TO CONSOLIDATED FINANCIAL STATEMENTS
While the extent and duration of the economic downturn from the COVID-19 pandemic remains unclear, the Company has considered, among other things, whether the global operational disruptions indicate a change in circumstances that may trigger asset impairments and whether it needs to revisit accounting estimates and projections or its expectations about collectability of receivables. Additionally, the Company has considered the potential impact on its fair value disclosures and on its internal control over financial reporting and while significant uncertainty still exists concerning the magnitude of the impact and duration of the COVID-19 pandemic on the global economy, the Company has determined that there was no triggering event for an impairment with respect to any of its assets nor has there been an adverse change in the probability related to the collectability of its receivables. The Company continues to assess the potential impact of the global economic situation on its consolidated financial statements.
Puna Power PlantORPD Transaction
On May July 11, 2023, ORPD LLC ("ORPD"), a subsidiary of the Company in which Northleaf Geothermal Holdings, LLC ("Northleaf") and the Company hold 36.75% and 63.25% equity interest, respectively, sold OREG 1, OREG 2, OREG 3 2018, ("OREGs") and the Don A. Campbell complex to Ormat Nevada Inc. ("ONI"), a fully owned subsidiary of the Company. The proceeds from the sale were partially used by ORPD to make a distribution to its shareholders in which Northleaf's share was $30.0 million. Following this purchase transaction with the noncontrolling interest, the Company fully owns the OREGs and the Don A. Campbell power plant complex and ORPD remains the holder of the Puna geothermal power plant. The Company accounted for this transaction as an equity transaction.
Short-term Commercial Paper
On October 19, 2023, the Kilauea volcanoCompany entered into a framework agreement for participation in the issuance of commercial paper (the "Commercial Paper Agreement") with Barak Capital Underwriting Ltd. under which the Company allowed the participants to submit proposals for purchasing and to purchase the Company's commercial paper ("Commercial Paper") in accordance with the provisions of the Commercial Paper Agreement. On October 23, 2023, the Company completed the issuance of the Commercial Paper in the aggregate amount of $73.2 million, and subsequently on December 11, 2023, the Company issued an additional amount of $26.8 million, under the same terms. The Commercial Paper was issued for a period of 90 days and extends automatically for additional 90 day periods for up to five years, unless the Company notifies the participants otherwise or a notice of termination is provided by the participants in accordance with the provisions of the Commercial Paper Agreement. The Commercial Paper bears an annual interest of three months SOFR +1.1% which will be paid at the end of each 90 day period. Base rate was 5.3%.
War in Israel
On October 7, 2023, Hamas terrorists and members of other terrorist organizations infiltrated Israel’s southern border from the Gaza Strip and conducted a series of attacks on civilian and military targets, including widespread killings and kidnappings. They also launched extensive rocket attacks on the Israeli civilian population. Shortly following the attack, Israel declared war against Hamas. The majority of the Company's senior management and its main Product segment production and manufacturing facilities are located in close proximityIsrael approximately 26 miles from the border with the Gaza Strip. More recently, the Houthi movement, which controls parts of Yemen, launched a number of attacks on marine vessels in the Red Sea. The Red Sea is an important maritime route for international trade. These disruptions have resulted, and may continue to result in, delayed deliveries of several key components used in the manufacturing of the Company's products and could impact its ability to timely deliver products to its customers under the Product Segment. This has also resulted in an increase in insurance premium costs for shipments into and out of the sea port.
As of the approval date of these consolidated financial statements, none of the Company's facilities or infrastructure have been damaged nor have its supply chains been significantly impacted since the war broke out. However, a prolonged war could result in further military reserve duty call-ups as well as irregularities to the Company's Punasupply chain and to its ability to ship its products from Israel, which could disrupt the operations of the Company's Product segment and potentially delay some of its growth plans in the Electricity segment. Management will continue to monitor the effect of the war on the Company's financial position and results of operations.
Heber 381 MWpower plant fire
The Company's Heber 1 geothermal power plant located in the Puna district of Hawaii's Big Island eruptedCalifornia experienced an outage following a significant increase in seismic activity infire on February 25, 2022 that caused damage primarily to the steam turbine-generator area. Before it stopped flowing, the lava covered the wellheads ofThe Heber three1 geothermal wells, monitoring wells and the substationpower plant is part of the Puna81 MW Heber complex and an adjacent warehouse that storedsells its electricity under a drilling rig that was also consumed bylong-term contract with the lava. The insurance policy coverage for propertySouthern California Public Power Authority. In mid- April, 2022 the Company gradually re-started operation of the binary units and business interruption is provided by a consortium of insurers some of denied in May 2023 the the full amount of our claim asserting that our insurance policy has coverage limitations. DuringHeber 2020,1 power plant successfully resumed operations. In 2022, the Company recognized $21.8 million of insurance recoveries in respect of the Heber 1 fire event, of which $8.0 million was attributable to property damage and thus recorded against the related receivable and offset the loss from the damaged equipment. The remainder of $13.8 million, was related to business insuranceinterruption and thus recorded as income of $28.6 million which was included inunder electricity cost of revenues up to the amount covering the related costs and the remainder, totaling $20.7 million, was included as a business interruption insurance income under operating expenses in the consolidated statements of operations and comprehensive income. Additionally, duringThe Company has received all insurance proceeds related to the Heber 2020,1 fire event.
ORMAT TECHNOLOGIES, INC. AND SUBSIDIARIES
NOTES TO CONSOLIDATED FINANCIAL STATEMENTS
February 2021 power crisis in Texas
In February 2021, extreme weather conditions in Texas resulted in a significant increase in demand for electricity on the one hand and a decrease in electricity supply in the region on the other hand. On February 15, 2021, the Electricity Reliability Council of Texas (“ERCOT”) issued an Energy Emergency Alert Level 3 ("EEA 3") prompting rotating outages in Texas. This ultimately led to a significant increase in the Responsive Reserve Service (“RRS”) market prices, where the Company received $4.7operates its Rabbit Hill battery energy storage facility which provides ancillary services and energy optimization to the wholesale markets managed by ERCOT. Due to the electricity supply shortage, ERCOT restricted battery charging in the Rabbit Hill facility from February 16, 2021 to February 19, 2021, resulting in a limited ability of the Rabbit Hill storage facility to provide RRS. As a result, the Company incurred losses of approximately $9.1 million, net of associated revenues, from a hedge transaction in property damage insurance proceedsrelation to its inability to provide RRS during that period. Starting February 19, 2021, the Rabbit Hill energy storage facility resumed operation at full capacity.
In addition, the Company recorded a provision for approximately $3.0 million for receivables related to imbalance charges from the grid operator in respect of which $0.6 was recordedits demand response operation as it estimated it is probable it may be unable to collect such receivables. The provision for uncollectible receivables is included in "General and administrative expenses" in the consolidated statements of operations and comprehensive income under non-operating income. The Company has filed a lawsuit againstfor the insurers that doyear ended notDecember 31, 2021. accept its claim.
As of February 2021, the Puna power plant that was shut down following the Kilauea volcano eruption in May 2018, has resumed operation and currently is operating at approximately 13 MW. On the field side, the Company connected one new production well to the power plant and the Company continues its field recovery work, which includes drilling new wells and expects a gradual increase in generation to full capacity by the middle of 2021, assuming field recovery is successfully achieved.
The Company continueshas filed billing disputes with ERCOT related to assesssome of the accounting implicationsimbalance charges and revenue allocated to its Demand Response services and customers, the outcome of this event onwhich may impact the assets and liabilities on its balance sheet and whether an impairment will be required. As of December 31, 2020, no impairment was required. final amount.
New Accounting Pronouncements
New accounting pronouncements effective in the year ended December 31, 20202023
Financial Instruments—Credit LossesRevenue Contracts Acquired in a Business Combination
In June 2016, the Financial Accounting Standards Board ("FASB") issued Accounting Standard Update ("ASU") 2016-13, Financial Instruments-Credit Losses (Topic 326) - Measurement of Credit Losses on Financial Instruments. This guidance replaces the current incurred loss impairment methodology. Under the new guidance, on initial recognition and at each reporting period, an entity is required to recognize an allowance that reflects its current estimate of credit losses expected to be incurred over the life of the financial instrument based on historical experience, current conditions and reasonable and supportable forecasts. In November 2018,October 2021, the FASB issued ASU 20182021-19,08, Codification Improvements"Business Combinations (Topic 805): Accounting for Contract Assets and Contract Liabilities from Contracts with Customers" ("ASU 2021-08"). ASU 2021-08 is intended to improve the accounting for acquired revenue contracts with customers in a business combination by addressing the following topics: (1) recognition of an acquired contract liability and (2) payment terms and their effect on subsequent revenue recognized by the acquirer. The amendments in ASU 2021-08 require that an entity that is the acquirer recognize and measure contract assets and contract liabilities acquired in a business combination in accordance with Topic 326,606 Financial Instruments - Credit Losses.at the acquisition date as if it had originated the contracts. The amendments in ASU 20182021-1908 clarifies that receivables from operating leases are accountedeffective for using the lease guidance andfiscal years beginning after not as financial instruments. The guidance became effective on January 1, 2020,December 15, 2022 including interim periods within that year and requires a modified retrospective transition approach through a cumulative-effect adjustment to retained earnings as of the beginning of the period of adoption. Under the modified retrospective method of adoption, prior year reported results are not restated. The Company has performed its analysis of the impact on its financial instruments that are within the scope of this guidance, primarily cash and cash equivalents and restricted cash and cash equivalents, receivables (excluding those accounted under lease accounting) and costs and estimated earnings in excess of billings on uncompleted contracts, based on class of financing receivables which share the same or similar risk characteristics such as customer type and geographic location, among others. The Company has estimated the expected credit losses for each class of financing receivables by applying the related corporate default rate which corresponds to the credit rating of the specific customer or class of financing receivables. For trade receivables, the Company applied this methodology using aging schedules reflecting how long the receivables have been outstanding. The Company has also considered the existence of credit enhancement arrangements that may mitigate the credit risk of its financial receivables in estimating the applicable corporate default rate. The Company adopted this update effective January 1, 2020 and recorded a cumulative-effect adjustment to its retained earnings as of that date of approximately $0.8 million. While significant uncertainty still exists concerning the magnitude of the impact and duration of the COVID-19 pandemic on the global economy, the Company considered the current and expected future economic and market conditions surrounding the COVID-19 pandemic and determined that the estimate of credit losses was not significantly impacted.
ORMAT TECHNOLOGIES, INC. AND SUBSIDIARIES
NOTES TO CONSOLIDATED FINANCIAL STATEMENTS
The following table describes the changes in the allowance for expected credit losses for the year ended December 31, 2020 (all related to trade receivables):
| | | Year Ended December 31, | |
| | | 2020 | |
| | | (Dollars in thousands) | |
Beginning balance of the allowance for expected credit losses | | $ | 755 | |
Change in the provision for expected credit losses for the period | | | (158 | ) |
Ending balance of the allowance for expected credit losses | | $ | 597 | |
Reference Rate Reform
In March 2020, the FASB issued ASU 2020-04, Reference Rate Reform (Topic 848).fiscal years. The amendments in this update provide optional guidance for a limited period of time to ease the potential burden in accounting for (or recognizing the effects of) reference rate reform on financial reporting as the London Interbank Offered Rate ("LIBOR") reference rate is scheduled to be discontinued on December 31, 2021. The amendments in this update provide optional expedients and exceptions for applying generally accepted accounting principles to contracts, hedging relationships and other transactions affected by reference rate reform if certain criteria are met. The amendments in this update apply only to contracts, hedging relationships, and other transactions that reference LIBOR or another reference rate expected to be discontinued because of reference rate reform. Modifications of contracts within the scope of Topic 470, Debt, should be accounted for by prospectively adjusting the effective interest rate. The amendments in this Update are effective for all entities as of March 12, 2020 through December 31, 2022. An entity may elect to apply the amendments for contract modifications by Topic or Industry Subtopic as of any date from the beginning of an interim period that includes or is subsequent to March 12, 2020, or prospectively from a date within an interim period that includes or is subsequent to March 12, 2020, up to the date that the financial statements are available to be issued. Once elected for a Topic or an Industry Subtopic, the amendments in this Update must be applied prospectively for all eligible contract modifications for that Topicto business combinations occurring on or Industry Subtopic.after the effective date of the amendments. The Company evaluatedadopted this guidance as prescribed, and the impactadoption of the transition from LIBOR, and currently believes that the transition willthis update did not have a material impact on its consolidated financial statements.
New accounting pronouncements effective in future periods
Accounting for Investments in Tax Credit Structures Using the Proportional Amortization Method
In March 2023, the FASB issued ASU 2023-02 “Investments - Equity Method and Joint Ventures (Topic 323),” which permits reporting entities to elect to account for tax equity investments, regardless of the tax credit program from which the income tax credits are received, using the proportional amortization method if certain conditions are met. The amendments in ASU 2023-02 are effective for fiscal years beginning after December 15, 2023, including interim periods within those fiscal years. The amendments in this update should be applied on either a modified retrospective or a retrospective basis. The Company is still evaluating the potential impact of this guidance on its consolidated financial statements, however, it anticipates that the adoption of ASU 2023-02 will not have an impact on its consolidated financial statements.
ORMAT TECHNOLOGIES, INC. AND SUBSIDIARIES
NOTES TO CONSOLIDATED FINANCIAL STATEMENTS
Improvements to Reportable Segments Disclosures
In November 2023, the FASB issued ASU 2023-07 “Segment Reporting–Improvements to Reportable Segments Disclosures (Topic 280)” to improve reportable segment disclosure requirements, primarily through enhanced disclosures about significant segment expenses. The amendments in this ASU (1) require that a public entity disclose, on an annual and interim basis, significant segment expenses that are regularly provided to the chief operating decision maker (“CODM”) and included within each reported measure of segment profit or loss; (2) require that a public entity disclose, on an annual and interim basis, an amount for other segment items by reportable segment and a description of its composition; (3) require that a public entity provide all annual disclosures about a reportable segment’s profit or loss and assets currently required by Topic 280 in interim periods; (4) clarify that if the CODM uses more than one measure of a segment’s profit or loss in assessing segment performance and deciding how to allocate resources, a public entity may report one or more of those additional measures; and (5) require that a public entity disclose the title and position of the CODM and an explanation of how the CODM uses the reported measure or measures of segment profit or loss in assessing segment performance and deciding how to allocate resources. The amendments in this ASU are effective for fiscal years beginning after December 15, 2023, and interim periods within fiscal years beginning after December 15, 2024, and should be applied retrospectively to all periods presented. Early adoption is permitted. The Company is currently evaluating the impact of the adoption of these amendments on its consolidated financial statements.
Improvements to Income TaxesTax Disclosures
In December 2019,2023, the FASB issued ASU 20192023-12,09 Income“Income Taxes (Topic 740): Simplifying–Improvements to Income Tax Disclosures” to enhance the Accounting for Income Taxes. ASU 2019- 12 is intendedtransparency and decision usefulness of income tax disclosures, primarily related to simplify the accounting forrate reconciliation and income taxes paid information. The amendments in this ASU require that public entities, on an annual basis, disclose specific categories in the rate reconciliation and provide additional information for reconciling items that meet a quantitative threshold. This ASU also requires that all entities disclose, on an annual basis, (1) the amount of income taxes paid disaggregated by removing certain exceptionsfederal, state, and foreign taxes, (2) the amount of income taxes paid disaggregated by individual jurisdictions in which income taxes paid is equal to the general principlesor greater than five percent of total income taxes paid, (3) income or loss from continuing operations before income tax expense or benefit disaggregated between domestic and foreign, and (4) income tax expense or benefit from continuing operations disaggregated by federal, state, and foreign. The amendments in ASC 740. The standard isthis ASU are effective for annual periods beginning after December 15, 20202024, and interim periods within.should be applied on a prospective basis with the option to apply retrospectively. Early adoption is permitted.permitted for annual financial statements that have not yet been issued or made available for issuance. The Company has not early adopted ASU 2019-12 asis currently evaluating the impact ofDecember 31, 2020 but does not anticipate the adoption of ASU 2019-12 to have a material impactthese amendments on its consolidated financial statements.
ORMAT TECHNOLOGIES, INC. AND SUBSIDIARIES
NOTES TO CONSOLIDATED FINANCIAL STATEMENTS
NOTE 2 —BUSINESS—BUSINESS ACQUISITIONS AND OTHERS
Energy storageBusiness combination - geothermal assets portfolio purchase transaction
On July 20, 2020,13, 2021, the Company completedclosed a transaction with TG Geothermal Portfolio, LLC (a subsidiary of Terra-Gen, LLC) (the "Seller") to acquire two contracted geothermal assets in Nevada with a total net generating capacity of 67.5 MW, a greenfield development asset adjacent to one of the acquisitionplants, and an underutilized transmission line (the "Terra-Gen Transaction"). The Company paid approximately $171.0 million in cash (excluding working capital adjustment of approximately $10.8 million) for 100% of the 20MW/80MWh Pomona Energy Storage ("Pomona") facilityequity interests in California from Alta Gas Power Holdings (U.S.) Inc. forthe entities holding those assets and assumed a total considerationfinancing obligation with a fair value at acquisition date of $43.4approximately $258.4 million. The Pomona facility has been in commercial operation since December 2016 two contracted geothermal assets include the Dixie Valley and Beowawe geothermal power plants which sell power under a 10-year energy storage resource agreementexisting power purchase agreements with Southern California Edison Company ("SCE").under a long term PPA expiring in 2038 and with NV Power, Inc. under a PPA expiring in December 2025, respectively.
The Pomona facility isAs a result of the Company's first battery storage asset in California. The purchase increasesacquisition, the Company's operating portfolioCompany expanded its overall generation capacity and expects to 73MW/136MWhimprove the profitability of the purchased assets through cost reduction and adds to its other battery storage assets located in New Jersey, New England and Texas.
synergies. The Company accounted for the transaction in accordance with Accounting Standard Codification ("ASC")ASC 805, Business Combinations and followingCombinations. Following the transaction, close date, consolidated the results of PomonaCompany consolidates the Dixie Valley and Beowawe power plants as well as the other geothermal assets included in the transaction in accordance with ASC 810, ConsolidationConsolidation. In 2021, the Company incurred approximately $4.7 million of acquisition-related costs included under "General and administrative expenses" in itsthe consolidated financial statements.statements of operations and comprehensive income for the year December 30, 2021.
The following table summarizes the purchase price allocation to the fair value of the assets acquired and liabilities assumed (in millions):
Trade and other receivables | | $ | 1.0 | |
Property, plant and equipment, net | | 20.1 | |
Intangible assets (1) | | 20.4 | |
Goodwill (2) | | | 4.1 | |
Total assets acquired | | $ | 45.6 | |
| | | | | |
Liabilities assumed | | $ | (2.2 | ) |
| | | | | |
Total assets acquired and liabilities assumed, net | | $ | 43.4 | |
(1) Intangible assets of $18.0 million are related to a long-term energy storage resource adequacy agreement with SCE and are depreciated over a period of approximately 6.5 years. The remaining $2.4 million is related to certain other contract rights.
(2) Goodwill is primarily related to certain potential future economic benefits arising from assets acquired. Goodwill is allocated to the Energy Storage segment and is deductible for tax purposes.
The amounts of revenues and earnings related to Pomona that are included in the Company's consolidated statements of operations and comprehensive income for the year ended 2020 since the acquisition date are $4.8 million and $1.6 million respectively. Unaudited pro forma information is not included as the Company deemed the transaction to not qualify as a significant business combination.
Ijen transaction
On July 2, 2019, the Company agreed to acquire 49% in the Ijen geothermal project company from a subsidiary of Medco Power (“Medco”), which is party to a Power Purchase Agreement and holds a geothermal license to develop the Ijen project in East Java in Indonesia for a total consideration of approximately $2.7 million. As part of the transaction, the Company committed to make additional funding for the exploration and development of the project, subject to specific conditions and during 2020 and 2019, the Company made additional cash investments of approximately $21.0 million and $7.4 million, respectively. Medco retains 51% ownership in the project company and the Company and Medco are developing the project jointly. The Company accounted for its investment in the Ijen geothermal project company under the equity method prescribed by ASC 323 - Investments - Equity Method and Joint Ventures.
ORMAT TECHNOLOGIES, INC. AND SUBSIDIARIES
NOTES TO CONSOLIDATED FINANCIAL STATEMENTS
USG transaction
On April 24, 2018, the Company completed the acquisition of USG. The total cash consideration (exclusive of transaction expenses) was approximately $110 million, comprised of approximately $106 million funded from available cash of Ormat Nevada Inc. (to acquire the outstanding shares of common stock of USG) and approximately $4 million funded from available cash of USG (to cash-settle outstanding in-the-money options for common stock of USG). As a result of the acquisition, USG became an indirect wholly owned subsidiary of Ormat, and Ormat indirectly acquired, among other things, interests held by USG and its subsidiaries in:
• three operating power plants at Neal Hot Springs, Oregon; San Emidio, Nevada; and Raft River, Idaho with a total net generating capacity of approximately 38 MW; and
• development assets which include a project at the Geysers, California; a second phase project at San Emidio, Nevada; a greenfield project in Crescent Valley, Nevada; and the El Ceibillo project located near Guatemala City, Guatemala.
As a result of the acquisition, the Company expanded its overall generation capacity and improved the profitability of the purchased assets through cost reduction and synergies. The Company accounted for the transaction in accordance with Accounting Standard Codification ASC 805, Business Combinations and following the transaction, the Company consolidates USG, in accordance with Accounting Standard Codification ASC 810, Consolidation.
The following table summarizes the purchase price allocation to the fair value of the assets acquired and liabilities assumed (in millions):
Cash and cash equivalents and restricted cash | | $ | 37.9 | | | $ | 10.9 | |
Trade receivables and others (1) | | | 8.6 | |
Deferred income taxes | | | 22.8 | |
Property, plant and equipment and construction-in-process | | 77.3 | | | 152.0 | |
Intangible assets (1) | | 127.0 | | |
Goodwill (2) | | 12.7 | | |
Deferred taxes | | | 1.7 | | |
Intangible assets (2) | | | 191.6 | |
Goodwill (3) | | | | 66.2 | |
Total assets acquired | | $ | 256.6 | | | $ | 452.1 | |
| | | |
Other working capital | | $ | (8.2 | ) | |
Long-term term debt | | (98.3 | ) | |
Accounts payable, accrued expenses and others | | | $ | 6.6 | |
Financing liability (4) | | | 258.4 | |
Asset retirement obligation | | (9.0 | ) | | | 5.3 | |
Noncontrolling interest | | | (34.9 | ) | |
Total liabilities assumed | | $ | (150.4 | ) | | $ | 270.3 | |
| | | | | |
Total assets acquired, and liabilities assumed, net | | $ | 106.2 | | | $ | 181.8 | |
| | (1) | Intangible assets are primarily related to long-term electricity power purchase agreementsThe gross amount of receivables due under the Dixie Valley and depreciated over an averageBeowawe PPAs is $7.8 million . These receivables were fully collected during the third quarter of 19 years.2021.
|
| | (2) | Intangible assets are related to the long-term electricity PPAs described above and are amortized over the term of those PPAs. |
| (3) | Goodwill is primarily related to the expected synergies and cost savings in operations as a result of the purchase transaction. The goodwill is allocated to the Electricity segment and notis deductible for tax purposes.purposes pending the exercise of the financial lease buy-out option as described below. |
ORMAT TECHNOLOGIES, INC. AND SUBSIDIARIES
NOTES TO CONSOLIDATED FINANCIAL STATEMENTS
| (4) | Financing liability is related to a sale and leaseback transaction entered into by the Seller in September 2015 under which it sold and leased back the undivided interests in the Dixie Valley power plant asset through June 2038. The lease transaction was accounted for by the Seller as a finance lease due to the Seller's continued involvement and management of the power plant and the existence of an early buy-out option. As per the accounting guidance, the Company retained the Seller's accounting of a "failed" sale and leaseback transaction and accordingly accounted for the liability as a financing liability. This financing liability, as well as the related power plant asset, were measured at their acquisition-date fair value. |
The fair value of the noncontrolling interest of $34.9 million reflects the 40% minority interests in the Neal Hot Springs project that was evaluated using the income approach. The fair value of the noncontrolling interest was based on the following significant inputs: (i) forecasted cash flows assumed to be generated in correspondence with the remaining life of the related power purchase agreement which is approximately 20 years; (ii) revenues were estimated in accordance with the price and generation capacity of the related power purchase agreement; (iii) assumed terminal value based on the realizable value of the project at the end of the power purchase agreement term; and (iv) assumed discount rate of approximately 9%.
Total Electricity revenues and operating profit related to the three USG power plants of approximately $21.4 million and $2.5 million, respectively, for the period started at the acquisition date to December 31, 2018 were included in the Company’s consolidated statements of operations and comprehensive income forDuring the year ended December 31, 2018.2023, the acquired geothermal power plants contributed $51.7 million to the Company Electricity revenues, $3.8 million to earnings, net of $8.3 million related to tax and interest expense in respect of the related finance liability. During the year ended December 31, 2022, the acquired geothermal power plants contributed $48.0 million to the Company Electricity revenues, $3.3 million to earnings, net of $7.4 million related to tax and interest expense in respect of the related finance liability. During the year ended 31,2021, starting from acquisition date, the acquired geothermal power plants contributed $26.2 million to the Company Electricity revenues, $5.5 million to earnings, net of $4.9 million related to tax and interest expense in respect of the related finance liability.
The following unaudited pro forma summary presents condensed consolidated information of the Company as if the business combination had occurred on January 1, 2020. The pro forma results below include the beginningimpact of certain adjustments related to the depreciation of property, plant and equipment, amortization of intangible assets, transaction-related costs incurred as of the earliest year presented:acquisition date, and interest expense on related borrowings, and in each case, the related income tax effects, as well as certain other post-acquisition adjustments. This pro forma presentation does not include any impact from transaction synergies.
| | | Pro forma for the | | |
| | | year ended December 31, 2018 | | | Pro forma for the Year Ended December 31, 2021 | |
| | | (Dollars in thousands) | | | (Dollars in millions) | |
Electricity revenues | | $ | 521,175 | | | $ | 613.3 | |
Total revenues | | 730,563 | | | $ | 690.6 | |
Income from continuing operations before income taxes and equity in losses of investees | | 134,142 | | |
Net income attributable to the Company's stockholders | | | $ | 69.6 | |
Business combination - Geothermal and solar assets purchase transaction
On 130January 4, 2024,
ORMAT TECHNOLOGIES, INC. AND SUBSIDIARIES
NOTES TO CONSOLIDATED FINANCIAL STATEMENTSEnel SpA (ENEL.MI) to acquire a portfolio of assets which includes two contracted geothermal power plants, one triple hybrid power plant which consists of geothermal, solar PV and solar thermal units, two stand alone solar power plants, and two greenfield development assets, for a total cash consideration of $272 million (subject to a customary post-closing working capital adjustment to the purchase price, based on the levels of net working capital of the acquired companies) for 100% of the equity interests in the entities holding those assets. See further details on this business combination transaction under Note 22 - Subsequent Events, to the consolidated financial statements.
NOTE 3 — INVENTORIES
Inventories consist of the following:
| | | December 31, | | | December 31, | |
| | | 2020 | | | 2019 | | | 2023 | | | 2022 | |
| | | (Dollars in thousands) | | | (Dollars in thousands) | |
Raw materials and purchased parts for assembly | | $ | 14,835 | | | $ | 21,942 | | | $ | 20,588 | | | $ | 10,629 | |
Self-manufactured assembly parts and finished products | | | 20,486 | | | | 13,007 | | | | 24,449 | | | | 12,203 | |
Total | | $ | 35,321 | | | $ | 34,949 | | | $ | 45,037 | | | $ | 22,832 | |
ORMAT TECHNOLOGIES, INC. AND SUBSIDIARIES
NOTES TO CONSOLIDATED FINANCIAL STATEMENTS
NOTE 4 — COST AND ESTIMATED EARNINGS ON UNCOMPLETED CONTRACTS
Cost and estimated earnings on uncompleted contracts consist of the following:
| | | December 31, | | | December 31, | |
| | | 2020 | | | 2019 | | | 2023 | | | 2022 | |
| | | (Dollars in thousands) | | | (Dollars in thousands) | |
Costs and estimated earnings incurred on uncompleted contracts | | $ | 227,591 | | | $ | 196,550 | | | $ | 267,111 | | | $ | 155,407 | |
Less billings to date | | | (214,226 | ) | | | (160,940 | ) | | | (267,413 | ) | | | (147,787 | ) |
Total | | $ | 13,365 | | | $ | 35,610 | | | $ | (302 | ) | | $ | 7,620 | |
These amounts are included in the consolidated balance sheets under the following captions:
| | | December 31, | | | December 31, | |
| | | 2020 | | | 2019 | | | 2023 | | | 2022 | |
| | | (Dollars in thousands) | | | (Dollars in thousands) | |
Costs and estimated earnings in excess of billings on uncompleted contracts | | $ | 24,544 | | | $ | 38,365 | | | $ | 18,367 | | | $ | 16,405 | |
Billings in excess of costs and estimated earnings on uncompleted contracts | | | (11,179 | ) | | | (2,755 | ) | | | (18,669 | ) | | | (8,785 | ) |
Total | | $ | 13,365 | | | $ | 35,610 | | | $ | (302 | ) | | $ | 7,620 | |
The completion costs of the Company’s construction contracts are subject to estimation. Due to uncertainties inherent in the estimation process, it is reasonably possible that estimated contract earnings will be further revised in the near term.
ORMAT TECHNOLOGIES, INC. AND SUBSIDIARIES
NOTES TO CONSOLIDATED FINANCIAL STATEMENTS
NOTE 5 — Investment in unconsolidated companies INVESTMENT IN UNCONSOLIDATED COMPANIES
Investment in unconsolidated companies mainly consists of the following:
| | | December 31, | |
| | | 2020 | | | 2019 | |
| | | (Dollars in thousands) | |
Sarulla | | $ | 67,451 | | | $ | 70,589 | |
Ijen | | | 30,766 | | | | 10,551 | |
Total investment in unconsolidated companies | | $ | 98,217 | | | $ | 81,140 | |
| | | December 31, | |
| | | 2023 | | | 2022 | |
| | | (Dollars in thousands) | |
Investment in Sarulla | | $ | 71,744 | | | $ | 74,881 | |
Investment in Ijen | | | 51,695 | | | | 40,812 | |
Other investment, at cost | | | 2,000 | | | | — | |
Total investment in unconsolidated companies | | $ | 125,439 | | | $ | 115,693 | |
The Sarulla Complex
The Company holds a 12.75% equity interest in a consortium that developed the 330 MW Sarulla geothermal power plant project in Tapanuli Utara, North Sumatra, Indonesia. The Sarulla project is comprised of 3three separately constructed 110 MW units, the most recent of which, NIL 2, was completed in April 2018. The Sarulla project is owned and operated by the consortium members under the framework of a joint operating contract and energy sales contract that were both executed on April 4, 2013. Under the joint operating contract, PT Pertamina Geothermal Energy, the concession holder for the project, provided the consortium with the right to use the geothermal field, and under the energy sales contract, PT PLN, the state electric utility, is the off-taker at the Sarulla complex for a period of 30 years. The Company has a significant influence over the Sarulla project through representation on Sarulla's board of directors and thus accounts for its investment in the Sarulla geothermal project under the equity method prescribed by ASC 323 - Investments - Equity Method and Joint Ventures.
During the years ended December 31, 2020,2023, 20192022 and 2018,2021, the Company made additionalno cash equity investmentsinvestment in the Sarulla complex. As of December 31, 2023, total cash investment in the Sarulla complex of approximately $0.0 million, $0.0 million and $3.8 million, respectively, for a total ofsince its inception is $62.0 million since inception.million.
ORMAT TECHNOLOGIES, INC. AND SUBSIDIARIES
NOTES TO CONSOLIDATED FINANCIAL STATEMENTS
The Sarulla consortium entered into interest rate swap agreements with various international banks, effective as of June 4, 2014, and accounted for the interest rate swap as a cash flow hedge upon which changes in the fair value of the hedging instrument, relative to the effective portion, are recorded in other comprehensive income. The Company’s share of such gains (losses) recorded in other comprehensive income (loss) are as follows:
| | | Year Ended
December 31, | |
| | | 2020 | | | 2019 | |
| | | (Dollars in thousands) | |
Change, net of deferred tax, in unrealized gains (losses) in respect of the Company’s share in derivative instruments of unconsolidated investment | | $ | (3,975 | ) | | $ | (3,417 | ) |
| | | Year Ended December 31, | |
| | | 2023 | | | 2022 | | | 2021 | |
| | | (Dollars in thousands) | |
Change in unrealized gains or losses in respect of the Company's share in derivatives instruments of unconsolidated investment that qualifies as a cash flow hedge | | $ | (470 | ) | | $ | 8,370 | | | $ | 3,892 | |
The related accumulated lossgain recorded by the Company under accumulated other comprehensive income (loss) as of December 31, 20202023, 2022and 20192021 and was $10.3$1.5 million, $2.0 million and $6.36.4 million, respectively.
The Sarulla power plant complex has been experiencing a certain reduction in generation primarily due to well fieldwellfield issues at one of its power plants. To address this issue,plants, as well as equipment failures which resulted in a decrease in profitability. In the projectsecond quarter of 2022, Sarulla agreed with its banks on a framework to perform remediation works that are aimed to restore the power plants' performance. The outcome of the first phase of the recovery plan is expected to implementunder evaluation after which we will make a remediation plan indecision regarding the implementation of the 2021.second The Companyphase. As we determined that the reductioncurrent situation and circumstances related to our equity method investment in generation is not considered "Other than temporary" and thereforeSarulla are temporary, no impairment testing was required.required for the period.
The Ijen Project
For details onOn July 2, 2019, the Company acquired 49% of the Ijen geothermal project from a subsidiary of Medco Power (“Medco”), which is a party to a Power Purchase Agreement and holds a geothermal license to develop the Ijen project please see Notein East Java in Indonesia for a total consideration of approximately $2.7 million. As part of the transaction, the Company committed to make additional funding for the exploration and development of the project, subject to specific conditions. During 22023, to2022 and 2021, the consolidated financial statementsCompany made additional cash investments of approximately $6.1 million, $4.5 million and $6.4 million, respectively, and $48.7 million in total. Medco retains 51% ownership in the project company and the Company and Medco are developing the project jointly. The Company accounted for its investment in the Ijen geothermal project company under the heading "Ijen transaction".equity method prescribed by ASC 323 - Investments - Equity Method and Joint Ventures. The construction of the power plant has started and major equipment was shipped.
NOTE 6 — VARIABLE INTEREST ENTITIES
The Company’s overall methodology for evaluating transactions and relationships under the variable interest entity (“VIE”) accounting and disclosure requirements includes the following two steps: (i) determining whether the entity meets the criteria to qualify as a VIE; and (ii) determining whether the Company is the primary beneficiary of the VIE.
ORMAT TECHNOLOGIES, INC. AND SUBSIDIARIES
NOTES TO CONSOLIDATED FINANCIAL STATEMENTS
In performing the first step, the significant factors and judgments that the Company considers in making the determination as to whether an entity is a VIE include: (i) the design of the entity, including the nature of its risks and the purpose for which the entity was created, to determine the variability that the entity was designed to create and distribute to its interest holders; (ii) the nature of the Company’s involvement with the entity; (iii) whether control of the entity may be achieved through arrangements that do not involve voting equity; (iv) whether there is sufficient equity investment at risk to finance the activities of the entity; and (v) whether parties other than the equity holders have the obligation to absorb expected losses or the right to receive residual returns.
| •
| The design of the entity, including the nature of its risks and the purpose for which the entity was created, to determine the variability that the entity was designed to create and distribute to its interest holders;
|
| •
| The nature of the Company’s involvement with the entity;
|
| •
| Whether control of the entity may be achieved through arrangements that do not involve voting equity;
|
| •
| Whether there is sufficient equity investment at risk to finance the activities of the entity; and
|
| •
| Whether parties other than the equity holders have the obligation to absorb expected losses or the right to receive residual returns.
|
If the Company identifies a VIE based on the above considerations, it then performs the second step and evaluates whether it is the primary beneficiary of the VIE by considering the following significant factors and judgments: (i) whether the Company has the power to direct the activities of the VIE that most significantly impact the entity’s economic performance; and (ii) whether the Company has the obligation to absorb losses of the entity that could potentially be significant to the VIE or the right to receive benefits from the entity that could potentially be significant to the VIE.
| •
| Whether the Company has the power to direct the activities of the VIE that most significantly impact the entity’s economic performance; and
|
| •
| Whether the Company has the obligation to absorb losses of the entity that could potentially be significant to the VIE or the right to receive benefits from the entity that could potentially be significant to the VIE.
|
ORMAT TECHNOLOGIES, INC. AND SUBSIDIARIES
NOTES TO CONSOLIDATED FINANCIAL STATEMENTS
The Company’s VIEs include certain of its wholly owned subsidiaries that own one or more power plants with long-term PPAs. In most cases, the PPAs require the utility to purchase substantially all of the plant’s electrical output over a significant portion of its estimated useful life. MostSome of the VIEs have associated project financing debt that is non-recourse to the general creditors of the Company, is collateralized by substantially all of the assets of the VIE and those of its wholly owned subsidiaries (also VIEs) and is fully and unconditionally guaranteed by such subsidiaries. The Company has concluded that such entities are VIEs primarily because the entities do not have sufficient equity at risk and/or subordinated financial support is provided through the long-term PPAs. The Company has evaluated each of its VIEs to determine the primary beneficiary by considering the party that has the power to direct the most significant activities of the entity. Such activities include, among others, construction of the power plant, operations and maintenance, dispatch of electricity, financing and strategy. Except for power plants that it acquired, the Company is responsible for the construction of its power plants and generally provides operation and maintenance services. Primarily due to its involvement in these and other activities, the Company has concluded that it directs the most significant activities at each of its VIEs and, therefore, is considered the primary beneficiary. The Company performs an ongoing reassessment of the VIEs to determine the primary beneficiary and may be required to deconsolidate certain of its VIEs in the future.for each. The Company has aggregated its consolidated VIEs into the following categories: (i) wholly owned subsidiaries with project debt; and (ii) wholly owned subsidiaries with PPAs.
The tables below detail the assets and liabilities (excluding intercompany balances which are eliminated in consolidation) for the Company’s VIEs, combined by VIE classifications, that were included in the consolidated balance sheets as of December 31, 20202023 and 2019:2022:
| | | December 31, 2020 | | | December 31, 2023 | |
| | | Project Debt | | | PPAs | | | Project Debt | | | PPAs | |
| | | (Dollars in thousands) | | | (Dollars in thousands) | |
Assets: | | | | | | |
Restricted cash and cash equivalents | | $ | 86,581 | | | $ | 0 | | | $ | 91,586 | | | $ | — | |
Other current assets | | 133,017 | | | 30,917 | | | 154,781 | | | 46,501 | |
Property, plant and equipment, net | | 1,208,165 | | | 770,055 | | | 1,646,973 | | | 1,155,947 | |
Construction-in-process | | 27,440 | | | 171,372 | | | 112,469 | | | 264,133 | |
Other long-term assets | | | 156,000 | | | | 60,143 | | | | 306,183 | | | | 43,478 | |
Total assets | | $ | 1,611,203 | | | $ | 1,032,487 | | | $ | 2,311,992 | | | $ | 1,510,059 | |
| | | |
Liabilities: | | | | | | |
Accounts payable and accrued expenses | | $ | 21,958 | | | $ | 15,362 | | | $ | 33,357 | | | $ | 14,619 | |
Long-term debt | | 730,177 | | | 0 | | | 545,954 | | | — | |
Other long-term liabilities | | | 143,985 | | | | 39,486 | | | | 440,621 | | | | 61,285 | |
Total liabilities | | $ | 896,120 | | | $ | 54,848 | | | $ | 1,019,932 | | | $ | 75,904 | |
| | | December 31, 2022 | |
| | | Project Debt | | | PPAs | |
| | | (Dollars in thousands) | |
Assets: | | | | | | | | |
Restricted cash and cash equivalents | | $ | 127,972 | | | $ | — | |
Other current assets | | | 128,414 | | | | 29,377 | |
Property, plant and equipment, net | | | 1,516,107 | | | | 810,384 | |
Construction-in-process | | | 104,956 | | | | 255,552 | |
Other long-term assets | | | 304,766 | | | | 51,037 | |
Total assets | | $ | 2,182,215 | | | $ | 1,146,350 | |
| | | | | | | | | |
Liabilities: | | | | | | | | |
Accounts payable and accrued expenses | | $ | 42,577 | | | $ | 8,552 | |
Long-term debt | | | 637,080 | | | | — | |
Other long-term liabilities | | | 400,271 | | | | 50,348 | |
Total liabilities | | $ | 1,079,928 | | | $ | 58,900 | |
ORMAT TECHNOLOGIES, INC. AND SUBSIDIARIES
NOTES TO CONSOLIDATED FINANCIAL STATEMENTS
| | | December 31, 2019 | |
| | | Project Debt | | | PPAs | |
| | | (Dollars in thousands) | |
Assets: | | | | | | | | |
Restricted cash and cash equivalents | | $ | 81,522 | | | $ | 20 | |
Other current assets | | | 164,386 | | | | 29,076 | |
Property, plant and equipment, net | | | 1,211,656 | | | | 668,891 | |
Construction-in-process | | | 10,188 | | | | 139,642 | |
Other long-term assets | | | 162,995 | | | | 40,138 | |
Total assets | | $ | 1,630,747 | | | $ | 877,767 | |
| | | | | | | | | |
Liabilities: | | | | | | | | |
Accounts payable and accrued expenses | | $ | 25,361 | | | $ | 13,201 | |
Long-term debt | | | 794,214 | | | | 0 | |
Other long-term liabilities | | | 126,851 | | | | 32,790 | |
Total liabilities | | $ | 946,426 | | | $ | 45,991 | |
NOTE 7—7— FAIR VALUE OF FINANCIAL INSTRUMENTS
The fair value measurement guidance clarifies that fair value represents the amount that would be received upon selling an asset or paid upon transferring a liability in an orderly transaction between market participants at the measurement date. As such, fair value is a market-based measurement that should be determined based on assumptions that market participants would use in pricing an asset or liability. The guidance establishes a fair value hierarchy that prioritizes the inputs to valuation techniques used to measure fair value. The hierarchy gives the highest priority to unadjusted quoted prices in active markets for identical assets or liabilities (Level 1 measurements) and the lowest priority to unobservable inputs (Level 3 measurements). The three levels of the fair value hierarchy under the fair value measurement guidance are described below:
Level 1 — Unadjustedunadjusted observable inputs that reflect quoted prices in active markets that are accessible at the measurement date for identical assets or liabilities;liabilities in active markets;
Level 2 — Quotedinputs other than quoted prices included in markets that areLevel not1 active, or inputs that are observable for the asset or liability either directly or indirectly, for substantially the full term of the asset or liability;indirectly;
Level 3 — Prices or valuation techniques that require inputs that are both significant to the fair value measurement and unobservable (supported by little or no market activity).inputs.
The following table sets forth certain fair value information at December 31, 20202023 and 20192022 for financial assets and liabilities measured at fair value by level within the fair value hierarchy, as well as cost or amortized cost. As required by the fair value measurement guidance, assets and liabilities are classified in their entirety based on the lowest level of inputs that is significant to the fair value measurement.
| | | | | | | December 31, 2020 | | | | | | | December 31, 2023 | |
| | | | | | | Fair Value | | | | | | | Fair Value | |
| | | Carrying Value at December 31, 2020 | | Total | | Level 1 | | Level 2 | | Level 3 | | | Carrying Value at December 31, 2023 | | Total | | Level 1 | | Level 2 | | Level 3 | |
| | | (Dollars in thousands) | | | (Dollars in thousands) | |
Assets: | | | | | | | | | | | | |
Current assets: | | | | | | | | | | | | |
Cash equivalents (including restricted cash accounts) | | $ | 28,653 | | | $ | 28,653 | | | $ | 28,653 | | | $ | 0 | | | $ | 0 | | | $ | 53,877 | | | $ | 53,877 | | | $ | 53,877 | | | $ | — | | | $ | — | |
Derivatives: | | | | | | | | | | | | |
Contingent receivable (1) | | 111 | | | 111 | | | 0 | | | 0 | | | 111 | | |
Currency forward contracts (2) | | 1,554 | | | 1,554 | | | 0 | | | 1,554 | | | 0 | | |
Long-term assets: | | | | | | | | | | | | |
Cross currency swap (3) | | | 27,829 | | | 27,829 | | | 0 | | | 27,829 | | | 0 | | |
Currency forward contracts (1) | | | 1,406 | | | 1,406 | | | — | | | 1,406 | | | — | |
Liabilities: | | | | | | | | | | | | |
Current liabilities: | | | | | | | | | | | | |
Derivatives: | | | | | | | | | | | | |
Contingent payables (1) | | (549 | ) | | (549 | ) | | 0 | | | 0 | | | (549 | ) | |
Cross currency swap (3) | | (2,283 | ) | | (2,283 | ) | | 0 | | | (2,283 | ) | | 0 | | |
Cross currency swap (2) | | | (3,686 | ) | | (3,686 | ) | | — | | | (3,686 | ) | | — | |
Long-term liabilities: | | | | | | | | | | | | |
Contingent payables (1) | | | (2,630 | ) | | (2,630 | ) | | 0 | | | 0 | | | (2,630 | ) | |
Cross currency swap (2) | | | | (8,137 | ) | | (8,137 | ) | | — | | | (8,137 | ) | | — | |
| | | $ | 52,685 | | | $ | 52,685 | | | $ | 28,653 | | | $ | 27,100 | | | $ | (3,068 | ) | | $ | 43,461 | | | $ | 43,461 | | | $ | 53,877 | | | $ | (10,416 | ) | | $ | — | |
ORMAT TECHNOLOGIES, INC. AND SUBSIDIARIES
NOTES TO CONSOLIDATED FINANCIAL STATEMENTS
| | | | | | | December 31, 2019 | |
| | | | | | | Fair Value | |
| | | Carrying Value at December 31, 2019 | | | Total | | | Level 1 | | | Level 2 | | | Level 3 | |
| | | (Dollars in thousands) | |
Assets | | | | | | | | | | | | | | | | | | | | |
Current assets: | | | | | | | | | | | | | | | | | | | | |
Cash equivalents (including restricted cash accounts) | | $ | 28,316 | | | $ | 28,316 | | | $ | 28,316 | | | $ | 0 | | | $ | 0 | |
Derivatives: | | | | | | | | | | | | | | | | | | | | |
Contingent receivable (1) | | | 102 | | | | 102 | | | | 0 | | | | 0 | | | | 102 | |
Currency forward contracts (2) | | | 362 | | | | 362 | | | | 0 | | | | 362 | | | | 0 | |
Liabilities: | | | | | | | | | | | | | | | | | | | | |
Current liabilities: | | | | | | | | | | | | | | | | | | | | |
Derivatives: | | | | | | | | | | | | | | | | | | | | |
Contingent payables (1) | | | (3,359 | ) | | | (3,359 | ) | | | 0 | | | | 0 | | | | (3,359 | ) |
| | | $ | 25,421 | | | $ | 25,421 | | | $ | 28,316 | | | $ | 362 | | | $ | (3,257 | ) |
| | | | | | | December 31, 2022 | |
| | | | | | | Fair Value | |
| | | Carrying Value at December 31, 2022 | | | Total | | | Level 1 | | | Level 2 | | | Level 3 | |
| | | (Dollars in thousands) | |
Assets | | | | | | | | | | | | | | | | | | | | |
Current assets: | | | | | | | | | | | | | | | | | | | | |
Cash equivalents (including restricted cash accounts) | | $ | 34,832 | | | $ | 34,832 | | | $ | 34,832 | | | $ | — | | | $ | — | |
Marketable securities | | | 136 | | | | 136 | | | | 136 | | | | — | | | | — | |
Derivatives: | | | | | | | | | | | | | | | | | | | | |
Long-term assets: | | | | | | | | | | | | | | | | | | | | |
Cross currency swap (2) | | | 3,029 | | | | 3,029 | | | | — | | | | 3,029 | | | | — | |
Liabilities: | | | | | | | | | | | | | | | | | | | | |
Current liabilities: | | | | | | | | | | | | | | | | | | | | |
Derivatives: | | | | | | | | | | | | | | | | | | | | |
Cross currency swap (2) | | | (2,777 | ) | | | (2,777 | ) | | | — | | | | (2,777 | ) | | | — | |
Currency forward contracts (1) | | | (800 | ) | | | (800 | ) | | | — | | | | (800 | ) | | | — | |
| | | $ | 34,420 | | | $ | 34,420 | | | $ | 34,968 | | | $ | (548 | ) | | $ | — | |
(1) These amounts relate to contingent receivables and payables and warrants pertaining to the Guadeloupe power plant purchase transaction, valued primarily based on unobservable inputs and are included within "Prepaid expenses and other", "Accounts payable and accrued expenses" and "Other long-term liabilities" on December 31, 2020 and 2019 in the consolidated balance sheets with the corresponding gain or loss being recognized within "Derivatives and foreign currency transaction gains (losses)" in the consolidated statement of operations and comprehensive income.
(2) These amounts relate to currency forward contracts valued primarily based on observable inputs, including forward and spot prices for currencies, net of contracted rates and then multiplied by notional amounts, and are included within "Receivables, other" and "Accounts payable and accrued expenses" on December 31, 20202023 and December 31, 2019,2022, as applicable, in the consolidated balance sheet with the corresponding gain or loss being recognized within "Derivatives and foreign currency transaction gains (losses)" in the consolidated statement of operations and comprehensive income.
(32) These amounts relate to cross currency swap contracts valued primarily based on the present value of the Cross Currency Swap future settlement prices for USD and NIS zero yield curves and the applicable exchange rate as of December 31, 2020.2023. These amounts are included within “Deposits and other” and "Accounts“Accounts payable and accrued expenses"expenses” and “Other long-term liabilities” on December 31, 20202023 and within "Prepaid expenses and other" and “Accounts payable and accrued expenses” on December 31, 2022 in the consolidated balance sheets. There are 0 cashCash collateral deposits onin respect of the cross currency swap are presented under “Receivables, others” in the consolidated balance sheet, and amounted to $10.6 million as of December 31, 2020.2023, and none as of December 31, 2022.
The amounts set forth in the tables above include investments in money market funds (which are included in cash equivalents). Those securities and deposits are classified within Level 1 of the fair value hierarchy because they are valued using quoted market prices in an active market.
ORMAT TECHNOLOGIES, INC. AND SUBSIDIARIES
NOTES TO CONSOLIDATED FINANCIAL STATEMENTS
The following table presents the amounts of gain (loss) recognized in the consolidated statements of operations and comprehensive income (loss):
Derivatives not designated as hedging instruments | | Location of recognized gain (loss) | | Amount of recognized gain (loss) | | | Location of recognized gain (loss) | | Amount of recognized gain (loss) | |
| | | | | 2020 | | 2019 | | 2018 | | | | | 2023 | | | 2022 | | | 2021 | |
| | | | | (Dollars in thousands) | | | | | (Dollars in thousands) | |
Contingent considerations | | Derivative and foreign currency transaction gains (losses) | | $ | 0 | | | $ | 0 | | | $ | 170 | | |
Contingent considerations | | General and administrative expenses | | 0 | | | 0 | | | 10,322 | | |
Swap transaction on RRS prices (1) | | | Derivative and foreign currency transaction gains (losses) | | $ | — | | | $ | — | | | $ | (14,540 | ) |
Currency forward contracts (1) | | Derivative and foreign currency transaction gains (losses) | | | 5,175 | | | | 2,556 | | | | (3,081 | ) | | Derivative and foreign currency transaction gains (losses) | | | (2,190 | ) | | | (5,466 | ) | | | 1,368 | |
| | | | | $ | 5,175 | | | $ | 2,556 | | | $ | 7,411 | | | | | $ | (2,190 | ) | | $ | (5,466 | ) | | $ | (13,172 | ) |
| | | | | | | | | | | | | | | | | | | | |
Derivatives designated as cash flow hedging instruments | | | | | | | | | | | | | | | | | | | | | | | | | | | | |
| | | | | | | | | | | | | | | | | | | | |
Cross currency swap (2) | | Derivative and foreign currency transaction gains (losses) | | $ | 21,187 | | | $ | 0 | | | $ | 0 | | | Derivative and foreign currency transaction gains (losses) | | $ | (6,201 | ) | | $ | (36,803 | ) | | $ | 10,501 | |
(1)The foregoing currency forward and put optionsprice swap transactions havewere not been designated as hedge transactions and arewere marked to market with the corresponding gains or losses recognized within “Derivatives and foreign currency transaction gains (losses)” in the consolidated statements of operations and comprehensive income. The price swap transaction was related to a hedging agreement with a third party that was effective January 1, 2021 under which the Company fixed the price per MWh on a portion of RRS provided by its Rabbit Hill storage facility. The price swap transaction was terminated effective April 1, 2021.
(2) The foregoing cross currency swap transactions were designated as a cash flow hedge as further described under noteNote 111 to the consolidated financial statements. The changes in the cross currency swap fair value are initially recorded in "Other comprehensive income (loss)" and a corresponding amount is reclassified out of "Accumulated other comprehensive income (loss)" to "Derivatives and foreign currency transaction gains (losses)" to offset the remeasurement of the underlying hedged transaction which also impacts the same line item in the consolidated statements of operations and comprehensive income.
ORMAT TECHNOLOGIES, INC. AND SUBSIDIARIES
NOTES TO CONSOLIDATED FINANCIAL STATEMENTS
There were no transfers of assets or liabilities between Level 1, Level 2 and Level 3 during the year ended December 31, 2020.2023.
The following table presents the effect of derivative instruments designated as cash flow hedges on the consolidated statements of operations and comprehensive income (loss) for the yearyears ended December 31, 2020:2023, 2022 and 2021 :
| | | Balance in Other comprehensive income (loss) beginning of period | | | Gain or (loss) recognized in Other comprehensive income (loss) (1) | | | Amount reclassified from Other comprehensive income (loss) into earnings | | | Balance in Other comprehensive income (loss) end of period | |
| | | (Dollars in thousands) | |
Cash flow hedge: | | | | | | | | | | | | | | | | |
Cross currency swap | | $ | 0 | | | $ | 24,553 | | | $ | (21,187 | ) | | $ | 3,366 | |
| | | Year Ended December 31, | |
| | | 2023 | | | 2022 | | | 2021 | |
| | | (Dollars in thousands) | |
Cross currency swap cash flow hedge: | | | | | | | | | | | | |
Balance in Other comprehensive income (loss) beginning of period | | $ | 3,920 | | | $ | 5,745 | | | $ | 3,366 | |
Gain or (loss) recognized in Other comprehensive income (loss) (1) | | | 1,963 | | | | (38,628 | ) | | | 12,880 | |
Amount reclassified from Other comprehensive income (loss) into earnings | | | (6,201 | ) | | | 36,803 | | | | (10,501 | ) |
Balance in Other comprehensive income (loss) end of period | | $ | (318 | ) | | $ | 3,920 | | | $ | 5,745 | |
(1) The amount of gain or (loss) recognized in Other comprehensive income (loss) for the years ended December 31, 2023, 2022 and 2021is net of tax of $1.1 million.$1.5 million, $0.5 million and $0.8 million, respectively.
The estimated net amount of existing gain (loss) that is reported in "Accumulated other comprehensive income (loss)" as of December 31, 20202023 that is expected to be reclassified into earnings within the next 12 months is immaterial. The maximum length of time over which the Company is hedging its exposure to the variability in future cash flow is from the transaction commencement date through June 2031.
ORMAT TECHNOLOGIES, INC. AND SUBSIDIARIES
NOTES TO CONSOLIDATED FINANCIAL STATEMENTS
The fair value of the Company’s long-term debt approximates its fair value, except for the following:
| | | Fair Value | | Carrying Amount | | | Fair Value | | Carrying Amount (*) | |
| | | 2020 | | 2019 | | 2020 | | 2019 | | | 2023 | | 2022 | | 2023 | | 2022 | |
| | | (Dollars in millions) | | (Dollars in millions) | | | (Dollars in millions) | | (Dollars in millions) | |
Mizrahi Loan | | | $ | 61.4 | | | $ | 71.4 | | | $ | 60.9 | | | $ | 70.3 | |
Mizrahi Loan 2023 | | | 52.0 | | | — | | | 50.0 | | | — | |
Convertible Senior Notes | | | 444.6 | | | 505.3 | | | 431.3 | | | 431.3 | |
HSBC Loan | | | 33.8 | | | 40.3 | | | 35.7 | | | 42.9 | |
Hapoalim Loan | | | 75.0 | | | 91.1 | | | 80.4 | | | 98.2 | |
Hapoalim Loan 2023 | | | 99.7 | | | — | | | 95.0 | | | — | |
Discount Loan | | | 69.9 | | | 81.1 | | | 75.0 | | | 87.5 | |
Financing Liability - Dixie Valley | | | 207.2 | | | 219.8 | | | 225.8 | | | 242.0 | |
Olkaria III Loan - DFC | | $ | 192.5 | | | $ | 202.1 | | | $ | 174.7 | | | $ | 192.6 | | | 116.4 | | | 134.2 | | | 120.7 | | | 138.7 | |
Olkaria III plant 4 Loan - DEG 2 | | 40.4 | | | 43.8 | | | 37.5 | | | 42.5 | | | 21.6 | | | 26.5 | | | 22.5 | | | 27.5 | |
Olkaria III plant 1 Loan - DEG 3 | | 35.8 | | | 38.8 | | | 32.8 | | | 37.1 | | | 19.0 | | | 23.3 | | | 19.7 | | | 24.0 | |
Platanares Loan - DFC | | 112.1 | | | 115.3 | | | 96.3 | | | 104.5 | | | 71.3 | | | 80.2 | | | 71.7 | | | 79.9 | |
Amatitlan Loan | | 23.5 | | | 26.4 | | | 22.8 | | | 26.3 | | | — | | | 14.7 | | | — | | | 15.8 | |
Senior Secured Notes: | | | | | | | | | | |
OFC 2 LLC ("OFC 2") | | 207.9 | | | 210.9 | | | 188.2 | | | 203.0 | | |
Don A. Campbell 1 ("DAC 1") | | 78.5 | | | 78.5 | | | 73.1 | | | 78.2 | | |
OFC 2 LLC Senior Secured Notes ("OFC 2") | | | 134.2 | | | 149.8 | | | 142.5 | | | 158.0 | |
Don A. Campbell 1 Senior Secured Notes ("DAC 1") | | | 52.3 | | | 57.4 | | | 57.4 | | | 62.7 | |
USG Prudential - NV | | 31.8 | | | 30.6 | | | 27.6 | | | 28.4 | | | 22.3 | | | 23.7 | | | 23.9 | | | 25.0 | |
USG Prudential - ID | | 18.3 | | | 18.6 | | | 18.4 | | | 19.6 | | |
USG Prudential - ID Refinancing (prior year: USG Prudential - ID) | | | 54.1 | | | 56.8 | | | 58.9 | | | 61.6 | |
USG DOE | | 45.1 | | | 45.0 | | | 38.2 | | | 40.8 | | | 30.0 | | | 32.8 | | | 30.2 | | | 32.8 | |
Senior Unsecured Bonds | | 585.1 | | | 205.7 | | | 529.1 | | | 204.3 | | | 202.8 | | | 235.1 | | | 220.6 | | | 255.8 | |
Senior Unsecured Loan | | 222.2 | | | 161.3 | | | 200.0 | | | 150.0 | | | 150.4 | | | 166.4 | | | 158.0 | | | 174.8 | |
Plumstriker | | 18.1 | | | 21.7 | | | 18.1 | | | 21.6 | | | — | | | 11.2 | | | — | | | 11.4 | |
Other long-term debt | | 17.4 | | | 16.3 | | | 17.6 | | | 17.4 | | | 6.8 | | | 9.2 | | | 7.7 | | | 10.4 | |
(*) The carrying amount value excludes the related deferred financing costs.
ORMAT TECHNOLOGIES, INC. AND SUBSIDIARIES
NOTES TO CONSOLIDATED FINANCIAL STATEMENTS
The fair value of the long-term debt is determined by a valuation model, which is based on a conventional discounted cash flow methodology and utilizes assumptions of current borrowing rates.Therates, except for the fair value of revolving lines of credit is determined usingthe Convertible Senior Notes for which the fair value was estimated based on a comparison of market-basedquoted bid price sources that are reflective of similar credit ratings to those of the Company.
As disclosed above under Note 1 toNotes in an over-the-counter market on the consolidated financial statements, the outbreaklast trading day of the COVID-19 pandemic has resultedreporting period. A hypothetical change in the quoted bid price will result in a global economic downturn and market volatility that may have an impact oncorresponding change in the estimated fair value of the Company'sNotes. The carrying value of the deposits, the short term revolving credit lines with banks and the commercial paper approximate their fair value.
Recently, interest rate for both short-term and long-term debt. While interest rates on U.S. Treasury securitiesdebt have declined andincreased sharply which may continue to decline as a result of the COVID-19 pandemic, other components of the Company's borrowing rates have increased and may continue to increase as the global economic situation evolves, all of which have a direct impact on the fair value of the Company's long-term debt.
The carrying value of other financial instruments, such as revolving lines of credit, commercial paper and deposits approximates fair value.
The following table presents the fair value of financial instruments as of December 31, 2020:2023:
| | | Level 1 | | Level 2 | | Level 3 | | Total | | | Level 1 | | Level 2 | | Level 3 | | Total | |
| | | (Dollars in millions) | | | (Dollars in millions) | |
Mizrahi Loan | | | $ | — | | | $ | — | | | $ | 61.4 | | | $ | 61.4 | |
Mizrahi Loan 2023 | | | — | | | — | | | 52.0 | | | 52.0 | |
Convertible Senior Notes | | | — | | | 444.6 | | | — | | | 444.6 | |
HSBC Loan | | | — | | | — | | | 33.8 | | | 33.8 | |
Hapoalim Loan | | | — | | | — | | | 75.0 | | | 75.0 | |
Hapoalim Loan 2023 | | | — | | | — | | | 99.7 | | | 99.7 | |
Discount Loan | | | — | | | — | | | 69.9 | | | 69.9 | |
Financing Liability - Dixie Valley | | | — | | | — | | | 207.2 | | | 207.2 | |
Olkaria III - DFC | | $ | 0 | | | $ | 0 | | | $ | 192.5 | | | $ | 192.5 | | | — | | | — | | | 116.4 | | | 116.4 | |
Olkaria III plant 4 - DEG 2 | | 0 | | | 0 | | | 40.4 | | | 40.4 | | | — | | | — | | | 21.6 | | | 21.6 | |
Olkaria III plant 1 - DEG 3 | | 0 | | | 0 | | | 35.8 | | | 35.8 | | | — | | | — | | | 19.0 | | | 19.0 | |
Platanares Loan - DFC | | 0 | | | 0 | | | 112.1 | | | 112.1 | | | — | | | — | | | 71.3 | | | 71.3 | |
Amatitlan Loan | | 0 | | | 23.5 | | | 0 | | | 23.5 | | |
Senior Secured Notes: | | | | | | | | | | |
OFC 2 Senior Secured Notes | | 0 | | | 0 | | | 207.9 | | | 207.9 | | | — | | | — | | | 134.2 | | | 134.2 | |
DAC 1 Senior Secured Notes | | 0 | | | 0 | | | 78.5 | | | 78.5 | | | — | | | — | | | 52.3 | | | 52.3 | |
USG Prudential - NV | | 0 | | | 0 | | | 31.8 | | | 31.8 | | | — | | | — | | | 22.3 | | | 22.3 | |
USG Prudential - ID | | 0 | | | 0 | | | 18.3 | | | 18.3 | | |
USG Prudential - ID - Refinancing | | | — | | | — | | | 54.1 | | | 54.1 | |
USG DOE | | 0 | | | 0 | | | 45.1 | | | 45.1 | | | — | | | — | | | 30.0 | | | 30.0 | |
Senior Unsecured Bonds | | 0 | | | 0 | | | 585.1 | | | 585.1 | | | — | | | — | | | 202.8 | | | 202.8 | |
Senior Unsecured Loan | | 0 | | | 0 | | | 222.2 | | | 222.2 | | | — | | | — | | | 150.4 | | | 150.4 | |
Plumstriker | | 0 | | | 18.1 | | | 0 | | | 18.1 | | |
Other long-term debt | | 0 | | | 0 | | | 17.4 | | | 17.4 | | | — | | | — | | | 6.8 | | | 6.8 | |
Deposits | | 14.8 | | | 0 | | | 0 | | | 14.8 | | | 20.9 | | | — | | | — | | | 20.9 | |
ORMAT TECHNOLOGIES, INC. AND SUBSIDIARIES
NOTES TO CONSOLIDATED FINANCIAL STATEMENTS
The following table presents the fair value of financial instruments as of December 31, 2019:2022:
| | | Level 1 | | Level 2 | | Level 3 | | Total | | | Level 1 | | Level 2 | | Level 3 | | Total | |
| | | (Dollars in millions) | | | (Dollars in millions) | |
Mizrahi Loan | | | $ | — | | | $ | — | | | $ | 71.4 | | | $ | 71.4 | |
Convertible Senior Notes | | | — | | | 505.3 | | | — | | | 505.3 | |
HSBC Loan | | | — | | | — | | | 40.3 | | | 40.3 | |
Hapoalim Loan | | | — | | | — | | | 91.1 | | | 91.1 | |
Discount Loan | | | — | | | — | | | 81.1 | | | 81.1 | |
Financing Liability - Dixie Valley | | | — | | | — | | | 219.8 | | | 219.8 | |
Olkaria III Loan - DFC | | $ | 0 | | | $ | 0 | | | $ | 202.1 | | | $ | 202.1 | | | — | | | — | | | 134.2 | | | 134.2 | |
Olkaria III plant 4 - DEG 2 | | 0 | | | 0 | | | 43.8 | | | 43.8 | | | — | | | — | | | 26.5 | | | 26.5 | |
Olkaria III plant 1 - DEG 3 | | 0 | | | 0 | | | 38.8 | | | 38.8 | | | — | | | — | | | 23.3 | | | 23.3 | |
Platanares Loan - DFC | | 0 | | | 0 | | | 115.3 | | | 115.3 | | | — | | | — | | | 80.2 | | | 80.2 | |
Amatitlan Loan | | 0 | | | 26.4 | | | 0 | | | 26.4 | | | — | | | 14.7 | | | — | | | 14.7 | |
Senior Secured Notes: | | | | | | | | | | |
OFC 2 Senior Secured Notes | | 0 | | | 0 | | | 210.9 | | | 210.9 | | | — | | | — | | | 149.8 | | | 149.8 | |
DAC 1 Senior Secured Notes | | 0 | | | 0 | | | 78.5 | | | 78.5 | | | — | | | — | | | 57.4 | | | 57.4 | |
USG Prudential - NV | | 0 | | | 0 | | | 30.6 | | | 30.6 | | | — | | | — | | | 23.7 | | | 23.7 | |
USG Prudential - ID | | 0 | | | 0 | | | 18.6 | | | 18.6 | | | — | | | — | | | 56.8 | | | 56.8 | |
USG DOE | | 0 | | | 0 | | | 45.0 | | | 45.0 | | | — | | | — | | | 32.8 | | | 32.8 | |
Senior Unsecured Bonds | | 0 | | | 0 | | | 205.7 | | | 205.7 | | | — | | | — | | | 235.1 | | | 235.1 | |
Senior Unsecured Loan | | 0 | | | 0 | | | 161.3 | | | 161.3 | | | — | | | — | | | 166.4 | | | 166.4 | |
Plumstriker | | 0 | | | 21.7 | | | 0 | | | 21.7 | | | — | | | 11.2 | | | — | | | 11.2 | |
Other long-term debt | | 0 | | | 0 | | | 16.3 | | | 16.3 | | | — | | | — | | | 9.2 | | | 9.2 | |
Commercial paper | | 0 | | | 50.0 | | | 0 | | | 50.0 | | |
Revolving lines of credit | | 0 | | | 40.6 | | | 0 | | | 40.6 | | |
Deposits | | 12.2 | | | 0 | | | 0 | | | 12.2 | | | 13.9 | | | — | | | — | | | 13.9 | |
NOTE 8 — PROPERTY, PLANT AND EQUIPMENT AND CONSTRUCTION-IN-PROCESS
Property, plant and equipment
Property, plant and equipment, net, consist of the following:
| | | December 31, | | | December 31, | |
| | | 2020 | | | 2019 | | | 2023 | | | 2022 | |
| | | (Dollars in thousands) | | | (Dollars in thousands) | |
Land owned by the Company where the geothermal resource is located | | $ | 40,157 | | | $ | 38,049 | | | $ | 47,612 | | | $ | 42,335 | |
Leasehold improvements | | 8,477 | | | 7,757 | | | 12,588 | | | 13,230 | |
Machinery and equipment | | 271,981 | | | 230,465 | | | 341,931 | | | 350,584 | |
Land, buildings and office equipment | | 43,555 | | | 39,099 | | | 127,970 | | | 52,222 | |
Vehicles | | 8,960 | | | 8,021 | | | 17,097 | | | 14,115 | |
Energy storage equipment | | 63,562 | | | 32,896 | | | 158,604 | | | 91,025 | |
Solar facility equipment | | | 59,214 | | | 32,003 | |
Geothermal and recovered energy generation power plants, including geothermal wells and exploration and resource development costs: | | | | | | |
United States of America, net of cash grants | | 2,296,415 | | | 2,128,014 | | | 3,191,505 | | | 2,641,280 | |
Foreign countries | | 732,537 | | | 721,824 | | | 868,289 | | | 897,657 | |
Asset retirement cost | | | 28,946 | | | | 19,824 | | | | 59,123 | | | | 48,578 | |
| | | 3,494,590 | | | 3,225,949 | | | 4,883,933 | | | 4,183,029 | |
Less accumulated depreciation | | | (1,395,543 | ) | | | (1,254,534 | ) | | | (1,884,984 | ) | | | (1,689,572 | ) |
| | | |
Property, plant and equipment, net | | $ | 2,099,047 | | | $ | 1,971,415 | | | $ | 2,998,949 | | | $ | 2,493,457 | |
ORMAT TECHNOLOGIES, INC. AND SUBSIDIARIES
NOTES TO CONSOLIDATED FINANCIAL STATEMENTS
Depreciation expense for the years ended December 31, 2020,2023, 20192022 and 20182021 amounted to $133.5$186.5 million, $126.7$163.2 million and $114.4$153.0 million, respectively. Depreciation expense for the years ended December 31, 2020,2023, 2019,2022, and 20182021 is net of the impact of the cash grant in the amount of $7.3$6.9 million, $7.3$7.5 million and $6.4$7.4 million, respectively.
ORMAT TECHNOLOGIES, INC. AND SUBSIDIARIES
NOTES TO CONSOLIDATED FINANCIAL STATEMENTS
U.S. Operations
The net book value of the property, plant and equipment, including construction-in-process, located in the United States was approximately $2,081.6$3,059.7 million and $1,841.4$2,830.3 million as of December 31, 20202023 and 2019,2022, respectively. These amounts as of December 31, 20202023 and 20192022 are net of cash grants in the amount of $155.0$128.0 million and $162.3$144.4 million, respectively.
Foreign Operations
The net book value of property, plant and equipment, including construction-in-process, located outside of the United States was approximately $496.8$754.2 million and $506.6$556.4 million as of December 31, 20202023 and 2019,2022, respectively.
The Company, through its wholly owned subsidiary, OrPower 4, Inc. (“OrPower 4”), owns and operates geothermal power plants in Kenya. The net book value of assets associated with the power plants was $289.3$377.6 million and $284.5$301.5 million as of December 31, 20202023 and 2019,2022, respectively. The Company sells the electricity produced by the power plants to Kenya Power and Lighting Co. Ltd. (“KPLC”) under a 20-year20 year PPA ending between 2033 and 2036.
The Company, through its wholly owned subsidiary, Orzunil I de Electricidad, Limitada (Orzunil), owns a power plant97% interest in Guatemala. On January 22, 2014, Orzunil signed an amendment to the PPA with INDE, a Guatemalan power company, for its Zunil geothermal power plant in Guatemala. The amendment extends the term of the PPA from 2019 to 2034. The PPA amendment also transfers operation and management responsibilities of the Zunil geothermal field from INDE to the Company for the term of the amended PPA in exchange for a tariff increase. Additionally, INDE exercised its right under the PPA to become a partner in the Zunil power plant with a 3% equity interest. The net book value of the assets related to the power plant was $10.1$31.9 million and $10.3$27.1 million at December 31, 20202023 and 2019,2022, respectively. The Company sells the electricity produced by the power plants to INDE, a Guatemalan power company under a PPA ending in 2034.
The Company, through its wholly owned subsidiary, Ortitlan, Limitada (“Ortitlan”), owns a power plant in Guatemala. The net book value of the assets related to the power plant was $42.0$42.8 million and $42.8$42.3 million at December 31, 20202023 and 2019,2022, respectively.
The Company, through its wholly owned subsidiary, GeoPlatanares, signed a BOT contract for the Platanares geothermal project in Honduras with ELCOSA, a privately owned Honduran energy company, for 15 years from the commercial operation date, which expires in 2047.date. Platanares sells the electricity produced by the power plants to ENEE, the national utility of Honduras under a 30-year PPA.30-year PPA which expires in 2047. The net book value of the assets related to the power plant was $97.2$81.9 million and $96.1$79.5 million at December 31, 20202023 and 2019,2022, respectively.
The Company, through its subsidiary, GB,Guadeloupe Bouillante ("GB"), owns a power plant in Guadeloupe. The net book value of the assets related to the power plant was $32.0$101.7 million and $24.5$43.5 million at December 31, 20202023 and 2019,2022, respectively. GB sells the electricity produced by the power plants to EDF, the French electric utility, under a 15-year PPA.PPA ending in 2030.
Construction-in-process
Construction-in-process consists of the following:
| | | December 31, | |
| | | 2023 | | | 2022 | |
| | | (Dollars in thousands) | |
Projects under exploration and development: | | | | | | | | |
Up-front bonus costs | | $ | 5,335 | | | $ | 5,335 | |
Exploration and development costs | | | 156,438 | | | | 89,230 | |
Interest capitalized | | | 703 | | | | 703 | |
| | | | 162,476 | | | | 95,268 | |
Projects under construction: | | | | | | | | |
Up-front bonus costs | | | 11,156 | | | | 11,156 | |
Drilling and construction costs | | | 618,416 | | | | 761,129 | |
Interest capitalized | | | 22,919 | | | | 25,645 | |
| | | | 652,491 | | | | 797,930 | |
Total | | $ | 814,967 | | | $ | 893,198 | |
ORMAT TECHNOLOGIES, INC. AND SUBSIDIARIES
NOTES TO CONSOLIDATED FINANCIAL STATEMENTS
| | | Projects under exploration and development | |
| | | Up-front Bonus Costs | | | Exploration and Development Costs | | | Interest Capitalized | | | Total | |
| | | (Dollars in thousands) | |
Balance at December 31, 2020 | | $ | 5,347 | | | $ | 45,478 | | | $ | 703 | | | $ | 51,528 | |
Cost incurred during the year | | | — | | | | 2,680 | | | | — | | | | 2,680 | |
Transfer of projects under exploration and development to projects under construction | | | (12 | ) | | | (3,494 | ) | | | — | | | | (3,506 | ) |
Balance at December 31, 2021 | | | 5,335 | | | | 44,664 | | | | 703 | | | | 50,702 | |
Cost incurred during the year | | | — | | | | 44,566 | | | | — | | | | 44,566 | |
Balance at December 31, 2022 | | | 5,335 | | | | 89,230 | | | | 703 | | | | 95,268 | |
Cost incurred during the year | | | — | | | | 70,667 | | | | — | | | | 70,667 | |
Write off of unsuccessful exploration costs | | | — | | | | (3,459 | ) | | | — | | | | (3,459 | ) |
Balance at December 31, 2023 | | $ | 5,335 | | | $ | 156,438 | | | $ | 703 | | | $ | 162,476 | |
| | | Projects under construction | |
| | | Up-front Bonus Costs | | | Drilling and Construction Costs | | | Interest Capitalized | | | Total | |
| | | (Dollars in thousands) | |
Balance at December 31, 2020 | | $ | 39,144 | | | $ | 379,117 | | | $ | 9,526 | | | $ | 427,787 | |
Cost incurred during the year | | | — | | | | 403,296 | | | | 10,546 | | | | 413,842 | |
Transfer of projects under exploration and development to projects under construction | | | 12 | | | | 3,494 | | | | — | | | | 3,506 | |
Transfer of completed projects to property, plant and equipment | | | — | | | | (174,354 | ) | | | — | | | | (174,354 | ) |
Balance at December 31, 2021 | | | 39,156 | | | | 611,553 | | | | 20,072 | | | | 670,781 | |
Cost incurred during the year | | | — | | | | 489,953 | | | | 5,573 | | | | 495,526 | |
Transfer of completed projects to property, plant and equipment | | | (28,000 | ) | | | (340,377 | ) | | | — | | | | (368,377 | ) |
Balance at December 31, 2022 | | | 11,156 | | | | 761,129 | | | | 25,645 | | | | 797,930 | |
Cost incurred during the year | | | — | | | | 473,422 | | | | 15,181 | | | | 488,603 | |
Cost write off | | | — | | | | (993 | ) | | | — | | | | (993 | ) |
Transfer of completed projects to property, plant and equipment | | | — | | | | (615,142 | ) | | | (17,907 | ) | | | (633,049 | ) |
Balance at December 31, 2023 | | $ | 11,156 | | | $ | 618,416 | | | $ | 22,919 | | | $ | 652,491 | |
ORMAT TECHNOLOGIES, INC. AND SUBSIDIARIES
NOTES TO CONSOLIDATED FINANCIAL STATEMENTS
Impairment of long-lived assets
The Brawley power plant has been generating electricity below its generating capacity of 13MW due to continuous wellfield issues which have resulted in higher-than-expected operating costs and lower-than-expected electricity revenues. The Company implemented a number of remediation plans and technical solutions involving additional investments in the power plant in order to improve its performance and reduce operating costs, however, during the fourth quarter of 2022, as a result of the failure of the recent remediation plan and the lower than forecasted performance of the power plant during that quarter, the Company decided that it was no longer economical to continue investing in the Brawley power plant as the probability of success of additional wellfield work to increase capacity and reduce operating costs is low. The Company concluded that the power plant can be operated at optimal capacity of 7MW which will require lower investment and results in lower operating costs.
Based on the above circumstances and indicators, the Brawley power plant was tested for recoverability during the fourth quarter of 2022 by comparing the carrying amount of its assets to the estimated future net undiscounted cash flows expected to be generated by such assets, the result of which was that the carrying amount of the asset was above the estimated future net undiscounted cash flows. The Company then estimated the fair value of those assets using the expected future discounted cash flow approach using Level 3 inputs under ASC 820, as a measure of fair value as it deemed it to be the most appropriate for the power plant. As a result of the impairment analysis, the Brawley power plant was written down to its fair value of $13.6 million and the Company recorded a non-cash impairment loss of $30.5 million which was presented in the consolidated statement of operations and comprehensive income (loss) under “Impairment of long-lived-assets” for the year ended December 31, 2022. This write-down is allocated to the Electricity segment.
In estimating the fair value for the power plant, the Company utilized the discounted cash flow approach ("DCF") which is a form of the Income Approach. The DCF approach is based on the present value of the estimated cash flow expected to be generated by the Brawley power plant which is the asset group. The expected cash flow was discounted using a rate of return that reflects the relative risk of the asset, as well as the time value of money. The determination of the Company and asset specific risk-adjusted discount rate is based on the weighted-average cost of capital ("WACC") taking into consideration the value of equity and interest-bearing debt. The Company applied a WACC rate of 9% in the estimation of the Brawley power plant. The Company noted that a 1% change to the WACC or long-term growth rates would not yield a significant change in the estimated fair value of the Brawley power plant. In addition to the WACC rate of 9%, other significant inputs of the future net cash flow estimates were generation capacity output, average realized price, and operating costs growth rate. These future net cash flow estimates are classified as Level 3 within the fair value hierarchy. Below are the significant unobservable inputs included in the valuation as of the year ended December 31, 2022.
Significant unobservable inputs: | | | | |
Average generation capacity (MW) | | | 7 | |
Electricity price escalation (%) | | | 2.2 | % |
Cost long-term growth rate | | | 2.2 | |
Average realized electricity price ($/MW) | | | 92.2 | |
NOTE 9— INTANGIBLE ASSETS AND GOODWILL
Construction-in-process
Construction-in-process consistsAs of December 31, 2023 and 2022, intangible assets amounted to $307.6 million and $333.8 million, respectively, net of accumulated amortization of $150.2 million and $122.8 million, respectively. Intangible assets are mainly related to the following:Company’s PPAs acquired in business combinations and to its energy storage activities, .
| | | December 31, | |
| | | 2020 | | | 2019 | |
| | | (Dollars in thousands) | |
Projects under exploration and development: | | | | | | | | |
Up-front bonus costs | | $ | 5,347 | | | $ | 17,018 | |
Exploration and development costs | | | 45,478 | | | | 66,916 | |
Interest capitalized | | | 703 | | | | 703 | |
| | | | 51,528 | | | | 84,637 | |
Projects under construction: | | | | | | | | |
Up-front bonus costs | | | 39,144 | | | | 27,473 | |
Drilling and construction costs | | | 379,117 | | | | 258,484 | |
Interest capitalized | | | 9,526 | | | | 5,961 | |
| | | | 427,787 | | | | 291,918 | |
Total | | $ | 479,315 | | | $ | 376,555 | |
| | | Projects under exploration and development | |
| | | Up-front Bonus
Costs | | | Exploration and
Development Costs | | | Interest
Capitalized | | | Total | |
| | | (Dollars in thousands) | |
Balance at December 31, 2017 | | $ | 17,018 | | | $ | 46,154 | | | $ | 703 | | | $ | 63,875 | |
Cost incurred during the year | | | 0 | | | | 7,209 | | | | 0 | | | | 7,209 | |
Write off of unsuccessful exploration costs | | | 0 | | | | (126 | ) | | | 0 | | | | (126 | ) |
Balance at December 31, 2018 | | | 17,018 | | | | 53,237 | | | | 703 | | | | 70,958 | |
Cost incurred during the year | | | 0 | | | | 17,215 | | | | 0 | | | | 17,215 | |
Transfer of projects under exploration and development to projects under construction | | | 0 | | | | (3,536 | ) | | | 0 | | | | (3,536 | ) |
Balance at December 31, 2019 | | | 17,018 | | | | 66,916 | | | | 703 | | | | 84,637 | |
Cost incurred during the year | | | 0 | | | | 5,832 | | | | 0 | | | | 5,832 | |
Transfer of projects under exploration and development to projects under construction | | | (11,671 | ) | | | (27,270 | ) | | | 0 | | | | (38,941 | ) |
Balance at December 31, 2020 | | $ | 5,347 | | | $ | 45,478 | | | $ | 703 | | | $ | 51,528 | |
| | | Projects under construction | |
| | | Up-front Bonus
Costs | | | Drilling and
Construction
Costs | | | Interest
Capitalized | | | Total | |
| | | (Dollars in thousands) | |
Balance at December 31, 2017 | | $ | 27,473 | | | $ | 198,943 | | | $ | 3,251 | | | $ | 229,667 | |
Cost incurred during the year | | | 0 | | | | 219,610 | | | | 0 | | | | 219,610 | |
| Cost write off | | | 0 | | | | (1,380 | ) | | | 0 | | | | (1,380 | ) |
Fair value of projects under construction acquired in a buisness combination | | | 0 | | | | 4,668 | | | | 0 | | | | 4,668 | |
Transfer of completed projects to property, plant and equipment | | | 0 | | | | (261,443 | ) | | | (390 | ) | | | (261,833 | ) |
Balance at December 31, 2018 | | | 27,473 | | | | 160,398 | | | | 2,861 | | | | 190,732 | |
Cost incurred during the year | | | 0 | | | | 264,137 | | | | 3,100 | | | | 267,237 | |
Transfer of projects under exploration and development to projects under construction | | | 0 | | | | 3,536 | | | | 0 | | | | 3,536 | |
Insurance recoveries | | | 0 | | | | (35,435 | ) | | | 0 | | | | (35,435 | ) |
Transfer of completed projects to property, plant and equipment | | | 0 | | | | (134,152 | ) | | | 0 | | | | (134,152 | ) |
Balance at December 31, 2019 | | | 27,473 | | | | 258,484 | | | | 5,961 | | | | 291,918 | |
Cost incurred during the year | | | 0 | | | | 298,215 | | | | 3,565 | | | | 301,780 | |
Transfer of projects under exploration and development to projects under construction | | | 11,671 | | | | 27,270 | | | | 0 | | | | 38,941 | |
Transfer of completed projects to property, plant and equipment | | | 0 | | | | (204,852 | ) | | | 0 | | | | (204,852 | ) |
Balance at December 31, 2020 | | $ | 39,144 | | | $ | 379,117 | | | $ | 9,526 | | | $ | 427,787 | |
ORMAT TECHNOLOGIES, INC. AND SUBSIDIARIES
NOTES TO CONSOLIDATED FINANCIAL STATEMENTS
NOTE 9 — INTANGIBLE ASSETS AND GOODWILL
Intangible assets amountingThe following table summarizes the information related to $194.4 million and $186.2 million consist mainly of the Company’s PPAs acquired in business combinations and its energy storage activities, net of accumulated amortization of $89.4 million and $74.1 millionCompany's intangible assets as of December 31, 20202023 and 2019,2022: respectively. Intangible assets relating to the Company's energy storage activities as of December 31, 2020 and 2019 amounted to $47.2 million and $30.2 million, net of accumulated amortization of $8.7 million and $5.4 million, respectively.
| | | December 31, 2023 | | | December 31, 2022 | |
| | | Gross Carrying Amount | | | Accumulated Amortization | | | Gross Carrying Amount | | | Accumulated Amortization | |
| | | (Dollars in thousands) | | | (Dollars in thousands) | |
Amortized intangible assets | | | | | | | | | | | | | | | | |
Electricity segment | | $ | 403,511 | | | $ | (127,324 | ) | | $ | 402,340 | | | $ | (104,601 | ) |
Storage segment | | | 54,310 | | | | (22,888 | ) | | | 54,310 | | | | (18,204 | ) |
Total | | $ | 457,821 | | | $ | (150,212 | ) | | $ | 456,650 | | | $ | (122,805 | ) |
Amortization expense for the years ended December 31, 2020,2023, 20192022 and 20182021 amounted to $14.4$26.8 million, $13.3$27.2 million and $11.2$21.7 million, respectively. Additions to intangible assets for the years ended December 31, 2020, 2019 and 2018, amounted to $20.4 million, $0.0 million and $127.0 million, respectively. The
There were no additions to intangible assets induring 20202023 and 20182022.
During 2022, relate to the Pomona and USG acquisitions, respectively as further describedCompany wrote-off specific certain customer related assets in Note 2 to the consolidated financial statements.total amount of $0.9 million. The Company tested the intangible assets for recoverability in December 2020,2023, 20192022 and 20182021 and assessed whether there arewere events or change in circumstances which may indicate that the intangible assets are not recoverable. The Company's assessment resulted in that there were 0no write-offs of intangible assets in 2020,2023, 20192022 and 2018.2021, except as noted above.
Estimated future amortization expense for the intangible assets as of December 31, 20202023 is as follows:
| | | (Dollars in thousands) | | | (Dollars in thousands) | |
Year ending December 31: | | | | | | |
2021 | | $ | 16,200 | | |
2022 | | 15,947 | | |
2023 | | 15,828 | | |
2024 | | 14,613 | | | $ | 26,277 | |
2025 | | 16,539 | | | 25,911 | |
2026 | | | 24,056 | |
2027 | | | 22,176 | |
2028 | | | 21,903 | |
Thereafter | | | 115,295 | | | | 187,286 | |
Total | | $ | 194,421 | | | $ | 307,609 | |
Goodwill
Goodwill amounting to $24.6$90.5 million and $20.1$90.3 million as of December 31, 20202023 and 2019,2022, respectively, represents the excess of the fair value of consideration transferred in business combination transactions over the fair value of tangible and intangible assets acquired, net of the fair value of liabilities assumed and non-controlling interest (as applicable) in the acquisitions.
In 2018, as a result of the quantitative assessment of goodwill, the Company recorded an impairment charge of $13.5 million to goodwill related to its Energy Storage segment in the consolidated statements of operations and comprehensive income (loss).
Except as noted above, for For the years 2020,2023, 20192022 and 20182021, the Company's impairment assessment of goodwill related to its reporting units resulted in no impairment.
Changes in the carrying amount of the Company’s goodwill for the years ended December 31, 20202023 and 20192022 were as follows:
| | | 2020 | | | 2019 | | | 2023 | | | 2022 | |
| | | (Dollars in thousands) | | | (Dollars in thousands) | |
Goodwill as of January 1, | | $ | 20,140 | | | $ | 19,950 | | | $ | 90,325 | | | $ | 89,954 | |
Goodwill acquired (1) | | 4,107 | | | 0 | | |
Translation differences | | | 319 | | | | 190 | | | | 219 | | | | 371 | |
Goodwill as of December 31, | | $ | 24,566 | | | $ | 20,140 | | | $ | 90,544 | | | $ | 90,325 | |
(1) GoodwillThere was no goodwill acquired is related to the purchase of the Pomona storage facility as further described in Noteduring 22023 to the consolidated financial statements.and 2022.
ORMAT TECHNOLOGIES, INC. AND SUBSIDIARIES
NOTES TO CONSOLIDATED FINANCIAL STATEMENTS
NOTE10 — ACCOUNTS PAYABLE AND ACCRUED EXPENSES
Accounts payable and accrued expenses consist of the following:
| | | December 31, | | | December 31, | |
| | | 2020 | | | 2019 | | | 2023 | | | 2022 | |
| | | (Dollars in thousands) | | | (Dollars in thousands) | |
Trade payable | | $ | 75,779 | | | $ | 73,271 | | | $ | 140,694 | | | $ | 77,551 | |
Salaries and other payroll costs | | 29,271 | | | 24,364 | | | 28,302 | | | 24,205 | |
Customer advances | | 1,197 | | | 2,092 | | | 769 | | | 1,060 | |
Accrued interest | | 7,843 | | | 6,321 | | | 17,826 | | | 14,063 | |
Income tax payable | | 19,913 | | | 11,344 | | | 6,995 | | | 8,393 | |
Property tax payable | | 1,378 | | | 3,033 | | | 2,606 | | | 3,271 | |
Scheduling and transmission | | 2,632 | | | 2,264 | | | 1,892 | | | 1,000 | |
Royalty accrual | | 3,581 | | | 6,457 | | | 5,445 | | | 9,825 | |
Warranty accrual | | 2,087 | | | 3,245 | | | 1,812 | | | 1,705 | |
Other | | | 9,082 | | | | 9,466 | | | | 8,177 | | | | 8,350 | |
Total | | $ | 152,763 | | | $ | 141,857 | | | $ | 214,518 | | | $ | 149,423 | |
NOTE11 — LONG-TERM DEBT, CREDIT AGREEMENTS AND COMMERCIAL PAPERFINANCE LIABILITY
Long-term debt consists of notes payable under the following loan agreements:
| | | December 31, | | | December 31, | |
| | | 2020 | | | 2019 | | | 2023 | | | 2022 | |
| | | (Dollars in thousands) | | | (Dollars in thousands) | |
Limited and non-recourse agreements: | | | | | | |
Loans: | | | | | | |
Non-recourse: | | | | | | |
Other loans | | $ | 9,826 | | | $ | 8,997 | | |
Limited and non-recourse agreements (1): | | | | | |
Limited recourse: | | | | | | |
Loan agreement with DFC (the Olkaria III power plant) | | 174,652 | | | 192,646 | | | $ | 120,668 | | | $ | 138,663 | |
Loan agreement with DFC (the Platanares power plant) | | 96,266 | | | 104,459 | | | 71,687 | | | 79,880 | |
Loan agreement with Banco Industrial S.A. and Westrust Bank (International) Limited | | 22,750 | | | 26,250 | | | — | | | 15,750 | |
Loan agreement with a global industrial company (the Plumstriker battery energy storage projects) | | 18,081 | | | 21,615 | | | — | | | 11,392 | |
Idaho Refinancing, U.S. Department of Energy and Prudential Capital Group Nevada | | | 112,959 | | | 119,392 | |
OFC 2 Senior Secured Notes | | | 142,464 | | | 158,036 | |
Other loans | | 7,807 | | | 8,367 | | | 3,460 | | | 4,585 | |
Senior Secured Notes: | | | | | | |
Non-recourse: | | | | | | |
DAC 1 Senior Secured Notes | | 73,121 | | | 78,247 | | | 57,397 | | | 62,698 | |
Limited recourse: | | | | | | |
OFC 2 Senior Secured Notes | | 188,223 | | | 203,040 | | |
Other loans | | | 84,118 | | | | 88,840 | | | | 4,216 | | | | 5,805 | |
Total limited and non-recourse agreements | | 674,844 | | | 732,461 | | | 512,852 | | | 596,201 | |
Less current portion | | | (60,834 | ) | | | (58,932 | ) | | | (57,207 | ) | | | (64,044 | ) |
Non current portion | | $ | 614,010 | | | $ | 673,529 | | |
Full recourse agreements: | | | | | | |
Senior Unsecured Bonds | | 529,066 | | | 204,332 | | |
Noncurrent portion | | | $ | 455,645 | | | $ | 532,157 | |
Full recourse agreements (1): | | | | | |
Senior Unsecured Bonds - Series 4 | | | $ | 220,568 | | | $ | 255,754 | |
Senior Unsecured Loan (Migdal) | | 200,000 | | | 150,000 | | | 158,000 | | | 174,800 | |
Hapoalim, Hapoalim 2023, Mizrahi, Mizrahi 2023, HSBC and Discount loans | | | 397,009 | | | 298,884 | |
Loan agreements with DEG (the Olkaria III and power plants 4 and 1 upgrade) | | 70,264 | | | 79,632 | | | | 42,160 | | | | 51,528 | |
Revolving credit lines with banks | | | 0 | | | | 40,550 | | |
Total full recourse agreements | | 799,330 | | | 474,514 | | | $ | 817,737 | | | $ | 780,966 | |
Less current portion | | | (17,768 | ) | | | (117,122 | ) | | | (116,864 | ) | | | (101,460 | ) |
Non current portion | | $ | 781,562 | | | $ | 357,392 | | |
Noncurrent portion | | | $ | 700,873 | | | $ | 679,506 | |
| | | |
Convertible senior notes (all noncurrent) (1) | | | $ | 431,250 | | | $ | 431,250 | |
Financing liability | | | $ | 225,760 | | | $ | 242,029 | |
Less current portion | | | | (5,141 | ) | | | (16,270 | ) |
Noncurrent portion | | | $ | 220,619 | | | $ | 225,759 | |
(1) the amounts presented exclude deferred financing costs, if any |
ORMAT TECHNOLOGIES, INC. AND SUBSIDIARIES
NOTES TO CONSOLIDATED FINANCIAL STATEMENTS
Full-Recourse Third-Party Debt
Mizrahi 2023 Loan
On November 1, 2023, the Company entered into a definitive loan agreement (the "Mizrahi 2023 Loan Agreement") with Mizrahi Tefahot Bank Ltd. (“Mizrahi Bank”). The Mizrahi 2023 Loan Agreement provides for a loan by Mizrahi Bank to the Company in an aggregate principal amount of $50.0 million (the “Mizrahi 2023 Loan”). The outstanding principal amount of the Mizrahi 2023 Loan will be repaid in 16 semi-annual payments of $3.1 million each, commencing on April 12, 2024. The duration of the Mizrahi 2023 Loan is 8 years. The Mizrahi 2023 Loan Agreement includes various affirmative and negative covenants, including a requirement that the Company maintain (i) a financial debt to adjusted EBITDA ratio not to exceed 6.0, (ii) a minimum equity capital amount of not less than $750 million, and (iii) an equity capital to total assets ratio of not less than 25%. The Mizrahi 2023 Loan Agreement includes other customary affirmative and negative covenants, including payment and covenant events of default. As of December 31, 2023, the covenants have been met.
| | | Amount | | | Amount Outstanding as of | | | Annual | | Maturity |
Loan | | Issued | | | December 31, 2023 | | | Interest Rate (1) | | Date |
| | | (Dollars in millions) | | | | | | |
Mizrahi Loan 2023 | | $ | 50.0 | | | $ | 50.0 | | | | 7.15 | % | October 2031 |
(1) payable semi-annually |
Hapoalim 2023 Loan
On February 27, 2023, the Company entered into a definitive loan agreement (the "BHI Loan Agreement") with Bank Hapoalim B.M. (“Hapoalim Bank”). The BHI Loan Agreement provides for a loan by Hapoalim Bank to the Company in an aggregate principal amount of $100.0 million (the “BHI Loan” or “Hapoalim 2023 Loan”). The outstanding principal amount of the BHI Loan will be repaid in 20 semi-annual payments of $5.0 million each, commencing on August 27, 2023. The duration of the BHI Loan is 10 years. The BHI Loan Agreement includes various affirmative and negative covenants, including a requirement that the Company maintain (i) a financial debt to adjusted EBITDA ratio not to exceed 6.0, (ii) a minimum equity capital amount of not less than $750 million, and (iii) an equity capital to total assets ratio of not less than 25%. The BHI Loan Agreement includes other customary affirmative and negative covenants, including payment and covenant events of default. As of December 31, 2023, the covenants have been met.
| | | Amount | | | Amount Outstanding as of | | | Annual | | Maturity |
Loan | | Issued | | | December 31, 2023 | | | Interest Rate (1) | | Date |
| | | (Dollars in millions) | | | | | | |
Hapoalim 2023 Loan | | $ | 100.0 | | | $ | 95.0 | | | | 6.45 | % | February 2033 |
(1) payable semi-annually |
ORMAT TECHNOLOGIES, INC. AND SUBSIDIARIES
NOTES TO CONSOLIDATED FINANCIAL STATEMENTS
Mizrahi Bank Loan
On April 12, 2022, the Company entered into a definitive loan agreement (the "Mizrahi Loan Agreement") with Mizrahi Tefahot Bank Ltd. (“Mizrahi Bank”). The Mizrahi Loan Agreement provides for a loan by Mizrahi Bank to the Company in an aggregate principal amount of $75.0 million (the “Mizrahi Loan”). The outstanding principal amount of the Mizrahi Loan will be repaid in 16 semi-annual payments of $4.7 million each, commencing on October 12, 2022. The duration of the Mizrahi Loan is 8 years. The Mizrahi Loan Agreement includes various affirmative and negative covenants, including a requirement that the Company maintain (i) a financial debt to adjusted EBITDA ratio not to exceed 6.0, (ii) a minimum equity capital amount of not less than $750 million, and (iii) an equity capital to total assets ratio of not less than 25%. The Mizrahi Loan Agreement includes other customary affirmative and negative covenants, including payment and covenant events of default. As of December 31, 2023, the covenants have been met.
| | | Amount | | | Amount Outstanding as of | | | Annual | | Maturity |
Loan | | Issued | | | December 31, 2023 | | | Interest Rate (1) | | Date |
| | | (Dollars in millions) | | | | | | |
Mizrahi Loan | | $ | 75.0 | | | $ | 60.9 | | | | 4.10 | % | April 2030 |
(1) payable semi-annually |
Bank Hapoalim Loan
On July 12, 2021, the Company entered into a definitive loan agreement (the "Hapoalim Loan Agreement") with Bank Hapoalim B.M. (“Bank Hapoalim”). The Hapoalim Loan Agreement provides for a loan by Bank Hapoalim to the Company in an aggregate principal amount of $125 million (the “Hapoalim Loan”). The outstanding principal amount of the Hapoalim Loan will be repaid in 14 semi-annual payments of $8.9 million each, commencing on December 12, 2021. The duration of the Hapoalim Loan is 7 years. The Hapoalim Loan Agreement includes various affirmative and negative covenants, including a requirement that the Company maintain (i) a financial debt to adjusted EBITDA ratio not to exceed 6, (ii) a minimum equity capital amount of not less than $750 million, and (iii) an equity capital to total assets ratio of not less than 25%. The Hapoalim Loan Agreement includes other customary affirmative and negative covenants, including payment and covenant events of default. As of December 31, 2023, the covenants have been met.
| | | Amount | | | Amount Outstanding as of | | | Annual | | Maturity |
Loan | | Issued | | | December 31, 2023 | | | Interest Rate (1) | | Date |
| | | (Dollars in millions) | | | | | | |
Hapoalim Loan | | $ | 125.0 | | | $ | 80.4 | | | | 3.45 | % | June 2028 |
(1) payable semi-annually |
HSBC Bank Loan
On July 15, 2021, the Company entered into a definitive loan agreement (the "HSBC Loan Agreement") with HSBC Bank PLC (“HSBC Bank”). The HSBC Loan Agreement provides for a loan by HSBC Bank to the Company in an aggregate principal amount of $50 million (the “HSBC Loan”). The outstanding principal amount of the HSBC Loan will be repaid in 14 semi-annual payments of $3.6 million each, commencing on January 19, 2022. The duration of the HSBC Loan is 7 years. The HSBC Loan Agreement includes various affirmative and negative covenants, including a requirement that the Company maintain (i) a financial debt to adjusted EBITDA ratio not to exceed 6, (ii) a minimum equity capital amount of not less than $750 million, and (iii) an equity capital to total assets ratio of not less than 25%. The HSBC Loan Agreement includes other customary affirmative and negative covenants, including payment and covenant events of default. As of December 31, 2023, the covenants have been met.
| | | Amount | | | Amount Outstanding as of | | | Annual | | Maturity |
Loan | | Issued | | | December 31, 2023 | | | Interest Rate (1) | | Date |
| | | (Dollars in millions) | | | | | | |
HSBC Loan | | $ | 50.0 | | | $ | 35.7 | | | | 3.45 | % | July 2028 |
(1) payable semi-annually
ORMAT TECHNOLOGIES, INC. AND SUBSIDIARIES
NOTES TO CONSOLIDATED FINANCIAL STATEMENTS
Discount Bank Loan
On September 2, 2021, the Company entered into a definitive loan agreement (the "Discount Loan Agreement") with Israel Discount Bank Ltd. (“Discount Bank”). The Discount Loan Agreement provides for a loan by Discount Bank to the Company in an aggregate principal amount of $100 million (the “Discount Loan”). The outstanding principal amount of the Discount Loan will be repaid in 16 semi-annual payments of $6.25 million each, commencing on March 2, 2022. The duration of the Discount Loan is 8 years. The Discount Loan Agreement includes various affirmative and negative covenants, including a requirement that the Company maintain (i) a financial debt to adjusted EBITDA ratio not to exceed 6, (ii) a minimum equity capital amount of not less than $750 million, and (iii) an equity capital to total assets ratio of not less than 25%. The Discount Loan Agreement includes other customary affirmative and negative covenants, including payment and covenant events of default. As of December 31, 2023, the covenants have been met.
| | | Amount | | | Amount Outstanding as of | | | Annual | | Maturity |
Loan | | Issued | | | December 31, 2023 | | | Interest Rate (1) | | Date |
| | | (Dollars in millions) | | | | | | |
Discount Loan | | $ | 100.0 | | | $ | 75.0 | | | | 2.9 | % | September 2029 |
(1) payable semi-annually |
Senior Unsecured Bonds - Series 4
On July 1, 2020, the Company concluded an auction tender and accepted subscriptions for New Israeli Shekels ("NIS") 1.0 billion aggregate principal amount of senior unsecured bonds (the “Senior Unsecured Bonds - Series 4”). The Senior Unsecured Bonds - Series 4 are denominated in NIS and were converted to approximately $289.8 million using a cross-currency swap transaction shortly after the completion of such issuance as further detailed below. The Senior Unsecured Bonds - Series 4 are payable semi-annually in arrears starting December 2020 and will be repaid in 10 equal annual payments commencing June 2022 unless prepaid earlier by the Company pursuant to the terms and conditions of the trust instrument that governs the Senior Unsecured Bonds - Series 4. The proceeds fromAs of December 31, 2023, the covenants relating to the Senior Unsecured Bonds - Series 4 were used to pay the total consideration of $43.4 million in the Pomona purchase transaction as further detailed under Note 2 to the consolidated financial statements and to repay certain existing indebtedness with the balance being used to support the Company's growth plans.have been met.
| | | Amount | | Amount Outstanding as of | | Annual | | Maturity | | Amount | | Amount Outstanding as of | | Annual | | Maturity |
Loan | | Issued | | | December 31, 2020 | | | Interest Rate | | Date | | Issued | | | December 31, 2023 | | | Interest Rate (1) | | Date |
| | | (Dollars in millions) | | | | | | | (Dollars in millions) | | | | | |
Senior Unsecured Bonds - Series 4 | | $ | 289.8 | | | $ | 311.0 | | | 3.35 | % | June 2031 | | $ | 289.8 | | | $ | 220.6 | | | 3.35 | % | June 2031 |
(1) payable semi-annually |
Cross Currency Swap
Concurrently with the issuance of the Senior Unsecured Bonds - Series 4, the Company entered into a long-term cross currency swap with the objective of hedging the currency rate fluctuations related to the aggregated principal amount and interest of the Senior Unsecured Bonds - Series 4 at an average fixed rate of 4.34%. The terms of the Cross Currency Swap match those of the Senior Unsecured Bonds - Series 4, including the notional amount of the principal and interest payment dates. The Company designated the Cross Currency Swap as a cash flow hedge as per ASC 815, Derivatives and Hedging and accordingly measures the Cross Currency Swap instrument at fair value. The changes in the Cross Currency Swap fair value are initially recorded in Other Comprehensive Income (Loss) and reclassified to Derivatives and foreign currency transaction gains (losses) in the same period or periods during which the hedged transaction affects earnings. The hedged transaction and the Senior Unsecured Bonds - Series 4 effect in earnings and isare presented in the same line item in the condensed consolidated statements of operations and comprehensive income as the earnings effect of the Senior Unsecured Bonds - Series 4.income.
ORMAT TECHNOLOGIES, INC. AND SUBSIDIARIES
NOTES TO CONSOLIDATED FINANCIAL STATEMENTS
Senior Unsecured Bonds
In September 2016, the Company concluded an auction tender and accepted subscriptions for two series of senior unsecured bonds comprised of approximately $67.0 million aggregate principal amount of senior unsecured bonds (the “Series 2 Bonds”) and approximately $137.0 million aggregate principal amount of senior unsecured bonds (the “Series 3 Bonds” and together with the Series 2 Bonds, the “Senior Unsecured Bonds”).
In September 2020, the Company fully repaid the Series 2 Bonds. The Series 3 Bonds will mature in September 2022 in a single bullet payment unless earlier prepaid by the Company pursuant to the terms and conditions of the trust instrument that governs such Senior Unsecured Bonds.
On April 6, 2020, the Company concluded an auction tender and accepted subscriptions for an additional aggregate principal amount of approximately $51.1 million of its Series 3 Senior Unsecured Bonds (the “Additional Series 3 Bonds”) for total consideration of $50.0 million, representing an effective interest rate of 4.45%. The Additional Series 3 Bonds will mature in September 2022 and will be repaid at maturity in a single bullet payment, unless earlier prepaid by the Company pursuant to the terms and conditions of the trust instrument that governs such Senior Unsecured Bonds.
On April 20, 2020, the Company concluded an additional auction tender and accepted subscriptions for an aggregate principal amount of approximately $14.5 million of its Series 3 Senior Unsecured Bonds (the “Second Addition to Series 3 Bonds”). The Second Addition to Series 3 Bonds will mature in September 2022 and will be repaid at maturity in a single bullet payment, unless earlier prepaid by the Company pursuant to the terms and conditions of the trust instrument that governs such Senior Unsecured Bonds.
On May 13, 2020, the Company concluded an additional auction tender and accepted subscriptions for an aggregate principal amount of approximately $15.3 million under Series 3 Senior Unsecured Bonds (the “Third Addition to Series 3 Bonds”). The Third Addition to Series 3 Bonds will mature in September 2022 and will be repaid at maturity in a single bullet payment, unless earlier prepaid by the Company pursuant to the terms and conditions of the trust instrument that governs such Senior Unsecured Bonds.
| | | Amount | | | Amount Outstanding as of | | | Annual | | Maturity |
Loan | | Issued | | | December 31, 2020 | | | Interest Rate | | Date |
| | | (Dollars in millions) | | | | | | |
Senior Unsecured Bonds - Series 3 | | $ | 218.0 | | | $ | 218.0 | | | | 4.45 | % | September 2022 |
Senior Unsecured Loan
On March 22, 2018 the Company entered into a definitive loan agreement (the "Migdal Loan Agreement") with Migdal Insurance Company Ltd., Migdal Makefet Pension and Provident Funds Ltd. and Yozma Pension Fund of Self-Employed Ltd., all entities within the Migdal Group, a leading Israeli insurance company and institutional investor in Israel. The Migdal Loan Agreement provides for a loan by the lenders to the Company in an aggregate principal amount of $100.0 million (the "Migdal Loan"). The Migdal Loan will beis repaid in 15 semi-annual payments of $4.2 million each, commencing on September 15, 2021, with a final payment of $37.0 million on March 15, 2029.
ORMAT TECHNOLOGIES, INC. AND SUBSIDIARIES
NOTES TO CONSOLIDATED FINANCIAL STATEMENTS
The Loan is subject to early redemption by the Company prior to maturity from time to time (but not more frequently than once per quarter) and at any time in whole or in part, at a redemption price set forth in the Migdal Loan Agreement. If the rating of the Company is downgraded to "ilA-"(or equivalent), of any of Standard and Poor’s, Moody’s or Fitch (whether in Israel or outside of Israel) (each a “Credit Rating Agency”), the interest rate applicable to the Migdal Loan will increase by 0.50%. If the rating of the Company is further downgraded to a lower level by any Credit Rating Agency, the interest rate applicable to the Migdal Loan will be increased by 0.25% for each additional downgrade. In no event will the cumulative increase in the interest rate applicable to the Loan exceed 1% regardless of the cumulative rating downgrade. A subsequent upgrade or reinstatement of a rating by any Credit Rating Agency will reduce the interest rate applicable to the Migdal Loan by 0.25% for each upgrade (but in no event will the interest rate applicable the Migdal Loan fall below the base interest rate of 4.8%). Additionally, if the ratio between short-term and long-term debt to financial institutions and bondholders, deducting cash and cash equivalents to EBITDA is equal to or higher than 4.5, the interest rate on all amounts then outstanding under the Migdal Loan shall be increased by 0.5% per annum over the interest rate then-applicable to the Migdal Loan.
ORMAT TECHNOLOGIES, INC. AND SUBSIDIARIES
NOTES TO CONSOLIDATED FINANCIAL STATEMENTS
The Migdal Loan Agreement includes various affirmative and negative covenants, including a covenant that the Company maintain (i) a debt to adjusted EBITDA ratio below 6, (ii) a minimum equity amount (as shown on its consolidated financial statements, excluding noncontrolling interests) of not less than $750 million, and (iii) an equity attributable to Company's stockholders to total assets ratio of not less than 25%. In addition, the Migdal Loan Agreement restricts the Company from making dividend payments if its equity falls below $800 million and otherwise restricts dividend payments in any one year to not more than 50% of the net income of the Company of such year as shown on the Company’s consolidated annual financial statements as long as any of the Company's bonds issued in Israel prior to March 27, 2018 remain outstanding. The Migdal Loan Agreement includes other customary affirmative and negative covenants and events of default. As of December 31, 2020, the covenants have been met.
On March 25, 2019, the Company entered into a first addendum (“First Addendum”) to the Migdal Loan Agreement with the Migdal Group dated March 22, 2018. The First Addendum provides for an additional loan by the lenders to the Company in an aggregate principal amount of $50.0 million (the “Additional Migdal Loan”). The Additional Migdal Loan will beis repaid in 15 semi-annual payments of $2.1 million each, commencing on September 15, 2021, with a final payment of $18.5 million on March 15, 2029. The Additional Migdal Loan was entered into under substantially the same terms and conditions of the Migdal Loan Agreement as disclosed above.
In April 2020, the Company entered into a second addendum (the “Second Addendum”) to the loan agreement with the Migdal Group dated March 22, 2018. The Second Addendum provides for an additional loan by the lenders to the Company in an aggregate principal amount of $50.0 million (the “Second Addendum Migdal Loan”). The principal amount of $31.5 million of the Second Addendum Migdal Loan will be repaid in 15 equal semi-annual payments commencing on September 15, 2021 and ending on September 15, 2028. The principal amount of $18.5 million will beis repaid in one bullet payment on March 15, 2029. The Second Addendum Migdal Loan was entered into under substantially the same terms and conditions of the Migdal Loan Agreement. As of December 31, 2023, the covenants have been met.
| | | Amount | | Amount Outstanding as of | | Annual | | Maturity | | Amount | | Amount Outstanding as of | | Annual | | Maturity |
Loan | | Issued | | | December 31, 2020 | | | Interest Rate (1) | | Date | | Issued | | | December 31, 2023 | | | Interest Rate (1) | | Date |
| | | (Dollars in millions) | | | | | | | (Dollars in millions) | | | | | |
Migdal Loan | | $ | 100.0 | | | $ | 100.0 | | | 4.80 | % | March 2029 | | $ | 100.0 | | | $ | 79.0 | | | 4.80 | % | March 2029 |
Additional Migdal Loan | | 50.0 | | | 50.0 | | | 4.60 | % | March 2029 | | 50.0 | | | 39.5 | | | 4.60 | % | March 2029 |
Second Addendum Migdal Loan | | | 50.0 | | | | 50.0 | | | 5.44 | % | March 2029 | | | 50.0 | | | | 39.5 | | | 5.44 | % | March 2029 |
Total Senior Unsecured Loan | | $ | 200.0 | | | $ | 200.0 | | | | | | | $ | 200.0 | | | $ | 158.0 | | | | | |
(1) payable semi-annually in arrears. |
Loan Agreements with DEG (the Olkaria III Complex)
On October 20, 2016, OrPower 4 entered into a new $50.0 million subordinated loan agreement with Deutsche Investitions-und Entwicklungsgesellschaft mbH ("DEG") (the “DEG 2 Loan Agreement”) and on December 21, 2016, OrPower 4 completed a drawdown of the full loan amount of $50 million, with a fixed interest rate of 6.28% for the duration of the loan (the “DEG 2 Loan”). The DEG 2 Loan is being repaid in 20 equal semi-annual principal installments which commenced on December 21, 2018, with a final maturity date of June 21, 2028. Proceeds of the DEG 2 Loan were used by OrPower 4 to refinance Plant 4 of the Olkaria III Complex, which was originally financed using equity. The DEG 2 Loan is subordinated to the senior loan provided by DFC for Plants 1-3 of the Olkaria III Complex. The DEG 2 Loan is guaranteed by the Company.
ORMAT TECHNOLOGIES, INC. AND SUBSIDIARIES
NOTES TO CONSOLIDATED FINANCIAL STATEMENTS
On January 4, 2019, OrPower 4 entered into an additional $41.5 million subordinated loan agreement with DEG (the “DEG 3 Loan Agreement”) and on February 28, 2019, OrPower 4 completed a drawdown of the full loan amount, with a fixed interest rate of 6.04% for the duration of the loan (the “DEG 3 Loan”). The DEG 3 Loan is being repaid in 19 equal semi-annual principal installments, which commenced on June 21, 2019, with a final maturity date of June 21, 2028. Proceeds of the DEG 3 Loan were used by OrPower 4 to refinance upgrades to Plant 1 of the Olkaria III Complex, which were originally financed using equity. The DEG 3 Loan is subordinated to the senior loan provided by DFC (formerly OPIC) for Plants 1-3 of the Olkaria III Complex. The DEG 3 Loan is guaranteed by the Company. As of December 31, 2023, the covenants have been met.
| | | Amount | | | Amount Outstanding as of | | | Annual | | Maturity |
Loan | | Issued | | | December 31, 2020 | | | Interest Rate (1) | | Date |
| | | (Dollars in millions) | | | | | | |
DEG 2 Loan | | $ | 50.0 | | | $ | 37.5 | | | | 6.28 | % | June 2028 |
DEG 3 Loan | | | 41.5 | | | | 32.8 | | | | 6.04 | % | June 2028 |
(1) payable semi-annually
|
| | | Amount | | | Amount Outstanding as of | | | Annual | | Maturity |
Loan | | Issued | | | December 31, 2023 | | | Interest Rate (1) | | Date |
| | | (Dollars in millions) | | | | | | |
DEG 2 Loan | | $ | 50.0 | | | $ | 22.5 | | | | 6.28 | % | June 2028 |
DEG 3 Loan | | | 41.5 | | | | 19.7 | | | | 6.04 | % | June 2028 |
| | | $ | 91.5 | | | $ | 42.2 | | | | | | |
ORMAT TECHNOLOGIES, INC. AND SUBSIDIARIES
NOTES TO CONSOLIDATED FINANCIAL STATEMENTS(1) payable semi-annually
Non-Recourse and Limited-Recourse Third-Party Debt
Finance Agreement with DFC (formerly OPIC) (the Olkaria III Complex)
On August 23, 2012, OrPower 4, the Company’s wholly owned subsidiary, entered into a Finance Agreement with U.S. International Development Finance Corporation, an agency of the U.S. government, to provide limited-recourse senior secured debt financing in an aggregate principal amount of up to $310.0 million (the “OPIC Loan”) for the refinancing and financing of the Olkaria III geothermal power complex in Kenya.
The OPIC Loan is comprised of up to three tranches:
| | | Amount | | | Amount Outstanding as of | | | Annual | | Maturity |
Loan | | Issued | | | December 31, 2020 | | | Interest Rate (1) | | Date |
| | | (Dollars in millions) | | | | | | |
OPIC Loan - Tranch I | | $ | 85.0 | | | $ | 47.2 | | | | 6.34 | % | December 2030 |
OPIC Loan - Tranch II | | | 180.0 | | | | 100.6 | | | | 6.29 | % | June 2030 |
OPIC Loan - Tranch III | | | 45.0 | | | | 26.9 | | | | 6.12 | % | December 2030 |
Total OPIC Loan | | $ | 310.0 | | | $ | 174.7 | | | | | | |
| | | Amount | | | Amount Outstanding as of | | | Annual | | Maturity |
Loan | | Issued | | | December 31, 2023 | | | Interest Rate (1) | | Date |
| | | (Dollars in millions) | | | | | | |
OPIC Loan - Tranche I | | $ | 85.0 | | | $ | 33.0 | | | | 6.34 | % | December 2030 |
OPIC Loan - Tranche II | | | 180.0 | | | | 68.8 | | | | 6.29 | % | June 2030 |
OPIC Loan - Tranche III | | | 45.0 | | | | 18.8 | | | | 6.12 | % | December 2030 |
Total OPIC Loan | | $ | 310.0 | | | $ | 120.6 | | | | | | |
The OPIC Loan is collateralized by substantially all of OrPower 4’s assets and by a pledge of all of the equity interests in OrPower 4. There are various restrictive covenants under the OPIC Loan, which include a required historical and projected 12-month DSCR. As of December 31, 2020,2023, the covenants have been met.
Finance Agreement with DFC (the Platanares power plant)
On April 30, 2018, Geotérmica Platanares, S.A. de C.V. (“Platanares”), a Honduran sociedad anónima de capital variable and an indirect subsidiary of Ormat Technologies, Inc., entered into a Finance Agreement (the “Finance Agreement”) with DFC, pursuant to which DFC will provide to Platanares senior secured non-recourse debt financing in an aggregate principal amount of up to $114.7 million (the “Platanares Loan”), the proceeds of which will be used principally for the refinancing and financing of the Platanares 35 MW geothermal power plant located in western Honduras. The finance agreement was amended and closed in October of 2018.
| | | Amount | | | Amount Outstanding as of | | | Annual | | Maturity |
Loan | | Issued | | | December 31, 2020 | | | Interest Rate (1) | | Date |
| | | (Dollars in millions) | | | | | | |
DFC - Platanares Loan | | $ | 114.7 | | | $ | 96.3 | | | | 7.02 | % | September 2032 |
ORMAT TECHNOLOGIES, INC. AND SUBSIDIARIES
NOTES TO CONSOLIDATED FINANCIAL STATEMENTS
| | | Amount | | | Amount Outstanding as of | | | Annual | | Maturity |
Loan | | Issued | | | December 31, 2023 | | | Interest Rate (1) | | Date |
| | | (Dollars in millions) | | | | | | |
DFC - Platanares Loan | | $ | 114.7 | | | $ | 71.7 | | | | 7.02 | % | September 2032 |
ORMAT TECHNOLOGIES, INC. AND SUBSIDIARIES
NOTES TO CONSOLIDATED FINANCIAL STATEMENTS
The Platanares Loan is be secured by a first priority lien on all of the assets and ordinary shares of Platanares. The Finance Agreement contains various restrictive covenants applicable to Platanares, among others (i) to maintain a projected and historic debt service coverage ratio; (ii) to maintain on deposit in a debt service reserve account and well reserve account funds or assets with a value in excess of a minimum threshold and (iii) covenants that restrict Platanares from making certain payments or other distributions to its equity holders. As of December 31, 2020,2023, the covenants have been met.
Loan Agreement with Banco Industrial S.A. and Westrust Bank (International) Limited
On July 31, 2015, Ortitlan, Limitada, the Company’s wholly owned subsidiary, obtained a 12-year secured term loan in the principal amount of $42.0 million (the "Amatitlan Loan") for the 20 MW Amatitlan power plant in Guatemala. Under the credit agreement with Banco Industrial S.A. and Westrust Bank (International) Limited, the Company can expand the Amatitlan power plant with financing to be provided either via equity, additional debt from Banco Industrial S.A. or from other lenders, subject to certain limitations on expansion financing in the credit agreement.
The loan is payable in 48 quarterly payments commencinghad a maturity date of September 30, 2015.June 2027 The loan bearsand bore interest at a rate per annum equal to the sum of LIBOR (which cannot be lower than 1.25%) plus a margin of (i) 4.35% as long as the Company’s guaranty of the loan (as described below) is outstanding or (ii) 4.75% otherwise. On September 29, 2023, the Company voluntarily fully prepaid the Amatitlan Loan in the amount of $14.0 million.
| | | Amount | | | Amount Outstanding as of | | Annual | | Maturity |
Loan | | Issued | | | December 31, 2020 | | Interest Rate (1) | | Date |
| | | (Dollars in millions) | | | | |
Amatitlan Loan | | $ | 42.0 | | | $ | 22.8 | | LIBOR+4.35% | | June 2027 |
There are various restrictive covenants under the Amatitlan credit agreement. These include, among other things, (i) a financial covenant to maintain a Debt Service Coverage Ratio (as defined in the credit agreement) and (ii) limitations on Restricted Payments (as defined in the credit agreement) that among other things would limit dividends that could be paid. As of December 31, 2020, the covenants have been met. The loan is collateralized by substantially all the assets of the borrower and a pledge of all of the membership interests of the borrower.
Plumstriker Loan
On May 4, 2019, a wholly owned indirect subsidiary of the Company (“Plumstriker”) and its two subsidiaries entered into a $23.5 million loan agreement with a United States (“U.S.”) financing division of a leading global industrial company for the financing of two 20 MW battery energy storage projects located in New Jersey.
On May 30, 2019, Plumstriker completed the drawdown of the full loan amount, bearingamount. The Plumstriker Loan bore interest of three months U.S. Libor plus a 3.5% margin. The loan is being repaid inmargin and had a maturity date of 29May 2026. equal quarterly principal installments of 1.25% of On April 4, 2023, the loan, and additional 14 unequal semi-annual principal payments, which commenced on June 30, 2019. Proceeds ofCompany voluntarily fully prepaid the loan were used to refinance investmentsPlumstriker Loan in the Plumsted and Stryker projects. The debt repaymentamount of the loan is not guaranteed by the Company or any of its subsidiaries.$11.1 million.
| | | Amount | | | Amount Outstanding as of | | Annual | | Maturity |
Loan | | Issued | | | December 31, 2020 | | Interest Rate (1) | | Date |
| | | (Dollars in millions) | | | | |
Plumstriker Loan | | $ | 23.5 | | | $ | 18.1 | | LIBOR+3.5% | | May 2026 |
ORMAT TECHNOLOGIES, INC. AND SUBSIDIARIES
NOTES TO CONSOLIDATED FINANCIAL STATEMENTS
Don A. Campbell Senior Secured Notes — Non-Recourse
On November 29, 2016, ORNI 47 LLC (“ORNI 47”), the Company’s subsidiary, entered into a note purchase agreement (the “ORNI 47 Note Purchase Agreement”) with MUFG Union Bank, N.A., as collateral agent, Munich Reinsurance America, Inc. and Munich American Reassurance Company (the “Purchasers”) pursuant to which ORNI 47 issued and sold to the Purchasers $92.5 million aggregate principal amount of its Senior Secured Notes (the “DAC 1 Senior Secured Notes”) in a private placement exempt from the registration requirements of the Securities Act of 1933, as amended. ORNI 47 is the owner of the first phase of the Don A. Campbell geothermal power plant (“DAC 1”), and part of the ORPD LLC (“ORPD”) portfolio.
The net proceeds from the sale of the DAC 1 Senior Secured Notes, were used to refinance the development and construction costs of the DAC 1 geothermal power plant, which were originally financed using equity.
The DAC 1 Senior Secured Notes constitute senior secured obligations of ORNI 47 and are secured by all of the assets of ORNI 47. The ORNI 47 Note Purchase Agreement requires ORNI 47 to comply with certain covenants, including, among others, restrictions on the incurrence of indebtedness or liens, amendment or modification of material project documents, the ability of ORNI 47 to merge or consolidate with another entity. In addition, there are restrictions on the ability of ORNI 47 to make distributions to its shareholders, which include a required historical and projected DSCR. As of December 31, 2020,2023, the covenants for this loan have notbeen met.met which resulted in certain restrictions on equity distribution by ORNI 47.
| | | Amount | | | Amount Outstanding as of | | | Annual | | Maturity |
Loan | | Issued | | | December 31, 2020 | | | Interest Rate (1) | | Date |
| | | (Dollars in millions) | | | | | | |
DAC 1 Senior Secured Notes | | $ | 92.5 | | | $ | 73.1 | | | | 4.03 | % | September 2033 |
ORMAT TECHNOLOGIES, INC. AND SUBSIDIARIES
NOTES TO CONSOLIDATED FINANCIAL STATEMENTS
| | | Amount | | | Amount Outstanding as of | | | Annual | | Maturity |
Loan | | Issued | | | December 31, 2023 | | | Interest Rate (1) | | Date |
| | | (Dollars in millions) | | | | | | |
DAC 1 Senior Secured Notes | | $ | 92.5 | | | $ | 57.4 | | | | 4.03 | % | September 2033 |
OFC 2 Senior Secured Notes
In September 2011, OFC 2, the Company’s wholly owned subsidiary and OFC 2’s wholly owned project subsidiaries (collectively, the “OFC 2 Issuers”) entered into a note purchase agreement (the “Note Purchase Agreement”) with OFC 2 Noteholder Trust, as purchaser, John Hancock Life Insurance Company (U.S.A.), as administrative agent, and the DOE, as guarantor, in connection with the offer and sale of up to $350.0 million aggregate principal amount of OFC 2 Senior Secured Notes (“OFC 2 Senior Secured Notes”) due December 31, 2034. The DOE will guarantee payment of 80% of principal and interest on the OFC 2 Senior Secured Notes pursuant to Section 1705 of Title XVII of the Energy Policy Act of 2005, as amended. The conditions precedent to the issuance of the OFC 2 Senior Secured Notes includes certain specified conditions required by the DOE in connection with its guarantee of the OFC 2 Senior Secured Notes.
On October 31, 2011, the OFC 2 Issuers completed the sale of $151.7 million in aggregate principal amount Series A Notes due 2032 (the “Series A Notes”). The net proceeds from the sale of the Series A Notes were used to finance a portion of the construction costs of Phase I of the McGinness Hills and Tuscarora power plants and to fund certain reserves.
On August 29, 2014, OFC 2 sold $140.0 million of OFC 2 Senior Secured Notes (the “Series C Notes”) to finance the construction of the second phase of the McGinness Hills project. The Series C Notes are the last tranche under the Note Purchase Agreement with John Hancock Life Insurance Company and are guaranteed by the DOE’s Loan Programs Office in accordance with and subject to the DOE's Loan Guarantee Program under Section 1705 of Title XVII of the Energy Policy Act of 2005.
The OFC 2 Senior Secured Notes are collateralized by substantially all of the assets of OFC 2 and those of its wholly owned subsidiaries and are fully and unconditionally guaranteed by all of the wholly owned subsidiaries of OFC 2. There are various restrictive covenants under the OFC 2 Senior Secured Notes, which include limitations on additional indebtedness of OFC 2 and its wholly owned subsidiaries. Failure to comply with these and other covenants will, subject to customary cure rights, constitute an event of default by OFC 2. In addition, there are restrictions on the ability of OFC 2 to make distributions to its shareholders. Among other things, the distribution restrictions include a historical debt service coverage ratio requirement and a projected future DSCR requirement. As of December 31, 2020,2023, the covenants have been met.
| | | Amount | | Amount Outstanding as of | | Annual | | Maturity | | Amount | | Amount Outstanding as of | | Annual | | Maturity |
Loan | | Issued | | | December 31, 2020 | | | Interest Rate (1) | | Date | | Issued | | | December 31, 2023 | | | Interest Rate (1) | | Date |
| | | (Dollars in millions) | | | | | | | (Dollars in millions) | | | | | |
OFC 2 Senior Secured Notes - Series A | | $ | 151.7 | | | $ | 86.9 | | | 4.69 | % | December 2032 | | $ | 151.7 | | | $ | 63.9 | | | 4.69 | % | December 2032 |
OFC 2 Senior Secured Notes - Series C | | | 140.0 | | | | 101.3 | | | 4.61 | % | December 2032 | | | 140.0 | | | | 78.6 | | | 4.61 | % | December 2032 |
| Total OFC 2 Senior Secured Notes | | $ | 291.7 | | | $ | 188.2 | | | | | | | $ | 291.7 | | | $ | 142.5 | | | | | |
(1) payable quarterly in arrears |
ORMAT TECHNOLOGIES, INC. AND SUBSIDIARIES
NOTES TO CONSOLIDATED FINANCIAL STATEMENTS
The Company provided a guaranty in connection with the issuance of the Series A Notes and Series C Notes. The guaranty may be drawn in the event of, among other things, the failure of any facility financed by the relevant series of OFC 2 Senior Secured Notes to reach completion and meet certain operational performance levels (the “non-performance trigger”) which gives rise to a prepayment obligation on the OFC 2 Senior Secured Notes. The guarantee may also be drawn if there is a payment default on the OFC 2 Senior Secured Notes or upon the occurrence of certain fundamental defaults that result in the acceleration of the OFC 2 Senior Secured Notes, in each case, prior to the date that the relevant facility(ies) financed by such OFC 2 Senior Secured Notes reaches completion and meets the applicable operational performance levels. The Company’s liability under the guaranty with respect to the non-performance trigger is limited to an amount equal to the prepayment amount on the OFC 2 Senior Secured Notes necessary to bring the OFC 2 Issuers into compliance with certain coverage ratios. The Company’s liability under the guaranteeguaranty with respect to the other trigger event described above is not so limited.
ORMAT TECHNOLOGIES, INC. AND SUBSIDIARIES
NOTES TO CONSOLIDATED FINANCIAL STATEMENTS
Other Limited Recourse LoansIdaho Refinancing Note
On April 24, 2018,November 28, 2022, the Company completed the acquisition of USG. As part of the acquisition the Company assumed the following non-recourse loans:
Prudential Capital Group – Idaho non-recourse
In May 2016, USG’s wholly owned subsidiary (Idaho USG Holdings, LLC)LLC (the “Issuer”) entered into a loannote purchase agreement with the Prudential Insurance Company of America and other noteholders, pursuant to which the Issuer issued approximately $61.6 million in aggregate principal amount of senior secured notes (“Idaho Refinancing Note”). Proceeds of the Idaho Refinancing Note were used by the Issuer for the refinancing of the Prudential Capital Group to finance its development activities. The original principal totaled $20.0 million. The principal and interest payments are due semi-annually and the principal is partially repaid through 2023 and the- Idaho non-recourse loan which had a remaining balance of approximately $16.0 million is due in full in March 2023. 2023 (the “Idaho Refinancing”).
The loanIdaho Refinancing note purchase agreement also includes an approximately $4.3 million revolving note tranche to be issued in the event of a shortfall in debt service with respect to the Idaho Refinancing Note. The Issuer shall pay a commitment fee on the revolving note tranche at a rate of 0.5% per annum. If drawn, the revolving notes shall bear interest at a rate of Term SOFR + 140bps.
The Idaho Refinancing is secured by the Company’sIssuer’s 100% ownership interests in Raft River Energy I LLC, which owns the Raft River geothermal project, and by the Issuer’s 60% ownership interests in Oregon USG Holdings, LLC, the owner of USG Oregon LLC, which owns the Neal Hot Springs geothermal project. The Idaho Refinancing Note will be repaid in 31 semi-annual payments, commencing on March 31st,2023. The Idaho Refinancing Note bears interest at a fixed rate of 6.26% per annum and has a final maturity date of March 31, 2038. The Company has provided a limited guarantee with respect to certain insurance obligations of the Raft River projects.Issuer.
There are various restrictive covenants under the Idaho Refinancing, including limitations on additional indebtedness of the Issuer and its subsidiaries. Failure to comply with these and other covenants will, subject to customary cure rights, constitute an event of default by the Issuer. In addition, there are restrictions on the ability of the Issuer to make distributions to its shareholders. Among other things, the distribution restrictions include both a historical and projected minimum debt service coverage ratio requirement. As of December 31, 2023, the covenants for this loan have been met.
As part of the security package, the note purchase agreement states the Issuer shall establish and maintain customary reserve accounts which include a debt service reserve account, a make-up well reserve account, a maintenance reserve account and a construction reserve account.
U.S. Department of Energy – non-recourseLoan
On August 31, 2011, USG’s wholly owned subsidiary, USG Oregon LLC (“USG Oregon”), completed the first funding drawdown associated with the U.S. Department of Energy (“DOE”) loan guarantee of $96.8 million loan guarantee (“Loan Guarantee”) to construct its power plant at Neal Hot Springs project in Eastern Oregon. In connection with the Loan Guarantee, the DOE has been granted a security interest in all of the equity interests of USG Oregon, as well as in the assets of USG Oregon, including a mortgage on real property interests relating to the Neal Hot Springs site. As of December 31, 2023, the covenants for this loan have been met.
Prudential Capital Group – Nevada non-recourse
On September 26, 2013, USG’s wholly owned subsidiary (“USG Nevada LLC”),LLC, entered into a note purchase agreement with the Prudential Capital Group to finance Phase I of the San Emidio geothermal project located in northwest Nevada. Principal payments are due quarterly based upon minimum debt service coverage ratios established according to projected operating results made at the loan origination date and available cash balances. The loan agreement is secured by USG Nevada LLC’s right, title and interest in and to its real and personal property, including the San Emidio project and the equity interests in USG Nevada LLC. As of December 31, 2023, the covenants for this loan have been met.
| | | Amount | | | Amount Outstanding as of | | | Annual | | Maturity |
Loan | | Issued | | | December 31, 2020 | | | Interest Rate (1) | | Date |
| | | (Dollars in millions) | | | | | | |
Prudential Capital Group – Idaho non-recourse | | $ | 20.0 | | | $ | 17.5 | | | | 5.80 | % | March 2023 |
U.S. Department of Energy – non-recourse | | | 96.8 | | | | 42.0 | | | | 2.60 | % | February 2035 |
Prudential Capital Group – Nevada non-recourse | | | 30.7 | | | | 26.3 | | | | 6.75 | % | December 2037 |
| Total | | $ | 147.5 | | | $ | 85.8 | | | | | | |
ORMAT TECHNOLOGIES, INC. AND SUBSIDIARIES
NOTES TO CONSOLIDATED FINANCIAL STATEMENTS
| | | Amount | | | Amount Outstanding as of | | | Annual | | Maturity |
Loan | | Issued | | | December 31, 2023 | | | Interest Rate (1) | | Date |
| | | (Dollars in millions) | | | | | | |
Idaho Refinancing Note | | $ | 61.6 | | | $ | 58.9 | | | | 6.26 | % | March 2038 |
U.S. Department of Energy | | | 96.8 | | | | 30.2 | | | | 2.60 | % | February 2035 |
Prudential Capital Group – Nevada | | | 30.7 | | | | 23.9 | | | | 6.75 | % | December 2037 |
Total | | $ | 189.1 | | | $ | 113.0 | | | | | | |
(1) payable semi-annually, except for Prudential Capital Group - Nevada non-recourse which is payable quarterly |
ORMAT TECHNOLOGIES, INC. AND SUBSIDIARIES
NOTES TO CONSOLIDATED FINANCIAL STATEMENTS
Bpifrance Loan - Non Recourse
On April 4, 2019, an indirect subsidiary of the Company (“Guadeloupe”), entered into a $8.9 million loan agreement with Banque Publique d’Investissement (“Bpifrance”). On April 29, 2019, Guadeloupe completed the drawdown of the full loan amount, bearing a fixed interest rate of 1.93%. The loan will be repaid in 20 equal quarterly principal installments, commencing June 30, 2021. The final maturity date of the loan is March 31, 2026. The loan is not guaranteed by the Company or any of its other subsidiaries. As of December 31, 2020,2023, $9.84.2 million is outstanding under the Bpifrance Loan.
Société GéneraléSociété Générale Loan - Limited Recourse
On April 9, 2019, Guadeloupe, entered into a $8.9 million loan agreement with Société Général.rale. On April 29, 2019, Guadeloupe completed the drawdown of the full loan amount of the loan, bearing a fixed interest rate of 1.52%. The loan is being repaid in 28 quarterly principal installments, which commenced on July 29, 2019. The final maturity date of the loan is April 29, 2026. The loan has a limited guarantee by one of the Company’s subsidiaries. As of December 31, 2020,2023, $7.83.5 million was outstanding under the Société Géneralé Loan.
Convertible Senior Notes
On June 22, 2022, the Company issued $375.0 million aggregate principal amount of its 2.5% convertible senior notes ("Notes") due 2027. The Notes were offered and sold in a private offering to qualified institutional buyers pursuant to Rule 144A under the Securities Act of 1933, as amended, pursuant to an indenture between the Company and U.S. Bank National Association, as trustee. Additionally, the Company granted the initial purchasers an option to purchase up to an additional $56.25 million aggregate principal amount of the Notes. The initial purchasers executed their option on June 27, 2022, and by that, increased the total aggregated principal amount of the Notes issued to $431.25 million. The Notes bear annual interest of 2.5%, payable semiannually in arrears on January 15 and July 15 of each year, beginning on January 15, 2023. The Notes mature on July 15, 2027, unless earlier converted, redeemed or repurchased and are the Company's senior unsecured obligations.
Holders of the Notes may convert all or any portion of their Notes at their option at any time prior to the close of business on the business day immediately preceding January 15, 2027 only under the following circumstances: (1) during any calendar quarter commencing after the calendar quarter ending on September 30, 2022 (and only during such calendar quarter), if the last reported sale price of the Company's common stock, par value $0.001 per share (the “Common Stock”), for at least 20 trading days (whether or not consecutive) during a period of 30 consecutive trading days ending on, and including, the last trading day of the immediately preceding calendar quarter is greater than or equal to 130% of the conversion price on each applicable trading day (equivalent to an initial conversion price of approximately $90.27 per share of common stock); (2) during the five consecutive business day period immediately after any five consecutive trading day period (the “Measurement Period”) in which the trading price per $1,000 principal amount of Notes, as determined following a request by a holder or holders of the Notes for each trading day of the Measurement Period was less than 98% of the product of the last reported sale price of the Company's Common Stock and the conversion rate on each such trading day; (3) if the Company calls any or all of the Notes for redemption (the Company may not redeem the notes prior to July 21, 2025), at any time prior to the close of business on the second scheduled trading day prior to the redemption date, but only with respect to the Notes called (or deemed called) for redemption; or (4) upon the occurrence of specified corporate events. On or after January 15, 2027 until the close of business on the second scheduled trading day immediately preceding the maturity date, holders may convert all or any portion of their Notes at any time, regardless of the foregoing circumstances. Upon conversion, the Company will pay cash up to the aggregate principal amount of the Notes to be converted and pay or deliver, as the case may be, cash, shares of its common stock or a combination of cash and shares of its common stock, at its election, in respect of the remainder, if any, of its conversion obligation in excess of the aggregate principal amount of the Notes being converted.
ORMAT TECHNOLOGIES, INC. AND SUBSIDIARIES
NOTES TO CONSOLIDATED FINANCIAL STATEMENTS
The initial conversion rate was 11.0776 shares of common stock per $1,000 principal amount of Notes, which is equivalent to an initial conversion price of approximately $90.27 per share of common stock, subject to adjustment in certain events. In addition, following certain corporate events that occur prior to the maturity date or if the Company delivers a notice of redemption, it will, in certain circumstances, increase the conversion rate for a holder who elects to convert its Notes in connection with such a corporate event or notice of redemption, as the case may be. The Company may not redeem the notes prior to July 21, 2025. The Company may redeem for cash all or any portion of the Notes, at its option, on or after July 21, 2025 and on or before the 41st scheduled trading day immediately preceding the maturity date, if the last reported sale price of its common stock has been at least 130% of the conversion price then in effect for at least 20 trading days (whether or not consecutive) during any 30 consecutive trading day period (including the last trading day of such period) ending on, and including, the trading day immediately preceding the date on which we provide notice of redemption at a redemption price equal to 100% of the principal amount of the notes to be redeemed, plus accrued and unpaid interest, but excluding, the redemption date. No sinking fund is provided for the Notes. Additionally, if the Company undergoes a fundamental change (other than certain exempted fundamental changes), holders may require the Company to repurchase for cash all or any portion of their Notes at a fundamental change repurchase price equal to 100% of the principal amount of the Notes to be repurchased, plus accrued and unpaid interest.
The Company incurred approximately $11.6 million of issuance costs in respect of the issuance of the Notes, which were deferred and are presented as a reduction to the Notes principal amounts on the consolidated balance sheets. The deferred issuance costs are amortized over the term of the Notes into interest expenses, net in the consolidated statements of operations and comprehensive income. During the year ended December 31, 2023, $2.3 million was recorded as amortized issuance costs under interest expenses, net. The effective interest rate on the Notes, including the impact of the deferred debt issuance costs, is 3.1%.
Based on the closing market price of the Company's common stock on December 31, 2023, the if-converted value of the Notes was less than their aggregate principal amount.
Capped Call Transactions
In connection with the issuance of the convertible notes described above, the Company entered into capped call transactions (the "Capped Calls") with certain counterparties. The capped call transactions will cover, subject to customary adjustments, the number of shares of our common stock initially underlying the Notes of approximately 4.8 million shares of common stock and at an initial strike price of $90.27 per share. The Capped Calls are generally intended to reduce the potential dilution to the Company's Common Stock upon any conversion of the Notes and/or offset any cash payments the Company is required to make in excess of the principal amount of converted Notes, in the event that at the time of conversion, the Common Stock price exceeds the conversion price. If, however, the market price per share of Common Stock exceeds the cap price of the Capped Calls, there would nevertheless be dilution or there would not be an offset of such potential cash payments, in each case, to the extent that such market price exceeds the cap price of the Capped Calls.
The Capped Calls exercise price is equal to the $90.27 initial conversion price of each of the Notes and the cap price of the Capped Calls is initially $107.63 per share, which represents a premium of approximately 55% above the closing price of the Company's common stock on the date of the Notes offering and is subject to customary anti-dilution adjustments. The Capped Calls transactions are separate transactions entered into by the Company with the option counterparties, are not part of the terms of the Notes and will not change the holders’ rights under the Notes.
The Company paid approximately $24.5 million for the Capped Calls which was recorded as a reduction to Additional Paid-in Capital in the consolidated statements of equity in the second quarter of 2022, as such transactions qualify for the equity classification with no subsequent adjustment to fair value under ASU 815, Derivatives and Hedging. The Capped Calls are not included in the calculation of diluted earnings per share because their impact is anti-dilutive.
ORMAT TECHNOLOGIES, INC. AND SUBSIDIARIES
NOTES TO CONSOLIDATED FINANCIAL STATEMENTS
Purchase of Treasury Stock
In connection with the issuance of the Notes as described above, the Company used approximately $18.0 million of the net proceeds from the issuance of these Notes to repurchase 258,667 shares of its common stock in privately negotiated transactions at a price of $69.45 per share. The Company recorded this purchase of treasury stock as a reduction to its equity on the consolidated statements of equity in the second quarter of 2022.
Prepayment of Series 3 Bonds
Additionally, in connection with the issuance of the Notes as described above, on June 27, 2022, the Company used approximately $221.9 million of the net proceeds from the issuance of these Notes to prepay its Series 3 Bonds that were set to mature in September 2022 in a single bullet payment. This amount included an aggregated principal amount of $218.0 million, $2.8 million of accrued interest and $1.1 million of make-whole premium which was recorded in the second quarter of 2022 under Other non-operating income (expense), net in the consolidated statements of operations and comprehensive income.
Financing Liability
On July 13, 2021, the Company closed a transaction with TG Geothermal Portfolio, LLC (a subsidiary of Terra-Gen, LLC) (the "Seller") to acquire a number of geothermal assets and a transmission line. The financing liability is related to a sale and leaseback transaction entered into by the Seller in September 2015 under which it sold and leased back the undivided interests in the Dixie Valley power plant asset through June 2038. The lease transaction was accounted for by the Seller as a finance lease due to the Seller's continued involvement and management of the power plant and the existence of an early buy-out option in September 2024. During the fourth quarter of 2023, the Company decided to defer the buy-out payment to June 2038, as permitted under the lease transaction agreement, which resulted in an adjustment to the effective interest rate of the financing liability. The adjusted rate increased from 2.55% to 6.12%, prospectively. Further details on the Terra-Gen business combination are described under Note 2 to the consolidated financial statements. As of December 31, 2023, the covenants have been met.
| | | Amount Outstanding as of | | | Annual | | Maturity |
Loan | | December 31, 2023 | | | Interest Rate (1) | | Date (2) |
| | | (Dollar in millions) | | | | | | |
Financing Liability - Dixie Valley | | $ | 225.8 | | | | 6.12 | % | June 2038 |
(1) payable semi-annually |
(2) final maturity date of the financing liability is assuming execution of the buy-out option in June 2038. |
Revolving credit linesCredit Lines with commercial banksCommercial Banks
As of December 31, 2020,2023, the Company has credit agreements for committed and uncommitted credit lines with a number of financial institutions for an aggregate amount of $623.0$608.0 million (including $60.0 million from MUFG Union Bank, N.A. (“Union Bank”) and $35.0 million from HSBC Bank USA N.A. as described below). Under the terms of these credit agreements, the Company, or its Israeli subsidiary, Ormat Systems Ltd. (“Ormat Systems), can request: (i) extensions of credit in the form of loans and/or the issuance of one or more letters of credit in the amount of up to $408.0$453.0 million; and (ii) the issuance of one or more letters of credit in the amount of up to $120.0$155.0 million. The credit agreements mature between March 20212024 and July 2022.August 2025. Loans and draws under the credit agreements or under any letters of credit will bear interest at the respective bank’s cost of funds or SOFR plus a margin.
As of December 31, 2020,2023, 0 loansshort-term credit lines of $20.0 million were outstanding and letters of credit with an aggregate amount of $94.4$302.8 million were issued and outstanding under committed and non-committed lines under such credit agreements.agreements (including the amounts outstanding under the section Credit Agreements below with MUFG Union bank and HSBC bank).
Credit Agreements
Credit Agreements
Credit agreementAgreement with MUFG Union Bank
Ormat Nevada has a credit agreement with MUFG Union Bank under which it has an aggregate available credit of up to $60.0 million as of December 31, 2020.2023. The credit termination date is June 30, 2021.2024.
ORMAT TECHNOLOGIES, INC. AND SUBSIDIARIES
NOTES TO CONSOLIDATED FINANCIAL STATEMENTS
The facility is limited to the issuance, extension, modification or amendment of letters of credit. Union Bank is currently the sole lender and issuing bank under the credit agreement, but is also designated as an administrative agent on behalf of banks that may, from time to time in the future, join the credit agreement as lenders. In connection with this transaction, the Company entered into a guarantee in favor of the administrative agent for the benefit of the banks, pursuant to which the Company agreed to guarantee Ormat Nevada’s obligations under the credit agreement. Ormat Nevada’s obligations under the credit agreement are otherwise unsecured.
ORMAT TECHNOLOGIES, INC. AND SUBSIDIARIES
NOTES TO CONSOLIDATED FINANCIAL STATEMENTS
There are various restrictive covenants under the credit agreement, which include a requirement to comply with the following financial ratios, which are measured quarterly: (i) a 12-month debt to EBITDA ratio not to exceed 4.5; (ii) 12-month DSCR of not less than 1.35; and (iii) distribution leverage ratio not to exceed 2.0. As of December 31, 2020:2023: (i) the actual 12-month debt to EBITDA ratio was 1.64;1.24; (ii) the 12-month DSCR was 5.05;5.75; and (iii) the distribution leverage ratio was 0.61.0.7. In addition, there are restrictions on dividend distributions in the event of a payment default or noncompliance with such ratios, and subject to specified carve-outs and exceptions, a negative pledge on the assets of Ormat Nevada in favor of Union Bank. As of December 31, 2023, the covenants have been met.
As of December 31, 2020,2023, letters of credit in the aggregate amount of $57.9$59.3 million were issued and outstanding under this credit agreement.
Credit agreementAgreement with HSBC Bank USA N.A.
Ormat Nevada has a credit agreement with HSBC Bank USA, N.A for one year with annual renewals. The current expiration date of the facility under this credit agreement is October 31, 2021.2024. On December 31, 2020,2023, the aggregate amount available under the credit agreement was $35.0 million. Other than $10.0 million of this credit facility which may be drawn for the Company's working capital needs, thisThis credit line is limited to the issuance, extension, modification or amendment of letters of credit. HSBC is currently the sole lender and issuing bank under theIn addition, Ormat Nevada has an uncommitted discretionary demand line of credit agreement, but is also designated as an administrative agent on behalf of banks that may, from time to time in the future, join theaggregate amount of $65.0 million available for letters of credit agreement as parties thereto.including up to $20 million of credit. In connection with this transaction, the Company entered into a guarantee in favor of the administrative agent for the benefit of the banks, pursuant to which the Company agreed to guarantee Ormat Nevada’s obligations under the credit agreement. Ormat Nevada’s obligations under the credit agreement are otherwise unsecured.
There are various restrictive covenants under the credit agreement, including a requirement to comply with the following financial ratios, which are measured quarterly: (i) a 12-month debt to EBITDA ratio not to exceed 4.5; (ii) 12-month DSCR of not less than 1.35; and (iii) distribution leverage ratio not to exceed 2.0. As of December 31, 2020:2023: (i) the actual 12-month debt to EBITDA ratio was 1.64;1.24; (ii) the 12-month DSCR was 5.05;5.75; and (iii) the distribution leverage ratio was 0.61.0.7. In addition, there are restrictions on dividend distributions in the event of a payment default or noncompliance with such ratios, and subject to specified carve-outs and exceptions, a negative pledge on the assets of Ormat Nevada in favor of HSBC. As of December 31, 2023, the covenants have been met.
As of December 31, 2020,2023, letters of credit in the aggregate amount of $27.9$34.3 million were issued and outstanding under the committed portion of this credit agreement and $36.3 million under the uncommitted portion of the agreement.
Chubb Surety BondBonds
In May 2017, theThe Company entered into a surety bond agreementagreements (the “Surety Agreement”Agreements”) with Chubb Limited, (“Chubb”Travelers, Allianz and certain other third parties (the “Surety”) pursuant to which the Company may request that Chubbthe Surety issue up to an aggregate $200.0amount of $635.0 million of surety bonds with respect to the contractual obligations of the Company and its subsidiaries in exchange for bank letters of credit or as otherwise may be required. There is no expiration date for the Surety Agreement,Agreements, but itthey may be terminated by the Company at any time upon between twenty and thirty days’ prior written notice to Chubb.the Surety. Delivery of such termination notice will not affect any surety bonds issued and outstanding prior to the date on which such notice is delivered. As of December 31, 2020,2023, Chubbthe Surety issued a surety bondbonds in the amount of $153.7$237.7 million under the Surety Agreement.
Short-term commercial paper
On June 27, 2019, the Company entered into a framework agreement for participation in the issuance of commercial paper (the "Agreement") with Discount Capital Underwriting Ltd. under which the Company allowed the participants to submit proposals for purchasing and to purchase the Company's commercial paper ("Commercial Paper") in accordance with the provisions of the Agreement. On July 3, 2019, the Company completed the issuance of the Commercial Paper in the aggregate amount of $50.0 million. The Commercial Paper was issued for a period of 90 days and extended automatically for additional 90 day periods for up to five years, unless the Company notifies the participants otherwise or a notice of termination is provided by the participants in accordance with the provisions of the Agreement. The Commercial Paper bore an annual interest of three months LIBOR +0.75% which was paid at the end of each 90 day period. The Commercial Paper was fully repaid during 2020.
ORMAT TECHNOLOGIES, INC. AND SUBSIDIARIES
NOTES TO CONSOLIDATED FINANCIAL STATEMENTS
Restrictive covenantsCovenants
The Company’s obligations under the credit agreements, the loan agreements, and the trust instrument governing the bonds, described above, are unsecured, but are subject to a negative pledge in favor of the banks and the other lenders and certain other restrictive covenants. These include, among other things, a prohibition on: (i) creating any floating charge or any permanent pledge, charge or lien over the Company's assets without obtaining the prior written approval of the lender; (ii) guaranteeing the liabilities of any third party without obtaining the prior written approval of the lender; and (iii) selling, assigning, transferring, conveying or disposing of all or substantially all of the Company's assets, or a change of control in the Company's ownership structure. Some of the credit agreements, the term loan agreements, as well as the trust instrument contain cross-default provisions with respect to other material indebtedness owed by us to any third party. In some cases, the Company has agreed to maintain certain financial ratios, which are measured quarterly, such as: (i) equity of at least $750 million and in no event less than 25% of total assets; and (ii) 12-month debt, net of cash, cash equivalents marketable securities and short-term bank deposits to Adjusted EBITDA ratio not to exceed 6;6. and (iii) dividend distribution not to exceed 50% of net income for that year. As of December 31, 2020:2023: (i) total equity was $1,941.4$2,441 million and the actual equity to total assets ratio was 49.9%46.9%, and (ii) the 12-month debt, net of cash, cash equivalents marketable securities and short-term bank deposits to Adjusted EBITDA ratio was 2.36. 3.74 and as such, the covenants have been met as of December 31, 2023. During the year ended December 31, 2020,2023, the Company distributed interim dividends in an aggregate amount of $22.5$28.4 million.
Future minimum payments
Future minimum payments under long-term obligations, including long-term debt and financing liability, as of December 31, 20202023 are as follows:
| | | (Dollars in
thousands) | | | (Dollars in thousands) | |
| | | |
Year ending December 31: | | | | | | |
| 2021 | | $ | 78,429 | | |
| 2022 | | 336,997 | | |
| 2023 | | 135,124 | | |
| 2024 | | 118,168 | | | $ | 178,954 | |
| 2025 | | 118,621 | | | 178,982 | |
2026 | | | 182,654 | |
2027 | | | 612,045 | |
2028 | | | 167,848 | |
Thereafter | | | 686,835 | | | | 669,074 | |
Total | | $ | 1,474,174 | | | $ | 1,989,557 | |
NOTE 12 — PUNA POWER PLANT TRANSACTIONS
In 2005, the Company’s wholly owned subsidiary in Hawaii, Puna Geothermal Ventures (“PGV”), entered into lease transactions involving the original geothermal power plant of the Puna complex located on the Big Island (the “Puna Power Plant”). In December 2019, PGV and HELCO executed an amended and restated PPA for power sold from the Puna complex power plant. The new PPA extends the term until 2052 with an increased contract capacity of 46 MW and a fixed price of $70 per MWh with no escalation for all energy purchased during any contract year up to 227,000 MWh and $40 per MWh above 227,000 MWh. In addition, annual capacity payments under the contract are expected to be approximately $19.5 million. The amended and restated PPA was filed with the Public Utilities Commission on December 31, 2019. The existing PPA remains in effect with its current terms until the expansion of the power plant is completed and the new power plant reaches commercial operation.
In connection with the execution of the amended and restated PPA, the Company paid $20.5 million to effectively terminate the lease transactions involving the original power plant which gives the Company the ability to satisfy its obligations under the new PPA. The Company recorded this payment under Deposits and other in its consolidated balance sheets as an incremental cost in obtaining the new amended and restated PPA as described above.
ORMAT TECHNOLOGIES, INC. AND SUBSIDIARIES
NOTES TO CONSOLIDATED FINANCIAL STATEMENTS
Prior to the amended and restated PPA, PGV leased the Puna Power Plant to an unrelated company under a 31-year head lease (the “Head Lease”) in return for prepaid lease payments in the total amount of $83.0 million (the “Deferred Lease Income”). The unrelated company (the “Lessor”) simultaneously leased back the Puna Power Plant to PGV under a 23-year lease (the “Project Lease”). PGV’s rent obligations under the Project Lease were paid solely from revenues generated by the Puna Power Plant under a PPA that PGV had with HELCO. The Head Lease and the Project Lease were non-recourse lease obligations to the Company. PGV’s rights in the geothermal resource and the related PPA were not leased to the Lessor as part of the Head Lease but are part of the Lessor’s security package.
NOTE 13 —TAXTAX MONETIZATION TRANSACTIONS
McGinness Hills 3 tax monetization transaction North Valley Tax Equity Transaction
On August 14, 2019,October 27, 2023, one of the Company’s wholly-owned subsidiaries that indirectly owns the 48 MW McGinness Hills phase 3 geothermal power plant entered into a partnership agreement with a private investor. Under the transaction documents, the private investor acquired membership interests in the McGinness Hills phase 3 geothermal power plant for an initial purchase price of approximately $59.3 million and for which it will pay additional installments that are expected to amount to approximately $9 million and can reach up to $22 million based on the actual generation. The Company will continue to consolidate, operate and maintain the power plant and will receive substantially all the distributable cash flow generated by the power plant and the private investor will receive substantially all of the tax attributes, as described below.
Pursuant to the transaction documents, prior to December 31, 2027 (“Target Flip Date”), one of the Company’s wholly owned subsidiaries receives substantially all of the distributable cash flow generated by the McGinness Hills phase 3 power plant, while the private investor receives substantially all of the tax attributes of the project. Following the later of the Target Flip Date and the date on which the private investor reaches its target return, the Company will receive 97.5% of the distributable cash generated by the power plant and 95.0% of the tax attributes, on a go forward basis. In the event that the private investor will not reach its target return by the Target Flip Date, then for the period between the Target Flip Date and the date on which the private investor reaches its target return, the private investor will receive 100% of the distributable cash generated by the power plant and 99% of the tax attributes as long as the project is generating PTCs (and 5% of the tax attributes afterwards).
On the Target Flip Date, the Company, through one of its wholly-owned subsidiaries, has the option to purchase the private investor’s interests at the then-current fair market value, plus an amount that causes the private investor to reach its target return, if needed. If the Company exercises this purchase option, it will become the sole owner of the project again.
Tungsten Mountain partnership transaction
On May 17, 2018, one of the Company’s wholly-owned subsidiaries that indirectly owns the 26 MW Tungsten MountainNorth Valley Geothermal power plant entered into a partnership agreement with a private investor. Under the transaction documents, the private investor acquired membership interests in the Tungsten MountainNorth Valley Geothermal power plant project for an initial purchase price of approximately $33.4$43.1 million and for which it will pay additional installments that are expected to amount to approximately $13$6.1 million. The Company will continuecontinues to operate and maintain the power plant and will receive substantially all the distributable cash flow generated by the power plant, as described below.
Under the transaction documents, prior to December 31, 20262032 (“Target Flip Date”), the Company’s wholly-owned subsidiary, Ormat Nevada Inc. ("Ormat Nevada"), receives substantially all of the distributable cash flow generated by the project, while the private investor receives substantially all of the tax attributes of the project. Following the later of the Target Flip Date and the date on which the private investor reaches its target return, Ormat Nevada will receive 97.5% of the distributable cash and 95.0% of the taxable income, on a go forwardgo-forward basis. In the event that the private investor will not reach its target return by the Target Flip Date, then for the period between the Target Flip Date and the date on which the private investor reaches its target return, the private investor will receive 100% of the distributable cash generated by the power plant and 99% of the tax attributes as long as the project is generating PTCsProduction Tax Credits ("PTCs") (and 5% of the tax attributes afterwards).
ORMAT TECHNOLOGIES, INC. AND SUBSIDIARIES
NOTES TO CONSOLIDATED FINANCIAL STATEMENTS
On the Target Flip Date, Ormat Nevada has the option to purchase the private investor’s interests at the then-current fair market value, plus an amount that causes the private investor to reach its target return, if needed. If Ormat Nevada exercises this purchase option, it will become the sole owner of the project again.
ORMAT TECHNOLOGIES, INC. AND SUBSIDIARIES
NOTES TO CONSOLIDATED FINANCIAL STATEMENTS
Transferable production and investment tax credits
The Inflation Reduction Act was signed into law in August 2022 and introduces a transferability provision for certain tax credits related to the clean production of energy. Under this provision, a reporting entity can monetize such credits through sale to a third party. The option for transferability of credits applies to taxable years beginning after December 31, 2022. Several of the Company’s projects that are not currently part of a tax monetization transaction generate eligible tax credits, such as ITCs and PTCs, that are eligible to be transferred to a third-party under the provisions of the IRA. The Company accounts for ITCs under ASC 740 through the “Income tax (provision) benefit” line in the consolidated statement of operations and comprehensive income. PTC’s are accounted similarly to refundable or direct-pay credits outside of the tax line with income recognized in the “Income attributable to sale of tax benefits” line in the consolidated statement of operations and comprehensive income. Income related to the expected sale of such transferable PTC’s recorded during 2023 amounted to $10.8 million, net of discount. Tax benefits recognized related to such transferable ITC’s during 2023 was $18.7 million, net of discount.
In December 2023, the Company entered into tax credit purchase agreements with a third-party under which it sold in cash to the third party PTC's in the amount of $3.3 million, net, which were generated by its eligible power plants and ITC's in the amount of $21.8 million, attributable to its investment in storage facilities.
Casa Diablo IV ("CD4") tax monetization transaction
On December 23, 2022, one of the Company’s wholly-owned subsidiaries that indirectly owns the CD4 Geothermal power plant entered into a partnership agreement with JPM. Under the transaction documents, the private investor acquired membership interests in the CD4 Geothermal power plant project for an initial purchase price of approximately $50.3 million and for which it will pay additional installments that are expected to amount to approximately $7.3 million. The Company continues to operate and maintain the power plant and will receive substantially all the distributable cash flow generated by the power plant, as described below.
Under the transaction documents, prior to December 31, 2031 (“CD 4 Target Flip Date”), the Company receives substantially all of the distributable cash flow generated by the project, while the private investor receives substantially 99% of the tax attributes of the project. Following the later of the CD4 Target Flip Date and the date on which the private investor reaches its target return, the Company will receive 97.5% of the distributable cash and 95.0% of the taxable income, on a go forward basis. In the event that JPM will not reach its target return by the CD4 Target Flip Date, then for the period between the CD4 Target Flip Date and the date on which the private investor reaches its target return, the private investor will receive 75% of the distributable cash generated by the power plant and 99% of the tax attributes as long as the project is generating Production Tax Credits ("PTCs") (and 5% of the tax attributes afterwards).
On the Target Flip Date, the Company has the option to purchase the private investor’s interests at the then-current fair market value, plus an amount that causes JPM to reach its target return, if needed. If the Company exercises this purchase option, it will become the sole owner of the project again.
JPM’s capital contribution of $50.3 million was recorded as allocation to noncontrolling interests of $3.9 million and to liability associated with sale of tax benefits of $46.4 million.
Steamboat Hills tax monetization transaction
On October 25, 2021, one of the Company’s wholly-owned subsidiaries that indirectly owns the Steamboat Hills Repower Geothermal power plant entered into a partnership agreement with a private investor. Under the transaction documents, the private investor acquired membership interests in the Steamboat Hills Repower Geothermal power plant project for an initial purchase price of approximately $38.9 million and for which it will pay additional installments that are expected to amount to approximately $5.3 million. The Company continues to operate and maintain the power plant and will receive substantially all the distributable cash flow generated by the power plant, as described below.
Under the transaction documents, prior to December 31, 2029 (“Steamboat Hills Target Flip Date”), the Company’s wholly-owned subsidiary, Ormat Nevada Inc. ("Ormat Nevada"), receives substantially all of the distributable cash flow generated by the project, while the private investor receives substantially all of the tax attributes of the project. Following the later of the Steamboat Hills Target Flip Date and the date on which the private investor reaches its target return, Ormat Nevada will receive 97.5% of the distributable cash and 95.0% of the taxable income, on a go forward basis. In the event that the private investor will not reach its target return by the Steamboat Hills Target Flip Date, then for the period between the Steamboat Hills Target Flip Date and the date on which the private investor reaches its target return, the private investor will receive 100% of the distributable cash generated by the power plant and 99% of the tax attributes as long as the project is generating PTCs (and 5% of the tax attributes afterwards).
ORMAT TECHNOLOGIES, INC. AND SUBSIDIARIES
NOTES TO CONSOLIDATED FINANCIAL STATEMENTS
On the Steamboat Hills Target Flip Date, Ormat Nevada has the option to purchase the private investor’s interests at the then-current fair market value, plus an amount that causes the private investor to reach its target return, if needed. If Ormat Nevada exercises this purchase option, it will become the sole owner of the project again.
McGinness Hills 3 tax monetization transaction
On August 14, 2019, one of the Company’s wholly-owned subsidiaries that indirectly owns the McGinness Hills phase 3 geothermal power plant entered into a partnership agreement with a private investor. Under the transaction documents, the private investor acquired membership interests in the McGinness Hills phase 3 geothermal power plant for an initial purchase price of approximately $59.3 million and for which it will pay additional installments that are expected to amount to approximately $9.0 million and can reach up to $22.0 million based on the actual generation. The Company continues to consolidate, operate and maintain the power plant and will receive substantially all the distributable cash flow generated by the power plant and the private investor will receive substantially all of the tax attributes, as described below.
Pursuant to the transaction documents, prior to December 31, 2027 (“MGH3 Target Flip Date”), one of the Company’s wholly owned subsidiaries receives substantially all of the distributable cash flow generated by the McGinness Hills phase 3 power plant, while the private investor receives substantially all of the tax attributes of the project. Following the later of the MGH3 Target Flip Date and the date on which the private investor reaches its target return, the Company will receive 97.5% of the distributable cash generated by the power plant and 95.0% of the tax attributes, on a go forward basis. In the event that the private investor will not reach its target return by the MGH3 Target Flip Date, then for the period between the MGH3 Target Flip Date and the date on which the private investor reaches its target return, the private investor will receive 100% of the distributable cash generated by the power plant and 99% of the tax attributes as long as the project is generating PTCs (and 5% of the tax attributes afterwards).
On the MGH3 Target Flip Date, the Company, through one of its wholly-owned subsidiaries, has the option to purchase the private investor’s interests at the then-current fair market value, plus an amount that causes the private investor to reach its target return, if needed. If the Company exercises this purchase option, it will become the sole owner of the project again.
Tungsten Mountain tax monetization transaction
On May 17, 2018, one of the Company’s wholly-owned subsidiaries that indirectly owns the Tungsten Mountain Geothermal power plant entered into a partnership agreement with a private investor. Under the transaction documents, the private investor acquired membership interests in the Tungsten Mountain Geothermal power plant project for an initial purchase price of approximately $33.4 million and for which it will pay additional installments that are expected to amount to approximately $13.0 million. The Company continues to operate and maintain the power plant and will receive substantially all the distributable cash flow generated by the power plant, as described below.
Under the transaction documents, prior to December 31, 2026 (“Tungsten Mountain Target Flip Date”), the Company’s wholly-owned subsidiary, Ormat Nevada Inc. ("Ormat Nevada"), receives substantially all of the distributable cash flow generated by the project, while the private investor receives substantially all of the tax attributes of the project. Following the later of the Tungsten Mountain Target Flip Date and the date on which the private investor reaches its target return, Ormat Nevada will receive 97.5% of the distributable cash and 95.0% of the taxable income, on a go forward basis. In the event that the private investor will not reach its target return by the Tungsten Mountain Target Flip Date, then for the period between the Tungsten Mountain Target Flip Date and the date on which the private investor reaches its target return, the private investor will receive 100% of the distributable cash generated by the power plant and 99% of the tax attributes as long as the project is generating PTCs (and 5% of the tax attributes afterwards).
On the Tungsten Mountain Target Flip Date, Ormat Nevada has the option to purchase the private investor’s interests at the then-current fair market value, plus an amount that causes the private investor to reach its target return, if needed. If Ormat Nevada exercises this purchase option, it will become the sole owner of the project again.
ORMAT TECHNOLOGIES, INC. AND SUBSIDIARIES
NOTES TO CONSOLIDATED FINANCIAL STATEMENTS
Opal Geo Transactiontax monetization transaction
On December 16, 2016, Ormat Nevada entered into an equity contribution agreement (the “Equity Contribution Agreement”) with OrLeaf LLC (“OrLeaf”) and JPM with respect to Opal Geo. Also on December 16, 2016, OrLeaf, a newly formed limited liability company formed by Ormat Nevada and ORPD LLC, entered into an amended and restated limited liability company agreement of Opal Geo (the “LLC Agreement”) with JPM. The transactions contemplated by the Equity Contribution Agreement and LLC Agreement will allow the Company to monetize federal PTCs and certain other tax benefits relating to the operation of five geothermal power plants located in Nevada.Nevada, until JPM reaches its target internal rate of return which was expected to be on December 31, 2022. On December 22, 2022, the Equity Contribution Agreement was amended (the "Amendment") and the target internal rate of return date was postponed by an additional one year in order to allow allocation of additional PTCs to JPM, as further described below.
In connection with the transactions contemplated by the Equity Contribution Agreement and the LLC Agreement, Ormat Nevada transferred its indirect ownership interest in the McGinness Hills (Phase I and Phase II), Tuscarora, Jersey Valley and second phase of the Don A. Campbell (“DAC 2”) geothermal power plants to Opal Geo. Prior to such transfer, Ormat Nevada held an approximately 63.25% indirect ownership interest in DAC 2 through ORPD LLC, a joint venture between Ormat Nevada and Northleaf Geothermal Holdings LLC (“Northleaf”), an affiliate of Northleaf Capital Partners, and held, directly or indirectly, a 100% ownership interest in the remaining geothermal power plants that were transferred to Opal Geo.
Pursuant to the Equity Contribution Agreement, in December 2016, JPM contributed approximately $62.1 million to Opal Geo in exchange for 100% of the Class B Membership Interests of Opal Geo. JPM also agreed to make deferred capital contributions to Opal Geo based on the amount of electricity generated by the DAC 2 and McGinness Hills Phase II power plants which are eligible for the federal PTC. The Company expects the aggregate amount of JPM’ssuch contributions totaled $15.3 million, as of December 31, 2022. Pursuant to the Amendment, JPM will not make additional deferred capital contributions to equal approximately $21 millionduring 2023, and to be paid over time covering the period throughCompany will indemnify JPM for tax losses incurred during the extended December 31, 2022.one year period.
Under the original LLC Agreement, until December 31, 2022, OrLeaf will receivereceived distributions of 97.5% of any distributable cash generated by operation of the power plants while JPM will receivereceived distributions of 2.5% of any distributable cash generated by operation of the power plants. Unless JPM has already achieved its target internal rate of return on its investment in Opal Geo, fromStarting December 31, 2022, until JPM has achieved its target internal rate of return, JPM will receive 100% of any distributable cash generated by operation of the power plants. Thereafter, OrLeaf will receive distributions of 97.5%, and JPM will receive 2.5%, of any distributable cash generated by operation of the power plants.
Under the LLC Agreement, all items of Opal Geo income and loss, gain, deduction and credit (including the federal production tax credits relating to the operation of the two PTC eligible power plants) will be allocated, until JPM has achieved its target internal rate of return on its investment in Opal Geo (and for so long as the two PTC eligible power plants are generating PTCs), 99% to JPM and 1% to OrLeaf, or 5% to JPM and 95% to OrLeaf if PTCs are no longer available to either of the two PTC eligible power plants. Once JPM achieves its target internal rate of return, all items of Opal Geo income and loss, gain, deduction and credit will be allocated 5% to JPM and 95% to OrLeaf.
Under the LLC Agreement, OrLeaf, which owns 100% of the Class A Membership Interests in Opal Geo, will serveserves as the managing member of Opal Geo and control the day-to-day management of Opal Geo and its portfolio of five power plants. However, in certain limited circumstances (such as bankruptcy of Orleaf,OrLeaf, fraud or gross negligence by OrLeaf) JPM may remove OrLeaf as the managing member of Opal Geo. JPM, as the Class B Member of Opal Geo, has consent and approval rights with respect to certain items that are designated as major decisions for Opal Geo and the five power plants. In addition, by virtue of certain provisions in OrLeaf’s own limited liability company agreement, and consistent with the ORPD LLC formation documents, Northleaf has similar consent and approval rights with respect to OrLeaf’s determination of major decisions pertaining to the DAC 2 power plant. In both cases, these major decisions are generally equivalent to customary minority protection rights. As a result, the Company’s wholly owned subsidiary, Ormat Nevada, which serves as the managing member of OrLeaf and as the managing member of ORPD LLC, will effectively retainretains the day-to-day control and management of Opal Geo and its portfolio of five power plants.
The LLC Agreement contains certain customary restrictions on transfer applicable to both OrLeaf and JPM with respect to their respective Membership Interests in Opal Geo, and also provides OrLeaf with a right of first offer in the event JPM desires to transfer any of its Class B Membership Interests, pursuant to which OrLeaf may purchase such Class B Membership Interests. TheFollowing the Amendment to the LLC Agreement also providesmade on December 22, 2022, the Target Flip Date was extended to December 31, 2023, entitling JPM to receive $2.0 million on such date. During the extended period, JPM shall not be required to make deferred contributions. The OrLeaf with the option to purchase all of the Class B Membership Interests on either December 31, 2022 or the date that is 9 years after the closing date under the Equity Contribution Agreement at a price equal to the greater of (i) the fair market value of the Class B Membership Interests as of the date of purchase (subject to certain adjustments) and (ii) $3 million.$3.0 million, was extended to December 31, 2023. The final settlement of amounts due and payable to JPM shall take place during the first quarter of 2024.
ORMAT TECHNOLOGIES, INC. AND SUBSIDIARIES
NOTES TO CONSOLIDATED FINANCIAL STATEMENTS
Pursuant to the Equity Contribution Agreement, the Company has provided a guaranty for the benefit of JPM of certain of OrLeaf’s indemnification obligations to JPM under the LLC Agreement. In addition, Ormat Nevada also provided a guaranty for the benefit of JPM of all present and future payment and performance obligations of OrLeaf under the LLC Agreement and each ancillary document to which OrLeaf is a party.
JPM’s approximately $62.1 million capital contribution to Opal Geo was recorded as a $3.7 million allocation to noncontrolling interests and a $58.5 million allocation to liability associated with sale of tax benefits as described in Note 1. JPM also agreed to make deferred capital contributions to Opal Geo based on the amount of electricity generated by the DAC 2 and McGinness Hills Phase II power plants which are eligible for the federal PTC.
NOTE1413 — ASSET RETIREMENT OBLIGATION
The following table presents a reconciliation of the beginning and ending aggregate carrying amount of asset retirement obligation for the years presented below:
| | | Year Ended December 31, | | | Year Ended December 31, | |
| | | 2020 | | | 2019 | | | 2023 | | | 2022 | | | 2021 | |
| | | (Dollars in thousands) | | | (Dollars in thousands) | |
Balance at beginning of year | | $ | 50,183 | | | $ | 39,475 | | | $ | 97,660 | | | $ | 84,891 | | | $ | 63,457 | |
Revision in estimated cash flows | | (165 | ) | | (335 | ) | | 2,056 | | | (1,802 | ) | | 10,504 | |
Liabilities incurred and acquired | | 10,207 | | | 8,334 | | | 8,490 | | | 9,314 | | | 6,953 | |
Accretion expense | | | 3,232 | | | | 2,709 | | | | 6,164 | | | | 5,257 | | | | 3,977 | |
Balance at end of year | | $ | 63,457 | | | $ | 50,183 | | | $ | 114,370 | | | $ | 97,660 | | | $ | 84,891 | |
NOTE 1514 — STOCK-BASED COMPENSATION
The Company makes an estimate of expected forfeitures and recognizes compensation costs only for those stock-based awards expected to vest. As of December 31, 2020,2023, the total future compensation cost related to unvested stock-based awards that are expected to vest is $18.0$15.8 million, which will be recognized over a weighted average period of 1.31.25 years.
During the years ended December 31, 2020,2023, 20192022 and 2018,2021, the Company recorded compensation related to stock-based awards as follows:
| | | Year Ended December 31, | | | Year Ended December 31, | |
| | | 2020 | | | 2019 | | | 2018 | | | 2023 | | | 2022 | | | 2021 | |
| | | (Dollars in thousands) | | | (Dollars in thousands) | |
Cost of revenues | | $ | 4,435 | | | $ | 3,633 | | | $ | 3,488 | | | $ | 6,899 | | | $ | 6,382 | | | $ | 4,656 | |
Selling and marketing expenses | | 1,081 | | | 916 | | | 792 | | | 866 | | | 1,230 | | | 766 | |
Research and development expenses | | | 94 | | | — | | | — | |
General and administrative expenses | | | 4,314 | | | | 4,810 | | | | 5,938 | | | | 7,620 | | | | 4,034 | | | | 3,746 | |
Total stock-based compensation expense | | 9,830 | | | 9,359 | | | 10,218 | | | 15,479 | | | 11,646 | | | 9,168 | |
Tax effect on stock-based compensation expense | | | 858 | | | | 736 | | | | 668 | | | | 1,598 | | | | 1,270 | | | | 872 | |
Net effect of stock-based compensation expense | | $ | 8,972 | | | $ | 8,623 | | | $ | 9,550 | | | $ | 13,881 | | | $ | 10,376 | | | $ | 8,296 | |
During the fourth quarter of 2020,2023, 20192022 and 2018,2021, the Company evaluated the trends the employees stock-based award forfeiture rate and determined that the actual rates are 10.8%11.6%, 10.7%11.5% and 5.3%11.1%, respectively. This represents an increase of 0.7%0.9%, an increase of 101.9%3.6%, and an increase of 381.8%2.8%, respectively, from prior estimates. As a result of the change in the estimated forfeiture rate, there was an immaterial impact on stock-based compensation expense for each of the respective periods.
ORMAT TECHNOLOGIES, INC. AND SUBSIDIARIES
NOTES TO CONSOLIDATED FINANCIAL STATEMENTS
Valuation assumptions
The Company estimates the fair value of the stock-based awards using the Complex Lattice, Tree-based option-pricing model. The dividend yield forecast is expected to be at least 20% of the Company’s yearly net profit, which is equivalent to a 0.6% yearly weighted average dividend rate in the year ended December 31, 2020.2023. The risk-free interest rate was based on the yield from U.S. constant treasury maturities bonds with an equivalent term. The forfeiture rate is based on trends in actual stock-based awards forfeitures.
The Company calculated the fair value of each stock-based award on the date of grant based on the following assumptions:
| | | Year Ended December 31, | | | Year Ended December 31, | |
| | | 2020 | | | 2019 | | | 2018 | | | 2023 | | | 2022 | | | 2021 | |
For stock based awards issued by the Company: | | | | | | | | |
Risk-free interest rates | | 0.4 | % | | 1.8 | % | | 2.8 | % | | 4.2 | % | | 1.7 | % | | 0.7 | % |
Expected lives (in weighted average years) | | 5.8 | | | 3.5 | | | 3.5 | | | 2.5 | | | 5.3 | | | 3.8 | |
Dividend yield | | 0.6 | % | | 0.7 | % | | 0.9 | % | | 0.6 | % | | 0.7 | % | | 0.6 | % |
Expected volatility (weighted average) | | 28.8 | % | | 25.1 | % | | 25.5 | % | | 38.2 | % | | 34.6 | % | | 36.7 | % |
The Company estimated the forfeiture rate (on a weighted average basis) as follows:
| | | Year Ended December 31, | |
| | | 2020 | | | 2019 | | | 2018 | |
Weighted average forfeiture rate | | | 8.2 | % | | | 8.6 | % | | | 3.1 | % |
| | | Year Ended December 31, | |
| | | 2023 | | | 2022 | | | 2021 | |
Weighted average forfeiture rate | | | 8.0 | % | | | 10.2 | % | | | 6.1 | % |
Stock-based awards
The 2012 Incentive Compensation Plan
In May 2012, the Company’s shareholders adopted the 2012 Incentive Plan, which provides for the grant of the following types of awards: incentive stock options, non-qualified stock options, restricted stock units ("RSUs"), stock appreciation rights ("SARs”), stock units, performance awards, phantom stock, incentive bonuses, and other possible related dividend equivalents to employees of the Company, directors and independent contractors. Under the 2012 Incentive Plan, a total of 4,000,000 shares of the Company’s common stock were reserved for issuance, all of which could be issued as options or as other forms of awards. Options and SARs granted to employees under the 2012 Incentive Plan typically vest and become exercisable as follows: 50% on the secondtwo year anniversary of the grant date and 25% on each of the thirdthree year and fourthfour year anniversaries of the grant date. Options granted to non-employee directors under the 2012 Incentive Plan will vest and become exercisable one year after the grant date. Restricted stock units granted to directors and members of senior management vest according to a vesting schedule as follows: for the directors, 100% on the firstone year anniversary of the grant date and for members of senior management, 25% on each of the first, second, third and fourth anniversaries of the grant date. The term of stock-based awards typically ranges from six to ten years from the grant date. The shares of common stock issued in respect of awards under the 2012 Incentive Plan are issued from the Company’s authorized share capital upon exercise of options or SARs. The 2012 Incentive Plan expired in May 2018 upon adoption of the 2018 Incentive Compensation Plan (“2018 Incentive Plan”), except as to stock-based awards outstanding under the 2012 Incentive Plan on that date.
ORMAT TECHNOLOGIES, INC. AND SUBSIDIARIES
NOTES TO CONSOLIDATED FINANCIAL STATEMENTS
The 2018 Incentive Compensation Plan
In May 2018, the Company held its 2018 Annual Meeting of Stockholders at which the Company's stockholders approved the 2018 Incentive Plan. The 2018 Incentive Plan provides for the grant of the following types of awards: incentive stock options, RSUs, SARs, Performance Stock Units ("PSUs"), stock units, performance awards, phantom stock, incentive bonuses and other possible related dividend equivalents to employees of the Company, directors and independent contractors. Under the 2018 Incentive Plan, a total of 5,000,000 shares of the Company’s common stock were authorized and reserved for issuance, all of which could be issued as options or as other forms of awards. SARs, RSUs and PSUs granted to employees under the 2018 Incentive Plan typically vest and become exercisable as follows: 50% on the second anniversary of the grant date and 25% on each of the third and fourth anniversaries of the grant date. SARs, RSUs and PSUs granted to directors under the 2018 Incentive Plan typically vest and become exercisable (100%) on the first anniversary of the grant date. The term of stock-based awards typically ranges from six to ten years from the grant date. The shares of common stock issued in respect of awards under the 2018 Incentive Plan are issued from the Company’s authorized share capital upon exercise of options or SARs. In June 2022, the 2018 Incentive Compensation Plan was amended and restated to increase the number of shares authorized for issuance by 1,700,000 shares, to change the fungible ratio, and to implement a one year mandatory minimum vesting period.
ORMAT TECHNOLOGIES, INC. AND SUBSIDIARIES
NOTES TO CONSOLIDATED FINANCIAL STATEMENTS
OnAs of December 31, 2020,2023, 3,313,670 shares of the Company’s common stock are available for future grants under the 2018 Incentive Plan.
In March 2023, the Company granted certain members of its management and employees an aggregate of 573 Stock Appreciation Rights ("SARs"), 2,103 Restricted Stock Units ("RSUs")174,422 RSUs and 1,952 Performance Stock Units ("PSUs")35,081 PSUs under the Company’s 2018 Incentive Compensation Plan. The exercise priceRSUs and PSUs have vesting periods of each SAR was $90.28 which represented the fair market value of the Company’s common stock onbetween 1 to 4 years from the grant date. The SARs will expire six years from date of the grant and the SARs, RSUs and PSUs have a vesting period of between 2 to 4 years from the grant date.
The average fair value of each SAR, RSU and PSU on the grant date was $25.50, $89.15$79.9 and $96.10,$79.6, respectively. The Company calculated the fair value of each SARRSU and PSU on the grant date using the Complex Lattice, Tree-based option-pricing model based on the following assumptions:
Risk-free interest rates | 3.86% | — | 4.68% |
Expected life (in years) | 2 | — | 5.75 |
Dividend yield | 0.59% |
Expected volatility (weighted average) | 36.0% | — | 42.2% |
In May 2023, the Company granted its directors an aggregate of 10,852 RSUs under the Company’s 2018 Incentive Compensation Plan. The RSUs have vesting periods 1 year from the grant date. The fair value of each RSU on the grant date was $82.9. The Company calculated the fair value of each RSU and PSU on the grant date using the complex lattice, tree-based option-pricing model based on the following assumptions:
Risk-free interest rates | | | 0.13% | - | 0.51% | |
Expected life (in years) | | | 2 | - | 6 | |
Dividend yield | | | | 0.61% | | |
Expected volatility (weighted average) | | | 37.68% | - | 30.15% | |
Risk-free interest rates | | | 4.70% | |
Expected life (in years) | | | 1% | |
Dividend yield | | | 0.56% | |
Expected volatility (weighted average) | | | 34.80% | |
On November 30,2022, the Company granted certain employees an aggregate of 19,750 RSUs under the Company’s 2018 Incentive Plan. The RSUs have a vesting period of between 2 to 3 2020, years from the grant date. The fair value of each RSU on the grant date was $89. The Company calculated the fair value of each RSU on the grant date using the Complex Lattice, Tree-based option-pricing model based on the following assumptions:
Risk-free interest rates | 4.13% | — | (4.38)% |
Expected life (in years) | 2 | — | 3 |
Dividend yield | 0.56% |
Expected volatility (weighted average) | 43.17% | — | 40.57% |
On March 1, 2022, the Company granted somecertain directors, members of its directorsmanagement and employees an aggregate of 11,835513,385 SARs, 72,303 RSUs and 10,010 RSUs19,581 PSUs under the Company’s 2018 Incentive Plan. The exercise price of each SAR was $67.54$71.15 which represented the fair market value of the Company’s common stock on the grant date. The SARs will expire in six years from date of the grant and the SARs, RSUs and RSUsPSUs have a vesting period of between one2 yearto 4 years from the grant date.
The average fair value of each SAR, RSU and RSUPSU on the grant date was $18.25$22.3, $69.6 and $67.13,$75.3, respectively. The Company calculated the fair value of each SAR on the grant date using the complex lattice, tree-basedComplex Lattice, Tree-based option-pricing model based on the following assumptions:
Risk-free interest rates | | | 0.12% | - | 0.44% | |
Expected life (in years) | | | 1 | - | 6 | |
Dividend yield | | | | 0.61% | | |
Expected volatility (weighted average) | | | 45.2% | - | 29.4% | |
On May 12, 2020, the Company granted certain members of its management an aggregate of 46,795 SARs, 6,142 RSUs and 5,637 PSUs under the Company’s 2018 Incentive Plan. The exercise price of each SAR was $68.34 which represented the fair market value of the Company’s common stock on the grant date. The SARs will expire six years from date of grant and the SARs, RSUs and PSUs have a vesting period of between 2 to 4 years from the grant date.
The fair value of each SAR, RSU and PSU on the grant date was $17.6, $67.2 and $73.2, respectively. The Company calculated the fair value of each SAR on the grant date using the complex lattice, tree-based option-pricing model based on the following assumptions:
Risk-free interest rates | | | 0.44% | | | 1.31% | — | 1.62% |
Expected life (in years) | | 2 | - | 6 | | 2 | — | 6 |
Dividend yield | | | 0.63% | | | 0.67% |
Expected volatility (weighted average) | | | 28.14% | | | 32.85% | — | 46.07% |
ORMAT TECHNOLOGIES, INC. AND SUBSIDIARIES
NOTES TO CONSOLIDATED FINANCIAL STATEMENTS
On June 15, 2020, the Company granted certain directors, members of its management and employees an aggregate of 852,475 SARs, 11,068 RSUs and 10,962 PSUs under the Company’s 2018 Incentive Plan. The exercise price of each SAR was $69.14 which represented the fair market value of the Company’s common stock on the grant date. The SARs will expire six years from date of grant, except for 1,156 SARs which will expire in 5 months from the grant date, and the SARs, RSUs and PSUs have a vesting period of between 2 to 4 years from the grant date.
The fair value of each SAR, RSU and PSU on the grant date was $18.0, $68.0 and $65.0, respectively. The Company calculated the fair value of each SAR on the grant date using the complex lattice, tree-based option-pricing model based on the following assumptions:
Risk-free interest rates | | | 0.44% | - | 0.28% | |
Expected life (in years) | | | 2 | - | 6 | |
Dividend yield | | | | 0.64% | | |
Expected volatility (weighted average) | | | 28.5% | - | 35.2% | |
On July 1, 2020, the Company granted its newly appointed CEO an aggregate of 45,365 SARs, 6,020 RSUs and 6,540 PSUs under the Company’s 2018 Incentive Plan. The exercise price of each SAR was $63.40 which represented the fair market value of the Company’s common stock on the grant date. The SARs will expire six years from date of grant and the SARs, RSUs and PSUs have a vesting period of between 2 to 4 years from the grant date.
The fair value of each SAR, RSU and PSU on the grant date was $16.5, $62.3 and $57.3, respectively. The Company calculated the fair value of each SAR on the grant date using the complex lattice, tree-based option-pricing model based on the following assumptions:
Risk-free interest rates | | | 0.41% | - | 0.17% | |
Expected life (in years) | | | 2 | - | 6 | |
Dividend yield | | | | 0.64% | | |
Expected volatility (weighted average) | | | 28.5% | - | 35.7% | |
On November 7, 2019,2021, the Company granted its directors an aggregate of 11,495 SARs and 9,42011,804 RSUs under the Company’s 2018 Incentive Plan. The exercise priceRSUs have a vesting period of each SAR was $76.87 which represented the fair market value of the Company’s common stock onone year from the grant date. The SARs will expire six years from date of grant and both the SARs and RSUs will fully vest on the first anniversary of the grant date.
Theaverage fair value of each SAR and RSU for the directors on the grant date was $19.8 and $76.4, respectively.$76.2. The Company calculated the fair value of each SARRSU on the grant date using the Exercise Multiple-BasedComplex Lattice, PricingTree-based option-pricing model based on the following assumptions:
Risk-free interest rate | | | 1.79% | | | |
Risk-free interest rates | | | 0.14% | — | (0.16)% |
Expected life (in years) | | 1 | - | 6 | | | | 1 | |
Dividend yield | | | 0.57% | | | | | 0.65% | |
Expected volatility | | | 24.80% | | | |
Expected volatility (weighted average) | | | | 43.26% | |
ORMAT TECHNOLOGIES, INC. AND SUBSIDIARIES
NOTES TO CONSOLIDATED FINANCIAL STATEMENTS
Information on the awards outstanding and the related weighted average exercise price as of and for the years ended December 31, 2020,2023, 20192022 and 20182021 are presented in the table below:
| | | Year Ended December 31, | | | Year Ended December 31, | |
| | | 2020 | | 2019 | | 2018 | | | 2023 | | | 2022 | | | 2021 | |
| | | Awards
(In thousands) | | Weighted
Average
Exercise
Price | | Awards
(In thousands) | | Weighted
Average
Exercise
Price | | Awards
(In thousands) | | Weighted
Average
Exercise
Price | | | Awards (In thousands) | | | Weighted Average Exercise Price | | | Awards (In thousands) | | | Weighted Average Exercise Price | | | Awards (In thousands) | | | Weighted Average Exercise Price | |
Outstanding at beginning of year | | 1,792 | | | $ | 50.39 | | | 2,527 | | | $ | 46.77 | | | 1,548 | | | $ | 41.35 | | | 1,810 | | | $ | 60.08 | | | 2,025 | | | $ | 58.70 | | | 2,240 | | | $ | 57.68 | |
Granted, at fair value: | | |
Granted: | | |
SARs (1) | | 957 | | | 68.82 | | | 38 | | | 69.13 | | | 1,172 | | | 53.87 | | | — | | | — | | | 513 | | | 71.15 | | | 15 | | | 77.22 | |
RSUs (2) | | 35 | | | 0 | | | 9 | | | 0 | | | 74 | | | 0 | | | 189 | | | — | | | 109 | | | — | | | 12 | | | — | |
PSUs (3) | | 25 | | | 0 | | | 0 | | | 0 | | | 0 | | | 0 | | | 35 | | | — | | | 20 | | | — | | | — | | | — | |
Exercised | | (469 | ) | | 45.71 | | | (711 | ) | | 37.83 | | | (203 | ) | | 29.75 | | | (492 | ) | | 56.00 | | | (728 | ) | | 52.73 | | | (159 | ) | | 40.47 | |
Forfeited | | (100 | ) | | 55.05 | | | (71 | ) | | 50.59 | | | (64 | ) | | 45.73 | | | (59 | ) | | 54.09 | | | (129 | ) | | 62.27 | | | (83 | ) | | 64.34 | |
Expired | | | 0 | | | 0 | | | | 0 | | | 0 | | | | 0 | | | 0 | | | | — | | | — | | | | — | | | — | | | | — | | | — | |
Outstanding at end of year | | | 2,240 | | | 57.68 | | | | 1,792 | | | 50.39 | | | | 2,527 | | | 46.77 | | | | 1,483 | | | 52.57 | | | | 1,810 | | | 60.08 | | | | 2,025 | | | 58.70 | |
Options and SARs exercisable at end of year | | | 704 | | | 51.64 | | | | 479 | | | 48.35 | | | | 846 | | | 42.06 | | | | 606 | | | 66.81 | | | | 749 | | | 58.30 | | | | 881 | | | 53.20 | |
Weighted-average fair value of awards granted during the year | | | | | $ | 20.84 | | | | | | $ | 29.24 | | | | | | $ | 16.45 | | | | | | $ | 79.98 | | | | | | $ | 33.02 | | | | | | $ | 46.23 | |
| (1) | Upon exercise, SARs entitle the recipient to receive shares of common stock equal to the increase in value of the award between the grant date and the exercise date. |
| (2) | An RSU represents the right to receive one share of common stock once certain vesting conditions are met. The value of an RSU is identical toapproximates the value of the underlying stock. |
| (3) | The Performance shares units shall be paid out based on achievement of three-year relative total stockholder return compared to other companies in the S&P 500 index.index or based on achievement of three-year megawatt COD production targets. |
ORMAT TECHNOLOGIES, INC. AND SUBSIDIARIES
NOTES TO CONSOLIDATED FINANCIAL STATEMENTS
As ofThe following table summarizes information about stock-based awards outstanding at December 31, 2020, 2023 (2,516,498 shares of the Company’s common stock are available for future grants under the 2018 Incentive Plan. NaN shares of the Company’s common stock are available for future grants under the 2012 Incentive Plan as of such date.in thousands):
| | | | | | Awards Outstanding | | | Awards Exercisable | |
| | Exercise Price | | | Number of Stock-based Awards Outstanding | | | Weighted Average Remaining Contractual Life in Years | | | Aggregate Intrinsic Value | | | Number of Stock-based Awards Exercisable | | | Weighted Average Remaining Contractual Life in Years | | | Aggregate Intrinsic Value | |
| | | | | | | | | | | | | | | | | | | | | | | | | | | | |
| | $ | — | | | | 345 | | | | 1.6 | | | $ | 26,127 | | | | | | | | | | | $ | — | |
| | | 51.71 | | | | 8 | | | | 1.0 | | | | 193 | | | | 8 | | | | 1.0 | | | | 193 | |
| | | 53.16 | | | | 3 | | | | 0.9 | | | | 73 | | | | 3 | | | | 0.9 | | | | 73 | |
| | | 53.44 | | | | 78 | | | | 0.5 | | | | 1,736 | | | | 78 | | | | 0.5 | | | | 1,736 | |
| | | 57.97 | | | | 8 | | | | 0.6 | | | | 134 | | | | 8 | | | | 0.6 | | | | 134 | |
| | | 63.40 | | | | 45 | | | | 2.5 | | | | 562 | | | | 34 | | | | 2.5 | | | | 422 | |
| | | 67.54 | | | | 7 | | | | 2.9 | | | | 54 | | | | 7 | | | | 2.9 | | | | 54 | |
| | | 68.34 | | | | 47 | | | | 2.4 | | | | 349 | | | | 35 | | | | 2.4 | | | | 261 | |
| | | 69.14 | | | | 470 | | | | 2.4 | | | | 3,128 | | | | 316 | | | | 2.4 | | | | 2,101 | |
| | | 71.15 | | | | 448 | | | | 4.2 | | | | 2,077 | | | | 101 | | | | 4.2 | | | | 468 | |
| | | 71.71 | | | | 4 | | | | 1.6 | | | | 16 | | | | 4 | | | | 1.6 | | | | 16 | |
| | | 76.43 | | | | 5 | | | | 1.9 | | | | — | | | | 5 | | | | 1.9 | | | | — | |
| | | 76.54 | | | | 9 | | | | 3.9 | | | | — | | | | 4 | | | | 3.9 | | | | — | |
| | | 78.53 | | | | 6 | | | | 3.3 | | | | — | | | | 3 | | | | 3.3 | | | | — | |
| | | 90.28 | | | | 1 | | | | 3.0 | | | | — | | | | — | | | | 3.0 | | | | — | |
| | | | | | | 1,483 | | | | 2.6 | | | $ | 34,449 | | | | 606 | | | | 2.4 | | | $ | 5,458 | |
The following table summarizes information about stock-based awards outstanding at December 31, 20202022 (shares in thousands):
| | | | | Awards Outstanding | | | Awards Exercisable | |
Exercise Price | | | Number of
Stock-based
Awards
Outstanding | | | Weighted
Average
Remaining
Contractual
Life in Years | | | Aggregate
Intrinsic Value | | | Number of
Stock-based
Awards
Exercisable | | | Weighted
Average
Remaining
Contractual
Life in Years | | | Aggregate
Intrinsic Value | |
| | | | | | | | | | | | | | | | | | | | | | | | | | | |
| $ | — | | | | 85 | | | | 2.1 | | | $ | 7,677 | | | | 0 | | | | — | | | $ | 0 | |
| | 42.87 | | | | 235 | | | | 1.5 | | | | 11,129 | | | | 235 | | | | 1.5 | | | | 11,129 | |
| | 47.46 | | | | 15 | | | | 2.9 | | | | 642 | | | | 15 | | | | 2.9 | | | | 642 | |
| | 51.71 | | | | 8 | | | | 4.0 | | | | 309 | | | | 0 | | | | 4.0 | | | | 0 | |
| | 53.16 | | | | 31 | | | | 3.9 | | | | 1,164 | | | | 21 | | | | 3.9 | | | | 792 | |
| | 53.44 | | | | 486 | | | | 3.5 | | | | 17,893 | | | | 129 | | | | 3.5 | | | | 4,719 | |
| | 55.16 | | | | 296 | | | | 2.9 | | | | 10,384 | | | | 213 | | | | 2.9 | | | | 7,484 | |
| | 57.97 | | | | 15 | | | | 3.6 | | | | 485 | | | | 15 | | | | 3.6 | | | | 485 | |
| | 58.79 | | | | 1 | | | | 1.5 | | | | 33 | | | | 0 | | | | 1.5 | | | | 0 | |
| | 63.35 | | | | 94 | | | | 2.9 | | | | 2,525 | | | | 68 | | | | 2.9 | | | | 1,843 | |
| | 63.40 | | | | 45 | | | | 5.5 | | | | 1,219 | | | | 0 | | | | 5.5 | | | | 0 | |
| | 67.54 | | | | 12 | | | | 5.9 | | | | 269 | | | | 0 | | | | 5.9 | | | | 0 | |
| | 68.34 | | | | 47 | | | | 5.4 | | | | 1,027 | | | | 0 | | | | 5.4 | | | | 0 | |
| | 69.14 | | | | 842 | | | | 5.4 | | | | 17,820 | | | | 0 | | | | 5.4 | | | | 0 | |
| | 71.71 | | | | 4 | | | | 4.6 | | | | 74 | | | | 0 | | | | 4.6 | | | | 0 | |
| | 72.14 | | | | 15 | | | | 4.7 | | | | 272 | | | | 0 | | | | 4.7 | | | | 0 | |
| | 76.43 | | | | 8 | | | | 4.9 | | | | 117 | | | | 8 | | | | 4.9 | | | | 117 | |
| | 90.28 | | | | 1 | | | | 2.8 | | | | 0 | | | | 0 | | | | 2.8 | | | | 0 | |
| | | | | | 2,240 | | | | 3.9 | | | $ | 73,039 | | | | 704 | | | | 2.6 | | | $ | 27,211 | |
ORMAT TECHNOLOGIES, INC. AND SUBSIDIARIES
NOTES TO CONSOLIDATED FINANCIAL STATEMENTS
The following table summarizes information about stock-based awards outstanding at December 31, 2019 (shares in thousands):
| | | | | Awards Outstanding | | | Awards Exercisable | |
Exercise Price | | | Number of
Stock-based
Awards
Outstanding | | | Weighted
Average
Remaining
Contractual
Life in Years | | | Aggregate
Intrinsic Value | | | Number of
Stock-based
Awards
Exercisable | | | Weighted
Average
Remaining
Contractual
Life in Years | | | Aggregate
Intrinsic Value | |
| | | | | | | | | | | | | | | | | | | | | | | | | | | |
| $ | — | | | | 59 | | | | 1.5 | | | $ | 4,369 | | | | 0 | | | | — | | | $ | 0 | |
| | 42.87 | | | | 427 | | | | 2.5 | | | | 13,517 | | | | 230 | | | | 2.5 | | | | 7,295 | |
| | 47.46 | | | | 15 | | | | 3.9 | | | | 406 | | | | 15 | | | | 3.9 | | | | 406 | |
| | 51.71 | | | | 8 | | | | 5.0 | | | | 182 | | | | 0 | | | | 0.0 | | | | 0 | |
| | 53.16 | | | | 35 | | | | 4.9 | | | | 756 | | | | 15 | | | | 4.9 | | | | 329 | |
| | 53.44 | | | | 783 | | | | 4.5 | | | | 16,498 | | | | 0 | | | | 0.0 | | | | 0 | |
| | 55.16 | | | | 296 | | | | 3.9 | | | | 5,724 | | | | 131 | | | | 3.9 | | | | 2,527 | |
| | 57.97 | | | | 30 | | | | 4.6 | | | | 497 | | | | 30 | | | | 4.6 | | | | 497 | |
| | 58.79 | | | | 12 | | | | 2.5 | | | | 187 | | | | 6 | | | | 2.5 | | | | 94 | |
| | 63.35 | | | | 98 | | | | 3.9 | | | | 1,094 | | | | 52 | | | | 3.9 | | | | 581 | |
| | 71.71 | | | | 4 | | | | 5.6 | | | | 11 | | | | 0 | | | | — | | | | 0 | |
| | 72.14 | | | | 15 | | | | 5.7 | | | | 36 | | | | 0 | | | | — | | | | 0 | |
| | 76.43 | | | | 10 | | | | 5.9 | | | | 0 | | | | 0 | | | | — | | | | 0 | |
| | | | | | | | | | | | | | | | | | | | | | | | | | | |
| | | | | | 1,792 | | | | 3.8 | | | $ | 43,277 | | | | 479 | | | | 3.2 | | | $ | 11,729 | |
| | | | | | Awards Outstanding | | | Awards Exercisable | |
| | Exercise Price | | | Number of Stock-based Awards Outstanding | | | Weighted Average Remaining Contractual Life in Years | | | Aggregate Intrinsic Value | | | Number of Stock-based Awards Exercisable | | | Weighted Average Remaining Contractual Life in Years | | | Aggregate Intrinsic Value | |
| | | | | | | | | | | | | | | | | | | | | | | | | | | | |
| | $ | — | | | | 157 | | | | 2.1 | | | $ | 13,536 | | | | — | | | | — | | | $ | — | |
| | | 51.71 | | | | 8 | | | | 2.0 | | | | 278 | | | | 6 | | | | 2.0 | | | | 209 | |
| | | 53.16 | | | | 3 | | | | 1.9 | | | | 108 | | | | 3 | | | | 1.9 | | | | 108 | |
| | | 53.44 | | | | 103 | | | | 1.5 | | | | 3,405 | | | | 103 | | | | 1.5 | | | | 3,405 | |
| | | 55.16 | | | | 295 | | | | 0.9 | | | | 9,236 | | | | 295 | | | | 0.9 | | | | 9,236 | |
| | | 57.97 | | | | 8 | | | | 1.6 | | | | 214 | | | | 8 | | | | 1.6 | | | | 214 | |
| | | 63.35 | | | | 74 | | | | 0.9 | | | | 1,719 | | | | 74 | | | | 0.9 | | | | 1,719 | |
| | | 63.40 | | | | 45 | | | | 3.5 | | | | 1,047 | | | | 23 | | | | 3.5 | | | | 524 | |
| | | 67.54 | | | | 7 | | | | 3.9 | | | | 125 | | | | 7 | | | | 3.9 | | | | 125 | |
| | | 68.34 | | | | 47 | | | | 3.4 | | | | 849 | | | | 23 | | | | 3.4 | | | | 424 | |
| | | 69.14 | | | | 539 | | | | 3.4 | | | | 9,357 | | | | 199 | | | | 3.4 | | | | 3,456 | |
| | | 71.15 | | | | 499 | | | | 5.2 | | | | 7,644 | | | | — | | | | 5.2 | | | | — | |
| | | 71.71 | | | | 4 | | | | 2.6 | | | | 59 | | | | 3 | | | | 2.6 | | | | 44 | |
| | | 76.43 | | | | 5 | | | | 2.9 | | | | 49 | | | | 5 | | | | 2.9 | | | | 49 | |
| | | 76.54 | | | | 9 | | | | 4.9 | | | | 85 | | | | — | | | | 4.9 | | | | — | |
| | | 78.53 | | | | 6 | | | | 4.3 | | | | 51 | | | | — | | | | 4.3 | | | | — | |
| | | 90.28 | | | | 1 | | | | 4.0 | | | | — | | | | — | | | | 4 | | | | — | |
| | | | | | | 1,810 | | | | 3.1 | | | $ | 47,762 | | | | 749 | | | | 1.8 | | | $ | 19,513 | |
The aggregate intrinsic value in the above tables represents the total pretax intrinsic value, based on the Company’s stock price of $90.28$75.79 and $74.52$86.48 as of December 31, 20202023 and 2019,2022, respectively, which would have potentially been received by the stock-based award holders had all stock-based award holders exercised their stock-based award as of those dates. The total number of in-the-money stock-based awards exercisable as of December 31, 20202023 and 20192022 was 704,169605,753 and 479,402,749,101, respectively.
ORMAT TECHNOLOGIES, INC. AND SUBSIDIARIES
NOTES TO CONSOLIDATED FINANCIAL STATEMENTS
The total pretax intrinsic value of options exercised during the year ended December 31, 20202023 and 20192022 was $11.0$11.5 million and $19.3$21.9 million, respectively, based on the average stock price of $69.2$79.4 and $65.04$82.8 during the years ended December 31, 20202023 and 2019,2022, respectively.
NOTE1615 — INTEREST EXPENSE, NET
The components of interest expense are as follows:
| | | Year Ended December 31, | |
| | | 2020 | | | 2019 | | | 2018 | |
| | | (Dollars in thousands) | |
Interest related to sale of tax benefits | | $ | 9,344 | | | $ | 11,786 | | | $ | 11,284 | |
Interest expense | | | 79,018 | | | | 71,883 | | | | 63,368 | |
Less — amount capitalized | | | (10,409 | ) | | | (3,285 | ) | | | (3,728 | ) |
| | | $ | 77,953 | | | $ | 80,384 | | | $ | 70,924 | |
ORMAT TECHNOLOGIES, INC. AND SUBSIDIARIES
NOTES TO CONSOLIDATED FINANCIAL STATEMENTS
| | | Year Ended December 31, | |
| | | 2023 | | | 2022 | | | 2021 | |
| | | (Dollars in thousands) | |
Interest related to sale of tax benefits | | $ | 15,289 | | | $ | 14,853 | | | $ | 12,246 | |
Interest expense | | | 100,853 | | | | 91,617 | | | $ | 84,994 | |
Less — amount capitalized | | | (17,261 | ) | | | (18,727 | ) | | $ | (14,582 | ) |
| | | $ | 98,881 | | | $ | 87,743 | | | $ | 82,658 | |
NOTE1716 — INCOME TAXES
U.S. and foreign components of income from continuing operations, before income taxes and equity in income (losses) of investees consisted of:
| | | Year Ended December 31, | | | Year Ended December 31, | |
| | | 2020 | | 2019 | | 2018 | | | 2023 | | 2022 | | 2021 | |
| | | (Dollars in thousands) | | | (Dollars in thousands) | |
U.S | | $ | 43,273 | | | $ | 14,187 | | | $ | 14,097 | | | $ | 53,984 | | | $ | 23,709 | | | $ | 37,032 | |
Non-U.S. (foreign) | | | 125,444 | | | | 123,116 | | | | 123,084 | | | | 85,101 | | | | 71,900 | | | | 66,519 | |
Total income from continuing operations, before income taxes and equity in losses | | $ | 168,717 | | | $ | 137,303 | | | $ | 137,181 | | | $ | 139,085 | | | $ | 95,609 | | | $ | 103,551 | |
The components of the provision (benefit) for income taxes, net are as follows:
| | | Year Ended December 31, | | | Year Ended December 31, | |
| | | 2020 | | 2019 | | 2018 | | | 2023 | | 2022 | | 2021 | |
| | | (Dollars in thousands) | | | (Dollars in thousands) | |
Current: | | | | | | | | |
Federal | | $ | 0 | | | $ | 0 | | | $ | 0 | | | $ | 672 | | | $ | 641 | | | $ | — | |
State | | 363 | | | 172 | | | 381 | | | (1,806 | ) | | 2,227 | | | 400 | |
Foreign | | | 61,574 | | | | 16,969 | | | | 14,992 | | | | 35,379 | | | | 29,370 | | | | 25,096 | |
Total current income tax expense | | $ | 61,937 | | | $ | 17,141 | | | $ | 15,373 | | | $ | 34,245 | | | $ | 32,238 | | | $ | 25,496 | |
| | | |
Deferred: | | | | | | | | |
Federal | | 22,682 | | | (12,179 | ) | | (6,886 | ) | | (12,780 | ) | | (17,179 | ) | | (3,267 | ) |
State | | 7,277 | | | 4,671 | | | (2,595 | ) | | 6,041 | | | 2,649 | | | 9,301 | |
Foreign | | | (24,893 | ) | | | 35,980 | | | | 28,841 | | | | (21,523 | ) | | | (2,966 | ) | | | (6,680 | ) |
Total deferred tax provision (benefit) | | | 5,066 | | | | 28,472 | | | | 19,360 | | | | (28,262 | ) | | | (17,496 | ) | | | (646 | ) |
Total Income tax provision | | $ | 67,003 | | | $ | 45,613 | | | $ | 34,733 | | | $ | 5,983 | | | $ | 14,742 | | | $ | 24,850 | |
ORMAT TECHNOLOGIES, INC. AND SUBSIDIARIES
NOTES TO CONSOLIDATED FINANCIAL STATEMENTS
Reconciliation of the U.S. federal statutory tax rate to the Company’s effective income tax rate is as follows:
| | | Year Ended December 31, | |
| | | 2023 | | | 2022 | | | 2021 | |
U.S. federal statutory tax rate | | | 21.0 | % | | | 21.0 | % | | | 21.0 | % |
Foreign tax credits | | | (3.8 | ) | | | (3.8 | ) | | | (0.4 | ) |
Withholding tax | | | 1.0 | | | | 0.2 | | | | 6 | |
Valuation allowance - U.S. | | | — | | | | (9.3 | ) | | | (10.4 | ) |
State income tax, net of federal benefit | | | 2.4 | | | | 5.3 | | | | 8.8 | |
Uncertain tax positions | | | 1.5 | | | | 0.9 | | | | 3.6 | |
Foreign tax rate change | | | (5.7 | ) | | | — | | | | — | |
Effect of foreign income tax, net | | | 0.4 | | | | 6.2 | | | | (5.2 | ) |
Production tax credits | | | — | | | | (4.0 | ) | | | (4.2 | ) |
Investment tax credits | | | (14.0 | ) | | | — | | | | — | |
Tax on global intangible low-tax income | | | 4.1 | | | | 4.8 | | | | 9.3 | |
Noncontrolling interest | | | (1.0 | ) | | | (2.2 | ) | | | (2.5 | ) |
Other, net | | | (1.6 | ) | | | (3.7 | ) | | | (1.9 | ) |
Effective tax rate | | | 4.3 | % | | | 15.4 | % | | | 24.0 | % |
| | | Year Ended December 31, | |
| | | 2020 | | | 2019 | | | 2018 | |
U.S. federal statutory tax rate | | | 21.0 | % | | | 21.0 | % | | | 21.0 | % |
Impact of federal tax reform | | | 0 | | | | 0 | | | | 2.6 | |
Transition tax inclusion | | | — | | | | 0 | | | | (5.7 | ) |
Foreign tax credits | | | (0.3 | ) | | | (22.8 | ) | | | (4.2 | ) |
Withholding tax | | | 4.4 | | | | 10.4 | | | | 5.9 | |
Valuation allowance - U.S. | | | 3.0 | | | | (3.7 | ) | | | (17.2 | ) |
State income tax, net of federal benefit | | | 3.8 | | | | 3.7 | | | | 1.0 | |
Uncertain tax positions | | | (7.5 | ) | | | 2.1 | | | | 2.1 | |
Effect of foreign income tax, net | | | 8.5 | | | | 9.7 | | | | 5.6 | |
Production tax credits | | | (1.8 | ) | | | (5.0 | ) | | | (3.1 | ) |
Subpart F income | | | 0.2 | | | | 0.5 | | | | 0.5 | |
Tax on global intangible low-tax income | | | 11.1 | | | | 16.9 | | | | 18.6 | |
Intra-entity transfers of assets other than inventory | | | (0.4 | ) | | | 0.3 | | | | (2.1 | ) |
Noncontrolling interest | | | (1.6 | ) | | | (0.4 | ) | | | (1.5 | ) |
Other, net | | | (0.7 | ) | | | 0.5 | | | | 1.8 | |
Effective tax rate | | | 39.7 | % | | | 33.2 | % | | | 25.3 | % |
ORMAT TECHNOLOGIES, INC. AND SUBSIDIARIES
NOTES TO CONSOLIDATED FINANCIAL STATEMENTS
The net deferred tax assets and liabilities consist of the following:
| | | December 31, | | | December 31, | |
| | | 2020 | | 2019 | | | 2023 | | 2022 | |
| | | (Dollars in thousands) | | | (Dollars in thousands) | |
Deferred tax assets (liabilities): | | |
Net foreign deferred taxes, primarily depreciation | | $ | (66,452 | ) | | $ | (88,508 | ) | | $ | (27,623 | ) | | $ | (49,295 | ) |
Depreciation | | (23,835 | ) | | (21,958 | ) | | 40,993 | | | 50,214 | |
Intangible drilling costs | | (6,689 | ) | | (1,405 | ) | | (17,543 | ) | | (13,855 | ) |
Net operating loss carryforward - U.S. | | 35,346 | | | 45,307 | | | 24,822 | | | 26,824 | |
Tax monetization transaction | | (46,449 | ) | | (30,964 | ) | | (125,462 | ) | | (84,585 | ) |
Right-of-use assets | | (3,753 | ) | | (3,715 | ) | | (5,218 | ) | | (5,824 | ) |
Lease liabilities | | 3,846 | | | 3,755 | | | 5,105 | | | 5,527 | |
State and Investment tax credits | | 813 | | | 813 | | |
Production tax credits | | 103,592 | | | 100,524 | | | 109,556 | | | 109,109 | |
Foreign tax credits | | 92,077 | | | 92,497 | | | 33,412 | | | 32,333 | |
Withholding tax | | (12,416 | ) | | (15,539 | ) | | (20,437 | ) | | (21,007 | ) |
Stock options amortization | | 1,510 | | | 1,409 | | |
Basis difference in partnership interest | | (41,818 | ) | | (39,622 | ) | | (12,448 | ) | | (51,392 | ) |
Excess business interest | | 10,971 | | | 6,189 | | | 6,162 | | | 522 | |
Sale and leaseback transaction | | | 58,608 | | | 62,939 | |
Other assets | | | 12,404 | | | 13,655 | |
Accrued liabilities and other | | | 6,777 | | | 1,013 | | | | 6,361 | | | 5,208 | |
| Total | | 53,520 | | | 49,796 | | | 88,692 | | | 80,373 | |
Less - valuation allowance | | | (22,193 | ) | | (17,412 | ) | | | (2,870 | ) | | (2,473 | ) |
Total, net | | $ | 31,327 | | | $ | 32,384 | | | $ | 85,822 | | | $ | 77,900 | |
The following table presents a reconciliation of the beginning and ending valuation allowance:
| | | 2020 | | 2019 | | | 2023 | | 2022 | |
| | | (Dollars in thousands) | | | (Dollars in thousands) | |
Balance at beginning of the year | | $ | 17,412 | | | $ | 22,441 | | | $ | 2,473 | | | $ | 11,298 | |
Additions to valuation allowance | | 20,214 | | | 15,437 | | | 479 | | | 35 | |
Release of valuation allowance | | | (15,433 | ) | | (20,466 | ) | | | (82 | ) | | (8,860 | ) |
Balance at end of the year | | $ | 22,193 | | | $ | 17,412 | | | $ | 2,870 | | | $ | 2,473 | |
ORMAT TECHNOLOGIES, INC. AND SUBSIDIARIES
NOTES TO CONSOLIDATED FINANCIAL STATEMENTS
At December 31, 2020,2023, the Company had U.S. federal net operating loss (“NOL”) carryforwards of approximately $72.7$35.4 million, all of this amount, $67.9 millionwhich was generated before 2018 and expires between 2032 and 2037. The remaining $4.8 million was generated afterby 20172038. and is available to be carried forward for an indefinite period.
At December 31, 2020,2023, the Company had production tax credits (“PTCs")PTCs in the amount of $103.6 million.$109.6 million . These PTCs are available for a 20-year20 years period and begin to expire betweenin 2022 and 2039.2026. At December 31, 2020,2023, the Company had U.S. foreign tax credits (“FTCs”) in the amount of $92.1$33.4 million. These FTCs are available for a 10-year10 year period and begin to expire in 2022.2027.
ORMAT TECHNOLOGIES, INC. AND SUBSIDIARIES
NOTES TO CONSOLIDATED FINANCIAL STATEMENTS
At December 31, 2020,2023, the Company had state NOL carryforwards of approximately $289.9$268.0 million, $287.3$268.3 million which expire between 2025 and 20402034 and $2.6$4.7 million are available to be carried forward for an indefinite period. At December 31, 2020,2023, the Company had state tax credits in the amount of $1.0$0.8 million. These state tax credits are available to be carried forward for an indefinite period.
The Company has recorded deferred tax assets for net operating losses, foreign tax credits, and production tax credits. Realization of the deferred tax assets and tax credits is dependent on generating sufficient taxable income in appropriate jurisdictions prior to expiration of the NOL carryforwards and tax credits. Based upon available evidence of the Company’s ability to generate additional taxable income in the future and historical losses in prior years, a valuation allowance in the amount of $22.2$2.9 million and $17.4$2.5 million is recorded against the U.S. deferred tax assets as of December 31, 20202023 and 2019,2022, respectively, as it is more likely than not that the deferred tax assets will not be realized. The overall increasedecrease in the valuation allowance of $4.8$0.4 million is due to an increased valuation allowance related to foreignchanges in state tax credits and capital loss carryover, partially offset by a valuation allowance release related to expected full utilization of U.S. production tax credits.apportionment rates in various states. The Company is maintaining a valuation allowance of $22.2$2.9 million against a portion of the U.S. foreign tax credit,its state NOLs and capital loss carryforward and state NOLs that are expected to expire before they can be utilized in future periods.
On April 24, 2018, the Company acquired 100% of stock of USG for approximately $110 million. Under the acquisition method of accounting, the Company recorded a net deferred tax asset of $1.7 million comprised primarily of federal and state NOLs netted against deferred tax liabilities for partnership basis differences and fixed assets. The total amount of acquired federal and state NOLs, which are subject to limitations under Section 382, were $115.2$113.9 million and $49.9 million, respectively. A valuation allowance of $2.1$1.8 million has been recorded against such acquired state NOLs, as it is more likely than not that the deferred tax asset will not be realized.
The FASB released guidance Staff Q&A, Topic 740, No. 5, that states a company can make an accounting policy election to either recognize deferred taxes related to GILTI or to provide for the GILTI tax expense in the year the tax is incurred as a period cost. The Company has elected to treat any GILTI inclusions as a period cost. We have elected and applied the tax law ordering approach when considering GILTI as part of our valuation allowance.
The Company uses the flow-through method to account for investment tax credit earned on eligible battery storage projects. Under this method, the investment tax credits are recognized as a reduction to income tax expense in the year they are earned rather than a reduction in the asset basis.
The following table presents the deferred taxes on the balance sheet as of the dates indicated:
| | | Year Ended December 31, | | | Year Ended December 31, | |
| | | 2020 | | | 2019 | | | 2023 | | | 2022 | |
| | | (Dollars in thousands) | | | (Dollars in thousands) | |
| | | |
Non-current deferred tax assets | | $ | 119,299 | | | $ | 129,510 | | | $ | 152,570 | | | $ | 161,365 | |
Non-current deferred tax liabilities | | | (87,972 | ) | | | (97,126 | ) | | | (66,748 | ) | | | (83,465 | ) |
Non-current deferred tax assets, net | | 31,327 | | | 32,384 | | | 85,822 | | | 77,900 | |
Uncertain tax benefit offset (1) | | | (95 | ) | | | (95 | ) | | | (95 | ) | | | (95 | ) |
| | | $ | 31,232 | | | $ | 32,289 | | | $ | 85,727 | | | $ | 77,805 | |
(1) The non-current deferred tax asset has been reduced by the uncertain tax benefit of $0.1 million in accordance with ASU 2013-11, Income Taxes.
At December 31, 2020, the Company is no indefinitely reinvested with respect to the earnings of its foreign subsidiaries due to forecasted changes in cash needs and the impact of U.S. tax reform. The Company has accrued withholding taxes that would be owed upon future distributions of such earnings, with the exception of a certain balance of earnings held in Israel. Accordingly, during 2020, the Company has accrued $10.5 million of foreign withholding taxes on future distributions of foreign earnings.
At December 31, 2019,2023, the Company is no longer indefinitely reinvested with respect to the earnings of its foreign subsidiaries due to forecasted changes in cash needs and the impact of U.S. tax reform. The Company has accrued withholding taxes that would be owed upon future distributions of such earnings, with the exceptionearnings. Accordingly, as of a certain balance of earnings held in Israel. Accordingly, during 2019,December 31, 2023, the Company has accrued $13.9$15.5 million of foreign withholding taxes on future distributions of foreign earnings.
ORMAT TECHNOLOGIES, INC. AND SUBSIDIARIES
NOTES TO CONSOLIDATED FINANCIAL STATEMENTS
Uncertain tax positions
The Company is subject to income taxes in the United States (federal and state) and numerous foreign jurisdictions. Significant judgment is required in evaluating the Company's tax positions and determining its provision for income taxes. During the ordinary course of business, there are many transactions and calculations for which the ultimate tax determination is uncertain. The Company establishes reserves for tax-related uncertainties based on estimates of whether, and the extent to which additional taxes will be due. These reserves are established when the Company believes that certain positions might be challenged despite evidence supporting the position. The Company adjusts these reserves in light of changing facts and circumstances, such as the outcome of tax audits. The provision for income taxes includes the impact of reserve positions and changes to reserves that are considered probable.
At December 31, 20202023 and 2019,2022, there are $2.0$8.7 million and $14.6$6.6 million of unrecognized tax benefits, respectively, that if recognized would reduce the effective tax rate .rate. Interest and penalties assessed by taxing authorities on an underpayment of income taxes are included as a component of income tax provision in the consolidated statements of operations and comprehensive income.
A reconciliation of the Company's unrecognized tax benefits is as follows:
| | | Year Ended December 31, | |
| | | 2020 | | | 2019 | |
| | | (Dollars in thousands) | |
Balance at beginning of year | | $ | 10,623 | | | $ | 8,820 | |
Additions based on tax positions taken in prior years | | | 283 | | | | 104 | |
Additions based on tax positions taken in the current year | | | 1,570 | | | | 2,314 | |
Reduction based on tax positions taken in prior years | | | (10,803 | ) | | | (615 | ) |
Balance at end of year | | $ | 1,673 | | | $ | 10,623 | |
| | | Year Ended December 31, | |
| | | 2023 | | | 2022 | |
| | | (Dollars in thousands) | |
Balance at beginning of year | | $ | 5,300 | | | $ | 5,076 | |
Additions based on tax positions taken in prior years | | | 395 | | | | — | |
Additions based on tax positions taken in the current year | | | 1,376 | | | | 364 | |
Reduction based on tax positions taken in prior years | | | (141 | ) | | | (47 | ) |
Reduction based on tax positions taken in the current year | | | — | | | | (93 | ) |
Balance at end of year | | $ | 6,930 | | | $ | 5,300 | |
The Company and its U.S. subsidiaries file consolidated income tax returns for federal and state (where applicable) purposes. As of December 31, 2020,2023, the Company has not been subject to U.S. federal or state income tax examinations.
The Company remains open to examination by the Internal Revenue Service for the years 20022006-20192022 and by local state jurisdictions for the years 20042008-2019.2022. These examinations may lead to ordinary course adjustments or proposed adjustments to the Company's taxes or the Company's net operating losses with respect to years under examination as well as subsequent periods.
The Company’s foreign subsidiaries remain open to examination by the local income tax authorities in the following countries for the years indicated:
Israel | | 2019 | - | 2020 | | 2019 | – | 2023 |
Kenya | | 2015 | - | 2020 | | 2018 | – | 2023 |
Guatemala | | 2016 | - | 2020 | | 2019 | – | 2023 |
Honduras | | 2015 | - | 2020 | | 2018 | – | 2023 |
Guadeloupe | | 2017 | - | 2020 | | 2020 | – | 2023 |
ORMAT TECHNOLOGIES, INC. AND SUBSIDIARIES
NOTES TO CONSOLIDATED FINANCIAL STATEMENTS
Management believes that the liability for unrecognized tax benefits is adequate for all open tax years based on its assessment of many factors, including among others, past experience and interpretations of local income tax regulations. This assessment relies on estimates and assumptions and may involve a series of complex judgments about future events. As a result, it is possible that federal, state and foreign tax examinations will result in assessments in future periods. To the extent any such assessments occur, the Company will adjust its liability for unrecognized tax benefits. The Company is not able to reasonably estimate the amount of unrecognized tax benefits that will be reduced within the next twelve months.
ORMAT TECHNOLOGIES, INC. AND SUBSIDIARIES
NOTES TO CONSOLIDATED FINANCIAL STATEMENTS
Tax benefits in the United States
The U.S. government encourages production of electricity from geothermal resources through certain tax subsidies. On February 9, 2018August 16, 2022, the Bipartisan BudgetInflation Reduction Act was signed into law in the United States. The Company believes that the construction and operations of its geothermal power plants, recovered energy-based power plants, battery energy storage systems and solar PV will benefit in the future from the IRA and enhance the economic feasibility of projects in the United States. PTC’s can be generated from 20182.75 was enacted extendingcents per kWh, once the PTCWages & Apprenticeship rules are met, and if bonus credit requirements are met the credit could rise up to 3.30 cents per kWh. ITC’s can be earned on investments from 30.0%, once the Wages & Apprenticeship rules are met, and if bonus credit requirements are met the credit could rise up to 50.0%. Battery Energy Storage Systems are eligible for ITC in lieu of PTCs for geothermal projects that began construction before 2018. Onplaced-in-service after December 20, 2019,31, 2022. the Tax Extenders Bill was enacted, further extending the PTC and ITC in lieu of PTCs. Therefore, geothermal projects that begin construction before 2021 and meet certain other “beginning of construction” rules qualify for PTCs for their first10-years of operations; alternatively, the owner of the project may elect to claim the ITC in lieu of PTCs. In either case, under current tax rules for tax credits, any unused tax credit has a 1-year carry back and a 20-year carry forward.
Ifaddition, the Company claimscan now monetize PTC’s and ITC’s earned by transferring the ITC, the Company’s “tax basis” in the plant that it can recover through bonus or accelerated depreciation (if elected) must be reduced by half of the ITC. If the Company claims the PTC, there iscredits to a nothird reduction in theparty without having to enter into a tax basis for depreciation. Whether the Company claims the PTC or the ITC in lieu of PTC, for assets acquired and placed in service after September 27, 2017, the Company is eligible to expense 100% of the cost of qualified property (“bonus depreciation”). In later years, the first-year bonus depreciation deduction phases down, as follows:
● 80% for property placed in service after Dec. 31, 2022 and before Jan. 1, 2024.
● 60% for property placed in service after Dec. 31, 2023 and before Jan. 1, 2025.
● 40% for property placed in service after Dec. 31, 2024 and before Jan. 1, 2026.
● 20% for property placed in service after Dec. 31, 2025 and before Jan. 1, 2027.
The Company could also elect in lieu of bonus depreciation to depreciate most of its "tax basis" in the plant for tax purposes over five years on an accelerated basis, meaning that more of the cost may be deducted in the first few years than during the remainder of the depreciation period.equity transaction.
Income taxes related to foreign operations
Guadeloupe - The Company’s operations in Guadeloupe are taxed at a maximum rate of 33.3% in 2018, a maximum rate 31% in 2019, a rate of 28% in 2020, 26.5% in 2021, 25% in 2022and 25% in 2022.2023. In October 2020, Geothermie Bouillante received a notice from the tax authority regarding an audit for the years 2017-2019. The audit is in its early stages and as such, no adjustment has been assesses or recorded as of the balance sheet date.
Guatemala — The enacted tax rate is 25%. Orzunil, a wholly owned subsidiary, was granted a benefit under a law which promotes development of renewable power sources. The law allows Orzunil to reduce the investment made in its geothermal power plant from income tax payable, which currently reduces the effective tax rate to zero. Ortitlan, another wholly owned subsidiary, was granted a tax exemption for a period of ten years ending August 2017. Starting August 2017, Ortitlan pays income tax of 7% on its Electricity revenues.
Honduras - The Company’s operations in Honduras are exempt from income taxes for the first ten years starting at the commercial operation date of the power plant, which was in September 2017.
Israel — The Company’s operations in Israel through its wholly owned Israeli subsidiary, Ormat Systems Ltd. (“Ormat Systems”), arewere taxed at the regulara reduced corporate tax rate of 24%16% in 2017 and 23% in 2018 and 16%, thereafter. Ormat Systems received thereafter, under the “Benefited Enterprise” status under Israel’s Law fortax regime of the Encouragement of Capital Investments Law, 1959 (the “Investment Law”), with respect to two of its investment programs. In January 2011, new legislation amending the Investment Law by adding, inter alia, the Preferred Enterprise Regime was enacted. Under the new legislation,Preferred Enterprise Regime, a uniform rate ofreduced corporate tax rate would apply to all qualified income of certain industrial companies, as opposed to the current law’sInvestment Law incentives that are limited to income from a “Benefited Enterprise” during their benefits period. According to the amendment, the uniform tax rate applicable to the zone where the production facilities of Ormat Systems are located would be 16% in 2014 and thereafter. Ormat Systems decided to irrevocably comply with the new law starting in 2011.
On December 29, 2016, the Investment Law was amended (“73 Amendment”), which includes, inter alia, two new tax incentive opportunities. These are the Preferred Technological Enterprise (“PTE”) and Special Preferred Technological Enterprise (“SPTE”). In order to benefit from either of these options, a company must meet certain qualifications and receive formal approval from the eventIsrael Innovation Authority (“IIA”). The Company received such approval on January 20, 2021, which allowed the Company to use the reduced corporate tax rate of distribution12% on its "Preferred Technological Income" for the tax years 2021,2022 and 2023. The benefit of the reduced corporate tax rate has been reflected in these financial statements.
The Investment Law also included a cash dividend outspecific order that allowed companies to distribute earnings that were previously untaxed after paying a reduced corporate tax rate of retained earnings which were10% versus 25% under the prior tax exempt due to prior benefits,regime. Ormat Systems would haveelected to pay tax in respect of the amount distributed. Since the exemptions are contingent upon nondistribution of dividends and since upon liquidation the Company will have10% corporate rate on such previously untaxed earnings during 2021 which now allows such earnings to pay a 25% tax on exempt income, Ormat Systems recorded deferred tax liability at the rate of 25% in respect of the tax exempt income in 2004-2008. In the event that Ormat Systems fails to comply with the program terms, the tax benefits may be canceled and it may be required to refund the amount of the benefits utilized, in whole or in part, with the addition of linkage differences and interest.dividended.
Kenya - On June 26, 2023, the President of Kenya signed into law the 2023 Finance Act ("Finance Act"). On June 30, 2023, the Kenyan High Court issued a Temporary Conservatory Order against the Finance Act which barred the implementation of the Finance Act until a decision was made by the High Court. The Company’sFinance Act, among several other changes, reduces the statutory corporate income tax rate for Branches from 37.5% to 30%, introduces a Branch Profits tax based on the change in Net Assets and limits interest deductions to 30% of EBITDA. On July 28, 2023, the Kenya appeals court lifted the Temporary Conservatory Order on the Finance Act which results in the Finance Act being implemented as signed. As a result, the Company recorded a tax benefit associated with the corporate tax rate change for Branches from 37.5% to 30.0% in 2023, in the amount of approximately $7.4 million. This benefit is recorded as a reduction to income tax expense in the condensed consolidated statements of comprehensive operations in Kenya are taxed at the rate of 37.5%.and income.
ORMAT TECHNOLOGIES, INC. AND SUBSIDIARIES
NOTES TO CONSOLIDATED FINANCIAL STATEMENTS
Tax audit in Israel
On December 28, 2020 the Company entered into a settlement agreement with the Israel Tax Authority ("ITA") in relation to a tax audit for the income tax years 2015 to 2018. The settlement amount for the audit period was $4.3 million and was paid on January 7, 2021. This settlement closes and concludes all years within the audit period.
Tax audit in Kenya
The Company was audited by the Kenya Revenue Authority ("KRA") for income tax years 2013 to 2017 for which it had received during 2019 and 2020three separate Notices of Assessments ("NoA") detailing different issues relating to certain findings in respect of the KRA review of such years.
On October 19, 2020, the Company entered into a settlement agreement in relation to the second NoA that was issued by the KRA on December 4, 2019 totaling approximately $190 million of proposed adjustments, including interest and penalties. The settlement agreement extended the audit period for the issues addressed within the assessment, to cover the period from 2013 through 2019 and resulted in a total settlement payment of approximately $28 million, including interest and penalties, related to late payment in respect of 2019 taxable income. Additionally, the settlement included a deferral of tax benefits to be utilized in years subsequent to 2019 in an amount of approximately $28 million. The assessment was paid on October 27, 2020.
On December 21, 2020, the Company entered into a settlement agreement with the KRA in relation to the first and third NoA's that were issued by the KRA on June 28, 2019 and May 12, 2020, respectively, totaling approximately $9 million, including interest and penalties. The total settlement amount reflected in the agreement was $1.5 million, which was paid on December 28, 2020. This concluded all open audits and NoAs with the KRA.
NOTE 1817 — BUSINESS SEGMENTS
The Company has 3three reporting segments: the Electricity segment, the Product segment and the Energy Storage segment (previously named "Energy Storage and Management Services").segment. These segments are managed and reported separately as each offers different products and serves different markets.
| | • | Under the Electricity segment, the Company builds, owns and operates geothermal, solar PV and recovered energy-based power plants in the United States and geothermal power plants in otherforeign countries, around the world and sell the electricity they generate.generated by those power plants. |
| | • | Under the Product segment, the Company designs, manufactures and sells equipment for geothermal and recovered energy-based electricity generation and remote power units and provide services relating to the engineering, procurement and construction of geothermal and recovered energy-based power plants. |
| | • | Under the Energy Storage segment, the Company provides battery energy storage and related servicessystems as a service as well as services relating to the engineering, procurement, construction, operation and maintenance of energy storage units. To better reflect the significant business activities under this reporting segment, the Company has renamed this reporting segment to be "Energy Storage". There is no change to the business units reported under this segment.related services. |
ORMAT TECHNOLOGIES, INC. AND SUBSIDIARIES
NOTES TO CONSOLIDATED FINANCIAL STATEMENTS
Transfer prices between the operating segments were determined on current market values or cost plus markup of the seller’s business segment.
Summarized financial information concerning the Company’s reportable segments is shown in the following tables, including, as further described under Note 1 to the consolidated financial statements, the Company's disaggregated revenues from contracts with customers as required by ASC 606:
| | | Electricity | | | Product | | | Energy Storage | | | Consolidated | | | Electricity | | | Product | | | Energy Storage | | | Consolidated | |
| | | (Dollars in thousands) | | | (Dollars in thousands) | |
Year Ended December 31, 2020: | | | | | | | | | |
Year Ended December 31, 2023: | | | | | | | | | |
Revenues from external customers: | | |
United States (1) | | $ | 341,399 | | | $ | 5,800 | | | $ | 15,824 | | | $ | 363,023 | | | $ | 473,323 | | | $ | 7,610 | | | $ | 28,894 | | | $ | 509,827 | |
Foreign (2) | | | 199,994 | | | | 142,325 | | | | 0 | | | | 342,319 | | | | 193,444 | | | | 126,153 | | | | — | | | | 319,597 | |
Net revenues from external customers | | 541,393 | | | 148,125 | | | 15,824 | | | 705,342 | | | 666,767 | | | 133,763 | | | 28,894 | | | 829,424 | |
Intersegment revenues | | 0 | | | 113,200 | | | 0 | | | 0 | | | — | | | 48,494 | | | — | | | — | |
Depreciation and amortization expense | | 144,357 | | | 6,010 | | | 6,245 | | | 156,612 | | | 199,344 | | | 10,908 | | | 14,545 | | | 224,797 | |
Operating income (loss) | | 205,256 | | | 13,145 | | | (4,388 | ) | | 214,013 | | | 168,834 | | | 3,536 | | | (5,785 | ) | | 166,585 | |
Segment assets at period end (3) (*) | | 3,607,384 | | | 145,911 | | | 135,692 | | | 3,888,987 | | | 4,652,392 | | | 199,897 | | | 355,990 | | | 5,208,279 | |
Expenditures for long-lived assets | | 267,843 | | | 18,011 | | | 34,884 | | | 320,738 | | | 474,592 | | | 20,599 | | | 123,192 | | | 618,383 | |
* Including unconsolidated investments | | 98,217 | | | 0 | | | 0 | | | 98,217 | | | 125,439 | | | — | | | — | | | 125,439 | |
| | | |
Year Ended December 31, 2019: | | | | | | | | | |
Year Ended December 31, 2022: | | | | | | | | | |
Revenues from external customers: | | |
United States (1) | | 333,797 | | | 30,562 | | | 13,597 | | | 377,956 | | | 446,000 | | | 7,037 | | | 31,018 | | | 484,055 | |
Foreign (2) | | | 206,536 | | | | 160,447 | | | | 1,105 | | | | 368,088 | | | | 185,727 | | | | 64,377 | | | | — | | | | 250,104 | |
Net revenues from external customers | | $ | 540,333 | | | $ | 191,009 | | | $ | 14,702 | | | $ | 746,044 | | | $ | 631,727 | | | $ | 71,414 | | | $ | 31,018 | | | $ | 734,159 | |
Intersegment revenues | | 0 | | | 84,614 | | | 0 | | | 0 | | | — | | | 83,394 | | | — | | | — | |
Depreciation and amortization expense | | 138,426 | | | 5,308 | | | 5,027 | | | 148,761 | | | 179,966 | | | 7,302 | | | 11,524 | | | 198,792 | |
Operating income (loss) | | 177,192 | | | 23,180 | | | (6,576 | ) | | 193,796 | | | 156,178 | | | (1,084 | ) | | (2,291 | ) | | 152,803 | |
Segment assets at period end (3) (*) | | 3,044,909 | | | 126,018 | | | 79,567 | | | 3,250,494 | | | 4,253,910 | | | 118,018 | | | 239,651 | | | 4,611,579 | |
Expenditures for long-lived assets | | 259,898 | | | 9,156 | | | 10,932 | | | 279,986 | | | 462,269 | | | 16,352 | | | 84,855 | | | 563,476 | |
* Including unconsolidated investments | | 81,140 | | | 0 | | | 0 | | | 81,140 | | | 115,693 | | | — | | | — | | | 115,693 | |
| | | |
Year Ended December 31, 2018: | | | | | | | | | |
Year Ended December 31, 2021: | | | | | | | | | |
Revenues from external customers: | | |
United States (1) | | 305,962 | | | 14,999 | | | 7,645 | | | 328,606 | | | 404,303 | | | 5,414 | | | 30,393 | | | 440,110 | |
Foreign (2) | | | 203,917 | | | | 186,744 | | | | 0 | | | | 390,661 | | | | 181,468 | | | | 41,506 | | | | — | | | | 222,974 | |
Net revenues from external customers | | 509,879 | | | 201,743 | | | 7,645 | | | 719,267 | | | 585,771 | | | 46,920 | | | 30,393 | | | 663,084 | |
Intersegment revenues | | 0 | | | 48,817 | | | 0 | | | 0 | | | — | | | 129,589 | | | — | | | — | |
Depreciation and amortization expense | | 126,181 | | | 4,311 | | | 1,741 | | | 132,233 | | | 164,490 | | | 7,719 | | | 10,763 | | | 182,972 | |
Operating income (loss) | | 155,546 | | | 38,083 | | | (8,519 | ) | | 185,110 | | | 171,550 | | | (3,641 | ) | | 1,448 | | | 169,357 | |
Segment assets at period end (3) (*) | | 2,896,938 | | | 156,942 | | | 67,470 | | | 3,121,350 | | | 4,142,341 | | | 113,817 | | | 169,520 | | | 4,425,678 | |
Expenditures for long-lived assets | | 219,803 | | | 9,993 | | | 28,725 | | | 258,521 | | | 383,307 | | | 10,687 | | | 25,278 | | | 419,272 | |
* Including unconsolidated investments | | 71,983 | | | 0 | | | 0 | | | 71,983 | | | 105,886 | | | — | | | — | | | 105,886 | |
ORMAT TECHNOLOGIES, INC. AND SUBSIDIARIES
NOTES TO CONSOLIDATED FINANCIAL STATEMENTS
(1) | Electricity segment revenues in the United States are all accounted under lease accounting, except for $68.1$124.7 million, $61.3$102.5 million and $26.9$83.4 million for the years 2020,2023, 20192022 and 20182021, which are accounted under ASC 606. Product and Energy Storage segment revenues in the United States are accounted under ASC 606, as further described under Note 1 to the consolidated financial statements. |
(2) | Electricity segment revenues in foreign countries are all accounted under lease accounting. Product and Energy Storage segment revenues in foreign countries are accounted under ASC 606 as further described under Note 1 to the consolidated financial statements. |
(3) | Electricity segment assets include goodwill in the amount of $20.5$85.9 million $20.1, $85.7 million and $20.0$85.3 million as of December 31, 2020,2023, 20192022 and 2018,2021, respectively.respectively, $66.2 million of which was added in the third quarter of 2021 as a result of the Terra-Gen Transaction as further described under Note 2 to the consolidated financial statements. Energy Storage segment assets include goodwill in the amount of $4.1$4.6 million , $4.6 million and $4.6 million as of December 31, 2020.2023, NaN2022 and 2021, respectively. No goodwill is included in the Product segment assets as of December 31, 2020,2023, 20192022 and 2018.2021. |
Reconciling information between reportable segments and the Company’s consolidated totals is shown in the following table:
| | | Year Ended December 31, | | | Year Ended December 31, | |
| | | 2020 | | 2019 | | 2018 | | | 2023 | | | 2022 | | | 2021 | |
| | | (Dollars in thousands) | | | (Dollars in thousands) | |
Revenues: | | | | | | | | |
Total segment revenues | | $ | 705,342 | | | $ | 746,044 | | | $ | 719,267 | | | $ | 829,424 | | | $ | 734,159 | | | $ | 663,084 | |
Intersegment revenues | | 113,200 | | | 84,614 | | | 48,817 | | | 48,494 | | | 83,394 | | | 129,589 | |
Elimination of intersegment revenues | | | (113,200 | ) | | | (84,614 | ) | | | (48,817 | ) | | | (48,494 | ) | | | (83,394 | ) | | | (129,589 | ) |
| | | |
Total consolidated revenues | | $ | 705,342 | | | $ | 746,044 | | | $ | 719,267 | | | $ | 829,424 | | | $ | 734,159 | | | $ | 663,084 | |
| | | |
Operating income (expense): | | | | | | | | |
Operating income | | $ | 214,013 | | | $ | 193,796 | | | $ | 185,110 | | | $ | 166,585 | | | $ | 152,803 | | | $ | 169,357 | |
Interest income | | 1,717 | | | 1,515 | | | 974 | | | 11,983 | | | 3,417 | | | 2,124 | |
Interest expense, net | | (77,953 | ) | | (80,384 | ) | | (70,924 | ) | | (98,881 | ) | | (87,743 | ) | | (82,658 | ) |
Derivatives and foreign currency transaction gains (losses) | | 3,802 | | | 624 | | | (4,761 | ) | | (3,278 | ) | | (6,044 | ) | | (14,720 | ) |
Income attributable to sale of tax benefits | | 25,720 | | | 20,872 | | | 19,003 | | | 61,157 | | | 33,885 | | | 29,582 | |
Other non-operating income (expense), net | | | 1,418 | | | | 880 | | | | 7,779 | | | | 1,519 | | | | (709 | ) | | | (134 | ) |
Total consolidated income before income taxes and equity in earnings (losses) of investees | | $ | 168,717 | | | $ | 137,303 | | | $ | 137,181 | | | $ | 139,085 | | | $ | 95,609 | | | $ | 103,551 | |
ORMAT TECHNOLOGIES, INC. AND SUBSIDIARIES
NOTES TO CONSOLIDATED FINANCIAL STATEMENTS
The Company sells electricity, products and energy storage services mainly to the geographical areas set forth below based on the location of the customer. The following tables present certain data by geographic area:geographic:
| | | Year Ended December 31, | | | Year Ended December 31, | |
| | | 2020 | | 2019 | | 2018 | | | 2023 | | | 2022 | | | 2021 | |
| | | (Dollars in thousands) | | | (Dollars in thousands) | |
Revenues from external customers attributable to: | | | | | | | | |
United States | | $ | 363,023 | | | $ | 377,956 | | | $ | 328,606 | | | $ | 509,827 | | | $ | 484,055 | | | $ | 440,110 | |
Indonesia | | 0 | | | 0 | | | 4,379 | | | 26,732 | | | 15,631 | | | 8,056 | |
Kenya | | 115,474 | | | 121,661 | | | 119,094 | | | 109,217 | | | 105,837 | | | 102,844 | |
Turkey | | 65,535 | | | 88,938 | | | 168,699 | | | 2,469 | | | 1,961 | | | 2,723 | |
Chile | | 32,418 | | | 25,540 | | | 980 | | | — | | | 579 | | | 7,035 | |
Guatemala | | 27,391 | | | 28,624 | | | 27,975 | | | 30,174 | | | 28,831 | | | 26,868 | |
New Zealand | | 34,985 | | | 31,222 | | | 10,451 | | | 66,526 | | | 17,130 | | | 6,770 | |
Honduras | | 35,197 | | | 34,446 | | | 34,355 | | | 31,589 | | | 33,837 | | | 35,233 | |
Other foreign countries | | | 31,319 | | | 37,657 | | | 24,728 | | | | 52,889 | | | | 46,298 | | | | 33,445 | |
| | | |
Consolidated total | | $ | 705,342 | | | $ | 746,044 | | | $ | 719,267 | | | $ | 829,424 | | | $ | 734,159 | | | $ | 663,084 | |
ORMAT TECHNOLOGIES, INC. AND SUBSIDIARIES
NOTES TO CONSOLIDATED FINANCIAL STATEMENTS
| | | Year Ended December 31, | | |
| | | 2020 | | 2019 | | 2018 | | | Year Ended December 31, | |
| | | (Dollars in thousands) | | | 2023 | | 2022 | | 2021 | |
| | | | (Dollars in thousands) | |
Long-lived assets (primarily power plants and related assets) located in: | | | | | | | | |
United States | | $ | 2,084,021 | | | $ | 1,870,335 | | | $ | 1,696,439 | | | $ | 3,085,892 | | | $ | 2,857,503 | | | $ | 2,527,429 | |
Kenya | | 289,266 | | | 284,526 | | | 301,956 | | | 377,563 | | | 301,491 | | | 297,427 | |
Other foreign countries | | | 232,953 | | | 224,676 | | | 222,872 | | | | 378,028 | | | 254,878 | | | 217,371 | |
Consolidated total | | $ | 2,606,240 | | | $ | 2,379,537 | | | $ | 2,221,267 | | | $ | 3,841,483 | | | $ | 3,413,872 | | | $ | 3,042,227 | |
The following table presents revenues from major customers:
| | | Year Ended December 31, | | | Year Ended December 31, | |
| | | 2020 | | 2019 | | 2018 | | | 2023 | | 2022 | | 2021 | |
| | | Revenues | | % | | Revenues | | % | | Revenues | | % | | | Revenues | | % | | Revenues | | % | | Revenues | | % | |
| | | (Dollars in
thousands) | | | | | | (Dollars in
thousands) | | | | | | (Dollars in
thousands) | | | | | | (Dollars in thousands) | | | | | | (Dollars in thousands) | | | | | | (Dollars in thousands) | | | | |
Southern California Public Power (1) | | $ | 145,450 | | | 20.6 | | | $ | 133,725 | | | 17.9 | | | $ | 109,208 | | | 15.2 | | | $ | 181,656 | | | 21.2 | | | $ | 157,663 | | | 21.5 | | | $ | 157,318 | | | 23.7 | |
Sierra Pacific Power Company and Nevada Power Company (1)(2) | | 123,734 | | | 17.5 | | | 125,486 | | | 16.8 | | | 116,149 | | | 16.1 | | | 116,797 | | | 14.1 | | | 124,116 | | | 16.9 | | | 123,333 | | | 18.6 | |
KPLC (1) | | 115,474 | | | 16.4 | | | 121,661 | | | 16.3 | | | 119,094 | | | 16.6 | | | 109,217 | | | 13.2 | | | 105,837 | | | 14.4 | | | 102,844 | | | 15.5 | |
(1)Revenues reported in Electricity segment.
(2)Subsidiaries of NV Energy, Inc.
NOTE1918 — TRANSACTIONS WITH RELATED ENTITIES
There were no transactions between the Company and related entities, other than those disclosed elsewhere in these consolidated financial statements.
ORMAT TECHNOLOGIES, INC. AND SUBSIDIARIES
NOTES TO CONSOLIDATED FINANCIAL STATEMENTS
NOTE 2019 — EMPLOYEE BENEFIT PLAN
401(k) Plan
The Company has a 401(k) Plan (the “Plan”) for the benefit of its U.S. employees. Employees of the Company and its U.S. subsidiaries who have completed 60 days of employment are eligible to participate in the Plan. Contributions are made by employees through pre- and post-tax deductions up to 60% of their annual salary. In 2020,2023, 20192022 and 2018,2021, the Company matched employee contributions, after completion of one year of service, up to a maximum of 4%6%, 4%5% and 4% of the employee’s annual salary, respectively. The Company’s contributions to the Plan were $1.6$3.9 million $1.6, $2.6 million and $1.6$1.8 million for the years ended December 31, 2020,2023, 20192022 and 2018,2021, respectively.
ORMAT TECHNOLOGIES, INC. AND SUBSIDIARIES
NOTES TO CONSOLIDATED FINANCIAL STATEMENTS
Severance plan
The Company, through Ormat Systems, provides limited non-pension benefits to all current employees in Israel who are entitled to benefits in the event of termination or retirement in accordance with the Israeli Government sponsored programs. These plans generally obligate the Company to pay one month’s salary per year of service to employees in the event of involuntary termination. There is no limit on the number of years of service in the calculation of the benefit obligation. The liabilities for these plans are recorded at each balance sheet date by determining the undiscounted obligation as if it were payable at that point in time. Such liabilities have been presented in the consolidated balance sheets as “liabilities for severance pay”. The Company has an obligation to partially fund the liabilities through regular deposits in pension funds and severance pay funds. The amounts funded amountedare to $10.7$6.5 million and $10.8$6.9 million at December 31, 20202023 and 2019,2022, respectively, and have been presented in the consolidated balance sheets as part of “Deposits and other”. The severance pay liability covered by the pension funds is not reflected in the financial statements as the severance pay risks have been irrevocably transferred to the pension funds. Under the Israeli severance pay law, restricted funds may not be withdrawn or pledged until the respective severance pay obligations have been met. As allowed under the program, earnings from the investment are used to offset severance pay costs. Severance pay expenses for the years ended December 31, 2020,2023, 20192022 and 20182021 were $3.0$2.2 million, $3.5$2.2 million and $3.0$2.0 million, respectively, which are net of income (including loss)(loss) amounting to $0.9$(0.2) million, $1.0$(1.0) million, and $(1.1)$1.3 million, respectively, generated from the regular deposits and amounts accrued in severance funds.
The Company expects to pay the following future benefits to its employees upon their reaching normal retirement age:
| | | | (Dollars in
thousands) | | | (Dollars in thousands) | |
Year ending December 31: | | | | | | |
2021 | | | $ | 4,968 | | |
2022 | | | 1,910 | | |
2023 | | | 148 | | |
2024 | | | 686 | | | $ | 2,396 | |
2025 | | | 1,160 | | | 291 | |
| 2026-2043 | | | | 11,582 | | |
2026 | | | 525 | |
2027 | | | 1,461 | |
2028 | | | 723 | |
| 2029-2046 | | | | 4,816 | |
Total | | | $ | 20,454 | | | $ | 10,212 | |
The above amounts were determined based on the employees’ current salary rates and the number of years’ service that will have been accumulated at their retirement date. These amounts do not include amounts that might be paid to employees that will cease working with the Company before reaching their normal retirement age.
NOTE 2120 — COMMITMENTS AND CONTINGENCIES
Geothermal resources
The Company, through its project subsidiaries in the United States and other foreign locations, controls certain rights to geothermal fluids through certain leases with the BLM or through private leases. Royalties on the utilization of the geothermal resources are computed and paid to the lessors as defined in the respective agreements. Royalty expense under the geothermal resource agreements were $20.8$30.9 million, $21.7$30.1 million and $21.6$25.2 million for the years ended December 31, 2020,2023, 20192022 and 2018,2021, respectively.
ORMAT TECHNOLOGIES, INC. AND SUBSIDIARIES
NOTES TO CONSOLIDATED FINANCIAL STATEMENTS
Letters of credit
In the ordinary course of business with customers, vendors, and lenders, the Company is contingently liable for performance under letters of credit totaling $190.3$302.8 million at December 31, 2020.2023. Management does not expect any material losses to result from these letters of credit because performance is not expected to be required.
ORMAT TECHNOLOGIES, INC. AND SUBSIDIARIES
NOTES TO CONSOLIDATED FINANCIAL STATEMENTS
Purchase commitments
The Company purchases raw materials for inventories, construction-in-process and services from a variety of vendors. During the normal course of business, in order to manage manufacturing lead times and help assure adequate supply, the Company enters into agreements with contract manufacturers and suppliers that either allow them to procure goods and services based upon specifications defined by the Company, or that establish parameters defining the Company’s requirements. At December 31, 2020,2023, total obligations related to such supplier agreements were approximately $159.9$419.8 million (out of which approximately $77.8$251.3 million relate to construction-in-process). All such obligations are payable in 2021.2024.
Grants and royalties
The Company, through Ormat Systems, had historically, through December 31, 2003, requested and received grants for research and development from the Office of the Chief Scientist of the Israeli Government. Ormat Systems is required to pay royalties to the Israeli Government at a rate of 3.5% to 5.0% of the revenues derived from products and services developed using these grants. NaNNo royalties were paid for the years ended December 31, 2020,2023, 20192022 and 2018.2021. The Company is not liable for royalties if the Company does not sell such products and services. Such royalties are capped at the amount of the grants received plus interest at LIBOR.of 5.9%. The cap at December 31, 20202023 and 2019,2022, amounted to $2.1$2.5 million every year,and $2.3 million, respectively, of which approximately $1.1$1.5 million and $1.2 million, represents interest based on the LIBOR rate,portion, as defined above.above, for 2023 and 2022, respectively.
Lease commitments
The Company's lease commitments are detailed under Note 22,21, Leases to the consolidated financial statements.
Contingencies
• On May 21, 2018, a motion to certify a class action was filed in Tel Aviv District Court against Ormat Technologies, Inc. and 11 officers and directors. The alleged class is defined as "All persons who purchased Ormat shares on the Tel Aviv Stock Exchange between August 3, 2017 and May 13, 2018". The motion alleges that the Company and other respondents violated Sections 31(a)(1) and 38C of the Israeli Securities Law, and Section 10(b) of the Exchange Act and Rule 10b-5 thereunder, because they allegedly: (1) misled investors by stating in the Company's financial statements that it maintains effective internal controls over its accounting policies and procedures, even though the Company's internal controls had material weaknesses which led to erroneous accounting in its 2017 unaudited quarterly reports that had to be restated, including adjustments to the Company’s net income and shareholders’ equity; and (2) failed to issue an immediate report in Israel until May 16, 2018, analogous to the report that was released in the United States on May 11, 2018 stating, inter alia, that the errors in its financial reports affected its balance sheet and would be remedied in its 2017 annual report. Agreed motions were filed from time to time with, and granted by, the Tel Aviv District Court to stay the proceedings in Israel in light of the United States case (Mac Costas). On June 30, 2020, pursuant to the execution and submission of a settlement agreement to the United States court for approval, which resolves the matters raised with respect to the entire class of shareholders (whether traded on the Tel Aviv Stock Exchange or U.S. stock exchange), the Company filed a motion informing the Tel Aviv court of the settlement. On January 4, 2021, the Tel Aviv District Court approved the parties’ joint motion for withdrawal and dismissal of the plaintiff’s July 2, 2020 motion for an Anti-Suit Injunction.
• On June 11, 2018,December 15, 2021, the Center for Biological Diversity and the Fallon Paiute-Shoshone Tribe (the “Plaintiffs”) filed a putative class action filed by Mac Costas on behalf of alleged shareholders that purchased or acquired the Company's ordinary shares between August 8, 2017 and May 15, 2018 was commencedlawsuit in the United StatesU.S. District Court for the DistrictState of Nevada against the Company and its Chief Executive Officer and Chief Financial Officer, which was subsequently amended by a consolidated complaint filed by lead plaintiff Phoenix Insurance in May 13, 2019. The complaint asserts claim against all defendants pursuant to Section 10(b)U.S. Department of the Exchange Act,Interior, the Bureau of Land Management (“the BLM”) and Jake Vialpando, in his official capacity as amended, and Rule 10b-5 thereunder and against its officers pursuant to Section 20(a)a field manager of the Exchange Act. The complaint allegesBLM, alleging that the Company's Formdefendants violated the National Environmental Protection Act and other federal laws by approving the Company’s Dixie Meadows project and the associated environmental assessment and Finding of 10No-K Significant Impact (“FONSI”). Plaintiffs additionally alleged that the project threatens the Dixie Valley Toad and infringes on the tribe’s enjoyment of a religious sacred site. Plaintiffs sought for the years endedcourt to vacate and set aside the environmental assessment, FONSI and the BLM’s authorizations for the project and to enjoin project construction. The Company intervened in the action on December 31, 2016January 4, 2022. andOn 2017,January 14, 2022, and Formthe court granted a temporary, 1090-Qs for each-day injunction pausing construction of the quarters inproject while it ruled on the nine months ended September 30, 2017 contained material misstatements or omissions, among other things, with respect to the Company’s tax provisions and the effectiveness of its internal control over financial reporting, and that, as a result of such alleged misstatements and omissions, the plaintiffs suffered damages. On December 6, 2019 the Company’s motion to dismiss was denied by the court. On March 23, 2020, pursuant to out of court mediation, a term sheet for a proposed settlementmerits of the action without admission of liability or wrongdoing, was signed betweencase. The Ninth Circuit subsequently set aside the parties andtemporary injunction, pending a hearing on June 10, 2020,15, 2022, a joint stipulation and motion for preliminary approval of the comprehensive executed settlement documentation was filed for the court for approval. construction began in February 2022. On January 21, 2020,August 1, 2022 the CourtNinth Circuit issued its Order and Final Judgement certifying the Class, approving the method of notification of the settlement pursued, and approving the final settlement and proposed Plan of Allocation as well as the plaintiff attornies’ and plaintiff’s awards. The final settlement was concluded with an immaterial amount for the Company.
ORMAT TECHNOLOGIES, INC. AND SUBSIDIARIES
NOTES TO CONSOLIDATED FINANCIAL STATEMENTS
• On September 11, 2018, the Klein derivative action (Klein Action) was filed against the Company, our board and its Chief Executive Officer and Chief Financial Officerorder in the United States District Court forCompany’s favor, affirming the District of Nevada, and onCourt’s ruling that an injunction after October 22, 2018,90-days was not warranted. On April 4, 2022, the Matthew derivative action (Matthew Action) was filed againstU.S. Fish and Wildlife Services (“FWS”) emergency listed the Company, certain named present and former board members (Barniv, Beck, Boehm, Clark, Falk, Freeland, Granot, Joyal, Nishigori, Sharir, Stern and Wong) inDixie Valley Toad under the United States District Court, DistrictEndangered Species Act of Nevada. The Klein1973 (the “ESA”). On July 6, 2022, Plaintiffs amended their complaint asserts four derivativeto add causes of action generally arising from Ormat's restatement of its financial statements: (i) the individual defendants allegedly breached their fiduciary duties by allowing the Company to improperly report its financials; (ii) the individual defendants allegedly were unjustly enriched by being compensated while breaching their fiduciary duties; (iii) the individual defendants allegedly committed corporate waste in paying officers and directors and by incurring legal costs and potential liability; and (iv) the director defendants allegedly breached Section 14(a) of the Exchange Act in connection with the issuance of the 2018 proxy. The Matthew complaint similarly alleges derivatively a breach of fiduciary duties, abuse of control, gross mismanagement, and corporate waste by the named directors. On January 24, 2019, the Nevada Court entered an order consolidating the Klein Action and Matthew Action. On July 10, 2020, a comprehensive settlement package and derivative stipulation of settlement was submittedrelated to the court, and on October 12, 2020, Plaintiff filed an unopposed motion to the Nevada Court requesting preliminary approval of the corporate governance enhancement settlement. On November 24, 2020, the Court issued its order preliminarily approving the derivative settlement and providing notice for a final settlement hearing on March 22, 2021 for its final decision for review of the settlement and of the request to dismiss the consolidated derivation action with prejudice. The sum the Company will bear for implementation is not material.
• Following the announcement of the Company’s acquisition of U.S. Geothermal Inc. ("USG"), a number of putative shareholder class action complaints were initially filed on behalf of USG shareholders between March 8, 2018 and March 30, 2018 ESA listing against USG and the individual members of the USG board of directors. All of the purported class action suits filed in Federal Court in Idaho have been voluntarily dismissed. The single remaining class action complaint is a purported class action filed in the Delaware Chancery Court, entitled Riche v. Pappas, et al., Case No.2018-0177 (Del. Ch., Mar. 12, 2018). An amended complaint was filed on May 24, 2018 under seal, under a confidentiality agreement that was executed by plaintiff. The amended Riche complaint alleges state law claims for breach of fiduciary duty against former USG directors and seeks post-closing damages. On March 27, 2020, pursuant to out of court mediation, a term sheet for a proposed settlement of the action, without admission of liability or wrongdoing, was signed between the parties. On June 3, 2020, a comprehensive settlement package and stipulation of settlement was filed with the court for approval, and on September 16, 2020 the Delaware Chancery Court approved the settlement. Plaintiff’s revised motion requesting the court to approve Plaintiff’s proposed allocation plan was filed on October 6, 2020. The sum the Company will bear in this context is not material.
• On March 29, 2016, a former local sales representative in Chile, Aquavant, S.A., filed a claim on the basis of unjust enrichment against Ormat’s subsidiaries in the 27th Civil Court of Santiago, Chile. The claim requests that the court order Ormat to pay Aquavant $4.6 million in connection with its activities in Chile, including the EPC contract for the Cerro Pabellon project and various geothermal concessions, plus 3.75% of Ormat geothermal products sales in Chile over the next 10 years. Pursuant to various motions submitted by the defendants and the plaintiffs to various courts, including the Court of Appeals, the case was removed from the original court and then refiled before the 11th Civil Court of Santiago. On April 16, 2020, the 11th Civil Court of Santiago issued its order rejecting Plaintiff's principal claim of unjust enrichment, as an improper cause of action, rejecting Plaintiff's secondary claim for declaratory judgment, which the Court associates with the principal claim of unjust enrichment and not relating to a number of defenses raised by the Company. In May 2020, each of the parties filed separately to the court of appeals, which are pending. On October 19, 2020, the Court of Appeals dismissed all ancillary appeals on procedural issues filed by Aquavant as well as two ancillary appeals on procedural issues filed by the Company. The Company considers itis currently working with the BLM and FWS in the Section 7 Consultation process including discussion and identification of potential additional mitigation measures, and has strong legal defensesagreed to temporarily pause construction of the facility. The Company requested that the BLM amend the Decision Record to limit the scope of the project to the first planned phase of development, a single power plant of approximately 12 MW and the probabilityBLM granted that request. The Company further requested that the court stay the litigation until the Section 7 Consultation process was complete, and the court granted the motion to stay on February 14, 2023. In July 2023, the Company determined that it would conduct a supplemental NEPA review with BLM, which will run simultaneously with Section 7 Consultation, during which time the litigation remains stayed. On September 18, 2023, the court issued an Order administratively closing the case without prejudice to reopening upon a motion by either party. The Company requested the BLM to begin a supplemental NEPA review of the claimant receiving an award is low. The potential amount thatproject in order to renew the Company may bear in this context cannot be reasonably estimated at this time.permit.
In addition,Additionally, from time to time, the Company is named as a party to other various other lawsuits, claims and other legal and regulatory proceedings that arise in the ordinary course of the Company's business. These actions typically seek, among other things, compensation for alleged personal injury, breach of contract, property damage, punitive damages, civil penalties or other losses, or injunctive or declaratory relief. With respect to such lawsuits, claims and proceedings, the Company accrues reserves when a loss is probable, and the amount of such loss can be reasonably estimated. It is the opinion of the Company’s management that the outcome of these proceedings, individually and collectively, will not be material to the Company’s consolidated financial statements as a whole.
Directors established a special committee of independent directors (the "Special Committee") to investigate, among other things, certain claims made in a report published by a short seller regarding the Company’s compliance with anti-corruption laws. The Special Committee is working with outside legal counsel to investigate the claims made. All members of the Special Committee are “independent” in accordance with the Company's Corporate Governance Guidelines, the NYSE listing standards and SEC rules applicable to boards of directors in general. The Company is also providing information as requested by the SEC and Department of Justice ("DOJ") related to the claims.
ORMAT TECHNOLOGIES, INC. AND SUBSIDIARIES
NOTES TO CONSOLIDATED FINANCIAL STATEMENTS
In Kenya, since 2021, various task forces have been appointed by the President and/or the Senate to review and analyze PPAs entered into between KPLC and various independent power producers (including our long-term PPA for the Olkaria complex), with the recommendation that KPLC review its contracts and attempt renegotiation with these independent power producers to reduce PPA tariffs within existing contractual arrangements. The Company has been approached by certain of these task forces and has participated in requested discussions with them, which remain ongoing.
NOTE 2221 — LEASES
The Company is a lessee in operating and finance lease transactions primarily consisting of land leases for its exploration and development activities. Additionally, the Company was a lessee under an operating lease in relation to the Puna power plant transaction which was terminated in December 2019 as further described under Note 12 to the consolidated financial statements. The Company is a lessee in finance lease transactions primarily consisting ofactivities and fleet vehicles, and office rentals.respectively. The Company is a lessor in PPAs that are accounted under lease accounting, as further described under Note 1 to the consolidated financial statements under "Revenues and cost of revenues" and "Leases".
A.
ORMAT TECHNOLOGIES, INC. AND SUBSIDIARIES NOTES TO CONSOLIDATED FINANCIAL STATEMENTS Leases in which the Company is a lessee | Leases in which the Company is a lessee
|
The table below presents the effects on the amounts relating to total lease cost:
| | | | Year Ended December 31, | |
| | | Year Ended December 31, 2020 | | | Year Ended December 31, 2019 | | | 2023 | | | 2022 | | | 2021 | |
| | | (Dollars in thousands) | | | (Dollars in thousands) | |
Lease cost | | | | | | | | | | | | | | |
Finance lease cost: | | | | | | |
Amortization of right-of-use assets | | $ | 3,422 | | | $ | 3,273 | | | $ | 1,922 | | | $ | 2,861 | | | $ | 3,265 | |
Interest on lease liabilities | | 1,226 | | | 1,330 | | | 168 | | | 441 | | | 770 | |
Operating lease cost | | 3,303 | | | 8,057 | | | 4,771 | | | 3,695 | | | 3,707 | |
Variable lease cost | | 1,891 | | | 1,647 | | |
Short-term lease cost | | | 0 | | | | 0 | | |
Short-term and variable lease cost | | | | 6,741 | | | | 7,436 | | | | 5,228 | |
Total lease cost | | $ | 9,842 | | | $ | 14,307 | | | $ | 13,602 | | | $ | 14,433 | | | $ | 12,970 | |
| | | |
Other information | | | | | | | | | | | | | | |
Cash paid for amounts included in the measurement of lease liabilities: | | | | | | |
Operating cash flows for finance leases | | $ | 1,226 | | | $ | 1,330 | | | $ | 168 | | | $ | 441 | | | $ | 770 | |
Operating cash flows for operating leases | | 3,213 | | | 9,004 | | | 4,448 | | | 4,507 | | | 3,589 | |
Financing cash flows for finance leases | | 2,890 | | | 3,164 | | | 1,963 | | | 2,983 | | | 3,181 | |
Right-of-use assets obtained in exchange for new finance lease liabilities | | 1,028 | | | 5,262 | | | 1,671 | | | 2,473 | | | 948 | |
Right-of-use assets obtained in exchange for new operating lease liabilities | | 2,614 | | | 6,364 | | | 4,731 | | | 6,286 | | | 5,227 | |
| | | December 31, | | December 31, | | | December 31, | | December 31, | |
Additional information as of the end of the year: | | 2020 | | | 2019 | | | 2023 | | | 2022 | |
Weighted-average remaining lease term — finance leases (in years) | | 5.2 | | | 4.0 | | |
Weighted-average remaining lease term — finance leases (in years) (*) | | | 14.3 | | | 1.8 | |
Weighted-average remaining lease term — operating leases (in years) | | 10.7 | | | 7.3 | | | 16.2 | | | 17.9 | |
Weighted-average discount rate (in percentage) | | 5 | % | | 5 | % | |
Weighted-average discount rate — finance leases (in percentage) (*) | | | 6 | % | | 3 | % |
Weighted-average discount rate — operating leases (in percentage) | | | 5 | % | | 5 | % |
(*) The increase in the weighted-average remaining lease term and discount rate is attributable to the deferral of the buy-out payment in the financing liability to June 2038, as further described under Note 11 to the consolidated financial statements.
Future minimum lease payments under non-cancellable leases as of December 31, 20202023 were as follows:
| | | Operating Leases | | | Finance Leases | |
| | | (Dollars in thousands) | |
Year ending December 31, | | | | | | | | |
2021 | | $ | 3,255 | | | $ | 4,177 | |
2022 | | | 2,539 | | | | 4,116 | |
2023 | | | 1,902 | | | | 3,015 | |
2024 | | | 1,625 | | | | 1,156 | |
2025 | | | 1,440 | | | | 565 | |
Thereafter | | | 9,559 | | | | 3,694 | |
Total future minimum lease payments | | | 20,320 | | | | 16,723 | |
Less imputed interest | | | 4,501 | | | | 4,450 | |
Total | | $ | 15,819 | | | $ | 12,273 | |
ORMAT TECHNOLOGIES, INC. AND SUBSIDIARIES
NOTES TO CONSOLIDATED FINANCIAL STATEMENTS
| | | Operating Leases | | | Finance Leases | | | Financing Liability (1) | |
| | | (Dollars in thousands) | |
Year ending December 31, | | | | | | | | | | | | |
2024 | | $ | 3,908 | | | $ | 1,456 | | | $ | 17,578 | |
2025 | | | 3,246 | | | | 1,291 | | | | 17,535 | |
2026 | | | 2,471 | | | | 913 | | | | 22,675 | |
2027 | | | 2,224 | | | | 136 | | | | 20,815 | |
2028 | | | 1,900 | | | | 0 | | | | 20,578 | |
Thereafter | | | 20,756 | | | | 0 | | | | 277,827 | |
Total future minimum lease payments | | | 34,505 | | | | 3,796 | | | | 377,008 | |
Less imputed interest | | | 11,386 | | | | 245 | | | | 151,248 | |
Total | | $ | 23,119 | | | $ | 3,551 | | | $ | 225,760 | |
B.
| Leases in which the Company is a lessor
|
The table below presents(1) Financing liability was assumed as part of the lease income recognized for lessors:Terra-Gen business combination transaction as further described under Note 2 to the consolidated financial statements and is related to the sale and lease-back transaction of the Dixie Valley geothermal assets.
| | | Year Ended December 31, 2020 | | | Year Ended December 31, 2019 | |
| | | (Dollars in thousands) | |
Lease income relating to lease payments of operating leases | | $ | 473,260 | | | $ | 479,059 | |
ORMAT TECHNOLOGIES, INC. AND SUBSIDIARIES
NOTES TO CONSOLIDATED FINANCIAL STATEMENTS
Leases in which the Company is a lessor
The table below presents lease income recognized as a lessor:
| | | Year Ended December 31, | |
| | | 2023 | | | 2022 | | | 2021 | |
| | | (Dollars in thousands) | |
Lease income relating to lease payments of operating leases | | $ | 542,065 | | | $ | 529,264 | | | $ | 502,355 | |
NOTE 2322 — QUARTERLY FINANCIAL INFORMATION (UNAUDITED)
| | | Three Months Ended | |
| | | Mar. 31,2019 | | | June 30,2019 | | | Sept. 30,2019 | | | Dec. 31,2019 | | | Mar. 31,2020 | | | June 30,2020 | | | Sept. 30,2020 | | | Dec. 31,2020 | |
| | | (Dollars in thousands, except per share amounts) | |
Revenues: | | | | | | | | | | | | | | | | | | | | | | | | | | | | | | | | |
Electricity | | $ | 142,908 | | | $ | 129,079 | | | $ | 123,978 | | | $ | 144,368 | | | $ | 142,856 | | | $ | 128,685 | | | $ | 123,660 | | | $ | 146,192 | |
Product | | | 52,128 | | | | 52,030 | | | | 43,037 | | | | 43,814 | | | | 47,411 | | | | 43,701 | | | | 29,625 | | | | 27,388 | |
Energy storage | | | 4,002 | | | | 2,956 | | | | 3,484 | | | | 4,260 | | | | 1,846 | | | | 2,514 | | | | 5,662 | | | | 5,802 | |
Total revenues | | | 199,038 | | | | 184,065 | | | | 170,499 | | | | 192,442 | | | | 192,113 | | | | 174,900 | | | | 158,947 | | | | 179,382 | |
Cost of revenues: | | | | | | | | | | | | | | | | | | | | | | | | | | | | | | | | |
Electricity | | | 77,543 | | | | 73,775 | | | | 80,124 | | | | 81,393 | | | | 71,368 | | | | 71,950 | | | | 76,670 | | | | 80,071 | |
Product | | | 42,106 | | | | 41,316 | | | | 31,073 | | | | 31,479 | | | | 36,978 | | | | 34,709 | | | | 24,037 | | | | 19,224 | |
Energy storage | | | 5,210 | | | | 3,827 | | | | 3,807 | | | | 5,068 | | | | 1,949 | | | | 2,855 | | | | 4,210 | | | | 5,046 | |
Total cost of revenues | | | 124,859 | | | | 118,918 | | | | 115,004 | | | | 117,940 | | | | 110,295 | | | | 109,514 | | | | 104,917 | | | | 104,341 | |
Gross profit | | | 74,179 | | | | 65,147 | | | | 55,495 | | | | 74,502 | | | | 81,818 | | | | 65,386 | | | | 54,030 | | | | 75,041 | |
Operating expenses: | | | | | | | | | | | | | | | | | | | | | | | | | | | | | | | | |
Research and development expenses | | | 900 | | | | 810 | | | | 1,062 | | | | 1,875 | | | | 1,619 | | | | 1,172 | | | | 1,490 | | | | 1,114 | |
Selling and marketing expenses | | | 3,865 | | | | 3,276 | | | | 3,783 | | | | 4,123 | | | | 4,794 | | | | 4,854 | | | | 4,076 | | | | 3,660 | |
General and administrative expenses | | | 15,689 | | | | 14,181 | | | | 11,931 | | | | 14,032 | | | | 16,745 | | | | 11,870 | | | | 14,539 | | | | 17,072 | |
Business interruption insurance income | | | 0 | | | | 0 | | | | 0 | | | | 0 | | | | (2,397 | ) | | | (585 | ) | | | (17,761 | ) | | | 0 | |
Operating income | | | 53,725 | | | | 46,880 | | | | 38,719 | | | | 54,472 | | | | 61,057 | | | | 48,075 | | | | 51,686 | | | | 53,195 | |
Other income (expense): | | | | | | | | | | | | | | | | | | | | | | | | | | | | | | | | |
Interest income | | | 293 | | | | 420 | | | | 482 | | | | 320 | | | | 402 | | | | 441 | | | | 626 | | | | 248 | |
Interest expense, net | | | (21,223 | ) | | | (21,517 | ) | | | (20,076 | ) | | | (17,568 | ) | | | (17,273 | ) | | | (19,785 | ) | | | (21,756 | ) | | | (19,139 | ) |
Derivatives and foreign currency transaction gains (losses) | | | 472 | | | | 19 | | | | 205 | | | | (72 | ) | | | 393 | | | | 671 | | | | 1,047 | | | | 1,691 | |
Income attributable to sale of tax benefits | | | 7,764 | | | | 4,637 | | | | 4,056 | | | | 4,415 | | | | 4,132 | | | | 5,672 | | | | 7,014 | | | | 8,902 | |
Other non-operating income (expense), net | | | 91 | | | | 1,027 | | | | 244 | | | | (482 | ) | | | 78 | | | | 304 | | | | 961 | | | | 75 | |
Income from operations before income tax and equity in earnings (losses) of investees | | | 41,122 | | | | 31,466 | | | | 23,630 | | | | 41,085 | | | | 48,789 | | | | 35,378 | | | | 39,578 | | | | 44,972 | |
Income tax (provision) benefit | | | (14,039 | ) | | | 3,529 | | | | (9,626 | ) | | | (25,477 | ) | | | (18,148 | ) | | | (11,766 | ) | | | (15,361 | ) | | | (21,728 | ) |
Equity in earnings (losses) of investees, net | | | 1,047 | | | | 1,202 | | | | 1,085 | | | | (1,481 | ) | | | (735 | ) | | | 1,658 | | | | (1,119 | ) | | | 288 | |
Net income | | | 28,130 | | | | 36,197 | | | | 15,089 | | | | 14,127 | | | | 29,906 | | | | 25,270 | | | | 23,098 | | | | 23,532 | |
Net loss (income) attributable to noncontrolling interest | | | (2,184 | ) | | | (2,259 | ) | | | 516 | | | | (1,521 | ) | | | (3,873 | ) | | | (2,224 | ) | | | (7,419 | ) | | | (2,834 | ) |
Net income (loss) attributable to the Company's stockholders | | $ | 25,946 | | | $ | 33,938 | | | $ | 15,605 | | | $ | 12,606 | | | $ | 26,033 | | | $ | 23,046 | | | $ | 15,679 | | | $ | 20,698 | |
| | | | | | | | | | | | | | | | | | | | | | | | | | | | | | | | | |
Earnings (loss) per share attributable to the Company's stockholders | | | | | | | | | | | | | | | | | | | | | | | | | | | | | | | | |
Basic | | $ | 0.51 | | | $ | 0.67 | | | $ | 0.31 | | | $ | 0.25 | | | $ | 0.51 | | | $ | 0.45 | | | $ | 0.31 | | | $ | 0.39 | |
| | | | | | | | | | | | | | | | | | | | | | | | | | | | | | | | | |
Diluted | | $ | 0.51 | | | $ | 0.66 | | | $ | 0.30 | | | $ | 0.24 | | | $ | 0.51 | | | $ | 0.45 | | | $ | 0.31 | | | $ | 0.39 | |
| | | | | | | | | | | | | | | | | | | | | | | | | | | | | | | | | |
Weighted average number of shares used in computation of earnings per share attributable to the Company's stockholders: | | | | | | | | | | | | | | | | | | | | | | | | | | | | | | | | |
Basic | | | 50,709 | | | | 50,800 | | | | 50,933 | | | | 51,017 | | | | 51,036 | | | | 51,043 | | | | 51,072 | | | | 53,106 | |
| | | | | | | | | | | | | | | | | | | | | | | | | | | | | | | | | |
Diluted | | | 51,012 | | | | 51,094 | | | | 51,334 | | | | 51,511 | | | | 51,526 | | | | 51,362 | | | | 51,282 | | | | 53,551 | |
ORMAT TECHNOLOGIES, INC. AND SUBSIDIARIES
NOTES TO CONSOLIDATED FINANCIAL STATEMENTS
NOTE 24 — SUBSEQUENT EVENTS
Cash dividend
On February 24, 2021, 21,2024,the Company’s Board of Directors declared, approved and authorized payment of a quarterly dividend of $6.7 million ($0.12 per share) to all holders of the Company’s issued and outstanding shares of common stock on March 11, 20216,2024,payable on March 29, 202120,2024.
Weather conditionsBusiness combination - Geothermal and solar assets purchase transaction
InOn February 2021,January 4, 2024, extreme weather conditionsthe Company closed a purchase transaction with Enel Green Power North America, a subsidiary of Enel SpA (ENEL.MI) to acquire a portfolio of assets which includes two contracted geothermal power plants, one triple hybrid power plant which consists of geothermal, solar PV and solar thermal units, two stand alone solar power plants, and two greenfield development assets, for a total cash consideration of $272 million (subject to a customary post-closing working capital adjustment to the purchase price, based on the levels of net working capital of the acquired companies) for 100% of the equity interests in the areaentities holding those assets.
The geothermal power plants include the Cove Fort power plant located in Beaver County, Utah, which sells electricity under a long-term power purchase agreement with Salt River Project and the Salt Wells power plant located in Churchill County, Nevada, which sells electricity under a long-term power purchase agreement with NV Energy. The Stillwater triple hybrid geothermal, solar PV and solar thermal power plant is located in Churchill County, Nevada, and sells electricity to NV Energy under a power purchase agreement. The Solar assets of Georgetown Texas, resultedStillwater Solar PV II in a significant increaseChurchill County, Nevada, and Woods Hill in demand forWindham County, Connecticut, sell their electricity on the one hand and decrease in the electricity supply in the region on the other hand. On February 15, the Electricity Reliability Council of Texas (“ERCOT”) issued an Energy Emergency Alert level 3 ("EEA 3") prompting rotating outages in Texas. Eventually, this led to a significant increase in the Responsive Reserve Service (“RRS”) market prices, where the Company operates its Rabbit Hill battery energy storage facility which provides ancillary services and energy optimization to the wholesale markets managed by ERCOT. Due to the electricity supply shortage, ERCOT restricted battery charging in the Rabbit Hill facility starting February 16, 2021 to February 19, 2021 resulting in a limited ability of the Rabbit Hill storage facility to provide RRS. under power purchase agreements, respectively.
As a result of the acquisition, the Company incurred lossesexpanded its overall generation capacity and expects to improve the profitability of up to approximately $11 million from a hedgethe purchased assets through cost reduction and synergies. The Company will account for the transaction in relation to its inability to provide RRS during that period that it doesunder ASC not805, expect to recover from the market. Starting February 19, 2021, the Rabbit Hill energy storage facility resumed operation in full capacity.
In addition, as the eventBusiness Combinations. The Company is still unfolding,evaluating the Company may incur additional losses related to imbalance charges from the grid operator in respect of its demand response operation as it may not be able to collect such charges from its customers.
Tax law amendment
In January 2017, the Encouragement Law was amended (the "Amendment” or "Amendment 73"). The Amendment includes, inter alia, new tax incentives track: Preferred Technological Enterprise (“PTE”). The new tax incentives include incentives with respect to income generated from intellectual property, such as patents and software (“Technological Income”), subject to meeting certain conditions. In order to qualify for the PTE tax regime, a company is required to meet certain mandatory conditions. Companies that do not meet the mandatory conditions are required to receive an approval from the Israeli Innovation Authority ("IIA") for owning "Innovation Promoting Enterprise" in order to be eligible for a reduced corporate income tax rate of 12%accounting related to the Preferred Technological Income stream under PTE.
Ormat Systems applied for a ruling frompurchase transaction, including the IIA in order to qualify as an “Innovation Promoting Enterprise", that will allow the company to bypass the quantitative pre-conditions and be eligible for the tax benefits of a PTE. On January 20, 2021, Ormat Systems received the IIA approval that it owns an "Innovation Promoting Enterprise"purchase price allocation, and therefore, such allocation is eligible for a reduced corporate tax rate of 12%not onprovided herewith. The Company expects to consolidate the acquired assets in its "Preferred Technological Income" forconsolidated financial statements starting at the tax years 2019 and 2020 (effective tax rate of approximately 13% for 2019 and 2020). This impact will be recorded in the first quarter of 2021.acquisition date.
ORMAT TECHNOLOGIES, INC. AND SUBSIDIARIES
NOTES TO CONSOLIDATED FINANCIAL STATEMENTS
Hapoalim 2024 Loan
Concurrently with the purchase transaction with EGPNA, on January 2, 2024, the Company entered into a definitive loan agreement (the "BHI Loan Agreement 2024") with Hapoalim Bank. The BHI Loan Agreement 2024 provides for a loan by Hapoalim Bank to the Company in an aggregate principal amount of $75 million (the “Hapoalim 2024 Loan”). The outstanding principal amount of the Hapoalim 2024 Loan will be repaid in 32 quarterly payments of $2.3 million each, commencing on April 1, 2024. The duration of the Hapoalim 2024 Loan is 8 years and it bears interest of 6.6%, payable every three months. The BHI Loan Agreement 2024 includes various affirmative and negative covenants, including a requirement that the Company maintain (i) a financial debt to adjusted EBITDA ratio not to exceed 6.0, (ii) a minimum equity capital amount of not less than $750 million, and (iii) an equity capital to total assets ratio of not less than 25%. The BHI Loan Agreement includes other customary affirmative and negative covenants, including payment and covenant events of default.
HSBC Bank 2024 Loan
Concurrently with the purchase transaction with EGPNA, on January 2, 2024, the Company entered into a definitive loan agreement (the "HSBC Loan Agreement 2024") with HSBC Bank. The HSBC Loan Agreement 2024 provides for a loan by HSBC Bank to the Company in an aggregate principal amount of $125 million (the “HSBC Bank 2024 Loan”). The outstanding principal amount of the HSBC Bank 2024 Loan will be repaid in 7 semi-annual payments of $12.5 million each, commencing on July 1, 2024, and an additional final principal payment on January 1, 2028 of $37.5 million. The duration of the HSBC Bank 2024 Loan is 4 years and it bears interest of 3-month SOFR+2.25%, payable quarterly. The HSBC Loan Agreement 2024 includes various affirmative and negative covenants, including a requirement that the Company maintain (i) a financial debt to adjusted EBITDA ratio not to exceed 6, (ii) a minimum equity capital amount of not less than $750 million, and (iii) an equity capital to total assets ratio of not less than 25%. The HSBC Loan Agreement 2024 includes other customary affirmative and negative covenants, including payment and covenant events of default.
Interest Rate Swap
Concurrently with the issuance of the HSBC Bank 2024 Loan, the Company entered into a long-term interest rate swap ("IRS") transaction with the objective of hedging the variable interest rate fluctuations related to the HSBC Bank 2024 Loan at a fixed 3-month SOFR of 3.9%. The terms of the IRS match those of the HSBC Bank 2024 Loan, including the notional amount of the principal and interest payment dates. The Company designated the IRS as a cash flow hedge as per ASC 815, Derivatives and Hedging, and accordingly will measure the IRS instrument at fair value. The changes in the IRS fair value will initially be recorded in Other Comprehensive Income (Loss) and reclassified to Interest expense, net in the same period or periods during which the hedged transaction affects earnings. The hedged transaction and the IRS effect in earnings are presented in the same line item in the consolidated statements of operations and comprehensive income.
ITEM 9. CHANGES IN AND DISAGREEMENTS WITH ACCOUNTANTS ON ACCOUNTING ANDFINANCIAL DISCLOSURE
None.
ITEM 9A. CONTROLS AND PROCEDURES
Disclosure Controls and Procedures
We maintain disclosure controls and procedures that are designed to provide reasonable assurance that information required to be disclosed by us in reports that we file or submit under the Securities Exchange Act of 1934, as amended (the “Exchange Act”) is recorded, processed, summarized and reported within the time periods specified in the SEC’s rules and forms, and that such information is accumulated and communicated to our management, including our CEO (principal executive officer) and CFO (principal financial officer), as appropriate, to allow for timely decisions regarding required disclosure. In designing and evaluating the disclosure controls and procedures, management recognizes that any controls and procedures, no matter how well designed and operated, can provide only reasonable assurance of achieving the desired control objectives, and management is required to apply its judgment in evaluating the cost-benefit relationship of possible controls and procedures.
As required by SEC Rule 13a-15(e), we carried out an evaluation, under the supervision and with the participation of our management, including our CEO and CFO, of the effectiveness of our disclosure controls and procedures as of December 31, 2020.2023. Based on this evaluation, our CEO and CFO concluded that our disclosure controls and procedures were effective as ofDecemberof December 31, 20202023 to provide the reasonable assurance described above.
Changes in Internal Control Over Financial Reporting
Other than steps taken in connection with the completion of the remediation process described below, thereThere were no changes in our internal control over financial reporting that occurred during the quarter ended December 31, 20202023 that have materially affected, or are reasonably likely to materially affect, our internal control over financial reporting.
During the year ended December 31, 2020, we completed our internal control procedures to address the previously identified material weakness as described in more detail under “Remediation Efforts” below.
Management’s Report on Internal Control over Financial Reporting
Our management is responsible for establishing and maintaining adequate internal control over financial reporting, as such term is defined in Rule 13a-15(f) of the Exchange Act. Under the supervision and with the participation of our management, including the CEO and the CFO, we carried out an evaluation of the effectiveness of our internal control over financial reporting as of December 31, 20202023 using the criteria established in “Internal Control-Integrated Framework” (2013), issued by the Committee of Sponsoring Organizations of the Treadway Commission (COSO). Based on that evaluation, our management concluded that our internal control over financial reporting was effective as of December 31, 2020.2023.
Our internal control over financial reporting as of December 31, 20202023 has been audited by Kesselman & Kesselman, Certified Public Accountants (Isr.), an independent registered public accounting firm and a member of PricewaterhouseCoopers International Limited (“PwC”), as stated in their report which is included under “Item 8—Financial Statements.”
Previously Identified Material Weaknesses in Internal Control Over Financial ReportingITEM 9B.OTHER INFORMATION
We previously identified and disclosed in our Annual Report on Form 10-K for the years ended December 31, 2017, 2018 and 2019, as well as in our Quarterly Reports on Form 10-Q for each interim period in fiscal 2020, material weaknesses in our internal control over financial reporting relating to the following:Item 5.02 Departure of Directors or Certain Officers; Election of Directors; Appointment of Certain Officers; Compensatory Arrangements of Certain Officers.
Material weaknessAdoption of Change in Control Severance Plan. In
On February 21, 2023, the Compensation Committee (the “Compensation Committee”) of the Board of Directors (the “Board”) of the Company approved the Ormat Technologies, Inc. Change in Control Severance Plan (the “Severance Plan”), pursuant to which certain management employees, including the Company’s named executive officers (the “Eligible Participants”) may be eligible for certain payments and benefits upon certain terminations of employment in connection with a Change in Control (as defined in the change in our repatriation strategy and the related releaseSeverance Plan) of the US income tax valuation allowance inCompany. The Severance Plan was adopted following a review of the second quarter of 2017, we did not perform an effective risk assessment relatedseverance provisions applicable to our internal controls over the accounting for income taxes. As a result, we identified a deficiency in the design of our internal control over financial reporting related to our accounting for income taxes, which resulted in the restatementsmembers of the Company’s unaudited condensed consolidated financial statementsmanagement team and in consultation with the Compensation Committee’s independent compensation consultant, so as to standardize severance payments and benefits for the threeEligible Participants and six months ended June 30, 2017, the threeto provide management and nine months ended September 30, 2017, and the restatement of the Company’s consolidated financial statements for the year ended December 31, 2017. Our management concludedcertain key employees with severance benefits in connection with a Change in Control that this deficiency constitutes a material weakness in our internal control over financial reporting.are consistent with market practice.
In Management’s ReportPursuant to the Severance Plan, in the event that an Eligible Participant’s employment is terminated by the Company without Cause within three months prior to and 24 months following a Change in Control, other than due to death or Disability, or an Eligible Participant resigns for Good Reason (all as defined in the Severance Plan) and subject to the effectiveness of a release and continued compliance with restrictive covenants, the Eligible Participant is entitled to the following: (i) cash severance payable in a lump sum equal to 200% or 150% (depending on Internal Control Over Financial Reporting includedthe Eligible Participant is designated as tier 1 or 2, respectively) of the sum of his/her base salary and target bonus; (ii) payment of a prorated target bonus in our original Annual Report on Form 10-K forrespect of the year ended December 31, 2017, our management concludedof termination payable in a lump sum; (iii) for U.S. participants, eligibility for monthly reimbursements of COBRA premiums for 18 months; and (iv) accelerated vesting of all equity awards that we did not maintain effective internal control over financial reportingwere outstanding as of December 31, 2017 becausethe Change in Control, with any performance-vesting awards to be deemed vested at actual level of performance determined at the material weakness described above.time of such termination (or maximum target level if actual performance cannot reasonably be determined). The above severance benefits are in lieu of any other severance benefits to which the participant may be entitled, except for certain statutory severance entitlements under Israeli law. As a result, we concluded that we did not maintain an effective internal control over financial reportingcondition of participation, Eligible Participants must execute and comply with restrictive covenants, which generally provide for post-termination non-competition and employee and customer non-solicit restrictions for periods of 12 or 18 months for tiers 1 and 2, respectively, as of December 31, 2017, based on the criteria in Internal Control-Integrated Framework (2013) issued by the COSO.well as perpetual confidentiality and non-disparagement provisions.
Remediation EffortsThe foregoing description of Previously Disclosed Material Weaknesses
Subsequentthe Severance Plan does not purport to be complete and is subject to, and qualified in its entirety by reference to, the evaluation made in connectionfull text thereof, a copy of which is filed with filing our Amendedthis Annual Report on Form 10-K for the year ended December 31, 2017, our management, with the oversight of the Audit Committee of the Board of Directors, has continued the process of remediating the material weakness. In connection with the remediation process, we have:
| •
| performed an enhanced risk assessment related to our internal controls over the accounting for income taxes;
|
| •
| recruited additional tax personnel throughout the years, including a VP of Tax in January 2019;
|
| •
| engaged an external tax and accounting firm to prepare and review our annual and quarterly income tax provision;
|
| •
| implemented specific control procedures for the review, analysis and reporting of our income tax accounts, including control procedures of projections that support the deferred tax assets and liabilities;
|
| •
| strengthened our income tax controls with improved documentation, communication and oversight.
|
As a result of these remediation activitiesas Exhibit 10.43 and based on testing of the new and modified controls for operating effectiveness, our management concluded that we remediated the previously reported material weakness as of December 31, 2020.incorporated by reference herein.
ITEM 9B. OTHER INFORMATION9C. DISCLOSURE REGARDING FOREIGN JURISDICTIONS THAT PREVENT INSPECTIONS
None.Not applicable.
PART III
ITEM 10. DIRECTORS, EXECUTIVE OFFICERS AND CORPORATE GOVERNANCE
Information required by this item and not set forth below is incorporated herein by reference to our definitive proxy statement for the 20212022 annual meeting.
Audit Committee
Information required by this Item and not set forth belowmeeting of stockholders, which is incorporated herein by reference to our definitive proxy statement forbe filed with the 2021 annual meeting.SEC (the “2022 Proxy Statement”).
ITEM 11. EXECUTIVE COMPENSATION
Information required by this item and not set forth below is incorporated herein by reference to our definitive proxy statement for the 2021 annual meeting.2024 Proxy Statement.
ITEM 12. SECURITY OWNERSHIP OF CERTAIN BENEFICIAL OWNERS AND MANAGEMENT AND RELATED STOCKHOLDER MATTERS
Information required by this item and not set forth below is incorporated herein by reference to our definitive proxy statement for the 2021 annual meeting.2024 Proxy Statement.
ITEM 13. CERTAIN RELATIONSHIPS AND RELATED TRANSACTIONS, AND DIRECTOR INDEPENDENCE
Information required by this item and not set forth below is incorporated herein by reference to our definitive proxy statement for the 2021 annual meeting.2024 Proxy Statement.
ITEM 14. PRINCIPAL ACCOUNTANT FEES AND SERVICES
Information required by this item is incorporated herein by reference to our definitive proxy statement for the 2021 annual meeting.2024 Proxy Statement.
PART IV
ITEM 15. EXHIBITS, FINANCIAL STATEMENT SCHEDULES
(a) (1) List of Financial Statements
See Index to Financial Statements in Part II, Item 8 of this annual report.Annual Report.
(2) List of Financial Statement Schedules
All applicable schedule information is included in our Financial Statements in Part II, Item 8 of this annual report.Annual Report.
(b) Exhibit Index. We hereby file, as exhibits to this Annual Report, those exhibits listed on the Exhibit Index immediately following the signature page hereto.
(C) EXHIBIT INDEX
4.3
| Indenture of Trust and Security Agreement, dated September 23, 2011, among OFC 2 LLC, ORNI 15 LLC, ORNI 39 LLC, ORNI 42 LLC, HSS II, LLC, and Wilmington Trust Company, as Trustee and Depository, incorporated by reference to Exhibit 4.8 to Ormat Technologies, Inc.’s Quarterly Report on Form 10-Q filed with the Securities and Exchange Commission on November 4, 2011. |
10.15*
| 10.20 | Note Purchase Agreement, dated September 23, 2011, among OFC 2 LLC, ORNI 15 LLC, ORNI 39 LLC, ORNI 42 LLC, and HSS II, LLC, as Issuers, OFC 2 Noteholder Trust, as Purchaser, John Hancock Life Insurance Company (U.S.A.), as Administrative Agent, and the United States Department of Energy (DOE), as Guarantor, incorporated by reference to Exhibit 10.1 to Ormat Technologies, Inc.’s Quarterly Report on Form 10-Q filed with the Securities and Exchange Commission on November 4, 2011. |
| 10.3810.21
| Finance Agreement, dated as of August 23, 2012, between OrPower 4, Inc., an indirect wholly-owned subsidiary of Ormat Technologies, Inc., and Overseas Private Investment Corporation, incorporated by reference to Exhibit 10.1 to Ormat Technologies, Inc.’s Quarterly Report on Form 10-Q filed with the Securities and Exchange Commission on November 8, 2012. |
| 10.3910.22
| Amendment No. 1 to the Finance Agreement, dated as of August 23, 2012, between OrPower 4, Inc., an indirect wholly-owned subsidiary of Ormat Technologies, Inc., and Overseas Private Investment Corporation, incorporated by reference to Exhibit 10.1 to Ormat Technologies, Inc.’s Quarterly Report on Form 10-Q filed with the Securities and Exchange Commission on November 8, 2012. |
10.53 | JBIC Facility Agreement, dated March 28, 2014, by and among Kyuden Sarulla Pte. Ltd., OrSarulla Inc., PT Medco Geopower Sarulla, Sarulla Operations Ltd, Sarulla Power Asset Limited, Japan Bank for International Cooperation and Mizuho Bank, Ltd., dated March 28, 2014, incorporated by reference to Exhibit 10.7 to Ormat Technologies, Inc.’s Quarterly Report on Form 10-Q filed with the Securities and Exchange Commission on May 9, 2014. |
10.54
| Common Terms Agreement, dated March 28, 2014, by and among Kyuden Sarulla Pte. Ltd., OrSarulla Inc., PT Medco Geopower Sarulla, Sarulla Operations Ltd, Sarulla Power Asset Limited, Japan Bank for International Cooperation, Asian Development Bank, The Bank of Tokyo-Mitsubishi UFJ, Ltd., ING Bank N.V., Tokyo Branch, National Australia Bank Limited, Mizuho Bank, Ltd., Mizuho Bank (USA), Pt. Bank Mizuho Indonesia, Société Générale, Société Générale Tokyo Branch, and Sumitomo Mitsui Banking Corporation, dated March 28, 2014, incorporated by reference to Exhibit 10.8 to Ormat Technologies, Inc.’s Quarterly Report on Form 10-Q filed with the Securities and Exchange Commission on May 9, 2014.
|
10.55
| Covered Lenders Facility Agreement, dated March 28, 2014, by and among Kyuden Sarulla Pte. Ltd., Orsarulla Inc., PT Medco Geopower Sarulla, Sarulla Operations Ltd, Sarulla Power Asset Limited, The Bank of Tokyo-Mitsubishi UFJ, Ltd., ING Bank N.V., Tokyo Branch, National Australia Bank Limited, Société Générale, Tokyo Branch, and Sumitomo Mitsui Banking Corporation, dated March 28, 2014, incorporated by reference to Exhibit 10.9 to Ormat Technologies, Inc.’s Quarterly Report on Form 10-Q filed with the Securities and Exchange Commission on May 9, 2014.
|
10.56
| ADB Facility Agreement, dated March 28, 2014, by and among Kyuden Sarulla Pte. Ltd., OrSarulla Inc., PT Medco Geopower Sarulla, Sarulla Operations Ltd, Sarulla Power Asset Limited and Asian Development Bank, dated March 28, 2014, incorporated by reference to Exhibit 10.10 to Ormat Technologies, Inc.’s Quarterly Report on Form 10-Q filed with the Securities and Exchange Commission on May 9, 2014.
|
10.57
| Ormat Equity Support Deed, dated March 28, 2014, by and among Ormat International, Inc., Ormat Holding Corp., OrPower 11 Inc., OrSarulla Inc., Sarulla Operations Ltd, Mizuho Bank, Ltd. and Mizuho Bank (USA), dated March 28, 2014, incorporated by reference to Exhibit 10.11 to Ormat Technologies, Inc.’s Quarterly Report on Form 10-Q filed with the Securities and Exchange Commission on May 9, 2014.
|
| 10.46+†^ | Membership Interest Purchase Agreement, dated October 23, 2023, between Snow Wolf Holdings LLC and Enel Green Power North America, Inc. and Enel Kansas, LLC, Enel Geothermal, LLC, EGP Nevada Power, LLC, Stillwater Woods Hill Holdings, LLC, Enel Surprise Valley, LLC, and Enel Cove Fort II, LLC. |
101.INS+ Inline XBRL Instance Document.
101.SCH+ Inline XBRL Taxonomy Extension Schema Document.
101.CAL+ Inline XBRL Taxonomy Extension Calculation Linkbase Document.
101.DEF+ Inline XBRL Taxonomy Extension Definition Linkbase Document.
101.LAB+ Inline XBRL Taxonomy Extension Label Linkbase Document.
101.PRE+ Inline XBRL Taxonomy Extension Presentation Linkbase Document.
104.1+ Cover Page Interactive Data File (Embedded within the Inline XBRL document and included in Exhibit 101).
| * | Management contract or compensatory plan in which directors and/or executive officers are eligible to participate. |
| ^ | Schedules to this exhibit have been omitted pursuant to Item 601(a)(5) of Regulation S-K. |
| † | Certain confidential information contained in this document has been redacted in accordance with Item 601(b)(10)(iv) of Regulation S-K. |
| ^#
| Schedules have been omitted pursuant to Item 601(b)(2) of Regulation S-K. We will furnish the omitted schedules to the SEC upon request.Furnished herewith.
|
ITEM 16. FORM 10-K SUMMARY
None.
SIGNATURES
Pursuant to the requirements of Section 13 or 15(d) of the Securities Exchange Act of 1934, the Registrant has duly caused this report to be signed on its behalf by the undersigned, thereunto duly authorized.
| | ORMAT TECHNOLOGIES, INC. | |
| | | | |
| | By: | /s/ Doron Blachar | |
| | | Name: Doron Blachar | |
| | | Title: Chief Executive Officer | |
Date: February 26, 202123, 2024
POWER OF ATTORNEY
KNOW ALL PERSONS BY THESE PRESENTS, that each person whose signature appears below constitutes and appoints Doron Blachar and Assaf Ginzburg, jointly and severally, his or her attorneys-in-fact, each with the power of substitution, for him or her in any and all capacities, to sign any amendments to this Annual Report on Form 10-K, and to file the same, with exhibits thereto and other documents in connection therewith, with the Securities and Exchange Commission, hereby ratifying and confirming all that each of said attorneys-in-fact, or his substitute or substitutes, may do or cause to be done by virtue hereof.
Pursuant to the requirements of the Securities Exchange Act of 1934, this report has been signed below by the following persons on behalf of the Registrant and in the capacities and on the dates indicated on February 26, 2021.23, 2024.
Signature | | Capacity | | Date |
| | | | |
/s/ Doron Blachar | | Chief Executive Officer | | February 23, 2024 |
Doron Blachar | | (Principal Executive Officer) | | |
| | | | |
/s/ AssiAssaf Ginzburg | | Chief Financial Officer | | February 23, 2024 |
AssiAssaf Ginzburg
| | (Principal Financial Officer and Principal Accounting Officer) | | |
| | | | |
/s/ Isaac Angel | | Chairman of the Board of Directors | | February 23, 2024 |
Isaac Angel | | | | |
| | | | | |
/s/ Dan FalkKarin Corfee | | Director | | February 23, 2024 |
Dan FalkKarin Corfee
| | | | |
| | | | |
/s/ Stan Koyanagi
| | Director
| |
Stan Koyanagi
| | | |
| | | | |
/s/ David Granot | | Director | | February 23, 2024 |
David Granot | | | | |
| | | | | |
/s/ Ravit Bar NivMike Nikkel | | Director | | February 23, 2024 |
Ravit Bar NivMike Nikkel
| | | | |
| | | | |
/s/ Michal Marom | | Director | | February 23, 2024 |
Michal Marom | | | | |
| | | | |
/s/ Hidetake Takahashi | | Director | | February 23, 2024 |
Hidetake Takahashi | | | | |
| | | | |
/s/ Dafna Sharir | | Director | | February 23, 2024 |
Dafna Sharir | | | | |
| | | | |
/s/ Stanley B. Stern | | Director | | February 23, 2024 |
Stanley B. Stern | | | |
/s/ Byron Wong
| | Director
| |
Byron Wong
| | | |
| | | | | |
/s/ Albertus “Bert” BrugginkByron Wong | | Director | | February 23, 2024 |
Albertus “Bert” BrugginkByron Wong
| | | | |