
UNITED STATES
SECURITIES AND EXCHANGE COMMISSION
Washington, D.C. 20549
FORM 10-K
| ☒ Annual Report Pursuant to Section 13 or 15(d) of the Securities Exchange Act of 1934 |
For the Fiscal Year Ended December 31, 20202023
or
| ☐ Transition Report Pursuant to Section 13 or 15(d) of the Securities Exchange Act of 1934 |
For the transition period from ________to________
P.A.M. TRANSPORTATION SERVICES, INC.
(Exact name of registrant as specified in its charter)
Delaware | 0-1507 | 71-0633135 |
(State or other jurisdiction of incorporation or organization) | (Commission File Number) | (I.R.S. Employer Identification No.) |
297 West Henri De Tonti Blvd, Tontitown, Arkansas 72770
(Address of principal executive offices) (Zip Code)
Registrant’s telephone number, including area code: (479) 361-9111
N/A |
(Former name, former address and former fiscal year, if changed since last report) |
Securities registered pursuant to Section 12(b) of the Act:
Title of each class | Trading Symbol(s) | Name of each exchange on which registered |
Common Stock, $.01 par value | PTSI | NASDAQ Global Market |
Securities registered pursuant to section 12(g) of the Act: None
Indicate by check mark if the registrant is a well-known seasoned issuer, as defined in Rule 405 of the Securities Act.
| Yes ☐ No ☑ |
Indicate by check mark if the registrant is not required to file reports pursuant to Section 13 or Section 15(d) of the Act.
Yes ☐ No ☑ |
|
Indicate by check mark whether the registrant (1) has filed all reports required to be filed by Section 13 or 15(d) of the Securities Exchange Act of 1934 during the preceding 12 months (or for such shorter period that the registrant was required to file such reports), and (2) has been subject to such filing requirements for the past 90 days.
Yes ☑ No ☐ |
|
Indicate by check mark whether the registrant has submitted electronically every Interactive Data File required to be submitted pursuant to Rule 405 of Regulation S-T (§232.405 of this chapter) during the preceding 12 months (or for such shorter period that the registrant was required to submit such files).
Yes ☑ No ☐ |
|
Indicate by check mark whether the registrant is a large accelerated filer, an accelerated filer, a non-accelerated filer, a smaller reporting company, or an emerging growth company. See the definitions of “large accelerated filer,” “accelerated filer,” “smaller reporting company,” and “emerging growth company” in Rule 12b-2 of the Exchange Act.
| Large accelerated filer ☐ | Accelerated filer ☑ | |
| ||
Non-accelerated filer ☐ | Smaller reporting company ☑ | |
| Emerging growth company ☐ |
If an emerging growth company, indicate by check mark if the registrant has elected not to use the extended transition period for complying with any new or revised financial accounting standards provided pursuant to Section 13(a) of the Exchange Act. ☐
Indicate by check mark whether the registrant has filed a report on and attestation to its management’s assessment of the effectiveness of its internal control over financial reporting under Section 404(b) of the Sarbanes-Oxley Act (15 U.S.C. 7262(b)) by the registered public accounting firm that prepared or issued its audit report. ☑
If securities are registered pursuant to Section 12(b) of the Act, indicate by check mark whether the financial statements of the registrant included in the filing reflect the correction of an error to previously issued financial statements. ☐
Indicate by check mark whether any of those error corrections are restatements that required a recovery analysis of incentive-based compensation received by any of the registrant’s executive officers during the relevant recovery period pursuant to §240.10D-1(b). ☐
Indicate by check mark whether the registrant is a shell company (as defined in Rule 12b-2 of the Exchange Act).
Yes ☐ No ☑ |
|
The aggregate market value of the common stock of the registrant held by non-affiliates of the registrant computed by reference to the average of the closing bid and ask prices of the common stock as of the last business day of the registrant's most recently completed second quarter was $55,474,883.160,431,964. Solely for the purposes of this response, the registrant has assumed, without admitting for any purpose, that all executive officers and directors of the registrant, and no other persons, are the affiliates of the registrant at that date.
The number of shares outstanding of the registrant’s common stock, as of February 24, 2021: 5,724,93928, 2024: 22,034,762 shares of $.01 par value common stock.
DOCUMENTS INCORPORATED BY REFERENCE
Portions of the registrant’s definitive Proxy Statement for its 2024 Annual Meeting of Stockholders to be held on May 5, 2021, are incorporated by reference in Part III of this report.
FORWARD-LOOKING STATEMENTS
This Annual Report on Form 10-K (this “Report”) contains forward-looking statements, including statements about our operating and growth strategies, our expected financial position and operating results, industry trends, our capital expenditure and financing plans and similar matters. Such forward-looking statements are found throughout this Report, including under Item 1, Business, Item 1A, Risk Factors, Item 7, Management’s Discussion and Analysis of Financial Condition and Results of Operations, and Item 7A, Quantitative and Qualitative Disclosures About Market Risk. In those and other portions of this Report, the words “believe,” “may,” “will,” “estimate,” “continue,” “anticipate,” “intend,” “expect,” “project”, “could”, “should”, “would” and similar expressions, as they relate to us, our management, and our industry are intended to identify forward-looking statements. We have based these forward-looking statements largely on our current expectations and projections about future events and financial trends affecting our business. Actual results may differ materially. Some of the risks, uncertainties and assumptions that may cause actual results to differ from these forward-looking statements include, but are not limited to ongoing and potential future economic, business and operational disruptions and uncertainties due to the COVID-19 pandemic or other public health crises; excess capacity in the trucking industry; surplus inventories; recessionary economic cycles and downturns in customers’ business cycles; a significant or sustained reduction in or termination of the Company's trucking service by a key customer, including as a result of recent or future labor disruptions; increases or rapid fluctuations in fuel prices, interest rates, fuel taxes, tolls, and license and registration fees; potential future economic, business and operational disruptions and uncertainties due to public health crises; the resale value of the Company’s used equipment andequipment; the price and availability of new equipment;equipment consistent with anticipated acquisition and replacement plans; increases in compensation for and difficulty in attracting and retaining qualified drivers and owner-operators; increases in insurance premiums and deductible amounts relating to accident, cargo, workers’ compensation, health, and other claims; unanticipated increases in the number or amount of claims for which the Company is self-insured; inability of the Company to continue to secure acceptable financing arrangements; seasonal factors such as harsh weather conditions that increase operating costs; competition from trucking, rail, and intermodal competitors including reductions in rates resulting from competitive bidding; the ability to identify acceptable acquisition candidates, consummate acquisitions, and integrate acquired operations; our ability to develop and implement suitable information technology systems and prevent failures in or breaches of such systems; the impact of future or pending litigation; general risks associated with doing business in Mexico, including, without limitation, exchange rate fluctuations, inflation, import duties, tariffs, quotas, political and economic instability and terrorism; the potential impact of new laws, regulations or policy, including, without limitation, laws and regulations governing the classification of independent contractors as employees, tariffs, import/export, trade and immigration regulations or policies; a significant reduction in or termination of the Company’s trucking service by a key customer; and other factors described under the headings “Risk Factors,” “Management’s Discussion and Analysis of Financial Condition and Results of Operations,” and “Quantitative and Qualitative Disclosures About Market Risk” of this Report.
All forward-looking statements attributable to us, or to persons acting on our behalf, are expressly qualified in their entirety by this cautionary statement.
We undertake no obligation to publicly update or revise any forward-looking statements, whether as a result of new information, future events or otherwise. In light of these risks and uncertainties, the forward-looking events and circumstances discussed in this Report might not transpire.
P.A.M. TRANSPORTATION SERVICES, INC.
FORM 10-K
For the fiscal year ended December 31, 2020.2023
Page | |||
Item 1 | |||
Item 1A |
| ||
Item 1B |
| ||
Item 1C | |||
Item 2 | |||
Item 3 | |||
Item 4 |
| ||
Item 5 | |||
Item 6 | |||
Item 7 | Management's Discussion and Analysis of Financial Condition and Results of Operations |
| |
Item 7A |
| ||
Item 8 |
| ||
Item 9 | Changes in and Disagreements with Accountants on Accounting and Financial Disclosure |
| |
Item 9A |
| ||
Item 9B |
| ||
Item 9C | Disclosure Regarding Foreign Jurisdictions that Prevent Inspections | ||
Item 10 |
| ||
Item 11 |
| ||
Item 12 | Security Ownership of Certain Beneficial Owners and Management and Related Stockholder Matters |
| |
Item 13 | Certain Relationships and Related Transactions, and Director Independence |
| |
Item 14 |
| ||
Item 15 |
| ||
| |||
Unless the context otherwise requires, all references in this Annual Report on Form 10-K to “P.A.M.,” the “Company,” “we,” “our,” or “us” mean P.A.M. Transportation Services, Inc. and its subsidiaries.
We are a holding company that owns subsidiaries engaged in providing truckload dry van carrier services transporting general commodities throughout the continental United States and Mexico, as well as in certain Canadian provinces. WeOur consolidated operating subsidiaries also provide transportation services in Mexico under agreements with Mexican carriers. Our freight consists primarily of automotive parts, expedited goods, consumer goods, such as general retail store merchandise, and manufactured goods, such as heating and air conditioning units.
P.A.M. Transportation Services, Inc. is a holding company incorporated under the laws of the State of Delaware in June 1986. We conduct operations and hold assets principally through the following wholly ownedwholly-owned subsidiaries: P.A.M. Transport, Inc., Met Express, Inc., Costar Real Estate Holding, Inc., Costar Equipment, Inc., Costar Management, Inc., Select CDL Driving School, Inc., Unmoored Realty, LLC, T.T.X., LLC, P.A.M. Cartage Carriers, LLC, Overdrive Leasing, LLC, P.A.M. Logistics Services, Inc., Choctaw Express, LLC, Choctaw Brokerage, Inc., Transcend Logistics, Inc., Decker Transport Co., LLC, East Coast Transport and Logistics, LLC, S & L Logistics, Inc., P.A.M. International, Inc, and P.A.M. Mexico Holdings LLC. Our operating authorities are held by P.A.M. Transport, Inc., Met Express, Inc., P.A.M. Cartage Carriers, LLC, Choctaw Express, LLC, Choctaw Brokerage, Inc., T.T.X., LLC, Decker Transport Co., LLC, and East Coast Transport and Logistics, LLC. Effective on January 1, 2010, the operations of most of the Company’s operating subsidiaries were consolidated under the P.A.M. Transport, Inc. name in an effort to more clearly reflect the Company’s scope and available service offerings.
We are headquartered and maintain our primary terminal, maintenance facilities, and our corporate and administrative offices in Tontitown, Arkansas, which is located in northwest Arkansas, a major center for the trucking industry and where the support services for most major truck and trailer equipment manufacturers are readily available.
Segment Financial Information
The Company's operations of the Company’s subsidiaries are all in the motor carrier segment and are aggregated into a single reporting segment in accordance with the aggregation criteria under Generally Accepted Accounting Principles (“GAAP”).
Operations
Our subsidiaries’ operations can generally be classified into truckload services or brokerage and logistics services. This designation is based primarily on the ownership of the asset that performed the freight transportation service. Truckload services are performed by Company divisions that generally utilize Company-owned trucks, long-term contractors, or single-trip contractors to transport loads of freight for customers, while brokerage and logistics services coordinate or facilitate the transport of loads of freight for customers and generally involve the utilization of single-trip contractors. Both our truckload operations and our brokerage and logistics operations have similar economic characteristics and are impacted by virtually the same economic factors as discussed elsewhere in this Report. Truckload services operating revenues, before fuel surcharges, represented 76.9%65.3%, 82.7%66.1% and 80.0%67.0% of total operating revenues for the years ended December 31, 2020, 20192023, 2022 and 2018,2021, respectively. The remaining operating revenues, before fuel surcharge, for the same periods were generated by brokerage and logistics services, representing 23.1%34.7%, 17.3%33.9% and 20.0%33.0%, respectively.
Approximately 66%63% of the Company's revenues are derived from domestic shipments while approximately 34%37% of the Company’s revenues are derived from freight originating from or destined to locations in Mexico or Canada.
Impact of COVID-19
The Company’s primary concern during the COVID-19 pandemic has been to do its part to protect its employees, customers, vendors and the general public from the spread of COVID-19 while continuing to serve the vital role of supplying essential goods to the nation. Where possible, our employees are working remotely from their homes. For essential functions, including our driving professionals, we have distributed cleaning and protective supplies to various terminals so that they are available to those that need them, increased cleaning frequency and coverage, and provided employees direction on precautionary measures, such as sanitizing truck interiors, personal hygiene, and social distancing. We will continue to adapt our operations as required to ensure safety while continuing to provide a high level of service to our customers.
As the escalation of the COVID-19 pandemic extended through the end of the second quarter, the Company experienced the increasing effects of weakening economic conditions, most notably the late March COVID-19 related shutdown of automotive customers, representing approximately 45% of the Company’s revenue. While we vigorously sought to replace lost automotive revenue with freight from customers supporting the effort to supply essential goods to the nation, competition for this freight increased as industry capacity collectively focused on freight that continued to move during this time. With the return of automotive production in June, the increase in general economic activity as we approached the end of the second quarter, cost reductions implemented in response to the pandemic, and other operational initiatives, we were able to return to normal operations during the third quarter and finished the year with record quarterly revenue and operating income in the fourth quarter.
While we believe we are well-positioned for success in 2021 and are optimistic about fully returning to a normal operating and business environment as the year progresses, we continue to monitor ongoing developments with the COVID-19 pandemic. Any future waves or outbreaks of alternative strains of the virus could adversely impact our future operations and financial results. The ultimate extent of the pandemic’s impact on the Company’s financial and operating results, which could be material, will be determined by the length of time the pandemic continues, its continued severity, any further government regulations imposed in response to the pandemic, and its continued effect on the economy and transportation demand.
While operating cash flows may be negatively impacted by the pandemic, the Company believes we will be able to continue to finance our near term needs for working capital over the next twelve months, as well as any planned capital expenditures during such period, with cash balances, cash flows from operations, and borrowings believed to be available from financing sources.
Business and Growth Strategy
Our strategy focuses on the following elements:
Providing a Full Suite of ComplimentaryComplementary Truckload Transportation Solutions. Our objective is to provide our customers with a comprehensive solution to their truckload transportation needs. Our array of asset-based service offerings consistconsists of dedicated, expedited, automotive, local, regional, and long-haul truckload services. Our brokerage and logistics solutions offer similar services but utilize third-party equipment to expand available capacity. Our area of service includes the continental United States, Mexico and, to a lesser degree, Canada.
Developing Customer Relationships within High Density Traffic Lanes. We strive to maximize utilization and increase revenue per truck while minimizing our time and empty miles between loads. In this regard, we seek to provide equipment to our customers in defined regions and disciplined traffic lanes. This strategy enables us to:
| maintain more consistent equipment capacity; |
| provide a high level of service to our customers, including time-sensitive delivery schedules; |
| attract and retain drivers; and |
| maintain a sound safety record as drivers travel familiar routes. |
Providing Superior and Flexible Customer Service. We strive to provide a very high level of service to our customers, thus creating a level of satisfaction, value, and loyalty within our customer base. We closely monitor each shipment for compliance regarding scheduled pickup, delivery and transit times, service levels and customer specific expectations. We provide verbal and electronic updates through various forums to customers to allow visibility of their products as they progress through the transport process.
Many of our customers depend on us to deliver shipments on a time-definite basis, meaning that parts or raw materials are scheduled for delivery as they are needed on a manufacturer’s production line. The need for this service is a product of modern manufacturing and assembly methods that are designed to decrease inventory levels and handling costs. Such requirements place a premium on our delivery performance and reliability.
Employing Stringent Cost Controls. Throughout our organization, emphasis is placed on gaining efficiency in our processes with the primary goals of decreasing costs and improving customer satisfaction. Maintaining a high level of efficiency and prioritizing our focus on improvements allows us to minimize the number of non-driving personnel we employ and positively influence other overhead costs. Expenses are intensely scrutinized for opportunities for elimination, reduction or to further leverage our purchasing power to achieve more favorable pricing.
Industry
According to the American Trucking Association’s “American Trucking Trends 2019”2023” report, the trucking industry generated over $791$940 billion in revenue during 20192022 which represented approximately 80%81% of the total amount spent on U.S. freight spend.freight. The truckload industry is highly fragmented and is impacted by several economic and business factors, many of which are beyond the control of individual carriers. The state of the economy, coupled with equipment capacity levels, can impact freight rates. Volatility of various operating expenses, such as fuel and insurance, make the predictability of profit levels uncertain. Availability, attraction, retention, and compensation of drivers also affect operating costs, as well as equipment utilization. In addition, the capital requirements for equipment, coupled withavailability of equipment and potential uncertainty of used equipment values, impact the ability of many carriers to expand their operations.
The current operating environment is characterized by the following:
| competition for drivers; |
· | competition for freight; |
| price increases by truck and trailer equipment manufacturers; |
| volatile fuel costs; |
· | increasing insurance costs; and |
| pressure on less profitable or undercapitalized carriers to consolidate or exit the industry. |
Competition
The trucking industry is highly competitive and includes thousands of carriers, none of which dominates the market in which the Company operates. The Company's market share is less than 1%, and we compete primarily with other medium and long-haul truckload carriers, with private carriage conducted by our existing and potential customers, and, to a lesser extent, with the railroads. We compete on the basis of quality of service and delivery performance, as well as price. Many of the carriers we compete with have substantially greater financial resources, own more equipment or carry a larger total volume of freight as compared to the Company.
Marketing and Significant Customers
Our marketing emphasis is directed to that portion of the truckload market which is generally service-sensitive, as opposed to being solely price driven. We seek to become a “core carrier” for our customers in order to maintain high utilization and capitalize on recurring revenue opportunities. Our marketing efforts are diversified and designed to gain access to dedicated, expedited, regional, automotive, and long-haul opportunities (including those in Mexico and Canada) and to expand brokerage and logistics offerings.
Our sales efforts are conducted by a staff of teneleven employees who are located in our major markets and supervised from our headquarters. These individuals work to improve profitability by maintaining an even flow of freight traffic (taking into account the balance between originations and destinations in a given geographical area), high utilization, and minimizing movement of empty equipment.
Our five largest customers, for which we provide carrier services covering a number of geographic locations, accounted for approximately 35%34%, 40%39% and 42%33% of our total revenues in 2020, 20192023, 2022 and 2018,2021, respectively. General Motors Company accounted for approximately 15%12%, 19%13% and 13%11% of our revenues in 2020, 20192023, 2022 and 2018,2021, respectively. Fiat Chrysler Automobiles accounted for approximately 7%, 6% and 5% of our revenues in 2023, 2022 and 2021, respectively. Walmart Inc. accounted for approximately 6%, 9% and 16%9% of our revenues in 2020, 20192023, 2022 and 2018, respectively. Ford Motor Company accounted for approximately 5%, 7% and 8% of our revenues in 2020, 2019 and 2018,2021, respectively.
We also provide transportation services to other manufacturers who are suppliers for automobile manufacturers. Approximately 30%, 40%31% and 46%27% of our revenues were derived from transportation services provided to the automobile industry during 2020, 20192023, 2022 and 2018,2021, respectively.
Revenue Equipment
At December 31, 2020,2023, we operated a fleet of 2,0132,200 trucks, which included 355300 independent contractor trucks. At December 31, 2020,2023, our trailer fleet consisted of 6,9448,567 trailers. Our company-owned trucks and leased trucks are late model, well-maintained, premium trucks, which we believe help to attract and retain drivers, maximize fuel efficiency, promote safe operations, minimize maintenance, and repair costs, and improve customer service by minimizing service interruptions caused by breakdowns. The average age of our trucks and trailers as of December 31, 20202023 was 1.442.9 years and 4.926.5 years, respectively. We evaluate our equipment purchasing decisions based on factors such as initial cost, useful life, warranty terms, expected maintenance costs, fuel economy, driver comfort, customer needs, manufacturer support, and resale value.
We contract with independent contractors to provide greater flexibility in responding to fluctuations in consumer demand. Independent contractors provide their own trucks and are contractually responsible for all associated expenses, including financing costs, fuel, maintenance, insurance, and taxes, among other things. They are also responsible for maintaining compliance with the Federal Motor Carrier Safety Administration regulations.
Technology
Our trucks and trailers are equipped with cellular-based global positioning and communications systems that allow fleet managers to communicate directly with drivers. Drivers provide location, status, and informational updates directly to our computer system which increases productivity, convenience, and customer visibility. This system provides information that allows us to calculate accurate estimated time of arrival information, which helps to optimize planning and customer service levels.
Our information systems manage the data provided by our on-board devices to update system information regarding the location and load status of our trucks, which permits us to better manage customer delivery schedules, respond to customer inquiries, and perform optimized equipment to load matching, among various other planning and support functions. In many instances, our systems also directly provide real-time information electronically to our customers regarding the status of freight shipments and anticipated arrival times, adding flexibility and convenience by extending supply chain visibility.
Maintenance
We have a strictly-enforced, comprehensive preventive maintenance program for our trucks and trailers. Inspections and various levels of preventive maintenance are performed at set intervals on both trucks and trailers. A maintenance and safety inspection is performed on all vehicles each time they return to a terminal.
Our trucks typically carry full warranty coverage for at least three years or 375,000 miles. Extended truck warranties are often negotiated with the truck manufacturers and manufacturers of major components, such as engine, transmission, and differential manufacturers, for up to five years or 575,000625,000 miles. Our trailers carry full warranties by the manufacturer for up to seven years with certain components covered for up to ten years.
Human Capital Resources
Overview. At December 31, 2020,2023, we employed 2,6532,530 persons, of whom 2,0211,739 were drivers, 170274 were employed in maintenance, 267260 were employed in operations, 5669 were employed in marketing, 78116 were employed in safety and personnel, and 6172 were employed in general administration and accounting. A total of 2,6502,512 of our employees were employed on a full-time basis as of December 31, 2020.2023. None of our employees are represented by a collective bargaining unit, and we believe that our employee relations are good.
At December 31, 2020,2023, we also had 449390 independent contractor drivers for independent contractors under contract who were compensated on a per mile basis. Our driversDrivers are paid for an array of services, including calculated miles driven, loading and unloading, additional stops, detention and layovers, among other things.
We contract with independent contractors to supply one or more trucks and drivers for our use. Independent contractors must pay their own truck expenses, fuel, maintenance, insurance, and driver costs. They must meet and operate within our guidelines with respect to safety. We have a lease-purchase program whereby we offer independent contractors the opportunity to lease a truck, with the option to purchase the truck at the end of the lease term. We believe our lease-purchase program has contributed to our ability to attract and retain independent contractors. At December 31, 2020,2023, our lease-purchase program had 333 trucks available for use, with approximately 305 independent contractors were leasing 393 trucks280 drivers participating in thisthe program.
Diversity and Inclusion. We believe diversity, equity, and inclusion are critical to our ability to win in the marketplace and enable our workforce and communities to succeed. Specifically, having a diverse and inclusive workplace allows us to attract and retain the best employees to deliver results for our shareholders. A qualified, diverse, and inclusive workforce also helps us represent the broad cross-section of ideas, values, and beliefs of our employees, customers, and communities. Our commitment to diversity and inclusion means that we will continue to strive to establish and improve an inclusive workplace environment where employees from all backgrounds can succeed and be heard.
Employee Health and Safety. We are committed to being an industry leader in health and safety standards. The physical health, wellbeing, and mental health of our employees is crucial to our success. Most recently, our primary concern during the COVID-19 pandemic has been to do our part to protect our employees, customers, vendors and the general public from the spread of COVID-19 while continuing to serve the vital role of supplying essential goods to the nation. Where possible, our employees are working remotely from their homes. For essential functions, including our driving professionals, we have distributed cleaning and protective supplies to various terminals so that they are available to those that need them, increased cleaning frequency and coverage, and provided employees direction on precautionary measures, such as sanitizing truck interiors, personal hygiene, and social distancing. We will continue to adapt our operations as required to ensure safety while continuing to provide a high level of service to our customers.
In addition to strict application screening and drug testing, before being permitted to operate a vehicle, our drivers must undergo classroom instruction on our policies and procedures, safety techniques as taught by the Smith System of Defensive Driving, and the proper operation of equipment, and must pass both written and road tests. Instruction in defensive driving and safety techniques continues after hiring, with seminars at several of our terminals. At December 31, 2020,2023, we employed 6485 persons on a full-time basis in our driver recruiting, training and safety instruction programs.
Talent Acquisition, Retention and Development. We continually strive to hire, develop and retain the top talent in our industry. Critical to attracting and retaining top talent is employee satisfaction, and we regularly implement programs to increase employee satisfaction. We reward our employees by providing competitive compensation, benefits and incentives throughout all levels in our organization, including for our drivers. Drivers can earn bonuses by recruiting other qualified drivers who become employed by us, and both cash and non-cash prizes are awarded for achieving certain safety, productivity and fuel efficiency goals.
Intense competition in the trucking industry for qualified drivers has resulted in additional expense to recruit and retain an adequate supply of drivers and has had a negative impact on the industry. Our operations have also been impacted and from time to time we have occasionally experienced under-utilization and increased expenses due to a shortage of qualified drivers. WeTherefore, we place a high priority on the recruitment and retention of an adequate supply of qualified drivers.
Our truck fleet averages one and a half2.9 years old, keeping our drivers safe, comfortable, and on the road. With many dedicated and over-the-road assignments, we allow our drivers to select routes that fit their lifestyles. We also have programs specifically designed to recruit and retain drivers who are military veterans, including our civilian career transition program called Honor Road, which provides military members and veterans on-the-job training allowing them to build a new career and earn compensation from the Company while receiving benefits from G.I. Bills. We are also proud to offer our Patriot Ride Fleet, in association with The Larson Group/Peterbilt and Bravo3Zero apparel, as a way to honor our uniformed service members past and present. Each unit is designed to pay tribute to a specific branch, and the professional men and women at their helms are veterans of the respective branch. We refer to these drivers as Ambassadors, as they continue to serve their country by safely delivering the goods needed to keep America moving.
Available Information
The Company maintains a website where additional information concerning its business can be found. The website address is www.pamtransport.com. On our website, under the caption “Investors,” the Company makes available, free of charge, its Annual Report on Form 10-K, quarterly reports on Form 10-Q, current reports on Form 8-K, and amendments to those reports filed or furnished pursuant to Section 13(a) or 15(d) of the Securities Exchange Act of 1934 (the “Exchange Act”) as soon as reasonably practicable after it electronically files or furnishes such materials to the Securities and Exchange Commission.
Seasonality
Generally, our revenues do not exhibit a significant seasonal pattern; however, revenue is affected by adverse weather conditions, holidays and the number of business days that occur during a given period because revenue is directly related to the available work days of shippers. Operating expenses are typically higher in the winter months primarily due to decreased fuel efficiency and increased maintenance costs associated with inclement weather. In addition, automobile plants for which we transport a large amount of freight typically undergo scheduled shutdowns in July and December, and the volume of automotive freight we ship is reduced during such scheduled plant shutdowns.
Regulation
We are a common and contract motor carrier regulated by various United States federal and state, Canadian provincial, and Mexican federal agencies. These regulatory agencies have broad powers, generally governing matters such as authority to engage in motor carrier operations, motor carrier registration, driver hours-of-service (“HOS”), drug and alcohol testing of drivers, and safety, size, and weight of transportation equipment. The primary regulatory agencies affecting the Company’s operations include the Federal Motor Carrier Safety Administration (“FMCSA”), the Pipeline and Hazardous Materials Safety Agency, and the Surface Transportation Board, which are all agencies within the U.S. Department of Transportation (“DOT”). We believe that we are in compliance in all material respects with applicable regulatory requirements relating to our business and operate with a “satisfactory” rating (the highest of three rating categories) from the DOT. In addition, we are subject to compliance with cargo-security and transportation regulations issued by the Transportation Security Administration, a component department within the U.S. Department of Homeland Security. To the extent that we conduct operations outside the United States, we are subject to the Foreign Corrupt Practices Act, which generally prohibits U.S. companies and their intermediaries from offering bribes to foreign officials for the purpose of obtaining or retaining favorable treatment.
In December 2011, the FMCSA released new rules regulating HOS that became effective in July 2013. These rules reduced the maximum hours that could be worked in a consecutive seven day period from 82 to 70, required that a driver take a mandatory thirty minutethirty-minute break during each consecutive eight hour driving period, and required that a driver take a 34 hour rest period, or restart, that included two periods between 1:00 a.m. and 5:00 a.m. that could only be used one time every seven calendar days.period.
In July 2012, Congress passed legislation renewing the mandate for electronic logging devices and designated authority to the FMCSA to propose a new rule. In December 2015, the FMCSA amended the Federal Motor Carrier Safety Regulations to establish minimum performance and design standards for HOS electronic logging devices (“ELDs”), requirements for the mandatory use of these devices by drivers currently required to prepare HOS records of duty status, requirements concerning HOS supporting documents, and measures to address concerns about harassment resulting from the mandatory use of ELDs. In May 2018 the FMCSA released a notice that they would allow a motor carrier that installed and required its drivers to use an Automatic on Board Recording Device (“AOBRD”) before December 18, 2017 and who uses registered ELD capable devices that run compliant AOBRD software to continue to do so until December 16, 2019. The Company was an early adopter of ELD capable devices, requiring the devices to be installed on its entire fleet and requiring its drivers to use AOBRD’s since 2010. These rulings affect the majority of carriers, including us, and the Company’s ELD devices were in compliance with FMCAFMCSA requirements prior to the December 16, 2019 deadline.
The FMCSA administers carrier safety compliance and enforcement through its Compliance, Safety, Accountability (“CSA”) program that became effective in December 2010. CSA is designed to measure and evaluate the safety performance of carriers and drivers through categorization of inspection and crash results into Behavior Analysis and Safety Improvement Categories (“BASICs”) including unsafe/fatigued driving, driver fitness, controlled substances and alcohol, maintenance, cargo, and crashes. BASIC scores are evaluated relative to carrier peer groups to determine carriers that exceed certain thresholds, identifying them for intervention. Intervention status might include targeted roadside inspections, onsite investigations and the development of cooperative safety plans, among other things. Ongoing compliance with CSA may result in additional expenses to the Company or a reduction in the pool of drivers eligible for us to hire. In addition to FMCSA action, a BASIC score that exceeds an intervention threshold might have a negative impact on our ability to attract customers and drivers.
The Environmental Protection Agency (“EPA”) and the National Highway Traffic Safety Administration (“NHTSA”) jointly developed new standards for various vehicles, including heavy duty trucks, that were adopted in August 2011 and covercovered model years 2014 through 2018. The standard adopted for heavy duty trucks was intended to achieve a reduction in CO2 and fuel consumption ranging from 7% to 20% by model year 2017. In August 2016, the EPA and NHTSA finalized the second phase of these standards which will further reduce GHGreduces greenhouse gas emissions and fuel consumption for heavy duty trucks through model year 2027. In December of 2022, the EPA finalized an additional phase of standards which is intended to reduce nitrous oxide (NOx) emissions to 0.035 grams per horsepower-hour during normal operation, 0.05 grams at low load and 10.0 grams at idle for vehicles with model years 2027 and above. Compliance with these federal and state requirements has increased the cost of our equipment and may further increase the cost of replacement equipment in the future.
The FMCSA Commercial Driver’s License (“CDL”) Drug and Alcohol Clearinghouse (“Clearinghouse”) became effective January 6, 2020. This new database contains information pertaining to violations of the U.S. Department of Transportation controlled substances and alcohol testing program for holders of CDL’s. The Clearinghouse rules requires FMCSA regulated employers, among others, to report to the Clearinghouse information related to violations of the drug and alcohol regulations. Further, the rules require that FMCSA regulated employers query current and prospective employees’ drug and alcohol violations before permitting those employees to operate a commercial motor vehicle on public roads, and to recheck each employee annually. The system is intended to remove the ability of prospective employees to fail to disclose past drug and alcohol violations at previous employers to potential employers. We anticipate enforcement of the Clearinghouse will remove certain drivers from the pool of drivers available to the industry and increase competition and related costs to attract and retain the remaining qualified drivers.
Our motor carrier operations are also subject to additional environmental laws and regulations, including laws and regulations dealing with the transportation of hazardous materials and other environmental matters, and our operations involve certain inherent environmental risks. These laws and regulations have the effect of increasing the costs, risks and liabilities associated with our applicable operations. If current regulatory requirements become more stringent or new environmental laws and regulations are introduced, we could be required to make significant expenditures or abandon certain activities. Our operations involve the risks of fuel spillage or seepage, environmental damage, and hazardous waste disposal, among others. We have instituted programs to monitor and control environmental risks and assure compliance with applicable environmental laws. As part of our safety and risk management program, we periodically perform internal environmental reviews so that we can achieve environmental compliance and avoid environmental risk. We transport a minimal amount of environmentally hazardous substances and, to date, have experienced no significant claims for hazardous materials shipments. If we should fail to comply with applicable regulations, we could be subject to substantial fines or penalties and to civil and criminal liability.
As global warming issues related to climate change become more prevalent, federal, state and local governments, as well as some of our customers, have made efforts to respond to these issues. This increased focus on sustainability may result in new legislation or regulations, andas well as customer requirements that could negatively affect us as we may incur additional costs or be required to make changes to our operations in order to comply with any new regulations or customer requirements. Legislation or regulations that potentially impose restrictions, caps, taxes, or other controls on emissions of greenhouse gases such as carbon dioxide, a by-product of burning fossil fuels such as those used in the Company’s trucks, could adversely affect our operations and financial results. More specifically, legislative or regulatory actions relating to climate change could adversely impact the Company by increasing our fuel costs and reducing fuel efficiency and could result in the creation of substantial additional capital expenditures and operating costs in the form of taxes, emissions allowances, or required equipment upgrades.
Company operations are often conducted in industrial areas, where truck terminals and other industrial activities are conducted, and where groundwater or other forms of environmental contamination have occurred, which could potentially expose us to claims that we contributed to the environmental contamination.
We believe we are currently in material compliance with applicable laws and regulations and that the cost of compliance has not materially affected results of operations.operations to date.
Set forth below, and elsewhere in this Report and in other documents we file with the SEC, are risks and uncertainties that could cause our actual results to differ materially from the results contemplated by the forward-looking statements contained in this Report.
Risks Related to Our Industry
Our business is subject to general economic and business factors that are largely beyond our control, any of which could have a material adverse effect on our operating results.
Our business is dependent upon a number of general economic and business factors that may adversely affect our results of operations. These factors include significant increases or rapid fluctuations in fuel prices, excess capacity in the trucking industry, surpluses in the market for used equipment, interest rates, fuel taxes, license and registration fees, insurance premiums, self-insurance levels, and difficulty in attracting and retaining qualified drivers, independent contractors, and third-party carriers.
We operate in a highly competitive and fragmented industry, and our business may suffer if we are unable to adequately address any downward pricing pressures or other factors that may adversely affect our ability to compete with other carriers.
Further, we are affected by recessionary economic cycles and downturns in customers’ business cycles, particularly in market segments and industries, such as the automotive industry, where we have a significant concentration of customers. Economic conditions may also adversely affect our customers and their ability to pay for our services.
Deterioration in the United States and/or world economies could exacerbate any difficulties experienced by our customers and suppliers in obtaining financing, which, in turn, could materially and adversely impact our business, financial condition, results of operations and cash flows.
We may be adversely impacted by fluctuations in the price and availability of diesel fuel.
Diesel fuel represents a significant operating expense for the Company and we do not currently hedge against the risk of diesel fuel price increases. An increase in diesel fuel prices or diesel fuel taxes, or any change in federal or state regulations that results in such an increase, could have a material adverse effect on our operating results to the extent we are unable to recoup such increases from customers in the form of increased freight rates or through fuel surcharges. Historically, we have been able to offset, to a certain extent, diesel fuel price increases through fuel surcharges to our customers, but we cannot be certain that we will be able to do so in the future. We continuously monitor the components of our pricing, including base freight rates and fuel surcharges, and address individual account profitability issues with our customers when necessary.
Difficulty in attracting drivers and independent contractors could affect our profitability and ability to grow.
The transportation industry often experiences significant difficulty in attracting and retaining qualified drivers and independent contractors. This shortage is exacerbated by several factors, including demand from competing industries, such as manufacturing, construction and farming, demand from other transportation companies, and the impact of regulations, including CSA and hours of service rules the temporary closure of commercial driver schools during the COVID-19 outbreak, and other difficulties attracting and training new drivers in the current socially distanced environment.drivers. Economic conditions affecting operating costs such as fuel, insurance, equipment and maintenance costs can negatively impact the number of qualified independent contractors available to us. We have from time to timeoccasionally experienced under-utilization and increased expenses due to a shortage of qualified drivers. If we are unable to attract drivers or contract with independent contractors when needed, we could be required to further adjust our driver compensation packages, increase driver recruiting efforts, or let trucks sit idle, any of which could adversely affect our growth and profitability.
Purchase price increases for new revenue equipment, and/or decreases in the value of used revenue equipment and/or disruptions in the availability of new revenue equipment could have an adverse effect on our results of operations, cash flows and financial condition.
Over the past decade, the purchase price of new revenue equipment has increased significantly as equipment manufacturers recover increased materials and engine design costs resulting from compliance with increasingly stringent EPA engine emission standards, government tariffs on raw materials and other factors beyond the Company’s control. Additional EPA emission mandates, tariff increases on raw materials, or other factors that increase material or manufacturing costs of new equipment in the future could increase the purchase price paid by the Company for new revenue equipment and could result in higher than anticipated depreciation expenses. If we wereare unable to offset any such increase in expenses with freight rate increases, our cash flows and results of operations could be adversely affected. If the market price for used revenue equipment declines, we could incur substantial losses upon disposition of our revenue equipment which could adversely affect our results of operations and financial condition.
We have significant ongoing capital requirements that could affect our liquidity and profitability if we are unable to generate sufficient cash from operations or obtain sufficient financing on favorable terms.
The trucking industry is capital intensive. If we are unable to generate sufficient cash from operations in the future, we may have to limit our growth, enter into unfavorable financing arrangements, or operate our revenue equipment for longer periods, any of which could have a material adverse effect on our profitability.
We operate in a highly regulated industry and increased costs of compliance with, or liability for violation of, existing or future regulations could have a material adverse effect on our business.
Our operations are authorized and regulated by various federal and state agencies in the United States, Mexico and Canada that generally govern such activities as authorization to engage in motor carrier operations, safety, and financial reporting. Specific standards and regulations such as equipment dimensions, engine emissions, maintenance, drivers’ hours of service, drug and alcohol testing, and hazardous materials are regulated by the Department of Transportation, Federal Motor Carrier Safety Administration, the Environmental Protection Agency and various other state and federal agencies. We may become subject to new or more restrictive regulations imposed by these authorities, which could significantly impair equipment and driver productivity and increase operating expenses.
The FMCSA administers carrier safety compliance and enforcement through its CSA program, which places carriers in peer groups and assigns each carrier a relative ranking compared to their peers in various categories. Carriers that exceed allowable thresholds in a particular category are placed in “intervention” status by the FMCSA until the score improves to a level below the threshold. IfWhile the Company has not exceeded allowable thresholds to date, if future roadside inspections or crashes were to result in the Company being placed in intervention status, we may incur additional operating costs to improve our safety program in deficient categories, experience increased roadside inspections, or have onsite visits by the FMCSA. If the intervention category is not remedied, it could affect our ability to attract and retain drivers and customers as they seek competitive carriers with scores below intervention thresholds. In addition, the CSA program could increase competition and related compensation and recruitment costs for drivers and independent contractors by reducing the pool of qualified drivers if existing drivers exit the profession, become disqualified due to low scores or as carriers focus recruiting efforts on drivers with the best relative safety scores.
The EPA and the NHTSA jointly developed new standards for various vehicles, including heavy duty trucks, that were adopted in August 2011 and cover model years 2014 through 2018. These standards are designed to reduce GHG emissions and improve fuel economyThe standard adopted for heavy duty trucks.trucks was intended to achieve a reduction in CO2 and fuel consumption ranging from 7% to 20% by model year 2017. In August 2016, the EPA and NHTSA finalized the second phase of these standards which will further reduce GHGgreenhouse gas emissions and fuel consumption for heavy duty trucks through model year 2027. In December of 2022, the EPA finalized an additional phase of standards which is intended to reduce nitrous oxide (NOx) emissions to 0.035 grams per horsepower-hour during normal operation, 0.05 grams at low load and 10.0 grams at idle for vehicles with model years 2027 and above. Compliance with these federal and state requirements has increased the cost of our equipment and may further increase the cost of replacement equipment in the future.
The Regulation section in Item 1 of Part I of this Annual Report on Form 10-K discusses several proposed and final regulations that could materially impact our business and operations.
A determination that independent contractors are employees could expose us to various liabilities and additional costs.
Federal and state legislation as well as tax and other regulatory authorities often seek to assert that independent contractors in the transportation service industry are employees rather than independent contractors. An exampleRecently issued rulemaking by the U.S. Department of such legislation recently enacted inLabor, which is effective March 11, 2024, and the laws of several states, including California, is currently under a judicial stay with respect to trucking companies while a legal challenge to the law is pending. There can be no assurance that interpretations that support theapply stricter tests for determining whether an independent contractor status will not change,should be classified as an employee. We believe we are in compliance with all applicable independent contractor classification requirements. However, it is possible that other federal or state legislation will notor regulations could be enacted or that various authorities will not successfullycould assert a position that re-classifies independent contractors to beas employees. If our independent contractors are determined to be ourproperly classified as employees, that determination could materially increase our exposure under a variety of federal and state tax, workers’ compensation, unemployment benefits, labor, employment and tort laws, as well as our potential liability for employee benefits. In addition, such changes may be applied retroactively, and if so, we may be required to pay additional amounts to compensate individuals for prior time periods. Any of the above increased costs would adversely affect our business and operating results.
We may incur additional operating expenses or liabilities as a result of potential future requirements to address climate change issues.
As global warming issues related to climate change become more prevalent, federal, state and local governments, as well as some of our customers, have made efforts to respond to these issues. This increased focus on sustainability may result in new legislation or regulations and customer requirements that could negatively affect us as we may incur additional costs or be required to make changes to our operations in order to comply with any new regulations or customer requirements. Legislation or regulations that potentially impose restrictions, caps, taxes, or other controls on emissions of greenhouse gases such as carbon dioxide, a by-product of burning fossil fuels such as those used in the Company’s trucks, could adversely affect our operations and financial results. More specifically, legislative or regulatory actions relating to climate change could adversely impact the Company by increasing our fuel costs and reducing fuel efficiency and could result in the creation of substantial additional capital expenditures and operating costs in the form of taxes, emissions allowances, or required equipment upgrades. Any of these factors could impair our operating efficiency and productivity and result in higher operating costs. In addition, revenues could decrease if we are unable to meet regulatory or customer sustainability requirements. These additional costs, changes in operations, or loss of revenues could have a material adverse effect on our business, financial condition and results of operations.
Risks Related to Our Business
The ongoing impact of the COVID-19 pandemic, or other similar outbreaks in the future, could negatively impact our financial condition, liquidity, results of operations, and cash flows.
The outbreak of the novel coronavirus (COVID-19) pandemic in early 2020 materially and adversely affected our operating results and cash flows during 2020. The ongoing impacts of the pandemic and any other outbreaks of contagious diseases or other adverse public health developments could have a further materially adverse effect on our financial condition, liquidity, results of operations, and cash flows. The rapid spread of COVID-19 has resulted in governmental authorities implementing numerous measures to try to contain the virus, such as travel bans and restrictions, quarantines, shelter in place orders, increased border and port controls and closures, and shutdowns. These measures and the public health concerns resulting from the outbreak have severely disrupted economic and commercial activity. The resulting impact on domestic and global supply chains caused slowdowns and reduced freight demand for transportation companies such as ours. Because we have a significant concentration of customers within the automotive industry, our freight volumes and revenues were significantly affected by the closure of North American automotive manufacturing facilities beginning in late March. Our automotive customers have since resumed operations; however, any future wave of the virus or other similar outbreaks could further adversely affect our business. In addition, the implementation of measures to protect the health and safety of our employees, customers, vendors and the general public may disrupt our ability to efficiently manage personnel and operations and to recruit and retain driver and non-driver personnel, which could have a material adverse effect on our operating results. Further, negative financial results, an economic downturn or uncertainty, or a tightening of credit markets caused by COVID-19 or other similar outbreaks could have a material adverse effect on our liquidity and our ability to effectively meet our short- and long-term financial obligations.
Numerous competitive factors could impair our ability to operate at an acceptable profit. These factors include, but are not limited to, the following:
| we compete with many other truckload carriers of varying sizes and, to a lesser extent, with less-than-truckload carriers and railroads, some of which have more equipment and greater capital resources than we do; |
| some of our competitors periodically reduce their freight rates to gain business, especially during times of reduced growth rates in the economy, which may limit our ability to maintain or increase freight rates, maintain our margins or maintain significant growth in our business; |
| many customers reduce the number of carriers they use by selecting so-called “core carriers” as approved service providers, and in some instances we may not be selected; |
| many customers periodically accept bids from multiple carriers for their shipping needs, and this process may depress freight rates or result in the loss of some of our business to competitors; |
| the trend toward consolidation in the trucking industry may create other large carriers with greater financial resources and other competitive advantages relating to their size and with whom we may have difficulty competing; |
| advances in technology require increased investments to remain competitive, and our customers may not be willing to accept higher freight rates to cover the cost of these investments; |
| competition from Internet-based and other logistics and freight brokerage companies may adversely affect our customer relationships and freight rates; and |
| economies of scale that may be passed on to smaller carriers by procurement aggregation providers may improve their ability to compete with us. |
We are highly dependent on our major customers, the loss of one or more of which could have a material adverse effect on our business.
A significant portion of our revenue is generated from our major customers. For 2020,2023, our top five customers, based on revenue, accounted for approximately 35%34% of our revenue, and our threerevenue. Our largest customers,customer, General Motors Company, Fiat Chrysler Automobiles, and Ford Motor Company, accounted for approximately 15%, 6% and 5%12% of our revenue, respectively.revenue. We also provide transportation services to other manufacturers who are suppliers for automobile manufacturers. As a result, the concentration of our business within the automobile industry is greater than the concentration in a single customer. Approximately 30% of our revenues for 20202023 were derived from transportation services provided to the automobile industry.
Generally, we do not have long-term contractual relationships with our major customers, and we cannot assure that our customer relationships will continue as presently in effect. Our business and profitability was materially and adversely affected by the closure of North American automotive manufacturing facilities during the spring of 2020 due to the COVID-19 outbreak and is currently being adversely impacted by similar production slowdowns and closures within the automotive manufacturing industry due to shortages of microprocessors and other computer chips essential for new vehicle production. Any sustained or future reduction in or termination of our services by our major customers could have a further material adverse effect on our business and operating results.
AOngoing effects from recent labor disputes involving several of our customers or the impact of any future significant labor dispute involving one or more of our customers, or that could otherwise affect our operations, could reduce our revenues and harm our profitability.
A substantial number of the employees of our largest customers are members of industrial trade unions and are employed under the terms of collective bargaining agreements. FutureIn September 2023, the United Auto Workers initiated a trilateral strike against Ford, General Motors, and Stellantis that lasted several weeks until each of these automotive customers was able to negotiate a new contract with the union. The strike targeted select plants at each of these automotive companies, causing prolonged plant shutdowns for these customers and ripple effects on plants and workers for other customers and automotive suppliers. The effects of these shutdowns adversely impacted our business and financial performance during the third and fourth quarters of 2023 and have continued into the first quarter of 2024. While operations at the affected customer and supplier plants have resumed, some of these customer facilities have yet to return to fully operational status, and we continue to experience reduced freight volumes as a result of the recent labor disruptions. Any sustained slowdown in operations for these customers and any future labor disputes involving our customers could further affect our operations. If the UAW and our automotive customers and their suppliers are unable to return to full operations in the near future or if these customers are unable to negotiate new contracts in the future and our customers’ plants experience slowdowns or closures as a result, our revenue and profitability could be negatively impacted. A labor dispute involving another supplier to our customers that results in a slowdown or closure of our customers’ plants to which we provide services could also have a material adverse effect on our business.
Ongoing insurance and claims expenses could significantly reduce our earnings.
Our future insurance and claims expenses might exceed historical levels, which could reduce our earnings. The Company is self-insured for a material portion of auto liability claims in excess of two million dollars and for health and workers’ compensation insurance up to certain limits. The actual cost to settle self-insured claims can differ from amounts reserved due to various uncertainties, including the ultimate severity of the claims and potential amounts required to defend and settle claims. If claims costs increase, or if the severity or number of claims increase, and if we are unable to offset the resulting increases in expenses with higher freight rates, our earnings could be materially and adversely affected. Healthcare legislation and inflationary cost increases could also have a negative effect on our results.
We may be subject to litigation claims that could result in significant expenditures.
By the nature of our operations we are exposed to the potential for a variety of litigation, including personal injury claims, vehicular collisions and accidents, alleged violations of federal and state labor and employment laws, such as class-action lawsuits alleging wage and hour violations and improper pay, commercial and contract disputes, cargo loss and property damage claims. While we purchase insurance coverage at levels we deem adequate, future litigation may exceed our insurance coverage or may not be covered by insurance. We accrue a provision for a litigation matter according to applicable accounting standards based on the ongoing assessment of the strengths and weaknesses of the litigation, its likelihood of success, and an evaluation of the possible range of loss. Our inability to defend ourselves against a significant litigation claim could have a material adverse effect on our financial results.
We have a substantial amount of debt, which could restrict our growth, place us at a competitive disadvantage or otherwise materially adversely affect our financial health. Our substantial debt levels could have important consequences such as the following:
| impair our ability to obtain additional future financing for working capital, capital expenditures, acquisitions or general corporate expenses; |
| limit our ability to use operating cash flow in other areas of our business due to the necessity of dedicating a substantial portion of these funds for payments on our indebtedness; |
| limit our flexibility in planning for, or reacting to, changes in our business and the industry in which we operate; |
| make it more difficult for us to satisfy our obligations; |
| increase our vulnerability to general adverse economic and industry conditions; and |
| place us at a competitive disadvantage compared to our competitors. |
Our ability to make scheduled payments on, or to refinance, our debt and other obligations will depend on our financial and operating performance, which, in turn, is subject to our ability to implement our strategic initiatives, prevailing economic conditions and certain financial, business and other factors beyond our control. If our cash flow and capital resources are insufficient to fund our debt service and other obligations, we may be forced to reduce or delay expansion plans and capital expenditures, sell material assets or operations, obtain additional capital or restructure our debt. We cannot provide any assurance that our operating performance, cash flow and capital resources will be sufficient to pay our debt obligations when they become due. We also cannot provide assurance that we would be able to dispose of material assets or operations or restructure our debt or other obligations if necessary or, even if we were able to take such actions, that we could do so on terms that are acceptable to us.
Discontinuation, reform or replacement of LIBOR may adversely affect our variable rate debt.
Borrowings under our credit facilities are at variable rates of interest, primarily based on London Interbank Offered Rate (“LIBOR”). LIBOR tends to fluctuate based on general interest rates, rates set by the U.S. Federal Reserve Board and other central banks, the supply of and demand for credit in the London interbank market, and general economic conditions. In July 2017, the Financial Conduct Authority in the U.K. announced a desire to phase out LIBOR as a benchmark by the end of 2021. Financial industry working groups are developing replacement rates and methodologies to transition existing agreements that depend on LIBOR as a reference rate; however, we can provide no assurance that market-accepted rates and transition methodologies will be available and finalized at the time of LIBOR cessation. If clear market standards and transition methodologies have not been developed by the time LIBOR becomes unavailable, we may have difficulty reaching agreement on acceptable replacement rates under our credit facilities. If we are unable to negotiate replacement rates on favorable terms, it could have a material adverse effect on our earnings and cash flows.
Disruptions in the credit markets may adversely affect our business, including the availability and cost of short-term funds for liquidity requirements and our ability to meet long-term commitments, which could adversely affect our results of operations, cash flows and financial condition.
If cash from operations is not sufficient, we may be required to rely on the capital and credit markets to meet our financial commitments and short-term liquidity needs. Disruptions in the capital and credit markets could adversely affect our ability to draw on our bank revolving credit facility. Our access to funds under the credit facility is dependent on the ability of banks to meet their funding commitments. A bank may not be able to meet their funding commitments if they experience shortages of capital and liquidity or if they experience excessive volumes of borrowing requests from other borrowers within a short period of time.
Longer term disruptions in the capital and credit markets as a result of uncertainty, changing or increased regulation, reduced alternatives, or failures of significant financial institutions could adversely affect our access to liquidity needed for our business. Any disruption could require us to take measures to conserve cash until the markets stabilize or until alternative credit arrangements or other funding for our business needs can be arranged, which could adversely affect our growth and profitability.
We are subject to certain risks arising from doing business in Mexico.
As we continue to grow our business in Mexico, we are subject to greater risks of doing business internationally, including fluctuations in foreign currencies, changes in the economic strength of Mexico, difficulties in enforcing contractual obligations and intellectual property rights, burdens of complying with a wide variety of international and U.S. export and import laws, and social, political, and economic instability. We also face additional risks associated with our Mexico business, including potential restrictive trade policies and imposition of any import or export taxes, duties, fees, etc. If we are unable to address business concerns related to our international operations in a timely and cost efficient manner, our financial position, results of operations or cash flows could be adversely affected. Additionally, approximately 34%37% of the freight we haul crosses the border between the United States and Mexico. In past years, we have experienced delays in Mexico border-crossings due to weather events, immigration-related issues and the reallocation of border agents to other border areas. Any future shutdowns or disruptions of Mexico border-crossings, particularly at the Laredo, Texas border, could materially and adversely impact our operations, cash flows and profitability. The agreement permitting cross-border movements for both United States and Mexican-based carriers in the United States and Mexico presents additional risks in the form of potential increased competition and the potential for increased congestion in our lanes that cross the border between countries.
On April 23, 2021, a decree was published that reforms various laws in Mexico regarding labor outsourcing. Under this new decree, operating companies are no longer able to source their labor resources used to carry out core business functions from service entities or third-party providers and could be subject to the loss of tax deductions and value-added tax credits on payments to outsourced personnel and certain penalties for failing to comply with the new requirements. The passage of this decree has not had a material adverse impact on our business and financial results to date.
Our results of operations may be affected by seasonal factors.
Our productivity may decrease during the winter season when severe winter weather impedes operations. Also, some shippers may reduce their shipments after the winter holiday season. At the same time, operating expenses may increase and fuel efficiency may decline due to engine idling during periods of inclement weather. Harsh weather conditions generally also result in higher accident frequency, increased freight claims, and higher equipment repair expenditures. In addition, automobile plants for which we transport a large amount of freight typically undergo scheduled shutdowns in July and December, which reduces the volume of automotive freight we ship during these plant shutdowns.
Our business may be disrupted by natural disasters and severe weather conditions causing supply chain disruptions.
Natural disasters such as earthquakes, tsunamis, hurricanes, tornadoes, floods or other adverse weather and climate conditions, whether occurring in the United States or abroad, could disrupt our operations or the operations of our customers or could damage or destroy infrastructure necessary to transport products as part of the supply chain. Specifically, these events may damage or destroy our assets, disrupt fuel supplies, increase fuel costs, disrupt freight shipments or routes, and affect regional economies. As a result, these events could make it difficult or impossible for us to provide logistics and transportation services; disrupt or prevent our ability to perform functions at the corporate level; and/or otherwise impede our ability to continue business operations in a continuous manner consistent with the level and extent of business activities prior to the occurrence of the unexpected event, which could adversely affect our business and results of operations or make our results more volatile.
Our operations are subject to various environmental laws and regulations, the violation of which could result in substantial fines or penalties.
We are subject to various environmental laws and regulations dealing with the handling of hazardous materials, underground fuel storage tanks, and discharge and retention of storm-water.stormwater. We operate in industrial areas, where truck terminals and other industrial activities are located, and where groundwater or other forms of environmental contamination could occur. We also maintain bulk fuel storage and fuel islands at one of our facilities. Our operations may involve the risks of fuel spillage or seepage, environmental damage, and hazardous waste disposal, among others. If we are involved in a spill or other accident involving hazardous substances, or if we are found to be in violation of applicable laws or regulations, it could have a materially adverse effect on our business and operating results. If we should fail to comply with applicable environmental regulations, we could be subject to substantial fines or penalties and to civil and criminal liability.
Our information technology systems are subject to certain cyber security and disaster risks that are beyond our control.
We depend heavily on the proper functioning and availability of our information, communications, and data processing systems, including operating and financial reporting systems, in operating our business. Our operating system is critical in meeting customer expectations, effectively tracking, maintaining and operating our equipment, directing and compensating our employees, and interfacing with our financial reporting system. Our financial reporting system receives, processes, controls and reports information for operating our business and for tabulation into our financial statements.
While we are not aware of a breach that has resulted in significant lost productivity or exposure of sensitive information to date, we are aware that our systems are targeted by various viruses and cyber-attacks and expect these efforts to continue. Our systems and those of our technology and communications providers are vulnerable to interruptions caused by natural disasters, power loss, telecommunication and internet failures, cyber-attack, and other events beyond our control. Accordingly, information security and the continued development and enhancement of the controls and processes designed to protect our systems, computers, software, data and networks from attack, damage or unauthorized access remain a priority for us and we maintain information security processes and policies to protect our systems and data from cyber security events and threats.
Although we have processes, policies and procedures in place and our information systems are protected through physical and software security as well as redundant backup systems, they remain susceptible to cyber securitycyber-security risks. Some of our software systems are utilized by third parties who provide outsourced processing services which may increase the risk of a cyber-security incident.
A successful cyber-attack or catastrophic natural disaster could significantly affect our operating and financial systems and could temporarily disrupt our ability to provide required services to our customers and impact our ability to manage our operations and perform vital financial processes, any of which could have a materially adverse effect on our business. In addition, regulatory and enforcement focus on data protection in the U.S. and failure to comply with applicable U.S. data protection regulations or other data protection standards may expose us to litigation, fines, sanctions or other penalties, which could harm our reputation and adversely impact our business, results of operations and financial condition.
We have substantial fixed costs and, as a result, our operating income fluctuates disproportionately with changes in our net sales.
A significant portion of our expenses are fixed costs that neither increase nor decrease proportionately with sales. There can be no assurance that we would be able to reduce our fixed costs proportionately in response to a decline in our sales, and therefore our competitiveness could be significantly impacted. As a result, a decline in our sales would result in a higher percentage decline in our income from operations and net income.
If our employees were to unionize, our operating costs would increase and our ability to compete would be impaired.
None of our employees are currently represented by a collective bargaining agreement. However, we can offer no assurance that our employees will not unionize in the future, particularly if legislation is passed that facilitates unionization. If our employees were to unionize, our operating costs would increase and our profitability could be adversely affected.
Our business may be harmed by terrorist attacks, future war or anti-terrorism measures.
In order to prevent terrorist attacks, federal, state and municipal authorities have implemented and continue to follow various security measures, including checkpoints and travel restrictions on large trucks. Our international operations in Canada and Mexico may be affected significantly if there are any disruptions or closures of border traffic due to security measures. Such measures may have costs associated with them, which, in connection with the transportation services we provide, we or our independent contractors could be forced to bear. Further, a terrorist attack, war, or risk of such an event, also may have an adverse effect on the economy. A decline in economic activity could adversely affect our revenue or restrict our future growth. Instability in the financial markets as a result of a health pandemic, terrorism or war also could affect our ability to raise capital. In addition, the insurance premiums charged for some or all of the coverage currently maintained by us could increase dramatically or such coverage could be unavailable in the future.
Future public health crises could negatively impact our financial condition, liquidity, results of operations, and cash flows.
The rapid spread of the COVID-19 pandemic during 2020 resulted in governmental authorities implementing numerous measures to try to contain the virus, such as travel bans and restrictions, quarantines, shelter in place orders, increased border and port controls and closures, and shutdowns. These measures and the public health concerns resulting from the outbreak severely disrupted economic and commercial activity. The resulting impact on domestic and global supply chains caused slowdowns and reduced freight demand for transportation companies such as ours. Because we have a significant concentration of customers within the automotive industry, our freight volumes and revenues were significantly affected by the temporary closure of North American automotive manufacturing facilities during the spring of 2020 as a result of the pandemic. Any future delays or interruptions of automotive production and other consumer activity affecting our customers that could result from any future public health crises could further adversely affect our business. In addition, the implementation of measures to protect the health and safety of our employees, customers, vendors and the general public, or any state of federal vaccination mandates, may disrupt our ability to efficiently manage personnel and operations and to recruit and retain driver and non-driver personnel, which could have a material adverse effect on our operating results. Further, negative financial results, an economic downturn or uncertainty, or a tightening of credit markets caused by a public health crisis could have a material adverse effect on our liquidity and our ability to effectively meet our short- and long-term financial obligations.
Risks Related to Our Common Stock
Our public shareholders may have limited influence over our significant corporate actions.
Matthew T. Moroun, the Chairman of our Board of Directors, is the trustee of family trusts that collectively own greater than 50% of our outstanding common stock. In this capacity, Mr. Moroun holds investment power over the shares of our common stock held by the family trusts. Frederick P. Calderone, a member of our Board of Directors, is the special trustee of certain of these family trusts, and in that capacity, he exercises voting power over the shares held by such trusts, while Mr. Moroun exercises voting power over the shares held by the other family trust of which he is trustee. The Chairmanspecial trustee serves at the discretion of the trustee of the trusts, and members of the Moroun family are the beneficiaries of the family trusts. Messrs. Moroun and Calderone have entered into a voting agreement under which Mr. Moroun agreed to vote the shares of our common stock over which he exercises voting power in accordance with and in the same manner as Mr. Calderone votes the shares of our common stock held by the family trusts over which the special trustee exercises voting power. Therefore, votes cast on behalf of the family trusts control any action requiring the general approval of our shareholders, including the election of our board of directors, holds athe adoption of amendments to our certificate of incorporation and bylaws, and the approval of any merger or sale of substantially all of our assets. This concentration of ownership could also limit the price that some investors might be willing to pay for shares of our common stock.
The interests of our controlling interestshareholders may conflict with those of the Company and our other shareholders.
The interests of the Moroun family trusts could conflict with the interests of the Company or our other shareholders. For example, the concentration of ownership in the Company; therefore,trusts could delay, defer, or prevent a change of control of the influenceCompany that may otherwise be favorable to the Company and our other shareholders. The votes cast on behalf of the family trusts could also result in our publicentry into transactions or agreements that our other shareholders over significant corporate actionsdo not approve. Our controlling shareholders might also refrain from voting in favor of a transaction that would result in our other shareholders receiving consideration for our common stock that is limited,much higher than its then-current market price. Any such decisions that may be made in the future by our controlling shareholders will be in their absolute discretion, subject to applicable laws and fiduciary duties.
Because we are a “controlled company” under NASDAQ rules, we are not subject to certain corporate governance standards that apply to other publicly traded companies.
Matthew T. Moroun,The NASDAQ rules state that a controlled company is one in which more than 50% of the Chairmanvoting power is held by another person or group of our Board of Directors, and a trust of which Mr. Moroun is a co-trustee together own approximately 68.0% of our outstanding common stock. As a result, Mr. Moroun has the power to:persons acting together. A controlled company may elect not to comply with certain corporate governance requirements, including:
|
|
• |
|
• |
|
• |
|
This concentration of ownership could limit the price that some investors might be willing to pay for shares of our common stock, and our ability to engage in significant transactions, such as a merger, acquisition or liquidation, will require the consent of Mr. Moroun. Conflicts of interest could arise between us and Mr. Moroun, and any conflict of interest may be resolved in a manner that does not favor us. Accordingly, Mr. Moroun could cause us to enter into transactions or agreements of which our other shareholders would not approve or make decisions with which they may disagree. Because of Mr. Moroun’s level of ownership, we have elected to be treated asWe are a controlled company in accordance withunder these rules, and these requirements will not apply to us as long as we retain that status. Accordingly, you may not have the rulessame protections afforded to shareholders of companies that are subject to all of the NASDAQ Stock Market. Accordingly, we are not required to comply with NASDAQ Stock Market rules which would otherwise require a majority of our Board to be comprised of independent directors and require our Board to have a compensation committee and a nominating and corporate governance committee comprisedrequirements of independent directors.
Mr. Moroun may continue to retain control of the Company for the foreseeable future and may decide not to enter into a transaction in which shareholders would receive consideration for our common stock that is much higher than the then-current market price of our common stock. In addition, Mr. Moroun could elect to sell a controlling interest in us to a third-party and our other shareholders may not be able to participate in such transaction or, if they are able to participate in such a transaction, such shareholders may receive less than the then-current fair market value of their shares. Any decision regarding ownership of us that Mr. Moroun may make at some future time will be in his absolute discretion, subject to applicable laws and fiduciary duties.NASDAQ.
Our stock trading volume may not provide adequate liquidity for investors.
Although shares of our common stock are traded on the NASDAQ Global Market, the average daily trading volume in our common stock is less than that of other larger transportation and logistics companies. A public trading market having the desired characteristics of depth, liquidity and orderliness depends on the presence in the marketplace of a sufficient number of willing buyers and sellers of the common stock at any given time. This presence depends on the individual decisions of investors and general economic and market conditions over which we have no control. Given the daily average trading volume of our common stock, significant sales of the common stock in a brief period of time, or the expectation of these sales, could cause a decline in the price of our common stock. Additionally, low trading volumes may limit a stockholder’s ability to sell shares of our common stock.
We currently do not intend to pay future dividends on our common stock.
We currently do not anticipate paying future cash dividends on our common stock. Any determination to pay future dividends and other distributions in cash, stock, or property by the Company in the future will be at the discretion of our Board of Directors and will be dependent on then-existing conditions, including our financial condition and results of operations and contractual restrictions. Therefore, stockholders should not rely on future dividend income from shares of our common stock.
Item 1B. Unresolved Staff Comments.
None.
Safeguarding the security and integrity of our systems, networks and data is an important element of our business activities. We invest in resources that help us develop and implement various cybersecurity programs and processes that are designed to assess, identify and manage material risks from cybersecurity threats and to address the ever-evolving cybersecurity landscape.
Our cybersecurity program utilizes various risk mitigation techniques to manage cybersecurity risk by deploying enhanced detection tools. We conduct cybersecurity penetration tests, purple team exercises, and risk assessments through both internal subject matter experts and with the support of third parties to identify threats and vulnerabilities that could adversely impact our business operations. We also attempt to assess the cybersecurity risk profile of, and threats related to, our business partners, vendors and service providers through various assertions of their security practices. In the normal course, we engage assessors, consultants and other third parties to assist in various cyber-related matters. The underlying controls of our cybersecurity program utilize recognized practices and standards for cybersecurity and information technology security. Our risk-based approach enables us to design and implement cybersecurity programs that are specific to our corporate resources, customer profiles and business network.
Our senior management team oversees our cybersecurity strategy and has the overall responsibility for assessing and managing our exposure to cybersecurity risk, with the audit committee of the board of directors providing board level oversight of the activities conducted by management to monitor and mitigate cybersecurity risks. Our corporate strategy for information security is led by our Chief Technology Officer ("CTO"), who develops and directs our information security strategy and policy. He also oversees the engineering and operations related to cybersecurity and issues the proper response when a cyber threat is detected. Our CTO has 22 years of experience in technology and 16 years in compliance and cybersecurity management. Cybersecurity strategy and updates are reviewed by our senior management team on a periodic basis. The audit committee periodically receives a report on cybersecurity matters and related risk exposure from our CTO or senior management and discusses this exposure and our risk management strategies and related controls with management and the internal and external auditors. When covered during an audit committee meeting, the chair of the audit committee reports on its discussion to the full board.
We have experienced, and will continue to experience, cyber incidents in the normal course of our business. While our approach to cybersecurity risk management is intended to mitigate the threat of a cyber attack or other data compromising incident, it may not be successful in preventing all attacks which could have a significant adverse impact to our business and reputation. See “Risk Factors” above for additional information on risks related our business, including from risks related to cyber-attacks, compromised information security, and technology disruptions and failures. As of the date of this report, we are not aware of any risks from cybersecurity threats that have materially affected or are reasonably likely to materially affect us, including our business strategy, results of operations or financial condition.
Our executive offices and primary terminal facilities, which we own, are located in Tontitown, Arkansas. These facilities are located on approximately 46.354.9 acres and consist of 134,581113,249 square feet of office space and maintenance and storage facilities.
Our subsidiaries lease facilities in Fort Wayne and Indianapolis, Indiana; Romulus, Michigan; Memphis, Tennessee;Charlotte, North Carolina; and Monterrey, Mexico. Our terminal facilities in North Little Rock, Arkansas; North Jackson, Ohio; Willard, Ohio; Bloomsburg, Pennsylvania; Bolingbrook, Illinois; and Irving and Laredo, Texas are owned. The leased facilities are leased primarily on contractual terms typically ranging from one to five years and have provisions for early cancellation if we so choose. As of December 31, 2020,2023, the following table provides a summary of the ownership and types of activities conducted at each location:
Location | Own/ Lease | Dispatch Office | Maintenance Facility | Safety Training | ||||
Tontitown, Arkansas | Own | Yes | Yes | Yes | ||||
Bloomsburg, Pennsylvania | Own | Yes | Yes | Yes | ||||
Bolingbrook, Illinois | Own | Yes | No | No | ||||
North Little Rock, Arkansas | Own |
| Yes | Yes | Yes | |||
Indianapolis, Indiana | Lease | No | Yes | No | ||||
Romulus, Michigan | Lease | No | Yes | No | ||||
North Jackson, Ohio | Own | Yes | Yes | Yes | ||||
Willard, Ohio | Own | Yes | Yes |
| ||||
|
|
|
| No | ||||
Irving, Texas | Own | Yes | Yes | Yes | ||||
Laredo, Texas | Own | Yes | Yes | Yes | ||||
Monterrey, Mexico | Lease | Yes | No |
| No | |||
Fort Wayne, Indiana | Lease | Yes | Yes | No | ||||
Charlotte, North Carolina | Lease | No | Yes | No |
We also have access to trailer drop and relay stations in various other locations across the country. We lease certain of these facilities on a month-to-month basis from affiliates of our largest stockholder.
We believe that all of the properties that we own or lease are suitable for their purposes and adequate to meet our needs.
We are involved in certain claims and pending litigation arising from the ordinary conduct of business. We also provide accruals for claims within our self-insured retention amounts. On September 1, 2019, we elected to become self-insured for certain layers of auto liability claims in excess of $1.0 million for which we previously maintained auto liability insurance coverage. On September 1, 2020, we elected to become self-insured for certain layers of auto liability claims in excess of $2.0 million. We currently specifically reserve for claims that are expected to exceed $2.0 million when fully developed, based on the facts and circumstances of those claims. Based on our knowledge of the facts, and in certain cases, opinions of outside counsel, we believe the resolution of such claims and pending litigation will not have a material effect on our financial position, results of operations or cash flows. However, if we experience claims that are not covered by our insurance or that exceed our estimated claim reserve, it could increase the volatility of our earnings and have a materially adverse effect on our financial condition, results of operations or cash flows.
Item 4. Mine Safety Disclosures.
Not applicable.We were named a defendant in a putative class action lawsuit filed on August 6, 2021, in the United States District Court for the Western District of Arkansas. The complaint alleged failure to pay over-the-road drivers minimum wage under the Fair Labor Standards Act and the Arkansas Minimum Wage Act, violations of the Electronic Funds Transfer Act (EFTA), violations of the Arkansas Wage Payment Law (discharge pay and unlawful, usurious advance fees), violations of the Arkansas Common Law, and violations of the Racketeer Influenced and Corrupt Organizations Act (RICO). We denied liability on all claims. On August 5, 2022, the parties filed a Joint Motion for Preliminary Approval of a Collective and Class Action Settlement. On October 7, 2022, the parties submitted to the court an executed Settlement Agreement and Release, to resolve and release all claims asserted in the litigation from January 1, 2020, through July 31, 2022, for $4,750,000. We did not admit liability for any claim. The District Court granted preliminary approval of the settlement on November 14, 2022, and notice of the settlement was sent to class and collective action members. A final settlement approval hearing was held, and the settlement was approved, on October 11, 2023.
Item 5. Market for Registrant’s Common Equity, Related Stockholder Matters and Issuer Purchases of Equity Securities.
Our common stock is traded on the NASDAQ Global Market under the symbol PTSI. As of February 24, 2021,7, 2024, there were approximately 6263 holders of record of our common stock.
Dividends
The Company historically has not declared or paid any cash dividends of $1.00 peron our common sharestock, except for certain special cash dividends paid during each of the months of April 2012 and December 2012. No dividends werehave been paid during any year prior to 2012 or subsequent tosince 2012. Future dividend policy and the payment of dividends, if any, will be determined by the Board of Directors in light of circumstances then existing, including our earnings, financial condition and other factors deemed relevant by the Board of Directors. Currently, the Company does not intend to pay dividends in the foreseeable future.
Repurchases of Equity Securities by the Issuer
The Company’s stock repurchase program has been extended and expanded several times, most recently in April 2017,July 2023, when the Board of Directors reauthorized 500,000 shares of common stock for repurchase under the initial September 2011 authorization. Since the reauthorization, the Company has repurchased 331,565 shares of its common stock under this repurchase program.
In addition, during 2019 and 2018 the CompanyNo shares were repurchased 192,743 shares and 185,597 shares, respectively, through publicly announced Dutch auction tender offers. See “Item 8. Financial Statements and Supplementary Data, Note 9 to the Consolidated Financial Statements – Capital Stock” for additional information regarding these tender offers. The Company did not engage in any tender offers during 2020.
The following table summarizesunder the Company’s common stock repurchasesrepurchase program during the fourth quarter of 2020. No shares were purchased during the quarter other than through the repurchase program described above, and all purchases were made by or on behalf of the Company and not by any “affiliated purchaser.”2023.
Total number of shares | Average price paid | Total number of shares purchased as part of publicly announced plans or | Maximum number of shares that may yet be purchased under the plans or | |||||||||||||
Period | purchased | per share | programs | programs(1) | ||||||||||||
October 1-31, 2020 | 983 | 37.86 | -- | 178,258 | ||||||||||||
November 1-30, 2020 | -- | -- | -- | 178,258 | ||||||||||||
December 1-31, 2020 | 9,823 | 45.91 | -- | 168,435 | ||||||||||||
Total | 10,806 | $ | 45.18 | -- | ||||||||||||
|
|
Securities Authorized for Issuance Under Equity Compensation Plans
See Part III, Item 12, “Security Ownership of Certain Beneficial Owners and Management and Related Stockholder Matters” of this Annual Report for a presentation of compensation plans under which equity securities of the Company are authorized for issuance.
Performance Graph
Set forth below is a line graph comparing the yearly percentage change in the cumulative total stockholder return on our common stock against the cumulative total return of the NASDAQ OMX Index for the NASDAQ Stock Market (U.S. companies) and the NASDAQ OMX Index for the NASDAQ Trucking and Transportation Stocks for the period of five years commencing December 31, 20152018 and ending December 31, 2020.2023. The graph assumes that the value of the investment in our common stock and in each index was $100 on December 31, 20152018 and that all dividends were reinvested.
COMPARISON OF CUMULATIVE TOTAL RETURN AMONG OUR COMMON STOCK,
THE NASDAQ OMX INDEX FOR THE NASDAQ STOCK MARKET (U.S. COMPANIES)
AND THE NASDAQ TRUCKING AND TRANSPORTATION STOCKS INDEX THROUGH DECEMBER 31, 20202023
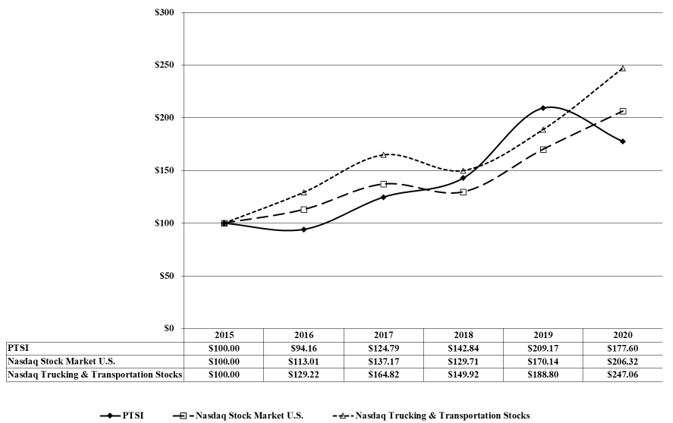
Item 6. Selected Financial Data.[Reserved]
The following selected financial and operating data should be read in conjunction with the Consolidated Financial Statements and notes thereto included elsewhere in this Report.
Year Ended December 31, | ||||||||||||||||||||
2020 | 2019 | 2018 | 2017 | 2016 | ||||||||||||||||
(in thousands, except per share amounts) | ||||||||||||||||||||
Statement of Operations Data: | ||||||||||||||||||||
Operating revenues: | ||||||||||||||||||||
Operating revenues, before fuel surcharge | $ | 438,987 | $ | 439,511 | $ | 445,855 | $ | 373,523 | $ | 382,737 | ||||||||||
Fuel surcharge | 47,838 | 74,666 | 87,406 | 64,315 | 50,115 | |||||||||||||||
Total operating revenues | 486,825 | 514,177 | 533,261 | 437,838 | 432,852 | |||||||||||||||
Operating expenses: | ||||||||||||||||||||
Salaries, wages and benefits | 124,098 | 129,738 | 119,819 | 102,227 | 112,235 | |||||||||||||||
Operating supplies and expenses | 84,275 | 98,420 | 93,130 | 79,505 | 82,993 | |||||||||||||||
Rent and purchased transportation | 165,984 | 168,399 | 201,455 | 174,477 | 158,298 | |||||||||||||||
Depreciation | 56,168 | 55,107 | 49,387 | 42,274 | 39,114 | |||||||||||||||
Insurance and claims | 8,866 | 35,622 | 17,191 | 17,484 | 16,632 | |||||||||||||||
Other | 13,138 | 13,761 | 11,983 | 9,249 | 8,352 | |||||||||||||||
Loss (gain) on sale or disposal of property | 373 | 583 | (1,306 | ) | (58 | ) | (4,700 | ) | ||||||||||||
Total operating expenses | 452,902 | 501,630 | 491,659 | 425,158 | 412,924 | |||||||||||||||
Operating income | 33,923 | 12,547 | 41,602 | 12,680 | 19,928 | |||||||||||||||
Non-operating (expense) income | (1,699 | ) | 6,222 | (4,016 | ) | 5,853 | 1,485 | |||||||||||||
Interest expense | (8,815 | ) | (8,654 | ) | (6,245 | ) | (3,902 | ) | (3,641 | ) | ||||||||||
Income before income taxes | 23,409 | 10,115 | 31,341 | 14,631 | 17,772 | |||||||||||||||
Income tax expense (benefit) | 5,582 | 2,215 | 7,347 | (24,268 | ) | 6,671 | ||||||||||||||
Net income | $ | 17,827 | $ | 7,900 | $ | 23,994 | $ | 38,899 | $ | 11,101 | ||||||||||
Earnings per common share: | ||||||||||||||||||||
Basic | $ | 3.10 | $ | 1.35 | $ | 3.94 | $ | 6.14 | $ | 1.68 | ||||||||||
Diluted | $ | 3.09 | $ | 1.34 | $ | 3.90 | $ | 6.08 | $ | 1.67 | ||||||||||
Average common shares outstanding – Basic | 5,752 | 5,832 | 6,083 | 6,331 | 6,627 | |||||||||||||||
Average common shares outstanding – Diluted (1) | 5,768 | 5,880 | 6,159 | 6,398 | 6,649 | |||||||||||||||
Cash dividends declared per common share | $ | - | $ | - | $ | - | $ | - | $ | - | ||||||||||
__________
|
|
At December 31, | ||||||||||||||||||||
2020 | 2019 | 2018 | 2017 | 2016 | ||||||||||||||||
Balance Sheet Data: | (in thousands) | |||||||||||||||||||
Total assets | $ | 578,592 | $ | 498,009 | $ | 466,066 | $ | 392,185 | $ | 380,066 | ||||||||||
Long-term debt, excluding current portion | 228,330 | 174,187 | 157,315 | 98,995 | 124,391 | |||||||||||||||
Stockholders' equity | 149,981 | 133,975 | 139,447 | 127,604 | 94,158 | |||||||||||||||
Year Ended December 31, | ||||||||||||||||||||
2020 | 2019 | 2018 | 2017 | 2016 | ||||||||||||||||
Operating Data: | ||||||||||||||||||||
Operating ratio (1) | 92.3 | % | 97.1 | % | 90.7 | % | 96.6 | % | 94.8 | % | ||||||||||
Average number of truckloads per week | 6,859 | 8,405 | 8,420 | 7,134 | 6,827 | |||||||||||||||
Average miles per trip | 553 | 499 | 521 | 635 | 684 | |||||||||||||||
Total miles traveled (in thousands) | 193,481 | 213,048 | 222,738 | 229,392 | 237,266 | |||||||||||||||
Average miles per truck | 96,532 | 102,674 | 117,169 | 125,009 | 125,471 | |||||||||||||||
Average revenue, before fuel surcharge per truck per day | $ | 863 | $ | 834 | $ | 923 | $ | 805 | $ | 797 | ||||||||||
Average revenue, before fuel surcharge per loaded mile | $ | 1.91 | $ | 1.84 | $ | 1.71 | $ | 1.51 | $ | 1.53 | ||||||||||
Empty mile factor | 8.8 | % | 7.3 | % | 6.3 | % | 6.8 | % | 6.8 | % | ||||||||||
At end of period: | ||||||||||||||||||||
Total company-owned/leased trucks (2) | 2,013 | 2,130 | 2,031 | 1,721 | 1,855 | |||||||||||||||
Average age of company-owned trucks (in years) | 1.44 | 1.46 | 1.20 | 1.49 | 1.49 | |||||||||||||||
Total company-owned/leased trailers (3) | 7,220 | 7,081 | 6,397 | 5,795 | 5,699 | |||||||||||||||
Average age of company-owned trailers (in years) | 4.92 | 4.18 | 3.54 | 3.38 | 2.71 | |||||||||||||||
Number of employees and independent contract drivers | 2,996 | 3,242 | 3,345 | 2,969 | 3,216 | |||||||||||||||
__________
|
|
|
|
|
|
Item 7. Management’s Discussion and Analysis of Financial Condition and Results of Operations.
Business Overview
The Company's administrative headquarters are in Tontitown, Arkansas. From this location we manage operations conducted through our wholly ownedwholly-owned subsidiaries based in various locations around the United States, Mexico, and Canada. The operations of these subsidiaries can generally be classified into either truckload services or brokerage and logistics services. This designation is based primarily on the ownership of the asset that performed the freight transportation service. Truckload services are performed by Company divisions that generally utilize Company- owned trucks, long-term contractors, or single-trip contractors to transport loads of freight for customers, while brokerage and logistics services coordinate or facilitate the transport of loads of freight for customers and generally involve the utilization of single-trip contractors. Both our truckload operations and our brokerage/logistics operations have similar economic characteristics and are impacted by virtually the same economic factors as discussed elsewhere in this Report. All of the Company's operations are in the motor carrier segment.
For both operations, substantially all of our revenue is generated by transporting freight for customers and is predominantly affected by the rates per mile received from our customers, equipment utilization, and our percentage of non-compensated miles. These aspects of our business are carefully managed and efforts are continuously underway to achieve favorable results. Truckload services revenues, excluding fuel surcharges, represented 76.9%65.3%, 82.7%66.1% and 80.0%67.0% of total revenues, excluding fuel surcharges for the twelve months ended December 31, 2020, 20192023, 2022 and 2018,2021, respectively.
The main factors that impact our profitability on the expense side are costs incurred in transporting freight for our customers. Currently, our most challenging costs include fuel, driver recruitment, training, wage and benefit costs, independent broker costs (which we record as purchased transportation), insurance and claims, and maintenance, and capital equipment costs.
In discussing our results of operations we use revenue, before fuel surcharge (and operating supplies and expense, net of fuel surcharge), because management believes that eliminating the impact of this sometimes volatile source of revenue allows a more consistent basis for comparing our results of operations from period to period. During 2020, 20192023, 2022 and 2018,2021, approximately $47.8$104.7 million, $74.7$128.1 million and $87.4$65.9 million, respectively, of the Company's total revenue was generated from fuel surcharges. We also discuss certain changes in our expenses as a percentage of revenue, before fuel surcharge, rather than absolute dollar changes. We do this because we believe the high variable cost nature of certain expenses makes a comparison of changes in expenses as a percentage of revenue more meaningful than absolute dollar changes.
Results of Operations - Truckload Services
The following table sets forth, for truckload services, the percentage relationship of expense items to operating revenues, before fuel surcharges, for the periods indicated. Operating supplies and expenses are shown net of fuel surcharges.
Years Ended December 31, | Years Ended December 31, | |||||||||||||||||||||||
2020 | 2019 | 2018 | 2023 | 2022 | 2021 | |||||||||||||||||||
Operating revenues, before fuel surcharge | 100.0 | % | 100.0 | % | 100.0 | % | 100.0 | % | 100.0 | % | 100.0 | % | ||||||||||||
Operating expenses: | ||||||||||||||||||||||||
Salaries, wages and benefits | 35.3 | 34.5 | 32.4 | 37.8 | 31.3 | 30.6 | ||||||||||||||||||
Operating supplies and expenses, net of fuel surcharge | 10.7 | 6.5 | 1.5 | 11.8 | 6.8 | 8.3 | ||||||||||||||||||
Rent and purchased transportation | 23.2 | 28.3 | 34.4 | 23.5 | 26.0 | 24.3 | ||||||||||||||||||
Depreciation | 16.5 | 15.0 | 13.7 | 13.8 | 11.3 | 12.5 | ||||||||||||||||||
Insurance and claims | 2.6 | 9.8 | 4.8 | 6.7 | 6.0 | 4.4 | ||||||||||||||||||
Other | 3.6 | 3.6 | 3.0 | 4.4 | 2.9 | 2.5 | ||||||||||||||||||
Gain on sale or disposal of property | 0.1 | 0.0 | (0.1 | ) | ||||||||||||||||||||
(Gain) on sale or disposal of property | (0.3 | ) | (0.6 | ) | (0.3 | ) | ||||||||||||||||||
Total operating expenses | 92.0 | 97.7 | 89.7 | 97.7 | 83.7 | 82.3 | ||||||||||||||||||
Operating income | 8.0 | 2.3 | 10.3 | 2.3 | 16.3 | 17.7 | ||||||||||||||||||
Non-operating (expense) income | (0.5 | ) | 1.5 | (1.0 | ) | |||||||||||||||||||
Non-operating income | 1.2 | 0.5 | 1.9 | |||||||||||||||||||||
Interest expense | (2.2 | ) | (2.1 | ) | (1.6 | ) | (1.6 | ) | (1.2 | ) | (1.4 | ) | ||||||||||||
Income before income taxes | 5.3 | % | 1.7 | % | 7.7 | % | 1.9 | % | 15.6 | % | 18.2 | % | ||||||||||||
20202023 Compared to 20192022
For the year ended December 31, 2020,2023, truckload services revenue, before fuel surcharges, decreased 7.2%14.8% to $337.5$460.9 million as compared to $363.6$540.9 million for the year ended December 31, 2019.2022. The decrease relates primarily to temporary plant shutdowns in early 2020 experienced by some of our major customers due to COVID-19, and to a 14.2% decrease in the average number of trucks in service from 2,075 during 2019 to 2,004 during 2020. These decreases were partially offset by a 3.9% increase in our rate per loaded mile, from $1.84$2.92 for the year ended December 31, 20192022 to $1.91$2.51 for the year ended December 31, 20202023 and to a 0.8% decrease in loaded miles from 185.0 million for the year ended December 31, 2022 to 183.8 million for the year ended December 31, 2023. The decrease in rate per loaded mile reflects the challenging freight rate environment across our industry during 2023, while the slight reduction in loaded miles was largely due to the impacts of the automotive plant shutdowns during the UAW strikes in September and October 2023, partially offset by an increase in our average truck count during the current year attributable to the acquisition of Metropolitan Trucking assets in June 2022. We expect freight rates to generally remain under pressure from customers during 2024 with freight demand continuing to be somewhat impacted by the recent automotive shutdowns and general economic uncertainties.
Salaries, wages and benefits increased from 34.5%31.3% of revenues, before fuel surcharges, during 20192022 to 35.3%37.8% of revenues, before fuel surcharges, during 2020.2023. The percentage-based increase relates primarily to an increase in amounts expensedthe percentage of miles driven by company-employed drivers, as opposed to third-party owner-operators for group health insurance expense and workers compensation claims expense. Also contributingthe year-ended December 31, 2023 compared to December 31, 2022. The increase also relates to the percentage-basedinteraction of a decrease in operating revenues with the fixed-cost nature of employing human capital.
Operating supplies and expenses increased from 6.8% of revenues, before fuel surcharges, during 2022 to 11.8% of revenues, before fuel surcharges, during 2023. The increase wasrelates primarily to the interaction of expenses with fixed-cost characteristics, such as generalrents, driver training schools and administrative wages, maintenance wages,operating taxes and operations wageslicenses with a decrease in revenuesrevenue. The increase also relates to an increase in the average surcharge-adjusted fuel price paid per gallon of diesel fuel, due to decreased fuel surcharge collections from customers for the periods compared. In addition, the proportion of total miles driven by company drivers increased as the number of company drivers increased year-over-year.year ended December 31, 2023 compared to December 31, 2022.
Operating suppliesRent and expenses increasedpurchased transportation decreased from 6.5%26.0% of revenues, before fuel surcharges, during 20192022 to 10.7%23.5% of revenues, before fuel surcharges, during 2020.2023. The decrease was primarily due to a decrease in the percentage of miles driven by third-party owner-operators as opposed to company-employed drivers for the year-ended December 31, 2023 compared to December 31, 2022. The decrease also relates to a decrease in the rates paid to third-party owner-operators for the year ended December 31, 2023 compared to the year ended December 31, 2022.
Depreciation increased from 11.3% of revenues, before fuel surcharges, during 2022 to 13.8% of revenues, before fuel surcharges, during 2023. The increase relates primarily to an increase in the proportion of total miles driven by company driverscost for the year ended December 31, 2020 compared to December 31, 2019. This increase in miles driven by company drivers has the effect of increasing our net operating supplies and expenses while decreasing the Rent and purchased transportation category, as fuel surchargereplacement revenue generated from transportation services performed by owner-operators is reflected as a reduction in net operating supplies and expenses, while fuel surcharges paid to owner-operators for their services is reported along with their base rate of pay in the Rent and purchased transportation category.
Rent and purchased transportation decreased from 28.3% of revenues, before fuel surcharges, during 2019 to 23.2% of revenues, before fuel surcharges, during 2020. The decrease was primarily due to a reduction in the proportion of total miles driven by owner-operators for the year ended December 31, 2020equipment compared to the year ended December 31, 2019.
Depreciation increased from 15.0%cost of revenues, before fuel surcharges, during 2019 to 16.5% of revenues, before fuel surcharges, during 2020. The increase relates primarilyretired equipment and to the interaction of a decrease in operating revenues with the fixed-cost nature of depreciation expense. Also contributing to the increase was an increase in the average number of trailers owned by the company and to a general increase in truck and trailer replacement costs. During 2020, the average number of company-owned trailers increased by 634 as compared to 2019. The Company uses a three-year replacement cycle for trucks it intends to trade back or sell and a five-year life cycle for tractors it intends to place in its lease to own program. Trailers are on a seven-year replacement cycle. The cost of new trucks and trailers have increased significantly over the previous three-year and seven-year periods and depreciating higher cost equipment over the same length of time will result in an increase in depreciation expense during the respective period.
Insurance and claims decreased from 9.8% of revenues, before fuel surcharges, during 2019 to 2.6% of revenues, before fuel surcharges, during 2020. This decrease relates primarily to the negative impact, recognized in 2019, of the settlement of a lawsuit which claimed that the Company was in violation of minimum wage laws with regard to certain activities performed by employee drivers and for a lawsuit brought against the Company by certain individuals who asserted that they were misclassified as owner-operators. In addition, the Company became self-insured for certain lower layers of auto liability claims commencing September 1, 2019. During the first nine months of 2019, the Company paid for auto liability insurance coverage in these lower levels through various third-party insurance carriers. The decision to self-insure these layers reduced insurance premium costs from that point through to the annual renewal date of September 1, 2020.
Non-operating income decreased from a gain of 1.5% of revenues, before fuel surcharges, during 2019 to a loss of 0.5% of revenues, before fuel surcharges, during 2020. This decrease resulted primarily from a decrease in the market value of our marketable equity securities portfolio at December 31, 2020 as compared to December 31, 2019.
The truckload services division operating ratio, which measures the ratio of operating expenses, net of fuel surcharges, to operating revenues, before fuel surcharges, improved from 97.7% for 2019 to 92.0% for 2020.
2019 Compared to 2018
For the year ended December 31, 2019, truckload services revenue, before fuel surcharges, increased 2.0% to $363.6 million as compared to $356.6 million for the year ended December 31, 2018. The increase related primarily to a 7.8% increase in our rate per loaded mile, from $1.71 for the year ended December 31, 2018 to $1.84 for the year ended December 31, 2019, and to an increase in the average number of trucks in service from 1,901 during 2018 to 2,075 during 2019. These increases were partially offset by a decrease in the average number of miles travelled per day by our trucks in 2019 compared to 2018, which was a result of a decrease in the average length of haul of shipments offered by our customers.
Salaries, wages and benefits increased from 32.4% of revenues, before fuel surcharges, during 2018 to 34.5% of revenues, before fuel surcharges, during 2019. The increase related primarily to an increase in company driver wages paid during 2019 compared to 2018. The increase in driver wages related primarily to route specific raises that were phased in throughout 2019 and to an increase in wages and benefits paid to regional and short-haul drivers. In addition, the proportion of total miles driven by company drivers increased as the number of company drivers increased year-over-year.
Operating suppliesInsurance and expensesclaims increased from 1.5%6.0% of revenues, before fuel surcharges, during 20182022 to 6.5%6.7% of revenues, before fuel surcharges, during 2019. The2023. This increase relatedrelates primarily to an increase in the average surcharge-adjusted fuel pricerate per mile paid for auto liability insurance combined with a decrease in our revenue rate per gallon of diesel fuel, which was a result of decreased fuel surcharge collections from customers. Fuel surcharge collections can fluctuate significantly from period to period as they are generally based on changes in fuel prices from period to period so that, during periods of rising fuel prices, fuel surcharge collections increase, while fuel surcharge collections decrease during periods of falling fuel prices. Also contributing to the increase was an increase in the proportion of total miles driven by company drivers for the year ended December 31, 2019 compared to December 31, 2018. This increase in miles driven by company drivers has the effect of increasing our net operating supplies and expenses while decreasing the Rent and purchased transportation category, as fuel surcharge revenue generated from transportation services performed by owner-operators is reflected as a reduction in net operating supplies and expenses, while fuel surcharges paid to owner-operators for their services is reported along with their base rate of pay in the Rent and purchased transportation category.mile.
Rent and purchased transportation decreasedNon-operating income increased from 34.4%0.5% of revenues, before fuel surcharges, during 20182022 to 28.3%1.2% of revenues, before fuel surcharges, during 2019. The decrease was primarily due to a reduction in the proportion of total miles driven by owner-operators for the year ended December 31, 2019 compared to the year ended December 31, 2018.
Depreciation increased from 13.7% of revenues, before fuel surcharges, during 2018 to 15.0% of revenues, before fuel surcharges, during 2019. This increase was primarily the result of an increase in the average number of trucks and trailers owned by the company. During 2019, the average number of company-owned trucks and trailers increased by 199 and 503, respectively, compared to 2018. The Company uses a three-year replacement cycle for trucks it intends to trade back or sell and a five-year life cycle for tractors it intends to place in its lease to own program. Trailers are on a seven-year replacement cycle. The cost of new trucks and trailers had increased significantly over the previous three-year and seven-year periods. Depreciating higher cost equipment over the same length of time will result in an increase in depreciation expense during the respective period.
Insurance and claims increased from 4.8% of revenues, before fuel surcharges, during 2018 to 9.8% of revenues, before fuel surcharges, during 2019. This increase was primarily the result of the negative impact of estimated amounts reserved for the settlement of a lawsuit which claims that the Company was in violation of minimum wage laws with regard to certain activities performed by employee drivers and for a similar suit brought against the Company by certain individuals who assert that they were misclassified as owner-operators. This increase was partially offset by decreases in insurance premiums resulting from the election to become self-insured for certain categories of property damage and liability risk. The Company became self-insured for property damage on company-owned trucks commencing on September 1, 2018. Prior to this, the Company paid insurance premiums and was insured for property damage insurance coverage for company-owned trucks through a third-party insurance carrier. In addition, the Company became self-insured for certain layers of auto liability claims in excess of $1.0 million commencing September 1, 2019. During the first nine months of 2019, and for the entire year of 2018, the Company paid for auto liability insurance coverage for claims in excess of $1.0 million through various third-party insurance carriers.
Other expenses increased from 3.0% of revenues, before fuel surcharges, during 2018 to 3.6% of revenues, before fuel surcharges, during 2019. This increase related primarily to an increase in amounts expensed for legal fees and other supplies and expenses. This increase was partially offset by a decrease for amounts expensed for uncollectible revenue.
Non-operating income increased from a loss of 1.0% of revenues, before fuel surcharges, during 2018 to 1.5% of revenue, before fuel surcharges, during 2019.2023. This increase resulted primarily from an increase in interest income recognized, as well as a larger increase in the market value of our marketable equity securities portfolio at December 31, 20192023 as compared to December 31, 2018. The unrealized pre-tax gain in market value for 2019 was approximately $3,698,000 compared to a net unrealized pre-tax loss in market value of approximately $5,763,000 reported as Non-operating expense for 2018.2022.
Interest expense increased from 1.6% of revenues, before fuel surcharges, during 2018 to 2.1% of revenues, before fuel surcharges, during 2019. This increase was attributable to market increases in interest rates and to increases in amounts financed by the Company for new equipment. The increase in amounts financed was the result of growth in the number of company-owned trucks and trailers operated within our fleet.
The truckload services division operating ratio, which measures the ratio of operating expenses, net of fuel surcharges, to operating revenues, before fuel surcharges, increased from 89.7% for 2018 to 97.7% for 2019.2023 from 83.7% for 2022.
2022 Compared to 2021
For the year ended December 31, 2022, truckload services revenue, before fuel surcharges, increased 25.9% to $540.9 million as compared to $429.6 million for the year ended December 31, 2021. The increase relates primarily to a 13.5% increase in our rate per loaded mile, from $2.58 for the year ended December 31, 2021 to $2.92 for the year ended December 31, 2022 and to a 10.9% increase in loaded miles from 166.8 million for the year ended December 31, 2021 to 185.0 million for the year ended December 31, 2022.
Salaries, wages and benefits increased from 30.6% of revenues, before fuel surcharges, during 2021 to 31.3% of revenues, before fuel surcharges, during 2022. The percentage-based increase relates primarily to the increase in employees combined with a decrease in independent contractors.
Operating supplies and expenses decreased from 8.3% of revenues, before fuel surcharges, during 2021 to 6.8% of revenues, before fuel surcharges, during 2022. The decrease relates primarily to a decrease in the average surcharge-adjusted fuel price paid per gallon of diesel fuel, due to increased fuel surcharge collections from customers for the year ended December 31, 2022 compared to December 31, 2021. The decrease also relates to the interaction of expenses with fixed-cost characteristics, such as rents, driver training schools and operating taxes and licenses.
Rent and purchased transportation increased from 24.3% of revenues, before fuel surcharges, during 2021 to 26.0% of revenues, before fuel surcharges, during 2022. The increase was primarily due to an increase in the rates paid to third-party owner-operators for the year ended December 31, 2022 compared to the year ended December 31, 2021.
Depreciation decreased from 12.5% of revenues, before fuel surcharges, during 2021 to 11.3% of revenues, before fuel surcharges, during 2022. The decrease relates primarily to the interaction of an increase in operating revenues with the fixed-cost nature of depreciation expense.
Insurance and claims increased from 4.4% of revenues, before fuel surcharges, during 2021 to 6.0% of revenues, before fuel surcharges, during 2022. This increase relates primarily to an increase in accident and legal reserves, recognized in 2022 as compared to 2021 and to an increase in the premiums paid for auto liability and cargo insurance.
Non-operating income decreased from 1.9% of revenues, before fuel surcharges, during 2021 to 0.5% of revenues, before fuel surcharges, during 2022. This decrease resulted primarily from a smaller increase in the market value of our marketable equity securities portfolio at December 31, 2022 as compared to December 31, 2021.
The truckload services division operating ratio, which measures the ratio of operating expenses, net of fuel surcharges, to operating revenues, before fuel surcharges, increased to 83.7% for 2022 from 82.3% for 2021.
Results of Operations - Logistics and Brokerage Services
The following table sets forth, for logistics and brokerage services, the percentage relationship of expense items to operating revenues, before fuel surcharges, for the periods indicated. Brokerage operations occur specifically in certain divisions; however, brokerage operations occur throughout the Company in similar operations having substantially similar economic characteristics. Rent and purchased transportation, which includes costs paid to third-party carriers, are shown net of fuel surcharges.
Years Ended December 31, | Years Ended December 31, | |||||||||||||||||||||||
2020 | 2019 | 2018 | 2023 | 2022 | 2021 | |||||||||||||||||||
Operating revenues, before fuel surcharge | 100.0 | % | 100.0 | % | 100.0 | % | 100.0 | % | 100.0 | % | 100.0 | % | ||||||||||||
Operating expenses: | ||||||||||||||||||||||||
Salaries, wages and benefits | 5.0 | 5.8 | 4.6 | 4.9 | 4.6 | 4.6 | ||||||||||||||||||
Rent and purchased transportation | 86.5 | 86.4 | 88.1 | 84.6 | 80.8 | 82.5 | ||||||||||||||||||
Insurance and claims | 0.1 | 0.1 | 0.1 | |||||||||||||||||||||
Other | 1.7 | 2.4 | 1.6 | 2.4 | 1.8 | 1.6 | ||||||||||||||||||
Total operating expenses | 93.3 | 94.7 | 94.4 | 91.9 | 87.2 | 88.7 | ||||||||||||||||||
Operating income | 6.7 | 5.3 | 5.6 | 8.1 | 12.8 | 11.3 | ||||||||||||||||||
Non-operating (expense) income | 0.0 | 0.8 | (0.5 | ) | ||||||||||||||||||||
Non-operating income | 0.8 | 0.2 | 1.0 | |||||||||||||||||||||
Interest expense | (1.1 | ) | (1.1 | ) | (0.7 | ) | (0.7 | ) | (0.5 | ) | (0.8 | ) | ||||||||||||
Income before income taxes | 5.6 | % | 5.0 | % | 4.4 | % | 8.2 | % | 12.5 | % | 11.5 | % | ||||||||||||
20202023 Compared to 20192022
For the year ended December 31, 2020,2023, logistics and brokerage services revenues, before fuel surcharges, decreased 11.7% to $245.2 million as compared to $277.8 million for the year ended December 31, 2022. The decrease was primarily related to a 21.4% decrease in revenue per load, partially offset by a 12.3% increase in the number of loads during 2023 as compared to 2022. The decrease in revenue per load was due to a reduction in rates paid for brokered loads during 2023, as spot market rates were negatively impacted by downward rate pressure driven by the challenging truckload freight rate environment across our industry during 2023. We expect freight rates to generally remain under pressure from customers during 2024 with freight demand continuing to be somewhat impacted by the recent automotive shutdowns and general economic uncertainties.
Rent and purchased transportation increased from 80.8% of revenues, before fuel surcharges, in 2022 to 84.6% of revenues, before fuel surcharges, in 2023. The increase results from paying third-party carriers a larger percentage of customer revenue, coupled with the interaction of a decrease in operating revenues with the need for purchased transportation.
The logistics and brokerage services division operating ratio, which measures the ratio of operating expenses, net of fuel surcharges, to operating revenues, before fuel surcharges, increased to 91.9% for 2023 from 87.2% for 2022.
2022 Compared to 2021
For the year ended December 31, 2022, logistics and brokerage services revenues, before fuel surcharges, increased 33.6%31.3% to $101.5$277.8 million as compared to $75.9$211.7 million for the year ended December 31, 2019.2021. The increase was primarily related to a 36.0%20.9% increase in the number of loads carried for customers during 20202022 as compared to 2019.2021, partially offset by a 3.5% decrease in revenue per load.
Salaries, wagesRent and benefitspurchased transportation decreased from 5.8%82.5% of revenues, before fuel surcharges, in 20192021 to 5.0%80.8% of revenues, before fuel surcharges, in 2020.2022. The decrease relates primarily to the effect of higher revenues without a corresponding increase in those wages with fixed cost characteristics, such as general and administrative wages.
Rent and purchased transportation increased from 86.4% of revenues, before fuel surcharges, in 2019 to 86.5% of revenues, before fuel surcharges, in 2020. The increase results from paying third-party carriers a largersmaller percentage of customer revenue.
The logistics and brokerage services division operating ratio, which measures the ratio of operating expenses, net of fuel surcharges, to operating revenues, before fuel surcharges, improved to 87.2% for 2022 from 94.7%88.7% for 2019 to 93.3% for 2020.
2019 Compared to 2018
For the year ended December 31, 2019, logistics and brokerage services revenues, before fuel surcharges, decreased 15.0% to $75.9 million as compared to $89.3 million for the year ended December 31, 2018. The decrease was primarily the result of a decrease in freight rates charged to customers during 2019 as compared to 2018.
Salaries, wages and benefits increased from 4.6% of revenues, before fuel surcharges, in 2018 to 5.8% of revenues, before fuel surcharges, in 2019. The increase related primarily to the effect of lower revenues without a corresponding decrease in those wages with fixed cost characteristics, such as general and administrative wages.
Rent and purchased transportation decreased from 88.1% of revenues, before fuel surcharges, in 2018 to 86.4% of revenues, before fuel surcharges, in 2019. The decrease results from paying third-party carriers a smaller percentage of customer revenue.2021.
The logistics and brokerage services division operating ratio, which measures the ratio of operating expenses, net of fuel surcharges, to operating revenues, before fuel surcharges, increased from 94.4% for 2018 to 94.7% for 2019.
Results of Operations - Combined Services
20202023 Compared to 20192022
Income tax expense was approximately $5.6$10.2 million in 2020,2023, resulting in an effective rate of 23.8%35.6%, as compared to approximately $2.2$28.3 million, or an effective tax rate of 21.9%23.8% in 2019.2022. The effective tax rate is impacted by the existenceeffect of partially non-deductible mealstate taxes and incidental expense per-diem payments to company drivers. Per-diem payments may cause a significant difference in the Company’s effective tax rate from period-to-period as the proportion of non-deductible expenses to pre-tax net income increases or decreases.other factors.
In determining whether a tax asset valuation allowance is necessary, management, in accordance with the provisions of Accounting Standards Codification (“ASC”) 740-10-30, weighs all available evidence, both positive and negative to determine whether, based on the weight of that evidence, a valuation allowance is necessary. If negative conditions exist which indicate a valuation allowance might be necessary, consideration is then given to what effect the future reversals of existing taxable temporary differences and the availability of tax strategies might have on future taxable income to determine the amount, if any, of the required valuation allowance. As of December 31, 2020,2023, management determined that the future reversals of existing taxable temporary differences and available tax strategies would generate sufficient future taxable income to realize its tax assets and therefore a valuation allowance was not necessary.
The Company recognizes a tax benefit from an uncertain tax position only if it is more likely than not that the position will be sustained on examination by taxing authorities, based on the technical merits of the position. As of December 31, 2020,2023, an adjustment to the Company’s consolidated financial statements for uncertain tax positions has not been required as management believes that the Company’s tax positions taken in income tax returns filed or to be filed are supported by clear and unambiguous income tax laws. The Company recognizes interest and penalties related to uncertain income tax positions, if any, in income tax expense. During 20202023 and 2019,2022, the Company has not recognized or accrued any interest or penalties related to uncertain income tax positions.
The Company and its subsidiaries are subject to U.S. and Canadian federal income tax laws as well as the income tax laws of multiple state jurisdictions. The major tax jurisdictions in which we operate generally provide for a deficiency assessment statute of limitation period of three years and as a result, the Company’s tax years 20172020 and forward remain open to examination in those jurisdictions.
The combined net income for all divisions was $17.8$18.4 million, or 4.1%2.6% of revenues, before fuel surcharge, for 20202023 as compared to the combined net income for all divisions of $7.9$90.7 million or 1.8%11.1% of revenues, before fuel surcharge, for 2019.2022. Diluted earnings per share increased from $1.34decreased to $0.83 for the year ended December 31, 2019 to $3.092023 from $4.04 for the year ended December 31, 2020.2022.
20192022 Compared to 20182021
Income tax expense was approximately $2.2$28.3 million in 2019,2022, resulting in an effective rate of 21.9%23.8%, as compared to approximately $7.3$26.0 million, or an effective tax rate of 23.4%25.4% in 2018.2021. The effective tax rate is impacted by the existenceeffect of partially non-deductible mealstate taxes and incidental expense per-diem payments to company drivers. Per-diem payments may cause a significant difference in the Company’s effective tax rate from period-to-period as the proportion of non-deductible expenses to pre-tax net income increases or decreases.other factors.
In determining whether a tax asset valuation allowance is necessary, management, in accordance with the provisions of ASC 740-10-30, weighs all available evidence, both positive and negative to determine whether, based on the weight of that evidence, a valuation allowance is necessary. If negative conditions exist which indicate a valuation allowance might be necessary, consideration is then given to what effect the future reversals of existing taxable temporary differences and the availability of tax strategies might have on future taxable income to determine the amount, if any, of the required valuation allowance. As of December 31, 2019,2022, management determined that the future reversals of existing taxable temporary differences and available tax strategies would generate sufficient future taxable income to realize its tax assets and therefore a valuation allowance was not necessary.
The Company recognizes a tax benefit from an uncertain tax position only if it is more likely than not Management also determined that the position will be sustained on examination by taxing authorities, based on the technical merits of the position. As of December 31, 2019, anno adjustment to the Company’s consolidated financial statements for uncertain tax positions was not required as of December 31, 2022 as management believes that the Company’s tax positions taken in income tax returns filed or to be filed are supported by clear and unambiguous income tax laws. The Company recognizes interestAdditionally, during 2022 and penalties related to uncertain income tax positions, if any, in income tax expense. During 2019 and 2018,2021, the Company did not recognize or accruedaccrue any interest or penalties related to uncertain income tax positions.
The Company and its subsidiaries are subject to U.S. and Canadian federal income tax laws as well as the income tax laws of multiple state jurisdictions. The major tax jurisdictions in which we operate generally provide for a deficiency assessment statute of limitation period of three years and as a result, as of December 31, 2019, the Company’s tax years 2016 and forward remained open to examination in those jurisdictions.
The combined net income for all divisions was $7.9$90.7 million, or 1.8%11.1% of revenues, before fuel surcharge, for 20192022 as compared to the combined net income for all divisions of $24.0$76.5 million or 5.4%11.9% of revenues, before fuel surcharge, for 2018.2021. Diluted earnings per share decreased from $3.90increased to $4.04 for the year ended December 31, 2018 to $1.342022 from $3.35 for the year ended December 31, 2019.2021.
Quarterly Results
Liquidity and Capital Resources
Our business has required, and will continue to require, a significant investment in new revenue equipment. Our primary sources of liquidity have been funds provided by operations, proceeds from the sales of revenue equipment, borrowings under our lines of credit, installment notes and investment margin account, and issuances of equity securities.
During 2020,2023, we generated $67.6$114.6 million in cash from operating activities compared to $84.3$168.8 million and $82.3$101.7 million in 20192022 and 2018,2021, respectively. Investing activities used $32.7$11.3 million in cash during 20202023 compared to $62.3using $113.5 million and $55.3generating $9.3 million in 20192022 and 2018,2021, respectively. The cash used for investing activities in all three years related primarily to the purchase of revenue equipment such as trucks and trailers and related equipment such as auxiliary power units. Financing activities used $34.9$76.8 million in cash during 20202023 compared to using $22.0generating $0.3 million during 20192022 and $27.0using $92.8 million during 2018.2021. See the Consolidated Statements of Cash Flows in Item 8 of this Report.
Our primary use of funds is for the purchase of revenue equipment. We typically use installment notes, our existing lines of credit on an interim basis, proceeds from the sale or trade of equipment, and cash flows from operations to finance capital expenditures and repay long-term debt. During 20202023 and 2019,2022, we utilized cash on hand, installment notes, and our lines of credit to finance revenue equipment purchases of approximately $106.9$113.5 million and $100.1$82.6 million, respectively.
We often finance the acquisition of revenue equipment through installment notes with fixed interest rates and terms ranging from 36 to 84 months. At December 31, 2020,2023, the Company’s subsidiaries had combined outstanding indebtedness under such installment notes of $250.6$261.7 million. These installment notes are payable in monthly installments, ranging from 36 monthly installments to 84 monthly installments, at a weighted average interest rate of 3.30%4.20%. At December 31, 2019,2022, the Company’s subsidiaries had combined outstanding indebtedness under such installment notes of $224.8$264.3 million. These installment notes were payable in monthly installments, ranging from 36 to 84 months at a weighted average interest rate of 3.65%3.16%.
In order to maintain our truck and trailer fleet count, it is often necessary to purchase replacement units and place them in service before trade units are removed from service. The timing of this process often requires the Company to pay for new units without any reduction in price for trade units. In this situation, the Company later receives payment for the trade units as they are delivered to the equipment vendor and have passed vendor inspection. During the twelve months ended December 31, 20202023 and 2019,2022, the Company received approximately $14.8$15.7 million and $11.2$0.0 million, respectively, for units delivered for trade.
During 2020,2023, we maintained a revolving line of credit with a borrowing limit of $60.0 million. Under this credit facility, amounts outstanding under the line bear interest at LIBOR (determined as of the first day of each month)Term SOFR plus 1.25% (1.40%1.35% (6.66% at December 31, 2020)2023), are secured by our trade accounts receivable and mature on July 1, 2022.2026. The credit facility also establishes an “unused fee” of 0.25% if average borrowings are less than $18.0 million. At December 31, 20202023, outstanding advances on the line of credit were approximately $18.6$0.1 million, including approximately $0.3$0.1 million in letters of credit, with availability to borrow $41.4$59.9 million.
During 2020, we borrowed $17.6 million under a ten-year term loan to refinance our purchase during the first quarter of 2020 of a terminal in Laredo, Texas, which was initially financed using funds from our line of credit. The term loan bears interest at a fixed rate of 3.02% and is secured by a mortgage and assignment of rents on the Laredo terminal property.
Trade accounts receivable increaseddecreased from $61.8$134.7 million at December 31, 20192022 to $77.7$80.6 million at December 31, 2020.2023. The increasedecrease relates to a general increasedecrease in freight revenue and fuel surcharge revenue, which flows through the accounts receivable account, during the fourth quarter of 20202023 as compared to the freight revenue and fuel surcharge revenue generated during the fourth quarter of 2019.2022.
Prepaid expenses and deposits increased from $8.7 million at December 31, 2019 to $10.2 million at December 31, 2020. The increase primarily relates to an increase in prepaid taxes and licenses.
Marketable equity securities at December 31, 2020 decreased2023 increased approximately $1.6$1.5 million as compared to December 31, 2019.2022. The decreaseincrease resulted from sales of marketable equity securities of approximately $2.0 million and a decreasean increase in the market value of the remaining portfolio ofby approximately $3.5$1.6 million offset by purchasessales of marketable equity securities of $3.9approximating $0.1 million. At December 31, 2020,2023, the remaining marketable equity securities have a combined cost basis of approximately $25.8$30.3 million and a combined fair market value of approximately $27.9$43.2 million. The Company has developed a strategy to invest in securities from which it expects to receive dividends that qualify for favorable tax treatment, as well as appreciate in value. During 2020,2023, the Company received dividends of approximately $1.3$1.5 million. The holding term of these securities depends largely on the general economic environment, the equity markets, borrowing rates, and the Company's cash requirements.
Land increased from $7.2 million at December 31, 2019 to $18.5 million at December 31, 2020. The increase relates primarily to the purchase
Revenue equipment at December 31, 2020,2023, which generally consists of trucks, trailers, and revenue equipment accessories such as Qualcomm™ satellite tracking units and auxiliary power units, increased approximately $67.9$51.7 million as compared to December 31, 2019.2022. The increase relates primarily to overall fleet growththe purchase of company-ownedreplacement trucks and trailers utilized by the company at December 31, 2020 compared to December 31, 2019 and to the higher purchase price of new trucks and trailers compared to the trucks and trailers which are being replaced and sold. Also contributing to the increase was a delay in the surrender of trade trucks in exchange for the new replacement trucks. These delayed trades will be surrendered when payment is received during 2021 which will reduce the balance in both the Revenue equipment and Accumulated depreciation category.trailers.
Accounts payable increased from $16.6$48.9 million at December 31, 20192022 to $46.1$62.7 million at December 31, 2020.2023. This increase was primarily attributable to extended payment terms with certain suppliers. Also contributing to thenew revenue equipment that was invoiced, or delivered, but not yet paid as of December 31, 2023. This increase was offset by other factors including a $8.7 million increasedecrease in the percentage of miles driven by third-party owner-operators, as opposed to company-employed drivers, a reduction in the bonus accrual and a decrease in amounts accrued for fixed asset purchases from $0.4 millionparts at the end of 2019 to $9.1 million at the end of 2020. In addition, $5.0 million of the increase was related to an increase in bank overdrafts outstanding, from $2.6 million at December 31, 2019 to $7.6 million at December 31, 2020.2023. Accounts payable accruals can vary significantly at the end of each reporting period depending on the timing of the actual date of payment in relation to the last day of the reporting period.
Accrued expenses and other liabilities decreased from $40.6$34.2 million at December 31, 20192022 to $26.6$16.8 million at December 31, 2020.2023. The decrease was primarily related to the payment of certain litigation settlements recordedpayments during 2019 and paid for during 2020. See “Item 3. Legal Proceedings” for more information regarding litigation.
Current maturities of long term-debt and long-term debt fluctuations are reviewed on an aggregate basis as the classification2023 of amounts in each category are typically affected merely by the passage of time. Current maturities of long-term debtaccrued for liability and long-term debt, on an aggregate basis,legal claims at December 31, 2020, increased approximately $44.3 million as compared to December 31, 2019. The increase was related to additional borrowings on our revolving line of credit and under installment notes entered into during 2020, net of the principal portion of scheduled installment note payments made during 2020.2022.
For 2021,2024, we expect to purchase 125688 new trucks and 1,548 trailers while continuing to sell or trade equipment that has reached the end of its life cycle, which we expect to result in net capital expenditures of approximately $20.5$113.1 million. Management believes we will be able to finance our existing needs for working capital over the next twelve months, as well as acquisitions of revenue equipment and any other asset acquisitions or capital transactions during such period, with cash balances, cash flows from operations, and borrowings believed to be available from financing sources. We will continue to have significant capital requirements over the long-term, which may require us to incur debt or seek additional equity capital. The availability of additional capital will depend upon prevailing market conditions, the market price of our common stock and several other factors over which we have limited control, as well as our financial condition and results of operations. Nevertheless, based on our anticipated future cash flows and sources of financing that we expect will be available to us, we do not expect that we will experience any significant liquidity constraints in the foreseeable future.
Contractual Obligations and Commercial Commitments
The following table sets forth the Company's contractual obligations and commercial commitments as of December 31, 2020:
Payments due by period (in thousands) | ||||||||||||||||||||
Total | Less than 1 Year | 1 to 3 Years | 3 to 5 Years | More than 5 Years | ||||||||||||||||
Long-term debt (1) | $ | 288,676 | $ | 66,068 | $ | 125,985 | $ | 86,119 | $ | 10,504 | ||||||||||
Operating leases (2) | 1,840 | 842 | 884 | 114 | - | |||||||||||||||
Total | $ | 290,516 | $ | 66,910 | $ | 126,869 | $ | 86,233 | $ | 10,504 | ||||||||||
|
|
|
|
Inflation
Inflation has an impact on most of our operating costs. Over the past three years, the effect of inflation has been minimal.significant. If the current rate of inflation persists, inflation, coupled with supply chain issues and international events could continue to result in increased costs for drivers, employee wages, equipment, fuel and other costs.
Adoption of Accounting Policies
See “Item 8. Financial Statements and Supplementary Data, Note 1 to the Consolidated Financial Statements – Accounting Policies, Recent Accounting Pronouncements.”
Critical Accounting PoliciesEstimates
The preparation of financial statements in accordance with accounting principles generally accepted in the United States of America requires management to adopt accounting policies and make significant judgments and estimates that impact the amounts reported in our consolidated financial statements and accompanying notes. Therefore, the reported amounts of assets, liabilities, revenue, expenses, and associated disclosures of contingent assets and liabilities are affected by judgments and estimates. In manysome cases, there are alternative assumptions, policies, or estimation techniques that could be used. Management evaluates its assumptions, policies, and estimates on an ongoing basis, utilizing historical experience, and other methods considered reasonable in the particular circumstances. Nevertheless, actual results may differ significantly from our estimates and assumptions, and it is possible that materially different amounts would be reported using differing estimates or assumptions. Management considers our critical accounting policiesestimates to be those that require more significant judgments and estimates when we prepare our consolidated financial statements. Our critical accounting policies include the following:
Accounts receivable and current expected credit losses. Accounts receivable are presentedNote 1 in Part II, Item 8 of this Annual Report describes the Company’s consolidated financial statements netCompany's accounting policies. The following discussion of current expected credit losses. Managementaccounting estimates expected credit losses based upon an evaluation ofshould be read in conjunction with Note 1, as it provides additional insight into critical accounting estimates. Our critical accounting estimates include the aging of our customer receivables and historical write-offs, as well as other trends and factors surrounding the credit risk of specific customers. The Company continually updates the history it uses to make these estimates so as to reflect the most recent trends, factors and other information available. In order to gather information regarding these trends and factors, the Company also performs ongoing credit evaluations of its customers. Customer receivables are considered to be past due when payment has not been received by the invoice due date. Write-offs occur when we determine an account to be uncollectible and could differ from the current expected credit losses estimate as a result of a number of factors, including unanticipated changes in the overall economic environment or factors and risks surrounding a particular customer. Management believes its methodology for estimating current expected credit losses to be reliable; however, additional credit losses may be incurred if the financial condition of our customers were to deteriorate and could have a material effect on the Company’s consolidated financial statements.following:
Depreciation of trucks and trailersAmortization. Depreciation of trucks and trailers is calculated by the straight-line method over the assets’ estimated useful lives, which generally range from three to seventen years, down to an estimated salvage value at the end of the assets’ estimated useful lives. Management must use its judgment in the selection of estimated useful lives and salvage values for purposes of this calculation. In some cases, the Company has agreements in place with certain manufacturers whereby salvage values are guaranteed by the manufacturer. In other cases, where salvage values are not guaranteed, estimates of salvage value are based on the expected market values of equipment at the time of disposal.
The depreciation of trucks and trailers over their estimated useful lives and the determination of any salvage value also require management to make judgments about future events. Therefore, the Company’s management periodically evaluates whether changes to estimated useful lives or salvage values are necessary to ensure these estimates accurately reflect the economic reality of the assets. This periodic evaluation may result in changes in the estimated lives and/or salvage values used by the Company to depreciate its assets, which can affect the amount of periodic depreciation expense recognized and, ultimately, the gain or loss on the disposal of an asset. Future changes in our estimated useful life or salvage value estimates, or fluctuations in market value that are not reflected in current estimates, could have a material effect on the Company’s consolidated financial statements.
Impairment of long-lived assets. Long-lived assets are reviewed for impairment in accordance with ASC Topic 360, “Property, Plant, and Equipment.” This authoritative guidance provides that whenever there are certain significant events or changes in circumstances, the value of long-lived assets or groups of assets must be tested to determine if their value can be recovered from their future cash flows. In the event that undiscounted cash flows expected to be generated by the asset are less than the carrying amount, the asset or group of assets must be evaluated for impairment. Impairment exists if the carrying value of the asset exceeds its fair value.
Significantly all of the Company’s cash flows from operations are generated by trucks and trailers, and as such, the cost of other long-lived assets are funded by those operations. Therefore, management tests for the recoverability of all of the Company’s long-lived assets as a single group at the entity level and examines the forecasted future cash flows generated by trucks and trailers, including their eventual disposition, to determine if those cash flows exceed the carrying value of the long-lived assets. Forecasted cash flows are estimated using assumptions about future operations. To the extent that facts and circumstances change in the future, our estimates of future cash flows may also change either positively or negatively. In light of the Company’s market capitalization during 2020 and net operating profits of the Company for the years ended December 31, 2020 and 2019, no impairment indicators existed which required management to test the Company’s long-lived assets for recoverability as of December 31, 2020. As such, no impairment losses were recorded during 2020.
Claims accruals. The Company is self-insured for health and workers' compensation benefits up to certain stop-loss limits. Such costs are accrued based on known claims and an estimate of incurred but not reported (IBNR) claims. IBNR claims are estimated using historical lag information and other data either provided by outside claims administrators or developed internally. Actual claims payments may differ from management’s estimates as a result of a number of factors, including evaluation of severity, increases in legal or medical costs, and other case-specific factors. The actual claims payments are charged against the Company’s recorded accrued claims liabilities and have been historically reasonable with respect to the estimates of the liabilities made under the Company’s methodology. However, the estimation process is generally subjective, and to the extent that future actual results materially differ from original estimates made by management, adjustments to recorded accruals may be necessary which could have a material effect on the Company’s consolidated financial statements. Based upon our 20202023 health and workers' compensation expenses, a 10% increase in both claims incurred and IBNR claims would increase our annual health and workers' compensation expenses by approximately $0.6$0.7 million.
On September 1, 2020, the Company elected to become self-insured for certain layers of auto liability claims in excess of $2.0 million. The Company specifically reserves for claims that are expected to exceed $2.0 million when fully developed, based on the facts and circumstances of those claims.
Revenue recognition. Revenue is recognized over time as freight progresses towards its destination and the transportation service obligation is fulfilled. For loads picked up during the reporting period, but delivered in a subsequent reporting period, revenue is allocated to each period based on the transit time in each period as a percentage of total transit time. See “Item 8. Financial Statements and Supplementary Data, Note 2 to the Consolidated Financial Statements – Revenue Recognition.”
Income Taxes. The Company’s deferred tax assets and liabilities represent items that will result in taxable income or a tax deduction in future years for which the Company has already recorded the related tax expense or benefit in its consolidated statements of operations. Deferred tax accounts arise as a result of timing differences between when items are recognized in the Company’s consolidated financial statements compared to when they are recognized in the Company’s tax returns. In establishing the Company’s deferred income tax assets and liabilities, management makes judgments and interpretations based on the enacted tax laws and published tax guidance that are applicable to its operations. Deferred income tax assets and liabilities are measured using enacted tax rates expected to apply to taxable income in the years in which those temporary differences are expected to be recovered or settled.
In determining whether a tax asset valuation allowance is necessary, management, in accordance with the provisions of ASC 740-10-30, weighs all available evidence, both positive and negative to determine whether, based on the weight of that evidence, a valuation allowance is necessary. If negative conditions exist which indicate a valuation allowance might be necessary, consideration is then given to what effect the future reversals of existing taxable temporary differences and the availability of tax strategies might have on future taxable income to determine the amount, if any, of the required valuation allowance. Significant management judgment is required as it relates to future taxable income, future capital gains, tax settlements, valuation allowances, and the Company’s ability to utilize tax loss and credit carryforwards. As of December 31, 2020, management determined that the future reversals of existing taxable temporary differences and available tax strategies would generate sufficient future taxable income to realize its tax assets and therefore a valuation allowance was not necessary.
Management believes that future tax consequences have been adequately provided for based on the current facts and circumstances and current tax law. However, should current circumstances change or the Company’s tax positions be challenged, different outcomes could result which could have a material effect on the Company’s consolidated financial statements.
Item 7A. Quantitative and Qualitative Disclosures about Market Risk.
Our primary market risk exposures include equity price risk, interest rate risk, commodity price risk (the price paid to obtain diesel fuel for our trucks), and foreign currency exchange rate risk. The potential adverse impact of these risks are discussed below. While the Company has used derivative financial instruments in the past to manage its interest rate and commodity price risks, the Company does not currently enter into such instruments for risk management purposes or for speculation or trading.
The following sensitivity analyses do not consider the effects that an adverse change may have on the overall economy nor do they consider additional actions we may take to mitigate our exposure to such changes. Actual results of changes in prices or rates may differ materially from the hypothetical results described below.
Equity Price Risk
We hold certain actively traded marketable equity securities, which subjects the Company to fluctuations in the fair market value of its investment portfolio based on current market price. The recorded value of marketable equity securities decreasedincreased to $27.9$43.2 million at December 31, 20202023 from $29.5$41.7 million at December 31, 2019.2022. The decreaseincrease resulted from an increase in market value of the portfolio by approximately $1.6 million and offset by net sales of marketable equity securities of approximately $2.0 million and a decrease in market value of the portfolio of approximately $3.5 million, partially offset by purchases of marketable equity securities of approximately $3.9$0.1 million. A 10% decrease in the market price of our marketable equity securities would cause a corresponding 10% decrease in the carrying amounts of these securities, or approximately $2.8$4.3 million. For additional information with respect to the marketable equity securities, see “Item 8. Financial Statements and Supplementary Data, Note 4 to the Consolidated Financial Statements – Marketable Equity Securities.”
Interest Rate Risk
Our line of credit bears interest at a floating rate equal to LIBORTerm SOFR plus a fixed percentage. Accordingly, changes in LIBOR,Term SOFR, which are affected by changes in interest rates, will affect the interest rate on, and therefore our costs under, the line of credit. Assuming $18.0 million of variable rate debt was outstanding under our line of credit for a full fiscal year, a hypothetical 100 basis point increase in LIBORTerm SOFR would result in approximately $180,000 of additional interest expense.
Commodity Price Risk
Prices and availability of all petroleum products are subject to political, economic and market factors that are generally outside of our control. Accordingly, the price and availability of diesel fuel, as well as other petroleum products, can be unpredictable. Because our operations are dependent upon diesel fuel, significant increases in diesel fuel costs could materially and adversely affect our results of operations and financial condition. Based upon our 20202023 fuel consumption, a 10% increase in the average annual price per gallon of diesel fuel would increase our annual fuel expenses by approximately $3.7$8.2 million.
Foreign Currency Exchange Rate Risk
We are exposed to foreign currency exchange rate risk related to the activities of our branch office located in Mexico. Currently, we do not hedge our exchange rate exposure through any currency forward contracts, currency options, or currency swaps as all of our revenues, and substantially all of our expenses and capital expenditures are transacted in U.S. dollars. However, certain operating expenditures and capital purchases related to our Mexico branch office are incurred within or exposed to fluctuations in the exchange rate between the U.S. dollar and the Mexican peso. Based on 20202023 expenditures denominated in pesos, a 10% decrease in the exchange rate would increase our annual operating expenses by approximately $208,000.$0.9 million. Foreign currency exchange rates did not have a material impact to our financial condition, results of operations or cash flows for the years ended December 31, 20202023 or 2019.2022.
Item 8. Financial Statements and Supplementary Data.
The following statements are filed with this report:
Report of Independent Registered Public Accounting Firm – Grant Thornton LLP (PCAOB ID Number 248)
Consolidated Balance Sheets - December 31, 20202023 and 20192022
Consolidated Statements of Operations - Years ended December 31, 2020, 20192023, 2022 and 20182021
Consolidated Statements of Comprehensive Income - Years ended December 31, 2020, 20192023, 2022 and 20182021
Consolidated Statements of Stockholders’ Equity - Years ended December 31, 2019, 20182023, 2022 and 20172021
Consolidated Statements of Cash Flows - Years ended December 31, 2020, 20192023, 2022 and 20182021
Notes to Consolidated Financial Statements
REPORT OF INDEPENDENT REGISTERED PUBLIC ACCOUNTING FIRM
Board of Directors and Stockholders
P.A.M. Transportation Services, Inc.
Opinion on the financial statements
We have audited the accompanying consolidated balance sheets of P.A.M. Transportation Services, Inc. (a Delaware corporation) and subsidiaries (the “Company”) as of December 31, 20202023 and 2019,2022, the related consolidated statements of operations, comprehensive income, stockholders’ equity, and cash flows for each of the three years in the period ended December 31, 2020,2023, and the related notes (collectively referred to as the “financial statements”). In our opinion, the financial statements present fairly, in all material respects, the financial position of the Company as of December 31, 20202023 and 2019,2022, and the results of its operations and its cash flows for each of the three years in the period ended December 31, 2020,2023, in conformity with accounting principles generally accepted in the United States of America.
We also have audited, in accordance with the standards of the Public Company Accounting Oversight Board (United States) (“PCAOB”), the Company’s internal control over financial reporting as of December 31, 2020,2023, based on criteria established in the 2013Internal Control—Control—Integrated Framework issued by the Committee of Sponsoring Organizations of the Treadway Commission (“COSO”), and our report dated March 5, 202113, 2024, expressed an unqualified opinion.
Basis for opinion
These financial statements are the responsibility of the Company’s management. Our responsibility is to express an opinion on the Company’s financial statements based on our audits. We are a public accounting firm registered with the PCAOB and are required to be independent with respect to the Company in accordance with the U.S. federal securities laws and the applicable rules and regulations of the Securities and Exchange Commission and the PCAOB.
We conducted our audits in accordance with the standards of the PCAOB. Those standards require that we plan and perform the audit to obtain reasonable assurance about whether the financial statements are free of material misstatement, whether due to error or fraud. Our audits included performing procedures to assess the risks of material misstatement of the financial statements, whether due to error or fraud, and performing procedures that respond to those risks. Such procedures included examining, on a test basis, evidence regarding the amounts and disclosures in the financial statements. Our audits also included evaluating the accounting principles used and significant estimates made by management, as well as evaluating the overall presentation of the financial statements. We believe that our audits provide a reasonable basis for our opinion.
Critical audit mattermatters
The criticalCritical audit matter communicated below is a mattermatters are matters arising from the current period audit of the financial statements that waswere communicated or required to be communicated to the audit committee and that: (1) relatesrelate to accounts or disclosures that are material to the financial statements and (2) involved our especially challenging, subjective, or complex judgments. The communication ofWe determined that there are no critical audit matters does not alter in any way our opinion on the financial statements, taken as a whole, and we are not, by communicating the critical audit matter below, providing a separate opinion on the critical audit matter or on the accounts or disclosures to which it relates.
Claims Liabilities
As described further in Note 6 to the consolidated financial statements, the Company is self-insured for a portion of its risk related to auto liability and workers’ compensation. Self-insurance results when the Company insures itself by maintaining funds to cover possible losses rather than by purchasing an insurance policy. The Company accrues for the cost of the self-insured portion of unpaid claims by evaluating the nature and severity of individual claims and by estimating future claims development based upon historical development trends. The actual cost to settle self-insured claim liabilities may differ from the Company’s reserve estimates due to legal costs, claims that have been incurred but not reported, and various other uncertainties.
We identified the estimation of auto liability and workers’ compensation claims accruals subject to exposure at claim dollar value layers ranging from $1.0 to $2.0 million depending on the specific coverages for auto liability, workers' compensation claims subject to self-insurer retention of $0.5 million, as a critical audit matter. Auto liability and workers’ compensation unpaid claim liabilities are determined by projecting the estimated loss related to a claim, less actual costs paid to date. These estimates rely on the assumption that historical claim patterns are an accurate representation for future claims that have been incurred but not completely paid. The principal considerations for assessing auto liability and workers’ compensation claims as a critical audit matter are the high level of estimation uncertainty related to determining the severity of these types of claims, as well as the inherent subjectivity in management’s judgment in estimating the total costs to settle or dispose of these claims.
Our audit procedures related to this critical audit matter included the following, among others:
|
|
|
|
|
|
matters.
/s/S/ GRANT THORNTON LLP
We have served as the Company’s auditor since 2005.
Tulsa, Oklahoma
March 5, 202113, 2024
P.A.M. TRANSPORTATION SERVICES, INC. AND SUBSIDIARIES CONSOLIDATED BALANCE SHEETS DECEMBER 31, 2023 AND 2022 (in thousands, except share and per share data) |
| 2023 | 2022 | ||||||
| ASSETS | ||||||||
CURRENT ASSETS: | ||||||||
Cash and cash equivalents | $ | 100,614 | $ | 74,087 | ||||
Accounts receivable—net: | ||||||||
Trade, less current estimated credit loss of $7,717 and $5,381, respectively | 80,604 | 134,739 | ||||||
Other | 7,203 | 6,263 | ||||||
Inventories | 2,321 | 2,570 | ||||||
Prepaid expenses and deposits | 13,213 | 15,729 | ||||||
Marketable equity securities | 43,203 | 41,728 | ||||||
Income taxes refundable | 3,883 | 5,650 | ||||||
Total current assets | 251,041 | 280,766 | ||||||
PROPERTY AND EQUIPMENT: | ||||||||
Land | 23,078 | 19,718 | ||||||
Structures and improvements | 43,552 | 35,534 | ||||||
Revenue equipment | 689,173 | 637,510 | ||||||
Office furniture and equipment | 15,328 | 13,157 | ||||||
Total property and equipment | 771,131 | 705,919 | ||||||
Accumulated depreciation | (266,412 | ) | (242,324 | ) | ||||
Net property and equipment | 504,719 | 463,595 | ||||||
OTHER ASSETS | 4,697 | 4,801 | ||||||
TOTAL ASSETS | $ | 760,457 | $ | 749,162 | ||||
(Continued)
See notes to consolidated financial statements.
CONSOLIDATED BALANCE SHEETS DECEMBER 31, 2023 AND 2022 (in thousands, except share and per share data) |
| 2023 | 2022 | ||||||
| LIABILITIES AND STOCKHOLDERS' EQUITY | ||||||||
CURRENT LIABILITIES: | ||||||||
Accounts payable | $ | 62,652 | $ | 48,917 | ||||
Accrued expenses and other liabilities | 16,799 | 34,233 | ||||||
Current maturities of long-term debt | 57,645 | 58,815 | ||||||
Total current liabilities | 137,096 | 141,965 | ||||||
Long-term debt—less current portion | 204,064 | 205,466 | ||||||
Deferred income taxes | 104,331 | 101,445 | ||||||
Other long-term liabilities | 750 | 103 | ||||||
Total liabilities | 446,241 | 448,979 | ||||||
COMMITMENTS AND CONTINGENCIES (Note 16) | ||||||||
STOCKHOLDERS’ EQUITY | ||||||||
Preferred stock, $.01 par value, 10,000,000 shares authorized; none issued | - | - | ||||||
Common stock, $.01 par value, 50,000,000 shares authorized; 22,317,671 and 22,293,687 shares issued; 22,021,341 and 22,166,450 shares outstanding at December 31, 2023 and 2022, respectively | 223 | 223 | ||||||
Additional paid-in capital | 40,825 | 40,472 | ||||||
Accumulated Other Comprehensive Income | - | - | ||||||
Treasury stock, at cost; 296,330 and 127,237 shares at December 31, 2023 and 2022, respectively | (8,736 | ) | (4,000 | ) | ||||
Retained earnings | 281,904 | 263,488 | ||||||
Total stockholders’ equity | 314,216 | 300,183 | ||||||
TOTAL LIABILITIES AND STOCKHOLDERS' EQUITY | $ | 760,457 | $ | 749,162 | ||||
(Concluded)
See notes to consolidated financial statements.
P.A.M. TRANSPORTATION SERVICES, INC. AND SUBSIDIARIES CONSOLIDATED YEARS ENDED DECEMBER 31, (in thousands, except |
2023 | 2022 | 2021 | ||||||||||
OPERATING REVENUES: | ||||||||||||
Revenue, before fuel surcharge | $ | 706,114 | $ | 818,751 | $ | 641,253 | ||||||
Fuel surcharge | 104,693 | 128,111 | 65,867 | |||||||||
Total operating revenues | 810,807 | 946,862 | 707,120 | |||||||||
OPERATING EXPENSES AND COSTS: | ||||||||||||
Salaries, wages and benefits | 186,223 | 181,918 | 141,019 | |||||||||
Operating supplies and expenses | 160,527 | 166,005 | 102,228 | |||||||||
Rents and purchased transportation | 315,647 | 364,971 | 279,016 | |||||||||
Depreciation | 64,605 | 62,806 | 55,012 | |||||||||
Insurance and claims | 30,769 | 32,516 | 18,792 | |||||||||
Other | 23,769 | 18,128 | 12,294 | |||||||||
Gain on disposition of equipment | (1,043 | ) | (3,250 | ) | (1,446 | ) | ||||||
Total operating expenses and costs | 780,497 | 823,094 | 606,915 | |||||||||
OPERATING INCOME | 30,310 | 123,768 | 100,205 | |||||||||
NON-OPERATING INCOME | 7,446 | 3,168 | 10,339 | |||||||||
INTEREST EXPENSE | (9,177 | ) | (7,929 | ) | (8,039 | ) | ||||||
INCOME BEFORE INCOME TAXES | 28,579 | 119,007 | 102,505 | |||||||||
FEDERAL & STATE INCOME TAX EXPENSE: | ||||||||||||
Current | 7,277 | 13,794 | 8,157 | |||||||||
Deferred | 2,886 | 14,541 | 17,832 | |||||||||
Total federal & state income tax expense | 10,163 | 28,335 | 25,989 | |||||||||
NET INCOME | $ | 18,416 | $ | 90,672 | $ | 76,516 | ||||||
EARNINGS PER COMMON SHARE: | ||||||||||||
Basic | $ | 0.83 | $ | 4.08 | $ | 3.37 | ||||||
Diluted | $ | 0.83 | $ | 4.04 | $ | 3.35 | ||||||
AVERAGE COMMON SHARES OUTSTANDING: | ||||||||||||
Basic | 22,056 | 22,246 | 22,715 | |||||||||
Diluted | 22,197 | 22,436 | 22,864 | |||||||||
ASSETS | 2020 | 2019 | ||||||
CURRENT ASSETS: | ||||||||
Cash and cash equivalents | $ | 337 | $ | 318 | ||||
Accounts receivable—net: | ||||||||
Trade, less current estimated credit loss of $3,482 and $2,952, respectively | 77,731 | 61,784 | ||||||
Other | 5,127 | 3,769 | ||||||
Inventories | 1,345 | 1,327 | ||||||
Prepaid expenses and deposits | 10,172 | 8,669 | ||||||
Marketable equity securities | 27,941 | 29,521 | ||||||
Income taxes refundable | 868 | 504 | ||||||
Total current assets | 123,521 | 105,892 | ||||||
PROPERTY AND EQUIPMENT: | ||||||||
Land | 18,486 | 7,246 | ||||||
Structures and improvements | 32,275 | 20,204 | ||||||
Revenue equipment | 592,476 | 524,527 | ||||||
Office furniture and equipment | 10,439 | 11,185 | ||||||
Total property and equipment | 653,676 | 563,162 | ||||||
Accumulated depreciation | (202,851 | ) | (175,887 | ) | ||||
Net property and equipment | 450,825 | 387,275 | ||||||
OTHER ASSETS | 4,246 | 4,842 | ||||||
TOTAL ASSETS | $ | 578,592 | $ | 498,009 | ||||
| |||||
See notes to consolidated financial statements. | |||||
P.A.M. TRANSPORTATION SERVICES, INC. AND SUBSIDIARIES CONSOLIDATED YEARS ENDED DECEMBER 31, (in thousands, except |
| 2020 | 2019 | |||||||
LIABILITIES AND STOCKHOLDERS' EQUITY | ||||||||
CURRENT LIABILITIES: | ||||||||
Accounts payable | $ | 46,102 | $ | 16,597 | ||||
Accrued expenses and other liabilities | 26,601 | 40,610 | ||||||
Current maturities of long-term debt | 57,776 | 67,637 | ||||||
Total current liabilities | 130,479 | 124,845 | ||||||
Long-term debt—less current portion | 228,330 | 174,187 | ||||||
Deferred income taxes | 68,883 | 63,522 | ||||||
Other long-term liabilities | 919 | 1,481 | ||||||
Total liabilities | 428,611 | 364,034 | ||||||
COMMITMENTS AND CONTINGENCIES (Note 16) | ||||||||
STOCKHOLDERS’ EQUITY | ||||||||
Preferred stock, $.01 par value, 10,000,000 shares authorized; none issued | 0 | 0 | ||||||
Common stock, $.01 par value, 40,000,000 shares authorized; 11,695,719 and 11,656,160 shares issued; 5,727,895 and 5,748,897 shares outstanding at December 31, 2020 and 2019, respectively | 117 | 117 | ||||||
Additional paid-in capital | 84,148 | 83,688 | ||||||
Accumulated Other Comprehensive Income | 0 | 0 | ||||||
Treasury stock, at cost; 5,967,824 and 5,907,263 shares at December 31, 2020 and 2019, respectively | (159,118 | ) | (156,837 | ) | ||||
Retained earnings | 224,834 | 207,007 | ||||||
Total stockholders’ equity | 149,981 | 133,975 | ||||||
TOTAL LIABILITIES AND STOCKHOLDERS' EQUITY | $ | 578,592 | $ | 498,009 | ||||
| Common Stock | Additional Paid-In | Treasury | Retained | |||||||||||||||||||||
Shares / Amount | Capital | Stock | Earnings | Total | ||||||||||||||||||||
BALANCE— January 1, 2021 | 22,912 | $ | 117 | $ | 84,148 | $ | (159,118 | ) | $ | 224,834 | $ | 149,981 | ||||||||||||
Net income | 76,516 | 76,516 | ||||||||||||||||||||||
Stock Split | 117 | (117 | ) | |||||||||||||||||||||
Restricted stock issued | 18 | |||||||||||||||||||||||
Treasury stock repurchases | (582 | ) | (10,828 | ) | (10,828 | ) | ||||||||||||||||||
Share-based compensation | 441 | 441 | ||||||||||||||||||||||
BALANCE— December 31, 2021 | 22,348 | $ | 234 | $ | 84,472 | $ | (169,946 | ) | $ | 301,350 | $ | 216,110 | ||||||||||||
Net income | 90,672 | 90,672 | ||||||||||||||||||||||
Stock Split | 112 | (111 | ) | 1 | ||||||||||||||||||||
Restricted stock issued | 29 | |||||||||||||||||||||||
Treasury stock repurchases | (211 | ) | (7,000 | ) | (7,000 | ) | ||||||||||||||||||
Treasury stock retired | (123 | ) | (44,289 | ) | 172,946 | (128,534 | ) | |||||||||||||||||
Restricted stock net settlement | (315 | ) | (315 | ) | ||||||||||||||||||||
Share-based compensation | 715 | 715 | ||||||||||||||||||||||
BALANCE— December 31, 2022 | 22,166 | $ | 223 | $ | 40,472 | $ | (4,000 | ) | $ | 263,488 | $ | 300,183 | ||||||||||||
Net income | 18,416 | 18,416 | ||||||||||||||||||||||
Restricted stock issued | 24 | |||||||||||||||||||||||
Treasury stock repurchases | (169 | ) | (4,736 | ) | (4,736 | ) | ||||||||||||||||||
Restricted stock net settlement | (199 | ) | (199 | ) | ||||||||||||||||||||
Share-based compensation | 552 | 552 | ||||||||||||||||||||||
BALANCE— December 31, 2023 | 22,021 | $ | 223 | $ | 40,825 | $ | (8,736 | ) | $ | 281,904 | $ | 314,216 | ||||||||||||
| ||
See notes to consolidated financial statements. |
P.A.M. TRANSPORTATION SERVICES, INC. AND SUBSIDIARIES CONSOLIDATED STATEMENTS OF YEARS ENDED DECEMBER 31, (in |
2020 | 2019 | 2018 | ||||||||||
OPERATING REVENUES: | ||||||||||||
Revenue, before fuel surcharge | $ | 438,987 | $ | 439,511 | $ | 445,855 | ||||||
Fuel surcharge | 47,838 | 74,666 | 87,406 | |||||||||
Total operating revenues | 486,825 | 514,177 | 533,261 | |||||||||
OPERATING EXPENSES AND COSTS: | ||||||||||||
Salaries, wages and benefits | 124,098 | 129,738 | 119,819 | |||||||||
Operating supplies and expenses | 84,275 | 98,420 | 93,130 | |||||||||
Rents and purchased transportation | 165,984 | 168,399 | 201,455 | |||||||||
Depreciation | 56,168 | 55,107 | 49,387 | |||||||||
Insurance and claims | 8,866 | 35,622 | 17,191 | |||||||||
Other | 13,138 | 13,761 | 11,983 | |||||||||
Loss (gain) on disposition of equipment | 373 | 583 | (1,306 | ) | ||||||||
Total operating expenses and costs | 452,902 | 501,630 | 491,659 | |||||||||
OPERATING INCOME | 33,923 | 12,547 | 41,602 | |||||||||
NON-OPERATING (EXPENSE) INCOME | (1,699 | ) | 6,222 | (4,016 | ) | |||||||
INTEREST EXPENSE | (8,815 | ) | (8,654 | ) | (6,245 | ) | ||||||
INCOME BEFORE INCOME TAXES | 23,409 | 10,115 | 31,341 | |||||||||
FEDERAL & STATE INCOME TAX EXPENSE: | ||||||||||||
Current | 220 | 590 | 141 | |||||||||
Deferred | 5,362 | 1,625 | 7,206 | |||||||||
Total federal & state income tax expense | 5,582 | 2,215 | 7,347 | |||||||||
NET INCOME | $ | 17,827 | $ | 7,900 | $ | 23,994 | ||||||
EARNINGS PER COMMON SHARE: | ||||||||||||
Basic | $ | 3.10 | $ | 1.35 | �� | $ | 3.94 | |||||
Diluted | $ | 3.09 | $ | 1.34 | $ | 3.90 | ||||||
AVERAGE COMMON SHARES OUTSTANDING: | ||||||||||||
Basic | 5,752 | 5,832 | 6,083 | |||||||||
Diluted | 5,768 | 5,880 | 6,159 | |||||||||
2023 | 2022 | 2021 | ||||||||||
OPERATING ACTIVITIES: | ||||||||||||
Net income | $ | 18,416 | $ | 90,672 | $ | 76,516 | ||||||
Adjustments to reconcile net income to net cash provided by operating activities: | ||||||||||||
Depreciation | 64,605 | 62,806 | 55,012 | |||||||||
Bad debt expense | 2,396 | 917 | 1,044 | |||||||||
Stock compensation—net of excess tax benefits | 553 | 715 | 441 | |||||||||
Provision for deferred income taxes | 2,886 | 14,541 | 17,832 | |||||||||
Recognized (gain) on marketable equity securities | (1,618 | ) | (1,129 | ) | (8,197 | ) | ||||||
Gain on sale or disposal of equipment | (1,043 | ) | (3,250 | ) | (1,446 | ) | ||||||
Changes in operating assets and liabilities: | ||||||||||||
Accounts receivable | 50,798 | (2,152 | ) | (47,132 | ) | |||||||
Prepaid expenses, deposits, inventories, and other assets | 2,538 | (7,257 | ) | (865 | ) | |||||||
Income taxes refundable | 1,768 | (5,373 | ) | 591 | ||||||||
Income taxes payable | - | (4,364 | ) | 4,364 | ||||||||
Trade accounts payable | (10,980 | ) | 2,198 | 5,945 | ||||||||
Accrued expenses and other liabilities | (15,742 | ) | 20,491 | (2,365 | ) | |||||||
Net cash provided by operating activities | 114,577 | 168,815 | 101,740 | |||||||||
INVESTING ACTIVITIES: | ||||||||||||
Purchases of property and equipment | (34,060 | ) | (63,961 | ) | (19,144 | ) | ||||||
Purchase of a business, net of cash acquired | - | (65,797 | ) | - | ||||||||
Proceeds from disposition of equipment | 22,622 | 17,406 | 31,680 | |||||||||
Sales of marketable equity securities | 143 | - | 3,109 | |||||||||
Purchases of marketable equity securities, net of return of capital | - | (1,175 | ) | (6,395 | ) | |||||||
Net cash (used in) provided by investing activities | (11,295 | ) | (113,527 | ) | 9,250 | |||||||
FINANCING ACTIVITIES: | ||||||||||||
Borrowings under line of credit | 879,191 | 945,610 | 654,212 | |||||||||
Repayments under line of credit | (879,191 | ) | (945,610 | ) | (672,458 | ) | ||||||
Borrowings of long-term debt | - | 74,925 | 21,408 | |||||||||
Repayments of long-term debt | (71,105 | ) | (67,335 | ) | (75,115 | ) | ||||||
Borrowings under margin account | 46 | 1,229 | 6,510 | |||||||||
Repayments under margin account | (960 | ) | (1,529 | ) | (16,547 | ) | ||||||
Repurchases of treasury stock | (4,736 | ) | (7,000 | ) | (10,828 | ) | ||||||
Net cash (used in) provided by financing activities | (76,755 | ) | 290 | (92,818 | ) | |||||||
NET INCREASE IN CASH AND CASH EQUIVALENTS | 26,527 | 55,578 | 18,172 | |||||||||
CASH AND CASH EQUIVALENTS—Beginning of year | 74,087 | 18,509 | 337 | |||||||||
CASH AND CASH EQUIVALENTS—End of year | $ | 100,614 | $ | 74,087 | $ | 18,509 | ||||||
SUPPLEMENTAL DISCLOSURES OF CASH FLOW INFORMATION— | ||||||||||||
Cash paid during the period for: | ||||||||||||
Interest | $ | 9,762 | $ | 7,842 | $ | 8,144 | ||||||
Income taxes | $ | 5,510 | $ | 23,243 | $ | 3,870 | ||||||
NON-CASH INVESTING AND FINANCING ACTIVITIES— | ||||||||||||
Purchases of revenue equipment included in accounts payable | $ | 25,147 | $ | 431 | $ | 383 | ||||||
See notes to consolidated financial statements.
|
2020 | 2019 | 2018 | ||||||||||
NET INCOME | $ | 17,827 | $ | 7,900 | $ | 23,994 | ||||||
Other comprehensive income, net of tax: | ||||||||||||
Other comprehensive income (1) | 0 | 0 | 0 | |||||||||
COMPREHENSIVE INCOME | $ | 17,827 | $ | 7,900 | $ | 23,994 | ||||||
| |||||
|
See notes to consolidated financial statements.
|
Common Stock Shares / Amount | Additional Paid-In Capital | Accumulated Other Comprehensive Income | Treasury Stock | Retained Earnings | Total | |||||||||||||||||||||||
BALANCE— January 1, 2018 | 6,161 | $ | 115 | $ | 81,559 | $ | 7,444 | $ | (129,183 | ) | $ | 167,669 | $ | 127,604 | ||||||||||||||
Net income | 23,994 | 23,994 | ||||||||||||||||||||||||||
Exercise of stock options-shares issued including tax benefits | 45 | 1 | 485 | 486 | ||||||||||||||||||||||||
Restricted stock issued | 38 | |||||||||||||||||||||||||||
Treasury stock repurchases | (287 | ) | (13,369 | ) | (13,369 | ) | ||||||||||||||||||||||
Share-based compensation | 732 | 732 | ||||||||||||||||||||||||||
Cumulative effect adjustment – ASU 2016-01 | (7,444 | ) | 7,444 | - | ||||||||||||||||||||||||
BALANCE— December 31, 2018 | 5,957 | $ | 116 | $ | 82,776 | $ | 0 | $ | (142,552 | ) | $ | 199,107 | $ | 139,447 | ||||||||||||||
Net income | 0 | 7,900 | 7,900 | |||||||||||||||||||||||||
Restricted stock issued | 44 | 1 | 1 | |||||||||||||||||||||||||
Treasury stock repurchases | (252 | ) | (14,285 | ) | (14,285 | ) | ||||||||||||||||||||||
Share-based compensation | 912 | 912 | ||||||||||||||||||||||||||
BALANCE— December 31, 2019 | 5,749 | $ | 117 | $ | 83,688 | $ | 0 | $ | (156,837 | ) | $ | 207,007 | $ | 133,975 | ||||||||||||||
Net income | 17,827 | 17,827 | ||||||||||||||||||||||||||
Restricted stock issued | 40 | |||||||||||||||||||||||||||
Treasury stock repurchases | (61 | ) | (2,281 | ) | (2,281 | ) | ||||||||||||||||||||||
Share-based compensation | 460 | 460 | ||||||||||||||||||||||||||
BALANCE— December 31, 2020 | 5,728 | $ | 117 | $ | 84,148 | $ | 0 | $ | (159,118 | ) | $ | 224,834 | $ | 149,981 | ||||||||||||||
See notes to consolidated financial statements.
|
2020 | 2019 | 2018 | ||||||||||
OPERATING ACTIVITIES: | ||||||||||||
Net income | $ | 17,827 | $ | 7,900 | $ | 23,994 | ||||||
Adjustments to reconcile net income to net cash provided by operating activities: | ||||||||||||
Depreciation | 56,168 | 55,107 | 49,387 | |||||||||
Bad debt expense | 530 | 728 | 889 | |||||||||
Stock compensation—net of excess tax benefits | 460 | 912 | 732 | |||||||||
Provision for deferred income taxes | 5,362 | 1,625 | 7,206 | |||||||||
Recognized loss (gain) on marketable equity securities | 3,463 | (4,753 | ) | 5,388 | ||||||||
Loss (gain) on sale or disposal of equipment | 373 | 583 | (1,306 | ) | ||||||||
Changes in operating assets and liabilities: | ||||||||||||
Accounts receivable | (17,835 | ) | 884 | (5,970 | ) | |||||||
Prepaid expenses, deposits, inventories, and other assets | (1,780 | ) | 1,865 | (137 | ) | |||||||
Income taxes refundable | (60 | ) | 1,372 | (76 | ) | |||||||
Trade accounts payable | 20,880 | (2,233 | ) | 1,731 | ||||||||
Accrued expenses and other liabilities | (17,798 | ) | 20,307 | 509 | ||||||||
Net cash provided by operating activities | 67,590 | 84,297 | 82,347 | |||||||||
INVESTING ACTIVITIES: | ||||||||||||
Purchases of property and equipment | (48,226 | ) | (79,354 | ) | (73,882 | ) | ||||||
Proceeds from disposition of equipment | 17,418 | 14,263 | 24,904 | |||||||||
Sales of marketable equity securities | 2,039 | 2,984 | 1,045 | |||||||||
Purchases of marketable equity securities, net of return of capital | (3,923 | ) | (203 | ) | (7,318 | ) | ||||||
Net cash used in investing activities | (32,692 | ) | (62,310 | ) | (55,251 | ) | ||||||
FINANCING ACTIVITIES: | ||||||||||||
Borrowings under line of credit | 517,668 | 590,902 | 615,612 | |||||||||
Repayments under line of credit | (516,468 | ) | (584,047 | ) | (605,419 | ) | ||||||
Borrowings of long-term debt | 26,837 | 60,203 | 52,717 | |||||||||
Repayments of long-term debt | (64,411 | ) | (70,917 | ) | (82,442 | ) | ||||||
Borrowings under margin account | 7,068 | 527 | 7,584 | |||||||||
Repayments under margin account | (3,292 | ) | (4,334 | ) | (2,206 | ) | ||||||
Repurchases of treasury stock | (2,281 | ) | (14,285 | ) | (13,369 | ) | ||||||
Proceeds from exercise of stock options | 0 | 0 | 485 | |||||||||
Net cash used in financing activities | (34,879 | ) | (21,951 | ) | (27,038 | ) | ||||||
NET INCREASE IN CASH AND CASH EQUIVALENTS | 19 | 36 | 58 | |||||||||
CASH AND CASH EQUIVALENTS—Beginning of year | 318 | 282 | 224 | |||||||||
CASH AND CASH EQUIVALENTS—End of year | $ | 337 | $ | 318 | $ | 282 | ||||||
SUPPLEMENTAL DISCLOSURES OF CASH FLOW INFORMATION— | ||||||||||||
Cash paid during the period for: | ||||||||||||
Interest | $ | 8,798 | $ | 8,612 | $ | 6,095 | ||||||
Income taxes | $ | 281 | $ | 671 | $ | 217 | ||||||
NONCASH INVESTING AND FINANCING ACTIVITIES— | ||||||||||||
Purchases of revenue equipment included in accounts payable | $ | 9,050 | $ | 366 | $ | 1,597 | ||||||
See notes to consolidated financial statements.
P.A.M. TRANSPORTATION SERVICES, INC. AND SUBSIDIARIES
NOTES TO CONSOLIDATED FINANCIAL STATEMENTS
YEARS ENDED DECEMBER 31, 2020, 20192023, 2022 AND 20182021
1. | ACCOUNTING POLICIES |
Description of Business and Principles of Consolidation–P.A.M. Transportation Services, Inc. (the “Company”), through its subsidiaries, operates as a truckload transportation and logistics company.
The consolidated financial statements include the accounts of the Company and its wholly ownedwholly-owned operating subsidiaries: P.A.M. Transport, Inc., P.A.M. Cartage Carriers, LLC, Met Express, Inc., Choctaw Brokerage, Inc., Costar Equipment, Inc., Costar Real Estate Holdings, Inc., Costar Management, Inc., Select CDL Driving School, Inc., Overdrive Leasing, LLC, Choctaw Express, LLC, Decker Transport Co., LLC, T.T.X., LLC, Transcend Logistics, Inc., Unmoored Realty, LLC and East Coast Transport and Logistics, LLC. The following subsidiaries were inactive during all periods presented: P.A.M. International, Inc., P.A.M. Logistics Services, Inc., Choctaw Brokerage, Inc., S & L Logistics, Inc. and P.A.M. Mexico Holdings, LLC.
Use of Estimates–The preparation of financial statements in conformity with accounting principles generally accepted in the United States of America requires management to make estimates and assumptions that affect the reported amounts of assets and liabilities, disclosure of any contingent assets and liabilities at the financial statement date and reported amounts of revenue and expenses during the reporting period. The Company periodically reviews these estimates and assumptions. The most significant estimates that affect our financial statements includeare accrued liabilities for insurance claims, legal reserves, and useful lives and salvage values for property and equipment, current expected credit losses, and estimates for income taxes.equipment. The Company's estimates were based on its historical experience and various other assumptions that management believes to be reasonable under the circumstances. Actual results could differ from those estimates.
Cash and Cash Equivalents–The Company considers all highly liquid investments with a maturity of three months or less when purchased to be cash equivalents. At times, cash held at banks may exceed FDIC insured limits.
Accounts Receivable and Current Expected Credit Losses–Accounts receivable are presented in the Company’s consolidated financial statements net of current expected credit losses. Management estimates current expected credit losses based upon an evaluation of the aging of our customer receivables and historical write-offs, as well as other trends and factors surrounding the credit risk of specific customers. The Company continually updates the history it uses to make these estimates so as to reflect the most recent trends, factors and other information available. In order to gather information regarding these trends and factors, the Company also performs ongoing credit evaluations of its customers. Customer receivables are considered to be past due when payment has not been received by the invoice due date. Write-offs occur when management determines an account to be uncollectible and could differ from the current expected credit losses estimate as a result of a number of factors, including unanticipated changes in the overall economic environment or factors and risks surrounding a particular customer. Management believes its methodology for estimating current expected credit losses to be reliable and consistent with prior periods. However, additional credit losses may be incurred if the financial condition of our customers were to deteriorate and could have a material effect on the Company’s consolidated financial statements in future periods.
Bank Overdrafts–The Company classifies bank overdrafts in current liabilities as accounts payable and does not offset other positive bank account balances located at the same or other financial institutions.payable. Bank overdrafts generally represent checks written in excess of available cash that have not yet cleared the Company’s bank accounts. The majority of the Company’s bank accounts are zero balance accounts that are funded at the time items clear against the account by drawings against a line of credit; therefore, the outstanding checks represent bank overdrafts. Because the recipients of these checks have generally not yet received payment, the Company continues to classify bank overdrafts as accounts payable. Bank overdrafts are classified as changes in accounts payable in the cash flows from operating activities section of the Company’s Consolidated Statement of Cash Flows. BankThere were no bank overdrafts as of December 31, 20202023 andor 20192022. were approximately $7,638,000 and $2,572,000, respectively.
Accounts Receivable Other–The components of accounts receivable other consist primarily of amounts representing downtime reimbursements due from our equipment partners, company driver advances, independent contractor advances, and equipment manufacturer warranties. Advances receivableEquipment downtime reimbursements due from company driversour equipment partners were approximately $2,100,000 and $994,000 as of December 31, 20202023 and 2019,December 31, 2022, were approximately $136,000 and $211,000, respectively. Accounts receivable from independent contractors as of December 31, 20202023 and 2019,2022, were approximately $614,000$768,000 and $1,381,000,$1,379,000, respectively. Independent contractors are allowed to purchase items such as fuel, repairs and tolls on Company accounts in order to share in favorable pricing negotiated by the Company. Advances receivable from company drivers as of December 31, 2023 and 2022, were approximately $182,000 and $135,000, respectively. Independent contractors and trip lease carriers are also allowed to receive advances for a portion of the revenue that they expect to receive for loads that they transport for the Company.
Marketable Equity Securities– The Company’s investment in marketable equity securities is accounted for in accordance with ASC Topic 321, (“ASC Topic 321”), Investments - Equity Securities. ASC Topic 321 requires companies to measure equity investments at fair value, with changes in fair value recognized in net income. The Company’s investments in marketable securities consist of equity securities with readily determinable fair values. The cost of securities sold is based on the specific identification method. Realized and unrealized gains and losses, interest and dividends on marketable equity securities are included in non-operating income (expense) in our consolidated statements of operations.
For additional information with respect to marketable equity securities, see Note 4 – Marketable Equity Securities.
Impairment of Long-Lived Assets–The Company reviews its long-lived assets for impairment whenever events or changes in circumstances indicate that the carrying amount of a long-lived asset may not be recoverable. An impairment loss would be recognized if the carrying amount of the long-lived asset is not recoverable, and it exceeds its fair value. For long-lived assets classified as held and used, if the carrying value of the long-lived asset exceeds the sum of the future net undiscounted cash flows, it is not recoverable. NaNNo impairment losses were recorded during 20202023 or 2019.2022.
Property and Equipment–Property and equipment is recorded at historical cost, less accumulated depreciation. For financial reporting purposes, the cost of such property is depreciated principally by the straight-line method. For tax reporting purposes, accelerated depreciation or applicable cost recovery methods are used. Depreciation is recognized over the estimated asset life, considering the estimated salvage value of the asset. Such salvage values are based on estimates using expected market values for used equipment and the estimated time of disposal which in many cases include guaranteed residual values by the manufacturers. Gains and losses are reflected in the year of disposal. The following is a table reflecting estimated ranges of asset useful lives by major class of depreciable assets:
Asset Class | Estimated Asset Life | Estimated Asset Life (in years) | ||||||||
Service vehicles | 3 | - | 5 | 3 | - | 5 | ||||
Office furniture and equipment | 3 | - | 7 | 3 | - | 10 | ||||
Revenue equipment | 3 | - | 8 | 3 | - | 11 | ||||
Structures and improvements | 5 | - | 40 | 5 | - | 40 | ||||
The Company’s management periodically evaluates whether changes to estimated useful lives and/or salvage values are necessary to ensure its estimates accurately reflect the economic use of the assets. During the 20202023 and 2019,evaluation, management determined that an adjustmentit necessary to adjust the estimated useful lives orand salvage values of trucks orand trailers wasto reflect the current market conditions more accurately. These adjustments did not necessary basedhave a material impact on such an evaluation.
the Company’s financial condition, results of operations, and cash flows as of December 31, 2023.
Inventory–Inventories consist primarily of revenue equipment parts, tires, supplies, and fuel. Inventories are carried at the lower of cost or market with cost determined using the first in, first out method.
Prepaid Tires–Tires purchased with revenue equipment are capitalized as a cost of the related equipment. Replacement tires are included in prepaid expenses and deposits and are amortized over a 24-month24-month period. Amounts paid for the recapping of tires are expensed when incurred.
Advertising Expense–Advertising costs are expensed as incurred and totaled approximately $1,102,000, $1,269,000$2,014,000, $2,101,000 and $1,234,000$1,154,000 for the years ended December 31, 2020,2023, 20192022 and 2018,2021, respectively.
Repairs and Maintenance–Repairs and maintenance costs are expensed as incurred.
Self-Insurance Liability–A liability is recognized for known health, workers’ compensation, cargo damage, property damage, and auto liability damage claims. An estimate of the incurred but not reported claims for each type of liability is made based on historical claims made, estimated frequency of occurrence, and considering changing factors that contribute to the overall cost of insurance. See Note 6 – Claims Liabilities for more information regarding insurance and claims liability.
Income Taxes–The Company applies the asset and liability method of accounting for income taxes, under which deferred taxes are determined based on the temporary differences between the financial statement and tax basis of assets and liabilities using tax rates expected to be in effect during the years in which the basis differences reverse. A valuation allowance is recorded when it is more likely than not that some or all of the deferred tax assets will not be realized. See Note 12 – Federal and State Income Taxes for more information regarding income taxes.
The application of income tax law to multi-jurisdictional operations such as those performed by the Company is inherently complex. Laws and regulations in this area are voluminous and often ambiguous. As such, we may be required to make subjective assumptions and judgments regarding our income tax exposures. Interpretations of and guidance surrounding income tax laws and regulations may change over time which could cause changes in our assumptions and judgments that could materially affect amounts recognized in the consolidated financial statements.
We recognize the impact of tax positions in our financial statements. These tax positions must meet a more-likely-than-not recognition threshold to be recognized and tax positions that previously failed to meet the more-likely-than-not threshold are recognized in the first subsequent financial reporting period in which that threshold is met. Previously recognized tax positions that no longer meet the more-likely-than-not threshold are derecognized in the first subsequent financial reporting period in which that threshold is no longer met. We recognize potential accrued interest and penalties related to unrecognized tax benefits within the consolidated statements of income as income tax expense.
In determining whether a tax asset valuation allowance is necessary, management, in accordance with the provisions of ASC 740-10-30, weighs all available evidence, both positive and negative to determine whether, based on the weight of that evidence, a valuation allowance is necessary. If negative conditions exist which indicate a valuation allowance might be necessary, consideration is then given to what effect the future reversals of existing taxable temporary differences and the availability of tax strategies might have on future taxable income to determine the amount, if any, of the required valuation allowance. As of December 31, 20202023 and 2019,2022, management determined that the future reversals of existing taxable temporary differences and available tax strategies would generate sufficient future taxable income to realize its tax assets and therefore a valuation allowance was not necessary.
Revenue Recognition– Revenue is recognized over time as the freight progresses towards its destination and the transportation service obligation is fulfilled. For loads picked up during the reporting period, but delivered in a subsequent reporting period, revenue is allocated to each period based on the transit time in each period as a percentage of total transit time. There are no assets or liabilities recorded in conjunction with revenue recognized, other than accounts receivable and current expected credit losses.
Earnings Per Share–The Company computes basic earnings per share (“EPS”) by dividing net income (loss) available to common stockholders by the weighted average number of common shares outstanding during the period. Diluted EPS includes the potential dilution that could occur from stock-based awards and other stock-based commitments using the treasury stock or the as if converted methods, as applicable. The difference between the Company's weighted-average shares outstanding and diluted shares outstanding is due to the dilutive effect of common stock optionsequivalents for all periods presented. See Note 14 – Earnings per Share for more information regarding the computation of diluted EPS.
Fair Value Measurements–Certain financial assets and liabilities are measured at fair value within the financial statements on a recurring basis. Fair value is defined as the exchange price that would be received for an asset or paid to transfer a liability (an exit price) in the principal or most advantageous market for the asset or liability in an orderly transaction between market participants on the measurement date. The fair value hierarchy requires an entity to maximize the use of observable inputs and minimize the use of unobservable inputs when measuring fair value. For additional information with respect to fair value measurements, see Note 18 – Fair Value of Financial Instruments.
ReportingReportable Segments–The Company's operations are all in the motor carrier segment and are aggregated into a single reportingreportable segment in accordance with the aggregation criteria under United States generally accepted accounting principles (“GAAP”). The Company provides truckload transportation services as well as brokerage and logistics services to customers throughout the United States and portions of Canada and Mexico. Truckload transportation services revenues, excluding fuel surcharges, represented 76.9%65.3%, 82.7%66.0% and 80.0%67.0% of total revenues, excluding fuel surcharges, for the twelve months ended December 31, 2020,2023, 20192022 and 2018,2021, respectively. Remaining revenues, excluding fuel surcharges, for each respective year were generated by brokerage and logistics services.
Concentrations of Credit Risk–The Company performs ongoing credit evaluations and generally does not require collateral from its customers. The Company maintains reserves for potential credit losses. In view of the concentration of the Company’s revenues and accounts receivable among a limited number of customers within the automobile industry, the financial health of this industry is a factor in the Company’s overall evaluation of accounts receivable.
Subsequent Events– We have evaluated subsequent events for recognition and disclosure through the date these financial statements were filed with the United States Securities and Exchange Commission and concluded that no subsequent events or transactions have occurred that require recognition or disclosure in our financial statements.
Risks and Uncertainties (COVID-19)– In March 2020, the World Health Organization declared the novel strain of coronavirus (“COVID-19”) a global pandemic, and the President of the United States declared the COVID-19 outbreak a national emergency. The rapid spread of the pandemic and the continuously evolving responses to combat it have had an increasingly negative impact on the global economy. In view of the rapidly changing business environment, unprecedented market volatility and heightened degree of uncertainty resulting from COVID-19, we are currently unable to fully determine its future impact on our business. We continue to monitor the progression of the pandemic, further government responses and development of treatments and vaccines and the resulting potential effect on our financial position, results of operations, cash flows and liquidity. These events could have an impact in future periods on certain estimates used in the preparation of our financial results, including, but not limited to impairment of goodwill, other intangible assets and other long-lived assets, income tax provision and recoverability of certain receivables. Should the pandemic continue for an even further extended period of time, the impact on our operations could have a material adverse effect on our financial condition, results of operations, cash flows and liquidity.
Foreign Currency Transactions–The functional currency of the Company’s foreign branch office in Mexico is the U.S. dollar. The Company remeasures the monetary assets and liabilities of this branch office, which are maintained in the local currency ledgers, at the rates of exchange in effect at the end of the reporting period. Revenues and expenses recorded in the local currency during the period are remeasured using average exchange rates for each period. Non-monetary assets and liabilities are remeasured using historical rates. Any resulting exchange gain or loss from the remeasurement process is included in non-operating income (loss) in the Company’s consolidated statements of operations.
Business Combinations– The purchase price of an acquired business, or the purchase of substantially all of the assets of a business, is allocated to the estimated fair value of the assets acquired and liabilities assumed at the date of acquisition. The calculation of the fair value of assets acquired, liabilities assumed and the potential value of any intangible assets involves many factors, some of which require estimates and judgement. In certain cases, valuation specialists may be engaged to assist in the determination of the fair value calculations. During 2022, we engaged valuation specialists to assist us in fair value determination for our acquisition of substantially all of the assets of Metropolitan Trucking, Inc. and related entities.
Recent Accounting Pronouncements–In June 2016,December 2023, the FASBFinancial Accounting Standards Board (the "FASB") issued ASUAccounting Standards Update, (“ASU”) No. 20162023-13,09, (“ASU 20162023-13”09”), Accounting for Credit Losses (Topic 326).Improvements to Income Tax Disclosures. ASU 20162023-1309 requireswas issued to enhance the usetransparency and decision usefulness of an “expected loss” model on certain types of financial instruments. The standard also amends the impairment model for available-for-sale debt securities and requires estimated credit losses to be recorded as allowances instead of reductionsincome tax disclosures primarily related to the amortized cost of the securities. For smaller reporting companies, ASU 2016-13rate reconciliation and income taxes paid information. The guidance is effective for fiscal years, and interimannual reporting periods within those years, beginning after December 15, 20222024, ,with early adoption permitted. The adoption of this guidance on January 1, 2020 did not have a material impact on the Company’s financial condition, results of operations, or cash flows.
In March 2020, the FASB issued Accounting Standards Update No.2020-04, (“ASU 2020-04”), Reference Rate Reform (Topic 848): Facilitation of the Effects of Reference Rate Reform on Financial Reporting. ASU 2020-04 was issued to provide optional guidance for a limited period of time to ease the potential burden in accounting for reference rate reform on financial reporting. ASU 2020-04 is effective as of March 12,2020 through December 31, 2022. The Company has evaluated the provisions of this standard and determined that it is applicable to our line of credit and investment margin account. The London Interbank Offered Rate (“LIBOR”) is the basis for interest charges on outstanding borrowings for both our line of credit and investment margin account. The scheduled discontinuation of LIBOR is not expected to materially alter any provisions of either of these debt instruments, except for the identification of a replacement reference rate. The Company has evaluated the new guidance and does not expect it to have a material impact on its financial condition, results of operations, or cash flows.
2. | REVENUE RECOGNITION |
The Company has a single performance obligation, to transport our customer’s freight from a specified origin to a specified destination. The Company has the discretion to choose to self-transport or to arrange for alternate transportation to fulfill the performance obligation. Where the Company decides to self-transport the freight, the Company classifies the service as truckload services, and where the Company arranges for alternate transportation of the freight, the Company classifies the service as brokerage and logistics services. In either case, the Company is paid a rate to transport freight from its origin location to a specified destination. Because the primary factors influencing revenue recognition, including performance obligation, customer base, and timing of revenue recognition are the same for both of its service categories, the Company utilizes the same revenue recognition method throughout its operations.
Company revenue is generated from freight transportation services performed utilizing heavy truck trailer combinations. While various ownership arrangements may exist for the equipment utilized to perform these services, including Company-owned or leased, owner-operator owned, and third-party carriers, revenue is generated from the same base of customers. Contracts with these customers establish rates for services performed, which are predominantly rates that will be paid to pick up, transport and drop off freight at various locations. In addition to transportation, revenue is also awarded for various accessorial services performed in conjunction with the base transportation service. The Company also has other revenue categories that are not discussed in this note or broken out in our consolidated statements of operations due to their immaterial amounts.
In fulfilling the Company’s obligation to transport freight from a specified origin to a specified destination, control of freight is transferred to usthe Company at the point it has been loaded into the driver’s trailer, the doors are sealed and the driver has signed a bill of lading, which is the basic transportation agreement that establishes the nature, quantity and condition of the freight loaded, responsibility for invoice payment, and pickup and delivery locations. OurThe Company’s revenue is generated, and our customer receives benefit, as the freight progresses towards delivery locations. In the event ourthe Company’s customer cancels the shipment at some point prior to the final delivery location and re-consigns the shipment to an alternate delivery location, we arethe Company is entitled to receive payment for services performed for the partial shipment. Shipments are generally conducted over a relatively short time span, generally one to three days; however, freight is sometimes stored temporarily in our trailer at one of our drop yard locations or at a location designated by a customer. OurThe Company’s revenue is categorized as either Freight Revenue or Fuel Surcharge Revenue, and both are earned by performing the same freight transportation services, as discussed further below.
Freight Revenue – revenue generated by the performance of the freight transportation service, including any accessorial service, provided to customers.
Fuel Surcharge Revenue – revenue designed to adjust freight revenue rates to an agreed uponagreed-upon base cost for diesel fuel. Diesel fuel prices can fluctuate widely during the term of a contract with a customer. At the point that freight revenue rates are negotiated with customers, a sliding scale is agreed upon that approximately adjusts diesel fuel costs to an agreed uponagreed-upon base amount. In general, as fuel prices increase, revenue from fuel surcharge increases, so that diesel fuel cost is adjusted to the approximate base amount agreed upon.
Revenue is recognized over time as the freight progresses towards its destination and the transportation service obligation is fulfilled. For loads picked up during the reporting period, but delivered in a subsequent reporting period, revenue is allocated to each period based on the transit time in each period as a percentage of total transit time. There are no assets or liabilities recorded in conjunction with revenue recognized, other than accounts receivable and current estimated credit losses.
3. | TRADE ACCOUNTS RECEIVABLE |
The Company's receivables result primarily from the sale of transportation and logistics services. The Company performs ongoing credit evaluations of its customers and generally does not require collateral for accounts receivable. Accounts receivable, which consist of both billed and unbilled receivables, are presented net of current estimated credit losses. Accounts outstanding longer than contractual payment terms are considered past due and are reviewed individually for collectability. Accounts receivable balances consist of the following components as of December 31, 20202023 and 2019:2022:
2020 | 2019 | 2023 | 2022 | |||||||||||||
(in thousands) | (in thousands) | |||||||||||||||
Billed | $ | 68,584 | $ | 57,495 | $ | 75,653 | $ | 119,552 | ||||||||
Unbilled | 12,629 | 7,241 | 12,668 | 20,568 | ||||||||||||
Current estimated credit losses | (3,482 | ) | (2,952 | ) | (7,717 | ) | (5,381 | ) | ||||||||
Total accounts receivable—net | $ | 77,731 | $ | 61,784 | $ | 80,604 | $ | 134,739 | ||||||||
An analysis of changes in current estimated credit losses for the years ended December 31, 2020,2023, 2019,2022, and 20182021 follows:
2020 | 2019 | 2018 | 2023 | 2022 | 2021 | |||||||||||||||||||
(in thousands) | (in thousands) | |||||||||||||||||||||||
Balance—beginning of year | $ | 2,952 | $ | 2,224 | $ | 1,335 | $ | 5,381 | $ | 4,526 | $ | 3,482 | ||||||||||||
Provision for bad debts | 530 | 728 | 889 | 2,396 | 917 | 1,044 | ||||||||||||||||||
Charge-offs | 0 | 0 | 0 | (60 | ) | (62 | ) | - | ||||||||||||||||
Recoveries | 0 | 0 | 0 | - | - | - | ||||||||||||||||||
Balance—end of year | $ | 3,482 | $ | 2,952 | $ | 2,224 | $ | 7,717 | $ | 5,381 | $ | 4,526 | ||||||||||||
4. | MARKETABLE EQUITY SECURITIES |
The Company accounts for its marketable securities in accordance with ASC Topic 321, Investments - Equity Securities. ASC Topic 321 requires companies to measure equity investments at fair value, with changes in fair value recognized in net income. The Company’s investments in marketable securities consist of equity securities with readily determinable fair values. The cost of securities sold is based on the specific identification method, and interest and dividends on securities are included in non-operating income (expense).
Marketable equity securities are carried at fair value, with changes in fair market value included in the determination of net income. The fair market value of marketable equity securities is determined based on quoted market prices in active markets. See Note 18 – Fair Value of Financial Instruments for additional information regarding the valuation of marketable equity securities.
The following table sets forth cost, market value and unrealized gain on equity securities classified as available-for-sale as of December 31, 20202023 and 2019.2022.
2020 | 2019 | 2023 | 2022 | |||||||||||||
(in thousands) | (in thousands) | |||||||||||||||
Available-for-sale securities: | ||||||||||||||||
Fair market value | $ | 27,941 | $ | 29,521 | $ | 43,203 | $ | 41,728 | ||||||||
Cost | 25,860 | 24,156 | 30,294 | 30,350 | ||||||||||||
Unrealized gain | $ | 2,081 | $ | 5,365 | $ | 12,909 | $ | 11,378 | ||||||||
The following table sets forth the gross unrealized gains and losses on the Company’s marketable securities as of December 31, 20202023 and 2019.2022.
2020 | 2019 | 2023 | 2022 | |||||||||||||
(in thousands) | (in thousands) | |||||||||||||||
Available-for-sale securities: | ||||||||||||||||
Gross unrealized gains | $ | 7,048 | $ | 7,808 | $ | 15,539 | $ | 13,478 | ||||||||
Gross unrealized losses | 4,967 | 2,443 | 2,630 | 2,100 | ||||||||||||
Net unrealized gains | $ | 2,081 | $ | 5,365 | $ | 12,909 | $ | 11,378 | ||||||||
For the years ended December 31, 2020,2023, 20192022 and 2018,2021, the Company recognized dividends of approximately $1,266,000, $1,309,000,$1,557,000, $1,539,000 and $1,171,000$1,448,000 in non-operating income in its consolidated statements of operations, respectively.
The following table shows the Company’s net realized (losses) gains during 2020,2023, 20192022 and 20182021 on certain marketable equity securities.
2020 | 2019 | 2018 | 2023 | 2022 | 2021 | |||||||||||||||||||
(in thousands) | (in thousands) | |||||||||||||||||||||||
Realized (losses) gains: | ||||||||||||||||||||||||
Sale proceeds | $ | 2,039 | $ | 2,984 | $ | 1,044 | $ | 343 | $ | - | $ | 3,109 | ||||||||||||
Cost of securities sold | 2,216 | 1,929 | 669 | 255 | - | 3,199 | ||||||||||||||||||
Realized (losses) / gains | $ | (177 | ) | $ | 1,055 | $ | 375 | $ | 88 | $ | - | $ | (90 | ) | ||||||||||
Realized (losses) / gains, net of taxes | $ | (90 | ) | $ | 815 | $ | 278 | |||||||||||||||||
At December 31, 2020,2023, the Company’s investments’ approximate fair value of securities in a loss position and related gross unrealized losses were $10,221,000$8,099,000 and $4,967,000,$2,630,000, respectively. At December 31, 2019,2022, the Company’s investments’ approximate fair value of securities in a loss position and related gross unrealized losses were $8,587,000$7,875,000 and $2,443,000,$2,100,000, respectively.
The market value of the Company’s equity securities are periodically used as collateral against any outstanding margin account borrowings. As ofAt December 31, 20202023, and 2019,the Company had no outstanding borrowings under its margin account. At December 31, 2022, the company had outstanding borrowings of $11,251,000 and $7,474,000$914,000 under its margin account, respectively, which iswas reflected in accrued expenses. The interest ratesrate on margin account borrowings were 0.75% and 2.40%4.92% as of December 31, 20202022, and 2019,respectively.
5. | ACCRUED EXPENSES AND OTHER LIABILITIES |
Accrued expenses and other liabilities at December 31 are summarized as follows:
2020 | 2019 | 2023 | 2022 | |||||||||||||
(in thousands) | (in thousands) | |||||||||||||||
Payroll | $ | 1,621 | $ | 2,226 | $ | 3,105 | $ | 1,995 | ||||||||
Accrued vacation | 835 | 2,191 | 1,050 | 983 | ||||||||||||
Taxes—other than income | 6,881 | 2,719 | 3,189 | 3,369 | ||||||||||||
Interest | 301 | 284 | 302 | 283 | ||||||||||||
Driver escrows | 1,782 | 2,211 | 907 | 1,271 | ||||||||||||
Margin account borrowings | 11,251 | 7,474 | - | 914 | ||||||||||||
Self-insurance claims | 3,303 | 2,988 | ||||||||||||||
Legal reserves | 0 | 19,901 | ||||||||||||||
Current portion of Right-of-Use asset | 627 | 616 | ||||||||||||||
Self-insurance claims and legal reserves | 7,417 | 22,709 | ||||||||||||||
Current portion of Right-of-Use liability | 114 | 340 | ||||||||||||||
Other liabilities | 715 | 2,369 | ||||||||||||||
Total accrued expenses and other liabilities | $ | 26,601 | $ | 40,610 | $ | 16,799 | $ | 34,233 | ||||||||
The Company’s accounts payable of $46,102,000$62,652,000 includes $9,050,000$25,147,000 in payables for purchases of revenue equipment.
6. | CLAIMS LIABILITIES |
The Company maintains cargo insurance coverage to protect it from certain business risks. This policy has a per occurrence deductible of $10,000.
OnSince September 1, 2020, the Company elected to becomehas been self-insured for certain layers of auto liability claims in excess of $2.0 million. Between September 1, 2019 and August 31, 2020, the Company was self-insured for certain layers of auto liability claims in excess of $1.0 million. Prior to September 1, 2019, the Company maintained auto liability insurance coverage for these layers. The Company currently specifically reserves for claims that are expected to exceed $2.0 million when fully developed, based on the facts and circumstances of those claims.
The Company maintains workers’ compensation coverage in Arkansas, Florida, Ohio, Oklahoma, and Mississippi with a $0.5 million self-insured retention and a $0.5 million per occurrence excess policy. The Company has elected to opt out of workers’ compensation coverage in Texas and is providing coverage through the P.A.M. Texas Injury Plan. The Company has accrued for estimated losses to pay such claims as well as claims incurred but not yet reported. The Company has not experienced any adverse trends involving differences in claims experienced versus claims estimates for workers’ compensation claims. Letters of credit aggregating approximately $310,000 and certificates of deposit totaling $300,000 are held by banks as security for workers’ compensation claims. The Company self-insures for employee health claims with a stop loss of $350,000$0.4 million per covered employee per year and estimates its liability for claims outstanding and claims incurred but not reported. See Note 5 – Accrued Expenses and Other Liabilities for additional information regarding self-insurance claims liabilities.
7. | LONG-TERM DEBT |
Long-term debt at December 31, consists of the following:
2020 | 2019 | 2023 | 2022 | |||||||||||||
(in thousands) | (in thousands) | |||||||||||||||
Line of credit with a bank—due July 1, 2022, and collateralized by accounts receivable (1) | 18,246 | 17,047 | ||||||||||||||
Line of credit with a bank—due July 1, 2026, and collateralized by accounts receivable (1) | - | - | ||||||||||||||
Equipment financing (2) | 250,572 | 224,777 | 219,033 | 216,875 | ||||||||||||
Real estate financing (3) | 17,288 | 0 | 42,676 | 47,406 | ||||||||||||
Total long-term debt | 286,106 | 241,824 | 261,709 | 264,281 | ||||||||||||
Less current maturities | (57,776 | ) | (67,637 | ) | (57,645 | ) | (58,815 | ) | ||||||||
Long-term debt—net of current maturities | $ | 228,330 | $ | 174,187 | $ | 204,064 | $ | 205,466 | ||||||||
(1) | Line of credit agreement with a bank provides for maximum borrowings of $60.0 million and contains certain restrictive covenants that must be maintained by the Company on a consolidated basis. Borrowings on the line of credit are at an interest rate of |
(2) | Equipment financings consist of installment obligations for revenue equipment purchases, payable in various monthly installments with various maturity dates through |
(3) | Real estate financing consisting of an installment obligation for the purchase of real estate in Laredo, TX, payable in 120 installments at an interest rate of 3.02% and maturing in August |
The Company has provided lettersa letter of credit to a third partiesparty totaling approximately $310,000$100,000 and $430,000$310,000 at December 31, 20202023 and December 31, 2019,2022, respectively. The letters areletter is held by thesethe third partiesparty to assist such partiesparty in collection of any amounts due by the Company should the Company default in its commitments to the parties.party.
Scheduled annual maturities on long-term debt outstanding at December 31, 2020,2023, are:
2021 | $ | 57,776 | ||||||
2022 | 72,681 | |||||||
2023 | 66,767 | |||||||
2024 | 43,116 | $ | 57,645 | |||||
2025 | 30,596 | 61,848 | ||||||
2026 | 7,921 | 43,588 | ||||||
2027 | 41,672 | |||||||
2028 | 25,914 | |||||||
Thereafter | 7,249 | 31,042 | ||||||
Total | $ | 286,106 | $ | 261,709 | ||||
8. | NONCASH INVESTING AND FINANCING ACTIVITIES |
The Company financed approximately $80.7$68.5 million, $22.2 million, and $24.5$36.1 million in equipment purchases during 20202023,2022 and 2019,2021, respectively, utilizing noncash financing.
9. | CAPITAL STOCK |
The Company's authorized capital stock consists of 40,000,00050,000,000 shares of common stock, par value $.01 per share, and 10,000,000 shares of preferred stock, par value $.01 per share. At December 31, 2020,2023, there were 11,695,71922,317,671 shares of our common stock issued and 5,727,89522,021,341 shares outstanding. At December 31, 2019,2022, there were 11,656,16022,293,687 shares of our common stock issued and 5,748,89722,166,450 shares outstanding. NaNNo shares of our preferred stock were issued or outstanding at December 31, 20202023 or 2019.2022.
Common Stock
The holders of our common stock, subject to such rights as may be granted to any preferred stockholders, elect all directors and are entitled to one vote per share. All shares of common stock participate equally in dividends when and as declared by the Board of Directors and in net assets on liquidation. The shares of common stock have no preference, conversion, exchange, preemptive, or cumulative voting rights.
Preferred Stock
Preferred stock may be issued from time to time by our Board of Directors, without stockholder approval, in such series and with such preferences, conversion or other rights, voting powers, restrictions, limitations as to dividends, qualifications or other provisions, as may be fixed by the Board of Directors in the resolution authorizing their issuance. The issuance of preferred stock by the Board of Directors could adversely affect the rights of holders of shares of common stock; for example, the issuance of preferred stock could result in a class of securities outstanding that would have certain preferences with respect to dividends and in liquidation over the common stock, and that could result in a dilution of the voting rights, net income per share and net book value of the common stock. As of December 31, 2020,2023, we have no agreements or understandings for the issuance of any shares of preferred stock.
Treasury Stock
In May 2019, our Board of Directors authorized the repurchase of up to 200,000 shares of our common stock through a Dutch auction tender offer (the “2019 tender offer”). Subject to certain limitations and legal requirements, the Company could repurchase up to an additional 2% of its outstanding shares, which totaled 118,996 shares. The 2019 tender offer commenced on May 13, 2019 and expired on June 11, 2019. Through this tender offer, the Company’s shareholders had the opportunity to tender some or all of their shares at a price within the range of $55.00 to $60.00 per share. Upon expiration, 192,743 shares were purchased through this offer at a final purchase price of $60.00 per share for a total of approximately $11.6 million, including fees and commission. The repurchase was settled on June 13, 2019. The Company accounted for the repurchase of these shares as treasury stock on the Company’s consolidated balance sheet as of December 31, 2019.
In May 2018, our Board of Directors authorized the repurchase of up to 100,000 shares of our common stock through a Dutch auction tender offer (the “2018 tender offer”). Subject to certain limitations and legal requirements, the Company could repurchase up to an additional 2% of its outstanding shares, which totaled 124,248 shares. The 2018 tender offer commenced on May 8, 2018 and expired on June 7, 2018. Through this tender offer, the Company’s shareholders had the opportunity to tender some or all of their shares at a price within the range of $39.00 to $43.00 per share. Upon expiration, 185,597 shares were purchased through this offer at a final purchase price of $40.00 per share for a total of approximately $7.5 million, including fees and commission. The repurchase was settled on June 12, 2018. The Company accounted for the repurchase of these shares as treasury stock on the Company’s consolidated balance sheet as of December 31, 2018.
The Company’s stock repurchase program has been extended and expanded several times, most recently in April 2017,July 2023, when the Board of Directors reauthorized 500,000 shares of common stock for repurchase under the initial September 2011 authorization. The Company repurchased 60,561169,093 shares and 58,934168,847 shares of its common stock under this program during 20202023 and 2019,2022, respectively.
The Company accounts for Treasury stock using the cost method, and as of December 31, 2020,2023, 5,967,824296,330 shares were held in the treasury at an aggregate cost of approximately $159,118,275.$8,736,000.
10. | SEGMENT INFORMATION, SIGNIFICANT CUSTOMERS, INDUSTRY CONCENTRATION AND GEOGRAPHIC AREAS |
The Company's revenues for 2020,2023, 20192022 and 20182021 were all generated from operations in the motor carrier segment and are aggregated into a single reporting segment in accordance with the aggregation criteria under GAAP.
The table below presents revenue dollars and percentages by geographic area:
Year Ended December 31, | Year Ended December 31, | |||||||||||||||||||||||||||||||||||||||||||||||
2020 | 2019 | 2018 | 2023 | 2022 | 2021 | |||||||||||||||||||||||||||||||||||||||||||
(in thousands) | (in thousands) | |||||||||||||||||||||||||||||||||||||||||||||||
Amount | Percent | Amount | Percent | Amount | Percent | Amount | Percent | Amount | Percent | Amount | Percent | |||||||||||||||||||||||||||||||||||||
United States - domestic shipments | $ | 316,542 | 66.1 | $ | 326,559 | 63.5 | $ | 302,754 | 56.8 | $ | 512,552 | 63.2 | $ | 629,921 | 66.5 | $ | 474,291 | 67.9 | ||||||||||||||||||||||||||||||
Shipments to or from Mexico | 161,412 | 33.7 | 186,392 | 36.3 | 229,350 | 43.0 | 296,696 | 36.6 | 313,885 | 33.2 | 223,315 | 32.0 | ||||||||||||||||||||||||||||||||||||
Shipments to or from Canada | 1,156 | 0.2 | 1,226 | 0.2 | 1,157 | 0.2 | 1,559 | 0.2 | 3,056 | 0.3 | 891 | 0.1 | ||||||||||||||||||||||||||||||||||||
Total Operating Revenues | $ | 479,110 | 100 | % | $ | 514,177 | 100 | % | $ | 533,261 | 100 | % | ||||||||||||||||||||||||||||||||||||
Total | $ | 810,807 | 100 | % | $ | 946,862 | 100 | % | $ | 698,497 | 100 | % | ||||||||||||||||||||||||||||||||||||
Our five largest customers, for which we provide carrier services covering a number of geographic locations, accounted for approximately 35%34%, 40%39% and 42%33% of our total revenues in 2020,2023, 20192022 and 2018,2021, respectively. General Motors Company accounted for approximately 15%12%, 19%13% and 13%11% of our revenues in 2020,2023, 20192022 and 2018, respectively. Fiat Chrysler Automobiles accounted for approximately 6%, 9% and 16%of our revenues in 2020,2019 and 2018, respectively. Ford Motor Company accounted for approximately 5%, 7% and 8% of our revenues in 2020,2019 and 2018,2021, respectively.
We also provide transportation services to other manufacturers who are suppliers for automobile manufacturers. Approximately 30%, 40%31% and 46%27% of our revenues were derived from transportation services provided to the automobile industry during 2020,2023, 20192022 and 2018,2021, respectively.
Accounts receivable from the three largest customers totaled approximately $25,593,000$24,665,000 and $31,327,000$36,622,000 at December 31, 20202023 and 2019,2022, respectively.
11. | DIVIDENDS |
The Company has paid cash dividends in the past; however, the Company currently intends to retain future earnings and does not anticipate paying cash dividends in the foreseeable future. Any future determination to pay dividends will be at the discretion of the Board and will depend on the Company’s financial condition, results of operations, capital requirements, any legal or contractual restrictions on the payment of dividends, and other factors the Board deems relevant.
12. | FEDERAL AND STATE INCOME TAXES |
Under GAAP, deferred income taxes reflect the net tax effects of temporary differences between the carrying amounts of assets and liabilities for financial reporting purposes and for income tax reporting purposes.
Significant components of the Company’s deferred tax liabilities and assets at December 31 are as follows:
2020 | 2019 | 2023 | 2022 | |||||||||||||
(in thousands) | (in thousands) | |||||||||||||||
Deferred tax liabilities: | ||||||||||||||||
Property and equipment | $ | 100,736 | $ | 83,453 | $ | 101,623 | $ | 102,169 | ||||||||
Unrealized gains on securities | 2,580 | 2,580 | 3,282 | 2,894 | ||||||||||||
Prepaid expenses and other | 2,599 | 2,193 | 3,303 | 3,836 | ||||||||||||
Total deferred tax liabilities | 105,915 | 88,226 | 108,208 | 108,899 | ||||||||||||
Deferred tax assets: | ||||||||||||||||
Current expected credit losses | 896 | 760 | 1,986 | 1,385 | ||||||||||||
Tax credit carryforwards | 988 | 988 | ||||||||||||||
Compensated absences | 189 | 512 | 168 | 215 | ||||||||||||
Self-insurance allowances | 674 | 5,630 | 1,674 | 5,746 | ||||||||||||
Marketable equity securities | 2,129 | 1,253 | ||||||||||||||
Net operating loss carryover | 32,031 | 15,364 | ||||||||||||||
Other | 125 | 197 | 49 | 108 | ||||||||||||
Total deferred tax assets | 37,032 | 24,704 | 3,877 | 7,454 | ||||||||||||
Net deferred tax liability | $ | 68,883 | $ | 63,522 | $ | 104,331 | $ | 101,445 | ||||||||
The reconciliation between the effective income tax rate and the statutory Federal income tax rate for the years ended December 31, 2020,2023, 20192022 and 20182021 is presented in the following table:
2020 | 2019 | 2018 | 2023 | 2022 | 2021 | |||||||||||||||||||||||||||||||||||||||||||
(in thousands) | (in thousands) | |||||||||||||||||||||||||||||||||||||||||||||||
Amount | Percent | Amount | Percent | Amount | Percent | Amount | Percent | Amount | Percent | Amount | Percent | |||||||||||||||||||||||||||||||||||||
Federal income tax at statutory rate | $ | 4,916 | 21.0 | $ | 2,124 | 21.0 | $ | 6,582 | 21.0 | $ | 6,002 | 21.0 | $ | 24,991 | 21.0 | $ | 21,526 | 21.0 | ||||||||||||||||||||||||||||||
Nondeductible per diem and meals | 321 | 1.4 | 0 | 0 | 0 | 0 | 371 | 1.3 | - | - | - | - | ||||||||||||||||||||||||||||||||||||
Other nondeductible expenses, net | 0 | 0 | 342 | 3.4 | 80 | 0.2 | ||||||||||||||||||||||||||||||||||||||||||
State income taxes/other, net | 345 | 1.5 | (251 | ) | (2.5 | ) | 685 | 2.2 | 3,790 | 13.3 | 3,344 | 2.8 | 4,463 | 4.4 | ||||||||||||||||||||||||||||||||||
Total income tax expense | $ | 5,582 | 23.9 | $ | 2,215 | 21.9 | $ | 7,347 | 23.4 | $ | 10,163 | 35.6 | $ | 28,335 | 23.8 | $ | 25,989 | 25.4 | ||||||||||||||||||||||||||||||
The provision (benefit) for income taxes consisted of the following:
2020 | 2019 | 2018 | 2023 | 2022 | 2021 | |||||||||||||||||||
(in thousands) | (in thousands) | |||||||||||||||||||||||
Current: | ||||||||||||||||||||||||
Federal | $ | (62 | ) | $ | (56 | ) | $ | (48 | ) | $ | 4,697 | $ | 10,673 | $ | 6,314 | |||||||||
State | 282 | 646 | 189 | 2,580 | 3,121 | 1,843 | ||||||||||||||||||
Total current income tax provision | 220 | 590 | 141 | 7,277 | 13,794 | 8,157 | ||||||||||||||||||
Deferred: | ||||||||||||||||||||||||
Federal | 4,860 | 2,177 | 6,185 | 944 | 12,920 | 13,720 | ||||||||||||||||||
State | 502 | (552 | ) | 1,021 | 1,942 | 1,621 | 4,112 | |||||||||||||||||
Total deferred income tax provision | 5,362 | 1,625 | 7,206 | 2,886 | 14,541 | 17,832 | ||||||||||||||||||
Total income tax provision expense | $ | 5,582 | $ | 2,215 | $ | 7,347 | $ | 10,163 | $ | 28,335 | $ | 25,989 | ||||||||||||
In March 2020, the President of the United States signed the Coronavirus Aid, Relief and Economic Security Act (“CARES Act”), to stabilize the economy during the coronavirus pandemic. The CARES Act temporarily suspends and modifies certain tax laws established by the TCJA, including, but not limited to, modifications to net operating loss limitations, business interest limitations and alternative minimum tax. The CARES Act did not have a material impact on the Company’s current year provision or the Company’s consolidated financial statements.
The Company has general business credits of approximately $988,000 at December 31, 2018, which begin to expire after the year 2030. The Company also has net operating loss carryovers for federal income purposes of approximately $59,715,000 of which $30,835,000 will begin to expire after the year 2030 while the remaining balance does not expire and can be carried forward indefinitely.
In determining whether a tax asset valuation allowance is necessary, management, in accordance with the provisions of ASC 740-10-30, weighs all available evidence, both positive and negative to determine whether, based on the weight of that evidence, a valuation allowance is necessary. If negative conditions exist which indicate a valuation allowance might be necessary, consideration is then given to what effect the future reversals of existing taxable temporary differences and the availability of tax strategies might have on future taxable income to determine the amount, if any, of the required valuation allowance. As of December 31, 20202023 and 2019,2022, management determined that the future reversals of existing taxable temporary differences and available tax strategies would generate sufficient future taxable income to realize its tax assets and therefore a valuation allowance was not necessary.
The Company recognizes a tax benefit from an uncertain tax position only if it is more likely than not that the position will be sustained on examination by taxing authorities, based on the technical merits of the position. As of December 31, 2020,2023, an adjustment to the Company’s consolidated financial statements for uncertain tax positions has not been required as management believes that the Company’s tax positions taken in income tax returns filed or to be filed are supported by clear and unambiguous income tax laws. The Company recognizes interest and penalties related to uncertain income tax positions, if any, in income tax expense. During 20202023 and 2019,2022, the Company has not recognized or accrued any interest or penalties related to uncertain income tax positions.
The Company and its subsidiaries are subject to U.S. and Canadian federal income tax laws as well as the income tax laws of multiple state jurisdictions. The major tax jurisdictions in which the Company operates generally provide for a deficiency assessment statute of limitation period of three years, and as a result, the Company’s tax years 20172020 and forward remain open to examination in those jurisdictions.
13. | STOCK-BASED COMPENSATION |
The Company maintains a stock incentive plan under which incentive and nonqualified stock options and other stock awards may be granted. On March 13, 2014, the Company’s Board of Directors adopted, and on May 29, 2014 our shareholders approved, the 2014 Amended and Restated Stock Option and Incentive Plan (the “Plan”) which amended and restated the Company’s 2006 Stock Option Plan. Under the Plan, 750,0003,000,000 shares (as adjusted for the Company’s 2-for-1 forward split of its common stock paid in August 2021 and the Company’s 2-for-1 forward split of its common stock paid in March 2022) are reserved for the issuance of stock awards to directors, officers, key employees, and others. The stock option exercise price and the restricted stock purchase price under the 2014 Plan shall not be less than 85% of the fair market value of the Company’s common stock on the date the award is granted. The fair market value is determined by the closing price of the Company’s common stock, on its primary exchange, on the same date that the option or award is granted.
In The Company granted unrestricted shares of its common stock to its non-employee directors and granted restricted shares of common stock to certain key employees during all periods presented. All share and per share amounts set forth below have been adjusted to reflect the impact of the 2-for-January 2020,1 forward stock split in both August 2021 and March 2022.
During February 2023, the Company granted 7,00028,313 shares of common stock to certain key employees. These restricted stock awards have ahad grant date fair valuevalues of $56.45$28.30 per share, based on the closing price of the Company’s stock on the date of grant, and vest on thein 25% increments over four years, beginning fourone year from the anniversary date of the award.grant.
InDuring March 2020,May 2023, the Company granted 2,6082,295 shares of common stock to non-employee directors. These stock awards havehad a grant date fair value of $30.75 per share, based on the closing price of the Company’s stock on the date of grant, and vested immediately.
In April 2020, the Company granted 242 shares of common stock to a non-employee director. This stock award has a grant date fair value of $41.40 per share, based on the closing price of the Company’s stock on the date of grant, and vested immediately.
In August 2020, the Company granted 40,000 restricted shares of common stock to the Company’s Chief Executive Officer. This restricted stock award has a grant date fair value of $35.37, based on the closing price of the Company’s stock on the date of grant, and will vest in increments of 5,000 shares each in 2022,2023,2024 and 2027 and 10,000 shares each in 2025 and 2026.
In August 2020, the Company granted 13,332 shares of common stock to certain key employees. These restricted stock awards have a grant date fair value of $30.25 per share, based on the closing price of the Company’s stock on the date of grant, and vest on the four year anniversary date of the award.
In April 2019, the Company granted 1,845 shares of common stock to non-employee directors. These stock awards have a grant date fair value of $48.94 per share, based on the closing price of the Company’s stock on the date of grant, and vested immediately.
In May 2019, the Company granted 213 shares of common stock to a non-employee director. These stock awards have a grant date fair value of $47.06 per share, based on the closing price of the Company’s stock on the date of grant, and vested immediately.
In December 2018, the Company granted 33,000 restricted shares of common stock to certain key employees. These restricted stock awards have a grant date fair value of $36.35 per share, based on the closing price of the Company’s stock on the date of grant, with onefourth of the award vesting each of the next four years on the anniversary date.
In March 2018, the Company granted 1,932 shares of common stock to non-employee directors. These stock awards have a grant date fair value of $36.35$23.95 per share, based on the closing price of the Company’s stock on the date of grant, and vested immediately.
During 2020February 2022, the Company granted 29,120 shares of common stock to certain key employees. These stock awards had grant date fair values of $38.80 per share, based on the closing price of the Company’s stock on the date of grant, and vest in 25% increments over four years, beginning one year from the anniversary date of the grant.
During May 2022, the Company granted 1,855 shares of common stock to non-employee directors. These stock awards had a grant date fair value of $29.60 per share, based on the closing price of the Company’s stock on the date of grant, and vested immediately.
During June 2022, the Company granted 3,500 shares of common stock to a key employee. This stock award had a grant date fair value of $27.68 per share, based on the closing price of the Company’s stock on the date of grant, and vests in 25% increments over four years, beginning one year from the anniversary date of the grant.
During 2023 and 2019,2022, there were 0no grants of stock options and there were 0no outstanding stock options at December 31, 20202023 or December 31, 2019.2022. At December 31, 2020,2023, approximately 362,0001,402,000 shares were available for granting future options or restricted stock.
The grant date fair value of stock and stock options vested during 2020,2023, 20192022 and 20182021 was approximately $759,000, $953,000$576,000, $392,000 and $719,000,$203,000, respectively. Total pre-tax stock-based compensation expense, recognized in Salaries,salaries, wages and benefits was approximately $461,000$553,000 during 20202023 and includes approximately $90,000$55,000 recognized as a result of the grant of 326a total of 2,295 shares of stock to eightfour non-employee directors during the first quarter of 2020 and 242 shares of stock to one non-employee director during the second quarter of 2020.2023. The Company recognized a total income tax benefit of approximately $100,000$197,000 related to stock-based compensation expense during 2020.2023. The recognition of stock-based compensation expense decreased both diluted earnings per common share by $0.02 and basic earnings per common share by approximately $0.06$0.02 during 2020.2023. As of December 31, 2020,2023, the Company had stock-based compensation plans with total unvested stock-based compensation expense of approximately $2,077,000$2,134,000 which is being amortized over the remaining vesting period. As a result, the Company expects to recognize the following approximate amounts of additional compensation expense related to unvested restricted stock awards during each of the years indicated:
| 2021 | $ | 342,000 | ||||||
| 2022 | $ | 375,000 | ||||||
| 2023 | $ | 310,000 | ||||||
| 2024 | $ | 297,000 | $ | 728,000 | ||||
| 2025 | $ | 354,000 | $ | 777,000 | ||||
| 2026 | $ | 288,000 | $ | 493,000 | ||||
| 2027 | $ | 111,000 | $ | 136,000 | ||||
| 2028 | - | |||||||
Total pre-tax stock-based compensation expense, recognized in Salaries,salaries, wages and benefits was approximately $912,000$715,000 during 20192022 and includedincludes approximately $100,000$55,000 recognized as a result of the grant of 2051,855 shares of stock to eachfour non-employee directordirectors during the firstsecond quarter of 2019.2022. The Company recognized a total income tax benefit of approximately $200,000$170,000 related to stock-based compensation expense during 2019.2022. The recognition of stock-based compensation expense decreased both diluted earnings per common share by $0.03 and basic earnings per common share by approximately $0.12$0.02 during 2019.2022.
Total pre-tax stock-based compensation expense, recognized in Salaries,salaries, wages and benefits was approximately $732,000$441,000 during 20182021 and includedincludes approximately $70,000$80,000 recognized as a result of the grant of 276652 shares of stock to eacheight non-employee directordirectors during the first quarter of 2018.2021. The Company recognized a total income tax benefit of approximately $172,000$110,000 related to stock-based compensation expense during 2018.2021. The recognition of stock-based compensation expense decreased diluted earnings per common share by $0.03 and basic earnings per common share by approximately $0.09 and $0.10, respectively,$0.02 during 2018.2021.
Transactions in stock options under these plans are summarized as follows:
Shares Under Option | Weighted- Average Exercise Price | |||||||
Outstanding—January 1, 2018: | 45,068 | $ | 10.79 | |||||
Granted | 0 | 0 | ||||||
Exercised | (45,005 | ) | 10.79 | |||||
Canceled | (63 | ) | 11.22 | |||||
Outstanding—December 31, 2018: | 0 | $ | 0 | |||||
Granted | 0 | 0 | ||||||
Exercised | 0 | 0 | ||||||
Canceled | 0 | 0 | ||||||
Outstanding—December 31, 2019: | 0 | $ | 0 | |||||
Granted | 0 | 0 | ||||||
Exercised | 0 | 0 | ||||||
Canceled | 0 | 0 | ||||||
Outstanding—December 31, 2020: | 0 | $ | 0 | |||||
Options exercisable—December 31, 2020: | 0 | $ | 0 | |||||
There were 0no options granted during 2020,2023, 2019,2022, or 2018.2021. The weighted-average grant-date fair value of options canceled, forfeited, or expired during 2018 was $6.34.
The total intrinsic value
A summary of the status of the Company’s non-vested restricted stock as of December 31, 20202023 and changes during the year ended December 31, 2020,2023, is presented below:
Restricted Stock | ||||||||
Number of Shares | Weighted- Average Grant Date Fair Value | |||||||
Nonvested—January 1, 2020 | 55,459 | $ | 24.35 | |||||
Granted | 63,182 | 36.46 | ||||||
Canceled/forfeited/expired | (18,047 | ) | 38.25 | |||||
Vested | (39,559 | ) | 19.18 | |||||
Nonvested—December 31, 2020: | 61,035 | $ | 36.12 | |||||
Cash received from option exercises totaled approximately $0, $0 and $485,000 during the years ended December 31, 2020, 2019 and 2018, respectively. The Company issued new shares upon option exercise.
Restricted Stock | ||||||||
Number of Shares | Weighted- Average Grant Date Fair Value | |||||||
Nonvested—January 1, 2023 | 235,832 | $ | 13.15 | |||||
Granted | 30,608 | 27.97 | ||||||
Canceled/forfeited/expired | (34,627 | ) | 16.85 | |||||
Vested | (32,954 | ) | 17.49 | |||||
Nonvested—December 31, 2023: | 198,859 | $ | 14.07 | |||||
14. | EARNINGS PER SHARE |
Basic earnings per common share was computed by dividing net income by the weighted average number of shares outstanding (on a stock split adjusted basis) during the period. Diluted earnings per common share was calculated as follows:
For the Year Ended December 31, | For the Year Ended December 31, | |||||||||||||||||||||||
2020 | 2019 | 2018 | 2023 | 2022 | 2021 | |||||||||||||||||||
(in thousands, except per share data) | (in thousands, except per share data) | |||||||||||||||||||||||
Net income | $ | 17,827 | $ | 7,900 | $ | 23,994 | $ | 18,416 | $ | 90,672 | $ | 76,516 | ||||||||||||
Basic weighted average common shares outstanding | 5,752 | 5,832 | 6,083 | 22,056 | 22,246 | 22,715 | ||||||||||||||||||
Dilutive effect of common stock equivalents | 16 | 48 | 76 | 141 | 190 | 149 | ||||||||||||||||||
Diluted weighted average common shares outstanding | 5,768 | 5,880 | 6,159 | 22,197 | 22,436 | 22,864 | ||||||||||||||||||
Basic earnings per share | $ | 3.10 | $ | 1.35 | $ | 3.94 | $ | 0.83 | $ | 4.08 | $ | 3.37 | ||||||||||||
Diluted earnings per share | $ | 3.09 | $ | 1.34 | $ | 3.90 | $ | 0.83 | $ | 4.04 | $ | 3.35 | ||||||||||||
(1) As adjusted for the Company’s 2-for-1 forward stock splits paid in August 2021 and March 2022, respectively.
15. | BENEFIT PLAN |
The Company sponsors a benefit plan for the benefit of all eligible employees. The plan qualifies under Section 401(k) of the Internal Revenue Code thereby allowing eligible employees to make tax-deductible contributions to the plan. The plan provides for employer matching contributions of 50% of each participant’s voluntary contribution up to 3% of the participant’s compensation and vests at the rate of 20% each year until fully vested after five years. Total employer matching contributions to the plan were approximately $190,000, $198,000$245,000, $212,000 and $176,000$190,000 in 2020,2023, 20192022 and 2018,2021, respectively.
16. | COMMITMENTS AND CONTINGENCIES |
We were a defendant in a collective- and class-action lawsuit which was filed on December 9, 2016, in the United States District Court for the Western District of Arkansas. The plaintiffs, who included current and former employee drivers who worked for the Company during the period of December 9, 2013, through December 31, 2019, alleged violations under the Fair Labor Standards Act and the Arkansas Minimum Wage Law including “failure to pay minimum wage during orientation, failure to pay minimum wage to team drivers after initial orientation, failure to pay minimum wage to solo-drivers after initial orientation, failure to pay for compensable travel time, Comdata card fees, unlawful deductions, and breach of contract.” The plaintiffs were seeking actual and liquidated damages to include court costs and legal fees. During July 2020, the United States District Court for the Western District of Arkansas granted final approval of a $16.5 million settlement reached with the plaintiffs and the settlement payment was disbursed by the Company during August 2020. Management has determined that the loss under this claim will not be covered by existing insurance policies.
On March 31, 2020, the United States District Court for the Western District of Arkansas dismissed the collective- and class-action lawsuit filed against the Company on May 29, 2019 by plaintiffs who were independent contractors alleging violations under the Fair Labor Standards Act and the Arkansas Minimum Wage Law. The plaintiffs, through their attorneys, alleged “misclassification as independent contractors, payment on the basis of miles without regard to the number of hours worked, improper deductions, and failure to pay minimum wage.” The dismissal of this lawsuit resulted when the Company and plaintiffs reached a settlement agreement and the Company paid approximately $421,000, plus legal fees. Legal reserve accruals in excess of the amount outlined in the settlement agreement were reversed during the firstnine months of 2020, resulting in a reduction in accrued expenses and other liabilities in the Company’s consolidated balance sheets.
We are involved in certain claims and pending litigation arising from the ordinary conduct of business. We also provide accruals for claims within our self-insured retention amounts. On September 1, 2019, we elected to become self-insured for certain layers of auto liability claims in excess of $1.0 million for which we previously maintained auto liability insurance coverage. OnSince September 1, 2020, we elected to becomehave been self-insured for certain layers of auto liability claims in excess of $2.0 million. We currently specifically reserve for claims that are expected to exceed $2.0$2.0 million when fully developed, based on the facts and circumstances of those claims. Based on our knowledge of the facts, and in certain cases, opinions of outside counsel, we believe the resolution of such claims and pending litigation will not have a material effect on our financial position, results of operations or cash flows. However, if we experience claims that are not covered by our insurance or that exceed our estimated claim reserve, it could increase the volatility of our earnings and have a materially adverse effect on our financial condition, results of operations or cash flows.
Total rental expense, net of amounts reimbursed, for the years ended December 31, 2020, 2019 and 2018 related to truck leases was approximately $0, $0, and $47,000, respectively.
17. | LEASES |
Right-of-Use Leases
During 2019, the Company entered into operating leases which include initial terms of approximately five years and which do not include an option for early cancellation. During 2020,2023 and 2022, the Company did not enter into any new leases with similar provisions. In accordance with the provisions of ASC Topic 842, these leases resulted in the recognition of right-of-use assets and corresponding operating lease liabilities, respectively, valued at $1.5approximately $0.1 million as of December 31, 2020.2023. These assets and liabilities are recognized based on the present value of future minimum lease payments over the lease term at commencement date, using the Company’s incremental borrowing rate as of the respective dates of lease inception, as the rate implicit in each lease is not readily determinable. The right-of-use assets are recorded in other assets, and the lease liability is recorded in accrued expenses and other liabilities and in other long-term liabilities on our consolidated balance sheet. Lease expense is recorded on a straight-line basis over the lease term and is recorded in rent and purchased transportation in our consolidated statements of operations. While the lease agreements contain provisions to extend after the initial term for an additional five years, the Company is not reasonably certain these extension options will be exercised. Therefore, potential lease payments that might occur under this extension period are not included in amounts recorded in our consolidated balance sheets as of December 31, 2020.2023.
Scheduled amounts and timing of cash flows arising from operating lease payments at December 31, 2020,2023, are:
(in thousands) | (in thousands) | |||||||
Maturity of Lease Liabilities | ||||||||
2021 | $ | 627 | ||||||
2022 | 544 | |||||||
2023 | 340 | |||||||
2024 | 114 | $ | 114 | |||||
2025 | 0 | - | ||||||
Thereafter | 0 | |||||||
2026 | - | |||||||
2027 | - | |||||||
2028 and Thereafter | - | |||||||
Total undiscounted operating lease payments | $ | 1,625 | $ | 114 | ||||
Less: Imputed interest | (79 | ) | (1 | ) | ||||
Present value of operating lease liabilities | $ | 1,546 | $ | 113 | ||||
Balance Sheet Classification | ||||||||
Right-of-use assets (recorded in other non-current assets) | $ | 1,546 | $ | 113 | ||||
Current lease liabilities (recorded in other current liabilities) | $ | 627 | $ | 113 | ||||
Long-term lease liabilities (recorded in other long-term liabilities) | 919 | - | ||||||
Total operating lease liabilities | $ | 1,546 | $ | 113 | ||||
Other Information | ||||||||
Weighted-average remaining lease term for operating leases (in years) | 2.81 | 0.33 | ||||||
Weighted-average discount rate for operating leases | 3.61 | % | 3.74 | % | ||||
Cash Flows
Right-of-useNo new right-of-use assets of $0 and $2.4 million were recognized as non-cash asset additions that resulted from new operating lease liabilities during the years ended December 31, 20202023 and December 31, 2019,2022, respectively. Cash paid for amounts included in the present value of right-of-use lease liabilities was $0.6$0.3 and $0.3$0.5 million during the years ended December 31, 20202023 and December 31, 2019,2022, respectively, and is included in operating cash flows.
Cash Paid for Operating Leases
Twelve Months Ended | ||||||||
December 31, | ||||||||
2023 | 2022 | |||||||
(in thousands) | ||||||||
Right-of-Use leases | $ | 330 | $ | 515 | ||||
Short-term leases (1) | 3,115 | 2,393 | ||||||
Total | $ | 3,445 | $ | 2,908 | ||||
Twelve Months Ended | ||||||||
December 31, | ||||||||
2020 | 2019 | |||||||
Right-of-Use leases | $ | 552 | $ | 255 | ||||
Short-term leases (1) | 2,177 | 2,214 | ||||||
Total | $ | 2,729 | $ | 2,469 | ||||
| (1) Short-term lease cost includes leases with a term of twelve months or less and leases with options for early cancellation. |
Lease Revenue
The Company has a lease-purchase program whereby we offer independent contractors the opportunity to lease a Company-owned truck. The terms associated with these leases require weekly lease payments over the term of the leases which range from 75 to 60 months. The cost and carrying amount of Company-owned trucks in this program at December 31, 20202023 were approximately $49,228,000$57,790,000 and $24,708,000,$32,595,000, respectively. The cost and carrying amount of the Company-owned trucks in this program at December 31, 20192022 were approximately $60,130,000$58,227,000 and $33,757,000,$22,960,000, respectively. Payments under this program are classified in the Company’s financial statements under the consolidated statement of operations category Revenue.
Leases in our lease-purchase program expire at various dates through 2025.2027. Payments received under this program are classified in the Company’s financial statements under the consolidated statements of operations category Revenue. Future minimum lease receipts related to these operating leases at December 31, 20202023 and 20192022 were approximately $15,242,000$14,268,000 and $18,792,000,$11,549,000, respectively. Depreciation is calculated on a straight-line basis over the estimated useful life of the equipment, down to an estimated salvage value. In most cases, the Company has agreements in place with certain manufacturers whereby salvage values are guaranteed by the manufacturer. In other cases, where salvage values are not guaranteed, estimates of salvage value are based on the expected market values of equipment at the time of disposal. During the year ended December 31, 2020,2023, the Company incurred $6.2$4.9 million of depreciation expense for these assets.
The Company leases dock space to a related party at our Laredo, Texas terminal and warehouse and office space to an unrelated lessee at a second Laredo, Texas terminal. At December 31, 2020,2023, the cost and carrying amount of the facilities leased were approximately $13,738,000 and $12,402,000,$11,305,000, respectively. Future minimum lease receipts related to this operating lease at December 31, 20202023 are approximately $705,000.$32,100. See Note 19 – Related Party Transactions for additional information regarding the Company’s transactions with related persons.
The Company's operating lease revenue is disclosed in the table below.
Twelve Months Ended | ||||||||||||||||
December 31, | Twelve Months Ended | |||||||||||||||
2020 | 2019 | December 31, | ||||||||||||||
2023 | 2022 | |||||||||||||||
(in thousands) | ||||||||||||||||
Leased truck revenue (recorded in revenue, before fuel surcharge) | $ | 6,756 | $ | 9,220 | $ | 7,850 | $ | 8,705 | ||||||||
Leased building space revenue (recorded in non-operating income) | 573 | 155 | 395 | 525 | ||||||||||||
Total lease revenue | $ | 7,329 | $ | 9,375 | $ | 8,245 | $ | 9,230 | ||||||||
Lease Receivable
Future minimum operating lease payments receivable at December 31, 2020:2023:
2021 | $ | 6,613 | ||
2022 | 4,774 | |||
2023 | 2,803 | |||
2024 | 1,051 | |||
2025 | 1 | |||
Thereafter | 0 | |||
Total future minimum lease payments receivable | $ | 15,242 |
| (in thousands) | ||||
2024 | $ | 6,283 | ||
2025 | 5,163 | |||
2026 | 2,795 | |||
2027 | 27 | |||
2028 & Thereafter | - | |||
Total future minimum lease payments receivable | $ | 14,268 | ||
Lease Payments to Related Parties
Payments to related parties of $1,129,231$1,540,102 were made for real estate leases during 20202023 which include maintenance facilities in one state and trailer drop yards in elevennine states. The leases are generally month to month leases with automatic monthly renewal provisions.
During 20202023 the Company leased office, shop and parking spaces from various lessors, including a related party. The initial term for the majority of these leases is one year, with an option for early cancellation and an option to renew for subsequent one-month periods. These leases can be terminated by either party by providing notice to the other party of the intent to cancel or to not extend. Relatively short lease durations for these properties are intended to provide flexibility to the Company as changing operational needs and shifting opportunities often result in cancellation or non-renewal of these leases by the Company or the lessor. The minimum operating lease payable under these arrangements was approximately $214,000$64,200 as of December 31, 2020.2023.
The Company leases office and shop facilities to a related party. At December 31, 2020,2023, the cost and carrying amount of the facilities leased were approximately $13,738,000$13,738,000 and $12,402,000,$11,305,000, respectively. Future minimum lease receipts related to this lease at December 31, 20202023 were approximately $12,100.$32,100.
18. | FAIR VALUE OF FINANCIAL INSTRUMENTS |
The Company’s financial instruments consist of cash and cash equivalents, marketable equity securities, accounts receivable, trade accounts payable, and borrowings.
The Company follows the guidance for financial assets and liabilities measured on a recurring basis. The guidance defines fair value as the exchange price that would be received for an asset or paid to transfer a liability (an exit price) in the principal or most advantageous market for the asset or liability in an orderly transaction between market participants on the measurement date and also establishes a fair value hierarchy which requires an entity to maximize the use of observable inputs and minimize the use of unobservable inputs when measuring fair value.
The standard describes three levels of inputs that may be used to measure fair value:
Level 1: | Quoted market prices in active markets for identical assets or liabilities. | ||
Level 2: | Inputs other than Level 1 inputs that are either directly or indirectly observable such as quoted prices for similar assets or liabilities in active markets; quoted prices for identical or similar assets or liabilities in markets that are not active; inputs other than quoted prices that are observable; or other inputs not directly observable, but derived principally from, or corroborated by, observable market data. | ||
Level 3: | Unobservable inputs that are supported by little or no market activity. |
The Company utilizes the market approach to measure fair value for its financial assets and liabilities. The market approach uses prices and other relevant information generated by market transactions involving identical or comparable assets or liabilities.
At December 31, 20202023 and 2019,2022, the following items are measured at fair value on a recurring basis:
2020 | 2019 | |||||||||||||||||||||||||||||||
Total | Level 1 | Level 2 | Level 3 | Total | Level 1 | Level 2 | Level 3 | |||||||||||||||||||||||||
Marketable equity securities | $ | 27,9417,549 | $ | 27,941 | 0 | 0 | $ | 29,521 | $ | 29,521 | 0 | 0 | ||||||||||||||||||||
2023 | 2022 | |||||||||||||||||||||||||||||||
Total | Level 1 | Level 2 | Level 3 | Total | Level 1 | Level 2 | Level 3 | |||||||||||||||||||||||||
Marketable equity securities | $ | 43,203 | $ | 43,203 | - | - | $ | 41,728 | $ | 41,728 | - | - | ||||||||||||||||||||
During 20202023 and 2019,2022, there were no transfers of marketable securities between levels of fair value measurement.
The Company’s investments in marketable equity securities are recorded at fair value based on quoted market prices. The carrying value of cash and cash equivalents, accounts receivable, trade accounts payable, and accrued liabilities approximate fair value due to their short maturities.
The carrying amount for the line of credit approximates fair value because the line of credit interest rate is adjusted frequently.
For long-term debt other than the lines of credit, the fair values are estimated using discounted cash flow analyses, based on the Company’s current incremental borrowing rates for similar types of borrowing arrangements. The carrying values and estimated fair values of this other long-term debt at December 31, 20202023 and 20192022 are summarized as follows:
2020 | 2019 | |||||||||||||||
Carrying Value | Estimated Fair Value | Carrying Value | Estimated Fair Value | |||||||||||||
(in thousands) | ||||||||||||||||
Long-term debt | $ | 267,860 | $ | 268,582 | $ | 224,777 | $ | 228,449 | ||||||||
2023 | 2022 | |||||||||||||||
Carrying Value | Estimated Fair Value | Carrying Value | Estimated Fair Value | |||||||||||||
(in thousands) | ||||||||||||||||
Long-term debt | $ | 261,709 | $ | 251,352 | $ | 264,281 | $ | 253,762 | ||||||||
The Company has not elected the fair value option for any of our financial instruments.
19. | RELATED PARTY TRANSACTIONS |
In the normal course of business, transactions for transportation and repair services, equipment, property leases and other services are conducted between the Company and companies affiliated with our Chairman and controlling stockholder.stockholders. The Company recognized approximately $9,897,000, $2,691,000$8,321,000, $1,363,000 and $2,854,000$8,085,000 in operating revenue and approximately $6,791,000, $9,190,000$27,286,000, $21,438,000 and $9,859,000$11,103,000 in operating expenses in 2020,2023, 2019,2022, and 2018,2021, respectively.respectively from related party transactions.
The Company purchased physical damage, auto liability, general liability and workers’ compensation insurance through an unaffiliated insurance broker which was written by an insurance company affiliated with our Chairman and controlling stockholder. The premiums for physical damage coverage were approximately $0, $0 and $1,271,000 for 2020,2019, and 2018, respectively.stockholders. Premiums for auto liability coverage during 2020,2023, 2019,2022, and 20182021 were approximately $8,516,000, $10,345,000,$13,307,000, $11,437,000, and $10,987,000, respectively. Premiums for general liability coverage during 2020,2019, and 2018 were approximately $0, $0 and $24,000,$9,851,000, respectively. Premiums for workers’ compensation coverage during 2020,2023, 2019,2022, and 20182021 were approximately $299,000, $266,000$298,000, $338,000 and $301,000,$300,000, respectively.
Amounts owed to the Company by these affiliates were approximately $2,348,000$1,809,000 and $1,052,000$723,000 at December 31, 20202023 and 2019,2022, respectively. Of the accounts receivable at December 31, 20202023 and 2019,2022, approximately $2,236,000$1,418,000 and $1,052,000$382,000 represent freight transportation and approximately $112,000$391,000 and $0$341,000 represent revenue resulting from other services performed for related parties. Amounts payable to affiliates at December 31, 20202023 and 20192022 were approximately $1,864,000$1,101,000 and $961,000$1,290,000 respectively.
20. |
|
On June 14, 2022, subsidiaries of the Company, Met Express, Inc. and Costar Equipment, Inc. (collectively, the “Buyer”), entered into an Asset Purchase Agreement with Metropolitan Trucking, Inc., and related subsidiaries. Metropolitan Trucking, Inc. was a truckload carrier headquartered in Saddle Brook, New Jersey, providing asset-based dry van truckload transportation services, including local, regional, and dedicated services. The tables below present quarterlyacquisition has been determined to be a business combination.
Pursuant to the Asset Purchase Agreement, the Buyer acquired substantially all the assets and assumed certain specified liabilities of Metropolitan Trucking, Inc., and its related entities (the “Transaction”). The Buyer paid $79.9 million of total consideration, including cash and certain assumed indebtedness of Metropolitan Trucking, Inc., and its related entities. The Transaction closed on June 14, 2022, subject to working capital adjustments.
Total cash paid of $64.3 million was funded out of the Company’s available cash. The Transaction included the assumption of $12.6 million of indebtedness and $2.9 million of other current liabilities. The Asset Purchase Agreement contains customary representations, warranties, covenants, escrow, and indemnification provisions.
The results of the acquired business have been included in the consolidated financial informationstatements since the date of acquisition and represented 2.1% of consolidated total assets as of December 31, 2023 and represented 9.7% of revenues excluding fuel surcharge for the year ended 2020December 31, 2023, andrespectively. Acquisition related expenses of $0.4 million were included in the condensed consolidated statements of operations for the year ended 2019:December 31, 2022.
2020 | ||||||||||||||||
Three Months Ended | ||||||||||||||||
March 31 | June 30 | September 30 | December 31 | |||||||||||||
(in thousands, except per share data) | ||||||||||||||||
Operating revenues | $ | 129,155 | $ | 92,979 | $ | 121,942 | $ | 142,750 | ||||||||
Operating expenses and costs | 119,669 | 94,986 | 111,868 | 126,380 | ||||||||||||
Operating income (loss) | 9,486 | (2,007 | ) | 10,074 | 16,370 | |||||||||||
Non-operating (loss) income | (9,076 | ) | 2,961 | (94 | ) | 4,510 | ||||||||||
Interest expense | (2,212 | ) | (2,179 | ) | (2,211 | ) | (2,214 | ) | ||||||||
Income tax benefit (expense) | 498 | 402 | (1,769 | ) | (4,713 | ) | ||||||||||
Net (loss) income | $ | (1,304 | ) | $ | (823 | ) | $ | 6,000 | $ | 13,953 | ||||||
Net (loss) income per common share: | ||||||||||||||||
Basic | $ | (0.23 | ) | $ | (0.14 | ) | $ | 1.04 | $ | 2.43 | ||||||
Diluted | $ | (0.23 | ) | $ | (0.14 | ) | $ | 1.04 | $ | 2.43 | ||||||
Average common shares outstanding: | ||||||||||||||||
Basic | 5,746 | 5,766 | 5,763 | 5,734 | ||||||||||||
Diluted | 5,746 | 5,766 | 5,768 | 5,752 | ||||||||||||
The assets and liabilities associated with the acquisition were recorded at their fair values as of the acquisition date and the amounts are as follows:
2019 | ||||||||||||||||
Three Months Ended | ||||||||||||||||
March 31 | June 30 | September 30 | December 31 | |||||||||||||
(in thousands, except per share data) | ||||||||||||||||
Operating revenues | $ | 128,686 | $ | 133,000 | $ | 128,994 | $ | 123,497 | ||||||||
Operating expenses and costs | 118,999 | 119,789 | 121,461 | 141,381 | ||||||||||||
Operating income (loss) | 9,687 | 13,211 | 7,533 | (17,884 | ) | |||||||||||
Non-operating income (loss) | 3,472 | (197 | ) | 490 | 2,457 | |||||||||||
Interest expense | (2,040 | ) | (2,059 | ) | (2,178 | ) | (2,377 | ) | ||||||||
Income tax (expense) benefit | (2,818 | ) | (2,301 | ) | (1,264 | ) | 4,168 | |||||||||
Net income (loss) | $ | 8,301 | $ | 8,654 | $ | 4,581 | $ | (13,636 | ) | |||||||
Net income (loss) per common share: | ||||||||||||||||
Basic | $ | 1.40 | $ | 1.47 | $ | 0.80 | $ | (2.37 | ) | |||||||
Diluted | $ | 1.39 | $ | 1.45 | $ | 0.79 | $ | (2.37 | ) | |||||||
Average common shares outstanding: | ||||||||||||||||
Basic | 5,921 | 5,901 | 5,756 | 5,751 | ||||||||||||
Diluted | 5,985 | 5,949 | 5,799 | 5,751 | ||||||||||||
(in thousands) | ||||
Trade and other accounts receivable | $ | 10,821 | ||
Other current assets | 316 | |||
Property and equipment | 68,722 | |||
Total assets | 79,859 | |||
Accounts payable | (2,915 | ) | ||
Long-term debt | (12,627 | ) | ||
Total cash paid | $ | 64,317 | ||
Item 9. Changes in and Disagreements with Accountants on Accounting and Financial Disclosure.
None.
Item 9A. Controls and Procedures.
Evaluation of Disclosure Controls and Procedures
Our management, with the participation of our chief executive officer and chief financial officer, evaluated the effectiveness of our disclosure controls and procedures pursuant to Rule 13a-15 under the Securities Exchange Act of 1934, as amended (the “Exchange Act”). In designing and evaluating the disclosure controls and procedures, management recognizes that any controls and procedures, no matter how well designed and operated, can provide only reasonable assurance of achieving the desired control objectives. In addition, the design of disclosure controls and procedures must reflect the fact that there are resource constraints and that management is required to apply its judgment in evaluating the benefits of possible controls and procedures relative to their costs.
Based on management’s evaluation, our chief executive officer and chief financial officer concluded that, as of December 31, 2020,2023, our disclosure controls and procedures are designed at a reasonable assurance level and are effective to provide reasonable assurance that information we are required to disclose in reports that we file or submit under the Exchange Act is recorded, processed, summarized and reported within the time periods specified in Securities and Exchange Commission rules and forms, and that such information is accumulated and communicated to our management, including our chief executive officer and chief financial officer, as appropriate, to allow timely decisions regarding required disclosure.
Changes in Internal Control Over Financial Reporting
We regularly review our system of internal control over financial reporting and make changes to our processes and systems to improve controls and increase efficiency, while ensuring that we maintain an effective internal control environment. Changes may include such activities as implementing new, more efficient systems, consolidating activities, and migrating processes.
There were no changes in our internal control over financial reporting that occurred during the last quarter of the period covered by this Annual Report on Form 10-K that have materially affected, or are reasonably likely to materially affect, our internal control over financial reporting.
Management’s Report on Internal Control Over Financial Reporting
Our management is responsible for establishing and maintaining adequate internal control over financial reporting, as defined in Exchange Act Rule 13a-15(f). Management conducted an evaluation of the effectiveness of our internal control over financial reporting based on the framework in the 2013 Internal Control—Integrated Framework issued by the Committee of Sponsoring Organizations of the Treadway Commission (“COSO”). Based on this evaluation, management concluded that our internal control over financial reporting was effective as of December 31, 2020. Management reviewed the results of its assessment with our Audit Committee. The effectiveness of our2023.
A company’s internal control over financial reporting is a process designed to provide reasonable assurance regarding the reliability of financial reporting for external purposes in accordance with generally accepted accounting principles. A company’s internal control over financial reporting includes those policies and procedures that (1) pertain to the maintenance of records that, in reasonable detail, accurately and fairly reflect the transactions and dispositions of the assets of the company; (2) provide reasonable assurance that transactions are recorded as necessary to permit preparation of December 31, 2020 has been audited by Grant Thornton LLP, an independent registered publicfinancial statements in accordance with generally accepted accounting firm, as statedprinciples, and that receipts and expenditures of the company are being made only in accordance with authorizations of management and directors of the company; and (3) provide reasonable assurance regarding prevention or timely detection of unauthorized acquisition, use, or disposition of the company’s assets that could have a material effect on the financial statements.
Because of its report which is included below.inherent limitations, internal control over financial reporting may not prevent or detect misstatements. Also, projections of any evaluation of effectiveness to future periods are subject to the risk that controls may become inadequate because of changes in conditions, or that the degree of compliance with the policies or procedures may deteriorate.
REPORT OF INDEPENDENT REGISTERED PUBLIC ACCOUNTING FIRM
Board of Directors and Stockholders
P.A.M. Transportation Services, Inc.
Opinion on internal control over financial reporting
We have audited the internal control over financial reporting of P.A.M. Transportation Services, Inc. (a Delaware corporation) and subsidiaries (the “Company”) as of December 31, 2020,2023, based on criteria established in the 2013 Internal Control—Control—Integrated Framework issued by the Committee of Sponsoring Organizations of the Treadway Commission (“COSO”). In our opinion, the Company maintained, in all material respects, effective internal control over financial reporting as of December 31, 2020,2023, based on criteria established in the 2013 Internal Control—Control—Integrated Framework issued by COSO.
We also have audited, in accordance with the standards of the Public Company Accounting Oversight Board (United States) (“PCAOB”), the consolidated financial statements of the Company as of and for the year ended December 31, 2020,2023, and our report dated March 5, 202113, 2024, expressed an unqualified opinion on those financial statements.
Basis for opinion
The Company’s management is responsible for maintaining effective internal control over financial reporting and for its assessment of the effectiveness of internal control over financial reporting, included in the accompanying Management’sManagement’s Report on Internal Control Over Financial Reporting. Our responsibility is to express an opinion on the Company’s internal control over financial reporting based on our audit. We are a public accounting firm registered with the PCAOB and are required to be independent with respect to the Company in accordance with the U.S. federal securities laws and the applicable rules and regulations of the Securities and Exchange Commission and the PCAOB.
We conducted our audit in accordance with the standards of the PCAOB. Those standards require that we plan and perform the audit to obtain reasonable assurance about whether effective internal control over financial reporting was maintained in all material respects. Our audit included obtaining an understanding of internal control over financial reporting, assessing the risk that a material weakness exists, testing and evaluating the design and operating effectiveness of internal control based on the assessed risk, and performing such other procedures as we considered necessary in the circumstances. We believe that our audit provides a reasonable basis for our opinion.
Definition and limitations of internal control over financial reporting
A company’s internal control over financial reporting is a process designed to provide reasonable assurance regarding the reliability of financial reporting and the preparation of financial statements for external purposes in accordance with generally accepted accounting principles. A company’s internal control over financial reporting includes those policies and procedures that (1) pertain to the maintenance of records that, in reasonable detail, accurately and fairly reflect the transactions and dispositions of the assets of the company; (2) provide reasonable assurance that transactions are recorded as necessary to permit preparation of financial statements in accordance with generally accepted accounting principles, and that receipts and expenditures of the company are being made only in accordance with authorizations of management and directors of the company; and (3) provide reasonable assurance regarding prevention or timely detection of unauthorized acquisition, use, or disposition of the company’s assets that could have a material effect on the financial statements.
Because of its inherent limitations, internal control over financial reporting may not prevent or detect misstatements. Also, projections of any evaluation of effectiveness to future periods are subject to the risk that controls may become inadequate because of changes in conditions, or that the degree of compliance with the policies or procedures may deteriorate.
/s/S/ GRANT THORNTON LLP
Tulsa, Oklahoma
March 5, 202113, 2024
None.Not Applicable
Item 9C. Disclosure Regarding Foreign Jurisdictions that Prevent Inspections.
Not Applicable
Portions of the information required by Part III of Form 10-K are, pursuant to General Instruction G-(3) of Form 10-K, incorporated by reference from our definitive proxy statement towhich will be filed with the Securities and Exchange Commission pursuant to Regulation 14A for our Annual Meeting of Stockholders to be held on May 5, 2021. We will, within 120 days of the end of our fiscal year file with the Securities and Exchange Commission a definitive proxy statement pursuant to Regulation 14A.2023.
Item 10. Directors, Executive Officers and Corporate Governance.
The information presented under the captions “Election of Directors,” “Executive Compensation,” “Delinquent Section 16(a) Reports,” “Corporate Governance – Code of Ethics,” “Corporate Governance – Director Nominating Process” and “Corporate Governance – Board Committees,” in the proxy statement is incorporated herein by reference.
Item 11. Executive Compensation.
The information presented under the captions “Executive Compensation,” “Corporate Governance – Compensation Committee Interlocks and Insider Participation,” and “Compensation Committee Report” in the proxy statement is incorporated herein by reference.
Item 12. Security Ownership of Certain Beneficial Owners and Management and Related Stockholder Matters.
The information presented under the caption “Security Ownership of Certain Beneficial Owners and Management” in the proxy statement is incorporated herein by reference.
Equity Compensation Plan Information
The following table summarizes, as of December 31, 2020,2023, information about compensation plans under which equity securities of the Company are authorized for issuance:
Plan Category | Number of securities to be issued upon exercise of outstanding options, warrants and rights(1) | Weighted-average exercise price of outstanding options, warrants and rights(1) | Number of securities remaining available for future issuance under equity compensation plans | Number of securities to be issued upon exercise of outstanding options, warrants and rights(1) (a) | Weighted-average exercise price of outstanding options, warrants and rights(1) (b) | Number of securities remaining available for future issuance under equity compensation plans (excluding securities reflected in column (a) (c) | ||||||||||||||||||
Equity Compensation Plans approved by Security Holders | 61,035 | - | 361,516 | 198,859 | - | 1,401,821 | ||||||||||||||||||
Equity Compensation Plans not approved by Security Holders | - | - | - | - | - | - | ||||||||||||||||||
Total | 61,035 | - | 361,516 | 198,859 | - | 1,600,680 | ||||||||||||||||||
|
|
(1) Consists of unvested shares of restricted stock, which do not require the payment of an exercise price.
Item 13. Certain Relationships and Related Transactions, and Director Independence.
The information presented under the captions “Transactions with Related Persons” and “Corporate Governance – Director Independence” in the proxy statement is incorporated here by reference.
Item 14. Principal Accounting Fees and Services.
The information presented under the caption “Independent Public Accountants – Principal Accountant Fees and Services” in the proxy statement is incorporated here by reference.
Item 15. Exhibits, Financial Statement Schedules.
(a) | Financial Statements and Schedules. |
(1) | Financial Statements: See Part II, Item 8 hereof. | |
|
Report of Independent Registered Public Accounting Firm - Grant Thornton LLP (PCAOB ID Number 248)
Consolidated Balance Sheets - December 31, 2023 and 2022
Consolidated Statements of Operations - Years ended December 31, 2023, 2022 and 2021
Consolidated Statements of Stockholders’ Equity - Years ended December 31, 2023, 2022 and 2021
Consolidated Statements of Cash Flows - Years ended December 31, 2023, 2022 and 2021
Notes to Consolidated Financial Statements
(2) | Financial Statement Schedules. |
All schedules for which provision is made in the applicable accounting regulations of the SEC are omitted as the required information is inapplicable, or because the information is presented in the consolidated financial statements or related notes.
(3) | Exhibits. |
Exhibit # | Description of Exhibit | Description of Exhibit | ||
2.1 | ||||
3.1 | ||||
3.2 | ||||
3.3 | ||||
3.4 | ||||
3.5 | ||||
4.1 | Specimen Stock Certificate (incorporated by reference to Exhibit 4.1 of the Company’s Registration Statement on Form S-1 under the Securities Act of 1933, as filed with the Securities and Exchange Commission on July 30, 1986, Registration No. 33-7618, as amended on August 8, 1986, September 3, 1986 and September 10, 1986) | |||
4.2 | ||||
10.1 | (1) | (1) | ||
10.2 | (1) | (1) | ||
10.3 | (1) | (1) | ||
10.4 | (1) | |||
10.5 | (1) | |||
10.6 | (1) | |||
10.7 | ||||
10.8 | ||||
21.1 | ||||
10.9 | ||||
23.1 | ||||
31.1 | ||||
10.10 | ||||
10.11 | ||
21.1 | ||
23.1 | ||
31.1 | ||
31.2 | ||
32.1 | Section 1350 Certifications of Chief Executive Officer and Chief Financial Officer | |
97.1 | ||
101.INS | Inline XBRL Instance Document | |
101.SCH | Inline XBRL Taxonomy Extension Schema Document | |
101.CAL | Inline XBRL Taxonomy Extension Calculation Linkbase Document | |
101.DEF | Inline XBRL Taxonomy Extension Definition Linkbase Document | |
101.LAB | Inline XBRL Taxonomy Extension Label Linkbase Document | |
101.PRE | Inline XBRL Taxonomy Extension Presentation Linkbase Document | |
104 | Cover Page Interactive Data File (formatted as Inline XBRL and contained in Exhibit 101) | |
* The disclosures schedules and exhibits in the Asset Purchase Agreement have been omitted pursuant to Item 605(a)(5) of Regulation S-K. The Company hereby agrees to furnish supplementally a copy of any omitted disclosure schedule or schedule to the SEC upon request. | ||
(1) Management contract or compensatory plan or arrangement. | ||
Pursuant to the requirements of Section 13 or 15(d) of the Securities Exchange Act of 1934, the registrant has duly caused this report to be signed on its behalf by the undersigned, thereunto duly authorized.
P.A.M. TRANSPORTATION SERVICES, INC. | |||||
Dated: March | By: | /s/ Joseph. A. Vitiritto | |||
JOSEPH A. VITIRITTO | |||||
President and Chief Executive Officer | |||||
(principal executive officer) | |||||
Pursuant to the requirements of the Securities Exchange Act of 1934, this report has been signed below by the following persons on behalf of the registrant and in the capacities and on the dates indicated. | |||||
Dated: March | By: | /s/ Michael D. Bishop | |||
MICHAEL D. BISHOP, Director | |||||
Dated: March | By: | /s/ Frederick P. Calderone | |||
FREDERICK P. CALDERONE, Director | |||||
Dated: March | By: | /s/ W. Scott Davis | |||
W. SCOTT DAVIS, Director | |||||
Dated: March | By: | /s/ Edwin J. Lukas | |||
EDWIN J. LUKAS, Director | |||||
Dated: March | By: | /s/ Franklin H. McLarty | |||
FRANKLIN H. MCLARTY, Director | |||||
Dated: March | By: | /s/ H. Pete Montaño | |||
H. PETE MONTAÑO, Director | |||||
Dated: March | By: | /s/ Matthew J. Moroun | |||
MATTHEW J. MOROUN, Director | |||||
Dated: March | By: | /s/ Matthew T. Moroun | |||
MATTHEW T. MOROUN, Director and Chairman of the Board | |||||
Dated: March | By: | /s/ Joseph. A. Vitiritto | |||
JOSEPH A. VITIRITTO | |||||
President and Chief Executive Officer | |||||
(principal executive officer) | |||||
Dated: March | By: | /s/ | |||
| |||||
Vice President-Finance, Chief Financial Officer | |||||
| |||||
(principal financial and accounting officer) | |||||