UNITED STATES
SECURITIES AND EXCHANGE COMMISSION
☑ANNUAL REPORT PURSUANT TO SECTION 13 OR 15(d) OF THE SECURITIES EXCHANGE ACT OF 1934 For the year ended December 31,
2021☐ 2023
oTRANSITION REPORT PURSUANT TO SECTION 13 OR 15(d) OF THE SECURITIES EXCHANGE ACT OF 1934 For the transition period from to
Commission File Number 001-36362
(Exact name of registrant as specified in its charter)
| | | | | |
| Delaware | 94-3076866 |
(State or other jurisdiction of
incorporation or organization)
| (IRS Employer
Identification No.)
|
3303
MONTE VILLA PARKWAY, SUITEMonte Villa Parkway, Suite 310,
BOTHELL,Bothell, Washington, 98021
(Address of registrant’s principal executive offices, Zip Code) (Telephone number, including area code)
Securities registered pursuant to Section12(b) of the Act: | | | | | | | | |
| Title of each class | Trading symbol ($) | Name of exchange on which registered |
Common Stock,stock, par value $0.001 per share | BLFS | The NASDAQ CapitalStock Market, LLC |
Securities registered pursuant to Section 12(g) of the Act: None
Indicate by check mark whether the registrant is a well-known seasoned issuer, as defined in Rule 405 of the Securities Act. Yes ☑ No ☐o Indicate by check mark whether the registrant is not required to file reports pursuant to Section 13 or Section 15(d) of the Act. Yes ☐o No ☑ Indicate by check mark whether the registrant (1) has filed all reports required to be filed by Section 13 or 15(d) of the Securities Exchange Act of 1934 during the preceding 12 months (or for such shorter period that the registrant was required to file such reports), and (2) has been subject to such filing requirements for the past 90 days. Yes ☑ No ☐o Indicate by check mark whether the registrant has submitted electronically every Interactive Data File required to be submitted pursuant to Rule 405 of Regulation S-T (S232.405 of this chapter) during the preceding 12 months (or for such shorter period that the Registrant was required to submit such said files). Yes ☑ No ☐o Indicate by check mark whether the registrant is a large accelerated filer, an accelerated filer, a non-accelerated filer, a smaller reporting company or an emerging growth company. See the definitions of “large accelerated filer,” “accelerated filer,” “smaller reporting company,” and “emerging growth company” in Rule 12b-2 of the Exchange Act.
Large accelerated filer ☑ Accelerated filer ☐o Non-accelerated filer ☐o Smaller reporting company ☑o Emerging Growth Company ☐o If an emerging growth company, indicate by check mark if the registrant has elected not to use the extended transition period for complying with any new or revised financial accounting standards provided pursuant to Section 13(a) of the Exchange Act. ☐o Indicate by check mark whether the registrant has filed a report on and attestation to its management’s assessment of the effectiveness of its internal control over financial reporting under Section 404(b) of the Sarbanes-Oxley Act (15 U.S.C. 7262(b)) by the registered public accounting firm that prepared or issued its audit report. ☑ If securities are registered pursuant to Section 12(b) of the Act, indicate by check mark whether the financial statements of the registrant included in the filing reflect the correction of an error to previously issued financial statements. ☐
Indicate by check mark whether any of those error corrections are restatements that required a recovery analysis of incentive-based compensation received by any of the registrant’s executive officers during the relevant recovery period pursuant to §240.10D-1(b). o
Indicate by check mark whether the registrant is a shell company (as defined in Rule 12b-2 of the Act). Yes ☐o No ☑ As of the registrant’s most recently completed second fiscal quarter, the aggregate market value of common equity (based on closing price on June 30,
20212023 of
$44.51$22.10 per share) held by non-affiliates was approximately
$1,433,451,805.$774 million.
As of
March 16, 2022, 42,094,963February 22, 2024, 45.3 million shares of the registrant’s common stock were outstanding.
FORWARD-LOOKING STATEMENTS
This Annual Report on Form 10-K (“Form 10-K” or “Annual Report”) contains forward-looking statements which are made pursuant to the safe harbor provisions of Section 27A of the Securities Act of 1933, as amended, and Section 21E of the Securities Exchange Act of 1934, as amended (the “Exchange Act”). The forward-looking statements in this Form 10-K do not constitute guarantees of future performance, and actual results could differ materially from those contained in the forward-looking statements. These statements are based on current expectations of future events. Such statements include, but are not limited to, statements about our products,
including our newly acquired products, customers, regulatory approvals, the potential utility of and market for our products and services, our ability to implement our business strategy and anticipated business and operations
in particular following our acquisitions in 2021, 2020, and 2019,(including with respect to acquired businesses), future financial and operational performance, our anticipated future growth strategy,
including the
acquisition ofexpected benefits and other
synergistic cellstatements relating to our divestitures and
gene therapy manufacturing tools and services or technologies or other companies or technologies,acquisitions, capital requirements, intellectual property, suppliers, joint venture partners, future financial and operating results, the impact of
macroeconomic developments (including the
COVID-19ongoing effects of the coronavirus (“COVID-19”) pandemic, plans, objectives, expectations and intentions, revenues, costs and expenses, interest rates, outcome of contingencies, business strategies, regulatory filings and requirements, the estimated potential size of markets,
capital requirements, the terms of any capital financing agreements and other statements that are not historical facts. You can find many of these statements by looking for words like “believes”, “expects”, “anticipates”, “estimates”, “may”, “should”, “will”, “could”, “plan”, “intend”, or similar expressions in this Form 10-K. We intend that such forward-looking statements be subject to the safe harbors
created thereby.for such statements.
These forward-looking statements are based on the current beliefs and expectations of our management and are subject to significant risks and uncertainties. If underlying assumptions prove inaccurate or unknown risks or uncertainties materialize, actual results may differ materially from current expectations and projections. Factors that might cause such a difference include those discussed under “Risk Factors”, as well as those discussed elsewhere in the Form 10-K.
You are cautioned not to place undue reliance on these forward-looking statements, which speak only as of the date of this Form 10-K or, in the case of documents referred to or incorporated by reference, the date of those documents.
All subsequent written or oral forward-looking statements attributable to us or any person acting on our behalf are expressly qualified in their entirety by the cautionary statements contained or referred to in this section. We do not undertake any obligation to release publicly any revisions to these forward-looking statements to reflect events or circumstances after the date of this Form 10-K or to reflect the occurrence of unanticipated events, except as may be required under applicable
United States (“U.S.
”) securities law. If we do update one or more forward-looking statements, no inference should be drawn that we will make additional updates with respect to those or other forward-looking statements.
References throughout this Form 10-K to “BioLife Solutions, Inc.”, “BioLife”, “we”, “us”, “our”, or the “Company” refer to BioLife Solutions, Inc. and its subsidiaries, taken as a whole, unless the context otherwise indicates.
ITEM 1. BUSINESS
The following discussion of our business contains forward-looking statements that involve risks and uncertainties (see the section entitled “Forward-Looking Statements” herein). Our actual results could differ materially from those anticipated in these forward-looking statements as a result of certain factors, including those factors set forth under “Risk Factors” and elsewhere in this Form 10-K. We
develop, manufacture,are a life sciences company that develops, manufactures, and
marketmarkets bioproduction tools and services
which are designed to
improve quality and de-risk biologic manufacturing, storage, distribution, and transportation in the cell and gene therapy (“CGT”) industry and broader biopharma
market, which are designed to improve quality and de-risk biologic manufacturing, storage, and distribution.markets. Our products are used in basic and applied research and commercial manufacturing of biologic-based therapies. Customers use our products to maintain the health and function of biologic material during sourcing, manufacturing, storage, and distribution.
We currently operate as one bioproduction tools and services business which supports several steps in the biologic material manufacturing and delivery process. We have a diversified portfolio of tools and services that
focusfocuses on biopreservation, cell processing, frozen biologic storage products and services, cold-chain
transportation,logistics, and thawing of biologic materials. We have in-house expertise in cryobiology and
the broader CGT workflow, and continue to
capitalize onevaluate opportunities to maximize the value of our product
platformplatforms for our extensive customer base through
both organic growth innovations,
partnerships, and acquisitions.
COVID-19 Considerations
In March 2020, the World Health Organization declared the COVID-19 outbreak to be a pandemic. In the second quarter of 2021, we believe our quarterly revenues were affected by COVID-19. Sales of portable freezers were significantly higher in the second quarter than the third and fourth quarters. The weight of these units and their compatibility with prevailing global electrical outlets attracted governments, scholarly institutions, and others to choose them for the distribution of drugs and drug materials in the pandemic. As the pandemic continues, customers who have secured enough freezers to achieve their objectives are tapering purchases with the intent to maintain their existing fleet. In the third and fourth quarters of 2021, our freezer and thaw systems product line experienced supply chain disruptions related to sheet metal and electronic components that incorporate semiconductor chips that led to increased supplier pricing and delays in production. We believe that the supply chain risks that were present in these quarters have been significantly mitigated through the diversification of sheet metal suppliers and strategic agreements with electronic component suppliers. However, we cannot provide any assurance that a continued or prolonged global pandemic will not have additional negative impacts on our manufacturing and shipping processes or our product costs. The extent to which the COVID-19 pandemic affects our future financial results and operations will depend on future developments which are highly uncertain and cannot be predicted, including the recurrence, severity and/or duration of the ongoing pandemic, and current or future domestic and international actions to contain and treat COVID-19.
We are following public and private sector policies and initiatives to reduce the transmission of COVID-19, such as the imposition of travel restrictions and the promotion of social distancing and work-from-home arrangements. We are taking a variety of measures to ensure the availability and functioning of our critical infrastructure, to promote the safety and security of our employees and to support the communities in which we operate. These measures include increasing our raw materials, manufacturing safety stock inventory for our biopreservation media and expanding availability of our biological and pharmaceutical storage, requiring remote working arrangements for employees who are not integral to physically making and shipping our products or who do not need specialized equipment to perform their work, restricting on-site visits by non-employees and implementing social distancing protocols, and investing in personal protective equipment. Beginning April 2, 2020, BioLife became actively engaged in managing the company COVID-19 response and protocols in accordance with federal, state and local regulations. BioLife has mandated mask wearing for all team members on-site throughout the pandemic per the guidelines and regulations in place. COVID-19 response is actively managed through daily reporting, contact tracing and quarantine guidelines as published by the CDC and state health departments in order to maintain safe working conditions. As a part of our COVID-19 response, on-site visitors have been limited to essential visitors only in order to reduce risk of transmission. Additionally, throughout the pandemic, BioLife has encouraged positions not essential to being on-site to work remotely in order to further reduce transmission rates and potential contact.
For further discussion of the risks relating to COVID-19, see “Our financial condition and results of operations may be adversely affected by the COVID-19 pandemic” in Item 1A. “Risk Factors”, below.
Our products
Our bioproduction tools and services are comprised of three revenue lines that contain seven main offerings:
| ●
| Cell processing
|
| | ○
| Biopreservation media
|
| | ○
| Human platelet lysate media (“hPL”), cryogenic vials, and automated cell-processing fill machines
|
| ●
| Freezers and thaw systems
|
| | ○
| Ultra-low temperature freezers
|
| | ○ | Cryogenic freezers and accessories |
| | ○
| Automated thawing devices
|
| ●
| Storage and cold chain services
|
| | ○
| Biological and pharmaceutical material storage
|
| | ○
| Cloud connected “smart” shipping containers
|
◦Human platelet lysate media (“hPL”), cryogenic vials, and automated cell-processing fill machines
•Freezers and thaw systems
◦Ultra-low temperature freezers
◦Cryogenic freezers and accessories
◦Automated thawing devices
•Biostorage services
◦Biological and pharmaceutical material storage and transport
◦Cloud-connected “smart” shipping containers
Subsequent to the second quarter of 2023, we began to seek divestment of our Global Cooling, Inc. (“GCI”) and Custom Biogenic Systems (“CBS”) freezer product lines (the “Freezer Business”) from our current product portfolio. For additional information regarding our ongoing initiative to divest the Freezer Business, see “Item 1A. Risk Factors” of this Annual Report for additional details.
Cell processing
Biopreservation media
Our proprietary biopreservation media products, HypoThermosol®HypoThermosol® FRS and CryoStor®,CryoStor® Freeze Media, are formulated to mitigate preservation-induced, delayed-onset cell damage and death which result when cells and tissues are subjected to reduced temperatures. Our technology can provide our CGT customers with significant shelf lifeshelf-life extension of biologic source material and final cell products, and can also greatly improve post-preservation cell and tissue viability and function. Our biopreservation media isare serum-free, protein-free, fully defined, and manufactured under current Good Manufacturing Practices (cGMP)("cGMP"). We strive to source wherever possible the highest available grade, multi-compendiumMulti-compendial raw materials. We estimateOur US FDA Type II Master File applicable to our mediabiopreservation products havehas been incorporatedcross referenced over 690 times by our customers, and we believe our cell processing products are utilized in more than 530 customerseveral hundred active clinical applications, including numerous chimeric antigen receptor (CAR) T cell and other cell types. trials worldwide.
Stability (i.e. shelf-life) and functional recovery are crucial aspects of academic research and clinical practice in the biopreservation of biologic-based source material, intermediate derivatives, and isolated/derived/expanded cellular products and therapies. Limited stability is especially critical in the CGT field, where harvested cells and tissues will lose viability over time if not maintained appropriately at normothermic body temperature (37ºC) or stored in a hypothermic or cryogenic state in an effective preservation medium.
Chilling (hypothermia) is used to reduce metabolism and delay degradation of harvested cells and tissues. However, subjecting biologic material to hypothermic or cryogenic environments inducesand subsequently rewarming them may also induce damaging molecular stress and structural changes. Although cooling successfully reduces metabolism (i.e., lowers demand for energy), various levels of cellular damage and death occur when using suboptimal methods. Biopreservation media can mitigate the damage from exposure to hypothermic or cryogenic temperatures and subsequent rewarming.
Traditional biopreservation media range from simple “balanced salt” (electrolyte) formulations to complex mixtures of electrolytes, energy substrates such as sugars, osmotic buffering agents, and antibiotics. The
resulting limited stability
which results from the use of these traditional biopreservation media formulations is a significant shortcoming that our optimized proprietary products address with great success.
Our scientific research activities over the last 20+ years enabled a detailed understanding of the molecular basis for the hypothermic and cryogenic (low-temperature induced) damage/destruction of cells through apoptosis and necrosis. This research led directly to the development of our
HypoThermosol®HypoThermosol FRS and
CryoStor®CryoStor technologies. Our proprietary biopreservation media products are specifically formulated to:
| ●
| Minimize cell and tissue swelling
|
| ●
| Reduce free radical levels upon formation
|
| ●
| Maintain appropriate low temperature ionic balances
|
| ●
| Provide regenerative, high-energy substrates to stimulate recovery upon warming
|
| ●
| Avoid the creation of an acidic state (acidosis)
|
| ●
| Inhibit the onset of apoptosis and necrosis
|
•Minimize cell and tissue swelling
•Reduce free radical levels upon formation
•Maintain appropriate low temperature ionic balances
•Provide regenerative, high-energy substrates to stimulate recovery upon warming
•Avoid the creation of an acidic state (acidosis)
•Inhibit the onset of apoptosis and necrosis
A key feature of our biopreservation media products is their “fully-defined” profile. All of our cGMP products are serum-free, protein-free and are formulated and filled using aseptic processing. We strive to use USP/
MulticompendialMulti-compendial grade or the highest quality available synthetic components. All of these features benefit prospective customers by facilitating the qualification process required to incorporate our products into their regulatory filings.
Competing biopreservation media products are often formulated with isotonic media cocktails, animal serum, and potentially a single sugar or human protein. A key differentiator of our proprietary HypoThermosol FRS and CryoStor formulations is the engineered optimization of the key ionic component concentrations for low-temperature environments. This is in contrast to media optimized for normothermic body temperature (around 37°C), as found in culture media or saline-based isotonic formulas. While competing cryopreservation freeze media is often comprised of a single permeating cryoprotectant such as dimethyl sulfoxide (“DMSO”), our CryoStor formulations incorporate multiple permeating and non-permeating cryoprotectant agents, which allows for multiple mechanisms of protection and reduces the dependence on a single cryoprotectant. We believe that our products offer significant advantages over in-house ("home brew") formulations or commercial “generic” biopreservation media. These advantages include time savings, more consistent and higher quality of components, more rigorous quality control release testing, cost effectiveness, and improved preservation efficacy.
The results of independent testing demonstrate that our biopreservation media products significantly extend shelf-life and improve cell and tissue post-thaw viability and function. Our products have demonstrated improved biopreservation outcomes, including greatly extended shelf-life and post-thaw viability
and yield across a broad array of cell and tissue types.
Competing biopreservation media products are often formulated with simple isotonic media cocktails, animal serum, potentially a single sugar or human protein. A key differentiator of our proprietary HypoThermosol FRS formulation is the engineered optimization of the key ionic component concentrations for low temperature environments, as opposed to normothermic body temperature around 37°C, as found in culture media or saline-based isotonic formulas. Competing cryopreservation freeze media is often comprised of a single permeating cryoprotectant such as dimethyl sulfoxide (“DMSO”). Our CryoStor formulations incorporate multiple permeating and non-permeating cryoprotectant agents which allow for multiple mechanisms of protection and reduces the dependence on a single cryoprotectant. We believe that our products offer significant advantages over in-house formulations, or commercial “generic” preservation media, including, time savings, improved quality of components, more rigorous quality control release testing, cost effectiveness, and improved preservation efficacy.
We estimate that annual revenue from each customer commercial application in which our products are used could range from $500,000$0.5 million to $2.0 million if such application is approved and our customer commences large scale commercial manufacturing of the biologic-based therapy.
Human platelet lysate media, cryogenic vials and automated cell-processing fill machines
In September 2021, we acquired Sexton Biotechnologies, Inc. (“Sexton”), a producer of bioproduction tools. Sexton's bioproduction tools portfolio includes human platelet lysates for cell expansion, reducingwhich reduces risk and improving improves
downstream performance over fetal bovine serum, human serum, and other chemically defined media, CellSeal®CellSeal® closed system vials that are purpose-built rigid containers used in CGT that can be filled manually or with high throughput systems, and automated cell processing machines that bring multiple processes traditionally performed by manual techniques under a higher level of control to protect therapies from loss or contamination. For our Sexton vials and media, we estimate that annual revenue from each customer commercial application in which these products are used could also range from $0.5 million to $2.0 million, if such application is approved and our customer commences large scale commercial manufacturing of the biologic-based therapy.
Biostorage services
Biological and pharmaceutical storage and transport
We are a premier provider of biological and pharmaceutical storage and cold chain logistics. These services ensure that materials are kept at controlled, target temperatures from the moment they leave the customer’s premises to their ultimate return. Our state-of-the-art monitoring systems allow customers real time tracking of the storage temperatures of their materials throughout the logistics process.
We operate five storage facilities in the USA and one facility in the Netherlands.
Cloud connected “smart” shipping containers
We are a leading developer and supplier of next generation cold chain management tools for cell and gene therapies. Our cloud-connected shipping containers and evo.is cloud app allows biologic products to be traced and tracked in real time. Our evo platform consists of rentable cloud-connected shippers that include technologies enabling tracking software to provide customizable, real-time information on geolocation, payload temperature, ambient temperature, tilt of shipper, humidity, altitude, and alerts when a shipper has been opened. The evo Dry Vapor Shipper (“DVS”) is specifically marketed for use with cell and gene therapies. The evo DVS has several design improvements over traditional competing shipping containers, providing benefits such as extended thermal performance, reduced liquid nitrogen recharge time, improved payload extractors, and the ability to maintain temperature for longer periods if the shipper is tilted on its side.
We partner with couriers with established logistic channels and distribution centers. This strategy greatly reduces the time and resource requirements associated with establishing our own logistics services, such as acquiring and maintaining fleets of delivery vehicles and building specialized facilities around the world. Partnerships with multiple white glove couriers allow us to scale our sales and marketing efforts by leveraging couriers' existing channel relationships, as well as the ongoing efforts of their sales and service teams. Courier partners provide promotional efforts by marketing our evo platform to their existing cell and gene therapy customers as a cost-effective and innovative solution.
Freezers and thaw systems
Ultra-low temperature freezers
In May 2021, we acquired Global Cooling, Inc. (“Global Cooling”), a manufacturer
Our portfolio of
class defining ultra-low temperature
freezers. Global Cooling carries a portfolio of freezers
that range in size from portable units to stationary upright freezers,
to accommodateaccommodating a wide variety of use cases. Users can configure these freezers to achieve temperatures between -20°C and -86°C. The portfolio was designed to be environmentally friendly and energy efficient, using as little as 2.8 kWh/day at temperatures of -80°C. The freezers do not use compressor-based or cascade refrigeration systems. Instead, they use patented free-piston Stirling engine technology that uses fewer moving parts.
Cryogenic freezers and accessories
In November 2019, we acquired Custom Biogenic Systems, Inc. (“CBS”) a global leader in the
Our line of cryogenic freezers offer leading design and manufacture of state-of-the-art liquid nitrogen laboratory freezers, cryogenic equipment and accessories.
CBS’sOur Isothermal LN2 freezers are constructed with a patented system which stores liquid nitrogen in a jacketed space in the walls of the freezer. This dry storage method eliminates liquid nitrogen contact with stored specimens,
reducesreducing the risk of cross-contamination and
providesproviding increased user safety in a laboratory
setting.setting by limiting liquid nitrogen contact injuries. To accommodate customer requirements, we offer customizable features, including wide bodied and extended
height. CBS’s high capacityheight models. Our high-capacity controlled rate freezers (“HCFR”) are designed for large volume storage with customizable freezing programs and the ability to monitor conditions in real time.
To accompany the offerings of cryogenic freezer equipment, we supply equipment for storing critically important biological materials. This storage equipment includes upright freezer racks, chest freezer racks, liquid nitrogen freezer racks, canisters/cassettes and frames, as well as laboratory boxes and dividers. Due to our onsite design and manufacturing
capability,capabilities, racks and canisters can be customized to address customers’ varying requirements.
In order to provide customers with a proactive approach to safety and monitoring of equipment containing liquefied gas, CBS offers VersalertTM, a patented wireless remote asset monitoring system that can monitor and record temperatures. Versalert has an intelligent mesh network system that enables customers to view current equipment conditions and receive alarm notification on smartphones, tablets or personal computers and maintain permanent electronic records for regulatory compliance and legal verification.
Automated thawing devices
In April 2019, we acquired Astero Bio Corporation (“Astero”), a provider of automated thawing devices.
The ThawSTAR®ThawSTAR® line includes automated vial and cryobag thawing products that control the heattemperature and timing of the thawing process of biologic material. Our customizable, automated, water-free thawing products use algorithmic programmed heating plates to consistently bring biologic material from a frozen state to a liquid state in a controlled and consistent manner. This helpsmanner, helping reduce damage during the temperature transition. Thetransition while delivering critical process consistency across cell batches. Use of ThawSTAR products can also reduce risksrisk of contamination versus using a traditional water bath. Storage and cold chain services
Biological and pharmaceutical storage
In October 2020, we acquired SciSafe Holdings, Inc. (“SciSafe”), a premier provider of biological and pharmaceutical storage. In addition to providing storage services, SciSafe provides cold chain logistics that ensures materials are kept at target temperatures from the moment that the materials leave the customer’s premises to their ultimate return. State-of-the-art monitoring systems employed by SciSafe allow for customers to monitor the storage temperatures of their materials throughout the entire logistics chain.
We operate six storage facilities in the USA and one facility in the Netherlands.
Cloud connected “smart” shipping containers
In August 2019, we acquired the remaining shares of SAVSU Technologies, Inc. (“SAVSU”) we did not previously own. SAVSU is a leading developer and supplier of next generation cold chain management tools for cell and gene therapies. The evo.is cloud app allows biologic products to be traced and tracked in real time. Our evo platform consists of rentable cloud-connected shippers and include technologies that enable tracking software to provide real-time information on geolocation, payload temperature, ambient temperature, tilt of shipper, humidity, altitude, and real-time alerts when a shipper has been opened. Our internally developed evo.is software allows customers to customize alert notifications both in data measurements and user requirements. The evo Dry Vapor Shipper (“DVS”) is specifically marketed to cell and gene therapies. The evo DVS has improved form factor and ergonomics over the traditional dewar, including extended thermal performance, reduced liquid nitrogen recharge time, improved payload extractors and ability to maintain temperature for longer periods on its side.
We utilize couriers who already have established logistic channels and distribution centers. Our strategy greatly reduces the cash need to build out specialized facilities around the world. Our partnerships with several white glove couriers allow us to scale our sales and marketing effort by utilizing their salesforce. Our courier partnerships market our evo platform to their existing cell and gene therapy customers as a cost effective and innovative solution. We also market directly to our existing and prospective customers who can utilize the evo platform through our courier partnerships.
Our market opportunity
The CGT market has been rapidly expanding, treating diseases once thought incurable. According to the Alliance for Regenerative Medicine (“ARM”),
“2022“2024 State of the Industry
Report”Briefing” there were
over 2,200approximately 1,900 ongoing clinical trials utilizing regenerative medicine at
the end of Q3 2021, including over 1,100 industry-sponsored clinical trials. Six new products received approvalsyear-end 2023, with continued growth in
2021.CGT development companies throughout 2023. ARM also reported there
were over $23.1was approximately $12 billion
in total global financingsinvested in the regenerative
medicine market
raised in
2021. The FDA2023. In addition, ARM predicts
tenup to
twenty17 US and EU cell and gene
therapies per year willtherapy regulatory approvals may be
approved by 2025.Thesegranted during 2024.
The technologies
developed within the CGT market change the
wayways physicians treat patients. The manufacturing, distribution and the delivery process
of these therapies is significantly different from many other types of
medicines and therapies.treatments. We believe we are well positioned to address many of the
unique manufacturing
difficultieschallenges in the process of
producingdelivering cell and gene therapies.
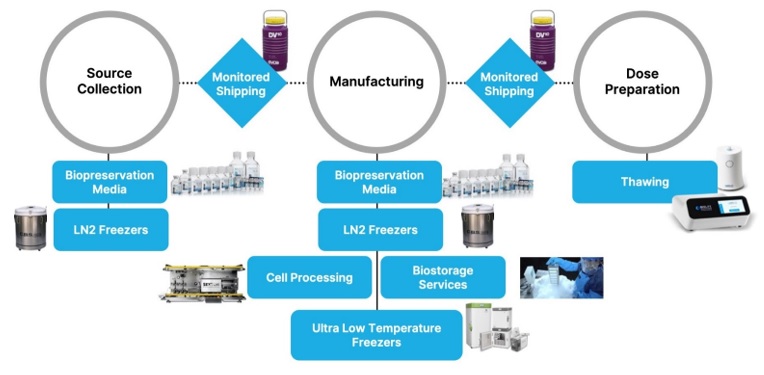
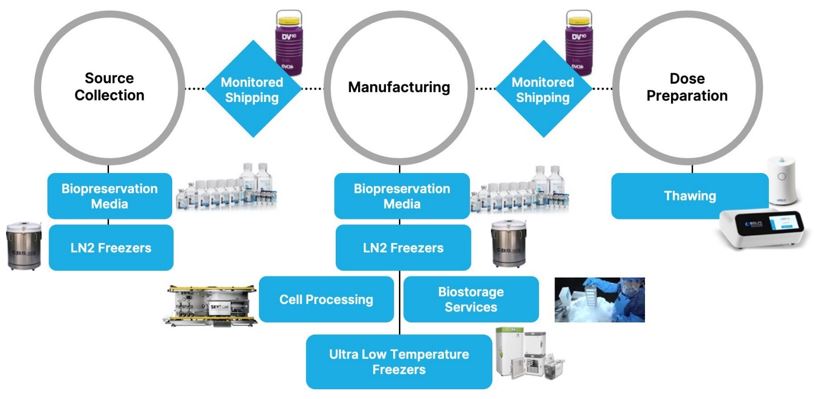
The bioproduction process
Our
various products
and services currently
fulfillintegrate into several steps in
theour customers’ bioproduction
workflow process for cell and gene therapies. See the diagram below
fromfor an illustration of this process and our product roles. We now offer products that integrate into the critical steps of preservation, thawing,
and both fixed
storage, and transportable storage under controlled conditions.
Complementary products portfolio
Expanding Participation in Customers’ Workflow
We are focused on the development, production, and commercialization of differentiated, best-in-class products and services that facilitate the manufacturing, delivery, and storage of cell and gene therapies and biologic materials. Our products are designed to increase our customers’ product yield and we are committed to supporting our customers with strong customer service and applications expertise.
We leverage our numerous relationships with
the leading cell and gene therapy companies that use our expanded
product portfoliooffering of bioproduction tools and services to cross-sell
ourother parts of the portfolio. Over the last several years, we have built a strong reputation as a trusted supplier of critical tools used in cell and gene therapy
manufacturing and
the broader biopharma
market.manufacturing. We believe that our relationships and reputation could enable us to drive
further incremental revenue growth through the sale of additional products to a captive customer base. Our products are designed to increase our customers’ product yield and functionality
while reducing their risk, and we are committed to supporting our customers with strong
customer service
in addition to scientific and
ourtechnical expertise
associated within the
clinical applications of our products.
Business Operations
Our research and development
activity isactivities are focused on evaluating new,
potentialpotentially disruptive technologies which may
be applicableadd value throughout the cell and gene therapy manufacturing
and delivery workflow. We routinely assess and analyze the strengths and weaknesses of competitive
and adjacent products, and are
typically engaged in business development discussions on an ongoing basis. We strive to continue to
introduce differentiated and high-quality products that address specific difficultiesanticipate customer needs in
manufacturing, delivery and storage of biologic material.providing enabling technologies in the CGT space.
We market and sell our products through direct sales and third-party distribution. We have
significantly expanded our global commercial organization
from 11 team members in 2019over time to
43 team members as of December 31, 2021.continue building relationships within the broader CGT market.
We have experienced field-based sales employees who market our growing product portfolio on a direct basis.
Over time, we have expanded and anticipate continuing to expand our sales team. Our technical applications engineers and customer care support teams have extensive experience
withproviding support both prior and subsequent to the
products and services that we offer.sale of products.
Our products are also marketed and distributed by STEMCELL Technologies, MilliporeSigma, VWR,
part of Avantor, Thermo Fisher, and several other regional distributors under non-exclusive agreements. In
2021, 2020,2023, 2022, and
2019,2021, sales to
third partythird-party distributors accounted for
46%49%,
45%50%, and 46% of our revenue, respectively.
In
During the years ended December 31, 2021, 2020,2023, 2022, and 2019,2021, we derived approximately 17%16%, 13% 18%, and 15%17% of our revenue from onethe same customer, one customer, and one customer, respectively. The following table represents the Company’s total revenue by geographic area (based on the location of the customer):
| | | Year Ended December 31, | |
Revenue by customers’ geographic locations | | 2021 | | | 2020 | | | 2019 | |
United States | | | 78 | % | | | 73 | % | | | 69 | % |
Canada | | | 7 | % | | | 13 | % | | | 16 | % |
Germany | | | 4 | % | | | 4 | % | | | 3 | % |
Europe, Middle East, Africa (excluding Germany) | | | 10 | % | | | 8 | % | | | 11 | % |
Other | | | 1 | % | | | 2 | % | | | 1 | % |
Total revenue | | | 100 | % | | | 100 | % | | | 100 | % |
| | | | | | | | | | | | | | | | | |
| Years Ended December 31, |
Revenue by customers’ geographic locations(1) | 2023 | | 2022 | | 2021 |
United States(2) | 80 | % | | 79 | % | | 85 | % |
| Europe, Middle East, Africa (EMEA) | 16 | % | | 16 | % | | 11 | % |
| Other | 4 | % | | 5 | % | | 4 | % |
| Total revenue | 100 | % | | 100 | % | | 100 | % |
(1) During the year ended December 31, 2023, the Company updated its methodology for determining the country of origin for its sales. Sales are now recorded by shipping country rather than billing country. The Company updated the methodology retrospectively, adjusting the prior year presentation for all regions presented.
(2) The line item presented above previously bifurcated sales between the United States and Canada. Due to the updated methodology for determining the country of origin for sales, it was noted that Canada no longer was a material location to
separately disclose. Canada sales have been included within the "Other" line item in the table above and United States sales has been retained as its own line item to more accurately reflect origin of sales for material regions.
Cell processing – We maintain and operate two independent cGMP clean room production suites for manufacturing sterile biopreservation media products in Bothell, Washington. Our quality management system (“QMS”) in Bothell is certified to the ISO 13485:2016 standard. Our QMS takes guidance from applicable sections of 21 CFR Part 820 -– Quality System Regulation for Good Manufacturing Practice of medical devices, 21 CFR Parts 210 and 211 -– cGMP for Finished Pharmaceuticals, FDA Guidance -– Sterile Drug Products, Volume 4, EU Guidelines Annex 1 -– Manufacture of Sterile Medicinal Products, ISO 13408 -– Aseptic Processing of Healthcare Products, and ISO 14644 -– Clean Rooms and Associated Controlled Environments. We also maintain and operate one cGMP clean room production suite for manufacturing hPL media in Indianapolis, Indiana. Our quality management system (“QMS”) in Indianapolis is certified to the ISO 9001:2015 standard. Our QMS takes guidance from applicable sections of 21 CFR Part 820
-– Quality System Regulation for Good Manufacturing Practice of medical devices, 21 CFR Parts 210 and 211
-– cGMP for Finished Pharmaceuticals, Volume 4, EU Guidelines Annex 2
-– Manufacture of Biological active substances and Medicinal Products for Human Use and ISO 14644 – Clean Rooms and Associated Controlled Environments.
We seek to manage single-source supplier risk by regularly assessing the quality and capacity of our suppliers, implementing supply and quality agreements where appropriate, and actively managing lead times and inventory levels of sourced components. Pursuant to our supply agreements, we are required to notify customers of any changes to our raw materials. For certain components in which we do not havewithout a secondary supplier, we estimate that it would take up to six months to find and qualify a second source. Order quantities and lead times for externally sourced components are based on our forecasts, which are derived from historical demand and anticipated future demand. Lead times for components may vary depending on the size of the order, specific supplier requirements, and current market demand for the materials and parts. Due to COVID-19,
We practice continuous improvement based on routine internal audits through our own monitoring of process outputs, external feedback, and audits performed by our partners and customers. In addition, we have seen increased lead times for certainmaintain a business continuity management system that focuses on key areas such as contingency planning, safety stocks and off-site storage of raw materials particularly personal protective equipment usedand finished goods to ensure continuous supply of our products.
Freezers and thaw systems –Ultra-low temperature (“ULT”) freezers are produced in our clean roomsfacilities in Athens, Ohio. As of the second quarter in 2023, we fully transitioned two freezer product lines under our ULT manufacturing operations from a contract manufacturing organization ("CMO") in Ohio to in-house production within the Athens, Ohio facility.
The majority of our isothermal LN2 freezers and
certain form factors of bottles and vials usedrelated accessories are manufactured in our
finished products.facility in Bruce Township, Michigan. We are reliant on certain critical suppliers for some components. To date, we have not experienced significant difficulties in obtaining raw materials for the manufacture of our
biopreservation media products.FreezersLN2 freezers and thaw systems –Ultra-low temperature (“ULT”) freezersrelated accessories.
Our ThawSTAR automated, water-free thawing products are produced
in our facility in Athens, Ohio and by a
contract manufacturing organization (“CMO”)CMO based in
Ohio.the United States. We believe this CMO has the skills, experience and capacity needed to meet our quality standards and demand expectations for the product line. We estimate that it would take up to six months to find and qualify an alternative CMO. To date, we have not experienced significant difficulties in obtaining our
ULT freezer products from our CMO. In the year ended December 31, 2021, we experienced difficulties in obtaining sheet metal and electrical components that incorporate semiconductor chips for the manufacture of our ULT freezer products. These difficulties led to increased supplier pricing for these materials and reduced production levels of ULT freezers in the third and fourth quarters of 2021. We believe the supply chain challenges related to sheet metal that we experienced in 2021 have been substantially mitigated through the diversification of suppliers. The availability of components that incorporate semiconductor chips, however, continues to be a challenge in comparison to pre-pandemic availability levels. Our strategic partnerships with key suppliers have secured sufficient supply of these electrical components for our operations for the foreseeable future.The majority of our isothermal LN2 freezers and related accessories are manufactured in our facility in Bruce Township, Michigan. We are reliant on certain critical suppliers for some components. Due to COVID-19, we have seen increased lead times for certain raw materials and components from our suppliers as well as increased costs on certain raw materials. To date, we have not experienced significant difficulties in obtaining raw materials for the manufacture of our LN2 freezers freezer and related accessories.
Our ThawSTAR automated, water-free thawing products are produced by a CMO based in the United States. We believe this CMO has the skills, experience and capacity needed to meet our quality standards and demand expectations for the product line. Due to COVID-19, we have seen increased lead times from our CMO due to increased lead times from our CMO’s suppliers. We estimate that it would take up to six months to find and qualify an alternative CMO. To date, we have not experienced significant difficulties in obtaining our automated thaw products from our CMO.
Storage and cold chain
Biostorage services –Production of our evo cold chain management hardware products is performed by external CMOs and by personnel in our Bruce Township, Michigan facility. As of the year-ended December 31, 2023, we fully transitioned our manufacturing operations from Albuquerque, New Mexico facility.to our facility in Bruce Township, Michigan. We leased a new, smaller facility in Albuquerque, New Mexico to retain engineering and administrative operations personnel. Our QMS is certified to the ISO 9001:2015 standard. Due to COVID-19, we have seen increased lead times for certain raw materials and components from our suppliers. To date, we have not experienced significant difficulties in obtaining raw materials for the manufacture of our evo cold chain products.We practice continuous improvement based on routine internal audits as well as external feedback and audits performed by our partners and customers. In addition, we maintain a business continuity management system that focuses on key areas such as contingency planning, security stocks and off-site storage of raw materials and finished goods to ensure continuous supply of our products.
SciSafe operates five cGMP compliant storage facilities and one state-of-the-art facility in the United States and one facility in the Netherlands.Netherlands, which is registered with the European Regulatory body in Netherlands (IGJ) for Good Distribution of Active Pharmaceutical Ingredients. One facility in the United States is certified to the ISO 20387:2018 standard, and one facilityall facilities, both in the United States isand the Netherlands, are certified to the ISO 9001:2015 standard. We rely on outside suppliers for the build outbuild-out of our cold-storage chambers and stand-alone freezers. Due
Supply chain constraints - Our domestic and international supply chain operations were affected during the years ended December 31, 2021 and 2022 by the global COVID-19 pandemic and the resulting volatility and uncertainty it caused in the U.S. and international markets. The onset of the COVID-19 pandemic caused supply chains globally to COVID-19, webecome constrained, and these constraints historically impacted our business through both increased difficulty in obtaining semiconductor chips and increased pricing on available parts across our product lines during the years ended December 31, 2021 and 2022. However, during the year ended December 31, 2023, both availability and pricing of semiconductor chips have experienced increased lead times in acquiring external stand-alone freezers, which we useimproved and no longer pose constraints on our supply chain. We currently have sufficient supply for electrical component parts within our operations and do not foresee constraints to store customers’ biologic materials.return over our supply chain.
Product regulatory status
Our products are not subject to any specific United States Food and Drug Administration (“FDA”) or other international marketing regulations for drugs, devices, or biologics. We are not required to sponsor formal prospective, controlled clinical trials in order to establish safety and efficacy. However, to support our current and prospective clinical customers, we manufacture and release our products in compliance with cGMP and other relevant quality standards.
To assist customers with their regulatory applications, we maintain Type II Master Files at the FDA for CryoStor, HypoThermosol FRS, BloodStor 27, Stemulate, nLiven PR, T-Liven PR, CellSeal Closed System Cryogenic Vials, and our Cell Thawing Media products, which provide the FDA with information regarding our manufacturing facility and process, our quality system, stability and safety, and any additional testing that has been performed. Customers engaged in clinical and commercial applications may notify the FDA of their intention to use our products in their product development and manufacturing process by requesting a cross-reference to our master files.
A group of isothermal, standard, and carousel LN2 freezers in our freezers and thaw systems product line is currently regulated as Class 2 medical devices in the EU.
Intellectual property
The following table lists our granted and pending patents. We have also obtained certain trademarks and tradenames for our products to distinguish our genuine products from our competitors’ products and we maintain certain details about our processes, products, and strategies as trade secrets. While we believe that the protection of patents and trademarks is important to our business, we also rely on a combination of trade secrets, nondisclosure and confidentiality agreements, scientific expertise, and continuing technological innovation to maintain our competitive position. Despite these precautions, it may be possible for unauthorized third parties to copy certain aspects of our products and/or to obtain and use information that we regard as proprietary (see “Item 1A. Risk Factors” of this Annual Report for additional details). The laws of some foreign countries in which we
may sell our products do not protect our proprietary rights to the same extent as do the laws of the United States.
| | | Issued Patents | | | Patents Applied For | | | Registered Trademarks | |
Cell processing | | | 52 | | | | 5 | | | | 38 | |
Freezers and thaw systems | | | 90 | | | | 48 | | | | 27 | |
Storage and cold chain services | | | 11 | | | | 8 | | | | 7 | |
Total | | | 153 | | | | 61 | | | | 72 | |
| | | | | | | | | | | | | | | | | |
| Issued Patents | | Patents Applied For | | Registered Trademarks |
| Cell processing | 56 | | | 16 | | | 41 | |
| Freezers and thaw systems | 85 | | | 71 | | | 25 | |
| Biostorage services | 13 | | | 33 | | | 6 | |
| Total | 154 | | | 120 | | | 72 | |
Our bioproduction products and services compete on the basis of value proposition, performance, quality, cost effectiveness, and application suitability with numerous established technologies. Additional products using new technologies that may be competitive with our products may also be introduced. Many of the companies selling or developing competitive products have greater financial and human resources, R&D, manufacturing and marketing experience than we do. They may undertake their own development of products that are substantially similar to or compete with our products, and they may succeed in developing products that are more effective or less costly than any that we may develop. These competitors may also prove to be more successful in their production, marketing and commercialization activities. We cannot be certain that the research, development and commercialization efforts of our competitors will not render any of our existing or potential products obsolete.
We view our employees and our culture as key to our success. As of December 31,
2021,2023, we had
432409 full time employees and 5 part-time employees. Our employees are not covered by any collective bargaining agreement. We consider relations with our employees to be good.
Since March 2020, we have operated with a flexible work environment in which positions not essential to being on-site may embrace hybrid ways of working. Overall, we aim to preserve the flexibility offered by hybrid work arrangements while offering our employees a healthy, supportive, and inclusive environment that supports their development, provides connection, and propels team and individual performance.
We were incorporated in Delaware in 1987 under the name Trans Time Medical Products, Inc. In 2002, the Company, then known as Cryomedical Sciences, Inc. was engaged in manufacturing and marketing cryosurgical products. The entity was merged with our
wholly-ownedwholly owned subsidiary, BioLife Solutions, Inc., which was engaged as a developer and marketer of biopreservation media products for cells and tissues. Following the merger, we changed our name to BioLife Solutions, Inc.
Principal offices; available information
Our principal executive offices are located at 3303 Monte Villa Parkway, Suite 310, Bothell, Washington 98021 and the telephone number is (425) 402-1400. We maintain a website at www.biolifesolutions.com. The information contained on or accessible through our website is not part of this Annual Report on Form 10-K and is not incorporated in any manner into this Annual Report. Our Annual Report on Form 10-K, Quarterly Reports on Form 10-Q, Current Reports on Form 8-K and amendments to reports filed or furnished pursuant to Sections 13(a) and 15(d) of the Securities Exchange Act of 1934 (the “Exchange Act”), are available free of charge on our website as soon as reasonably practicable after we electronically file such reports with, or furnish those reports to, the Securities and Exchange Commission (the “SEC”). The SEC also maintains an Internet site that contains reports, proxy and information statements, and other information regarding issuers that file electronically with the SEC at http://www.sec.gov.www.sec.gov.
Investing in our common stock involves a high degree of risk. You should carefully consider the risks and uncertainties described below, together with all of the other information contained in this Annual Report, before deciding to invest in our common stock. If any of the following risks materialize, our business, financial condition, results of operation and prospects will likely be materially and adversely affected. In that event, the market price of our common stock could decline and you could lose all or part of your investment.
Risks related to our financial condition
Despite our increasingly diversified customer base, we
have historically dependeddepend on a limited number of customers and products in a limited number of market
sectors; ifsectors. If we lose any of these large customers or if there are
problemsdisruptions in
those market sectors, particularly as a resultthe sales of
the COVID-19 pandemic,these products, our net product revenue and operating results could decline significantly.
In
During the years ended December 31,
2021, 20202023, 2022, and
2019,2021, we derived approximately
17%16%,
13%18%, and
15%17% of our revenue from
one customer, one customer, and onethe same customer, respectively. No other customer accounted for more than 10% of revenue in the years ended December 31,
2023, 2022 and 2021. In the years ended December 31, 2023, 2022, and 2021,
2020,we derived approximately 39%, 36%, and
2019.33% of our revenue from CryoStor products, respectively. Additionally, during the years ended December 31, 2023, 2022 and 2021, we derived approximately 19%, 22% and 22% of our revenues from our 780XLE freezers, respectively. Our principal customers may vary from period to period and such customers may not continue to purchase products from us at current levels or at
all (particularly as a result of the COVID-19 pandemic).all. Further, the inability of some of our customers to consummate anticipated purchases of our products due to changes in end-user demand, and other unpredictable factors that may affect customer ordering patterns could lead to significant reductions in net product revenue which could harm our business.
Because our revenue and operating results are difficult to predict (particularly as a result of the COVID-19 pandemic), we believe that period-to-period comparisons of our results of operations are not a good indicator of our future performance. Additionally, if revenue declines in a quarter, whether due to a delay in recognizing expected revenue, adverse economic conditions, the COVID-19 pandemic, supply chain issues or otherwise, our results of operations will be harmed because many of our expenses are relatively fixed. In particular, a large portion of our manufacturing costs, our research and development, sales and marketing and general and administrative expenses are not significantly affected by variations in revenue. Further, our cost of product revenue is dependent on product mix. If our quarterly operating results fail to meet investor expectations, the price of our common stock may decline.
We expect our operating results to fluctuate significantly from period to period.
Following
Our revenue, operating margins and other operating results have varied significantly in the past and may continue to fluctuate from period to period in the future due to a variety of factors, many of which are beyond our control. Factors relating to our business that may contribute to these fluctuations include changes in customer demand, pricing pressures applicable to our products, the length of our sales cycles, supply chain and inventory management, changes in competitive conditions, including the introduction of new products and enhancements by our competitors, among other factors described elsewhere in this Annual Report. In addition, following our acquisitions
infrom 2019 through 2021,
2020 and 2019, we have increased our fixed costs and now sell products having higher costs of product revenue than our biopreservation media products. We expect that the result of these acquisitions
and subsequent operational decisions regarding the businesses acquired will make it more difficult to predict our revenue and operating results from period-to-period and that, as a result, comparisons of our results of operations are not currently and will not be for the foreseeable future a good indicator of our future performance. For example, if revenue declines in a quarter, whether due to a delay in recognizing expected revenue, adverse economic conditions,
the COVID-19 pandemic, supply chain issues or otherwise, our results of operations in such period will be harmed because many of our expenses are now relatively fixed. In particular, a large portion of our manufacturing costs, research and development expenses, sales and marketing expenses and general and administrative expenses are not significantly affected by variations in revenue. Further, a shift in product revenue concentration away from our CryoStor products and towards
our newother developing products with higher costs of product revenue will adversely affect our operating margin. If our quarterly operating results fail to meet
investor expectations
of investors or research analysts, the price of our common stock may decline.
We have announced that we intend to divest our Freezer Business. The failure to complete such divestiture on favorable terms or at all, or the pursuit of such divestiture, could adversely affect our businesses, results of operations and financial condition.
Subsequent to the second quarter of 2023, we began to actively seek divestment of our Freezer Business to optimize the performance of our product portfolio. Although we are diligently pursuing a sale of the Freezer Business, no potential buyer has yet committed to purchasing the business and we have not yet entered into any agreement for the sale of such business. We may not be successful in selling our Freezer Business in a timely manner, if at all, or may do so on terms that are less favorable than we currently anticipate. If the Freezer Business is not sold as an ongoing business, we may have to liquidate those assets and incur substantial costs to shut down those operations. In addition, we have already recorded impairment charges over the property and equipment and definitive-lived intangible assets of the Freezer Business, as reflected in our consolidated financial statements. See Note 2: Impairment of property and equipment and definite-lived intangible assets, to our consolidated financial statements included in this Annual Report on Form 10-K for more information. If the Freezer Business is sold, it is possible that the net proceeds from the sale could be less than its current
carrying value on our books, which would require us to take an additional impairment charge against our earnings in the amount of the difference, which could be significant. Moreover, the announcement and conduct of the divestiture process could cause disruptions in, and create uncertainty surrounding, our Freezer Business, including affecting relationships with its existing and future customers, suppliers and employees, which could have an adverse effect on the Freezer Business’s operations and financial condition, potentially making it more difficult to successfully complete a transaction on favorable terms. The divestiture process may also divert our management’s attention from overseeing and exploring opportunities that may be beneficial to our other businesses and operations. If we are unable to complete a divestiture of our Freezer Business on favorable terms or at all, we may suffer negative publicity, and our business, results of operations, and financial condition may be adversely affected and the price of our common stock may decline.
Risks related to our acquisition strategy
If intangible assets and goodwill that we recorded in connection with our acquisitions become impaired, we may have to take significant charges against earnings.
In connection with the accounting for our completed acquisitions in recent years, we recorded a significant amount of intangible assets, including developed technology, in-process research and development, and customer relationships relating to the acquired product lines, and goodwill. As of December 31, 2023, the net carrying value of our goodwill and other intangible assets totaled $245.9 million. Under generally accepted accounting principles in the United States, we must assess, at least annually and potentially more frequently, whether the value of indefinite-lived intangible assets and goodwill have been impaired. Intangible assets and goodwill are assessed for impairment in the event of an impairment indicator, as was the case in the third quarter of 2023 when we began to actively seek divestment of our GCI and CBS freezer product lines (the “Freezer Business”). The announcement, coupled with broader economic uncertainty leading to reductions in spending across the biopharma industry and our customer base constituted interim triggering events that required further analysis with respect to potential impairment to goodwill, indefinite-lived intangibles, and our long-lived asset groups. As a result of the interim quantitative impairment analysis performed, we recorded a $5.8 million non-cash impairment charge over definite-lived intangible assets reflected in our consolidated statements of operations. Any future reduction or impairment of the value of intangible assets and goodwill will result in a charge against earnings, which could materially adversely affect our results of operations and shareholders’ equity in future periods.
Our acquisitions expose us to risks that could adversely affect our business, and we may not achieve the anticipated benefits of acquisitions of businesses or technologies.
As a part of our growth strategy, we have made, and may continue to make, selected acquisitions of complementary products and/or businesses. Any acquisition involves numerous risks and operational, financial, and managerial challenges, including the following, any of which could adversely affect our business, financial condition, or results of operations:
•difficulties in integrating new operations, technologies, products, and personnel;
•problems maintaining uniform procedures, controls, and policies with respect to our financial accounting systems;
•lack of synergies or the inability to realize expected synergies and cost-savings;
•difficulties in managing geographically dispersed operations, including risks associated with entering foreign markets in which we have no or limited prior experience;
•underperformance of any acquired technology, product, or business relative to our expectations and the price we paid;
•negative near-term impacts on financial results after an acquisition, including acquisition-related earnings charges;
•the potential loss of key employees, customers, and strategic partners of acquired companies;
•claims by terminated employees and shareholders of acquired companies or other third parties related to the transaction;
•the assumption or incurrence of additional debt obligations or expenses, or use of substantial portions of our cash;
•diversion of management’s attention and company resources from existing operations of the business;
•inconsistencies in standards, controls, procedures, and policies;
•cash expenses and non-cash accounting charges incurred in connection with acquisitions, including unanticipated costs associated with the amortization of intangible assets;
•the impairment of intangible assets as a result of technological advancements, or worse-than-expected performance of acquired companies;
•assumption of, or exposure to, historical liabilities of the acquired business, including unknown contingent or similar liabilities, including product liability, that are difficult to identify or accurately quantify; and
•risks associated with acquiring intellectual property, including potential disputes regarding acquired companies’ intellectual property.
In addition, the successful integration of acquired businesses requires significant efforts and expense across all operational areas, including sales and marketing, research and development, manufacturing, finance, legal, and information technologies. Our acquisitions we may not be successful or may not be, or remain, profitable. Our failure to successfully address the foregoing risks may prevent us from achieving the anticipated benefits from any acquisition in a reasonable time frame, or at all.
Our recent acquisitions may result in unexpected consequences to our business and results of operations.
Although we believe that our acquired product lines will generally be subject to risks similar to those to which we are subject to in our existing operations, we may not have discovered all risks applicable to these businesses during the due diligence process. Some of these risks could produce unexpected and unwanted consequences for us. Undiscovered risks may result in us incurring financial liabilities, which could be material and have a negative impact on our business operations.
We may engage in future acquisitions or
other strategic transactions which may require us to seek additional financing or financial commitments, increase our expenses and/or present significant distractions to our management.
In the last three years, we acquired six companies and made investments in two other companies.
We
are continuingcontinue to actively evaluate opportunities
and consider other strategic transactions to grow our portfolio of bioproduction tools and services for the cell and gene therapy and broader biopharma markets. In the event we engage in an acquisition or strategic transaction, including by making an investment in another company, we may need to acquire additional financing. Obtaining financing through the issuance or sale of additional equity and/or debt securities, if possible, may not be at favorable terms and may result in additional dilution to our current
stockholders.stockholders (which in the case of certain of our prior acquisitions were significant). We also may be unable to issue our equity to finance or as consideration for any acquisition if the price of our common stock decreases or is volatile. Additionally, any such transaction may require us to incur non-recurring or other charges, may increase our near and long-term expenditures and may pose significant integration challenges or disrupt our management or business, which could adversely affect our operations and financial results. For example, an acquisition or strategic transaction may entail numerous operational and financial risks, including the risks outlined above and additionally:
| ●
| •exposure to unknown financial or product liabilities; |
| ●
| disruption of our business and diversion of our management's time and attention in order to develop acquired products or technologies;
|
| ●
| higher than expected acquisition and integration costs;
|
| ●
| write-downs of assets or goodwill or impairment charges;
|
| ●
| increased amortization expenses;
|
| ●
| difficulty and cost in combining the operations and personnel of any acquired businesses with our operations and personnel;
|
| ●
| impairment of relationships with key suppliers or customers of any acquired businesses due to changes in management and ownership; and
|
| ●
| inability to retain key employees of any acquired businesses.
|
Accordingly, although there can be no assurance that we will undertake or successfully completeproduct liabilities;
•disruption of our business and diversion of our management's time and attention in order to negotiate and close on such transaction or develop acquired products or technologies;
•higher than expected acquisition and integration costs;
•write-downs of assets or goodwill or impairment charges;
•increased amortization expenses;
•difficulty and cost in combining the operations and personnel of any transactionsacquired businesses with our operations and personnel;
•impairment of the nature described above,relationships with key suppliers or customers of any acquired businesses due to changes in management and ownership; and
•inability to retain key employees of any acquired businesses.
Accordingly, any transactions that we
do complete could have a material adverse effect on our business, results of operations, financial condition, and prospects.
If intangible assets and goodwill that we recorded in connection with our acquisitions become impaired, we may have to take significant charges against earnings.
In connection with the accounting for our completed acquisitions in 2021, 2020, and 2019, we recorded a significant amount of intangible assets, including developed technology, in-process research and development, and customer relationships relating to the acquired product lines, and goodwill. Under generally accepted accounting principles in the United States, we must assess, at least annually and potentially more frequently, whether the value of indefinite-lived intangible assets and goodwill have been impaired. Intangible assets and goodwill will be assessed for impairment in the event of an impairment indicator. Any reduction or impairment of the value of intangible assets and goodwill will result in a charge against earnings, which could materially adversely affect our results of operations and shareholders’ equity in future periods.
Our acquisitions expose us to risks that could adversely affect our business, and we may not achieve the anticipated benefits of acquisitions of businesses or technologies.
As a part of our growth strategy, we have made and may continue to make selected acquisitions of complementary products and/or businesses. Any acquisition involves numerous risks and operational, financial, and managerial challenges, including the following, any of which could adversely affect our business, financial condition, or results of operations:
| ●
| difficulties in integrating new operations, technologies, products, and personnel;
|
| ●
| problems maintaining uniform procedures, controls and policies with respect to our financial accounting systems;
|
| ●
| lack of synergies or the inability to realize expected synergies and cost-savings;
|
| ●
| difficulties in managing geographically dispersed operations, including risks associated with entering foreign markets in which we have no or limited prior experience;
|
| ●
| underperformance of any acquired technology, product, or business relative to our expectations and the price we paid;
|
| ●
| negative near-term impacts on financial results after an acquisition, including acquisition-related earnings charges;
|
| ●
| the potential loss of key employees, customers, and strategic partners of acquired companies;
|
| ●
| claims by terminated employees and shareholders of acquired companies or other third parties related to the transaction;
|
| ●
| the assumption or incurrence of additional debt obligations or expenses, or use of substantial portions of our cash;
|
| ●
| the issuance of equity securities to finance or as consideration for any acquisitions that dilute the ownership of our stockholders (which in the case of certain of our prior acquisitions were significant);
|
| ●
| the issuance of equity securities to finance or as consideration for any acquisitions may not be an option if the price of our common stock is low or volatile which could preclude us from completing any such acquisitions;
|
| ●
| diversion of management’s attention and company resources from existing operations of the business;
|
| ●
| inconsistencies in standards, controls, procedures, and policies;
|
| ●
| the impairment of intangible assets as a result of technological advancements, or worse-than-expected performance of acquired companies;
|
| ●
| assumption of, or exposure to, historical liabilities of the acquired business, including unknown contingent or similar liabilities, including product liability, that are difficult to identify or accurately quantify; and
|
| ●
| risks associated with acquiring intellectual property, including potential disputes regarding acquired companies’ intellectual property.
|
In addition, the successful integration of acquired businesses requires significant efforts and expense across all operational areas, including sales and marketing, research and development, manufacturing, finance, legal, and information technologies. There can be no assurance that any of the acquisitions we may make will be successful or will be, or will remain, profitable. Our failure to successfully address the foregoing risks may prevent us from achieving the anticipated benefits from any acquisition in a reasonable time frame, or at all.
The integration of our acquisitions may result in significant accounting charges that adversely affect the announced results of our company.
The financial results of our company may be adversely affected by cash expenses and non-cash accounting charges incurred in connection with our acquisitions over the prior three years. In addition to the anticipated cash charges, costs associated with the amortization of intangible assets are expected. The price of our common stock could decline to the extent our financial results are materially affected by the foregoing charges or if the foregoing charges are larger than anticipated.
Our recent acquisitions may result in unexpected consequences to our business and results of operations.
Although we believe that our recently acquired businesses will generally be subject to risks similar to those to which we are subject to in our existing operations, we may not have discovered all risks applicable to these businesses during the due diligence process. Some of these risks could produce unexpected and unwanted consequences for us. Undiscovered risks may result in us incurring financial liabilities, which could be material and have a negative impact on our business operations.
Failure to realize the benefits expected from our recent acquisitions, and in particular our acquisition of Global Cooling, could adversely affect the value of our common stock.
The success of our recent acquisitions will depend, in part, on our ability to:
| ●
| capitalize on our cross-selling opportunities by leveraging our extensive relationships with cell and gene therapy companies to drive sales of our recently acquired products and leveraging the relationships of our recently acquired businesses to offer them our full portfolio of bioproduction tools and services;
|
| ●
| deploy Global Cooling’s freezers in SciSafe global biorepositories and expand the reach of the Global Cooling sales team and distributors to provide access to our entire portfolio of bioproduction tools and services offered to the cell and gene therapy and biopharma markets;
|
| ●
| realize cost savings from reduced back-office and infrastructure expenses, elimination of duplicative company and management structure costs, and improved purchasing power through greater scale;
|
| ●
| operate our combined businesses efficiently, achieve the strategic operating objectives for our business and realize significant cost savings and synergies;
|
| ●
| realize the attractive risk-adjusted equity returns from our acquisitions for our stockholders; and
|
| ●
| capitalize on the embedded and/or underexploited expansion opportunities offered by our acquisitions that we can expand upon.
|
However, to realize the anticipated benefits of our acquisitions we must successfully integrate their businesses in a manner that permits those benefits and cost savings to be realized. Although we expect significant benefits to result from these acquisitions, there can be no assurance that we will be able to successfully realize these benefits. The challenges involved in this integration will be complex and time consuming and may require a disproportionate amount of resources and management attention and could result in the loss of valuable employees, the disruption of each company’s ongoing business or inconsistencies in standards, controls, procedures, practices, and policies that could adversely impact our operations. If we do not successfully manage these and related issues and challenges, we may not achieve the anticipated benefits of these acquisitions and our revenue, expenses, operating results, financial condition and stock price could be materially adversely affected.
Risks related to our business and operations
Healthcare reform measures could adversely affect our
business.business and financial results.
The efforts of governmental and third-party payors to contain or reduce the costs of healthcare and, more generally, to reform the U.S. healthcare system may adversely affect the business and financial condition of pharmaceutical and biotechnology companies, including ours. Specifically, in both the United States and some foreign jurisdictions, there have been a number of legislative and regulatory proposals to change the healthcare system in ways that could affect our ability to sell our products profitably.profitably, including by limiting the prices we are able to charge for our products, the amounts of reimbursement available for our products or the acceptance and availability of our products. Efforts by governments and
other third-party payors to contain or reduce the costs of healthcare through various means may limit our commercial opportunities and adversely affect our operating results and result in a decrease in the price of our common stock or limit our ability to raise capital.
If our products
or the products of our competitors do not perform as expected or the reliability of the technology on which our products are based is questioned, we could experience lost revenue, delayed or reduced market acceptance of our products, increased costs, and damage to our reputation.
Our success depends on the market’s confidence that we can provide reliable, high-quality products to our customers. We believe that customers in our target markets are likely to be particularly sensitive to product defects and errors. Our reputation and the public image of our products and technologies may be impaired if our products
or similar products of our competitors fail to perform as expected.
Although our products are tested prior to shipment, defects or errors could nonetheless occur in our products. In the future, if our products experience, or are perceived to experience, a material defect or error, this could result in loss or delay of revenues, delayed
or reduced market acceptance,
damageddamage to our reputation, diversion of development resources, legal claims, increased insurance costs or increased service and warranty costs, any of which could harm our
business.business, financial condition or results of operations. Such defects or errors could also narrow the scope of the use of our products, which could hinder our success in the market. Even after any underlying concerns or problems are resolved, any lingering concerns in our target market regarding our technology or any manufacturing defects or performance errors in our products could continue to result in lost revenue, delayed
or reduced market acceptance,
damageddamage to our reputation, increased service and warranty costs and claims against us.
We
face significant competition.operate in a highly competitive industry and if we cannot compete effectively, our business, financial condition and operating results could be materially and adversely affected.
The life sciences industry is highly competitive.competitive and subject to rapid technological change. We anticipate that we will continue to face increased competition as existing companies may choose to develop new or improved products and as new companies could enter the market with new technologies, any of which could compete with our productproducts or even render our products obsolete. Many of our competitors are significantly larger than us and have greater financial, technical, research, marketing, sales, distribution and other resources than us. There canusand may have longer operating histories. These companies may develop technologies that are superior alternatives to our products or may be no assurancemore effective at commercializing and marketing their technologies in products. We may need to improve our existing technologies or develop new technologies for our products to remain competitive. Our future success depends on our ability to compete effectively against current technologies, as well as to respond effectively to technological advances by developing and marketing products that ourare competitive in the continually changing technological landscape. Our competitors will notmay succeed in developing or marketing technologies and products that are more effective or commercially attractive than any that are being developed or marketed by us, or that such competitors will notmay succeed in obtaining regulatory approval, or introducing or commercializing any such products, prior to us. Such developments could have a material adverse effect on our business, financial condition and results of operations. Also, even if we can compete successfully, there can be no assurance that we canmay not continue do so in a profitable manner. We are dependent on outside suppliers for all our manufacturing supplies.
We relydepend on outside suppliers for all our manufacturing supplies, parts and components. Although we believe we could develop alternative sources of supply
We rely on outside suppliers, including several single-source suppliers, for
most of these components within a reasonable period of time, thereall our manufacturing supplies, parts and components. There can be no assurance that, in the future, our current or alternative sources
for manufacturing supplies will be able to meet all our demands on a timely
basis, particularly given the uncertainty surrounding the COVID-19 pandemic.basis. Unavailability of necessary components could require us to re-engineer our products to accommodate available substitutions, which could increase costs to us and/or have a material adverse effect on manufacturing schedules, products performance and market acceptance. In addition, an uncorrected defect or supplier’s variation in a component or raw material, either unknown to us or incompatible with our manufacturing process, could harm our ability to manufacture products. We might not be able to find a sufficient alternative supplier in a reasonable amount of time, or on commercially reasonable terms, if at all. If we fail to obtain
aan alternative supplier for the components of our products, our operations could be disrupted.
In the year ended December 31, 2021, we experienced difficulties in obtaining sheet metal and electrical components that incorporate semiconductor chips for the manufacture of our ULT freezer products. These difficulties led to increased supplier pricing for these materials and reduced production levels of ULT freezers in the third and fourth quarters of 2021. The availability of components that incorporate semiconductor chips continues to be a challenge in comparison to pre-pandemic availability levels. Our strategic partnerships with key suppliers have secured sufficient supply of these electrical components for our operations for the foreseeable future.
Our success will depend on our ability to attract and retain key personnel.
In order to execute our business plan, we must attract, retain and motivate highly qualified managerial, scientific, manufacturing, and sales personnel. If we fail to attract and retain skilled scientific and sales personnel, our sales efforts will be hindered. Our future success depends to a significant degree upon the continued services of key scientific and technical personnel. If we do not attract and retain qualified personnel, we will not be able to achieve our growth objectives.
Difficulties in manufacturing could have an adverse effect upon our expenses and our product revenues.
We currently manufacture all of our biopreservation media products, freezer products and related components. We currently outsource the manufacturing of certain thaw products, certain cold chain products, two ULT freezer models, and components of our LN2 freezers. The manufacturing of our products is difficult and complex. To support our current and prospective clinical customers, we comply with, and intend to continue to comply with, cGMP in the manufacture of our products. Our ability to adequately manufacture and supply our products in a timely matter is dependent on the uninterrupted and efficient operation of our facilities and those of third-partiesthird partiesmanufacturing certain of our products or producing raw materials and supplies upon which we rely in our manufacturing. The manufacture of our products may be impacted by: | ●
| availability or contamination of raw materials and components used in the manufacturing process, particularly those for which we have no other source or supplier;
|
| ●
| the ongoing capacity of our facilities;
|
| ●
| our ability to comply with new regulatory requirements, including our ability to comply with cGMP;
|
| ●
| inclement weather and natural disasters;
|
| ●
| changes in forecasts of future demand for product components;
|
| ●
| potential facility contamination by microorganisms or viruses;
|
| ●
| updating of manufacturing specifications;
|
| ●
| product quality success rates and yields; and
|
| ●
| global viruses and pandemics, including the current COVID-19 pandemic.
|
•availability or contamination of raw materials and components used in the manufacturing process, particularly those for which we have no other source or supplier;
•the ongoing capacity of our facilities and those of our outside manufacturers;
•our and our outside manufacturers’ ability to comply with existing and new regulatory requirements, including cGMP;
•inclement weather and natural disasters;
•changes in forecasts of future demand for product components;
•potential facility contamination by microorganisms or viruses;
•updating of manufacturing specifications;
•product quality success rates and yields;
•labor strike; and
•global viruses and pandemics, including COVID-19.
If efficient manufacture and supply of our products is interrupted, we may experience delayed shipments or supply constraints. If we are at any time unable to provide an uninterrupted supply of our products to customers, our customers may be unable to supply their end-products incorporating our products to their patients and other customers, which could materially and adversely affect our product revenue and results of operations.
In addition, if we are unable to procure a component from one of our outside manufacturers, we may be required to enter into arrangements with one or more alternative manufacturing companies, which may cause delays in producing components or result in significant increase in expenses.
While we are not currently subject to FDA or other regulatory approvals on
substantially all of our products, if
weour products become subject to regulatory requirements, the manufacture and sale of our products may be delayed or prevented, or we may become subject to increased expenses.
None of our products are subject to
FDA.FDA regulation. In particular, we are not required to sponsor formal prospective, controlled clinical-trials to establish safety and efficacy. A group of isothermal, standard, and carousel LN2 freezers in our freezers and thaw systems product line is currently regulated as Class 2 medical devices in the EU. Additionally, we comply with cGMP
requirements.requirements and other relevant quality standards. This is done solely to support our current and prospective clinical customers. However, there can be no assurance that we will not be required to obtain approval from the FDA, or foreign regulatory authorities, as applicable, prior to marketing any of our products in the future. Any such requirements could delay or prevent the sale of our products or may subject us to additional expenses.
Our business may be subject to product liability claims or product recalls, which could be expensive and could result in a diversion of management’s attention.
Our business exposes us to potential product liability risks that are inherent in the design, manufacturedesigning, manufacturing, and marketing of our products. In particular, we are a supplier of bioproduction tools to the cell and gene therapy industry. Our products are used in basic and applied research, and commercial manufacturing of biologic-based therapies. Customers use our products to maintain the health and function of biologic material during sourcing, manufacturing, storage, and distribution of cells and tissues, and component failures, manufacturing flaws, design defects or inadequate disclosure of product-related risks with respect to these or other products we manufacture or sell could result in an unsafe condition or injury. As a result, we face an inherent risk of damage to our reputation if one or more of our products are, or are alleged to be, defective. Although we carry product liability insurance, weWe may be exposed to risks from product liability and warranty claims in the event that our products actually or allegedly fail to perform as expected or the use of our products results, or is alleged to result, in bodily injury and/or property damage. The outcome of litigation, particularly any class-action lawsuits, is difficult to quantify. Plaintiffs often seek recovery of very large or indeterminate amounts, including punitive damages. The magnitude of the potential losses relating to these lawsuits may remain unknown for substantial periods of time and the cost to defend against any such litigation, whether or not we are found liable, may be significant. Accordingly, we could experience product liability losses in the future and
incur significant costs to defend these claims.
While we maintain product liability insurance coverage, which we deem to be adequate based on historical experience, there can be no assurance that coverage will be available for such risks in the future or that, if available, it would prove sufficient to cover potential claims or that the present amount of insurance can be maintained in force at an acceptable cost to us.
In addition, if any of our products are, or are alleged to be, defective, we may voluntarily participate, or be required by applicable regulators, to participate in a recall of that product if the defect or the alleged defect relates to safety. In the event of a recall, we may experience lost sales and be exposed to individual or class-action litigation claims and reputational risk. Product liability, warranty and recall costs may have a material adverse effect on our business, financial condition and results of operations.
Insurance coverage is increasingly difficult to obtain or maintain.
While we currently maintain product liability insurance, directors’ and officers’ liability insurance, general liability insurance, and other types of insurance, first- and third-party insurance is increasingly more costly and narrower in scope, and we may be required to assume more risk in the future. If we are subject to third-party claims or suffer a loss or damage in excess of our insurance coverage, we may be required to share that risk in excess of our insurance limits. Furthermore, any first- or third-party claims made on our insurance policies may impact our future ability to obtain or maintain product liability insurance coverage at reasonable costs, if at all.
We are and may become the subject of various claims, litigation or investigations which could have a material adverse effect on our business, financial condition,
or results of operations or
the price of our common stock.
We are and may become subject to various claims (including “whistleblower” complaints), litigation or investigations, including commercial disputes and employee claims, and from time to time may be involved in governmental or regulatory investigations or similar matters.
Some of these claims may relate to the activities of businesses that we have acquired, even though these activities may have occurred prior to our acquisition of such businesses. Any claims asserted against us or our management, regardless of merit or eventual outcome, could harm our reputation,
distract our management and have an adverse impact on our relationship with our
existing or prospective clients, distribution partners and other
third partiesthird-parties and could lead to additional related claims. Furthermore, there is no guarantee that we will be successful in defending ourselves in pending or future litigation or similar matters under various laws. Any judgments or settlements in any pending litigation or future claims, litigation or investigation could have a material adverse effect on our business, financial condition,
or results of operations
andor the price of our common stock.
Risks related to our intellectual property and cyber security
Expiration of our patents may subject us to increased competition and reduce our opportunity to generate product revenue.
The patents for our products have varying expiration dates and, when these patents expire, we may be subject to increased competition and we may not be able to recover our development costs. In some of the larger economic territories, such as the United States and Europe, patent term extension/restoration may be available. We cannot, however, be certain that an extension will be granted or, if granted, what the applicable time or the scope of patent protection afforded during any extended period will be. If we are unable to obtain patent term extension/restoration or some other exclusivity, we could be subject to increased competition and our opportunity to establish or maintain product revenue could be substantially reduced or eliminated. Furthermore, we may not have sufficient time to recover our development costs prior to the expiration of our U.S. and non-U.S. patents.
Our proprietary rights may not adequately protect our technologies and products.
Our commercial success will depend on our ability to obtain patents and/or regulatory exclusivity and maintain adequate protection for our technologies and products in the United States and other countries. We will be able to protect our proprietary rights from unauthorized use by
third partiesthird-parties only to the extent that our proprietary technologies and products are covered by valid and enforceable patents or are effectively maintained as trade secrets.
We intend to apply for additional patents covering both our technologies and products, as we deem appropriate. We may, however, fail to apply for patents on important technologies or products in a timely fashion, if at all. Our existing patents and any future patents we obtain may not be sufficiently broad to prevent others from practicing our technologies or from developing competing products and technologies. In addition, the patent positions of life science industry companies are
highly uncertain and involve complex legal and factual questions for which important legal principles remain unresolved. As a result, the validity and enforceability of our patents cannot be predicted with certainty. In addition, we cannot guarantee that:
| ●
| we were the first to make the inventions covered by each of our issued patents and pending patent applications;
|
| ●
| we were the first to file patent applications for these inventions;
|
| ●
| others will not independently develop similar or alternative technologies or duplicate any of our technologies;
|
| ●
| any of our pending patent applications will result in issued patents;
|
| ●
| any of our patents will be valid or enforceable;
|
| ●
| any patents issued to us will provide us with any competitive advantages, or will not be challenged by third parties; and
|
| ●
| we will develop additional proprietary technologies that are patentable, or the patents of others will not have an adverse effect on our business.
|
•we were the first to make the inventions covered by each of our issued patents and pending patent applications;
•we were the first to file patent applications for these inventions;
•others will not independently develop similar or alternative technologies or duplicate any of our technologies;
•any of our pending patent applications will result in issued patents;
•any of our patents will be valid or enforceable;
•any patents issued to us will provide us with any competitive advantages, or will not be challenged by third parties; and
•we will develop additional proprietary technologies that are patentable, or the patents of others will not have an adverse effect on our business.
The actual protection afforded by a patent varies on a product-by-product basis, from country to country and depends on many factors, including the type of patent, the scope of its coverage, the availability of regulatory related extensions, the availability of legal remedies in a particular country and the validity and enforceability of the patents. Our ability to maintain and solidify our proprietary position for our products will depend on our success in obtaining effective claims and enforcing those claims once granted. Our issued patents and those that may be issued in the future, or those licensed to us, may be challenged, invalidated, unenforceable or circumvented, and the rights granted under any issued patents may not provide us with proprietary protection or competitive advantages against competitors with similar products. We also rely on trade secrets to protect some of our technology, especially where it is believed that patent protection is inappropriate or unobtainable. However, trade secrets are difficult to maintain. While we use reasonable efforts to protect our trade secrets, our employees, consultants, contractors, or scientific and other advisors may unintentionally or willfully disclose our proprietary information to competitors. Enforcement of claims that a third party has illegally obtained and is using trade secrets is expensive, time consuming and uncertain. In addition, non-U.S. courts are sometimes less willing than U.S. courts to protect trade secrets. If our competitors independently develop equivalent knowledge, methods, and know-how, we would not be able to assert our trade secrets against them and our business could be harmed.
We may not be able to protect our intellectual property rights throughout the world.
Filing, prosecuting, and defending patents on all our products in every jurisdiction would be prohibitively expensive. Competitors may use our technologies in jurisdictions where we have not obtained patent protection to develop their own products. These products may compete with our products and may not be covered by any patent claims or other intellectual property rights.
The laws of some non-U.S. countries do not protect intellectual property rights to the same extent as the laws of the United States, and many companies have encountered significant problems in protecting and defending such rights in foreign jurisdictions. The legal systems of certain countries, particularly certain developing countries, do not favor the enforcement of patents and other intellectual property protection, particularly those relating to biotechnology, which could make it difficult for us to stop the infringement of our patents. Proceedings to enforce our patent rights in foreign jurisdictions could result in substantial cost and divert our efforts and attention from other aspects of our business.
If we fail to protect our intellectual property rights, our competitors may take advantage of our ideas and compete directly against us.
Our success will depend to a significant degree on our ability to secure and protect intellectual property rights and enforce patent and trademark protections relating to our technology. While we believe that the protection of patents and trademarks is important to our business, we also rely on a combination of copyright, trade secret, nondisclosure and confidentiality agreements, know-how and continuing technological innovation to maintain our competitive position. From time to time, litigation may be advisable to protect our intellectual property position. However, these legal means afford only limited protection and may not adequately protect our rights or permit us to gain or keep any competitive advantage. Any litigation in this regard could be costly, and it is possible that we will not have sufficient resources to fully pursue litigation or to protect our intellectual property rights. This could result in the rejection or invalidation of our existing and future patents. Any adverse outcome in litigation relating to the validity of our patents, or any failure to pursue litigation or otherwise to protect our patent position, could materially harm our business and financial condition. In addition, confidentiality
agreements with our employees, consultants, customers, and key vendors may not prevent the unauthorized disclosure or use of our technology. It is possible that these agreements will be breached or that they will not be enforceable in every instance, and that we will not have adequate remedies for any such breach. Enforcement of these agreements may be costly and time consuming.
Furthermore, the laws of foreign countries may not protect our intellectual property rights to the same extent as the laws of the United States.We may incur substantial costs as a result of litigation or other proceedings relating to patent and other intellectual property rights, and we may be unable to protect our rights to, or use of, our technology.
If we choose to go to court to stop someone else from using the inventions claimed in our patents or our licensed patents, that individual or company has the right to ask the court to rule that these patents are invalid and/or should not be enforced against that third party. These lawsuits are expensive and would consume time and other resources even if we were successful in stopping the infringement of these patents. In addition, there is a risk that the court will decide that these patents are invalid or unenforceable and that we do not have the right to stop the other party from using the inventions. There is also the risk that, even if the validity or enforceability of these patents is upheld, the court will refuse to stop the other party on the grounds that such other party’s activities do not infringe our rights.
If we wish to use the technology claimed in issued and unexpired patents owned by others, we will need to obtain a license from the owner, enter into litigation to challenge the validity or enforceability of the patents or incur the risk of litigation in the event that the owner asserts that we infringed its patents. The failure to obtain a license to technology or the failure to challenge an issued patent that we may require to discover, develop or commercialize our products may have a material adverse effect on us.
If a third party asserts that we infringed its patents or other proprietary rights, we could face a number of risks that could seriously harm our results of operations, financial condition and competitive position, including:
| ●
| patent infringement and other intellectual property claims, which would be costly and time consuming to defend, whether or not the claims have merit, and which could delay a product and divert management’s attention from our business;
|
| ●
| substantial damages for past infringement, which we may have to pay if a court determines that our product or technologies infringe a competitor’s patent or other proprietary rights;
|
| ●
| a court prohibiting us from selling or licensing our technologies unless the third party licenses its patents or other proprietary rights to us on commercially reasonable terms, which it is not required to do; and
|
| ●
| if a license is available from a third party, we may have to pay substantial royalties or lump-sum payments or grant cross licenses to our patents or other proprietary rights to obtain that license.
|
•patent infringement and other intellectual property claims, which would be costly and time consuming to defend, whether or not the claims have merit, and which could delay a product and divert management’s attention from our business;
•substantial damages for past infringement, which we may have to pay if a court determines that our product or technologies infringe a competitor’s patent or other proprietary rights;
•a court prohibiting us from selling or licensing our technologies unless the third party licenses its patents or other proprietary rights to us on commercially reasonable terms, which it is not required to do; and
•if a license is available from a third party, we may have to pay substantial royalties or lump-sum payments or grant cross licenses to our patents or other proprietary rights to obtain that license.
The biotechnology industry has produced a proliferation of patents, and it is not always clear to industry participants, including us, which patents cover various types of products or methods of use. The coverage of patents is subject to interpretation by the courts, and the interpretation is not always uniform. If we are sued for patent infringement, we would need to demonstrate that our products or methods of use either do not infringe the patent claims of the relevant patent, and/or that the patent claims are invalid, and/or that the patent is unenforceable, and we may not be able to do this. Proving invalidity, in particular, is difficult since it requires a showing of clear and convincing evidence to overcome the presumption of validity enjoyed by issued patents.
U.S. patent laws as well as the laws of some foreign jurisdictions provide for provisional rights in published patent applications beginning on the date of publication, including the right to obtain reasonable royalties, if a patent subsequently issues and certain other conditions are met.
Because some patent applications in the United States may be maintained in secrecy until the patents are issued, because patent applications in the United States and many foreign jurisdictions are typically not published until 18 months after filing, and because publications in the scientific literature often lag behind actual discoveries, we cannot be certain that others have not filed patent applications for technology covered by our issued patents or our pending applications, or that we were the first to invent the technology.
Patent applications filed by third parties that cover technology similar to ours may have priority over our patent applications and could further require us to obtain rights to issued patents covering such technologies. If another party files a U.S. patent application on an invention similar to ours, we may elect to participate in or be drawn into an interference proceeding declared by the U.S. Patent and Trademark Office to determine priority of invention in the United States. The costs of these proceedings could be substantial, and it is possible that such efforts would be unsuccessful, resulting in a loss
of our U.S. patent position with respect to such inventions. Some of our competitors may be able to sustain the costs of complex patent litigation more effectively than we can because they have substantially greater resources. In addition, any uncertainties resulting from the initiation and continuation of any litigation could have a material adverse effect on our ability to raise the funds necessary to continue our operations. We cannot predict whether third parties will assert these claims against us, or whether those claims will harm our business. If we are forced to defend against these claims, whether they are with or without any merit and whether they are resolved in favor of or against us, we may face costly litigation and diversion of management’s attention and resources. As a result of these disputes, we may have to develop costly non-infringing technology, or enter into licensing agreements. These agreements, if necessary, may be unavailable on terms acceptable to us, if at all, which could seriously harm our business or financial condition.
Our inability to protect our systems and data from continually evolving cybersecurity risks or other technological risks, including as a result of breaches of our associated third parties,parties' information technology systems, could affect our ability to conduct our business.
In conducting our business, we process, transmit and store sensitive,
business informationproprietary and
personalconfidential information about our
employees, customers, vendors, and other
parties.parties, including business and personal information. This information may include account access credentials, credit and debit card numbers, bank account numbers, social security numbers, driver’s license numbers, names and addresses and other types of sensitive business or personal information. Some of this information is also processed and stored by our third-party service providers to whom we outsource certain functions and other agents, including our customers, which we refer to collectively as our associated third parties.
We are a regular target of malicious third-party attempts,
some of which have been successful, to identify and exploit system vulnerabilities and/or penetrate or bypass our security measures in order to gain unauthorized access to our networks and systems or those of our associated third parties. Such access
has led and could lead
in the future to the compromise of sensitive, business, personal or confidential
information.information or instructions to transfer funds by us or customers to unauthorized recipients. In the third quarter during the year ended December 31, 2022, we experienced an immaterial security breach that successfully redirected payments from BioLife customers to unauthorized bank accounts. As a result, we proactively employ multiple methods at different layers of our systems to defend our systems against intrusion and attack and to protect the data we collect.
However,These measures have been breached in the past, and we cannot be certain that
these measuresthey will be successful and
will be sufficient to counter
all current and emerging technology threats that are designed to breach our systems in order to gain access to confidential information.
Our computer systems and our associated third parties’ computer systems could be in the future, subject to breach, and our data protection measures may not prevent unauthorized access.
The techniques used to obtain unauthorized access, disable or degrade service, or sabotage systems change frequently and are often difficult to detect. Threats to our systems and our associated third parties’ systems can derive
and have derived from human error, fraud or malice on the part of employees or third parties, or may result from accidental technological
failure.failure, including as a result of natural disasters, power failures or other events beyond our control. Computer viruses and other malware can be distributed and
have infiltrated, and could
in the future infiltrate, our systems or those of our associated third parties. In addition, denial of service or other attacks could be launched against us for a variety of purposes, including to interfere with our services or create a diversion for other malicious activities. Our defensive measures
in the past have not, and in the future, may not, prevent downtime, unauthorized access, or use of sensitive data. Further, while we select our
associated third
party service providersparties carefully, and we seek to ensure that our customers adequately protect their systems and data, we do not control their actions and are not able to oversee their processes. Any problems experienced by our associated third parties, including those resulting from breakdowns or other disruptions in the services provided by such parties or cyber-attacks and security breaches, could adversely affect our ability to conduct our business and our financial condition.
We could also be subject to liability for claims relating to
the loss or misuse of personal information, such as violation of data privacy laws. We cannot provide assurance that the contractual requirements related to security and privacy that we impose on our service providers who have access to
our data, including customer
datainformation, will be followed or will be adequate to prevent the unauthorized use or disclosure of
such data. Any failure to adequately enforce or provide these protective measures
or to prevent unauthorized access to our data, including customer information could result in liability,
loss of business, protracted and costly litigation, governmental intervention,
fines and
fines.damage to our reputation.
Risks related to our common stock
Our stock price
and volume may be volatile, and purchasers of our securities could incur substantial losses.
Our
The trading price and volume of our common stock, traded on the NASDAQ Capital Market ("NASDAQ"), has been, and may in the future be, volatile and has experienced price and volume fluctuations.volatile. For example, in the year ended December 31, 2021,2023, the highest intra-day sale price of our common stock on NASDAQ was $60.67$26.89 per share and the lowest intra-day sale price of our common stock on NASDAQ
was
$28.15$8.92 per share.
Our highest trading day volume was 2,242,100 shares traded and the lowest trading day volume was 138,500 shares traded. We may continue to incur substantial increases or decreases in our stock price
and volume in the foreseeable future.
Our stock price and
trading volume and the market prices
and trading volume of many publicly traded companies, including
emerging companies in the life sciences industry, have been, and can be expected to be, highly volatile. The future market price
and trading volume of our common stock could be significantly impacted by numerous factors, including, but not limited to:
| ●
| •Future sales of our common stock or other fundraising events; |
| ●
| Sales of our common stock by existing shareholders;
|
| ●
| Changes in our capital structure, including stock splits or reverse stock splits;
|
| ●
| Announcements of technological innovations for new commercial products by our present or potential competitors;
|
| ●
| Developments concerning proprietary rights;
|
| ●
| Adverse results in our field or with clinical tests of our products in customer applications;
|
| ●
| Unfavorable legislation or regulatory decisions;
|
| ●
| Public concerns regarding our products;
|
| ●
| Variations in quarterly operating results;
|
| ●
| General trends in the health care industry;
|
| ●
| Global viruses, epidemics and pandemics, including the current COVID-19 pandemic; and
|
| ●
| Other factors outside of our control, including significant market fluctuations.
|
•Sales of our common stock by existing shareholders;
•Changes in our capital structure, including stock splits or reverse stock splits;
•Changes in our product offerings and business structure through acquisitions or divestitures;
•Announcements of technological innovations for new commercial products by our present or potential competitors;
•Developments concerning proprietary rights;
•Adverse results in our field or with clinical tests of our products in customer applications;
•Adverse litigation;
•Unfavorable legislation or regulatory decisions;
•Public concerns regarding our products;
•Variations in quarterly operating results;
•General trends in the health care industry;
•Global viruses, epidemics, and pandemics, including COVID-19; and
•Other factors outside of our control, including significant market fluctuations.
In addition, sales of a substantial number of shares of our common stock or other securities in the public markets (including an issuance by us of additional securities in a public offering or private placement), or the perception that these sales may occur, could cause the market price of our common stock or other securities to decline and could materially impair our ability to raise capital through the sale of additional securities. The sale of a large number of shares of our common stock or other securities also might make it more difficult for us to sell equity or equity-related securities in the future at a time and at the prices that we deem appropriate
A significant percentage of our outstanding common stock is held by one stockholder, and this stockholder therefore has significant influence on us and our corporate actions.
As of December 31,
2021,2023, based on our review of public filings and the Company’s records, one of our existing stockholders, Casdin Capital, LLC (“Casdin”), owned
7,566,2928,707,165 shares of our common stock, representing
18%19.3% of the issued and outstanding shares of common stock. Accordingly, this stockholder has had, and will continue to have, significant influence in determining the outcome of any corporate transaction or other matter submitted to our stockholders for approval, including mergers, consolidations and the sale of all or substantially all our assets, election of directors and other significant corporate actions. In addition, without the consent of this stockholder
where a stockholder vote may be necessary, we could be prevented from entering into transactions that could be beneficial to us.
Any future sales of our securities in the public markets or any future securities issuances in connection with our acquisition strategy may cause the trading price of our common stock to decline and could impair our ability to raise capital through future equity offerings.
Sales of a substantial number of shares of our common stock or other securities in the public markets, or the perception that these sales may occur, could cause the market price of our common stock or other securities to decline and could materially impair our ability to raise capital through the sale of additional securities. If we issue additional securities in a public offering or a private placement, such sales or any resales of such securities could further adversely affect the market price of our common stock. The sale of a large number of shares of our common stock or other securities also might make it more difficult for us to sell equity or equity-related securities in the future at a time and at the prices that we deem appropriate.
We do not anticipate declaring any cash dividends on our common stock.
We have never declared or paid cash dividends on our common stock and do not plan to pay any cash dividends in the near future. Our current policy is to retain all funds and earnings for use in the operation and expansion of our business.
Anti-takeover provisions in our Amended and Restated Certificate of Incorporation and Amended and Restated Bylaws and under Delaware law could make an acquisition of us, which may be beneficial to our stockholders, more difficult and may prevent attempts by our stockholders to replace or remove our current management and limit the market price of our common stock.
Provisions in our Amended and Restated Certificate of Incorporation and Amended and Restated Bylaws may have the effect of delaying or preventing a change of control or changes in our management, including provisions that:
•authorize our board of directors to issue, without further action by the stockholders, undesignated preferred stock;
•allow stockholders to require us to call a special meeting of stockholders upon written request of the holders of 35% of the outstanding shares entitled to vote thereat;
•establish an advance notice procedure for stockholder nominations;
•provide that vacancies on our board of directors may be filled only by a majority of directors then in office, even though less than a quorum; and
•specify that no stockholder is permitted to cumulate votes at any election of directors.
These provisions may frustrate or prevent any attempts by our stockholders to replace or remove our current management by making it more difficult for stockholders to replace members of our board of directors, which is responsible for appointing the members of our management. In addition, because we are incorporated in Delaware, we are governed by the provisions of Section 203 of the Delaware General Corporation Law, which limits the ability of stockholders owning in excess of 15% of our outstanding voting stock to merge or combine with us.
Risks related to accounting matters
Changes in accounting standards and subjective assumptions, estimates, and judgments by management related to complex accounting matters could significantly affect our financial results or financial condition.
Generally accepted accounting principles and related accounting pronouncements, implementation guidelines, and interpretations with regard to a wide range of matters that are relevant to our business, such as revenue recognition, asset impairment and fair value determinations, inventories, business combinations and intangible asset valuations, leases, and litigation, are highly complex and involve many subjective assumptions, estimates, and judgments. Changes in these rules or their interpretation or changes in underlying assumptions, estimates, or judgments could significantly change our reported or expected financial performance or financial condition and could require us to restate our prior financial statements and issue a non-reliance statement regarding our prior financial disclosures.
Our ability to use net operating loss and tax credit carryforwards and certain built-in losses to reduce future tax payments is limited by provisions of the Internal Revenue Code, and it is possible that certain transactions or a combination of certain transactions may result in material additional limitations on our ability to use our net operating loss and tax credit carryforwards.
Section 382 and 383 of the Internal Revenue Code of 1986, as amended, contain rules that limit the ability of a company that undergoes an ownership change, which is generally any change in ownership of more than 50% of its stock over a three-year period, to utilize its net operating loss and tax credit carryforwards and certain built-in losses recognized in years after the ownership change. These rules generally operate by focusing on ownership changes involving stockholders owning directly or indirectly 5% or more of the stock of a company and any change in ownership arising from a new issuance of stock by the company. Generally, if an ownership change occurs, the yearly taxable income limitation on the use of net operating loss and tax credit carryforwards and certain built-in losses is equal to the product of the applicable long-term, tax-exempt rate and the value of the company’s stock immediately before the ownership change. We may be unable to offset our taxable income with losses, or our tax liability with credits, before such losses and credits expire and therefore would incur larger federal income tax liability.
If we are unable to develop an effective system of internal controls, we may not be able to accurately report financial results or prevent fraud. If we identify additional
We have identified material weaknesses in our internal control over financial reporting,
and if our remediation of such material weaknesses is not effective, or
if we are unable to
rectify the material weaknesses thatdevelop and maintain an effective system of internal control over financial reporting or disclosure controls and procedures, we
have identified,may not be able to accurately and timely report financial results or prevent fraud, and our ability to meet our reporting obligations and the trading price of our
common stock could be negatively affected.
As described in Item 9A — Controls and Procedures and elsewhere in this Form 10-K, Management identified material weaknesses in our internal control over financial reporting for the fiscal years ended December 31,
20212023 and
2020.In the course of making our assessment of the effectiveness of2022. Effective internal control over financial reporting as of December 31, 2019, we identified a material weakness in our internal control over financial reporting with regard to our controls over the accounting for financial instruments containing characteristics of both liabilities and equity due to insufficient technical resources.
In the course of making our assessment of the effectiveness of internal control over financial reporting as of December 31, 2021, we identified several material weaknesses. Material weaknesses were identified in relation to (i) inappropriately designed entity-level controls impacting the control environment, risk assessment, and monitoring activities to prevent or detect material misstatements to the consolidated financial statements attributed to an insufficient number of qualified resources and inadequate oversight and accountability over the performance of controls, ineffective identification and assessment or risks impacting internal control over financial reporting, and ineffective monitoring controls; (ii) information system logical access within certain key financial systems; (iii) accounting policies and procedures and related controls over complex financial statement areas; (iv) accounting policies, procedures, and related controls over assets held for lease; (v) accounting policies, procedures, and related controls over the preparation and review of projected financial information used in determining the valuation of acquired intangible assets and contingent consideration in business combinations as well as the quantitative impairment analysis of indefinite-lived intangible assets; and (vi) policies, procedures, and related controls over the presentation and disclosure of amounts presented in the consolidated financial statements in accordance with the applicable financial reporting requirements. Because material weaknesses in internal control exist, the Company’s internal controls may not prevent, or detect and correct a material misstatement in its financial statements or disclosures.
The aforementioned material weaknesses did not result in any identified material misstatements to our financial statements, and there were no changes to previously released financial results.
Effective internal controls areis necessary to provide reliable financial reports and to assist in the effective prevention of fraud. Any inability to provide reliable financial reports or prevent fraud could harm our business. We regularly review and update our system of internal controls,control over financial reporting, disclosure controls and procedures, and corporate governance policies. In addition, we are required under the Sarbanes-Oxley Act of 2002 to report annually on our internal control over financial reporting. Any system of internal controls, however well designed and operated, is based in part on certain assumptions and can provide only reasonable, not absolute, assurances that the objectives of the system are met. A material weakness is a deficiency, or a combination of deficiencies, in internal control over financial reporting, such that there is a reasonable possibility that a material misstatement of our annual or interim financial statements will not be prevented or detected on a timely basis. Accordingly, a material weakness increases the risk that the financial information we report contains material errors.
While
In the course of making our assessment of the effectiveness of internal control over financial reporting as of December 31, 2023, we areidentified several material weaknesses. Material weaknesses were identified in relation to (i) ineffective control environment attributed to the acquisition of six private companies in 2019 – 2021 without the proper internal control infrastructure in place, insufficient resources with the appropriate level of internal controls training, knowledge, and expertise to meet our financial reporting requirements and provide adequate oversight over the performance of internal controls, and turnover in the processfirst half of addressing2023 in key positions, resulting in a delay in establishing control activities to effectively mitigate the risks; (ii) internal control procedures over certain financial statement areas; and (iii) change management controls over certain key financial systems.
In the course of making our assessment of the effectiveness of internal control over financial reporting as of December 31, 2022, we identified several material weaknesses. Material weaknesses were identified in relation to (i) inappropriately designed entity-level controls impacting the control environment, risk assessment, and monitoring activities to prevent or detect material misstatements to the consolidated financial statements attributed to an insufficient number of qualified resources and inadequate oversight and accountability over the performance of controls, ineffective identification and assessment or risks impacting internal control over financial reporting, and ineffective monitoring controls; (ii) information system logical access within certain key financial systems; (iii) accounting policies and procedures and related controls over certain financial statement areas; (iv) inadequate risk assessment, accounting policies, procedures, and related controls performed over the recognition and measurement of indirect tax liabilities.
The aforementioned material weaknesses did not result in any identified material misstatements to our financial statements, and there were only immaterial changes to previously released financial results.
To address our material weaknesses,
as disclosed herein,we have developed and begun to implement the remediation plans described in Item 9A — Controls and Procedures and elsewhere in this Form 10-K. However, elements of our remediation
planplans can only be accomplished over time and we can offer no assurance that these initiatives will ultimately have the intended effects. Any failure to
establish and maintain
sucheffective internal
control over financial reporting and disclosure controls
and procedures could adversely impact our ability to report our financial results on a timely and accurate basis. If our financial statements are not accurate, investors may not have a complete understanding of our operations or may lose confidence in our reported financial information. Likewise, if our financial statements are not filed on a timely basis as required by the SEC and The NASDAQ Stock Market
LLC, we could face severe consequences from those authorities. In either case, it could result in a material adverse effect on our business or have a negative effect on the trading price of our common stock. Further, if we fail to remedy these deficiencies (or any other future deficiencies) or maintain the adequacy of our internal
control over financial reporting and disclosure controls
and procedures, we could be subject to regulatory scrutiny, civil or criminal penalties or shareholder litigation. We can give no assurance that the measures we have taken and plan to take in the future will remediate the material weaknesses identified or that any additional material weaknesses or restatements of our financial statements will not arise in the future due to a failure to implement and maintain adequate internal control over financial reporting or
circumvention of those controls.disclosure controls and procedures.
Further, in the future, if we cannot conclude that we have effective internal control over
our financial reporting
or disclosure controls and procedures, or if our independent registered public accounting firm is unable to provide an unqualified opinion regarding the effectiveness of our internal control over financial reporting, investors could lose confidence in the reliability of our financial statements, which could lead to a decline in our stock price. Failure to comply with reporting requirements could also subject us to sanctions and/or investigations by the SEC, The NASDAQ Stock Market
LLC or other regulatory authorities.
Risks related to
COVID-19 and other disruptive events
Our
Public health crises, such as the COVID-19 pandemic, have adversely affected, and could in the future adversely affect, our business, financial
condition andcondition. results of operations
may be adversely affected by the COVID-19 pandemic.and cash flows.
We
continueare subject to
closely monitor the impact ofrisks associated with public heath crises, including those related to the COVID-19 global
pandemic on all aspects of our business and geographies, including how it has and will impact our customers, team members, suppliers, vendors, business partners and distribution channels.pandemic. The COVID-19
global pandemic has created significant volatility, uncertainty, and economic disruption, which
has had, and may continue to
affecthave, an adverse effect our business operations,
and may materially and adversely affect our results of operations, cash flows and financial
position.We are currently followingcondition. Other future public health crises may also have a negative impact on our business.
In particular, the recommendationsfinancial or operational impacts as a result of localCOVID-19 or other future public health authorities to minimize exposure riskcrises have included, and may in the future include:
•The temporary closure of our manufacturing facilities and/or those of our outside manufacturers;
•Unavailability of supplies and other components for our team members and visitors. While we have implemented specific business continuity plans to reduce the impact of COVID-19 and believe that we have sufficient inventory to meet forecasted demand for the next six to nine months, there is no guarantee that our continuity plan will be successful or that our inventory will meet forecasted or actual demand.In the third and fourth quarters of 2021, we experiencedproducts, including difficulties in obtaining sheet metal and electrical components that incorporateincorporating semiconductor chips for the manufacture of our ULTUL freezer manufacturing operations. These difficulties ledproducts, which have largely abated during the year ended December 31, 2023
; •Costs associated with protecting the health of our employees and adhering to any guidance or orders of various governmental authorities, such masking, testing, and social distancing requirements;
•Risks associated with remote work, including increased supplier pricing for these materials and reduced production levelscybersecurity risk;
•Widespread staffing shortages;
•Outbreaks of disease in the third and fourth quartersour facilities or those of 2021. We believe some or all of these difficulties arose as a result of suppliers’ production planning in response to COVID-19 and logistics challenges that have occurred as a result of the global pandemic. We believe the supply chain challenges related to sheet metal that we experienced in 2021 have been substantially mitigated through the diversification of suppliers. The availability of components that incorporate semiconductor chips, however, continues to be a challenge in comparison to pre-pandemic availability levels. Our strategic partnerships with key suppliers have secured sufficient supply of these electrical components for our operations for the foreseeable future.Additional disruptions may occur for our customers or suppliers that may materially affect our ability to obtain supplies or other components for our products, produce our products or deliver inventory in a timely manner. This would result in lost product revenue, additional costs, or penalties, or damage our reputation. Similarly, COVID-19 could impact our customers and/or suppliers as a result of a health epidemic or other outbreak occurring in other locationsthird-party service providers, which could reducerequire us or them to temporarily shut down business operations or cause a disruption to, or shortage in, our or their workforce;
•Significant volatility or reductions in demand for our products or their ability to deliver needed supplies for the productionproducts;
•Delays in shipments of our products.We cannot predict at this timeproducts, which could harm our customer relations and adversely impact our competitive position and sales;
•Restrictions on the fullability of our personnel to access customers;
•Challenges to our capacity to manufacture, sell and support the use of our products; and
•Volatility in credit or financial markets.
The extent to which thepublic health crises, including health epidemics and other outbreaks, such as COVID-19, pandemic will impactimpacts our business or results and financial condition, which will depend on many factors thatfuture developments, which are not known at this time, ashighly uncertain and cannot be predicted, including new information which may emerge concerning the situation is unprecedentedseverity of a particular virus and continuesits variants and the actions to evolve. Thesecontain it or treat its impact, among others. Such impacts of the COVID-19 pandemic include, among others, the extent of harm to public health, including the duration of the pandemic, any potential subsequent waves of COVID-19 infection, the emergence of new variants of COVID-19, some of which may be more transmissible or virulent than the initial strain, and the availability and distribution of effective vaccines and medical treatments, further disruption to the manufacturing of and demand for our products, our ability to effectively manage inventory levels and adjust our production schedules to align with demand, impairments and other charges, the impact of the global business and economic environment on liquidity and the availability of capital, the costs incurred to keep our employees safe while maintaining continued operations, and our ability to effectively motivate and retain the necessary workforce. We are staying in close communication with our manufacturing facilities, employees, customers, and suppliers, and acting to mitigate the impact of this dynamic and evolving situation through a variety of measures, which may not be successful and are subject to the factors described above, many of which are uncertain or outside of our control. Even after the COVID-19 pandemic has subsided, we may continue to experience impacts to our business as a result of its global economic impact. In addition, we cannot at this time quantify or forecast the potential business impact of any future public health crisis.
To the extent the COVID-19 pandemic or other public health crisis adversely affects our business, results of operations or financial condition, many of the other risks described in this “Risk Factors” section may also be heightened. Natural disasters, geopolitical unrest, war, terrorism, public health issues or other catastrophic events could disrupt the supply, delivery or demand of products, which could negatively affect our operations and performance.
We are subject to the risk of disruption by earthquakes, floods and other natural disasters, fire, power shortages, geopolitical unrest, war, terrorist attacks and other hostile acts, public health issues, epidemics or pandemics and other events beyond our control and the control of the third parties on which we depend. Any of these catastrophic events, whether in the United States or abroad, may have a strong negative impact on the global economy, our employees, facilities, partners, suppliers, distributors or customers, and could decrease demand for our products, create delays and inefficiencies in our supply chain and make it difficult or impossible for us to deliver products to our customers. A catastrophic event that results in the destruction or disruption of our data centers or our critical business or information technology systems would severely affect our ability to conduct normal business operations and, as a result, our operating results would be adversely affected.
ITEM 1B.
| UNRESOLVED STAFF COMMENTS
|
ITEM 1B. UNRESOLVED STAFF COMMENTS
ITEM 1C. CYBERSECURITY
We have a thorough process for identifying, assessing, and managing cybersecurity risks within our broader risk management framework. We gather insights from external experts and internal threat intelligence teams for our cybersecurity risk management program. A dedicated team oversees cybersecurity risk management, led by professionals with deep expertise, including our Vice President, Cybersecurity and Information Security Officer. Our executive leadership, supported by our cybersecurity team, oversees our enterprise risk management and regularly considers cybersecurity and other material risks.
Within our cybersecurity risk management system, our incident management team tracks and logs privacy and security incidents across the Company and third-party service providers. Significant incidents undergo review by a cross-functional group, with immediate escalation for potentially material incidents. We consult with outside counsel as needed, with final decisions made by senior management.
The Audit Committee oversees cybersecurity risks and incidents, ensuring compliance with disclosure requirements and cooperation with law enforcement. Senior management regularly updates the committee on cyber risks and any material incidents.
While our business strategy and financial condition have not been materially affected by cybersecurity risks, we cannot guarantee future immunity. For more details, refer to Item 1A Risk Factors in our Annual Report on Form 10-K.
ITEM 2. PROPERTIES
Our material office and manufacturing leases are detailed below:
| | | | | | | | | | | | | | | | | | | | |
| Location | | Square Feet | | Principal Use | | Lease Expiration |
Bothell, WA | | 45,522 | | 36,766 | | Corporate headquarters, manufacturing, research and development, marketing, and administrative offices | | July 2031 |
Menlo Park, CA
Woodinville, WA | | 13,578 | | Warehouse | | 3,460January 2030 |
| Albuquerque, NM | | 2,940 | | Research and development and administrative offices | | Month to Month
April 2027 |
Albuquerque, NM
Bruce Township, MI | | 106,998 | | 9,932 | | Manufacturing, research and development, and administrative offices | | December 2022
Month to Month |
Bruce Township, MI
Athens, OH | | 50,000 | | 106,998 | | Manufacturing, research and development, and administrative offices | | Month to Month
March 2028 |
Athens,Nelsonville, OH
| | 24,114 | | Warehouse | | 50,000June 2024 |
| Columbus, OH | | 1,807 | | Administrative offices | | January 2025 |
| Indianapolis, IN | | 11,415 | | Manufacturing, research and development, and administrative offices | | March 2028
September 2024 |
Nelsonville, OH
| | | 22,764 | | Warehouse
| | May 2022
|
Columbus, OH
| | | 1,807 | | Administrative offices
| | Month to Month
|
Indianapolis, IN
| | | 11,415 | | Manufacturing, research and development, and administrative offices
| | September 2024
|
United States | | 12,500 | | 12,500 | | Biological and pharmaceutical specimen storage | | January 2023 2027 |
United States | | 26,600 | | 20,000 | | Biological and pharmaceutical specimen storage | | March 2024 |
United States | | 16,153 | | 16,153 | | Biological and pharmaceutical specimen storage | | June 2024 |
United States | | 16,800 | | 16,800 | | Biological and pharmaceutical specimen storage | | February 2026 |
United States | | 26,800 | | 26,800 | | Biological and pharmaceutical specimen storage | | November 2031 |
Netherlands | | 47,533 | | 47,533 | | Biological and pharmaceutical specimen storage | | March 2026 |
We consider the facilities to be in a condition suitable for their current uses. Because of anticipated growth in the business and due to the increasing requirements of customers or regulatory agencies, we may need to acquire additional space or upgrade and enhance existing space. We believe that adequate facilities will be available upon the conclusion of our leases.
ITEM 3. LEGAL PROCEEDINGS
From time to time, we may be subject to legal proceedings and claims in the ordinary course of business. We are not currently aware of any such proceedings or claims that we believe will have, individually or in the aggregate, a material adverse effect on our business, financial condition or results of operations.
ITEM 4.
| MINE SAFETY DISCLOSURES
|
ITEM 4. MINE SAFETY DISCLOSURES
PART II
ITEM 5.
| MARKET FOR REGISTRANT’S COMMON EQUITY, RELATED STOCKHOLDER MATTERS AND ISSUER PURCHASES OF EQUITY SECURITIES
|
ITEM 5. MARKET FOR REGISTRANT’S COMMON EQUITY, RELATED STOCKHOLDER MATTERS AND ISSUER PURCHASES OF EQUITY SECURITIES
Market information for common stock
Our common stock is traded on the NASDAQ
CapitalStock Market
exchange under the
tickertrading symbol “BLFS.”
Stockholders and dividends
As of
March 16, 2022,February 22, 2024, there were approximately
224256 holders of record of our common stock. We have never paid cash dividends on our common stock and do not anticipate that any cash dividends will be paid in the foreseeable future. We anticipate that we will retain all earnings, if any, to support our operations. Any future determination as to the payment of dividends will be at the sole discretion of our Board of Directors and will depend on our financial condition, results of operations, capital requirements and other factors our Board of Directors deems relevant.
See Item 12 for
Performance graph
The following information
regarding securities authorized for issuanceis not deemed to be “soliciting material” or to be “filed” with the SEC or subject to Regulation 14A under
our equity compensation plans.
Tablethe Exchange Act, or to the liabilities of ContentsSection 18 of the Exchange Act, and will not be deemed to be incorporated by reference into any filing under the Securities Act or the Exchange Act, except to the extent we specifically incorporate it by reference into such a filing.Performance graph
The following graph shows the cumulative total stockholder return on our common stock with the cumulative total return of the S&P Small Cap 600 Index and our peer group, assuming an initial investment of $100 on December 31,
20162018 and the reinvestment of all dividends.
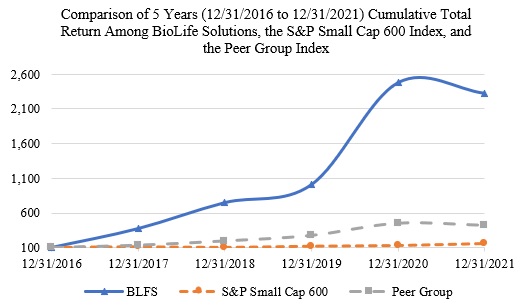
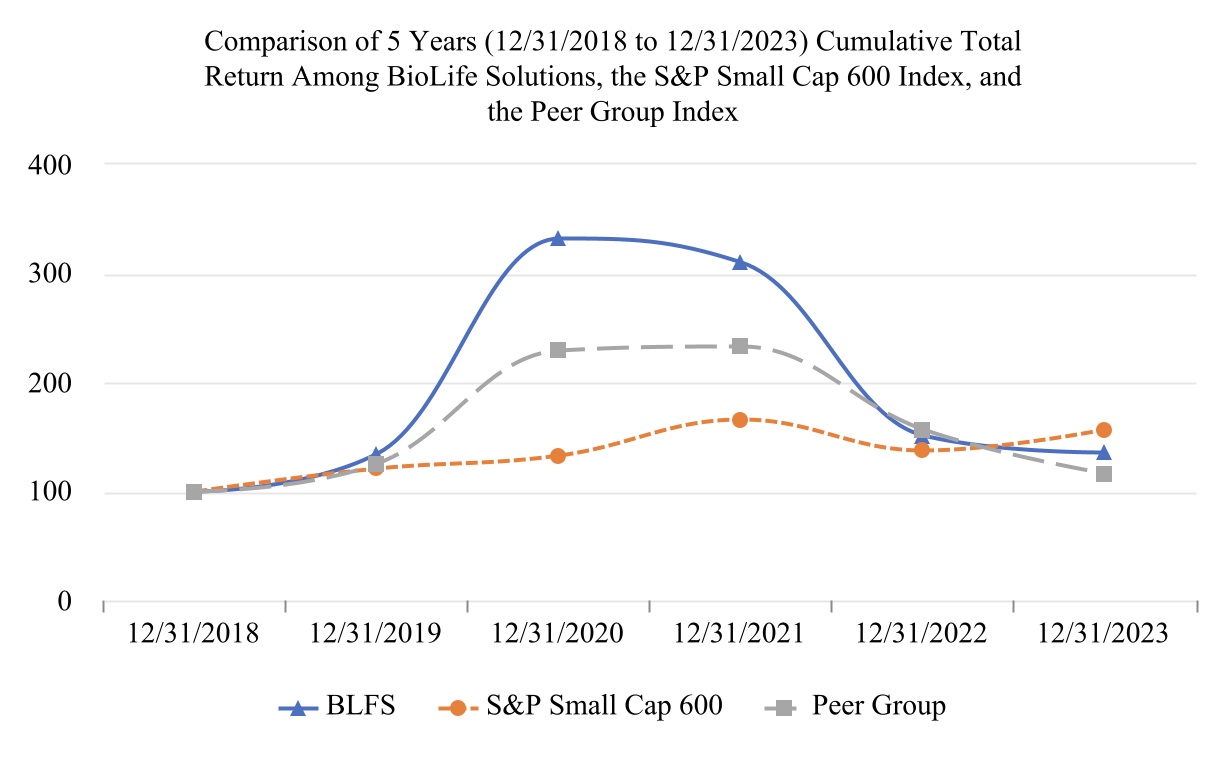
Issuer repurchases of equity securities
Not applicable.
ITEM 6.
| SELECTED CONSOLIDATED FINANCIAL DATA
|
ITEM 6. RESERVED
Reserved.
ITEM 7.
| MANAGEMENT’S DISCUSSION AND ANALYSIS OF FINANCIAL CONDITION AND RESULTS OF OPERATIONS
|
This Form 10-K contains “forward-looking statements”. These forward-looking statements involve a number of risks and uncertainties. We caution readers that any forward-looking statement is not a guarantee of future performance and that actual results could differ materially from those contained in the forward-looking statement. These statements are based on current expectations of future events. Such statements include, but are not limited to, statements about our products, including our newly acquired products, customers, regulatory approvals, the potential utility of and market for our products and services, our ability to implement our business strategy and anticipated business and operations, in particular following the 2021, 2020, and 2019 acquisitions, future financial and operational performance, our anticipated future growth strategy, including the acquisition of synergistic cell and gene therapy manufacturing tools and services or technologies, or other companies or technologies, capital requirements, intellectual property, suppliers, joint venture partners, future financial and operating results, the impact of the COVID-19 pandemic, plans, objectives, expectations and intentions, revenues, costs and expenses, interest rates, outcome of contingencies, business strategies, regulatory filings and requirements, the estimated potential size of markets, capital requirements, the terms of any capital financing agreements and other statements that are not historical facts. You can find many of these statements by looking for words like “believes”, “expects”, “anticipates”, “estimates”, “may”, “should”, “will”, “could” “plan”, “intend”, or similar expressions in this Form 10-K. We intend that such forward-looking statements be subject to the safe harbors created thereby.
These forward-looking statements are based on the current beliefs and expectations of our management and are subject to significant risks and uncertainties. If underlying assumptions prove inaccurate or unknown risks or uncertainties materialize, actual results may differ materially from current expectations and projections. Factors that might cause such a difference include those discussed under “Risk Factors”, as well as those discussed elsewhere in the Form 10-K.
You are cautioned not to place undue reliance on these forward-looking statements, which speak only as of the date of this Form 10-K or, in the case of documents referred to or incorporated by reference, the date of those documents.
All subsequent written or oral forward-looking statements attributable to us or any person acting on our behalf are expressly qualified in their entirety by the cautionary statements contained or referred to in this section. We do not undertake any obligation to release publicly any revisions to these forward-looking statements to reflect events or circumstances after the date of this Form 10-K or to reflect the occurrence of unanticipated events, except as may be required under applicable U.S. securities law. If we do update one or more forward-looking statements, no inference should be drawn that we will make additional updates with respect to those or other forward-looking statements.
ITEM 7. MANAGEMENT’S DISCUSSION AND ANALYSIS OF FINANCIAL CONDITION AND RESULTS OF OPERATIONS
Company Overview
We are a life sciences company that develops,
manufactures and
commercializes innovative technologies used in the manufacture, storage and transportation of biological materials and provides storage solutions for biological and pharmaceutical materials.We develop, manufacture, and marketsupplies bioproduction tools and services to the cell and gene therapy (“CGT”) industry and broader biopharma market, which are designed to improve quality and de-risk biologic manufacturing, storage, distribution, and distribution.transportation in the cell and gene therapy industry and broader biopharma market. Our products are used in basic and applied research and commercial manufacturing of biologic-based therapies. Customers use our products to maintain the health and function of biologic material during sourcing, manufacturing, storage, and distribution.
Our current portfolio of bioproduction tools and services are comprised of three revenue lines that contain seven main offerings: (i) cell processing (including biopreservation media for the preservation of cells and tissues, human platelet lysate media for the supplementation of cell expansion, cryogenic vials and automated fill machines that provide high-quality, efficient, and precise mixes of solutions), (ii) freezers and thaw systems (including a full line of mechanical
ULT,ultra-low temperature (“ULT”), isothermal, and liquid nitrogen freezers and accessories, automated thaw devices which provide controlled, consistent thawing of frozen biologics in vials and cryobags), and (iii)
storage and cold chainBiostorage services (including biological and pharmaceutical storage services
and transport, and “smart”, cloud connected devices for transporting biologic payloads).
We currently operate as one bioproduction tools and services business which supports several steps in the biologic material manufacturing and delivery process. We have a diversified portfolio of tools and services that focus on biopreservation, cell processing, frozen biologic storage products and services, cold-chain transportation, and thawing of biologic materials. We have in-house expertise in cryobiology and continue to capitalize on opportunities to maximize the value of our product platform for our extensive customer base through both organic growth innovations and acquisitions.
Sexton Biotechnologies, Inc. acquisition
On August 9, 2021, BioLife entered into an Agreement and Plan of Merger (the “Sexton Merger Agreement”) with BLFS Merger Sub, Inc., a Delaware corporation (“Sexton Merger Sub”), Fortis Advisors LLC, in its capacity as the representative of the stockholders of Sexton (the “Sexton Seller Representative”) and Sexton Biotechnologies, Inc., a Delaware corporation.
On September 1, 2021, the Company completed the merger of Sexton Merger Sub with and into Sexton and Sexton became a wholly-owned subsidiary of the Company (the “Sexton Merger”). As consideration for the Sexton Merger (the “Sexton Merger Consideration”), holders of common stock, preferred stock and options of Sexton, other than the Company (collectively, the “Sexton Participating Holders”), are entitled
Subsequent to
receive an aggregate of 530,502 newly issued shares of the Company’s common stock, subject to certain post-closing adjustments, of which 477,452 shares of Common Stock were issued to the Sexton Participating Holders at the Closing, and 53,050 shares of Common Stock, or approximately 10% of the Merger consideration, were deposited into an escrow account for indemnification and post-closing purchase price adjustment purposes. Prior to the merger, the Company held preferred stock in Sexton, which was accounted for using a measurement alternative that measures the securities at cost minus impairment, if any. The Company accounted for the merger as a step acquisition, which required remeasurement of the Company’s existing ownership in Sexton to fair value prior to completing the acquisition method of accounting. Using step acquisition accounting, the Company increased the value of its existing equity interest to its fair value, resulting in the recognition of a non-cash gain of $6.5 million, which was included in the gain on acquisition of Sexton Biotechnologies, Inc. in the Consolidated Statements of Operations in the year ended December 31, 2021. The Company utilized a market-based valuation approach to determine the fair value of the existing equity interest based on the total merger consideration offered and the Company’s stock price at acquisition.The Sexton Merger was accounted for as a purchase of a business under FASB ASC Topic 805, Business Combinations. The fair value of the net tangible assets acquired was approximately $4.1 million, the deferred tax liability acquired was approximately $1.5 million, the fair value of the intangible assets acquired was approximately $8.8 million, and the residual goodwill was approximately $28.5 million. The fair value calculations required critical estimates, including, but not limited to, future expected cash flows, revenue and expense projections, discount rates, revenue volatility, and royalty rates.
Global Cooling, Inc. acquisition
On March 19, 2021, the Company entered into an Agreement and Plan of Merger (the “GCI Merger Agreement”) with BLFS Merger Subsidiary, Inc., a Delaware corporation (“GCI Merger Sub”), Global Cooling, a Delaware corporation and Albert Vierling and William Baumel, in their capacity as the representatives of the stockholders of GCI (collectively, the “GCI Seller Representative”).
On May 3, 2021, pursuant to the GCI Merger Agreement, subject to the terms and conditions set forth therein, the transactions contemplated by the GCI Merger Agreement were consummated (the “GCI Closing”), GCI Merger Sub merged with and into GCI (the “GCI Merger” and, together with other transactions contemplated by the GCI Merger Agreement, the “GCI Transactions”), with GCI continuing as the surviving corporation in the GCI Merger and a wholly-owned subsidiary of the Company. In the GCI Merger, all of the issued and outstanding shares of capital stock of GCI immediately prior to the filing of the Certificate of Merger with the Secretary of State of the State of Delaware (other than those properly exercising any applicable dissenter’s rights under Delaware law) were converted into the right to receive the GCI Merger Consideration (as defined below). The Company paid the GCI Merger Consideration to the holders of common stock and preferred stock of GCI (collectively, the “GCI Stockholders”).
The aggregate merger consideration paid pursuant to the GCI Merger Agreement to the GCI Stockholders was 6,646,870 newly issued shares of common stock, provided, however, that the GCI Merger Consideration otherwise payable to GCI Stockholders is subject to the withholding of the GCI Escrow Shares (as defined below) and is subject to reduction for indemnification obligations. The GCI Merger Consideration allocable to one GCI stockholder was reduced by 10,400 shares to satisfy an outstanding note receivable of $374,000. In accordance with ASC 805, the Company recognized the settlement of pre-existing relationships in the forms of cash deposits, trade receivables, and trade payables, which are included in the consideration transferred. The GCI Merger Consideration is not subject to any purchase price adjustments.
At the GCI Closing, approximately nine percent (9%) of the GCI Merger Consideration (the “Escrow Shares”, along with any other dividends, distributions or other income on the GCI Escrow Shares, the “GCI Escrow Property”) otherwise issuable to the GCI Stockholders (allocated pro rata among the GCI Stockholders based on the GCI Merger Consideration otherwise issuable to them at the GCI Closing), was deposited into a segregated escrow account in accordance with an escrow agreement to be entered into in connection with the GCI Transactions (the “GCI Escrow Agreement”).
The GCI Escrow Property will be held for a period of up to twenty-four (24) months after the GCI Closing as the sole and exclusive source of payment for any post-GCI Closing indemnification claims (other than fraud claims), unless earlier released in accordance with the terms of the GCI Escrow Agreement.
The GCI Merger was accounted for as a purchase of a business under FASB ASC Topic 805, Business Combinations. The fair value of the net tangible assets acquired was $740,000, the deferred tax liability acquired was $24.1 million, the fair value of the intangible assets acquired was $120.5 million, and the residual goodwill was $137.8 million. The fair value calculations required critical estimates, including, but not limited to, future expected cash flows, revenue and expense projections, discount rates, revenue volatility, and royalty rates.
SciSafe Holdings, Inc. acquisition
On September 18, 2020, BioLife entered into a Stock Purchase Agreement, by and among the Company, SciSafe Holdings, Inc., a Delaware corporation, and the stockholders of SciSafe (collectively, the “SciSafe Sellers”), pursuant to which the Company agreed to purchase from the SciSafe Sellers one hundred percent (100%) of the issued and outstanding capital shares or other equity interests of SciSafe (the “SciSafe Acquisition”). The SciSafe Acquisition closed October 1, 2020.
In connection with the SciSafe Acquisition, the Company issued to the SciSafe Sellers 611,683 shares of common stock valued at $29.29 per share and a cash payment of $15 million, with $1.5 million held in escrow to account for adjustments for net working capital and as a security for, and a source of payment of, the Company’s indemnity rights. Pending the occurrence of certain events, the Company will issue to the SciSafe Sellers an additional 626,000 shares of common stock, which are issuable to SciSafe Sellers upon SciSafe achieving certain specified revenue targets in each year from 2021 to 2024. The revenue target set for 2021 was met and, therefore, has resulted in 64,130 shares of common stock becoming issuable to the SciSafe Sellers.
The SciSafe Acquisition was accounted for as a purchase of a business under FASB ASC Topic 805, Business Combinations. The fair value of the contingent consideration was $3.7 million, the fair value of the net tangible assets acquired was $2.8 million, the deferred tax liability was $3.3 million, the fair value of the intangible assets acquired was $12.1 million, and the residual goodwill was $24.9 million. The fair value estimates required critical estimates, including, but not limited to, future expected cash flows, revenue and expense projections, discount rates, revenue volatility, and royalty rates.
Custom Biogenic Systems, Inc. Acquisition
On November 10, 2019, we entered into an Asset Purchase Agreement, by and among the Company, Arctic Solutions, Inc., a Delaware corporation and wholly-owned subsidiary of the Company, and Custom Biogenic Systems, Inc., a Michigan corporation (“CBS Seller”), pursuant to which we agreed to purchase from the CBS Seller substantially all of CBS Seller’s assets, properties and rights (the “CBS Acquisition”). The CBS Seller, a privately held company with operations located near Detroit, Michigan, designs and manufactures liquid nitrogen laboratory freezers and cryogenic equipment and also offers a related cloud-based monitoring system that continuously assesses biologic sample storage conditions and alerts equipment owners if a fault condition occurs. The Acquisition closed on November 12, 2019.
In connection with the CBS Acquisition, we paid to CBS Seller a base payment in the amount of $15.0 million, consisting of a cash payment of $11.0 million paid at the closing of the CBS Acquisition, less a cash holdback escrow of $550,000 to satisfy certain indemnification claims, and an aggregate number of shares of our common stock, with an aggregate fair value equal to $4.0 million, less a holdback escrow of shares of Common Stock with an aggregate value equal to $3.0 million to satisfy potential payments related to any product liability claims outstanding as of March 13, 2019 and potential earnout payments in calendar years 2020, 2021, 2022, 2023 and 2024 of up to an aggregate of, but not exceeding, $15.0 million payable to CBS Seller upon achieving certain specified revenue targets in each year for certain product lines. The revenue targets set for 2020 and 2021 were not met and no amounts were paid or are considered payable for the earnouts related to those years.
The CBS acquisition was accounted for as a purchase of a business under FASB ASC Topic 805, Business Combinations. Under the acquisition method of accounting, the acquired assets and liabilities assumed from CBS were recorded as of the acquisition date, at their fair values, and consolidated with BioLife. The fair value of the net tangible assets acquired was $6.0 million, the fair value of the identifiable intangibles was $6.8 million, and the residual goodwill was $3.1 million. The fair value estimates required critical estimates, including, but not limited to, future expected cash flows, revenue and expense projections, discount rates, revenue volatility, and royalty rates.
SAVSU Technologies, Inc. Acquisition
On August 7, 2019, the Company consummated the acquisition (the “SAVSU Acquisition”) of the remaining shares of SAVSU Technologies, Inc., a Delaware corporation, pursuant to a Share Exchange Agreement (the “Exchange Agreement”) by and among the Company, SAVSU and SAVSU Origin LLC, a Delaware limited liability company (“Origin”). Pursuant to the Exchange Agreement, Origin agreed to transfer to the Company and the Company agreed to acquire from Origin 8,616 shares of common stock of SAVSU, representing the remaining 56% of the outstanding shares of SAVSU that the Company did not own, in exchange for 1,100,000 shares of common stock of the Company. On August 8, 2019, the Company completed the SAVSU Acquisition, and SAVSU became a wholly owned subsidiary of the Company.
SAVSU is a leading developer and supplier of next generation cold chain management tools for CGT. The evo® cloud connect platform allows biologic products to be traced and tracked in real time. Our evo platform consists of rentable cloud connected shippers and evo technology tracking software provides real-time information on geolocation, payload temperature, ambient temperature, tilt of shipper, humidity, altitude, and real-time alerts when a shipper has been opened. Our internally developed evo software allows customers to customize alert notifications both in data measurements and user requirements. The evo Dry Vapor Shipper (“DVS”) is specifically marketed to CGT companies. The evo DVS has improved form factor and ergonomics over the traditional dewar, including extended thermal performance, reduced liquid nitrogen recharge time, improved payload extractors and ability to maintain temperature for longer periods on its side. The evo DVS does not require to be shipped in a pallet format, enabling shipping on narrow-bodied aircraft which is not an option for competitors who use palletized shipments. Our integrated system of internal and external packing innovations reduces risk of payload breakage due to shock while in transportation.
The Company paid to Origin 1,100,000 shares of unregistered common stock totaling $19.9 million (based on a share price of $18.12 at the time of acquisition) for the 56% we did not previously own.
The SAVSU Acquisition was accounted for as a purchase of a business under ASC 805, Business Combinations. Under the acquisition method of accounting, the acquired assets and liabilities assumed from SAVSU were recorded as of the acquisition date, at their fair values, and consolidated with BioLife. The fair value of the net tangible assets acquired was $4.2 million, the fair value of the identifiable intangibles was $12.2 million, and the residual goodwill was $19.5 million. The fair value estimates required critical estimates, including, but not limited to, future expected cash flows, revenue and expense projections, discount rates, revenue volatility, and royalty rates.
Astero Bio Corporation Acquisition
On April 1, 2019, BioLife completed the acquisition of all the outstanding shares of Astero (the “Astero Acquisition”). Astero’s ThawSTAR product line is comprised of a family of automated thawing devices for frozen cell and gene therapies packaged in cryovials and cryobags. The products improve the quality of administration of high-value, temperature-sensitive biologic therapies to patients by standardizing the thawing process and reducing the risks of contamination and overheating, which are inherent with the use of traditional water baths.
In connection with the Astero Acquisition, the Company paid a base payment in the amount of $12.5 million consisting of an initial cash payment of $8.0 million at the closing of the transactions contemplated by the Purchase Agreement, subject to adjustment for working capital, net debt and transaction expenses, and a deferred cash payment that was paid into escrow of $4.5 million payable upon the earlier of Astero meeting certain product development milestones or one year after the date of the Closing. In addition to the consideration paid, the sellers were eligible to receive earnout payments in calendar years 2021, 2020, and 2019 of up to an aggregate of $3.5 million, which would have been payable upon Astero achieving certain specified revenue targets in each year and a separate earnout payment of $5.0 million for calendar year 2021 which would have been payable upon Astero achieving a cumulative revenue target over the three-year period from 2019 to 2021. In the second quarter of 20202023, we paid $483,000began to seek divestment of our Freezer Business from our current product portfolio. For additional information regarding our ongoing initiative to divest the Freezer Business, see “Item 1A. Risk Factors” of this Annual Report for additional details.
Segment reporting
Management views the
earnout relatedCompany's operations and makes decisions regarding how to
2019 revenues. Revenue targets for 2020, 2021,allocate resources as one reportable segment and
the cumulative period from 2019 to 2021 were not met and no amounts were paid or are considered payable for the earnouts related to those years.The Astero acquisition was accounted for as a purchase of a business under FASB ASC Topic 805, Business Combinations. Under the acquisition method of accounting, the assets acquired and liabilities assumed from Astero were recorded as of the acquisition date, at their respective fair values, and consolidated with those of BioLife. The fair value of the contingent consideration of $1.5 million was determined using an option pricing model. The fair value of the net tangible assets acquired was $324,000, the fair value of the intangible assets acquired was $4.1 million, and the residual goodwill was $9.5 million. The fair value estimates required critical estimates, including, but not limited to, future expected cash flows, revenue and expense projections, discount rates, revenue volatility, and royalty rates.
one reporting unit.
Critical accounting policies and estimates
We have identified the policies and estimates below as being critical to our business operations and the understanding of our results of operations. These policies require management’s most difficult, subjective, or complex judgements, often as a result of the need to make estimates about the effect of matters that are inherently uncertain. The impact of any associated risks related to these policies on our business operations are discussed throughout “Management’s Discussion and Analysis of Financial Condition,” including in the “Results of Operations” section, where such policies affect our reported and expected financial results. Although we believe that our estimates, assumptions, and judgements are reasonable, they are based upon information presently available. Actual results may differ significantly from these estimates under different assumptions, judgments, or conditions.
To determine revenue recognition for contractual arrangements that we determine are within the scope of Financial Accounting Standards Board (“FASB”) Topic 606, Revenue from Contracts with Customers, we perform the following five steps: (i) identify each contract with a customer; (ii) identify the performance obligations in the contract; (iii) determine the transaction price; (iv) allocate the transaction price to our performance obligations in the contract; and (v) recognize revenue when (or as) we satisfy the relevant performance obligation. We only apply the five-step model to contracts when it is probable that we will collect the consideration we are entitled to in exchange for the goods or services we transfer to the customer. Contracts with customers may contain multiple performance obligations. For such arrangements, the transaction price is allocated to each performance obligation based on the estimated relative standalone selling prices of the promised products or services underlying each performance obligation. The Company determines standalone selling prices based on the price at which the performance obligation is sold separately. If the standalone selling price is not observable through past transactions, the Company estimates the standalone selling price, taking into account available information such as market conditions and internally approved pricing guidelines related to the performance obligations. Payment terms and conditions vary, although terms generally include a requirement of payment within 30 to 90 days. The Company primarily recognizes product revenues, service revenues, and rental revenues. Product revenues are generated from the sale of biopreservation media, ThawSTAR, and freezer products. We recognize product revenue,
including shipping and handling charges billed to customers, when we transfer control of our products to our customers. Shipping and handling costs are classified as part of cost of product revenue in the Consolidated Statement of Operations. Service revenues are generated from the storage of biological and pharmaceutical materials. We recognize service revenues over time as services are performed or ratably over the contract term. To the extent the transaction price includes variable consideration, the Company estimates the amount of variable consideration that should be included in the transaction price utilizing the expected value method or the most likely amount method, depending on the facts and circumstances relative to the contract. When determining the transaction price of a contract, an adjustment is made if payment from a customer occurs either significantly before or significantly after performance, resulting in a significant financing component. Applying the practical expedient in paragraph 606-10-32-18, the Company does not assess whether a significant financing component exists if the period between when the Company performs its obligations under the contract and when the customer pays is one year or less. None of the Company’s contracts contained a significant financing component or variable consideration as of and during the years ended December 31,
2021, 2020,2023, 2022, and
2019.2021.
The Company also generates revenue from the leasing of our property plant, and equipment, operating right-of-use assets, and evo cold chain systems to customers pursuant to service contracts or rental arrangements entered into with the customer. Revenue from these arrangements is not within the scope of FASB ASC Topic 606 as it is within the scope of FASB ASC Topic 842, Leases. All customers leasing shippers currently do so under month-to-month rental arrangements. We account for these rental transactions as operating leases and record rental revenue on a straight-line basis over the rental term. Amounts paid for acquisitions are allocated to the tangible and intangible assets acquired and liabilities assumed, if any, based on their fair values at the dates of acquisition. This purchase price allocation process requires management to make significant estimates and assumptions with respect to intangible assets and deferred revenue obligations. The fair value of identifiable intangible assets is based on detailed valuations that use information and assumptions determined by management. Any excess of purchase price over the fair value of the net tangible and intangible assets acquired is allocated to goodwill. While we use our best estimates and assumptions to accurately value assets acquired and liabilities assumed at the acquisition date as well as any contingent consideration, where applicable, our estimates are inherently uncertain and subject to refinement. As a result, during the measurement period, which may be up to one year from the acquisition date, we record adjustments to the assets acquired and liabilities assumed with the corresponding offset to goodwill. Upon conclusion of the measurement period or final determination of the values of assets acquired or liabilities assumed, whichever comes first, any subsequent adjustments are recorded to our Consolidated Statements of Operations. The fair value of contingent consideration includes estimates and judgments made by management regarding the probability that future contingent payments will be made, the extent of royalties to be earned in excess of the defined minimum royalties, etc. Management updates these estimates and the related fair value of contingent consideration at each reporting period based on the estimated probability of achieving the earnout targets and applying a discount rate that captures the risk associated with the expected contingent payments. To the extent our estimates change in the future regarding the likelihood of achieving these targets we may need to record material adjustments to our accrued contingent consideration. Changes in the fair value of contingent consideration are recorded in our Consolidated Statements of Operations. We use the income approach to determine the fair value of certain identifiable intangible assets including customer relationships and developed technology. This approach determines fair value by estimating after-tax cash flows attributable to these assets over their respective useful lives and then discounting these after-tax cash flows back to a present value. We base our assumptions on estimates of future cash flows, expected growth rates, expected trends in technology, etc. We base the discount rates used to arrive at a present value as of the date of acquisition on the time value of money and certain industry-specific risk factors. We believe the estimated purchased customer relationships, developed technologies, trademarks, tradenames,
patents, and
in process research and developmentpatents amounts so determined represent the fair value at the date of acquisition and do not exceed the amount a third party would pay for the assets.
Intangible assets and goodwill
Intangible assets with a definite life are amortized over their estimated useful lives using the straight-line method and the amortization expense is recorded within intangible asset amortization in the Consolidated Statements of Operations. If the estimate of a definite-lived intangible asset’s remaining useful life is changed, the remaining carrying amount of the intangible asset is amortized prospectively over the revised remaining useful life. Definite-lived intangible assets and their related estimated useful lives are reviewed at least annually to determine if any adverse conditions exist that would indicate the carrying value of these assets may not be recoverable. The Company determined that no adverse conditions existed that would indicate that the carrying value
Indefinite-lived intangibles are carried at the initially recorded fair value less any recognized impairment.
In-process research and development (“IPR&D”) is initially capitalized at fair value as an intangible asset with an indefinite life. When the IPR&D project is complete, it is reclassified as a definite-lived intangible asset and is amortized over its estimated useful life. If an IPR&D project is abandoned, a charge would be recorded for the value of the related intangible asset to our Consolidated Statement of Operations in the period it is abandoned. Indefinite-lived intangibles are tested annually for impairment. Impairment assessments are conducted more frequently if certain conditions exist, including a change in the competitive landscape, any internal decisions to pursue new or different technology strategies, a loss of a significant customer, or a significant change in the marketplace, including changes in the prices paid for the Company’s products or changes in the size of the market for the Company’s products. If impairment indicators are present, the Company determines whether the underlying intangible asset is recoverable through estimated future undiscounted cash flows. If the asset is not found to be recoverable, it is written down to the estimated fair value of the asset based on the sum of the future discounted cash flows expected to result from the use and disposition of the asset.
The Company performed a quantitative impairment test of one of the IPR&D assets acquired during 2021 during the fourth quarter of 2021 and determined that no impairment existed. The Company performed a qualitative test for the other IPR&D assets acquired during 2021 and determined that no impairment existed.
We test goodwill for impairment on an annual basis, and between annual tests if events and circumstances indicate it is more likely than not that the fair value of our goodwill is less than its carrying value. Events that would indicate impairment and trigger an interim impairment assessment include, but are not limited to, current economic and market conditions, including a decline in the Company’s market capitalization, a significant adverse change in legal factors, business climate or operational performance of the business, and an adverse action or assessment by a regulator. Goodwill is tested for impairment in the fourth quarter of each year, or more frequently as warranted by events or changes in circumstances mentioned above. Accounting guidance also permits an optional qualitative assessment for goodwill to determine whether it is more likely than not that the carrying value of a reporting unit exceeds its fair value. If, after this qualitative assessment, we determine that it is not more likely than not that the fair value of a reporting unit is less than its carrying amount, then no further quantitative testing would be necessary. A quantitative assessment is performed if the qualitative assessment results in a more likely than not determination or if a qualitative assessment is not performed. The quantitative assessment considers whether the carrying amount of a reporting unit exceeds its fair value, in which case an impairment charge is recorded to the extent the reporting unit’s carrying value exceeds its fair value. The Company operates as one reporting unit as of the goodwill impairment measurement date in the fourth quarter of
2021. As of the testing date and the period after that date through the issuance date of our financial statements, the Company has observed no indicators of potential goodwill impairment at any point during the period based on its qualitative assessment.2023.
Our freezer and thaw and certain cell processing products are warranted to provide assurance that the product will function as expected and to ensure customer confidence in design and overall quality. Warranty coverage on our products is generally provided for specified periods of time and on select products' hours of usage, and generally covers parts, labor, and other expenses for non-maintenance repairs. Warranty coverage generally does not cover operator abuse or improper use.
At the time of sale, we recognize expense and record a warranty accrual by product line for estimated costs in connection with forecasted future warranty claims. Our estimate of the cost of future warranty claims is based primarily on the estimated number of products under warranty, historical average costs incurred to service warranty claims, the trend in the historical ratio of warranty claims for each part covered, and the historical length of time between the sale and resulting warranty claim. If applicable, historical claims experience may be adjusted for known product design improvements or for the impact of unusual product quality issues. We periodically assess the adequacy of our warranty accruals based on changes in our estimates and assumptions and record any necessary adjustments if the cost of actual claim experience differs from our estimate and indicates that adjustments to our warranty accrual are necessary. Factors that could have an impact on actual future claims and our warranty accrual include, but are not limited to, items such as performance of new products; product failure rates; factors impacting product usage, such as changes in sales volumes and shifts in product mix; manufacturing quality and product design issues, including significant manufacturing or design defects not discovered until after the product is delivered to customers; higher or lower than expected service and component part costs to satisfactorily address the repair, and, if applicable, changes to the warranty coverage periods. Additionally, from time to time, we also establish warranty accruals for our estimate of the costs necessary to settle major rework campaigns on a product-specific basis during the period in which the circumstances giving rise to the major rework campaign become known and when the costs to satisfactorily address the situation are both probable and estimable. The warranty accrual for the cost of a major rework campaign is primarily based on an estimate of the cost to repair each affected unit and the number of affected units expected to be repaired.
We believe that our analysis of historical warranty claim trends and knowledge of potential manufacturing and/or product design improvements or issues provide sufficient information to establish a reasonable estimate for the cost of future warranty claims at the time of sale and our warranty accruals as of the date of our Consolidated Balance Sheets. We believe that our $9.4$7.9 million warranty accrual as of December 31, 20212023 is adequate and historically has been adequate; however, due to the inherent uncertainty in the accrual estimation process, including forecasting future warranty claims, costs
associated with servicing future warranty claims, and unexpected major rework campaigns that may arise in the future, our actual warranty costs incurred may differ from our warranty accrual estimate. An unexpected increase in warranty claims and/or in the costs associated with servicing those claims would result in an increase in our warranty accruals and a decrease in our net earnings.
We estimate the acquisition date fair value of the acquisition-related contingent consideration using various valuation approaches, including option pricing models and Monte Carlo simulations, as well as significant unobservable inputs, reflecting the Company’s assessment of the assumptions market participants would use to value these liabilities. The fair value of the contingent consideration is remeasured each reporting period, with any change in the value recorded in our Consolidated Statements of Operations as change in fair value of contingent consideration.
During the year ended December 31, 2023, all contingent consideration liabilities were written off upon assessment of the probability we would achieve certain revenue targets for earnouts. For additional details on the factors considered in the write-off, see Note 3: Fair value measurement within the consolidated financial statements in Part II, Item 8 of this Annual Report.
We measure and record compensation expense using the applicable accounting guidance for share-based payments related to stock options, time-based restricted stock, market-based restricted stock awards and performance-based awards granted to our directors and employees. The fair value of
stock options is determined by using the Black-Scholes option-pricing model. The fair value of market-based restricted stock awards is estimated at the date of grant using the Monte Carlo Simulation model. The
Black-Scholes and Monte Carlo Simulation valuation
models incorporatemodel incorporates assumptions as to stock price volatility, the expected life of options or awards, a risk-free interest rate and dividend yield. In valuing our
stock options and market-based stock awards, significant judgment is required in determining the expected volatility of our common stock. Expected
volatility for stock options is based on the historical and implied volatility of our own common stock while the volatility for our market-based restricted stock awards is based on the historical volatility of our own stock and the stock of companies within our defined peer group. Further, our expected volatility may change in the future, which could substantially change the grant-date fair value of future awards and, ultimately, the expense we record. The fair value of restricted stock, including performance awards, without a market condition is estimated using the current market price of our common stock on the date of grant.
We expense stock-based compensation for stock options, restricted stock awards, and performance awards over the requisite service period. For awards with only a service condition, we expense stock-based compensation using the straight-line method over the requisite service period for the entire award. For awards with a market condition, we expense over the vesting period regardless of the value that the award recipients will ultimately receive.
Provision for income taxes
The assessment regarding whether a valuation allowance is required considers both positive and negative evidence when determining whether it is more likely than not that deferred tax assets are recoverable. In making this assessment, significant weight is given to evidence that can be objectively verified. In its evaluation, the Company considered its cumulative loss and its forecasted losses in the near-term as significant negative evidence. Based upon a review of the four sources of income identified within ASC 740, Accounting for Income Taxes, the Company determined that the Company’s recorded deferred tax liabilities as of December 31, 20212023 would be a sufficient source of taxable income to realize all of its deferred tax assets except for a portion of its net operating loss carryforwards. As a result, a partialfull valuation allowance on its deferred tax assets was recorded as of December 31, 2021.2023. The Company will continue to assess the realizability of its assets going forward and will adjust the valuation allowance as needed. The Company determines its uncertain tax positions based on a determination of whether and how much of a tax benefit taken by the Company in its tax filings or positions is more likely than not to be sustained upon examination by the relevant income tax authorities. The Company is generally subject to examination by U.S. federal and local income tax authorities for all tax years in which loss carryforward is available.
The Company applies judgment in the determination of the financial statement recognition and measurement of tax positions taken or expected to be taken in a tax return. As of December 31,
2021,2023, the Company has an
unrecordedunrecognized tax benefit of
$255,000$2.2 million related to tax attributes being carried forward. The Company is generally subject to examination by U.S. federal and local income tax authorities for all tax years in which loss carryforward is available.
As of December 31,
2021,2023, the Company had U.S. federal net operating loss (“NOL”) carryforwards of approximately
$120.6$151.9 million, which is available to reduce future taxable income. Approximately
$39.5$39.2 million of NOL will expire from
20222024 through 2037, and approximately
$81.1$112.7 million of NOL will be carried forward indefinitely. The NOL carryforwards are subject to an annual limitation in the event of certain cumulative changes in the ownership interest. This limits the amount of tax attributes that can be utilized annually to offset future taxable income or tax liabilities. Subsequent ownership changes may further affect the limitation in future years.
Recent accounting standards update
See Note 1: “Organization and significant accounting policies – recent accounting pronouncements,” to our Consolidated Financial Statements included within the consolidated financial statements in Part II, Item 8 of this Annual Report for more information.
Discussions of 2021 results and year-to-year comparisons between 2022 and 2021 that are omitted in this
reportAnnual Report on Form 10-K can be found in “Management’s Discussion and Analysis of Financial Condition and Results of Operations” in Part II, Item 7 of our Annual Report on Form 10-K for
more information.the year ended December 31, 2022, filed with the SEC on March 31, 2023.
The following discussion of the financial condition and results of operations should be read in conjunction with the accompanying Consolidated Financial Statements and the related footnotes thereto.
RevenueRevenues diversified significantly
Revenue for years ended December 31, 2023, 2022, and 2021 were comprised of the following:
| | | | | | | | | | | | | | | | | | | | | | | | | | | | | | | | | | | | | | | | | |
| Year Ended December 31, | | 2023 vs. 2022 | | 2022 vs. 2021 |
| (In thousands, except percentages) | 2023 | | 2022 | | 2021⁽¹⁾ | | $ Change | | % Change | | $ Change | | % Change |
| Product revenue | | | | | | | | | | | | | |
| Freezer and thaw | $ | 50,622 | | | $ | 66,682 | | | $ | 56,620 | | | $ | (16,060) | | | (24 | %) | | $ | 10,062 | | | 18 | % |
| Cell processing | 65,772 | | | 68,509 | | | 44,965 | | | (2,737) | | | (4 | %) | | 23,544 | | | 52 | % |
| Biostorage services | 1,301 | | | 809 | | | 328 | | | 492 | | | 61 | % | | 481 | | | 147 | % |
| Service revenue | | | | | | | | | | | | | |
| Freezer and thaw | 1,024 | | | 74 | | | — | | | 950 | | | 1284 | % | | 74 | | | — | % |
| Biostorage services | 16,527 | | | 15,234 | | | 9,817 | | | 1,293 | | | 8 | % | | 5,417 | | | 55 | % |
| Rental revenue | | | | | | | | | | | | | |
| Biostorage services | 8,025 | | | 10,451 | | | 7,426 | | | (2,426) | | | (23 | %) | | 3,025 | | | 41 | % |
| Total revenue | $ | 143,271 | | | $ | 161,759 | | | $ | 119,156 | | | $ | (18,488) | | | (11 | %) | | $ | 42,603 | | | 36 | % |
(1)2021 revenue includes product revenue related to Global Cooling from May 3, 2021 through December 31, 2021 and product revenue related to Sexton from September 1, 2021 through December 31, 2021.
Total Revenue decline in the year ended December 31,
20212023, as compared to the year ended December 31,
2020. This diversification2022, was
driven primarily
driven by
reduced purchases of ultra-low temperature and LN2 freezers. The Company has seen a decrease in customer purchases of these products as customers have reacted to preserve cash and abstain from acquiring inventory due to increased interest rates across the
acquisition of Global Cooling and Sexton in May and September of 2021, respectively. Most notably, the Company’s freezer and thaw revenues increased by 318% as a result of the acquisition of Global Cooling and growth in LN2 freezer sales. Revenuesbroader CGT market. Customers also
diversified significantlyreevaluated safety stock levels in the year ended December 31,
2020 as compared2023 for cell processing products, causing revenue levels to
fall approximately 4% from the year ended December 31,
2019. This diversification was primarily driven by the acquisition of SciSafe in October of 2020 and the recognition of a full year of revenue from the acquisition of Custom Biogenic Systems in November of 2019. Given the Company’s acquisition strategy, we expect product diversification to continue in future periods as the Company executes its strategy and makes additional acquisitions.Revenue concentrations with one customer increased to 17% in the year ended December 31, 2021 from 13% from a different customer in the year ended December 31, 2020, primarily as a result of concentrations of sales to a prominent international distributor. 2022.
Revenue concentrations with one customer decreased to
13%16% in the year ended December 31,
20202023 from
15%18% from the same customer in the year ended December 31,
2019, primarily due to2022. This concentration remained relatively consistent despite significant changes in product mix, as the
expansion of the Company’s customer base through the aforementioned acquisitions. We expect customer concentrations to diminish as revenues increase and we expand our presencecustomer's reduction in
the global marketsdemand for capital purchases was less pronounced than others in
which we participate.Revenue for years ended December 31, 2021, 2020, and 2019 were comprised of the following:
| | | Year Ended December 31, | | | 2021 vs. 2020 | | | 2020 vs. 2019 | |
(In thousands, except percentages) | | 2021(1) | | | 2020(2) | | | 2019(3) | | | $ Change | | | % Change | | | $ Change | | | % Change | |
Product revenue | | | | | | | | | | | | | | | | | | | | | | | | | | | | |
Freezer and thaw | | $ | 56,620 | | | $ | 13,548 | | | $ | 3,312 | | | $ | 43,072 | | | | 318 | % | | $ | 10,236 | | | | 309 | % |
Cell processing | | | 44,965 | | | | 30,946 | | | | 23,367 | | | | 14,019 | | | | 45 | % | | | 7,579 | | | | 32 | % |
Storage and cold chain services | | | 328 | | | | 46 | | | | 165 | | | | 282 | | | | 613 | % | | | (119 | ) | | | (72 | )% |
Service revenue | | | | | | | | | | | | | | | | | | | | | | | | | | | | |
Storage and cold chain services | | | 9,817 | | | | 1,752 | | | | - | | | | 8,065 | | | | 460 | % | | | 1,752 | | | | - | % |
Rental revenue | | | | | | | | | | | | | | | | | | | | | | | | | | | | |
Storage and cold chain services | | | 7,426 | | | | 1,795 | | | | 527 | | | | 5,631 | | | | 314 | % | | | 1,268 | | | | 241 | % |
Total revenue | | $ | 119,156 | | | $ | 48,087 | | | $ | 27,371 | | | $ | 71,069 | | | | 148 | % | | $ | 20,716 | | | | 76 | % |
(1)
| 2021 revenue includes product revenue related to Global Cooling from May 3, 2021 through December 31, 2021 and product revenue related to Sexton from September 1, 2021 through December 31, 2021.
|
(2)
| 2020 revenue includes service revenue related to SciSafe from October 1, 2020 through December 31, 2020.
|
(3)
| 2019 revenue includes product revenue related to Astero from April 1, 2019 through December 31, 2019; rental revenue related to SAVSU from August 8, 2019 through December 31, 2019; and product revenue related to CBS from November 12, 2019 through December 31, 2019.
|
2023.In the year ended December 31, 2021, revenue increased by $71.1 million, or 148%, from the year ended December 31, 2020. Of this increase, $40.9 million, or 85%, was driven by inorganic growth from the acquisitions of Global Cooling and Sexton. The remaining $30.2 million, or 63%, of the increase was driven primarily by organic growth in our biological and pharmaceutical storage and biopreservation media product lines of $13.0 million and $12.2 million, respectively.
In the year ended December 31, 2020, revenue increased by $20.7 million, or 76%, from the year ended December 31, 2019. Of this increase, $1.8 million, or 6%, was driven by inorganic growth from the acquisition of SciSafe. The remaining $18.9 million, or 70%, of the increase was driven primarily by organic growth in our biopreservation media product line of $7.6 million and the recognition of a full year of revenue from the acquisition of Custom Biogenic Systems in November of 2019, which contributed $9.7 million of incremental revenue in 2020.
Revenue is impacted by the relatively high degree of customer concentration, the timing of orders, the development efforts of our customers or end-users and regulatory approvals for biologics that incorporate our products, which may result in significant quarterly fluctuations. Such fluctuations are expected, but they may not be predictive of future revenue or otherwise indicative of a trend.
Costs and operating expenses
Total costs and operating expenses for years ended December 31,
2021, 2020,2023, 2022, and
20192021 were comprised of the following:
| | | Year Ended December 31, | | | 2021 vs. 2020 | | | 2020 vs. 2019 | |
| (In thousands, except percentages) | | 2021 | | | 2020 | | | 2019 | | | $ Change | | | % | | | $ Change | | | % | |
Cost of product, rental, and service revenue | | $ | 82,108 | | | $ | 20,646 | | | $ | 8,760 | | | $ | 61,462 | | | | 298 | % | | $ | 11,886 | | | | 136 | % |
Research and development | | | 11,821 | | | | 6,720 | | | | 3,168 | | | | 5,101 | | | | 76 | % | | | 3,552 | | | | 112 | % |
Sales and marketing | | | 14,006 | | | | 6,413 | | | | 4,701 | | | | 7,593 | | | | 118 | % | | | 1,712 | | | | 36 | % |
General and administrative | | | 32,448 | | | | 14,607 | | | | 8,893 | | | | 17,841 | | | | 122 | % | | | 5,714 | | | | 64 | % |
Intangible asset amortization | | | 8,202 | | | | 3,033 | | | | 1,079 | | | | 5,169 | | | | 170 | % | | | 1,954 | | | | 181 | % |
Acquisition costs | | | 1,636 | | | | 668 | | | | 940 | | | | 968 | | | | 145 | % | | | (272 | ) | | | (29 | )% |
Change in fair value of contingent consideration | | | 2,875 | | | | 1,575 | | | | 50 | | | | 1,300 | | | | 83 | % | | | 1,525 | | | | 3,050 | % |
Total operating expenses | | $ | 153,096 | | | $ | 53,662 | | | $ | 27,591 | | | $ | 99,434 | | | | 185 | % | | $ | 26,071 | | | | 94 | % |
| | | | | | | | | | | | | | | | | | | | | | | | | | | | | | | | | | | | | | | | | |
| Year Ended December 31, | | 2023 vs. 2022 | | 2022 vs. 2021 |
| (In thousands, except percentages) | 2023 | | 2022 | | 2021 | | $ Change | | % Change | | $ Change | | % Change |
| Cost of product, rental, and service revenue | $ | 96,519 | | | $ | 107,937 | | | $ | 82,108 | | | $ | (11,418) | | | (11 | %) | | $ | 25,829 | | | 31 | % |
| General and administrative | 55,725 | | | 47,670 | | | 33,668 | | | 8,055 | | | 17 | % | | 14,002 | | | 42 | % |
| Sales and marketing | 24,583 | | | 21,570 | | | 14,006 | | | 3,013 | | | 14 | % | | 7,564 | | | 54 | % |
| Research and development | 18,796 | | | 14,798 | | | 11,821 | | | 3,998 | | | 27 | % | | 2,977 | | | 25 | % |
| Asset impairment charges | 15,485 | | | 110,364 | | | — | | | (94,879) | | | (86 | %) | | 110,364 | | | - | % |
| Intangible asset amortization | 5,181 | | | 9,697 | | | 8,202 | | | (4,516) | | | (47 | %) | | 1,495 | | | 18 | % |
| Acquisition costs | — | | | 18 | | | 1,636 | | | (18) | | | (100) | % | | (1,618) | | | (99 | %) |
| Change in fair value of contingent consideration | (2,193) | | | (4,754) | | | 2,875 | | | 2,561 | | | (54) | % | | (7,629) | | | (265 | %) |
| Total operating expenses | $ | 214,096 | | | $ | 307,300 | | | $ | 154,316 | | | $ | (93,204) | | | (30 | %) | | $ | 152,984 | | | 99 | % |
Cost of product, rental, and service revenue
In the year ended December 31,
2021,2023, cost of product, rental, and service revenue
increased $61.5decreased $11.4 million, or
298%11%, from the year ended December 31,
2020. Of this increase, $44.2 million, or 214%,2022. This decrease was
primarily driven by
inorganic growth fromdecreased sales compared to the
acquisitions of Global Cooling and Sexton. The remaining $17.3 million, or 84%, of the increase was driven primarily by organic growth in our biopreservation media and biological and pharmaceutical storage product lines.In the year ended December 31, 2020, cost of product, rental, and service revenue increased $11.9 million or 136% from the year ended December 31, 2019. Of this increase, $1.2 million, or 14%, was driven by inorganic growth from the acquisition of SciSafe. The remaining $10.7 million, or 122%, of the increase driven primarily by organic growth in our biopreservation media product line and the recognition of a full year of costs from the acquisition of Custom Biogenic Systems in November of 2019.
prior year. We expect the cost of product, rental, and service revenue to fluctuate in future quarters based on production volumes and product mix, and the impact of any future acquisitions.
mix.
Cost of product, rental, and service revenue as a percentage of revenue was 69%
, 43%, and
32%70% for the years ended December 31,
2021, 2020,2023 and
2019,2022, respectively. Cost of product, rental, and service revenue in the years ended December 31,
2021, 2020,2023 and
20192022 includes
$1.1 million, $411,000,zero and
$289,000,$251,000, respectively, in inventory step-up expense recorded in the purchase accounting of our Global Cooling,
Custom Biogenic Systems,CBS, and AsteroBio
Corporation (“Astero”) acquisitions.
General and administrative expenses
During the years ended December 31, 2023, 2022, and 2021, general and administrative (“G&A”) expense consisted primarily of personnel-related expenses, stock-based compensation, professional fees, such as accounting and consulting fees, and corporate insurance.
In the year ended December 31, 2023, G&A expenses increased by $8.1 million, or 17%, compared with the year ended December 31, 2022. Of this increase, $3.7 million, or 31%, was driven by increased consulting fees related to our strategic transaction on the Freezer Business. The remaining costs primarily relate to an increase of $1.4 million in costseverance related to the departure of product, rental,the former CEO and service revenue asother staff in addition to a percentagereduction in headcount that occurred in the quarter ended September 30, 2023.
Sales and marketing expenses
During the years ended December 31, 2023, 2022, and 2021, sales and marketing expense (“S&M”) consisted primarily of revenue to 69%personnel-related costs, stock based compensation, consulting, advertising, and travel expenses.
S&M expense increased $3.0 million in the year ended December 31,
2021 from 43% in2023, or 14%, compared with the year ended December 31,
20202022. The increase is primarily
a result of the acquisitions of Global Cooling and Sexton, which were acquired in May and September of 2021, respectively. Of the increase noted, $43.0 million was recognized by Global Cooling and $1.2 million was recognized by Sexton. $9.8due to $2.0 million of
the costs recognized by Global Cooling were incurred in relation to warranty expenses. In the thirdincreased stock compensation and
fourth quarters$0.7 million of
2021, Global Cooling experienced supply chain disruptions related to sheet metal and electronic components that incorporate semiconductor chips that led to increased
supplier pricing and delays in production that led to a lower margin profile than we believe to otherwise be achievable. We believe that the supply chain risks that were present in these quarters have been significantly mitigated through the diversification of sheet metal suppliers and strategic agreements with electronic component suppliers.The increase in cost of product, rental, and service revenue as a percentage of revenue to 43% in the year ended December 31, 2020 from 32% in the year ended December 31, 2019 is primarily a result of the acquisition of SciSafe, which was acquired in October of 2020 and the recognition of a full year of costs from the acquisition of Custom Biogenic Systems in November of 2019. Of the increase noted, SciSafe recognized $1.2 million, whereas the incremental costs recognized by Custom Biogenic Systems in the year ended December 31, 2021 amounted to $7.2 million.
advertising. Research and development expenses
During the years ended December 31,
2021, 2020,2023, 2022, and
2019,2021, research and development (“R&D”) expense consisted primarily of personnel-related costs, consulting,
research supplies, and
external product development services.milestone expenses related to third party research agreements.
R&D expense increased
$5.1$4.0 million in the year ended December 31,
2021,2023, or
76%27%, compared with the year ended December 31,
2020.2022. The increase is primarily due to
in-process$2.5 million of increased stock-based compensation expenses and $1.0 million of scrapped research
and development costs associated with the freezer technology acquiredmaterials related to an adjustment in the
acquisitiondesign of
Global Cooling.R&D expense increased $3.6 milliona future freezer product release that rendered certain components obsolete.
Asset impairment charges
Asset impairment charges in the year ended December 31, 2020, or 112%, compared with2023 consist of the yearimpairment incurred of $15.5 million during the quarter ended December 31, 2019. The increase is primarily due to recognition of a full year of research and development activity from the acquisitions of Custom Biogenic Systems, SAVSU, and AsteroBioSeptember 30, 2023. Asset impairment charges in the year ended December 31, 2019. Additionally,2022 consist of the Company invested increased levelsimpairments incurred of capital into$69.9 million and $40.5 million during the refinementquarter ended June 30, 2022 and impairment assessment date of its cold chain shipper productsOctober 1, 2022, respectively. These impairment charges impacted both definite and indefinite-lived intangible assets acquired during the acquisition of Global Cooling and Custom Biogenic Systems. See Note 2: Impairment of property and equipment and definite-lived intangible assets within the consolidated financial statements in Part II, Item 8 of this Annual Report for more information on the yearevents and assessment leading to these non-cash impairment charges during the years ended December 31, 2020.We expect our R&D expense to increase as we continue to expand, develop,2023 and refine our product lines.
Sales and marketing expenses
Sales and marketing expense (“S&M”) consisted primarily of personnel-related costs, stock compensation expense, trade shows, sales commissions and advertising.
S&M expense increased $7.6 million in the year ended December 31, 2021, or 118%, compared with the year ended December 31, 2020. Of this increase, $4.4 million, or 68%, was incurred by Global Cooling. The remaining costs primarily relate to additional headcount of $1.2 million, commission expense associated with organic revenue growth of $413,000, and stock-based compensation of $691,000.
S&M expense increased $1.7 million in the year ended December 31, 2020, or 36%, compared with the year ended December 31, 2019. Of this increase, $336,000 was composed of incremental costs associated with a full year’s ownership of Custom Biogenic Systems, $306,000 was composed of incremental costs associated with a full year’s ownership of SAVSU, and $139,000 was composed of incremental costs associated with a full year’s ownership of AsteroBio. The remaining costs primarily relate to additional headcount of $506,000.
We expect S&M expense to increase, as we expand our product line offerings and our presence in the markets in which we participate.
General and administrative expenses
General and administrative (“G&A”) expense consists primarily of personnel-related expenses, non-cash stock-based compensation for administrative personnel and members of the board of directors, professional fees, such as accounting and legal, and corporate insurance.
In the year ended December 31, 2021, G&A expenses increased by $17.8 million, or 122%, compared with the year ended December 31, 2020. Of this increase, $4.2 million, or 29%, was incurred by Global Cooling. The remaining costs primarily relate to stock-based compensation awarded to attract and retain talent of $4.4 million, accounting fees of $1.4 million, insurance expense of $524,000, and the continued buildout of our administrative infrastructure, predominantly through increased headcount of $4.6 million, to support expected future growth.
In the year ended December 31, 2020, G&A expenses increased by $5.7 million, or 64%, compared with the year ended December 31, 2019. Of this increase, $1.3 million, or 22%, was composed of incremental costs associated with a full year’s ownership of Custom Biogenic Systems and $471,000, or 8%, associated with a full year’s ownership of SAVSU. The remaining costs primarily relate to stock-based compensation awarded to attract and retain talent and the continued buildout of our administrative infrastructure, predominantly through increased headcount, to support expected future growth.
We expect G&A expense to increase as we continue to execute on our growth strategy.
2022.
Intangible asset amortization expense
Amortization expense consists of charges related to the amortization of intangible assets associated with the acquisitions of Global Cooling, Custom Biogenic Systems
(“CBS”), SciSafe,
Sexton, SAVSU
Technologies, Inc. (“SAVSU”), and
AsteroBioAstero in which we acquired definite-lived intangible assets.
Acquisition costs consist of legal, accounting, third-party valuations, and other due diligence costs related to our Global Cooling
Custom Biogenic Systems, SciSafe,and Sexton
SAVSU, and AsteroBio acquisitions.
Change in fair value of contingent consideration
Change in fair value of contingent consideration consists of changes in estimated fair value of our potential earnouts related to our SciSafe
CBS, and
AsteroCustom Biogenic Systems acquisitions.
The benefit recognized in the year ended December 31, 2023 relates primarily to changes in our estimated probability of achieving earnout targets set forth within the purchase agreements.Other income and expenses
Total other income and expenses for the years ended December 31,
2021, 2020,2023, 2022, and
20192021 were comprised of the following:
| | | Year Ended December 31, | | | 2021 vs. 2020 | | | 2020 vs. 2019 | |
(In thousands, except percentages) | | 2021 | | | 2020 | | | 2019 | | | $ Change | | | % Change | | | $ Change | | | % Change | |
Change in fair value of warrant liability | | $ | (121 | ) | | $ | 3,601 | | | $ | (12,835 | ) | | $ | (3,722 | ) | | | (103 | )% | | $ | 16,436 | | | | (128 | )% |
Change in fair value of investments | | | - | | | | 1,319 | | | | - | | | | (1,319 | ) | | | (100 | )% | | | 1,319 | | | | - | % |
Interest (expense) income, net | | | (432 | ) | | | 58 | | | | 501 | | | | (490 | ) | | | (845 | )% | | | (443 | ) | | | (88 | )% |
Other income (expense) | | | 289 | | | | - | | | | (13 | ) | | | 289 | | | | - | % | | | 13 | | | | (100 | )% |
Loss from equity-method investment in SAVSU | | | - | | | | - | | | | (739 | ) | | | - | | | | - | % | | | 739 | | | | (100 | )% |
Gain on acquisition of SAVSU | | | - | | | | - | | | | 10,108 | | | | - | | | | - | % | | | (10,108 | ) | | | (100 | )% |
Gain on acquisition of Sexton Biotechnologies, Inc. | | | 6,451 | | | | - | | | | - | | | | 6,451 | | | | - | % | | | - | | | | - | % |
Total other income (expense), net | | $ | 6,187 | | | $ | 4,978 | | | $ | (2,978 | ) | | $ | 1,209 | | | | 24 | % | | $ | 7,956 | | | | (267 | )% |
| | | | | | | | | | | | | | | | | | | | | | | | | | | | | | | | | | | | | | | | | |
| Year Ended December 31, | | 2023 vs. 2022 | | 2022 vs. 2021 |
| (In thousands, except percentages) | 2023 | | 2022 | | 2021 | | $ Change | | % Change | | $ Change | | % Change |
| Change in fair value of warrant liability | $ | — | | | $ | — | | | $ | (121) | | | $ | — | | | — | % | | $ | 121 | | | (100) | % |
| Change in fair value of investments | — | | | 697 | | | — | | | (697) | | | (100 | %) | | 697 | | | — | % |
| Interest expense, net | (1,812) | | | (687) | | | (485) | | | (1,125) | | | 164 | % | | (202) | | | 42 | % |
| Other income | 1,264 | | | 704 | | | 289 | | | 560 | | | 80 | % | | 415 | | | 144 | % |
| Gain on settlement of Global Cooling escrow | 5,115 | | | — | | | — | | | 5,115 | | | — | % | | — | | | — | % |
| Gain on acquisition of Sexton Biotechnologies, Inc. | — | | | — | | | 6,451 | | | — | | | — | % | | (6,451) | | | (100 | %) |
| Total other income, net | $ | 4,567 | | | $ | 714 | | | $ | 6,134 | | | $ | 3,853 | | | 540 | % | | $ | (5,420) | | | (88 | %) |
Change in fair value of warrant liability.
Reflects the changes in fair value associated with the periodic “mark-to-market” valuation of certain warrants that were issued in 2014. See Note 1: “Organization and Significant Accounting Policies” of our accompanying Consolidated Financial Statements “Certainsignificant accounting policies, “Certain Warrants which have Features that may Result in Cash Settlement” within the consolidated financial statements in Part II, Item 8 of this Annual Report for more information.
Change in fair value of investments.
Reflects
the fair value adjustments to our investment in
iVexSol convertible debt prior to its conversion to Series A-1 Preferred Stock. The fair value was determined by expected term of the instrument, the underlying credit worthiness of iVexSol and the valuation of various embedded features in the note, which were based on future financings of iVexSol.
The expected term range of our estimate was 1 to 5 years, with projected weighting over this term.
Interest (expense) income,expense, net.
Interest expense incurred in the year ended December 31, 20212023 related primarily to three termthe loan obtained in September 2022 and two loans that were assumed in the acquisition of Global Cooling. These term loans were refinanced in the fourth quarter of 2021 to obtain more favorable interest rates to the Company. We also earn interest on cash held in our money market account. Despite having a higher average cash balanceIncreases in interest expenses during the year ended December 31, 2020 as compared2023 can also be attributed primarily to interest incurred on the yearTerm Loan (as defined under Note 13: Long-term debt within the consolidated financial statements in Part II, Item 8 of this Annual Report) drawn in the quarter ended December 31, 2019, yields in our money market account dropped steeply between February and March of 2020 due to reduced interest rates set by the United States Federal Reserve, causing interest income to be significantly lower for the remainder of 2020 and the year ended December 31, 2021.Loss on equity method investment. Reflects the non-cash loss associated with our proportionate share of the net loss in our investment in SAVSU prior to our acquisition of the remaining shares of SAVSU and subsequent consolidation of SAVSU in our financial statements.
September 30, 2022.
Gain on acquisitionsettlement of SAVSU. Global Cooling escrow.
Reflects the non-cash gain associated with our
equity investmentpost-closing adjustments for indemnifications and negotiated terms in
SAVSU due to the step-acquisitionconnection with our acquisition of
the remainingGlobal Cooling, and subsequent release and cancellation of these shares of
SAVSU and subsequent consolidationour common stock from the third-party escrow account established in connection with that transaction. For additional information, see Note 12 within the consolidated financial statements in Part II, Item 8 of
SAVSU in our financial statements. this Annual Report.
Gain on acquisition of Sexton Biotechnologies, Inc.
Reflects the non-cash gain associated with our investment in Sexton due to the step-acquisition of the remaining shares of Sexton and subsequent consolidation of Sexton in our financial statements.
Income Tax
(Expense) Benefit
Income tax benefit for the years ended December 31,
2021, 20202023, 2022, and
20192021 was as follows:
| | | Year Ended December 31, | | | 2021 vs. 2020 | | | 2020 vs. 2019 | |
(In thousands, except percentages) | | 2021 | | | 2020 | | | 2019 | | | $ Change | | | % Change | | | $ Change | | | % Change | |
Income tax benefit | | $ | 20,118 | | | $ | 3,264 | | | $ | 1,541 | | | $ | 16,854 | | | | 516 | % | | $ | 1,723 | | | | 112 | % |
Effective tax rate | | | 72 | % | | | 547 | % | | | 47 | % | | | | | | | | | | | | | | | | |
| | | | | | | | | | | | | | | | | | | | | | | | | | | | | | | | | | | | | | | | | |
| Year Ended December 31, | | 2023 vs. 2022 | | 2022 vs. 2021 |
| (In thousands, except percentages) | 2023 | | 2022 | | 2021 | | $ Change | | % Change | | $ Change | | % Change |
| Income tax (expense) benefit | $ | (169) | | | $ | 5,022 | | | $ | 20,118 | | | $ | (5,191) | | | (103) | % | | $ | (15,096) | | | (75 | %) |
| Effective tax rate | — | % | | 4 | % | | 69 | % | | | | | | | | |
The income tax benefit recognized in the year ended December 31,
20212023 primarily related to losses generated in
2021 and the recognition of the release of our valuation allowance related to the acquisition of Global Cooling.2023. Our effective tax rate for
20212023 was
higherlower than the U.S. statutory rate of 21% primarily due to
windfall benefits on stock compensation, 162(m) limitations on executive compensation, and the change in our valuation allowance.
The income tax benefit recognized in the year ended December 31,
20202022 primarily related to
the partial release of our valuation allowance related to the acquisition of SciSafe.losses generated in 2022. Our effective tax rate
in 2020for 2022 was
significantly higherlower than the U.S. statutory rate of 21% primarily due to
windfall benefits on stock compensation, changes in the fair value of our warrant liability, changes in the fair value of contingent consideration, and the expiration of net operating losses.The income tax benefit recognized in the year ended December 31, 2019 primarily related to the recognition of partial release of our valuation allowance related to the acquisitions of SAVSU and Astero. Our effective tax rate was higher than the U.S. statutory rate of 21% due primarily to changes in the fair value of our warrant liability, windfall benefits on stock compensation, and gain recognized on our acquisition of SAVSU.
allowance.
Liquidity and capital resources
We believe our cash,
and cash equivalents,
restricted cash, cash generated from operations,
available-for-sale securities, and credit lines will satisfy, for at least the next twelve months
from the date of this filing, our liquidity requirements, both globally and domestically, including the following: working capital needs, capital expenditures,
business acquisitions,ongoing initiative for divestiture of the Freezer Business, contractual obligations, commitments, principal and interest payments on debt, and other liquidity requirements associated with our operations.
We have not identified any material liquidity concerns as a result of the COVID-19 pandemic.On December 31, 2021,2023, we had $69.9$52.3 million in cash, cash equivalents, and available-for-sale securities, compared to $64.1 million as of December 31, 2022, as follows:
| | | | | | | | | | | | | | | | | | | | | | | |
| Year Ended December 31, | | 2023 vs. 2022 |
| (In thousands, except percentages) | 2023 | | 2022 | | $ Change | | % Change |
| Cash and cash equivalents | $ | 35,407 | | | $ | 19,442 | | | $ | 15,965 | | | 82 | % |
| Restricted cash | 31 | | | 31 | | | — | | | — | % |
| Available-for-sale securities | 16,836 | | | 44,592 | | | (27,756) | | | (62) | % |
| Maturities in less than one year | 16,288 | | | 43,260 | | | (26,972) | | | (62) | % |
| Maturities in greater than one year | 548 | | | 1,332 | | | $ | (784) | | | (59) | % |
| Total cash, cash equivalents, and available-for-sale securities | $ | 52,274 | | | $ | 64,065 | | | $ | (11,791) | | | (18) | % |
The increase in cash and cash equivalents compared to $90.4of $16.0 million as of December 31, 2020. The decrease in cash2023 is primarily due to the payoffsale and maturity of debtour available for sale securities of $27.8 million, change in accounts receivable of $15.4 million, and liabilities acquiredproceeds from financing activities of $10.6 million. These increases were partially impacted by $14.0 million in the Global Cooling transaction, thenet loss after non-cash adjustments, use of capitalcash in accounts payable and inventory of $17.0 million, and acquisition of property and equipment and assets held for funding operations,rent of $11.2 million.
Our available-for-sale securities consist of U.S. government securities, corporate debt securities, and
other debt securities. Management classifies investments at the
expansiontime of
our storage services footprint both domesticallypurchase and
reevaluates such classification at each balance sheet date. The decrease in
available-for-sale securities of $27.8 million resulted from the
Netherlands.maturity of $52.7 million of available-for-sale securities during the year, offset by purchases of similar instruments of $27.1 million.
On
May 22, 2020,October 19, 2023, we entered into a Securities Purchase Agreement with Casdin Partners Master Fund, L.P. ("Casdin") whereby the Company
closed on a share purchase agreement withsold, and Casdin
Capital LLC, a current stockholder of the Company, pursuant to which Casdin invested $20.0 million in the Company at $10.50 per share.On July 7, 2020, the Company closed its public offering of 5,951,250purchased, 927,165 shares of common stock of the Company at a share price of $11.19 per share for an aggregate purchase price of $10.4 million.
On September 20, 2022, the Company, and certain of its subsidiaries, entered into a term loan agreement, which provided for up to $60 million in aggregate principal to be drawn with $30 million being available upon closing and an additional
$30 million available in three separate tranches, subject to the Company meeting revenue milestones by a certain date or at the public offering price of $14.50 per share, which includes the shares purchased pursuant to the exercise in fulldiscretion of the underwriters' option to purchase up to an additional 776,250 shares of its common stock.lender by a certain date. The net proceeds from the public offering to BioLife, after deducting underwriting discounts and commissions and estimated underwriter offering expenses of $6.1Company borrowed $20 million were approximately $80.2 million.On October 1, 2020, we acquired SciSafe for $15.0 million in cash, 611,683 shares of common stock, and up to 626,000 additional shares of common stock as contingent consideration. 64,130 of the additional shares were earned asupon closing. As of December 31, 2021 and will be issued2023, the Company had not drawn additional funding outlined within the Loan Agreement. For additional information on terms, see Note 13:
Long-term debt within the consolidated financial statements in the year ended December 31, 2022.Part II, Item 8 of this Annual Report.
Cash flows
| | | Year Ended December 31, | | | 2021 vs. 2020 | | | 2020 vs. 2019 | |
(In thousands) | | 2021 | | | 2020 | | | 2019 | | | $ Change | | | % Change | | | $ Change | | | % Change | |
Operating activities | | $ | (4,593 | ) | | $ | 6,645 | | | $ | 1,213 | | | $ | (11,238 | ) | | | (169 | )% | | $ | 5,432 | | | | 448 | % |
Investing activities | | | (13,192 | ) | | | (24,715 | ) | | | (27,018 | ) | | | 11,523 | | | | (47 | )% | | | 2,303 | | | | (9 | )% |
Financing activities | | | (2,778 | ) | | | 102,078 | | | | 1,596 | | | | (104,856 | ) | | | (103 | )% | | | 100,482 | | | | 6,296 | % |
Net (decrease) increase in cash and cash equivalents | | $ | (20,563 | ) | | $ | 84,008 | | | $ | (24,209 | ) | | $ | (104,571 | ) | | | (124 | )% | | $ | 108,217 | | | | (447 | )% |
| | | | | | | | | | | | | | | | | | | | | | | |
| Year Ended December 31, | | 2023 vs. 2022 |
| (In thousands, except percentages) | 2023 | | 2022 | | $ Change | | % Change |
| Operating activities | $ | (12,498) | | | $ | (8,488) | | | $ | (4,010) | | | (47 | %) |
| Investing activities | 17,837 | | | (58,117) | | | 75,954 | | | 131 | % |
| Financing activities | 10,591 | | | 16,316 | | | (5,725) | | | (35) | % |
| Net increase (decrease) in cash and cash equivalents | $ | 15,930 | | | $ | (50,289) | | | $ | 66,219 | | | 132 | % |
In the year ended December 31, 2021,2023, our operating activities used cash of $4.6$12.5 million reflecting net loss of $7.6$66.4 million and non-cash charges totaling $6.6$53.9 million primarily related to stock-based compensation, impairment of assets, depreciation, amortization, changes in the fair value of investments,contingent consideration, gain on settlement of Global Cooling escrow, and non-cash lease charges. Significant changes in operating assets and liabilities include a decrease of accounts receivable of $15.3 million, an increase in inventory of $8.6 million, and a decrease in accounts payable of $8.4 million.
In the year ended December 31, 2022, our operating activities used cash of $8.5 million reflecting net loss of $139.8 million and non-cash charges totaling $146.2 million primarily related to impairment of intangible assets, depreciation, amortization, changes in fair value of contingent consideration, deferred income tax benefit, stock-based compensation, and non-cash lease charges. An increase in
accounts receivableaccrued expenses and current liabilities of
$10.1$5.7 million was primarily driven by
the 148% year-to-date increase in revenues. The remaining cash provided by operating activities resulted from favorable changes in various other working capital accounts.In the year ended December 31, 2020, our operating activities provided cash of $6.6a $3.7 million reflecting net income of $2.7 millionnon-income tax liability estimated for sales taxes owed and non-cash charges totaling $5.8 million primarily related to depreciation, amortization, changes in the fair value of investments, changes in fair value of contingent consideration, income tax benefit related to the acquisition of SciSafe, change in the fair value of the warrant liability, and stock-based compensation charges. An increase in accounts receivable ofapproximately $1.8 million was primarily driven by the 76% year-to-date increase in revenues and an increase in inventory used $629,000 to support future revenue. These cash items used for operating activities were offset by cash items provided by operating activities that included an increase in accrued liabilities of $780,000. The remaining cash used in operating activities resulted from unfavorable changes in various other working capital accounts.
In the year ended December 31, 2019, our operating activities provided cash of $1.2 million, reflecting a net loss of $1.7 million and non-cash charges totaling $7.3 million primarily related to depreciation, amortization, gain on acquisition of SAVSU, changes in fair value contingent consideration, income tax benefit relatedcompensation for increased headcount compared to the acquisition of SAVSU, fair value changeprior year. The increase in warrantaccrued expenses and current liabilities was offset by a $6.9 million reduction in warranty liability and stock-based compensation charges. An increase$1.6 million reduction in accounts receivable used $290,000 of cash and was primarily driven by the 39% year-to-date increase in revenues and an increase in inventory used $3.8 million to support future revenue. These cash items used for operating activities were offset by cash items provided by operating activities that included an increase in accounts payable of $768,000. The remaining cash used in operating activities resulted from unfavorable changes in various other working capital accounts.
payable.
Our investing activities
used $13.2generated $17.8 million of cash in the year ended December 31,
2021.2023. We
acquired $1.6had $29.1 million in
cash in the acquisitionsnet proceeds of
Global Coolingavailable-for-sale securities to fund capital projects and
Sexton.operations. Capital expenditures and purchases of assets held for rent
to maintain and expand the Company's operations used
$14.8 million as we continue to invest in our manufacturing and storage facilities.$11.2 million.
Our investing activities used
$24.7$58.1 million of cash in the year ended December 31,
2020.2022. We
used $15.0invested $44.6 million in
cash for the SciSafe acquisition. We also invested $1.0 million and $995,000available-for-sale securities in
our strategic investmentsaddition to continued investment in
iVexSol and PanTHERA, respectively. Capital expenditures, deposits on future capital expenditures
and purchases of assets held for rent,
and deposits made on assets held for rent used $7.8using an additional $13.9 million.
Our investing activities used $27.0 million of cash in the year ended December 31, 2019. We used $12.4 million, acquired $1.3 million, and used $11.0 million in cash for the Astero, SAVSU, and CBS acquisitions, respectively. We also invested $1.0 million and $1.5 million in our strategic investments in iVexSol and Sexton, respectively. Capital expenditures used $2.3 million in our manufacturing facilities and to increase SAVSU’s assets held for rent.
Financing activities
In the year ended December 31,
2021,2023, cash
usedprovided by financing activities was
$2.8$10.6 million.
We used $4.2 million to pay off the line of credit assumedThe increase in
the acquisition of Global Cooling. Other significant cash
flows include $1.6 million provided by
lendersfinancing activities compared to
finance equipment for our continued expansion, $1.4the prior year is primarily due to a private placement of $10.4 million
provided by the exercise of stock options, and
$1.0 million used to payproceeds from financed insurance
premiums.premiums of $2.6 million, offset by payments on financed insurance premiums of $2.4 million.
In the year ended December 31,
2020,2022, cash provided by financing activities was
$102.1$16.3 million.
We received $100.1 million from the sale of common shares and $1.5 million from the proceeds of warrant and stock option exercises. We used $483,000 for contingent consideration related to the Astero acquisition.In the year ended December 31, 2019,The increase in cash provided by financing activities of $1.6 million included $1.8 million fromcompared to the proceeds of warrant and stock option exercises.
Impacts of COVID-19
Our domestic and international operations have been and continue to be affected by the ongoing global pandemic of COVID-19 and the resulting volatility and uncertainty it has caused in the U.S. and international markets. During theprior year ended December 31, 2021, many businesses and countries, including the U.S., continued applying preventative and precautionary measures to mitigate the spread of the virus including government orders and other restrictions on the conduct of business operations.
In the year ended December 31, 2021, we experienced supply chain disruptionsis primarily due to the effectsdrawing $20 million on a term loan obtained on September 20, 2022, offset by payments on outstanding debt of COVID-19$1.7 million and payments on our suppliersfinanced insurance premiums of sheet metal and electronic components that incorporate semiconductor chips. These supply chain disruptions decreased the Company’s profitability as a result of increased supplier pricing and production stoppages. We believe that the supply chain risks that were present have been significantly mitigated through the diversification of sheet metal suppliers and strategic agreements with electronic component suppliers. However, we cannot be assured that a continued or prolonged global pandemic will not have other negative impacts on our manufacturing and shipping processes or our product costs. The extent to which the COVID-19 pandemic affects our future financial results and operations will depend on future developments which are highly uncertain and cannot be predicted, including the recurrence, severity and/or duration of the ongoing pandemic, and current or future domestic and international actions to contain and treat COVID-19.
We are following public and private sector policies and initiatives to reduce the transmission of COVID-19, such as the imposition of travel restrictions and the promotion of social distancing and work-from-home arrangements. We are taking a variety of measures to ensure the availability and functioning of our critical infrastructure, to promote the safety and security of our employees and to support the communities in which we operate. These measures include increasing our raw materials, manufacturing safe stock inventory for our biopreservation media and expanding availability of our biological and pharmaceutical storage, requiring remote working arrangements for employees who are not integral to physically making and shipping our products or who do not need specialized equipment to perform their work, restricting on-site visits by non-employees and implementing social distancing protocols and investing in personal protective equipment. Beginning April 2, 2020, BioLife became actively engaged in managing the company COVID-19 response and protocols in accordance with federal, state and local regulations. BioLife has mandated mask wearing for all team members on-site throughout the pandemic per the guidelines and regulations in place. COVID-19 response is actively managed through daily reporting, contact tracing and quarantine guidelines as published by the CDC and state health departments in order to maintain safe working conditions. As a part of our COVID-19 response, on-site visitors have been limited to essential visitors only in order to reduce risk of transmission. Additionally, throughout the pandemic, BioLife has encouraged positions not essential to being on-site to work remotely in order to further reduce transmission rates and potential contact.
$1.4 million.
Our cash flows from operations are dependent on a number of factors, including fluctuations in our operating results, accounts receivable collections, inventory management, and the timing of tax and other payments. As a result, the impact
of contractual obligations on our liquidity and capital resources in future periods should be analyzed in conjunction with such factors.
Despite these uncertainties, we believe that our balances of cash, cash equivalents, available-for-sale securities, and restricted cash in addition to our cash flows from operations are adequate to meet our liquidity requirements in the next 12 months.
The following summarizes certain of our contractual obligations as of December 31,
20212023 and the effect such obligations are expected to have on our cash flows in
future periods:(In thousands) | | Less than 1 year | | | 1 - 3 years | | | 3 - 5 years | | | More than 5 years | | | Total | |
Long-term debt, including interest⁽¹⁾ | | $ | 1,175 | | | $ | 3,618 | | | $ | 1,009 | | | $ | 2,623 | | | $ | 8,425 | |
Operating leases⁽²⁾ | | | 3,443 | | | | 6,034 | | | | 4,503 | | | | 8,364 | | | | 22,344 | |
Financing leases⁽²⁾ | | | 171 | | | | 272 | | | | 39 | | | | - | | | | 482 | |
Purchase obligations⁽³⁾ | | | 254 | | | | 507 | | | | - | | | | - | | | | 761 | |
Total | | $ | 5,043 | | | $ | 10,431 | | | $ | 5,551 | | | $ | 10,987 | | | $ | 32,012 | |
(1)
| These amounts represent expected cash payments, including principal and interest. Debt obligations are described in Note 7 of the Consolidated Financial Statements.
|
(2)
| Lease obligations are described in Note 5 of the Consolidated Financial Statements.
|
(3)
| Purchase obligations are defined asthe next fiscal year:
Long-term debt, including interest These amounts represent expected cash payments, including principal and interest. Debt obligations are described in Note 13 of the Consolidated Financial statements in Part II, Item 8 of this Annual Report. As of December 31, 2023, our total obligations were $25.2 million, of which $6.8 million was short-term. Lease obligations We have various operating and financing lease agreements to purchase goods or services that are enforceable and legally binding and that specify all significant terms, including fixed or minimum quantities to be purchased, fixed, minimum or variable pricing provisions and the approximate timing of the transactions. |
Purchase orders or contracts for the purchase of suppliesoffice space, warehouses, manufacturing, research equipment, machinery, and production locations as well as vehicles and other equipment. Lease obligations are described in Note 6 of the Consolidated Financial statements in Part II, Item 8 of this Annual Report. As of December 31, 2023, our total obligations were $17.5 million, of which $3.2 million was short-term.
Purchase obligations
Purchase obligations are defined as agreements to purchase goods or services that are enforceable and serviceslegally binding and that specify all significant terms, including fixed or minimum quantities to be purchased, fixed, minimum or variable pricing provisions and the approximate timing of the transactions. As of December 31, 2023, our total obligations were $13.9 million, of which $13.7 million was short-term.
Sales Tax
We are not included in the table above.process of evaluating a state sales tax liability analysis for states in which we have economic nexus, and collecting exemption documentation from our customers. It is probable that we will be subject to sales tax liabilities plus interest and penalties relating to historical activity in certain states. We arehave estimated a contingent liability for sales tax which is recorded in the Consolidated Balance Sheet. The liability includes significant judgments and estimates that may change in the future, and the liability may exceed our current estimate. We may be subject to examination by the relevant state tax authorities and we can provide no assurances that outcomes from these examinations will not able to determine the aggregate amount of such purchase orders that represent contractual obligations, as purchase orders may represent authorizations to purchase rather than binding agreements. Our purchase orders are basedhave a significant effect on our current procurement or developmental needsoperating results, financial condition, and fulfilled by our vendors within short time horizons.cash flows. Capital requirements
Our future capital requirements will depend on many factors, including the following:
| ●
| the expansion of our cell and gene therapy tools and services business;
|
| ●
| the ability to sustain product revenue and profits of our cell and gene therapy products and services;
|
| ●
| The degree to which we implement additional automated production equipment throughout our facilities;
|
| ●
| our ability to acquire additional cell and gene therapy products and services;
|
| ●
| the scope of and progress made in our research and development activities; and
|
| ●
| the success of any proposed financing efforts.
|
•the expansion of our cell and gene therapy tools and services business
•the ability to sustain product revenue and profits of our cell and gene therapy products and services;
•The degree to which we implement additional automated production equipment throughout our facilities;
•our ability to acquire additional cell and gene therapy products and services;
•the scope of and progress made in our research and development activities; and
•the success of any proposed financing efforts.
Absent acquisitions of additional products, product candidates, or intellectual property, we believe our current cash,
cash equivalents, and available-for-sale securities balances,
in addition to our cash flows from operations, are adequate to meet our cash needs for at least the next 12
months.months as of the date of this filing. We expect operating expenses in the year ending December 31,
20222024 to
increasedecrease as we continue to
expandseek opportunities for the divestiture of our
CGT tools business.freezer product lines from our current product portfolio. We expect to incur continued spending related to the
development and expansion of our
other existing product lines and expansion of our commercial capabilities for the foreseeable future. Our future capital requirements may include, but are not limited to, purchases of property
plant and equipment, the acquisition of additional cell and gene therapy products and technologies,
to complement our existing manufacturing capabilities, and continued investment in our intellectual property portfolio.
We actively evaluate various strategic transactions on an ongoing basis, including acquiring complementary products, technologies or businesses that would complement our existing portfolio. We continue to seek to acquire such potential assets that may offer us the best opportunity to create value for our shareholders. In order to acquire such assets, we may need to seek additional financing to fund these investments. If our available cash balances and anticipated cash flow from operations are insufficient to satisfy our liquidity requirements, including because of any such acquisition-related financing needs or lower demand for our products, we may seek to sell common or preferred equity or convertible debt securities, enter into a credit facility or another form of third-party funding, or seek other debt funding. The sale of equity and convertible debt securities may result in dilution to our stockholders, and those securities may have rights senior to those of our common shares. If we raise additional funds through the issuance of preferred stock, convertible debt securities or other debt financing, these securities or other debt could contain covenants that would restrict our operations. Any other third-party funding arrangement could require us to relinquish valuable rights. We may require additional capital beyond our currently anticipated amounts. Additional capital may not be available on reasonable terms, if at all.
ITEM 7A.
| QUANTITATIVE AND QUALITATIVE DISCLOSURE ABOUT MARKET RISK
|
Sexton Biotechnologies, Inc. acquisition
On August 9, 2021, BioLife entered into an Agreement and Plan of Merger (the “Sexton Merger Agreement”) with BLFS Merger Sub, Inc., a Delaware corporation (“Sexton Merger Sub”), Fortis Advisors LLC, in its capacity as the representative of the stockholders of Sexton (the “Sexton Seller Representative”) and Sexton Biotechnologies, Inc., a Delaware corporation.
On September 1, 2021, the Company completed the merger of Sexton Merger Sub with and into Sexton and Sexton became a wholly owned subsidiary of the Company (the “Sexton Merger”). As consideration for the Sexton Merger (the “Sexton Merger Consideration”), holders of common stock, preferred stock and options of Sexton, other than the Company (collectively, the “Sexton Participating Holders”), were entitled to receive an aggregate of 530,502 newly issued shares of the Company’s common stock, subject to certain post-closing adjustments, of which 477,452 shares of Common Stock were issued to the Sexton Participating Holders at the Closing, and 53,050 shares of Common Stock, or approximately 10% of the Merger consideration, were deposited into an escrow account for indemnification and post-closing purchase price adjustment purposes. Prior to the merger, the Company held preferred stock in Sexton, which was accounted for using a measurement alternative that measures the securities at cost minus impairment, if any. The Company accounted for the merger as a step acquisition, which required remeasurement of the Company’s existing ownership in Sexton to fair value prior to completing the acquisition method of accounting. Using step acquisition accounting, the Company increased the value of its existing equity interest to its fair value, resulting in the recognition of a non-cash gain of $6.5 million, which was included in the gain on acquisition of Sexton Biotechnologies, Inc. in the Consolidated Statements of Operations in the year ended December 31, 2021. The Company utilized a market-based valuation approach to determine the fair value of the existing equity interest based on the total merger consideration offered and the Company’s stock price at acquisition.
The Sexton Merger was accounted for as a purchase of a business under FASB ASC Topic 805, Business Combinations. The fair value of the net tangible assets acquired was approximately $4.1 million, the deferred tax liability acquired was approximately $1.5 million, the fair value of the intangible assets acquired was approximately $8.8 million, and the residual goodwill was approximately $28.5 million. The fair value calculations required critical estimates, including, but not limited to, future expected cash flows, revenue and expense projections, discount rates, revenue volatility, and royalty rates.
Global Cooling, Inc. acquisition
On March 19, 2021, the Company entered into an Agreement and Plan of Merger (the “GCI Merger Agreement”) with BLFS Merger Subsidiary, Inc., a Delaware corporation (“GCI Merger Sub”), Global Cooling, a Delaware corporation and Albert Vierling and William Baumel, in their capacity as the representatives of the stockholders of GCI (collectively, the “GCI Seller Representative”).
On May 3, 2021, pursuant to the GCI Merger Agreement, subject to the terms and conditions set forth therein, the transactions contemplated by the GCI Merger Agreement were consummated (the “GCI Closing”), GCI Merger Sub merged with and into GCI (the “GCI Merger” and, together with other transactions contemplated by the GCI Merger Agreement, the “GCI Transactions”), with GCI continuing as the surviving corporation in the GCI Merger and a wholly owned subsidiary of the Company. In the GCI Merger, all of the issued and outstanding shares of capital stock of GCI immediately prior to the filing of the Certificate of Merger with the Secretary of State of the State of Delaware (other than those properly exercising any applicable dissenter’s rights under Delaware law) were converted into the right to receive the
GCI Merger Consideration (as defined below). The Company paid the GCI Merger Consideration to the holders of common stock and preferred stock of GCI (collectively, the “GCI Stockholders”).
The aggregate merger consideration paid pursuant to the GCI Merger Agreement to the GCI Stockholders was 6,646,870 newly issued shares of common stock, provided, however, that the GCI Merger Consideration otherwise payable to GCI Stockholders was subject to the withholding of the GCI Escrow Shares (as defined below) and was subject to reduction for indemnification obligations. The GCI Merger Consideration allocable to one GCI stockholder was reduced by 10,400 shares to satisfy an outstanding note receivable of $374,000. In accordance with ASC 805, the Company recognized the settlement of pre-existing relationships in the forms of cash deposits, trade receivables, and trade payables, which are included in the consideration transferred. The GCI Merger Consideration is not subject to any purchase price adjustments.
At the GCI Closing, approximately nine percent (9%) of the GCI Merger Consideration (the “Escrow Shares”, along with any other dividends, distributions or other income on the GCI Escrow Shares, the “GCI Escrow Property”) otherwise issuable to the GCI Stockholders (allocated pro rata among the GCI Stockholders based on the GCI Merger Consideration otherwise issuable to them at the GCI Closing), was deposited into a segregated escrow account in accordance with an escrow agreement entered into in connection with the GCI Transactions (the “GCI Escrow Agreement”).
The GCI Escrow Property was held for a period of up to twenty-four (24) months after the GCI Closing as the sole and exclusive source of payment for any post-GCI Closing indemnification claims (other than fraud claims). On September 28, 2022, BioLife asserted an indemnification claim pursuant to the GCI Merger Agreement. On June 5, 2023, the Company entered into a Settlement Agreement with the representatives of the GCI Stockholders, pursuant to which the parties agreed to release 65% of the General Escrow Shares, totaling 216,024 shares, to the Company from the GCI Escrow Account. These shares were returned to the Company and subsequently cancelled. As a result of the settlement, the Company recorded a $5.1 million gain recognizing the return of the shares during the second quarter of 2023.
The GCI Merger was accounted for as a purchase of a business under FASB ASC Topic 805, Business Combinations. The fair value of the net tangible assets acquired was $740,000, the deferred tax liability acquired was $24.1 million, the fair value of the intangible assets acquired was $120.5 million, and the residual goodwill was $137.8 million. The fair value calculations for intangible assets required critical estimates, including, but not limited to, future expected cash flows, revenue and expense projections, discount rates, revenue volatility, and royalty rates.
Supply chain considerations
Our domestic and international supply chain operations were affected during the years ended December 31, 2021 and 2022 by the global COVID-19 pandemic and the resulting volatility and uncertainty it caused in the U.S. and international markets. The onset of the COVID-19 pandemic caused supply chains globally to become constrained, and these constraints historically impacted our business through both increased difficulty in obtaining semiconductor chips and increased pricing on available parts across our product lines during the years ended December 31, 2021 and 2022. However, during the year ended December 31, 2023, both availability and pricing of semiconductor chips have improved and no longer pose constraints on our supply chain. We currently have sufficient supply for electrical component parts within our operations and do not foresee constraints to return over our supply chain.
ITEM 7A. QUANTITATIVE AND QUALITATIVE DISCLOSURES ABOUT MARKET RISK
Foreign currency exchange risk
The Company operates internationally, and thus is subject to potentially adverse movements in foreign currency exchange rates. Approximately 1% of the Company's consolidated net sales in the year ended December 31,
20212023 were made in euros. The Company is exposed to market risk primarily from foreign exchange rate fluctuations of the euro as compared to the U.S. dollar as the financial position and operating results of the Company's foreign operations are translated into U.S. dollars for consolidation.
Month-end exchange rates between the euro and the U.S. dollar, which have not been weighted for actual sales volume in the applicable months in the periods, were as follows:
| | | Year Ended December 31, | |
| | | 2021 | | | 2020 | | | 2019 | |
High | | $ | 1.24 | | | $ | 1.23 | | | $ | 1.16 | |
Low | | $ | 1.12 | | | $ | 1.06 | | | $ | 1.09 | |
Average | | $ | 1.18 | | | $ | 1.14 | | | $ | 1.12 | |
| | | | | | | | | | | | | | | | | |
| Year Ended December 31, |
| 2023 | | 2022 | | 2021 |
| High | $ | 1.11 | | | $ | 1.15 | | | $ | 1.24 | |
| Low | $ | 1.06 | | | $ | 0.95 | | | $ | 1.12 | |
| Average | $ | 1.08 | | | $ | 1.05 | | | $ | 1.18 | |
The Company's exposure to foreign exchange rate fluctuations also arises from trade receivables and intercompany payables denominated in one currency in the financial statements, but receivable or payable in another currency.
The Company does not enter into foreign currency forward contracts to reduce its exposure to foreign currency rate changes on forecasted intercompany sales transactions or on intercompany foreign currency denominated balance sheet positions. Foreign currency transaction gains and losses are included in "Other
income (expense)"income" in the Consolidated Statements of Operations. The effect of translating net assets of foreign subsidiaries into U.S. dollars are recorded on the Consolidated Balance Sheet as part of "Accumulated other comprehensive loss, net of taxes".
The effects of a hypothetical 10% appreciation in the U.S. dollar from December 31,
20212023 levels against the euro are as follows (in thousands):
Decrease in translation of 2021 earnings into U.S. dollars | | $ | 46 | |
Decrease in translation of net assets of foreign subsidiaries | | $ | 1,132 | |
| | | | | |
| Decrease in translation of 2023 earnings into U.S. dollars | $ | 150 | |
| Decrease in translation of net assets of foreign subsidiaries | $ | 187 | |
Interest rate risk
Our exposure to market risk for changes in interest rates relates primarily to our investments in available-for-sale securities and our long-term debt. We invest our excess cash in investment grade short to intermediate-term fixed income securities. These securities may have their fair market value adversely affected due to a rise in interest rates, and we may suffer losses if forced to sell securities that have declined in market value due to changes in interest rates. Our long-term debt primarily bears interest at a fixed rate, with a variable component subject to an interest rate ceiling. Fluctuations in interest rates therefore do not materially impact our consolidated financial statements from long-term debt. For additional information about our available-for-sale securities and long-term debt, see Notes 4 and 13 to the Consolidated Financial statements in Part II, Item 8 of this Annual Report.
ITEM 8. CONSOLIDATED FINANCIAL STATEMENTS AND SUPPLEMENTARY DATA
ITEM 8.
| CONSOLIDATED FINANCIAL STATEMENTS AND SUPPLEMENTARY DATA
|
INDEX TO CONSOLIDATED FINANCIAL STATEMENTS
| | | | | |
| Page No. |
| | Page No.
|
| | |
| |
| | 39
|
| | 41
|
| | 42 |
| | 43
|
| | 44
|
| | 45
|
| | 46
|
REPORT OF INDEPENDENT REGISTERED PUBLIC ACCOUNTING FIRM
Board of Directors
and Shareholders
BioLife Solutions, Inc.
Bothell, Washington
Opinion on the
Consolidated Financial Statementsfinancial statements
We have audited the accompanying consolidated balance sheets of BioLife Solutions, Inc. and subsidiaries (the “Company”) as of December 31, 20212023 and 2020,2022, the related consolidated statements of operations, comprehensive (loss) income,loss, shareholders’ equity, and cash flows for each of the threetwo years in the period ended December 31, 2021,2023, and the related notes (collectively referred to as the “consolidated financial“financial statements”). In our opinion, the consolidated financial statements present fairly, in all material respects, the financial position of the Company atas of December 31, 20212023 and 2020,2022, and the results of its operations and its cash flows for each of the threetwo years in the period ended December 31, 2021,2023, in conformity with accounting principles generally accepted in the United States of America.
We also have audited, in accordance with the standards of the Public Company Accounting Oversight Board (United States) (“PCAOB”), the Company'sCompany’s internal control over financial reporting as of December 31, 2021,2023, based on criteria established in the 2013 Internal Control –Control—Integrated Framework (2013) issued by the Committee of Sponsoring Organizations of the Treadway Commission (“COSO”), and our report dated March 31, 2022February 29, 2024 expressed an adverse opinion thereon.opinion.
Adoption of New Accounting Standard
As discussed in Note 1 to the consolidated financial statements, the Company has changed its method of accounting for credit losses in 2023 due to the adoption of ASU 2016-13, Measurement of Credit Losses on Financial Instruments.
These
consolidated financial statements are the responsibility of the Company’s management. Our responsibility is to express an opinion on the Company’s
consolidated financial statements based on our audits. We are a public accounting firm registered with the PCAOB and are required to be independent with respect to the Company in accordance with the U.S. federal securities laws and the applicable rules and regulations of the Securities and Exchange Commission and the PCAOB.
We conducted our audits in accordance with the standards of the PCAOB. Those standards require that we plan and perform the audit to obtain reasonable assurance about whether the financial statements are free of material misstatement, whether due to error or fraud. Our audits included performing procedures to assess the risks of material misstatement of the financial statements, whether due to error or fraud, and performing procedures that respond to those risks. Such procedures included examining, on a test basis, evidence regarding the amounts and disclosures in the financial statements. Our audits also included evaluating the accounting principles used and significant estimates made by management, as well as evaluating the overall presentation of the financial statements. We believe that our audits provide a reasonable basis for our opinion.
Critical audit matter
The critical audit matter communicated below is a matter arising from the current period audit of the financial statements that was communicated or required to be communicated to the audit committee and that: (1) relates to accounts or disclosures that are material to the financial statements and (2) involved our especially challenging, subjective, or complex judgments. The communication of critical audit matters does not alter in any way our opinion on the financial statements, taken as a whole, and we are not, by communicating the critical audit matter below, providing a separate opinion on the critical audit matter or on the accounts or disclosures to which it relates.
Consolidated Financial Statements - Impact of Internal Control over Financial Reporting
As described in Management’s Report on Internal Control Over Financial Reporting, material weaknesses were identified as of December 31, 2023. The prevention, detection, and correction of material misstatements of the consolidated financial statements, is dependent, in part, on management (i) designing and maintaining an effective control environment, including maintaining sufficient resources within the accounting and financial reporting department to review complex financial reporting transactions; and updating and distributing accounting policies and procedures across the organization (ii) designing and implementing effective information and communication process to identify and assess the source of and controls necessary to ensure the reliability of information used in financial reporting and that communicates relevant information about roles and responsibilities for internal control over financial reporting and (iii) designing and implementing effective process-level control activities and general information technology controls related to financial
reporting processes. We identified the impact on our audit of the material weaknesses related to the control environment, information and communication, and control activities (“material weaknesses”), as further described in Management’s Report, as a critical audit matter.
The principal consideration for our determination that the impact on our audit of the material weaknesses is a critical audit matter is that especially challenging auditor judgment was required in designing audit procedures and evaluating audit evidence due to the ineffective system of internal control over financial reporting, which affects substantially all consolidated financial statement account balances and disclosures.
Our audit procedures related to the material weaknesses included the following, among others.
•We determined the nature and extent of audit procedures that are responsive to the identified material weaknesses and evaluated the evidence obtained from the procedures performed.
•We lowered the threshold used for investigating differences noted for recorded amounts.
•We selected larger sample sizes for tests of details.
•We substantively tested the accuracy and completeness of system-generated reports used in the audit and more extensively tested these reports.
•We increased the extent of supervision over the execution of audit procedures.
/s/ GRANT THORNTON LLP
We have served as the Company's auditor since 2022.
Bellevue, Washington
February 29, 2024
REPORT OF INDEPENDENT REGISTERED PUBLIC ACCOUNTING FIRM
Shareholders and Board of Directors
BioLife Solutions, Inc.
Bothell, Washington
Opinion on the Consolidated Financial Statements
We have audited the accompanying consolidated statements of operations, comprehensive loss, shareholders’ equity, and cash flows of BioLife Solutions, Inc. (the “Company”) for the year ended December 31, 2021, and the related notes (collectively referred to as the “consolidated financial statements”). In our opinion, the consolidated financial statements present fairly, in all material respects, the results of its operations and its cash flows for the year ended December 31, 2021, in conformity with accounting principles generally accepted in the United States of America.
Basis for Opinion
These consolidated financial statements are the responsibility of the Company’s management. Our responsibility is to express an opinion on the Company’s consolidated financial statements based on our audit. We are a public accounting firm registered with the Public Company Accounting Oversight Board (United States) (“PCAOB”) and are required to be independent with respect to the Company in accordance with the U.S. federal securities laws and the applicable rules and regulations of the Securities and Exchange Commission and the PCAOB.
We conducted our audit in accordance with the standards of the PCAOB. Those standards require that we plan and perform the audit to obtain reasonable assurance about whether the consolidated financial statements are free of material misstatement, whether due to error or fraud.
Our
auditsaudit included performing procedures to assess the risks of material misstatement of the consolidated financial statements, whether due to error or fraud, and performing procedures that respond to those risks. Such procedures included examining, on a test basis, evidence regarding the amounts and disclosures in the consolidated financial statements. Our
auditsaudit also included evaluating the accounting principles used and significant estimates made by management, as well as evaluating the overall presentation of the consolidated financial statements. We believe that our
audits provideaudit provides a reasonable basis for our opinion.
Critical Audit Matters
The critical audit matters communicated below are matters arising from the current period audit of the consolidated financial statements that were communicated or required to be communicated to the audit committee and that: (1) relate to accounts or disclosures that are material to the consolidated financial statements and (2) involved our especially challenging, subjective, or complex judgments. The communication of critical audit matters does not alter in any way our opinion on the consolidated financial statements, taken as a whole, and we are not, by communicating the critical audit matters below, providing separate opinions on the critical audit matters or on the accounts or disclosures to which they relate.
Contingent Consideration – SciSafe Holdings (“SciSafe”)
As described in Note 2 to the consolidated financial statements, contingent consideration liabilities are recorded at fair value on the acquisition date and are revalued each reporting period, with changes in the fair value recognized within the consolidated statement of operations. As of and for the year ended December 31, 2021, the Company recorded a contingent consideration liability associated with the October 1, 2020 acquisition of SciSafe of $9.9 million and a change in fair value of $3.0 million. Management estimated the fair value of contingent consideration through valuation models that incorporate unobservable inputs including projected revenue, revenue and asset volatility, and discount rates. Changes in the fair value of contingent consideration can result from changes to one or multiple assumptions.
We identified the estimation of the fair value of the SciSafe contingent consideration liability as a critical audit matter. The determination of the SciSafe contingent consideration liability’s fair value requires management to make significant judgments including the appropriateness of the valuation model and the reasonableness of estimates and assumptions. Changes in these estimates and assumptions could have a significant impact on the fair value of the SciSafe contingent consideration liability. Auditing these elements involved especially challenging auditor judgment due to the subjectivity and the nature and extent of audit effort required to address the matter, including the extent of specialized skill or knowledge needed.
The primary procedures we performed to address this critical audit matter included:
| ●
| Assessing the reasonableness of certain significant assumptions used in the valuation model, through: (i) comparing historical forecasts to SciSafe’s actual performance, (ii) evaluating the reasonableness of significant assumptions (including revenue projections) against current budgets and the expected performance of SciSafe, and (iii) evaluating the impact of alternative assumptions on the measurements and comparing to management’s estimate.
|
| ●
| Utilizing professionals with specialized skills and knowledge to assist in evaluating the appropriateness of the valuation model utilized by management and to assess the reasonableness of assumptions and accuracy of the underlying calculations used by management to develop the discount rate, revenue volatility, and asset volatility applied to the revenue forecast.
|
Business Combinations – Valuation of Acquired Intangible Assets
As described in Note 12 to the consolidated financial statements, on May 3, 2021, the Company acquired Global Cooling, Inc. (“GCI”) for purchase consideration of approximately $234.9 million and on September 1, 2021, the Company acquired Sexton Biotechnologies (“Sexton”) for purchase consideration of approximately $39.9 million. Management applied significant judgment in estimating the fair value of the identifiable intangible assets including in-process research and development assets, developed technology, customer relationships, and tradenames.
We identified the determination of the fair values of the identifiable intangible assets as a critical audit matter. The Company’s estimation of the acquisition date fair values of certain identifiable intangible assets is complex, requires management’s judgment and involves the use of significant estimates and assumptions, including selection of the appropriate valuation methodology, revenue growth rates, forecasted expenses, royalty rates, and discount rates. Auditing these elements involved especially challenging and subjective auditor judgment due to the nature and extent of audit effort required to address these matters, including the extent of specialized skill or knowledge needed.
The primary procedures we performed to address this critical audit matter included:
●
| Assessing the reasonableness of projected revenue growth rates and forecasted expenses through: (i) evaluating historical performance of the target entities, and (ii) assessing financial projections against market trends, industry metrics and peer-group/guideline companies.
|
●
| Utilizing personnel with specialized knowledge and skill with valuation to assist in: (i) assessing the reasonableness of royalty rates and discount rates incorporated into the various valuation models, and (ii) assessing the appropriateness of various valuation models utilized by management to determine the fair values of the intangible assets.
|
/s/ BDO USA, LLP
We
have served as the Company's auditor
since 2019.from 2019 to 2022.
BioLife Solutions, Inc.
Consolidated Balance Sheets | | | December 31, | |
| December 31, | | | December 31, |
(In thousands, except per share and share data) | | 2021 | | 2020 | | (In thousands, except per share and share data) | 2023 | | 2022 |
Assets | | | | |
Current assets: | |
| Current assets: | |
| Current assets: | |
| Cash and cash equivalents | |
| Cash and cash equivalents | |
Cash and cash equivalents | | $ | 69,860 | | | $ | 90,403 | |
Restricted cash | | 10 | | | 53 | |
Accounts receivable, trade, net of allowance for doubtful accounts of $275 and $85 as of December 31, 2021 and December 31, 2020, respectively | | 23,217 | | | 8,006 | |
| Available-for-sale securities, current portion | |
| Accounts receivable, trade, net of allowance for credit losses of $1,710 and $739 as of December 31, 2023 and December 31, 2022, respectively | |
Inventories | | 28,345 | | | 11,602 | |
Prepaid expenses and other current assets | | | 4,427 | | | | 4,648 | |
Total current assets | | 125,859 | | | 114,712 | |
| | |
Assets held for rent, net | | 9,809 | | | 4,705 | |
| Assets held for rent, net | |
| Assets held for rent, net | |
Property and equipment, net | | 17,657 | | | 10,120 | |
Operating lease right-of-use assets, net | | 18,705 | | | 9,675 | |
Financing lease right-of-use assets, net | | 440 | | | 17 | |
Long-term deposits and other assets | | 325 | | | 230 | |
Investments | | 4,372 | | | 5,872 | |
| Available-for-sale securities, long term | |
| Equity Investments | |
Intangible assets, net | | 152,149 | | | 31,049 | |
Goodwill | | | 224,741 | | | | 58,449 | |
Total assets | | $ | 554,057 | | | $ | 234,829 | |
| | |
Liabilities and Shareholders’ Equity | | | | |
| Liabilities and Shareholders’ Equity | |
| Liabilities and Shareholders’ Equity | |
| Liabilities and Shareholders’ Equity | |
| Current liabilities: | |
| Current liabilities: | |
Current liabilities: | |
Accounts payable | | $ | 14,945 | | | $ | 3,672 | |
| Accounts payable | |
| Accounts payable | |
Accrued expenses and other current liabilities | | 7,142 | | | 4,543 | |
| Sales taxes payable | |
Warranty liability | | 9,398 | | | 212 | |
Lease liabilities, operating, current portion | | 2,758 | | | 1,107 | |
Lease liabilities, financing, current portion | | 149 | | | 8 | |
Debt, current portion | | 862 | | | 614 | |
Warrant liability | | 0 | | | 2,780 | |
Contingent consideration, current portion | | | 5,127 | | | | 2,637 | |
Total current liabilities | | 40,381 | | | 15,573 | |
| | |
| Contingent consideration, long-term | |
| Contingent consideration, long-term | |
Contingent consideration, long-term | | 4,900 | | | 4,515 | |
Lease liabilities, operating, long-term | | 16,466 | | | 8,757 | |
Lease liabilities, financing, long-term | | 291 | | | 12 | |
Debt, long-term | | 6,353 | | | 655 | |
Deferred tax liabilities | | 5,487 | | | 0 | |
Other long-term liabilities | | | 42 | | | | 71 | |
Total liabilities | | | 73,920 | | | | 29,583 | |
| | |
Commitments and Contingencies (Note 11) | | | | | |
| Commitments and contingencies (Note 12) | |
| Commitments and contingencies (Note 12) | |
| Commitments and contingencies (Note 12) | | | | |
| | |
Shareholders’ equity: | |
Preferred stock, $0.001 par value; 1,000,000 shares authorized, Series A, 4,250 shares designated, and 0 shares issued and outstanding as of December 31, 2021 and December 31, 2020 | | 0 | | | 0 | |
Common stock, $0.001 par value; 150,000,000 shares authorized, 41,817,503 and 33,039,146 shares issued and outstanding as of December 31, 2021 and December 31, 2020, respectively | | 42 | | | 33 | |
| Shareholders’ equity: | |
| Shareholders’ equity: | |
| Preferred stock, $0.001 par value; 1,000,000 shares authorized, Series A, 4,250 shares designated, and 0 shares issued and outstanding as of December 31, 2023 and December 31, 2022 | |
| Preferred stock, $0.001 par value; 1,000,000 shares authorized, Series A, 4,250 shares designated, and 0 shares issued and outstanding as of December 31, 2023 and December 31, 2022 | |
| Preferred stock, $0.001 par value; 1,000,000 shares authorized, Series A, 4,250 shares designated, and 0 shares issued and outstanding as of December 31, 2023 and December 31, 2022 | |
| Common stock, $0.001 par value; 150,000,000 shares authorized, 45,167,225 and 42,832,231 shares issued and outstanding as of December 31, 2023 and December 31, 2022, respectively | |
Additional paid-in capital | | 585,397 | | | 302,598 | |
Accumulated other comprehensive loss, net of taxes | | (282 | ) | | 0 | |
Accumulated deficit | | | (105,020 | ) | | | (97,385 | ) |
Total shareholders’ equity | | | 480,137 | | | | 205,246 | |
Total liabilities and shareholders’ equity | | $ | 554,057 | | | $ | 234,829 | |
The accompanying Notes to consolidated Financial Statements are an integral part of these consolidated financial statements
BioLife Solutions, Inc.
Consolidated Statements of Operations
| | | Years Ended December 31 | |
(In thousands, except per share and share data) | | 2021 | | | 2020 | | | 2019 | |
| | | | | | | | | | | | | |
Product revenue | | $ | 101,913 | | | $ | 44,540 | | | $ | 26,844 | |
Service revenue | | | 9,817 | | | | 1,752 | | | | 0 | |
Rental revenue | | | 7,426 | | | | 1,795 | | | | 527 | |
Total product, service, and rental revenue | | | 119,156 | | | | 48,087 | | | | 27,371 | |
Costs and operating expenses: | | | | | | | | | | | | |
Cost of product revenue (exclusive of intangible assets amortization) | | | 69,676 | | | | 18,058 | | | | 8,355 | |
Cost of service revenue (exclusive of intangible assets amortization) | | | 5,381 | | | | 1,367 | | | | 405 | |
Cost of rental revenue (exclusive of intangible assets amortization) | | | 7,051 | | | | 1,221 | | | | 0 | |
Research and development | | | 11,821 | | | | 6,720 | | | | 3,168 | |
Sales and marketing | | | 14,006 | | | | 6,413 | | | | 4,701 | |
General and administrative | | | 32,448 | | | | 14,607 | | | | 8,893 | |
Intangible asset amortization | | | 8,202 | | | | 3,033 | | | | 1,079 | |
Acquisition costs | | | 1,636 | | | | 668 | | | | 940 | |
Change in fair value of contingent consideration | | | 2,875 | | | | 1,575 | | | | 50 | |
Total operating expenses | | | 153,096 | | | | 53,662 | | | | 27,591 | |
Operating loss | | | (33,940 | ) | | | (5,575 | ) | | | (220 | ) |
| | | | | | | | | | | | | |
Other income (expense): | | | | | | | | | | | | |
Change in fair value of warrant liability | | | (121 | ) | | | 3,601 | | | | (12,835 | ) |
Change in fair value of investments | | | 0 | | | | 1,319 | | | | 0 | |
Interest (expense) income, net | | | (432 | ) | | | 58 | | | | 501 | |
Other income (expense) | | | 289 | | | | 0 | | | | (13 | ) |
Loss from equity-method investment in SAVSU | | | 0 | | | | 0 | | | | (739 | ) |
Gain on acquisition of SAVSU | | | 0 | | | | 0 | | | | 10,108 | |
Gain on acquisition of Sexton Biotechnologies, Inc. | | | 6,451 | | | | 0 | | | | 0 | |
Total other income (expense), net | | | 6,187 | | | | 4,978 | | | | (2,978 | ) |
| | | | | | | | | | | | | |
Loss before income tax benefit | | | (27,753 | ) | | | (597 | ) | | | (3,198 | ) |
Income tax benefit | | | 20,118 | | | | 3,264 | | | | 1,541 | |
Net (loss) income | | $ | (7,635 | ) | | $ | 2,667 | | | $ | (1,657 | ) |
| | | | | | | | | | | | | |
Net (loss) income attributable to common shareholders: | | | | | | | | | | | | |
Basic | | $ | (7,635 | ) | | $ | 2,450 | | | $ | (1,657 | ) |
Diluted | | | (7,635 | ) | | | (954 | ) | | | (1,657 | ) |
(Loss) earnings attributable to common shareholders: | | | | | | | | | | | | |
Basic | | $ | (0.20 | ) | | $ | 0.09 | | | $ | (0.09 | ) |
Diluted | | $ | (0.20 | ) | | $ | (0.03 | ) | | $ | (0.09 | ) |
Weighted average shares used to compute (loss) earnings per share attributable to common shareholders: | | | | | | | | | | | | |
Basic and Diluted | | | 38,503,944 | | | | 27,306,258 | | | | 19,460,299 | |
The accompanying Notes to Consolidated Financial Statements are an integral part of these consolidated financial statements
42
BioLife Solutions, Inc.
Consolidated Statements of
Comprehensive (Loss) IncomeOperations| | | Years Ended December 31 | |
(In thousands) | | 2021 | | | 2020 | | | 2019 | |
| | | | | | | | | | | | | |
Net (loss) income | | $ | (7,635 | ) | | $ | 2,667 | | | $ | (1,657 | ) |
| | | | | | | | | | | | | |
Other comprehensive loss - foreign currency translation adjustment, net of tax | | | (282 | ) | | | 0 | | | | 0 | |
| | | | | | | | | | | | | |
Comprehensive (loss) income | | $ | (7,917 | ) | | $ | 2,667 | | | $ | (1,657 | ) |
| | | | | | | | | | | | | | | | | |
| Years Ended December 31 |
| (In thousands, except per share and share data) | 2023 | | 2022 | | 2021 |
| | | | | |
| Product revenue | $ | 117,695 | | | $ | 136,000 | | | $ | 101,913 | |
| Service revenue | 17,551 | | | 15,308 | | | 9,817 | |
| Rental revenue | 8,025 | | | 10,451 | | | 7,426 | |
| Total product, service, and rental revenue | 143,271 | | | 161,759 | | | 119,156 | |
| Costs and operating expenses: | | | | | |
| Cost of product revenue (exclusive of intangible assets amortization) | 75,751 | | | 88,519 | | | 69,676 | |
| Cost of service revenue (exclusive of intangible assets amortization) | 15,586 | | | 12,360 | | | 5,381 | |
| Cost of rental revenue (exclusive of intangible assets amortization) | 5,182 | | | 7,058 | | | 7,051 | |
| General and administrative | 55,725 | | | 47,670 | | | 33,668 | |
| Sales and marketing | 24,583 | | | 21,570 | | | 14,006 | |
| Research and development | 18,796 | | | 14,798 | | | 11,821 | |
| Asset impairment charges | 15,485 | | | 110,364 | | | — | |
| Intangible asset amortization | 5,181 | | | 9,697 | | | 8,202 | |
| Acquisition costs | — | | | 18 | | | 1,636 | |
| Change in fair value of contingent consideration | (2,193) | | | (4,754) | | | 2,875 | |
| Total operating expenses | 214,096 | | | 307,300 | | | 154,316 | |
| Operating loss | (70,825) | | | (145,541) | | | (35,160) | |
| | | | | |
| Other income: | | | | | |
| Change in fair value of warrant liability | — | | | — | | | (121) | |
| Change in fair value of investments | — | | | 697 | | | — | |
| Interest expense, net | (1,812) | | | (687) | | | (485) | |
| Other income | 1,264 | | | 704 | | | 289 | |
| Gain on settlement of Global Cooling escrow | 5,115 | | | — | | | — | |
| Gain on acquisition of Sexton Biotechnologies, Inc. | — | | | — | | | 6,451 | |
| Total other income, net | 4,567 | | | 714 | | | 6,134 | |
| | | | | |
| Loss before income tax (expense) benefit | (66,258) | | | (144,827) | | | (29,026) | |
| Income tax (expense) benefit | (169) | | | 5,022 | | | 20,118 | |
| Net loss | $ | (66,427) | | | $ | (139,805) | | | $ | (8,908) | |
| | | | | |
| Net loss attributable to common shareholders: | | | | | |
| Basic and Diluted | $ | (66,427) | | | $ | (139,805) | | | $ | (8,908) | |
| Net loss per share attributable to common shareholders: | | | | | |
| Basic and Diluted | $ | (1.52) | | | $ | (3.29) | | | $ | (0.23) | |
| Weighted average shares used to compute loss per share attributable to common shareholders: | | | | | |
| Basic and Diluted | 43,719,185 | | 42,481,027 | | 38,503,944 |
The accompanying Notes to Consolidated Financial Statements are an integral part of these consolidated financial statements
43
BioLife Solutions, Inc.
Consolidated Statements
of Shareholders’ EquityOf Comprehensive Loss| | | Series A | | | Series A | | | | | | | | | | | | | | | Accumulated | | | | | | | | | |
| | | Preferred | | | Preferred | | | Common | | | Common | | | Additional | | | Other | | | | | | | Total | |
| | | Stock | | | Stock | | | Stock | | | Stock | | | Paid-in | | | Comprehensive | | | Accumulated | | | Shareholders’ | |
(In thousands, except share data) | | Shares | | | Amount | | | Shares | | | Amount | | | Capital | | | Income | | | Deficit | | | Equity | |
Balance, December 31, 2018 | | | 0 | | | $ | 0 | | | | 18,547,406 | | | $ | 19 | | | $ | 113,008 | | | $ | - | | | $ | (98,395 | ) | | $ | 14,632 | |
Stock based compensation | | | - | | | | - | | | | - | | | | - | | | | 3,043 | | | | - | | | | - | | | | 3,043 | |
Shares issued in acquisitions | | | 0 | | | | 0 | | | | 1,334,219 | | | | 1 | | | | 23,931 | | | | 0 | | | | 0 | | | | 23,932 | |
Stock option exercises | | | - | | | | 0 | | | | 697,010 | | | | 1 | | | | 1,180 | | | | 0 | | | | 0 | | | | 1,181 | |
Stock issued – on vested RSAs | | | 0 | | | | 0 | | | | 125,817 | | | | 0 | | | | 0 | | | | 0 | | | | 0 | | | | 0 | |
Warrant exercises | | | - | | | | - | | | | 121,000 | | | | - | | | | 2,323 | | | | - | | | | - | | | | 2,323 | |
Net loss | | | - | | | | 0 | | | | - | | | | 0 | | | | 0 | | | | 0 | | | | (1,657 | ) | | | (1,657 | ) |
Balance, December 31, 2019 | | | - | | | | - | | | | 20,825,452 | | | | 21 | | | | 143,485 | | | | 0 | | | | (100,052 | ) | | | 43,454 | |
Stock issued as 2019 bonus payout | | | - | | | | - | | | | - | | | | - | | | | 314 | | | | - | | | | - | | | | 314 | |
Stock based compensation | | | - | | | | 0 | | | | - | | | | 0 | | | | 5,981 | | | | 0 | | | | 0 | | | | 5,981 | |
Sale of common stock, net of costs | | | 0 | | | | 0 | | | | 7,856,012 | | | | 8 | | | | 100,113 | | | | 0 | | | | 0 | | | | 100,121 | |
Common stock issued for services | | | - | | | | - | | | | 3,175 | | | | - | | | | 60 | | | | - | | | | - | | | | 60 | |
Shares issued in acquisitions | | | 0 | | | | 0 | | | | 611,683 | | | | 0 | | | | 17,916 | | | | 0 | | | | 0 | | | | 17,916 | |
Stock option exercises | | | 0 | | | | 0 | | | | 777,496 | | | | 1 | | | | 1,471 | | | | 0 | | | | 0 | | | | 1,472 | |
Stock issued – on vested RSAs | | | 0 | | | | 0 | | | | 208,858 | | | | 0 | | | | 0 | | | | 0 | | | | 0 | | | | 0 | |
Cashless exercises of 3,871,405 warrants | | | - | | | | 0 | | | | 2,747,970 | | | | 3 | | | | 33,108 | | | | 0 | | | | 0 | | | | 33,111 | |
Warrant exercises | | | 0 | | | | 0 | | | | 8,500 | | | | 0 | | | | 150 | | | | 0 | | | | 0 | | | | 150 | |
Net income | | | - | | | | - | | | | - | | | | - | | | | - | | | | - | | | | 2,667 | | | | 2,667 | |
Balance, December 31, 2020 | | | 0 | | | | 0 | | | | 33,039,146 | | | | 33 | | | | 302,598 | | | | 0 | | | | (97,385 | ) | | | 205,246 | |
Stock issued as consideration in GCI acquisition | | | - | | | | - | | | | 6,636,470 | | | | 7 | | | | 232,734 | | | | - | | | | - | | | | 232,741 | |
Stock issued as consideration in Sexton acquisition | | | - | | | | - | | | | 530,502 | | | | - | | | | 31,977 | | | | - | | | | - | | | | 31,977 | |
Fees incurred for registration filings | | | - | | | | - | | | | - | | | | - | | | | (186 | ) | | | - | | | | - | | | | (186 | ) |
Stock based compensation | | | - | | | | 0 | | | | - | | | | 0 | | | | 13,956 | | | | 0 | | | | 0 | | | | 13,956 | |
Stock option exercises | | | 0 | | | | 0 | | | | 869,065 | | | | 1 | | | | 1,417 | | | | 0 | | | | 0 | | | | 1,418 | |
Cashless exercise of 79,100 warrants | | | - | | | | - | | | | 70,030 | | | | 0 | | | | 2,901 | | | | - | | | | - | | | | 2,901 | |
Stock issued – on vested RSAs | | | 0 | | | | 0 | | | | 672,290 | | | | 1 | | | | 0 | | | | 0 | | | | 0 | | | | 1 | |
Foreign currency translation | | | - | | | | - | | | | - | | | | - | | | | - | | | | (282 | ) | | | - | | | | (282 | ) |
Net loss | | | - | | | | 0 | | | | - | | | | 0 | | | | 0 | | | | 0 | | | | (7,635 | ) | | | (7,635 | ) |
Balance, December 31, 2021 | | | 0 | | | $ | 0 | | | | 41,817,503 | | | $ | 42 | | | $ | 585,397 | | | $ | (282 | ) | | $ | (105,020 | ) | | $ | 480,137 | |
| | | | | | | | | | | | | | | | | |
| Years Ended December 31 |
| (In thousands) | 2023 | | 2022 | | 2021 |
| | | | | |
| Net loss | $ | (66,427) | | | $ | (139,805) | | | $ | (8,908) | |
| | | | | |
| Other comprehensive income (loss) - foreign currency translation adjustment, net of tax | 278 | | | (347) | | | (282) | |
| Unrealized gain (loss) on available-for-sale securities, net of tax | 56 | | | (50) | | | - | |
| | | | | |
| Comprehensive loss | $ | (66,093) | | | $ | (140,202) | | | $ | (9,190) | |
The accompanying Notes to Consolidated Financial Statements are an integral part of these consolidated financial statements
BioLife Solutions, Inc.
Consolidated Statements of Cash FlowsShareholders’ Equity | | | Year Ended December 31, | |
(In thousands) | | 2021 | | | 2020 | | | 2019 | |
Cash flows from operating activities | | | | | | | | | | | | |
Net (loss) income | | $ | (7,635 | ) | | $ | 2,667 | | | $ | (1,657 | ) |
Adjustments to reconcile net (loss) income to net cash (used in) provided by operating activities | | | | | | | | | | | | |
Depreciation | | | 4,663 | | | | 2,035 | | | | 718 | |
Amortization of intangible assets | | | 8,202 | | | | 3,033 | | | | 1,079 | |
Amortization of loan costs | | | 121 | | | | 0 | | | | 0 | |
Stock-based compensation | | | 13,956 | | | | 5,981 | | | | 3,043 | |
Non-cash lease expense | | | 2,053 | | | | 737 | | | | 512 | |
Loss from equity method investment in SAVSU | | | 0 | | | | 0 | | | | 739 | |
Gain on acquisition of SAVSU | | | 0 | | | | 0 | | | | (10,108 | ) |
Deferred income tax benefit | | | (20,127 | ) | | | (3,297 | ) | | | (1,541 | ) |
Change in fair value of contingent consideration | | | 2,875 | | | | 1,575 | | | | 50 | |
Change in fair value of warrant liability | | | 121 | | | | (3,601 | ) | | | 12,835 | |
Change in fair value of investments | | | 0 | | | | (1,319 | ) | | | 0 | |
Gain on acquisition of Sexton Biotechnologies, Inc. | | | (6,451 | ) | | | 0 | | | | 0 | |
Stock issued for services | | | 0 | | | | 60 | | | | 0 | |
Loss on disposal of assets held for rent, net | | | 609 | | | | 365 | | | | 0 | |
Loss on disposal of property and equipment, net | | | 482 | | | | 0 | | | | 0 | |
Forgiveness of loans payable | | | (284 | ) | | | 0 | | | | 0 | |
Other | | | 353 | | | | 190 | | | | 15 | |
| | | | | | | | | | | | | |
Change in operating assets and liabilities, net of effects of acquisitions | | | | | | | | | | | | |
Accounts receivable, trade, net | | | (10,132 | ) | | | (1,786 | ) | | | (290 | ) |
Inventories | | | 114 | | | | (629 | ) | | | (3,777 | ) |
Prepaid expenses and other current assets | | | 2,802 | | | | 25 | | | | (704 | ) |
Accounts payable | | | 2,018 | | | | (171 | ) | | | 768 | |
Accrued expenses and other current liabilities | | | (3,936 | ) | | | 780 | | | | (327 | ) |
Warranty liability | | | 5,833 | | | | 0 | | | | 0 | |
Other | | | (230 | ) | | | 0 | | | | (142 | ) |
Net cash (used in) provided by operating activities | | | (4,593 | ) | | | 6,645 | | | | 1,213 | |
| | | | | | | | | | | | | |
Cash flows from investing activities | | | | | | | | | | | | |
Cash acquired in acquisition of SAVSU | | | 0 | | | | 0 | | | | 1,251 | |
Acquisition of Astero Bio, net of cash acquired | | | 0 | | | | 0 | | | | (12,439 | ) |
Payments related to the acquisition of CBS | | | 0 | | | | 0 | | | | (11,000 | ) |
Payments related to the acquisition of SciSafe, net of cash acquired | | | - | | | | (14,947 | ) | | | 0 | |
Cash acquired in acquisition of Global Cooling, Inc. and Sexton Biotechnologies, Inc. | | | 1,559 | | | | - | | | | - | |
Investment in Sexton | | | 0 | | | | 0 | | | | (1,500 | ) |
Investment in iVexSol convertible debt | | | 0 | | | | 0 | | | | (1,000 | ) |
Investment in iVexSol preferred stock | | | 0 | | | | (1,000 | ) | | | 0 | |
Investment in PanTHERA Cryosolutions | | | 0 | | | | (995 | ) | | | 0 | |
Purchases of property and equipment | | | (8,385 | ) | | | (1,961 | ) | | | (675 | ) |
Deposits on property and equipment | | | 0 | | | | (2,672 | ) | | | 0 | |
Purchases of assets held for rent | | | (6,371 | ) | | | (2,813 | ) | | | (1,655 | ) |
Deposits on assets held for rent | | | 0 | | | | (362 | ) | | | 0 | |
Proceeds from sale of equipment | | | 5 | | | | 35 | | | | 0 | |
Net cash used in investing activities | | | (13,192 | ) | | | (24,715 | ) | | | (27,018 | ) |
| | | | | | | | | | | | | |
Cash flows from financing activities | | | | | | | | | | | | |
Proceeds from Paycheck Protection Program ("PPP") Loan | | | 0 | | | | 2,175 | | | | 0 | |
Payoff of PPP Loan | | | 0 | | | | (2,175 | ) | | | 0 | |
Proceeds from equipment loans | | | 1,550 | | | | 984 | | | | 0 | |
Payments on equipment loans | | | (214 | ) | | | 0 | | | | 0 | |
Payments of contingent consideration | | | 0 | | | | (483 | ) | | | 0 | |
Proceeds from sale of common stock, net of $6.2 million of costs in 2020 | | | 0 | | | | 100,121 | | | | 0 | |
Fees paid related to issuance of common stock | | | (145 | ) | | | - | | | | - | |
Proceeds from line of credit | | | 27,306 | | | | 0 | | | | 0 | |
Payments on line of credit | | | (31,536 | ) | | | 0 | | | | 0 | |
Proceeds from exercise of common stock options | | | 1,418 | | | | 1,472 | | | | 1,181 | |
Proceeds from exercise of warrants | | | 0 | | | | 40 | | | | 574 | |
Payments on financed insurance premium | | | (1,033 | ) | | | 0 | | | | 0 | |
Other | | | (124 | ) | | | (56 | ) | | | (159 | ) |
Net cash (used in) provided by financing activities | | | (2,778 | ) | | | 102,078 | | | | 1,596 | |
| | | | | | | | | | | | | |
Net (decrease) increase in cash, cash equivalents, and restricted cash | | | (20,563 | ) | | | 84,008 | | | | (24,209 | ) |
Cash, cash equivalents, and restricted cash – beginning of period | | | 90,456 | | | | 6,448 | | | | 30,657 | |
Effects of currency translation on cash, cash equivalents, and restricted cash | | | (23 | ) | | | 0 | | | | 0 | |
Cash, cash equivalents, and restricted cash – end of period | | $ | 69,870 | | | $ | 90,456 | | | $ | 6,448 | |
Non-cash investing and financing activities | | | | | | | | | | | | |
Cashless exercise of warrants reclassified from warrant liability to common stock | | $ | 2,901 | | | $ | 33,111 | | | $ | 0 | |
Stock issued as consideration to acquire Global Cooling, Inc. and Sexton Biotechnologies, Inc. | | $ | 264,718 | | | $ | 0 | | | $ | 0 | |
Equipment acquired under operating leases | | $ | 6,875 | | | $ | 8,096 | | | $ | 0 | |
Equipment acquired under finance leases | | $ | 440 | | | $ | 0 | | | $ | 0 | |
Purchase of property and equipment not yet paid | | $ | 197 | | | $ | 0 | | | $ | 29 | |
Reclassification of warrant liabilities to equity upon exercise | | $ | 0 | | | $ | 110 | | | $ | 1,749 | |
Stock issued as consideration to acquire SAVSU | | $ | 0 | | | $ | 0 | | | $ | 19,932 | |
Stock issued as consideration to acquire assets of CBS | | $ | 0 | | | $ | 0 | | | $ | 4,000 | |
Stock issued as consideration to acquire SciSafe | | $ | 0 | | | $ | 17,916 | | | $ | 0 | |
Stock issued as bonus consideration | | $ | 0 | | | $ | 314 | | | $ | 0 | |
Cash interest paid | | $ | 452 | | | $ | 0 | | | $ | 0 | |
| | | | | | | | | | | | | | | | | | | | | | | | | | | | | | | | | | | | | | | | | | | | | | | |
| (In thousands, except share data) | Series A
Preferred
Stock
Shares | | Series A
Preferred
Stock
Amount | | Common
Stock
Shares | | Common
Stock
Amount | | Additional
Paid-in
Capital | | Accumulated
Other
Comprehensive
Loss | | Accumulated
Deficit | | Total
Shareholders’
Equity |
| Balance, December 31, 2020 | — | | $ | — | | | 33,039,146 | | $ | 33 | | | $ | 302,598 | | | $ | — | | | $ | (98,202) | | | $ | 204,429 | |
| Stock issued as consideration in GCI acquisition | — | | — | | | 6,636,470 | | 7 | | | 232,734 | | | — | | | — | | | 232,741 | |
| Stock issued as consideration in Sexton acquisition | — | | — | | | 530,502 | | — | | | 31,977 | | | — | | | — | | | 31,977 | |
| Fees incurred for registration filings | — | | — | | | — | | — | | | (186) | | | — | | | — | | | (186) | |
| Stock-based compensation | — | | — | | | — | | — | | | 13,956 | | | — | | | — | | | 13,956 | |
| Stock option exercises | — | | — | | | 869,065 | | 1 | | | 1,417 | | | — | | | — | | | 1,418 | |
| Cashless exercise of 79,100 warrants | — | | — | | | 70,030 | | — | | | 2,901 | | | — | | | — | | | 2,901 | |
| Stock issued – on vested RSAs | — | | — | | | 672,290 | | 1 | | | — | | | — | | | — | | | 1 | |
| Foreign currency translation | — | | — | | | — | | — | | | — | | | (282) | | | — | | | (282) | |
| Net loss | — | | — | | | — | | — | | | — | | | — | | | (8,908) | | | (8,908) | |
| Balance, December 31, 2021 | — | | — | | | 41,817,503 | | 42 | | | 585,397 | | | (282) | | | (107,110) | | | 478,047 | |
| Stock issued as consideration for SciSafe earnout | — | | — | | | 64,130 | | — | | | 817 | | | — | | | — | | | 817 | |
| Fees incurred for registration filings | — | | — | | | — | | — | | | (131) | | | — | | | — | | | (131) | |
| Stock-based compensation | — | | — | | | — | | — | | | 25,334 | | | — | | | — | | | 25,334 | |
| Stock option exercises | — | | — | | | 161,646 | | — | | | 323 | | | — | | | — | | | 323 | |
| Stock issued – on vested RSAs | — | | — | | | 788,952 | | 1 | | | (1) | | | — | | | — | | | — | |
| Other comprehensive loss | — | | — | | | — | | — | | | — | | | (397) | | | — | | | (397) | |
| Net loss | — | | — | | | — | | — | | | — | | | — | | | (139,805) | | | (139,805) | |
| Balance, December 31, 2022 | — | | — | | | 42,832,231 | | 43 | | | 611,739 | | | (679) | | | (246,915) | | | 364,188 | |
| Stock issued as consideration for SciSafe earnout | — | | — | | | 116,973 | | — | | | 2,263 | | | — | | | — | | | 2,263 | |
| Fees incurred for registration filings | — | | — | | | — | | — | | | (132) | | | — | | | — | | | (132) | |
| Stock-based compensation | — | | — | | | — | | — | | | 31,670 | | | — | | | — | | | 31,670 | |
| Stock option exercises | — | | — | | | 239,043 | | — | | | 507 | | | — | | | — | | | 507 | |
| Stock issued – on vested RSA units | — | | — | | | 1,267,837 | | 1 | | | (1) | | | — | | | — | | | — | |
| Settlement of Global Cooling escrow | — | | — | | | (216,024) | | — | | | (5,115) | | | — | | | — | | | (5,115) | |
| Common stock shares issued | — | | — | | | 927,165 | | 1 | | | 10,374 | | | — | | | — | | | 10,375 | |
| Other comprehensive loss | — | | — | | | — | | — | | | — | | | 334 | | | — | | | 334 | |
| Net loss | — | | — | | | — | | — | | | — | | | — | | | (66,427) | | | (66,427) | |
| Balance, December 31, 2023 | — | | $ | — | | | 45,167,225 | | $ | 45 | | | $ | 651,305 | | | $ | (345) | | | $ | (313,342) | | | $ | 337,663 | |
The accompanying Notes to Consolidated Financial Statements are an integral part of these consolidated financial statements
BioLife Solutions, Inc.
Consolidated Statements of Cash Flows
| | | | | | | | | | | | | | | | | |
| Year Ended December 31, |
| (In thousands) | 2023 | | 2022 | | 2021 |
| Cash flows from operating activities | | | | | |
| Net loss | $ | (66,427) | | | $ | (139,805) | | | $ | (8,908) | |
| Adjustments to reconcile net loss to net cash used in operating activities | | | | | |
| Impairment of intangible assets | 5,758 | | | 110,364 | | | — | |
| Impairment of long-lived assets | 9,727 | | | — | | | — | |
| Gain on settlement of Global Cooling escrow | (5,115) | | | — | | | — | |
| Depreciation | 7,114 | | | 6,775 | | | 4,663 | |
| Amortization of intangible assets | 5,181 | | | 9,697 | | | 8,202 | |
| Amortization of loan costs | 13 | | | 18 | | | 121 | |
| Stock-based compensation | 31,670 | | | 25,334 | | | 13,956 | |
| Non-cash lease expense | 404 | | | 3,486 | | | 2,053 | |
| Deferred income tax benefit | (62) | | | (5,238) | | | (20,127) | |
| Change in fair value of contingent consideration | (2,193) | | | (4,754) | | | 2,875 | |
| Change in fair value of warrant liability | — | | | — | | | 121 | |
| Change in fair value of investments | — | | | (697) | | | — | |
| Accretion of investments | (1,262) | | | (447) | | | — | |
| Gain on acquisition of Sexton Biotechnologies, Inc. | — | | | — | | | (6,451) | |
| Loss on disposal of assets held for rent, net | 594 | | | 773 | | | 609 | |
| Loss on disposal of property and equipment, net | 633 | | | 745 | | | 482 | |
| Forgiveness of loans payable | — | | | — | | | (284) | |
| Other | — | | | 166 | | | 353 | |
| | | | | |
| Change in operating assets and liabilities, net of effects of acquisitions | | | | | |
| Accounts receivable, trade, net | 15,351 | | | (10,753) | | | (10,132) | |
| Inventories | (8,552) | | | (6,559) | | | 114 | |
| Prepaid expenses and other current assets | 137 | | | 26 | | | 2,663 | |
| Accounts payable | (8,425) | | | 414 | | | 2,018 | |
| Accrued expenses and other current liabilities | 2,002 | | | 1,787 | | | (3,936) | |
| Sales taxes payable | 1,311 | | | 1,526 | | | 1,412 | |
| Warranty liability | (454) | | | (1,086) | | | 5,833 | |
| Other | 97 | | | (260) | | | (230) | |
| Net cash used in operating activities | (12,498) | | | (8,488) | | | (4,593) | |
| | | | | |
| Cash flows from investing activities | | | | | |
| Cash acquired in acquisition of Global Cooling, Inc. and Sexton Biotechnologies, Inc. | — | | | — | | | 1,559 | |
| Purchases of property and equipment | (6,381) | | | (10,385) | | | (8,385) | |
| Purchases of assets held for rent | (4,856) | | | (3,536) | | | (6,371) | |
| Proceeds from sale of equipment | — | | | — | | | 5 | |
| Proceeds from sale of available-for-sale securities | 3,469 | | | 420 | | | — | |
| Maturities of available-for-sale securities | 52,700 | | | 8,500 | | | — | |
| Investment in available-for-sale securities | (27,095) | | | (53,116) | | | — | |
| Net cash provided by (used in) investing activities | 17,837 | | | (58,117) | | | (13,192) | |
| | | | | |
| Cash flows from financing activities | | | | | |
| Proceeds from term loan | — | | | 20,000 | | | — | |
| Payments on term loan | (300) | | | (1,666) | | | — | |
| Payments on equipment loans | (198) | | | (498) | | | (214) | |
| Proceeds from equipment loans | — | | | — | | | 1,550 | |
| Issuance of common stock | 10,244 | | | — | | | — | |
| Fees paid related to issuance of common stock | — | | | (131) | | | (145) | |
| Proceeds from line of credit | — | | | — | | | 27,306 | |
| Payments on line of credit | — | | | — | | | (31,536) | |
| Proceeds from exercise of common stock options | 507 | | | 323 | | | 1,418 | |
| Proceeds from financed insurance premium | 2,639 | | | — | | | — | |
| Payments on financed insurance premium | (2,365) | | | (1,375) | | | (1,033) | |
| Other | 64 | | | (337) | | | (124) | |
| Net cash provided by (used in) financing activities | 10,591 | | | 16,316 | | | (2,778) | |
| | | | | |
| Net increase (decrease) in cash, cash equivalents, and restricted cash | 15,930 | | | (50,289) | | | (20,563) | |
| Cash, cash equivalents, and restricted cash – beginning of period | 19,473 | | | 69,870 | | | 90,456 | |
| Effects of currency translation on cash, cash equivalents, and restricted cash | 35 | | | (108) | | | (23) | |
| Cash, cash equivalents, and restricted cash – end of period | $ | 35,438 | | | $ | 19,473 | | | $ | 69,870 | |
| Non-cash investing and financing activities | | | | | |
| Cashless exercise of warrants reclassified from warrant liability to common stock | $ | — | | | $ | — | | | $ | 2,901 | |
| Stock issued as consideration to acquire Global Cooling, Inc. and Sexton Biotechnologies, Inc. | $ | — | | | $ | — | | | $ | 264,718 | |
| Assets acquired under operating leases | $ | 880 | | | $ | 243 | | | $ | 6,875 | |
| Assets acquired under finance leases | $ | 1,682 | | | $ | — | | | $ | 440 | |
| Purchase of property and equipment not yet paid | $ | 359 | | | $ | 478 | | | $ | 197 | |
| Unrealized (gain) loss on available-for-sale securities | $ | (56) | | | $ | 50 | | | $ | — | |
| Unrealized gain on currency translation | $ | (12) | | | $ | — | | | $ | — | |
| Cashless issuance of SciSafe earnout shares | $ | 2,263 | | | $ | 817 | | | $ | — | |
| Returned shares from settlement of Global Cooling escrow | $ | (5,115) | | | $ | — | | | $ | — | |
| Cash interest paid | $ | 1,927 | | | $ | 586 | | | $ | 452 | |
The accompanying Notes to Consolidated Financial Statements are an integral part of these consolidated financial statements
NOTES TO CONSOLIDATED FINANCIAL STATEMENTS
1.
| Organization and significant accounting policies
|
1. Organization and significant accounting policies
BioLife Solutions, Inc. (“BioLife”, “us”, “we”, “our”, or the “Company”) is a developer, manufacturer, and supplier of a portfolio of bioproduction tools and services including proprietary biopreservation media, automated thawing devices, cloud-connected shipping containers, ultra-low temperature mechanical freezers, cryogenic and controlled rate freezers, and biological and pharmaceutical materials storage. Our
CryoStor®CryoStor freeze media and
HypoThermosol®HypoThermosol hypothermic storage media are optimized to preserve cells in the regenerative medicine market. These novel biopreservation media products are serum-free and protein-free, fully defined, and are formulated to reduce preservation-induced cell damage and death. Our Sexton cell processing product line includes human platelet lysates (“hPL”) for cell expansion, reducing risk and improving downstream performance over fetal bovine serum, human serum, and other chemically defined media,
CellSeal®CellSeal cryogenic vials that are purpose-built rigid containers used in cell and gene therapy (“CGT”) that can be filled manually or with high throughput systems, and automated cell processing machines that bring multiple processes traditionally performed by manual techniques under a higher level of control to protect therapies from loss or contamination. Our
ThawSTAR®ThawSTAR product line is comprised of a family of automated thawing devices for frozen cell and gene therapies packaged in cryovials and cryobags. These products help administer temperature-sensitive biologic therapies to patients by standardizing the thawing process and reducing the risks of contamination and overheating, which are inherent with the use of traditional water baths. Our cryogenic freezer technology provides for controlled rate freezing and cryogenic storage of biologic materials. Our ultra-low temperature mechanical freezers allow biological materials and vaccines to be stored at temperatures which range from negative
20℃ to negative
86℃. Our evo® shipping containers provide cloud-connected passive storage and transport containers for temperature-sensitive biologics and pharmaceuticals. Our biological and pharmaceutical materials storage services provide facilities that allow for real-time tracking of biologic materials and vaccines that can be stored at a wide range of temperatures.
The preparation of financial statements in conformity with generally accepted accounting principles in the United States (“U.S. GAAP”) requires management to make estimates and assumptions that affect the reported amounts of assets and liabilities as of the date of the financial statements and reported amounts of revenue and expenses during the reporting period. Actual results could differ from those estimates.
Significant estimates
Estimates and assumptions by management affect the Company’s allowance for
doubtful accounts,credit losses, the net realizable value of inventory, fair value of warrant liability,
sales tax liabilities, valuation of market based
stock awards, valuations and purchase price allocations related to investments and business combinations, expected future cash flows including growth rates, discount rates, terminal values and other assumptions and estimates used to evaluate the recoverability of long-lived assets, estimated fair values of intangible assets and goodwill, amortization methods and periods, warranty reserves, certain accrued expenses, share-based compensation, contingent consideration from business combinations, and the
recoverability of the Company’s deferred tax assets and the related valuation allowance.provision for income taxes.
The Company regularly assesses these estimates; however, actual results could differ materially from these estimates. Changes in estimates are recorded in the period in which they become known. The Company bases its estimates on historical experience and various other assumptions that it believes to be reasonable under the circumstances.
The Consolidated Financial Statements include the accounts of the Company and its
wholly-ownedwholly owned subsidiaries,
SAVSU Technologies, Inc. (“SAVSU” acquired on August 8, 2019), Arctic Solutions, Inc. doing business as Custom Biogenic Systems (“CBS” acquired on November 12, 2019), SciSafe Holdings, Inc. (“SciSafe” acquired on October 1, 2020), Global Cooling, Inc. doing business as Stirling Ultracold (“Global Cooling” or “GCI” acquired on May 3, 2021), and Sexton Biotechnologies, Inc. (“Sexton” acquired on September 1, 2021). All intercompany accounts and transactions have been eliminated in consolidation.
All long-lived assets are maintained in the United States of America and the Netherlands.
Financial statement reclassification
Certain classifications on the Consolidated Balance Sheets related to accrued expenses and other current liabilities, debt, current portion, and debt, long-term as of December 31, 2020 were reclassified to conform to current period presentation. These reclassifications have no impact on previously reported total revenue, net (loss) income, net assets, or total operating cash flows.
Foreign currency translation
The Company translates balance sheet and income statement items into U.S. dollars. For the Company’s subsidiaries that operate in a local currency functional environment, all assets and liabilities are translated into U.S. dollars using current exchange rates at the balance sheet date; revenue and expenses are translated using quarterly exchange rates which
approximate to average exchange rates in effect during each period. Resulting translation adjustments are reported as a separate component of accumulated other comprehensive
(loss) incomeloss in shareholders' equity.
The Company views its operations and makes decisions regarding how to allocate resources and manages its business as
one reportable segment and
one reporting unit. The Company’s Chief Executive Officer, who is the chief operating decision maker, reviews financial information on an aggregate basis for purposes of allocating
resources and evaluating financial performance.
To determine revenue recognition for contractual arrangements that we determine are within the scope of Financial Accounting Standards Board (“FASB”) Topic 606,Revenue from Contracts with Customers, we perform the following five steps: (i) identify each contract with a customer; (ii) identify the performance obligations in the contract; (iii) determine the transaction price; (iv) allocate the transaction price to our performance obligations in the contract; and (v) recognize revenue when (or as) we satisfy the relevant performance obligation. We only apply the five-stepfive-step model to contracts when it is probable that we will collect the consideration we are entitled to in exchange for the goods or services we transfer to the customer. Contracts with customers may contain multiple performance obligations. For such arrangements, the transaction price is allocated to each performance obligation based on the observable and estimated relative standalone selling prices of the promised products or services underlying each performance obligation. The Company determines standalone selling prices based on the price at which the performance obligation is sold separately. If the standalone selling price is not observable through past transactions, the Company estimates the standalone selling price, taking into account available information such as market conditions and internally approved pricing guidelines related to the performance obligations. Payment terms and conditions vary, although terms generally include a requirement of payment within 30 to 90 days. During the year ended December 31, 2021, 2023, the Company recognized approximately $671,000$0.4 million of revenue that was included in the deferred revenue balance at the beginning of the year. The Company primarily recognizes product revenues, service revenues, and rental revenues. Product revenues are generated from the sale of biopreservation media, ThawSTAR, and freezer products. We recognize product revenue, including shipping and handling charges billed to customers, at a point in time when we transfer control of our products to our customers, which is upon shipment for substantially all transactions. Shipping and handling costs are classified as part of cost of product revenue in the Consolidated
StatementStatements of Operations. Service revenues are generated from the storage of biological and pharmaceutical materials. We recognize service revenues over time as services are performed or ratably over the contract term. To the extent the transaction price includes variable consideration, the Company estimates the amount of variable consideration that should be included in the transaction price utilizing the expected value method or the most likely amount method, depending on the facts and circumstances relative to the contract. When determining the transaction price of a contract, an adjustment is made if payment from a customer occurs either significantly before or significantly after performance, resulting in a significant financing component. Applying the practical expedient in paragraph
606-10-32-18,606-10-32-18, the Company does
not assess whether a significant financing component exists if the period between when the Company performs its obligations under the contract and when the customer pays is
one year or less.
None of the Company’s contracts contained a significant financing component as of and during the year ended
December 31, 2021.2023.
The Company also generates revenue from the leasing of our property plant, and equipment, operating right-of-use assets, and evo cold chain systems to customers pursuant to service contracts or rental arrangements entered into with the customer. Revenue from these arrangements is not within the scope of FASB ASC Topic 606 as it is within the scope of FASB ASC Topic 842, Leases.Leases. All customers leasing shippers currently do so under month-to-month rental arrangements. We account for these rental transactions as operating leases and record rental revenue on a straight-line basis over the rental term. The Company enters into various customer service agreements (collectively, “Service Contracts”) with customers to provide biological and pharmaceutical storage services. In certain of these Service Contracts, the property
plant, and equipment or operating right-of-use assets used to store
the customera customer’s product are used only for the benefit of
one customer. This is primarily driven by the customer’s desire to ensure that sufficient storage capacity is available in a specific geographic location for a set period of time. These agreements
may include extension and termination clauses. These Service Contracts do
not allow for customers to purchase the underlying assets.
The Company has assessed its Service Contracts and concluded that certain of the contracts for the storage of customer products met the criteria to be considered a leasing arrangement (“Embedded Leases”), with the Company as the lessor. The specific Service Contracts that met the criteria were those that provided a single customer with the ability to substantially direct the use of the Company’s property, plant, and equipment or operating right-of-use assets.
Under ASC 842, consistent with the previous guidance, the
The Company
will continue to recognizerecognizes operating right-of-use asset embedded lessor arrangements on its Consolidated Balance Sheets in
operatingOperating right-of-use assets.
None of the Embedded Leases identified by the Company qualify as a sales-type or direct finance lease. None of the operating leases for which the Company is the lessor include options for the lessee to purchase the underlying asset at the end of the lease term or residual value guarantees, nor are any such operating leases with related parties.
Embedded Leases
may contain both lease and non-lease components. We have elected to utilize the practical expedient to account for lease and non-lease components together as a single combined lease component as the timing and pattern of transfer are the same for the non-lease components and associated lease component and, the lease component, if accounted for separately, would be classified as an operating lease. Non-lease components of the Company’s rental arrangements include reimbursements of lessor costs.
Total bioproduction tools and services revenue for the years ended December 31, 2021, 2020,2023, 2022, and 20192021 were comprised of the following:
| | | Year Ended December 31, | |
(In thousands, except percentages) | | 2021⁽¹⁾ | | | 2020⁽²⁾ | | | 2019⁽³⁾ | |
Product revenue | | | | | | | | | | | | |
Freezer and thaw | | $ | 56,620 | | | $ | 13,548 | | | $ | 3,312 | |
Cell processing | | | 44,965 | | | | 30,946 | | | | 23,367 | |
Storage and cold chain services | | | 328 | | | | 46 | | | | 165 | |
Service revenue | | | | | | | | | | | | |
Storage and cold chain services | | | 9,817 | | | | 1,752 | | | | 0 | |
Rental revenue | | | | | | | | | | | | |
Storage and cold chain services | | | 7,426 | | | | 1,795 | | | | 527 | |
Total revenue | | $ | 119,156 | | | $ | 48,087 | | | $ | 27,371 | |
(1)
| 2021 revenue includes product revenue related to Global Cooling from May 3, 2021 through December 31, 2021 and product revenue related to Sexton from September 1, 2021 through December 31, 2021.
|
(2)
| 2020 revenue includes service revenue related to SciSafe from October 1, 2020 through December 31, 2020.
|
(3)
| 2019 revenue includes product revenue related to Astero Bio Corporation ("Astero") from April 1, 2019 through December 31, 2019; rental revenue related to SAVSU from August 8, 2019 through December 31, 2019; and product revenue related to CBS from November 12, 2019 through December 31, 2019.
|
| | | | | | | | | | | | | | | | | |
| Years Ended December 31, |
| (In thousands, except percentages) | 2023 | | 2022 | | 2021(1) |
| Product revenue | | | | | |
| Freezer and thaw | $ | 50,622 | | | $ | 66,682 | | | $ | 56,620 | |
| Cell processing | 65,772 | | | 68,509 | | | 44,965 | |
| Biostorage services | 1,301 | | | 809 | | | 328 | |
| Service revenue | | | | | |
| Freezer and thaw | 1,024 | | | 74 | | | - | |
| Biostorage services | 16,527 | | | 15,234 | | | 9,817 | |
| Rental revenue | | | | | |
| Biostorage services | 8,025 | | | 10,451 | | | 7,426 | |
| Total revenue | $ | 143,271 | | | $ | 161,759 | | | $ | 119,156 | |
(1)2021 revenue includes product revenue related to Global Cooling from May 3, 2021 through December 31, 2021 and product revenue related to Sexton from September 1, 2021 through December 31, 2021.
The following table includes estimated rental revenue expected to be recognized in the future related to embedded leases as well as estimated service revenue expected to be recognized in the future related to performance obligations that are unsatisfied or partially unsatisfied as of the end of the reporting periods. The Company is electing elected not to disclose the value of the remaining unsatisfied performance obligation with a duration of one year or less as permitted by the practical expedient in ASU 2014-09,2014-09, Revenue from Contracts with Customers. The estimated revenue in the following table does not include contracts with the original durations of one year or less, amounts of variable consideration attributable to royalties, or contract renewals that are unexercised as of December 31, 2021.2023.
The balances in the table below are partially based on judgments involved in estimating future orders from customers subject to the exercise of material rights pursuant to respective contracts:
| | | Year Ending December 31, | |
(In thousands) | | 2022 | | | 2023 | | | 2024 | | | Total | |
Rental revenue | | $ | 10,151 | | | $ | 3,748 | | | $ | 900 | | | $ | 14,799 | |
Service revenue | | $ | 67 | | | $ | 31 | | | $ | 10 | | | $ | 108 | |
| | | | | | | | | | | |
| (In thousands) | 2024 | | Total |
| Rental revenue | $ | 900 | | | $ | 900 | |
| Service revenue | $ | 50 | | | $ | 50 | |
Risks and uncertainties
COVID-19 pandemic
Supply chain considerations
Our domestic and international
supply chain operations
have beenwere affected during the years ended December 31, 2021 and
continue to be affected2022 by the
ongoing global pandemic of
a novel strain of coronavirus (“COVID-19”)COVID-19 and the resulting volatility and uncertainty it
has caused in the U.S. and international markets.
During the year ended December 31, 2021, many businesses and countries, including the U.S., continued applying preventative and precautionary measures to mitigate the spreadThe onset of the
virus including government ordersCOVID-19 pandemic caused supply chains globally to become constrained, and
other restrictionsthese constraints historically impacted our business through both increased difficulty in obtaining semiconductor chips and increased pricing on
the conduct of business operations.In the year ended December 31, 2021, we experienced supply chain disruptions due to the effects of COVID-19 on our suppliers of sheet metal and electronic components that incorporate semiconductor chips. These supply chain disruptions decreased our profitabilityavailable parts. However, as a result of increased supplier pricing and production stoppages. We cannot be assured that a continued or prolonged global pandemic will not have other negative impacts on our manufacturing and shipping processes or our product costs. The extent to which the COVID-19 pandemic affects our future financial results and operations will depend on future developments which are highly uncertain and cannot be predicted, including the recurrence, severity and/or duration of the ongoing pandemic, and current or future domestic and international actions to contain and treat COVID-19.
The Company reviews capital and amortizing intangible assets (long-lived assets) for impairment on an annual basis or whenever events or changes in circumstances indicate that the carrying amount may not be recoverable. The Company determined that the economic uncertainty caused by the COVID-19 pandemic was a trigger for an impairment review in the quarter ended June 30, 2020 of certain long-lived assets based on the expected near-term weakness in ThawSTAR and freezer revenue resulting from the impact of COVID-19.
As a result of the Company’s outlook for revenue from the ThawSTAR and freezer product lines, estimated undiscounted cash flow projections were developed to determine if any impairment of the related intangible assets was warranted. After conducting such review, the Company determined that there was no impairment of the remaining long-lived assets as of June 30, 2020. Given the inherent uncertainties of the COVID-19 pandemic and the estimates used in these cash flow projections, changes based on facts and circumstances in future quarters could give rise to impairment.
The Company revised the revenue projections for the ThawSTAR and freezer product lines in the second quarter ended June 30, 2020 to determine the impact on the fair value of the contingent consideration related to the existing earnout provisions. Based on results of the year ended December 31, 2020 related to these two product lines, we made further adjustments to2023, both availability and pricing of semiconductor chips have improved and no longer pose constraints on our revenue projections. After reviewing the impact of the updated revenue projections on estimated undiscounted cash flow projections, the Company determined that there was no impairment of the remaining long-lived assets as of December 31, 2020. The Company reduced the fair value of the combined contingent consideration liability from $388,000 at June 30, 2020, to $221,000 as of December 31, 2020 due to updated revenue projections, the time value of money, and actual resultssupply chain. We currently have sufficient supply for the year ended December 31, 2020.
The Company may also experience other negative impacts of the COVID-19 outbreak such as the lack of availability of the Company’s key personnel, additional temporary closures of the Company’s office or the facilities of the Company’s business partners, customers, third party service providers or other vendors, the inability to travel to market and sellelectrical component parts within our products, and the interruption of the Company’s supply chain, distribution channels, liquidity and capital or financial markets.
Any disruption and volatility in the global capital markets as a result of the pandemic may increase the Company’s cost of capital and adversely affect the Company’s ability to access financing when and on terms that the Company desires. In addition, a potential recession resulting from the spread of COVID-19 could materially affect the Company’s business, especially if a recession results in higher unemployment causing potential patients to not have access to health insurance.
The ultimate extent to which the COVID-19 pandemic and its repercussions impact the Company’s business will depend on future developments, which are highly uncertain. However, the foregoing and other continued disruptions to the Company’s business as a result of COVID-19 could result in a material adverse effect on the Company’s business, results of operations, financial condition and cash flows.
On March 27, 2020, the President of the United States signed into law the “Coronavirus Aid, Relief, and Economic Security (CARES) Act.” The CARES Act, among other things, includes provisions relating to refundable payroll tax credits, deferment of employer side social security tax payments, net operating loss carryback periods, alternative minimum tax credit refunds, modifications to the net interest deduction limitations, increased limitations on qualified charitable contributions, and technical corrections to tax depreciation methods for qualified improvement property.
On March 11, 2021, the President of the United States signed into law the “American Rescue Plan Act of 2021” (the American Rescue Plan), which included additional economic stimulus and tax credits, including the expansion of the Employee Retention Credit. BioLife continues to examine the impact that the American Rescue Plan will have on its financial condition, results of operations and liquidity.
We determined that we met the original eligibility requirements per the guidelines original established by the U.S. federal government as part of the CARES Act for the Pursuantdo not foresee constraints to the Paycheck Protection Program (the “PPP”). As such, on April 20, 2020, the Company received $2,175,320 in support from the PPP. Because the U.S. government subsequently changed its position and guidelines related to the PPP and publicly traded companies, the Company repaid the loan on April 29, 2020. As of March 30, 2020, the company started deferring the employer side of social security tax payments. As of December 31, 2021, the amount of deferred social security tax payments was $297,000. In the year ended December 31, 2021, we paid $135,000 of the deferred payments. The remainder of the outstanding balance is anticipated to be paid by December 31, 2022.
In the SciSafe acquisition, the Company acquired a $295,300 loan from the PPP. The loan incurred interest at 1% and was unsecured. Of the principal borrowed, $284,000 was forgiven in December 2021. The remaining principal that was not forgiven was repaid in December 2021.
return over our supply chain.
The Company considers its unexercised warrants and unvested restricted shares, which contain non-forfeitable rights to dividends, participating securities, and includes such participating securities in its computation of earnings per share pursuant to the
two-classtwo-class method. Basic earnings per share for the
two classes of stock (common stock and warrants) is calculated by dividing net income by the weighted average number of shares of common stock and warrants outstanding during the reporting period. Diluted earnings per share is calculated using the weighted average number of shares of common stock plus the potentially dilutive effect of common equivalent shares outstanding determined under both the
two-classtwo-class method and the treasury stock method, whichever is more dilutive. In periods when we have a net loss, common stock equivalents are excluded from our calculation of earnings per share as their inclusion would have an antidilutive effect.
The following table presents computations of basic and diluted earnings per share under the two-class method:
| | | Year Ended December 31, | |
(In thousands, except share and earnings per share data) | | 2021 | | | 2020 | | | 2019 | |
Basic earnings (loss) per common share Numerator: | | | | | | | | | | | | |
Net (loss) income | | $ | (7,635 | ) | | $ | 2,667 | | | $ | (1,657 | ) |
Amount attributable to unvested restricted shares | | | 0 | | | | (135 | ) | | | 0 | |
Amount attributable to warrants outstanding | | | 0 | | | | (82 | ) | | | 0 | |
Net (loss) income allocated to common shareholders | | | (7,635 | ) | | | 2,450 | | | | (1,657 | ) |
| | | | | | | | | | | | | |
Denominator: | | | | | | | | | | | | |
Weighted-average common shares issued and outstanding | | | 38,503,944 | | | | 27,306,258 | | | | 19,460,299 | |
Basic (loss) earnings per common share | | $ | (0.20 | ) | | $ | 0.09 | | | $ | (0.09 | ) |
| | | | | | | | | | | | | |
Diluted earnings (loss) per common share Numerator: | | | | | | | | | | | | |
Net (loss) income | | $ | (7,635 | ) | | $ | 2,667 | | | $ | (1,657 | ) |
Amount attributable to warrants | | | 0 | | | | (20 | ) | | | 0 | |
Less: gain related to change in fair value of warrants | | | 0 | | | | (3,601 | ) | | | 0 | |
Diluted (loss) earnings per common share | | | (7,635 | ) | | | (954 | ) | | | (1,657 | ) |
| | | | | | | | | | | | | |
Denominator: | | | | | | | | | | | | |
Weighted-average common shares issued and outstanding | | | 38,503,944 | | | | 27,306,258 | | | | 19,460,299 | |
Diluted (loss) earnings per common share | | $ | (0.20 | ) | | $ | (0.03 | ) | | $ | (0.09 | ) |
share:
| | | | | | | | | | | | | | | | | |
| Year Ended December 31, |
| (In thousands, except share and earnings per share data) | 2023 | | 2022 | | 2021 |
| Basic and diluted loss per common share | | | | | |
| Numerator: | | | | | |
| Net loss | $ | (66,427) | | | $ | (139,805) | | | $ | (8,908) | |
| Net loss attributable to common shareholders | (66,427) | | | (139,805) | | | (8,908) | |
| | | | | |
| Denominator: | | | | | |
| Weighted-average common shares issued and outstanding | 43,719,185 | | 42,481,027 | | 38,503,944 |
| Basic and diluted loss per common share | $ | (1.52) | | | $ | (3.29) | | | $ | (0.23) | |
The following table sets forth the number of shares excluded from the computation of diluted loss per share, as their inclusion would have been anti-dilutive:
| | | Year Ended December 31, | |
| | | 2021 | | | 2020 | | | 2019 | |
Stock options and restricted stock awards | | | 1,637,745 | | | | 2,131,794 | | | | 2,564,456 | |
Warrants | | | 18,204 | | | | 1,499,953 | | | | 2,956,039 | |
Total | | | 1,655,949 | | | | 3,631,747 | | | | 5,520,495 | |
| | | | | | | | | | | | | | | | | |
| Year Ended December 31, |
| 2023 | | 2022 | | 2021 |
| Stock options and restricted stock awards | 647,348 | | 592,446 | | 1,637,745 |
| Warrants | — | | — | | 18,204 |
| Total | 647,348 | | 592,446 | | 1,655,949 |
Cash, cash equivalents, and restricted cash
Cash equivalents consist primarily of interest-bearing money market accounts. We consider all highly liquid debt instruments purchased with an initial maturity of
three months or less to be cash equivalents. We maintain cash balances that
may exceed federally insured limits. We do
not believe that this results in any significant credit risk.
Restricted cash consists entirely of amounts that will be recovered from escrow in relation to the acquisition of SciSafe. The restricted cash is short term in nature, as the Company anticipates to receive the funds within
one year of the balance sheet date.
The following is a summary of the Company’s cash, cash equivalents, and restricted cash total as presented in the Company’s
consolidated statementsConsolidated Statements of
cash flowsCash Flows for the years ended
December 31, 2021, 2020,2023 and
2019.| | | Year Ended December 31, | |
(In thousands) | | 2021 | | | 2020 | | | 2019 | |
Cash and cash equivalents | | $ | 69,860 | | | $ | 90,403 | | | $ | 6,448 | |
Restricted cash | | | 10 | | | | 53 | | | | 0 | |
Total cash, cash equivalents, and restricted cash | | $ | 69,870 | | | $ | 90,456 | | | $ | 6,448 | |
2022.
| | | | | | | | | | | |
| (In thousands) | 2023 | | 2022 |
| Cash and cash equivalents | $ | 35,407 | | | $ | 19,442 | |
| Restricted cash | 31 | | | 31 | |
| Total cash, cash equivalents, and restricted cash | $ | 35,438 | | | $ | 19,473 | |
Available-for-sale securities
Available-for-sale securities consist of U.S. government securities, corporate debt securities, and other debt securities. Management classifies investments at the time of purchase and reevaluates such classification at each balance sheet date. Investments with maturities beyond one year may be classified as short-term based on their liquid nature and because such marketable securities represent the investment of cash that is available for current operations. Available-for-sale securities are reported at fair value based on quoted market prices and other observable market data. Unrealized gains and losses are reported as a component of other comprehensive (loss) income, net of any related tax effect. Realized gains and losses and other-than-temporary impairments on investments are included in other income.
Inventories relate to the Company’s cell and gene therapy products. The Company values biopreservation media inventory at cost or, if lower, net realizable value, using the specific identification method. All other inventory is valued at cost or, if lower, net realizable value, using the first-in, first-outfirst-in, first-out method. The Company reviews its inventories at least quarterly and records a provision for inventory that has become obsolete, inventory that has a cost basis in excess of its expected net realizable value, and inventory in excess of expected revenue volume to cost of product revenue. The Company bases its estimates on expected product revenue volume, production capacity and expiration dates of raw materials, work in process, and finished products. A change in the estimated timing or amount of demand for the Company’s products could result in additional provisions for excess inventory quantities on hand. Any significant unanticipated changes in demand or unexpected quality failures could have a significant impact on the value of inventory and reported operating results. During all periods presented in the accompanying consolidated financial statements, there have been no material adjustments related to a revised estimate of inventory valuations. However, during the year ended December 31, 2023, we assessed nonrecurring write-downs of approximately $5.7 million. For additional information, see Note 5: Inventories. Work-in-process and finished products inventories consist of material, labor, outside testing costs and manufacturing overhead.
Accounts receivable
Accounts receivable consist of short-term amounts due from our customers (generally
30 to
90 days) and are stated at the amount we expect to collect. We establish an allowance for
doubtful accountscredit losses based on our assessment of the collectability of specific customer accounts.
Accounts receivable are stated at principal amount, do
not bear interest, and are generally unsecured. We provide an allowance for
doubtful accountscredit losses based on an evaluation of the collectability of customer account balances. Accounts considered uncollectible are charged against the established allowance.
Investments
Equity investments
We periodically invest in securities of private companies to promote business and strategic objectives. These investments are measured and recorded as follows:
Non-marketable equity securities are equity securities without a readily determinable fair value. As of December 31, 2021, 2023 and December 31, 2022, these investments are comprised of $3.4$4.1 million in Series A-1A-1 and A-2A-2 Preferred Stock in iVexSol, Inc. (“iVexSol”) and $995,000 in Series E Preferred Stock in PanTHERA CryoSolutions, Inc. (“PanTHERA”). As
In November of
December 31, 2020,these investments were comprised of $1.5 million in Series A Preferred Stock in Sexton, $3.4 million in Series A-1 and A-2 Preferred Stock in iVexSol, Inc. (“iVexSol”), and $995,000 in Series E Preferred Stock in PanTHERA CryoSolutions, Inc. (“PanTHERA”).As of December 31, 2021, Sexton is consolidated in the Consolidated Financial Statements as a result of the step-acquisition completed September 1, 2021. As of December 31, 2020, the Sexton investment was measured and recorded using a measurement alternative for equity investments that do not have a readily determinable fair value that measures the securities at cost minus impairment, if any, plus or minus changes resulting from observable process changes in orderly transactions for identical or similar investments of the same issuer. In September of 2019, the Company invested $1.0 million in a convertible note receivable of iVexSol, Inc. The Company made an irrevocable election to record this convertible note in its entirety at fair value utilizing the fair value option available under U.S. GAAP. The Company believed that carrying this investment at fair value better portrayed the economic substance of the investment. Under the fair value option, gains and losses on the convertible note were included in unrealized gains/(losses) on investments within net earnings each applicable reporting period. Gains related to the increase in fair value of this convertible note were zero, $1.3 million and 0 for the years ended December 31, 2021, 2020, and 2019, respectively. The fair value of the note on the date of investment was determined to be equal to its principal amount. Interest income related to this note was recorded separately from other changes in its fair value within interest income each period. In November of 2020, the Company elected to convert thea convertible note from its investment in Sexton, which was fully acquired as of September 1, 2021, into Series A-1A-1 Preferred Stock and invest an additional $1.0 million in Series A-2A-2 Preferred Stock in iVexSol. The Preferred Stock investments in iVexSol are carried at cost minus impairment, if any, plus or minus changes resulting from observable process changes in orderly transactions for identical or similar investments of
the same issuer.
Gains related to the increase in fair value of this convertible note were zero, $0.7 million, and zero for the years ended December 31, 2023, 2022, and 2021, respectively.
In
November of
2020, the Company invested $995,000 in Class E Preferred Shares in PanTHERA CryoSolutions, Inc. In conjunction with this investment, the Company executed a development and license agreement with PanTHERA under which the Company will make milestone development payments up to
$2$2.0 million in the event that certain milestones are met in exchange for exclusive, perpetual, worldwide marketing and distribution rights to the technology for use in cell and gene therapy applications. In
June of
2021, PanTHERA satisfied the
first milestone and the Company paid $200,000 in accordance with the agreement. The Preferred Stock investments in PanTHERA are carried at cost minus impairment, if any, plus or minus changes resulting from observable process changes in orderly transactions for identical or similar investments of the same issuer.
As of
December 31, 2021, 2023, management believes there are
no indications of impairment or changes in fair value for the investments in iVexSol or PanTHERA.
Property and equipment are stated at cost and are depreciated using the straight-line method over estimated useful lives of three to ten years. Leasehold improvements are amortized using the straight-line method over the shorter of the estimated useful lives of the assets or the remaining lease term of the respective assets. Gains or losses on disposals of property and equipment are recorded within income from operations. Costs of repairs and maintenance are included as part of operating expenses unless they are incurred in relation to major improvements to existing property and equipment, at which time they are capitalized.Property and equipment are reviewed for impairment whenever events or changes in circumstances indicate that their net book value may not be recoverable. Carrying values are reviewed for recoverability at the asset grouping level to determine if the facts and circumstances suggest that a potential impairment may have occurred. If the sum of the expected future cash flows (undiscounted and before interest) from the use of the assets is less than the net book value of the asset an impairment could exist and the amount of the impairment loss, if any, will generally be measured as the difference between the net book value of the assets and their estimated fair values. There were 0 impairment losses recognized during the years ended December 31, 2021, 2020, and 2019.
Assets held for rent
Assets held for rent are carried at cost less accumulated depreciation. These assets consist of dedicated storage space, evo shippers and related components in production shippers complete and ready to be deployed and placed in service upon a customer order, shippers in the process of being assembled, and components available to build shippers. Assets utilized to provide dedicated storage space are depreciated over their applicable useful lives once placed in service. Shippers are depreciated over a useful life of
three years when in use by customers.
Our customers rent assets per a rental agreement. Each agreement provides for fixed monthly rent. Rental revenue and fees are recognized over the rental term on a straight-line basis. We retain the ownership of the assets rented. At the end of the rental agreement, the customer returns the asset to the Company.
Assets held for rent are reviewed for impairment whenever events or changes in circumstances indicate that their net book value
may not be recoverable. Carrying values are reviewed for recoverability at the asset grouping level to determine if the facts and circumstances suggest that a potential impairment
may have occurred. If the sum of the expected future cash flows (undiscounted and before interest) from the use of the assets is less than the net book value of the asset, an impairment could exist and the amount of the impairment loss, if any, will generally be measured as the difference between the net book value of the assets and their estimated fair values. There were
no impairment losses recognized during the years ended
December 31, 2021, 2020,2023, 2022, and
2019.2021.
Long-Lived Assets
The Company reviews long-lived assets, including property and equipment, leased assets, and definite life intangible assets for impairment whenever events and changes in circumstances indicate that the carrying value of an asset may not be recoverable. In order to determine if assets have been impaired, assets are grouped and tested at the lowest level for which identifiable independent cash flows are available ("asset group"). An impairment loss is recognized when the sum of the projected undiscounted cash flows is less than the carrying value of the asset group. The measurement of the impairment loss to be recognized is based on the difference between the fair value and the carrying value of the asset group. Fair value can be determined using a market approach, income approach or cost approach.
We determine if an arrangement is a lease at inception. Where an arrangement is a lease, we determine if it is an operating lease or a financefinancing lease. At lease commencement, we record a lease liability and corresponding right-of-use (“ROU”)
asset. Lease liabilities represent the present value of our future lease payments over the expected lease term which includes options to extend or terminate the lease when it is reasonably certain those options will be exercised. The present value of our lease liability is determined using our incremental collateralized borrowing rate at lease inception. ROU assets represent our right to control the use of the leased asset during the lease and are recognized in an amount equal to the lease liability for leases with an initial term greater than
12 months. Over the lease term we use the effective interest rate method to account for the lease liability as lease payments are made and the ROU asset is amortized in a manner that results in straight-line expense recognition.
We elected to apply the practical expedient for short-term leases and accordingly do
not apply lease recognition requirements for short-term leases with a duration less than
twelve months. Instead, we recognize payments related to these arrangements in the
consolidated statementConsolidated Statement of
operationsOperations as lease costs on a straight-line basis over the lease term.
Our standard warranty terms typically extend between
one year and
seven years from the date of delivery. We accrue for standard warranty costs based on historical trends in warranty charges. The accrual is reviewed regularly and periodically adjusted to reflect changes in warranty cost over the period.
We account for income taxes using an asset and liability method which generally requires recognition of deferred tax assets and liabilities for the expected future tax effects of events that have been included in the financial statements or tax returns. Under this method, deferred tax assets and liabilities are recognized for the future tax effects of differences between tax bases of assets and liabilities, and financial reporting amounts, based upon enacted tax laws and statutory rates applicable to the periods in which the differences are expected to affect taxable income. We evaluate the likelihood of realization of deferred tax assets and provide an allowance where, in management’s opinion, it is more likely than
not that the asset will
not be realized. Our policy for interest and penalties is to recognize interest and penalties as a component of the provision for income taxes in the Consolidated Statement of Operations.
We determine any uncertain tax positions based on a determination of whether and how much of a tax benefit taken in the Company’s tax filings or positions is more likely than
not to be sustained upon examination by the relevant income tax authorities.
Judgment is applied in the determination of the financial statement recognition and measurement of tax positions taken or expected to be taken in a tax return. As of
December 31, 2021, 2023, the Company has an
unrecordedunrecognized tax benefit of
$255,000$2.2 million related to tax attributes being carried forward. The Company is generally subject to examination by U.S. federal and local income tax authorities for all tax years in which loss carryforward is available.
Sales Taxes Payable
The Company records sales tax collected from customers on a net basis, and therefore excludes it from total product, service and rental revenue as defined in ASC 606. Cash collected from customers is recorded in accrued expenses on the Company's Consolidated Balance Sheet and then remitted to the proper taxing authority. In addition, refer to Note 12: Commitments and contingencies for discussion regarding an estimated sales tax liability the Company recorded in relation to historical activity in certain states. As of December 31, 2023, total interest expenses assessed on sales tax liabilities was $0.4 million.
Advertising costs are expensed as incurred and totaled $552,000, $167,000,$1.5 million, $0.8 million, and $43,000$0.6 million for the years endedDecember 31, 2023, 2022, and 2021, 2020, and 2019,respectively.
Concentrations of risk
In
During the years ended
December 31, 2021, 2020,2023, 2022, and
2019,2021, we derived approximately
17%16%,
13%18%, and
15%17% of our revenue from
one customer, 1 customer, and 1the same customer, respectively.
No other customers accounted for more than
10% of revenues. Revenue from foreign customers is denominated in United States dollars or euros.
| | | | | | | | | | | | | | | | | |
| Years Ended December 31, |
| Revenue by major product | 2023 | | 2022 | | 2021 |
| CryoStor | 39 | % | | 36 | % | | 33 | % |
| 780XLE Freezer | 19 | % | | 22 | % | | 22 | % |
In the
yearyears ended
December 31, 2019, we made approximately 12% of purchases from 1 supplier. No other2023, 2022, and 2021, no suppliers accounted for more than
10% of
purchases in the years ended December 31, 2021, 2020, and 2019.purchases.
The following table represents the Company’s total revenue by geographic area (based on the location of the customer):
| | | Year Ended December 31, | |
Revenue by customers’ geographic locations | | 2021 | | | 2020 | | | 2019 | |
United States | | | 78 | % | | | 73 | % | | | 69 | % |
| Canada | | | 7 | % | | | 13 | % | | | 16 | % |
Germany | | | 4 | % | | | 4 | % | | | 3 | % |
Europe, Middle East, Africa (excluding Germany) | | | 10 | % | | | 8 | % | | | 11 | % |
Other | | | 1 | % | | | 2 | % | | | 1 | % |
Total revenue | | | 100 | % | | | 100 | % | | | 100 | % |
| | | | | | | | | | | | | | | | | |
| Years Ended December 31, |
Revenue by customers’ geographic locations(1) | 2023 | | 2022 | | 2021 |
United States(2) | 80 | % | | 79 | % | | 85 | % |
| Europe, Middle East, Africa (EMEA) | 16 | % | | 16 | % | | 11 | % |
| Other | 4 | % | | 5 | % | | 4 | % |
| Total revenue | 100 | % | | 100 | % | | 100 | % |
(1) During the year ended December 31, 2023, the Company updated its methodology for determining the country of origin for its sales. Sales are now recorded by shipping country rather than billing country. The Company updated the methodology retrospectively, adjusting the prior year presentation for all regions presented.
(2) The line item presented above previously bifurcated sales between the United States and Canada. Due to the updated methodology for determining the country of origin for sales, it was noted that Canada no longer was a material location to separately disclose. Canada sales have been included within the "Other" line item in the table above and United States sales has been retained as its own line item to more accurately reflect origin of sales for material regions.
The following table represents the Company’s long-lived assets by geographic area as of
December 31:(In thousands) | | 2021 | | | 2020 | |
| United States | | $ | 40,708 | | | $ | 30,389 | |
| Netherlands | | | 5,903 | | | | 0 | |
Total | | $ | 46,611 | | | $ | 30,389 | |
| | | | | | | | | | | |
| (In thousands) | 2023 | | 2022 |
| United States | $ | 33,378 | | | $ | 42,829 | |
| Netherlands | 6,952 | | | 5,437 | |
| Total | $ | 40,330 | | | $ | 48,266 | |
As of
December 31, 2021 and 2020,two customers and 2023, one customer accounted for
32% and 17%14% of gross accounts
receivable, respectively. receivable. As of December 31, 2022, two customers accounted for 26% of gross accounts receivable. No other customers accounted for more than
10% of our gross accounts receivable.
As of
December 31, 2021 and 2020,2023, one supplier and one supplier accounted for
10% and 21%12% of accounts
payable, respectively. payable. As of December 31, 2022, a different supplier accounted for 23% of accounts payable. No other suppliers accounted for more than
10% of our accounts payable.
Research and development costs are expensed as incurred.
We measure and record compensation expense using the applicable accounting guidance for share-based payments related to stock options, time-based restricted stock, market-based restricted stock awards and performance-based restricted stock awards granted to our directors and employees. The fair value of stock options, including performance awards, without a market-based condition is determined by using the Black-Scholes option-pricing model. The fair value of restricted stock
awards with a market condition is estimated at the date of grant using the Monte Carlo Simulation model. The Black-Scholes and Monte Carlo Simulation valuation models incorporate assumptions as to stock price volatility, the expected life of options or awards, a risk-free interest rate and dividend yield. The fair value of restricted stock, including performance awards, without a market condition is estimated using the current market price of our common stock on the date of grant.
We expense stock-based compensation for stock options, restricted stock awards, and performance awards over the requisite service period. For awards with only a service condition, we expense stock-based compensation using the straight-line method over the requisite service period for the entire award. For awards with a market condition, we expense the grant date fair value over the vesting period regardless of the value that the award recipients ultimately receive.
We have, from time to time, modified the terms of restricted stock awards awarded to employees. We account for the incremental increase in the fair value over the original award on the date of the modification as an expense for vested awards or over the remaining service (vesting) period for unvested awards. The incremental compensation cost is the excess of the fair value of the modified award on the date of modification over the fair value of the original award immediately before the modification.
Business combinations goodwill and intangible assets
Business combinations
The Company accounts for business acquisitions using the acquisition method as required by FASB ASC Topic 805,Business Combinations.The Company’s identifiable assets acquired and liabilities, including identified intangible assets, assumed in a business combination are recorded at their acquisition date fair values. The valuation requires management to make significant estimates and assumptions, especially with respect to long-lived and intangible assets. Critical estimates in valuing intangible assets include, but are not limited to:
| ●
| future expected cash flows, including revenue and expense projections;
|
| ●
| to i) future expected cash flows, including revenue and expense projections; ii) discount rates to determine the present value of recognized assets and liabilities and; |
| ●
| revenue volatility to determine contingent consideration using option pricing models
|
Goodwill is calculated as the present value of recognized assets and liabilities and; iii) revenue volatility to determine contingent consideration using option pricing models. The excess of the acquisition price over the fair value of net assets acquired, including the amount assigned to identifiable intangible assets.assets is the resulting goodwill. Acquisition-related costs, including advisory, legal, accounting, valuation, and other costs, are expensed in the periods in which these costs are incurred. The results of operations of an acquired business are included in the consolidated financial statements beginning at the acquisition date.
The Company estimates the acquisition date fair value of the acquisition-related contingent consideration using various valuation approaches, including option pricing models, as well as significant unobservable inputs, reflecting the Company’s assessment of the assumptions market participants would use to value these liabilities. The fair value of the contingent consideration is remeasured each reporting period.
During the measurement period, which
may be up to
one year from the acquisition date, any refinements made to the fair value of the assets acquired, liabilities assumed, or contingent consideration are recorded in the period in which the adjustments are recognized. Upon the conclusion of the measurement period or final determination of the fair value of the assets acquired, liabilities assumed, or contingent consideration, whichever comes first, any subsequent adjustments are recognized in the
consolidated statementsConsolidated Statements of
operations.Operations.
Goodwill represents the excess of the purchase price over the net amount of identifiable assets acquired and liabilities assumed in a business combination measured at fair value. Goodwill is not amortized but is tested for impairment at least annually. The Company reviews goodwill for impairment annually in the fourth quarter and whenever events or changes in circumstances indicate that the fair value of a reporting unit may be less than its carrying amount (a triggering event). The Company first assesses qualitative factors to determine whether it is more likely than not that the fair value of its reporting unit is less than its carrying amount as a basis for determining whether it is necessary to perform the quantitative goodwill impairment test described in FASB ASC Topic 350,Intangibles – Goodwill and Other. The more likely than not threshold is defined as having a likelihood of more than 50 percent. If, after assessing the totality of events or circumstances, the Company determines that it is not more likely than not that the fair value of a reporting unit is less than its carrying amount, then performing the quantitative goodwill impairment test is unnecessary and goodwill is considered to be unimpaired. However, if based on the qualitative assessment the Company concludes that it is more likely than not that the fair value of a reporting unit is less than its carrying amount, the Company will proceed with performing the quantitative goodwill impairment test. In performing the quantitative goodwill impairment test, the Company determines the fair value of its reporting unit and compares it to its carrying value. If the fair value of the reporting unit exceeds the carrying value of the
net assets assigned to that unit, goodwill is
not impaired. If the carrying value of the reporting unit exceeds its fair value, the Company records an impairment loss equal to the difference. The Company operates as
one reporting unit as of the goodwill impairment measurement date in the
fourth quarter of
2021.2023. As of the testing date and the period after that date through the issuance date of our financial statements, the Company has observed
no indicators of potential goodwill impairment at any point during the period based on its
qualitativerequired assessment.
Intangible assets with a definite life are amortized over their estimated useful lives using the straight-line method and the amortization expense is recorded within intangible asset amortization in the Consolidated Statements of Operations. If the estimate of a definite-lived intangible asset’s remaining useful life is changed, the remaining carrying amount of the intangible asset is amortized prospectively over the revised remaining useful life. Definite-lived intangible assets and their related estimated useful lives are reviewed at least annually to determine if any adverse conditions exist that would indicate the carrying value of these assets may not be recoverable. The Company determined that Refer to Note 2: noImpairment of property and equipment and definite-lived intangible assets adverse conditions existed that would indicate that for further details of impairment charges assessed during the carrying value of these assets may not be recoverable.years ended December 31, 2023 and 2022.
Indefinite-lived intangibles are carried at the initially recorded fair value less any recognized impairment. In-process research and development (“IPR&D”) is initially capitalized at fair value as an intangible asset with an indefinite life. When the IPR&D project is complete, it is reclassified as a definite-lived intangible asset and is amortized over its estimated useful life. If an IPR&D project is abandoned, a charge would be recorded for the value of the related intangible asset to our Consolidated Statement of Operations in the period it is abandoned. Indefinite-lived intangibles are tested annually for impairment. Impairment assessments are conducted more frequently if certain conditions exist, including a change in the competitive landscape, any internal decisions to pursue new or different technology strategies, a loss of a significant customer, or a significant change in the marketplace, including changes in the prices paid for the Company’s products or changes in the size of the market for the Company’s products. If impairment indicators are present, the Company determines whether the underlying intangible asset is recoverable through estimated future undiscounted cash flows. If the asset is not found to be recoverable, it is written down to the estimated fair value of the asset based on the sum of the future discounted cash flows expected to result from the use and disposition of the asset. TheRefer to Note 2: Impairment of property and equipment and definite-lived intangible assets for further details.
Recent accounting pronouncements
As of January 1, 2023, we adopted ASU 2016-13, Measurement of Credit Losses on Financial Instruments, which later was codified as ASC 326 (CECL). In addition to the adoption of ASC 326, the Company performedadopted the accompanying Accounting Standard Update ("ASU") No. 2022-02, Financial Instruments-Credit Losses(Topic 326): Troubled Debt Restructurings and Vintage Disclosures. Both standards mark a quantitative impairment test of one of the IPR&D assets acquired during 2021 during the fourth quarter of 2021 and determined that no impairment existed. The Company performed a qualitative test for the other IPR&D assets acquired during 2021 and determined that no impairment existed.
Certain warrants which have features that may result in cash settlement
Warrants that include cash settlement features are recorded as liabilities at their estimated fair value at the date of issuance and are remeasured at fair value each reporting period with the increase or decrease in fair value recorded in the Consolidated Statements of Operations. The warrants are measured at estimated fair value using the Black Scholes valuation model, which is based, in part, upon inputs for which there is little or no observable market data,significant change requiring the Companyimmediate recognition of estimated credit losses expected to develop its own assumptions. Inherent in this model are assumptions related to expected stock-price volatility, expected life, risk-free interest rate and dividend yield. We estimateoccur over the volatility of our common stock at the date of issuance, and at each subsequent reporting period, based on historical volatility that matches the contractual remaining life of many financial assets. ASU 2022-02 specifically eliminates the warrants. The risk-freeaccounting guidance for troubled debt restructurings and requires disclosure of current-period gross write-offs by year of loan origination. Additionally, ASU 2022-02 updates the accounting for credit losses under ASC 326 and adds enhanced disclosures with respect to loan refinancings and restructurings in the form of principal forgiveness, interest rate concessions, other-than-insignificant payment delays, or term extensions when the borrower is basedexperiencing financial difficulties. ASC 326 is intended to improve financial reporting by corporations by requiring earlier recognition of credit losses on loans from corporations, held-to-maturity (HTM) securities, and certain other financial assets. ASC 326 also amended the impairment guidance for available-for-sale (AFS) debt securities in that it eliminated the Other Than Temporary Impairment (OTTI) impairment model. Under Subtopic ASC 326-30,
Financial Instruments—Credit Losses—Available-for-Sale Debt Securities, changes in expected cash flows due to credit on AFS debt securities will be recorded through an allowance, rather than permanent write-downs for negative changes and prospective yield adjustments for positive changes, as required by the current OTTI model. ASC 326 replaces the current incurred loss impairment model that recognizes losses when a probable threshold is met with a requirement to recognize lifetime expected credit losses immediately when a financial asset is originated or purchased. For the year ended December 31, 2023, the adoption of ASC 326 did not result in a material effect on the U.S. Treasury zero-coupon yield curve on the grant date for a maturity similar to the expected remaining life of the warrants. The expected life of the warrants is assumed to be equivalent to their remaining contractual term. The dividend rate is based on our historical rate, which we anticipate to remain at zero. The assumptions used in calculating the estimated fair value of the warrants represent our best estimates. However, these estimates involve inherent uncertainties and the application of management judgment. As a result, if factors change and different assumptions are used, the warrant liability and the change in estimated fair value could be materially different. As of Company’s Consolidated financial statements. In December 31, 2021, no warrants were outstanding. The following is our weighted average assumptions used in the Black Scholes calculations of the warrants as of December 31:| | | 2020 | | | 2019 | |
Risk free interest rate | | | 0.1 | % | | | 1.9 | % |
Expected dividend yield | | | 0.0 | % | | | 0.0 | % |
Contractual remaining lives | | | 0.2 | | | | 1.7 | |
Expected volatility | | | 56.8 | % | | | 70.3 | % |
Recent accounting pronouncements
In November 2021, 2023, the Financial Accounting Standards Board (“FASB”) issued Accounting StandardsASU No. 2023-09,
Improvements to Income Tax Disclosures (“ASU 2023-09”), which requires additional disaggregated information about a reporting entity’s effective tax rate reconciliation as well as information increasing transparency of income taxes paid. The standard is intended to benefit investors by providing more detailed income tax disclosures that would be useful in making capital allocation decisions. This ASU is effective for public companies with annual periods beginning after December 15, 2024, with early adoption permitted. The Company is currently evaluating the effects adoption of this guidance will have on the consolidated financial statements.
In November 2023, the FASB issued ASU No. 2023-07, Improvements to Reportable Segments Disclosures. While ASU 2023-07 requires incremental disclosures, it does not change how an entity identifies its operating segments, aggregates those operating segments, or applies the quantitative thresholds to determine reportable segments. This ASU is effective for all public business entities for fiscal years beginning after December 15, 2023, and interim periods within fiscal years beginning after December 15, 2024. Entities must adopt the changes to the segment reporting guidance on a retrospective basis. We do not expect a material impact as a result of adopting this amendment.
In October 2023, the FASB issued ASU No. 2023-06, Disclosure Improvements: Codification Amendments in Response to the SEC’s Disclosure Update and Simplification Initiative, which amends U.S. GAAP to reflect updates and simplifications to certain disclosure requirements referred to FASB by the SEC. The targeted amendments incorporate 14 of the 27 disclosures referred by the SEC into Codification. Some of the amendments represent clarifications to, or technical corrections of, the current requirements. Each amendment in ASU 2023-06 will only become effective if the SEC removes the related disclosure or presentation requirement from its existing regulation by June 30, 2027. No amendments were effective at December 31, 2023. The Company is still currently evaluating the impact of the adoption of the new standard but does not expect a significant impact on the consolidated financial statements.
In June 2022, the FASB issued ASU No. 2022-03,Fair Value Measurements (Topic 820): Fair Value Measurement of Equity Securities Subject to Contractual Sales Restrictions(“ASU”ASC Topic 820”). The FASB issued ASU 2022-03 to (1) clarify the guidance in Topic 820, Fair Value Measurement, when measuring the fair value of an equity security subject to contractual restrictions that prohibit the sale of an equity security, (2) to amend a related illustrative example, and (3) to introduce new disclosure requirements for equity related securities subject to contractual sale restrictions that are measured at fair value in accordance with Topic 820. ASU 2022-03 clarifies that a contractual restriction on the sale of an equity security is not considered part of the unit of account of the equity security and, therefore, is not considered in measuring fair value. The guidance is effective for fiscal years beginning after December 15, 2023, and interim periods within those fiscal years with early adoption permitted. We are evaluating when to adopt the amendments in ASU 2022-03. We do not expect a material impact as a result of adopting this amendment.
In March 2022, the FASB issued ASU No. 2022-02 Financial Instruments-Credit Losses (Topic 326): Troubled Debt Restructurings and Vintage Disclosures. ASU 2022-02 eliminates the accounting guidance for troubled debt restructurings and requires disclosure of current-period gross write-offs by year of loan origination. Additionally, ASU 2022-02 updates the accounting for credit losses under ASC 326 and adds enhanced disclosures with respect to loan refinancings and restructurings in the form of principal forgiveness, interest rate concessions, other-than-insignificant payment delays, or term extensions when the borrower is experiencing financial difficulties. ASU 2022-02 is effective for fiscal years beginning after December 15, 2022 and early adoption is permitted. The Company adopted this guidance and it did not have a material impact on the Company’s Consolidated Financial Statements.
In November 2021,-10, the FASB issued ASU No. 2021-10, Government Assistance (Topic 832)832): Disclosures by Business Entities about Government Assistance,, to increase the transparency of government assistance including the disclosure of the types of assistance an entity receives, an entity’s method of accounting for government assistance, and the effect of the assistance on an entity’s financial statements. The guidance in this update will be effective for fiscal years beginning after December 15, 2023, with early application of the amendments allowed. The amendments are to be applied prospectively to all transactions within the scope of the amendments that are reflected in financial statements at the date of initial application and new transactions that are entered into after the date of initial application or, retrospectively to those transactions. The Company is currently evaluating the impact of this standard on its consolidated financial statements. In October 2021, the FASB issued ASU No.2021-08, 2021-08, Business Combinations (Topic 805)805):Accounting for Contract Assets and Contract Liabilities from Contracts with Customers. This update amends guidance to require that an entity (acquirer) recognize and measure contract assets and contract liabilities acquired in a business combination in accordance with Revenue from Contracts with Customers (Topic 606). At the acquisition date, an acquirer should account for the related revenue contracts in accordance with Topic 606 as if it had originated the contracts. ASU 2021-082021-08 is effective for fiscal years beginning after December 15, 2022, including interim periods within those fiscal years. Early adoption of the amendments is permitted including adoption in an interim period. The Company is currently evaluating the impact of this standard on its consolidated financial statements.In July 2021, the FASB issued ASU No.2021-05,Leases (Topic 842): Lessors - Certain Leases with Variable Lease Payments. The guidance in ASU 2021-05 amends the lease classification requirements for the lessors under certain leases containing variable payments to align with practice under Accounting Standards Codification (“ASC”) 840. The lessor should classify and account for a lease with variable lease payments that do not depend on a reference index or a rate as an operating lease if both of the following criteria are met: 1) the lease would have been classified as a sales-type lease or a direct financing lease in accordance with the classification criteria in ASC 842-10-25-2 through 25-3; and 2) the lessor would have otherwise recognized a day-one loss. The amendments in ASU 2021-05 are effective for fiscal years beginning after December 15, 2021, with early adoption permitted. The Company adopted this guidance and it did not have a material impact on the company’s financial position, results of operation or cash flows.
Company’s Consolidated Financial Statements.
In May 2021, March 2020, the FASB issued ASU No.2021-04,Issuer’s Accounting for Certain Modifications or Exchanges of Freestanding Equity-Classified Written Call Options, which clarifies the accounting for modifications or exchanges of freestanding equity-classified written call options that remain equity classified after modification or exchange. Specifically, ASU 2021-04 requires the issuer to treat a modification of an equity-classified warrant as an exchange of the original warrant. The difference between the fair value of the modified warrant and the fair value of the warrant immediately before modification is then recognized as an issuance cost or discount of the related transaction. ASU 2021-04 is effective for fiscal years beginning after December 15, 2021, and interim periods within those fiscal years, with early adoption permitted. ASU 2021-04 should be applied prospectively to modifications or exchanges occurring after the effective date. Either the full or modified retrospective adoption method is allowed. The Company adopted this guidance and it did not have a material impact on the company’s financial position, results of operation or cash flows.
In August 2020, the FASB issued ASU No.2020-06,Debt - Debt with Conversion and Other Options (Subtopic 470-20) and Derivatives and Hedging - Contracts in Entity’s Own Equity (Subtopic 815-40). ASU 2020-06 simplifies the accounting for convertible debt instruments and convertible preferred stock by reducing the number of accounting models and the number of embedded conversion features that could be recognized separately from the primary contract. ASU 2020-06 also enhances transparency and improves disclosures for convertible instruments and earnings per share guidance. ASU 2020-06 is effective for annual reporting periods beginning after December 15, 2021, including interim periods within those fiscal years. Early adoption is permitted, but no earlier than fiscal years beginning after December 15, 2020. This update permits the use of either the modified retrospective or fully retrospective method of transition. The Company adopted this guidance and it did not have a material impact on the company’s financial position, results of operation or cash flows.
In March 2020, the FASB issued ASU No.2020-04, 2020-04,
Reference Rate Reform (Topic 848)848): Facilitation of the Effects of Reference Rate Reform on Financial Reporting. ASU 2020-042020-04 provides optional expedient and exceptions for applying generally accepted accounting principles to contracts, hedging relationships, and other transactions affected by reference rate reform if certain criteria are met. In response to the concerns about structural risks of interbank offered rates and,
particularly, the risk of cessation of the London Interbank Offered Rate (“LIBOR”), regulators in several jurisdictions around the world have undertaken reference rate reform initiatives to identify alternative reference rates that are more observable or transaction-based and less susceptible to manipulation. The ASU provides companies with optional guidance to ease the potential accounting burden associated with transitioning away from reference rates that are expected to be discontinued. In January 2021, the FASB issued ASU 2021-01,2021-01, Reference Rate Reform—Reform—Scope, which clarified the scope and application of the original guidance. The Company will adopt these standards when LIBOR is discontinued. TheIn December 2022, the FASB issued ASU can be adopted no later than 2022-06, Reference Rate Reform—Deferral of the Sunset Date of Topic 848. This update extends the sunset provision of ASU 2020-04 to December 1, 2022, with early adoption permitted.31, 2024. The Company has not yet adopted this ASU and is evaluating the effect of adopting this new accounting guidance. 2. Impairment of property and equipment and definite-lived intangible assets
Impairment testing as of September 30, 2023
Subsequent to the second quarter of 2023, the Company began to initially seek divestment of its Freezer Business. The announcement, coupled with broader economic uncertainty leading to reductions in spending across the biopharma industry and the Company's customer base constituted interim triggering events that required further analysis with respect to potential impairment to goodwill, indefinite-lived intangibles, and its long-lived asset groups. The Company performed an interim quantitative impairment test as of the September 30, 2023 balance sheet date.
To assess any potential impairment of goodwill, the Company compared the carrying value of its single reporting unit against its market capitalization, noting that the market capitalization exceeded the carrying value. As such, goodwill was not impaired as of September 30, 2023.
As a part of the interim quantitative impairment analysis performed, the Company determined that decreases in the market price of the GCI long-lived asset group and historical operating cash flow losses for both GCI and CBS were indicative of potential impairment. The recoverability tests performed over the asset groups of the Freezer Business resulted in a $9.7 million non-cash impairment charge over property and equipment and a $5.8 million non-cash impairment charge over definite-lived intangible assets.
In June 2016, order to determine the FASB issued ASU No.2016-13,Financial Instruments – Credit Losses (Topic 326): Measurementfair value of Credit Losses on Financial Instruments. ASU 2016-13 requires companiesthe property and equipment, acquired technology, customer relationships, and tradename definite-lived intangible assets, the Company utilized the market approach and discounted cash flow analyses to determine if the recoverability of the Freezer Business asset groups were above its carrying value. The key assumptions associated with determining the estimated fair value include (i) the amount and timing of projected future cash flows (including revenue and expenses), (ii) the discount rate selected to measure credit losses utilizingthe risks inherent in the future cash flows, (iii) the assessment of the asset’s life cycle, and (iv) the competitive trends impacting the asset. As a methodologyresult of the analysis, we recognized non-cash impairment charges of $9.7 million, $3.1 million, $0.2 million, and $2.5 million during the period ended September 30, 2023 for the property and equipment, acquired technology, customer relationships, and tradename definite-lived intangible assets, respectively, which represents the difference between the estimated fair value of the Company’s definite-lived intangible assets and their carrying values.
Fair value determinations require considerable judgment and are sensitive to changes in underlying assumptions, estimates and market factors. Estimating the fair value of the Company’s reporting unit and definite-lived intangible assets requires us to make assumptions and estimates regarding our future plans, as well as industry, economic, and regulatory conditions. These assumptions and estimates include projected future revenue growth rates, EBITDA margins, terminal growth rates, discount rates, royalty rates and other market factors. If current expectations of future growth rates, margins and cash flows are not met, or if market factors outside of our control change significantly, then our reporting unit, indefinite-lived intangible assets, and definite-lived intangible assets might become impaired in the future, negatively impacting our operating results and financial position. As the carrying amounts of the Company’s definite-lived intangible assets were impaired as of September 30, 2023 and written down to fair value, those amounts are more susceptible to an impairment risk if there are unfavorable changes in assumptions and estimates.
Impairment testing during the year ended December 31, 2022
In the six months ended June 30, 2022, the Company experienced a significant decline in its market capitalization. In July 2022, the Company abandoned an in-process research and development project within the asset group acquired in the acquisition of Global Cooling and revised its forecasts for net income and net cash flows to be generated by that reflects expected credit lossesasset group. The Company determined that these three events constituted interim triggering events that required further analysis with respect to potential impairment to goodwill, indefinite-lived intangibles, and requiresdefinite-lived intangibles. The Company performed an interim quantitative impairment test as of the June 30, 2022 balance sheet date.
To assess any potential impairment of goodwill, the Company compared the carrying value of its single reporting unit against its market capitalization, noting that the market capitalization exceeded the carrying value. As such, goodwill was not impaired as of June 30, 2022.
Additionally, the Company annually performs an impairment assessment as of October 1. To assess any potential impairment of goodwill, the Company compared the carrying value of its single reporting unit against its market capitalization, noting that the market capitalization exceeded the carrying value. As such, goodwill was not impaired as of October 1, 2022.
In order to determine the fair value of our indefinite-lived intangible assets acquired from Global Cooling, which included an in-process research and development project, the Company utilized a considerationdiscounted cash flow analysis. In order to determine the fair value of our in-process research and development intangible assets not related to the abandoned project, the Company utilized an average of a broader range of reasonablediscounted cash flow analysis and supportable information to inform credit loss estimates. For companies that qualified as Smaller Reporting Companies as defined bycomparable public company analysis. The key assumptions associated with determining the SEC as of November 19, 2019, ASU 2016-13 is effectiveestimated fair value for fiscal years beginning after December 15, 2023, including interim periods within those fiscal years. The Company is evaluatingboth asset groups include projected future revenue growth rates, earnings before interest, taxes, depreciation and amortization ("EBITDA") margins, the impactterminal growth rate, and the discount rate. As a result of the guidance on its financial statements.changes in these assumptions in addition to the abandonment of the aforementioned in-process research and development project, we recognized a $67.4 million non-cash impairment charge during the year-ended December 31, 2022 in the line item Asset impairment charges in the Company's Consolidated Statements of Operations, which represents full impairment of the carrying value of the Company’s in-process research and development intangible asset. In order to determine the fair value of the acquired technology, customer relationships, tradename, and non-compete definite-lived intangible assets, the Company utilized the excess earnings approach, distributor method, relief from royalty method, and with and without approach, respectively. The key assumptions associated with determining the estimated fair value include (i) the amount and timing of projected future cash flows (including revenue and expenses), (ii) the discount rate selected to measure the risks inherent in the future cash flows, (iii) the assessment of the asset’s life cycle, and (iv) the competitive trends impacting the asset. As a result of the analysis, we recognized non-cash impairment charges of $14.1 million, $6.2 million, $21.9 million, and $0.8 million during the year-ended December 31, 2022 for the acquired technology, customer relationships, tradename, and non-compete definite-lived intangible assets, respectively, in the line item Asset impairment charges in the Company's Consolidated Statements of Operations, which represents the difference between the estimated fair value of the Company’s definite-lived intangible assets and their carrying values.
3. Fair value measurement
In accordance with FASB ASC Topic 820,Fair Value Measurements and Disclosures, (“ASC Topic 820”), the Company measures its financial instruments at fair value on a recurring basis. The carrying values of certain of our financial instruments including cash and cash equivalents, accounts receivable, accounts payable, and accrued liabilities approximate fair value because of their short maturities. The carrying value of our marketable debt securities, which are accounted for as available-for-sale, are classified within either Level 1 or Level 2 in the fair value hierarchy because we use quoted market prices or alternative pricing sources and models utilizing market observable inputs to determine their fair value. The carrying values of our long-term debt, which is classified within Level 2 in the fair value hierarchy, approximates fair value as our borrowings with lenders are at interest rates that approximate market rates for comparable loans. The fair values of investments and contingent consideration classified as Level 3 were derived from management assumptions. The Company also measures certain assets and liabilities at fair value on a non-recurring basis when applying acquisition accounting. ASC Topic 820 clarifies that fair value is an exit price, representing the amount that would be received to sell an asset or paid to transfer a liability in an orderly transaction between market participants. As such, fair value is a market-based measurement that should be determined based on assumptions that market participants would use in pricing an asset or liability. As a basis for considering such assumptions, ASC Topic 820 establishes a three-tierthree-tier value fair hierarchy, which prioritizes the inputs used in measuring fair value as follows: Level
1 – Observable inputs that reflect quoted prices (unadjusted) in active markets for identical assets or liabilities.
Level
2 – Observable inputs other than quoted prices included in Level
1 for similar assets or liabilities, quoted prices in markets that are
not active or other inputs that are observable or can be corroborated by observable market data for substantially the full term of the related assets or liabilities.
Level
3 – Unobservable data points for the asset or liability, and include situations where there is little, if any, market activity for the asset or liability.
For the investment in iVexSol convertible debt that was converted to Series A-1 preferred stock in November 2020, the significant Level 3 inputs were the expected term of the instrument, the underlying credit worthiness of iVexSol and the valuation of various embedded features in the note, which were based on future financings of iVexSol. We considered a range of probability-weighted financing or payoff settlements between 5% and 50% with outcomes occurring over a range of 1 to 2 years. The estimated market interest rate of approximately 8.0% was based on an average of indexes of below investment grade debt. The market rate was calibrated to the rate implied in the original issuance in September 2019 and adjusted for changes in market rates quarterly.
The fair value of the AsteroSciSafe contingent consideration liability was initially valued based on unobservable inputs using a Black-Scholes valuation model.Monte Carlo simulation. These inputs included the estimated amount and timing of projected future revenue, a discount rate of 17.5%4.5%, a risk-free rates between 2.29% and 2.41%rate of approximately 0.2%, asset volatility of 60%, and revenue volatility of 56%15%. Significant increases (decreases)changes in any of those inputs in isolation would result in a significantly higher (lower)significant changes in fair value measurement. Generally, changes used in the assumptions for projected future revenue and revenue volatility would be accompanied by a directionally similar change in the fair value measurement. Conversely, changes in the discount rate would be accompanied by a directionally opposite change in the related fair value measurement. However, due to the contingent consideration having a maximum payout amount, changes in these assumptions would not affect the fair value of the contingent consideration if they increase (decrease) beyond certain amounts. Subsequent to the acquisition date, at each reporting period, the contingent consideration liability is re-measured to fair value with changes recorded in the change in fair value of contingent consideration in the Consolidated Statements of Operations. During the most recent re-measurement of the contingent consideration liability as of December 31, 2021, the Company assessed the probability of meeting previously determined metrics as unlikely. The Company recognized a reduction of $81,000 in the Change in Fair Value of Contingent Consideration in the Consolidated Statements of Operations for the year ended December 31, 2021. This Contingent Consideration liability is included in the Consolidated Balance Sheets as of December 31, 2020 in the amount of $81,000.The fair value of the CBS contingent consideration liability was initially valued based on unobservable inputs using a Monte Carlo simulation. These inputs included the estimated amount and timing of projected future revenue, a discount rate of 26.0%, a risk-free rate of approximately 1.74% and revenue volatility of 70%. Significant increases (decreases) in any of those inputs in isolation would result in a significantly higher (lower) fair value measurement. Generally, changes used in the assumptions for projected future revenue and revenue volatility would be accompanied by a directionally similar change in the fair value measurement. Conversely, changes in the discount rate would be accompanied by a directionally opposite change in the related fair value measurement. However, due to the contingent consideration having a maximum payout amount, changes in these assumptions would not affect the fair value of the contingent consideration if they increase (decrease) beyond certain amounts. Subsequent to the acquisition date, at each reporting period, the contingent consideration liability is re-measured to fair value with changes recorded in the change in fair value of contingent consideration in the consolidated statements of operations. During the most recent re-measurement of the Contingent Consideration liability as of December 31, 2021, the Company used a discount rate of 21.0%, a risk-free rate of 0.23% and revenue volatility of 63%. This Contingent Consideration Liability is included in the Consolidated Balance Sheet as of December 31, 2021 and 2020 in the amount of $140,000.
The fair value of the SciSafe contingent consideration liability was initially valued based on unobservable inputs using a Monte Carlo simulation. These inputs included the estimated amount and timing of projected future revenue, a discount rate of 4.5%, a risk-free rate of approximately 0.20%, asset volatility of 60%, and revenue volatility of 15%. Significant increases (decreases) in any of those inputs in isolation would result in a significantly higher (lower) fair value measurement. Generally, changes used in the assumptions for projected future revenue and revenue volatility would be accompanied by a directionally similar change in the fair value measurement. Conversely, changes in the discount rate would be accompanied by a directionally opposite change in the related fair value measurement. However, due to the contingent consideration having a maximum payout amount, changes in these assumptions would not affect the fair value of the contingent consideration if they increase (decrease)vary beyond certain amounts. At the acquisition date, the contingent consideration was determined to have a fair value of $3.7 million. Subsequent to the acquisition date, the contingent consideration liability was re-measured to fair value with changes recorded in the change
Change in fair value of contingent consideration line item in the consolidated statementsConsolidated Statements of operations. Operations. During the most recent re-measurement of the contingent consideration liability as of
December 31, 2021, 2023, the Company
used a discount ratedetermined it appropriate to write-off the remaining balance of
7.1%, a risk-free rate of approximately 0.85%, asset volatility of 72%,the SciSafe contingent consideration liability. The target revenue required for earnout was not met during the year ended December 31, 2023 and
revenue volatility of 27%.has been determined to not be probable to achieve in future years. This contingent consideration liability
iswas included in the Consolidated Balance Sheets as of
December 31, 2021 and 20202022 in the
amountsamount of
$9.9 million and $6.9 million, respectively.$4.3 million. The changes in fair value of contingent consideration of
$3.0$2.1 million and
$3.3$5.6 million associated with this liability are included within the Change in Fair Value of Contingent Consideration in the Consolidated Statements of Operations for the years ended
December 31, 2021 2023 and
2020,2022, respectively.
For the warrant liability, the significant Level 3 inputs included the contractual remaining term of the warrants and the volatility of the Company’s common stock. For the estimated term of the warrants, we used the actual terms of the warrants, which expired March 25, 2021. For the volatility of the Company’s stock as of December 31, 2020, we used historical volatility for the remaining term of each warrant. These amounts ranged from 56.8% to 84.6%. We did not make any adjustments to the historical volatility. Certain assumptions used in estimating the fair value of the warrants are uncertain by nature. On March 25, 2021, the expiration date of all remaining warrants, all remaining warrants were exercised via a “cashless” exercise and the warrant liability was revalued to its intrinsic value, as the Company’s stock price was observable as of that date.
There were
no remeasurements to fair value during the year ended
December 31, 2021 2023 of financial assets and liabilities that are
not measured at fair value on a recurring basis.
The following tables set forth the Company’s financial assets and liabilities measured at fair value on a recurring basis as of December 31, 2021 2023 and 2020,2022, based on the three-tierthree-tier fair value hierarchy:
(In thousands)
As of December 31, 2021 | | Level 1 | | | Level 2 | | | Level 3 | | | Total | |
Assets: | | | | | | | | | | | | | | | | |
Money market accounts | | $ | 63,873 | | | $ | 0 | | | $ | 0 | | | $ | 63,873 | |
Total | | | 63,873 | | | | 0 | | | | 0 | | | | 63,873 | |
Liabilities: | | | | | | | | | | | | | | | | |
Contingent consideration - business combinations | | | 0 | | | | 0 | | | | 10,027 | | | | 10,027 | |
Total | | $ | 0 | | | $ | 0 | | | $ | 10,027 | | | $ | 10,027 | |
As of December 31, 2020 | | Level 1 | | | Level 2 | | | Level 3 | | | Total | |
Assets: | | | | | | | | | | | | | | | | |
Money market accounts | | $ | 90,403 | | | $ | 0 | | | $ | 0 | | | $ | 90,403 | |
Total | | | 90,403 | | | | 0 | | | | 0 | | | | 90,403 | |
Liabilities: | | | | | | | | | | | | | | | | |
Contingent consideration - business combinations | | | 0 | | | | 0 | | | | 7,152 | | | | 7,152 | |
Warrant liability | | | 0 | | | | 0 | | | | 2,780 | | | | 2,780 | |
Total | | $ | 0 | | | $ | 0 | | | $ | 9,932 | | | $ | 9,932 | |
The fair values
| | | | | | | | | | | | | | | | | | | | | | | |
| As of December 31, 2023 | Level 1 | | Level 2 | | Level 3 | | Total |
| Assets: | | | | | | | |
| Cash equivalents: | | | | | | | |
| Money market accounts | $ | 25,034 | | | $ | — | | | $ | — | | | $ | 25,034 | |
| Available-for-sale securities: | | | | | | | |
| U.S. government securities | 5,170 | | | — | | | — | | | 5,170 | |
| Corporate debt securities | — | | | 9,674 | | | — | | | 9,674 | |
| Other debt securities | — | | | 1,992 | | | — | | | 1,992 | |
| Total | 30,204 | | | 11,666 | | | — | | | 41,870 | |
| | | | | | | | | | | | | | | | | | | | | | | |
| As of December 31, 2022 | Level 1 | | Level 2 | | Level 3 | | Total |
| Assets: | | | | | | | |
| Cash equivalents: | | | | | | | |
| Money market accounts | $ | 11,416 | | | $ | — | | | $ | — | | | $ | 11,416 | |
| Available-for-sale securities: | | | | | | | |
| U.S. government securities | 15,051 | | | — | | | — | | | 15,051 | |
| Corporate debt securities | — | | | 26,047 | | | — | | | 26,047 | |
| Other debt securities | — | | | 3,494 | | | — | | | 3,494 | |
| Total | 26,467 | | | 29,541 | | | $ | — | | | 56,008 | |
| Liabilities: | | | | | | | |
| Contingent consideration - business combinations | — | | | — | | | 4,456 | | | 4,456 | |
| Total | $ | — | | | $ | — | | | $ | 4,456 | | | $ | 4,456 | |
There have been
no transfers of assets or liabilities between the fair value measurement levels.
The following table presents the changes in fair value of contingent consideration liabilities which are measured using Level
3 inputs for the years ended
December 31, 2021, 2020,2023, 2022, and
2019:| | | Year Ended December 31, | |
(In thousands) | | 2021 | | | 2020 | | | 2019 | |
Beginning balance | | $ | 7,152 | | | $ | 1,914 | | | | 0 | |
Additions | | | 0 | | | | 3,663 | | | | 2,347 | |
Change in fair value recognized in net (loss) income | | | 2,875 | | | | 1,575 | | | | 50 | |
Payments earned, reclassified to accrued liabilities | | | 0 | | | | 0 | | | | (483 | ) |
Ending balance | | $ | 10,027 | | | $ | 7,152 | | | $ | 1,914 | |
2021:
| | | | | | | | | | | | | | | | | |
| Year Ended December 31, |
| (In thousands) | 2023 | | 2022 | | 2021 |
| Balance at beginning of period | $ | 4,456 | | | $ | 10,027 | | | $ | 7,152 | |
| Change in fair value recognized in net loss | (2,193) | | | (4,754) | | | 2,875 | |
| Payment of contingent consideration earned | (2,263) | | | (817) | | | — | |
| Balance at end of period | $ | — | | | $ | 4,456 | | | $ | 10,027 | |
The following table presents the changes in fair value of warrant liabilities which are measured using Level 3 inputs for the yearsyear ended December 31, 2021, 2020,2021:
| | | | | | | | |
| (In thousands) | | 2021 |
| Balance at beginning of period | | 2,780 | |
| Exercised warrants | | (2,901) | |
| Change in fair value recognized in net loss | | 121 | |
| Balance at end of period | | $ | — | |
There was no warrant liability activity as of December 31, 2023 and
2019:| | | Year Ended December 31, | |
(In thousands) | | 2021 | | | 2020 | | | 2019 | |
Beginning balance | | $ | 2,780 | | | $ | 39,602 | | | | 28,516 | |
Exercised warrants | | | (2,901 | ) | | | (33,221 | ) | | | (1,749 | ) |
Change in fair value recognized in net (loss) income | | | 121 | | | | (3,601 | ) | | | 12,835 | |
Ending balance | | $ | 0 | | | $ | 2,780 | | | $ | 39,602 | |
4. Investments
Available-for-sale securities
The Company’s portfolio of available-for-sale marketable securities consists of the following:
| | | | | | | | | | | | | | | | | | | | | | | |
| December 31, 2023 |
| Amortized
Cost | | Gross unrealized | | Estimated
Fair Value |
| (In thousands) | | Gains | | Losses | |
| Available-for-sale securities, current portion | | | | | | | |
| U.S. government securities | $ | 5,169 | | | $ | 1 | | | $ | — | | | $ | 5,170 | |
| Corporate debt securities | 9,673 | | | 5 | | | (4) | | | 9,674 | |
| Other debt securities | 1,443 | | | 1 | | | — | | | 1,444 | |
| Total short-term | 16,285 | | | 7 | | | (4) | | | 16,288 | |
| | | | | | | |
| Available-for-sale securities, long-term | | | | | | | |
| Other debt securities | 545 | | | 3 | | | — | | | 548 | |
| | | | | | | |
| Total available-for-sale securities | $ | 16,830 | | | $ | 10 | | | $ | (4) | | | $ | 16,836 | |
| | | | | | | | | | | |
| (In thousands) | Amortized
Cost | | Estimated
Fair Value |
| Due in one year or less | $ | 16,285 | | | $ | 16,288 | |
| Due after one year through five years | 545 | | | 548 | |
| Total | $ | 16,830 | | | $ | 16,836 | |
There were no outstanding available-for-sale marketable securities as of December 31, 2022.
As of December 31, 2023, none of our available-for-sale marketable securities exhibited risk of credit loss and therefore no allowance for credit losses was recorded.
Equity investments
The Company periodically invests in non-marketable equity securities of private companies without a readily determinable fair value to promote business and strategic objectives. The non-marketable equity securities are carried at cost minus impairment, if any, plus or minus changes resulting from observable process changes in orderly transactions for identical or similar investments of the same issuer. These securities included Series A-1 and A-2 Preferred Stock in iVexSol, Inc. with a fair value of $4.1 million as of December 31, 2023 and December 31, 2022, and Series E Preferred Stock in PanTHERA CryoSolutions, Inc. with a fair value of $995,000 as of December 31, 2023 and December 31, 2022.
5. Inventories
Inventories consist of the following as of December 31, 2021 2023and 2020:(In thousands) | | 2021 | | | 2020 | |
Raw materials | | $ | 17,252 | | | $ | 2,855 | |
Work in progress | | | 5,015 | | | | 2,006 | |
Finished goods | | | 6,078 | | | | 6,741 | |
Total | | $ | 28,345 | | | $ | 11,602 | |
| | | | | | | | | | | |
| (In thousands) | 2023 | | 2022 |
| Raw materials | $ | 26,219 | | | $ | 20,950 | |
| Work in progress | 7,128 | | | 5,680 | |
| Finished goods | 10,109 | | | 8,274 | |
| Total | $ | 43,456 | | | $ | 34,904 | |
During the year ended December 31, 2023, the Company recorded a $5.7 million inventory write-down for potentially unusable products. The products consisted of slow moving inventory, product defects, and supplier defects in raw materials.
6. Leases
We have various operating lease agreements for office space, warehouses, manufacturing, and production locations as well as vehicles and other equipment. Our real estate leases had original lease terms of three to eleven years and remaining lease terms of one to eight years. We exclude options that are not reasonably certain to be exercised from our lease terms, ranging from one to five years. Our lease payments consist primarily of fixed rental payments for the right to use the underlying leased assets over the lease terms, with all other lease payments consisting of variable lease costs. For certain leases, we receive incentives from our landlords, such as rent abatements, which effectively reduce the total lease payments owed for these leases. Vehicle and other equipment operating leases had original lease terms of four and five years and have remaining lease terms between one and five years.
Our financing leases relate to research equipment, machinery, and other equipment.
The table below presents certain information related to the weighted average discount rate and weighted average remaining lease term for the Company’s leases as of December 31, 2023 and 2022:
| | | | | | | | | | | |
| 2023 | | 2022 |
| Weighted average discount rate - operating leases | 4.3 | % | | 4.2 | % |
| Weighted average discount rate - finance leases | 8.3 | % | | 6.1 | % |
| Weighted average remaining lease term in years - operating leases | 6.4 | | 7.2 |
| Weighted average remaining lease term in years - finance leases | 4.1 | | 2.0 |
The components of lease expense for the years ended December 31, 2023, 2022, and 2021 were as follows:
| | | | | | | | | | | | | | | | | |
| Year Ended December 31, |
| (In thousands) | 2023 | | 2022 | | 2021 |
| Operating lease costs | $ | 3,515 | | | $ | 3,701 | | | $ | 2,817 | |
| Financing lease costs | 420 | | | 174 | | | 166 | |
| Short-term lease costs | 2,037 | | | 2,141 | | | 1,727 | |
| Total operating lease costs | 5,972 | | | 6,016 | | | 4,710 | |
| | | | | |
| Variable lease costs | 1,292 | | | 1,104 | | | 749 | |
| Total lease expense | $ | 7,264 | | | $ | 7,120 | | | $ | 5,459 | |
Maturities of our lease liabilities as of December 31, 2023 are as follows:
| | | | | | | | | | | |
| (In thousands) | Operating Leases | | Financing Leases |
| 2024 | $ | 3,400 | | | $ | 487 | |
| 2025 | 2,960 | | | 424 | |
| 2026 | 2,655 | | | 389 | |
| 2027 | 2,280 | | | 386 | |
| 2028 | 2,042 | | | 134 | |
| Thereafter | 4,896 | | | — | |
| Total lease payments | 18,233 | | | 1,820 | |
| Less: interest | (2,231) | | | (275) | |
| Total present value of lease liabilities | $ | 16,002 | | | $ | 1,545 | |
7. Assets held for rent
Assets held for rent consist of the following as of
December 31, 2021 2023 and
2020:(In thousands) | | 2021 | | | 2020 | |
Shippers placed in service | | $ | 5,645 | | | $ | 3,171 | |
Fixed assets held for rent | | | 4,040 | | | | 0 | |
Accumulated depreciation | | | (2,272 | ) | | | (411 | ) |
Net | | | 7,413 | | | | 2,760 | |
Shippers and related components in production | | | 2,396 | | | | 1,945 | |
Total | | $ | 9,809 | | | $ | 4,705 | |
2022:
| | | | | | | | | | | |
| (In thousands) | 2023 | | 2022 |
| Shippers placed in service | $ | 9,866 | | | $ | 7,671 | |
| Fixed assets held for rent | 1,468 | | | 4,686 | |
| Accumulated depreciation | (6,272) | | | (4,952) | |
| Net | 5,062 | | | 7,405 | |
| Shippers and related components in production | 2,651 | | | 1,659 | |
| Total | $ | 7,713 | | | $ | 9,064 | |
Shippers and related components in production include shippers complete and ready to be deployed and placed in service upon a customer order, shippers in the process of being assembled, and components available to build shippers. We recognized $3.5 million, $3.5 million, and $1.9 million $671,000, and $174,000 in depreciation expense related to assets held for rent during the years ended December 31, 2023, 2022, and 2021, 2020,respectively.
8. Property and
2019, respectively.equipment We have various operating lease agreements for office space, warehouses, manufacturing,Property and production locations as well as vehicles and other equipment. Our real estate leases have remaining lease termsequipment consist of one to ten years. We exclude options that are not reasonably certain to be exercised from our lease terms, ranging from one to five years. Our lease payments consist primarily of fixed rental payments for the right to use the underlying leased assets over the lease terms. For certain leases, we receive incentives from our landlords, such as rent abatements, which effectively reduce the total lease payments owed for these leases. Vehicle and other equipment operating leases have terms between one and five years.
Our financing leases relate to research equipment, machinery, and other equipment.
The table below presents certain information related to the weighted average discount rate and weighted average remaining lease term for the Company’s leasesfollowing as of December 31, 2021 2023 and 2020:
| | | 2021 | | | 2020 | |
Weighted average discount rate - operating leases | | | 3.8 | % | | | 3.3 | % |
Weighted average discount rate - finance leases | | | 6.1 | % | | | 5.7 | % |
Weighted average remaining lease term in years - operating leases | | | 7.8 | | | | 9.4 | |
Weighted average remaining lease term in years - finance leases | | | 3.0 | | | | 2.6 | |
The components of lease2022:
| | | | | | | | | | | |
| (In thousands) | 2023 | | 2022 |
| Property and equipment | | | |
| Leasehold improvements | $ | 5,913 | | | $ | 5,249 | |
| Furniture and computer equipment | 820 | | | 1,908 | |
| Manufacturing and other equipment | 19,893 | | | 20,557 | |
| Construction in-progress | 3,953 | | | 5,095 | |
| Subtotal | 30,579 | | | 32,809 | |
| Less: Accumulated depreciation | (9,502) | | | (9,171) | |
| Property and equipment, net | $ | 21,077 | | | $ | 23,638 | |
Depreciation expense for property and equipment was $3.6 million, $3.3 million, and $2.9 million for the years ended December 31, 2023, 2022, and 2021, 2020,respectively.
9. Accrued expenses and 2019 wereother current liabilities
Accrued expenses and other current liabilities consist of the following as of December 31, 2023 and 2022:
| | | | | | | | | | | |
| (In thousands) | 2023 | | 2022 |
| Accrued expenses | $ | 6,909 | | | $ | 3,128 | |
| Accrued taxes | 562 | | | 975 | |
| Accrued compensation | 3,800 | | | 5,080 | |
| Deferred revenue, current | 661 | | | 548 | |
| Other | — | | | 51 | |
| Total accrued expenses and other current liabilities | $ | 11,932 | | | $ | 9,782 | |
10. Warranty reserve liability
We reserve estimated exposures on known claims, as well as on a portion of anticipated claims, for product warranty and rework cost, based on historical product liability claims. Claim costs are deducted from the accrual when paid. Factors that could have an impact on the warranty accrual in any given period include the following: changes in manufacturing quality, changes in product costs, changes in product mix and any significant changes in sales volume.
A rollforward of our warranty liability is as follows:
| | | Year Ended December 31, | |
(In thousands) | | 2021 | | | 2020 | | | 2019 | |
Operating lease costs | | $ | 2,817 | | | $ | 839 | | | $ | 612 | |
Short-term lease costs | | | 1,727 | | | | 277 | | | | 51 | |
Total operating lease costs | | | 4,544 | | | | 1,116 | | | | 663 | |
| | | | | | | | | | | | | |
Variable lease costs | | | 749 | | | | 357 | | | | 299 | |
Total lease expense | | $ | 5,293 | | | $ | 1,473 | | | $ | 962 | |
Maturities
| | | | | | | | | | | | | | | | | |
| (In thousands) | 2023 | | 2022 | | 2021 |
| Balance at beginning of period | $ | 8,312 | | | $ | 9,398 | | | $ | 212 | |
| Warranty reserve acquired in the acquisition of Global Cooling | — | | | — | | | 3,353 | |
| Provision for warranties⁽¹⁾ | 3,351 | | | 4,463 | | | 10,989 | |
| Settlements of warranty claims⁽¹⁾ | (3,805) | | | (5,549) | | | (5,156) | |
| Balance at end of period | $ | 7,858 | | | $ | 8,312 | | | $ | 9,398 | |
(1)Both the Provision for warranties and Settlements of our lease liabilities aswarranty claims balances include reclassifications of $1.6 million and $1.1 million for the years ended December 31, 2022 and 2021, are as follows: (In thousands) | | Operating Leases | | | Financing Leases | |
2022 | | $ | 3,443 | | | $ | 171 | |
2023 | | | 3,151 | | | | 171 | |
2024 | | | 2,883 | | | | 101 | |
2025 | | | 2,497 | | | | 37 | |
2026 | | | 2,006 | | | | 2 | |
Thereafter | | | 8,364 | | | | 0 | |
Total lease payments | | | 22,344 | | | | 482 | |
Less: interest | | | (3,120 | ) | | | (42 | ) |
Total present value of lease liabilities | | $ | 19,224 | | | $ | 440 | |
11. Goodwill and intangible assets
Goodwill
6.
| Goodwill and intangible assets
|
Goodwill
The following table represents the
changes incomponents of the carrying value of goodwill for the
yearsyear ended
December 31, 2021 and 2020:(In thousands) | | Goodwill | |
Balance as of December 31, 2019 | | $ | 33,637 | |
Correction of an error related to CBS goodwill | | | (131 | ) |
Goodwill related to SciSafe acquisition | | | 24,943 | |
Balance as of December 31, 2020 | | | 58,449 | |
Goodwill related to Global Cooling acquisition | | | 137,822 | |
Goodwill related to Sexton acquisition | | | 28,470 | |
Balance as of December 31, 2021 | | $ | 224,741 | |
We adjusted goodwill from the CBS Acquisition related to an immaterial error of $131,000 in payables that were paid during closing and incorrectly recorded as liabilities in our purchase price accounting as of December 31, 2019. We reduced our goodwill and accounts payable by $131,000 in the year ended December 31, 2020.
2023:
| | | | | |
| (In thousands) | Goodwill |
| Balance as of December 31, 2020 | $ | 58,449 | |
| Goodwill related to Global Cooling acquisition | 137,822 | |
| Goodwill related to Sexton acquisition | 28,470 | |
| Balance as of December 31, 2023 and 2022 | $ | 224,741 | |
Intangible assets, net consisted of the following as of December 31, 2023 and 2022:
| | | | | | | | | | | | | | | | | | | | | | | |
| (In thousands, except weighted average useful life) | December 31, 2023 | | |
| Intangible assets: | Gross Carrying Value | | Accumulated Amortization | | Net Carrying Value | | Weighted Average Useful Life
(in years) |
Customer Relationships(1) | $ | 9,936 | | | $ | (4,217) | | | $ | 5,719 | | | 10.7 |
Tradenames(1) | 8,134 | | | (2,077) | | | 6,057 | | | 11.3 |
Technology - acquired(1) | 18,372 | | | (9,123) | | | 9,249 | | | 4.1 |
| Non-compete agreements | 750 | | | (626) | | | 124 | | | 0.8 |
| Total intangible assets | $ | 37,192 | | | $ | (16,043) | | | $ | 21,149 | | | 7.3 |
(1) The entirety of the gross carrying values and accumulated amortization of the specified intangible assets above associated with the Freezer Business were impaired during the three months ended September 30, 2023. Refer to Note 2: Impairment of property and equipment and definite-lived intangible assets for more information on the assessed non-cash impairment charges.
| | | | | | | | | | | | | | | | | | | | | | | |
| December 31, 2022 | | |
| Intangible assets: | Gross Carrying Value(1) | | Accumulated Amortization(1) | | Net Carrying Value | | Weighted Average Useful Life (in years)(1) |
| Customer Relationships | $ | 10,496 | | | $ | (3,328) | | | $ | 7,168 | | | 8.8 |
| Tradenames | 11,328 | | | (1,794) | | | 9,534 | | | 11.8 |
| Technology - acquired | 23,802 | | | (8,705) | | | 15,097 | | | 5.3 |
| Non-compete agreements | 750 | | | (461) | | | 289 | | | 1.8 |
| Total intangible assets | $ | 46,376 | | | $ | (14,288) | | | $ | 32,088 | | | 8.0 |
(1) Both the Gross Carrying Value and Accumulated Amortization balances as of December 31, 2022 contain immaterial adjustments to reflect impairments taken during the year ended December 31, 2022 on each of the intangible asset classes presented here. Each intangible asset class was adjusted as follows: Customer relationships: $0.8 million; Tradenames: $2.4 million, Technology - acquired: $4.1 million, Non-compete agreements: $0.4 million. The Weighted Average Useful Life was additionally adjusted to reflect the updated balances subsequent to the impairment charges.
Impairment expense for both finite and indefinite-lived intangible assets was $5.8 million, $110.4 million, and zero for the years ended December 31, 2023, 2022, and 2021,
and 2020:(In thousands, except weighted average useful life) | | December 31, 2021 | | | | | |
Intangible assets: | | Gross Carrying Value | | | Accumulated Amortization | | | Net Carrying Value | | | Weighted Average Useful Life (in years) | |
Customer Relationships | | $ | 17,516 | | | $ | (1,776 | ) | | $ | 15,740 | | | | 10.3 | |
Tradenames | | | 35,574 | | | | (2,306 | ) | | | 33,268 | | | | 13.8 | |
Technology - acquired | | | 41,942 | | | | (7,789 | ) | | | 34,153 | | | | 5.9 | |
Non-compete agreements | | | 1,990 | | | | (442 | ) | | | 1,548 | | | | 3.0 | |
In-process research and development⁽¹⁾ | | | 67,440 | | | | - | | | | 67,440 | | | | N/A | |
Total intangible assets | | $ | 164,462 | | | $ | (12,313 | ) | | $ | 152,149 | | | | 9.8 | |
| | | December 31, 2020 | | | | | |
Intangible assets: | | Gross Carrying Value | | | Accumulated Amortization | | | Net Carrying Value | | | Weighted Average Useful Life (in years) | |
Customer Relationships | | $ | 8,220 | | | $ | (330 | ) | | $ | 7,890 | | | | 12.8 | |
Tradenames | | | 6,610 | | | | (508 | ) | | | 6,102 | | | | 14.0 | |
Technology - acquired | | | 19,670 | | | | (3,232 | ) | | | 16,438 | | | | 7.1 | |
Non-compete agreements | | | 660 | | | | (41 | ) | | | 619 | | | | 3.8 | |
Total intangible assets | | $ | 35,160 | | | $ | (4,111 | ) | | $ | 31,049 | | | | 9.7 | |
(1)
| In-process R&D represents the fair value of incomplete research and development that has not yet reached technological feasibility. We will amortize the asset upon technological feasibility.
|
respectively. Amortization expense for finite-lived intangible assets was $8.2
$5.2 million,
$3.0$9.7 million, and
$1.1$8.2 million for the years ended
December 31, 2021, 2020,2023, 2022, and
2019,2021, respectively. As of
December 31, 2021, 2023, the Company expects to record the following amortization expense:
(In thousands) | | | | |
For the Years Ending December 31, | | Estimated Amortization Expense | |
2022 | | $ | 11,421 | |
2023 | | | 10,951 | |
2024 | | | 10,126 | |
2025 | | | 9,748 | |
2026 | | | 9,346 | |
Thereafter | | | 33,117 | |
Total | | $ | 84,709 | |
| | | | | |
| (In thousands) | |
| For the Years Ending December 31, | Estimated
Amortization
Expense |
| 2024 | $ | 3,602 | |
| 2025 | 3,468 | |
| 2026 | 3,358 | |
| 2027 | 2,605 | |
| 2028 | 1,500 | |
| Thereafter | 6,616 | |
| Total | $ | 21,149 | |
7.
| Line of credit and long-term debt
|
Line
12. Commitments and contingencies
Employment agreements
We have employment agreements with certain key employees. None of
creditIn these employment agreements is for a definitive period, but rather each will continue indefinitely until terminated in accordance with its terms. The agreements provide for a base annual salary, payable in monthly (or shorter) installments. Under certain conditions and for certain of these officers, we may be required to pay additional amounts upon terminating the officer or upon the officer resigning for good reason.
Litigation
From time to time, the Company is subject to various legal proceedings that arise in the ordinary course of business, none of which are currently material to the Company’s business. The Company’s industry is characterized by frequent claims and litigation, including claims regarding intellectual property. As a result, the Company may be subject to various legal proceedings from time to time. The results of any future litigation cannot be predicted with certainty, and regardless of the outcome, litigation can have an adverse impact on the Company because of defense and settlement costs, diversion of management resources and other factors. Management is not aware of any pending or threatened litigation.
Indemnification
As permitted under Delaware law and in accordance with the Company’s bylaws, the Company is required to indemnify its officers and directors for certain errors and occurrences while the officer or director is or was serving in such capacity. The Company is also party to indemnification agreements with its directors. The Company believes the fair value of the indemnification rights and agreements is minimal. Accordingly, the Company has not recorded any liabilities for these indemnification rights and agreements as of December 31, 2023.
Non-income related taxes
Companies are required to collect and remit sales tax from certain customers if the company is determined to have nexus in a particular state. Upon the determination of nexus, which varies by state, companies are additionally required to maintain detailed record of specific product and customer information within each jurisdiction in which it has established nexus to appropriately determine their sales tax liability, requiring technical knowledge of each jurisdiction’s tax case law. During the year ended December 31, 2022, the Company determined that a sales tax liability related to the periods of 2019 through 2022 is probable. The estimated liability was determined to be approximately $5.4 million and $3.7 million as of December 31, 2023 and December 31, 2022, respectively. Due to the variety of jurisdictions in which this estimated liability relates to and our ongoing assessment of sales taxes owed, we cannot predict when final liabilities will be satisfied. We will reevaluate the estimated liability and timing of satisfaction each reporting period.
Settlement of Global Cooling Escrow
On May 3, 2021, the Company acquired Global CoolingGCI pursuant to an Agreement and assumedPlan of Merger, dated as of March 19, 2021 (the “GCI Merger Agreement”). Pursuant to the GCI Merger Agreement, the aggregate consideration paid to former stockholders of GCI (collectively, the “GCI Stockholders”) was 6,646,870 newly issued shares of common stock (the “GCI Merger Consideration”) were provided with the requirement that the GCI Merger Consideration otherwise payable to GCI Stockholders were subject to reduction for indemnification obligations. Approximately 9% of the GCI Merger Consideration (the "GCI Escrow Shares") otherwise issuable to the GCI Stockholders were deposited into a linesegregated escrow account (the “GCI Escrow Account”) in accordance with an escrow agreement entered into in connection with the closing of credit which bore interest at a floating ratethe transactions contemplated by the GCI Merger Agreement (the “GCI Escrow Agreement”). Of the GCI Escrow Shares, an amount equal to 5% of the 3-month LIBOR rate plus 5.50%GCI Merger Consideration were considered general escrow shares (the “General Escrow Shares”). The maximum allowed onGeneral Escrow Shares were eligible to be held in escrow for a period of up to 18 months after the lineclosing of credit was $5.0 million. The line was securedthe GCI acquisition as the sole and exclusive source of payment for any indemnification claims made by substantially all assets of Global Cooling. In October 2021, the Company.
On September 28, 2022, BioLife asserted an indemnification claim pursuant to the GCI Merger Agreement. On June 5, 2023, the Company
paid offentered into a Settlement Agreement with the
entiretyrepresentatives of the
outstanding balance onGCI Stockholders, pursuant to which the
lineparties agreed to release 65% of
creditthe General Escrow Shares, totaling 216,024 shares, to the Company from the GCI Escrow Account. These shares were returned to the Company and
all related interest.subsequently cancelled. As a result of the settlement, the Company recorded a $5.1 million gain recognizing the return of the shares during the second quarter of 2023.
In
May 2021, the Company assumed
three term notes in the acquisition of Global Cooling. At the time of acquisition, these notes carried aggregate outstanding principal balances of $4.4 million. These term notes bore interest at a floating rate equal to the
3-month3-month LIBOR rate plus 6.50%. The term notes included financial covenants tied to the performance of Global Cooling.
In October 2021, the Company entered into amended and restated term notes for all three term notes assumed in the acquisition of Global Cooling. Pursuantwith two lenders (the “Global Cooling Term Note Agreements”). The principal amount borrowed pursuant to the loan agreements, Global Cooling Term Note Agreements (the “Global Cooling Term Notes”) consisted of an aggregate $4.6 million, with one lender provided providing two term notes in the amounts of $1.4 million and $1.4 million. Amillion and a separate lender provided providing one term note in the amount of $1.8 million. The maturity dates for these notes are July 17, 2024, September 7, 2024, and December 18, 2027, respectively. All three term notes bear interest at a fixed rate of 4%, arewere interest-only with one balloon principal payment at maturity, and cancould be pre-paid without penalty at any time. The Company fully extinguished the term notes with maturity dates of September 7, 2024 and July 17, 2024 on September 20, 2022 and July 17, 2023, respectively. All financial covenants included in the original agreements previously in effect were removed by the amendedGlobal Cooling Term Note Agreements.
On September 20, 2022, the Company and certain of its subsidiaries entered into a term loan
agreements.agreement (the “Loan Agreement”), which provides for up to $60 million in aggregate principal to be drawn. Principal amounts borrowed pursuant to the Loan Agreement (the “Term Loan”) mature on June 1, 2026. The Loan Agreement permitted the Company to borrow up to $30 million upon the initial closing of the transactions contemplated by the Loan Agreement (the “Term Loan Closing”), and provided options to borrow (i) up to $10 million between the Term Loan Closing and June 30, 2023, (ii) up to $10 million upon the achievement of certain revenue milestones by the Company, and (iii) an additional $10 million at the discretion of the lender. The Company borrowed $20 million at the Term Loan Closing and accounts for the Term Loan at cost. As of December 31, 2023, the Company had not drawn additional funding nor had it met the revenue milestones outlined within the Loan Agreement. The Company had until December 31, 2023 to draw an additional $10 million, subject to approval from the lender, and therefore has no additional opportunities under current loan terms to draw upon the Loan Agreement. Payments on the borrowing are interest-only through June 2024, with additional criteria allowing for interest-only payments to continue through June 2025. Tranches borrowed under the term loan agreement bear interest at the Wall Street Journal prime rate plus 0.5%. However, the interest rate is subject to a ceiling that restricts the interest rate for each tranche from exceeding 1.0% above the overall rate applicable to each tranche at their respective funding dates and has a balloon payment due at the earliest of term loan maturity, repayment of the term loan in full, or termination of the loan agreement at $1.2 million. As of December 31, 2023 the implied interest rate of the Term Loan is 6.7% and the implied value of the Term Loan is $20.3 million. The term loan agreement contains customary representations and warranties as well as customary affirmative and negative covenants. As of December 31, 2023, the Company is in compliance with the covenants set forth in the Loan Agreement. In the event that borrowings under the Loan Agreement exceed $20 million, the Company will become subject to financial covenants.
Long-term debt consisted of the following as of
December 31, 2021 2023 and
2020:| | | | | | | | December 31, | |
(In thousands) | Maturity Date | | Interest Rate | | | 2021 | | | 2020 | |
2022 term loan 1 | Sep-24 | | | 4.0 | % | | $ | 1,750 | | | $ | 0 | |
2022 term loan 2 | Various | | | 4.0 | % | | | 2,813 | | | | 0 | |
Insurance premium financing | Apr-22 | | | 4.0 | % | | | 373 | | | | 0 | |
Paycheck Protection Program loan | May-22 | | | 1.0 | % | | | 0 | | | | 295 | |
Freezer equipment loan | Dec-25 | | | 5.7 | % | | | 612 | | | | 365 | |
Manufacturing equipment loans | Oct-25 | | | 5.7 | % | | | 355 | | | | 439 | |
Freezer installation loan | Various | | | 6.3 | % | | | 1,334 | | | | 156 | |
Other loans | Various | | Various | | | | 9 | | | | 14 | |
Total debt, excluding unamortized debt issuance costs | | | | | | | 7,246 | | | | 1,269 | |
Less: unamortized debt issuance costs | | | | | | | (31 | ) | | | 0 | |
Total debt | | | | | | | 7,215 | | | | 1,269 | |
Less: current portion of debt | | | | | | | (862 | ) | | | (614 | ) |
Total long-term debt | | | | | | $ | 6,353 | | | $ | 655 | |
2022:
| | | | | | | | | | | | | | | | | | | | | | | |
| | | | | December 31, |
| (In thousands) | Maturity Date | | Interest Rate | | 2023 | | 2022 |
| Global Cooling Term Notes | Various | | 4.0 | % | | 2,596 | | | 2,896 | |
| Term Loan | Jun-26 | | 7.0 | % | | 20,000 | | | 20,000 | |
| Insurance premium financing | Jul-24 | | 8.3 | % | | 1,348 | | | 1,074 | |
| Freezer equipment loan | Dec-25 | | 5.7 | % | | 317 | | | 466 | |
| Manufacturing equipment loans | Oct-25 | | 5.7 | % | | 172 | | | 266 | |
| Freezer installation loan | Various | | 6.3 | % | | 807 | | | 1,078 | |
| Other loans | Various | | Various | | 2 | | | 6 | |
| Total debt, excluding unamortized debt issuance costs | | | | | 25,242 | | | 25,786 | |
| Less: unamortized debt issuance costs | | | | | (98) | | | (179) | |
| Total debt | | | | | 25,144 | | | 25,607 | |
| Less: current portion of debt | | | | | (6,833) | | | (1,814) | |
| Total long-term debt | | | | | $ | 18,311 | | | $ | 23,793 | |
The
2022 term loansTerm Loan is secured by substantially all assets of BioLife, SAVSU, CBS, SciSafe, Global Cooling and Sexton, other than intellectual property. The Global Cooling Term Notes are secured by substantially all assets of Global
Cooling.Cooling and is effectively subordinated to the security interest established by the Loan Agreement. Equipment loans are secured by the financed equipment.
As of
December 31, 2021, 2023, the scheduled maturities of loans payable for each of the next
five years and thereafter were as follows:
(In thousands) | | Amount | |
2022 | | $ | 862 | |
2023 | | | 813 | |
2024 | | | 2,294 | |
2025 | | | 543 | |
2026 | | | 221 | |
Thereafter | | | 2,513 | |
Total debt, excluding unamortized debt issuance costs | | | 7,246 | |
Less: unamortized debt issuance costs | | | (31 | ) |
Total debt | | $ | 7,215 | |
| | | | | |
| (In thousands) | Amount |
| 2024 | $ | 6,830 | |
| 2025 | 10,500 | |
| 2026 | 5,218 | |
| 2027 | 2,596 | |
| 2028 | — | |
| Thereafter | — | |
| Total | $ | 25,144 | |
6114. Warrants
The following are the domestic and foreign components of the Company's loss before income taxes:
| | | Year Ended December 31, | |
(In thousands) | | 2021 | | | 2020 | | | 2019 | |
Domestic | | $ | (27,317 | ) | | $ | (597 | ) | | $ | (3,198 | ) |
Foreign | | | (436 | ) | | | 0 | | | | 0 | |
Total | | $ | (27,753 | ) | | $ | (597 | ) | | $ | (3,198 | ) |
Income tax benefit consists of the following:
| | | Year Ended December 31, | |
(In thousands) | | 2021 | | | 2020 | | | 2019 | |
Current: | | | | | | | | | | | | |
Federal | | $ | 0 | | | $ | 0 | | | $ | 0 | |
State | | | 0 | | | | 33 | | | | 0 | |
Foreign | | | 9 | | | | 0 | | | | 0 | |
Total current tax provision | | | 9 | | | | 33 | | | | 0 | |
| | | | | | | | | | | | | |
Deferred: | | | | | | | | | | | | |
Federal | | | (17,703 | ) | | | (3,297 | ) | | | (1,541 | ) |
State | | | (2,424 | ) | | | 0 | | | | 0 | |
Foreign | | | 0 | | | | 0 | | | | 0 | |
Total deferred tax benefit | | | (20,127 | ) | | | (3,297 | ) | | | (1,541 | ) |
| | | | | | | | | | | | | |
Income tax benefit | | $ | (20,118 | ) | | $ | (3,264 | ) | | $ | (1,541 | ) |
In the years ended December 31, 2021, 2020, and 2019, income tax benefit included excess tax benefits from stock-based compensation of $10.5 million, $3.2 million, and $2.3 million, respectively.
In connection with the 2021 Global Cooling acquisition, the Company recognized a deferred tax liability estimated to be $24.1 million. As a result, the Company recorded an income tax benefit of $8.0 million for the release of valuation allowance on our existing U.S. deferred tax assets as a result of the offset of the deferred tax liabilities established for intangible assets from the acquisition. In connection with the 2021 Sexton acquisition, the Company recorded a deferred tax liability estimated to be $1.5 million with an offset to goodwill.
In connection with the 2020 SciSafe acquisition, the Company recognized a deferred tax liability of $3.3 million on acquired intangible assets. As a result, the Company recorded an income tax benefit of $3.3 million for the release of valuation allowance on our existing U.S. deferred tax assets as a result of the offset of deferred tax liabilities established for intangible assets from the acquisition.
In connection with the 2019 SAVSU acquisition, the Company recognized a deferred tax liability of $1.5 million on acquired intangible assets. As a result, the Company recorded an income tax benefit of $1.5 million for the release of valuation allowance on our existing U.S. deferred tax assets as a result of the offset of deferred tax liabilities established for intangible assets from the acquisition.
A reconciliation of income taxes computed using the U.S. federal statutory rate to that reflected in operations follows:
| | | Year Ended December 31, | |
| | | 2021 | | | 2020 | | | 2019 | |
Federal statutory tax | | | 21 | % | | | 21 | % | | | 21 | % |
State tax, net of federal benefit | | | 7 | % | | | 39 | % | | | 0 | |
Stock compensation | | | 38 | % | | | 538 | % | | | 74 | % |
Sec. 162(m) limitation on executive compensation | | | (12 | %) | | | (35 | %) | | | (17 | %) |
Fair value change in contingent consideration | | | (2 | %) | | | (81 | %) | | | 0 | |
Fair value change in warrant liability | | | 0 | | | | 127 | % | | | (82 | %) |
Transaction costs | | | (1 | %) | | | (6 | %) | | | (4 | %) |
Gain on stock acquisition | | | 5 | % | | | 0 | | | | 64 | % |
Tax credits | | | 0 | | | | 12 | % | | | 5 | % |
Change in valuation allowance | | | 21 | % | | | 35 | % | | | (5 | %) |
Book loss on equity method investment | | | 0 | | | | 0 | | | | (5 | %) |
Expired net operating losses | | | (5 | %) | | | (100 | %) | | | (5 | %) |
Other | | | 0 | | | | (3 | %) | | | 1 | % |
Total | | | 72 | % | | | 547 | % | | | 47 | % |
The principal components of the Company’s net deferred tax assets are as follows as of December 31, 2021 and 2020:
(In thousands) | | 2021 | | | 2020 | |
Deferred tax assets related to: | | | | | | | | |
Net operating loss carryforwards | | $ | 27,500 | | | $ | 12,314 | |
Stock-based compensation | | | 2,066 | | | | 1,678 | |
Accruals and reserves | | | 2,902 | | | | 427 | |
Inventory | | | 236 | | | | 142 | |
Lease liabilities | | | 4,198 | | | | 2,247 | |
Tax credit carryforward | | | 594 | | | | 225 | |
Other | | | 318 | | | | 48 | |
Total deferred tax assets | | | 37,814 | | | | 17,081 | |
| | | | | | | | | |
Deferred tax liabilities related to: | | | | | | | | |
Intangibles | | | (35,241 | ) | | | (5,025 | ) |
Right-of-use assets | | | (4,070 | ) | | | (2,261 | ) |
Fair value change in investments | | | (294 | ) | | | (287 | ) |
Fixed assets | | | (1,203 | ) | | | (959 | ) |
Other | | | 0 | | | | (51 | ) |
Total deferred tax liabilities | | | (40,808 | ) | | | (8,583 | ) |
| | | | | | | | | |
Net deferred tax (liabilities) assets before valuation allowance | | | (2,994 | ) | | | 8,498 | |
Less: valuation allowance | | | (2,493 | ) | | | (8,498 | ) |
Net deferred tax liabilities | | $ | (5,487 | ) | | $ | 0 | |
Realization of deferred tax assets is dependent upon the generation of future taxable income, if any, the timing and amount of which are uncertain. The assessment regarding whether a valuation allowance is required on deferred tax assets considers the evaluation of both positive and negative evidence when concluding whether it is more likely than not that deferred tax assets are realizable. The valuation allowance recorded as of December 31, 2021 and 2020 primarily relates to deferred tax assets for net operating loss carryforwards.
The changes in the valuation allowance for deferred tax assets were as follows:
(In thousands) | | 2021 | | | 2020 | | | 2019 | |
Balance at January 1 | | $ | 8,498 | | | $ | 8,706 | | | $ | 8,345 | |
Deferred tax liabilities assumed through acquisitions | | | (8,498 | ) | | | (3,297 | ) | | | (1,541 | ) |
Charged to income tax expense | | | 2,493 | | | | 3,089 | | | | 1,902 | |
Balance at December 31 | | $ | 2,493 | | | $ | 8,498 | | | $ | 8,706 | |
As of December 31,January 1, 2021, the Company had U.S. federal net operating loss (“NOL”) carryforwards of approximately $120.6 million. Approximately $39.5 million of NOL will expire from 2023 through 2037, and approximately $81.1 million of NOL will be carried forward indefinitely. The NOL carryforwards are subject to an annual limitation in the event of certain cumulative changes in the ownership interest. This limited the amount of tax attributes that can be utilized annually to offset future taxable income or tax liabilities. Subsequent ownership changes may further affect the limitation in future years.
The Company determines its uncertain tax positions based on a determination of whether and how much of a tax benefit taken by the Company in its tax filings or positions is more likely than not to be sustained upon examination by the relevant income tax authorities.
A reconciliation of the beginning and ending balances of uncertain tax positions in the years ended December 31, 2021 and 2020 is as follows:
(In thousands) | | 2021 | | | 2020 | |
| Balance as of January 1 | | $ | 96 | | | $ | 0 | |
Increase related to prior year tax positions | | | - | | | | 36 | |
Increase related to current year tax positions | | | 159 | | | | 60 | |
Balance as of December 31 | | $ | 255 | | | $ | 96 | |
The Company did not have any uncertain tax positions or changes in uncertain tax positions as of or in the year ended December 31, 2019. The Company is generally subject to examination by U.S. federal and local income tax authorities for all tax years in which loss carryforward is available, which includes 2003 through 2021.
In March 2014, pursuant to a to a registered public offering and note conversion agreement with certain note holders, the Company issuedthere were 79,100 warrants to purchase 6,910,283 shares ofthe Company's common stock at $4.75 per share. The warrants had an original expiration date of March 2021.
outstanding. In May 2016, in connection with a credit facility, the Company issued a warrant to purchase 550,000 shares of common stock at $1.75 per share. The warrant was immediately exercisable and had an original expiration date of May 2021.
In May 2020, the Company entered into separate warrant exercise agreements with WAVI Holding AG and Taurus4757 GmbH pursuant to which the warrant holders immediately exercised their respective warrants via a “cashless” exercise as agreed to by the Company. As a result of the cashless exercise, the Company issued an aggregate of 2,747,970 shares of Company common stock upon cashless exercise of an aggregate of 3,871,405 warrants.
In March 2021, all remaining outstanding warrants were exercised via a “cashless” exercise. As a result of the cashless exercise, the Company issued an aggregate of 70,030 shares of Company common stock upon cashless exercise of an aggregate of 79,100 warrants.
stock.
The following table summarizes warrant activity for the year ended December 31, 2021:
| | | | | | | | | | | |
| 2021 |
| Shares | | Wtd. Avg. Exercise Price |
| Outstanding at beginning of year | 79,100 | | $ | 4.75 | |
| Exercised | (79,100) | | 4.75 | |
| Outstanding and exercisable at end of year | — | | $ | — | |
There was no warrant activity during the years ended
December 31, 2021, 2020,2023 and
2019:| | | 2021 | | | 2020 | | | 2019 | |
| | | Shares | | | Wtd. Avg. Exercise Price | | | Shares | | | Wtd. Avg. Exercise Price | | | Shares | | | Wtd. Avg. Exercise Price | |
Outstanding at beginning of year | | | 79,100 | | | $ | 4.75 | | | | 3,959,005 | | | $ | 4.33 | | | | 4,080,005 | | | $ | 4.35 | |
Exercised | | | (79,100 | ) | | | 4.75 | | | | (3,879,905 | ) | | | 4.33 | | | | (121,000 | ) | | | 4.75 | |
Outstanding and exercisable at end of year | | | 0 | | | $ | 0 | | | | 79,100 | | | $ | 4.75 | | | | 3,959,005 | | | $ | 4.33 | |
10.
| Stock-based compensation
|
15. Stock-based compensation
Our stock-based compensation programs are long-term retention programs that are intended to attract, retain, and provide incentives for talented employees, officers, and directors, and to align stockholder and employee interests.
Compensation expense associated with equity-based awards is recognized on a straight-line basis over the requisite service period, with awards generally vesting over a 4 year period, and forfeitures recognized as incurred. We have the following stock-based compensation plans and programs:
During
2013, we adopted the
2013 Performance Incentive Plan (the
“2013“2013 Plan”), which
allowsallowed us to grant options or restricted stock awards to all employees, including executive officers, outside consultants and non-employee directors. An aggregate of 3.1 million shares of common stock
werewas initially reserved for issuance under the
2013 Plan. In
May 2017, July 2020, and June 2021, and June 2022, the shareholders approved an increase in the number of shares available for issuance to 4.1 million shares, 5.0 million shares,
6.5 million shares, and
6.58.5 million shares, respectively. As of
April 25, 2023, the 2013 Plan expired as to future awards in accordance with its terms. As of December 31, 2021, 2023, there were outstanding options to purchase
589,000217,000 shares of
Companythe Company’s common stock and
1.41.6 million unvested restricted stock awards outstanding under the
2013 Plan.
On July 21, 2023, our stockholders approved the 2023 Omnibus Performance Incentive Plan (the "2023 Plan"). The
Company also2023 Plan allows us to grant equity awards to employees, directors, and outside consultants. An aggregate of 4.2 million shares of common stock were initially reserved for issuance under the 2023 Plan, plus any shares subject to awards under the 2013 Plan that were outstanding as of July 21, 2023, and which are subsequently forfeited or lapsed and not issued
outside any approved compensation plans, non-incentive stock options.under the 2013 Plan. As of
December 31, 2021, 2023, there were
36,000 such options1.2 million unvested restricted stock awards outstanding
which were fully vested prior to 2019.under the 2023 Plan.
When options and warrants are exercised, it is the Company’s policy to issue new shares.
Service vesting-based stock options
The following is a summary of service vesting-based stock option activity for the year ended
December 31, 2021 2023 and
2020,2022, and the status of service vesting-based stock options outstanding as of
December 31, 2021 2023 and
2020:| | | 2021 | | | 2020 | |
| | | Shares | | | Wtd. Avg. Exercise Price | | | Shares | | | Wtd. Avg. Exercise Price | |
Outstanding as of beginning of year | | | 844,455 | | | $ | 2.00 | | | | 1,570,455 | | | $ | 1.96 | |
Exercised | | | (183,064 | ) | | | 1.61 | | | | 0 | | | | 0 | |
Forfeited | | | (1,146 | ) | | | 5.69 | | | | (726,000 | ) | | | 1.91 | |
Expired | | | (35,714 | ) | | | 1.73 | | | | 0 | | | | 0 | |
Outstanding as of end of year | | | 624,531 | | | $ | 2.13 | | | | 844,455 | | | $ | 2.00 | |
| | | | | | | | | | | | | | | | | |
Stock options exercisable at year end | | | 624,531 | | | $ | 2.13 | | | | 832,478 | | | $ | 1.98 | |
| | | | | | | | | | | | | | | | | | | | | | | |
| 2023 | | 2022 |
| Shares | | Wtd. Avg.
Exercise Price | | Shares | | Wtd. Avg.
Exercise Price |
| Outstanding as of beginning of year | 456,293 | | $ | 2.17 | | | 624,531 | | $ | 2.13 | |
| Exercised | (239,043) | | 2.12 | | | (161,646) | | 2.00 | |
| Expired | — | | | — | | | (6,592) | | 3.22 | |
| Outstanding at end of year | 217,250 | | $ | 2.21 | | | 456,293 | | $ | 2.17 | |
| | | | | | | |
| Stock options exercisable at year end | 217,250 | | $ | 2.21 | | | 456,293 | | $ | 2.17 | |
We recognizeddid not recognize stock compensation expense related to service-based options of $25,000, $119,000, and $370,000 during the years ended December 31, 2021, 2020,2023 and 2019.2022. We recognized $25,000 in stock compensation expense related to service-based options during the year ended December 31, 2021. As of December 31, 2021, 2023, there was $21.9$3.1 million of aggregate intrinsic value of outstanding service vesting-based stock options, including $21.9$3.1 million of aggregate intrinsic value of exercisable service vesting-based stock options. Intrinsic value is the total pretax intrinsic value for all “in-the-money” options (i.e., the difference between the Company’s closing stock price on the last trading day of the year and the exercise price, multiplied by the number of
shares) that would have been received by the option holders had all option holders exercised their options on
December 31, 2021. 2023. This amount will change based on the fair market value of the Company’s stock. Intrinsic value of service vesting-based awards exercised during the years ended
December 31, 2023, 2022, and 2021 2020, and 2019was
$6.9$3.9 million,
$13.1$4.1 million, and
$7.1$6.9 million, respectively. There were
0no service based-vesting options granted during the years ended
December 31, 2021, 2020,2023, 2022, and
2019.2021. The weighted average remaining contractual life of service vesting-based options outstanding and exercisable as of
December 31, 2021 2023 is
3.22.1 years. There were
0no unrecognized compensation costs for service vesting-based stock options as of
December 31, 2021.2023.
The following table summarizes information about service vesting-based stock options outstanding as of
December 31, 2021:Range of Exercise Prices | | | Number Outstanding as of December 31, 2021 | | | Weighted Average Remaining Contractual Life | | | Weighted Average Exercise Price | |
| $1.00 | - | 1.50 | | | | 26,428 | | | | 1.05 | | | $ | 1.38 | |
| $1.51 | - | 2.00 | | | | 290,760 | | | | 3.27 | | | | 1.87 | |
| $2.01 | - | 2.50 | | | | 265,775 | | | | 3.35 | | | | 2.06 | |
| $2.51 | - | 8.60 | | | | 41,568 | | | | 3.75 | | | | 4.86 | |
| | | | | | | 624,531 | | | | 3.24 | | | $ | 2.13 | |
2023:
| | | | | | | | | | | | | | | | | | | | |
| Range of Exercise Prices | | Number Outstanding at
December 31, 2023 | | Weighted Average
Remaining Contractual Life | | Weighted Average Exercise
Price |
| $1.00 - 1.50 | | 2,000 | | 2.85 | | $ | 1.49 | |
| $1.51 - 2.00 | | 116,500 | | 2.32 | | 1.89 | |
| $2.01 - 2.50 | | 84,500 | | 1.36 | | 2.07 | |
| $2.51 - 8.60 | | 14,250 | | 3.92 | | 5.69 | |
| | 217,250 | | 2.06 | | $ | 2.21 | |
Performance-based stock options
The Company’s Board of Directors implemented a Management Performance Bonus Plan for 2017. Based on achieving varying levels of specified revenue for the year ending December 31, 2017, up to 1,000,000 options to purchase shares of the Company’s common stock were available for vesting. The options had an exercise price of $1.64 and vested if revenue levels for 2017 were met. If the minimum performance targets were not achieved,
There was no
options would have vested. On February 27, 2018, the Company’s Board of Directors determined that the specified revenue target had been achieved. Accordingly, 999,997 options to purchase shares of the Company’s common stock vested in 2017 and 2018.The following is a summary of performance-based stock option grant activity under our stock option plans forduring the yearsyear ended December 31, 2021 and 2020, and the status of performance-based stock options outstanding as of December 31, 2021 and 2020:
| | | 2021 | | | 2020 | |
| | | Shares | | | Wtd. Avg. Exercise Price | | | Shares | | | Wtd. Avg. Exercise Price | |
Outstanding as of beginning of year | | | 686,001 | | | $ | 1.64 | | | | 737,497 | | | $ | 1.64 | |
Exercised | | | (686,001 | ) | | | 1.64 | | | | (51,496 | ) | | | 1.64 | |
Outstanding as of end of year | | | 0 | | | $ | 0 | | | | 686,001 | | | $ | 1.64 | |
| | | | | | | | | | | | | | | | | |
Stock options exercisable as of year end | | | 0 | | | $ | 0 | | | | 686,001 | | | $ | 1.64 | |
NaN2023.
No stock compensation expense was recognized during the years ended
December 31, 2021, 2020,2023, 2022, and
20192021 related to performance-based options. The intrinsic value of performance-based awards exercised during the years ending
December 31, 2023, 2022, and 2021 2020,was zero, zero, and
2019 was $27.4
million, $1.3 million, and $3.7 million, respectively. There were
0no stock options granted to employees and non-employee directors in the years ending
December 31, 2021, 2020,2023, 2022, and
2019.2021.
Restricted stock
Service vesting-based restricted stock
The following is a summary of service vesting-based restricted stock activity for the years ended
December 31, 2021 2023 and
2020,2022, and the status of unvested service vesting-based restricted stock outstanding as of
December 31, 2021 2023 and
2020:| | | 2021 | | | 2020 | |
| | | Shares | | | Wtd. Avg. Grant Date Fair Value | | | Shares | | | Wtd. Avg. Grant Date Fair Value | |
Outstanding as of beginning of year | | | 930,854 | | | $ | 19.31 | | | | 429,399 | | | $ | 13.25 | |
Granted | | | 801,484 | | | | 47.20 | | | | 717,267 | | | | 20.88 | |
Granted in lieu of cash | | | 0 | | | | 0 | | | | 34,154 | | | | 9.18 | |
Vested | | | (378,502 | ) | | | 19.31 | | | | (208,858 | ) | | | 11.32 | |
Forfeited | | | (141,053 | ) | | | 36.95 | | | | (41,108 | ) | | | 15.47 | |
Non-vested as of year end | | | 1,212,783 | | | $ | 37.48 | | | | 930,854 | | | $ | 19.31 | |
2022:
| | | | | | | | | | | | | | | | | | | | | | | |
| 2023 | | 2022 |
| Shares | | Wtd. Avg. Grant
Date Fair Value | | Shares | | Wtd. Avg. Grant
Date Fair Value |
| Outstanding as of beginning of year | 1,879,215 | | $ | 28.94 | | | 1,212,783 | | $ | 37.48 | |
| Granted | 1,907,101 | | 13.12 | | | 1,373,909 | | 25.26 | |
| Vested | (1,237,221) | | 24.97 | | | (569,535) | | 35.51 | |
| Forfeited | (236,197) | | 25.88 | | | (137,942) | | 40.19 | |
| Non-vested at year end | 2,312,898 | | $ | 18.32 | | | 1,879,215 | | $ | 28.94 | |
On
November 4, 2021, the Board of Directors approved to modify certain restricted stock awards that were awarded to
one executive that otherwise would have expired upon the executive’s intended retirement in early
2023. The modification accelerated the vesting of the awards to vest equally over
four quarters in the year ended
December 31, 2022. We recorded incremental stock-based compensation expense of $666,000 in the year ended
December 31, 2021 for this stock option modification.
The aggregate fair value of the service vesting-based awards granted during the years ended December 31, 2023, 2022, and 2021 2020, and 2019was $37.8$25.0 million, $15.3$34.7 million, and $5.3$37.8 million, respectively. The aggregate fair value of the service vesting-basedvesting-
based awards that vested during the years ended December 31, 2023, 2022, and 2021 2020,was $20.5 million, $12.6 million, and2019 was $15.9 million, $4.5respectively.
On October 19, 2023, Michael Rice, the Chief Executive Officer at that time, announced his resignation from the company. In accordance with his separation agreement, all unvested stock grants, excluding the 99,038 market-based restricted stock units awarded to him January 3, 2023 and the 70,094 market-based restricted stock units awarded to him on February 24, 2022 by the board of directors, were accelerated and vested as of the date of his separation. The Company recognized stock compensation expense in connection with the acceleration of his unvested stock grants of $1.7 million,
and $1.9 million, respectively.On March 25, 2020, representing 150,155 shares.
During the months of August through December 2023, our board of directors granted 34,15422,675 restricted stock awards, based on a fair value on the grant date of $9.18 per share,units in lieu of the 2019 cash performance bonussalary for our executive compensation plan.leadership. The awardawards vested in full on September 25, 2020 the date of grant, regardless of employment status on that date. Salary expenses incurred in connection with the restricted stock units awarded in lieu of salary totaled $0.2 million. For all specific grant information related to these awards, refer to the Equity Incentive Compensation discussion of Part III within this filing.
During the months of May through August 2022, our board of directors granted 21,566 restricted stock awards in lieu of salary for executive leadership. The awards vested in full on the date of grant, regardless of employment status on that date. All expenses related to these awards were incurred in the year ended
December 31, 2019.2022.
We recognized stock compensation expense of
$12.7$25.2 million,
$3.0$21.0 million, and
$1.2$12.7 million related to service vesting-based awards during the years ended
December 31, 2021, 2020,2023, 2022, and
2019,2021, respectively. As of
December 31, 2021, 2023, there was
$38.9$37.8 million in unrecognized compensation costs related to service vesting-based awards. We expect to recognize those costs over
3.02.7 years.
Performance-based restricted stock
On March 25, 2020, the Company granted 82,805 shares of performance-based stock to its executives in the form of restricted stock. The shares granted contain a performance condition based on several Company metrics related to 2020 performance. The grant date fair value of this award was $9.18 per share. The fair value of this award was expensed on a straight-line basis over the requisite service period ending on December 31, 2020.
The following is a summary of performance-based restricted stock activity for the years ended December 31, 2021 and 2020:
| | | 2021 | | | 2020 | |
| | | Shares | | | Wtd. Avg. Grant Date Fair Value | | | Shares | | | Wtd. Avg. Grant Date Fair Value | |
Outstanding as of beginning of year | | | 0 | | | $ | 0 | | | | 0 | | | $ | 0 | |
Granted | | | 0 | | | | 0 | | | | 82,805 | | | | 9.18 | |
Vested | | | 0 | | | | 0 | | | | (82,805 | ) | | | 9.18 | |
Non-vested as of year end | | | 0 | | | $ | 0 | | | | 0 | | | $ | 0 | |
We recognized stock compensation expense of zero, $760,000, and 0 related to performance-based restricted stock awards for the years ended December 31, 2021, 2020, and 2019, respectively. As of December 31, 2021, there were no unrecognized non-cash compensation costs related to performance-based restricted stock awards. Non-cash compensation costs were expensed over the period for which performance was measured.
The aggregate fair value of the performance-based awards granted during the years ended December 31, 2021, 2020, and 2019 was zero, $760,000, and zero, respectively. The aggregate fair value of the performance-based awards that vested during the years ended December 31, 2021, 2020, and 2019 was zero, $2.3 million, and zero, respectively.
Market-based restricted stock
The following is a summary of market-based restricted stock activity under our stock option plan for the years ended
December 31, 2021 2023 and
20202022 and the status of market-based restricted stock outstanding as of
December 31, 2021 2023 and
2020:| | | 2021 | | | 2020 | |
| | | Shares | | | Wtd. Avg. Grant Date Fair Value | | | Shares | | | Wtd. Avg. Grant Date Fair Value | |
Outstanding as of beginning of year | | | 224,774 | | | $ | 19.20 | | | | 123,851 | | | $ | 26.99 | |
Granted | | | 152,665 | | | | 32.50 | | | | 109,140 | | | | 10.95 | |
Vested | | | (231,268 | ) | | | 26.98 | | | | 0 | | | | 0 | |
Forfeited | | | (6,415 | ) | | | 40.65 | | | | (8,217 | ) | | | 27.02 | |
Non-vested as of year end | | | 139,756 | | | $ | 19.86 | | | | 224,774 | | | $ | 19.20 | |
2022:
| | | | | | | | | | | | | | | | | | | | | | | |
| 2023 | | 2022 |
| Shares | | Wtd. Avg. Grant Date Fair
Value | | Shares | | Wtd. Avg. Grant Date Fair
Value |
| Outstanding as of beginning of year | 271,044 | | $ | 30.64 | | | 139,756 | | $ | 19.86 | |
| Granted | 268,738 | | 24.23 | | | 349,568 | | 22.66 | |
| Vested | (30,616) | | 51.65 | | | (218,280) | | 10.95 | |
| Non-vested at year end | 509,166 | | $ | 26.00 | | | 271,044 | | $ | 30.64 | |
On
February 25, 2019 the Company granted 94,247 shares and on April 1, 2019 granted 29,604 shares of market-based stock to its executives in the form of restricted stock. The shares granted contain a market condition based on Total Shareholder Return (“TSR”). The TSR market condition measures the Company’s performance against a peer group. On February 8, 2021, the Company determined the TSR attainment was 200% of the targeted shares, resulting in 115,634 shares being granted and 231,268 shares vesting to current employees of the Company based on our total shareholder return during the period beginning on January 1, 2019 through December 31, 2020 as compared to the total shareholder return of 20 of our peers. The fair value of this award was determined at the grant date using a Monte Carlo simulation with the following assumptions: a historical volatility of 69%, 0% dividend yield and a risk-free interest rate of 2.5%. The historical volatility was based on the most recent 2-year period for the Company and correlated with the components of the peer group. The stock price projection for the Company and the components of the peer group assumes a 0% dividend yield. This is mathematically equivalent to reinvesting dividends in the issuing entity over the performance period. The risk-free interest is based on the yield on the U.S. Treasury Strips as of the Measurement Date with a maturity consistent with the 2-year term associated with the market condition of the award. The fair value of this award of $3.1 million was expensed on a straight-line basis over the grant date to the vesting date of December 31, 2020.On March 25, 2020, the Company granted 109,140 shares of market-based stock to its executives in the form of restricted stock. The shares granted contain a market condition based on TSR. The TSR market condition measures the Company’s performance against a peer group. On February 24, 2022, the Company determined the TSR attainment was 200% of the targeted shares, resulting in 109,140 shares being granted and 218,280 shares vesting to current employees of the Company based on our total shareholder return during the period beginning on January 1, 2020 through December 31, 2021 as compared to the total shareholder return of 20 of our peers. The market-based restricted stock awards will vest as to between 0% and 200% of the number of restricted shares granted to each recipient based on our total shareholder return during the period beginning on January 1, 2020 through December 31, 2021 as compared to the total shareholder return of 20 of our peers. The fair value of this award was determined at the grant date using a Monte Carlo simulation with the following assumptions: a historical volatility of 78%, 0% dividend yield and a risk-free interest rate of 0.3%. The historical volatility was based on the most recent 2-year period for the Company and correlated with the components of the peer group. The stock price projection for the Company and the components of the peer group assumes a 0% dividend yield. This is mathematically equivalent to reinvesting dividends in the issuing entity over the performance period. The risk-free interest is based on the yield on the U.S. Treasury Strips as of the Measurement Date with a maturity consistent with the 2-year2-year term associated with the market condition of the award. The fair value of this award of $1.2 million was expensed on a straight-line basis over the grant date to the vesting date of December 31, 2021.
On
February 8, 2021, the Company granted 30,616 shares of market-based stock to its executives in the form of restricted stock. The shares granted contain a market condition based on TSR. The TSR market condition measures the Company’s performance against a peer group.
On January 3, 2023, the Company determined the TSR attainment was 100% of the targeted shares, resulting in 30,616 shares being granted and 30,616 shares vesting to current employees of the Company based on our total shareholder return during the period beginning on January 1, 2021 through December 31, 2022 as compared to the total shareholder return of 20 of our peers. The market-based restricted stock awards will vest as to between 0% and 200% of the number of restricted shares granted to each recipient based on our total shareholder return during the period beginning on
January 1, 2021 through
December 31, 2022 2023 as compared to the total shareholder return of
20 of our peers. The fair value of this award was determined using a Monte Carlo simulation with the following assumptions: a historical volatility of 68%, 0% dividend yield, and a risk-free interest rate of 0.1%. The historical volatility was based on the most recent 2-year period for the Company and correlated with the components of the peer group. The stock price projection for the Company and the components of the peer group assumes a
0% dividend yield. This is mathematically equivalent to reinvesting dividends in the issuing entity over the performance period. The risk-free interest rate is based on the yield on the U.S. Treasury Strips as of the Measurement Date with a maturity consistent with the 2-year term associated with the market condition of the award. The fair value of this award of $1.3 million is being expensed on a straight-line basis over the grant date to the vesting date of
December 31, 2022.On May 3, 2021, February 24, 2022, the Company granted 6,415240,428 shares of market-based stock to one executiveits executives in the form of restricted stock. The shares granted contain a market condition based on TSR. The TSR market condition measures the Company’s performance against a peer group. The market-based restricted stock awards will vest as to between 0% and 200% of the number of restricted shares granted to theeach recipient based on our total shareholder return during the period beginning on January 1, 2021 2022 through December 31, 2022 2023 as compared to the total shareholder return of 20 of our peers. The fair value of this award was determined using a Monte Carlo simulation with the following assumptions: a historical volatility of 68%63%, 0% dividend yield, and a risk-free interest rate of 0.2%1.5%. The historical volatility was based on the most recent 2-year period for the Company and correlated with the components of the peer group. The stock price projection for the Company and the components of the peer group assumes a 0% dividend yield. This is mathematically equivalent to reinvesting dividends in the issuing entity over the performance period. The risk-free interest rate is based on the yield on the U.S. Treasury Strips as of the Measurement Date with a maturity consistent with the 2-year term associated with the market condition of the award. In November 2021, The fair value of this award of $6.7 million is being expensed on a straight-line basis over the executive departedgrant date to the company and, as a result, forfeited thesevesting date of December 31, 2023.
On January 3, 2023, the Company granted 268,738 shares
resulting in 0 expense being recognizedof market-based stock to its executives in the
year ended form of restricted stock. The shares granted contain a market condition based on TSR. The TSR market condition measures the Company’s performance against a peer group. The market-based restricted stock awards will vest as to between 0% and 200% of the number of restricted shares granted to each recipient based on our total shareholder return during the period beginning on January 1, 2023 through December 31, 2021 2024 as compared to the total shareholder return of 20 of our peers. The fair value of this award was determined using a Monte Carlo simulation with the following assumptions: a historical volatility of 78%, 0% dividend yield, and a risk-free interest rate of 4.4%. The historical volatility was based on the most recent 2-year period for
the Company and correlated with the components of the peer group. The stock price projection for the Company and the components of the peer group assumes a 0% dividend yield. This is mathematically equivalent to reinvesting dividends in the issuing entity over the performance period. The risk-free interest rate is based on the yield on the U.S. Treasury Strips as of the Measurement Date with a maturity consistent with the 2-year term associated with the market condition of the award. The fair value of this
award.
Tableaward of Contents$6.8 million is being expensed on a straight-line basis over the grant date to the vesting date of December 31, 2024.We recognized stock compensation expense of
$1.4$6.5 million,
$2.1$4.3 million, and
$1.5$1.4 million related to market-based restricted stock awards for the years ended
December 31, 2021, 2020,2023, 2022, and
2019.2021. As of
December 31, 2021, 2023, there was
$834,000$3.3 million in unrecognized non-cash compensation costs related to market-based restricted stock awards expected to vest. We expect to recognize those costs over
1.01 year.
The aggregate fair value of the market-based awards granted during the years ended
December 31, 2023, 2022, and 2021 2020, and 2019was
$1.8$6.5 million,
$1.2$6.7 million, and
$3.3$1.8 million, respectively. The aggregate fair value of the market-based awards that vested during the years ended
December 31, 2023, 2022, and 2021 2020,was $0.7 million, $5.0 million, and
2019 was $10.2 million,
zero, and zero, respectively.
Total stock compensation expense
We recorded total stock compensation expense for the years ended December 31, 2023, 2022, and 2021, as follows:
| | | | | | | | | | | | | | | | | |
| 2023 | | 2022 | | 2021 |
| Research and development costs | $ | 5,631 | | | $ | 3,176 | | | $ | 1,906 | |
| Sales and marketing costs | 5,620 | | | 3,649 | | | 1,788 | |
| General and administrative costs | 14,937 | | | 14,066 | | | 8,061 | |
| Cost of revenue | 5,482 | | | 4,443 | | | 2,201 | |
| Total | $ | 31,670 | | | $ | 25,334 | | | $ | 13,956 | |
16. Income taxes
The following are the domestic and foreign components of the Company's loss before income taxes:
| | | | | | | | | | | | | | | | | |
| Year Ended December 31, |
| (In thousands) | 2023 | | 2022 | | 2021 |
| Domestic | $ | (67,296) | | | $ | (146,091) | | | $ | (28,590) | |
| Foreign | 1,038 | | | 1,264 | | | (436) | |
| Total | $ | (66,258) | | | $ | (144,827) | | | $ | (29,026) | |
Income tax expense (benefit) consists of the following:
| | | | | | | | | | | | | | | | | |
| Year Ended December 31, |
| (In thousands) | 2023 | | 2022 | | 2021 |
| Current: | | | | | |
| Federal | $ | — | | | $ | — | | | $ | — | |
| State | 46 | | | 11 | | | — | |
| Foreign | 185 | | | 205 | | | 9 | |
| Total current tax provision | 231 | | | 216 | | | 9 | |
| | | | | |
| Deferred: | | | | | |
| Federal | (62) | | | (2,924) | | | (17,703) | |
| State | — | | | (2,314) | | | (2,424) | |
| Foreign | — | | | — | | | — | |
| Total deferred tax benefit | (62) | | | (5,238) | | | (20,127) | |
| | | | | |
| Income tax expense (benefit) | $ | 169 | | | $ | (5,022) | | | $ | (20,118) | |
In the year ended December 31, 2021,
2020,income tax benefit included excess tax benefits from stock-based compensation of $10.5 million. The tax benefit for the years ended December 31, 2023 and
2019, as follows:| | | 2021 | | | 2020 | | | 2019 | |
Research and development costs | | $ | 1,906 | | | $ | 1,012 | | | $ | 571 | |
Sales and marketing costs | | | 1,788 | | | | 852 | | | | 711 | |
General and administrative costs | | | 8,061 | | | | 3,518 | | | | 1,584 | |
Cost of revenue | | | 2,201 | | | | 599 | | | | 177 | |
Total | | $ | 13,956 | | | $ | 5,981 | | | $ | 3,043 | |
11.
| Commitments and contingencies
|
Employment agreements
We have employment agreementsIn connection with certain key employees. None of these employment agreements is for a definitive period, but rather each will continue indefinitely until terminated in accordance with its terms. The agreements provide for a base annual salary, payable in monthly (or shorter) installments. Under certain conditions and for certain of these officers, we may be required to pay additional amounts upon terminating the officer or upon the officer resigning for good reason.
Litigation
From time to time,2021 Global Cooling acquisition, the Company is subjectrecognized a deferred tax liability estimated to various legal proceedings that arise in the ordinary course of business, none of which are currently material to the Company’s business. The Company’s industry is characterized by frequent claims and litigation, including claims regarding intellectual property.be $24.1 million. As a result, the Company recorded an income tax benefit of $8.0 million for the release of valuation allowance on our existing U.S. deferred tax assets as a result of the offset of the deferred tax liabilities established for intangible assets from the acquisition. In connection with the 2021 Sexton acquisition, the Company recorded a deferred tax liability estimated to be $1.5 million with an offset to goodwill.
A reconciliation of income taxes computed using the U.S. federal statutory rate to that reflected in operations follows:
| | | | | | | | | | | | | | | | | |
| Year Ended December 31, |
| 2023 | | 2022 | | 2021 |
| Federal statutory tax | 21 | % | | 21 | % | | 21 | % |
| State tax, net of federal benefit | 4 | % | | 3 | % | | 7 | % |
| Stock compensation | (2 | %) | | — | | 36 | % |
| Sec. 162(m) limitation on executive compensation | (2 | %) | | (1 | %) | | (11 | %) |
| Fair value change in contingent consideration | 1 | % | | 1 | % | | (2 | %) |
| Transaction costs | — | | — | | (1 | %) |
| Gain on stock acquisition | — | | — | | 5 | % |
| Tax credits | 1 | % | | 1 | % | | — |
| Change in valuation allowance | (25 | %) | | (21 | %) | | 20 | % |
| Expired net operating losses | — | | — | | (5 | %) |
| Gain on escrow settlement | 2 | % | | — | | — | % |
| Other | — | | — | | (1 | %) |
| Total | — | | | 4 | % | | 69 | % |
The principal components of the Company’s net deferred tax assets are as follows as of December 31, 2023 and 2022:
| | | | | | | | | | | |
| (In thousands) | 2023 | | 2022 |
| Deferred tax assets related to: | | | |
| Net operating loss carryforwards | $ | 35,505 | | | $ | 29,102 | |
| Stock-based compensation | 3,008 | | | 3,207 | |
| Accruals and reserves | 3,590 | | | 3,724 | |
| Inventory | 1,408 | | | 425 | |
| Fixed assets | 585 | | | — | |
| Lease liabilities | 3,950 | | | 3,653 | |
| Tax credit carryforward | 2,226 | | | 1,423 | |
| Capitalized research and development | 4,818 | | | 2,405 | |
| Other | 875 | | | 445 | |
| Total deferred tax assets | 55,965 | | | 44,384 | |
| | | |
| Deferred tax liabilities related to: | | | |
| Intangibles | (3,696) | | | (6,150) | |
| Right-of-use assets | (2,500) | | | (3,458) | |
| Fair value change in investments | (440) | | | (447) | |
| Fixed assets | — | | | (1,177) | |
| Total deferred tax liabilities | (6,636) | | | (11,232) | |
| | | |
| Net deferred tax (liabilities) assets before valuation allowance | 49,329 | | | 33,152 | |
| Less: valuation allowance | (49,517) | | | (33,402) | |
| Net deferred tax liabilities | $ | (188) | | | $ | (250) | |
Realization of deferred tax assets is dependent upon the generation of future taxable income, if any, the timing and amount of which are uncertain. The assessment regarding whether a valuation allowance is required on deferred tax assets considers the evaluation of both positive and negative evidence when concluding whether it is more likely than not that
deferred tax assets are realizable. The valuation allowance recorded as of December 31, 2023 and 2022 primarily relates to deferred tax assets for net operating loss carryforwards.
The changes in the valuation allowance for deferred tax assets were as follows:
| | | | | | | | | | | | | | | | | |
| (In thousands) | 2023 | | 2022 | | 2021 |
| Balance at beginning of period | $ | 33,402 | | | $ | 2,993 | | | $ | 8,498 | |
| Deferred tax liabilities assumed through acquisitions | — | | | — | | | (8,498) | |
| Charged to income tax expense | 16,115 | | | 30,409 | | | 2,993 | |
| Balance at end of period | $ | 49,517 | | | $ | 33,402 | | | $ | 2,993 | |
As of December 31, 2023, the Company had U.S. federal net operating loss (“NOL”) carryforwards of approximately $151.9 million. Approximately $39.2 million of NOL will expire from 2024 through 2037, and approximately $112.7 million of NOL will be carried forward indefinitely. The NOL carryforwards may bebecome subject to various legal proceedings from timean annual limitation in the event of certain cumulative changes in the ownership interest. This limited the amount of tax attributes that can be utilized annually to time. offset future taxable income or tax liabilities. Subsequent ownership changes may further affect the limitation in future years.
The Tax Cuts and Jobs Act contained a provision which requires the capitalization of Section 174 costs incurred in years beginning on or after January 1, 2022. Section 174 costs are expenditures which represent research and development costs that are incident to the development or improvement of a product, process, formula, invention, computer software, or technique. This provision changes the treatment of Section 174 costs such that the expenditures are no longer allowed as an immediate deduction but rather must be capitalized and amortized. We have included the impact of this provision, which results in a deferred tax asset of any future litigation cannotapproximately $4.8 million as of December 31, 2023.
The Company determines its uncertain tax positions based on a determination of whether and how much of a tax benefit taken by the Company in its tax filings or positions is more likely than not to be predicted with certainty, and regardlesssustained upon examination by the relevant income tax authorities.
A reconciliation of the
outcome, litigation can have an adverse impact onbeginning and ending balances of uncertain tax positions in the
Company because of defenseyears ended December 31, 2023 and
settlement costs, diversion of management resources and other factors. Management2022 is
not aware of any pending or threatened litigation.Indemnification
As permitted under Delaware law and in accordance with the Company’s bylaws, the Company is required to indemnify its officers and directors for certain errors and occurrences while the officer or director is or was serving in such capacity. as follows:
| | | | | | | | | | | |
| (In thousands) | 2023 | | 2022 |
| Balance at beginning of period | $ | 610 | | | $ | 255 | |
| Increase related to prior year tax positions | 20 | | | 170 | |
| Increase related to current year tax positions | 324 | | | 185 | |
| Balance at end of period | $ | 954 | | | $ | 610 | |
The Company is
also partygenerally subject to
indemnification agreements with its directors. The Company believes the fair value of the indemnification rightsexamination by U.S. federal and
agreementslocal income tax authorities for all tax years in which loss carryforward is
minimal. Accordingly, the Company has not recorded any liabilities for these indemnification rights and agreements as of December 31, 2021.available, which includes 2004 through 2023.17. Acquisitions
68
Sexton acquisition
General terms and effects
On
August 9, 2021, BioLife entered into an Agreement and Plan of Merger (the “Sexton Merger Agreement”) with BLFS Merger Sub, Inc., a Delaware corporation (“Sexton Merger Sub”), Fortis Advisors LLC, in its capacity as the representative of the stockholders of Sexton (the “Sexton Seller Representative”) and Sexton, a Delaware corporation. The acquisition strengthens BioLife’s offerings in the cell and gene therapy and broader biopharma markets.
On September 1, 2021, the Company completed the merger of Sexton Merger Sub with and into Sexton and Sexton became a wholly-ownedwholly owned subsidiary of the Company (the “Sexton Merger”). As consideration for the Sexton Merger (the “Sexton Merger Consideration”), holders of common stock, preferred stock and options of Sexton, other than the Company (collectively,
(collectively, the “Sexton Participating Holders”), are entitled to receive an aggregate of 530,502 newly issued shares of the Company’s common stock, subject to certain post-closing adjustments, of which 477,452 shares of Common Stock were issued to the Sexton Participating Holders at the Closing, and 53,050 shares of Common Stock, or approximately 10% of the Merger consideration, were deposited into an escrow account for indemnification and post-closing purchase price adjustment purposes. Prior to the merger, the Company held preferred stock in Sexton, which was accounted for using a measurement alternative that measures the securities at cost minus impairment, if any, plus or minus changes resulting from observable process changes in orderly transactions for identical or similar investments of the same issuer. The Company accounted for the merger as a step acquisition, which required remeasurement of the Company’s existing ownership in Sexton to fair value prior to completing the acquisition method of accounting. Using step acquisition accounting, the Company increased the value of its existing equity interest to its fair value, resulting in the recognition of a non-cash gain of $6.5 million, which was included in the gain on acquisition of Sexton Biotechnologies, Inc. in the Consolidated Statements of Operations for the year ended
December 31, 2021. The Company utilized a market-based valuation approach to determine the fair value of the existing equity interest based on the total merger consideration offered and the Company’s stock price at acquisition.
Total consideration transferred (in thousands, except number of shares and stock price):
Merger consideration shares | | | 530,502 | |
BioLife stock price (as of September 1, 2021) | | $ | 60.50 | |
Value of issued shares | | $ | 32,095 | |
plus: Fair value of BioLife’s existing investment in Sexton | | $ | 7,951 | |
less: Net working capital adjustment | | $ | (118 | ) |
Merger Consideration | | $ | 39,928 | |
| | | | | |
| Merger consideration shares | 530,502 |
| BioLife stock price (as of September 1, 2021) | $ | 60.50 | |
| Value of issued shares | $ | 32,095 | |
| plus: Fair value of BioLife’s existing investment in Sexton | $ | 7,951 | |
| less: Net working capital adjustment | $ | (118) | |
| Merger Consideration | $ | 39,928 | |
Transaction costs related to the acquisition are expensed as incurred and are
not included in the calculation of consideration transferred.
Fair value of net assets acquired
Under the acquisition method of accounting, the assets acquired and liabilities assumed from Sexton were calculated as of the merger date, at their respective fair values, and consolidated with those of BioLife. The gross contractual accounts receivable acquired in the acquisition was $509,000. Of the acquired accounts receivable, $17,000 is estimated to be
uncollectable.uncollectible. The fair value calculations required critical estimates, including, but
not limited to, future expected cash flows, revenue and expense projections, discount rates, revenue volatility, and royalty rates.
The table below represents the fair value of the net assets acquired and liabilities assumed, which were recorded as of the merger date (amounts in thousands).
Cash | | $ | 1,516 | |
Accounts receivable, net | | | 492 | |
Inventory | | | 1,310 | |
Prepaid expenses and other current assets | | | 670 | |
Property, plant and equipment, net | | | 737 | |
Operating lease right-of-use assets, net | | | 470 | |
Developed technology | | | 4,132 | |
Customer relationships | | | 2,276 | |
Tradenames | | | 2,324 | |
Non-compete agreements | | | 90 | |
Goodwill | | | 28,470 | |
Accounts payable | | | (291 | ) |
Lease liabilities, operating | | | (470 | ) |
Deferred tax liability | | | (1,482 | ) |
Other liabilities | | | (316 | ) |
Fair value of net assets acquired | | $ | 39,928 | |
| | | | | |
| Cash | $ | 1,516 | |
| Accounts receivable, net | 492 | |
| Inventory | 1,310 | |
| Prepaid expenses and other current assets | 670 | |
| Property, plant and equipment, net | 737 | |
| Operating lease right-of-use assets, net | 470 | |
| Developed technology | 4,132 | |
| Customer relationships | 2,276 | |
| Tradenames | 2,324 | |
| Non-compete agreements | 90 | |
| Goodwill | 28,470 | |
| Accounts payable | (291) | |
| Lease liabilities, operating | (470) | |
| Deferred tax liability | (1,482) | |
| Other liabilities | (316) | |
| Fair value of net assets acquired | $ | 39,928 | |
We recorded a measurement period adjustment in the
fourth quarter of the year ended
December 31, 2021 of $198,000 to the fair value of goodwill and the deferred tax liability. This adjustment related to the tax attributes of the business combination.
The fair value of Sexton’s identifiable intangible assets and useful lives are as follows (amounts in thousands, except years):
| | | Fair Value | | | Useful Life (Years) | |
Developed technology | | $ | 4,132 | | | | 5 | - | 9 | |
Customer relationships | | | 2,276 | | | | | 2 | | |
Tradenames | | | 2,324 | | | | | 11 | | |
Non-compete agreements | | | 90 | | | | | 1 | | |
Total identifiable intangible assets | | $ | 8,822 | | | | | | | |
| | | | | | | | | | | |
| Fair Value | | Useful
Life (Years) |
| Developed technology | $ | 4,132 | | | 5 - 9 |
| Customer relationships | 2,276 | | | 2 |
| Tradenames | 2,324 | | | 11 |
| Non-compete agreements | 90 | | | 1 |
| Total identifiable intangible assets | $ | 8,822 | | | |
Fair value measurement methodologies used to calculate the value of any asset can be broadly classified into
one of
three approaches, referred to as the cost, market and income approaches. In any fair value measurement analysis, all
three approaches must be considered, and the approach or approaches deemed most relevant will then be selected for use in the fair value measurement of that asset. The estimated fair values of developed technology were estimated using a multi-period excess earnings approach. The estimated fair values of customer relationships and non-compete agreements were estimated using a “with and without” approach, comparing projected cash flows under scenarios assuming the customer relationships and non-compete agreements were and were
not in place. The estimated fair value of the tradenames is based on the relief from royalty method, which estimates the value of the trade names based on the hypothetical royalty payments that are saved by owning the asset.
Some of the more significant assumptions inherent in the development of intangible asset fair values, from the perspective of a market participant, include, but are
not limited to (i) the amount and timing of projected future cash flows (including revenue and expenses), (ii) the discount rate selected to measure the risks inherent in the future cash flows, (iii) the assessment of the asset’s life cycle, and (iv) the competitive trends impacting the asset.
The goodwill of $28.5 million represents future economic benefits expected to arise from synergies from combining operations and commercial organizations to increase market presence and the extension of existing customer relationships. The goodwill recorded is
not deductible for income tax purposes.
Global Cooling acquisition
General terms and effects
On
March 19, 2021, the Company entered into an Agreement and Plan of Merger (the “GCI Merger Agreement”) with BLFS Merger Subsidiary, Inc., a Delaware corporation (“GCI Merger Sub”), Global Cooling, a Delaware corporation and Albert Vierling and William Baumel, in their capacity as the representatives of the stockholders of GCI (collectively, the “GCI Seller Representative”). The acquisition strengthens BioLife’s offerings in the cell and gene therapy and broader biopharma markets.
On
May 3, 2021, pursuant to the GCI Merger Agreement, subject to the terms and conditions set forth therein, the transactions contemplated by the GCI Merger Agreement were consummated (the “GCI Closing”), GCI Merger Sub merged with and into GCI (the “GCI Merger” and, together with other transactions contemplated by the GCI Merger Agreement, the “GCI Transactions”), with GCI continuing as the surviving corporation in the GCI Merger and a
wholly-ownedwholly owned subsidiary of the Company. In the GCI Merger, all of the issued and outstanding shares of capital stock of GCI immediately prior to the filing of the Certificate of Merger with the Secretary of State of the State of Delaware (other than those properly exercising any applicable dissenter’s rights under Delaware law) were converted into the right to receive the GCI Merger Consideration (as defined below). The Company paid the GCI Merger Consideration to the holders of common stock and preferred stock of GCI (collectively, the “GCI Stockholders”).
The aggregate merger consideration paid pursuant to the GCI Merger Agreement to the GCI Stockholders was 6,646,870 newly issued shares of common stock, provided, however, that the GCI Merger Consideration otherwise payable to GCI Stockholders is subject to the withholding of the GCI Escrow Shares (as defined below) and is subject to reduction for indemnification obligations. The GCI Merger Consideration allocable to
one GCI stockholder was reduced by 10,400 shares to satisfy an outstanding note receivable of $374,000. In accordance with ASC
805, the Company recognized the settlement of pre-existing relationships in the forms of cash deposits, trade receivables, and trade payables, which are included in the consideration transferred. The GCI Merger Consideration is
not subject to any purchase price adjustments.
Total consideration transferred (in thousands, except number of shares, stock price, and consideration percentage):
BioLife shares outstanding (as of March 19, 2021) | | | 33,401,359 | |
Merger consideration percentage | | | 19.9 | % |
Merger consideration shares | | | 6,646,870 | |
less: Merger consideration shares withheld to satisfy outstanding GCI stockholder obligations to GCI | | | 10,400 | |
Subtotal | | | 6,636,470 | |
BioLife stock price (as of May 3, 2021) | | $ | 35.07 | |
Value of issued shares | | $ | 232,741 | |
plus: Settlement of BioLife prepaid deposits | | $ | 2,152 | |
plus: Net settlement of BioLife accounts receivable | | $ | 16 | |
Merger Consideration | | $ | 234,909 | |
| | | | | |
| BioLife shares outstanding (as of March 19, 2021) | 33,401,359 |
| Merger consideration percentage | 19.9 | % |
| Merger consideration shares | 6,646,870 |
| less: Merger consideration shares withheld to satisfy outstanding GCI stockholder obligations to GCI | 10,400 |
| Subtotal | 6,636,470 |
| BioLife stock price (as of May 3, 2021) | $ | 35.07 | |
| Value of issued shares | $ | 232,741 | |
| plus: Settlement of BioLife prepaid deposits | $ | 2,152 | |
| plus: Net settlement of BioLife accounts receivable | $ | 16 | |
| Merger Consideration | $ | 234,909 | |
Transaction costs related to the acquisition are expensed as incurred and are
not included in the calculation of consideration transferred.
At the GCI Closing, approximately
nine percent (9%) of the GCI Merger Consideration (the “Escrow Shares”, along with any other dividends, distributions or other income on the GCI Escrow Shares, the “GCI Escrow Property”) otherwise issuable to the GCI Stockholders (allocated pro rata among the GCI Stockholders based on the GCI Merger Consideration otherwise issuable to them at the GCI Closing), was deposited into a segregated escrow account in accordance with an escrow agreement to be entered into in connection with the GCI Transactions (the “GCI Escrow Agreement”).
The GCI Escrow Property will be held for a period of up to
twenty-four (24) months after the GCI Closing as the sole and exclusive source of payment for any post-GCI Closing indemnification claims (other than fraud claims), unless earlier released in accordance with the terms of the GCI Escrow Agreement.
Fair value of net assets acquired
Under the acquisition method of accounting, the assets acquired and liabilities assumed from Global Cooling were calculated as of the merger date, at their respective fair values, and consolidated with those of BioLife. The gross contractual accounts receivable acquired in the acquisition was $7.1 million. Of the acquired accounts receivable, $53,000 was estimated to be
uncollectable.uncollectible. The fair value calculations required critical estimates, including, but
not limited to, future expected cash flows, revenue and expense projections, discount rates, revenue volatility, and royalty rates.
The table below represents the fair value of the net assets acquired and liabilities assumed, which were recorded as of the merger date (amounts in thousands).
Cash | | $ | 43 | |
Accounts receivable, net | | | 7,076 | |
Inventory | | | 15,547 | |
Prepaid expenses and other current assets | | | 639 | |
Property, plant and equipment, net | | | 3,512 | |
Operating lease right-of-use assets, net | | | 1,741 | |
Financing lease right-of-use assets, net | | | 114 | |
Long-term deposits and other assets | | | 4 | |
Developed technology | | | 18,140 | |
Customer relationships | | | 7,020 | |
Tradenames | | | 26,640 | |
Non-compete agreements | | | 1,240 | |
In-process research and development | | | 67,440 | |
Goodwill | | | 137,822 | |
Accounts payable | | | (9,837 | ) |
Line of credit | | | (4,231 | ) |
Lease liabilities, operating | | | (1,880 | ) |
Lease liabilities, financing | | | (114 | ) |
Long-term debt | | | (4,410 | ) |
Deferred tax liability | | | (24,133 | ) |
Other liabilities | | | (7,464 | ) |
Fair value of net assets acquired | | $ | 234,909 | |
| | | | | |
| Cash | $ | 43 | |
| Accounts receivable, net | 7,076 | |
| Inventory | 15,547 | |
| Prepaid expenses and other current assets | 639 | |
| Property, plant and equipment, net | 3,512 | |
| Operating lease right-of-use assets, net | 1,741 | |
| Financing lease right-of-use assets, net | 114 | |
| Long-term deposits and other assets | 4 | |
| Developed technology | 18,140 | |
| Customer relationships | 7,020 | |
| Tradenames | 26,640 | |
| Non-compete agreements | 1,240 | |
| In-process research and development | 67,440 | |
| Goodwill | 137,822 | |
| Accounts payable | (9,837) | |
| Line of credit | (4,231) | |
| Lease liabilities, operating | (1,880) | |
| Lease liabilities, financing | (114) | |
| Long-term debt | (4,410) | |
| Deferred tax liability | (24,133) | |
| Other liabilities | (7,464) | |
| Fair value of net assets acquired | $ | 234,909 | |
We recorded a measurement period adjustment in the
fourth quarter of the year ended
December 31, 2021 of $607,000 to the fair value of goodwill and the deferred tax liability. This adjustment related to the tax attributes of the business combination.
The fair value of Global Cooling’s identifiable intangible assets and useful lives are as follows (amounts in thousands, except years):
| | | Fair Value | | | Useful Life (Years) | |
Developed technology | | $ | 18,140 | | | | 6 | |
Customer relationships | | | 7,020 | | | | 12 | |
Tradenames | | | 26,640 | | | | 15 | |
Non-compete agreements | | | 1,240 | | | | 4 | |
In-process research and development | | | 67,440 | | | | N/A | |
Total identifiable intangible assets | | $ | 120,480 | | | | | |
| | | | | | | | | | | |
| Fair Value | | Useful
Life (Years) |
| Developed technology | $ | 18,140 | | | 6 |
| Customer relationships | 7,020 | | | 12 |
| Tradenames | 26,640 | | | 15 |
| Non-compete agreements | 1,240 | | | 4 |
| In-process research and development | 67,440 | | | N/A |
| Total identifiable intangible assets | $ | 120,480 | | | |
Fair value measurement methodologies used to calculate the value of any asset can be broadly classified into
one of
three approaches, referred to as the cost, market and income approaches. In any fair value measurement analysis, all
three approaches must be considered, and the approach or approaches deemed most relevant will then be selected for use in the fair value measurement of that asset. The fair values of developed technology and in-process research and development were estimated using a multi-period excess earnings approach. The fair values of customer relationships were estimated using the “distributor method”. The fair value of the tradenames is based on the relief from royalty method, which estimates the value of the trade names based on the hypothetical royalty payments that are saved by owning the asset. The fair values of non-compete agreements were estimated using a “with and without” approach, comparing projected cash flows under scenarios assuming the non-compete agreements were and were
not in place. The fair value of inventory and property, plant and equipment were determined using the “market approach”.
Some of the more significant assumptions inherent in the development of intangible asset fair values, from the perspective of a market participant, include, but are
not limited to (i) the amount and timing of projected future cash flows (including revenue and expenses), (ii) the discount rate selected to measure the risks inherent in the future cash flows, (iii) the assessment of the asset’s life cycle, and (iv) the competitive trends impacting the asset.
The goodwill of $137.8 million represents future economic benefits expected to arise from synergies from combining operations and commercial organizations to increase market presence and the extension of existing customer relationships. The goodwill recorded is
not deductible for income tax purposes.
SciSafe acquisition
On September 18, 2020, BioLife entered into a Stock Purchase Agreement, by and among the Company, SciSafe Holdings, Inc., a Delaware corporation, and the stockholders of SciSafe (collectively, the “SciSafe Sellers”) in accordance with the Stock Purchase Agreement, pursuant to which the Company agreed to purchase from the SciSafe Sellers one hundred percent (100%) of the issued and outstanding capital shares or other equity interests of SciSafe (the “SciSafe Acquisition”). The SciSafe Acquisition closed October 1, 2020. The acquisition strengthens BioLife’s offerings in the cell and gene therapy and broader biopharma markets.
Consideration transferred
The SciSafe Acquisition was accounted for as a purchase of a business under FASB ASC Topic 805,Business Combinations. At the closing of the SciSafe Acquisition, the Company agreed to issue to the SciSafe Sellers 611,683 shares of common stock valued at $29.29 per share and a cash payment of $15 million, with $1.5 million held in escrow to account for adjustments for net working capital and as a security for, and a source of payment of, the Company’s indemnity rights. Pending the occurrence of certain events, the Company will issue to the SciSafe Sellers an additional 626,000 shares of common stock, which shall be issuable to SciSafe Sellers upon SciSafe achieving certain specified revenue targets in each year from 2021 to 2024. Under the acquisition method of accounting, the assets acquired and liabilities assumed from SciSafe were recorded as of the acquisition date, at their respective fair values, and consolidated with those of BioLife. The fair value calculations required critical estimates, including, but not limited to, future expected cash flows, revenue and expense projections, discount rates, revenue volatility, and royalty rates.
Total consideration transferred (in thousands):
Cash consideration | | $ | 15,000 | |
Stock consideration | | | 17,916 | |
Contingent consideration | | | 3,663 | |
Working capital adjustment | | | (53 | ) |
Total consideration transferred | | $ | 36,526 | |
Fair value of net assets acquired
The table below represents the purchase price allocation to the net assets acquired based on their fair values (amounts in thousands).
Cash | | $ | 500 | |
Accounts receivable, net | | | 945 | |
Prepaid expenses and other current assets | | | 31 | |
Property, plant and equipment, net | | | 3,400 | |
Customer relationships | | | 7,420 | |
Tradenames | | | 4,020 | |
Non-compete agreements | | | 660 | |
Goodwill | | | 24,943 | |
Other assets | | | 1,547 | |
Accounts payable | | | (885 | ) |
Deferred tax liability | | | (3,297 | ) |
Other liabilities | | | (2,758 | ) |
Fair value of net assets acquired | | $ | 36,526 | |
On September 30, 2020, the Company advanced SciSafe $500,000 in cash for working capital purposes. This cash and a payable due to the Company were both assumed in the transaction and are both reflected in the fair value of net assets acquired.
The fair value of SciSafe’s identifiable intangible assets and useful lives are as follows (amounts in thousands except years):
| | | Fair Value | | | Useful Life (Years) | |
Customer relationships | | $ | 7,420 | | | | 14 | |
Tradenames | | | 4,020 | | | | 19 | |
Non-compete agreements | | | 660 | | | | 4 | |
Total identifiable intangible assets | | $ | 12,100 | | | | | |
Fair value measurement methodologies used to calculate the value of any asset can be broadly classified into one of three approaches, referred to as the cost, market and income approaches. In any fair value measurement analysis, all three approaches must be considered, and the approach or approaches deemed most relevant will then be selected for use in the fair value measurement of that asset. The fair values of customer relationships were estimated using a multi-period excess earnings approach. The fair value of the tradenames is based on the relief from royalty method which estimates the value of the trade names based on the hypothetical royalty payments that are saved by owning the asset. The fair values of non-compete agreements were estimated using a “with and without” approach, comparing projected cash flows under scenarios assuming the non-compete agreements were and were not in place. The fair value of property, plant and equipment was determined using the “market approach”. The fair value of the milestone contingent consideration was determined using a scenario analysis valuation method which incorporates BioLife’s assumptions with respect to the likelihood of achievement of certain revenue milestones, revenue volatility, credit risk, timing of earnout share issuances and a risk-adjusted discount rate to estimate the present value of the expected earnout share issuances.
Some of the more significant assumptions inherent in the development of intangible asset fair values, from the perspective of a market participant, include, but are not limited to (i) the amount and timing of projected future cash flows (including revenue and expenses), (ii) the discount rate selected to measure the risks inherent in the future cash flows, (iii) the assessment of the asset’s life cycle, and (iv) the competitive trends impacting the asset.
Indemnification asset
In 2020, the Company recognized a $130,000 liability for a non-income tax contingency related to the acquisition of SciSafe. At the date of acquisition, we recognized an indemnification asset at the same time and on the same basis as the recognized liability, to the extent that collection is reasonably assured, in accordance with ASC 805. When indemnified, subsequent changes in the indemnified item are offset by changes in the indemnification asset. We assess the realizability of the indemnification asset each reporting period. Changes in the principal portion of non-income tax contingencies, as well as changes in any related indemnification asset, are included in operating income. The indemnification asset is included within prepaid expenses and other current assets on the balance sheet.
Acquired goodwill
The goodwill of $24.9 million represents future economic benefits expected to arise from synergies from combining operations and commercial organizations to increase market presence and the extension of existing customer relationships. The goodwill recorded is not deductible for income tax purposes.
Custom Biogenic Systems Acquisition
On November 10, 2019, we entered into an Asset Purchase Agreement, by and among the Company, Arctic Solutions, Inc., a Delaware corporation and wholly-owned subsidiary of the Company, and CBS, a Michigan corporation, pursuant to which we agreed to purchase from CBS substantially all of CBS’s assets, properties and rights (the “CBS Acquisition”). CBS, a privately held company with operations located near Detroit, Michigan, designs and manufactures liquid nitrogen laboratory freezers and cryogenic equipment and also offers a related cloud-based monitoring system that continuously assesses biologic sample storage conditions and alerts equipment owners if a fault condition occurs. The CBS Acquisition closed on November 12, 2019.
In connection with the CBS Acquisition, we paid to CBS (i) a base payment in the amount of $15.0 million, consisting of a cash payment of $11.0 million paid at the closing of the CBS Acquisition, less a cash holdback escrow of $550,000 to satisfy certain indemnification claims, and an aggregate number of shares of our common stock, with an aggregate fair value equal to $4.0 million, less a holdback escrow of shares of Common Stock with an aggregate value equal to $3.0 million to satisfy potential payments related to any product liability claims outstanding as of March 13, 2019, and (ii) potential earnout payments in calendar years 2020,2021,2022,2023 and 2024 of up to an aggregate of, but not exceeding, $15.0 million payable to the sole shareholder of CBS upon achieving certain specified revenue targets in each year for certain product lines. The revenue targets set for 2020 and 2021 were not met and 0 amounts were paid or are considered payable for the earnouts related to those years.
The CBS Acquisition was accounted for as a purchase of a business under FASB ASC Topic 805,Business Combinations. Under the acquisition method of accounting, the acquired assets and liabilities assumed from CBS were recorded as of the acquisition date, at their fair values, and consolidated with BioLife. The fair value estimates required critical estimates, including, but not limited to, future expected cash flows, revenue and expense projections, discount rates, revenue volatility, and royalty rates.
Total consideration transferred (in thousands):
Cash consideration | | $ | 11,000 | |
Stock consideration | | | 4,000 | |
Contingent consideration | | | 856 | |
Total consideration transferred | | $ | 15,856 | |
Fair Value of Net Assets Acquired
The table below represents the purchase price allocation to the net assets acquired based on their fair values (amounts in thousands).
Accounts receivable, net | | $ | 1,044 | |
Inventory | | | 3,232 | |
Prepaid expenses and other current assets | | | 29 | |
Property, plant and equipment, net | | | 3,615 | |
Customer relationships | | | 560 | |
Tradenames | | | 800 | |
Developed technology | | | 5,430 | |
Goodwill | | | 2,954 | |
Accounts Payable | | | (1,197 | ) |
Other liabilities | | | (611 | ) |
Fair value of net assets acquired | | $ | 15,856 | |
The fair value of CBS’s identifiable intangible assets and weighted average useful lives are as follows (amounts in thousands except years):
| | | Fair Value | | | Useful Life (Years) | |
Customer relationships | | $ | 560 | | | | 6 | |
Tradenames | | | 800 | | | | 6 | |
Developed technology | | | 5,430 | | | | 9 | |
Total identifiable intangible assets | | $ | 6,790 | | | | | |
Fair value measurement methodologies used to calculate the value of any asset can be broadly classified into one of three approaches, referred to as the cost, market and income approaches. In any fair value measurement analysis, all three approaches must be considered, and the approach or approaches deemed most relevant will then be selected for use in the fair value measurement of that asset. The fair value of identifiable intangible assets was determined primarily using variations of the income approach, which is based on the present value of the future after-tax cash flows attributable to each identifiable intangible asset. The fair value of inventories was determined using both the cost approach and the market approach and the fair value of property, plant and equipment was determined using the cost and market approach.
Some of the more significant assumptions inherent in the development of intangible asset fair values, from the perspective of a market participant, include, but are not limited to (i) the amount and timing of projected future cash flows (including revenue and expenses), (ii) the discount rate selected to measure the risks inherent in the future cash flows, (iii) the assessment of the asset’s life cycle, and (iv) the competitive trends impacting the asset. Some of the more significant assumptions inherent in valuing the contingent consideration, include, but are not limited to (i) the amount and timing of projected future revenue, (ii) the volatility rate selected to measure the risks inherent in the revenue, and (iii) risk free interest rate.
Acquired Goodwill
The goodwill of $3.0 million represents future economic benefits expected to arise from synergies from combining operations and commercial organizations to increase market presence and the extension of existing customer relationships. All of the goodwill recorded is deductible for income tax purposes.
SAVSU Acquisition
On August 8, 2019, we closed the acquisition of SAVSU pursuant to a Share Exchange Agreement. Pursuant to the Share Exchange Agreement, SAVSU Origin, LLC agreed to transfer to us and we agreed to acquire from the seller 8,616 shares of common stock of SAVSU, representing the remaining 56% of the outstanding shares of SAVSU that we did not previously own, in exchange for 1,100,000 shares of BioLife common stock. As a result of the acquisition, SAVSU became a wholly-owned subsidiary on August 8, 2019, the acquisition date.
Consideration transferred
The SAVSU acquisition was accounted for as a purchase of a business under FASB ASC Topic 805,Business Combinations. The acquisition of 56% of SAVSU was funded through a transfer of 1,100,000 shares of BioLife common stock, which had a fair value of $18.12 per share or $19.9 million at time of closing. The total value of 100% of SAVSU consisting of the fair value of the stock issued and the fair value of our existing investment in SAVSU was $35.8 million at time of closing. Prior to the acquisition, we accounted for our investment of SAVSU using the equity method of accounting which resulted in a recorded book value of $5.8 million at the acquisition date. We remeasured to fair value the equity interest in SAVSU held immediately before the business combination. The fair value of our equity interest was determined to be $15.9 million on our existing 44% ownership based on the fair value of shares transferred at the time of acquisition for the 56% we did not previously own. As a result, we recorded a non-operating gain of $10.1 million.
Under the acquisition method of accounting, the assets acquired and liabilities assumed from SAVSU were recorded as of the acquisition date, at their respective fair values, and consolidated with those of BioLife. The fair value estimates required critical estimates, including, but not limited to, future expected cash flows, revenue and expense projections, discount rates, revenue volatility, and royalty rates.
Total consideration paid for the acquisition of SAVSU is as follows (amounts in thousands):
Stock consideration for 55.6% equity interest purchased
| | $ | 19,932 | |
This stock consideration plus the fair value of our existing equity investment in SAVSU of $15.9 million results in the total purchase price for accounting purposes of $35.8 million.
Fair Value of Net Assets Acquired
The table below represents the purchase price allocation to the net assets acquired based on their fair values (amounts in thousands).
Cash and cash equivalents | | $ | 1,251 | |
Accounts receivable, net | | | 753 | |
Prepaid expenses and other current assets | | | 19 | |
Property, plant and equipment, net | | | 546 | |
Operating right-of-use asset | | | 233 | |
Assets held for lease | | | 2,441 | |
Customer relationships | | | 80 | |
Tradenames | | | 1,320 | |
Developed technology | | | 10,750 | |
Goodwill | | | 21,037 | |
Accounts Payable and accrued expenses | | | (807 | ) |
Deferred tax liabilities | | | (1,541 | ) |
Other liabilities | | | (232 | ) |
Fair value of net assets acquired | | $ | 35,850 | |
The fair value of SAVSU’s identifiable intangible assets and useful lives are as follows (amounts in thousands except years):
| | | Fair Value | | Useful Life (Years) | |
Customer relationships | | $ | 80 | | | 6 | | |
Tradenames | | | 1,320 | | | 9 | | |
Developed technology | | | 10,750 | | 7 | - | 8 | |
Total identifiable intangible assets | | $ | 12,150 | | | | | |
Astero Acquisition
On April 1, 2019, BioLife completed the acquisition of all the outstanding shares of Astero. Astero’s ThawSTAR product line is comprised of a family of automated thawing devices for frozen cell and gene therapies packaged in cryovials and cryobags. The products improve the quality of administration of high-value, temperature-sensitive biologic therapies to patients by standardizing the thawing process and reducing the risks of contamination and overheating, which are inherent with the use of traditional water baths.
In connection with the acquisition, the Company paid (i) a base payment in the amount of $12.5 million consisting of an initial cash payment of $8.0 million at the closing of the transactions, subject to adjustment for working capital, net debt and transaction expenses, and a deferred cash payment that was paid into escrow and subsequently paid to Astero of $4.5 million which was payable upon the earlier of Astero meeting certain product development milestones or one year after the date of the Closing and (ii) earnout payments in calendar years 2019,2020 and 2021 of up to an aggregate of $3.5 million, was payable upon Astero achieving certain specified revenue targets in each year and a separate earnout payment of $5.0 million for calendar year 2021, which was payable upon Astero achieving a cumulative revenue target over the three-year period from 2019 to 2021. In the second quarter of 2020 we paid $483,000 for the earnout related to 2019 revenues. Revenue targets for 2020,2021, and the cumulative period from 2019 to 2021 were not met and no amounts were paid or are considered payable for the earnouts related to those years.
Consideration transferred
The Astero acquisition was accounted for as a purchase of a business under FASB ASC Topic 805,Business Combinations. Under the acquisition method of accounting, the assets acquired and liabilities assumed from Astero were recorded as of the acquisition date, at their respective fair values, and consolidated with those of BioLife. The fair value estimates required critical estimates, including, but not limited to, future expected cash flows, revenue and expense projections, discount rates, revenue volatility, and royalty rates.
Total consideration recorded for the acquisition of Astero is as follows (amounts in thousands):
Cash consideration | | $ | 12,521 | |
Contingent consideration | | | 1,491 | |
Working capital adjustment | | | (71 | ) |
Total consideration transferred | | $ | 13,941 | |
Fair Value of Net Assets Acquired
The table below represents the purchase price allocation to the net assets acquired based on their fair values (amounts in thousands).
Cash and cash equivalents | | $ | 11 | |
Accounts receivable, net | | | 154 | |
Inventory | | | 456 | |
Customer relationships | | | 160 | |
Tradenames | | | 470 | |
Developed technology | | | 2,840 | |
In-process research and development | | | 650 | |
Goodwill | | | 9,515 | |
Other assets | | | 99 | |
Accounts Payable | | | (250 | ) |
Other liabilities | | | (164 | ) |
Fair value of net assets acquired | | $ | 13,941 | |
The fair value of Astero’s identifiable intangible assets and useful lives are as follows (amounts in thousands except years):
| | | Fair Value | | Useful Life (Years) | |
Customer relationships | | $ | 160 | | | 4 | | |
Tradenames | | | 470 | | | 9 | | |
Developed technology | | | 2,840 | | 5 | - | 9 | |
In-process research and development | | | 650 | | | N/A | | |
Total identifiable intangible assets | | $ | 4,120 | | | | | |
Fair value measurement methodologies used to calculate the value of any asset can be broadly classified into one of three approaches, referred to as the cost, market and income approaches. In any fair value measurement analysis, all three approaches must be considered, and the approach or approaches deemed most relevant will then be selected for use in the fair value measurement of that asset. The fair value of identifiable intangible assets was determined by third-party appraisal primarily using variations of the income approach, which is based on the present value of the future after-tax cash flows attributable to each identifiable intangible asset. The fair value of inventories was determined using both the cost approach and the market approach.
Some of the more significant assumptions inherent in the development of intangible asset fair values, from the perspective of a market participant, include, but are not limited to (i) the amount and timing of projected future cash flows (including revenue and expenses), (ii) the discount rate selected to measure the risks inherent in the future cash flows, (iii) the assessment of the asset’s life cycle, and (iv) the competitive trends impacting the asset. Some of the more significant assumptions inherent in valuing the contingent consideration, include, but are not limited to (i) the amount and timing of projected future revenue, (ii) the volatility rate selected to measure the risks inherent in the revenue, and (iii) risk free interest rate.
Acquired Goodwill
The goodwill of $9.5 million represents future economic benefits expected to arise from synergies from combining operations and commercial organizations to increase market presence and the extension of existing customer relationships. All but $1.1 million of the goodwill recorded is not deductible for income tax purposes.
Revenue, net income, and pro forma presentation
The Company recorded revenue from Sexton of $1.8 million and a net loss of $1.0 million from
September 1, 2021, the date of acquisition, to
December 31, 2021. The Company recorded revenue from Global Cooling of $39.1 million and a net loss of $19.6 million from
May 3, 2021, the date of acquisition, to
December 31, 2021. The Company recorded revenue from SciSafe of $1.8 million and a net loss of $416,000 from October 1, 2020, the date of acquisition, to December 31, 2020. The Company recorded revenue from CBS of $2.1 million and net income of $187,000 from November 12, 2019, the date of acquisition, to December 31, 2019. The Company recorded revenue from SAVSU of $692,000 and a net loss of $1.7 million from August 8, 2019, the date of acquisition, to December 31, 2019. The Company recorded revenue from Astero of $1.2 million and a net loss of $1.5 million from April 1, 2019, the date of acquisition, to December 31, 2019. The Company has included the operating results of the acquisitions in its
Unaudited Condensed Consolidated Statements of Operations since their respective acquisition date.
The following unaudited pro forma financial information presents the combined results of operations of Sexton as if the acquisition had occurred on
January 1, 2020 2021 after giving effect to certain pro forma adjustments. These pro forma adjustments include intangible amortization, stock-based compensation expense and salary expense related to a key employee, and the income tax effect of the adjustments made:
| | | 2021 | | | 2020 | |
(In thousands) | | (unaudited) | | | (unaudited) | |
Total revenue | | $ | 122,494 | | | $ | 50,856 | |
Net (loss) income | | $ | (9,860 | ) | | $ | (1,028 | ) |
| | | | | |
| (In thousands) | 2021
(unaudited) |
| Total revenue | $ | 122,494 | |
| Net loss | $ | (9,860) | |
The following unaudited pro forma financial information presents the combined results of operations of Global Cooling as if the acquisition had occurred on January 1, 2020 2021 after giving effect to certain pro forma adjustments. These pro forma adjustments include intangible amortization, amortization of increased inventory basis, depreciation expense, lease
expense, transaction costs, interest expense, stock-based compensation expense and salary expense related to a key employee, and the income tax effect of the adjustments made:
| | | 2021 | | | 2020 | |
(In thousands) | | (unaudited) | | | (unaudited) | |
Total revenue | | $ | 143,732 | | | $ | 87,370 | |
Net income (loss) | | $ | (16,375 | ) | | $ | 501 | |
The following unaudited pro forma financial information presents the combined results of operations of SciSafe as if the acquisition had occurred on January 1, 2019 after giving effect to certain pro forma adjustments. These pro forma adjustments include intangible amortization, depreciation expense, stock-based compensation expense, and the income tax effect of the adjustments made:
| | | 2020 | | | 2019 | |
(In thousands) | | (unaudited) | | | (unaudited) | |
Total revenue | | $ | 52,613 | | | $ | 43,221 | |
Net income (loss) | | $ | 1,798 | | | $ | (4,528 | ) |
The following unaudited pro forma financial information presents the combined results of operations of CBS as if the acquisition had occurred on January 1, 2018 after giving effect to certain pro forma adjustments. These pro forma adjustments include amortization expense on the acquired identifiable intangible assets, adjustments to stock-based compensation expense for equity compensation issued to employees and the income tax effect of the adjustments made:
| | | 2019 | |
(In thousands) | | (unaudited) | |
Total revenue | | $ | 37,001 | |
Net income (loss) | | $ | (493 | ) |
The following unaudited pro forma financial information presents the combined results of operations of SAVSU as if the acquisition had occurred on January 1, 2018 after giving effect to certain pro forma adjustments. These pro forma adjustments include amortization expense on the acquired identifiable intangible assets, adjustments to stock-based compensation expense for equity compensation issued to employees and the income tax effect of the adjustments made:
| | | 2019 | |
(In thousands) | | (unaudited) | |
Total revenue | | $ | 28,824 | |
Net income (loss) | | $ | (1,518 | ) |
The following unaudited pro forma financial information presents the combined results of operations of Astero as if the acquisition had occurred on January 1, 2018 after giving effect to certain pro forma adjustments. These pro forma adjustments include amortization expense on the acquired identifiable intangible assets, adjustments to stock-based compensation expense for equity compensation issued to employees and the income tax effect of the adjustments made:
| | | 2019 | |
(In thousands) | | (unaudited) | |
Total revenue | | $ | 28,745 | |
Net income (loss) | | $ | (183 | ) |
| 13.
| | | | |
| (In thousands) | Consolidated balance sheet detail
2021
(unaudited) |
Property and equipment
Property and equipment consist of the following as of December 31, 2021 and 2020:
(In thousands) | | 2021 | | | 2020 | |
Property and equipment | | | | | | | | |
Leasehold improvements | | $ | 3,840 | | | $ | 2,393 | |
Furniture and computer equipment | | | 1,861 | | | | 902 | |
Manufacturing and other equipment | | | 16,675 | | | | 10,076 | |
Construction in-progress | | | 2,022 | | | | 591 | |
Subtotal | | | 24,398 | | | | 13,962 | |
Less: Accumulated depreciation | | | (6,741 | ) | | | (3,842 | ) |
Net property and equipment | | $ | 17,657 | | | $ | 10,120 | |
Depreciation expense for property and equipment was $2.9 million, $1.4 million, and $544,000 for the years ended December 31, 2021, 2020, and 2019, respectively.
Accrued expenses and other current liabilities
Accrued expenses and other current liabilities consist of the following as of December 31, 2021 and 2020:
(In thousands) | | 2021 | | | 2020 | |
Accrued expenses | | $ | 1,656 | | | $ | 472 | |
Accrued taxes | | | 27 | | | | 112 | |
Accrued compensation | | | 4,351 | | | | 2,898 | |
Deferred revenue, current | | | 814 | | | | 931 | |
Other | | | 294 | | | | 130 | |
Total accrued expenses and other current liabilities | | $ | 7,142 | | | $ | 4,543 | |
Warranty reserve liability
We reserve estimated exposures on known claims, as well as on a portion of anticipated claims, for product warranty and rework cost, based on historical product liability claims. Claim costs are deducted from the accrual when paid. Factors that could have an impact on the warranty accrual in any given period include the following: changes in manufacturing quality, changes in product costs, changes in product mix and any significant changes in sales volume.
A rollforward of our warranty liability is as follows:
(In thousands) | | 2021 | | | 2020 | |
Beginning balance | | $ | 212 | | | $ | 191 | |
Warranty reserve acquired in the acquisition of Global Cooling | | | 3,353 | | | | 0 | |
Provision for warranties | | | 9,845 | | | | 137 | |
Settlements of warranty claims | | | (4,012 | ) | | | (116 | ) |
Ending Balance | | $ | 9,398 | | | $ | 212 | |
14.
Total revenue | Employee benefit plan
$ | 143,732 | |
| Net income (loss) | $ | (16,375) | |
18. Employee benefit plan
The Company sponsors
401(k)401(k) defined contribution plans for its employees. These plans provide for pre-tax and post-tax contributions for all employees. Employee contributions are voluntary. Employees
may contribute up to 100% of their annual compensation to these plans, as limited by an annual maximum amount as determined by the Internal Revenue Service. The Company matches employee contributions in amounts to be determined at the Company’s sole discretion. The Company made contributions of
$822,000, $347,000,$1.1 million, $1.0 million, and
$158,000$0.8 million to the plans for the years ended
December 31, 2021, 2020,2023, 2022, and
2019.2021.The
19. Subsequent events
On January 1, 2024, the Company
has evaluated events subsequentfailed to
December 31, 2021 throughcomply with Section 5.7 (a) and Section 5.7 (c) of the
dateLoan Agreement related to its Term Loan with respect to the depository account requirements and the requirement to deliver a Control Agreement for any Permitted Temporary Account upon the expiration of
this filingthe Transition Period to
assesstransfer all cash holdings to the
need for potential recognition or disclosure. Based upon this evaluation, it was determined that no subsequent events occurred that require recognition or disclosure inLender's bank. On February 26, 2024, the
Consolidated Financial Statements.Lender waived the existing defaults under the Loan Agreement and entered into the Waiver and First Amendment to Loan and Security Agreement ("the Amendment").
ITEM 9.
| CHANGES IN AND DISAGREEMENTS WITH ACCOUNTANTS ON ACCOUNTING AND FINANCIAL DISCLOSURE
|
None.
ITEM 9. CHANGES IN AND DISAGREEMENTS WITH ACCOUNTANTS ON ACCOUNTING AND FINANCIAL DISCLOSURE
None.
ITEM 9A.
| CONTROLS AND PROCEDURES
|
(a)
| Evaluation of Disclosure Controls and Procedures
|
ITEM 9A. CONTROLS AND PROCEDURES
(a)Evaluation of Disclosure Controls and Procedures
Our management, with the participation of our Chief Executive Officer
("CEO") and Chief Financial Officer
("CFO"), evaluated the effectiveness of our disclosure controls and procedures (as defined in Rules 13a-15(e) and 15d-15(e) under the Exchange Act) as of
the end of the period covered by this Form 10-K. Based on that evaluation, our Chief Executive Officer and Chief Financial Officer concluded that our disclosureDecember 31, 2023. The term “disclosure controls and
procedures as of the end of the period covered by this Form 10-K were not effective, due to the material weaknesses in our internal controls over financial reporting described below.Our management, including our Chief Executive Officer and Chief Financial Officer, does not expect that our disclosureprocedures” means controls and other procedures of a company that are designed to provide reasonable assurance that information required to be disclosed by a company in the reports that it files or our internal controls will prevent all errorsubmits under the Exchange Act is recorded, processed, summarized, and all fraud. Areported within the time periods specified in the U.S. Securities and Exchange Commission’s (“SEC”) rules and forms. Management recognizes that a control system, no matter how well conceived and operated, can provide only reasonable, not absolute, assurance that the objectives of the control system are met. Further, management necessarily applies its judgment in evaluating the designcost-benefit relationship of possible controls and procedures.
Based on the evaluation of our disclosure controls and procedures, our CEO and CFO have concluded that, as of December 31, 2023, our disclosure controls and procedures were not effective due to the material weaknesses in internal control over financial reporting described in section (b) below. A material weakness is a
deficiency, or combination of deficiencies, in internal control
system must reflectover financial reporting, that adversely affects the
factCompany’s ability to initiate, authorize, record, process, or report external financial data reliably in accordance with U.S. GAAP such that there
are resource constraints, and the benefits of controls must be considered relative to their costs. Becauseis more than a remote likelihood that a material misstatement of the
inherent limitations in all control systems, no evaluation of controls can provide absolute assurance that all control issues and instances of fraud, if any, within BioLife Solutions have beenCompany’s annual or interim financial statements will not be prevented or detected.
(b)
| Management’s Annual Report on Internal Control Over Financial Reporting
|
(b)Management’s Annual Report on Internal Control Over Financial Reporting
Our management is responsible for establishing and maintaining adequate internal control over financial reporting (as defined in Rule 13a-15(f) of the Exchange Act)
and the preparation of financial statements for external purposes in accordance with United States Generally Accepted Accounting Policies (“U.S. GAAP”).
Our management assessed the effectiveness of our internal control over financial reporting as of December 31, 2021. In making this assessment, our management usedUsing the criteria set forth by the Committee of Sponsoring Organizations of the Treadway Commission (“COSO”) in Internal Control—Integrated Framework (2013 framework)
.In accordance with guidance issued by, management of the SecuritiesCompany under supervision and Exchange Commission, companies are permitted to exclude acquisitions from their final assessmentparticipation of the CEO and CFO, conducted an evaluation of the effectiveness of our internal control over financial reporting for the first fiscal year in which the acquisition occurred. Our management’s evaluation of internal control over financial reporting excluded the internal control activities of Global Cooling, Inc. (“Global Cooling” acquired on May 3, 2021) and Sexton Biotechnologies, Inc. (“Sexton” acquired on September 1, 2021) as discussed in Note 12, “Acquisitions,” of the Notes to the Consolidated Financial Statements. We have included the financial results of these acquired businesses in the consolidated financial statements from the date of acquisition. These acquired businesses constituted approximately 19% of our total consolidated assets (excluding goodwill and intangible assets related to the transactions, which were integrated into our systems and control environment) and 35% of the total consolidated revenue included in our consolidated financial statements as of and for the year ended December 31, 2021.
2023.
Based on our assessment under the framework in Internal Control—Integrated Framework (2013 framework), our management concluded that our internal control over financial reporting was not effective as of December 31,
20212023 due to the existence of material weaknesses described below.
A
The material
weakness in internalweaknesses identified by management primarily relate to an ineffective control
is a deficiency in internal control, or combinationenvironment that also impacted the design and operating effectiveness of
control deficiencies, that adversely affects the Company’s ability to initiate, authorize, record, process, or report external financial data reliably in accordance with GAAP such that there is more than a remote likelihood that a material misstatementelements of the
Company’s annual or interim financial statements will not be prevented or detected.Control Environment, Risk Assessment, and Monitoring Activities
Management did not maintain appropriately designed entity-level controls impacting the control environment, risk assessment, procedures,monitoring and monitoring activities to prevent or detect material misstatements to the consolidated financial statements in a timely manner.other components. These material weaknesses were attributed to:
●
| Insufficient number of qualified resources and inadequate oversight and accountability over the performance of controls;
|
●
| Ineffective identification and assessment of risks impacting internal control over financial reporting; and,
|
●
| Ineffective monitoring controls, as the Company did not effectively evaluate whether the components of internal control were present and functioning.
|
Control Activitiesa sufficient complement of resources with the appropriate level of internal controls training, knowledge, and Informationexpertise necessary to meet our financial reporting requirements and Communication
to provide adequate oversight over the performance of controls.
Additionally, management did not adequately design and implement effective control activities, including general controls over information technology, and effective policies and procedures, resulting in additional material weaknesses within certain business processes. As a result, the following additional material weaknesses were identified:
●
| •Management did not design and maintain effective internal controls over information system logical access within certain key financial systems, including inadequate segregation of duties impacting the revenue and inventory processes at certain financial statement areas, including the procure to pay process and revenue recognition. •Management did not design and maintain effective information technology general controls for the significant systems used in the preparation of the financial statements. Specifically, we did not design and maintain: ◦controls over change management for certain financial systems to ensure that data or system changes were identified, tested, and authorized according to policy, and migrated correctly into the production environment; and ◦monitoring controls which are executed by users other than those conducting changes to our financial systems.
Following the identification of the Company’s subsidiaries; |
●
| Management did not establish effective accounting policies and procedures and related controls over complex financial statement areas, including revenue recognition, lease modifications, modifications to share-based payments, income taxes, and financial instruments with characteristics of liabilities and equity;
|
●
| Management did not maintain effectively designed and implemented accounting policies, procedures, and related controls over assets held for lease;
|
●
| Management did not maintain effectively designed and implemented accounting policies, procedures, and related controls over the preparation and review of projected financial information used in determining the valuation of acquired intangible assets and contingent consideration in business combinations as well as the quantitative impairment analysis of indefinite-lived intangible assets;
|
●
| Management did not maintain effectively designed and implemented policies, procedures, and related controls over the presentation and disclosure of amounts presented in the consolidated financial statements in accordance with the applicable financial reporting requirements, including controls over the completeness and accuracy of underlying data to support the amounts presented.
|
After giving full consideration to these material weaknesses and theprior to filing this Annual Report on Form 10-K, we performed additional analyses and other procedures that we performed to ensure that our consolidated financial statements included in this Annual Report on Form 10-K were prepared in accordance with U.S. GAAP, our management, including ourGAAP. Our CEO and CFO hashave concluded that our consolidated financial statements present fairly, in all material respects, our financial position, results of operations and cash flows for the periods disclosedpresented in conformity with U.S. GAAP.
this Annual Report.
These
control deficienciesmaterial weaknesses create a reasonable possibility that a material misstatement to the consolidated financial statements
willwould not be prevented or detected on a timely
basis, and therefore,basis. Therefore, we concluded that the deficiencies
above represent material weaknesses in our internal control over financial reporting, and our internal control over financial reporting was not effective as of December 31,
2021.2023.
Management has been actively engaged in developing and implementing remediation plans to address these material weaknesses as described below in section (c).
The Company’s independent registered public accounting firm,
BDO USA,Grant Thornton, LLP, who audited our internal controls over financial reporting, has issued an adverse opinion on the effectiveness of the Company’s internal control over financial reporting as of December 31,
2021,2023, as stated in its report.
With respect to
(c)Remediation
During fiscal year 2023, management made the
material weaknesses described above, management has continued to test and evaluate the elements of the remediation plan implemented to date.Management of the Company and the Board of Directors are committed to maintaining a strong internal control environment and to making further progress in remediating the material weaknesses described in section (b). The following steps either have been planned for implementation or have been implemented in the Company’s ongoing efforts to remediate the material weaknesses identified:
| ●
| The Company reassigned all system administrator rights to personnel who do not perform key accounting duties;
|
| ●
| The Company plans to hire and retain additional individuals with the appropriate skills related to technical accounting and internal control over financial reporting;
|
| ●
| The Company will enhance its reconciliations and management review controls with the added stability of new hires and the implementation of technology solutions to automate visibility and enforcement of the independent review and documentation of journal entries, including proper segregation of duties, thus mitigating risks of both unintentional errors and fraud; and
|
| ●
| The Company plans to develop processes and procedures to enhance the precision of management review of financial statement information.
|
As we continue to evaluate and test the remediation plan outlined above, we may also identify additional measures to address the material weaknesses or modify certain of the remediation procedures described above. We also may implement additional changes to our internal control over financial reporting to remediate previously identified material weaknesses, as may befollows:
•Ensured system administrator access is restricted to appropriate individuals.
•Made a significant investment in hiring additional resources to enhance our technical accounting and internal control over financial reporting capabilities.
•Redesigned controls in all financial reporting processes and implemented 48 additional internal control procedures in our financial reporting processes.
•Trained finance and accounting personnel and key management roles across the organization in the coursedesign and execution of remediatinginternal controls under the required standards.
•Transitioned the accounting system for one additional subsidiary to NetSuite in mid-2023, aiding in the standardization of controls; all entities were transitioned to NetSuite as of July 1, 2023 except the two subsidiary entities the Company plans to dispose.
•Hired a new ERP implementation consulting team in Q4 2023 with expertise in internal control system design.
•Hired a new internal audit consulting team in Q4 2023 with expertise in internal control design, including IT general controls.
Although the Company implemented meaningful control enhancements throughout the year and hired additional resources, including a new internal audit consulting firm, there was insufficient time to demonstrate full remediation of its controls related to effective control environment and process level controls in certain financial statement areas.
While we have implemented changes to our control environment and identified fewer material weaknesses. weaknesses in fiscal year 2023 compared to fiscal year 2022, we require additional time to complete the implementation of our remediation plans and demonstrate the effectiveness of our remediation efforts in fiscal year 2024. The material weaknesses cannot be considered remediated until the underlying remedial controls operate for a sufficient period of time and Management has concluded, through testing, that these controls are operating effectively.
Management, with the oversight of the Audit Committee
of the Board of Directors, will continue to take steps necessary to remedy the material weaknesses to reinforce the overall design and capability of our control environment.
(d)
| Changes in Internal Control Over Financial Reporting
|
The following has been planned for implementation in Management’s ongoing efforts to remediate the identified material weaknesses:
•The Company has included remediation of material weaknesses into its bonus compensation goals for 2024 to promote accountability of management personnel.
•The Company will enhance and standardize policies and procedures across all entities to ensure consistency in the performance of the controls; and
•The Company will continue to make strategic investments in personnel, external consultants, and available tools or systems to streamline execution and documentation of controls through organization and automation.
(d)Changes in Internal Control Over Financial Reporting
For the fiscal quarter ended December 31, 2023, Management established internal controls related to a formal cybersecurity program and a cybersecurity incident reporting policy, in compliance with the SEC cyber disclosure rule effective December 18, 2023. Additionally, the Company remediated the prior year material weaknesses related to indirect tax and IT logical access.
Management assessed control design in all financial reporting processes, identifying 48 additional key controls over financial reporting. Based on the results of testing, Management identified fewer material weaknesses in fiscal year 2023 compared to fiscal year 2022.
Other than the
controls implemented to remediate the material weaknesses describedchanges noted above, there have been no
other changes in our internal control over financial reporting during the fiscal quarter ended December 31,
20212023 that have materially affected, or are reasonably likely to materially affect, our internal control over financial reporting.
(e)
| Attestation Report of the Independent Registered Public Accounting Firm
|
REPORT OF INDEPENDENT REGISTERED PUBLIC ACCOUNTING FIRM
Board of Directors
and Shareholders
BioLife Solutions, Inc.
Bothell, Washington
Opinion on
Internal Control over Financial ReportingWe have audited BioLife Solutions, Inc.’s (the “Company’s”) internal control over financial reporting
We have audited the internal control over financial reporting of BioLife Solutions, Inc. and subsidiaries (the “Company”) as of December 31, 2021,2023, based on criteria established in the 2013 Internal Control –Control—Integrated Framework(2013) issued by the Committee of Sponsoring Organizations of the Treadway Commission (the “COSO criteria”(“COSO”). In our opinion, because of the effect of the material weakness described in the following paragraphs on the achievement of the objectives of the control criteria, the Company didhas not maintain, in all material respects,maintained effective internal control over financial reporting as of December 31, 2021,2023, based on criteria established in the COSO criteria.We do2013
Internal Control—Integrated Framework issued by COSO. A material weakness is a deficiency, or combination of control deficiencies, in internal control over financial reporting, such that there is a reasonable possibility that a material misstatement of the company’s annual or interim financial statements will not
express an opinionbe prevented or
any other form of assurancedetected on
management’s statements referring to any corrective actions taken by the Company after the date ofa timely basis. The following material weakness has been identified and included in management’s assessment.
(i) Inappropriately designed entity-level controls impacting the control environment, risk assessment, and monitoring activities to prevent or detect material misstatements to the consolidated financial statements attributed to an insufficient number of qualified resources and inadequate oversight and accountability over the performance of controls, ineffective identification and assessment or risks impacting internal control over financial reporting, and ineffective monitoring controls; (ii) inappropriate information system change management within certain key financial systems; (iii) ineffective accounting procedures and related controls over certain financial statement areas; (iv) inadequate risk assessment, accounting policies, procedures and related controls performed over the procure to pay and revenue recognition processes.
We also have audited, in accordance with the standards of the Public Company Accounting Oversight Board (United States) (“PCAOB”), the consolidated
balance sheetsfinancial statements of the Company as of
December 31, 2021 and
2020,for the
related consolidated statements of operations and comprehensive loss (income), shareholders’ equity, and cash flows for each of the three years in the periodyear ended December 31,
2021,2023. The material weakness identified above was considered in determining the nature, timing, and
extent of audit tests applied in our audit of the
related notes2023 consolidated financial statements, and
this report does not affect our report dated
March 31, 2022February 29, 2024 which expressed an unqualified opinion
thereon.on those financial statements.
The Company’s management is responsible for maintaining effective internal control over financial reporting and for its assessment of the effectiveness of internal control over financial reporting, included in the accompanying
“Item 9A, Management’s
Annual Report on Internal Control over Financial
Reporting”.Reporting. Our responsibility is to express an opinion on the Company’s internal control over financial reporting based on our audit. We are a public accounting firm registered with the PCAOB and are required to be independent with respect to the Company in accordance with
the U.S. federal securities laws and the applicable rules and regulations of the Securities and Exchange Commission and the PCAOB.
We conducted our audit
of internal control over financial reporting in accordance with the standards of the PCAOB. Those standards require that we plan and perform the audit to obtain reasonable assurance about whether effective internal control over financial reporting was maintained in all material respects. Our audit included obtaining an understanding of internal control over financial reporting, assessing the risk that a material weakness exists,
and testing and evaluating the design and operating effectiveness of internal control based on the assessed
risk. Our audit also includedrisk, and performing such other procedures as we considered necessary in the circumstances. We believe that our audit provides a reasonable basis for our opinion.
As indicated in the accompanying “Item 9A, Management’s Report on Internal Control over Financial Reporting”, management’s assessment ofDefinition and conclusion on the effectivenesslimitations of internal control over financial reporting did not include the internal controls of Global Cooling, Inc. and Sexton Biotechnologies, Inc., which were acquired on May 3, 2021 and September 1, 2021, respectively, and which are included in the consolidated balance sheets of the Company as of December 31, 2021, and the related consolidated statements of operations and comprehensive loss (income), shareholders’ equity, and cash flows for the year then ended. Global Cooling, Inc. constituted 16% of total assets as of December 31, 2021, and 33% of total revenues for the year then ended. Sexton Biotechnologies, Inc. constituted 3% of total assets as of December 31, 2021, and 2% of total revenues for the year then ended. Management did not assess the effectiveness of internal control over financial reporting of Global Cooling, Inc. and Sexton Biotechnologies, Inc. because of the timing of the acquisitions. Our audit of internal control over financial reporting of the Company also did not include an evaluation of the internal control over financial reporting of Global Cooling, Inc. and Sexton Biotechnologies, Inc.
A material weakness is a deficiency, or a combination of deficiencies, in internal control over financial reporting, such that there is a reasonable possibility that a material misstatement of the Company’s annual or interim financial statements will not be prevented or detected on a timely basis. Material weaknesses have been identified and described in management’s assessment. These material weaknesses related to management’s failure to design and maintain effective controls over financial reporting, specifically related to the following: (1) entity-level controls impacting the control environment, risk assessment procedures, and monitoring controls to prevent or detect material misstatements to the consolidated financial statements; (2) information system logical access within certain key financial systems, including inadequate segregation of duties impacting the revenue and inventory processes at certain of the Company’s subsidiaries; (3) accounting policies and related controls over complex financial statement areas, including revenue recognition, lease modifications, modifications to share-based payments, income taxes, and financial instruments with characteristics of liabilities and equity; (4) accounting policies, procedures, and related controls over assets held for lease; (5) controls over the preparation and review of projected financial information used in determining the valuation of acquired intangible assets and contingent consideration in business combinations as well as the quantitative impairment analysis of indefinite-lived intangible assets; and (6) policies, procedures and related controls over the presentation and disclosure of amounts presented in the consolidated financial statements in accordance with the applicable financial reporting requirements, including controls over the completeness and accuracy of underlying data to support the amounts presented.
These material weaknesses were considered in determining the nature, timing, and extent of audit tests applied in our audit of the 2021 financial statements, and this report does not affect our report dated March 31, 2022 on those financial statements.
Definition and Limitations of Internal Control over Financial Reporting
A company’s internal control over financial reporting is a process designed to provide reasonable assurance regarding the reliability of financial reporting and the preparation of financial statements for external purposes in accordance with generally accepted accounting principles. A company’s internal control over financial reporting includes those policies and procedures that (1) pertain to the maintenance of records that, in reasonable detail, accurately and fairly reflect the transactions and dispositions of the assets of the company; (2) provide reasonable assurance that transactions are recorded as necessary to permit preparation of financial statements in accordance with generally accepted accounting principles, and that receipts and expenditures of the company are being made only in accordance with authorizations of management and directors of the company; and (3) provide reasonable assurance regarding prevention or timely detection of unauthorized acquisition, use, or disposition of the company’s assets that could have a material effect on the financial statements.
Because of its inherent limitations, internal control over financial reporting may not prevent or detect misstatements. Also, projections of any evaluation of effectiveness to future periods are subject to the risk that controls may become inadequate because of changes in conditions, or that the degree of compliance with the policies or procedures may deteriorate.
Other information
We do not express an opinion or any other form of assurance on the remediation plans and actions described in Management’s Report.
/s/
BDO USA,GRANT THORNTON LLP
Seattle,
Bellevue, Washington
March
February 29, 2024
ITEM 9B. OTHER INFORMATION
Rule 10b5-1 Trading Arrangements
The following table identifies and provides the material terms of the Rule 10b5-1 trading arrangements (as such term is defined in Item 408 of Regulation S-K) adopted or terminated by our officers (as defined in Rule 16a-1(f) under the Exchange Act) and directors during the quarter ended December 31,
2022ITEM 9B.
| OTHER INFORMATION
|
None.
ITEM 9C.
| DISCLOSURE REGARDING FOREIGN JURISDICTION THAT PREVENTS INSPECTIONS
|
None.
2023.
| | | | | | | | | | | | | | | | | | | | | | | | | | |
| Name and Position | | Plan Adoption / Termination | | Plan Adoption / Termination Date | | Expiration Date | | Number of Shares Purchased (Sold) / Terminated under Plan |
| Sarah Aebersold, Chief Human Resources Officer | | Adoption | | December 15, 2023 | | September 30, 2024 | | (10,000) |
Todd Berard, Chief Marketing Officer(1) | | Termination | | December 15, 2023 | | December 31, 2023 | | 30,000 |
| Todd Berard, Chief Marketing Officer | | Adoption | | December 15, 2023 | | December 31, 2024 | | (30,000) |
Michael Rice, Former Chief Executive Officer(2) | | Termination | | November 14, 2023 | | November 16, 2023 | | 33,334 |
| Marcus Schulz, Former Chief Revenue Officer | | Termination | | October 19, 2023 | | April 30, 2024 | | 10,000 |
(1) On December 15, 2023, Todd Berard, our Chief Marketing Officer, terminated the remaining portion of his Rule 10b5-1 trading arrangement originally adopted on September 14, 2022 for the sale of up to 50,000 shares of the Company's common stock until December 31, 2023. The Rule 10b5-1 trading arrangement was in place solely for the potential exercise of vested stock options and for sales intended to satisfy tax obligations payable due to the vesting and settlement of certain restricted stock awards. Since the adoption of the Rule 10b5-1 trading arrangement, 20,000 shares of the Company's common stock were sold out of the original 50,000 shares.
(2) On November 14, 2023, Michael Rice, our former Chief Executive Officer, terminated the remaining portion of his Rule 10b5-1 trading arrangement originally adopted on September 14, 2022 for the sale of up to 100,000 shares of the Company's common stock until November 16, 2023. The trading arrangement was in place solely for the potential exercise of vested stock options and for sales intended to satisfy tax obligations payable due to the vesting and settlement of certain restricted stock awards. Since the adoption of the Rule 10b5-1 trading arrangement, 66,666 shares of the Company's common stock were sold out of the original 100,000 shares.
Non-Rule 10b5-1 Trading Arrangements
During the quarter ended December 31, 2023, none of our officers or directors adopted or terminated any non-Rule 10b5-1 trading arrangement (as such term is defined in Item 408 of Regulation S-K).
Waiver and first amendment of Term Loan
On January 1, 2024, the Company failed to comply with Section 5.7 (a) and Section 5.7 (c) of the Loan Agreement related to its Term Loan with respect to the depository account requirements and the requirement to deliver a Control Agreement for any Permitted Temporary Account upon the expiration of the Transition Period to transfer all cash holdings to the Lender's bank. On February 26, 2024, the Lender waived the existing defaults under the Loan Agreement and entered into the Waiver and First Amendment to Loan and Security Agreement ("the Amendment").
ITEM 9C. DISCLOSURE REGARDING FOREIGN JURISDICTIONS THAT PREVENT INSPECTIONS
None.
PART III
ITEM 10. DIRECTORS, EXECUTIVE OFFICERS AND CORPORATE GOVERNANCE
The following table and text set forth the names and ages of our directors and executive officers as of December 31, 2023. The Board is comprised of only one class of directors. Also provided herein are brief descriptions of the business experience of each director and executive officer during the past five years (based on information supplied by them) and an indication of directorships held by each director in other public companies subject to the reporting requirements under the Federal securities laws. During the past ten years, none of our current directors or executive officers has been involved in any legal proceedings that are material to an evaluation of the ability or integrity of such person. There are no family relationships among any of the directors or executive officers named. No director or executive officer has any arrangement
or understanding between him or her and any other person(s) pursuant to which he or she is to be selected as a director or officer of the Company.
| | | | | | | | | | | | | | |
| Name | | Age | | Position and Offices With the Company |
Roderick de Greef(1) | | 62 | | Chief Executive Officer and Chairman of the Board |
| Troy Wichterman | | 39 | | Chief Financial Officer |
| Aby J. Mathew, Ph.D. | | 51 | | Chief Scientific Officer and Executive Vice President |
| Todd Berard | | 55 | | Chief Marketing Officer |
| Karen Foster | | 64 | | Chief Quality and Operations Officer |
| Geraint Phillips | | 57 | | Senior Vice President, Global Operations |
| Garrie Richardson | | 51 | | Chief Revenue Officer |
| Sarah Aebersold | | 48 | | Chief Human Resources Officer |
| Joseph Schick | | 62 | | Director |
| Rachel Ellingson | | 54 | | Director |
| Amy DuRoss | | 49 | | Lead Director |
| Joydeep Goswami | | 52 | | Director |
| Tim Moore | | 62 | | Director |
(1) Roderick de Greef, previously serving as a director of the Company since January 4, 2023, was appointed as Chief Executive Officer and Chairman of the Board as of the same day.
Roderick de Greef has been Chief Executive Officer and Chairman of the Board since October 2023 at BioLife. Previously, Mr. de Greef began serving as a director of the Board in January 2023, prior to which he served as President and Chief Operating Officer from November 2021 until he retired on January 3, 2023. Mr. de Greef was appointed Chief Operating Officer from December 2019 to May 2021 after his appointment as Chief Financial Officer from May 2016 to November 2021. He also served as interim Chief Financial Officer and interim Secretary from March 2016 through May 2016. Mr. de Greef served as a director of the Company from June 2000 through November 2013, and provided the Company with strategic and financial consulting services from July 2007 through August 2011. Since November 2022, Mr. de Greef has served as a director of the Upper Connecticut Valley Hospital, a non-profit, rural hospital in northern New Hampshire. Since December 2020, Mr. de Greef has served as a director of Sirona Medical Technologies, a cardia electrophysiology company. From February 2019 to January 2021, Mr. de Greef served as a director, chairman of the Audit Committee of the board of directors of Indonesia Energy Corporation Limited, an oil and gas exploration and production company. Mr. de Greef served Pareteum Corporation., a mobile communications company, as a director, chair of the Audit Committee and member of the Nominating and Corporate Governance Committee and Compensation Committee from September 2015 to September 2017, and also from January 2008 to October 2011. From November 2013 to October 2014, Mr. de Greef served as the president and sole director of Cambridge Cardiac Technologies, Inc. a privately held successor to Cambridge Heart, Inc. From November 2008 to October 2013, Mr. de Greef was the chairman of the board of Cambridge Heart, Inc., a manufacturer of non-invasive diagnostic cardiology products. From November 2003 to May 2013, Mr. de Greef served as a director, member of the Audit Committee and chairman of the Compensation Committee of Endologix, Inc. From 2001 to 2006, Mr. de Greef served as Executive Vice President and Chief Financial Officer of NASDAQ listed Cardiac Science, Inc., which in 2004 was ranked as the 4th fastest growing technology company in North America on Deloitte & Touche’s Fast 500 listing. Mr. de Greef received his Master of Business Administration degree from the University of Oregon, and a Bachelor of Arts in Economics and International Relations from San Francisco State University. Mr. de Greef has extensive experience in corporate finance and the business world in general as well as serving as an officer and director of public companies.
Troy Wichterman has been Chief Financial Officer since November 2021. Before his appointment as Chief Financial Officer, Mr. Wichterman served as the Company’s Vice President, Finance since November 2019. In that role, Mr. Wichterman oversaw the finance and accounting organization in the areas of integrating acquired businesses, acquisition due diligence and deal structure, SEC reporting, financial planning and analysis, operational finance, and audit compliance. Mr. Wichterman also served as Director of Financial Planning and Analysis from June 2016 to November 2019 and Financial Analyst from February 2015 to June 2016. Prior to joining the company, he was most recently a Senior Financial Analyst, Acquisitions at Ventas, a public healthcare REIT, from January 2013 to September 2014. Prior to Ventas, he was most recently a Senior Portfolio Analyst at Heitman, a private equity REIT, from June 2009 – January 2013 and began his career as an Auditing Associate at PwC in Chicago from 2008 to 2009. Mr. Wichterman is a CPA (inactive) and holds a
Bachelor of Business Administration degree and a Master of Accountancy degree from the University of Wisconsin – Madison.
Aby J. Mathew, Ph.D. has been Executive Vice President and Chief Scientific Officer since December 2019. Before his appointment as Executive Vice President and Chief Scientific Officer, Dr. Mathew had served as Chief Technology Officer. Dr. Mathew was part of the founding team of BioLife Solutions, Inc., and has been employed by BioLife since 2000. Dr. Mathew is a co-developer of BioLife’s biopreservation media solutions and co-inventor on issued and pending patents related to methods, devices, and formulations for the preservation of cells, tissues, and organs. He holds a Ph.D. in Biological Sciences from Binghamton University and a B.S. in Microbiology from Cornell University. Dr. Mathew has been researching low temperature biopreservation since 1994, and his studies contributed to the development of BioLife’s current commercial HypoThermosol and CryoStor product platforms and intellectual property foundation. Dr. Mathew is currently active in, or previously a member of, AABB (formerly the American Association of Blood Banks), BEST (the Biomedical Excellence for Safer Transfusion collaborative), the International Society for Cell and Gene Therapy (ISCT), the Alliance for Regenerative Medicine (ARM), Tissue Engineering & Regenerative Medicine International Society (TERMIS), Society for Cryobiology, International Society for Biological and Environmental Repositories (ISBER), American Society for Cell Biology, and the Society for In Vitro Biology. Dr. Mathew is a member of, the Board of Directors, and Advisory Panel, of the Parent’s Guide to Cord Blood Foundation, the Scientific Advisory Board of HemaCare Corporation, the founding Board of Directors of the Cord Blood Association, the Board of Directors of PanTHERA CryoSolutions, Inc., the NIST-AMTech National Cell Manufacturing Consortium, the California Institute for Regenerative Medicine (CIRM) Clinical Advisory Panel, the Business Advisory Board of RoosterBio Inc., and the Scientific Advisory Board of SAVSU Technologies. Dr. Mathew has obtained UCLA Corporate Governance Program Certification.
Todd Berard has been Chief Marketing Officer since December 2019. Before his appointment as Chief Marketing Officer, Mr. Berard had served as Vice President of Marketing since February 2015 and Senior Director of Marketing since July 2014. Previous to BioLife, Mr. Berard served as Director of Marketing at Verathon Medical; a division of Roper Inc., from September 2010 until July 2014, overseeing the global marketing, product development, and product launch strategies for a portfolio of six medical device brands. He also managed all strategic partnerships for product development and helped guide the organization through several key product launches and the corporate acquisition. At Verathon, Mr. Berard oversaw a creative and product management team of 12. Responsibilities included all global marketing initiatives and campaigns, strategy, product portfolio management, and strategic planning. He has over twenty years of experience in life sciences, health care, medical devices, and technology; working for both global leaders and small technology startups, including the University of Washington School of Medicine, DuPont, and Medtronic. He has a Bachelor of Science Degree in Biochemistry from the University of Vermont and an MBA from the University of Washington Foster School of Business.
Karen Foster has been Chief Quality Officer since December 2019, and became Chief Quality and Operations Officer as of January 2024. Before her appointment as Chief Quality Officer, Ms. Foster had served as Vice President, Operations since April 2016. From 2003 to early 2016, Ms. Foster was Vice President of Laboratory Operations and Site Leader at ViaCord, LLC, a family cord blood bank, and subsidiary of PerkinElmer Inc. Over a 25-year career, Ms. Foster has managed manufacturing and quality operations in several capacities for companies including ViaCord, Pfizer, Inc. (formerly Pharmacia Corporation) and Amersham Pharmacia Biotech, Inc. (formerly Phamacia Biotech, Inc.). She holds an MBA from the University of Wisconsin-Milwaukee (specialization in Operations Management), an M.S. in Zoology from University of Wisconsin-Milwaukee (specialization in Microbiology) and a B.S. in Biological Sciences from Michigan Technological University.
Geraint Phillips has been Senior Vice President, Global Operations since January 2023. Before his appointment as Chief Operating Officer, Mr. Phillips served as Vice President of Freezer Operations upon the acquisition of Global Cooling, Inc. in May 2021, where he served as its Chief Operating Officer since December 2020. While VP of Freezer Operations, Mr. Phillips oversaw the Company’s liquid nitrogen storage freezer product lines. His career spans more than 20 years of operational executive leadership positions that include Senior Director of Global Operations at Azenta Life Sciences (NASDAQ: AZTA; formerly Brooks Life Sciences) and 14 years of progressive operational responsibility to the VP of Global Operations, Environmental Health Division at PerkinElmer (NYSE: PKI), where he held global responsibilities for a number of divisions. Phillips has a Bachelor of Science in Physics from Cardiff University and an MBA from the University of South Wales.
Garrie Richardson has been Chief Revenue Officer since October 2023. Before his appointment to Chief Revenue Officer, Mr. Richardson served as General Manager of SciSafe, Inc., a wholly owned subsidiary of BioLife Solutions, Inc. from 2020 to 2023. Prior to BioLife’s acquisition of SciSafe, Inc. in October 2020, Mr. Richardson was the President and
Founder of SciSafe, Inc. from 2010 to 2020, overseeing operations, sales and marketing and strategic planning. He has a Bachelor of Science Degree in Marketing and Master of Business Administration from the Sorrell College of Business at Troy University.
Sarah Aebersold has been Chief Human Resources Officer since January 2023. Previously, Ms. Aebersold was Vice President, Global Human Resources since January 2021 and served as the Senior Director, Global Human Resources & Administration since February 2020. In that role, Ms. Aebersold oversaw human resources programs in the areas of employee relations, talent acquisition, benefits, compensation, coaching, training and development, policy, and data management. Prior to joining the Company, Ms. Aebersold served in a variety of human resources roles with companies including MCG Health, a healthcare solutions provider (2016-2020, most recently as Head of Human Resources and Administration), Spacelabs Healthcare, a manufacturer of medical equipment (2014-2016, 2012-2013, most recently as Senior Manager, Human Resources), T-Mobile, a mobile communication company, (2013-2013, most recently as Human Resource Manager), Seattle Children’s Hospital, a children’s hospital (2009-2012, most recently as Manager, Human Resources Consulting), and ZymoGenetics, Inc., a biotechnology/pharmaceutical company (2004-2009, most recently as Human Resources Manager).
Joseph Schick joined the Board in November 2013 as a director and Chair of the Audit Committee. He has 17 years of experience as a Chief Financial Officer spanning four different mid-sized companies in various industries. Prior to his experience as a Chief Financial Officer, Mr. Schick worked in various roles for seven years at Expedia (NASDAQ: EXPE), including Senior Vice President of Finance. From this background, Mr. Schick has significant experience with SEC reporting, internal controls, strategic planning, and mergers and acquisitions. Mr. Schick started his career with Arthur Andersen and is a CPA who received his B.S. in Accounting from the University of Illinois. He is also on various non-profit boards and completed the Director Certification program at UCLA. The Board has determined that Mr. Schick is qualified to serve as a director because of his financial experience with public companies.
Rachel Ellingson has served as a director and member of the Company’s Compensation Committee and Audit Committee since April 2021. Since April 2018, Ms. Ellingson has served as Senior Vice President and Chief Strategy Officer at Zimmer Biomet Holdings, Inc., a medical device company (NYSE: ZBH). As a member of the executive leadership team at ZBH, Ms. Ellingson is responsible for global oversight of strategy, business development and integration. Prior to joining ZBH, Ms. Ellingson served as Vice President, Corporate Strategy and as a member of the executive leadership team at St. Jude Medical, Inc., a medical device company, from 2011 to 2017. Before joining St. Jude Medical, Ms. Ellingson served as Vice President, Business Development and Investor Relations at AGA Medical Corporation, a developer and manufacturer of cardiovascular medical devices. Prior to joining AGA Medical, Ms. Ellingson was an investment banker, most recently as a Managing Director, Healthcare Investment Banking with Bank of America Corporation (NYSE: BAC) and prior to that, was with Cowen & Company (NASDAQ: COWN). Ms. Ellingson holds an MBA in Finance from the University of Connecticut and a Bachelor of Arts degree from the University of Rhode Island. The Board has determined that Ms. Ellingson is qualified to serve as a director because of her experience with strategic leadership and investment banking.
Amy DuRoss has served as Lead Director of the Company's Board of Directors since August 2023 and member of the Company’s Governance and Nominating Committee and as Chair of the Compensation Committee since April 2021. Ms. DuRoss previously served as Chief Executive Officer of Vineti, Inc., a healthcare technology company, from the time that she co-founded Vineti in April 2016 through March 2022. Ms. DuRoss led Vineti and its software as a service platform to the forefront of innovation supporting cell and gene therapy manufacturing, delivery and patient follow up. Before co-founding Vineti, Ms. DuRoss focused on healthcare new business creation for GE Ventures, a venture capital subsidiary of General Electric (NYSE: GE), serving as a Managing Director from May 2013 to May 2017. Prior to GE, Ms. DuRoss was Chief Business Officer at Navigenics, Inc., a genomics company sold to Life Technologies Corporation in 2012. Ms. DuRoss was Co-founder and Executive Director of Proposition 71, California's stem cell research initiative passed in 2004, as well as Chief of Staff at the resulting state grant oversight agency. Ms. DuRoss was named a 2016 Health Innovator Fellow by the Aspen Institute. Ms. DuRoss also serves as a member of the Board of Directors for the ARM Foundation for Cell and Gene Medicine. Ms. DuRoss holds an MBA, Masters degree in English, and Bachelors of Arts degree in English from Stanford University. The Board has determined that Ms. DuRoss is qualified to serve as a director because of her experience founding and growing a successful business in the cell and gene therapy space.
Joydeep Goswami has served as a director and member of the Company’s Audit Committee and as chair of the Nominating and Governance Committee since October 2021. Mr. Goswami currently serves as Chief Financial Officer at Illumina, a biotechnology company, since February 2023. Previously, Mr. Goswami was the Interim Chief Financial Officer at Illumina since July of 2022 and Chief Strategy and Corporate Development Officer since September 2019. As a member of the executive leadership at Illumina, Mr. Goswami is responsible for driving planning, strategic partnerships, and
acquisitions. Prior to Illumina, Mr. Goswami served as the President of Thermo Fisher Scientific's Clinical Next-Generation Sequencing (NGS) and Oncology business unit, where he oversaw efforts that drove the adoption of NGS in clinical oncology, research and reproductive health. Mr.Goswami has held senior leadership roles across the pharma/biotech, diagnostics and research tool continuum, previously serving at companies such as Life Technologies and Invitrogen, in addition to Thermo Fisher Scientific. He has led teams across various functions, including sales, marketing, R&D and other support functions. Mr. Goswami served as President, Asia Pacific and Japan while at Thermo Fisher Scientific and created the Stem Cells and Regenerative Medicine Business Unit at Invitrogen. Additionally, he spent five years at McKinsey, where he specialized in strategy for pharmaceutical, medical technology and technology companies. Mr. Goswami holds his MS, PhD in Chemical Engineering, and MBA from MIT and a Bachelor's degree in Chemical Engineering from the Indian Institute of Technology. The Board has determined that Mr. Goswami is qualified to serve as a director because of his experience with strategic leadership and international business operations.
Tim Moore has served as a director and member of the Company’s Compensation and Nominating and Governance Committees since September 2022. He has more than three decades of leadership experience in biopharmaceutical manufacturing and operations. Mr. Moore served as COO of Instil Bio through December 2022, a TIL cell therapy company focused on solid tumors. Mr. Moore also served as the President and COO at PACT Pharma from October 2019 through September 2022. Prior to joining PACT, he served as Executive Vice President, Technical Operations at Kite, a Gilead Company, since March of 2016. During this time Mr. Moore was responsible for overseeing the process development, manufacturing, quality and supply chain for the launch of Yescarta®, one of the first CAR T therapies to be developed, manufactured and commercialized, as well as advancement of the Kite pipeline. In addition, Mr. Moore globally expanded the biopharmaceutical operations to serve and support the US, EU, as well as key partners in Asia. Prior to Kite, Mr. Moore served as the Senior Vice President, Head of Global Technical Operations – Biologics of Genentech, Inc. and as a member of the Genentech Executive Committee since 2010. In this role, Mr. Moore oversaw global leadership for more than 7,500 professionals across 10 internal sites and over 37 contract manufacturing organizations, as well as global manufacturing and end-to-end quality supply performance of more than 20 biological product families. Prior to that, Mr. Moore was Genentech’s Senior Vice President, Global Supply Chain and Global Engineering from 2007 to 2010. Previously, Mr. Moore served as Vice President, Operations at ZLB Behring (formerly Aventis Behring). He is currently a member of ISPE, PDA and has been a part of the Executive Committee of BioPhorum and serves as a Board member for Cerus. Mr. Moore received a B.S. in Chemical Engineering from Tulsa University and a M.S. in Engineering Management from Northwestern University. The Board has determined that Mr. Moore is qualified to serve as a director because of his extensive experience with leading and executing large scale manufacturing operations in the biopharmaceutical industry.
Except as otherwise provided by law, each director shall hold office until either their successor is elected and qualified, or until he or she sooner dies, resigns, is removed or becomes disqualified. Officers serve at the discretion of the Board.
Board of Directors
Overview
Our Bylaws provide that the size of our Board is to be determined from time to time by resolution of the Board but shall consist of at least three members. As of the date of this filing, our Board consists of six members. Our Board has determined five of our directors – Messrs. Schick, Goswami, and Moore, and Mss. DuRoss and Ellingson – to be independent under the rules of the NASDAQ Stock Market, after taking into consideration, among other things, those transactions described under “Certain Transactions.” Mr. de Greef serves as Chairman of the Board and is Chief Executive Officer and, as of August 1, 2023, Amy DuRoss was appointed as Lead Director of the Board.
At each annual meeting of stockholders, members of our Board are elected to serve until the next annual meeting and until their successors are duly elected and qualified. If the nominees named in this report are elected, the Board will consist of six persons.
Committees of the Board of Directors
The Board has established an Audit Committee, a Compensation Committee, and a Governance and Nominating Committee. Each committee operates pursuant to a written charter that may be viewed on our website at http://investors.biolifesolutions.com/corporate-governance. The inclusion of our web site address in this document does not include or incorporate by reference the information on our web site into this annual filing.
The following table sets forth the current composition of the three standing committees of our Board:
| | | | | | | | | | | | | | | | | | | | | | | | | | |
| Name | | Board | | Audit | | Compensation | | Governance
and
Nominating |
| Mr. de Greef | | Chair | | | | | | |
| Mr. Schick (financial expert) | | X | | Chair | | X | | X |
| Ms. DuRoss | | X | | | | Chair | | X |
| Ms. Ellingson | | X | | X | | X | | |
| Mr. Goswami | | X | | X | | | | Chair |
| Mr. Moore | | X | | | | X | | X |
Audit Committee. Our Audit Committee’s role includes the oversight of our financial, accounting and reporting processes; our system of internal accounting and financial controls; and our compliance with related legal, regulatory, and ethical requirements. The Audit Committee oversees the appointment, compensation, engagement, retention, termination and services of our independent registered public accounting firm, including conducting a review of its independence; reviewing and approving the planned scope of our annual audit; overseeing our independent registered public accounting firm’s audit work; reviewing and pre-approving any audit and non-audit services that may be performed by our independent registered public accounting firm; reviewing with management and our independent registered public accounting firm the adequacy of our internal financial and disclosure controls; reviewing our critical accounting policies and the application of accounting principles; and monitoring the rotation of partners of our independent registered public accounting firm on our audit engagement team as required by regulation.
In addition, the Audit Committee’s role includes meeting to review our annual audited financial statements and quarterly financial statements with management and our independent registered public accounting firm. The Audit Committee has the authority to obtain independent advice and assistance from internal or external legal, accounting and other advisors, at the Company’s expense.
The Board has determined that all members of our Audit Committee meet the independence and financial literacy standards of NASDAQ and applicable SEC rules. The Board of Directors has determined that Mr. Schick is an “audit committee financial expert” as defined by the rules of the SEC.
Please see the section entitled “Report of the Audit Committee of the Board of Directors” for further matters related to the Audit Committee.
Compensation Committee. The purpose of the Compensation Committee is to discharge its fiduciary responsibilities relating to the compensation of executive officers, the organizational structure, succession, retention and training policies and review and oversight of benefit programs. Our Compensation Committee is responsible for reviewing the recommendations of our Chief Executive Officer and Chief Financial Officer, making recommendations to the Board regarding the compensation of our executive officers, and ensuring that the total compensation paid to the executive officers is reasonable and competitive, and does not promote excessive risk taking. In making its recommendation to the Board, the Compensation Committee considers the results of the most recent stockholder advisory vote on executive compensation. The Chief Executive Officer may not be present during voting or deliberation on his compensation. The Compensation Committee is also responsible for reviewing and making recommendations to the Board regarding director and committee member compensation. In addition, the Compensation Committee approves and has oversight over our bonus plans for executive officers and/or stock-based compensation plans and oversight of our overall compensation plans and benefit programs, including approval and oversight of grants.
In discharge of its duties related to administration of executive bonus plans, the Compensation Committee may, subject to the terms of each plan, delegate authority to management for the day-to-day non-material administration of such plans. Further, the Compensation Committee may, subject to the terms of each plan, delegate authority to management to make grants to non-executive officers under stock-based compensation plans.
The Compensation Committee has the authority to obtain independent advice and assistance from internal or external legal, accounting and other advisors, at the Company’s expense. The Compensation Committee may select, or receive advice from, a compensation consultant, legal counsel or other adviser to the Committee, other than in-house legal counsel, only
after taking into consideration the six factors outlined in Rule 10C-1 of the Securities Exchange Act of 1934, as amended (the “Exchange Act”). In considering and determining compensation levels, the Compensation Committee reviews independent and externally generated compensation data, in accordance with Rule 10C-1 of the Exchange Act.
The members of the Compensation Committee are independent directors within the meaning of the listing standards of the NASDAQ Stock Market.
Governance and Nominating Committee. Our Governance and Nominating Committee’s primary purpose is to evaluate candidates for membership on our Board and make recommendations to our Board regarding candidates; make recommendations with respect to the composition of our Board and its committees; provide guidance to our human resources, legal, and finance departments relating to director orientation programs; recommend corporate governance principles applicable to the Company; manage periodic review, discussion and evaluation of the performance of our Board, its committees and its members and oversee and monitor compliance with our Code of Business Conduct and Ethics. The Governance and Nominating Committee has the authority to obtain independent advice and assistance from internal or external legal, accounting, and other advisors, at the Company’s expense.
All members of our Governance and Nominating Committee are independent under the listing standards of the NASDAQ Stock Market.
The Governance and Nominating Committee will consider candidates recommended by stockholders in accordance with the procedures set forth in our Bylaws, and prior to the date it recommends a slate of director nominees to the Board. Pursuant to General Instructions Gthe Governance and Nominating Committee Charter, there is no difference in the manner in which a nominee recommended by a stockholder or otherwise is evaluated.
In carrying out its function to nominate candidates for election to our Board, the Governance and Nominating Committee considers the Board’s mix of skills, experience, character, commitment and diversity, with diversity being broadly construed to mean a variety of opinions, perspectives and backgrounds, such as gender, race and ethnicity differences, as well as other differentiating characteristics, all in the context of the requirements and needs of our Board at that point in time. In reviewing potential candidates, the Committee will also consider all relationships between any proposed nominee and any of our stockholders, competitors, customers, suppliers or other persons with a relationship to the Company. The Governance and Nominating Committee believes that each candidate should be an individual who has demonstrated exceptional ability and judgment, who are willing and able to make a sufficient time commitment to the Company, and who shall be most effective, in conjunction with the other nominees to the Board, in collectively serving the long-term interests of the stockholders.
The Governance and Nominating Committee’s methods for identifying candidates for election to our Board include the solicitation of ideas for possible candidates from a number of sources, including from members of our Board, our executive officers, individuals who our executive officers or Board members believe would be aware of candidates who would add value to our Board and through other research. The Governance and Nominating Committee may, from time to time, retain, for a fee, one or more third-party search firms to identify suitable candidates. The Governance and Nominating Committee will consider all candidates identified through the processes described above, and will evaluate each candidate, including incumbents, based on the same criteria.
The Governance and Nominating Committee does not have a formal policy with respect to diversity; however, the Board and the Governance and Nominating Committee believe that it is essential that the Board members represent diverse viewpoints.
Number of Meetings
The Board held a total of 23 meetings during 2023. Our Audit Committee held seven meetings in 2023, our Compensation Committee held two meetings in 2023 and our Governance and Nominating Committee held 2 meetings during 2023. Each incumbent director attended greater than 60% of the total number of Board meetings in which they were responsible for attending.
Board Member Attendance at Annual Stockholder Meetings
Although we do not have a formal policy regarding director attendance at annual stockholder meetings, directors are encouraged to attend these annual meetings.
Codes of Business Conduct and Ethics
We believe in sound corporate governance practices and have always encouraged our employees, including officers and directors to conduct business in an honest and ethical manner. Additionally, it has always been our policy to comply with all applicable laws and provide accurate and timely disclosure.
Accordingly, the Board has adopted a Code of Business Conduct and Ethics for all employees. The Board has adopted an additional corporate code of ethics for its Chief Executive Officer, Chief Financial Officer, and other senior financial officers, which is intended to be a “code of ethics” as defined by applicable SEC rules. The Code of Business Conduct and Ethics is publicly available on our website at http://investors.biolifesolutions.com/corporate-governance. The Code of Business Conduct and Ethics is designed to deter wrongdoing and promote honest and ethical conduct and compliance with applicable laws and regulations. These codes also incorporate what we expect from our executives so as to enable us to provide accurate and timely disclosure in our filings with the SEC and other public communications. Any amendments made to the Code of Business Conduct and Ethics will be available on our website.
Delinquent Section 16(a) Reports
Section 16(a) of the Exchange Act requires the Company’s directors and executive officers, and persons who own more than 10% of a registered class of the Company’s equity securities, to file with the SEC reports of beneficial ownership and reports of changes in beneficial ownership in the Company’s securities. Based solely upon a review of Forms 3, 4 and 5, and amendments thereto, filed electronically with the SEC during the year ended December 31, 2023, the Company believes that all Section 16(a) filings applicable to its directors, officers, and 10% stockholders were filed on a timely basis during the year ended December 31, 2023, except those listed below:
•January 10, 2023: Section 16(a) filings filed late by Michael Rice, Aby Mathew, Karen Foster, Geraint Phillips, Troy Wichterman, Sarah Aebersold, Todd Berard, and Marcus Schulz. Each filed one late Form 4 reporting one transaction.
•November 1, 2023: Section 16(a) filing filed late by Garrie Richardson reflecting one late Form 4 reporting one transaction.
•December 1, 2023: Section 16(a) filings filed late by Aby Mathew, Karen Foster, Geraint Phillips, and Troy Wichterman. Each filed one late Form 4 reporting one transaction.
Stockholder Communications with Directors
Stockholders wishing to communicate with the Board or with a particular member or committee of the Board should address communications to the Board, or to an individual member or committee as follows: c/o BioLife Solutions, Inc., Attention: Corporate Secretary, 3303 Monte Villa Parkway, Suite 310, Bothell, Washington 98021. All communications will be relayed to that addressee. From time to time, the Board may change the process through which stockholders communicate with the Board or its members or committees. There were no changes in this process in 2023 or as of the date hereof. Please refer to our website at www.biolifesolutions.com for any future changes in this process. The Board or the particular director or committee of the Board to which a communication is addressed will, if it deems appropriate, promptly refer the matter either to management or to the full Board depending on the nature of the communication.
Board Diversity Matrix
| | | | | | | | | | | | | | | | | | | | | | | | | | |
| Board Diversity Matrix as of December 31, 2023 |
| Total Number of Directors | | 6 |
| | Female | | Male | | Non-Binary | | Did Not Disclose Gender |
| Part I: Gender Identity | | | | | | | | |
| Directors | | | | | | | | |
| Part II: Demographic Background | | | | | | | | |
| African American or Black | | | | | | | | |
| Alaskan Native or Native American | | | | | | | | |
| Asian | | | | 1 | | | | |
| Hispanic or Latinx | | | | | | | | |
| Native Hawaiian or Pacific Islander | | | | | | | | |
| White | | 2 | | 3 | | | | |
| Two or More Races or Ethnicities | | | | | | | | |
| LGBTQ+ | | | | | | | | |
| Did Not Disclose Demographic Background | | | | | | | | |
ITEM 11. EXECUTIVE COMPENSATION
Compensation Committee report
The Compensation Committee of the Board, which is comprised solely of independent directors within the meaning of applicable rules of NASDAQ, outside directors within the meaning of Section 162(m) of the Internal Revenue Code of 1986, as amended (the “Code”), and non-employee directors within the meaning of Rule 16b-3 under the Exchange Act, is responsible for developing executive compensation policies and advising the Board with respect to such policies and administering the Company’s cash and equity incentive plans. The Compensation Committee sets performance goals and objectives for the CEO and the other executive officers, evaluates their performance with respect to those goals and sets their compensation based upon the evaluation of their performance. In evaluating executive officer pay, the Compensation Committee may retain the services of a compensation consultant and consider recommendations from the CEO with respect to goals and compensation of the other executive officers. The Compensation Committee assesses the information it receives in accordance with its business judgment. The Compensation Committee also periodically reviews non-employee director compensation. All decisions with respect to executive compensation are approved by the Compensation Committee and all decisions with respect to director compensation are recommended by the Compensation Committee to the full Board for approval.
The Compensation Committee of the Company has reviewed and discussed the compensation discussion and analysis required by Item 402(b) of Regulation S-K with management and, based on such review and discussions, the Compensation Committee recommended to the Board that the compensation discussion and analysis be included in this document.
Respectfully submitted by the Compensation Committee:
Amy DuRoss, Chairperson
Joseph Schick
Rachel Ellingson
Timothy Moore
Compensation discussion and analysis
Our compensation discussion and analysis (“CD&A”) describes our executive-compensation philosophy and program as reported in the executive compensation tables that follow, which provide information relating primarily to compensation decisions for the following 2023 named executive officers (“NEOs”) of the Company:
| | | | | | | | |
| Name | | Position with the Company |
Roderick de Greef(1) | | Chief Executive Officer and Chairman of the Board |
Michael Rice(1) | | Former Chief Executive Officer and Chairman of the Board |
| Troy Wichterman | | Chief Financial Officer |
| Aby J. Mathew, Ph.D. | | Chief Scientific Officer and Executive Vice President |
| Geraint Phillips | | Senior Vice President, Global Operations |
| Karen Foster | | Chief Quality and Operations Officer |
(1) As of October 19, 2023, Michael Rice resigned from his position as Chief Executive Officer and Chairman of the Board and the board appointed Roderick de Greef as successor. Mr. Rice is included as an NEO pursuant to Regulation S-K.
2023 year in review
For the fiscal year ended December 31, 2023, the macroeconomic environment created challenging headwinds for the CGT and broader biopharma industry, and, as a result, the Company did not achieve its financial goals for 2023. Factors contributing to the economic constraints within the industry included reduced spending across our customer base for both capital equipment and consumables in addition to destocking by our customers and distributors in our high margin cell processing products.
To navigate the financial challenges that arose from the macroeconomic conditions in 2023, we focused our efforts on managing our operating expenses through a reduction in workforce and limiting discretionary expenses in Q3, 2023. As announced in the third quarter of 2023, we determined that divesting our Freezer Businesses would optimize the performance of our product portfolio by focusing on recurring, higher margin revenue streams within our cell processing and biostorage services product lines. We anticipate the divestiture of the Freezer Businesses to conclude during the first half of 2024.
In continued efforts to manage our expenses given the economic circumstances our company faced during the year, the Board did not award cash bonuses to the executive team as the 2023 financial goals for the year had not been met. However, we are keenly focused on continuing to achieve our corporate goals in alignment with our broader purpose to return long-term value to our shareholders. We are confident the execution of the initiatives outlined above will increase our profitability through our focus on differentiated products suited to the complexities of manufacturing cell and gene therapies, and are in the best interest of the Company and our shareholders.
Compensation philosophy
The Company’s compensation philosophy is to provide compensation that will attract and retain high-performing talent in our industry, motivate the Company’s executive officers to create long-term, enhanced shareholder value and provide a fair reward for executive effort, and stimulate professional and personal growth. The Company believes that the compensation of its executive officers should align the executive officers’ interests with those of the shareholders and focus executive officer behavior to achieve both near-term corporate goals and long-term business and strategies.
It is the responsibility of the Compensation Committee of the Board to administer the Company’s compensation programs to ensure that they are competitive with other bioprocessing, life sciences, and biotechnology companies, and to include incentives that are designed to appropriately drive the Company’s continued development to create shareholder value. The Compensation Committee reviews and approves all components of the Company’s executive officer compensation, including base salaries, annual cash incentive compensation, and equity incentive compensation.
Compensation objectives
The Company’s compensation programs for its executive officers are designed to provide the following:
•Salaries and total compensation that are competitive with other bioprocessing, life sciences, and biotechnology companies with which the Company competes for talent, determined by comparing the Company’s pay practices
with these companies. The committee’s objective is to align executive total annual compensation, including salary, cash bonus and long-term equity, near the 50th percentile of the Company’s peer group.
•Equity incentive compensation, including market-based equity awards, to ensure that its executive officers are motivated over the long-term to respond to the Company’s business challenges and opportunities as owners and not just as employees, thereby aligning the executive officers’ interests with those of shareholders.
•Annual cash incentive compensation that motivates the executive officers to lead and manage the business to meet the Company’s near-and long-term objectives.
The following features of our compensation programs are designed to protect and promote the interests of our shareholders while aligning executive compensation with performance. Below we summarize practices we follow to incentivize performance and retain leadership, and practices we do not follow because we do not believe they serve the long-term interests of our shareholders:
| | | | | | | | |
| We Do | | We Don’t |
Pay for Performance: We emphasize market-based compensation that aligns the interests of our shareholders and executive officers through the use of both near-term cash incentive compensation and long-term equity awards subject to both time and market-based vesting. | | Hedge or Pledge: We do not allow executive officers to engage in hedging or pledging of our securities. |
Benchmark: We maintain an industry-specific peer group for annual benchmarking of executive compensation. This benchmarking is a key factor among those used to determine appropriate compensation for our NEOs. | | Re-Pricing: We do not allow re-pricing of underwater stock options without shareholder approval. |
Benefits: We offer market-competitive benefits for executives that are consistent with the benefits we offer all our employees. | | Gross up Payments: We do not provide excise tax gross-up payments for our executive officers. |
Consult: We consistently engage an independent compensation consultant to advise on compensation levels and practices. | | Guaranteed Bonuses: We do not provide guaranteed bonuses to our executive officers. |
Risk Assessment: We perform an annual compensation risk assessment. | | |
Double Trigger: We provide each NEO severance benefits that are triggered only upon a termination of employment, including resignation for good reason, following a change-in-control (i.e., double trigger). | | |
Board and Compensation Committee consideration of shareholder advisory votes on compensation
In evaluating our executive compensation programs for the fiscal year ended December 31, 2023, the Compensation Committee considered the shareholder advisory vote on our executive compensation, (the “say-on-pay vote”), for the fiscal year ended December 31, 2022, which was approved by 74.2% of the votes cast.
The Compensation Committee determined that the structure of our executive compensation policies continues to be appropriately aligned to the achievement of Company goals and objectives and the best interests of shareholders. We believe that compensation program enhancements of the past several years, as well as our commitment to improved transparency in our CD&A disclosure, have resulted in a compensation program that best serves our Company, our executives, and our shareholders. The Compensation Committee values and continues to consider shareholder input and feedback, including the results of say-on-pay votes, on our compensation program structure.
Compensation evaluation process
The Company’s executive officer compensation consists of three primary components: base salary, annual cash incentive compensation, and equity incentive compensation. Each of these components is intended to complement the others, and taken together, to satisfy the Company’s compensation objectives. The Compensation Committee considers a number of factors in setting compensation for its executive officers, including Company performance, the executive’s functional performance, experience and responsibilities, and the compensation of executive officers in similar positions in our peer group of companies.
Role of compensation consultant
In establishing compensation levels for each executive officer, the Compensation Committee has the authority to engage the services of outside experts. For analysis of the fiscal year ended December 31, 2023 executive compensation structure, the Compensation Committee retained FW Cook, an independent compensation consulting firm, to assist management in assessing and reporting to the Compensation Committee the competitiveness and effectiveness of the Company’s executive compensation programs. In addition, our finance and human resources departments support management in their work and act in accordance with the direction given to them to administer our compensation programs.
Management has assessed any potential conflicts of interest raised by the work of FW Cook, our compensation consultant, pursuant to SEC rules and has determined that no such conflict of interest exists.
In December 2022, the Compensation Committee held meetings with management to review the reports prepared by FW Cook to:
•Review our compensation objectives
•Review the actual compensation of our executive officers for consistency with our objectives
•Analyze trends in executive compensation
•Assess our variable cash compensation structure, as well as incentive plan components and mechanics, to ensure an appropriate correlation between pay and performance with resulting compensation opportunities that balance returns to the Company and its shareholders
•Assess our equity-based awards programs against our objectives of executive incentive, retention, and alignment with shareholder interests
•Review our peer group and consider appropriate changes related to the realignment of our business
•Benchmark our executive cash compensation and equity-based awards programs, and assess our pay versus performance against our peer group
•Review recommendations for fiscal year 2023 compensation for appropriateness relative to our compensation objectives
Use of peer group to benchmark compensation
In December 2022, FW Cook provided management with an analysis of base salary, target bonus, target total cash, long-term incentive value and design, and target total compensation for executives, and cash and equity compensation for non-employee directors, of comparable companies in the bioprocessing, life sciences, and biotechnology industries. In performing this analysis, FW Cook used a peer group of 20 bioprocessing, life sciences, and biotechnology companies, which was reviewed and approved by management. As necessary, FW Cook, in conjunction with management, reevaluates our peer group in light of developments in the market and our industry. As a result of this review, three companies were added to the peer group and three companies were removed from the peer group compared to the prior report. The companies included in the peer group had revenues with a median of $215 million, as compared to the group’s median revenue of $168 million in fiscal year 2022, when the evaluation was last completed.
The peer group used in the report presented for consideration of 2023 compensation decisions and approved by the management consisted of the following companies:
| | | | | | | | | | | | | | | | | |
| ANGO | AngioDynamics | CSII | Cardiovascular Systems, Inc | NSTG | NanoString Technologies, Inc. |
| HALO | Antares Pharma, Inc.(1) | CERS | Cerus Corporation | NVRO | NEVRO Corporation |
| AORT | Artivion | CDXS | Codexis, Inc. | MCRB | Seres Therapeutics |
| ATRI | Atrion Corporation | CYRX | Cryoport, Inc. | SILK | Silk Road Medical, Inc. |
| CDMO | Avid Bioservices, Inc. | GKOS | Glaukos Corporation | STAA | STAAR Surgical Company |
| AXGN | Axogen Corporation | IRTC | iRhythm Technologies, Inc. | VCYT | Veracyte, Inc. |
| AZTA | Azenta | MLAB | Mesa Laboratories, Inc. | | |
(1)Antares Pharma, Inc. was acquired by Halozyme (NASDAQ: HALO) as of May 2022.
The use of peer group compensation data is one of several factors in determining appropriate compensation parameters for base salary, variable cash compensation, and equity-based, long-term incentives. The Compensation Committee’s
executive compensation decisions are made on a case-by-case basis, and specific benchmark results do not, in and of themselves, determine individual target compensation decisions.
While the Compensation Committee generally targets each NEO’s total compensation to be near the 50th percentile of the peer group, it considers a number of additional factors to determine the appropriate level of each NEO’s total compensation and each component of compensation, including Company performance and the relevant executive’s performance, experience, responsibilities and impact. Due to these other factors, the Compensation Committee may set an NEO’s compensation below, at, or above the 50th percentile of the peer group.
Annual review of long-term incentives
The Compensation Committee believes that equity incentives in the form of restricted stock awards, subject to vesting over time or upon achievement of performance or market-based objectives, are effective vehicles to align individual and team performance with the achievement of the Company’s strategic and financial goals over time, retain our NEOs, and align the interests of our NEOs with those of our shareholders.
In January 2023, the Compensation Committee granted to the NEOs, service vesting-based restricted stock awards which vest over a four-year period, and market-based restricted stock awards which contain a market condition based on Total Shareholder Return (“TSR”). The TSR market condition measures the Company’s performance against a peer group. The market-based restricted stock awards will vest as to between 0% and 200% of the number of restricted shares granted to each recipient based on our total shareholder return during the period beginning on January 1, 2023 through December 31, 2024 as compared to the total shareholder return of our 20 company peer group. The size of these grants is based on target long-term incentive levels for each of the NEOs.
Executive compensation
Base salary
Base salary represents the fixed portion of an executive officer’s compensation and is intended to provide compensation for day-to-day performance. The Compensation Committee believes that a competitive base salary is a necessary element of any compensation program that is designed to attract and retain talented and experienced executives. Each executive officer’s base salary is initially determined upon hire or promotion based on the executive officer’s responsibilities, prior experience, individual compensation history and salary levels of other executives within the Company and similarly situated executives within our peer group. Base salary is typically reviewed annually. The Compensation Committee believes that the base salaries paid to our executive officers during the fiscal year ended December 31, 2023 achieved the Company’s compensation objectives. Base salaries for the named executive officers for 2023, 2022 and 2021 are as follows:
| | | | | | | | | | | | | | | | | | | | | | | | | | | | | |
| Name | 2023 Base Salary ($) (1) | | 2022 Base Salary ($) (1) | | 2021 Base Salary ($) (1) | | Base Salary Increase in 2023 vs 2022 (%) | | Base Salary Increase in 2022 vs 2021 (%) |
Roderick de Greef(2) | 744,450 | | | 450,000 | | | 412,137 | | | 65 | | | 9 | |
Michael Rice(2) | 709,000 | | | 645,000 | | | 641,019 | | | 10 | | | 1 | |
| Aby J Mathew | 435,000 | | | 419,750 | | | 419,750 | | | 4 | | | — | |
| Troy Wichterman | 472,000 | | | 375,000 | | | 249,077 | | | 26 | | | 50 | |
| Geraint Phillips | 380,000 | | | 300,000 | | | 237,415 | | | 27 | | | 25 | |
| Karen Foster | 382,000 | | | 356,500 | | | 356,500 | | | 7 | | | — | |
(1) These base salary increases were based on each named executive officer’s performance, qualifications, experience, responsibilities, and FW Cook’s survey of the publicly disclosed compensation for similar positions at companies in the peer group.
(2) The 2023 base salaries presented here are reflecting the annual salaries outlined within the employment agreements of each respective NEO. The actual salary earned by each NEO is presented within the Summary compensation table as both did not serve in their position for the entirety of 2023.
Annual cash incentive compensation (short-term incentive) plan
In 2023, as in prior years, executives were eligible for bonuses, as approved by the Compensation Committee and the Board, with pre-established goals and weightings, which was designed to reward achievements based upon quantitative and qualitative Company performance (the “Company Objectives”), and to incentivize and reward NEOs for achieving performance goals that drive Company performance, align pay and performance, and support the long-term growth of the Company.
All NEO incentive payouts are calculated based solely on Company Objectives to closely align compensation with the Company’s performance. The Compensation Committee determines each NEO’s annual cash incentive compensation after the end of each fiscal year, which is calculated as a percentage of the executive officer’s target annual cash incentive compensation (“Target Award”). The Compensation Committee establishes each NEOs Target Award at a level that represents a meaningful portion of each NEOs cash compensation. In addition, the Compensation Committee sets thresholds, target, and maximum performance goals, and related payout levels, considering annual cash incentive compensation levels for comparable positions within our peer group and our own historical practices. An NEO could earn between 0% and 110% of the NEOs Target Award for achievement of Corporate Objectives, dependent upon the level of achieved performance.
Annual cash incentive compensation (short-term incentive) plan protocol
The Compensation Committee administers the Plan:
1.At the beginning of the fiscal year, the CEO, with assistance from senior management, proposes annual Company Objectives, measurement criteria and weightings, subject to review and approval by the Compensation Committee.
2.At the beginning of the following fiscal year, the CEO and CFO evaluate performance levels and the achievement of these annual Company Objectives, which are subject to review and approval by the Compensation Committee. Specific bonus award recommendations for all participants are submitted by the CEO to the Compensation Committee for review and approval.
3.The Compensation Committee determines the bonus awards for individual participants based on the Target Awards and the Company’s performance against the Company Objectives.
Summary of 2023 performance measure and goals
The Compensation Committee may, at its discretion, elect to adjust bonuses or not to pay bonuses at all. A Target Award and the weight assigned to Company Objectives are determined based upon competitive market data derived from our peer group. The final incentive payout is determined based on the achievement of Company Objectives defined for each organizational level and position and the Target Award.
Our Company is focused on driving above-industry level growth through internal innovation, acquisitions, and expansion of applications for our products and services. With our focus on revenue growth, gross margin improvements, and positive adjusted EBITDA, we believe that revenue, gross margin, and Adjusted EBITDA are relevant metrics to reflect success. Revenue was the highest weighted Company Objective, and the remaining weighting was attributed to each of the other Company Objectives as recommended by management and approved by the Compensation Committee. We believe these are objectives that our executive team can directly impact, and that drive shareholder value.
For the 2023 Plan, the Compensation Committee set the following Company Objectives and related payout levels:
•Revenue (60%): For 2023, the revenue target was set at $194 million, which if achieved, would result in a payout of 60% of each NEOs Target Award. If the Company achieved revenues of $200 million, a 20% increase of payout would result and each NEOs Target Award would be paid at 72% with respect to the revenue metric. If achieved performance was below $194 million but at or above $186 million, a 20% reduction of payout would result and each NEOs Target Award would be paid at 48% with respect to the revenue metric. If achieved performance was below $186 million, then no payout would be made to the NEOs with respect to the revenue metric.
•Adjusted Gross Margin(1) (20%): For 2023, the adjusted gross margin target was set at 38%, which if achieved, would result in a payout of 20% of each NEOs Target Award. If the Company achieved adjusted gross margin of 40%, a 20% increase of payout would result and each NEOs Target Award would be paid at 24% with respect to the adjusted gross margin metric. If achieved performance was below 38% but at or above 36%, a 20% reduction of payout would result and each NEOs Target Award would be paid at 16% with respect to the adjusted gross margin
metric. If achieved performance was below 36%, then no payout would be made to the NEOs with respect to the adjusted gross margin metric.
•Adjusted EBITDA(1) (20%): For 2023, the adjusted EBITDA target was set at 8% of revenues, which if achieved, would result in a payout of 20% of each NEOs Target Award with respect to the adjusted EBITDA metric. If the Company achieved adjusted EBITDA of 10% of revenues, a 20% increase of payout would result and each NEOs Target Award would be paid at 24% with respect to the adjusted EBITDA metric. If achieved performance was below 8% of revenues but at or above 6% of revenues, a 20% reduction of payout would result and each NEOs Target Award would be paid at 16% with respect to the adjusted EBITDA metric. If achieved performance was below 6% of revenues, then no payout would be made to the NEOs with respect to the adjusted EBITDA metric.
(1) Adjusted Gross Margin and Adjusted EBITDA are non-GAAP metrics. A reconciliation of these metrics is provided below.
Non-GAAP metric reconciliation tables
Our Target Awards include the calculation of non-GAAP financial measures in which we believe provide useful information for evaluating business performance. When analyzing the Company's operating results, investors should not consider non-GAAP measures as substitutes for the comparable financial measures prepared in accordance with GAAP.
Adjusted gross margin reconciliation
| | | | | | | | | | | | | | | | | |
| Year Ended December 31, |
| 2023 | | 2022 | | 2021 |
| GAAP total revenues | $ | 143,271 | | | $ | 161,759 | | | $ | 119,156 | |
| GAAP cost of revenues | (96,519) | | | (107,937) | | | (82,108) | |
| COGS intangible asset amortization | (2,781) | | | (5,007) | | | (4,557) | |
| GAAP GROSS PROFIT | $ | 43,971 | | | $ | 48,815 | | | $ | 32,491 | |
| GAAP GROSS MARGIN | 30.7 | % | | 30.2 | % | | 27.3 | % |
| | | | | |
| ADJUSTMENTS TO GROSS PROFIT: | | | | | |
| Inventory step-up | — | | | 251 | | | 1,130 | |
| Inventory reserve costs | 2,334 | | | — | | | — | |
| Loss on disposal of assets | 286 | | | — | | | — | |
| Intangible asset amortization | 2,781 | | | 5,007 | | | 4,557 | |
| ADJUSTED GROSS PROFIT | $ | 49,372 | | | $ | 54,073 | | | $ | 38,178 | |
| ADJUSTED GROSS MARGIN | 34.5 | % | | 33.4 | % | | 32.0 | % |
Adjusted EBITDA reconciliation
| | | | | | | | | | | | | | | | | |
| Year Ended December 31, |
| 2023 | | 2022 | | 2021 |
| GAAP NET (LOSS) / INCOME | $ | (66,427) | | | $ | (139,805) | | | $ | (8,908) | |
| | | | | |
| ADJUSTMENTS: | | | | | |
| Interest expense, net | 1,812 | | | 687 | | | 485 | |
| Income tax (expense) benefit | 169 | | | (5,022) | | | (20,118) | |
| Depreciation | 7,126 | | | 6,834 | | | 4,800 | |
| Intangible asset amortization | 5,181 | | | 9,697 | | | 8,202 | |
| EBITDA | $ | (52,139) | | | $ | (127,609) | | | $ | (15,539) | |
| Share-based compensation (non-cash) | 31,670 | | | 25,334 | | | 13,974 | |
| Inventory step-up | — | | | 251 | | | 1,130 | |
| Acquisition and divestiture costs | 3,226 | | | 18 | | | 1,636 | |
| Severance costs | 1,591 | | | — | | | — | |
| Loss (gain) on disposal of assets | 477 | | | 683 | | | (145) | |
| Change in fair value of investments | — | | | (697) | | | — | |
| Change in fair value of contingent consideration | (2,193) | | | (4,754) | | | 2,875 | |
| Change in fair value of warrant liability | — | | | — | | | 121 | |
| Gain on settlement of Global Cooling escrow | (5,115) | | | — | | | — | |
| Asset impairment charges | 15,485 | | | 110,364 | | | — | |
| Inventory reserve costs | 2,334 | | | — | | | — | |
ADJUSTED EBITDA(1) | $ | (4,664) | | | $ | 3,590 | | | $ | 4,052 | |
| ADJUSTED EBITDA as a percentage of total revenues | (3.3 | %) | | 2.2 | % | | 3.4 | % |
(1) Adjusted EBITDA excluded executive bonuses from GAAP operating expenses to determine target award percentage.
Individual annual cash incentive targets
For the fiscal year ended December 31, 2023, the Company established a Target Award for each NEO Company Objectives, which are set forth below:
| | | | | | | | | | | |
| Name | Target Award as % of Salary for the Fiscal Year Ended December 31, 2023 | | Portion Tied to Company Objectives (%) |
| Roderick de Greef | 100 | | | 100 | |
| Michael Rice | 100 | | | 100 | |
| Aby J Mathew | 45 | | | 100 | |
| Troy Wichterman | 60 | | | 100 | |
| Geraint Phillips | 55 | | | 100 | |
| Karen Foster | 45 | | | 100 | |
Performance against 2023 company objectives
The following table summarizes the performance of the Company against its Objectives for the fiscal year ended December 31, 2023:
| | | | | |
| Company Objectives for the Fiscal Year Ended December 31, 2023 |
| Revenue target | Revenues of $143.3 million did not meet threshold |
| Adjusted Gross Margin target | Adjusted Gross Margin of 34.5% did not meet threshold |
| Adjusted EBITDA target | Adjusted EBITDA of (3.3%) did not meet threshold |
Annual bonus incentive payments under the plan
As stated above, the Company did not achieve its financial goals for 2023. As a result, the Compensation Committee did not award bonus payouts to NEOs.
Objectives for the fiscal year ending December 31, 2024
Our annual cash incentive compensation plan for the fiscal year ending December 31, 2024 is generally consistent with the program for the fiscal year ended December 31, 2023. The Compensation Committee, after reviewing assessments provided by management along with market data from FW Cook, determined each NEOs Target Award percentage of salary for the fiscal year 2024. Company Objectives, including revenue, adjusted gross margin, adjusted EBITDA, remediation of material weaknesses, system implementation metrics, and weightings were established to determine threshold, target, and maximum performance goals for the 2024 annual bonus.
Equity incentive compensation
The Compensation Committee believes that equity incentives in the form of service vesting-based restricted stock awards and market-based restricted stock awards are effective instruments for long-term compensation. Equity incentives align individual and team performance with the achievement of the Company’s strategic and financial goals, long-term value creation, and shareholders’ interests. Restricted stock awards are impacted by all stock price changes, so the value to the executive officers is affected by both increases and decreases in stock price from the market price at the date of grant.
For the fiscal year ended December 31, 2023, the Compensation Committee considered a number of factors in determining what, if any, equity incentive compensation to grant to the executive officers, including:
•the performance of the Company during the fiscal year
•the number of shares subject to, and exercise price of, outstanding options held by the executive officers
•the number of restricted stock units held by the executive officers
•the vesting schedule of the unvested equity awards held by the executive officers
•the financial statement impact of any equity award
•the amount and percentage of the total equity on a diluted basis held by the executive officers
•the available shares under the Company’s equity incentive plan
The target split of the long-term equity incentive compensation awards made to our NEOs, based upon dollar value, is 50% market-based, and 50% service vesting-based restricted stock awards. We granted our NEOs these equity incentive instruments in 2023, 2022 and 2021 and we anticipate that we will continue to include these grants as part of our long-term incentive compensation program going forward for the reasons noted above.
In January 2023, the Compensation Committee granted the following long-term incentive compensation awards to each of the named executive officers of the Company. These awards are split based upon dollar value between service vesting-based restricted stock awards (50%) and market-based restricted stock awards (50%).
| | | | | | | | | | | |
| Name | Service-vesting based stock awards (#) | | Market-based Stock Units (#) |
Roderick de Greef(1) | — | | — |
Michael Rice(2) | 99,038 | | 99,038 |
| Aby J Mathew | 20,940 | | 20,940 |
| Troy Wichterman | 34,296 | | 34,296 |
| Geraint Phillips | 21,223 | | 21,223 |
| Karen Foster | 16,978 | | 16,978 |
(1) As of the date of grant for the long-term incentive compensation awards, Mr. de Greef was a member of the Board of Directors and therefore did not receive the award above designated to the NEOs. However, Mr. de Greef was awarded 394,856 shares, vesting annually in four equal parts, upon appointment to Chief Executive Officer on October 19, 2023. All awarded shares were service-vesting based. Further details on all shares awarded are within the Grants of plan-based awards table below.
(2) Upon Mr. Rice's resignation on October 19, 2023, all service-vesting based shares, both vested and unvested, were accelerated. Only Mr. Rice's market-based stock granted during 2022 and 2023, which were 70,094 and 99,038 market-based shares, respectively, remain active and will vest only upon the achievement of the Company's performance against the 20 company peer group during the periods of January 1, 2022 through December 31, 2023 and January 1, 2023 through December 31, 2024, respectively.
Service vesting-based equity awards granted in 2023 will vest one-quarter of the shares in one year with the remainder vesting quarterly over three years. Market-based restricted stock awards contain a market condition based on Total Shareholder Return (“TSR”). The TSR market condition measures the Company’s performance against a peer group. The market-based restricted stock awards will vest as to between 0% and 200% of the number of restricted shares granted to each recipient based on our total shareholder return during the period beginning on January 1, 2023 through December 31, 2024 as compared to the total shareholder return of our 20 company peer group.
2024 long-term equity incentive compensation
In January 2024, the Compensation Committee granted long-term incentive compensation awards to each of the NEOs of the Company. Consistent with the Company’s compensation philosophy and objectives, as described above, these awards are split based upon dollar value between service vesting-based restricted stock (50%) and market-based restricted stock (50%), all of which are subject to similar vesting conditions to comparable service vesting-based and market-based instruments awarded by BioLife as discussed above.
Other compensation
All full-time employees, including the executive officers, are eligible to participate in the health benefits programs, including medical, dental and vision care coverage, disability and life insurance and the Company’s 401(k) plan. Under the 401(k) plan, the Company matches 100% of the first 4% of eligible compensation contributed by employees. Additionally, the Company reimburses the Chief Executive Officer for travel expenses and additional tax gross up payments to cover travel costs between the corporate headquarters and their personal residence.
Termination and change of control provisions
We have entered into agreements with our NEOs that provide certain benefits if employment is terminated under certain circumstances, including under certain circumstances in connection with a change of control. We believe that these protections serve our retention objectives by permitting our NEOs to maintain continued focus and dedication to their responsibilities in order to maximize shareholder value, including in the event of a transaction that could result in a change of control of the Company. We believe that these protections promote the stability, continuity and impartiality of our executives in a change of control situation.
Tax and accounting considerations
We have not provided or agreed to provide any of the Company’s executive officers or directors with a gross-up or other reimbursement for tax amounts they might pay pursuant to Section 4999 or Section 409A of the Code. Sections 280G and 4999 of the Code provide that executive officers, directors who hold significant shareholder interests and certain other service providers could be subject to significant additional taxes if they receive payments or benefits in connection with a change in control of the Company that exceed certain limits, and that we or our successor could lose a deduction on the amounts subject to the additional tax. Section 409A also imposes additional significant taxes on the individual in the event that an employee, director or service provider receives “deferred compensation” that is not exempt from or does not meet the requirements of Section 409A.
For the Company’s financial statements, cash compensation, such as salary and bonus, is expensed and for income tax returns, cash compensation is generally deductible except as set forth below. For equity-based compensation, we expense the fair value of such grants over the requisite service period.
Generally, Section 162(m) of the Code disallows a federal income tax deduction for public corporations of remuneration in excess of $1 million paid for any fiscal year to its chief executive officer, chief financial officer, and certain other current and former highly compensated employees that qualify as “covered employees” within the meaning of Section 162(m). The Compensation Committee believes that shareholder interests are best served if the Compensation Committee retains maximum flexibility to design executive compensation programs that meet stated business objectives. For these reasons, the Compensation Committee, while considering tax deductibility as a factor in determining executive compensation, may not limit such compensation to those levels that will be deductible.
Incentive compensation clawback policy
As required by the Dodd-Frank Wall Street Reform and Consumer Protection Act of 2010 (Dodd-Frank Act), we maintain a clawback policy, which requires that certain incentive compensation paid to any current or former executive officer, including our NEOs, will be subject to recoupment if (x) the incentive compensation was calculated based on financial statements that were required to be restated due to material noncompliance with financial reporting requirements, without regard to any fault or misconduct, and (y) that noncompliance resulted in overpayment of the incentive compensation within the three fiscal years preceding the fiscal year in which the restatement was required. Incentive compensation subject to the clawback policy consists of compensation that is granted, earned or vested based wholly or in part upon the attainment of a financial reporting measure (as defined in the rules implementing such requirement), including stock price and total shareholder return, on and after October 2, 2023.
Compensation risk assessment
The Compensation Committee not only considers and evaluates risks related to the Company’s cash and equity-based compensation programs and practices, but also evaluates whether the Company’s compensation plans encourage participants to take excessive risks that are reasonably likely to have a material adverse effect on the Company. Consistent with SEC disclosure requirements, the Compensation Committee has worked with management to assess compensation policies and practices for Company employees and has concluded that such policies and practices do not create risks that are reasonably likely to have a material adverse effect on the Company.
Executive compensation tables
Summary compensation table
The following table summarizes the compensation earned during the fiscal years ended December 31, 2023, 2022, and 2021 by the Company’s named executive officers, as such officers are determined in accordance with Regulation S-K (each referred to herein as a “named executive officer” or “NEO”).
| | | | | | | | | | | | | | | | | | | | | | | | | | | | | | | | | | | | | | | | | | | | | | | | | | | | | | | | |
Name and Principal
Positions
(a) | | Year
(b) | | Salary
($)
(c)(1) | | | Bonus
($) (d) | | | Stock
Awards
($) (e)(2) | | | Non-Equity
Incentive Plan
Compensation
($) (f)(3) | | All Other
Compensation
($) (g) | | | Total
($)
(h) |
| | | | | | | | | | | | | | | | | | |
| Roderick de Greef | | 2023 | | 198,890 | | (4) | | 62,740 | | (5) | | 4,588,883 | | (6) | | — | | | 466,285 | | (7) | | 5,316,798 | |
| Chief Executive Officer and | | 2022 | | 450,000 | | | | — | | | | 1,747,823 | | (8) | | 185,850 | | | — | | | | 2,383,673 | |
| Chairman of the Board | | 2021 | | 412,137 | | | | — | | | | 544,603 | | (9) | | 223,850 | | | — | | | | 1,180,590 | |
| | | | | | | | | | | | | | | | | | |
| Michael Rice | | 2023 | | 567,200 | | (10) | | — | | | | 3,603,003 | | (11) | | — | | | 730,252 | | (12) | | 4,900,455 | |
| Former Chief Executive Officer | | 2022 | | 645,000 | | | | — | | | | 3,703,620 | | (13) | | 380,550 | | | — | | | | 4,729,170 | |
| and Chairman of the Board | | 2021 | | 641,019 | | | | — | | | | 1,005,813 | | (14) | | 603,075 | | | — | | | | 2,249,907 | |
| | | | | | | | | | | | | | | | | | |
| Aby J. Mathew | | 2023 | | 435,000 | | | | — | | | | 897,488 | | (15) | | — | | | 13,200 | | (16) | | 1,345,688 | |
| Executive Vice President and | | 2022 | | 419,750 | | | | — | | | | 1,155,834 | | (17) | | 111,510 | | | 12,200 | | | | 1,699,294 | |
| Chief Scientific Officer | | 2021 | | 419,750 | | | | — | | | | 579,568 | | (18) | | 207,776 | | | 11,266 | | | | 1,218,360 | |
| | | | | | | | | | | | | | | | | | |
| Troy Wichterman | | 2023 | | 472,000 | | | | — | | | | 1,212,021 | | (19) | | — | | | 13,200 | | (20) | | 1,697,221 | |
| Chief Financial Officer | | 2022 | | 375,000 | | | | — | | | | 1,245,968 | | (21) | | 121,688 | | | 12,200 | | | | 1,754,856 | |
| | 2021 | | 249,077 | | | | — | | | | 280,024 | | (22) | | 30,000 | | | 11,463 | | | | 570,564 | |
| | | | | | | | | | | | | | | | | | |
| Geraint Phillips | | 2023 | | 380,000 | | | | — | | | | 909,617 | | (23) | | — | | | 13,200 | | (24) | | 1,302,817 | |
| Senior Vice President | | 2022 | | 300,000 | | | | — | | | | 482,254 | | (25) | | 45,600 | | | 12,200 | | | | 840,054 | |
| Global Operations | | 2021 | | 237,415 | | | | — | | | | 266,023 | | (26) | | — | | | — | | | | 503,438 | |
| | | | | | | | | | | | | | | | | | |
| Karen Foster | | 2023 | | 382,000 | | | | — | | | | 727,677 | | (27) | | — | | | 13,200 | | (28) | | 1,122,877 | |
| Chief Quality and Operations | | 2022 | | 356,500 | | | | — | | | | 891,900 | | (29) | | 84,252 | | | 12,200 | | | | 1,344,852 | |
| Officer | | 2021 | | 356,500 | | | | — | | | | 492,530 | | (30) | | 156,860 | | | 11,518 | | | | 1,017,408 | |
________________________
(1)Reflects base salary earned in each applicable period.
(2)Represents the the aggregate grant-date fair value of restricted stock measured in accordance with ASC Topic 718, excluding the effect of estimated forfeitures. The assumptions used in the valuation are consistent with the valuation methodologies specified in the notes to our consolidated financial statements included in this Form 10-K.
(3)The named executive officers’ Cash Incentive Plan awards are based on the performance of the Company relative to predetermined financial goals (Company Objectives) that closely align compensation with the Company’s performance. The threshold, target, and maximum payout amounts for each named executive officer’s Cash Incentive Plan payout opportunity for 2023 are shown in the table entitled Grants of Plan-Based Awards table below.
(4)The base salary reflected here is prorated for the period in which Mr. de Greef served as Chief Executive Officer. Mr. de Greef was appointed on October 19, 2023 to the position at a base salary of $744,450. The base salary presented reflects his service as CEO from his date of appointment through December 31, 2023. Mr. de Greef's salary also reflects his board retainer compensation for services performed as a Board Member from January 4, 2023 through October 18, 2023.
(5)This bonus reflects Mr. de Greef's extraordinary award provided by the BOD for extraordinary services as a director upon his appointment to Chief Executive Officer and Chairman on October 19, 2023.
(6)Represents the grant-date fair value of 394,856 service vesting-based restricted stock granted on October 19, 2023. The service vesting-based restricted stock award granted October 19, 2023 will vest 1/4 of the shares annually over 4 years so long as Mr. de Greef remains employed by the Company through such date, provided that all unvested shares as of January 1, 2027 shall fully vest. The total fair value of shares awarded reflected here do not reflect the fair value of shares awarded to Mr. de Greef during his service as a Director on the BOD from January 4, 2023 through October 18, 2023. These shares are reflected in the Director compensation section below.
(7)This amount represents the $450,000 severance Mr. de Greef received upon his retirement from the Company on January 3, 2023 prior to being appointed to the BOD and subsequently reappointed to Chief Executive Officer as of October 19, 2023. The amount also includes $16,285 of travel expense reimbursement provided to Mr. de Greef for travel between his personal residence and corporate headquarters in Bothell, Washington. Per his employment agreement, Mr. de Greef is eligible for up to $75,000 in travel expense reimbursement each year.
(8)Represents fair value of 23,365 service vesting-based restricted stock and 23,365 market-based restricted stock granted on February 24, 2022, 12,068 service vesting-based restricted stock awards granted on January 3, 2022, and 5,882 service vesting-based restricted stock awards granted in lieu of salary on various dates from May 2022 through August 2022. The service vesting-based restricted stock award granted February 24, 2022 will vest 1/4 of the shares on February 24, 2023 with the remainder vesting quarterly over 3 years. The market-based restricted stock awards will vest as to between 0% and 200% of the number of restricted shares granted to each recipient based on our total shareholder return during the period beginning on January 1, 2022 through December 31, 2023 as compared to the total shareholder return of our 20 company peer group. The service vesting-based restricted award granted on January 3, 2022 vested 1/4 each quarter end during 2022 and was fully vested on December 31, 2022.
(9)Represents fair value of 4,740 service vesting-based restricted stock and 4,740 market-based restricted stock granted on February 8, 2021, and 3,222 service vesting-based restricted stock granted on April 12, 2021. The service vesting-based restricted stock award granted February 8, 2021 vests in 4 quarterly increments beginning on January 1, 2022, provided that Mr. de Greef continues to be employed with BioLife through the vesting dates. The market-based restricted stock awards will vest as to between 0% and 200% of the number of restricted shares granted to each recipient based on our total shareholder return during the period beginning on January 1, 2021 through December 31, 2022 as compared to the total shareholder return of our 20 company peer group. The service vesting-based restricted award granted April 12, 2021 fully vested October 12, 2021.
(10)The base salary reflected here is prorated for the period in which Mr. Rice served as Chief Executive Officer. Mr. Rice retired from his position on October 19, 2023, which had a base salary of $709,000. The base salary presented reflects his service as CEO from January 1, 2023 through his date of retirement.
(11)Represents fair value of 99,038 service vesting-based restricted stock and 99,038 market-based restricted stock granted on January 8, 2023. The service vesting-based restricted stock award granted January 8, 2023 was accelerated and fully vested as of Mr. Rice's retirement date of October 19, 2023. The market-based restricted stock awards will vest as to between 0% and 200% of the number of restricted shares granted to each recipient based on our total shareholder return during the period beginning on January 1, 2023 through December 31, 2024 as compared to the total shareholder return of our 20 company peer group.
(12)Represents the severance paid out to Mr. Rice upon his resignation from the Company on October 19, 2023.
(13)Represents fair value of 70,094 service vesting-based restricted stock and 70,094 market-based restricted stock granted on February 24, 2022, and 5,537 service vesting-based restricted stock awards granted in lieu of salary on various dates from May 2022 through August 2022. The service vesting-based restricted stock award granted February 24, 2022 vested 1/4 of the shares on February 24, 2023 with the remainder vesting quarterly over 3 years. The market-based restricted stock awards will vest as to between 0% and 200% of the number of restricted shares granted to each recipient based on our total shareholder return during the period beginning on January 1, 2022 through December 31, 2023 as compared to the total shareholder return of our 20 company peer group.
(14)Represents fair value of 7,511 service vesting-based restricted stock and 7,511 market-based restricted stock granted on February 8, 2021, and 8,487 service vesting-based restricted stock granted on April 12, 2021. The service vesting-based restricted stock award granted February 8, 2021 vested 1/4 of the shares on February 8, 2022 with the remainder vesting quarterly over 3 years. The service vesting-based restricted award granted April 12, 2021 fully vested October 12, 2021. The market-based restricted stock awards will vest as to between 0% and 200% of the number of restricted shares granted to each recipient based on our total shareholder return during the period beginning on January 1, 2021 through December 31, 2022 as compared to the total shareholder return of our 20 company peer group. The performance-based restricted stock vested at 100% of the
number of restricted shares granted to each recipient based on achievement of specified performance metrics approved by the Compensation Committee.
(15)Represents fair value of 20,940 service vesting-based restricted stock and 20,940 market-based restricted stock granted on January 8, 2023. The service vesting-based restricted stock award granted January 8, 2023 vested 1/4 of the shares on January 3, 2024 with the remainder vesting quarterly over 3 years. The market-based restricted stock awards will vest as to between 0% and 200% of the number of restricted shares granted to each recipient based on our total shareholder return during the period beginning on January 1, 2023 through December 31, 2024 as compared to the total shareholder return of our 20 company peer group.
(16)This amount represents the match paid by the Company on behalf of such individual into the Company 401(k) plan on 100% of the first 4% of eligible compensation contributed by such individual during the fiscal year 2023.
(17)Represents fair value of 21,029 service vesting-based restricted stock and 21,029 market-based restricted stock granted on February 24, 2022, and 4,514 service vesting-based restricted stock awards granted in lieu of salary on various dates from May 2022 through August 2022. The service vesting-based restricted stock award granted February 24, 2022 vested 1/4 of the shares on February 24, 2023 with the remainder vesting quarterly over 3 years. The market-based restricted stock awards will vest as to between 0% and 200% of the number of restricted shares granted to each recipient based on our total shareholder return during the period beginning on January 1, 2022 through December 31, 2023 as compared to the total shareholder return of our 20 company peer group.
(18)Represents fair value of 4,891 service vesting-based restricted stock and 4,891 market-based restricted stock granted on February 8, 2021, and 3,360 service vesting-based restricted stock granted on April 12, 2021. The service vesting-based restricted stock award granted February 8, 2021 vested 1/4 of the shares on February 8, 2022 with the remainder vesting quarterly over 3 years. The service vesting-based restricted award granted April 12, 2021 fully vested October 12, 2021. The market-based restricted stock awards will vest as to between 0% and 200% of the number of restricted shares granted to each recipient based on our total shareholder return during the period beginning on January 1, 2021 through December 31, 2022 as compared to the total shareholder return of our 20 company peer group. The performance-based restricted stock vested at 100% of the number of restricted shares granted to each recipient based on achievement of specified performance metrics approved by the Compensation Committee.
(19)Represents fair value of 34,296 service vesting-based restricted stock and 34,296 market-based restricted stock granted on January 8, 2023. The service vesting-based restricted stock award granted January 8, 2023 vested 1/4 of the shares on January 3, 2024 with the remainder vesting quarterly over 3 years. The market-based restricted stock awards will vest as to between 0% and 200% of the number of restricted shares granted to each recipient based on our total shareholder return during the period beginning on January 1, 2023 through December 31, 2024 as compared to the total shareholder return of our 20 company peer group.
(20)This amount represents the match paid by the Company on behalf of such individual into the Company 401(k) plan on 100% of the first 4% of eligible compensation contributed by such individual during the fiscal year 2023.
(21)Represents fair value of 23,365 service vesting-based restricted stock and 23,365 market-based restricted stock granted on February 24, 2022, and 2,574 service vesting-based restricted stock awards granted in lieu of salary on various dates from May 2022 through August 2022. The service vesting-based restricted stock award granted February 24, 2022 vested 1/4 of the shares on February 24, 2023 with the remainder vesting quarterly over 3 years. The market-based restricted stock awards will vest as to between 0% and 200% of the number of restricted shares granted to each recipient based on our total shareholder return during the period beginning on January 1, 2022 through December 31, 2023 as compared to the total shareholder return of our 20 company peer group.
(22)Represents fair value of 5,680 service vesting-based restricted stock granted on August 9, 2021. The service vesting-based stock award vested 1/4 of the shares on August 9, 2022 with the remainder vesting quarterly over 3 years.
(23)Represents fair value of 21,223 service vesting-based restricted stock and 21,223 market-based restricted stock granted on January 8, 2023. The service vesting-based restricted stock award granted January 8, 2023 vested 1/4 of the shares on January 3, 2024 with the remainder vesting quarterly over 3 years. The market-based restricted stock awards will vest as to between 0% and 200% of the number of restricted shares granted to each recipient based on our total shareholder return during the period beginning on January 1, 2023 through December 31, 2024 as compared to the total shareholder return of our 20 company peer group.
(24)This amount represents the match paid by the Company on behalf of such individual into the Company 401(k) plan on 100% of the first 4% of eligible compensation contributed by such individual during the fiscal year 2023.
(25)Represents fair value of 9,346 service vesting-based restricted stock and 9,346 market-based restricted stock granted on February 24, 2022. The service vesting-based restricted stock award granted February 24, 2022 vested 1/4 of the shares on February 24, 2023 with the remainder vesting quarterly over 3 years. The market-based restricted stock awards will vest as to between 0% and 200% of the number of restricted shares granted to each recipient based on our total shareholder return during the period beginning on January 1, 2022 through December 31, 2023 as compared to the total shareholder return of our 20 company peer group.
(26)Represents fair value of 5,396 service vesting-based restricted stock granted to Mr. Phillip's on August 9, 2021 at the discretion of the Compensation Committee upon the closing of the acquisition of Global Cooling, Inc. The service vesting-based restricted stock award granted August 9, 2021 vested 1/4 of the shares on August 9, 2022 with the remainder vesting quarterly over 3 years.
(27)Represents fair value of 16,978 service vesting-based restricted stock and 16,978 market-based restricted stock granted on January 8, 2023. The service vesting-based restricted stock award granted January 8, 2023 vested 1/4 of the shares on January 3, 2024 with the remainder vesting quarterly over 3 years. The market-based restricted stock awards will vest as to between 0% and 200% of the number of restricted shares granted to each recipient based on our total shareholder return during the period beginning on January 1, 2023 through December 31, 2024 as compared to the total shareholder return of our 20 company peer group.
(28)This amount represents the match paid by the Company on behalf of such individual into the Company 401(k) plan on 100% of the first 4% of eligible compensation contributed by such individual during the fiscal year 2023.
(29)Represents fair value of 16,536 service vesting-based restricted stock and 16,536 market-based restricted stock granted on February 24, 2022 and 3,059 service vesting-based restricted stock awards granted in lieu of salary on various dates from May 2022 through August 2022. The service vesting-based restricted stock award granted February 24, 2022 vested 1/4 of the shares on February 24, 2023 with the remainder vesting quarterly over 3 years. The market-based restricted stock awards will vest as to between 0% and 200% of the number of restricted shares granted to each recipient based on our total shareholder return during the period beginning on January 1, 2022 through December 31, 2023 as compared to the total shareholder return of our 20 company peer group.
(30)Represents fair value of 4,157 service vesting-based restricted stock and 4,157 market-based restricted stock granted on February 8, 2021 and 2,854 service vesting-based restricted stock granted on April 12, 2021. The service vesting-based restricted stock award granted February 8, 2021 vested 1/4 of the shares on February 8, 2022 with the remainder vesting quarterly over 3 years. The service vesting-based restricted award granted April 12, 2021 fully vested October 12, 2021. The market-based restricted stock awards will vest as to between 0% and 200% of the number of restricted shares granted to each recipient based on our total shareholder return during the period beginning on January 1, 2021 through December 31, 2022 as compared to the total shareholder return of our 20 company peer group. The performance-based restricted stock vested at 100% of the number of restricted shares granted to each recipient based on achievement of specified performance metrics approved by the Compensation Committee.
The following table reflects the allocation of base salary, cash incentive compensation, equity incentive compensation, and other compensation earned by the Company’s NEOs in the fiscal year 2023 as set forth in the 2023 Summary Compensation Table above.
| | | | | | | | | | | | | | | | | | | | | | | |
| Name | Long-Term Incentives (%) | | Short-Term Incentives (%) | | Base Salary (%) | | Total Compensation ($) |
| Roderick de Greef | 86 | | | 10 | | | 4 | | | 5,316,798 | |
| Michael Rice | 74 | | | 14 | | | 12 | | | 4,900,455 | |
| Aby J Mathew | 68 | | | — | | | 32 | | | 1,345,688 | |
| Troy Wichterman | 71 | | | — | | | 29 | | | 1,697,221 | |
| Geraint Phillips | 70 | | | — | | | 30 | | | 1,302,817 | |
| Karen Foster | 66 | | | — | | | 34 | | | 1,122,877 | |
Grants of plan-based awards
The following table sets forth certain information regarding each grant of plan-based awards made to a named executive officer in the last completed fiscal year under any plan, including awards that subsequently have been transferred.
| | | | | | | | | | | | | | | | | | | | | | | | | | | | | | | | | | | | | | | | | | | | | | | | | | | | | | | | | | | | | | |
| | | | | | Estimated Future Payouts Under
Non-Equity Incentive Plan Awards | | Estimated Future Payouts Under
Equity Incentive Plan Awards | | All Other Stock
Awards: Number of | | Grant Date
Fair Value of |
| Name (a) | | Award Type | | Grant Date
(b) | | Threshold
(#) (c) | | Target
(#) (d) | | Maximum
(#) (e) | | Threshold
(#) (c) | | Target
(#) (d) | | Maximum
(#) (e) | | Shares of Stock
or Units (#) (e) | | Stock Awards
($) (f) (1) |
| | | | | | | | | | | | | | | | | | | | |
| Roderick de Greef | | Cash incentive | | - | | 119,112 | | 744,450 | | 893,340 | | — | | — | | — | | — | | — | |
| Roderick de Greef | | Service-vesting RSUs | | 10/19/2023 | | | | | | | | — | | — | | — | | 394,856 | | 4,418,439 | |
| Roderick de Greef | | Service-vesting RSUs | | 1/3/2023 | | | | | | | | — | | — | | — | | 9,646 | | 170,445 | |
| Roderick de Greef | | In lieu of director fees | | 10/1/2023(2) | | | | | | | | — | | — | | — | | 362 | | 4,999 | |
| Michael Rice | | Market-based RSUs | | 1/3/2023 | | | | | | | | — | | 99,038 | | 198,076 | | — | | 2,494,767 | |
| Michael Rice | | Service-vesting RSUs | | 1/3/2023 | | | | | | | | — | | — | | — | | 99,038 | | 1,108,235 | |
| Michael Rice | | In lieu of salary | | 8/25/2023(2) | | | | | | | | — | | — | | — | | 1,248 | | 13,628 | |
| Michael Rice | | In lieu of salary | | 9/8/2023(2) | | | | | | | | — | | — | | — | | 1,022 | | 13,623 | |
| Michael Rice | | In lieu of salary | | 9/22/2023(2) | | | | | | | | — | | — | | — | | 290 | | 3,814 | |
| Michael Rice | | In lieu of salary | | 10/6/2023(2) | | | | | | | | — | | — | | — | | 282 | | 3,818 | |
| Michael Rice | | In lieu of salary | | 10/20/2023(2) | | | | | | | | — | | — | | — | | 771 | | 7,864 | |
| Aby J. Mathew | | Cash incentive | | - | | 31,320 | | 195,750 | | 234,900 | | — | | — | | — | | — | | — | |
| Aby J. Mathew | | Market-based RSUs | | 1/3/2023 | | | | | | | | — | | 20,940 | | 41,880 | | — | | 527,479 | |
| Aby J. Mathew | | Service-vesting RSUs | | 1/3/2023 | | | | | | | | — | | — | | — | | 20,940 | | 370,010 | |
| Aby J. Mathew | | In lieu of salary | | 8/25/2023(2) | | | | | | | | — | | — | | — | | 966 | | 10,549 | |
| Aby J. Mathew | | In lieu of salary | | 9/8/2023(2) | | | | | | | | — | | — | | — | | 792 | | 10,557 | |
| Aby J. Mathew | | In lieu of salary | | 9/22/2023(2) | | | | | | | | — | | — | | — | | 802 | | 10,546 | |
| Aby J. Mathew | | In lieu of salary | | 10/6/2023(2) | | | | | | | | — | | — | | — | | 779 | | 10,548 | |
| Aby J. Mathew | | In lieu of salary | | 10/20/2023(2) | | | | | | | | — | | — | | — | | 1,034 | | 10,547 | |
| Aby J. Mathew | | In lieu of salary | | 11/3/2023(2) | | | | | | | | — | | — | | — | | 924 | | 10,552 | |
| Aby J. Mathew | | In lieu of salary | | 11/17/2023(2) | | | | | | | | — | | — | | — | | 826 | | 10,548 | |
| Aby J. Mathew | | In lieu of salary | | 12/1/2023(2) | | | | | | | | — | | — | | — | | 796 | | 10,547 | |
| Aby J. Mathew | | In lieu of salary | | 12/15/2023(2) | | | | | | | | — | | — | | — | | 705 | | 10,540 | |
| Troy Wichterman | | Cash incentive | | - | | 45,312 | | 283,200 | | 339,840 | | — | | — | | — | | — | | — | |
| Troy Wichterman | | Market-based RSUs | | 1/3/2023 | | | | | | | | — | | 34,296 | | 68,592 | | — | | 606,010 | |
| Troy Wichterman | | Service-vesting RSUs | | 1/3/2023 | | | | | | | | — | | — | | — | | 34,296 | | 606,010 | |
| Troy Wichterman | | In lieu of salary | | 8/25/2023(2) | | | | | | | | — | | — | | — | | 498 | | 5,438 | |
| Troy Wichterman | | In lieu of salary | | 9/8/2023(2) | | | | | | | | — | | — | | — | | 408 | | 5,439 | |
| Troy Wichterman | | In lieu of salary | | 9/22/2023(2) | | | | | | | | — | | — | | — | | 290 | | 3,814 | |
| Troy Wichterman | | In lieu of salary | | 10/6/2023(2) | | | | | | | | — | | — | | — | | 281 | | 3,805 | |
| Troy Wichterman | | In lieu of salary | | 10/20/2023(2) | | | | | | | | — | | — | | — | | 373 | | 3,805 | |
| Troy Wichterman | | In lieu of salary | | 11/3/2023(2) | | | | | | | | — | | — | | — | | 333 | | 3,803 | |
| Troy Wichterman | | In lieu of salary | | 11/17/2023(2) | | | | | | | | — | | — | | — | | 298 | | 3,805 | |
| Troy Wichterman | | In lieu of salary | | 12/1/2023(2) | | | | | | | | — | | — | | — | | 287 | | 3,803 | |
| Troy Wichterman | | In lieu of salary | | 12/15/2023(2) | | | | | | | | — | | — | | — | | 254 | | 3,797 | |
| Geraint Phillips | | Cash incentive | | - | | 33,440 | | 209,000 | | 250,800 | | — | | — | | — | | — | | — | |
| Geraint Phillips | | Market-based RSUs | | 1/3/2023 | | | | | | | | — | | 21,223 | | 42,446 | | — | | 534,607 | |
| Geraint Phillips | | Service-vesting RSUs | | 1/3/2023 | | | | | | | | — | | — | | — | | 21,223 | | 375,010 | |
| Geraint Phillips | | In lieu of salary | | 8/25/2023(2) | | | | | | | | — | | — | | — | | 401 | | 4,379 | |
| Geraint Phillips | | In lieu of salary | | 9/8/2023(2) | | | | | | | | — | | — | | — | | 328 | | 4,372 | |
| Geraint Phillips | | In lieu of salary | | 9/22/2023(2) | | | | | | | | — | | — | | — | | 221 | | 2,906 | |
| Geraint Phillips | | In lieu of salary | | 10/6/2023(2) | | | | | | | | — | | — | | — | | 219 | | 2,965 | |
| Geraint Phillips | | In lieu of salary | | 10/20/2023(2) | | | | | | | | — | | — | | — | | 291 | | 2,968 | |
| | | | | | | | | | | | | | | | | | | | | | | | | | | | | | | | | | | | | | | | | | | | | | | | | | | | | | | | | | | | | | |
| Geraint Phillips | | In lieu of salary | | 11/3/2023(2) | | | | | | | | — | | — | | — | | 262 | | 2,992 | |
| Geraint Phillips | | In lieu of salary | | 11/17/2023(2) | | | | | | | | — | | — | | — | | 234 | | 2,988 | |
| Geraint Phillips | | In lieu of salary | | 12/1/2023(2) | | | | | | | | — | | — | | — | | 229 | | 3,034 | |
| Geraint Phillips | | In lieu of salary | | 12/15/2023(2) | | | | | | | | — | | — | | — | | 211 | | 3,154 | |
| Karen Foster | | Cash incentive | | - | | 27,504 | | 171,900 | | 206,280 | | — | | — | | — | | — | | — | |
| Karen Foster | | Market-based RSUs | | 1/3/2023 | | | | | | | | — | | 16,978 | | 33,956 | | — | | 427,676 | |
| Karen Foster | | Service-vesting RSUs | | 1/3/2023 | | | | | | | | — | | — | | — | | 16,978 | | 300,001 | |
| Karen Foster | | In lieu of salary | | 8/25/2023(2) | | | | | | | | — | | — | | — | | 403 | | 4,401 | |
| Karen Foster | | In lieu of salary | | 9/8/2023(2) | | | | | | | | — | | — | | — | | 330 | | 4,399 | |
| Karen Foster | | In lieu of salary | | 9/22/2023(2) | | | | | | | | — | | — | | — | | 260 | | 3,419 | |
| Karen Foster | | In lieu of salary | | 10/6/2023(2) | | | | | | | | — | | — | | — | | 252 | | 3,412 | |
| Karen Foster | | In lieu of salary | | 10/20/2023(2) | | | | | | | | — | | — | | — | | 335 | | 3,417 | |
| Karen Foster | | In lieu of salary | | 11/3/2023(2) | | | | | | | | — | | — | | — | | 299 | | 3,415 | |
| Karen Foster | | In lieu of salary | | 11/17/2023(2) | | | | | | | | — | | — | | — | | 267 | | 3,410 | |
| Karen Foster | | In lieu of salary | | 12/1/2023(2) | | | | | | | | — | | — | | — | | 258 | | 3,419 | |
| Karen Foster | | In lieu of salary | | 12/15/2023(2) | | | | | | | | — | | — | | — | | 228 | | 3,409 | |
(1)The fair value of the market-based restricted stock awards is estimated at the date of grant using the Monte Carlo Simulation model.
(2)The grants awarded on dates indicated here were made in lieu of salary for each applicable pay period.
Discussion of summary compensation table and grants of plan-based awards table
The Company’s executive compensation policies and practices, pursuant to which the compensation set forth in the Summary Compensation Table and the Grants of Plan-Based Awards Table was paid or awarded, are described above under “Compensation Discussion and Analysis.” The material terms of employment agreements and arrangements with the Company’s named executive officers are described below under the heading “Employment Arrangements.” The material terms of the equity awards disclosed in the grants-of plan-based awards table are listed in the footnotes to the Summary Compensation Table, above.
Outstanding equity awards at December 31, 2023
The following table sets forth certain information regarding the outstanding stock option grants and stock awards held by the NEOs at December 31, 2023. Awards were made under both the 2013 Performance Incentive Plan and 2023 Omnibus Performance Incentive Plan. For the outstanding stock option grants and stock awards described below, vesting is conditioned on the NEO remaining in service to the Company through such vesting date. Such awards may also be subject to accelerated vesting as described in “Potential Payments Upon Termination or Change in Control.”
| | | | | | | | | | | | | | | | | | | | | | | | | | | | | | | | |
| | OPTION AWARDS |
| Name (a) | | Number of Securities Underlying Unexercised Options (#) Exercisable (b) | | Number of Securities Underlying Unexercised Options (#) Unexercisable (c) | | Equity Incentive Plan Awards:
Number of Securities Underlying Unexercised Unearned Options (#) (d) | | Option Exercise Price ($) (e) | | Option Expiration Date (f) |
| Aby J. Mathew | | 50,000 | | –– | | –– | | 2.06 | | | 5/4/2025(1) |
| | | | | | | | | | |
| Karen Foster | | 100,000 | | –– | | –– | | 1.90 | | | 4/13/2026(1) |
(1)This award is fully vested.
| | | | | | | | | | | | | | | | | | | | | | | | | | | | | | | | | | | | | | |
| | UNVESTED SHARES |
| Name (a) | | Grant Date (b) | | Number of shares or units of stock that have not vested (#) (c) | | | Market value of shares of units of stock that have not vested (1) ($) (d) | | Equity incentive plan awards:
Number of unearned shares, units or other rights that have not vested (#) (e) | | | Equity incentive plan awards:
Market or payout value of unearned shares, units or other rights that have not vested ($) (f) |
| Roderick de Greef | | 1/4/2023 | | 9,646 | | (2) | | 156,748 | | | — | | | | — | |
| Roderick de Greef | | 10/19/2023 | | 394,856 | (3) | | 6,416,410 | | — | | | | — | |
| | | | | | | | | | | | |
| Michael Rice | | 2/24/2022 | | — | | | | — | | | 70,094 | | (4) | | 1,139,028 | |
| Michael Rice | | 1/3/2023 | | — | | | | — | | | 99,038 | | (5) | | 1,609,368 | |
| | | | | | | | | | | | |
| Aby J. Mathew | | 3/25/2020 | | 1,779 | (6) | | 28,909 | | — | | | | — | |
| Aby J. Mathew | | 2/8/2021 | | 1,529 | (7) | | 24,846 | | — | | | | — | |
| Aby J. Mathew | | 2/24/2022 | | 11,829 | (8) | | 192,221 | | 21,029 | (9) | | 341,721 | |
| Aby J. Mathew | | 1/3/2023 | | 20,940 | (10) | | 340,275 | | 20,940 | (11) | | 340,275 | |
| | | | | | | | | | | | |
| Troy Wichterman | | 6/19/2020 | | 2,663 | (12) | | 43,274 | | — | | | | — | |
| Troy Wichterman | | 8/9/2021 | | 1,775 | (13) | | 28,844 | | — | | | | — | |
| Troy Wichterman | | 2/24/2022 | | 13,143 | (14) | | 213,574 | | 23,365 | | (15) | | 379,681 | |
| Troy Wichterman | | 1/3/2023 | | 34,296 | (16) | | 557,310 | | 34,296 | (17) | | 557,310 | |
| | | | | | | | | | | | |
| Geraint Phillips | | 8/9/2021 | | 2,361 | (18) | | 38,366 | | — | | | | — | |
| Geraint Phillips | | 2/24/2022 | | 5,258 | (19) | | 85,443 | | 9,346 | (20) | | 151,873 | |
| Geraint Phillips | | 1/3/2023 | | 21,223 | (21) | | 344,874 | | 21,223 | (22) | | 344,874 | |
| | | | | | | | | | | | |
| Karen Foster | | 3/25/2020 | | 1,511 | (23) | | 24,554 | | — | | | | — | |
| Karen Foster | | 2/8/2021 | | 1,300 | (24) | | 21,125 | | — | | | | — | |
| Karen Foster | | 2/24/2022 | | 9,201 | (25) | | 149,516 | | 16,356 | (26) | | 265,785 | |
| Karen Foster | | 1/3/2023 | | 16,978 | (27) | | 275,893 | | 16,978 | (28) | | 275,893 | |
(1)The dollar amounts shown in columns (d) and (f) are determined by multiplying the number of shares or units shown in column (c) or (e), as applicable, by $16.25, the closing price of BioLife’s common stock on December 31, 2023.
(2)9,646 unvested service vesting-based RSAs subject to this award vested January 4, 2024. This award was provided to Mr. de Greef upon his appointment to the BOD on January 4, 2023.
(3)394,856 service vesting-based RSAs subject to this award are scheduled to vest in 4 equal quarterly increments measured from the grant date, provided that Mr. de Greef continues to be employed with BioLife through the vesting dates.
(4)The target number of 70,094 market-based RSAs is shown. Between 0% and 200% of the target number of market-based RSAs vest based on our total shareholder return during (“TSR”) compared to our 20 company peer group over the relevant two-year performance period between January 1, 2022 and December 31, 2023.
(5)The target number of 99,038 market-based RSAs is shown. Between 0% and 200% of the target number of market-based RSAs vest based on our total shareholder return during (“TSR”) compared to our 20 company peer group over the relevant two-year performance period between January 1, 2023 and December 31, 2024.
(6)1,779 unvested service vesting-based RSAs subject to this award will vest March 25, 2024.
(7)1,529 unvested service vesting-based RSAs subject to this award are scheduled to vest in 4 equal quarterly increments measured from the grant date, provided that Mr. Mathew continues to be employed with BioLife through the vesting dates.
(8)11,829 unvested service vesting-based RSAs subject to this award are scheduled to vest in 8 equal quarterly increments measured from the grant date, provided that Mr. Mathew continues to be employed with BioLife through the vesting dates.
(9)The target number of 21,029 market-based RSAs is shown. Between 0% and 200% of the target number of market-based RSAs vest based on our total shareholder return during (“TSR”) compared to our 20 company peer group over the relevant two-year performance period between January 1, 2022 and December 31, 2023.
(10)20,940 unvested service vesting-based RSAs subject to this award vested ¼ one year from the grant date, January 3, 2024 and, thereafter, will vest in 12 equal quarterly increments, provided that Mr. Mathew continues to be employed with BioLife through the vesting dates.
(11)The target number of 20,940 market-based RSAs is shown. Between 0% and 200% of the target number of market-based RSAs vest based on our total shareholder return during (“TSR”) compared to our 20 company peer group over the relevant two-year performance period between January 1, 2023 and December 31, 2024.
(12)2,663 unvested service vesting-based RSAs subject to this award are scheduled to vest in 2 equal quarterly increments measured from the grant date, provided that Mr. Wichterman continues to be employed with BioLife through the vesting dates.
(13)1,755 unvested service vesting-based RSAs subject to this award are scheduled to vest in 4 equal quarterly increments measured from the grant date, provided that Mr. Wichterman continues to be employed with BioLife through the vesting dates.
(14)13,143 unvested service vesting-based RSAs subject to this award are scheduled to vest in 8 equal quarterly increments measured from the grant date, provided that Mr. Wichterman continues to be employed with BioLife through the vesting dates.
(15)The target number of 23,365 market-based RSAs is shown. Between 0% and 200% of the target number of market-based RSAs vest based on our total shareholder return during (“TSR”) compared to our 20 company peer group over the relevant two-year performance period between January 1, 2022 and December 31, 2023.
(16)34,296 unvested service vesting-based RSAs subject to this award vested ¼ one year from the grant date, January 3, 2024 and, thereafter, will vest in 12 equal quarterly increments, provided that Mr. Wichterman continues to be employed with BioLife through the vesting dates.
(17)The target number of 34,296 market-based RSAs is shown. Between 0% and 200% of the target number of market-based RSAs vest based on our total shareholder return during (“TSR”) compared to our 20 company peer group over the relevant two-year performance period between January 1, 2023 and December 31, 2024.
(18)2,361 unvested service vesting-based RSAs subject to this award are scheduled to vest in 6 equal quarterly increments measured from the grant date, provided that Mr. Phillips continues to be employed with BioLife through the vesting dates.
(19)5,258 unvested service vesting-based RSAs subject to this award are scheduled to vest in 8 equal quarterly increments measured from the grant date, provided that Mr. Phillips continues to be employed with BioLife through the vesting dates.
(20)The target number of 9,346 market-based RSAs is shown. Between 0% and 200% of the target number of market-based RSAs vest based on our total shareholder return during (“TSR”) compared to our 20 company peer group over the relevant two-year performance period between January 1, 2022 and December 31, 2023.
(21)21,223 unvested service vesting-based RSAs subject to this award vested ¼ one year from the grant date, January 3, 2024 and, thereafter, will vest in 12 equal quarterly increments, provided that Mr. Phillips continues to be employed with BioLife through the vesting dates.
(22)The target number of 21,223 market-based RSAs is shown. Between 0% and 200% of the target number of market-based RSAs vest based on our total shareholder return during (“TSR”) compared to our 20 company peer group over the relevant two-year performance period between January 1, 2023 and December 31, 2024.
(23)1,511 unvested service vesting-based RSAs subject to this award will vest March 25, 2024.
(24)1,300 unvested service vesting-based RSAs subject to this award are scheduled to vest in 4 equal quarterly increments measured from the grant date, provided that Ms. Foster continues to be employed with BioLife through the vesting dates.
(25)9,201 unvested service vesting-based RSAs subject to this award are scheduled to vest in 8 equal quarterly increments measured from the grant date, provided that Ms. Foster continues to be employed with BioLife through the vesting dates.
(26)The target number of 16,356 market-based RSAs is shown. Between 0% and 200% of the target number of market-based RSAs vest based on our total shareholder return during (“TSR”) compared to our 20 company peer group over the relevant two-year performance period between January 1, 2022 and December 31, 2023.
(27)16,978 unvested service vesting-based RSAs subject to this award vested ¼ one year from the grant date, January 3, 2024 and, thereafter, will vest in 12 equal quarterly increments, provided that Ms. Foster continues to be employed with BioLife through the vesting dates.
(28)The target number of 16,978 market-based RSAs is shown. Between 0% and 200% of the target number of market-based RSAs vest based on our total shareholder return during (“TSR”) compared to our 20 company peer group over the relevant two-year performance period between January 1, 2023 and December 31, 2024.
Option exercises and stock vested for the fiscal year ended December 31, 2023
The following Option Exercises and Stock Vested table sets forth certain information regarding each exercise of stock options and each vesting of restricted stock during the last completed year for each of the named executive officers on an aggregated basis.
| | | | | | | | | | | | | | | | | | | | | | | | | | |
| | Option Awards | | Stock Awards |
| Name (a) | | Number of
Shares
Acquired on
Exercise (#) (b) | | Value Realized on
Exercise ($)
(c)(1) | | Number of
Shares
Acquired on
Vesting (#) (d) | | Value Realized
on Vesting ($)
(e)(2) |
Roderick de Greef(3) | | — | | | — | | | 28,467 | | | 520,816 | |
| Michael Rice | | 60,000 | | 597,570 | | | 197,927 | | 2,642,439 | |
| Aby J. Mathew | | 140,000 | | 2,683,400 | | | 31,088 | | 562,614 | |
| Troy Wichterman | | 938 | | 17,466 | | | 20,111 | | 364,238 | |
| Geraint Phillips | | — | | — | | | 7,833 | | 133,107 | |
| Karen Foster | | — | | — | | | 21,754 | | 413,440 | |
(1) Value realized is calculated based on the difference between the closing price of our common stock on the date of exercise and the exercise price of the stock option.
(2) Value realized is calculated based on the closing price of our common stock on the date of vesting.
(3) Of the shares awarded to Mr. de Greef during the year ended December 31, 2023, 362 shares that vested were associated with his service period as a Director on the BOD from January 4, 2023 through October 18, 2023. The shares awarded are also outlined within the Director compensation section below.
Pension benefits
The Company has no defined benefit plans or other supplemental retirement plans for the NEOs.
Nonqualified deferred compensation
The Company has no nonqualified defined contribution plans or other nonqualified deferred compensation plans for the named executive officers.
Employment agreements
The terms and conditions of employment for each of our NEOs are set forth in written employment agreements, as amended from time to time (“employment agreements”). Each of the employment agreements with our NEOs sets forth the terms and conditions of such executive’s employment with us and provides for severance and change in control payments and benefits, as described below.
Roderick de Greef
The Company entered into an employment agreement with Roderick de Greef, Chief Executive Officer and Chairman of the Board, effective December 1, 2020, as later amended, which has been superseded by an executive employment agreement dated October 19, 2023. Please see “Potential Payments Upon Termination or Upon Termination in Connection with a Change in Control” below for the severance benefits for which Mr. de Greef is eligible.
Michael Rice
On October 19, 2023, Michael Rice, former Chief Executive Officer and Chairman of the Board, resigned his positions as Chairman of the Board and Chief Executive Officer of the Company, effective immediately. In connection with Mr. Rice’s resignation, the Company and Mr. Rice entered into a Separation, Release of Claims and Consulting Agreement on October 19, 2023, pursuant to which Mr. Rice will serve as a consultant for the Company beginning on the separation date and ending on the six-month anniversary thereof. During the consulting term, Mr. Rice will assist the Company’s senior leadership team with certain projects as determined by mutual agreement between Mr. Rice and the Company’s Chief Executive Officer.
Troy Wichterman
The Company entered into an employment agreement with Troy Wichterman, Chief Financial Officer, effective November 4, 2021, as amended effective June 1, 2023 and August 15, 2023. Please see “Potential Payments Upon Termination or Upon Termination in Connection with a Change in Control” below for the severance benefits for which Mr. Wichterman is eligible.
Aby J. Mathew
The Company entered into an employment agreement with Aby J. Mathew, Chief Scientific Officer and Executive Vice President, effective December 1, 2020, as amended effective January 1, 2023 and August 15, 2023. Please see “Potential Payments Upon Termination or Upon Termination in Connection with a Change in Control” below for the severance benefits for which Mr. Mathew is eligible.
Geraint Phillips
The Company entered into an employment agreement with Geraint Phillips, Senior Vice President, Global Operations, effective November 9, 2021, as amended effective January 1, 2023 and August 15, 2023. Please see “Potential Payments Upon Termination or Upon Termination in Connection with a Change in Control” below for the severance benefits for which Mr. Phillips is eligible.
Karen Foster
The Company entered into an employment agreement with Karen Foster, Chief Quality and Operations Officer, effective January 1, 2018, as amended effective June 1, 2023 and August 15, 2023. Please see “Potential Payments Upon Termination or Upon Termination in Connection with a Change in Control” below for the severance benefits for which Ms. Foster is eligible.
Potential payments upon termination or change in control
Executive Employment Agreements
Pursuant to each NEO’s employment agreement, upon termination of the NEO’s employment by the Company without “cause” or the NEO’s resignation for “good reason” (each as defined in each NEO’s employment agreements), the NEO will receive the following severance payments: (i) a lump sum severance payment equal to 12 months’ base salary, (ii) an amount equal to the cost of 12 months of medical insurance premiums at a monthly amount equal to the amount of COBRA coverage in effect as of the termination date, plus a tax gross-up with respect to such premiums, and (iii) full vesting of all unvested equity awards.
If the NEO’s employment is terminated by the Company or the NEO resigns for “good reason” (except in the case of Mr. de Greef) upon, or within 12 months following, a “change in control” (as defined in each NEO’s employment agreement), the NEO will receive the following severance payments: (i) a lump sum severance payment equal to 12 months’ (or, in the case of Mr. de Greef, 24 months’) salary, (ii) 100% of any incentive cash and/or stock bonus opportunity for the year in which the Change in Control occurs, (iii) an amount equal to the cost of 12 months’ (or, in the case of Mr. de Greef, 24 months’) of medical insurance premiums at a monthly amount equal to the amount of COBRA coverage in effect as of the termination date, plus a tax gross-up with respect to such premiums, and (iii) full vesting of all unvested equity awards.
If the NEO’s employment is terminated by the Company due to death or disability, the NEO will receive a prorated portion of any incentive bonus opportunity previously approved by the Board (assuming target level achievement) and full vesting of all unvested equity awards.
For purposes of each of the NEO employment agreements, “cause” generally means any of the following has occurred: (i) any breach of the employment agreement by the executive; (ii) any failure to perform assigned job responsibilities that continues unremedied for a period of 10 days after written notice to the executive officer by the Company; (iii) the executive officer’s malfeasance or misconduct in connection with the executive officer’s duties under the employment agreement or any act or omission of the executive officer which is materially injurious to the financial condition or business reputation of the Company or any of its subsidiaries or affiliates, (iv) commission or conviction of a felony or misdemeanor or failure to contest prosecution for a felony or misdemeanor; (v) the Company’s reasonable belief that the executive officer engaged in a violation of any statute, rule or regulation, any of which in the judgment of the Company is harmful to the business or to Company’s reputation; (vi) the Company’s reasonable belief that the executive officer engaged in unethical practices, dishonesty or disloyalty; or (vii) any reason that would constitute “cause” under the laws the State of Washington.
For purposes of each of the NEO employment agreements, a “change in control” means (i) the consummation of a merger or consolidation of the Company with or into another entity, (ii) the dissolution, liquidation or winding up of the Company or (iii) the sale of all or substantially all of the Company’s assets. The foregoing notwithstanding, a merger or consolidation of the Company shall not constitute a “Change in Control” if immediately after such merger or consolidation a majority of the voting power of the capital stock of the continuing or surviving entity, or any direct or indirect parent corporation of such continuing or surviving entity, will be owned by the persons who were the Company’s stockholders immediately prior to such merger or consolidation in substantially the same proportions as their ownership of the voting power of the Company’s capital stock immediately prior to such merger or consolidation.
For purposes of each of the NEO employment agreements, “good reason” generally means the following: (i) the Company’s material breach of the terms of the employment agreement or any other written agreement between the executive officer and Company; (ii) significant diminution in the nature or scope of the executive’s authority, title, function or duties, (iii) a material reduction of the executive officer’s salary or target bonus opportunity, other than as a result of a general salary reduction affecting substantially all Company employees; (iv) any failure by the Company to obtain the assumption of the employment agreement by any successor or assign of the Company; or, except in the case of Mr. Phillips, (v) a requirement that the executive officer be based at any office or location more than 50 miles from the executive officer’s primary work location prior to the effective date of the employment agreement.
Assuming the NEOs employment was terminated by the Company without cause or the NEOs resigned for good reason and such event took place on December 31, 2023, each of the continuing NEOs would have been entitled to the payments and benefits shown in the table below.
| | | | | | | | | | | | | | | | | | | | | | | |
| Payments and Benefits |
| Name | Base Salary Continuation ($) | | Accelerated Vesting of Equity Awards ($) (1) | | Health Insurance Under COBRA ($) | | Total ($) |
| Roderick de Greef | 744,450 | | | 6,416,410 | | | 30,668 | | | 7,191,528 | |
| Aby J Mathew | 435,000 | | | 2,080,748 | | | 9,656 | | | 2,525,404 | |
| Troy Wichterman | 472,000 | | | 1,779,993 | | | 14,275 | | | 2,266,268 | |
| Geraint Phillips | 380,000 | | | 965,430 | | | 21,252 | | | 1,366,682 | |
| Karen Foster | 382,000 | | | 2,637,765 | | | 21,252 | | | 3,041,017 | |
(1) The dollar amounts shown are based on the intrinsic value of the stock options and restricted stock awards on December 31, 2023 calculated using $16.25, the closing price of BioLife’s common stock on December 31, 2023.
Assuming the NEO’s employment was terminated by the Company or the NEOs resigned for good reason upon or within 12 months following a change in control and such events took place on December 31, 2023, each of the continuing NEOs would have been entitled to the payments and benefits shown in the table below.
| | | | | | | | | | | | | | | | | | | | | | | | | | | | | |
| Payments and Benefits |
| Name | Base Salary Continuation ($) | | 2023 Annual Cash Incentive ($) (1) | | Accelerated Vesting of Equity Awards ($) (2) | | Health Insurance Under COBRA ($) | | Total ($) |
| Roderick de Greef | 1,116,675 | | | — | | | 6,416,410 | | | 61,336 | | | 7,594,421 | |
| Aby J Mathew | 435,000 | | | — | | | 2,080,748 | | | 9,656 | | | 2,525,404 | |
| Troy Wichterman | 472,000 | | | — | | | 1,779,993 | | | 19,033 | | | 2,271,026 | |
| Geraint Phillips | 380,000 | | | — | | | 965,430 | | | 21,252 | | | 1,366,682 | |
| Karen Foster | 382,000 | | | — | | | 2,637,765 | | | 21,252 | | | 3,041,017 | |
(1) No bonus payout was provided for the year ended December 31, 2023.
(2) The dollar amounts shown are based on the intrinsic value of the stock options and restricted stock awards on December 31, 2023 calculated using $16.25, the closing price of BioLife’s common stock on December 31, 2023.
Assuming the NEO’s employment was terminated by the Company due to death or disability and such event took place on December 31, 2023, each of the continuing NEOs would have been entitled to the payments and benefits shown in the table below.
| | | | | | | | | | | | | | | | | | | | | | | |
| Payments and Benefits |
| Name | Base Salary Continuation ($) | | Current year end Annual Cash Incentive ($) (1) | | Accelerated Vesting of Equity Awards ($) (2) | | Total ($) |
| Roderick de Greef | 744,450 | | | — | | | 6,416,410 | | | 7,160,860 | |
| Aby J Mathew | 435,000 | | | — | | | 2,080,748 | | | 2,515,748 | |
| Troy Wichterman | 472,000 | | | — | | | 1,779,993 | | | 2,251,993 | |
| Geraint Phillips | 380,000 | | | — | | | 965,430 | | | 1,345,430 | |
| Karen Foster | 382,000 | | | — | | | 2,637,765 | | | 3,019,765 | |
(1) No bonus payout was provided for the year ended December 31, 2023.
(2) The dollar amounts shown are based on the intrinsic value of the stock options and restricted stock awards on December 31, 2023 calculated using $16.25, the closing price of BioLife’s common stock on December 31, 2023.
Equity Incentive Plans and Forms of Award Agreements
The 2023 Plan provides for full accelerated vesting of awards in the event a “change in control” (as defined in the 2023 Plan) occurs and the surviving entity or successor corporation in such change in control does not assume or substitute outstanding awards. The 2023 Plan further provides for “double-trigger” acceleration, meaning that in the event an award continues in effect or is assumed or substituted by the surviving entity or successor corporation in connection with a change in control, and an NEO’s employment or service is terminated without “cause” (as defined in the 2023 Plan) upon or within 12 months following such change in control, all outstanding awards will accelerate and vest in full.
The award agreements under the 2013 Plan provide for “single-trigger” acceleration, meaning that in the event of a “change in control” (as defined in the 2013 Plan), all outstanding awards will accelerate and vest in full.
For purposes of the 2023 Plan, “cause” means, unless otherwise provided in an award agreement or employment or similar agreement entered into by and between the participant and the Company or any of its affiliates, termination of a participant’s employment by the Company and its affiliates based on the employer’s belief that any of the following has occurred: (a) the continued refusal or omission by the participant to perform any material duties required of such participant by the Company or any of its affiliates; (b) any act or omission by the participant involving malfeasance, misconduct, dishonesty or gross negligence in the performance of the participant’s duties to, or material deviation from any of the policies or directives of, the Company or any of its affiliates; (c) the participant engaged in conduct that constitutes a breach of any statutory or common law duty of loyalty to the Company or any of its affiliates; (d) the participant engaged
in a violation of any statute, rule, regulation or policy of the Company or any of its affiliates, any of which in the judgment of the Company is harmful to the business or reputation of the Company or any of its affiliates; (e) the participant’s commission or conviction of a felony or misdemeanor (other than a misdemeanor traffic violation) or any crime involving moral turpitude, including a plea of guilty or failure to contest prosecution for a felony, misdemeanor or crime involving moral turpitude; (f) any reason that would constitute Cause under the laws of the State of Washington; or (g) the participant’s breach of an employment or similar agreement entered into by and between the participant and the Company or any of its affiliates, including, without limitation, a breach of any restrictive covenants contained therein.
For purposes of the 2013 Plan and the 2023 Plan, “change in control” generally means the occurrence of any of the following events: (a) the acquisition, directly or indirectly, in one transaction or a series of related transactions, by any person or group (within the meaning of Section 13(d)(3) of the Exchange Act) of the beneficial ownership of securities of the Company possessing more than 50% of the total combined voting power of all outstanding securities of the Company; (b) a merger or consolidation of the Company with any other entity, whether or not the Company is the surviving entity in such transaction; (c) the sale, transfer or other disposition (in one transaction or a series of related transactions) of all or substantially all of the consolidated assets of the Company; or (d) the approval by the stockholders of a plan or proposal for the liquidation or dissolution of the Company.
CEO pay ratio
Pursuant to a mandate of the Dodd-Frank Act, the SEC adopted a rule requiring that we annually disclose the ratio of our median employee’s total annual compensation to the total annual compensation of our CEO, Roderick de Greef, who is also our principal executive officer (the “CEO Pay Ratio”).
The Company’s compensation and benefits philosophy and the overall structure of the compensation and benefit programs are broadly similar across the organization and aim to encourage and reward all employees who contribute to the Company’s success. The Company strives to ensure the pay of every employee reflects the level of their job impact and responsibilities and is competitive within the Company’s peer group. Compensation rates are benchmarked and are generally set to be market-competitive in the country in which the jobs are performed. The Company’s ongoing commitment to pay equity is critical to successfully supporting a diverse workforce with opportunities for all employees to grow, develop, and contribute.
We identified the median employee using total salary and wages earned, then subtracting bonuses earned in 2022 but paid in 2023, adding bonuses earned in 2023 but not paid until 2024, adding the fair value of equity awards granted to the employee during 2023, and adding other compensation. Salary and wages were annualized for any employees hired during the most recent fiscal year. A total of 414 US based employees who were employed by the Company on December 31, 2023, the last day of the Company’s fiscal year, were included in the determination of this calculation (including all employees, whether employed on a full-time, part-time, seasonal or temporary basis).
As illustrated in the table below, the Company’s 2023 CEO Pay Ratio was approximately 72:1.
| | | | | | | | |
| Roderick de Greef (CEO) 2023 Compensation | | $ | 5,316,798 | |
| Median Employee 2023 Compensation | | $ | 74,106 | |
| CEO Pay Ratio | | 72:1 |
To determine the median employee, we included all individuals employed as of December 31, 2023. Compensation for the median employee was determined in the same manner as the total compensation reported for Mr. de Greef in the “Total” column of the Summary Compensation Table. The pay ratio reported above is a reasonable estimate calculated in a manner consistent with SEC rules, based on the Company’s internal records and the methodology described above. The SEC rules for identifying the median compensated employee allow companies to adopt a variety of methodologies, to apply certain exclusions and to make reasonable estimates and assumptions that reflect their employee populations and compensation practices. Accordingly, the pay ratio reported by other peer companies may not be comparable to the pay ratio reported above, as other companies have different employee populations and compensation practices and may use different methodologies, exclusions, estimates and assumptions in calculating their own pay ratios.
Director compensation
Each of our non-employee directors, during the year ended December 31, 2023, were compensated with an annual retainer fee of $60,000. Committee chairpersons were compensated with additional annual retainers as follows:
| | | | | | | | |
| | Annual Retainer |
| | |
| Audit Committee Chair | | $ | 13,750 | |
| Compensation Committee Chair | | $ | 12,500 | |
| Governance and Nominating Committee Chair | | $ | 10,000 | |
A total of $465,657 in cash director compensation was recorded during the year ended December 31, 2023, which varied by director depending on when their services began or ended. The following table sets forth information regarding compensation earned by our non-employee directors for the year ended December 31, 2023.
| | | | | | | | | | | | | | | | | | | | |
| Name (1) | | Annual Cash Retainer ($) (2) | | Board and Committee Chair Fees ($) | | Total Cash Compensation ($) |
Roderick de Greef(3) | | 112,740 | | | — | | | 112,740 | |
Amy DuRoss(4) | | 76,667 | | | 12,500 | | | 89,167 | |
| Rachel Ellingson | | 60,000 | | | - | | | 60,000 | |
| Joydeep Goswami | | 60,000 | | | 10,000 | | | 70,000 | |
| Tim Moore | | 60,000 | | | - | | | 60,000 | |
| Joseph Schick | | 60,000 | | | 13,750 | | | 73,750 | |
(1)Michael Rice did not receive compensation for his services as Board Chairman from January 1, 2023 through October 19, 2023.
(2)Due to the timing of member resignations and appointments, the annual cash retainers vary depending on the respective period of time each director served.
(3)Mr. de Greef joined the board as a Director on January 4, 2023 and served for approximately 10 months prior to being appointed Chief Executive Officer and Chairman on October 19, 2023. Upon appointment to the Chief Executive Officer position, the BOD awarded Mr. de Greef $62,740 for extraordinary services as a director in addition to his fees earned as a director through October 19, 2023. Mr. de Greef did not receive compensation for his services as Board Chairman for the remainder of they year ended December 31, 2023.
(4)Effective on August 1, 2023, Ms. DuRoss was appointed as lead independent director and received an increase in annual compensation of $40,000. This was prorated for the period of her service to $16,667 for the year ended December 31, 2023.
The Company’s compensation practices for non-employee directors, as determined by the Compensation Committee and our independent compensation consultant, FW Cook, includes annual awards of restricted shares of Common Stock. Equity compensation for non-employee directors was based on a fixed value of $180,000. These awards vest one year from the date of grant, provided such person is still a director on such vesting date.
Director compensation table for the fiscal year ended December 31, 2023
The following table sets forth a summary of the compensation the Company paid to its non-employee directors in the year ended December 31, 2023.
| | | | | | | | | | | | | | | | | | | | |
| Name (1) | | Fees Earned or
Paid in Cash
($) (1) | | Stock Awards
($) (2) | | Total
Compensation
($) |
Roderick de Greef(3) | | 112,740 | | | 170,444 | | | 283,184 | |
| Amy DuRoss | | 89,170 | | | 180,000 | | | 269,170 | |
| Rachel Ellingson | | 60,000 | | | 180,000 | | | 240,000 | |
| Joydeep Goswami | | 70,000 | | | 180,000 | | | 250,000 | |
| Tim Moore | | 60,000 | | | 180,000 | | | 240,000 | |
| Joseph Schick | | 73,750 | | | 180,000 | | | 253,750 | |
(1)For three months of the year ended December 31, 2023, the Directors agreed to be compensated in stock awards in lieu of their cash retainer fees. The totals below therefore represent cash paid to each Director. The remainder of their compensation is captured in the Stock Awards column.
(2)Represents the grant date fair value of awards granted in 2023 calculated in accordance with the ASC Topic 718. The assumptions the Company used for calculating the grant date fair values are set forth in Note 1: “Organization and significant accounting policies – Stock-based compensation.”
(3)The BOD awarded Mr. de Greef an additional $62,740 for extraordinary services as a director prior to his appointment as Chief Executive Officer and Chairman on October 19, 2023.
The following table presents the aggregate number of unvested restricted stock units held by directors as of December 31, 2023:
| | | | | | | | |
| Name | | Number of Unvested Restricted Stock Units (#) |
| Roderick de Greef | | 9,646 |
| Amy DuRoss | | 10,187 |
| Rachel Ellingson | | 10,187 |
| Joydeep Goswami | | 10,187 |
| Tim Moore | | 10,187 |
| Joseph Schick | | 10,187 |
The following table presents the grant date fair value of each restricted stock award in the fiscal year ended December 31, 2023 to non-employee directors, computed in accordance with the ASC Topic 718:
| | | | | | | | | | | | | | | | | | | | |
| Name | | Grant Date | | Number of Securities Stock Awards (#) | | Grant Date Fair Value of Stock Awards ($) |
| Roderick de Greef | | 1/3/2023 | | 9,646 | | 170,445 | |
| Roderick de Greef | | 10/1/2023(1) | | 362 | | 4,999 | |
| | | | | | |
| Amy DuRoss | | 1/3/2023 | | 10,187 | | 180,004 | |
| Amy DuRoss | | 10/1/2023(1) | | 437 | | 6,035 | |
| Amy DuRoss | | 11/1/2023(1) | | 598 | | 6,040 | |
| Amy DuRoss | | 12/1/2023(1) | | 488 | | 6,037 | |
| | | | | | |
| Rachel Ellingson | | 1/3/2023 | | 10,187 | | 180,004 | |
| Rachel Ellingson | | 10/1/2023(1) | | 362 | | 4,999 | |
| Rachel Ellingson | | 11/1/2023(1) | | 495 | | 5,000 | |
| Rachel Ellingson | | 12/1/2023(1) | | 404 | | 4,997 | |
| | | | | | |
| Joydeep Goswami | | 1/3/2023 | | 10,187 | | 180,004 | |
| Joydeep Goswami | | 10/1/2023(1) | | 422 | | 5,828 | |
| Joydeep Goswami | | 11/1/2023(1) | | 577 | | 5,828 | |
| Joydeep Goswami | | 12/1/2023(1) | | 471 | | 5,826 | |
| | | | | | |
| Tim Moore | | 1/3/2023 | | 10,187 | | 180,004 | |
| Tim Moore | | 10/1/2023(1) | | 362 | | 4,999 | |
| Tim Moore | | 11/1/2023(1) | | 495 | | 5,000 | |
| Tim Moore | | 12/1/2023(1) | | 404 | | 4,997 | |
| | | | | | |
| Joseph Schick | | 1/3/2023 | | 10,187 | | 180,004 | |
| Joseph Schick | | 10/1/2023(1) | | 445 | | 6,145 | |
| Joseph Schick | | 11/1/2023(1) | | 608 | | 6,141 | |
| Joseph Schick | | 12/1/2023(1) | | 496 | | 6,136 | |
(1)The grants awarded on dates indicated here were made in lieu of director fees for each applicable distribution date.
Compensation Committee interlocks and insider participation
Ms. DuRoss, Mr. Schick, Ms. Ellingson, and Mr. Moore were the members of the Compensation Committee during the year ended December 31, 2023. No member of the Compensation Committee is a current or former employee of the Company or had any relationship with the Company requiring disclosure herein. No interlocking relationship exists between any member of the Board or the Compensation Committee and any member of the board or Compensation Committee of any other company and no such interlocking relationship has existed in the past.
ITEM 12. SECURITY OWNERSHIP OF CERTAIN BENEFICIAL OWNERS AND MANAGEMENT RELATED STOCKHOLDER MATTERS
The following table sets forth, as of February 22, 2024, certain information regarding the beneficial ownership of Common Stock by (i) each stockholder known by the Company to be the beneficial owner of more than 5% of the outstanding shares of the Company’s common stock; (ii) each director of the Company; (iii) each named executive officer of the Company; and (iv) all of the Company’s current directors and executive officers (including executive officers that are not named executive officers) as a group. This table is based upon information supplied by officers, directors, and principal stockholders and Schedule 13D(s) and Schedule 13G(s) filed with the SEC. There are 45.8 million outstanding shares inclusive of the number of shares of the Company’s common stock that the person or group has the right to acquire within 60 days after February 22, 2024. Except as indicated by footnote, and subject to community property laws where applicable, we believe that the persons named in the table have sole voting and investment power with respect to all shares shown as beneficially owned by them. Unless otherwise indicated, the business address of each person listed is in care of 3303 Monte Villa Parkway, #310, Bothell, WA 98021.
| | | | | | | | | | | | | | |
| Name and Address of Beneficial Owner | | Common Stock | | Percentage of Class |
| Directors and Executive Officers | | | | |
| Michael Rice (Former Officer)(1) | | 417,179 | | * |
| Aby J. Mathew (Officer)(2) | | 320,108 | | * |
| Karen Foster (Officer)(3) | | 219,405 | | * |
| Roderick de Greef (Officer and Director)(4) | | 68,406 | | * |
| Troy Wichterman(Officer)(5) | | 50,174 | | * |
| Geraint Phillips (Officer)(6) | | 46,178 | | * |
| Joseph Schick (Director) | | 32,689 | | * |
| Rachel Ellingson (Director) | | 31,685 | | * |
| Joydeep Goswami (Director) | | 29,846 | | * |
| Amy DuRoss (Director) | | 29,379 | | * |
| Tim Moore (Director) | | 18,633 | | * |
| Total shares owned by Executive Officers and Directors (14 persons) | | 1,489,735 | | 3.3 | % |
| 5% Stockholders | | | | |
| Casdin Capital, LLC(7) | | 8,707,165 | | 19.0 | % |
| BlackRock, Inc.(8) | | 5,424,116 | | 11.9 | % |
| The Vanguard Group(9) | | 2,571,608 | | 5.6 | % |
| Goldman Sachs Group Inc(10) | | 2,476,242 | | 5.4 | % |
| Integrated Core Strategies (US) LLC(11) | | 2,404,862 | | 5.3 | % |
*Less than 1%
(1)Includes 70,094 shares of common stock to be issued pursuant to restricted stock awards within 60 days from February 22, 2024.
(2)Includes options to purchase 50,000 shares of common stock issuable under stock options exercisable within 60 days from February 22, 2024 and 25,430 shares of common stock to be issued pursuant to restricted stock awards within 60 days from February 22, 2024.
(3)Includes options to purchase 100,000 shares of common stock issuable under stock options exercisable within 60 days from February 22, 2024 and 19,951 shares of common stock to be issued pursuant to restricted stock awards within 60 days from February 22, 2024.
(4)Includes 23,365 shares of common stock to be issued pursuant to restricted stock awards within 60 days from February 22, 2024.
(5)Includes 28,299 shares of Common Stock to be issued pursuant to restricted stock awards within 60 days from February 22, 2024.
(6)Includes 11,258 shares of Common Stock to be issued pursuant to restricted stock awards within 60 days from February 22, 2024.
(7)Based on a Schedule 13D/A filed on October 24, 2023 reporting shared voting and dispositive power over 8,707,165 shares of common stock. Casdin Capital, LLC (“Casdin”) is the investment manager to Casdin Partners Master Fund, L.P. (the “Fund”) and Casdin Partners GP, LLC (the “GP”) is the general partner of the Fund. Eli Casdin is the managing member of Casdin and the GP. Pursuant to the Schedule 13D/A, Casdin, the GP and Eli Casdin may be deemed to be the beneficial owners of 8,707,165 shares of common stock, and the Fund may be deemed to be the beneficial owner of 8,557,165 shares of common stock. The business address of Casdin is 1350 Avenue of the Americas, Suite 2405, New York, New York 10019.
(8)Based on a Schedule 13G/A filed on January 23, 2024, reporting sole voting power over 5,379,424 shares of common stock and sole dispositive power over 5,424,116 shares of common stock. The business address of BlackRock, Inc. is 55 East 52nd Street, New York, New York 10055.
(9)Based on a Schedule 13G/A filed on February 13, 2024, reporting shared voting power over 61,469 shares of common stock, sole dispositive power over 2,475,884 shares of common stock and shared dispositive power over 95,724 shares of common stock. The business address of The Vanguard Group is 100 Vanguard Blvd., Malvern, Pennsylvania 19355.
(10)Based on a Schedule 13G filed on February 2, 2024, reporting shared voting power over 2,461,009 shares of common stock and shared dispositive power over 2,462,710 shares of common stock. The shares reported as beneficially owned by The Goldman Sachs Group, Inc. (“GS Group”), as a parent holding company, are owned, or may be deemed to be beneficially owned, by Goldman Sachs & Co. LLC (“Goldman Sachs”), a registered broker or dealer and a registered investment adviser. Goldman Sachs is a subsidiary of GS Group. The business address of GS Group is 200 West Street, New York, NY 10282.
(11)Based on a Schedule 13G/A filed on January 24, 2024, reporting shared voting and dispositive power over 2,404,862 shares of common stock. The shares reported as beneficially owned by Integrated Core Strategies (US) LLC may be deemed beneficially owned by Millennium Management LLC, Millennium Group Management LLC and Mr. Englander and are held by entities subject to voting control and investment discretion by Millennium Management LLC and/or other investment managers that may be controlled by Millennium Group Management LLC (the managing member of Millennium Management LLC) and Mr. Englander (the sole voting trustee of the managing member of Millennium Group Management LLC). The business address of Integrated Core Strategies (US) LLC is 399 Park Avenue, New York, New York 10022.
Equity Compensation Plan Information
The following table sets forth information as of December 31, 2023 relating to all our equity compensation plans:
| | | | | | | | | | | | | | | | | | | | | | | | | | |
| Plan category | | Number of
securities to
be issued upon
exercise
of outstanding
options
(in thousands) | | Weighted Average
exercise price of
outstanding
options | | Number of
granted restricted
stock awards
outstanding
(in thousands) | | Number of securities
remaining available
for future issuance
(in thousands) |
| Second amended and restated 2013 performance incentive plan | | 217 | | $ | 2.21 | | | 1,572 | | 1,067 |
| 2023 Omnibus performance incentive plan | | — | | $ | — | | | 1,250 | | 3,295 |
ITEM 13. CERTAIN RELATIONSHIPS AND RELATED TRANSACTIONS, AND DIRECTOR INDEPENDENCE
Certain relationships and related transactions
Since January 1, 2023, there has not been, nor has there been proposed, any transaction, arrangement or relationship or series of similar transactions, arrangements or relationships, including those involving indebtedness not in the ordinary course of business, to which we or our subsidiaries were or are a party, or in which we or our subsidiaries were or are a participant, in which the amount involved exceeded or exceeds the lesser of $120,000 or 1% of the average of our total assets at year-end for the last two completed fiscal years and in which any of our directors, nominees for director, executive officers, beneficial owners of more than 5% of any class of our voting securities, or any member of the immediate family of any of the foregoing persons, had or will have a direct or indirect material interest, other than as described above under
the headings “Executive Compensation” and “Board of Directors-Director Compensation” and other than the transactions described below. Each of the transactions described below was reviewed and approved or ratified by the Audit Committee of the Board. It is anticipated that any future transactions between us and our officers, directors, principal stockholders and affiliates will be on terms no less favorable to us than could be obtained from unaffiliated third-parties. In accordance with our Audit Committee’s charter, all such transactions will be reviewed and approved by our Audit Committee and a majority of the independent and disinterested members of the Board.
Director independence
Our board of directors is responsible for determining the independence of our directors. For purposes of determining director independence, our board of directors has applied the definitions set forth in NASDAQ Rule 5605(a)(2) and the related rules of the SEC. Based upon its evaluation, our board of directors has affirmatively determined that the following directors meet the standards of independence: Mr. Schick, Ms. DuRoss, Ms. Ellingson, Mr. Goswami, and Mr. Moore.
ITEM 14. PRINCIPAL ACCOUNTANT FEES AND SERVICES
Independent Registered Public Accounting Firm Fees
The following table sets forth the aggregate fees billed by our current independent auditors, Grant Thornton LLP (“Grant Thornton”), for professional services rendered in the fiscal years ended December 31, 2023 and 2022.
| | | | | | | | | | | |
| 2023 | | 2022 |
| | | |
Audit fees(1) | $ | 1,887,800 | | | $ | 1,257,800 | |
Audit related fees(2) | 18,550 | | | — | |
| Total | $ | 1,906,350 | | | $ | 1,257,800 | |
(1)Audit fees consist of professional services for the audit of our annual financial statements, review of financial statements included in our Form 10-Q or services that are normally provided by the accountant in connection with statutory and regulatory filings or engagement for those fiscal years.
(2)Audit-related fees consist of assurance and related services reasonably related to the performance of the audit or review of our financial statements that are not reported under the heading Audit fees above.
Audit Committee Pre-Approval Policies and Procedures
The Audit Committee must pre-approve all services to be performed for us by our independent auditors. Pre-approval is granted usually at regularly scheduled meetings of the Audit Committee. If unanticipated items arise between regularly scheduled meetings of the Audit Committee, the Audit Committee has delegated authority to the chairman of the Audit Committee to pre-approve services. The Audit Committee also may approve the additional unanticipated services by either convening a special meeting or acting by unanimous written consent. During the years ended December 31, 2023 and 2022, all services billed by Grant Thornton were pre-approved by the Audit Committee Chair in accordance with this policy.
PART IV
ITEM 15. EXHIBITS AND FINANCIAL STATEMENT SCHEDULES
(a)The following documents are filed as part of this Annual Report on Form 10-K:
(1)Financial Statements (Included Under Item 8): The Index to the Financial Statements is included in this Annual Report on Form 10-K the information required for Part III, Items 10, 11, 12, 13 and 14, is incorporated herein by reference fromreference.
(2)Financial Statement Schedules: Schedules to the Company’s proxy statement forFinancial Statements have been omitted because the 2022 Annual Meeting of Stockholders.PART IV
information required to be set forth therein is not applicable or is shown in the accompanying Financial Statements or notes thereto. (b)Exhibits
| ITEM 15.
| | | | | | | |
| Exhibit Number | | EXHIBITS AND FINANCIAL STATEMENT SCHEDULES
(a)
| The following documents are filed as part of this Annual Report on Form10-K:
|
| (1)
| Financial Statements (Included Under Item 8): The Index to the Financial Statements is included on page 28 of this Annual Report on Form 10-K and is incorporated herein by reference.
|
| (2)
| Financial Statement Schedules: Schedules to the Financial Statements have been omitted because the information required to be set forth therein is not applicable or is shown in the accompanying Financial Statements or notes thereto.
|
Exhibit
Number
| | Document |
2.1†* | | |
2.2†
| | Share Exchange Agreement, dated August 7, 2019, by and among the Company, SAVSU Technologies, Inc. and SAVSU Origin LLC (included as Exhibit 2.1 to the current report on Form 8-K filed on August 13, 2019)
|
2.3†*
| | Asset Purchase Agreement, dated November 10, 2019, by and among the Company, Arctic Solutions, Inc., a Delaware corporation and wholly-owned subsidiary of the Company, and Custom Biogenic Systems, Inc. (included as Exhibit 2.1 to the current report on Form 8-K filed on November 15, 2019)
|
2.4†*
| | Stock Purchase Agreement, dated September 18, 2020, by and among the Company, SciSafe, the stockholders of SciSafe party thereto and Garrie Richardson (included as Exhibit 2.1 to the current report on Form 8-K filed on September 24, 2020)
|
2.5†*
| | Agreement and Plan of Merger, dated as of March 19, 2021, by and among the Company, BLFS Merger Subsidiary, Inc., Global Cooling, Inc. and Albert Vierling and William Baumel, in their capacity as the representatives of the stockholders of Global Cooling, Inc. (included as Exhibit 2.1 to the current report on Form 8-K filed on March 25, 2021) |
2.6†*2.2† | | Agreement and Plan of Merger, dated as of August 9, 2021, by and among the Company, BLFS Merger Sub, Inc., Sexton Biotechnologies, Inc. and Fortis Advisors LLC, in their capacity as the representatives of the stockholders of Sexton Biotechnologies, Inc. (filed herewith)(incorporated by reference to Exhibit 2.6 to Company's report on Form 10-K filed March 31, 2022) |
3.1 | | |
3.2 | | |
3.3 | | |
3.4 | | |
4.1 | | |
| 10.1** | | |
10.1*10.2**
| | |
| 10.3** | | |
| 10.4** | | |
10.2*10.5**
| | |
10.3*10.6**
| | |
10.4*10.7** | | |
10.5*10.8** | | |
10.610.9 | | |
10.710.10 | | |
| 10.11 | | |
10.810.12 | | |
10.9
10.13 | | |
10.10
| | First Amendment to the Lease, dated November 4, 2008, between the Company and Monte Villa Farms, LLC (included as Exhibit 10.16 to the Annual Report on Form 10-K for the fiscal year ended December 31, 2008 filed March 31, 2009)
|
10.11
| | Second Amendment to the Lease, dated March 2, 2012, between the Company and Monte Villa Farms, LLC (included as Exhibit 10.30 to the Quarterly Report on Form 10-Q for the quarterly period ended March 31, 2012 filed May 14, 2012)
|
10.12
| | Third Amendment to the Lease, dated June 15, 2012, between the Company and Monte Villa Farms, LLC (included as Exhibit 10.37 to the Annual Report on Form 10-K for the fiscal year ended December 31, 2012 filed March 29, 2013)
|
10.13
| | Fourth Amendment to the Lease, dated November 26, 2012, between the Company and Monte Villa Farms, LLC (included as Exhibit 10.41 to the Annual Report on Form 10-K for the fiscal year ended December 31, 2012 filed March 29, 2013)
|
10.14
| | Fifth Amendment to Lease, dated August 19, 2014, by and between the Company and Monte Villa Farms LLC (included as Exhibit 10.1 Quarterly Report on Form 10-Q for the quarterly period ended September 30, 2014 filed on November 6, 2014)
|
10.15 | | Sixth Amendment to the Lease, dated March 3, 2017, by and between the Company and Monte Villa Farms LLC296 South Harper St. Nelsonville, OH 45764 (filed herewith) |
| | | | | | | | |
10.1610.14 | | Seventh Amendment to the Lease, dated December 4, 2018, by and between the Company and Monte Villa Farms LLC (filed herewith) |
10.17 | | Eighth Amendment to the Lease, dated November 1, 2019, by and between the Company and Monte Villa Farms LLC (filed herewith) |
10.18 | | Ninth Amendment to the Lease, dated November 12, 2020, by and between the Company and Monte Villa Farms LLC (filed herewith) |
10.19 | | Tenth Amendment to the Lease, dated October 8, 2021, by and between the Company and ARE-SEATTLE No. 38, LLC (filed herewith) |
10.20 | | |
10.2110.15 | | |
10.2210.16 | | Commercial Lease and Deposit Receipt Agreement dated November 2, 2020 for facility space 3505 and 3507 Edison Way, Menlo Park, CA 94025 (filed herewith) |
10.23 | | Extension and Amendment of Lease dated February 24, 2022 for facility space 3505 and 3507 Edison Way, Menlo Park, CA 94025 (filed herewith) |
10.24 | | |
10.2510.17 | | |
10.2610.18 | | |
10.2710.19 | | |
10.28
| | Form of Warrant issued to purchasers in the March 25, 2014 public offering (incorporated by reference to Exhibit 4.110.27 to Company's report on Form 10-K filed March 31, 2022)
|
| 10.20 | | |
| 10.21 | | |
| 10.22 | | |
10.29**
10.23 | | |
10.30**10.24 | | |
10.31**10.25 | | |
10.32**10.26 | | |
10.33**10.27 | | |
10.34** | | Employment Agreement dated JanuaryJune 1, 20212023 between the Company and Sarah Aebersold (incorporated by reference to Exhibit 10.24 to the Company’s report on Form 10-K (filed March 31, 2021)herewith) |
10.35**10.28 | | |
10.36** | | Employment Agreement dated November 4, 2021June 1, 2023 between the Company and Troy Wichterman (filed herewith) |
10.3710.29 | | |
| 10.30 | | |
| 10.31 | | |
21.110.32 | | |
| 16.1 | | |
| 21.1 | | |
| 23.1 | | |
| 23.2 | | |
| 31.1 | | |
| 31.2 | | |
| 32.1 | | |
| 32.2 | | |
101.INS97.1 | | |
| | | | | | | | |
| 101.INS | | Inline XBRL Instance Document (filed herewith) |
| 101.SCH | | Inline XBRL Taxonomy Extension Schema (filed herewith) |
| 101.CAL | | Inline XBRL Taxonomy Extension Calculation Linkbase (filed herewith) |
| 101.DEF | | Inline XBRL Taxonomy Extension Definition Linkbase (filed herewith) |
| 101.LAB | | Inline XBRL Taxonomy Extension Label Linkbase (filed herewith) |
| 101.PRE | | Inline XBRL Taxonomy Extension Presentation Linkbase (filed herewith) |
| 104 | | Cover Page Interactive Data File (formatted as Inline XBRL and contained in Exhibit 101) |
| *
| Certain sensitive financial, commercial and strategic information relating to the Company has been redacted in the marked portions of the exhibit.
|
| **
| Management contract or compensatory plan or arrangement.
|
| †
| The exhibits and schedules to this Exhibit have been omitted in accordance with Regulation S-K Item 601(b)(2). The Registrant agrees to furnish supplementally a copy of all omitted exhibits and schedules to the Securities and Exchange Commission upon its request.
|
(c)
| Excluded financial statements:
|
*Certain portions of this exhibit have been redacted pursuant to Item 601(b)(10) of Regulation S-K. A copy of the omitted portions will be furnished supplementally to the Securities and Exchange Commission upon request.
**Management contract or compensatory plan or arrangement.
†The exhibits and schedules to this Exhibit have been omitted in accordance with Regulation S-K Item 601(b)(2). The Registrant agrees to furnish supplementally a copy of all omitted exhibits and schedules to the Securities and Exchange Commission upon its request.
(c)Excluded financial statements:
None.
ITEM 16.
| FORM 10-K SUMMARY
|
ITEM 16. FORM 10-K SUMMARY
The Company has elected not to include a summary pursuant to this Item 16.
SIGNATURES
Pursuant to the requirements of Section 13 or 15(d) of the Securities Exchange Act of 1934, the registrant has duly caused this report to be signed on its behalf by the undersigned, thereunto duly authorized.
| | | | | | | | |
| Date: | March 31, 2022
February 29, 2024 | BIOLIFE SOLUTIONS, INC. |
| | |
| | /s/ RODERICK DE GREEF |
| | /s/ MICHAEL RICE
Roderick de Greef |
| | Michael Rice
|
| | Chief Executive Officer (principal executive officer) and Chairman of the Board of Directors |
Pursuant to the requirements of the Securities Exchange Act of 1934, this report has been signed below by the following persons on behalf of the registrant and in the capacities and on the dates indicated.
| | | | | | | | |
| Date: | March 31, 2022February 29, 2024 | /s/ MICHAEL RICE RODERICK DE GREEF |
| | Michael Rice
Roderick De Greef |
| | Chief Executive Officer (principal executive officer) and Chairman of the Board of Directors |
| | |
Date: | March 31, 2022February 29, 2024 | /s/ TROY WICHTERMAN |
| | Troy Wichterman |
| | Chief Financial Officer (principal financial
|
| | |
Date: | March 31, 2022February 29, 2024 | /s/ JOSEPH SCHICK |
| | Joseph Schick |
| | Director |
| | |
Date: | March 31, 2022February 29, 2024 | /s/ AMY DUROSS |
| | Amy DuRoss |
| | Director |
| | |
| Date: | March 31, 2022February 29, 2024 | /s/ RACHEL ELLINGSON |
| | Rachel Ellingson |
| | Director |
| | |
| Date: | March 31, 2022February 29, 2024 | /s/ JOYDEEP GOSWAMI |
| | Joydeep Goswami |
| | Director |
| | |
| Date: | February 29, 2024 | Director/s/ TIM MOORE |
| | Tim Moore |
| | Director |