Name | Principal Occupation | Age | Director Since |
| Rickey J. Barker | President, Supply Resources, Inc. (tailor-made packaging provider), Danville, VA since 2007. Mr. Barker brings extensive experience from multiple industries. His entrepreneurial, construction, finance and real estate knowledge, as well as leadership and strategic planning skills, are expected to enhance the quality of the Board. He has been instrumental in economic development within the Danville, Virginia region. He also served on the Company's Virginia State Banking Board. | 63 | 2023 |
| Adrian T. Smith | President and Chief Executive Officer, Ice Management, Inc. (McDonald's franchises), Greensboro, NC since 2004. Mr. Smith brings a diverse perspective combining extensive operational and financial knowledge as well as strategic planning expertise from his experience as owner of a large restaurant organization. He also served on the Company's North Carolina State Banking Board. | 51 | 2023 |
| Dan M. Pleasant | Senior Consultant, The Dewberry Companies, Inc. (engineering, architectural and consulting), Fairfax, VA from April 2022 until April 2023. Managing Member of DMP Consulting PLLC (consulting to the engineering and architecture industry) beginning May 2023. Retired Chief Operating Officer, The Dewberry Companies, Inc. from April 2010 to March 2022. Mr. Pleasant brings significant experience as a professional engineer working in the Company's market areas in Virginia and North Carolina. In addition, until his retirement in 2022, he was the Chief Operating Officer of a large national architectural, engineering and consulting firm, leading the firm's merger and acquisition program. He is the immediate Past Chair of the Board of the Virginia Economic Development Partnership and served as director of the Virginia Chamber of Commerce. | 73 | 2011 |
| J. Nathan Duggins III | Managing Partner of Tuggle Duggins (law firm), Greensboro, NC since 2015. Mr. Duggins brings an expert legal perspective as well as extensive experience in both real estate and privately-owned businesses. He has helped a large variety of clients with legal needs across a wide range of industries during his career as a practicing attorney in North Carolina since 1995. He served on the Company's North Carolina State Banking Board and has been active in numerous community organizations in Greensboro and beyond, including the Guilford Education Alliance and the Guilford Merchants Association. | 54 | 2022 |
| William J. Farrell II | President of Berglund Automotive Group, Roanoke, VA since 2006. Mr. Farrell is a veteran of the automotive industry and brings a keen business acumen. He is a former director of HomeTown Bank and HomeTown Bankshares Corporation (together, "HomeTown") (acquired by the Company in 2019) and subsequently served on the Company's Virginia State Banking Board. He is very involved in the Roanoke community, serving on the boards of the Virginia Western Educational Foundation, Visit Virginia's Blue Ridge and the Virginia Automobile Dealers Association. | 57 | 2022 |
| Tammy Moss Finley | Executive Vice President, General Counsel and Corporate Secretary, Advance Auto Parts, Inc. (automotive aftermarket parts provider), Roanoke, VA since 2016. Executive Vice President, Human Resources, General Counsel and Corporate Secretary, Advance Auto Parts, Inc. from 2015 to 2016. Senior Vice President, Human Resources, Advance Auto Parts, Inc. from 2013 to 2015. Vice President, Employment Counsel and Government Affairs, Advance Auto Parts, Inc. from 2010 to 2013. Ms. Finley brings significant legal, human resources, retail, risk management, and public company corporate governance expertise from her multiple leadership roles at Advance Auto Parts, as well as merger and acquisition experience. In addition, her close ties to the communities American National Bank & Trust Company (the "Bank") serves benefit the entire organization. | 57 | 2017 |
| Joel R. Shepherd | President, Virginia Home Furnishings, Inc. (furniture retailer) and 220 Self Storage, Inc. (self-storage provider), Rocky Mount, VA. A former Chair of Franklin Community Bank, N.A. and MainStreet BankShares, Inc. (acquired by the Company in 2015), Mr. Shepherd brings substantial entrepreneurial, construction, finance and management skills gained through his various enterprises. He also brings banking and investment experience. He was Vice President and Portfolio Manager in the Funds Management Division of Dominion Bankshares, Inc. (acquired by First Union Corporation, now part of Wells Fargo & Company) from 1986 to 1993. He serves as a financial expert on the Company's Audit Committee. | 60 | 2015 |
| Michael P. Haley | Retired Adviser, Fenway Partners, LLC (private equity investments), New York, NY. Retired Managing Director, Fenway Resources since 2015. Adviser to Fenway Partners, LLC from 2006 and Managing Director of its affiliate, Fenway Resources, from 2008, respectively, to 2015. Mr. Michael Haley brings high level financial expertise as a former Chief Executive Officer of a publicly traded manufacturing company and as a former adviser to a private equity firm. He also brings experience in operations and risk management and public company corporate governance. His background helps him fill the role of financial expert on the Company's Audit Committee as well as to serve as Lead Independent Director. | 73 | 2002 |
| F. D. Hornaday, III | President and Chief Executive Officer, Knit Wear Fabrics, Inc. (circular knit manufacturer), Burlington, NC. A former director and Vice Chair of MidCarolina Bank and MidCarolina Financial Corporation (together, "MidCarolina") (acquired by the Company in 2011), Mr. Hornaday brings his multifaceted experience as President of a textile company, adding to the Board's understanding of the challenges and opportunities facing manufacturing. In addition, his board service in the health industry and his former board service in the trust industry bring value to the Board. | 74 | 2011 |
| Nancy Howell Agee | President and Chief Executive Officer, Carilion Clinic (health care organization), Roanoke, VA. A former director of HomeTown, Ms. Agee brings to the Board her leadership abilities, many years of service in the Bank's Roanoke market area and significant knowledge and experience in finance and management as President and Chief Executive Officer of a large healthcare organization. She currently serves as director of two publicly traded companies and was formerly Chair of the American Hospital Association. | 71 | 2019 |
| Jeffrey V. Haley | Chairman of the Company and the Bank since 2023. President and Chief Executive Officer of the Company and the Bank since 2013. President of the Company and President and Chief Executive Officer of the Bank from 2012 to 2013. Executive Vice President of the Company and President of the Bank from 2010 to 2012. President of Trust and Financial Services and Executive Vice President of the Bank from 2008 to 2010. Mr. Jeffrey Haley brings expertise based on more than 21 years in community banking and 17 years in the retail industry. His varied operational and management responsibilities during his banking tenure enable him to contribute a uniquely relevant perspective to the Board's deliberations. | 63 | 2012 |
| John H. Love | President, Motor Carrier Insurance Educational Foundation, Fort Myers, FL since 2022. Co-founder and President, W.E. Love & Associates (insurance brokerage), Burlington, NC from 1993 to 2022. A former director of MidCarolina, Mr. Love brings an expert perspective on risk management, mitigation and governmental regulation based on his experience as President of a large commercial insurance brokerage firm. | 64 | 2011 |
| Ronda M. Penn | Chief Financial Officer, Plexus Capital, LLC (small business investments), Raleigh, NC since 2012. Partner, Dixon Hughes Goodman LLP (public accounting), Greensboro, NC from 2006 to 2012. Ms. Penn brings significant financial, accounting, internal control, investment and management expertise as a Chief Financial Officer, Certified Public Accountant and former partner with a national accounting firm. Her background helps her fill the role of financial expert on the Company's Audit Committee as well as chair of that Committee. | 61 | 2015 |
The information required by Item 11 is incorporated herein by reference to the information that appears under the headings "Compensation Discussion and Analysis," "Election of Directors – Board of Directors and Committees," "Compensation Committee Interlocks and Insider Participation," and "Compensation Committee Report" in the Registrant's Proxy Statement for the 2023 Annual Meeting of Shareholders.
The information required by Item 12 is incorporated herein by reference to the information that appears under the heading "Security Ownership" in the Registrant's Proxy Statement for the 2023 Annual Meeting of Shareholders.
The information required by Item 13 is incorporated herein by reference to the information that appears under the headings "Related Party Transactions" and "Election of Directors – Board Independence" in the Registrant's Proxy Statement for the 2023 Annual Meeting of Shareholders.
The information required by Item 14 is incorporated herein by reference to the information that appears under the heading "Independent Registered Public Accounting Firm" in the Registrant's Proxy Statement for the 2023 Annual Meeting of Shareholders.
PART
Forward-Looking Statements
Certain statements in Item 1, of this Form 10-K10-K/A.
| |
| |
| |
| |
| |
| |
| |
| |
| |
| |
| |
| |
|
More informationConduct for senior financial officers meets the requirements of a "code of ethics" as defined by Item 406 of the SEC's Regulation S-K. The Code of Conduct is available on risk factorsthe Company's website, www.amnb.com. Select the "Investors" icon, and then select "Governance Documents." The Code of Conduct is reviewed and reaffirmed on an annual basis by the Board, executive officers, and all other employees.
Overview
American National Bankshares Inc. is a one-bank holding company organized under the laws of the Commonwealth of Virginia in 1984. On September 1, 1984, the Company acquired all of the outstanding capital stock of American National Bank and Trust Company (the "Bank"), a national banking association chartered in 1909 under the laws of the United States. American National Bank and Trust Company is the only banking subsidiary of the Company.
| Respectfully submitted, | |
Dan M. Pleasant, Chair William J. Farrell II Tammy Moss Finley John H. Love Adrian T. Smith |
As of December 31, 2022, the operations of the Company were conducted at 26 banking offices in south central Virginia and north central North Carolina. Through these offices, the Company serves its primary market area of south central Virginia, the New River Valley and Roanoke, Virginia, and north central North Carolina.
The Company has two reportable segments, (i) community banking and (ii) wealth management. For more financial data and other information about each of the Company's operating segments, refer to "Note 21 - Segment and Related Information" of the Consolidated Financial Statements contained in Item 8 of this Form 10-K.
Human Capital Resources
Profile
At December 31, 2022, the Company employed 343 full-time persons and 44 part-time persons. None of our employees are represented by a union or covered under a collective bargaining agreement. In the opinion of the management of the Company, relations with employees of the Company and the Bank are good.
As a holding company for a community bank, the Company is a relationship-driven organization. A key aspect of the Company’s business strategy is for its senior officers to have primary contact with current and potential customers. The Company’s growth and development are in large part a result of these personalized relationships with the customer base. The success of the Company also often depends on its ability to hire and retain qualified banking officers. The Company’s senior officers have considerable experience in the banking industry and related financial services and are extremely valuable.
Corporate Culture
The Company believes that as a regional community bank it is only as strong as the communities it serves, and has established core values to guide the organization. We are relationship focused establishing trust by respecting others and doing the right thing. We work together as a team and value diverse perspectives that help move us forward together. We fulfill commitments through responsive communication and service to and with our employees, shareholders and customers. We strive to embrace change as it comes and to continually work to be better. We work to be genuine in both words and actions. The Company has worked to utilize technology to allow for more digital transactions for our customers and more options for remote work and virtual meetings. We work with local organizations to provide financial education to the communities we serve and support various not-for-profit organizations. During the pandemic, we were ardent participants in the Paycheck Protection Program ("PPP"), assisting small businesses, their employees and their communities.
Compensation and Benefits
The Company’s senior officerexecutive compensation programs are designed to attract, retain, pay for performance, and motivate bankersthe leadership team, even during times of uncertainty, and include a mix of fixed and variable compensation with the abilityboth short- and long-term incentives used to generate strong business resultsdrive sustained growth and ensure the long-term successprofitability of the Company. The Company's compensation committeeprograms, levels, practices, and policies are consistent with the Company's values, culture, and mission. This section provides an overview and explanation of the Company’s board of directors has establishedmaterial information relevant to understanding the objectives, policies, and philosophy underlying the Company's executive compensation programs, that reflectfocusing on the named executive officers.
100% of our employees were eligible for an incentive opportunity in 2022. Incentive plans include a mix of individual and corporate goals that are measurable and defined.
Diversity, Equity and Inclusion
We are committed to hiring diverse talent and fostering, cultivating and preserving a culture of a diversity, equity and inclusion. We believe that the collective sum of the individual differences, life experiences, knowledge, inventiveness, innovation, self-expression, unique capabilities, and talent that our teammates invest in their work represents a significant part of not only our culture, but our reputation and achievement. We strive to foster a culture and workplace that, among other things, is inclusive and welcoming, treats everyone with respect and dignity, promotes people on their merits, and promotes diversity of thoughts, ideas, perspective and values. Our Board believes that diversity contributes to the overall effectivenessCompensation Committee of the Board and generally conceptualizes diversity expansively to include, without limitation, concepts such as race, gender, ethnicity, sexual orientation, education, age, work experience, professional skills, geographic location and other qualities or attributes that support diversity. We have a Diversity, Equity and Inclusion Committee which includes a cross-functional group of teammates from diverse backgrounds, that manages our efforts to create a more diverse, equitable, and inclusive workplace.
Competition and Markets
Vigorous competition exists in the Company's service areas. The Company competes not only with national, regional, and community banks, but also with other types of financial institutions including finance companies, mutual and money market fund providers, financial technology companies, brokerage firms, wealth management firms, insurance companies, credit unions, and mortgage companies.
In addition, nonbank competitors are increasingly offering products and services that traditionally were only offered by banks. Many of these nonbank competitors are not subject to the same extensive federal regulations that govern bank holding companies and federally insured banks, which may allow them to offer greater lending limits and certain products and services that we do not provide.
The Company's primary market area is south central Virginia and north central North Carolina. The Company also has a significant presence in Roanoke, Virginia that increased substantially in connection with the acquisition of HomeTown Bankshares Corporation ("HomeTown") in 2019. The Company's Virginia banking offices are located in the cities of Danville, Lynchburg, Martinsville, Roanoke, and Salem and in the counties of Campbell, Franklin, Halifax, Henry, Montgomery, Pittsylvania and Roanoke. In North Carolina, the Company's banking offices are located in the cities of Burlington, Graham, Greensboro, Mebane, Raleigh, Winston-Salem, and Yanceyville, which are within the counties of Alamance, Caswell, Forsyth, Guilford, and Wake.
Unemployment levels in each Virginia market the Company serves have remained low for the past twelve months. Based on Virginia Employment Commission data, the state's seasonally-adjusted unemployment rate was 3.0% as of December 31, 2022, compared to 3.3% at December 31, 2021 and continued to be below the national rate of 3.5% at December 31, 2022. North Carolina's unemployment rate was 3.9% as of December 31, 2022, compared to 4.1% at December 31, 2021 and slightly above the national rate of 3.5% at December 31, 2022.
Service sectors, financials, medical, manufacturing, construction, timber management and production, and technology related businesses have remained strong. Other important business industries include farming, tobacco and hemp processing and sales, and food processing. New businesses continue to move into the Company's Virginia and North Carolina footprints, which has been positive for economic growth.
The Company's market area in North Carolina includes larger metropolitan areas characterized by strong competition in attracting deposits and making loans. Its most direct competition for deposits comes from commercial banks and credit unions located in the market area, including many regional and national banks. The company has experienced strong loan growth in these markets, but has been more challenged in growing deposit market share.
Supervision and Regulation
The Company and the Bank are extensively regulated under federal and state law. The following description briefly addresses certain provisions of federal and state laws and regulations, and their potential effects on the Company and the Bank. Proposals to change the laws, regulations, and policies governing the banking industry are frequently raised in U.S. Congress, in state legislatures, and before the various bank regulatory agencies. The likelihood and timing of any changes and the impact such changes might have on the Company and the Bank are impossible to determine with any certainty. A change in applicable laws, regulations or policies, or a change in the way such laws, regulations or policies are interpreted by regulatory agencies or courts, may have a material impact on the business, operations, and earnings of the Company and the Bank.
American National Bankshares Inc.
American National Bankshares Inc. is qualified as a bank holding company ("BHC") within the meaning of the Bank Holding Company Act of 1956, as amendedDirectors (the "BHC Act"), and is registered as such with the Board of Governors of the Federal Reserve System (the "FRB"). As a bank holding company, the Company is subject to supervision, regulation and examination by the FRB and is required to file various reports and additional information with the FRB. The Company is also registered under the bank holding company laws of Virginia and is subject to supervision, regulation and examination by the Bureau of Financial Institutions of the Virginia State Corporation Commission (the "SCC").
American National Bank and Trust Company
American National Bank and Trust Company is a federally chartered national bank and is a member of the Federal Reserve System. As a national bank, the Bank is subject to supervision, regulation and examination by the Office of the Comptroller of the Currency (the "OCC") and is required to file various reports and additional information with the OCC. The OCC has primary supervisory and regulatory authority over the operations of the Bank. Because the Bank accepts insured deposits from the public, it is also subject to examination by the Federal Deposit Insurance Corporation ("FDIC").
Depository institutions, including the Bank, are subject to extensive federal and state regulations that significantly affect their business and activities. Regulatory bodies have broad authority to implement standards and initiate proceedings designed to prohibit depository institutions from engaging in unsafe and unsound banking practices. The standards relate generally to operations and management, asset quality, interest rate exposure, and capital. The bank regulatory agencies are authorized to take action against institutions that fail to meet such standards.
As with other financial institutions, the earnings of the Bank are affected by general economic conditions and by the monetary policies of the FRB. The FRB exerts a substantial influence on interest rates and credit conditions, primarily through open market operations in U.S. Government securities, setting the reserve requirements of member banks, and establishing the discount rate on member bank borrowings. The policies of the FRB have a direct impact on loan and deposit growth and the interest rates charged and paid thereon. They also impact the source, cost of funds, and the rates of return on investments. Changes in the FRB's monetary policies have had a significant impact on the operating results of the Bank and other financial institutions and are expected to continue to do so in the future; however, the exact impact of such conditions and policies upon the future business and earnings cannot accurately be predicted.
Deposit Insurance
The deposits of the Bank are insured up to applicable limits by the DIF and are subject to deposit insurance assessments to maintain the DIF. The deposit insurance assessment base of the Bank is based on its average total assets minus average tangible equity, pursuant to a rule issued by the FDIC as required by the Dodd-Frank Wall Street Reform and Consumer Protection Act (the "Dodd-Frank Act"). The FDIC uses a "financial ratios method" based on CAMELS composite ratings to determine assessment rates for small established institutions with less than $10 billion in assets, such as the Bank. The CAMELS rating system is a supervisory rating system designed to take into account and reflect all financial and operational risks that a bank may face, including capital adequacy, asset quality, management capability, earnings, liquidity and sensitivity to market risk ("CAMELS"). CAMELS composite ratings set a maximum assessment for CAMELS 1 and 2 rated banks, and set minimum assessments for lower rated institutions.
In March 2016, the FDIC implemented by final rule certain Dodd-Frank Act provisions by raising the DIF's minimum reserve ratio from 1.15% to 1.35%. The FDIC imposed a 4.5 basis point annual surcharge on insured depository institutions with total consolidated assets of $10 billion or more. The rule granted credits to smaller banks, such as the Bank, for the portion of their regular assessments that contributed to increasing the reserve ratio from 1.15% to 1.35%. In October 2022, the FDIC adopted a final rule to increase the assessment base rate schedules uniformly by two basis points beginning with the first quarterly assessment period of 2023. In 2022 and 2021, the Company recorded expense of $903,000 and $864,000, respectively, for FDIC insurance premiums.
Capital Requirements
The FRB, the OCC and the FDIC have issued substantially similar capital guidelines applicable to all banks and bank holding companies. In addition, those regulatory agencies may from time to time require that a banking organization maintain capital above the minimum levels because of its financial condition or actual or anticipated growth.
Effective January 1, 2015, the Company and the Bank became subject to rules implementing the Basel III regulatory capital reforms from the Basel Committee on Banking Supervision (the "Basel Committee") and certain provisions of the Dodd-Frank Act (the "Basel III Capital Rules"). The Basel III Capital Rules require the Company and the Bank to comply with the following minimum capital ratios: (i) a ratio of common equity Tier 1 to risk-weighted assets ("CET1") of at least 4.5%, plus a 2.5% "capital conservation buffer" (effectively resulting in a minimum CET1 ratio of at least 7%), (ii) a ratio of Tier 1 capital to risk-weighted assets of at least 6.0%, plus the 2.5% capital conservation buffer (effectively resulting in a minimum Tier 1 capital ratio of 8.5%), (iii) a ratio of total capital to risk-weighted assets of at least 8.0%, plus the 2.5% capital conservation buffer (effectively resulting in a minimum total capital ratio of 10.5%), and (iv) a leverage ratio of 4%, calculated as the ratio of Tier 1 capital to average assets. The capital conservation buffer, which was phased in ratably over a four year period beginning January 1, 2016, is designed to absorb losses during periods of economic stress. Institutions with a CET1 ratio above the minimum (4.5%) but below the minimum plus the conservation buffer (7.0%) will face constraints on dividends, equity repurchases, and discretionary compensation paid to certain officers, based on the amount of the shortfall.
With respect to the Bank, the "prompt corrective action" regulations pursuant to Section 38 of the Federal Deposit Insurance Act (the "FDIA") were also revised, effective as of January 1, 2015, to incorporate a CET1 ratio and to increase certain other capital ratios. To be well capitalized under the revised regulations, a bank must have the following minimum capital ratios: (i) a CET1 ratio of at least 6.5%; (ii) a Tier 1 capital to risk-weighted assets ratio of at least 8.0%; (iii) a total capital to risk-weighted assets ratio of at least 10.0%; and (iv) a leverage ratio of at least 5.0%. See "Prompt Corrective Action" below.
The Tier 1 and total capital to risk-weighted asset ratios of the Company were 12.86% and 13.67%, respectively, as of December 31, 2022, thus exceeding the minimum requirements. The CET 1 ratio of the Company was 11.70% and the Bank was 12.57% as of December 31, 2022. The Tier 1 and total capital to risk-weighted asset ratios of the Bank were 12.57% and 13.38%, respectively, as of December 31, 2022, also exceeding the minimum requirements.
The Basel III Capital Rules provide for a number of deductions from and adjustments to CET1. In July 2019, the federal banking agencies adopted final rules (the "Capital Simplification Rules") that, among other things, revised these deductions and adjustments. Following the adoption of the Capital Simplification Rules, certain deferred tax assets and significant investments in non-consolidated financial entities must be deducted from CET1 to the extent that any one such category exceeds 25% of CET1. Prior to the adoption of the Capital Simplification Rules, amounts were deducted from CET1 to the extent that any one such category exceeded 10% of CET1 or all such items, in the aggregate, exceeded 15% of CET1. The Capital Simplification Rules took effect for the Company as of January 1, 2020. These limitations did not impact regulatory capital during any of the reported periods.
The Basel III Capital Rules prescribe a standardized approach for risk weightings that expanded the risk-weighting categories from the general risk-based capital rules to a much larger and more risk-sensitive number of categories, depending on the nature of the assets, generally ranging from 0% for U.S. government and agency securities, to 600% for certain equity exposures (and higher percentages for certain other types of interests), and resulting in higher risk weights for a variety of asset categories. In November 2019, the federal banking agencies adopted a rule revising the scope of commercial real estate mortgages subject to a 150% risk weight.
In December 2017, the Basel Committee published standards that it described as the finalization of the Basel III post-crisis regulatory reforms (the standards are commonly referred to as "Basel IV"). Among other things, these standards revise the Basel Committee's standardized approach for credit risk (including by recalibrating risk weights and introducing new capital requirements for certain "unconditionally cancellable commitments," such as unused credit card lines of credit) and provide a new standardized approach for operational risk capital. Under the current capital rules, operational risk capital requirements and a capital floor apply only to advanced approaches institutions, and not to the Company. The impact of Basel IV on the Company and the Bank will depend on the manner in which it is implemented by the federal bank regulatory agencies.
On September 17, 2019, the federal banking agencies jointly issued a final rule required by the Economic Growth, Regulatory Relief and Consumer Protection Act of 2018 (the "EGRRCPA") that permits qualifying banks and bank holding companies that have less than $10 billion in consolidated assets to elect to be subject to a 9% leverage ratio (commonly referred to as the community bank leverage ratio or "CBLR"). Under the final rule, banks and bank holding companies that opt into the CBLR framework and maintain a CBLR of greater than 9% are not subject to other risk-based and leverage capital requirements under the Basel III Capital Rules and are deemed to have met the well capitalized ratio requirements under the "prompt corrective action" framework. In addition, a community bank that falls out of compliance with the framework has a two-quarter grace period to come back into full compliance, provided its leverage ratio remains above 8%, and will be deemed well-capitalized during the grace period. The CBLR framework was first available for banking organizations to use in their March 31, 2020 regulatory reports. The Company and the Bank do not currently expect to opt into the CBLR framework.
Dividends
The Company's principal source of cash flow, including cash flow to pay dividends to its shareholders, is dividends it receives from the Bank. Statutory and regulatory limitations apply to the Bank's payment of dividends to the Company. As a general rule, the amount of a dividend may not exceed, without prior regulatory approval, the sum of net income in the calendar year to date and the retained net earnings of the immediately preceding two calendar years. A depository institution may not pay any dividend if payment would cause the institution to become "undercapitalized" or if it already is "undercapitalized." The OCC may prevent the payment of a dividend if it determines that the payment would be an unsafe and unsound banking practice. The OCC also has advised that a national bank should generally pay dividends only out of current operating earnings.
Permitted Activities
As a bank holding company, the permitted activities of the Company are limited to managing or controlling banks, furnishing services to or performing services for its subsidiaries, and engaging in other activities that the FRB determines by regulation or order to be so closely related to banking or managing or controlling banks as to be a proper incident thereto. In determining whether a particular activity is permissible, the FRB must consider whether the performance of such an activity reasonably can be expected to produce benefits to the public that outweigh possible adverse effects. Possible benefits include greater convenience, increased competition, and gains in efficiency. Possible adverse effects include undue concentration of resources, decreased or unfair competition, conflicts of interest, and unsound banking practices. Despite prior approval, the FRB may order a bank holding company or its subsidiaries to terminate any activity or to terminate ownership or control of any subsidiary when the FRB has reasonable cause to believe that a serious risk to the financial safety, soundness or stability of any bank subsidiary of that bank holding company may result from such an activity.
Banking Acquisitions; Changes in Control
The BHC Act and related regulations require, among other things, the prior approval of the FRB in any case where a bank holding company proposes to (i) acquire direct or indirect ownership or control of more than 5% of the outstanding voting stock of any bank or bank holding company (unless it already owns a majority of such voting shares), (ii) acquire all or substantially all of the assets of another bank or bank holding company, or (iii) merge or consolidate with any other bank holding company. In determining whether to approve a proposed bank acquisition, the FRB will consider, among other factors, the effect of the acquisition on competition, the public benefits expected to be received from the acquisition, any outstanding regulatory compliance issues of any institution that is a party to the transaction, the projected capital ratios and levels on a post-acquisition basis, the financial condition of each institution that is a party to the transaction and of the combined institution after the transaction, the parties' managerial resources and risk management and governance processes and systems, the parties' compliance with the Bank Secrecy Act and anti-money laundering requirements, and the acquiring institution's performance under the Community Reinvestment Act of 1977, as amended (the "CRA"), and compliance with fair housing and other consumer protection laws.
Subject to certain exceptions, the BHC Act and the Change in Bank Control Act, together with the applicable regulations, require FRB approval (or, depending on the circumstances, no notice of disapproval) prior to any person or company acquiring "control" of a bank or bank holding company. A conclusive presumption of control exists if an individual or company acquires the power, directly or indirectly, to direct the management or policies of an insured depository institution or to vote 25% or more of any class of voting securities of any insured depository institution. A rebuttable presumption of control exists if a person or company acquires 10% or more but less than 25% of any class of voting securities of an insured depository institution and either the institution has registered its securities with the Securities and Exchange Commission (the "SEC") under Section 12 of the Securities Exchange Act of 1934 (the "Exchange Act") or no other person will own a greater percentage of that class of voting securities immediately after the acquisition. The Company's common stock is registered under Section 12 of the Exchange Act.
In addition, Virginia law requires the prior approval of the SCC for (i) the acquisition by a Virginia bank holding company of more than 5% of the voting shares of a Virginia bank or any holding company that controls a Virginia bank, or (ii) the acquisition by a Virginia bank holding company of a bank or its holding company domiciled outside Virginia.
Source of Strength
FRB policy has historically required bank holding companies to act as a source of financial and managerial strength to their subsidiary banks. The Dodd-Frank Act codified this policy as a statutory requirement. Under this requirement, the Company is expected to commit resources to support the Bank, including at times when the Company may not be in a financial position to provide such resources. Any capital loans by a bank holding company to any of its subsidiary banks are subordinate in right of payment to depositors and to certain other indebtedness of such subsidiary banks. In the event of a bank holding company's bankruptcy, any commitment by the bank holding company to a federal bank regulatory agency to maintain the capital of a subsidiary bank will be assumed by the bankruptcy trustee and entitled to priority of payment.
Safety and Soundness
There are a number of obligations and restrictions imposed on bank holding companies and their subsidiary banks by law and regulatory policy that are designed to minimize potential loss to the depositors of such depository institutions and the FDIC insurance fund in the event of a depository institution insolvency, receivership or default. For example, under the Federal Deposit Insurance Corporation Improvement Act of 1991, to avoid receivership of an insured depository institution subsidiary, a bank holding company is required to guarantee the compliance of any subsidiary bank that may become "undercapitalized" with the terms of any capital restoration plan filed by such subsidiary with its appropriate federal bank regulatory agency up to the lesser of (i) an amount equal to 5% of the institution's total assets at the time the institution became undercapitalized or (ii) the amount that is necessary (or would have been necessary) to bring the institution into compliance with all applicable capital standards as of the time the institution fails to comply with such capital restoration plan.
Under the FDIA, the federal bank regulatory agencies have adopted guidelines prescribing safety and soundness standards. These guidelines establish general standards relating to capital management, internal controls and information systems, internal audit systems, data security, loan documentation, credit underwriting, interest rate exposure, risk management, vendor management, corporate governance, asset growth, and compensation, fees and benefits. In general, the guidelines require, among other things, appropriate systems and practices to identify and manage the risk and exposures specified in the guidelines.
Prompt Corrective Action
The federal bank regulatory agencies possess broad powers to take prompt corrective action to resolve problems of insured depository institutions. The extent of these powers depends upon whether the institution is "well capitalized," "adequately capitalized," "undercapitalized," "significantly undercapitalized," or "critically undercapitalized," as defined by the law. "Well capitalized" institutions may generally operate without additional supervisory restriction. With respect to "adequately capitalized" institutions, such banks cannot normally pay dividends or make any capital contributions that would leave the bank undercapitalized; they cannot pay a management fee to a controlling person if after paying the fee, it would be undercapitalized; and they cannot accept, renew, or rollover any brokered deposit unless the bank has applied for and been granted a waiver by the FDIC.
Immediately upon becoming "undercapitalized," a depository institution becomes subject to the provisions of Section 38 of the FDIA, which: (i) restrict payment of capital distributions and management fees; (ii) require that the appropriate federal banking agency monitor the condition of the institution and its efforts to restore its capital; (iii) require submission of a capital restoration plan; (iv) restrict the growth of the institution’s assets; and (v) require prior approval of certain expansion proposals. The appropriate federal banking agency for an undercapitalized institution also may take any number of discretionary supervisory actions if the agency determines that any of these actions is necessary to resolve the problems of the institution at the least possible long-term cost to the DIF, subject in certain cases to specified procedures. These discretionary supervisory actions include: (i) requiring the institution to raise additional capital; (ii) restricting transactions with affiliates; (iii) requiring divestiture of the institution or the sale of the institution to a willing purchaser; and (iv) any other supervisory action that the agency deems appropriate. These and additional mandatory and permissive supervisory actions may be taken with respect to significantly undercapitalized and critically undercapitalized institutions. Management believes, as of December 31, 2022 and 2021, the Bank met the requirements for being classified as "well capitalized."
Transactions with Affiliates
Pursuant to Sections 23A and 23B of the Federal Reserve Act and Regulation W, the authority of the Bank to engage in transactions with related parties or "affiliates" or to make loans to insiders is limited. Loan transactions with an affiliate generally must be collateralized and certain transactions between the Bank and its affiliates, including the sale of assets, the payment of money, or the provision of services, must be on terms and conditions that are substantially the same, or at least as favorable to the Bank, as those prevailing for comparable nonaffiliated transactions. In addition, the Bank generally may not purchase securities issued or underwritten by affiliates.
Loans to executive officers, directors or to any person who directly or indirectly, or acting through or in concert with one or more persons, owns, controls or has the power to vote more than 10% of any class of voting securities of a bank, are subject to Sections 22(g) and 22(h) of the Federal Reserve Act and their corresponding regulations (Regulation O) and Section 13(k) of the Exchange Act relating to the prohibition on personal loans to executives (which exempts financial institutions in compliance with the insider lending restrictions of Section 22(h) of the Federal Reserve Act). Among other things, these loans must be made on terms substantially the same as those prevailing on transactions made to unaffiliated individuals and certain extensions of credit to those persons must first be approved in advance by a disinterested majority of the entire board of directors. Section 22(h) of the Federal Reserve Act prohibits loans to any of those individuals where the aggregate amount exceeds an amount equal to 15% of an institution's unimpaired capital and surplus plus an additional 10% of unimpaired capital and surplus in the case of loans that are fully secured by readily marketable collateral, or when the aggregate amount on all of the extensions of credit outstanding to all of these persons would exceed the Bank's unimpaired capital and unimpaired surplus. Section 22(g) of the Federal Reserve Act identifies limited circumstances in which the Bank is permitted to extend credit to executive officers.
Consumer Financial Protection
The Company is subject to a number of federal and state consumer protection laws that extensively govern its relationship with its customers. These laws include the Equal Credit Opportunity Act, the Fair Credit Reporting Act, the Truth in Lending Act, the Truth in Savings Act, the Electronic Fund Transfer Act, the Expedited Funds Availability Act, the Home Mortgage Disclosure Act, the Fair Housing Act, the Real Estate Settlement Procedures Act, the Fair Debt Collection Practices Act, the Service Members Civil Relief Act, laws governing flood insurance, federal and state laws prohibiting unfair and deceptive business practices, foreclosure laws, and various regulations that implement some or all of the foregoing. These laws and regulations mandate certain disclosure requirements and regulate the manner in which financial institutions must deal with customers when taking deposits, making loans, collecting loans and providing other services. If the Company fails to comply with these laws and regulations, it may be subject to various penalties. Failure to comply with consumer protection requirements may also result in failure to obtain any required bank regulatory approval for merger or acquisition transactions the Company may wish to pursue or being prohibited from engaging in such transactions even if approval is not required.
The Dodd-Frank Act centralized responsibility for consumer financial protection by creating a new agency, the Consumer Financial Protection Bureau (the "CFPB"), and giving it responsibility for implementing, examining, and enforcing compliance with federal consumer protection laws. The CFPB focuses on (i) risks to consumers and compliance with the federal consumer financial laws, (ii) the markets in which firms operate and risks to consumers posed by activities in those markets, (iii) depository institutions that offer a wide variety of consumer financial products and services, and (iv) non-depository companies that offer one or more consumer financial products or services.
The CFPB has broad rulemaking authority for a wide range of consumer financial laws that apply to all banks, including, among other things, the authority to prohibit "unfair, deceptive or abusive" acts and practices. Abusive acts or practices are defined as those that materially interfere with a consumer's ability to understand a term or condition of a consumer financial product or service or take unreasonable advantage of a consumer's (i) lack of financial savvy, (ii) inability to protect himself in the selection or use of consumer financial products or services, or (iii) reasonable reliance on a covered entity to act in the consumer's interests. The CFPB can issue cease-and-desist orders against banks and other entities that violate consumer financial laws. The CFPB may also institute a civil action against an entity in violation of federal consumer financial law in order to impose a civil penalty or injunction. Further regulatory positions taken by the CFPB may influence how other regulatory agencies may apply the subject consumer financial protection laws and regulations.
Community Reinvestment Act
The CRA requires the appropriate federal banking agency, in connection with its examination of a bank, to assess the bank's record in meeting the credit needs of the communities served by the bank, including low and moderate income neighborhoods. Furthermore, such assessment is also required of banks that have applied, among other things, to merge or consolidate with or acquire the assets or assume the liabilities of an insured depository institution, or to open or relocate a branch. In the case of a BHC applying for approval to acquire a bank or BHC, the record of each subsidiary bank of the applicant BHC is subject to assessment in considering the application. Under the CRA, institutions are assigned a rating of "outstanding," "satisfactory," "needs to improve," or "substantial non-compliance." The Bank was rated "satisfactory" in its most recent CRA evaluation.
In May 2022, the federal bank regulatory agencies jointly issued a proposed rule intended to strengthen and modernize the CRA regulatory framework. If implemented, the rule would, among other things, (i) expand access to credit, investment and basic banking services in low- and moderate-income communities, (ii) adapt to changes in the banking industry, including internet and mobile banking, (iii) provide greater clarity, consistency and transparency in the application of the regulations and (iv) tailor performance standards to account for differences in bank size, business model, and local conditions.
Anti-Money Laundering Legislation
The Company is subject to several federal laws that are designed to combat money laundering, terrorist financing, and transactions with persons, companies or foreign governments designated by U.S. authorities ("AML laws"). This category of laws includes the Bank Secrecy Act of 1970, the Money Laundering Control Act of 1986, the USA PATRIOT Act of 2001, and the Anti-Money Laundering Act of 2020.
The AML laws and their implementing regulations require insured depository institutions, broker-dealers, and certain other financial institutions to have policies, procedures, and controls to detect, prevent, and report money laundering and terrorist financing. The AML laws and their regulations also provide for information sharing, subject to conditions, between federal law enforcement agencies and financial institutions, as well as among financial institutions, for counter-terrorism purposes. Federal banking regulators are required, when reviewing bank holding company acquisition and bank merger applications, to take into account the effectiveness of the anti-money laundering activities of the applicants. To comply with these obligations, the Company has implemented appropriate internal practices, procedures, and controls.
Office of Foreign Assets Control
The U.S. Treasury Department's Office of Foreign Assets Control ("OFAC""Committee") is responsible for administeringestablishing and enforcing economic and trade sanctions against specified foreign parties, including countries and regimes, foreign individuals and other foreign organizations and entities. OFAC publishes listsapproving the compensation of prohibited parties that are regularly consulted by the Company in the conduct of its business in order to assure compliance. The Company is responsible for, among other things, blocking accounts of, and transactions with, prohibited parties identified by OFAC, avoiding unlicensed trade and financial transactions with such parties and reporting blocked transactions after their occurrence. Failure to comply with OFAC requirements could have serious legal, financial and reputational consequences for the Company.
Privacy Legislation
Several recent laws, including the Right to Financial Privacy Act, and related regulations issued by the federal bank regulatory agencies, also provide new protections against the transfer and use of customer information by financial institutions. A financial institution must provide to its customers information regarding its policies and procedures with respect to the handling of customers' personal information. Each institution must conduct an internal risk assessment of its ability to protect customer information. These privacy provisions generally prohibit a financial institution from providing a customer's personal financial information to unaffiliated parties without prior notice and approval from the customer.
Incentive Compensation
The Dodd-Frank Act requires the federal banking agencies and the SEC to establish joint regulations or guidelines prohibiting incentive-based payment arrangements at specified regulated entities with at least $1 billion in total consolidated assets, that encourage inappropriate risks by providing an executive officer, employee, director, or principal shareholder with excessive compensation, fees, or benefits that could lead to material financial loss to the entity. In 2016, the SEC and the federal banking agencies proposed rules that prohibit covered financial institutions (including bank holding companies and banks) from establishing or maintaining incentive-based compensation arrangements that encourage inappropriate risk taking by providing covered persons (consisting of senior executive officers and significant risk takers, as defined in the rules) with excessive compensation, fees, or benefits that could lead to material financial loss to the financial institution. The proposed rules outline factors to be considered when analyzing whether compensation is excessive and whether an incentive-based compensation arrangement encourages inappropriate risks that could lead to material loss to the covered financial institution, and establishes minimum requirements that incentive-based compensation arrangements must meet to be considered to not encourage inappropriate risks and to appropriately balance risk and reward. The proposed rules also impose additional corporate governance requirements on the boards of directors of covered financial institutions and impose additional record-keeping requirements. The comment period for these proposed rules has closed, and a final rule has not yet been published. If the rules are adopted as proposed, they will restrict the manner in which executive compensation is structured.
In October 2022, the SEC adopted a final rule directing national securities exchanges and associations, including The Nasdaq Stock Market, LLC, the exchange on which our common stock is listed, to implement listing standards that require listed companies to adopt policies mandating the recovery or "clawback" of excess incentive compensation earned by a current or former executive officer during the three fiscal years preceding the date the listed company is required to prepare an accounting restatement, including to correct an error that would result in a material misstatement if the error were corrected in the current period or left uncorrected in the current period. In February 2023, The Nasdaq Stock Market, LLC posted its initial rule filing with the SEC to implement this directive. The final rule will require us to adopt a clawback policy that is compliant with the new listing standard within 60 days after such standard becomes effective.
Mortgage Banking Regulation
In connection with making mortgage loans, the Bank is subject to rules and regulations that, among other things, establish standards for loan origination, prohibit discrimination, provide for inspections and appraisals of property, require credit reports on prospective borrowers, in some cases restrict certain loan features and fix maximum interest rates and fees, require the disclosure of certain basic information to mortgagors concerning credit and settlement costs, limit payment for settlement services to the reasonable value of the services rendered and require the maintenance and disclosure of information regarding the disposition of mortgage applications based on race, gender, geographical distribution and income level. The Bank is also subject to rules and regulations that require the collection and reporting of significant amounts of information with respect to mortgage loans and borrowers. The Bank’s mortgage origination activities are subject to the FRB’s Regulation Z, which implements the Truth in Lending Act. Certain provisions of Regulation Z require creditors to make a reasonable and good faith determination based on verified and documented information that a consumer applying for a mortgage loan has a reasonable ability to repay the loan according to its terms.
Cybersecurity
The federal bank regulatory agencies have adopted guidelines for establishing information security standards and cybersecurity programs for implementing safeguards under the supervision of a financial institution’s board of directors. These guidelines, along with related regulatory materials, increasingly focus on risk management and processes related to information technology and the use of third parties in the provision of financial products and services. The federal bank regulatory agencies expect financial institutions to establish lines of defense and to ensure that their risk management processes address the risk posed by compromised customer credentials, and also expect financial institutions to maintain sufficient business continuity planning processes to ensure rapid recovery, resumption and maintenance of the institution’s operations after a cyberattack. If we fail to meet the expectations set forth in this regulatory guidance, we could be subject to various regulatory actions and any remediation efforts may require us to devote significant resources
On November 18, 2021, the federal bank regulatory agencies issued a final rule, effective April 1, 2022, imposing new notification requirements for cybersecurity incidents. The rule requires financial institutions to notify their primary federal regulator as soon as possible and no later than 36 hours after the institution determines that a cybersecurity incident has occurred that has materially disrupted or degraded, or is reasonably likely to materially disrupt or degrade, the institution’s: (i) ability to carry out banking operations, activities, or processes, or deliver banking products and services to a material portion of its customer base, in the ordinary course of business, (ii) business line(s), including associated operations, services, functions, and support, that upon failure would result in a material loss of revenue, profit, or franchise value, or (iii) operations, including associated services, functions and support, as applicable, the failure or discontinuance of which would pose a threat to the financial stability of the United States.
To date, the Company has not experienced a significant compromise, significant data loss or any material financial losses related to cybersecurity attacks, but its systems and those of its customers and third-party service providers are under constant threat and it is possible that the Company could experience a significant event in the future. Risks and exposures related to cybersecurity attacks are expected to remain high for the foreseeable future due to the rapidly evolving nature and sophistication of these threats, as well as due to the expanding use of Internet banking, mobile banking and other technology-based products and services by the Company and its customers.
Future Legislation and Regulation
Congress may enact legislation from time to time that affects the regulation of the financial services industry, and state legislatures may enact legislation from time to time affecting the regulation of financial institutions chartered by or operating in those states. Federal and state regulatory agencies also periodically propose and adopt changes to their regulations or change the manner in which existing regulations are applied. The substance or impact of pending or future legislation or regulation, or the application thereof, cannot be predicted, although enactment of the proposed legislation could affect the regulatory structure under which the Company and the Bank operate and may significantly increase costs, impede the efficiency of internal business processes, require an increase in regulatory capital, require modifications to business strategy, and limit the ability to pursue business opportunities in an efficient manner. A change in statutes, regulations or regulatory policies applicable to the Company or the Bank could have a material adverse effect on the business, financial condition and results of operations of the Company and the Bank.
Effect of Governmental Monetary Policies
The Company's operations are affected not only by general economic conditions, but also by the policies of various regulatory authorities. In particular, the FRB regulates money and credit conditions and interest rates to influence general economic conditions. These policies have a significant impact on overall growth and distribution of loans, investments and deposits; they affect interest rates charged on loans or paid for time and savings deposits. FRB monetary policies have had a significant effect on the operating results of commercial banks, including the Company, in the past and are expected to do so in the future. As a result, it is difficult for the Company to predict the potential effects of possible changes in monetary policies upon its future operating results.
Tax Reform
As a result of the enactment of the Coronavirus Aid, Relief, and Economic Security Act ("CARES Act") in 2020, the Company recognized a tax benefit for the net operating loss ("NOL") five-year carryback provision for the NOL acquired in the HomeTown merger.
Internet Access to Company Documents
The Company provides access to its SEC filings through a link on the Investor Relations page of the Company's website at www.amnb.com. Reports available at no cost include the annual report on Form 10-K, quarterly reports on Form 10-Q, current reports on Form 8-K, and all amendments to those reports as soon as reasonably practicable after the reports are filed electronically with the SEC. The information on the Company's website is not incorporated into this Annual Report on Form 10-K or any other filing the Company makes with the SEC. The SEC maintains an Internet site that contains reports, proxy and information statements, and other information regarding issuers that file electronically with the SEC at www.sec.gov.
Executive Officers of the Company
The following table lists the executive officers of the Company, their ages,except for the compensation of the Chief Executive Officer, which is approved by the independent members of the Board of Directors. The Committee considers a variety of factors and their positions:
Principal Position During 2023 | Years of |
| |||
| Jeffrey V. Haley |
| President and Chief Executive Officer of the Company and the Bank | 27 | ||
| Jeffrey W. Farrar | Senior | ||||
|
|
| 5 | ||
| Edward C. Martin | Senior Executive Vice President and Chief Administrative Officer of the Company and the Bank and President of Virginia Banking | 8 | |||
| Rhonda P. Joyce |
| Executive Vice President and Co-Head of | 13 | ||
| Alexander Jung | Executive Vice President and Co-Head of | 2 |
Institution Name | Ticker | State |
| Stock Yards Bancorp, Inc. | SYBT | KY |
| City Holding Co. | CHCO | WV |
| Community Trust Bancorp, Inc. | CTBI | KY |
| CNB Financial Corp. | CCNE | PA |
| Peoples Bancorp Inc. | PEBO | OH |
| SmartFinancial Inc. | SMBK | TN |
| HomeTrust Bancshares Inc. | HTBI | NC |
| Mid Penn Bancorp Inc. | MPB | PA |
| Primis Financial Corp. | FRST | VA |
| Summit Financial Group Inc. | SMMF | WV |
| Capstar Financial Holdings Inc. | CSTR | TN |
| First Community Bancshares, Inc. | FCBC | VA |
| Orrstown Financial Services | ORRF | PA |
| Southern First Bancshares, Inc. | SFST | SC |
| MetroCity Bankshares Inc. | MCBS | GA |
| Codorus Valley Bancorp Inc. | CVLY | PA |
| The Community Financial Corporation | TCFC | MD |
| C&F Financial Corporation | CFFI | VA |
CREDIT RISK
December 31, 2022 Equity compensation plans approved by shareholders Equity compensation plans not approved by shareholders Total Period Beginning on First Day of Month Ended Total Number of Shares Purchased Average Price Paid Per Share Total Number of Shares Purchased as Part of Publicly Announced Plans or Programs Maximum Number of Shares that May Yet Be Purchased Under Plans or Programs October 31, 2022 November 30, 2022 December 31, 2022 Total Period Ending Index 12/31/2017 12/31/2018 12/31/2019 12/31/2020 12/31/2021 12/31/2022 American National Bankshares Inc. Nasdaq Composite SNL Bank $1B-$5B Year Ended December 31, 2022 2021 2020 Efficiency Ratio Noninterest expense Add/subtract: gain/loss on sale OREO, net of writedowns Subtract: core deposit intangible amortization Adjusted noninterest expense Net interest income Tax equivalent adjustment Noninterest income Subtract: gain on securities Add/subtract: loss/gain on sale of fixed assets Adjusted revenues Efficiency ratio Year Ended December 31, 2022 2021 2020 Reconciliation of Net Interest Income to Tax-Equivalent Net Interest Income Non-GAAP measures: Interest income - loans Interest income - investments and other Interest expense - deposits Interest expense - customer repurchase agreements Interest expense - other short-term borrowings Interest expense - long-term borrowings Total net interest income Less non-GAAP measures: Tax benefit realized on nontaxable interest income - loans Tax benefit realized on nontaxable interest income - municipal securities GAAP measures net interest income Year Ended December 31, 2022 2021 2020 Return on Average Tangible Common Equity Return on average common equity (GAAP basis) Impact of excluding average goodwill and other intangibles Return on average tangible common equity (non-GAAP) As of December 31, 2022 2021 Tangible Common Equity to Tangible Assets Common equity to assets ratio (GAAP basis) Impact of excluding goodwill and other intangibles Tangible common equity to tangible assets ratio (non-GAAP) As of December 31, 2022 2021 Tangible Book Value Per Share Book value per share (GAAP basis) Impact of excluding goodwill and other intangibles Tangible book value per share (non-GAAP) Average Balance Interest Income/Expense(1) Average Yield/Rate 2022 2021 2020 2022 2021 2020 2022 2021 2020 Loans: Commercial Real estate Consumer Total loans(2) Securities: U.S. Treasury Federal agencies and GSEs Mortgage-backed and CMOs State and municipal Other securities Total securities Deposits in other banks Total interest earning assets Nonearning assets Total assets Deposits: Demand Money market Savings Time Total interest bearing deposits Customer repurchase agreements Other short-term borrowings Long-term borrowings Total interest bearing liabilities Noninterest bearing demand deposits Other liabilities Shareholders' equity Total liabilities and shareholders' equity Interest rate spread Net interest margin Net interest income (taxable equivalent basis) Less: Taxable equivalent adjustment(3) Net interest income 2022 vs. 2021 2021 vs. 2020 Change Change Increase Attributable to Increase Attributable to Interest income (Decrease) Rate Volume (Decrease) Rate Volume Loans: Commercial Real estate Consumer Total loans Securities: U.S. Treasury Federal agencies and GSEs Mortgage-backed and CMOs State and municipal Other securities Total securities Deposits in other banks Total interest income Interest expense Deposits: Demand Money market Savings Time Total deposits Customer repurchase agreements Other short-term borrowings Long-term borrowings Total interest expense Net interest income Loans Accretion Deposit Accretion Borrowings Amortization Total For the year ended December 31, 2020 For the year ended December 31, 2021 For the year ended December 31, 2022 For the years ending (estimated): 2023 2024 2025 2026 2027 Thereafter (estimated) Year Ended December 31, (Dollars in thousands) 2022 2021 $ Change % Change Noninterest income: Wealth management income Service charges on deposit accounts Interchange fees Other fees and commissions Mortgage banking income Securities gains, net Income from Small Business Investment Companies Income from insurance investments Losses on premises and equipment, net Other Total noninterest income Year Ended December 31, (Dollars in thousands) 2021 2020 $ Change % Change Noninterest income: Wealth management income Service charges on deposit accounts Interchange fees Other fees and commissions Mortgage banking income Securities gains, net Income from Small Business Investment Companies Income from insurance investments Losses on premises and equipment, net Other Total noninterest income Year Ended December 31, (Dollars in thousands) 2022 2021 $ Change % Change Noninterest expense: Salaries and employee benefits Occupancy and equipment FDIC assessment Bank franchise tax Core deposit intangible amortization Data processing Software Other real estate owned, net Other Total noninterest expense Year Ended December 31, (Dollars in thousands) 2021 2020 $ Change % Change Noninterest expense: Salaries and employee benefits Occupancy and equipment FDIC assessment Bank franchise tax Core deposit intangible amortization Data processing Software Other real estate owned, net Other Total noninterest expense December 31, 2022 Change in net interest income Change in interest rates Amount Percent Up 4.0% Up 3.0% Up 2.0% Up 1.0% Flat Down 1.0% Down 2.0% Down 3.0% December 31, 2022 Change in interest rates Amount $ Change % Change Up 4.0% Up 3.0% Up 2.0% Up 1.0% Flat Down 1.0% Down 2.0% Down 3.0% As of December 31, 2022 2021 Taxable Taxable Equivalent Equivalent Yield Yield U. S. Treasury Within 1 year % % 1 to 5 years 5 to 10 years Over 10 years Total Federal Agencies: Within 1 year 1 to 5 years 5 to 10 years Over 10 years Total Mortgage-backed: Within 1 year 1 to 5 years 5 to 10 years Over 10 years Total State and Municipal: Within 1 year 1 to 5 years 5 to 10 years Over 10 years Total Corporate Securities: Within 1 year 1 to 5 years 5 to 10 years Over 10 years Total Total portfolio % % As of December 31, 2022 Maturing within one year Maturing after one but within five years Maturing after five but within fifteen years Maturing after fifteen years Total Real estate: Construction and land development Commercial real estate - owner occupied Commercial real estate - non-owner occupied Residential real estate Home equity Total real estate Commercial and industrial Consumer Total loans, net of deferred fees and costs Interest rate sensitivity: Fixed interest rates Floating or adjustable rates Total loans, gross Commercial Construction and Land Development Commercial Real Estate - Owner Occupied Commercial Real Estate - Non-owner Occupied Residential Real Estate Consumer Total Balance at December 31, 2021 Provision for (recovery of) loan losses Charge-offs Recoveries Balance at December 31, 2022 Average Loans Ratio of net (recoveries) charge-offs to average loans Commercial Construction and Land Development Commercial Real Estate - Owner Occupied Commercial Real Estate - Non-owner Occupied Residential Real Estate Consumer Total Balance at December 31, 2020 Recovery of provision for loan losses Charge-offs Recoveries Balance at December 31, 2021 Average Loans Ratio of net (recoveries) charge-offs to average loans As of or For the Year Ended December 31, 2022 2021 2020 Allowance to loans (1) ASC 450/general allowance Net charge-offs (recoveries) to year-end allowance Net charge-offs (recoveries) to average loans Nonperforming assets to total assets Nonperforming loans to loans Provision to net charge-offs (recoveries) Provision (recovery) to average loans Allowance to nonperforming loans Year Ended December 31, 2022 2021 Average Average Balance Rate Balance Rate Noninterest bearing deposits Interest bearing accounts: NOW accounts Money market Savings Time Total interest bearing deposits Average total deposits December 31, 2022 3 months or less Over 3 through 6 months Over 6 through 12 months Over 12 months Total As of December 31, 2022 2021 Risk-Based Capital Ratios: Common equity tier 1 capital ratio Tier 1 capital ratio Total capital ratio Leverage Capital Ratios: Tier 1 leverage ratio Payments Due By Period Total Under 1 Year 1-3 Years 3-5 Years More than 5 years Time deposits Repurchase agreements Operating leases Junior subordinated debt December 31, Off-Balance Sheet Commitments 2022 2021 Commitments to extend credit Standby letters of credit Mortgage loan rate-lock commitments December 31, 2022 2021 2020 2019 2018 Results of Operations: Interest income Interest expense Net interest income Provision for (recovery of) loan losses Noninterest income Noninterest expense Income before income tax provision Income tax provision Net income Financial Condition: Assets Loans, net of unearned income Securities Deposits Shareholders' equity Per Share Information: Earnings per share, basic Earnings per share, diluted Cash dividends paid Book value Book value, tangible (1) Average common shares outstanding - basic Average common shares outstanding - diluted Selected Ratios: Return on average assets Return on average common equity Return on average tangible common equity (1) Dividend payout ratio Efficiency ratio (1) Net interest margin Asset Quality Ratios: Allowance for loan losses to period end loans Allowance for loan losses to period end nonperforming loans Nonperforming assets to total assets Net charge-offs (recoveries) to average loans Capital Ratios: Total risk-based capital ratio Common equity tier 1 capital ratio Tier 1 capital ratio Tier 1 leverage ratio 2022 2021 ASSETS Cash and due from banks Interest-bearing deposits in other banks Securities available for sale, at fair value Restricted stock, at cost Loans held for sale Loans, net of deferred fees and costs Less allowance for loan losses Net loans Premises and equipment, net Assets held-for-sale Other real estate owned, net of valuation allowance Goodwill Core deposit intangibles, net Bank owned life insurance Other assets Total assets LIABILITIES and SHAREHOLDERS' EQUITY Liabilities: Noninterest-bearing deposits Interest-bearing deposits Total deposits Customer repurchase agreements Other short-term borrowings Junior subordinated debt Other liabilities Total liabilities Commitments and contingencies Shareholders' equity: Preferred stock, $5 par value, 2,000,000 shares authorized, none outstanding Common stock, $1 par value, 20,000,000 shares authorized, 10,608,781 shares outstanding at December 31, 2022 and 10,766,967 shares outstanding at December 31, 2021 Capital in excess of par value Retained earnings Accumulated other comprehensive loss, net Total shareholders' equity Total liabilities and shareholders' equity 2022 2021 2020 Interest and Dividend Income: Interest and fees on loans Interest and dividends on securities: Taxable Tax-exempt Dividends Other interest income Total interest and dividend income Interest Expense: Interest on deposits Interest on short-term borrowings Interest on subordinated debt Interest on junior subordinated debt Total interest expense Net Interest Income Provision for (recovery of) loan losses Net Interest Income after Provision for (Recovery of) Loan Losses Noninterest Income: Wealth management income Service charges on deposit accounts Interchange fees Other fees and commissions Mortgage banking income Securities gains, net Income from Small Business Investment Companies Income from insurance investments Losses on premises and equipment, net Other Total noninterest income Noninterest Expense: Salaries and employee benefits Occupancy and equipment FDIC assessment Bank franchise tax Amortization of intangible assets Data processing Software Other real estate owned, net Other Total noninterest expense Income Before Income Taxes Income Taxes Net Income Net Income Per Common Share: Basic Diluted Weighted Average Common Shares Outstanding: Basic Diluted Year Ended December 31, 2022 2021 2020 Net income Other comprehensive income (loss): Unrealized gains (losses) on securities available for sale Tax effect Reclassification adjustment for gains on sale or call of securities Tax effect Unrealized gains (losses) on cash flow hedges Tax effect Change in unfunded pension liability Tax effect Other comprehensive income (loss) Comprehensive income (loss) Accumulated Capital in Other Total Common Excess of Retained Comprehensive Shareholders' Stock Par Value Earnings Income (Loss) Equity Balance, December 31, 2019 Net income Other comprehensive income Stock repurchased (140,526 shares) Stock options exercised (2,573 shares) Vesting of restricted stock (18,487 shares) Equity based compensation (48,780 shares) Cash dividends paid, $1.08 per share Balance, December 31, 2020 Net income Other comprehensive loss Stock repurchased (265,939 shares) Stock options exercised (5,346 shares) Vesting of restricted stock (23,968 shares) Equity based compensation (45,193 shares) Cash dividends paid, $1.09 per share Balance, December 31, 2021 Net income Other comprehensive loss Stock repurchased (206,978 shares) Stock options exercised (713 shares) Vesting of restricted stock (17,583 shares) Equity based compensation (16,462 shares) Cash dividends paid, $1.14 per share Balance, December 31, 2022 2022 2021 2020 Cash Flows from Operating Activities: Net income Adjustments to reconcile net income to net cash provided by operating activities: Provision for (recovery of) loan losses Depreciation Net accretion of acquisition accounting adjustments Core deposit intangible amortization Net amortization of securities Net gain on sale or call of securities available for sale Gain on sale of loans held for sale Proceeds from sales of loans held for sale Originations of loans held for sale Net (gain) loss on other real estate owned Net loss on sale, write-down or disposal of premises and equipment Equity based compensation expense Earnings on bank owned life insurance Deferred income tax (benefit) expense Net change in other assets Net change in other liabilities Net cash provided by operating activities Cash Flows from Investing Activities: Proceeds from sales of securities available for sale Proceeds from maturities, calls and paydowns of securities available for sale Purchases of securities available for sale Net change in restricted stock Proceeds from sales of purchased credit impaired loans Net decrease (increase) in loans Net change in collateral with other financial institutions Proceeds from sale of premises and equipment Purchases of premises and equipment Proceeds from sales of other real estate owned Net cash used in investing activities Cash Flows from Financing Activities: Net change in noninterest-bearing deposits Net change in interest-bearing deposits Net change in customer repurchase agreements Net change in short-term borrowings Net change in long-term borrowings Common stock dividends paid Repurchase of common stock Proceeds from exercise of stock options Net cash (used in) provided by financing activities Net (Decrease) Increase in Cash and Cash Equivalents Cash and Cash Equivalents at Beginning of Period Cash and Cash Equivalents at End of Period December 31, 2022 Amortized Unrealized Unrealized Cost Gains Losses Fair Value Securities available for sale: U.S. Treasury Federal agencies and GSEs Mortgage-backed and CMOs State and municipal Corporate Total securities available for sale (Dollars in thousands) Amortized Unrealized Unrealized Cost Gains Losses Fair Value Securities available for sale: U.S. Treasury Federal agencies and GSEs Mortgage-backed and CMOs State and municipal Corporate Total securities available for sale Available for Sale Amortized Cost Fair Value Due in one year or less Due after one year through five years Due after five years through ten years Due after ten years Mortgage-backed and CMOs For the Year Ended December 31, 2022 2021 2020 Gross realized gains Gross realized losses Proceeds from sales of securities Total Less than 12 Months 12 Months or More Fair Unrealized Fair Unrealized Fair Unrealized Value Loss Value Loss Value Loss U.S. Treasury Federal agencies and GSEs Mortgage-backed and CMOs State and municipal Corporate Total Total Less than 12 Months 12 Months or More Fair Unrealized Fair Unrealized Fair Unrealized Value Loss Value Loss Value Loss U.S. Treasury Federal agencies and GSEs Mortgage-backed and CMOs State and municipal Corporate Total December 31, 2022 2021 Commercial Commercial real estate: Construction and land development Commercial real estate - owner occupied Commercial real estate - non-owner occupied Residential real estate: Residential Home equity Consumer Total loans, net of deferred fees and costs 2022 2021 Outstanding principal balance Carrying amount 2022 2021 Outstanding principal balance Carrying amount 2022 2021 2020 Balance at January 1 Accretion Reclassification from nonaccretable difference Other changes, net (1) Balance at December 31 90 Days + Past Due Non- Total 30- 59 Days 60-89 Days and Still Accrual Past Total Past Due Past Due Accruing Loans Due Current Loans Commercial Commercial real estate: Construction and land development Commercial real estate - owner occupied Commercial real estate - non-owner occupied Residential: Residential Home equity Consumer Total 90 Days + Past Due Non- Total 30- 59 Days 60-89 Days and Still Accrual Past Total Past Due Past Due Accruing Loans Due Current Loans Commercial Commercial real estate: Construction and land development Commercial real estate - owner occupied Commercial real estate - non-owner occupied Residential: Residential Home equity Consumer Total Unpaid Average Interest Recorded Principal Related Recorded Income Investment Balance Allowance Investment Recognized With no related allowance recorded: Commercial Commercial real estate: Construction and land development Commercial real estate - owner occupied Commercial real estate - non-owner occupied Residential: Residential Home equity Consumer With a related allowance recorded: Commercial Commercial real estate: Construction and land development Commercial real estate - owner occupied Commercial real estate - non-owner occupied Residential Residential Home equity Consumer Total: Commercial Commercial real estate: Construction and land development Commercial real estate - owner occupied Commercial real estate - non-owner occupied Residential: Residential Home equity Consumer Unpaid Average Interest Recorded Principal Related Recorded Income Investment Balance Allowance Investment Recognized With no related allowance recorded: Commercial Commercial real estate: Construction and land development Commercial real estate - owner occupied Commercial real estate - non-owner occupied Residential: Residential Home equity Consumer With a related allowance recorded: Commercial Commercial real estate: Construction and land development Commercial real estate - owner occupied Commercial real estate - non-owner occupied Residential: Residential Home equity Consumer Total: Commercial Commercial real estate: Construction and land development Commercial real estate - owner occupied Commercial real estate - non-owner occupied Residential: Residential Home equity Consumer Loans Modified as TDRs for the Year Ended December 31, 2022 Pre-Modification Post-Modification Number of Outstanding Recorded Outstanding Recorded Contracts Investment Investment Commercial Commercial real estate - owner occupied Commercial real estate - non-owner occupied Residential real estate Home equity Consumer Total Loans Modified as TDRs for the Year Ended December 31, 2021 Pre-Modification Post-Modification Number of Outstanding Recorded Outstanding Recorded Contracts Investment Investment Commercial Commercial real estate - owner occupied Commercial real estate - non-owner occupied Residential real estate Home equity Consumer Total Loans Modified as TDRs for the Year Ended December 31, 2020 Pre-Modification Post-Modification Number of Outstanding Recorded Outstanding Recorded Contracts Investment Investment Commercial Commercial real estate - owner occupied Commercial real estate - non-owner occupied Residential real estate Home equity Consumer Total Commercial Construction and Land Development Commercial Real Estate - Owner Occupied Commercial Real Estate - Non-owner Occupied Residential Real Estate Home Equity Pass Special Mention Substandard Doubtful Total Consumer Performing Nonperforming Total Commercial Construction and Land Development Commercial Real Estate - Owner Occupied Commercial Real Estate - Non-owner Occupied Residential Real Estate Home Equity Pass Special Mention Substandard Doubtful Total Consumer Performing Nonperforming Total Year Ended December 31, 2022 2021 2020 Allowance for Loan Losses Balance, beginning of year Provision for (recovery of) loan losses Charge-offs Recoveries Balance, end of year Year Ended December 31, 2022 2021 2020 Reserve for Unfunded Lending Commitments Balance, beginning of year Provision for (recovery of) unfunded commitments Charge-offs Balance, end of year Commercial (1) Construction and Land Development Commercial Real Estate - Owner Occupied Commercial Real Estate - Non-owner Occupied Residential Real Estate Consumer Total Allowance for Loan Losses Balance at December 31, 2021 Charge-offs Recoveries Provision/(recovery) Balance at December 31, 2022 Balance at December 31, 2022: Allowance for Loan Losses Individually evaluated for impairment Collectively evaluated for impairment Purchased credit impaired loans Total Loans Individually evaluated for impairment Collectively evaluated for impairment Purchased credit impaired loans Total Commercial (1) Construction and Land Development Commercial Real Estate - Owner Occupied Commercial Real Estate - Non-owner Occupied Residential Real Estate Consumer Total Allowance for Loan Losses Balance at December 31, 2020 Charge-offs Recoveries Provision/(recovery) Balance at December 31, 2021 Balance at December 31, 2021: Allowance for Loan Losses Individually evaluated for impairment Collectively evaluated for impairment Purchased credit impaired loans Total Loans Individually evaluated for impairment Collectively evaluated for impairment Purchased credit impaired loans Total December 31, 2022 2021 Land Buildings Leasehold improvements Furniture and equipment Accumulated depreciation Premises and equipment, net Goodwill Intangibles Balance at December 31, 2021 Amortization Balance at December 31, 2022 Gross Carrying Accumulated Net Carrying Value Amortization Value December 31, 2022 Core deposit intangibles Goodwill December 31, 2021 Core deposit intangibles Goodwill Year Amount 2023 2024 2025 2026 2027 Total December 31, 2022 December 31, 2021 Lease liabilities Right-of-use assets Weighted average remaining lease term (in years) Weighted average discount rate December 31, 2022 December 31, 2021 December 31, 2020 Lease cost Operating lease cost Short-term lease cost Total lease cost Cash paid for amounts included in the measurement of lease liabilities Lease payments due As of December 31, 2022 2023 2024 2025 2026 2027 2028 and after Total undiscounted cash flows Discount Lease liabilities Year Amount 2023 2024 2025 2026 2027 2028 and after Total December 31, 2022 December 31, 2021 Amount Amount Customer repurchase agreements FHLB borrowings Total short-term borrowings Principal Amount As of December 31, Issuing Entity Date Issued Interest Rate Maturity Date 2022 2021 AMNB Trust I 4/7/2006 Libor plus 1.35% 6/30/2036 MidCarolina Trust I 10/29/2002 Libor plus 3.45% 11/7/2032 MidCarolina Trust II 12/3/2003 Libor plus 2.95% 10/7/2033 (Dollars in thousands) December 31, 2022 Notional Amount Positions Assets Liabilities Cash Collateral Pledged Cash flow hedges: Interest rate swaps: Variable-rate to fixed-rate swaps with counterparty (Dollars in thousands) December 31, 2021 Notional Amount Positions Assets Liabilities Cash Collateral Pledged Cash flow hedges: Interest rate swaps: Variable-rate to fixed-rate swaps with counterparty Weighted Weighted Average Aggregate Average Remaining Intrinsic Option Exercise Contractual Term Value Shares Price (In Years) ($000) Outstanding at December 31, 2021 Granted Exercised Expired Outstanding at December 31, 2022 Exercisable at December 31, 2022 Average Grant Shares Date Value Per Share Nonvested at December 31, 2021 Granted Vested Forfeited Nonvested at December 31, 2022 December 31, 2022 2021 Deferred tax assets: Allowance for loan losses Nonaccrual loan interest Other real estate owned valuation allowance Deferred compensation Acquisition accounting Lease liability, net of right of use asset Accrued pension liability Net unrealized loss on cash flow hedges Net unrealized loss on securities available for sale Other Total deferred tax assets Deferred tax liabilities: Depreciation Core deposit intangibles Deferred loan origination costs, net Net unrealized gain on cash flow hedges Other Total deferred tax liabilities Net deferred tax assets Year Ended December 31, 2022 2021 2020 Current tax expense Deferred tax (benefit) expense Total income tax expense Year Ended December 31, 2022 2021 2020 Expected federal tax expense Nondeductible interest expense Tax-exempt interest State income taxes Other, net Total income tax expense Year Ended December 31, 2022 2021 2020 Per Share Per Share Per Share Shares Amount Shares Amount Shares Amount Basic earnings per share Effect of dilutive securities - stock options Diluted earnings per share December 31, 2022 2021 Commitments to extend credit Standby letters of credit Mortgage loan rate lock commitments Balance at December 31, 2021 Additions Repayments Reclassifications(1) Balance at December 31, 2022 As of and for the Year Ended December 31, 2022 2021 2020 Change in Benefit Obligation: Projected benefit obligation at beginning of year Service cost Interest cost Actuarial (gain) loss Settlement gain (loss) Benefits paid Projected benefit obligation at end of year Change in Plan Assets: Fair value of plan assets at beginning of year Actual return on plan assets Employer contributions Benefits paid Fair value of plan assets at end of year Funded Status at End of Year Amounts Recognized in the Consolidated Balance Sheets Other assets (liabilities) Amounts Recognized in Accumulated Other Comprehensive Loss Net actuarial loss Deferred income taxes Amount recognized As of and for the Year Ended December 31, 2022 2021 2020 Components of Net Periodic Benefit Cost Service cost Interest cost Expected return on plan assets Recognized net loss due to settlement Recognized net actuarial loss Net periodic benefit cost Other Changes in Plan Assets and Benefit Obligations Recognized in Other Comprehensive (Income) Loss Net actuarial (gain) loss Amortization of prior service cost Total recognized in other comprehensive (income) loss Total Recognized in Net Periodic Benefit Cost and Other Comprehensive (Income) Loss Asset Category December 31, 2022 2021 Fixed Income Equity Cash and Accrued Income Total Fair Value Measurements at December 31, 2022 Using Quoted Prices Significant in Active Other Significant Balance as of Markets for Observable Unobservable December 31, Identical Assets Inputs Inputs Asset Category 2022 Level 1 Level 2 Level 3 Cash Fixed income securities Government sponsored entities Municipal bonds and notes Corporate bonds and notes Fair Value Measurements at December 31, 2021 Using Quoted Prices Significant in Active Other Significant Balance as of Markets for Observable Unobservable December 31, Identical Assets Inputs Inputs Asset Category 2021 Level 1 Level 2 Level 3 Cash Fixed income securities Government sponsored entities Municipal bonds and notes Corporate bonds and notes Equity securities U.S. companies Foreign companies are not reasonably likely to have a material adverse effect on the Company, but rather will have a positive effect on the Company.The Company's credit standardsPerformance Compensation and its on-going credit assessment processes might not protect it from significant credit losses.The Company takes credit risk by virtue of making loans and extending loan commitments and letters of credit. The Company manages credit risk through a program of underwriting standards, the review of certain credit decisions and an on-going process of assessment of the quality of the credit already extended. The Company's exposure to credit risk is managed through the use of consistent underwriting standards that emphasize local lending while avoiding highly leveraged transactions as well as excessive industry and other concentrations. The Company's credit administration function employs risk management techniques to help ensure that problem loans are promptly identified. While these procedures are designed to provide the Company with the information needed to implement policy adjustments where necessary and to take appropriate corrective actions, and have proven to be reasonably effective to date, there can be no assurance that such measures will be effective in avoiding future undue credit risk.The Company's focus on lending to small to mid-sized community-based businesses may increase its credit risk.Most of the Company's commercial business and commercial real estate loans are made to small business or middle market customers. These businesses generally have fewer financial resources in terms of capital or borrowing capacity than larger entities and have a heightened vulnerability to economic conditions. Additionally, these loans may increase concentration risk as to industry or collateral securing the loans. If general economic conditions in the market areas in which the Company operates negatively impact this important customer sector, the Company's results of operations and financial condition may be adversely affected. Moreover, a portion of these loans have been made by the Company in recent years, and the borrowers may not have experienced a complete business or economic cycle. The deterioration of the borrowers' businesses may hinder their ability to repay their loans with the Company, which could have a material adverse effect on the Company's financial condition and results of operations.The Company depends on the accuracy and completeness of information about clients and counterparties, and its financial condition could be adversely affected if it relies on misleading information.In deciding whether to extend credit or to enter into other transactions with clients and counterparties, the Company may rely on information furnished to it by or on behalf of clients and counterparties, including financial statements and other financial information, which the Company does not independently verify. The Company also may rely on representations of clients and counterparties as to the accuracy and completeness of that information and, with respect to financial statements, on reports of independent auditors. For example, in deciding whether to extend credit to clients, the Company may assume that a customer's audited financial statements conform with accounting principles generally accepted in the United States of America ("GAAP") and present fairly, in all material respects, the financial condition, results of operations and cash flows of the customer. The Company's financial condition and results of operations could be negatively impacted to the extent it relies on financial statements that do not comply with GAAP or are materially misleading.The allowance for loan losses ("ALLL") may not be adequate to cover actual losses.In accordance with GAAP, an allowance for loan losses is maintained by the Company to provide for loan losses. The allowance for loan losses may not be adequate to cover actual credit losses, and future provisions for credit losses could materially and adversely affect operating results. The allowance for loan losses is based on prior experience, as well as an evaluation of the risks in the current portfolio. The amount of future losses is susceptible to changes in economic, operating, and other outside forces and conditions, including changes in interest rates, all of which are beyond the Company's control; and these losses may exceed current estimates. Federal bank regulatory agencies, as a part of their examination process, review the Company's loans and allowance for loan losses. While management believes that the allowance for loan losses is adequate to cover current losses, it cannot make assurances that it will not further increase the allowance for loan losses or that regulators will not require it to increase this allowance. Either of these occurrences could adversely affect earnings.In addition, the adoption of Accounting Standards Update ("ASU") 2016-13, as amended, could result in a change in the amount of the allowance for loan losses as a result of changing from an "incurred loss" model, which encompasses allowances for current known and inherent losses within the portfolio, to an "expected loss" model, which encompasses allowances for losses expected to be incurred over the life of the portfolio and a look forward of economic forecasts. The measure of the Company's ALLL is dependent on the adoption and interpretation of the new standard. The new standard may create more volatility. ASU 2016-13 was adopted on January 1, 2023. Refer to Note 1 of the Consolidated Financial Statements contained in Item 8 of this Form 10-K for a discussion of recent accounting pronouncements.Nonperforming assets take significant time to resolve and adversely affect the Company's results of operations and financial condition.The Company's nonperforming assets adversely affect its net income in various ways. The Company does not record interest income on nonaccrual loans, which adversely affects its income and increases credit administration costs. When the Company receives collateral through foreclosures and similar proceedings, it is required to mark the related asset to the then fair market value of the collateral less estimated selling costs, which may, and often does, result in a loss. An increase in the level of nonperforming assets also increases the Company's risk profile and may impact the capital levels regulators believe are appropriate in light of such risks. The Company utilizes various techniques such as workouts, restructurings, and loan sales to manage problem assets. Increases in or negative adjustments in the value of these problem assets, the underlying collateral, or in the borrowers' performance or financial condition, could adversely affect the Company's business, results of operations and financial condition. In addition, the resolution of nonperforming assets requires significant commitments of time from management and staff, which can be detrimental to the performance of their other responsibilities, including generation of new loans. There can be no assurance that the Company will avoid increases in nonperforming loans in the future.A downturn in the local real estate market could materially and negatively affect the Company's business.The Company offers a variety of secured loans, including commercial lines of credit, commercial term loans, real estate, construction, home equity lines of credit, consumer and other loans. Many of these loans are secured by real estate (both residential and commercial) located in the Company's market area. A downturn in the real estate market in the areas in which the Company conducts its operations could negatively affect the Company's business because significant portions of its loans are secured by real estate. At December 31, 2022, the Company had approximately $2.2 billion in loans, of which approximately $1.9 billion (85.8%) were secured by real estate. The ability to recover on defaulted loans by selling the real estate collateral could then be diminished and the Company would be more likely to suffer losses.Substantially all of the Company's real property collateral is located in its market area. If there is a decline in real estate values, especially in the Company's market area, the collateral for loans would deteriorate and provide significantly less security.The Company relies upon independent appraisals to determine the value of the real estate which secures a significant portion of its loans, and the values indicated by such appraisals may not be realizable if the Company is forced to foreclose upon such loans.A significant portion of the Company's loan portfolio consists of loans secured by real estate. The Company relies upon independent appraisers to estimate the value of such real estate. Appraisals are only estimates of value and the independent appraisers may make mistakes of fact or judgment which adversely affect the reliability of their appraisals. In addition, events occurring after the initial appraisal may cause the value of the real estate to increase or decrease. As a result of any of these factors, the real estate securing some of the Company's loans may be more or less valuable than anticipated at the time the loans were made. If a default occurs on a loan secured by real estate that is less valuable than originally estimated, the Company may not be able to recover the outstanding balance of the loan and will suffer a loss.MARKET RISKBonus ProgramThe Company's business is subjectPursuant to interest rate risk, and variations in interest rates and inadequate management of interest rate risk may negatively affect financial performance.Changes in the interest rate environment may reduce the Company's profits. It is expected that the Company will continue to realize income from the spread between the interest earned on loans, securities, and other interest earning assets, and interest paid on deposits, borrowings and other interest-bearing liabilities. Net interest spreads are affected by the difference between the maturities and repricing characteristics of interest earning assets and interest-bearing liabilities. In addition, loan volume and yields are affected by market interest rates on loans, and the current interest rate environment encourages extreme competition for new loan originations from qualified borrowers. Since the beginning of 2022, in response to elevated inflation, the Federal Open Market Committee ("FOMC")terms of the FRB has increased the target range for the federal funds rate by 425 basis points, to a range of 4.25% to 4.50% as of December 31, 2022, and further increased it to the current range of 4.50% to 4.75% in February 2023. As it seeks to control inflation without creating a recession, the FOMC has indicated further increases are to be expected in 2023. If the FOMC further increases the targeted federal funds rates, overall interest rates will likely continue to rise, which is expected to positively impact our net interest income modestly but may negatively impact both the housing market by reducing refinancing activity and new home purchases and the U.S. economy. In addition, inflationary pressures will increase our operating costs and could have a significant negative effect on our borrowers, especially our business borrowers, and the values of collateral securing loans, which could negatively affect our financial performance.If the interest rates paid on deposits and other borrowings increase at a faster rate than the interest rates received on loans and other investments, the Company's net interest income, and therefore earnings, could be adversely affected. Earnings could also be adversely affected if the interest rates received on loans and other investments fall more quickly than the interest rates paid on deposits and other borrowings. Any substantial, unexpected, or prolonged change in market interest rates could have a material adverse effect on the Company's financial condition and results of operations.Inflation may have a negative impact on earnings.Inflation has increased at the highest rate since the 1980s. Increased inflation translates to increased cost of goods and services, and labor costs. We may have to pay higher than normal wages to attract and retain employees, and incur additional operating costs. The FRB has increased the target range for the federal funds rate seven times over the course of 2022 to reduce inflation. Increased interest rates decrease demand for loans, increase the chance our customers will have difficulty paying back loans and increase demand for higher rates on deposits. Transition away from the London Interbank Offered Rate ("LIBOR") to another benchmark rate could adversely affect our operations.The administrator of LIBOR announced that the most commonly used U.S. dollar LIBOR settings would cease to be published or cease to be representative after June 30, 2023. Management cannot predict whether or when LIBOR will actually cease to be available or what impact such a transition may have on the Company’s business, financial condition and results of operations.The Adjustable Interest Rate (LIBOR) Act, enacted in March 2022, provides a statutory framework to replace LIBOR with a benchmark rate based on the Secured Overnight Funding Rate ("SOFR") for contracts governed by U.S. law that have no or ineffective fallbacks. Although governmental authorities have endeavored to facilitate an orderly discontinuation of LIBOR, no assurance can be provided that this aim will be achieved or that the use, level, and volatility of LIBOR or other interest rates, or the value of LIBOR-based securities will not be adversely affected. There continues to be substantial uncertainty as to the ultimate effects of the LIBOR transition, including with respect to the acceptance and use of SOFR and other benchmark rates.We have an insignificant number of loans, borrowings and other financial instruments with attributes that are either directly or indirectly dependent on LIBOR. The transition from LIBOR could create considerable costs and additional risk. Since proposed alternative rates are calculated differently, payments under contracts referencing new rates will differ from those referencing LIBOR. The transition will change our market risk profiles, requiring changes to risk and pricing models, valuation tools, product design and hedging strategies. Furthermore, failure to adequately manage this transition process with our customers could adversely impact our reputation. Although we are currently unable to assess what the ultimate impact of the transition from LIBOR will be, failure to adequately manage the transition could have a material adverse effect on our business, financial condition and results of operations.LIQUIDITY RISKThe Company may need to raise additional capital in the future to continue to grow, but may be unable to obtain additional capital on favorable terms or at all.Federal and state banking regulators and safe and sound banking practices require the Company to maintain adequate levels of capital to support its operations. The Company's business strategy calls for it to continue to grow in its existing banking markets (internally and through additional offices) and to expand into new markets as appropriate opportunities arise. Continued growth in the Company's earning assets, which may result from internal expansion and new branch offices, at rates in excess of the rate at which its capital is increased through retained earnings, will reduce the Company's capital ratios. If the Company's capital ratios fell below "well capitalized" levels, the FDIC deposit insurance assessment rate would increase until capital was restored and maintained at a "well capitalized" level. A higher assessment rate would cause an increase in the assessments the Company pays for federal deposit insurance, which would have an adverse effect on the Company's operating results.Management of the Company believes that its current and projected capital position is sufficient to maintain capital ratios significantly in excess of regulatory requirements for the next several years and allow the Company flexibility in the timing of any possible future efforts to raise additional capital. However, if, in the future, the Company needs to increase its capital to fund additional growth or satisfy regulatory requirements, its ability to raise that additional capital will depend on conditions at that time in the capital markets, economic conditions, the Company's financial performance and condition, and other factors, many of which are outside its control. There is no assurance that the Company will be able to raise additional capital on terms favorable to it or at all. Any future inability to raise additional capital on terms acceptable to the Company may have a material adverse effect on its ability to expand operations, and on its financial condition, results of operations and future prospects.TECHNOLOGY RISKThe Company's operations may be adversely affected by cybersecurity risks.The Company relies heavily on communications and information systems to conduct business. Our computer systems and network infrastructure and those of third parties, on which we are highly dependent, are subject to security risks and could be susceptible to cyber-attacks, such as denial of service attacks, hacking, social engineering attacks targeting our employees and customers, malware intrusion or data corruption attempts, terrorist activities or identity theft. Any failure, interruption, or breach in security of these systems could result in failures or disruptions in the Company's internet banking, deposit, loan, and other systems. While the Company has policies and procedures designed to prevent or limit the effect of such failure, interruption, or security breach of the Company's information systems, there can be no assurance that they will not occur or, if they do occur, that they will be adequately addressed. Further, to access the Company's products and services, its customers may use computers and mobile devices that are beyond the Company's security control systems. The occurrence of any failure, interruption or security breach of the Company's communications and information systems could damage the Company's reputation, result in a loss of customer business, subject the Company to additional regulatory scrutiny, or expose the Company to civil litigation and possible financial liability. Additionally, the Company outsources its data processing to a third-party. If the Company's third party provider encounters difficulties or if the Company has difficulty in communicating with such third party, it will significantly affect the Company's ability to adequately process and account for customer transactions, which would significantly affect its business operations.In the ordinary course of business, the Company collects and stores sensitive data, including proprietary business information and personally identifiable information of its customers and employees in systems and on networks. The secure processing, maintenance and use of this information is critical to operations and the Company's business strategy. The Company has invested in accepted technologies, and annually reviews processes and practices that are designed to protect its networks, computers and data from damage or unauthorized access. Despite these security measures, the Company's computer systems and infrastructure may be vulnerable to attacks by hackers or breached due to employee error, malfeasance or other disruptions. A breach of any kind could compromise systems, and the information stored there could be accessed, damaged or disclosed. A breach in security could result in legal claims, regulatory penalties, disruption in operations, and damage to the Company's reputation, which could adversely affect the Company's business. Furthermore, as cyberattacks continue to evolve and increase, the Company may be required to expend significant additional resources to modify or enhance its protective measures, or to investigate and remediate any identified information security vulnerabilities.Multiple major U.S. retailers, financial institutions, government agencies and departments have experienced data systems incursions reportedly resulting in the thefts of credit and debit card information, online account information, and other financial data of tens of millions of individuals and customers. Retailer incursions affect cards issued and deposit accounts maintained by many financial institutions, including the Bank. Although neither the Company's nor the Bank's systems are breached in government or retailer incursions, these events can cause the Bank to reissue a significant number of cards and take other costly steps to avoid significant theft loss to the Bank and its customers. In some cases, the Bank may be required to reimburse customers for the losses they incur. Other possible points of intrusion or disruption not within the Company's nor the Bank's control include internet service providers, electronic mail portal providers, social media portals, distant-server (so called "cloud") service providers, electronic data security providers, personal computers and mobile phones, telecommunications companies, and mobile phone manufacturers.Consumers may increasingly decide not to use the Bank to complete their financial transactions because of technological and other changes, which would have a material adverse impact on the Company's financial condition and operations.Technology and other changes are allowing parties to complete financial transactions through alternative methods that historically have involved banks. In particular, the activity of fintech companies has grown significantly over recent years and is expected to continue to grow. Fintech companies have and may continue to offer bank or bank-like products and some fintech companies have applied for bank charters. In addition, other fintech companies have partnered with existing banks to allow them to offer deposit products to their customers. For example, consumers can now maintain funds that would have historically been held as bank deposits in brokerage accounts, mutual funds or general-purpose reloadable prepaid cards. Consumers can also complete transactions such as paying bills and/or transferring funds directly without the assistance of banks. The process of eliminating banks as intermediaries, known as "disintermediation," could result in the loss of fee income, as well as the loss of customer deposits and the related income generated from those deposits. The loss of these revenue streams and the lower cost of deposits as a source of funds could have a material adverse effect on the Company's financial condition and results of operations.OPERATIONAL RISKThe Company is dependent on key personnel and the loss of one or more of those key personnel may materially and adversely affect the Company's operations and prospects.The Company is a relationship-driven organization. A key aspect of the Company's business strategy is for its senior officers to have primary contact with current and potential customers. The Company's growth and development are in large part a result of these personalized relationships with the customer base. The success of the Company also often depends on its ability to hire and retain qualified banking officers.The Company's senior officers have considerable experience in the banking industry and related financial services and are extremely valuable and would be difficult to replace. The loss of the services of these officers could have a material adverse effect upon future prospects. Although the Company has entered into employment contracts with certain of its senior executive officers, and purchased key man life insurance policies to mitigate the risk of an unforeseen departure or death of certain of the senior executive officers, it cannot offer any assurance that they and other key employees will remain employed by the Company. The unexpected loss of services of one or more of these key employees could have a material adverse effect on operations and possibly result in reduced revenues.Failure to maintain effective systems of internal and disclosure control could have a material adverse effect on the Company's results of operation and financial condition.Effective internal and disclosure controls are necessary for the Company to provide reliable financial reports and effectively prevent fraud and to operate successfully as a public company. If the Company cannot provide reliable financial reports or prevent fraud, its reputation and operating results would be harmed. As part of the Company's ongoing monitoring of internal control, it may discover material weaknesses or significant deficiencies in its internal control that require remediation. A "material weakness" is a deficiency, or a combination of deficiencies, in internal control over financial reporting, such that there is a reasonable possibility that a material misstatement of a company's annual or interim financial statements will not be prevented or detected on a timely basis.The Company has in the past discovered, and may in the future discover, areas of its internal controls that need improvement. Even so, the Company is continuing to work to improve its internal controls. The Company cannot be certain that these measures will ensure that it implements and maintains adequate controls over its financial processes and reporting in the future. Any failure to maintain effective controls or to timely effect any necessary improvement of the Company's internal and disclosure controls could, among other things, result in losses from fraud or error, harm the Company's reputation or cause investors to lose confidence in the Company's reported financial information, all of which could have a material adverse effect on the Company's results of operation and financial condition.The carrying value of goodwill may be adversely impacted.When the Company completes an acquisition, generally goodwill is recorded on the date of acquisition as an asset. Current accounting guidance requires for goodwill to be tested for impairment, which the Company performs an impairment analysis at least annually, rather than amortizing it over a period of time. A significant adverse change in expected future cash flows or sustained adverse change in the Company's common stock could require the asset to become impaired. If impaired, the Company would incur a non-cash charge to earnings that would have a significant impact on the results of operations. The carrying value of goodwill was approximately $85.0 million at December 31, 2022.The Company relies on other companies to provide key components of the Company's business infrastructure.Third parties provide key components of the Company's business operations such as data processing, recording and monitoring transactions, online banking interfaces and services, Internet connections and network access. While the Company has selected these third-party vendors carefully, it does not control their actions. Any problem caused by these third-parties, including those resulting from disruptions in communication services provided by a vendor, failure of a vendor to handle current or higher volumes, cybersecurity breaches, failure of a vendor to provide services for any reason or poor performance of services, could adversely affect the Company's ability to deliver products and services to its customers and otherwise conduct its business. Financial or operational difficulties of a third-party vendor could also hurt the Company's operations if those difficulties interface with the vendor's ability to serve the Company. Replacing these third party vendors could also create significant delay and expense. Accordingly, use of such third parties creates an unavoidable inherent risk to the Company's business operations.LEGAL, REGULATORY AND COMPLIANCE RISKThe Company is subject to extensive regulation which could adversely affect its business.The Company's operations as a publicly traded corporation, a bank holding company, and a parent company to an insured depository institution are subject to extensive regulation by federal, state, and local governmental authorities and are subject to various laws and judicial and administrative decisions imposing requirements and restrictions on part or all of the Company's operations. Because the Company's business is highly regulated, the laws, rules, and regulations applicable to it are subject to frequent and sometimes extensive change. Such changes could include higher capital requirements, increased insurance premiums, increased compliance costs, reductions of non-interest income and limitations on services that can be provided. Actions by regulatory agencies or significant litigation against the Company could cause it to devote significant time and resources to defend itself and may lead to liability or penalties that materially affect the Company and its shareholders. Any future changes in the laws, rules or regulations applicable to the Company may negatively affect the Company's business and results of operations.Regulatory capital standards may have an adverse effect on the Company's profitability, lending, and ability to pay dividends on the Company's securities.The Company is subject to capital adequacy guidelines and other regulatory requirements specifying minimum amounts and types of capital that the Company and the Bank must maintain. From time to time, regulators implement changes to these regulatory capital adequacy guidelines. If the Company fails to meet these minimum capital guidelines and/or other regulatory requirements, its financial condition would be materially and adversely affected. The Basel III Capital Rules require bank holding companies and their subsidiaries to maintain significantly more capital as a result of higher required capital levels and more demanding regulatory capital risk weightings and calculations. The Bank must also comply with the capital requirements set forth in the "prompt corrective action" regulations pursuant to Section 38 of the FDIA. Satisfying capital requirements may require the Company to limit its banking operations, retain net income or reduce dividends to improve regulatory capital levels, which could negatively affect its business, financial condition and results of operations.In addition, the adoption of Accounting Standards Update ("ASU") 2016-13, as amended, could result in a change in the amount of the allowance for loan losses as a result of changing from an "incurred loss" model, which encompasses allowances for current known and inherent losses within the portfolio, to an "expected loss" model, which encompasses allowances for losses expected to be incurred over the life of the portfolio and a look forward of economic forecasts. The measure of the Company's ALLL is dependent on the adoption and interpretation of the new standard. The new standard may create more volatility. ASU 2016-13 was adopted on January 1, 2023. Refer to Note 1 of the Consolidated Financial Statements contained in Item 8 of this Form 10-K for a discussion of recent accounting pronouncements.Regulations issued by the CFPB could adversely impact earnings due to, among other things, increased compliance costs or costs due to noncompliance.The CFPB has broad rulemaking authority to administer and carry out the provisions of the Dodd-Frank Act with respect to financial institutions that offer covered financial products and services to consumers. The CFPB has also been directed to write rules identifying practices or acts that are unfair, deceptive or abusive in connection with any transaction with a consumer for a consumer financial product or service, or the offering of a consumer financial product or service. For example, the CFPB has issued a final rule requiring mortgage lenders to make a reasonable and good faith determination based on verified and documented information that a consumer applying for a mortgage loan has a reasonable ability to repay the loan according to its terms, or to originate "qualified mortgages" that meet specific requirements with respect to terms, pricing and fees. The rule also contains additional disclosure requirements at mortgage loan origination and in monthly statements. The requirements under the CFPB's regulations and policies could limit the Company's ability to make certain types of loans or loans to certain borrowers, or could make it more expensive and/or time consuming to make these loans, which could adversely impact the Company's profitability.Changes in accounting standards could impact reported earnings.From time to time, with increasing frequency, there are changes in the financial accounting and reporting standards that govern the preparation of the Company's financial statements. These changes can materially impact how the Company records and reports its financial condition and results of operations. In some instances, the Company could be required to apply a new or revised standard retroactively, resulting in the restatement of prior period financial statements. Refer to Note 1 of the Consolidated Financial Statements contained in Item 8 of this Form 10-K for a discussion of recent accounting pronouncements.Current and proposed regulation addressing consumer privacy and data use and security could increase the Company's costs and impact its reputation.The Company is subject to a number of laws concerning consumer privacy and data use and security, including information safeguard rules under the Gramm-Leach-Bliley Act. These rules require that financial institutions develop, implement and maintain a written, comprehensive information securityincentive program containing safeguards that are appropriate to the financial institution's size and complexity, the nature and scope of the financial institution's activities, and the sensitivity of any customer information at issue. The United States has experienced a heightened legislative and regulatory focus on privacy and data security, including requiring consumer notification in the event of a data breach. In addition, most states have enacted security breach legislation requiring varying levels of consumer notification in the event of certain types of security breaches. New regulations in these areas may increase the Company's compliance costs, which could negatively impact earnings. In addition, failure to comply with the privacy and data use and security laws and regulations to which the Company is subject, including by reason of inadvertent disclosure of confidential information, could result in fines, sanctions, penalties or other adverse consequences and loss of consumer confidence, which could materially adversely affect the Company's results of operations, overall business, and reputation.The Company is subject to claims and litigation pertaining to fiduciary responsibility.From time to time, customers make claims and take legal action pertaining to the performance of the Company's fiduciary responsibilities. Whether customer claims and legal action related to the performance of the Company's fiduciary responsibilities are founded or unfounded, if such claims and legal actions are not resolved in a manner favorable to the Company, they may result in significant financial liability and/or adversely affect the market perception of the Company and its products and services, as well as impact customer demand for those products and services. Any financial liability or reputation damage could have a material adverse effect on the Company's business, which, in turn, could have a material adverse effect on the Company's financial condition and results of operations.Increasing scrutiny and evolving expectations from customers, regulators, investors, and other stakeholders with respect to ESG practices may impose additional costs on the Company or expose it to new or additional risks.Companies are facing increasing scrutiny from customers, regulators, investors, and other stakeholders related to ESG practices and disclosure. Investor advocacy groups, investment funds and influential investors are also increasingly focused on these practices, especially as they relate to climate risk, hiring practices, the diversity of the work force, and racial and social justice issues. Increased ESG related compliance costs could result in increases to the Company’s overall operational costs. Failure to adapt to or comply with regulatory requirements or investor or stakeholder expectations and standards could negatively impact the Company’s reputation, ability to do business with certain partners, and the Company’s stock price. New government regulations could also result in new or more stringent forms of ESG oversight and expanding mandatory and voluntary reporting, diligence, and disclosure.Governments, investors, customers, and the general public are increasingly focused on ESG practices and disclosures. For us and others in the financial services industry, this focus extends to the practices and disclosures of the customers, counterparties, and service providers with whom we choose to do business. In addition, certain organizations that provide corporate governance and other corporate risk information to investors and shareholders have developed scores and ratings to evaluate companies based on ESG metrics. Currently, there are no universal standards for such scores or ratings, but the importance of ESG evaluations is becoming more broadly accepted by investors and shareholders. Views about ESG are diverse, dynamic, and rapidly changing, and if we were to fail to maintain appropriate ESG practices and disclosures or be subject to a low ESG score or rating, we could face potential negative ESG-related publicity in traditional and social media, including based on the identity of those we choose to do business with and the public’s view of those customers. If we or our relationships with customers, service providers and suppliers were to become the subject of such negative publicity or low ESG scores or ratings, our ability to attract and retain customers and employees may be negatively impacted and our stock price may also be adversely impacted. Additionally, new government regulations could result in new or more stringent forms of ESG oversight and expanded mandatory and voluntary reporting, diligence and disclosure. ESG-related costs, including with respect to compliance with any additional regulatory or disclosure requirements or expectations, could adversely impact our results of operations.Investors also have begun to consider how corporations are addressing ESG matters when making investment decisions. For example, certain investors are beginning to incorporate the business risks of climate change and the adequacy of companies’ responses to climate change and other ESG matters as part of their investment theses. Any such negative publicity regarding ESG, low ESG scores or ratings, or shifts in investing priorities may result in adverse effects on the trading price of our common stock and/or our business, operations and earnings if investors, shareholders or other stakeholders determine that we have not adequately considered or addressed ESG matters.STRATEGIC RISKThe Company faces strong competition from financial services companies and other companies that offer banking and other financial services, which could negatively affect the Company's business.The Company encounters substantial competition from other financial institutions in its market area. Ultimately, the Company may not be able to compete successfully against current and future competitors. Many competitors offer the same banking services that the Company offers. These competitors include national, regional, and community banks. The Company also faces competition from many other types of financial institutions, including finance companies, mutual and money market fund providers, financial technology ("fintech") companies, brokerage firms, insurance companies, credit unions, financial subsidiaries of certain industrial corporations, and mortgage companies. In particular, competitors include several major financial companies whose greater resources may afford them a marketplace advantage by enabling them to maintain numerous banking locations and ATMs and conduct extensive promotional and advertising campaigns. Increased competition may result in reduced business for the Company.Additionally, banks and other financial institutions with larger capitalization and financial intermediaries not subject to bank regulatory restrictions have larger lending limits and are thereby able to serve the credit needs of larger customers. These institutions also may have differing pricing and underwriting standards, which may adversely affect the Company through the loss of business or causing a misalignment in the Company's risk-return relationship. Areas of competition include interest rates for loans and deposits, efforts to obtain loans and deposits, and range and quality of products and services provided, including new technology-driven products and services. Technological innovation continues to contribute to greater competition in domestic financial services markets as technological advances enable more companies to provide financial services. If the Company is unable to attract and retain banking customers, it may be unable to continue to grow loan and deposit portfolios and its results of operations and financial condition may be adversely affected.The inability of the Company to successfully manage its growth or implement its growth strategy may adversely affect the Company's results of operations and financial condition.The Company may not be able to successfully implement its growth strategy if it is unable to identify attractive markets, locations or opportunities to expand in the future. In addition, the ability to manage growth successfully depends on whether the Company can maintain adequate capital levels, cost controls and asset quality, and successfully integrate any businesses acquired into the Company.As the Company continues to implement its growth strategy by opening new branches or acquiring branches or banks, it expects to incur increased personnel, occupancy and other operating expenses. In the case of new branches, the Company must absorb those higher expenses while it begins to generate new deposits; there is also further time lag involved in redeploying new deposits into attractively priced loans and other higher yielding earning assets. The Company's plans to expand could depress earnings in the short run, even if it efficiently executes a growth strategy leading to long-term financial benefits.Difficulties in combining the operations of acquired entities with the Company's own operations may prevent the Company from achieving the expected benefits from acquisitions.The Company may not be able to achieve fully the strategic objectives and operating efficiencies expected in an acquisition. Inherent uncertainties exist in integrating the operations of an acquired entity. In addition, the markets and industries in which the Company and its potential acquisition targets operate are highly competitive. The Company may lose customers or the customers of acquired entities as a result of an acquisition; the Company may lose key personnel, either from the acquired entity or from itself; and the Company may not be able to control the incremental increase in noninterest expense arising from an acquisition in a manner that improves its overall operating efficiencies. These factors could contribute to the Company not achieving the expected benefits from its acquisitions within desired time frames, if at all. Future business acquisitions could be material to the Company and it may issue additional shares of common stock to pay for those acquisitions, which would dilute current shareholders' ownership interests. Acquisitions also could require the Company to use substantial cash or other liquid assets or to incur debt; the Company could therefore become more susceptible to economic downturns and competitive pressures.
RISKS RELATING TO OUR SECURITIESWhile the Company’s common stock is currently traded on the Nasdaq Global Select Market, it has less liquidity than stocks for larger companies quoted on a national securities exchange.The trading volume in the Company’s common stock on the Nasdaq Global Select Market has been relatively low when compared with larger companies listed on the Nasdaq Global Select Market or other stock exchanges. There is no assurance that a more active and liquid trading market for the common stock will exist in the future. Consequently, shareholders may not be able to sell a substantial number of shares for the same price at which shareholders could sell a smaller number of shares. In addition, the Company cannot predict the effect, if any, that future sales of the Company’s common stock in the market, or the availability of shares of common stock for sale in the market, will have on the market price of the common stock.Economic and other conditions may cause volatility in the price of the Company’s common stock.In the current economic environment, the prices of publicly traded stocks in the financial services sector have been volatile. However, even in a more stable economic environment the price of the Company’s common stock can be affected by a variety of factors such as expected or actual results of operations, changes in analysts’ recommendations or projections, announcements of developments related to its businesses, operating and stock performance of other companies deemed to be peers, news or expectations based on the performance of others in the financial services industry, and expected impacts of a changing regulatory environment. These factors not only impact the price of the Company’s common stock but could also affect the liquidity of the stock given the Company’s size, geographical footprint, and industry. The price for shares of the Company’s common stock may fluctuate significantly in the future, and these fluctuations may be unrelated to the Company’s performance. General market price declines or market volatility in the future could adversely affect the price for shares of the Company’s common stock, and the current market price of such shares may not be indicative of future market prices.Future issuances of the Company’s common stock could adversely affect the market price of the common stock and could be dilutive.The Company is not restricted from issuing additional shares of common stock, including any securities that are convertible into or exchangeable for, or that represent the right to receive, shares of common stock. Issuances of a substantial number of shares of common stock, or the expectation that such issuances might occur, including in connection with acquisitions by the Company, could materially adversely affect the market price of the shares of the common stock and could be dilutive to shareholders. Because the Company’s decision to issue common stock in the future will depend on market conditions and other factors, it cannot predict or estimate the amount, timing or nature of possible future issuances of its common stock. Accordingly, the Company’s shareholders bear the risk that future issuances will reduce the market price of the common stock and dilute their stock holdings in the Company.The primary source of the Company’s income from which it pays cash dividends is the receipt of dividends from its subsidiary bank.The availability of dividends from the Company is limited by various statutes and regulations. It is possible, depending upon the financial condition of the Bank and other factors, that the OCC could assert that payment of dividends or other payments is an unsafe or unsound practice. In the event the Bank was unable to pay dividends to the Company, or be limited in the payment of such dividends, the Company would likely have to reduce or stop paying common stock dividends. The Company’s reduction, limitation. or failure to pay such dividends on its common stock could have a material adverse effect on the market price of the common stock.The Company’s governing documents and Virginia law contain anti-takeover provisions that could negatively impact its shareholders.The Company’s Articles of Incorporation and Bylaws and the Virginia Stock Corporation Act contain certain provisions designed to enhance the ability of the Company’s Board of Directors to deal with attempts to acquire control of the Company. These provisions and the ability to set the voting rights, preferences and other terms of any series of preferred stock that may be issued, may be deemed to have an anti-takeover effect and may discourage takeovers (which certain shareholders may deem to be in their best interest). To the extent that such takeover attempts are discouraged, temporary fluctuations in the market price of the Company’s common stock resulting from actual or rumored takeover attempts may be inhibited. These provisions also could discourage or make more difficult a merger, tender offer, or proxy contest, even though such transactions may be favorable to the interests of shareholders, and could potentially adversely affect the market price of the Company’s common stock.GENERAL RISKChanges in economic conditions could materially and negatively affect the Company's business.The Company's business is directly impacted by economic, political, and market conditions, broad trends in industry and finance, legislative and regulatory changes, changes in government monetary and fiscal policies, and inflation, all of which are beyond the Company's control. A deterioration in economic conditions, whether caused by global, national or local events (including inflation, the COVID-19 pandemic, rising wages in a tight labor market, geopolitical instability and supply chain complications), especially within the Company's market area, could result in potentially negative material consequences such as the following, among others: loan delinquencies increasing; problem assets and foreclosures increasing; demand for products and services decreasing; low cost or noninterest bearing deposits decreasing; and collateral for loans, especially real estate, declining in value, in turn reducing customers' borrowing power, and reducing the value of assets and collateral associated with existing loans. Each of these consequences may have a material adverse effect on the Company's financial condition and results of operations.Wealth management income is a major source of non-interest income for the Company. Trust and brokerage fee revenue is largely dependent on the fair market value of assets under management and on trading volumes in the brokerage business. General economic conditions and their subsequent effect on the securities markets tend to act in correlation. When general economic conditions deteriorate, securities markets generally decline in value, and the Company's trust and brokerage fee revenue is negatively impacted as asset values and trading volumes decrease.The Company's exposure to operational, technological and organizational risk may adversely affect the Company.The Company is exposed to many types of operational risks, including reputation, legal, and compliance risk, the risk of fraud or theft by employees or outsiders, unauthorized transactions by employees or operational errors, clerical or record-keeping errors, and errors resulting from faulty or disabled computer or telecommunications systems.Negative public opinion can result from the actual or alleged conduct in any number of activities, including lending practices, corporate governance, and acquisitions, and from actions taken by government regulators and community organizations in response to those activities. Negative public opinion can adversely affect the Company's ability to attract and retain customers and can expose it to litigation and regulatory action.Certain errors may be repeated or compounded before they are discovered and successfully rectified. The Company's necessary dependence upon automated systems to record and process its transactions may further increase the risk that technical system flaws or employee tampering or manipulation of those systems will result in losses that are difficult to detect. The Company may also be subject to disruptions of its operating systems arising from events that are wholly or partially beyond its control (for example, computer viruses or electrical or telecommunications outages), which may give rise to disruption of service to customers and to financial loss or liability. The Company is further exposed to the risk that its external vendors may be unable to fulfill their contractual obligations (or will be subject to the same risk of fraud or operational errors by their respective employees as is the Company) and to the risk that the Company's (or its vendors') business continuity and data security systems prove to be inadequate.The Company's risk-management framework may not be effective in mitigating risk and loss.The Company maintains an enterprise risk management program that is designed to identify, quantify, monitor, report, and control the risks that it faces. These risks include, but are not limited to: strategic, interest-rate, credit, liquidity, operations, pricing, reputation, compliance, litigation and cybersecurity. While the Company assesses and improves this program on an ongoing basis, there can be no assurance that its approach and framework for risk management and related controls will effectively mitigate all risk and limit losses in its business. If conditions or circumstances arise that expose flaws or gaps in the Company's risk-management program, or if its controls break down, the Company's results of operations and financial condition may be adversely affected.Negative perception of the Company through media may adversely affect the Company's reputation and business.The Company's reputation is critical to the success of its business. The Company believes that its brand image has been well received by customers, reflecting the fact that the brand image, like the Company’s business, is based in part on trust and confidence. The Company’s reputation and brand image could be negatively affected by rapid and widespread distribution of publicity through social and traditional media channels. The Company’s reputation could also be affected by the Company’s association with clients affected negatively through social and traditional media distribution, or other third parties, or by circumstances outside of the Company’s control. Negative publicity, whether deserved or undeserved, could affect the Company’s ability to attract or retain customers, or cause the Company to incur additional liabilities or costs, or result in additional regulatory scrutiny.Climate change and related legislative and regulatory initiatives may result in operational changes and expenditures that could significantly impact the Company’s business.The current and anticipated effects of climate change are creating an increasing level of concern for the state of the global environment. As a result, political and social attention to the issue of climate change has increased. Federal and state legislatures and regulatory agencies have continued to propose and advance numerous legislative and regulatory initiatives seeking to mitigate the effects of climate change. The federal banking agencies, including the OCC, have emphasized that climate-related risks are faced by banking organizations of all types and sizes and are in the process of enhancing supervisory expectations regarding banks’ risk management practices. In December 2021, the OCC published proposed principles for climate risk management by banking organizations with more than $100 billion in assets. The OCC also has appointed its first ever Climate Change Risk Officer and established an internal climate risk implementation committee in order to assist with these initiatives and to support the agency’s efforts to enhance its supervision of climate change risk management. Similar and even more expansive initiatives are expected, including potentially increasing supervisory expectations with respect to banks’ risk management practices, accounting for the effects of climate change in stress testing scenarios and systemic risk assessments, revising expectations for credit portfolio concentrations based on climate-related factors and encouraging investment by banks in climate-related initiatives and lending to communities disproportionately impacted by the effects of climate change. To the extent that these initiatives lead to the promulgation of new regulations or supervisory guidance applicable to the Company, the Company would likely experience increased compliance costs and other compliance-related risks.The lack of empirical data surrounding the credit and other financial risks posed by climate change render it impossible to predict how specifically climate change may impact the Company’s financial condition and results of operations; however, the physical effects of climate change may also directly impact the Company. Specifically, unpredictable and more frequent weather disasters may adversely impact the value of real property securing the loans in the Bank’s loan portfolio. Additionally, if insurance obtained by borrowers is insufficient to cover any losses sustained to the collateral, or if insurance coverage is otherwise unavailable to borrowers, the collateral securing loans may be negatively impacted by climate change, which could impact the Company’s financial condition and results of operations. Further, the effects of climate change may negatively impact regional and local economic activity, which could lead to an adverse effect on customers and impact the communities in which the Company operates. Overall, climate change, its effects and the resulting, unknown impact could have a material adverse effect on the Company’s financial condition and results of operations.Severe weather, natural disasters, acts of war or terrorism, geopolitical instability, public health issues, and other external events could significantly impact the Company's business.Severe weather, natural disasters, acts of war or terrorism, geopolitical instability, public health issues, and other adverse external events could have a significant impact on the Company's ability to conduct business. In addition, such events could affect the stability of the Company's deposit base, impair the ability of borrowers to repay outstanding loans, impair the value of collateral securing loans, cause significant property damage, result in loss of revenue, and/or cause the Company to incur additional expenses. The occurrence of any such event in the future could have a material adverse effect on the Company's business, which, in turn, could have a material adverse effect on its financial condition and results of operations.The economic impact of the COVID-19 pandemic and measures intended to reduce the spread of the virus could adversely affect our business, financial condition, and operations.Global health and economic concerns relating to the COVID-19 pandemic and government actions taken to reduce the spread of the virus have significantly disrupted the macroeconomic environment in the United States. Although the domestic and global economies have begun to recover from the COVID-19 pandemic as many health and safety restrictions have been lifted and vaccine distribution has increased, certain adverse consequences of the pandemic continue to impact the macroeconomic environment and may persist for some time, including labor shortages and disruptions of global supply chains. The growth in economic activity and in the demand for goods and services, coupled with labor shortages and supply chain disruptions, has also contributed to rising inflationary pressures and the risk of recession. Further, the COVID-19 pandemic could have long-lasting impacts on consumer behavior and business practices, including on remote work and business travel. The COVID-19 pandemic and related adverse economic consequences could cause adverse effects on the Company due to a number of operational factors impacting it or its customers or business partners, including but not limited to:●loan losses resulting from financial stress experienced by our customers;●collateral for loans, especially real estate, may decline in value, which could cause loan losses to increase;●operational failures, disruptions, or inefficiencies due to changes in our normal business practices;●business disruptions experienced by our vendors and business partners in carrying out critical services that support our operations;●decreased demand for our products and services;●potential financial liability, loan losses, litigation costs, or reputational damage resulting from our origination of loans as a participating lender in the PPP; and●heightened levels of cybersecurity risks and payment fraud due to disruption brought about by the pandemic, remote work and increased online activity.The extent to which the COVID-19 pandemic and related economic consequences impact our business, liquidity, financial condition, and operations will depend on future developments, which are highly uncertain and are difficult to predict, including, but not limited to, if and when the virus can be fully controlled and abated and the extent of its lasting impacts on economic and operating conditions. The impact of the removal of most pandemic related economic stimulus programs is also unknown. To the extent any of the foregoing risks or other factors that develop as a result of COVID-19 and related economic consequences materialize, it could exacerbate the other risk factors discussed in this section, or otherwise materially and adversely affect our business, liquidity, financial condition, and results of operations.ITEM 1B – UNRESOLVED STAFF COMMENTSNone.As of December 31, 2022, the Company maintained 26 banking offices that are used in the normal course of business. The principal executive offices of the Company are located at 628 Main Street in the business district of Danville, Virginia. This building is owned by the Company and has three floors totaling approximately 27,000 square feet. The Company leases certain space located at 202 S. Jefferson Street, Roanoke, Virginia as a result of the merger with HomeTown. This office serves as the Virginia banking headquarters. The Company leases an office at 703 Green Valley Road in Greensboro, North Carolina. This building serves as the head office for the Company's North Carolina banking headquarters. The Company owns 22 other officesnamed executive officers, the officers had the opportunity to earn incentive payments for a total2023 performance, with the targeted payout for the Chief Executive Officer initially set at amount equal to 60% of 23 owned buildings. There are no mortgages or liens against any of the properties owned by the Company. The Company operates 37 ATMs on owned or leased facilities. The Company leases five other offices for a total of seven leased office locations and leases one storage warehouse. Management believes that upon expiration of each of the Company's leases it will be able to extend the lease on satisfactory terms or relocate to another acceptable location.In the ordinary course of operations, the Companyhis base salary, and the Bank are parties to various legal proceedings. Based upon information currently available, management believes that such legal proceedings, in the aggregate, will not have a material adverse effect on the business, financial condition, or results of operations of the Company.ITEM 4 – MINE SAFETY DISCLOSURESNone.PART IIITEM 5 – MARKET FOR REGISTRANT'S COMMON EQUITY, RELATED STOCKHOLDER MATTERS AND ISSUER PURCHASES OF EQUITY SECURITIESMarket and Dividend InformationThe Company's common stock is traded on the Nasdaq Global Select Market under the symbol "AMNB." At December 31, 2022, the Company had 4,029 shareholders of record. The Company paid quarterly cash dividends of $0.28 per sharetargeted payout for each of the first three quartersother named executive officers initially set at an amount equal to 50% of 2022their respective base salaries. For 2023, for the Chief Executive Officer and $0.30each of the other named executive officers targeted incentive payment was based primarily on the achievement of a singular corporate goal of core earnings per share for("Core EPS"), defined as net income per diluted share, per generally accepted accounting principles, less the fourth quarterimpact of 2022.fair value and merger related adjustments. The Company's future dividend policy is subject toachievement of certain individual non-financial operational goals was also considered. Incentive payments are normally made in a combination of cash and restricted stock grants, with the discretionpercentage mix established by the Committee in its sole discretion. The participants have the option of taking a larger percentage of the Boards of Directors ofbonus payment in restricted stock and less in cash.Companyeconomic headwinds associated with rapidly increasing interest rates, inflation and the Bank and will depend upon a number of factors, including future earnings, financial condition, cash requirements and general business conditions. The Company andpending merger with Atlantic Union, the Bank are also subjectCommittee elected to certain restrictions imposed by the reserve and capital requirements of federal and state statutes and regulations. See "Part I, Item 1. Business - Supervision and Regulation - Dividends," for information on regulatory restrictions on dividends.Stock Compensation PlansThe Company's 2018 Stock Incentive Plan was adopted by the Board of Directors of the Company on February 20, 2018 and approved by shareholders on May 15, 2018 at the Company's 2018 Annual Meeting of Shareholders. The plan and stock compensation in general are discussed in Note 13 of the Consolidated Financial Statements contained in Item 8 of this Form 10-K.The following table summarizes information, as of December 31, 2022, relating to the Company's equity based compensation plans, pursuant to which grants of options to acquire shares of common stock have been and may be granted from time to time. Number of Shares to be Issued Upon Exercise of Outstanding Options, Warrants and Rights Weighted-Average Per Share Exercise Price of Outstanding Options, Warrants and Rights Number of Shares Remaining Available for Future Issuance Under Equity Compensation Plans 4,150 $ 16.63 477,691 — — — 4,150 $ 16.63 477,691 Stock Repurchase ProgramOn January 20, 2022, the Company filed a Form 8-K with the SEC to announce the approval by its Board of Directors of a stock repurchase program that authorized the repurchase of up to $13.0 million of the Company's common stock through December 31, 2022. Shares of the Company's common stock were repurchased during the three months ended December 31, 2022, as detailed below. 602 $ 35.41 602 5,011 2,667 36.68 2,667 2,344 — — — — 3,269 $ 37.14 3,269 In 2022, the Company repurchased 206,978 shares at an average cost of $36.26 per share for a total cost of $7.5 million. On January 26, 2023, the Company filed a Form 8-K with the SEC to announce the approval by its Board of Directors of a stock repurchase program that authorized the repurchase of up to $10.0 million of the Company's common stock through December 31, 2023. Comparative Stock PerformanceThe following graph compares the Company's cumulative total return to its shareholders with the returns of two indexes for the five-year period ended December 31, 2022. The cumulative total return was calculated taking into consideration changes in stock price, cash dividends, stock dividends, and stock splits since December 31, 2017. The indexes are the Nasdaq Composite Index and the SNL Bank $1 Billion - $5 Billion Index, which includes bank holding companies with assets of $1 billion to $5 billion and is published by SNL Financial, LC.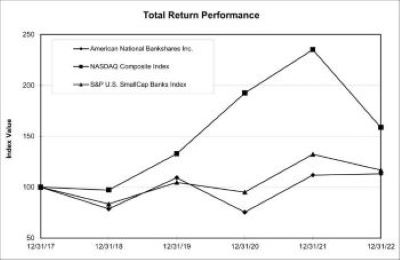
$ 100.00 $ 78.59 $ 109.28 $ 75.38 $ 111.84 $ 113.13 100.00 97.16 132.81 192.47 235.15 158.65 100.00 83.44 104.69 95.08 132.36 116.69 ITEM 7 - MANAGEMENT'S DISCUSSION AND ANALYSIS OF FINANCIAL CONDITION AND RESULTS OF OPERATIONSThe main purpose of this discussion is to focus on significant changes inreset both the financial conditiontargets and results of operations of the Company during the past three years. The discussion and analysis are intended to supplement and highlight information contained in the accompanying Consolidated Financial Statements and the selected financial data presented elsewhere in this Annual Report on Form 10-K.RECLASSIFICATIONIn certain circumstances, reclassifications have been made to prior period information to conform to the 2022 presentation. There were no material reclassifications.CRITICAL ACCOUNTING POLICIESThe accounting and reporting policies followed by the Company conform with GAAP and to general practices within the banking industry. The Company's critical accounting policies, which are summarized below, relate to (1) the allowancepayout ratios for loan losses, (2) acquired loans with specific credit-related deterioration, and (3) goodwill and intangible assets. A summary of the Company's significant accounting policies is set forth in Note 1 to the Consolidated Financial Statements.The financial information contained within the Company's financial statements is, to a significant extent, financial information that is based on measures of the financial effects of transactions and events that have already occurred. A variety of factors could affect the ultimate value that is obtained when earning income, recognizing an expense, recovering an asset, or relieving a liability. In addition, GAAP itself may change from one previously acceptable method to another method.Allowance for Loan LossesThe purpose of the ALLL is to provide for probable losses inherent in the loan portfolio. The allowance is increased by the provision for loan losses and by recoveries of previously charged-off loans. Loan charge-offs decrease the allowance.The goal of the Company is to maintain an appropriate, systematic, and consistently applied process to determine the amounts of the ALLL and the provision for or recovery of loan loss expense.The Company uses certain practices to manage its credit risk. These practices include (1) appropriate lending limits for loanthen named executive officers (2) a loan approval process, (3) careful underwriting of loan requests, including analysis of borrowers, cash flows, collateral, and market risks, (4) regular monitoring of the portfolio, including diversification by type and geography, (5) review of loans by the Loan Review department, which operates independently of loan production (the Loan Review function consists of a co-sourced arrangement using both internal personnel and external vendors to provide the Company with a more robust review function of the loan portfolio), (6) regular meetings of the Credit Committee to discuss portfolio and policy changes and make decisions on large or unusual loan requests, and (7) regular meetings of the Asset Quality Committee which reviews the status of individual loans.Risk grades are assigned as part of the loan origination process. From time to time, risk grades may be modified as warranted by the facts and circumstances surrounding the credit.Calculation and analysis of the ALLL is prepared quarterly by the Finance Department with input from the Credit Department. The Company's Credit Committee, Risk and Compliance Committee, Audit Committee, and the Board of Directors review the allowance for adequacy.The Company's ALLL has two basic components: the formula allowance and the specific allowance. Each of these components is determined based upon estimates and judgments.The formula allowance uses historical loss experience as an indicator of future losses, along with various qualitative factors, including levels and trends in delinquencies, nonaccrual loans, charge-offs and recoveries, trends in volume and terms of loans, effects of changes in underwriting standards, experience of lending staff, economic conditions, portfolio concentrations, regulatory, legal, competition, quality of loan review system, and value of underlying collateral. In the formula allowance for commercial and commercial real estate loans, the historical loss rate is combined with the qualitative factors, resulting in an adjusted loss factor for each risk-grade category of loans. The period-end balances for each loan risk-grade category are multiplied by the adjusted loss factor. Allowance calculations for residential real estate and consumer loans are calculated based on historical losses for each product category without regard to risk grade. This loss rate is combined with qualitative factors resulting in an adjusted loss factor for each product category.The specific allowance uses various techniques to arrive at an estimate of loss for specifically identified impaired loans. These include:•The present value of expected future cash flows discounted at the loan's effective interest rate. The effective interest rate on a loan is the rate of return implicit in the loan (that is, the contractual interest rate adjusted for any net deferred loan fees or costs and any premium or discount existing at the origination or acquisition of the loan);•The loan's observable market price; or•The fair value of the collateral, net of estimated costs to dispose, if the loan is collateral dependent.The use of these computed values is inherently subjective and actual losses could be greater or less than the estimates.No single statistic, formula, or measurement determines the adequacy of the allowance. Management makes subjective and complex judgments about matters that are inherently uncertain, and different amounts would be reported under different conditions or using different assumptions. For analytical purposes, management allocates a portion of the allowance to specific loan categories and specific loans. However, the entire allowance is used to absorb credit losses inherent in the loan portfolio, including identified and unidentified losses.The relationships and ratios used in calculating the allowance, including the qualitative factors, may change from period to period as facts and circumstances evolve. Furthermore, management cannot provide assurance that in any particular period the Bank will not have sizable credit losses in relation to the amount reserved. Management may find it necessary to significantly adjust the allowance, considering current factors at the time.On January 1, 2023, the Company adopted ASU No. 2016-13, Financial Instruments - Credit Losses (Topic 326): Measurement of Credit Losses on Financial Instruments. The new accounting standard replaced the methodology described above and reflected in the calculations for the years ended December 31, 2022, 2021, and 2020. The incurred loss model was replaced with the current expected credit losses model, a methodology that requires consideration of reasonable and supportable information to estimate losses over the life of the loan. Acquired Loans with Specific Credit-Related DeteriorationAcquired loans with specific credit deterioration are accounted for by the Company in accordance with Financial Accounting Standards Board ("FASB") Accounting Standards Codification ("ASC") 310-30, Receivables - Loans and Debt Securities Acquired with Deteriorated Credit Quality. Certain acquired loans, those for which specific credit-related deterioration since origination is identified, are recorded at the amount paid, such that there is no carryover of the seller's allowance for loan losses. Income recognition on these loans is based on a reasonable expectation aboutrevised forecast for the timing and amount of cash flows to be collected.Goodwill and Intangible AssetsThe Company follows ASC 350, Goodwill and Other Intangible Assets, which prescribes the accounting for goodwill and intangible assets subsequent to initial recognition. Goodwill resulting from business combinations prior to January 1, 2009 represents the excessremainder of the purchase price over the fair value of the net assets of businesses acquired. Goodwill resulting from business combinations after January 1, 2009 is generally determined as the excess of the fair value of the consideration transferred, plus the fair value of any noncontrolling interests in the acquiree, over the fair value of the net assets acquired and liabilities assumed as of the acquisition date. Goodwill and intangible assets acquired in a purchase business combination and determined to have an indefinite useful life are not amortized, but tested for impairment at least annually or more frequently if events and circumstances exist that indicate that a goodwill impairment test should be performed.year. The Company records as goodwill the fair value of the consideration transferred, plus the fair value of any noncontrolling interests in the acquiree, over the fair value of the net assets acquired and liabilities assumed as of the acquisition date. Impairment testing is performed annually, as well as when an event triggering impairment may have occurred. The Company performs its annual analysis on June 30 of each fiscal year. No indicators of impairment were notedtargeted payout for the years ended December 31, 2022, 2021 or 2020. Intangible assets with definite useful lives are amortizing over their estimated useful lives of 5Chief Executive Officer was reduced to 10 years. Goodwill is the only intangible asset with an indefinite life on the Company's consolidated balance sheets.NON-GAAP PRESENTATIONSNon-GAAP presentations are provided because the Company believes these may be valuable to investors. These include (1) the calculation of the efficiency ratio, (2) the analysis of net interest income presented on a taxable equivalent basis to facilitate performance comparisons among various taxable and tax-exempt assets, (3) return on average tangible common equity, (4) tangible common equity to tangible assets ratio, and (5) tangible book value per share. Such information is not prepared in accordance with GAAP and should not be construed as such. Management believes, however, such financial information is meaningful to the reader in understanding operating performance but cautions that such information not be viewed as a substitute for GAAP information. In addition, the Company's non-GAAP financial measures may not be comparable to non-GAAP financial measures of other companies. The Company, in referring to its net income, is referring to income under GAAP.The efficiency ratio is calculated by dividing noninterest expense excluding (1) gains or losses on the sale of other real estate owned ("OREO"), and (2) core deposit intangible amortization by net interest income including tax equivalent income on nontaxable loans and securities and noninterest income and excluding (x) gains or losses on securities and (y) gains or losses on sale or disposal of premises and equipment. The efficiency ratio for 2022, 2021, and 2020 was 57.37%, 51.05%, and 52.80%, respectively. This ratio increased in 2022 as the benefits of PPP related items decreased. The efficiency ratio is a non-GAAP financial measure that the Company believes provides investors with important information regarding operational efficiency. The components of the efficiency ratio calculation are summarized in the following table (dollars in thousands): $ 64,086 $ 59,008 $ 54,565 2 (111 ) 4 (1,260 ) (1,464 ) (1,637 ) $ 62,828 $ 57,433 $ 52,932 $ 90,238 $ 90,391 $ 83,820 244 241 288 18,807 21,031 16,843 — (35 ) (814 ) 228 885 110 $ 109,517 $ 112,513 $ 100,247 57.37 % 51.05 % 52.80 % Net interest margin is calculated by dividing tax equivalent net interest income by total average earning assets. Because a portion of interest income earned by the Company is nontaxable, the tax equivalent net interest income is considered in the calculation of this ratio. Tax equivalent net interest income is calculated by adding the tax benefit realized from interest income that is nontaxable to total interest income then subtracting total interest expense. The tax rate utilized in calculating the tax benefit is 21% for 2022, 2021, and 2020. The reconciliation of tax equivalent net interest income, which is not a measurement under GAAP, to net interest income, is reflected in the table below (in thousands): $ 82,708 $ 87,181 $ 87,881 13,540 8,856 8,247 (3,553 ) (3,645 ) (9,729 ) (26 ) (22 ) (259 ) (633 ) — — (1,554 ) (1,738 ) (2,032 ) $ 90,482 $ 90,632 $ 84,108 (139 ) (141 ) (181 ) (105 ) (100 ) (107 ) $ 90,238 $ 90,391 $ 83,820 Return on average tangible common equity is calculated by dividing net income available to common shareholders by average common equity. 10.36 % 12.50 % 9.12 % 4.20 % 4.84 % 4.07 % 14.56 % 17.34 % 13.19 % Tangible common equity to tangible assets ratio is calculated by dividing period-end common equity less period-end intangibles by period-end assets less period-end intangibles. 10.48 % 10.64 % (2.66 )% (2.47 )% 7.82 % 8.17 % The Company presents book value per share (period-end shareholders' equity divided by period-end common shares outstanding) and tangible book value per share. In calculating tangible book value, the Company excludes goodwill and other intangible assets. $ 30.27 $ 32.95 (8.33 ) (8.33 ) $ 21.94 $ 24.62 RESULTS OF OPERATIONSExecutive OverviewThe Company's 2022 financial highlights include the following:•Net income available to common shareholders was $34.4 million and diluted earnings per share was $3.23 for the year ended December 31, 2022, compared to net income of $43.5 million and diluted earnings per share of $4.00 for the year ended December 31, 2021.•Earnings produced a return on average tangible common equity of 14.56% for 2022, compared to 17.34% for 2021.*•Period end net loans grew $239.9 million or 12.3% in 2022 as compared to 2021.•Period-end deposits decreased $294.0 million or 10.2% as compared to 2021.•The 2022 provision for loan losses totaled $1.6 million, compared to a negative provision of ($2.8) million in the prior year. •Nonperforming assets as a percentage of total assets were 0.05% at December 31, 2022, down from 0.07% at December 31, 2021.•Net charge-offs to total average loans were 0.04% for 2022, compared to net recoveries to total net average loans of (0.01%) for 2021.*Refer to the Non-GAAP Financial Measures section within this section for further information on these non-GAAP financial measurements.Net IncomeNet income for 2022 was $34.4 million compared to $43.5 million for 2021, a decrease of $9.1 million or 20.9%. Basic and diluted earnings per share were $3.23 for 2022 compared to $4.00 for 2021. This net income produced for 2022 a return on average assets of 1.07%, a return on average common equity of 10.36%, and a return on average tangible common equity of 14.56%.Net income for 2021 was $43.5 million compared to $30.0 million for 2020, an increase of $13.5 million or 44.9%. Basic earnings per share were $4.00 per share for 2021 compared to $2.74 for 2020. Diluted earnings per share were $4.00 for 2021 compared to $2.73 for 2020. This net income produced for 2021 a return on average assets of 1.37%, a return on average common equity of 12.50%, and a return on average tangible common equity of 17.34%.The decrease in earnings in 2022 was the net result of provision expense of $1.6 million compared to a recovery of provision in 2021 of $2.8 million, a decrease of $2.5 million in mortgage banking income, and increased salaries and employee benefits expenses in 2022 compared to 2021. The increase in earnings in 2021 was primarily the result of the recovery of provision of $2.8 million in 2021 compared to the $8.9 million provision expense in 2020, reduced costs of deposits year over year and an additional $2.0 million of PPP net fees recognized in 2021 over 2020. Net Interest IncomeNet interest income is the difference between interest income on earning assets, primarily loans and securities, and interest expense on interest-bearing liabilities, primarily deposits and borrowings. Fluctuations in interest rates as well as volume and mix changes in earning assets and interest bearing liabilities can materially impact net interest income. Mergers, including the most recent 2019 acquisition of HomeTown, impacted net interest income positively for 2022, 2021, and 2020 through increased earning assets.The following discussion of net interest income is presented on a taxable equivalent basis to facilitate performance comparisons among various taxable and tax-exempt assets, such as certain state and municipal securities. A tax rate of 21% was used in adjusting interest on tax-exempt assets to a fully taxable equivalent basis for 2022, 2021, and 2020. Net interest income divided by average earning assets is referred to as the net interest margin. The net interest spread represents the difference between the average rate earned on earning assets and the average rate paid on interest bearing liabilities. All references in this section relate to average yields and rates and average asset and liability balances during the periods discussed.Net interest income on a taxable equivalent basis decreased $150 thousand, or less than one percent, in 2022 from 2021, following an increase of $6.5 million, or 7.8%, in 2021 from 2020. The decrease in net interest income in 2022 was the net result of less PPP fee income in 2022, and higher short-term borrowings costs compared to 2021. Average interest-bearing deposit balances for 2022 were down $32.3 million, or 1.8%, from 2021. The cost of interest-bearing deposits remained constant at 20 basis points because the change in mix of interest-bearing deposits offset the general rise in interest rates during 2022. Increased volume of higher cost short-term borrowings increased the total cost of interest bearing liabilities. Yields on loans were 4.02% in 2022 compared to 4.44% in 2021. Cost of interest-bearing liabilities was 0.31% in 2022 compared to 0.29% in 2021. Between 2022 and 2021, deposit rates for demand, money market, and savings accounts increased by 1, 13, and 3 basis points, respectively, while time deposits decreased by 17 basis points. The net interest margin was 2.97% for 2022, compared to 3.05% for 2021. The decrease in net interest margin was driven by increasing interest rates on both sides of the balance sheet and significantly less loan discount accretion compounded by a changing liquidity mix.In March 2020, the FOMC, in response to the COVID-19 crisis, reduced the target federal funds rate by 1.50% taking the federal funds target rate down to 0.25% where it remained until March 2022, when rates began to rise. By the end of 2022, the FOMC had raised rates seven times for a cumulative total of 4.25% in response to higher inflation.The following presentation is an analysis of net interest income and related yields and rates, on a taxable equivalent basis, for the last three years. Nonaccrual loans are included in average balances. Interest income on nonaccrual loans, if recognized, is recorded on a cash basis or when the loan returns to accrual status.Net Interest Income Analysis(dollars in thousands) $ 292,833 $ 372,538 $ 475,068 $ 11,448 $ 18,819 $ 17,768 3.91 % 5.05 % 3.74 % 1,755,982 1,584,856 1,531,195 70,837 67,887 69,525 4.03 4.28 4.54 6,578 6,984 8,998 423 475 588 6.43 6.80 6.53 2,055,393 1,964,378 2,015,261 82,708 87,181 87,881 4.02 4.44 4.36 150,886 57,048 9,010 1,372 507 51 0.91 0.89 0.57 107,311 97,943 72,112 1,348 1,132 1,423 1.26 1.16 1.97 355,331 308,158 200,612 5,420 4,142 4,060 1.53 1.34 2.02 68,928 61,698 45,836 1,399 1,272 1,175 2.03 2.06 2.56 37,545 24,707 20,382 1,510 1,205 1,098 4.02 4.88 5.39 720,001 549,554 347,952 11,049 8,258 7,807 1.53 1.50 2.24 267,381 453,867 188,700 2,491 598 440 0.93 0.13 0.23 3,042,775 2,967,799 2,551,913 96,248 96,037 96,128 3.16 3.24 3.77 168,893 208,765 221,094 $ 3,211,668 $ 3,176,564 $ 2,773,007 $ 522,043 $ 476,710 $ 386,790 202 152 344 0.04 0.03 0.09 688,631 710,948 574,510 1,648 758 2,634 0.24 0.11 0.46 273,788 243,123 198,313 102 26 117 0.04 0.01 0.06 280,672 366,604 436,081 1,601 2,709 6,634 0.57 0.74 1.52 1,765,134 1,797,385 1,595,694 3,553 3,645 9,729 0.20 0.20 0.61 24,005 37,632 42,937 26 22 259 0.11 0.06 0.60 15,629 — 1 633 — — 4.05 — 0.55 28,280 31,878 35,586 1,554 1,738 2,032 5.50 5.45 5.71 1,833,048 1,866,895 1,674,218 5,766 5,405 12,020 0.31 0.29 0.72 1,028,871 939,186 746,659 17,393 22,325 22,777 332,356 348,158 329,353 $ 3,211,668 $ 3,176,564 $ 2,773,007 2.85 % 2.95 % 3.05 % 2.97 % 3.05 % 3.30 % 90,482 90,632 84,108 244 241 288 $ 90,238 $ 90,391 $ 83,820 ______________________(1) Interest income includes net accretion/amortization of acquired loan fair value adjustments and the net accretion/amortization of deferred loan fees/costs.(2) Nonaccrual loans are included in the average balances.(3) A tax rate of 21% in 2022, 2021, and 2020 was used in adjusting interest on tax-exempt assets to a fully taxable equivalent basis.The following table presents the dollar amount of changes in interest income and interest expense, and distinguishes between changes resulting from fluctuations in average balances of interest earning assets and interest bearing liabilities (volume) and changes resulting from fluctuations in average interest rates on such assets and liabilities (rate). Changes attributable to both volume and rate have been allocated proportionately (dollars in thousands):Changes in Net Interest Income (Rate / Volume Analysis) $ (7,371 ) $ (3,787 ) $ (3,584 ) $ 1,051 $ 5,398 $ (4,347 ) 2,950 (4,103 ) 7,053 (1,638 ) (4,022 ) 2,384 (52 ) (25 ) (27 ) (113 ) 23 (136 ) (4,473 ) (7,915 ) 3,442 (700 ) 1,399 (2,099 ) 865 12 853 456 44 412 216 103 113 (291 ) (703 ) 412 1,278 598 680 82 (1,645 ) 1,727 127 (20 ) 147 97 (259 ) 356 305 (239 ) 544 107 (111 ) 218 2,791 454 2,337 451 (2,674 ) 3,125 1,893 2,233 (340 ) 158 (255 ) 413 211 (5,228 ) 5,439 (91 ) (1,530 ) 1,439 50 35 15 (192 ) (258 ) 66 890 915 (25 ) (1,876 ) (2,388 ) 512 76 72 4 (91 ) (113 ) 22 (1,108 ) (546 ) (562 ) (3,925 ) (2,997 ) (928 ) (92 ) 476 (568 ) (6,084 ) (5,756 ) (328 ) 4 14 (10 ) (237 ) (208 ) (29 ) 633 — 633 — — — (184 ) 14 (198 ) (294 ) (89 ) (205 ) 361 504 (143 ) (6,615 ) (6,053 ) (562 ) $ (150 ) $ (5,732 ) $ 5,582 $ 6,524 $ 4,523 $ 2,001 Fair Value Impact to Net Interest MarginThe Company's fully taxable equivalent net interest margin includes the impact of acquisition accounting fair value adjustments. The impact of net accretion for 2020, 2021, and 2022 and the remaining estimated net accretion are reflected in the following table (dollars in thousands): $ 3,716 $ 181 $ (85 ) $ 3,812 5,259 78 (101 ) 5,236 1,648 51 (102 ) 1,597 744 457 324 252 116 112 Noninterest IncomeFor the year ended December 31, 2022, noninterest income decreased $2.2 million, or 10.6%, compared to the year ended December 31, 2021. $ 6,521 $ 6,019 $ 502 8.3 % 2,676 2,611 65 2.5 4,107 4,152 (45 ) (1.1 ) 906 801 105 13.1 1,666 4,195 (2,529 ) (60.3 ) — 35 (35 ) (100.0 ) 1,409 1,972 (563 ) (28.5 ) 747 1,199 (452 ) (37.7 ) (228 ) (885 ) 657 74.2 1,003 932 71 7.6 $ 18,807 $ 21,031 $ (2,224 ) (10.6 )% Wealth management income increased $502 thousand for 2022 compared to 2021 primarily caused by growth in clients. Mortgage banking income decreased $2.5 million for 2022 compared to 2021. The decrease in 2022 was the result of decreased volume for new purchases and refinancing of existing loans as interest rates were increased seven times in 2022. Income from Small Business Investment Companies ("SBICs") investments decreased $563 thousand as rising interest rates impacted the market valuation of their portfolios. Income from insurance investments decreased $452 thousand in 2022 compared to 2021. The year ended December 31, 2022 reflected lower losses on premises and equipment, net compared to 2021. The 2022 year reflected a write-down of $146 thousand on a building acquired in the HomeTown acquisition while the 2021 year reflected losses of $588 thousand from the sale of two buildings and the write-down of $218 thousand on an additional property from that acquisition. $ 6,019 $ 4,789 $ 1,230 25.7 % 2,611 2,557 54 2.1 4,152 3,213 939 29.2 801 712 89 12.5 4,195 3,514 681 19.4 35 814 (779 ) (95.7 ) 1,972 270 1,702 630.4 1,199 321 878 273.5 (885 ) (110 ) (775 ) 704.5 932 763 169 22.1 $ 21,031 $ 16,843 $ 4,188 24.9 % Wealth management income increased $1.2 million for 2021 compared to 2020 caused by growth in clients and growth and market value. Interchange fees increased $939 thousand year-over-year as consumers rely more heavily on debit cards for spending versus cash. Mortgage banking income increased $681 thousand for 2021 compared to 2020. The increase in 2021 was the result of continued historically low rates in 2021 resulting in increased application volume for new purchases and refinancing of existing loans. Net securities gains decreased $779 thousand in 2021 compared to 2020. Income from SBIC investments increased $1.7 million as the fund's investment companies improved their performance compared to 2020. The investments held by the SBICs were significantly impacted in 2020 from the pandemic. Income from insurance investments increased $878 thousand compared to 2020. The Company received an additional earnings distribution in 2021 not received in 2020. The year ended December 31, 2021 reflected losses on premises and equipment, net of $588 thousand from the sale of two buildings acquired in the HomeTown acquisition and the write-down of $218 thousand on an additional property based on a current valuation.Noninterest ExpenseFor the year ended December 31, 2022, noninterest expense increased $5.1 million, or 8.6%, as compared to the year ended December 31, 2021. $ 36,382 $ 32,342 $ 4,040 12.5 % 6,075 6,032 43 0.7 903 864 39 4.5 1,953 1,767 186 10.5 1,260 1,464 (204 ) (13.9 ) 3,310 2,958 352 11.9 1,505 1,368 137 10.0 3 131 (128 ) (97.7 ) 12,695 12,082 613 5.1 $ 64,086 $ 59,008 $ 5,078 8.6 % Salaries and employee benefits increased $4.0 million in 2022 as compared to 2021. The year ended December 31, 2022 reflected additional incentive expenses based on measurement to goals. Data processing costs increased by $352 thousand due to increased volume of transactions and vendor price increases. Other expenses increased $613 thousand in 2022 compared to 2021 as a result of vendor price increases and investments in technology. $ 32,342 $ 29,765 $ 2,577 8.7 % 6,032 5,586 446 8.0 864 639 225 35.2 1,767 1,702 65 3.8 1,464 1,637 (173 ) (10.6 ) 2,958 3,017 (59 ) (2.0 ) 1,368 1,454 (86 ) (5.9 ) 131 60 71 118.3 12,082 10,705 1,377 12.9 $ 59,008 $ 54,565 $ 4,443 8.1 % Salaries and employee benefits increased $2.6 million in 2021 as compared to 2020. The year ended December 31, 2021 reflected additional incentive expenses based on performance measurement to goals and increased commissions as the result of increased mortgage production. Occupancy expense increased $446 thousand in 2021 as compared to 2020 primarily related to the full-year costs of the Triangle (North Carolina) banking office in 2021, which opened in late 2020. FDIC assessment expense increased $225 thousand in 2021 compared to 2020 due to balance sheet growth and 2020 benefitted from the final installment of a $75 thousand credit for Small Bank Assessment Credits. Other expenses increased $1.4 million for loan related expenses, investment related expenses, investments in technology and normal expense seasonality.Income TaxesIncome taxes on 2022 earnings amounted to $8.9 million, resulting in an effective tax rate of 20.6%, compared to 21.2% in 2021 and 19.2% in 2020. As a result of the enactment of the CARES Act, the Company recognized in the first quarter of 2020 a tax benefit for the net operating loss ("NOL") five-year carryback provision for the NOL acquired in the HomeTown merger. This NOL carryback tax benefit was the reason for the decreased rate in 2020 compared to 2021. The effective tax rate is lowered by income that is not taxable for federal income tax purposes. The primary nontaxable income is from state and municipal securities and loans.Impact of Inflation and Changing PricesThe majority of assets and liabilities of a financial institution are monetary in nature and therefore differ greatly from most commercial and industrial companies that have significant investments in fixed assets or inventories. The most significant effect of inflation is on noninterest expenses that tend to rise during periods of inflation. Changes in interest rates have a greater impact on a financial institution's profitability than do the effects of higher costs for goods and services. Through its balance sheet management practices, the Company has the ability to react to those changes and measure and monitor its interest rate and liquidity risk.Market Risk ManagementEffectively managing market risk is essential to achieving the Company's financial objectives. Market risk reflects the risk of economic loss resulting from changes in interest rates and market prices. The Company is generally not subject to currency exchange risk or commodity price risk. The Company's primary market risk exposure is interest rate risk; however, market risk also includes liquidity risk. Both are discussed in the following sections.Interest Rate Risk ManagementInterest rate risk and its impact on net interest income is a primary market risk exposure. The Company manages its exposure to fluctuations in interest rates through policies approved by its Asset Liability Committee ("ALCO") and Board of Directors, both of which receive and review periodic reports of the Company's interest rate risk position.The Company uses computer simulation analysis to measure the sensitivity of projected earnings to changes in interest rates. Simulation takes into account current balance sheet volumes and the scheduled repricing dates, instrument level optionality, and maturities of assets and liabilities. It incorporates numerous assumptions including growth, changes in the mix of assets and liabilities, prepayments, and average rates earned and paid. Based on this information, management uses the model to project net interest income under multiple interest rate scenarios.A balance sheet is considered asset sensitive when its earning assets (loans and securities) reprice faster or to a greater extent than its liabilities (deposits and borrowings). An asset sensitive balance sheet will produce relatively more net interest income when interest rates rise and less net interest income when they decline. Based on the Company's simulation analysis, management believes the Company's interest sensitivity position at December 31, 2022 is asset sensitive. Earnings SimulationThe table below shows the estimated impact of changes in interest rates on net interest income as of December 31, 2022 (dollars in thousands), assuming instantaneous and parallel changes in interest rates, and consistent levels of assets and liabilities. Net interest income for the following twelve months is projected to increase when interest rates are higher than current rates.Estimated Changes in Net Interest Income $ 1,665 1.6 % 1,183 1.1 751 0.7 335 0.3 — — (2,349 ) (2.2 ) (6,725 ) (6.4 ) (11,458 ) (11.0 ) Management cannot predict future interest rates or their exact effect on net interest income. Computations of future effects of hypothetical interest rate changes are based on numerous assumptions and should not be relied upon as indicative of actual results. Certain limitations are inherent in such computations. Assets and liabilities may react differently than projected to changes in market interest rates. The interest rates on certain types of assets and liabilities may fluctuate in advance of changes in market interest rates, while rates on other types of assets and liabilities may lag changes in market interest rates. Interest rate shifts may not be parallel.Changes in interest rates can cause substantial changes in the amount of prepayments of loans and mortgage-backed securities, which may in turn affect the Company's interest rate sensitivity position. Additionally, credit risk may rise if an interest rate increase adversely affects the ability of borrowers to service their debt.Economic Value SimulationEconomic value simulation is used to calculate the estimated fair value of assets and liabilities over different interest rate environments. Economic values are calculated based on discounted cash flow analysis. The net economic value of equity is the economic value of all assets minus the economic value of all liabilities. The change in net economic value over different rate environments is an indication of the longer-term earnings capability of the balance sheet. The same assumptions are used in the economic value simulation as in the earnings simulation. The economic value simulation uses instantaneous rate shocks to the balance sheet.The following table reflects the estimated change in net economic value over different rate environments using economic value simulation for the balances at the period ended December 31, 2022 (dollars in thousands):Estimated Changes in Economic Value of Equity $ 656,307 $ 120,084 22.4 % 634,192 97,969 18.3 608,096 71,873 13.4 575,960 39,737 7.4 536,223 — — 476,684 (59,539 ) (11.1 ) 398,879 (137,344 ) (25.6 ) 321,542 (214,681 ) (40.0 ) Liquidity Risk ManagementLiquidity is the ability of the Company in a timely manner to convert assets into cash or cash equivalents without significant loss and to raise additional funds by increasing liabilities. Liquidity management involves maintaining the Company's ability to meet the daily cash flow requirements of its customers, whether they are borrowers requiring funds or depositors desiring to withdraw funds. Additionally, the Company requires cash for various operating needs including dividends to shareholders, the servicing of debt, and the payment of general corporate expenses. The Company manages its exposure to fluctuations in interest rates and liquidity needs through policies approved by the ALCO and Board of Directors, both of which receive periodic reports of the Company's interest rate risk and liquidity position. The Company uses a computer simulation model to assist in the management of the future liquidity needs of the Company.Liquidity sources include on balance sheet and off balance sheet sources.Balance sheet liquidity sources include cash, amounts due from banks, loan repayments, bond maturities and calls, and increases in deposits. Further, the Company maintains a large, high quality, very liquid bond portfolio, which is generally 0% to 50% unpledged and would, accordingly, be available for sale if necessary.Off balance sheet sources include lines of credit from the Federal Home Loan Bank of Atlanta ("FHLB"), federal funds lines of credit, and access to the Federal Reserve Bank of Richmond's discount window.The Company has a line of credit with the FHLB, equal to 30% of the Company's assets, subject to the amount of collateral pledged. Under the terms of its collateral agreement with the FHLB, the Company provides a blanket lien covering all of its residential first mortgage loans, home equity lines of credit, commercial real estate loans and commercial construction loans. In addition, the Company pledges as collateral its capital stock in and deposits with the FHLB. At December 31, 2022 and 2021, there were $100.5 million and $0, respectively, in principal advance obligations to the FHLB. The Company had $170 million in outstanding FHLB letters of credit at December 31, 2022 compared to $275 million in letters of credit at December 31, 2021. The letters of credit provide the Bank with additional collateral for securing public entity deposits above FDIC insurance levels, thereby providing less need for collateral pledging from the securities portfolio and accordingly increasing the Company's balance sheet liquidity.Short-term borrowing is discussed in Note 10 and long-term borrowing is discussed in Note 11 of the Consolidated Financial Statements contained in Item 8 of this Form 10-K.The Company has federal funds lines of credit established with correspondent banks in the amount of $60 million and has access to the Federal Reserve Bank of Richmond's discount window. There were no amounts outstanding under these facilities at December 31, 2022. The Bank also participates with the IntraFi Insured Cash Sweep, a product which provides the Bank the capability of providing additional deposit insurance to customers in the context of a money market account arrangement. BALANCE SHEET ANALYSISSecuritiesThe securities portfolio generates income, plays a strategic role in the management of interest rate sensitivity, provides a source of liquidity, and is used to meet collateral requirements. The securities portfolio consists of high quality investments, mostly federal agency, mortgage-backed, and state and municipal securities.The Company is cognizant of the current rising interest rate environment and has executed an asset liability strategy of purchasing high quality taxable securities with relatively low optionality and short and overall balanced duration.The following table presents information on the maturities and taxable equivalent yields of available for sale securities: 0.72 -0.02 0.90 0.71 1.32 1.22 — — 0.92 0.69 0.45 0.29 1.29 1.09 2.36 1.68 3.81 2.23 1.60 1.12 2.58 3.09 3.25 0.82 2.02 1.47 1.56 1.61 1.76 1.35 2.45 2.02 1.80 1.91 2.07 1.87 4.10 3.01 2.15 2.01 2.41 — — 2.42 4.95 3.67 — — 4.91 3.63 1.73 1.29 The Company had no equity securities at December 31, 2022 and 2021. LoansThe loan portfolio consists primarily of commercial and residential real estate loans, commercial loans to small and medium-sized businesses, construction and land development loans, and home equity loans. Average loans increased $91.0 million, or 4.6%, from 2021 to 2022. Average loans decreased $50.9 million or 2.5%, from 2020 to 2021, primarily due to PPP loan forgiveness.At December 31, 2022, total loans, net of deferred fees and costs, were $2.2 billion, an increase of $239.9 million, or 12.3%, from the prior year. Excluding PPP loans of $74.0 thousand and $12.2 million at December 31, 2022 and 2021, respectively, loans held for investment increased $252.2 million or 13.0%.Loans held for sale and associated with secondary mortgage activity totaled $1.1 million at December 31, 2022 and $8.5 million at December 31, 2021. Loan production volume was $61.0 million and $142.8 million for 2022 and 2021, respectively. These loans were approximately 65% purchase, 35% refinancing for the year ended December 31, 2022 compared to approximately 35% purchase, 65% refinancing for the year ended December 31, 2021.Management of the loan portfolio is organized around portfolio segments. Each segment is comprised of various loan types that are reflective of operational and regulatory reporting requirements. The following table presents the Company's portfolio maturities as of the dates indicated by segment (dollars in thousands): Loans $ 25,395 $ 145,192 $ 26,023 $ 915 $ 197,525 42,891 231,270 142,602 1,699 418,462 39,746 503,210 246,862 37,910 827,728 18,200 152,871 142,008 25,053 338,132 4,915 27,819 61,006 — 93,740 131,147 1,060,362 618,501 65,577 1,875,587 56,236 158,473 80,023 9,515 304,247 916 3,837 284 1,578 6,615 $ 188,299 $ 1,222,672 $ 698,808 $ 76,670 $ 2,186,449 $ 112,589 $ 1,018,439 $ 588,116 $ 26,416 $ 1,745,560 75,710 204,233 110,692 50,254 440,889 $ 188,299 $ 1,222,672 $ 698,808 $ 76,670 $ 2,186,449 The Company does not participate in or have any highly leveraged lending transactions, as defined by bank regulations. The Company has no foreign loans. There were no concentrations of loans to any individual, group of individuals, business, or industry that exceeded 10% of total loans at December 31, 2022 or 2021.Provision for Loan LossesThe Company had a provision for loan losses of $1.6 million for the year ended December 31, 2022 compared to a negative provision for loan losses of ($2.8) million for the year ended December 31, 2021, and a provision for loan losses of $8.9 million for the year ended December 31, 2020.The provision for 2022 was primarily the result of loan growth. The negative provision (recovery) in 2021 was the result of improved economic data supporting changes to the qualitative factors. The provision for 2020 reflects an increase in allowance requirements in response to the declining and uncertain economic landscape caused by the COVID-19 pandemic. The increase in 2020 can be attributed to a measurable increase in qualitative factors related to significant contractions in economic data for both national and local economies and a significant increase in unemployment rates. Allowance for Loan LossesThe purpose of the ALLL is to provide for probable losses inherent in the loan portfolio. The allowance is increased by the provision for loan losses and by recoveries of previously charged-off loans. Loan charge-offs decrease the allowance.The ALLL was $19.6 million, $18.7 million, and $21.4 million at December 31, 2022, 2021, and 2020, respectively. The ALLL as a percentage of loans at each of those dates was 0.89%, 0.96%, and 1.06%, respectively. The total amount of the allowance increased year over year as the result of loan growth. However, the allowance as a percent of total loans decreased primarily because of the decrease in the total sum of qualitative factors used in the calculation. The decrease in 2021 compared to 2020 was primarily due to improvements in various qualitative factors, notably economic, used in the determination of the allowance. The provision for 2020 reflected a declining and uncertain landscape caused by the COVID-19 pandemic. In an effort to better evaluate the adequacy of its ALLL, the Company computes its ASC 450, Contingencies, loan balance by reducing total loans by acquired loans and loans that were evaluated for impairment individually or smaller balance nonaccrual loans evaluated for impairment in homogeneous pools. It also adjusts its ASC 450 loan loss reserve balance total by removing allowances associated with these other pools of loans.The general allowance, ASC 450 (FAS 5) reserves to ASC 450 loans, was 0.94% at December 31, 2022, compared to 1.01% at December 31, 2021. On a dollar basis, the reserve was $19.5 million at December 31, 2022, compared to $18.0 million at December 31, 2021. The percentage of the reserve to total loans has decreased due to improved qualitative factors. This segment of the allowance represents by far the largest portion of the loan portfoliohis base salary, and the largest aggregate risk. There is no allowance for performing acquired loans in accordance with generally accepted accounting principles.The Company was considered a small reporting company at the one-time evaluation date for ASU 2016-13 "Financial Instruments-Credit Losses (Topic 326): Measurement of Credit Losses of Financial Instruments," and was not subject to adoption of this standard until January 1, 2023. Refer to "Note 1 - Summary of Significant Accounting Policies" of the consolidated financial statements for further information. The Company adopted the standard January 1, 2023.The specific allowance, ASC 310-40 (FAS 114) reserves to ASC 310-40 loans was $0 at December 31, 2022 and $7 thousand at December 31, 2021. The reserve related to acquired loans with deteriorated credit quality was $93 thousand at December 31, 2022, compared to $667 thousand at December 31, 2021. This is the only portion of the reserve related to acquired loans. Cash flow expectations for these loans are reviewed on a quarterly basis and unfavorable changes in those estimates relative to the initial estimates can result in the need for specific loan loss provisions.The following table presents the Company's loan loss and recovery experience for the years ended December 31, 2022 and 2021 (dollars in thousands): $ 2,668 $ 1,397 $ 3,964 $ 7,141 $ 3,458 $ 50 $ 18,678 442 399 (199 ) 476 373 106 1,597 (357 ) — — (436 ) (5 ) (221 ) (1,019 ) 121 — 20 3 41 114 299 $ 2,874 $ 1,796 $ 3,785 $ 7,184 $ 3,867 $ 49 $ 19,555 237,213 177,718 411,744 814,440 404,465 6,578 2,052,158 0.10 % 0.00 % (0.00 )% 0.05 % (0.01 )% 1.63 % 0.04 % $ 3,373 $ 1,927 $ 4,340 $ 7,626 $ 4,067 $ 70 21,403 (745 ) (530 ) (380 ) (493 ) (655 ) (22 ) (2,825 ) — — (3 ) — (53 ) (90 ) (146 ) 40 — 7 8 99 92 246 $ 2,668 $ 1,397 $ 3,964 $ 7,141 $ 3,458 $ 50 $ 18,678 329,893 138,902 385,262 719,355 372,725 6,984 1,953,121 (0.01 )% 0.00 % (0.00 )% (0.00 )% (0.01 )% (0.03 )% (0.01 )% Asset Quality IndicatorsThe following table provides certain qualitative indicators relevant to the Company's loan portfolio for the past three years.Asset Quality Ratios 0.89 % 0.96 % 1.06 % 0.94 1.01 1.16 3.68 (0.54 ) 3.11 0.04 (0.01 ) 0.03 0.05 0.07 0.12 0.06 0.11 0.13 221.81 2,825.00 1,340.75 0.08 (0.14 ) 0.44 1,478.08 840.59 793.88 __________________________(1) Excluding PPP loans, 0.89%, 0.97%, and 1.19% at December 31, 2022, 2021, and 2020, respectively.Nonperforming Assets (Loans and Other Real Estate Owned)Nonperforming loans include loans on which interest is no longer accrued and accruing loans that are contractually past due 90 days or more. Nonperforming loans include loans originated and loans acquired exclusive of purchased credit impaired loans.Nonperforming loans to total loans were 0.06% at December 31, 2022 and 0.11% at December 31, 2021. The decrease in nonperforming loans during 2022 was $699 thousand compared to 2021.Nonperforming assets include nonperforming loans, foreclosed real estate and repossessions. Nonperforming assets represented 0.05% of total assets at December 31, 2022 compared to 0.07% of total assets at December 31, 2021.In most cases, it is the policy of the Company that any loan that becomes 90 days past due will automatically be placed on nonaccrual loan status, accrued interest reversed out of income, and further interest accrual ceased. Any payments received on such loans will be credited to principal. In some cases, a loan in process of renewal may become 90 days past due. In these instances, the loan may still be accruing because of a delayed renewal process in which the customer has not been billed. In accounting for acquired impaired loans, such loans are not classified as nonaccrual when they become 90 days past due. They are considered to be accruing because their interest income relates to the accretable yield and not to contractual interest payments.Loans will only be restored to full accrual status after six consecutive months of payments that were each less than 30 days delinquent. The Company strictly adheres with this policy before restoring a loan to normal accrual status.Impaired LoansA loan is considered impaired when, based on current information and events, it is probable that the Company will be unable to collect the scheduled payments of principal or interest when due according to the contractual terms of the loan agreement. Total impaired loans, exclusive of purchased credit impaired loans, at December 31, 2022 and 2021 were $5.1 million and $2.2 million, respectively. Troubled Debt Restructurings ("TDRs")TDRs exist whenever the Company makes a concession to a customer based on the customer's financial distress that would not have otherwise been made in the normal course of business.There were $4.1 million in TDRs at December 31, 2022 compared to $1.7 million at December 31, 2021. The increase was related to the increase in impaired loans in 2022.Other Real Estate OwnedOREO is carried on the consolidated balance sheets at $27 thousand and $143 thousand as of December 31, 2022 and 2021, respectively. Foreclosed assets are initially recorded at fair value, less estimated costs to sell, at the date of foreclosure. Loan losses resulting from foreclosure are charged against the ALLL at that time. Subsequent to foreclosure, valuations are periodically performed by management, and the assets are carried at the lower of the new cost basis or fair value, less estimated costs to sell, with any additional write-downs charged against earnings. For significant assets, these valuations are typically outside annual appraisals. DepositsThe Company's deposits consist primarily of checking, money market, savings, and consumer and commercial time deposits. Period-end total deposits decreased $294.0 million, or 10.2%, during 2022. Customers have utilized funds accumulated over the past two years during and after the pandemic, and have become more rate sensitive as market rates have moved up during the course of the year. This has been a trend for all commercial banks. The Company has only a relatively small portion of its time deposits provided by wholesale sources. Total average deposits increased $57.4 million or 2.1% for 2022 compared to 2021. Average deposits and rates for the years indicated (dollars in thousands):Deposits $ 1,028,871 — % $ 939,186 — % $ 522,043 0.04 % $ 476,710 0.03 % 688,631 0.24 710,948 0.11 273,788 0.04 243,123 0.01 280,672 0.57 366,604 0.74 $ 1,765,134 0.20 % $ 1,797,385 0.20 % $ 2,794,005 0.13 % $ 2,736,571 0.13 % Certificates of Deposit over $250,000 At December 31, 2022, certificates of deposit that meet or exceed the FDIC insurance limit held by the Company were $87.6 million. The following table provides information on the maturity distribution of the time deposits exceeding the FDIC insurance limit at December 31, 2022. Amounts of $250 thousand or more were classified by maturity as follows (dollars in thousands): $ 12,863 24,250 30,469 19,976 $ 87,558 The Company's total uninsured deposits, which are the amounts of deposit accounts that exceed the FDIC insurance limit, currently $250 thousand, were approximately $974.0 million and $1.2 billion at December 31, 2022 and 2021, respectively. These amounts were estimated based on the same methodologies and assumptions used for regulatory reporting purposes.Borrowed FundsIn addition to internal deposit generation, the Company also relies on borrowed funds as a supplemental source of funding. Borrowed funds consist of customer repurchase agreements, overnight borrowings from the FHLB and longer-term FHLB advances, subordinated debt acquired in the HomeTown merger, and trust preferred capital notes. Customer repurchase agreements are borrowings collateralized by securities of the U.S. Government, its agencies, or Government Sponsored Enterprises ("GSEs") and generally mature daily. The Company considers these accounts to be a stable and low cost source of funds. The securities underlying these agreements remain under the Company's control. Refer to Note 10 and Note 11 of the Consolidated Financial Statements contained in Item 8 of this Form 10-K for a discussion of short-term and long-term debt. At December 31, 2022 and 2021, the Company had short-term debt of $100.5 million and $0, respectively. During 2020 and 2021 as the pandemic continued and stimulus funds were distributed from the government, deposits increased substantially across financial institutions nationwide. Consumers were stockpiling funds as economic uncertainty increased leading into 2022 and the Company had excess liquidity as a result. During 2022, as inflation increased and the effects of the pandemic waned, customers utilized funds from existing accounts which resulted in the Company utilizing supplemental sources of funding.In the regular course of conducting its business, the Company takes deposits from political subdivisions of the states of Virginia and North Carolina. At December 31, 2022, the Bank's public deposits totaled $220.9 million.The Company is legally required to provide collateral to secure the deposits that exceed the insurance coverage provided by the FDIC. This collateral can be provided in the form of certain types of government agency bonds or letters of credit from the FHLB. At year-end 2022, the Company had $170.0 million in letters of credit with the FHLB outstanding to supplement collateral for such deposits.Shareholders' EquityThe Company's goal with capital management is to comply with all regulatory capital requirements and to support growth, while generating acceptable returns on equity and paying a high rate of dividends.Shareholders' equity was $321.2 million at December 31, 2022 and $354.8 million at December 31, 2021.The Company declared and paid quarterly dividends totaling $1.14 per share for 2022, $1.09 per share for 2021, and $1.08 per share for 2020. Cash dividends in 2022 totaled $12.1 million and represented a 35.3% payout of 2022 net income, compared to a 27.2%targeted payout in 2021, and a 39.4% payout in 2020.The Company and the Bank became subject to the Basel III Capital Rules. The Basel III Capital Rules require the Company and the Bank to comply with the following minimum capital ratios: (i) a ratio of common equity Tier 1 to risk-weighted assets of at least 4.5%, plus the 2.5% capital conservation buffer (effectively resulting in a minimum ratio of common equity Tier 1 to risk-weighted assets of at least 7%), (ii) a ratio of Tier 1 capital to risk-weighted assets of at least 6.0%, plus the 2.5% capital conservation buffer (effectively resulting in a minimum Tier 1 capital ratio of 8.5%), (iii) a ratio of total capital to risk-weighted assets of at least 8.0%, plus the 2.5% capital conservation buffer (effectively resulting in a minimum total capital ratio of 10.5%), and (iv) a leverage ratio of 4%, calculated as the ratio of Tier 1 capital to average assets. In addition, to be well capitalized under the "prompt corrective action" regulations pursuant to Section 38 of the FDIA, the Bank must have the following minimum capital ratios: (i) a common equity Tier 1 capital ratio of at least 6.5%; (ii) a Tier 1 capital to risk-weighted assets ratio of at least 8.0%; (iii) a total capital to risk-weighted assets ratio of at least 10.0%; and (iv) a leverage ratio of at least 5.0%.On September 17, 2019, the federal banking agencies jointly issued a final rule required by the EGRRCPA that will permit qualifying banks and bank holding companies that have less than $10 billion in consolidated assets to elect to opt into the CBLR framework. Under the final rule, banks and bank holding companies that opt into the CBLR framework and maintain a CBLR of greater than 9% would not be subject to other risk-based and leverage capital requirements under the Basel III Capital Rules and will be deemed to have met the well capitalized ratio requirements under the "prompt corrective action" framework. In addition, a community bank that falls out of compliance with the framework will have a two-quarter grace period to come back into full compliance, provided its leverage ratio remains above 8%, and will be deemed well-capitalized during the grace period. The CBLR framework was first available for banking organizations to use in their March 31, 2020 regulatory reports. The Company and the Bank have not opted into the CBLR framework.The following table represents the major regulatory capital ratios for the Company as of the dates indicated: 11.70 % 12.43 % 12.86 % 13.73 % 13.67 % 14.61 % 10.36 % 9.13 % Management believes the Company is in compliance with all regulatory capital requirements applicable to it, and the Bank meets the requirements to be considered "well capitalized" under the prompt corrective action framework as of December 31, 2022 and 2021.Stock Repurchase ProgramsIn 2022, the Company repurchased 206,978 shares at an average cost of $36.26 per share for a total cost of $7.5 million. In 2021, the Company repurchased 265,939 shares at an average cost of $33.08 per share for a total cost of $8.8 million. In 2020, the Company repurchased 140,526 shares at an average cost of $35.44 per share for a total cost of $5.0 million. On January 26, 2023, the Company filed a Form 8-K with the SEC to announce the approval by its Board of Directors of another stock repurchase program. The program authorizes the repurchase of up to $10 million of the Company's common stock through December 31, 2023.CONTRACTUAL OBLIGATIONSThe following items are contractual obligations of the Company as of December 31, 2022 (dollars in thousands): $ 257,933 $ 171,415 $ 41,758 $ 38,484 $ 6,276 370 370 — — — 3,720 1,002 1,089 487 1,142 28,334 — — — 28,334 OFF-BALANCE SHEET ACTIVITIESThe Company enters into certain financial transactions in the ordinary course of performing traditional banking services that result in off-balance sheet transactions. Other than AMNB Statutory Trust I, formed in 2006 to issue trust preferred securities, and MidCarolina Trust I and MidCarolina Trust II, the Company does not have any off-balance sheet subsidiaries. Refer to Note 11 of the Consolidated Financial Statements contained in Item 8 of this Form 10-K for a discussion of junior subordinated debt. Off-balance sheet transactions were as follows as of the dates indicated (dollars in thousands): $ 635,851 $ 654,436 12,897 10,201 1,920 10,891 Commitments to extend credit to customers represent legally binding agreements with fixed expiration dates or other termination clauses. Since many of the commitments are expected to expire without being funded, the total commitment amounts do not necessarily represent future funding requirements. Standby letters of credit are conditional commitments issued by the Company guaranteeing the performance of a customer to a third party. Those guarantees are primarily issued to support public and private borrowing arrangements.ITEM 7A – QUANTITATIVE AND QUALITATIVE DISCLOSURES ABOUT MARKET RISKThis information is incorporated herein by reference from Item 7, "Management's Discussion and Analysis of Financial Condition and Results of Operations" of this Form 10-K.ITEM 8 – FINANCIAL STATEMENTS AND SUPPLEMENTARY DATASelected Financial Results (Unaudited)(dollars in thousands, except per share amounts) $ 96,004 $ 95,796 $ 95,840 $ 92,855 $ 68,768 5,766 5,405 12,020 15,728 9,674 90,238 90,391 83,820 77,127 59,094 1,597 (2,825 ) 8,916 456 (103 ) 18,807 21,031 16,843 15,170 13,274 64,086 59,008 54,565 66,074 44,246 43,362 55,239 37,182 25,767 28,225 8,934 11,713 7,137 4,861 5,646 $ 34,428 $ 43,526 $ 30,045 $ 20,906 $ 22,579 $ 3,065,902 $ 3,334,597 $ 3,050,010 $ 2,478,550 $ 1,862,866 2,186,449 1,946,580 2,015,056 1,830,815 1,357,476 620,713 700,523 474,806 387,825 339,730 2,596,328 2,890,353 2,611,330 2,060,547 1,566,227 321,174 354,792 337,894 320,258 222,542 $ 3.23 $ 4.00 $ 2.74 $ 1.99 $ 2.60 3.23 4.00 2.73 1.98 2.59 1.14 1.09 1.08 1.04 1.00 30.27 32.95 30.77 28.93 25.52 21.94 24.62 22.47 20.64 20.38 10,672,314 10,873,817 10,981,623 10,531,572 8,698,014 10,674,613 10,877,231 10,985,790 10,541,337 8,708,462 1.07 % 1.37 % 1.08 % 0.91 % 1.24 % 10.36 % 12.50 % 9.12 % 7.16 % 10.56 % 14.56 % 17.34 % 13.19 % 10.43 % 13.49 % 35.27 % 27.17 % 39.41 % 52.45 % 38.54 % 57.37 % 51.05 % 52.80 % 57.25 % 59.20 % 2.97 % 3.05 % 3.30 % 3.68 % 3.49 % 0.89 % 0.96 % 1.06 % 0.72 % 0.94 % 1,478.08 % 840.59 % 793.88 % 570.59 % 1,101.98 % 0.05 % 0.07 % 0.12 % 0.15 % 0.11 % 0.04 % (0.01 )% 0.03 % 0.01 % 0.05 % 13.67 % 14.61 % 15.18 % 14.04 % 15.35 % 11.70 % 12.43 % 12.36 % 11.56 % 12.55 % 12.86 % 13.73 % 13.78 % 12.98 % 14.46 % 10.36 % 9.13 % 9.48 % 10.75 % 11.62 % (1) Refer to Management's Discussion and Analysis Non-GAAP section for calculations.
REPORT OF INDEPENDENT REGISTERED PUBLIC ACCOUNTING FIRMTo the Board of Directors and ShareholdersAmerican National Bankshares Inc.Danville, VirginiaOpinion on the Financial StatementsWe have audited the accompanying consolidated balance sheets of American National Bankshares Inc. and Subsidiary (the Company) as of December 31, 2022 and 2021, the related consolidated statements of income, comprehensive income, changes in shareholders' equity and cash flows for each of the three yearsother named executive officers initially was reduced to an amount equal to 22.5% of their respective base salaries. 100% $ 3.37 $ 3.50 $ 3.63 100% $ 2.63 $ 2.74 $ 2.83 period ended December 31, 2022,team's efforts including the pending merger with Atlantic Union.related notesmaximum threshold (Core EPS of $2.83) would have resulted in a $243,000 payment eligibility. As discussed above, the payout was approved at the maximum threshold, resulting in a total incentive payment to the consolidated financial statements (collectively, the financial statements). In our opinion, the financial statements present fairly,Chief Executive Officer of 40.5% of his base salary, or $243,000, paid in all material respects, the financial position of the Company as of December 31, 2022 and 2021, and the results of its operations and its cash flows forcash.three yearsnamed executive officers other than the Chief Executive Officer, the revised targeted Core EPS of $2.74 would have resulted in the period ended December 31, 2022, in conformity with accounting principles generally accepted in the United States of America.We have also audited, in accordance with the standardsa target incentive payment equal to 22.5% of the Public Company Accounting Oversight Board (United States) (PCAOB), the Company's internal control over financial reporting as of December 31, 2022, based on criteria established in Internal Control — Integrated Framework issued by the Committee of Sponsoring Organizations of the Treadway Commission in 2013,respective base salaries for Messrs. Farrar, Martin Jung, and our report dated March 14, 2023 expressed an unqualified opinion on the effectiveness of the Company's internal control over financial reporting.Basis for OpinionThese financial statements are the responsibility of the Company’s management. Our responsibility is to express an opinion on the Company’s financial statements based on our audits. We are a public accounting firm registered with the PCAOB and are required to be independent with respect to the Company in accordance with U.S. federal securities laws and the applicable rules and regulations of the Securities and Exchange Commission and the PCAOB.We conducted our audits in accordance with the standards of the PCAOB. Those standards require that we plan and perform the audits to obtain reasonable assurance about whether the financial statements are free of material misstatement, whether due to errorMs. Joyce. The target payment would have decreased or fraud. Our audits included performing procedures to assess the risks of material misstatement of the financial statements, whether due to error or fraud, and performing procedures that respond to those risks. Such procedures included examining, on a test basis, evidence regarding the amounts and disclosures in the financial statements. Our audits also included evaluating the accounting principles used and significant estimates made by management, as well as evaluating the overall presentation of the financial statements. We believe that our audits provide a reasonable basis for our opinion.Critical Audit MattersThe critical audit matter communicated below is a matter arising from the current period audit of the financial statements thatincreased proportionately if Core EPS was communicated or required to be communicated to the audit committee and that: (1) relates to accounts or disclosures that are material to the financial statements and (2) involved our especially challenging, subjective, or complex judgments. The communication of critical audit matters does not alter in any way our opinion on the financial statements, taken as a whole, and we are not, by communicating the critical audit matter below, providing separate opinions on the critical audit matter or on the accounts or disclosures to which it relates.Allowance for Loan Losses – Loans Collectively Evaluated for Impairment – Qualitative FactorsDescription of the MatterAs described in Note 1 (Summary of Significant Accounting Policies) and Note 5 (Allowance for Loan Losses and Reserve for Unfunded Lending Commitments) to the consolidated financial statements, the Company maintains an allowance for loan losses to provide for probable losses inherent in the loan portfolio. The Company’s allowance for loan losses has two basic components, the formula allowance and the specific allowance. For loans that are not specifically identified for impairment, the formula allowance uses historical loss experience along with various qualitative factors to develop adjusted loss factors for each loan segment. The qualitative adjustments to the historical loss experience are established by applying a loss percentage to the loan segments identified by management based on their assessment of shared risk characteristics within groups of similar loans. Qualitative factors are determined based on management’s continuing evaluation of inputs and assumptions underlying the quality of the loan portfolio. Management evaluates qualitative factors, primarily considering national, regional and local economic trends and conditions; concentrations of credit; trends in delinquencies, nonaccrual loans, and loss rates; trends in volume and terms of loans; effects of changes in risk selection, underwriting standards, and lending policies; experience of lending officers, other lending staff and loan review; and legal, regulatory and collateral factors. Management exercised significant judgment when assessing the qualitative factors in estimating the allowance for loan losses. We identified the assessment of the qualitative factors as a critical audit matter as auditing the qualitative factors involved especially complex and subjective auditor judgment in evaluating management’s assessment of the inherently subjective estimates. How We Addressed the Matter in Our AuditThe primary audit procedures we performed to address this critical audit matter included: ●Testing the effectiveness of controls over the evaluation of qualitative factors, including management's development and review of the data inputs used as the basis for the allocation factors and management's review and approval of the reasonableness of the assumptions used to develop the qualitative adjustments ●Substantively testing management’s process, including evaluating their judgments and assumptions for developing the qualitative factors, which included:●Evaluating the completeness and accuracy of data inputs used as a basis for the qualitative factors.●Evaluating the reasonableness of management’s judgments related to the determination of qualitative factors.●Evaluating the qualitative factors for directional consistency and for reasonableness.●Testing the mathematical accuracy of the allowance calculation, including the application of the qualitative factors./s/ YOUNT, HYDE & BARBOUR, P.C.We have served as the Company's auditor since 2002.Richmond, VirginiaMarch 14, 2023REPORT OF INDEPENDENT REGISTERED PUBLIC ACCOUNTING FIRMTo the Board of Directors and ShareholdersAmerican National Bankshares Inc.Danville, VirginiaOpinion on the Internal Control over Financial ReportingWe have audited American National Bankshares Inc. and Subsidiary’s (the Company) internal control over financial reporting as of December 31, 2022, based on criteria established in Internal Control — Integrated Framework issued by the Committee of Sponsoring Organizations of the Treadway Commission in 2013. In our opinion, the Company maintained, in all material respects, effective internal control over financial reporting as of December 31, 2022, based on criteria established in Internal Control — Integrated Framework issued by the Committee of Sponsoring Organizations of the Treadway Commission in 2013.We have also audited, in accordance with the standards of the Public Company Accounting Oversight Board (United States) (PCAOB), the consolidated balance sheets as of December 31, 2022 and 2021, the related consolidated statements of income, comprehensive income, changes in shareholders’ equity and cash flows for each of the three years in the period ended December 31, 2022, and the related notes to the consolidated financial statements of the Company and our report dated March 14, 2023 expressed an unqualified opinion.Basis for OpinionThe Company’s management is responsible for maintaining effective internal control over financial reporting and for its assessment of the effectiveness of internal control over financial reporting in the accompanying Management’s Annual Report on Internal Control over Financial Reporting. Our responsibility is to express an opinion on the Company’s internal control over financial reporting based on our audit. We are a public accounting firm registered with the PCAOB and are required to be independent with respect to the Company in accordance with U.S. federal securities laws and the applicable rules and regulations of the Securities and Exchange Commission and the PCAOB.We conducted our audit in accordance with the standards of the PCAOB. Those standards require that we plan and perform the audit to obtain reasonable assurance about whether effective internal control over financial reporting was maintained in all material respects. Our audit included obtaining an understanding of internal control over financial reporting, assessing the risk that a material weakness exists, and testing and evaluating the design and operating effectiveness of internal control based on the assessed risk. Our audit also included performing such other procedures as we considered necessary in the circumstances. We believe that our audit provides a reasonable basis for our opinion.Definition and Limitations of Internal Control over Financial ReportingA company's internal control over financial reporting is a process designed to provide reasonable assurance regarding the reliability of financial reporting and the preparation of financial statements for external purposes in accordance with generally accepted accounting principles. A company's internal control over financial reporting includes those policies and procedures that (1) pertain to the maintenance of records that, in reasonable detail, accurately and fairly reflect the transactions and dispositions of the assets of the company; (2) provide reasonable assurance that transactions are recorded as necessary to permit preparation of financial statements in accordance with generally accepted accounting principles, and that receipts and expenditures of the company are being made only in accordance with authorizations of management and directors of the company; and (3) provide reasonable assurance regarding prevention or timely detection of unauthorized acquisition, use or disposition of the company's assets that could have a material effect on the financial statements.Because of its inherent limitations, internal control over financial reporting may not prevent or detect misstatements. Also, projections of any evaluation of effectiveness to future periods are subject to the risk that controls may become inadequate because of changes in conditions, or that the degree of compliance with the policies or procedures may deteriorate./s/ YOUNT, HYDE & BARBOUR, P.C.Richmond, VirginiaMarch 14, 2023American National Bankshares Inc.Consolidated Balance SheetsAs of December 31, 2022 and 2021(Dollars in thousands, except per share data) $ 32,207 $ 23,095 41,133 483,723 608,062 692,467 12,651 8,056 1,061 8,481 2,186,449 1,946,580 (19,555 ) (18,678 ) 2,166,894 1,927,902 32,900 34,182 1,382 1,382 27 143 85,048 85,048 3,367 4,627 29,692 29,107 51,478 36,384 $ 3,065,902 $ 3,334,597 $ 1,010,602 $ 1,009,081 1,585,726 1,881,272 2,596,328 2,890,353 370 41,128 100,531 — 28,334 28,232 19,165 20,092 2,744,728 2,979,805 — — 10,538 10,710 141,948 147,777 223,664 201,380 (54,976 ) (5,075 ) 321,174 354,792 $ 3,065,902 $ 3,334,597 The accompanying notes are an integral part of the consolidated financial statements.American National Bankshares Inc.Consolidated Statements of IncomeFor the Years Ended December 31, 2022, 2021, and 2020(Dollars in thousands, except per share data) $ 82,568 $ 87,040 $ 87,700 10,065 7,309 6,764 407 385 433 473 464 503 2,491 598 440 96,004 95,796 95,840 3,553 3,645 9,729 659 22 259 — 203 489 1,554 1,535 1,543 5,766 5,405 12,020 90,238 90,391 83,820 1,597 (2,825 ) 8,916 88,641 93,216 74,904 6,521 6,019 4,789 2,676 2,611 2,557 4,107 4,152 3,213 906 801 712 1,666 4,195 3,514 — 35 814 1,409 1,972 270 747 1,199 321 (228 ) (885 ) (110 ) 1,003 932 763 18,807 21,031 16,843 36,382 32,342 29,765 6,075 6,032 5,586 903 864 639 1,953 1,767 1,702 1,260 1,464 1,637 3,310 2,958 3,017 1,505 1,368 1,454 3 131 60 12,695 12,082 10,705 64,086 59,008 54,565 43,362 55,239 37,182 8,934 11,713 7,137 $ 34,428 $ 43,526 $ 30,045 $ 3.23 $ 4.00 $ 2.74 $ 3.23 $ 4.00 $ 2.73 10,672,314 10,873,817 10,981,623 10,674,613 10,877,231 10,985,790 The accompanying notes are an integral part of the consolidated financial statements.American National Bankshares Inc.Consolidated Statements of Comprehensive Income (Loss)For the Years Ended December 31, 2022, 2021, and 2020(Dollars in thousands) $ 34,428 $ 43,526 $ 30,045 (68,877 ) (12,236 ) 7,213 14,868 2,643 (1,557 ) — (35 ) (814 ) — 7 176 4,125 2,068 (2,210 ) (866 ) (434 ) 448 1,082 590 (413 ) (233 ) (115 ) 77 (49,901 ) (7,512 ) 2,920 $ (15,473 ) $ 36,014 $ 32,965 The accompanying notes are an integral part of the consolidated financial statements.American National Bankshares Inc.Consolidated Statements of Changes in Shareholders' EquityFor the Years Ended December 31, 2022, 2021, and 2020(Dollars in thousands, except per share data) $ 11,019 $ 158,244 $ 151,478 $ (483 ) $ 320,258 — — 30,045 — 30,045 — — — 2,920 2,920 (141 ) (4,840 ) — — (4,981 ) 3 40 — — 43 18 (18 ) — — — 27 1,424 — — 1,451 — — (11,842 ) — (11,842 ) 10,926 154,850 169,681 2,437 337,894 — — 43,526 — 43,526 — — — (7,512 ) (7,512 ) (266 ) (8,544 ) — — (8,810 ) 5 84 — — 89 24 (24 ) — — — 21 1,411 — — 1,432 — — (11,827 ) — (11,827 ) 10,710 147,777 201,380 (5,075 ) 354,792 — — 34,428 — 34,428 — — — (49,901 ) (49,901 ) (207 ) (7,298 ) — — (7,505 ) 1 11 — — 12 18 (18 ) — — — 16 1,476 — — 1,492 — — (12,144 ) — (12,144 ) $ 10,538 $ 141,948 $ 223,664 $ (54,976 ) $ 321,174 The accompanying notes are an integral part of the consolidated financial statements.American National Bankshares Inc.Consolidated Statements of Cash FlowsFor the Years Ended December 31, 2022, 2021, and 2020(Dollars in thousands) $ 34,428 $ 43,526 $ 30,045 1,597 (2,825 ) 8,916 2,246 2,243 2,188 (1,597 ) (5,236 ) (3,812 ) 1,260 1,464 1,637 1,646 1,846 1,186 — (35 ) (814 ) (1,666 ) (4,195 ) (3,514 ) 70,059 154,041 155,705 (60,973 ) (142,736 ) (165,755 ) (2 ) 111 (4 ) 228 885 110 1,492 1,432 1,451 (585 ) (625 ) (665 ) (385 ) 808 (640 ) (2,484 ) 245 (3,421 ) 2,677 146 (2,387 ) 47,941 51,095 20,226 — 561 5,811 120,052 192,672 208,429 (106,170 ) (433,690 ) (295,109 ) (4,595 ) 659 (85 ) — — 4,939 (238,993 ) 73,836 (186,635 ) 3,200 1,700 (2,300 ) 4 2,031 1 (1,196 ) (1,000 ) (2,694 ) 118 704 195 (227,580 ) (162,527 ) (267,448 ) 1,521 178,987 251,488 (295,496 ) 100,114 299,476 (40,758 ) (1,423 ) 2,076 100,531 — — — (7,500 ) — (12,144 ) (11,827 ) (11,842 ) (7,505 ) (8,810 ) (4,981 ) 12 89 43 (253,839 ) 249,630 536,260 (433,478 ) 138,198 289,038 506,818 368,620 79,582 $ 73,340 $ 506,818 $ 368,620 The accompanying notes are an integral part of the consolidated financial statements.American National Bankshares Inc.Notes to Consolidated Financial StatementsDecember 31, 2022, 2021, and 2020Note 1 – Summary of Significant Accounting PoliciesNature of Operations and ConsolidationThe consolidated financial statements include the accounts of American National Bankshares Inc. (the "Company") and its wholly owned subsidiary, American National Bank and Trust Company (the "Bank"). The Bank offers a wide variety of retail, commercial, secondary market mortgage lending, and trust and investment services which also include non-deposit products such as mutual funds and insurance policies.The preparation of consolidated financial statements in conformity with accounting principles generally accepted in the United States of America ("GAAP") requires management to make estimates and assumptions that affect the reported amounts of assets and liabilities and disclosure of contingent assets and liabilities at the date of the financial statements and the reported amounts of revenues and expenses during the reporting period. Actual results could differ from those estimates. Material estimates that are particularly susceptible to significant change in the near term relate to the determination of the allowance for loan losses, goodwill and intangible assets, and accounting for acquired loans with specific credit-related deterioration.The accompanying consolidated financial statements include financial information related to the Company and its majority-owned subsidiaries and those variable interest entities where the Company is the primary beneficiary, if any. In preparing the consolidated financial statements, all significant inter-company accounts and transactions have been eliminated. Assets held in an agency or fiduciary capacity are not included in the consolidated financial statements. Accounting guidance states that if a business enterprise is the primary beneficiary of a variable interest entity, the assets, liabilities, and results of the activities of the variable interest entity should be included in the consolidated financial statements of the business enterprise. An entity is deemed to be the primary beneficiary of a variable interest entity if that entity has both the power to direct the activities that most significantly impact its economic performance; and the obligation to absorb losses or the right to receive benefits that could potentially be significant to the variable interest entity. Refer to Note 11 for further details concerning variable interest entities.Cash and Cash EquivalentsCash includes cash on hand, cash with correspondent banks, and cash on deposit at the Federal Reserve Bank of Richmond. Cash equivalents are short-term, highly liquid investments that are readily convertible to cash with original maturities of three months or less and are subject to an insignificant risk of change in value. Cash and cash equivalents are carried at cost.Interest-bearing Deposits in Other BanksInterest-bearing deposits in other banks mature within one year and are carried at cost.SecuritiesCertain debt securities that management has the positive intent and ability to hold to maturity are classified as "held to maturity" and recorded at amortized cost. Trading securities are recorded at fair value with changes in fair value included in earnings. Debt securities not classified as held to maturity or trading are classified as "available for sale" and recorded at fair value, with unrealized gains and losses excluded from earnings and reported in other comprehensive income. Purchase premiums and discounts are recognized in interest income using the interest method over the terms of the securities or to the earliest call with premiums. Gains and losses on the sale of securities are recorded on the trade date and are determined using the specific identification method.The Company does not currently have any securities in held to maturity or trading and has no plans to add any to either category. Management evaluates securities for other-than-temporary impairment ("OTTI") on at least a quarterly basis, and more frequently when economic or market conditions warrant such an evaluation. For securities in an unrealized loss position, management considers the extent and duration of the unrealized loss and the financial condition and near-term prospects of the issuer. Management also assesses whether it intends to sell, or it is more likely than not that it will be required to sell, a security in an unrealized loss position before recovery of its amortized cost basis. If either of the criteria regarding intent or requirement to sell is met, the entire difference between amortized cost and fair value is recognized as impairment through earnings. For debt securities that do not meet the aforementioned criteria, the amount of impairment is split into two components as follows: (1) OTTI related to credit loss, which must be recognized in the income statement and, (2) OTTI related to other factors, which is recognized in other comprehensive income. The credit loss is defined as the difference between the present value of the cash flows expected to be collected and the amortized cost basis.Equity securities with readily determinable fair values are carried at fair value with changes in fair value included in noninterest income.Due to the nature and restrictions placed on the Company's investment in common stock of the Federal Home Loan Bank of Atlanta ("FHLB") and the Federal Reserve Bank of Richmond, these securities have been classified as restricted equity securities and carried at cost.52Loans Held for SaleSecondary market mortgage loans are designated as held for sale at the time of their origination. These loans are pre-sold with servicing released and the Company does not retain any interest after the loans are sold. These loans consist primarily of fixed-rate, single-family residential mortgage loans which meet the underwriting characteristics of certain government-sponsored enterprises (conforming loans). In addition, the Company requires a firm purchase commitment from a permanent investor before a loan can be committed, thus limiting interest rate risk. Loans held for sale are carried at fair value. Gains on sales of loans are recognized at the loan closing date and are included in noninterest income.Derivative Loan CommitmentsThe Company enters into mortgage loan commitments whereby the interest rate on the loan is determined prior to funding (rate lock commitments). Mortgage loan commitments are referred to as derivative loan commitments if the loan that will result from exercise of the commitment will be held for sale upon funding. Loan commitments that are derivatives are recognized at fair value on the consolidated balance sheets with net changes in their fair values recorded in other expenses. The period of time between issuance of a loan commitment and sale of the loan generally ranges from 30 to 60 days. The Company protects itself from changes in interest rates through the use of best efforts forward delivery contracts, by committing to sell a loan at the time the borrower commits to an interest rate with the intent that the buyer has assumed the interest rate risk on the loan. As a result, the Company is not generally exposed to significant losses nor will it realize significant gains related to its rate lock commitments due to changes in interest rates. The correlation between the rate lock commitments and the best efforts contracts is very high due to their similarity.The fair value of rate lock commitments and best efforts contracts is not readily ascertainable with precision because rate lock commitments and best efforts contracts are not actively traded in stand-alone markets. The Company determines the fair value of rate lock commitments and best efforts contracts by measuring the change in the estimated value of the underlying assets while taking into consideration the probability that the loans will be funded.Loans Held for InvestmentThe Company makes mortgage, commercial, and consumer loans. A substantial portion of the loan portfolio is secured by real estate. The ability of the Company's debtors to honor their contracts is dependent upon the real estate market and general economic conditions in the Company's market area.Loans that management has the intent and ability to hold for the foreseeable future or until maturity or pay-off generally are reported at their outstanding unpaid principal balance adjusted for the allowance for loan losses and any deferred fees or costs. Interest income is accrued on the unpaid principal balance. Loan origination fees, net of certain direct origination costs, are deferred and recognized as an adjustment of the related loan yield using the interest method. The accrual of interest on loans is generally discontinued at the time the loan is 90 days delinquent unless the credit is well-secured and in process of collection. Loans are typically charged off when the loan is 120 days past due, unless secured and in process of collection. Loans are placed on nonaccrual status or charged-off at an earlier date if collection of principal or interest is considered doubtful.Interest accrued but not collected for loans that are placed on nonaccrual status or charged-off is reversed against interest income. The interest on these loans is accounted for on the cash basis or cost recovery method until qualifying for return to accrual status. Loans are returned to accrual status when all the principal and interest amounts contractually due are brought current and future payments are reasonably assured.A loan is considered past due when a payment of principal or interest or both is due but not paid. Management closely monitors past due loans in timeframes of 30-59 days, 60-89 days, and 90 or more days past due.These policies apply to all loan portfolio classes and segments.Substandard and doubtful risk graded commercial, commercial real estate, and construction loans are reviewed for impairment. All troubled debt restructurings ("TDRs"), regardless of dollar amount, are also evaluated for impairment. A loan is considered impaired when, based on current information and events, it is probable that the Company will be unable to collect the scheduled payments of principal or interest when due according to the contractual terms of the loan agreement. Factors considered by management in determining impairment and establishing a specific allowance include payment status, collateral value, and the probability of collecting scheduled principal and interest payments when due. Loans that experience insignificant payment delays and payment shortfalls generally are not classified as impaired. Management determines the significance of payment delays and payment shortfalls on a case-by-case basis, taking into consideration all of the circumstances surrounding the loan and the borrower, including the length of the delay, the reasons for the delay, the borrower's prior payment record, and the amount of the shortfall in relation to the principal and interest owed. Impairment is measured on a loan-by-loan basis for commercial, commercial real estate, and construction loans by either the present value of expected future cash flows discounted at the loan's effective interest rate, the loan's obtainable market price, or the fair value of the collateral if the loan is collateral dependent.Generally, large groups of smaller balance homogeneous loans (residential real estate and consumer loans) are collectively evaluated for impairment. The Company's policy for recognizing interest income on impaired loans is consistent with its nonaccrual policy.53The Company's loan portfolio is organized by major segment. These include: commercial, commercial real estate, residential real estate and consumer loans. Each segment has particular risk characteristics that are specific to the borrower and the generic category of credit. Commercial loan repayments are highly dependent on cash flows associated with the underlying business and its profitability. They can also be impacted by changes in collateral values. Commercial real estate loans share the same general risk characteristics as commercial loans but are often more dependent on the value of the underlying real estate collateral and, when construction is involved, the ultimate completion of and sale of the project. Residential real estate loans are generally dependent on the value of collateral and the credit worthiness of the underlying borrower. Consumer loans are very similar in risk characteristics to residential real estate.In connection with mergers, certain loans were acquired which exhibited deteriorated credit quality since origination and for which the Company does not expect to collect all contractual payments. These purchased credit impaired loans are accounted for in accordance with Accounting Standards Codification ("ASC") 310-30,Receivables - Loans and Debt Securities Acquired with Deteriorated Credit Quality, and are recorded at the amount paid, such that there is no carryover of the seller's allowance for loan losses. After acquisition, losses are recognized by an increase in the allowance for loan losses.Such purchased credit impaired loans are accounted for individually or aggregated into pools of loans based on common risk characteristics such as, credit score, loan type, and date of origination. The Company estimates the amount and timing of expected cash flows for each loan or pool, and the expected cash flows in excess of amount paid is recorded as interest income over the remaining life of the loan or pool (accretable yield). The excess of the loan's or pool's contractual principal and interest over expected cash flows is not recorded (nonaccretable difference).Over the life of the loan or pool, expected cash flows continue to be estimated. If the present value of expected cash flows is less than the carrying amount,target to a loss is recorded as a provision for loan losses. If the present valueminimum Core EPS of expected cash flows is greater$2.63 or more than the carrying amount, it is recognized as part of future interest income.Troubled Debt RestructuringsIn situations where, for economic or legal reasons relatedtarget to a borrower's financial condition, management may grantmaximum of Core EPS of $2.83. The revised maximum incentive payment eligibility, in combination of cash and restricted stock grants, for 2023 was 33.75% of base salary for Messrs. Farrar, Martin, Jung, and Ms. Joyce.concession to the borrower that it would not otherwise consider, the related loan is classified as a TDR. Management strives to identify borrowers in financial difficulty early and work with them to modify their loan to more affordable terms before their loan reaches nonaccrual status. These modified terms may include rate reductions, principal forgiveness, payment forbearance and other actions intended to minimize the economic loss and to avoid foreclosure or repossession of the collateral. In cases where borrowers are granted new terms that provide for a reduction of either interest or principal, management measures any impairment on the restructuring as noted above for impaired loans. Allowance for Loan LossesThe purpose of the allowance for loan losses ("ALLL") is to provide for probable losses inherent in the loan portfolio. The allowance is increased by the provision for loan losses and by recoveries of previously charged-off loans. Loan charge-offs decrease the allowance.The goal of the Company is to maintain an appropriate, systematic, and consistently applied process to determine the amounts of the ALLL and the provision for loan loss expense.The Company uses certain practices to manage its credit risk. These practices include (1) appropriate lending limits for loan officers, (2) a loan approval process, (3) careful underwriting of loan requests, including analysis of borrowers, cash flows, collateral, and market risks, (4) regular monitoring of the portfolio, including diversification by type and geography, (5) review of loans by the Loan Review department, which operates independently of loan production (the Loan Review function consists of a co-sourced arrangement using both internal personnel and external vendors to provide the Company with a more robust review function of the loan portfolio), (6) regular meetings of the Credit Committees to discuss portfolio and policy changes and make decisions on large or unusual loan requests, and (7) regular meetings of the Asset Quality Committee which reviews the status of individual loans.Risk grades are assigned as part of the loan origination process. From time to time risk grades may be modified as warranted by the facts and circumstances surrounding the credit.Calculation and analysis of the allowance for loan losses is prepared quarterly by the Finance Department. The Company's Credit Committee, Risk and Compliance Committee, Audit Committee, and the Board of Directors review the allowance for adequacy.The Company's allowance for loan losses has two basic components: the formula allowance and the specific allowance. Each of these components is determined based upon estimates and judgments.The formula allowance uses historical loss experience as an indicator of future losses, along with various qualitative factors, including levels and trends in delinquencies, nonaccrual loans, charge-offs and recoveries, trends in volume and terms of loans, effects of changes in underwriting standards, experience of lending staff, economic conditions, and portfolio concentrations. In the formula allowance for commercial and commercial real estate loans, the historical loss rate is combined with the qualitative factors, resulting in an adjusted loss factor for each risk-grade category of loans. The period-end balances for each loan risk-grade category are multiplied by the adjusted loss factor. Allowance calculations for consumer loans are calculated based on historical losses for each product category without regard to risk grade. This loss rate is combined with qualitative factors resulting in an adjusted loss factor for each product category.54The specific allowance uses various techniques to arrive at an estimate of loss for specifically identified impaired loans. These include:•The present value of expected future cash flows discounted at the loan's effective interest rate. The effective interest rate on a loan is the rate of return implicit in the loan (that is, the contractual interest rate adjusted for any net deferred loan fees or costs and any premium or discount existing at the origination or acquisition of the loan);•The loan's observable market price; or•The fair value of the collateral, net of estimated costs to dispose, if the loan is collateral dependent.The use of these computed values is inherently subjective and actual losses could be greater or less than the estimates. No single statistic, formula, or measurement determines the adequacy of the allowance. Management makes subjective and complex judgments about matters that are inherently uncertain, and different amounts would be reported under different conditions or using different assumptions. For analytical purposes, management allocates a portion of the allowance to specific loan categories and specific loans. However, the entire allowance is used to absorb credit losses inherent in the loan portfolio, including identified and unidentified losses.The relationships and ratios used in calculating the allowance, including the qualitative factors, may change from period to period as facts and circumstances evolve. Furthermore, management cannot provide assurance that in any particular period the Company will not have sizeable credit losses in relation to the amount reserved. Management may find it necessary to significantly adjust the allowance, considering current factorspayout at the time.On January 1, 2023, maximum threshold for incentive payment eligibility under the Company adopted Accounting Standards Update ("ASU") No.2016-13, "Financial Instruments - Credit Losses (Topic 326): Measurementprogram. Accordingly, Messrs. Farrar, Martin, Jung, and Ms. Joyce received cash payments of Credit Losses on Financial Instruments." The new accounting standard replaced the methodology described above$128,996, $118,058, $104,288, and reflected in the calculations for the years ended December 31, 2022, 2021, and 2020. The current expected credit losses ("CECL") model methodology requires consideration of reasonable and supportable information to estimate losses over the life of the loan. Management estimates the Day 1 adjustment to be within a reasonable range of $4.0 to $6.0 million. Premises and EquipmentLand is carried at cost. Premises and equipment are stated at cost, less accumulated depreciation and amortization. Premises and equipment are depreciated over their estimated useful lives ranging from three years to thirty-nine years; leasehold improvements are amortized over the lives of the respective leases or the estimated useful lives of the improvements, whichever is less. Software is generally amortized over three years. Depreciation and amortization are recorded on the straight-line method.Costs of maintenance and repairs are charged to expense as incurred. Costs of replacing structural parts of major units are considered individually and are expensed or capitalized as the facts dictate. Gains and losses on routine dispositions are reflected in current operations.Goodwill and Intangible AssetsGoodwill represents the excess of the cost of an acquired entity over the fair value of the identifiable net assets acquired. The Company follows ASC 350, Intangibles - Goodwill and Other, which prescribes the accounting for goodwill and intangible assets subsequent to initial recognition. The Company performs its annual analysis as of June 30 each year. Goodwill is not amortized, but is subject to at least an annual assessment for impairment. Other acquired intangible assets with finite lives (such as core deposit intangibles) are initially recorded at estimated fair value and are amortized over their useful lives. Core deposit and other intangible assets are generally amortized using accelerated methods over their useful lives of five to ten years.LeasesThe Company determines if an arrangement is a lease at inception. All of the Company’s leases are currently classified as operating leases and are included in other assets and other liabilities on the Company’s Consolidated Balance Sheets. Periodic operating lease costs are recorded in occupancy expenses of premises on the Company's Consolidated Statements of Income.Right-of-use ("ROU") assets represent the Company’s right to use an underlying asset for the lease term, and lease liabilities represent the Company’s obligation to make lease payments arising from the lease arrangements. Operating lease ROU assets and liabilities are recognized at the lease commencement date based on the present value of the expected future lease payments over the remaining lease term. In determining the present value of future lease payments, the Company uses its incremental borrowing rate based on the information available at the lease commencement date. The operating ROU assets are adjusted for any lease payments made at or before the lease commencement date, initial direct costs, any lease incentives received and, for acquired leases, any favorable or unfavorable fair value adjustments. The present value of the lease liability may include the impact of options to extend or terminate the lease when it is reasonably certain that the Company will exercise such options provided in the lease terms. Lease expense is recognized on a straight-line basis over the expected lease term. Lease agreements that include lease and non-lease components, such as common area maintenance charges, are accounted for separately.Wealth Management AssetsSecurities and other property held by the wealth management segment in a fiduciary or agency capacity are not assets of the Company and are not included in the accompanying consolidated financial statements.55Other Real Estate Owned ("OREO")OREO represents real estate that has been acquired through loan foreclosures or deeds received in lieu of loan payments. Generally, such properties are appraised at the time acquired and are recorded at fair value less estimated selling costs. Subsequent to foreclosure, valuations are periodically performed by management, and the assets are carried at the lower of carrying amount or fair value less cost to sell. Revenue and expenses from operations and changes in the valuation allowance are included in noninterest expense.Bank Owned Life InsuranceIn connection with mergers, the Company has acquired bank owned life insurance ("BOLI"). The asset is reflected as the cash surrender value of the policies as provided by the insurer on a monthly basis.Transfers of Financial AssetsTransfers of financial assets are accounted for as sales when control over the assets has been surrendered. Control over transferred assets is deemed to be surrendered when (1) the assets have been isolated from the Company – put presumptively beyond reach of the transferor and its creditors, even in bankruptcy or other receivership, (2) the transferee obtains the right (free of conditions that constrain it from taking advantage of that right) to pledge or exchange the transferred assets, and (3) the Company does not maintain effective control over the transferred assets through an agreement to repurchase them before their maturity or the ability to unilaterally cause the holder to return specific assets.Income TaxesThe Company uses the balance sheet method to account for deferred income tax assets and liabilities. Under this method, the net deferred tax asset or liability is determined based on the tax effects of the temporary differences between the book and tax bases of the various balance sheet assets and liabilities and gives current recognition to changes in tax rates and laws.When tax returns are filed, it is highly certain that some positions taken would be sustained upon examination by the taxing authorities, while others are subject to uncertainty about the merits of the position taken or the amount of the position that would be ultimately sustained. The benefit of a tax position is recognized in the financial statements in the period during which, based on all available evidence, management believes it is more likely than not that the position will be sustained upon examination, including the resolution of appeals or litigation processes, if any. Tax positions taken are not offset or aggregated with other positions. Tax positions that meet the more-likely-than-not recognition threshold are measured as the largest amount of tax benefit that is more than 50 percent likely of being realized upon settlement with the applicable taxing authority. The portion of the benefits associated with tax positions taken that exceeds the amount measured as described above is reflected as a liability for unrecognized tax benefits in the accompanying consolidated balance sheet along with any associated interest and penalties that would be payable to the taxing authorities upon examination. The Company had no liability for unrecognized tax benefits as of December 31,2022 and 2021.Stock-Based CompensationStock compensation accounting guidance ASC 718,Compensation - Stock Compensation, requires that the compensation cost relating to share-based payment transactions be recognized in financial statements. That cost will be measured based on the grant date fair value of the equity or liability instruments issued. The stock compensation accounting guidance covers a wide range of share-based compensation arrangements including stock options, restricted share plans, performance-based awards, share appreciation rights, and employee share purchase plans.The stock compensation accounting guidance requires that compensation cost for all stock awards be calculated and recognized over the employees' service period, generally defined as the vesting period. For awards with graded-vesting, compensation cost is recognized on a straight-line basis over the requisite service period for the entire award. A Black-Scholes model is used to estimate the fair value of stock options, while the market price of the Company's common stock at the date of grant is used for restricted stock awards.Earnings Per Common ShareBasic earnings per common share represent income available to common shareholders divided by the average number of common shares outstanding during the period. Diluted earnings per common share reflect the impact of additional common shares that would have been outstanding if dilutive potential common shares had been issued, as well as any adjustment to income that would result from the assumed issuance. Potential common shares that may be issued by the Company consist solely of outstanding stock options and are determined using the treasury method. Nonvested shares of restricted stock are included in the computation of basic earnings per share because the holder has voting rights and shares in non-forfeitable dividends during the vesting period.Comprehensive IncomeComprehensive income is shown in a two statement approach; the first statement presents total net income and its components followed by a second statement that presents all the components of other comprehensive income which include unrealized gains and losses on available for sale securities, unrealized gains and losses on cash flow hedges, and changes in the funded status of the defined benefit postretirement plan.56Advertising and Marketing CostsAdvertising and marketing costs are expensed as incurred.Mergers and AcquisitionsBusiness combinations are accounted for under ASC 805,Business Combinations, using the acquisition method of accounting. The acquisition method of accounting requires an acquirer to recognize the assets acquired and the liabilities assumed at the acquisition date measured at their fair values as of that date. To determine the fair values, the Company relies on third party valuations, such as appraisals, or internal valuations based on discounted cash flow analyses or other valuation techniques. Under the acquisition method of accounting, the Company identifies the acquirer and the closing date and applies applicable recognition principles and conditions. Acquisition-related costs are costs the Company incurs to effect a business combination. Those costs include advisory, legal, accounting, valuation, and other professional or consulting fees. Some other examples of costs to the Company include systems conversions, integration planning consultants and advertising costs. The Company accounts for acquisition-related costs as expenses in the periods in which the costs are incurred and the services are received, with one exception. The costs to issue debt or equity securities is recognized in accordance with other applicable GAAP. These acquisition-related costs have been and will be included within the consolidated statements of income classified within the noninterest expense caption. There were no such acquisition related costs for the years ended December 31, 2022, 2021, or 2020.Derivative Financial InstrumentsThe Company uses derivatives primarily to manage risk associated with changing interest rates. The Company's derivative financial instruments consist of interest rate swaps that qualify as cash flow hedges of the Company's trust preferred capital notes. The Company recognizes derivative financial instruments at fair value as either an other asset or other liability in the consolidated balance sheets. The effective portion of the gain or loss on the Company's cash flow hedges is reported as a component of other comprehensive income, net of deferred income taxes, and is reclassified into earnings in the same period or periods during which the hedged transactions affect earnings.ReclassificationsCertain reclassifications have been made in prior years' financial statements to conform to classifications used in the current year. There were no material reclassifications.Recent Accounting PronouncementsDuring June 2016, the Financial Accounting Standards Board ("FASB") issued Accounting Standards Update ("ASU") 2016-13, "Financial Instruments – Credit Losses (Topic 326): Measurement of Credit Losses on Financial Instruments." The ASU, as amended, requires an entity to measure expected credit losses for financial assets carried at amortized cost based on historical experience, current conditions, and reasonable and supportable forecasts. Among other things, the ASU also amended the impairment model for available for sale securities and addressed purchased financial assets with deterioration. The Company adopted ASU 2016-13 as of January 1, 2023 in accordance with the required implementation date. The final adjustment is estimated to be within a reasonable range of $4.0 million to $6.0 million and consists of an adjustment to retained earnings, net of deferred income taxes, and adjustments to the allowance for credit losses on loans as well as an adjustment to the Company’s reserve for unfunded loan commitments. Subsequent to adoption, the Company will record adjustments to its allowances for credit losses and reserves for unfunded commitments through the provision for credit losses in the consolidated statements of income.The Company is utilizing a third-party model to tabulate its estimate of current expected credit losses. In accordance with ASC 326, the Company has segmented its loan portfolio based on similar risk characteristics. The Company primarily utilizes market data for its reasonable and supportable forecasting of current expected credit losses. To further adjust the allowance for credit losses for expected losses not already included within the quantitative component of the calculation, the Company may consider the following qualitative adjustment factors: risk selection and lending policies and procedures, economic trends, experience and depth of credit department management and staff, quality of loan review systems and changes in regulatory, legal and competition. The Company’s CECL implementation process was overseen by executive management and included an assessment of data availability and gap analysis, data collection, consideration and analysis of multiple loss estimation methodologies, an assessment of relevant qualitative factors and correlation analysis of multiple potential loss drivers and their impact on the Company’s historical loss experience. During 2022, the Company calculated its current expected credit losses model parallel to its incurred loss model in order to further refine the methodology and model. In addition, the Company engaged a third-party to perform a comprehensive model validation.Effective November 25, 2019, the SEC adopted Staff Accounting Bulletin (SAB) 119. SAB 119 updated portions of SEC interpretative guidance to align with FASB ASC 326, "Financial Instruments – Credit Losses." It covers topics including (1) measuring current expected credit losses; (2) development, governance, and documentation of a systematic methodology; (3) documenting the results of a systematic methodology; and (4) validating a systematic methodology.57In March 2020, FASB issued ASU 2020-04 "Reference Rate Reform (Topic 848): Facilitation of the Effects of Reference Rate Reform on Financial Reporting." These amendments provide temporary optional guidance to ease the potential burden in accounting for reference rate reform. The ASU provides optional expedients and exceptions for applying generally accepted accounting principles to contract modifications and hedging relationships, subject to meeting certain criteria, that reference LIBOR or another reference rate expected to be discontinued. It is intended to help stakeholders during the global market-wide reference rate transition period. The guidance is effective for all entities as of March 12, 2020 through December 31, 2022. Subsequently, in January 2021, the Financial Accounting Standards Board (FASB) issued Accounting Standards Update (ASU) No.2021-01 "Reference Rate Reform (Topic 848): Scope." This ASU clarifies that certain optional expedients and exceptions in Topic 848 for contract modifications and hedge accounting apply to derivatives that are affected by the discounting transition. The ASU also amends the expedients and exceptions in Topic 848 to capture the incremental consequences of the scope clarification and to tailor the existing guidance to derivative instruments affected by the discounting transition. An entity may elect to apply ASU No.2021-01 on contract modifications that change the interest rate used for margining, discounting, or contract price alignment retrospectively as of any date from the beginning of the interim period that includes March 12, 2020, or prospectively to new modifications from any date within the interim period that includes or is subsequent to January 7, 2021, up to the date that financial statements are available to be issued. An entity may elect to apply ASU No.2021-01 to eligible hedging relationships existing as of the beginning of the interim period that includes March 12, 2020, and to new eligible hedging relationships entered into after the beginning of the interim period that includes March 12, 2020. The Company adopted ASU on January 1, 2022 and identified and transitioned all loans directly or indirectly influenced by LIBOR as of December 31, 2022. The adoption of ASU 2020-04 did not have a material effect on the Company’s consolidated financial statements for the transition away from LIBOR for its loan and other financial instruments. In December 2022, the FASB issued ASU 2022-06, "Reference Rate Reform (Topic 848): Deferral of the Sunset Date of Topic 848". ASU 2022-06 extends the period of time preparers can utilize the reference rate reform relief guidance in Topic 848. The objective of the guidance in Topic 848 is to provide relief during the temporary transition period, so the FASB included a sunset provision within Topic 848 based on expectations of when the London Interbank Offered Rate ("LIBOR") would cease being published. In 2021, the UK Financial Conduct Authority (FCA) delayed the intended cessation date of certain tenors of USD LIBOR to June 30, 2023. The Company has assessed ASU 2022-06 and does not expect it to have a material impact to the Company's consolidated financial statements.To ensure the relief in Topic 848 covers the period of time during which a significant number of modifications may take place, the ASU defers the sunset date of Topic 848 from December 31, 2022, to December 31, 2024, after which entities will no longer be permitted to apply the relief in Topic 848. The ASU is effective for all entities upon issuance. The Company is assessing ASU 2022-06 and its impact on the Company’s transition away from LIBOR for its loan and other financial instruments. In March 2022, FASB issued Accounting Standards Update ASU No.2022-02, "Financial Instruments-Credit Losses (Topic 326), Troubled Debt Restructurings and Vintage Disclosures." ASU 2022-02 addresses areas identified by the FASB as part of its post-implementation review of the credit losses standard (ASU 2016-13) that introduced the CECL model. The amendments eliminate the accounting guidance for troubled debt restructurings by creditors that have adopted the CECL model and enhance the disclosure requirements for loan refinancings and restructurings made with borrowers experiencing financial difficulty. In addition, the amendments require a public business entity to disclose current-period gross write-offs for financing receivables and net investment in leases by year of origination in the vintage disclosures. The amendments in this ASU should be applied prospectively, except for the transition method related to the recognition and measurement of Troubled Debt Restructurings ("TDRs"), an entity has the option to apply a modified retrospective transition method, resulting in a cumulative-effect adjustment to retained earnings in the period of adoption. For entities that have adopted ASU 2016-13, ASU 2022-02 is effective for fiscal years beginning after December 15, 2022, including interim periods within those fiscal years. For entities that have not yet adopted ASU 2016-13, the effective dates for ASU 2022-02 are the same as the effective dates in ASU 2016-13. Early adoption is permitted if an entity has adopted ASU 2016-13. An entity may elect to early adopt the amendments about TDRs and related disclosure enhancements separately from the amendments related to vintage disclosures. The Company adopted this standard on January 1, 2023. The adoption of ASU No.2022-02 will not have a material affect on the Company's consolidated financial statements.Note 2 – Restrictions on CashThe Company is a member of the Federal Reserve System and prior to March 2020 was required to maintain certain levels of its cash and cash equivalents as reserves based on regulatory requirements. The gross reserve requirement and the required balances with the Federal Reserve Bank of Richmond were zero at December 31, 2022 and 2021, respectively. The Company maintains cash accounts in other commercial banks. The amount on deposit with correspondent institutions at December 31, 2022 exceeded the insurance limits of the FDIC by$2.3 million.58Note 3 - SecuritiesThe amortized cost and estimated fair value of investments in securities at December 31,2022 and 2021 were as follows (dollars in thousands): $ 152,033 $ — $ 12,606 $ 139,427 90,363 4 7,019 83,348 336,393 1 42,301 294,093 69,023 12 5,312 63,723 31,299 — 3,828 27,471 $ 679,111 $ 17 $ 71,066 $ 608,062 The Company had no equity securities at December 31, 2022 or December 31, 2021. December 31, 2021 $ 150,751 $ — $ 1,174 $ 149,577 104,518 993 931 104,580 357,981 2,854 4,525 356,310 65,939 1,021 488 66,472 15,450 218 140 15,528 $ 694,639 $ 5,086 $ 7,258 $ 692,467 The amortized cost and estimated fair value of investments in debt securities at December 31, 2022, by contractual maturity, are shown in the following table. Expected maturities will differ from contractual maturities because borrowers may have the right to call or prepay obligations with or without call or prepayment penalties. Because mortgage-backed securities have both known principal repayment terms as well as unknown principal repayments due to potential borrower pre-payments, it is difficult to accurately predict the final maturity of these investments. Mortgage-backed securities are shown separately (dollars in thousands): $ 44,859 $ 43,579 208,162 191,338 74,582 65,037 15,114 14,015 336,394 294,093 $ 679,111 $ 608,062 Gross realized gains and losses on, and the proceeds from the sale of, securities available for sale were as follows (dollars in thousands): $ — $ 35 $ 814 — — — — 561 5,811 Securities with a carrying value of approximately $118.9 million and $150.4 million at December 31, 2022 and 2021, respectively, were pledged to secure public deposits, repurchase agreements, and for other purposes as required by law. FHLB letters of credit were used as additional collateral in the amounts of $170.0 million at December 31, 2022 and $275.0 million at December 31,2021.59Temporarily Impaired SecuritiesThe following table shows estimated fair value and gross unrealized losses, aggregated by investment category and length of time that individual securities have been in a continuous unrealized loss position, at December 31, 2022. The reference point for determining when securities are in an unrealized loss position is month-end. Therefore, it is possible that a security's market value exceeded its amortized cost on other days during the past twelve-month period.Available for sale securities that have been in a continuous unrealized loss position are as follows (dollars in thousands): $ 139,427 $ 12,606 $ 10,824 $ 915 $ 128,603 $ 11,691 82,958 7,019 29,204 1,920 53,754 5,099 293,929 42,301 96,758 7,245 197,171 35,056 60,629 5,312 31,866 980 28,763 4,332 27,471 3,828 18,991 2,556 8,480 1,272 $ 604,414 $ 71,066 $ 187,643 $ 13,616 $ 416,771 $ 57,450 U.S. Treasury: The unrealized losses on the Company's investment in 22 U.S. Treasury securities were caused by normal market fluctuations. Nineteen of these securities were in an unrealized loss position for 12 months or more. The contractual terms of those investments do not permit the issuer to settle the securities at a price less than the amortized cost bases of the investments. Because the Company does not intend to sell the investments and it is not more likely than not that the Company will be required to sell the investments before recovery of their amortized cost bases, which may be maturity, the Company does not consider those investments to be other-than-temporarily impaired at December 31, 2022.Federal agencies and GSEs: The unrealized losses on the Company's investment in 43 government sponsored entities ("GSEs") were caused by normal market fluctuations. Twenty-one of these securities were in an unrealized loss position for 12 months or more. The contractual terms of those investments do not permit the issuer to settle the securities at a price less than the amortized cost bases of the investments. Because the Company does not intend to sell the investments and it is not more likely than not that the Company will be required to sell the investments before recovery of their amortized cost bases, which may be maturity, the Company does not consider those investments to be other-than-temporarily impaired at December 31, 2022.Mortgage-backed securities: The unrealized losses on the Company's investment in 138 GSE mortgage-backed securities were caused by normal market fluctuations. Twenty-one of these securities were in an unrealized loss position for 12 months or more. The contractual cash flows of those investments are guaranteed by an agency of the U.S. Government. Accordingly, it is expected that the securities would not be settled at a price less than the amortized cost bases of the Company's investments. Because the decline in market value is attributable to changes in interest rates and not credit quality, and because the Company does not intend to sell the investments and it is not more likely than not that the Company will be required to sell the investments before recovery of their amortized cost bases, which may be maturity, the Company does not consider those investments to be other-than-temporarily impaired at December 31, 2022.Collateralized Mortgage Obligations: The unrealized losses associated with 56 GSE collateralized mortgage obligations ("CMOs") were due to normal market fluctuations. Thirty-five of these securities were in an unrealized loss position for 12 months or more. The contractual cash flows of these investments are guaranteed by an agency of the U.S. Government. Accordingly, it is expected that the securities would not be settled at a price less than the amortized cost bases of the Company's investments. Because the decline in market value is attributable to changes in interest rates and not credit quality, and because the Company does not intend to sell the investments and it is not more likely than not that the Company will be required to sell the investments before recovery of its amortized cost bases, which may be maturity, the Company does not consider the investments to be other-than-temporarily impaired at December 31, 2022.State and municipal securities: The unrealized losses on 81 state and municipal securities were caused by normal market fluctuations. Forty-six of these securities were in an unrealized loss position for 12 months or more. These securities are of high credit quality (rated A- or higher), and principal and interest payments have been made timely. The contractual terms of these investments do not permit the issuer to settle the securities at a price less than the amortized cost bases of the investments. Because the Company does not intend to sell the investments and it is not more likely than not that the Company will be required to sell the investments before recovery of their amortized cost bases, which may be maturity, the Company does not consider these investments to be other-than-temporarily impaired at December 31, 2022.Corporate securities: The unrealized losses on 13 corporate securities were caused by normal market fluctuations and not credit deterioration. Fourof these securities were in an unrealized loss position for 12 months or more. These securities are not rated, but the Company conducted thorough internal credit reviews prior to purchase and conducts ongoing quarterly reviews of these companies as well, and the Company's analysis did not indicate the existence of credit loss. The contractual terms of these investments do not permit the issuer to settle the securities at a price less than the amortized cost basis of the investments. Because the Company does not intend to sell the investments and it is not more likely than not that the Company will be required to sell the investments before recovery of their amortized cost basis, which may be maturity, the Company does not consider those investments to be other-than-temporarily impaired at December 31, 2022.60Due to restrictions placed upon the Bank's common stock investment in the Federal Reserve Bank of Richmond and FHLB, these securities have been classified as restricted equity securities and carried at cost. These restricted securities are not subject to the investment security classification requirements and are included as a separate line item on the Company's consolidated balance sheet. Restricted equity securities consist of Federal Reserve Bank of Richmond stock in the amount of $6.5 million as of December 31, 2022 and 2021 and FHLB stock in the amount of $6.1 million and $1.6 million as of December 31, 2022 and 2021, respectively.The table below shows gross unrealized losses and fair value, aggregated by investment category and length of time that individual securities had been in a continuous unrealized loss position, at December 31,2021 (dollars in thousands): $ 149,577 $ 1,174 $ 149,577 $ 1,174 $ — $ — 73,640 931 63,042 512 10,598 419 253,444 4,525 213,292 3,014 40,152 1,511 26,646 488 23,341 354 3,305 134 7,611 140 7,611 140 — — $ 510,918 $ 7,258 $ 456,863 $ 5,194 $ 54,055 $ 2,064 Other-Than-Temporary-Impaired SecuritiesAs of December 31, 2022 and 2021, there were no securities classified as other-than-temporary impaired.Note 4 – LoansLoans, excluding loans held for sale, at December 31,2022 and 2021 were comprised of the following (dollars in thousands): $ 304,247 $ 299,773 197,525 134,221 418,462 391,517 827,728 731,034 338,132 289,757 93,740 93,203 6,615 7,075 $ 2,186,449 $ 1,946,580 Commercial includes approximately $74 thousand and $12.2 million in net PPP loans at December 31, 2022 and 2021, respectively. The PPP loan balances at December 31, 2022 and 2021 included $5 thousand and $282 thousand,$115,172, respectively in unamortized net PPP fees. Net deferred loan costs includedcash payments.the above loan categories are $202 thousand for 2022 and $616 thousand for 2021 in all other categories (excludes PPP fees and costs).Overdraft deposits were reclassified to consumer loans in the amount of $70 thousand and $90 thousand for 2022 and 2021, respectively.Acquired LoansThe outstanding principal balance and the carrying amount of these loans, including ASC 310-30 loans, included in the consolidated balance sheets at December 31,2022 and 2021 are as follows (dollars in thousands): $ 125,856 $ 163,574 120,432 156,975 61The outstanding principal balance and related carrying amount of purchased credit impaired loans, for which the Company applies ASC 310-30 to account for interest earned, at December 31,2022 and 2021 are as follows (dollars in thousands): $ 17,788 $ 24,696 13,541 19,802 The following table presents changes in the accretable yield on purchased credit impaired loans, for which the Company applies ASC 310-30, for the years ended December 31,2022,2021, and 2020 (dollars in thousands): $ 4,902 $ 6,513 $ 7,893 (2,186 ) (5,292 ) (3,553 ) 986 2,780 2,233 (172 ) 901 (60 ) $ 3,530 $ 4,902 $ 6,513 __________________________(1) This line item represents changes in the cash flows expected to be collected due to the impact of non-credit changes such as prepayment assumptions, changes in interest rates on variable rate acquired impaired loans, and discounted payoffs that occurred in the period.Past Due LoansThe following table shows an analysis by portfolio segment of the Company's past due loans at December 31,2022 (dollars in thousands): $ 161 $ — $ — $ 4 $ 165 $ 304,082 $ 304,247 — — — — — 197,525 197,525 724 268 — — 992 417,470 418,462 319 — — 301 620 827,108 827,728 664 90 — 797 1,551 336,581 338,132 104 — — 205 309 93,431 93,740 — — 16 — 16 6,599 6,615 $ 1,972 $ 358 $ 16 $ 1,307 $ 3,653 $ 2,182,796 $ 2,186,449 The following table shows an analysis by portfolio segment of the Company's past due loans at December 31,2021 (dollars in thousands): $ 120 $ — $ — $ 26 $ 146 $ 299,627 $ 299,773 — — — — — 134,221 134,221 — — — 12 12 391,505 391,517 — — — 1,093 1,093 729,941 731,034 670 20 154 792 1,636 288,121 289,757 12 30 47 80 169 93,034 93,203 6 — 15 3 24 7,051 7,075 $ 808 $ 50 $ 216 $ 2,006 $ 3,080 $ 1,943,500 $ 1,946,580 62Impaired LoansThe following table presents the Company's impaired loan balances by portfolio segment, excluding acquired impaired loans, at December 31,2022 (dollars in thousands): $ — $ — $ — $ — $ — — — — — — 2,420 2,420 — 1,454 108 1,360 1,359 — 1,186 40 1,149 1,156 — 935 21 165 165 — 93 — — — — — — $ 5,094 $ 5,100 $ — $ 3,668 $ 169 $ — $ — $ — $ 139 $ — — — — — — — — — — — — — — — — — — — 41 — — — — — — — — — 38 — $ — $ — $ — $ 218 $ — $ — $ — $ — $ 139 $ — — — — — — 2,420 2,420 — 1,454 108 1,360 1,359 — 1,186 40 1,149 1,156 — 976 21 165 165 — 93 — — — — 38 — $ 5,094 $ 5,100 $ — $ 3,886 $ 169 In the table above, recorded investment may be different than unpaid principal balance due to acquired loans with a premium or discount and loans with unearned costs or unearned fees.63The following table presents the Company's impaired loan balances by portfolio segment, excluding acquired impaired loans, at December 31,2021 (dollars in thousands): $ — $ — $ — $ 4 $ — — — — — — 8 5 — 71 1 1,185 1,186 — 1,107 23 1,021 1,031 — 1,217 41 4 4 — 5 1 — — — — — $ 2,218 $ 2,226 $ — $ 2,404 $ 66 $ 14 $ 7 $ 7 $ 25 $ 1 — — — — — — — — — — — — — 30 — — — — 61 2 — — — — — — — — — — $ 14 $ 7 $ 7 $ 116 $ 3 $ 14 $ 7 $ 7 $ 29 $ 1 — — — — — 8 5 — 71 1 1,185 1,186 — 1,137 23 1,021 1,031 — 1,278 43 4 4 — 5 1 — — — — — $ 2,232 $ 2,233 $ 7 $ 2,520 $ 69 In the table above, recorded investment may be different than unpaid principal balance due to acquired loans with a premium or discount and loans with unearned costs or unearned fees.64The following table shows the detail of loans modified as TDRs during the years ended December 31,2022,2021, and 2020, included in the impaired loan balances (dollars in thousands): — $ — $ — 1 2,420 2,420 — — — 1 109 109 — — — — — — 2 $ 2,529 $ 2,529 — $ — $ — — — — 1 1,093 1,093 — — — — — — — — — 1 $ 1,093 $ 1,093 1 $ 106 $ 106 — — — 2 1,311 1,311 1 82 82 1 6 6 — — — 5 $ 1,505 $ 1,505 All loans modified as TDRs during the years ended December 31,2022,2021, and 2020 were structure modifications. There was no impact to allowance for loan losses for the one real estate - owner-occupied TDR or the one residential real estate TDR in 2022. There was no impact to the allowance for loan losses for the one commercial real estate - non-owner occupied TDR in 2021. The impact on the allowance for loan losses for the commercial loan modified as a TDR in 2020 was $88 thousand. The impact on the allowance for loan losses for one of the commercial real estate - non-owner occupied loans modified as a TDR in 2020 was $138 thousand; there was no impact on the allowance for loan losses for the other commercial real estate - non-owner occupied loan. There was no impact on the allowance for loan losses for the residential real estate loan and the home equity loan modified as TDRs in 2020. For the year ended December 31, 2020, the impact on the allowance was due to specific reserves that were charged-off prior to year-end. During the year ended December 31,2022, the Company had one residential real estate loan with a recorded investment of $109 thousand that subsequently defaulted within 12 months of modification. During the year ended December 31, 2021, the Company had no loans that subsequently defaulted within 12 months of modification. During the year ended December 31, 2020, the Company had one commercial real estate - non-owner occupied loan with a recorded investment of $1.1 million that subsequently defaulted within 12 months of modification. The Company defines default as one or more payments that occur more than 90 days past the due date, charge-off, or foreclosure subsequent to modification. Any charge-offs resulting in default were adjusted through the allowance for loan losses.65The loan portfolio consists primarily of commercial and residential real estate loans, commercial loans to small and medium-sized businesses, construction and land development loans, and home equity loans. The Company had $715 thousand and $102 thousand in residential real estate loans in the process of foreclosure at December 31,2022 and December 31,2021, respectively, and had no residential OREO at December 31,2022 and December 31,2021, respectively.Risk RatingsThe following tables show the Company's loan portfolio broken down by internal risk grading as of December 31,2022 (dollars in thousands):Commercial and Consumer Credit ExposureCredit Risk Profile by Internally Assigned Grade $ 288,041 $ 197,331 $ 405,223 $ 826,844 $ 333,124 $ 93,062 10,657 — 2,388 239 1,577 — 5,548 194 10,851 645 3,431 678 1 — — — — — $ 304,247 $ 197,525 $ 418,462 $ 827,728 $ 338,132 $ 93,740 Consumer Credit ExposureCredit Risk Profile Based on Payment Activity $ 6,599 16 $ 6,615 Loans classified in the Pass category typically are fundamentally sound, and risk factors are reasonable and acceptable.Loans classified in the Special Mention category typically have been criticized internally, by loan review or the loan officer, or by external regulators under the current credit policy regarding risk grades.Loans classified in the Substandard category typically have a well-defined weakness or weaknesses that jeopardize the liquidation of the debt; they are typically characterized by the possibility that the Bank will sustain some loss if the deficiencies are not corrected.Loans classified in the Doubtful category typically have all the weaknesses inherent in loans classified as substandard, plus the added characteristic the weaknesses make collection or liquidation in full on the basis of currently existing facts, conditions, and values highly questionable and improbable. However, these loans are not yet rated as loss because2015, certain events may occur that may salvage the debt.Consumer loans are classified as performing or nonperforming. A loan is nonperforming when payments of interest and principal are past due 90 days or more.66The following tables show the Company's loan portfolio broken down by internal risk grading as of December 31,2021 (dollars in thousands):Commercial and Consumer Credit ExposureCredit Risk Profile by Internally Assigned Grade $ 290,823 $ 130,111 $ 372,177 $ 720,138 $ 285,188 $ 92,807 8,333 2,881 11,048 8,702 1,774 — 617 1,229 8,292 2,194 2,795 396 — — — — — — $ 299,773 $ 134,221 $ 391,517 $ 731,034 $ 289,757 $ 93,203 Consumer Credit ExposureCredit Risk Profile Based on Payment Activity $ 7,057 18 $ 7,075 Note 5 – Allowance for Loan Losses and Reserve for Unfunded Lending CommitmentsChanges in the allowance for loan losses and the reserve for unfunded lending commitments (included in other liabilities) for each of the years in the three-year period ended December 31,2022, are presented below (dollars in thousands): $ 18,678 $ 21,403 $ 13,152 1,597 (2,825 ) 8,916 (1,019 ) (146 ) (1,006 ) 299 246 341 $ 19,555 $ 18,678 $ 21,403 $ 386 $ 304 $ 329 (9 ) 82 (25 ) — — — $ 377 $ 386 $ 304 67The reserve for unfunded loan commitments is included in other liabilities, and the provision for unfunded commitments is included in noninterest expense. The following table presents the Company's allowance for loan losses by portfolio segment and the related loan balance total by segment for the year ended December 31,2022 (dollars in thousands): $ 2,668 $ 1,397 $ 3,964 $ 7,141 $ 3,458 $ 50 $ 18,678 (357 ) — — (436 ) (5 ) (221 ) (1,019 ) 121 — 20 3 41 114 299 442 399 (199 ) 476 373 106 1,597 $ 2,874 $ 1,796 $ 3,785 $ 7,184 $ 3,867 $ 49 $ 19,555 $ — $ — $ — $ — $ — $ — $ — 2,873 1,772 3,762 7,184 3,822 49 19,462 1 24 23 — 45 — 93 $ 2,874 $ 1,796 $ 3,785 $ 7,184 $ 3,867 $ 49 $ 19,555 $ — $ — $ 2,420 $ 1,360 $ 1,314 $ — $ 5,094 304,240 196,357 408,656 824,153 427,809 6,599 2,167,814 7 1,168 7,386 2,215 2,749 16 13,541 $ 304,247 $ 197,525 $ 418,462 $ 827,728 $ 431,872 $ 6,615 $ 2,186,449 __________________________(1) Includes PPP loans, which are guaranteed by the SBA and have no related allowance.The following table presents the Company's allowance for loan losses by portfolio segment and the related loan balance total by segment for the year ended December 31,2021 (dollars in thousands): $ 3,373 $ 1,927 $ 4,340 $ 7,626 $ 4,067 $ 70 $ 21,403 — — (3 ) — (53 ) (90 ) (146 ) 40 — 7 8 99 92 246 (745 ) (530 ) (380 ) (493 ) (655 ) (22 ) (2,825 ) $ 2,668 $ 1,397 $ 3,964 $ 7,141 $ 3,458 $ 50 $ 18,678 $ 7 $ — $ — $ — $ — $ — $ 7 2,642 1,365 3,767 6,778 3,402 50 18,004 19 32 197 363 56 — 667 $ 2,668 $ 1,397 $ 3,964 $ 7,141 $ 3,458 $ 50 $ 18,678 $ 14 $ — $ 8 $ 1,185 $ 1,025 $ — $ 2,232 299,470 133,984 382,562 724,180 377,290 7,060 1,924,546 289 237 8,947 5,669 4,645 15 19,802 $ 299,773 $ 134,221 $ 391,517 $ 731,034 $ 382,960 $ 7,075 $ 1,946,580 (1) Includes PPP loans, which are guaranteed by the SBA and have no related allowance.68The allowance for loan losses is allocated to loan segments based upon historical loss factors, risk grades on individual loans, portfolio analysis of smaller balance, homogenous loans, and qualitative factors. Qualitative factors include trends in delinquencies, nonaccrual loans, and loss rates; trends in volume and terms of loans, effects of changes in risk selection, underwriting standards, and lending policies; experience of lending officers, other lending staff and loan review; national, regional, and local economic trends and conditions; legal, regulatory and collateral factors; and concentrations of credit.The provision expense recorded for the year ended December 31, 2022 was necessitated in large part by loan growth. For the year ended December 31, 2021, the Company recorded a negative provision (recovery) as the credit issues anticipated in 2020 did not materialize and the economic landscape improved substantially. Management will continue to evaluate the adequacy of the Company's allowance for loan losses as more economic data becomes available and as changes within the Company's loan portfolio are known. Changes in economic conditions may require further changes in the level of allowance.Note 6 – Premises and EquipmentMajor classifications of premises and equipment at December 31,2022 and 2021 are summarized as follows (dollars in thousands): $ 9,308 $ 9,489 32,515 32,475 1,536 1,524 19,379 18,494 62,738 61,982 (29,838 ) (27,800 ) $ 32,900 $ 34,182 Depreciation expense was $2.2 million for the years ended December 31,2022 and 2021 and $2.0 million in 2020.Note 7 – Goodwill and Other Intangible AssetsThe Company records as goodwill the fair value of the consideration transferred, plus the fair value of any noncontrolling interests in the acquiree, over the fair value of the net assets acquired and liabilities assumed as of the acquisition date. Impairment testing is performed annually, as well as when an event triggering impairment may have occurred. In testing goodwill for impairment, the Company must first decide if circumstances lead to a determination that it is not more likely than not that the fair value of a reporting unit is less than its carrying value. If, after assessing, it concludes that it is not more likely than not that the fair value of a reporting unit is greater than its carrying value, then no further testing is required and the goodwill is not impaired. In the wake of the COVID-19 pandemic, the Company determined a triggering event had occurred and evaluated goodwill each of the four quarters of 2020 and no indicators of impairment were noted. The Company performed its annual analysis for the years ended December 31, 2022 and 2021, respectively, and no indications of impairment were noted.Core deposit intangibles resulting from the MidCarolina Financial Corporation ("MidCarolina") acquisition in July 2011 were $6.6 million and became fully amortized at June 30, 2020. Core deposit intangibles resulting from the MainStreet Bankshares, Inc. acquisition in January 2015 were $1.8 million and are being amortized on an accelerated basis over 120 months. Core deposit intangibles resulting from the acquisition of HomeTown Bankshares Corporation ("Hometown") in April 2019 were $8.2 million and are being amortized on an accelerated basis over 120 months.The changes in the carrying amount of goodwill and intangibles for the twelve months ended December 31,2022, are as follows (dollars in thousands): $ 85,048 $ 4,627 — (1,260 ) $ 85,048 $ 3,367 69Goodwill and intangible assets at December 31,2022 and 2021 were as follows (dollars in thousands): $ 19,708 $ (16,341 ) $ 3,367 85,048 — 85,048 $ 19,708 $ (15,081 ) $ 4,627 85,048 — 85,048 Amortization expense of core deposit intangibles for the years ended December 31,2022,2021, and 2020 was $1.3 million, $1.5 million, and $1.6 million, respectively. As of December 31,2022, the estimated future amortization expense of core deposit intangibles is as follows (dollars in thousands): $ 1,069 800 617 454 427 $ 3,367 Note 8 – LeasesThe right-of-use assets and lease liabilities relate to banking offices and other space occupied by the Company under noncancelable operating lease agreements. The aggregate right-of-use assets and lease liabilities are included in other assets and other liabilities, respectively, in the Company's consolidated balance sheets. Lease liabilities represent the Company's obligation to make lease payments and are presented at each reporting date as the net present value of the remaining contractual cash flows. Cash flows are discounted at the Company's incremental borrowing rate in effect at the commencement date of the lease. Right-of-use assets represent the Company's right to use the underlying asset for the lease term and are calculated as the sum of the lease liability and if applicable, prepaid rent, initial direct costs and any incentives received from the lessor.The Company's long-term lease agreements are classified as operating leases. Certain of these leases offer the option to extend the lease term, and the Company has included such extensions in its calculation of the lease liabilities to the extent the options are reasonably certain of being exercised. The lease agreements do not provide for residual value guarantees and have no restrictions or covenants that would impact dividends or require incurring additional financial obligations.The following tables present information about the Company's leases as of December 31, 2022 and 2021 and for the years ended December 31,2022,2021 and 2020 (dollars in thousands): $ 3,318 $ 4,023 $ 3,245 $ 3,939 6.77 6.92 3.16 % 3.09 % Year Ended Year Ended Year Ended $ 1,072 $ 1,069 $ 993 — — 3 $ 1,072 $ 1,069 $ 996 $ 1,083 $ 1,047 $ 959 70A maturity analysis of operating lease liabilities and reconciliation of the undiscounted cash flows to the total of operating lease liabilities is as follows (dollars in thousands): $ 1,002 573 516 279 208 1,142 $ 3,720 (402 ) $ 3,318 Lease expense, a component of occupancy and equipment expense, for the years ended December 31,2022 and 2021 totaled $1.3 million and December 31, 2020 totaled $1.2 million. The amounts recognized in lease expense include insurance, property taxes, and common area maintenance.Note 9 - DepositsThe aggregate amount of time deposits in denominations of $250,000 or more at December 31,2022 and 2021 was $89.8 million and $159.8 million, respectively.At December 31,2022, the scheduled maturities and amounts of certificates of deposits (included in interest-bearing deposits on the consolidated balance sheets) were as follows (dollars in thousands): $ 171,415 28,939 12,819 25,284 13,200 6,276 $ 257,933 There were no brokered time deposits at December 31,2022 or December 31,2021.Note 10 – Short-term BorrowingsShort-term borrowings consist of customer repurchase agreements, overnight borrowings from the FHLB, and federal funds purchased. The Company has federal funds lines of credit established with correspondent banks in the amount of $60 million and has access to the Federal Reserve Bank of Richmond's discount window. The Company has $220.8 million in collateral pledged to the Federal reserve discount window. Customer repurchase agreements are collateralized by securities of the U.S. Government, its agencies or GSEs. They mature daily. The interest rates are generally fixed but may be changed at the discretion of the Company. The securities underlying these agreements remain under the Company's control. FHLB overnight borrowings contain floating interest rates that may change daily at the discretion of the FHLB. Short-term borrowings consisted solely of the following at December 31,2022 and 2021 (dollars in thousands): Weighted Average Rate Weighted Average Rate $ 370 0.10 % $ 41,128 0.03 % 100,531 4.42 — — $ 100,901 4.40 % $ 41,128 0.03 % 71Note 11 – Long-term BorrowingsUnder the terms of its collateral agreement with the FHLB, the Company provides a blanket lien covering all of its residential first mortgage loans, second mortgage loans, home equity lines of credit, and commercial real estate loans. In addition, the Company pledges as collateral its capital stock in the FHLB and deposits with the FHLB. The Company has a line of credit with the FHLB equal to 30% of the Company's assets, subject to the amount of collateral pledged. As of December 31, 2022, $1.0 billion in eligible collateral was pledged under the blanket floating lien agreement which covers both short-term and long-term borrowings. FHLB availability based on pledged collateral at December 31, 2022 was $406.7 million, with $270.1 million remaining collateral eligible to be pledged.The Company had Junior Subordinated debt at December 31, 2022 and 2021, as noted below.In the regular course of conducting its business, the Company takes deposits from political subdivisions of the states of Virginia and North Carolina. At December 31,2022, the Bank's public deposits totaled $220.1 million. The Company is required to provide collateral to secure the deposits that exceed the insurance coverage provided by the FDIC. This collateral can be provided in the form of certain types of government or agency bonds or letters of credit from the FHLB. At December 31,2022, the Company had $170.0 million in letters of credit with the FHLB outstanding as well as $88.2 million in agency, state, and municipal securities to provide collateral for such deposits.Junior Subordinated DebtOn April 7, 2006, AMNB Statutory Trust I, a Delaware statutory trust and a wholly owned subsidiary of the Company, issued $20 million of preferred securities (the "Trust Preferred Securities") in a private placement pursuant to an applicable exemption from registration. The Trust Preferred Securities mature on June 30,2036, but may be redeemed at the Company's option beginning on September 30, 2011. Initially, the securities required quarterly distributions by the trust to the holder of the Trust Preferred Securities at a fixed rate of 6.66%. Effective September 30, 2011, the rate resets quarterly at the three-month LIBOR plus 1.35%. Distributions are cumulative and accrue from the date of original issuance but may be deferred by the Company from time to time for up to 20 consecutive quarterly periods. The Company has guaranteed the payment of all required distributions on the Trust Preferred Securities. The proceeds of the Trust Preferred Securities received by the trust, along with proceeds of $619 thousand received by the trust from the issuance of common securities by the trust to the Company, were used to purchase $20.6 million of the Company's junior subordinated debt securities (the "Trust Preferred Capital Notes"), issued pursuant to a junior subordinated debenture entered into between the Company and Wilmington Trust Company, as trustee. The proceeds of the Trust Preferred Securities were used to fund the cash portion of the merger consideration to the former shareholders of Community First Financial Corporation in connection with the Company's acquisition of that company, and for general corporate purposes.On July 1, 2011, in connection with the MidCarolina merger, the Company assumed $8.8 million in junior subordinated debentures to MidCarolina Trust I and MidCarolina Trust II, two separate unconsolidated Delaware statutory trusts (the "MidCarolina Trusts"), to fully and unconditionally guarantee the preferred securities issued by the MidCarolina Trusts. These long-term obligations, which currently qualify as Tier 1 capital, constitute a full and unconditional guarantee by the Company of the MidCarolina Trusts' obligations. The MidCarolina Trusts are not consolidated in the Company's financial statements.In accordance with ASC 810-10-15-14,Consolidation - Overall - Scope and Scope Exceptions, the Company did not eliminate through consolidation the Company's $619 thousand equity investment in AMNB Statutory Trust I or the $264 thousand equity investment in the MidCarolina Trusts. Instead, the Company reflected these equity investments in other assets in the Company's consolidated balance sheets. 72A description of the junior subordinated debt securities outstanding payable to the trusts is shown below (dollars in thousands): $ 20,619 $ 20,619 4,601 4,545 3,114 3,068 $ 28,334 $ 28,232 The principal amounts reflected above for the MidCarolina Trusts are net of fair value adjustments of $554 thousand and $495 thousand at December 31, 2022 and $610 thousand and $541 thousand at December 31, 2021, respectively. The original fair value adjustments of $1.2 million and $1.0 million were recorded as a result of the acquisition of MidCarolina on July 1, 2011, and are being amortized into interest expense over the remaining lives of the respective borrowings.Note 12 - Derivative Financial Instruments and Hedging ActivitiesThe Company uses derivative financial instruments ("derivatives") primarily to manage risks associated with changing interest rates. The Company's derivatives are hedging instruments in a qualifying hedge accounting relationship (cash flow or fair value hedge).The Company designates derivatives as cash flow hedges when they are used to manage exposure to variability in cash flows on variable rate borrowings such as the Company's Trust Preferred Capital Notes. The Company uses interest rate swap agreements as part of its hedging strategy by exchanging variable-rate interest payments on a notional amount equal to the principal amount of the borrowings for fixed-rate interest payments, with such interest rates set based on benchmarked interest rates.All interest rate swaps were entered into with counterparties that met the Company's credit standards and the agreements contain collateral provisions protecting the at-risk party. The Company believes that the credit risk inherent in these derivative contracts is not significant.Terms and conditions of the interest rate swaps vary and amounts receivable or payable are recognized as accrued under the terms of the agreements. The Company assesses the effectiveness of each hedging relationship on a periodic basis. In accordance with ASC 815,Derivatives and Hedging, the effective portions of the derivatives' unrealized gains or losses are recorded as a component of other comprehensive income. Based on the Company's assessment, its cash flow hedges are highly effective, but to the extent that any ineffectiveness exists in the hedge relationships, the amounts would be recorded in the Company's consolidated statements of income. $ 28,500 $ 3 $ 1,325 $ — $ 850 $ 28,500 $ 3 $ — $ 2,800 $ 4,050 In addition, the Company has commitments to fund certain mortgage loans (interest rate lock commitments) to be sold into the secondary market and forward commitments for the future delivery of mortgage loans to third party investors which are considered derivatives. It is the Company's practice to enter into forward commitments for the future delivery of residential mortgage loans when interest rate lock commitments are entered into in order to economically hedge the effect of change in interest rates resulting from its commitments to fund the loans. These mortgage banking derivatives are not designated in hedge relationships.Note 13 – Stock-Based CompensationThe Company's 2018 Stock Incentive Plan (the "2018 Plan") provides for the granting of restricted stock awards, incentive and non-statutory options, and other equity-based awards to employees and directors at the discretion of the Compensation Committee of the Board of Directors. The 2018 Plan authorizes the issuance of up to 675,000 shares of common stock. Stock OptionsAccounting guidance requires that compensation cost relating to share-based payment transactions be recognized in the financial statements with measurement based upon the fair value of the equity or liability instruments issued.A summary of stock option transactions for the year ended December 31,2022 is as follows: 4,863 $ 16.63 — — (713 ) 16.63 — — 4,150 $ 16.63 1.97 $ 84 4,150 $ 16.63 1.97 $ 84 The aggregate intrinsic value of stock options in the table above represents the total pre-tax intrinsic value (the amount by which the current fair value of the underlying stock exceeds the exercise price of the option) that would have been received by the option holders had all option holders exercised their options on December 31,2022. This amount changes based on changes in the fair value of the Company's common stock.The total proceeds of the in-the-money options exercised during the years ended December 31,2022,2021, and 2020 were $12 thousand, $89 thousand, and $43 thousand, respectively. Total intrinsic value of options exercised during the years ended December 31,2022,2021, and 2020 was $16 thousand, $96 thousand, and $42 thousand, respectively.There was no recognized or unrecognized stock compensation expense attributable to outstanding stock options at December 31, 2022 or 2021.No stock options were granted in 2022,2021 or 2020.Restricted StockThe Company from time-to-time grants shares of restricted stock to key employees and non-employee directors. These awards help align the interests of these employees and directors with the interests of the shareholders of the Company by providing economic value directly related to increases in the value of the Company's common stock. The value of the stock awarded is established as the fair market value of the stock at the time of the grant. The Company recognizes expense, equal to the total value of such awards, ratably over the vesting period of the stock grants. Restricted stock granted in 2022 cliff vests at the end of a 36-month period beginning on the date of grant. Nonvested restricted stock activity for the year ended December 31,2022 is summarized in the following table: Weighted 58,461 $ 31.71 33,363 35.18 (18,370 ) 31.23 (1,747 ) 34.12 71,707 33.39 74As of December 31,2022,2021, and 2020, there was $1.1 million, $782 thousand, and $797 thousand, respectively, in unrecognized compensation cost related to nonvested restricted stock granted under the 2018 Plan. This cost is expected to be recognized over the next 12 to 36 months. The share-based compensation expense for nonvested restricted stock was $889 thousand, $749 thousand, and $672 thousand during 2022,2021, and 2020, respectively.The Company offers its outside directors alternatives with respect to director compensation. For 2022,2021, and 2020 the regular quarterly board retainer could be received in the form of shares of immediately vested but restricted stock with a market value of $10,000. Monthly meeting fees could be received as $800 per meeting in cash or $1,000 in immediately vested but restricted stock. Only outside directors receive board fees. The Company issued 16,474, 20,474 and 27,986 shares and recognized share-based compensation expense of $603 thousand, $683 thousand, and $779 thousand during 2022,2021 and 2020, respectively.Note 14 – Income TaxesThe Company files income tax returns in the U.S. federal jurisdiction and the states of Virginia and North Carolina. With few exceptions, the Company is no longer subject to U.S. federal, state, and local income tax examinations by tax authorities for years prior to 2019.The components of the Company's net deferred tax assets were as follows (dollars in thousands): $ 4,226 $ 4,116 229 250 12 23 1,277 1,183 1,174 1,258 16 18 86 320 — 588 15,339 469 374 253 22,733 8,478 1,044 1,094 728 999 42 72 278 — 179 6 2,271 2,171 $ 20,462 $ 6,307 The provision for income taxes consists of the following (dollars in thousands): $ 9,319 $ 10,905 $ 7,777 (385 ) 808 (640 ) $ 8,934 $ 11,713 $ 7,137 75A reconcilement of the "expected" federal income tax expense to reported income tax expense is as follows (dollars in thousands): $ 9,106 $ 11,600 $ 7,808 10 8 31 (202 ) (198 ) (259 ) 308 326 207 (288 ) (23 ) (650 ) $ 8,934 $ 11,713 $ 7,137 Note 15 – Earnings Per Common ShareThe following shows the weighted average number of shares used in computing earnings per common share and the effect on the weighted average number of shares of potentially dilutive common stock. Potentially dilutive common stock had no effect on income available to common shareholders. Nonvested restricted shares are included in the computation of basic earnings per share as the holder is entitled to full shareholder benefits during the vesting period including voting rights and sharing in nonforfeitable dividends. 10,672,314 $ 3.23 10,873,817 $ 4.00 10,981,623 $ 2.74 2,299 — 3,414 — 4,167 (0.01 ) 10,674,613 $ 3.23 10,877,231 $ 4.00 10,985,790 $ 2.73 There were no outstanding stock options that were excluded from the calculation of diluted earnings per share because their effects were anti-dilutive in 2022,2021, and 2020.Note 16 – Off-Balance Sheet ActivitiesThe Company is party to credit-related financial instruments with off-balance sheet risk in the normal course of business to meet the financing needs of its customers. These financial instruments include commitments to extend credit and standby letters of credit. Such commitments involve, to varying degrees, elements of credit and interest rate risk in excess of the amount recognized in the consolidated balance sheets. The Company evaluates each customer's credit worthiness on a case-by-case basis. The amount of collateral obtained, if applicable, is based on management's credit evaluation of the customer.The Company's exposure to credit loss is represented by the contractual amount of these commitments. The Company follows the same credit policies in making commitments as it does for on-balance sheet instruments.The following off-balance sheet financial instruments whose contract amounts represent credit risk were outstanding at December 31,2022 and 2021 (dollars in thousands): $ 635,851 $ 654,436 12,897 10,201 1,920 10,891 Commitments to extend credit are agreements to lend to a customer as long as there is no violation of any condition established in the contract. These commitments generally consist of unused portions of lines of credit issued to customers. Commitments generally have fixed expiration dates or other termination clauses and may require payment of a fee. Since some of the commitments are expected to expire without being drawn upon, the total commitment amounts do not necessarily represent future cash requirements.76Standby letters of credit are conditional commitments issued by the Company to guarantee the performance of a customer to a third party. Those letters of credit are primarily issued to support public and private borrowing arrangements. The credit risk involved in issuing letters of credit is essentially the same as that involved in extending loans to customers.At December 31,2022, the Company had locked-rate commitments to originate mortgage loans amounting to approximately $1.9 million and loans held for sale of $1.1 million. Risks arise from the possible inability of counterparties to meet the terms of their contracts, though the Company has never experienced a failure of one of its counterparties to perform. If a loan becomes past due 90 days within 180 days of sale, the Company would be required to repurchase the loan.Note 17 – Related Party TransactionsIn the ordinary course of business, loans are granted to executive officers, directors, and their related entities. Management believes that all such loans are made on substantially the same terms, including interest rates and collateral, as those prevailing at the time for comparable loans to similar, unrelated borrowers, and do not involve more than a normal risk of collectability or present other unfavorable features. As of December 31,2022 and 2021,none of these loans was restructured, past due, or on nonaccrual status.An analysis of these loans for 2022 is as follows (dollars in thousands): $ 15,853 3,907 (1,816 ) 6,532 $ 24,476 __________________________(1) Includes loans to two new board members who joined the Company during the year.Related party deposits totaled $9.5 million at December 31,2022 and $10.9 million at December 31,2021.77Note 18 – Employee Benefit PlansDefined Benefit PlanThe Company previously maintained a non-contributory defined benefit pension plan which covered substantially all employees who were 21 years of age or older and who had at least one year of service. The Company froze its pension plan to new participants and converted its pension plan to a cash balance plan effective December 31, 2009. Each year, existing participants will receive, with some adjustments, income based on the yield of the 10 year U.S. Treasury Note in December of the preceding year. The Plan notified participants of the intent to apply for Internal Revenue Service approval to terminate the Pension Plan. Final determination can take 12-24 months for the projected benefit payments. Total projected payments of $3.3 million are estimated to be disbursed in 2023 or 2024. Information pertaining to the activity in the plan is as follows (dollars in thousands): $ 5,013 $ 5,821 $ 6,262 — — — 107 91 152 (1,403 ) (259 ) 814 (10 ) 6 44 (437 ) (646 ) (1,451 ) 3,270 5,013 5,821 5,045 4,701 5,915 (344 ) 190 237 — 800 — (437 ) (646 ) (1,451 ) 4,264 5,045 4,701 $ 994 $ 32 $ (1,120 ) $ 994 $ 32 $ (1,120 ) $ 400 $ 1,481 $ 2,071 (86 ) (320 ) (435 ) $ 314 $ 1,161 $ 1,636 $ — $ — $ — 107 91 152 (245 ) (230 ) (285 ) 112 195 352 145 182 140 $ 119 $ 238 $ 359 $ (1,082 ) $ (590 ) $ 413 — — — $ (1,082 ) $ (590 ) $ 413 $ (963 ) $ (352 ) $ 772 78The accumulated benefit obligation as of December 31,2022,2021, and 2020 was $3.3 million, $5.0 million, and $5.8 million, respectively. The rate of compensation increase is no longer applicable since the defined benefit plan was frozen and converted to a cash balance plan.The plan sponsor selected the expected long-term rate-of-return-on-assets assumption in consultation with their investment advisors and actuary. This rate was intended to reflect the average rate of earnings expected to be earned on the funds invested or to be invested to provide plan benefits. Historical performance is reviewed, especially with respect to real rates of return (net of inflation), for the major asset classes held or anticipated to be held by the trust, and for the trust itself. Undue weight is not given to recent experience that may not continue over the measurement period, with higher significance placed on current forecasts of future long-term economic conditions.Because assets are held in a qualified trust, anticipated returns are not reduced for taxes. Further, solely for this purpose, the plan is assumed to continue in force and not terminate during the period in which assets are invested. However, consideration is given to the potential impact of current and future investment policy, cash flow into and out of the trust, and expenses (both investment and non-investment) typically paid from plan assets (to the extent such expenses are not explicitly estimated within periodic cost).Below is a description of the plan's assets. The plan's weighted-average asset allocations by asset category are as follows as of December 31,2022 and 2021: 71.4 % 56.5 % 0.0 % 22.9 % 28.6 % 20.6 % 100.0 % 100.0 % The investment policy and strategy for plan assets can best be described as a growth and income strategy. Diversification is accomplished by limiting the holding of any one equity issuer to no more than 5% of total equities. Exchange traded funds are used to provide diversified exposure to the small capitalization and international equity markets. All fixed income investments are rated as investment grade, with the majority of these assets invested in corporate issues. The assets are managed by the Company's Trust and Investment Services Division. No derivatives are used to manage the assets. Equity securities do not include holdings in the Company.The fair value of the Company's pension plan assets at December 31,2022 and 2021, by asset category are as follows (dollars in thousands): $ 1,218 $ 1,218 $ — $ — 1,532 — 1,532 — 1,154 — 1,154 — 360 — 360 — $ 4,264 $ 1,218 $ 3,046 $ — 79 $ 1,042 $ 1,042 $ — $ — 469 — 469 — 2,067 — 2,067 — 312 — 312 — 964 964 — — 191 191 — — $ 5,045 $ 2,197 $ 2,848 $ — 401(k) PlanThe Company maintains a 401(k) plan that covers substantially all full-time employees of the Company. The Company matches a portion of the contribution made by employee participants after at least one year of service. The Company contributed $1.2 million, $1.1 million, and $1.0 million to the 401(k) plan in 2022,2021, and 2020, respectively. These amounts are included in employee benefits expense for the respective years.Deferred Compensation ArrangementsPrior to 2015, the Company maintained deferred compensation agreements with former employees providing for annual payments to each ranging from $25,000 to $50,000 per year for 10 years upon their retirement. The liabilities under these agreements were accrued over the officers' remaining periods of employment so that, on the date of their retirement, the then-present value of the annual payments had been accrued. As of December 31,2022, the Company only had one remaining agreement under which payments are being made to a former officer. The liabilities were $100 thousand and $150 thousand at December 31,2022 and 2021, respectively. There was no expense for this agreement for the years ended December 31,2022,2021, and 2020. As a result of acquisitions, the Company has various agreements with current and former employees and executives with balances of $5.4 million and $5.6 million at December 31,2022 and 2021, respectively that accrue through eligibility and are payable upon retirement. The Company recognized expenses of $159 thousand, $430 thousand and $422 thousand for the years ended December 31, 2022, 2021, and 2020, respectively.Certain named executive officers arebecame eligible to participate in a voluntary, nonqualified deferred compensation plan pursuant to which the officers may defer any portion of their annual cash incentive payments. The only eligible executive officer for 2023 was Mr. Jeffrey Haley. In addition, the Company may make discretionary cash bonus contributions to the deferred compensation plan. Such contributions, if any, are made on an annual basis after the Committee assesses the performance of each of the named executive officers and the Company during the most recently completed fiscal year. The contributions chargedgoal of the Committee is to salary expense were $86 thousand, $184 thousandaward such discretionary bonus payments commensurate with the officer's performance during such year.$0 for the years ended December 31,2022,2021Board of Directors, the Company's compensation practices do not encourage excessive or inappropriate risk taking and 2020, respectively.Incentive Arrangementscashproprietary interest in the Company as an incentive compensation planto contribute to the success of the Company, and reward employees for officers basedoutstanding performance and the attainment of goals. The 2018 Plan was adopted by the Board of Directors of the Company on February 20, 2018, approved by the shareholders on May 15, 2018 at the Company's performance2018 Annual Meeting and individual officer goals.expires on February 19, 2028. The total amount charged to salary expense for this plan was $5.1 million, $3.1 million and $1.2 million2018 Plan provides for the years ended granting of restricted stock awards, incentive and non-statutory stock options, restricted stock units and other stock-based awards to employees and directors, at the discretion of the Board or a Board designated committee. The 2018 Plan prohibits the payment of dividends or similar distributions on awards, whether subject to time-based or performance-based vesting, unless and until the vesting requirements have been met, and prohibits share recycling. The 2018 Plan authorizes the issuance of up to 675,000 shares of common stock and replaced the Company's 2008 Stock Incentive Plan ("2008 Plan") that expired February 18, 2018. As of December 31,2022,2021, and 2020, respectively. 2023, of the 675,000 shares authorized, 477,691 shares were available for granting purposes under the 2018 Plan.80
Note 19 – Fair Value Measurements
Fair Value Measurements at December 31, 2022 Using Quoted Prices Significant in Active Other Significant Balance as of Markets for Observable Unobservable December 31, Identical Assets Inputs Inputs Description 2022 Level 1 Level 2 Level 3 Assets: Securities available for sale: U.S. Treasury Federal agencies and GSEs Mortgage-backed and CMOs State and municipal Corporate Total securities available for sale Loans held for sale Derivative - cash flow hedges Fair Value Measurements at December 31, 2021 Using Quoted Prices Significant in Active Other Significant Balance as of Markets for Observable Unobservable December 31, Identical Assets Inputs Inputs Description 2021 Level 1 Level 2 Level 3 Assets: Securities available for sale: U.S. Treasury Federal agencies and GSEs Mortgage-backed and CMOs State and municipal Corporate Total securities available for sale Loans held for sale Liabilities: Derivative - cash flow hedgesDeterminationFair ValueThe Company uses fair value measurementsshares subject to record fair value adjustmentseach option, whether such options will be exercised by delivering other shares of common stock, and when such options become vested and exercisable. In general, the per share exercise price of an incentive stock option must be at least equal to certain assets and liabilities and to determine fair value disclosures. In accordance with the fair value measurements and disclosures topic of FASB ASC 825,Financial Instruments, the fairmarket value of a financial instrumentshare of common stock on the date the option is granted. Restricted stock is granted under terms and conditions established by the price that would be received to sell an asset or paid to transfer a liability (an exit price)Committee.principalmanner specified by the Committee. Each stock option or most advantageous market forportion thereof is exercisable at any time on or after it vests and is exercisable until ten years after its date of grant. No stock options can be backdated or repriced. As of December 31, 2023, there were no options outstanding or awarded under the asset or liability2018 Plan.an orderly transaction between market participants at the measurement date. Fair value is best determined based upon quoted market prices. However, in many instances, there are no quoted market prices forof the Company's various financial instruments. In cases where quoted market prices are not available, fair values are based on estimates using presentcommon stock. The value or other valuation techniques. Those techniques are significantly affected by the assumptions used, including the discount rate and estimates of future cash flows. Accordingly, the fair value estimates may not be realized in an immediate settlement of the instrument. The fair value guidance provides a consistent definition of fair value, which focuses on exit price in the principal or most advantageous market for the asset or liability in an orderly transaction (that is, not a forced liquidation or distressed sale) between market participants at the measurement date under current market conditions. If there has been a significant decrease in the volume and level of activity for the asset or liability, a change in valuation technique or the use of multiple valuation techniques may be appropriate. In such instances, determining the price at which willing market participants would transact at the measurement date under current market conditions depends on the facts and circumstances and requires the use of significant judgment. The fair value is a reasonable point within the range that is most representative of fair value under current market conditions.Fair Value HierarchyIn accordance with this guidance, the Company groups its financial assets and financial liabilities generally measured at fair value in three levels, based on the markets in which the assets and liabilities are traded and the reliability of the assumptions used to determine fair value.Level 1 –Valuation is based on quoted prices in active markets for identical assets and liabilities.Level 2 –Valuation is based on observable inputs including quoted prices in active markets for similar assets and liabilities, quoted prices for identical or similar assets and liabilities in less active markets, and model-based valuation techniques for which significant assumptions can be derived primarily from or corroborated by observable data in the market.Level 3 –Valuation is based on model-based techniques that use one or more significant inputs or assumptions that are unobservable in the market.The following describes the valuation techniques used by the Company to measure certain financial assets and liabilities recorded at fair value on a recurring basis in the financial statements:Securities available for sale: Securities available for sale are recorded at fair value on a recurring basis. Fair value measurement is based upon quoted market prices, when available (Level 1). If quoted market prices are not available, fair values are measured utilizing independent valuation techniques of identical or similar securities for which significant assumptions are derived primarily from or corroborated by observable market data. Third party vendors compile prices from various sources and may determine the fair value of identical or similar securities by using pricing models that consider observable market data (Level 2).Loans held for sale: Loans held for sale are carried at fair value. These loans currently consist of residential loans originated for sale in the secondary market. Fair valuestock awarded is based on the price secondary markets are currently offering for similar loans using observablefair market data which is not materially different than cost due to the short duration between origination and sale (Level 2). Gains and losses on the sale of loans are recorded in current period earnings as a component of mortgage banking income on the Company's consolidated statements of income.Derivative asset (liability) - cash flow hedges: Cash flow hedges are recorded at fair value on a recurring basis. Cash flow hedges are valued by a third party using significant assumptions that are observable in the market and can be corroborated by market data. All of the Company's cash flow hedges are classified as Level 2. Unvested at January 1, 2023 71,707 $ 33.36 Granted 32,554 $ 35.78 Vested (19,805 ) $ 33.73 Forfeited (1,878 ) $ 34.16 Unvested at December 31, 2023 82,578 $ 33.39 balancesterm of financial assets and liabilities measured at fair valuethe agreement will be automatically extended on a recurringdaily basis duringby one day so that there will always be at least two years remaining in the period (dollars in thousands): �� $ 139,427 $ — $ 139,427 $ — 83,348 — 83,348 — 294,093 — 294,093 — 63,723 — 63,723 — 27,471 — 27,471 — $ 608,062 $ — $ 608,062 $ — $ 1,061 $ — $ 1,061 $ — $ 1,325 $ — $ 1,325 $ — $ 149,577 $ — $ 149,577 $ — 104,580 — 104,580 — 356,310 — 356,310 — 66,472 — 66,472 — 15,528 — 15,528 — $ 692,467 $ — $ 692,467 $ — $ 8,481 $ — $ 8,481 $ — $ 2,800 $ — $ 2,800 $ — Certain assets are measured at fair valueterm of the agreement upon such extension. Each agreement for Messrs. Farrar, Martin, and Jung, and Ms. Joyce has an initial term of two years from its effective date, January 1, 2022, and expires on December 31, 2023, provided that on and after January 1, 2023, the term of the agreement will be automatically extended on a nonrecurringdaily basis by one day so that there will always be at least one year remaining in the term of the agreement upon such extension. The Company may give each of the officers notice of nonrenewal of their respective agreements at any time on or after January 1, 2023, and Mr. Jeffrey Haley's agreement will terminate two years after the date of such notice and Messrs. Farrar, Martin, and Jung, and Ms. Joyce's agreements will terminate one year after the date of such notice. Each of the agreements automatically terminate on the first day of the month immediately following the month in which the officer turns 67.GAAP. Adjustmentsthe terms and conditions of the applicable short-term and long-term cash and equity incentive plans of the Company. Any incentive-based compensation or award that an officer receives is subject to the fair value of these assets usually result from the application of lower-of-cost-or-market accounting or write-downs of individual assets.The following describes the valuation techniques usedclawback by the Company as may be required by applicable law or, if applicable, any stock exchange listing requirement and on such basis as the Company determines. Each officer is expected to measure certain assets recorded at fair value onmaintain a nonrecurring basis in the financial statements:Impaired loans: Loans are designated as impaired when, in the judgmentlevel of management based on current information and events, it is probable that all amounts due according to the contractual terms of the loan agreements will not be collected when due. The measurement of loss associated with impaired loans can be based on either the observable market price of the loan or the fair value of the collateral. Collateral may be in the form of real estate or business assets including equipment, inventory, and accounts receivable. The vast majorityshare ownership of the Company's collateralcommon stock in accordance with guidelines established by the Company.real estate. Theentitled as of the date of termination. In addition, subject to the officer's execution and non-revocation of a general release of claims, the Company will make a lump sum payment to the officer in an amount equal to the product of (x) the officer's "Total Annual Compensation" divided by 12 times (y) the number of months remaining between the date of termination and the last day of the then-current term of the agreement, including pro-rated credit for any partial month. As defined in the agreement for each officer, "Total Annual Compensation" means the sum of: (1) the officer's base salary in effect on the date of termination; (2) the greater of the officer's maximum annual bonus opportunity for the year in which the officer's employment terminates and the annual bonus earned for the most recently completed calendar year; (3) the grant date value of real estate collateralany equity awards granted to the officer over the 12 months immediately prior to the date of termination (the "prior 12 months"); (4) any tax-qualified or non-tax qualified plan contributions or allocations made on the officer's behalf over the prior 12 months; and (5) the value of any perquisites and other benefits, including the employer portion of benefit premiums, paid or made available to the officer or on the officer's behalf over the prior 12 months. Upon termination of employment under the above-described circumstances, Mr. Jeffrey Haley will be subject to certain non-competition and non-solicitation restrictions for 12 months, and Messrs. Farrar, Martin and Jung, and Ms. Joyce will be subject to certain non-competition restrictions for 6 months and non-solicitation restrictions for 12 months.determined utilizingterminated by him for Good Reason or by the Company on account of its failure to renew the agreement or without Cause, in each case within 24 months following the Change in Control, he will be entitled to receive, subject to his execution and non-revocation of a market valuation approachgeneral release of claims, a lump sum payment equal to the sum of: (1) any earned but unpaid incentive or bonus compensation with respect to any completed calendar year; (2) a pro-rated cash bonus amount based on an appraisal,his prior year's cash bonus amount; (3) any other benefits or awards which, pursuant to the terms of one yearany plans, policies or less, conducted by an independent, licensed appraiser using observable market data (Level 2). However, if the collateral is a house or building in the process of construction or if an appraisalprograms of the propertyCompany, have been earned or become payable but which have not been paid; and (4) an amount equal to either (A) 2.99 times Mr. Haley's Total Annual Compensation, or (B) if his employment terminates between his 65th birthday and the date he attains his U.S. Social Security Administration ("Social Security") normal retirement age, the product of (x) his Total Annual Compensation divided by 12 times (y) the number of months remaining between the date of termination and the date he attains his Social Security normal retirement age.more than one year old and not solelyterminated by him or her for Good Reason or by the Company on account of its failure to renew the agreement or without Cause, in each case within 24 months following the Change in Control, the officer will be entitled to receive, subject to execution of a general release of claims, a lump sum payment equal to the sum of: (1) any earned but unpaid incentive or bonus compensation with respect to any completed calendar year; (2) a pro-rated cash bonus amount based on observable market comparablesthe officer's prior year's cash bonus amount; (3) any other benefits or management determinesawards which, pursuant to the fair valueterms of any plans, policies or programs of the collateral is further impaired belowCompany, have been earned or become payable but which have not been paid to the appraised value, then a Level 3 valuation is consideredofficer; and (4) an amount equal to measure the fair value. The valueproduct of business equipment is based upon an outside appraisal,(x) the officer's Total Annual Compensation divided by 12 times (y) the lesser of one year or less, if deemed significant,24 or the net book value onnumber of months remaining between the applicable business's financial statements if not considered significant using observable market data. Likewise, values for inventorydate of termination and accounts receivables collateral are based on financial statement balancesthe date the officer attains his or aging reports (Level 3). Impaired loans allocated to the allowance for loan losses are measured at fair value on a nonrecurring basis. Any fair value adjustments are recorded in the period incurred as provision for loan losses on the consolidated statements of income.her Social Security normal retirement age.82
Other real estate owned: Measurement
The following table summarizes the Company's assets that were measured at fair value ondecision making with respect to executive compensation. To maintain flexibility in compensating executive officers in a nonrecurring basis duringmanner designed to promote varying corporate goals, the period (dollars in thousands):
Fair Value Measurements at December 31, 2022 Using | ||||||||||||||||
Quoted Prices | Significant | |||||||||||||||
in Active | Other | Significant | ||||||||||||||
Balance as of | Markets for | Observable | Unobservable | |||||||||||||
December 31, | Identical Assets | Inputs | Inputs | |||||||||||||
Description | 2022 | Level 1 | Level 2 | Level 3 | ||||||||||||
Assets: | ||||||||||||||||
Other real estate owned, net | $ | 27 | $ | - | $ | - | $ | 27 | ||||||||
Fair Value Measurements at December 31, 2021 Using | ||||||||||||||||
Quoted Prices | Significant | |||||||||||||||
in Active | Other | Significant | ||||||||||||||
Balance as of | Markets for | Observable | Unobservable | |||||||||||||
December 31, | Identical Assets | Inputs | Inputs | |||||||||||||
Description | 2021 | Level 1 | Level 2 | Level 3 | ||||||||||||
Assets: | ||||||||||||||||
Impaired loans, net of valuation allowance | $ | 7 | $ | — | $ | — | $ | 7 | ||||||||
Other real estate owned, net | 143 | — | — | 143 | ||||||||||||
Quantitative Information About Level 3 Fair Value Measurements as of December 31,2022 and 2021:
December 31, 2022 | December 31, 2021 | |||||||||
Assets | Valuation Technique | Unobservable Input | Range; Weighted Average | Range; Weighted Average | ||||||
Other real estate owned, net | Discounted appraised value | Selling cost | 8.00% | 8.00% | ||||||
FASB ASC 825,Financial Instruments, requires disclosure about fair value of financial instruments, including those financial assets and financial liabilities that are Committee has not required adopted a policy requiring all compensation to be measureddeductible. The Company did not have any nondeductible compensation in 2023.
Name and Principal Position | Year | Salary ($) | Bonus ($) (1) | Stock Awards ($) (2) | Non- Equity Incen- tive Plan Com- pen- sation ($) (3) | Change in Pension Value and Non- Qualified Deferred Compen- sation Earnings ($) (4) | All Other Compen- sation ($) (5) | Total ($) | ||||||||||||||||||||||
| Jeffrey V. Haley | 2023 | 599,039 | 90,000 | 182,250 | 243,000 | — | 2,692,006 | 3,806,295 | ||||||||||||||||||||||
Chairman, President and Chief | 2022 | 574,520 | 86,250 | 143,192 | 237,188 | — | 40,948 | 1,082,098 | ||||||||||||||||||||||
Executive Officer of | 2021 | 571,161 | 82,500 | 122,027 | 187,500 | — | 39,263 | 1,002,451 | ||||||||||||||||||||||
the Company and | ||||||||||||||||||||||||||||||
the Bank | ||||||||||||||||||||||||||||||
| Jeffrey W. Farrar | 2023 | 381,510 | 32,249 | 84,055 | 128,996 | — | 740,428 | 1,367,238 | ||||||||||||||||||||||
Senior Executive Vice | 2022 | 363,740 | — | 56,775 | 136,503 | — | 40,196 | 597,214 | ||||||||||||||||||||||
President and Chief | 2021 | 348,855 | 35,000 | 50,003 | 65,627 | — | 35,812 | 535,297 | ||||||||||||||||||||||
Operating and Chief | ||||||||||||||||||||||||||||||
Financial Officer of the | ||||||||||||||||||||||||||||||
Company and the Bank | ||||||||||||||||||||||||||||||
| Edward C. Martin | 2023 | 349,039 | — | 76,678 | 118,058 | — | 787,134 | 1,330,909 | ||||||||||||||||||||||
Senior Executive Vice | 2022 | 329,423 | — | 45,455 | 123,750 | — | 27,108 | 525,736 | ||||||||||||||||||||||
President and Chief | 2021 | 281,116 | 30,000 | 50,003 | 56,250 | — | 23,557 | 440,926 | ||||||||||||||||||||||
Administrative Officer of | ||||||||||||||||||||||||||||||
the Company and the Bank | ||||||||||||||||||||||||||||||
| Rhonda P. Joyce (6) | 2023 | 340,625 | — | 72,913 | 115,172 | — | 557,533 | 1,086,243 | ||||||||||||||||||||||
Executive Vice President | 2022 | 325,000 | — | 41,675 | 121,875 | — | 28,845 | 517,395 | ||||||||||||||||||||||
and Co-Head of Banking | 2021 | — | — | — | — | — | — | — | ||||||||||||||||||||||
- Commercial of the Bank | ||||||||||||||||||||||||||||||
| Alexander Jung (7) | 2023 | 308,654 | — | 66,661 | 104,288 | — | 419,252 | 898,855 | ||||||||||||||||||||||
Executive Vice President | 2022 | 300,000 | — | 36,002 | 91,950 | — | 24,944 | 452,896 | ||||||||||||||||||||||
and Co-Head of Banking | 2021 | — | — | — | — | — | — | — | ||||||||||||||||||||||
- Consumer and Financial | ||||||||||||||||||||||||||||||
Services of the Bank | ||||||||||||||||||||||||||||||
| (1) | The Human Resources and Compensation Committee assessed the performance of the eligible executive officer and the Company during the indicated year and awarded discretionary cash bonus payments commensurate with the officer's performance. For 2023, 2022, and 2021, the payments were made by contributions into an account established for the officer under the Company’s nonqualified deferred compensation plan for eligible executive officers of the Company. |
| (2) | Amounts shown represent the aggregate full grant date fair value of each award calculated in accordance with FASB ASC Topic 718. The assumptions made in the calculation of these amounts are contained in Note 13 to the Company's audited financial statements for the year ended December 31, 2023, included herein. |
| (3) | Represents cash award for individual and Company performance under the incentive program based upon achievement of specific goals approved by the Board. Achievement of specific goals and amounts of cash awards are determined by the Human Resources and Compensation Committee and submitted to the Board for approval. Participants have the option of taking a larger percentage in restricted stock and less in cash. |
| (4) | Because the pension plan was converted to a cash balance plan and frozen effective December 31, 2009, the assumptions used to determine the present value of accumulated benefit for each participant were changed so that the present value of accumulated benefit shown as of the end of that year was equal to the opening balance under the cash balance plan. This is the same amount that would have been payable under the prior plan had the participant terminated employment and elected a lump sum payment. There were no benefit increases for any participant attributable to the cash balance plan conversion. For the years ended December 31, 2023, 2022 and 2021, the present value of the accumulated benefits under such plan increased by $11,205, decreased by $81,231 and decreased by $379, respectively, for Mr. Haley, which amounts are not reflected in the table above. |
| (5) | Details of other compensation for each of the executive officers appear in the All Other Compensation table shown below. |
| (6) | Ms. Joyce was appointed an executive officer of the Bank on October 5, 2021 and was not a named executive officer for 2021. |
| (7) | Mr. Jung joined the Bank as an executive officer of the Bank on November 15, 2021 and was not a named executive officer for 2021. |
Name | Year | Company Contribution to 401(k) Plan ($) | Change In Control Payments ($) (1) | Other Benefits ($) (2) | Total ($) | |||||||||||||
| Jeffrey V. Haley | 2023 | 22,601 | 2,648,351 | 21,054 | 2,692,006 | |||||||||||||
| 2022 | 20,286 | — | 20,662 | 40,948 | ||||||||||||||
| 2021 | 19,654 | — | 19,609 | 39,263 | ||||||||||||||
| Jeffrey W. Farrar | 2023 | 15,845 | 702,205 | 22,378 | 740,428 | |||||||||||||
| 2022 | 19,322 | — | 20,874 | 40,196 | ||||||||||||||
| 2021 | 16,986 | — | 18,826 | 35,812 | ||||||||||||||
| Edward C. Martin | 2023 | 23,110 | 746,865 | 17,159 | 787,134 | |||||||||||||
| 2022 | 15,464 | — | 11,644 | 27,108 | ||||||||||||||
| 2021 | 14,559 | — | 8,998 | 23,557 | ||||||||||||||
| Rhonda P. Joyce | 2023 | 17,028 | 525,468 | 15,037 | 557,533 | |||||||||||||
| 2022 | 15,298 | — | 13,547 | 28,845 | ||||||||||||||
| 2021 | — | — | — | — | ||||||||||||||
| Alexander Jung | 2023 | 16,958 | 386,790 | 15,504 | 419,252 | |||||||||||||
| 2022 | 13,859 | — | 11,085 | 24,944 | ||||||||||||||
| 2021 | — | — | — | — | ||||||||||||||
| (1) | Includes the Change in Control Payments described in "Compensation Discussion and Analysis – Executive Employment Agreements and Change in Control Arrangements" beginning on page 14 as follows: Mr. Haley, $2,648,351, Mr. Farrar, $702,205, Mr. Martin, $746,865, Ms. Joyce, $525,468, and Mr. Jung, $386,790. |
| (2) | Other benefits include company paid insurance premiums for all named executive officers. |
Fair Value Measurements at December 31, 2022 Using | ||||||||||||||||||||
| Quoted Prices in Active Markets for Identical Assets | Significant Other Observable Inputs | Significant Unobservable Inputs | Fair Value | |||||||||||||||||
Carrying Value | Level 1 | Level 2 | Level 3 | Balance | ||||||||||||||||
Financial Assets: | ||||||||||||||||||||
Cash and cash equivalents | $ | 73,340 | $ | 73,340 | $ | — | $ | — | $ | 73,340 | ||||||||||
Securities available for sale | 608,062 | — | 608,062 | — | 608,062 | |||||||||||||||
Restricted stock | 12,651 | — | 12,651 | — | 12,651 | |||||||||||||||
Loans held for sale | 1,061 | — | 1,061 | — | 1,061 | |||||||||||||||
Loans, net of allowance | 2,166,894 | — | — | 2,096,480 | 2,096,480 | |||||||||||||||
Bank owned life insurance | 29,692 | — | 29,692 | — | 29,692 | |||||||||||||||
Derivative - cash flow hedges | 1,325 | — | 1,325 | — | 1,325 | |||||||||||||||
Accrued interest receivable | 7,255 | — | 7,255 | — | 7,255 | |||||||||||||||
Financial Liabilities: | ||||||||||||||||||||
Deposits | $ | 2,596,328 | $ | — | $ | 2,595,713 | $ | — | $ | 2,595,713 | ||||||||||
Repurchase agreements | 370 | — | 370 | — | 370 | |||||||||||||||
Other short-term borrowings | 100,531 | — | 100,531 | — | 100,531 | |||||||||||||||
Junior subordinated debt | 28,334 | — | — | 24,479 | 24,479 | |||||||||||||||
Accrued interest payable | 799 | — | 799 | — | 799 | |||||||||||||||
The carrying values and estimated fair values of the Company's financial instruments at December 31,2021 are as follows (dollars in thousands):
Fair Value Measurements at December 31, 2021 Using | ||||||||||||||||||||
Quoted Prices in Active Markets for Identical Assets | Significant Other Observable Inputs | Significant Unobservable Inputs | Fair Value | |||||||||||||||||
Carrying Value | Level 1 | Level 2 | Level 3 | Balance | ||||||||||||||||
Financial Assets: | ||||||||||||||||||||
Cash and cash equivalents | $ | 506,818 | $ | 506,818 | $ | — | $ | — | $ | 506,818 | ||||||||||
Securities available for sale | 692,467 | — | 692,467 | — | 692,467 | |||||||||||||||
Restricted stock | 8,056 | — | 8,056 | — | 8,056 | |||||||||||||||
Loans held for sale | 8,481 | — | 8,481 | — | 8,481 | |||||||||||||||
Loans, net of allowance | 1,927,902 | — | — | 1,914,887 | 1,914,887 | |||||||||||||||
Bank owned life insurance | 29,107 | — | 29,107 | — | 29,107 | |||||||||||||||
Accrued interest receivable | 5,822 | — | 5,822 | — | 5,822 | |||||||||||||||
Financial Liabilities: | ||||||||||||||||||||
Deposits | $ | 2,890,353 | $ | — | $ | 2,892,487 | $ | — | $ | 2,892,487 | ||||||||||
Repurchase agreements | 41,128 | — | 41,128 | — | 41,128 | |||||||||||||||
Junior subordinated debt | 28,232 | — | — | 26,635 | 26,635 | |||||||||||||||
Accrued interest payable | 392 | — | 392 | — | 392 | |||||||||||||||
Derivative - cash flow hedges | 2,800 | — | 2,800 | — | 2,800 | |||||||||||||||
Estimated Future Payouts Under Non- Equity Incentive Plan Awards (1) | All Other Stock | Grant Date Fair Value | ||||||||||||||||||||||
| Name | Grant Date | Threshold ($) | Target ($) | Maximum ($) | Awards: Number of Shares of Stock (2) | of Stock and Option Awards ($) (3) | ||||||||||||||||||
| Jeffrey V. Haley | 1/17/2023 | 6,504 | 237,201 | |||||||||||||||||||||
| N/A | 80,871 | 162,000 | 243,000 | — | — | |||||||||||||||||||
| Jeffrey W. Farrar | 1/17/2023 | 3,743 | 136,507 | |||||||||||||||||||||
| N/A | 42,920 | 85,840 | 128,996 | — | — | |||||||||||||||||||
| Edward C. Martin | 1/17/2023 | 3,394 | 123,779 | |||||||||||||||||||||
| N/A | 39,269 | 78,534 | 118,058 | — | — | |||||||||||||||||||
| Rhonda P. Joyce | 1/17/2023 | 3,342 | 121,883 | |||||||||||||||||||||
| N/A | 38,320 | 76,640 | 115,172 | — | — | |||||||||||||||||||
| Alexander Jung (4) | 1/17/2023 | 2,522 | 91,977 | |||||||||||||||||||||
| N/A | 34,724 | 69,447 | 104,288 | — | — | |||||||||||||||||||
| (1) | Represents cash award amounts for individual and Company performance under the incentive program based upon achievement of specific goals approved by the Board. Achievement of specific goals and amounts of cash awards are determined by the Human Resources and Compensation Committee and submitted to the Board for approval. Participants have the option of taking a larger percentage in restricted stock and less in cash. The actual annual cash incentive awards paid to the named executive officers earned in 2023 under the incentive plan are shown in the Summary Compensation Table under the column captioned "Non-Equity Incentive Plan Compensation." Maximum represents the potential payout for performance that exceeds expectations. |
| (2) | Restricted stock granted under the 2018 Equity Compensation Plan. The restricted stock awards vest at 36 months after the date of grant, contingent on continuous service through the applicable vesting date. Restricted stock has no express performance criteria other than continued employment (with limited exceptions for termination of employment due to death, disability, retirement, reduction-in-force, and change in control). |
| (3) | Amounts shown represent the aggregate full grant date fair value of each award calculated in accordance with FASB ASC Topic 718. The assumptions made in the calculation of these amounts are contained in Note 13 to the Company's audited financial statements for the year ended December 31, 2023.included herein. |
| (4) | Mr. Jung joined the Company in November 2021, so his awards in 2022 were pro-rated accordingly. |
To Be Well Capitalized Under Prompt Corrective Actual Required for Capital Adequacy Purposes* Action Provisions Amount Ratio Amount Ratio Amount Ratio December 31, 2022 Common Equity Tier 1 Company Bank Tier 1 Capital Company Bank Total Capital Company Bank Leverage Capital Company Bank December 31, 2021 Common Equity Tier 1 Company Bank Tier 1 Capital Company Bank Total Capital Company Bank Leverage Capital Company Bank Note 20 – Dividend RestrictionsOutstanding Equity Awards at Fiscal Year-EndRegulatory Capitalvest at 36 months after the date of grant, contingent on continuous service through the applicable vesting date. There were no stock options outstanding as of December 31, 2023 for the named executive officers. Jeffrey V. Haley 15,797 770,104 — — Jeffrey W. Farrar 7,283 355,046 — — Edward C. Martin 4,807 325,991 — — Rhonda P. Joyce 6,388 311,415 — — Alexander Jung 5,319 259,301 — — approvalfollowing table reflects shares acquired upon the vesting of restricted stock awards in 2023 by the named executive officers and the value realized on vesting. None of the Office of the Comptroller of the Currency is required if the total of all dividends declared by a national bank innamed executive officers holds any calendar year exceeds the bank's retained net income, as defined, for that year combined with its retained net income for the preceding two calendar years. Under this formula, the Bank can distribute as dividends to the Company, without the approval of the Office of the Comptroller of the Currency, up to $58.2 million as of December 31,2022. Dividends paid by the Bank to the Company are the only significant source of funding for dividends paid by the Company to its shareholders.Federal bank regulators have issued substantially similar guidelines requiring banks and bank holding companies to maintain capital at certain levels. In addition, regulators may from time to time require that a banking organization maintain capital above the minimum levels because of its financial condition or actual or anticipated growth. Failure to meet minimum capital requirements can trigger certain mandatory and discretionary actions by regulators that could have a direct material effect on the Company's financial condition and results of operations.Management believes that as of December 31,2022, the Company and Bank met all capital adequacy requirements to which they are subject. At year-end 2022 and 2021, the most recent regulatory notifications categorized the Bank as "well capitalized" under the regulatory framework for prompt corrective action. There are no conditions or events since that notification that management believes have changed the Bank's category.Actual and required capital amounts (in thousands) and ratios are presented below at year-end. $ 287,735 11.70 % $ 172,098 >7.00% N/A N/A 308,690 12.57 171,962 >7.00 $ 159,679 >6.50% 316,069 12.86 208,977 >8.50 N/A N/A 308,690 12.57 208,811 >8.50 196,528 >8.00 336,001 13.67 258,147 >10.50 N/A N/A 328,622 13.38 257,942 >10.50 245,660 >10.00 316,069 10.36 122,086 >4.00 N/A N/A 308,690 10.12 121,990 >4.00 152,488 >5.00 $ 270,192 12.43 % $ 97,798 >7.00% N/A N/A 285,260 13.15 151,845 >7.00 $ 140,999 >6.50% 298,424 13.73 130,397 >8.50 N/A N/A 285,260 13.15 184,383 >8.50 173,537 >8.00 317,488 14.61 173,862 >10.50 N/A N/A 304,324 14.03 277,767 >10.50 216,921 >10.00 298,424 9.13 130,722 >4.00 N/A N/A 285,260 8.76 130,264 >4.00 162,830 >5.00 *Ratios include the conservation buffer. Jeffrey V. Haley 4,217 113,592 Jeffrey W. Farrar 570 20,127 Edward C. Martin 807 28,495 Rhonda P. Joyce 755 26,659 Alexander Jung — — (1) The value realized on vesting is based on the closing price of the Company's common stock on the date of vesting multiplied by the number of shares acquired. 85
2022 Community Banking Wealth Management Total Interest income Interest expense Noninterest income Noninterest expense Income before income taxes Net income Depreciation and amortization Total assets Goodwill Capital expenditures 2021 Community Banking Wealth Management Total Interest income Interest expense Noninterest income Noninterest expense Income before income taxes Net income Depreciation and amortization Total assets Goodwill Capital expenditures 2020 Community Banking Wealth Management Total Interest income Interest expense Noninterest income Noninterest expense Income before income taxes Net income Depreciation and amortization Total assets Goodwill Capital expendituresNote 21 – SegmentPension BenefitsRelated Informationthe number of years of service earned and credited under the plan as of December 31, 2009, which was the final year of the plan. Jeffrey V. Haley Pension 14 331,583 Jeffrey W. Farrar (1) Pension — — Edward C. Martin (1) Pension — — Rhonda P. Joyce (1) Pension — — Alexander Jung (1) Pension — — (1) Mr. Farrar joined the Company in 2019, Mr. Martin 2016, Ms. Joyce in 2011, and Mr. Jung in 2021. The pension plan was closed to new participants before the officers became eligible for any credited service or accumulated benefit under the plan. Company has two reportable segments, community banking and wealth management.Community banking involves making loans to and generating deposits from individuals and businesses. All assets and liabilitiesexecutive officers of the Company are allocatedentitled to community banking. Investment income from securities is also allocatedparticipate in the American National Bank & Trust Company Deferred Compensation Plan. Pursuant to the community banking segment. Loan fee income, service charges from deposit accounts, and non-deposit fees such as automated teller machine fees and insurance commissions generate additional incomeDeferred Compensation Plan, eligible employees can defer up to 100% of base salary or annual cash bonus or both, on an annual basis. Deferral elections are made by eligible executives in December of each year for the community banking segment.Wealth management include estate planning, trust account administration, investment management, and retail brokerage. Investment management include purchasing equity, fixed income, and mutual fund investments for customer accounts. The wealth management segment receives fees for investment and administrative services.Segment information as of and for the years ended December 31,2022,2021, and 2020, is shownamounts to be earned in the following year. The plan is administered through the Virginia Bankers Association.(dollars in thousands): $ 96,004 $ — $ 96,004 5,766 — 5,766 12,286 6,521 18,807 61,173 2,913 64,086 39,754 3,608 43,362 31,578 2,850 34,428 3,496 10 3,506 3,065,611 291 3,065,902 85,048 — 85,048 1,196 — 1,196 $ 95,796 $ — $ 95,796 5,405 — 5,405 15,012 6,019 21,031 56,251 2,757 59,008 51,977 3,262 55,239 40,949 2,577 43,526 3,697 10 3,707 3,334,347 250 3,334,597 85,048 — 85,048 1,000 — 1,000 $ 95,840 $ — $ 95,840 12,020 — 12,020 12,054 4,789 16,843 52,245 2,320 54,565 34,714 2,468 37,182 28,052 1,993 30,045 3,815 10 3,825 3,049,779 231 3,050,010 85,048 — 85,048 2,690 4 2,694 Jeffrey V. Haley — 176,250 78,520 — 798,643 Jeffrey W. Farrar 32,249 — 12,145 — 92,111 Edward C. Martin — — 1,296 — 31,512 Rhonda P. Joyce (3) — — — — — Alexander Jung (3) — — — — — (1) Mr. Farrar made a voluntary deferral of a bonus payment in 2023. (2) The amounts in this column reflect the Company's contributions to the nonqualified deferred compensation plan. The compensation was earned in 2023, credited to the officer's account in December 2023, and is included in the "Bonus" column of the Summary Compensation Table on page 23. (3) Ms. Joyce and Mr. Jung, as executive officers of the Bank only, are not eligible to participate in the nonqualified deferred compensation plan. 86
December 31, Parent Company Condensed Balance Sheets 2022 2021 Cash Securities available for sale, at fair value Investment in subsidiaries Due from subsidiaries Other assets Total Assets Junior subordinated debt Other liabilities Shareholders' equity Total Liabilities and Shareholders' Equity Year Ended December 31, Parent Company Condensed Statements of Income 2022 2021 2020 Dividends from subsidiary Other income Expenses Income tax benefit Income before equity in undistributed earnings of subsidiary Equity in undistributed earnings of subsidiary Net Income Year Ended December 31, Parent Company Condensed Statements of Cash Flows 2022 2021 2020 Cash Flows from Operating Activities: Net income Adjustments to reconcile net income to net cash provided by operating activities: (Equity in earnings) of subsidiary Net amortization of securities Net change in other assets Net change in other liabilities Net cash provided by operating activities Cash Flows from Investing Activities: Sales, cal1s and maturities of equity securities Net cash provided by investing activities Cash Flows from Financing Activities: Common stock dividends paid Repurchase of common stock Proceeds from exercise of stock options Net change in subordinated debt Net cash used in financing activities Net increase (decrease) in cash and cash equivalents Cash and cash equivalents at beginning of period Cash and cash equivalents at end of periodNote 22Potential Payments upon Termination or Change in ControlParentExecutive Employment Agreements and Change in Control Arrangements." The amounts reflected in the following table are estimates, as the actual amounts to be paid to or received by a named executive officer can only be determined at the time of termination or change in control. Jeffrey V. Haley 3,783,359 — 770,104 4,553,463 Jeffrey W. Farrar 1,406,779 — 355,046 1,761,825 Edward C. Martin 1,294,483 — 325,991 1,620,474 Rhonda P. Joyce 1,254,893 — 311,415 1,566,308 Alexander Jung 1,144,414 — 259,301 1,403,715 (1) Based on "Total Annual Compensation" (see "Executive Employment Agreements and Change in Control Arrangements" for definition) multiplied by 2.99 for Mr. Jeffrey Haley and multiplied by 2 for all other NEOs. Each NEO's employment agreement includes a "best-net" provision regarding Section 280G of the Internal Revenue Code, which could result in a reduction in the amounts paid by the Company following a change in control. The amounts shown do not reflect the potential impact of those provisions. (2) 2023 incentive compensation earned for 2023 performance was paid in 2023. (see "Performance Compensation and Bonus Program"). (3) Market value as of December 31, 2023 of unvested restricted stock awards that would vest as a result of a termination following a change in control (see "Outstanding Equity Awards at Fiscal Year-End"). Financial InformationCondensed Parentis providing the following information about the relationship of the annual total compensation of its median employee and the annual total compensation of its Chief Executive Officer.financialexcluding the Chief Executive Officer, was $68,173 and the annual total compensation of the Chief Executive Officer was $3,806,295 as reflected in the Summary Compensation Table. Based on this information, isfor 2023, the ratio of the annual total compensation of the Chief Executive Officer to the median of the annual total compensation of all employees was 55 to 1.follows (dollarsof December 31, 2023, which consisted of 352 employees. To identify the median employee, the Company conducted a full analysis of this employee population, without the use of statistical sampling. The median employee was determined using "total compensation" for the full year 2023. "Total compensation" consisted of gross wages which included base wages, bonus, paid time off, and overtime plus Company provided benefits. Gross wages were annualized for employees who were not employed for the full year in thousands): $ 3,906 $ 10,560 1,639 1,766 342,013 372,902 152 128 2,222 607 $ 349,932 $ 385,963 $ 28,334 $ 28,232 424 2,939 321,174 354,792 $ 349,932 $ 385,963 $ 16,000 $ 16,000 $ 25,500 146 411 512 2,994 3,057 3,369 (598 ) (556 ) (600 ) 13,750 13,910 23,243 20,678 29,616 6,802 $ 34,428 $ 43,526 $ 30,045 $ 34,428 $ 43,526 $ 30,045 (20,678 ) (29,616 ) (6,802 ) — 10 — (876 ) 27 84 109 102 85 12,983 14,049 23,412 — 6,800 — — 6,800 — (12,144 ) (11,827 ) (11,842 ) (7,505 ) (8,810 ) (4,981 ) 12 89 43 — (7,500 ) — (19,637 ) (28,048 ) (16,780 ) (6,654 ) (7,199 ) 6,632 10,560 17,759 11,127 $ 3,906 $ 10,560 $ 17,759 Year Summary Compensation Table Total for PEO (1) Compensation Actually Paid to PEO (2) Average Summary Compensation Table Total for Non-PEO NEOs (1) Average Compensation Actually Paid to Non-PEO NEOs (2) Net Income
(in millions) Core EPS (less PPP) (5) 2023 $ 3,806,295 $ 4,056,898 $ 1,170,811 $ 1,290,778 $ 141.45 $ 107.99 $ 26.16 $ 2.70 2022 $ 1,082,098 $ 1,077,764 $ 523,305 $ 520,550 $ 103.51 $ 107.95 $ 34.43 $ 3.17 2021 $ 1,002,451 $ 1,123,925 $ 468,054 $ 513,444 $ 102.34 $ 119.79 $ 43.53 $ 3.00 2020 $ 754,799 $ 579,539 $ 398,606 $ 354,370 $ 68.98 $ 89.23 $ 30.05 $ 2.10 (1) The Company's PEO is Mr. Jeffery V. Haley, who has served as Chief Executive Officer for all four years covered in the table. For 2020 and 2021, the Non-PEO NEOs were Mr. H. Gregg Strader, Mr. Jeffery W. Farrar, Mr. Edward C. Martin, and Mr. John H. Settle Jr. For 2022 and 2023, the Non-PEO NEOs were Ms. Joyce, Mr. Farrar, Mr. Martin, and Mr. Jung. The dollar amounts reported are total compensation in the Summary Compensation Table for the PEO and the average for Non-PEO NEOs for each reported fiscal year. (2) The dollar amounts reported represent CAP for the PEO and the average for Non-CEO PEOs for each reported year. The dollar amounts do not reflect actual amounts of compensation paid or earned during the covered year, but reflect the Summary Compensation Table total compensation amounts as adjusted in each covered year for (i) the year-end fair values of unvested equity awards granted in the current year, (ii) the year-over-year difference of year-end fair values for unvested awards granted in prior years, (iii) the fair values at vest date for awards granted and vested in the current year, (iv) the difference between prior year-end fair values and vest date fair values for awards granted in prior years, (v) the value of dividends or dividend equivalents no otherwise included in compensation, and (vi) the year-over-year increase in fair value of accumulated pension benefits. These calculations are shown in further detail in the tables below. (3) Reflects the cumulative TSR of the Company's common stock over the four-year period. The reporting is based on a theoretical $100 invested on the last day of 2019 and valued as of the last trading day of 2023, 2022, 2021, and 2020, assuming reinvestment of dividends. (4) Reflects the cumulative total shareholder return of the S&P SmallCap Banking Index. The S&P SmallCap Banking Index is the peer group used by the company for purposes of Item 201(e) of Regulation S-K in our Annual Report on Form 10K for the year ended December 31, 2023. (5) Core EPS is a measure not calculated in accordance with U.S. generally accepted accounting principles.
(dollars in thousands) As of or for the Year Ended December 31, 2022 2021 2020 Supplemental Schedule of Cash and Cash Equivalents: Cash and due from banks Interest-bearing deposits in other banks Supplemental Disclosure of Cash Flow Information: Cash paid for: Interest on deposits and borrowed funds Income taxes Noncash investing and financing activities: Transfer of loans to other real estate owned Transfer of loans to repossessions Transfer from premises and equipment to other assets Increase (decrease) in operating lease right-of-use asset Increase (decrease) in operating lease liabilities Unrealized gains (losses) on securities available for sale Unrealized gains (losses) on cash flow hedges Change in unfunded pension liabilityNote 23 – Supplemental Cash Flow InformationCalculation of Compensation Actually Paid (" �� $ 32,207 $ 23,095 $ 30,767 41,133 483,723 337,853 $ 73,340 $ 506,818 $ 368,620 $ 5,308 $ 5,791 $ 12,455 8,472 3,102 7,609 — — 95 53 — 411 — 1,316 — 240 (21 ) 371 240 (21 ) 371 (68,877 ) (12,271 ) 6,399 4,125 2,068 (2,210 ) 1,082 590 (413 )
Note 24 – Accumulated Other Comprehensive Income (Loss)
Changes
Unrealized | Adjustments | Accumulated | ||||||||||||||
Net Unrealized | Losses on | Related to | Other | |||||||||||||
Gains (Losses) | Cash Flow | Pension | Comprehensive | |||||||||||||
on Securities | Hedges | Benefits | Income (Loss) | |||||||||||||
Balance at Balance at December 31, 2019 | $ | 2,902 | $ | (2,084 | ) | $ | (1,301 | ) | $ | (483 | ) | |||||
Net unrealized gains on securities available for sale, net of tax, $1,557 | 5,656 | — | — | 5,656 | ||||||||||||
Reclassification adjustment for realized gains on securities, net of tax, $(176) | (638 | ) | — | — | (638 | ) | ||||||||||
Net unrealized losses on cash flow hedges, net of tax, $(448) | — | (1,762 | ) | — | (1,762 | ) | ||||||||||
Change in unfunded pension liability, net of tax, $(77) | — | — | (336 | ) | (336 | ) | ||||||||||
Balance at December 31, 2020 | 7,920 | (3,846 | ) | (1,637 | ) | 2,437 | ||||||||||
Net unrealized losses on securities available for sale, net of tax, $(2,643) | (9,593 | ) | — | — | (9,593 | ) | ||||||||||
Reclassification adjustment for realized gains on securities, net of tax, $(7) | (28 | ) | — | — | (28 | ) | ||||||||||
Net unrealized gains on cash flow hedges, net of tax, $434 | — | 1,634 | — | 1,634 | ||||||||||||
Change in unfunded pension liability, net of tax, $115 | — | — | 475 | 475 | ||||||||||||
Balance at December 31, 2021 | (1,701 | ) | (2,212 | ) | (1,162 | ) | (5,075 | ) | ||||||||
Net unrealized losses on securities available for sale, net of tax, $(14,868) | (54,009 | ) | — | — | (54,009 | ) | ||||||||||
Net unrealized gains on cash flow hedges, net of tax, $866 | — | 3,259 | — | 3,259 | ||||||||||||
Change in unfunded pension liability, net of tax, $233 | — | — | 849 | 849 | ||||||||||||
Balance at December 31, 2022 | $ | (55,710 | ) | $ | 1,047 | $ | (313 | ) | $ | (54,976 | ) | |||||
covered year.
2023 | ||||||||
CEO | Average Non-CEO NEOs | |||||||
Total Compensation from Summary Compensation Table | $ | 3,806,295 | $ | 1,170,811 | ||||
Adjustments for Equity Awards | ||||||||
| Adjustment for grant date values in the Summary Compensation Table | $ | (182,250 | ) | $ | (75,077 | ) | ||
| Year-end fair value of unvested awards granted in the current year | $ | 317,070 | $ | 158,450 | ||||
| Year-over-year difference of year-end fair values for unvested awards granted in prior years | $ | 109,843 | $ | 37,458 | ||||
| Fair values at vest date for awards granted and vested in current year | $ | - | $ | - | ||||
| Difference in fair values between prior year-end fair values and vest date fair values for awards granted in prior years | $ | (5,212 | ) | $ | (863 | ) | ||
| Dividends or dividend equivalents not otherwise included in total compensation | $ | 11,152 | $ | - | ||||
Total Adjustments for Equity Awards | $ | 250,603 | $ | 119,967 | ||||
Compensation Actually Paid (as calculated) | $ | 4,056,898 | $ | 1,290,778 | ||||
Reclassifications Out of Accumulated Other Comprehensive Income (Loss)
For2023, calculated in accordance with SEC regulations, to Company performance. Core EPS was used in determining payouts under the Three Years Ended December 31,2022Company's annual incentive program discussed in the Compensation Discussion and Analysis.
| • | Core EPS – PPP (Company Selected Measure) |
| • | GAAP Diluted Earnings Per Share |
| • | Return on Tangible Common Equity |
Details about AOCI Components | Amount Reclassified from AOCI | Affected Line Item in the Statement of Where Net Income is Presented | |||||||||||
Year Ended December 31, | |||||||||||||
2022 | 2021 | 2020 | |||||||||||
Available for sale securities: | |||||||||||||
Realized gain on sale of securities | $ | — | $ | 35 | $ | 814 | Securities gains, net | ||||||
| — | (7 | ) | (176 | ) | Income taxes | ||||||||
| $ | — | $ | 28 | $ | 638 | Net of tax | |||||||
| • | Company and peer group TSR versus CAP for the PEO and average for other NEOs for each covered year. |
| • | Company Net Income versus CAP for the PEO and average for other NEOs for each covered year. |
| • | Company Core EPS minus PPP versus CAP for the PEO and average for other NEOs for each covered year. |
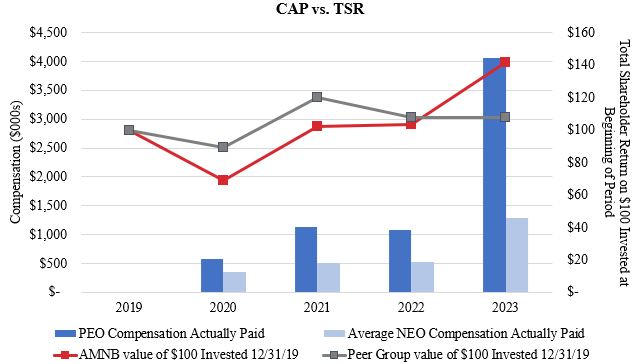
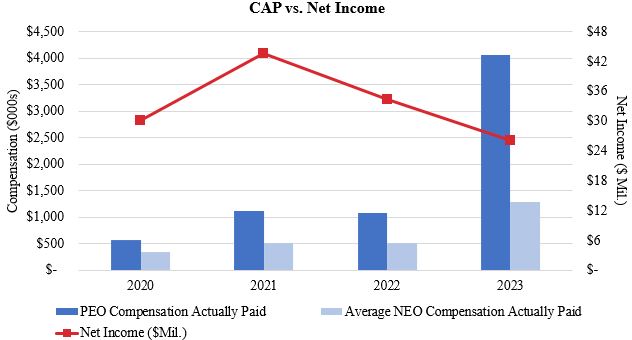
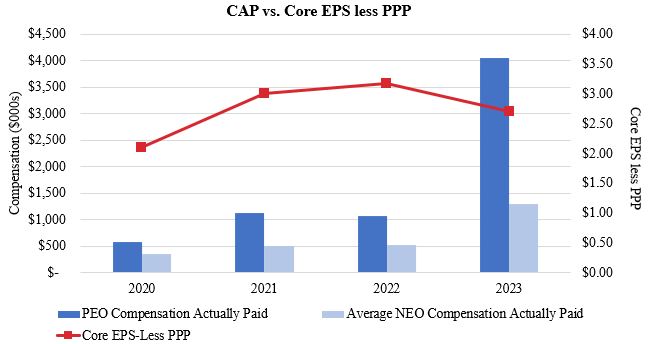
Appendix A: Calculation of Core EPS less PPP: | ||||||||||||||||
2023 | 2022 | 2021 | 2020 | |||||||||||||
Income Before Taxes | $ | 34,373 | $ | 43,362 | $ | 55,239 | $ | 37,183 | ||||||||
less: | ||||||||||||||||
| Loan Accretion | 1,968 | 1,650 | 5,333 | 3,812 | ||||||||||||
| CD Valuation | 31 | 49 | 77 | (1,637 | ) | |||||||||||
| TPS Accretion | (102 | ) | (96 | ) | (96 | ) | - | |||||||||
| Amortization CDI | (1,069 | ) | (1,260 | ) | (1,464 | ) | - | |||||||||
| Merger expenses | (2,577 | ) | - | - | - | |||||||||||
| PCI exp (recover) | - | 88 | 78 | (631 | ) | |||||||||||
| (1,749 | ) | 431 | 3,928 | 1,544 | ||||||||||||
| Core Earnings | 36,122 | 42,931 | 51,311 | 35,639 | ||||||||||||
| Less PPP income/exp | (6 | ) | (288 | ) | (9,820 | ) | (7,146 | ) | ||||||||
| 36,116 | 42,643 | 41,491 | 28,493 | |||||||||||||
| Tax effected NI | 28,661 | 33,857 | 32,675 | 23,024 | ||||||||||||
| Avg O/S shares | 10,627,709 | 10,672,314 | 10,873,817 | 10,982,000 | ||||||||||||
| Core EPS less PPP | $ | 2.70 | $ | 3.17 | $ | 3.00 | $ | 2.10 | ||||||||
the Chair of the Subcommittee on Technology and Information Security received annual retainers in 2023 of $4,000 in cash or shares of restricted stock with a market value of $4,000.
Name | Fees Earned or Paid in Cash ($) | Stock Awards ($) (1) (2) (3) | Total ($) | |||||||||
| Nancy Howell Agee | — | 73,576 | 73,576 | |||||||||
| Rickey J. Barker (4) | — | 52,054 | 52,054 | |||||||||
| J. Nathan Duggins III | — | 66,056 | 66,056 | |||||||||
| William J. Farrell II | — | 70,070 | 70,070 | |||||||||
| Tammy Moss Finley | — | 77,030 | 77,030 | |||||||||
| Jeffrey V. Haley (5) | — | — | — | |||||||||
| Michael P. Haley | — | 84,562 | 84,562 | |||||||||
| F.D. Hornaday, III | 16,000 | 61,105 | 77,105 | |||||||||
| John H. Love | 15,000 | 64,105 | 79,105 | |||||||||
| Charles H. Majors | 80,000 | — | 80,000 | |||||||||
| Ronda M. Penn | — | 77,070 | 77,070 | |||||||||
| Dan M. Pleasant | — | 74,074 | 74,074 | |||||||||
| Joel R. Shepherd | — | 77,070 | 77,070 | |||||||||
| Adrian T. Smith (4) | — | 47,041 | 47,041 | |||||||||
| Total | 111,000 | 823,813 | 934,813 | |||||||||
| (1) | Restricted stock was awarded with a market value of $5,000 for the quarterly retainer and $1,000 per committee meeting as previously described, issued quarterly based on the closing price of the Company's common stock on the first market day of the third month of the quarter. In addition, restricted stock was awarded with a market value of $4,000 for the annual retainer for the chairs of the Company and Bank Board committees and subcommittees, issued annually based on the closing price of the Company's common stock on the first market day of the sixth month of the year. |
| (2) | Restricted stock awarded in 2023, as follows: Ms. Agee, 2,109 shares; Mr. Barker, 1,504 shares; Mr. Duggins, 1,878 shares; Mr. Farrell, 2,037 shares; Ms. Finley, 2,265 shares; Mr. Michael Haley, 2,503 shares; Mr. Hornaday, 1,734 shares; Mr. Love, 1,880 shares; Ms. Penn, 2,249 shares; Mr. Pleasant, 2,194 shares; Mr. Shepherd, 2,249 shares; and Mr. Smith, 1,332 shares. |
| (3) | Amounts shown represent the aggregate full grant date fair value of each award calculated in accordance with FASB ASC Topic 718. The assumptions made in the calculation of these amounts are contained in Note 13 to the Company's audited financial statements for the year ended December 31, 2023, included herein. |
| (4) | Messrs. Barker and Smith were appointed to the Board of Directors effective May 2023. |
| (5) | Mr. Jeffrey Haley, as an employee of the Company, does not receive any compensation for his service as a director. |
Name and Address of | Shares of Common Stock Beneficially Owned | Investment Power (1) | Voting Power (1) | Percent of Class | ||||||||||||||||||||||||||||
Beneficial Owner | (#) (1) | Shared | Sole | None | Shared | Sole | None | (%) | ||||||||||||||||||||||||
| BlackRock, Inc. | 786,336 | — | 786,336 | — | — | 786,336 | — | 7.4 | % | |||||||||||||||||||||||
| 55 East 52nd Street | ||||||||||||||||||||||||||||||||
| New York, New York 10055 (2) | ||||||||||||||||||||||||||||||||
| (1) | For purposes of this table, beneficial ownership has been determined in accordance with the provisions of Rule 13d-3 of the Securities Exchange Act of 1934 under which, in general, a person or entity is deemed to be the beneficial owner of a security if he or it has or shares the power to vote or direct the voting of the security or the power to dispose of or direct the disposition of the security, or if he or it has the right to acquire beneficial ownership of the security within 60 days. |
| (2) | This information is based solely upon information as of December 31, 2023 contained in a Schedule 13G/A filed by BlackRock, Inc. with the SEC on February 13, 2024 relating to the beneficial ownership of the Company's common stock by BlackRock, Inc. and entities affiliated with BlackRock, Inc. |
Name of Beneficial Owner | Shares of Common Stock Beneficially Owned (#) (1) | Percent of Class (%) | ||||||
| Nancy Howell Agee | 23,269 | (2) | * | |||||
| Rickey J. Barker | 10,430 | * | ||||||
| J. Nathan Duggins III | 4,159 | (2) | * | |||||
| Jeffrey W. Farrar | 10,538 | (3) | * | |||||
| William J. Farrell II | 2,600 | * | ||||||
| Tammy Moss Finley | 13,362 | (2) | * | |||||
| Jeffrey V. Haley | 85,126 | (2) (3) | * | |||||
| Michael P. Haley | 30,451 | (4) | * | |||||
| F. D. Hornaday, III | 40,623 | (2) | * | |||||
| Rhonda P. Joyce | 17,179 | (2) (3) | * | |||||
| Alexander Jung | 5,644 | (3) | * | |||||
| John H. Love | 33,727 | * | ||||||
| Edward C. Martin | 11,569 | (2) (3) | * | |||||
| Ronda M. Penn | 16,226 | * | ||||||
| Dan M. Pleasant | 37,586 | (2) (4) | * | |||||
| Joel R. Shepherd | 80,157 | (2) (4) | * | |||||
| Adrian T. Smith | 1,659 | * | ||||||
| All directors and executive officers as a group (17) | 424,305 | (5) | 3.99% | |||||
| * | Represents less than 1% ownership. |
| (1) | For purposes of this table, beneficial ownership has been determined in accordance with the provisions of Rule 13d-3 of the Securities Exchange Act of 1934 under which, in general, a person is deemed to be the beneficial owner of a security if he or she has or shares the power to vote or direct the voting of the security or the power to dispose of or direct the disposition of the security, or if he or she has the right to acquire beneficial ownership of the security within 60 days. |
| (2) | Includes shares held by affiliated companies, close relatives, minor children, and shares held jointly with spouses or as custodians or trustees, as follows: Ms. Agee, 3,452 shares; Mr. Duggins, 1,150 shares; Ms. Finley, 1,074 shares; Mr. Jeffrey Haley, 28,173 shares; Mr. Hornaday, 2,072 shares; Ms. Joyce, 406 shares; Mr. Martin, 1,148 shares; Mr. Pleasant, 1,685 shares; and Mr. Shepherd, 39,364 shares. |
| (3) | Includes shares of restricted stock awarded, as follows: Mr. Farrar, 7,283 shares; Mr. Jeffrey Haley, 15,797 shares; Ms. Joyce, 6,388 shares; Mr. Jung, 5,319 shares; Mr. Martin, 4,807 shares; and all executive officers as a group, 39,594 shares. The shares are subject to a vesting schedule, forfeiture risk and other restrictions. |
| (4) | Includes stock awards held under a nonqualified deferred compensation plan for directors, as follows: Mr. Michael Haley, 10,043 shares; Mr. Pleasant, 9,089 shares; and Mr. Shepherd, 3,335 shares. |
| (5) | None of the individuals named in the table have pledged their shares as collateral. |
December 31, 2023 | ||||||||||||
Number of Shares to be Issued Upon Exercise of Outstanding Options, Warrants and Rights | Weighted-Average Per Share Exercise Price of Outstanding Options, Warrants and Rights | Number of Shares Remaining Available for Future Issuance Under Equity Compensation Plans | ||||||||||
| Equity compensation plans approved by shareholders | — | $ | — | 423,148 | ||||||||
| Equity compensation plans not approved by shareholders | — | — | — | |||||||||
| Total | — | $ | — | 423,148 | ||||||||
Management's Annual Reportquarterly reports on Internal Control over Financial Reporting
ManagementForm 10-Q during the years ended December 31, 2023 and 2022; and audited management's assessment of the Company is responsible for establishing and maintaining adequate internal control over financial reporting. Internal control is designed to provide reasonable assurance regarding the reliability of financial reporting and the preparation of financial statements for external purposes in accordance with accounting principles generally accepted in the United States of America. Management regularly monitors its internal control over financial reporting, and actions are taken to correct deficiencies as they are identified.
Under the supervision and with the participation of management, including the principal executive officer and principal financial officer, the Company conducted an evaluation of the effectiveness of internal control over financial reporting. This assessment was based on the framework in Internal Control – Integrated Framework issued by the Committee of Sponsoring Organizations of the Treadway Commission in 2013. Based on this evaluation under the framework in Internal Control – Integrated Framework, management concluded that the Company maintained effective internal control over financial reporting as of December 31, 2022, as such term is defined in Exchange Act Rule 13a-15(f).
Because of its inherent limitations, internal control over financial reporting may not prevent2023 and 2022. The following table presents aggregate fees paid or detect misstatements. Further, because of changes in conditions, internal control effectiveness may vary over time.
The Company's independent registered public accounting firm,to be paid by the Company and the Bank for professional services rendered by Yount, Hyde and Barbour, P.C., has audited the Company's internal control over financial reporting as of December 31, 2022, as stated in their report included in Item 8 of this Form 10-K. Yount, Hyde and Barbour, P.C. also audited the Company's consolidated financial statements as of and for the yearyears ended December 31, 2023 and 2022.
| |
| |
| |
| |
| |
| |
| |
|
None
ITEM 9C – DISCLOSURE REGARDING FOREIGN JURISDICTIONS THAT PREVENT INSPECTIONS
Not applicable
2023 | 2022 | |||||||
| Audit Fees | $ | 263,325 | $ | 218,400 | ||||
| Audit-related Fees | 7,950 | 7,550 | ||||||
| Tax Fees | 16,750 | 17,170 | ||||||
| Total | $ | 288,025 | $ | 243,320 | ||||
|
EXHIBIT INDEX | |
|
| |
|
|
| ||
Exhibit No. | Description | Location |
|
| |
|
| |
|
| |
|
|
|
|
| |
|
| |
|
| |
|
| |
|
| |
|
|
|
| ||
|
|
|
|
| |
| ||
|
| |
|
| |
| Section 302 Certification of Jeffrey V. Haley, President and Chief Executive Officer | Filed herewith |
| Filed herewith | |
|
|
|
|
| |
101.INS | Inline XBRL Instance Document (the instance document does not appear in the Interactive Data File because its XBRL tags are embedded within the Inline XBRL document). | |
101.SCH | Inline XBRL Taxonomy Extension Schema Document | |
101.CAL | Inline XBRL Taxonomy Extension Calculation Linkbase Document | |
101.DEF | Inline XBRL Taxonomy Extension Definition Linkbase Document | |
101.LAB | Inline XBRL Taxonomy Extension Label Linkbase Document | |
101.PRE | Inline XBRL Taxonomy Extension Presentation Linkbase Document | |
| 104 | The cover page from the Company's Annual Report on Form 10-K for the year ended December 31, |
The registrant has not selected the option to provide the summary of the Form 10-K.
Date: March | AMERICAN NATIONAL BANKSHARES INC. | |
|
| |
|
Pursuant to the requirements of the Securities Exchange Act of 1934, this report has been signed below by the following persons on behalf of the registrant and in the capacities indicated on March 14, 2023.
|
| |||||
|
| |||||
|
| |||||
| ||||||
|
|
|
| |||
|
| |||||
| By: | /s/ Jeffrey V. Haley | |||||
|
|
| ||||
|
|
|
| |||
|
| |||||
|
|
|
| |||
| ||||||
|
|
|
| |||
| (principal accounting officer) |
|
|