6 The information contained on the websites referenced in this Form 10-K is not incorporated by reference into this filing. Further, the Company’s references to website URLs are intended to be inactive textual references only. The SEC maintains an Internet site that contains reports, proxy and information statements, and other information regarding issuers that file electronically with the SEC at www.sec.gov.
RISK FACTORS |
You should carefully consider the following risk factors as well as the other risks and uncertainties contained in this Annual Report onmateriallymaterially and adversely affect our business, financial condition and operating results. In this Annual Report on Form 10-K, unless the context expressly requires a different reading, when we state that a factor could “adversely affect us,” have a “material adverse effect,” “adversely affect our business” and similar expressions, we mean that the factor could materially and adversely affect our business, financial condition, operating results and cash flows. Information contained in this section may be considered “forward-looking statements.” See “Item 7—Management’s Discussion and Analysis of Financial Condition and Results of Operations—Cautionary Note Regarding Forward-Looking Statements” for a discussion of certain qualifications regarding forward looking statements.
Risks Related to Our Business
Decreased capital and other expenditures in the energy industry, which can result from decreased oil and natural gas prices, among other things, can adversely impact our customers’ demand for our products and our revenue.
A large portion of our revenue depends upon the level of capital and operating expenditures in the oil and natural gas industry, including capital and other expenditures in connection with exploration, drilling, production, gathering, transportation, refining and processing operations.industry. Demand for the products we distribute and services we provide is particularly sensitive to the level of exploration, development, production and productionrefining activity of, and the corresponding capital and other expenditures by, oil and natural gas companies. A material decline in oil or natural gas prices, inability to access capital, and consolidation within the industry could all depress levels of exploration, development and production activity and, therefore, could lead to a decrease in our customers’ capital and other expenditures. This is especially the case in the upstream sector and, to some extent, in the midstream sector. If our customers’ expenditures decline, our business will suffer.
Volatile oil and gas prices affect demand for our products.
As evidenced by the decline of oil prices from late 2014 through 2016 and again in 2020, prices for oil and natural gas are cyclical and subject to large fluctuations in response to relatively minor changes in the supply of and demand for oil and natural gas, market uncertainty and a variety of other factors that are beyond our control. Any sustained decrease in capital expenditures in the oil and natural gas industry could have a material adverse effect on us.
Many factors affect the supply of and demand for energy and, therefore, influence oil and natural gas prices, including:
| ● | the level of domestic and worldwide oil and natural gas production and inventories; |
| ● | the level of drilling activity and the availability of attractive oil and natural gas field prospects, which governmental actions may affect, such as regulatory actions or legislation, or other restrictions on drilling, including those related to environmental concerns; |
| ● | the discovery rate of new oil and natural gas reserves and the expected cost of developing new reserves; |
| ● | the actual cost of finding and producing oil and natural gas; |
| ● | depletion rates; |
| ● | domestic and worldwide refinery overcapacity or undercapacity and utilization rates; |
| ● | the availability of transportation infrastructure and refining capacity; |
| ● | increases in the cost of products and services that the oil and gas industry uses, such as those that we provide, which may result from increases in the cost of raw materials such as steel; |
● |
| |
● | increases in usage of alternative fuels and fuel technology to increase energy efficiency; |
| ● | the economic or political attractiveness of alternative fuels, such as |
| ● | increases in oil and natural gas prices or historically high oil and natural gas prices, which could lower demand for oil and natural gas products; |
| ● | worldwide economic activity including growth or decline in |
| ● | interest rates and the cost of capital; |
● |
| national government policies, including government policies |
| ● | the ability of the Organization of Petroleum Exporting Countries (“OPEC”) along with other countries, such as Russia, to set and maintain production levels and prices for oil; |
7
| ● | the impact of armed hostilities, or the threat or perception of armed hostilities; |
| ● | environmental regulation and policies; |
| ● | technological advances; |
| ● | global weather conditions and natural disasters; |
● |
| |
● | currency fluctuations; and |
● |
|
|
Oil and natural gas prices have been and are expected to remain volatile. This volatility has historically caused oil and natural gas companies to change their strategies and expenditure levels from year to year. We have experienced in the past, and we will likely experience in the future, significant fluctuations in operating results based on these changes. In particular, volatility in the oil and natural gas sectors could adversely affect our business.
General economic conditions may adversely affect our business.
U.S. and global general economic conditions affect many aspects of our business, including demand for the products we distribute and the pricing and availability of supplies. General economic conditions and predictions regarding future economic conditions also affect our forecasts. A decrease in demand for the products we distribute or other adverse effects resulting from an economic downturn may cause us to fail to achieve our anticipated financial results. General economic factors beyond our control that affect our business and customers include interest rates, recession, inflation, deflation, customer credit availability, consumer credit availability, consumer debt levels, performance of housing markets, energy costs, tax rates and policy, unemployment rates, commencement or escalation of war or hostilities, the threat or possibility of war, terrorism or other global or national unrest, political or financial instability and other matters that influence our customers’ spending. Increasing volatility in financial markets may cause these factors to change with a greater degree of frequency or increase in magnitude. In addition, worldwide economic conditions could have an adverse effect on our business, prospects, operating results, financial condition, and cash flows going forward. Continued adverse economic conditions would have an adverse effect on us.business.
We may be unable to compete successfully with other companies in our industry.
We sell products and services in very competitive markets. In some cases, we compete with large companies with substantial resources. In other cases, we compete with smaller regional players that may increasingly be willing to provide similar products and services at lower prices. Competitive actions, such as price reductions, consolidation in the industry, improved delivery and other actions, could adversely affect our revenue and earnings. We could experience a material adverse effect to the extent that our competitors are successful in reducing our customers’ purchases of products and services from us. Competition could also cause us to lower our prices, which could reduce our margins and profitability. Furthermore, consolidation inof our industrycustomers' businesses could heighten the impacts of the competition on our business andbusiness. Our results of operations discussed above,could also be impacted, particularly if consolidation results in competitors with stronger financial and strategic resources, andwhich could also result in increases to the prices we are required to pay for acquisitions we may make in the future.
Demand for the products we distribute could decrease if the manufacturers of those products were to sell a substantial amount of goods directly to end users in the sectors we serve.
Historically, users of PVF and related products have purchased certain amounts of these products through distributors and not directly from manufacturers. If customers were to purchase the products that we sell directly from manufacturers, or if manufacturers sought to increase their efforts to sell directly to end users, we could experience a significant decrease in profitability. These or other developments that remove us from, or limit our role in, the distribution chain, may harm our competitive position in the marketplace, reduce our sales and earnings and adversely affect our business.
We may experience unexpected supply shortages.
We distribute products from a wide variety of manufacturers and suppliers. Nevertheless, in the future we may have difficulty obtaining the products we need from suppliers and manufacturers as a result of unexpected demand or production difficulties that might extend lead times. Also, products may not be available to us in quantities sufficient to meet our customer demand. Our inability to obtain products from suppliers and manufacturers in sufficient quantities, or at all, could adversely affect our product and service offerings and our business.
We may experience cost increases from suppliers, which we may be unable to pass on to our customers.
In the future, we may face supply cost increases due to, among other things, unexpected increases in demand for supplies, decreases in production of supplies, increases in the cost of raw materials, transportation, changes in exchange rates or the imposition of import taxes or tariff on imported products. Any inability to pass supply price increases on to our customers could have a material adverse
8
effect on us. For example, we may be unable to pass increased supply costs on to our customers because significant amounts of our sales are derived from stocking program arrangements, contracts and maintenance and repair arrangements, which provide our customers time limited price protection, which may obligate us to sell products at a set price for a specific period. In addition, if supply costs increase, our customers may elect to purchase smaller amounts of products or may purchase products from other distributors. While we may be able to work with our customers to reduce the effects of unforeseen price increases because of our relationships with them, we may not be able to reduce the effects of the cost increases. In addition, to the extent that competition leads to reduced purchases of products or services from us or a reduction of our prices, and these reductions occur concurrently with increases in the prices for selected commodities which we use in our operations, including steel, nickel and molybdenum, the adverse effects described above would likely be exacerbated and could result in a prolonged downturn in profitability.
We do not have contracts with most of our suppliers. The loss of a significant supplier would require us to rely more heavily on our other existing suppliers or to develop relationships with new suppliers. Such a loss may have an adverse effect on our product and service offerings and our business.
Given the nature of our business, and consistent with industry practice, we do not have contracts with most of our suppliers. We generally make our purchases through purchase orders. Therefore, most of our suppliers have the ability to terminate their relationships with us at any time. Approximately 42% of our total purchases during the year ended December 31, 20182020 were from our 25 largest suppliers. Although we believe there are numerous manufacturers with the capacity to supply the products we distribute, the loss of one or more of our major suppliers could have an adverse effect on our product and service offerings and our business. Such a loss would require us to rely more heavily on our other existing suppliers or develop relationships with new suppliers, which may cause us to pay higher prices for products due to, among other things, a loss of volume discount benefits currently obtained from our major suppliers.
Price reductions by suppliers of products that we sell could cause the value of our inventory to decline. Also, these price reductions could cause our customers to demand lower sales prices for these products, possibly decreasing our margins and profitability on sales to the extent that we purchased our inventory of these products at the higher prices prior to supplier price reductions.
The value of our inventory could decline as a result of manufacturer price reductions with respect to products that we sell. There is no assurance that aA substantial decline in product prices would notmay result in a write-down of our inventory value. Such a write-down could have an adverse effect on our financial condition.
Also, decreases in the market prices of products that we sell could cause customers to demand lower sales prices from us. These price reductions could reduce our margins and profitability on sales with respect to the lower-priced products. Reductions in our margins and profitability on sales could have a material adverse effect on us.
A substantial decrease in the price of steel could significantly lower our gross profit or cash flow.
We distribute many products manufactured from steel. As a result, the price and supply of steel can affect our business and, in particular, our carbon steel line pipe product category. When steel prices are lower, the prices that we charge customers for products may decline, which affects our gross profit and cash flow. At times pricing and availability of steel can be volatile due to numerous factors beyond our control, including general domestic and international economic conditions, labor costs, sales levels, competition, consolidation of steel producers, fluctuations in and the costs of raw materials necessary to produce steel, steel manufacturers’ plant utilization levels and capacities, import duties and tariffs and currency exchange rates. Increases in manufacturing capacity for the carbon steel line pipe products could put pressure on the prices we receive for our carbon steel line pipe products. When steel prices decline, customer demands for lower prices and our competitors’ responses to those demands could result in lower sales prices and, consequently, lower gross profit and cash flow.
If steel prices rise, we may be unable to pass along the cost increases to our customers.
We maintain inventories of steel products to accommodate the lead time requirements of our customers. Accordingly, we purchase steel products in an effort to maintain our inventory at levels that we believe to be appropriate to satisfy the anticipated needs of our customers based upon historic buying practices, contracts with customers and market conditions. Our commitments to purchase steel products are generally at prevailing market prices in effect at the time we place our orders. If steel prices increase between the time we order steel products and the time of delivery of the products to us, our suppliers may impose surcharges that require us to pay for increases in steel prices during the period. Demand for the products we distribute, the actions of our competitors and other factors will influence whether we will be able to pass on steel cost increases and surcharges to our customers, and we may be unsuccessful in doing so.
We do not have long-term contracts or agreements with many of our customers. The contracts and agreements that we do have generally do not commit our customers to any minimum purchase volume. The loss of a significant customer may have a material adverse effect on us.
Given the nature of our business, and consistent with industry practice, we do not have long-term contracts with many of our customers. In addition, our contracts, including our maintenance, repair and operations (“MRO”) contracts, generally do not commit our customers to any minimum purchase volume. Therefore, a significant number of our customers, including our MRO customers, may terminate their relationships with us or reduce their purchasing volume at any time. Furthermore, the customer contracts that we do have are generally terminable without cause on short notice. Our 25 largest customers represented approximately 55%56% of our sales for the year ended December 31, 2018.2020. The products that we may sell to any particular customer depend in large part on the size of that customer’s capital expenditure budget in a particular year and on the results of competitive bids for major projects. Consequently, a customer that accounts for a significant portion of our sales in one fiscal year may represent an immaterial portion of our sales in subsequent fiscal years. The loss of a significant customer, or a substantial decrease in a significant customer’s orders, may have an adverse effect on our sales and revenue. In addition, we are subject to customer audit clauses in many of our multi-year contracts. If we are not able to provide the proper documentation or support for invoices per the contract terms, we may be subject to negotiated settlements with our major customers.
Changes in our customer and product mix could cause our gross profit percentage to fluctuate.
From time to time, we may experience changes in our customer mix or in our product mix. Changes in our customer mix may result from geographic expansion, daily selling activities within current geographic markets and targeted selling activities to new customer segments. Changes in our product mix may result from marketing activities to existing customers and needs communicated to us from existing and prospective customers. If customers begin to require more lower-margin products from us and fewer higher-margin products, our business, results of operations and financial condition may suffer.
Customer credit risks could result in losses.
The concentration of our customers in the energy industry may impact our overall exposure to credit risk as customers may be similarly affected by prolonged changes in economic and industry conditions. Further, laws in some jurisdictions in which we operate could make collection difficult or time consuming. In addition, in times when commodity prices are low, our customers with higher debt levels may not have the ability to pay their debts. Other customers may have specific issues regarding their ability to pay their indebtedness. We perform ongoing credit evaluations of our customers and do not generally require collateral in support of our trade receivables. While we maintain reserves for expected credit losses, we cannot assure these reserves willmay not be sufficient to meet write-offs of uncollectible receivables or that our losses from such receivables will be consistent with our expectations.
We may be unable to successfully execute or effectively integrate acquisitions.
From time to time, we may selectively pursue acquisitions, including large scale acquisitions, to continue to grow and increase profitability. However, acquisitions, particularly of a significant scale, involve numerous risks and uncertainties, including intense competition for suitable acquisition targets, the potential unavailability of financial resources necessary to consummate acquisitions in the future, increased leverage due to additional debt financing that may be required to complete an acquisition, dilution of our stockholders’ net current book value per share if we issue additional equity securities to finance an acquisition, difficulties in identifying suitable acquisition targets or in completing any transactions identified on sufficiently favorable terms, assumption of undisclosed or unknown liabilities and the need to obtain regulatory or other governmental approvals that may be necessary to complete acquisitions. In addition, any future acquisitions may entail significant transaction costs and risks associated with entry into new markets.
Even when acquisitions are completed, integration of acquired entities can involve significant difficulties, such as:
| ● | failure to achieve cost savings or other financial or operating objectives with respect to an acquisition; |
| ● | strain on the operational and managerial controls and procedures of our business, and the need to modify systems or to add management resources; |
| ● | difficulties in the integration and retention of customers, suppliers or personnel and the integration and effective deployment of operations or technologies; |
| ● | amortization of acquired assets, which would reduce future reported earnings; |
| ● | possible adverse short-term effects on our cash flows or operating results; |
| ● | diversion of management’s attention from the ongoing operations of our business; |
| ● | integrating personnel with diverse backgrounds and organizational cultures; |
● |
|
|
10
| ● | failure to obtain and retain key personnel of an acquired business; and |
● |
|
assumption of known or unknown material liabilities or regulatory non-compliance issues.
Failure to manage these acquisition risks could have an adverse effect on us.
Our indebtedness may affect our ability to operate our business, and this could have a material adverse effect on us.
We have now and will likely continue to have indebtedness. As of December 31, 2018,2020, we had total debt outstanding of $684$383 million and excess availability of $449$432 million under our credit facilities. We may incur significant additional indebtedness in the future. If new indebtedness is added to our current indebtedness, the risks described below could increase. Our significant level of indebtedness could have important consequences, such as:
| ● | limiting our ability to obtain additional financing to fund our working capital, acquisitions, expenditures, debt service requirements or other general corporate purposes; |
| ● | limiting our ability to use operating cash flow in other areas of our business because we must dedicate a substantial portion of these funds to service debt; |
| ● | limiting our ability to compete with other companies who are not as highly leveraged; |
| ● | subjecting us to restrictive financial and operating covenants in the agreements governing our and our subsidiaries’ long-term indebtedness; |
| ● | exposing us to potential events of default (if not cured or waived) under financial and operating covenants contained in our or our subsidiaries’ debt instruments that could have a material adverse effect on our business, results of operations and financial condition; |
| ● | increasing our vulnerability to a downturn in general economic conditions or in pricing of our products; and |
● |
| limiting our ability to react to changing market conditions in our industry and in our |
In addition, borrowings under our credit facilities bear interest at variable rates. If market interest rates increase, the variable-rate debt will create higher debt service requirements, which could adversely affect our cash flow. In March 2018, we entered into a five-year $250million interest rate swap to fix a portion of our variable interest rate exposure. Our interest expense for the year ended December 31, 20182020 was $38$28 million.
Our ability to make scheduled debt payments, to refinance our obligations with respect to our indebtedness and to fund capital and non-capital expenditures necessary to maintain the condition of our operating assets, properties and systems software, as well as to provide capacity for the growth of our business, depends on our financial and operating performance, which, in turn, is subject to prevailing economic conditions and financial, business, competitive, legal and other factors. Our business may not generate sufficient cash flow from operations, and future borrowings may not be available to us under our credit facilities in an amount sufficient to enable us to pay our indebtedness or to fund our other liquidity needs. We may seek to sell assets to fund our liquidity needs but may not be able to do so. We may also need to refinance all or a portion of our indebtedness on or before maturity. We may not be able to refinance any of our indebtedness on commercially reasonable terms or at all.
In addition, we are and will be subject to covenants contained in agreements governing our present and future indebtedness. These covenants include and will likely include restrictions on:
| ● | investments, including acquisitions; |
| ● | prepayment of certain indebtedness; |
| ● | the granting of liens; |
| ● | the incurrence of additional indebtedness; |
| ● | asset sales; |
| ● | the making of fundamental changes to our business; |
| ● | transactions with affiliates; and |
● |
|
the payment of dividends.
In addition, any defaults under our credit facilities, including our global asset-based lending facility (“Global ABL Facility”), our senior secured term loan B (“Term Loan”) or our other debt could trigger cross defaults under other or future credit agreements and may permit acceleration of our other indebtedness. If our indebtedness is accelerated, we cannot be certain that we will have sufficient funds available to pay the accelerated indebtedness or that we will have the ability to refinance the accelerated indebtedness on terms favorable to us or at all. For a description of our credit facilities and indebtedness, see “Item 7—Management’s Discussion and Analysis of Financial Condition and Results of Operations—Liquidity and Capital Resources”.
We are a holding company and depend upon our subsidiaries for our cash flow.
We are a holding company. Our subsidiaries conduct all of our operations and own substantially all of our assets. Consequently, our cash flow and our ability to meet our obligations or to pay dividends or make other distributions in the future will depend upon the cash flow of our subsidiaries and our subsidiaries’ payment of funds to us in the form of dividends, tax sharing payments or otherwise.
The ability of our subsidiaries to make any payments to us will depend on their earnings, the terms of their current and future indebtedness, tax considerations and legal and contractual restrictions on the ability to make distributions. In particular, our subsidiaries’ credit facilities currently impose limitations on the ability of our subsidiaries to make distributions to us and consequently our ability to pay dividends to our stockholders. Subject to limitations in our credit facilities, our subsidiaries may also enter into additional agreements that contain covenants prohibiting them from distributing or advancing funds or transferring assets to us under certain circumstances, including to pay dividends.
Our subsidiaries are separate and distinct legal entities. Any right that we have to receive any assets of or distributions from any of our subsidiaries upon the bankruptcy, dissolution, liquidation or reorganization, or to realize proceeds from the sale of their assets, will be junior to the claims of that subsidiary’s creditors, including trade creditors and holders of debt that the subsidiary issued.
Changes in our credit profile may affect our relationship with our suppliers, which could have a material adverse effect on our liquidity.
Changes in our credit profile may affect the way our suppliers view our ability to make payments and may induce them to shorten the payment terms of their invoices if they perceive our indebtedness to be high. Given the large dollar amounts and volume of our purchases from suppliers, a change in payment terms may have a material adverse effect on our liquidity and our ability to make payments to our suppliers and, consequently, may have a material adverse effect on us.
If tariffs, quotas and duties on imports into the U.S. of certain of the products that we sell are lifted or imposed, we could have too many of these products in inventory competing against less expensive imports or conversely pay higher prices for products that we sell.
U.S. law currently imposes tariffs and duties on imports from certain foreign countries of line pipe and certain other products that we sell. If these tariffs and duties are lifted or reduced or if the level of these imported products otherwise increase, and our U.S. customers accept these imported products, we could be materially and adversely affected to the extent that we would then have higher-cost products in our inventory or experience lower prices and margins due to increased supplies of these products that could drive down prices and margins. If prices of these products were to decrease significantly, we might not be able to profitably sell these products, and the value of our inventory would decline. In addition, significant price decreases could result in a significantly longer holding period for some of our inventory. Conversely, if tariffs and duties are imposed on imports from certain foreign countries of products that we sell, we could be required to pay higher prices for our products. Demand for the products we distribute, the actions of our competitors and other factors will influence whether we will be able to pass on additional cost increases to our customers, and we may be unsuccessful in doing so.
A transition to alternative forms of energy could adversely impact our customers, result in lower sales and adversely impact our results and financial condition.
If through legislation, treaty or consumer preference demand for oil and gas is substantially reduced through the use of alternative forms of energy, we could experience a reduction in sales to our existing customers, which could adversely impact our results and financial condition.
We are subject to strict environmental, health and safety laws and regulations that may lead to significant liabilities and negatively impact the demand for our products.
We are subject to a variety of federal, state, local, foreign and provincial environmental, health and safety laws, regulations and permitting requirements (collectively, “environmental laws”), including those governing the following:
| ● | the discharge of pollutants or hazardous substances into the air, soil or water; |
| ● | the generation, handling, use, management, storage and disposal of, or exposure to, hazardous substances and wastes; |
| ● | the responsibility to investigate, remediate, monitor and clean up |
● |
|
occupational health and safety.
Our failure to comply with applicable environmental laws could result in fines, penalties, enforcement actions, employee, neighbor or other third-party claims for property damage and personal injury, requirements to clean up property or to pay for the costs of cleanup or regulatory or judicial orders requiring corrective measures, including the installation of pollution control equipment or remedial actions.
Certain environmental laws, such as the U.S. federal Superfund law or its state or foreign equivalents, may impose the obligation to investigate, remediate, monitor and clean up contamination at a facility on current and former owners, lessees or operators or on persons who may have sent waste to that facility for disposal. These environmental laws may impose liability without regard to fault or to the legality of the activities giving rise to the contamination. Although we are not aware of any active litigation against us under the U.S. federal Superfund law or its state or foreign equivalents, we have identified contamination at several of our current and former facilities, and we have incurred and will continue to incur costs to investigate, remediate, monitor and clean up these conditions. Moreover, we may incur liabilities in connection with environmental conditions currently unknown to us relating to our
12
prior, existing or future owned or leased sites or operations or those of predecessor companies whose liabilities we may have assumed or acquired. We believe that indemnities contained in certain of our acquisition agreements may cover certain environmental conditions existing at the time of the acquisition subject to certain terms, limitations and conditions. However, if these indemnification provisions terminate or if the indemnifying parties do not fulfill their indemnification obligations, we may be subject to liability with respect to the environmental matters that those indemnification provisions address. Although our responsibility for the clean-up of contamination or pollution to date has not been material, were there to be a significant release of contamination or pollution related to our past or current operations, our obligation to clean up that contamination or pollution could have a material adverse effect on our business, financial position, results of operations or cash flows.
Certain governments at the international, national, regional and state level are at various stages of considering or implementing treaties and environmental laws that could limit emissions of greenhouse gases, including carbon dioxide, associated with the burning of fossil fuels. It is not possible to predict how new environmental laws to address greenhouse gas emissions would impact our business or that of our customers, but these laws and regulations could impose costs on us or negatively impact the market for the products we distribute and, consequently, our business.
In addition, federal, state, local, foreign and provincial governments have adopted, or are considering the adoption of, environmental laws that could impose more stringent permitting; disclosure; wastewater and other waste disposal; greenhouse gas, ethane or volatile organic compound control, leak detection and repair requirements; and well construction and testing requirements on our customers’ hydraulic fracturing.
Environmental laws applicable to our business and the business of our customers, including environmental laws regulating the energy industry, and the interpretation or enforcement of these environmental laws, are constantly evolving; it is impossible to predict accurately the effect that changes in these environmental laws, or their interpretation or enforcement, may have upon our business, financial condition or results of operations. Should environmental laws, or their interpretation or enforcement, become more stringent, our costs, or the costs of our customers, could increase, which may have a material adverse effect on our business, financial position, results of operations or cash flows.
We may not have adequate insurance for potential liabilities, including liabilities arising from litigation.
In the ordinary course of business, we have, and in the future, may become the subject of various claims, lawsuits and administrative proceedings seeking damages or other remedies concerning our commercial operations, the products we distribute, employees and other matters, including potential claims by individuals alleging exposure to hazardous materials as a result of the products we distribute or our operations. Some of these claims may relate to the activities of businesses that we have acquired, even though these activities may have occurred prior to our acquisition of the businesses. The products we distribute are sold primarily for use in the energy industry, which is subject to inherent risks that could result in death, personal injury, property damage, pollution, release of hazardous substances or loss of production. In addition, defects in the products we distribute could result in death, personal injury, property damage, pollution, release of hazardous substances or damage to equipment and facilities. Actual or claimed defects in the products we distribute may give rise to claims against us for losses and expose us to claims for damages.
We maintain insurance to cover certain of our potential losses, and we are subject to various self-insured retentions, deductibles and caps under our insurance. It is possible, however, that judgments could be rendered against us in cases in which we would be uninsured and beyond the amounts of insurance we have or beyond the amounts that we currently have reserved or anticipate incurring for these matters. Even a partially uninsured claim, if successful and of significant size, could have a material adverse effect on us. Furthermore, we may not be able to continue to obtain insurance on commercially reasonable terms in the future, and we may incur losses from interruption of our business that exceed our insurance coverage. Even in cases where we maintain insurance coverage, our insurers may raise various objections and exceptions to coverage that could make uncertain the timing and amount of any possible insurance recovery. Finally, while we may have insurance coverage, we cannot guarantee that the insurance carrier will have the financial wherewithal to pay a claim otherwise covered by insurance, and as a result we may be responsible for any such claims.
Due to our position as a distributor, we are subject to personal injury, product liability and environmental claims involving allegedly defective products.
Our customers use certain of the products we distribute in potentially hazardous applications that can result in personal injury, product liability and environmental claims. A catastrophic occurrence at a location where end users use the products we distribute may result in us being named as a defendant in lawsuits asserting potentially large claims, even though we did not manufacture the products. Applicable law may render us liable for damages without regard to negligence or fault. In particular, certain environmental laws provide for joint and several and strict liability for remediation of spills and releases of hazardous substances. Certain of these risks are reduced by the fact that we are a distributor of products that third-party manufacturers produce, and, thus, in certain circumstances, we may have third-party warranty or other claims against the manufacturer of products alleged to have been defective. However, there is no assurance that these claims could fully protect us or that the manufacturer would be able financially to provide protection. There is no assurance that our insurance coverage will cover or be adequate to cover the underlying claims. Our insurance does not provide
13
coverage for all liabilities (including but not limited to liability for certain events involving pollution or other environmental claims). Our insurance does not cover damages from breach of contract by us or based on alleged fraud or deceptive trade practices.
We are a defendant in asbestos-related lawsuits. Exposure to these and any future lawsuits could have a material adverse effect on us.
We are a defendant in lawsuits involving approximately 1,1661,153 claims, arising from exposure to asbestos-containing materials included in products that we are alleged to have distributed. Each claim involves allegations of exposure to asbestos-containing materials by a single individual, his or her spouse or family members. The complaints in these lawsuits typically name many other defendants. In the majority of these lawsuits, little or no information is known regarding the nature of the plaintiffs’ alleged injuries or their connection with the products we distributed. Based on our experience with asbestos litigation to date, as well as the existence of certain insurance coverage, we do not believe that the outcome of these pending claims will have a material impact on us. However, theThe potential liability associated with asbestos claims is subject to many uncertainties, including negative trends with respect to settlement payments, dismissal rates and the types of medical conditions alleged in pending or future claims, negative developments in the claims pending against us, the current or future insolvency of co-defendants, adverse changes in relevant laws or the interpretation of those laws and the extent to which insurance will be available to pay for defense costs, judgments or settlements. In addition, applicable insurance policies are subject to overall caps on limits, which coverage may exhaust the amount available from insurers under those limits. In those cases, the Company is seeking indemnity payments from responsive excess insurance policies, but other insurers may not be solvent or may not make payments under the policies without contesting their liability. Further, while we anticipate that additional claims will be filed against us in the future, we are unable to predict with any certainty the number, timing and magnitude of future claims. Therefore, we can give no assurance that pending or future asbestos litigation will notmay ultimately have a material adverse effect on us. See “Item 7—Management’s Discussion and Analysis of Financial Condition and Results of Operations—Contractual Obligations, Commitments and Contingencies—Legal Proceedings” and “Item 3—Legal Proceedings” for more information.
If we lose any of our key personnel, we may be unable to effectively manage our business or continue our growth.
Our future performance depends to a significant degree upon the continued contributions of our management team and our ability to attract, hire, train and retain qualified managerial, sales and marketing personnel. In particular, we rely on our sales and marketing teams to create innovative ways to generate demand for the products we distribute. The loss or unavailability to us of any member of our management team or a key sales or marketing employee could have a material adverse effect on us to the extent we are unable to timely find adequate replacements. We face competition for these professionals from our competitors, our customers and other companies operating in our industry. We may be unsuccessful in attracting, hiring, training and retaining qualified personnel.
Adverse health events, such as a pandemic, could adversely impact our business.
From time to time, various diseases have spread across the globe such as COVID-19, SARS and the avian flu. If a disease spreads sufficiently to cause an epidemic or a pandemic, the ability to operate our business or the businesses of our suppliers, contractors or customers could be reduced. In addition, our supply chain that spans over 40 countries could be negatively impacted. Such an adverse health event could adversely impact our business.
Interruptions in the proper functioning of our information systems could disrupt operations and cause increases in costs or decreases in revenue.
The proper functioning of our information systems is critical to the successful operation of our business. We depend on our information management systems to process orders, track credit risk, purchase, and manage inventory and monitor accounts receivable collections. Our information systems also allow us to efficiently purchase products from our vendors and ship products to our customers on a timely basis, maintain cost-effective operations and provide superior service to our customers. However, our information systems are vulnerable to natural disasters, power losses, telecommunication failures, cyber incidents and other problems. If critical information systems fail or are otherwise unavailable, our ability to procure products to sell, process and ship customer orders, identifyoperate our business opportunities, maintain proper levels of inventories, collect accounts receivable and pay accounts payable and expenses could be adversely affected. In addition, the cost to repair, modify or replace all or part of our information systems or consolidate one or more systems onto one information technology platform, whether by necessity or choice, would require a significant cash investment on the part of the Company. Our ability to integrate our systems with our customers’ systems would also be significantly affected. We maintain information systems controls designed to protect against, among other things, unauthorized program changes and unauthorized access to data on our information systems. If our information systems controls do not function properly, we face increased risks of unexpected errors and unreliable financial data or theft of proprietary Company information.
The occurrence of cyber incidents, or a deficiency in our cybersecurity, could negatively impact our business by causing a disruption to our operations, a compromise or corruption of our confidential information or damage to our Company’s image or reputation, all of which could negatively impact our financial results.
A cyber incident is considered to be any adverse event that threatens the confidentiality, integrity or availability of our information resources. More specifically, a cyber incident is an intentional attack or an unintentional event that can include gaining unauthorized access to systems to disrupt operations, corrupt data or steal confidential information. As our reliance on technology has increased, so have the risks posed to our systems, both internal and those we have outsourced. Our three primary risks that could directly result from the occurrence of a cyber incident include operational interruption, damage to our Company’s reputation and image and private data exposure. We have implemented hardware and software solutions, processes, training and procedures to help mitigate this risk, but these measures, as well as our organization’s increased awareness of our risk of a cyber incident, such measures may fail and do not guarantee that our financial results and operations will not be negatively impacted by such an incident. While we also have some insurance to protect against the financial damage that a cyber incident could cause, there can be no guarantee that the insurance wouldmay not be adequate for every type of incident to protect against the financial damages that could occur. In some incidents, the Company may be required to shut off its
14
computer systems, reboot them and reestablish its information from back up sources. In other incidents, the Company may be required under various laws to notify any third parties whose data has been compromised. These incidents can adversely affect us.
Among others, cyber incidents could include the following:
| ● | Denial of service attacks, whereby third parties attempt to slow down or shut down our computer systems by overloading information interfaces, which in turn, could interrupt our operations. |
| ● | Computer virus software that infects our computer systems to either allow third parties unauthorized access to private, confidential data or denies the Company access from its own information, often for the attacker’s financial gain by demanding a ransom. |
| ● | Theft of private information. An unauthorized disclosure of sensitive or confidential supplier, customer or Company information or employee information could cause a theft or unwanted disclosure of data. |
| ● | E-mail or other forms of spoofing or “phishing” whereby third parties attempt to trick or induce employees to provide private information, such as passwords, social security numbers or other identifying information, to allow the third party to fraudulently attempt to invoice the Company or gain access to the Company’s computer systems. |
| ● | Intrusion into payment systems. The Company does not generally accept credit cards for payment as most of its customers are industrial and energy companies who provide payment through invoicing processes. Even so, a portion of our payment methods also subject us to potential fraud and theft by criminals, who are becoming increasingly more sophisticated, seeking to obtain unauthorized access to or exploit weaknesses that may exist in the payment systems. |
| ● | Supplier or customer cyber incidents. Our suppliers and customers also rely upon computer information systems to operate their respective businesses. If any of them experience a cyber incident, this could adversely impact their operations. Suppliers could delay providing product to us for our distribution to our customers. Customers, especially those who do business with us through electronic data interchanges, could be negatively impacted by cyber incidents applicable to them, which, could slow order processing from them or payments to us. |
| ● | Cyber incidents applicable to outsourced information systems. We outsource the operations of a significant portion of our computer information systems to third party service providers, which store our information on hosted or cloud systems. Although we review their security precautions with them and attempt to hold them contractually responsible for cyber incidents applicable to our information on their systems |
The loss of third-party transportation providers upon whom we depend, or conditions negatively affecting the transportation industry, could increase our costs or cause a disruption in our operations.
We depend upon third-party transportation providers for delivery of products to our customers. Strikes, slowdowns, transportation disruptions or other conditions in the transportation industry, including, among others, shortages of truck drivers, disruptions in rail service, increases in fuel prices and adverse weather conditions, could increase our costs and disrupt our operations and our ability to service our customers on a timely basis. We cannot predict whether or to what extent increases or anticipated increases in fuel prices may impact our costs or cause a disruption in our operations going forward.
We may need additional capital in the future, and it may not be available on acceptable terms, or at all.
We may require more capital in the future to:
| ● | fund our operations; |
| ● | finance investments in equipment and infrastructure needed to maintain and expand our distribution capabilities; |
| ● | enhance and expand the range of products we offer; and |
● |
|
|
We can give no assurance that additional
Additional financing willmay not be available on terms favorable to us, or at all. The terms of available financing may place limits on our financial and operating flexibility. If adequate funds are not available on acceptable terms, we may be forced to reduce our operations or delay, limit or abandon expansion opportunities. Moreover, even if we are able to continue our operations, the failure to obtain additional financing could reduce our competitiveness.
Adverse weather events or natural disasters could negatively affect our local economies or disrupt our operations.
Certain areas in which we operate have been susceptible to more frequent and more severe weather events, such as hurricanes, tornadoes and floods and to natural disasters such as earthquakes.earthquakes and fires. These events can disrupt our operations, result in damage to our properties and negatively affect the local economies in which we operate. Additionally, we may experience communication disruptions with our customers, vendors and employees. These events can cause physical damage to our branches and require us to
15
close branches. Additionally, our sales order backlog and shipments can experience a temporary decline immediately following these events.
We cannot predict whether or to what extent damage caused by these events will affect our operations or the economies in regions where we operate. These adverse events could result in disruption of our purchasing or distribution capabilities, interruption of our business that exceeds our insurance coverage, our inability to collect from customers and increased operating costs. Our business or results of operations may be adversely affected by these and other negative effects of these events.
We have a substantial amount of goodwill and other intangible assets recorded on our balance sheet, partly because of acquisitions and business combination transactions. The amortization of acquired intangible assets will reduce our future reported earnings. Furthermore, if our goodwill or other intangible assets become impaired, we may be required to recognize non-cash charges that would reduce our income.
As of December 31, 2018,2020, we had $806$493 million of goodwill and other intangibles recorded on our consolidated balance sheet. A substantial portion of these intangible assets results from our use of purchase accounting in connection with the acquisitions we have made over the past several years. In accordance with the purchase accounting method, the excess of the cost of an acquisition over the fair value of identifiable tangible and intangible assets is assigned to goodwill. The amortization expense associated with our identifiable intangible assets will have a negative effect on our future reported earnings. Many other companies, including many of our competitors, may not have the significant acquired intangible assets that we have because they may not have participated in recent acquisitions and business combination transactions similar to ours. Thus, the amortization of identifiable intangible assets may not negatively affect their reported earnings to the same degree as ours.
Additionally, under U.S. generally accepted accounting principles, goodwill and certain other indefinite-lived intangible assets are not amortized, but must be reviewed for possible impairment annually, or more often in certain circumstances where events indicate that the asset values are not recoverable. These reviews could result in an earnings charge for impairment, which would reduce our net income even though there would be no impact on our underlying cash flow. During the year ended December 31, 2020, we recognized impairment charges of $217 million for goodwill and $25 million for our indefinite-lived intangible asset.
We face risks associated with conducting business in markets outside of North America.
We currently conduct substantial business in countries outside of North America. We could be materially and adversely affected by economic, legal, political and regulatory developments in the countries in which we do business in the future or in which we expand our business, particularly those countries which have historically experienced a high degree of political or economic instability. Examples of risks inherent in such non-North American activities include:
| ● | changes in the political and economic conditions in the countries in which we operate, including civil uprisings and terrorist acts; |
| ● | unexpected changes in regulatory requirements; |
| ● | changes in tariffs; |
| ● | the adoption of foreign or domestic laws limiting exports to or imports from certain foreign countries; |
● |
|
|
| ● | restrictions on repatriation of earnings; |
| ● | expropriation of property without fair compensation; |
| ● | governmental actions that result in the deprivation of contract or proprietary rights; and |
● |
| the acceptance of business practices which are not consistent with or are antithetical to prevailing business practices |
If we begin doing business in a foreign country in which we do not presently operate, we may also face difficulties in operations and diversion of management time in connection with establishing our business there.
We are subject to U.S. and other anti-corruption laws, trade controls, economic sanctions, and similar laws and regulations, including those in the jurisdictions where we operate. Our failure to comply with these laws and regulations could subject us to civil, criminal and administrative penalties and harm our reputation.
Doing business on a worldwide basis requires us to comply with the laws and regulations of the U.S. government and various foreign jurisdictions. These laws and regulations place restrictions on our operations, trade practices, partners and investment decisions. In particular, our operations are subject to U.S. and foreign anti-corruption and trade control laws and regulations, such as the Foreign Corrupt Practices Act (“FCPA”), export controls and economic sanctions programs, including those administered by the U.S. Treasury Department’s Office of Foreign Assets Control (“OFAC”). As a result of doing business in foreign countries and with foreign partners, we are exposed to a heightened risk of violating anti-corruption and trade control laws and sanctions regulations.
16
The FCPA prohibits us from providing anything of value to foreign officials for the purposes of obtaining or retaining business or securing any improper business advantage. It also requires us to keep books and records that accurately and fairly reflect the Company’s transactions. As part of our business, we may deal with state-owned business enterprises, the employees of which are considered foreign officials for purposes of the FCPA. In addition, the provisions of the United Kingdom Bribery Act (the “Bribery Act”) extend beyond bribery of foreign public officials and also apply to transactions with individuals that a government does not employ. The provisions of the Bribery Act are also more onerous than the FCPA in a number of other respects, including jurisdiction, non-exemption of facilitation payments and penalties. Some of the international locations in which we operate lack a developed legal system and have higher than normal levels of corruption. Our continued expansion outside the U.S., including in developing countries, and our development of new partnerships and joint venture relationships worldwide, could increase the risk of FCPA, OFAC or Bribery Act violations in the future.
Economic sanctions programs restrict our business dealings with certain sanctioned countries, persons and entities. In addition, because we act as a distributor, we face the risk that our customers might further distribute our products to a sanctioned person or entity, or an ultimate end-user in a sanctioned country, which might subject us to an investigation concerning compliance with OFAC or other sanctions regulations.
Violations of anti-corruption and trade control laws and sanctions regulations are punishable by civil penalties, including fines, denial of export privileges, injunctions, asset seizures, debarment from government contracts and revocations or restrictions of licenses, as well as criminal fines and imprisonment. We have established policies and procedures designed to assist our compliance with applicable U.S. and international anti-corruption and trade control laws and regulations, including the FCPA, the Bribery Act and trade controls and sanctions programs that OFAC administers, and have trained our employees to comply with these laws and regulations. However, there can be no assurance that all of our employees, consultants, agents or other associated persons will not take actions in violation of our policies and these laws and regulations, and that our policies and procedures will effectively prevent us from violating these regulations in every transaction in which we may engage or provide a defense to any alleged violation. In particular, we may be held liable for the actions that our local, strategic or joint venture partners take inside or outside of the United States, even though our partners may not be subject to these laws. Such a violation even if our policies prohibit it, could have a material adverse effect on our reputation, business, financial condition and results of operations. In addition, various state and municipal governments, universities and other investors maintain prohibitions or restrictions on investments in companies that do business with sanctioned countries, persons and entities, which could adversely affect the market for our common stock and other securities.
We face risks associated with international instability and geopolitical developments.
In some countries, there is an increased chance for economic, legal or political changes that may adversely affect the performance of our services, sale of our products or repatriation of our profits. We do not know the impact that these regulatory, geopolitical and other factors may have on our business in the future and any of these factors could adversely affect us. In addition, war, terrorist acts, civil wars or armed hostilities, or the public anticipation of these events, could negatively impact our business.
We are exposed to risks relating to evaluations of controls required by Section 404 of the Sarbanes-Oxley Act of 2002 (the “Sarbanes-Oxley Act”).
Section 404 of the Sarbanes-Oxley Act requires us to annually evaluate our internal controls systems over financial reporting. This is not a static process as we may change our processes each year or acquire new companies that have different controls than our existing controls. Upon completion of this process each year, we may identify control deficiencies of varying degrees of severity under applicable U.S. Securities and Exchange Commission (“SEC”) and Public Company Accounting Oversight Board (“PCAOB”) rules and regulations that remain unremediated. We are required to report, among other things, control deficiencies that constitute a “material weakness” or changes in internal controls that, or that are reasonably likely to, materially affect internal controls over financial reporting. A “material weakness” is a significant deficiency or combination of significant deficiencies in internal control over financial reporting that results in a reasonable possibility that a material misstatement of the annual or interim financial statements will not be prevented or detected and corrected on a timely basis.
We could suffer a loss of confidence in the reliability of our financial statements if we or our independent registered public accounting firm reports a material weakness in our internal controls, if we do not develop and maintain effective controls and procedures or if we are otherwise unable to deliver timely and reliable financial information. Any loss of confidence in the reliability of our financial statements or other negative reaction to our failure to develop timely or adequate disclosure controls and procedures or internal controls could result in a decline in the price of our common stock. In addition, if we fail to remedy any material weakness, our financial statements may be inaccurate, we may face restricted access to the capital markets and our stock price may be adversely affected.
We do not currently intend to pay dividends to our common stockholders in the foreseeable future.
It is uncertain when, if ever, we will declare dividends to our common stockholders. We do not currently intend to pay dividends to our common stockholders in the foreseeable future. Our ability to pay dividends to our common stockholders is constrained by our holding company structure under which we are dependent on
17
our subsidiaries for payments. Additionally, we and our subsidiaries are parties to credit agreements which restrict our ability and their ability to pay dividends. See “Item 5—Market for the Registrant’s Common Equity, Related Stockholder Matters and Issuer Purchases of Equity Securities” and “Item 7—Management’s Discussion and Analysis of Financial Condition and Results of Operations—Liquidity and Capital Resources”.
Compliance with and changes in laws and regulations in the countries in which we operate could have a significant financial impact and affect how and where we conduct our operations.
We have operations in the U.S. and in 2116 other countries. Expected and unexpected changes in the business and legal environments in the countries in which we operate can impact us. Compliance with and changes in laws, regulations and other legal and business issues could impact our ability to manage our costs and to meet our earnings goals. Compliance related matters could also limit our ability to do business in certain countries. Changes that could have a significant cost to us include new legislation, new regulations, or a differing interpretation of existing laws and regulations, changes in tax law or tax rates, the unfavorable resolution of tax assessments or audits by various taxing authorities, changes in trade and other treaties that lead to differing tariffs and trade rules, the expansion of currency exchange controls, export controls or additional restrictions on doing business in countries subject to sanctions in which we operate or intend to operate.
ITEM 1B. UNRESOLVED STAFF COMMENTS
UNRESOLVED STAFF COMMENTS |
Not applicable.
PROPERTIES |
In North America, we operate a hub and spoke model that is centered around our 9seven distribution centers in the U.S. and Canada with 12094 branch locations which have inventory and local employees and house 13 valve and engineering service centers. Our U.S. network is comprised of 10085 branch locations and eightsix distribution centers. We own our Charleston, West Virginia corporate office. In Canada, we have 209 branch locations and we own our one distribution center in Nisku, Alberta, Canada.center. We own less than 10%5% of our branch locations as we primarily lease these facilities. All of our distribution centers are leased.
Outside North America, we operate through a network of 4922 branch locations located throughout Europe, Asia, Australasia, the Middle East and Caspian, including six distribution centers in the United Kingdom, Norway, Singapore, the Netherlands, the United Arab Emirates and Australia. Twelve valve and engineering service centers are housed within our distribution centers and branch locations. We own our Brussels, Belgium location, and the remainder of our locations are leased.
Our Company maintains its principal executive office at 1301 McKinney Street, Suite 2300, Houston, Texas, 77010 and also maintains corporate offices in Charleston, West Virginia and LaPorte,La Porte, Texas. These locations have corporate functions such as executive management, accounting, human resources, legal, marketing, supply chain management, business development and information technology.
ITEM 3.
LEGAL PROCEEDINGS |
From time to time, we have been subject to various claims and involved in legal proceedings incidental to the nature of our businesses. We maintain insurance coverage to reduce financial risk associated with certain of these claims and proceedings. It is not possible to predict the outcome of these claims and proceedings. However, in our opinion, there are no pending legal proceedings that upon resolution are likely to have a material effect on our business, financial condition, results of operations or cash flows.
Also, from time to time, in the ordinary course of our business, our customers may claim that the products that we distribute are either defective or require repair or replacement under warranties that either we or the manufacturer may provide to the customer. These proceedings are, in the opinion of management, ordinary and routine matters incidental to our normal business. Our purchase orders with our suppliers generally require the manufacturer to indemnify us against any product liability claims, leaving the manufacturer ultimately responsible for these claims. In many cases, state, provincial or foreign law provides protection to distributors for these sorts of claims, shifting the responsibility to the manufacturer. In some cases, we could be required to repair or replace the products for the benefit of our customer and seek our recovery from the manufacturer for our expense. In the opinion of management, the ultimate disposition of these claims and proceedings are not expected to have a material adverse effect on our financial position, results of operations or cash flows.
For information regarding asbestos cases in which we are a defendant and other claims and proceedings, see “Item 7—Management’s Discussion and Analysis of Financial Condition and Results of Operations—Contractual Obligations, Commitments and Contingencies—Legal Proceedings” and “Note 16—17—Commitments and Contingencies” to our audited consolidated financial statements included elsewhere in this report.
MINE SAFETY DISCLOSURES |
18Not applicable.
ITEM 4.MINE SAFETY DISCLOSURES
Not applicable.
19
EXECUTIVE OFFICERS OF THE REGISTRANT
The name, age, period of service and the title of each of our executive officers as of February 15, 201912, 2021 are listed below.
Andrew R. Lane, age 59,61,has served as our president and chief executive officer (“CEO”) since September 2008. He has also served as a director of MRC Global Inc. since September 2008 and was chairman of the board from December 2009 to April 2016. From December 2004 to December 2007, he served as executive vice president and chief operating officer of Halliburton Company, a global oilfield services company. Prior to that, he held a variety of leadership roles within Halliburton. Mr. Lane received a B.S. in mechanical engineering from Southern Methodist University in 1981 (cum laude). He also completed the Advanced Management Program (“A.M.P.”) at Harvard Business School in 2000. Mr. Lane has announced his intent to retire on December 31, 2021, and the Company’s board of directors (the “Board”) is undertaking a process to name his successor.
James E. BraunKelly Youngblood, age 59,55, has served as our executive vice president and chief financial officer since March 1, 2020 and executive vice president since November 2011. In addition2019. Mr. Youngblood brings more than 30 years of extensive energy and finance expertise to financial functions, since January 2019, Mr. Braun oversees our information technology function.MRC Global. Prior to joining the Company, Mr. BraunYoungblood served as executive vice president and chief financial officer of Newpark Resources, Inc. since 2006. Newpark provides drilling fluidsBJ Services, a leading pressure pumping services provider in North America, from December 2017 to November 2019 and other productsprior to that was the senior vice president and services to the oil and gas exploration and production industry, both inside and outside of the U.S. Before joining Newpark, Mr. Braun was chief financial officer at Diamond Offshore Drilling, Inc. from 2016 to 2017. He has also held a variety of Baker Oil Tools, onefinance and accounting positions of the largest divisions of Baker Hughes Incorporated, a leading provider of drilling, formation evaluation, completion and production products and services to the worldwide oil and gas industry. From 1998 until 2002, he wasincreasing responsibility at Halliburton, including vice president finance and administration of Baker Petrolite, the oilfield specialty chemical business division of Baker Hughes. Previously, he served as vice president and controller of Baker Hughes.investor relations. Mr. BraunYoungblood is a CPA and was formerly a partner with Deloitte & Touche. Mr. Braun received a B.A. in accountingAccounting from the University of Illinois at Urbana-Champaign.Cameron University.
Daniel J. Churay, age 56,58, has served as our executive vice president – corporate affairs, general counsel, chief human resources officer and corporate secretary since May 2012. In his current role, Mr. Churay manages the Company’s human resources, legal, risk and compliance, cyber security, external and government affairs and certain shared services functions. He also acts as corporate secretary to the Company’s board of directors.Board. Prior to May 2012, Mr. Churay served as executive vice president and general counsel since August 2011 and as our corporate secretary since November 2011. From December 2010 to June 2011, he served as president and CEO of Rex Energy Corporation, an independent oil and gas company. From September 2002 to December 2010, Mr. Churay served as executive vice president, general counsel and secretary of YRC Worldwide Inc., a transportation and logistics company. From 1985, he served in various legal roles with increasing responsibility with Baker Hughes Company. Mr. Churay received a bachelor’s degree in economics from the University of Texas and a juris doctorate from the University of Houston Law Center, where he was a member of the Law Review.
Grant Bates, age 47,49, is our senior vice president of strategy, corporate development and e-commerce since April 2020. In this role, he leads the implementation of our long-term business strategy, mergers and acquisitions and e-commerce initiatives. Prior to that he served as senior vice president of operations, International and Canada, and operational excellence sinceexcellence. Prior to January 2019. In this role, in addition to International2019, Mr. Bates was our senior vice president and Canada operations, he is responsible for our global quality, safety, health and environment (QHSE) and our transportation, warehouse operations, business processes and customer implementation teams. He previouslychief information officer led our information systems and operational excellence functions since April 2016. Mr. Bates previously led our Canada region since March 2014 and prior to that served as regional vice president of the Australasian region since March 2012. Mr. Bates holds a B.E. in mechanical engineering from the University of Newcastle, a graduate diploma in management and a Master of Business Administration from Deakin University.
John L. Bowhay, age 53,55, is our senior vice president –of international operations and global valves, automation, measurement and instrumentation ("VAMI"). Prior to that he served as senior vice president of supply chain management, valve and technical product sales since August 2015. He previously served as senior vice president of Asia Pacific and Middle East operations since August 2014. Before that, Mr. Bowhay served as vice president of European operations since August 2013. Prior to this role, Mr. Bowhay served as the managing director for our United Kingdom operations and prior to that role, he was the vice president of sales in the U.K. He brings more than 31 years of industry experience and valve expertise to the MRC Global team. Mr. Bowhay attended the London Business School.
G. Tod MossRance Long, age 57, is our senior vice president of U.S. Western Region operations since April 2016. From April 2016 until 2018, Mr. Moss also led our Canada operations. Since 2001, Mr. Moss has held multiple operational leadership positions at our Company. He has been involved in opening and expanding many of our service locations in the Rockies, Alaska and North Dakota,52, serves as well as our Cheyenne, Tulsa, Odessa and Bakersfield regional distribution centers. Prior to these roles, Mr. Moss was the branch manager in Salt Lake City, Utah from 1993 – 2001, and served as assistant product manager of tubular products from 1991-1993. His early career included various field positions including inside sales, outside sales and responsibility for coordinating the line pipe sales and inventory level in the Western U.S. Mr. Moss began with Vinson Supply in 1984, which was later acquired by Red Man Pipe & Supply (a predecessor to the Company). Mr. Moss attended the University of Utah.
Robert W. Stein, age 60, isour senior vice president of business development responsible for our business development efforts globally. Most recently he served as our vice president business development, midstream pipeline & gas utilities since April 2016.2013. Prior to this role, he served as vice president of line pipe and was responsible for all line pipe sales in the US. He previously ledjoined MRC Global as part of the acquisition of LaBarge Pipe and Steel in 2008. Rance holds a bachelor’s degree in construction from Southern Illinois University Edwardsville.
Jack McCarthy, age 55, currently serves as our downstreamsenior vice president of supply chain. Most recently, he served as our vice president of supply chain and integrated supply teams.technical sales. Prior to that Mr. Steinrole, Jack serviced as vice president of carbon steel pipe, fittings, flanges and VAMI supply chain management where he led our U.S. Southwestern region operations. He has been part ofline pipe team since 2011 with responsibilities for our carbon steel fittings and flanges being added in 2016. Prior to joining MRC Global since 1984with the acquisition of LaBarge Pipe and has servedSteel in a variety of2005, he held roles including regional and branch management, downstreamin business development, project servicessales and integrated supply. Mr. Stein receivedsales management in the industrial distribution industry for 17 years. Jack is a B.B.A. in business management from Sam Houston State University.graduate of the University of Illinois at Urbana-Champaign and is a former vice president and board member of the National Association of Steel Pipe Distributors.
20
Karl W. Witt, age 58,60, is our senior vice president of U.S. Eastern Region and Gulf CoastNorth America operations since April 2020 having previously been responsible for U.S. operations since 2016. Prior to that, he served in a variety of roles including seven years as regional vice president of the Eastern regionand Gulf Coast regions since 2013 and seven years as regional vice president of the Midwest sub-region as well as warehouse manager, outside sales representative, branch manager and vice president of operations with Joliet Valves, which was acquired by McJunkin Red Man Corporation (a predecessor to the Company)Company in 2001. Mr. Witt attended South Suburban College in Chicago.
Elton Bond, age 43,45, has served as our senior vice president and chief accounting officer since May 2011. From September 2009 to May 2011, he served as senior vice president and treasurer. Prior to that, he served as vice president of finance and compliance. Before that, Mr. Bond was the director of finance and compliance. He started his career with MRC Global as the acquisition development manager in April 2006. Prior to joining MRC Global, Mr. Bond was employed with Ernst & Young LLP from 1997 to 2006, serving in a variety of roles, including senior manager of assurance and advisory business services. Mr. Bond received a B.B.A. from Marshall University in 1997. He is a C.P.A., a chartered global management accountant and is a member of the American Institute of Certified Public Accountants as well as the West Virginia Society of Certified Public Accountants.
21
PART II
ITEM 5.MARKET FOR THE REGISTRANT’S COMMON EQUITY, RELATED STOCKHOLDER MATTERS AND ISSUER PURCHASES OF EQUITY SECURITIES
MARKET FOR THE REGISTRANT’S COMMON EQUITY, RELATED STOCKHOLDER MATTERS AND ISSUER PURCHASES OF EQUITY SECURITIES |
As of February 8, 2019,5, 2021, there were 226135 holders of record of the Company’s common stock.
The Company’s common stock is traded on the New York Stock Exchange (“NYSE”) under the symbol “MRC”.
Our board of directors has not declared any dividends on common stock during 20182020 or 20172019 and currently has no intention to declare any dividends.dividends on common stock.
The Company’s Global ABL Facility, Term Loan and our 6.5% Series A Convertible Perpetual Preferred Stock restrict our ability to declare cash dividends under certain circumstances. Any future dividends declared would be at the discretion of our board of directors and would depend on our financial condition, results of operations, cash flows, contractual obligations, the terms of our financing agreements at the time a dividend is considered, and other relevant factors.
Issuer Purchases of Securities
|
|
|
|
|
|
|
|
A summary of our purchases of MRC Global Inc. common stock during the fourth quarter of fiscal year 2018 is as follows: | |||||||
|
|
|
|
|
|
|
|
| Total Number of Shares Purchased |
| Average Price Paid per Share |
| Total number of Shares Purchased as Part of Publicly Announced Plans or Programs |
| Maximum Dollar Value of Shares that May Yet Be Purchased Under the Plans or Programs |
October 1 - October 31 | - |
| $ - |
| - |
| $ 150,000,000 |
November 1 - November 30 | 3,048,194 |
| $ 16.28 |
| 3,048,194 |
| $ 100,384,444 |
December 1 - December 31 | 1,676,715 |
| $ 15.20 |
| 1,676,715 |
| $ 74,905,515 |
|
|
|
|
|
|
|
|
| 4,724,909 |
|
|
|
|
|
|
|
|
|
|
|
|
|
|
|
|
|
|
|
|
|
|
|
|
|
|
|
|
|
|
|
|
|
|
|
|
|
|
|
|
|
|
|
|
|
|
| |||||||
22None.
PERFORMANCE GRAPH
The graph below compares the cumulative total shareholder return on our common stock to the S&P 500 Index and the Philadelphia Oil Service Sector Index. The total shareholder return assumes $100 invested on December 31, 2013,2015, in MRC Global Inc., the S&P 500 Index and the Philadelphia Oil Service Sector Index. It also assumes reinvestment of all dividends. The results shown in the graph below are not necessarily indicative of future performance.
Comparison of Cumulative Total Return
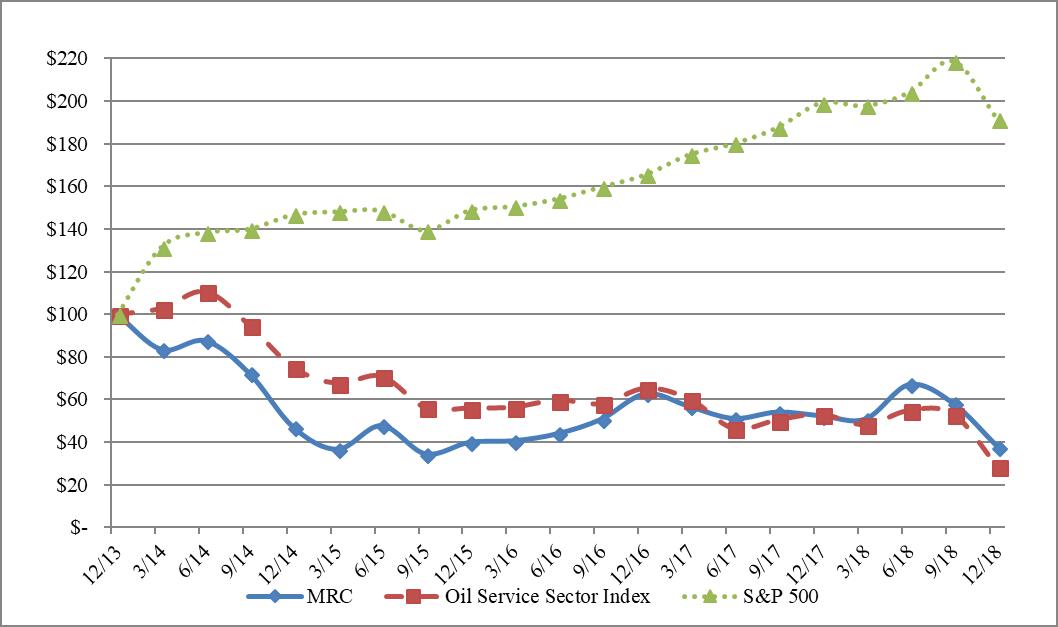
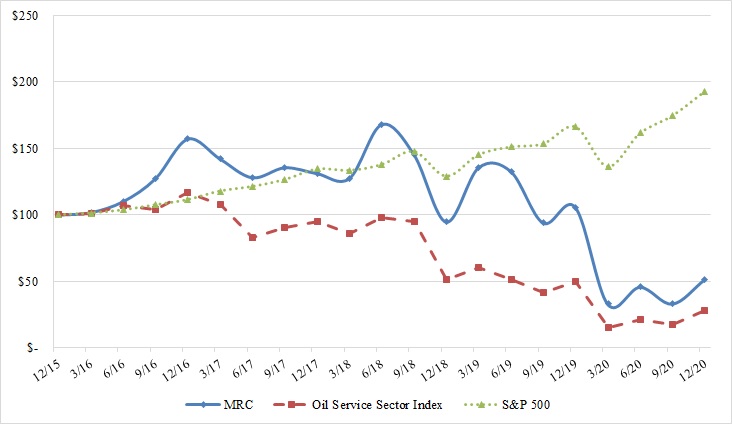
This information shall not be deemed to be ‘‘soliciting material’’ or to be ‘‘filed’’ with the SEC or subject to Regulation 14A (17 CFR 240.14a-1-240.14a-104), other than as provided in Item 201(e) of Regulation S-K, or to the liabilities of Section 18 of the Exchange Act (15 U.S.C. 78r).
SELECTED FINANCIAL DATA |
ITEM 6. SELECTED FINANCIAL DATA
The selected financial data presented below have been derived from the consolidated financial statements of MRC Global Inc. that have been prepared using accounting principles generally accepted in the United States of America and audited byAmerica. Ernst & Young LLP, our independent registered public accounting firm.firm, has audited these statements. This data should be read in conjunction with “Item 7—Management’s Discussion and Analysis of Financial Condition and Results of Operations” and the consolidated financial statements, related notes and other financial information included elsewhere in this report.
Year Ended December 31, | ||||||||||||||||||||
2020 | 2019 | 2018 | 2017 | 2016 | ||||||||||||||||
(in millions, except per share amounts) | ||||||||||||||||||||
Statement of Operations Data: | ||||||||||||||||||||
Sales | $ | 2,560 | $ | 3,662 | $ | 4,172 | $ | 3,646 | $ | 3,041 | ||||||||||
Cost of sales | 2,129 | 3,009 | 3,483 | 3,064 | 2,573 | |||||||||||||||
Gross profit | 431 | 653 | 689 | 582 | 468 | |||||||||||||||
Selling, general and administrative expenses | 449 | 550 | 562 | 536 | 524 | |||||||||||||||
Goodwill and intangible asset impairment | 242 | — | — | — | — | |||||||||||||||
Operating (loss) income | (260 | ) | 103 | 127 | 46 | (56 | ) | |||||||||||||
Other expenses: | ||||||||||||||||||||
Interest expense | (28 | ) | (40 | ) | (38 | ) | (31 | ) | (35 | ) | ||||||||||
Other, net | 5 | 3 | 6 | (8 | ) | — | ||||||||||||||
(Loss) income before income taxes | (283 | ) | 66 | 95 | 7 | (91 | ) | |||||||||||||
Income tax (benefit) expense | (9 | ) | 27 | 21 | (43 | ) | (8 | ) | ||||||||||||
Net (loss) income | (274 | ) | 39 | 74 | 50 | (83 | ) | |||||||||||||
Series A preferred stock dividends | 24 | 24 | 24 | 24 | 24 | |||||||||||||||
Net (loss) income attributable to common stockholders | $ | (298 | ) | $ | 15 | $ | 50 | $ | 26 | $ | (107 | ) | ||||||||
(Loss) earnings per share amounts: | ||||||||||||||||||||
| Basic | $ | (3.63 | ) | $ | 0.18 | $ | 0.55 | $ | 0.28 | $ | (1.10 | ) | ||||||||
| Diluted | $ | (3.63 | ) | $ | 0.18 | $ | 0.54 | $ | 0.27 | $ | (1.10 | ) | ||||||||
Weighted-average shares, basic | 82.0 | 83.0 | 90.1 | 94.3 | 97.3 | |||||||||||||||
Weighted-average shares, diluted | 82.0 | 83.9 | 91.8 | 95.6 | 97.3 | |||||||||||||||
Dividends (common) | — | — | — | — | — | |||||||||||||||
Year Ended December 31, | ||||||||||||||||||||
2020 | 2019 | 2018 | 2017 | 2016 | ||||||||||||||||
Balance Sheet Data: | ||||||||||||||||||||
Cash | $ | 119 | $ | 32 | $ | 43 | $ | 48 | $ | 109 | ||||||||||
Working capital (1) | 567 | 732 | 896 | 756 | 684 | |||||||||||||||
Total assets | 1,781 | 2,325 | 2,434 | 2,340 | 2,164 | |||||||||||||||
Long-term debt (2) | 383 | 551 | 684 | 526 | 414 | |||||||||||||||
Redeemable preferred stock | 355 | 355 | 355 | 355 | 355 | |||||||||||||||
Stockholders' equity | 350 | 642 | 692 | 759 | 763 | |||||||||||||||
Year Ended December 31, | ||||||||||||||||||||
2020 | 2019 | 2018 | 2017 | 2016 | ||||||||||||||||
Other Financial Data: | ||||||||||||||||||||
Net cash flow: | ||||||||||||||||||||
Operating activities | $ | 261 | $ | 242 | $ | (11 | ) | $ | (48 | ) | $ | 253 | ||||||||
Investing activities | 19 | (16 | ) | (14 | ) | (27 | ) | 16 | ||||||||||||
Financing activities | (195 | ) | (238 | ) | 24 | 9 | (226 | ) | ||||||||||||
(1) | Working capital is defined as current assets less current liabilities. |
(2) | Includes current portion of long-term debt. |
|
|
|
|
|
|
|
|
|
|
|
|
|
|
|
|
|
|
|
| Year Ended December 31, | |||||||||||||
|
|
| 2018 |
| 2017 |
| 2016 |
| 2015 |
| 2014 | |||||
|
|
|
| (in millions, except per share amounts) | ||||||||||||
Statement of Operations Data: |
|
|
|
|
|
|
|
|
|
|
|
|
|
|
|
|
Sales |
|
| $ | 4,172 |
| $ | 3,646 |
| $ | 3,041 |
| $ | 4,529 |
| $ | 5,933 |
Cost of sales |
|
|
| 3,483 |
|
| 3,064 |
|
| 2,573 |
|
| 3,743 |
|
| 4,915 |
Gross profit |
|
|
| 689 |
|
| 582 |
|
| 468 |
|
| 786 |
|
| 1,018 |
Selling, general and administrative expenses |
|
|
| 562 |
|
| 536 |
|
| 524 |
|
| 606 |
|
| 716 |
Goodwill and intangible asset impairment |
|
|
| - |
|
| - |
|
| - |
|
| 462 |
|
| - |
Operating income (loss) |
|
|
| 127 |
|
| 46 |
|
| (56) |
|
| (282) |
|
| 302 |
Other expenses: |
|
|
|
|
|
|
|
|
|
|
|
|
|
|
|
|
Interest expense |
|
|
| (38) |
|
| (31) |
|
| (35) |
|
| (48) |
|
| (62) |
Other, net |
|
|
| 6 |
|
| (8) |
|
| - |
|
| (12) |
|
| (14) |
Income (loss) before income taxes |
|
|
| 95 |
|
| 7 |
|
| (91) |
|
| (342) |
|
| 226 |
Income tax expense (benefit) |
|
|
| 21 |
|
| (43) |
|
| (8) |
|
| (11) |
|
| 82 |
Net income (loss) |
|
|
| 74 |
|
| 50 |
|
| (83) |
|
| (331) |
|
| 144 |
Series A preferred stock dividends |
|
|
| 24 |
|
| 24 |
|
| 24 |
|
| 13 |
|
| - |
Net income (loss) attributable to common stockholders |
|
| $ | 50 |
| $ | 26 |
| $ | (107) |
| $ | (344) |
| $ | 144 |
Earnings (loss) per share amounts: |
|
|
|
|
|
|
|
|
|
|
|
|
|
|
|
|
Basic |
|
| $ | 0.55 |
| $ | 0.28 |
| $ | (1.10) |
| $ | (3.38) |
| $ | 1.41 |
Diluted |
|
| $ | 0.54 |
| $ | 0.27 |
| $ | (1.10) |
| $ | (3.38) |
| $ | 1.40 |
Weighted-average shares, basic |
|
|
| 90.1 |
|
| 94.3 |
|
| 97.3 |
|
| 102.1 |
|
| 102.0 |
Weighted-average shares, diluted |
|
|
| 91.8 |
|
| 95.6 |
|
| 97.3 |
|
| 102.1 |
|
| 102.8 |
Dividends (common) |
|
|
| - |
|
| - |
|
| - |
|
| - |
|
| - |
|
|
|
|
|
|
|
|
|
|
|
|
|
|
|
|
|
|
|
| Year Ended December 31, | |||||||||||||
|
|
| 2018 |
| 2017 |
| 2016 |
| 2015 |
| 2014 | |||||
Balance Sheet Data: |
|
|
|
|
|
|
|
|
|
|
|
|
|
|
|
|
Cash |
|
| $ | 43 |
| $ | 48 |
| $ | 109 |
| $ | 69 |
| $ | 25 |
Working capital (1) |
|
|
| 896 |
|
| 756 |
|
| 684 |
|
| 960 |
|
| 1,504 |
Total assets |
|
|
| 2,434 |
|
| 2,340 |
|
| 2,164 |
|
| 2,497 |
|
| 3,869 |
Long-term debt (2) |
|
|
| 684 |
|
| 526 |
|
| 414 |
|
| 519 |
|
| 1,447 |
Redeemable preferred stock |
|
|
| 355 |
|
| 355 |
|
| 355 |
|
| 355 |
|
| - |
Stockholders' equity |
|
|
| 692 |
|
| 759 |
|
| 763 |
|
| 956 |
|
| 1,397 |
MANAGEMENT’S DISCUSSION AND ANALYSIS OF FINANCIAL CONDITION AND RESULTS OF OPERATIONS |
|
|
|
|
|
|
|
|
|
|
|
|
|
|
|
|
|
|
|
| Year Ended December 31, | |||||||||||||
|
|
| 2018 |
| 2017 |
| 2016 |
| 2015 |
| 2014 | |||||
Other Financial Data: |
|
|
|
|
|
|
|
|
|
|
|
|
|
|
|
|
Net cash flow: |
|
|
|
|
|
|
|
|
|
|
|
|
|
|
|
|
Operating activities |
|
| $ | (11) |
| $ | (48) |
| $ | 253 |
| $ | 690 |
| $ | (106) |
Investing activities |
|
|
| (14) |
|
| (27) |
|
| 16 |
|
| (41) |
|
| (362) |
Financing activities |
|
|
| 24 |
|
| 9 |
|
| (226) |
|
| (599) |
|
| 467 |
|
|
|
|
|
|
|
|
|
|
|
|
|
|
|
|
|
(1)Working capital is defined as current assets less current liabilities.
(2)Includes current portion of long-term debt.
24
ITEM 7. MANAGEMENT’S DISCUSSION AND ANALYSIS OF FINANCIAL CONDITION AND RESULTS OF OPERATIONS
You should read the following discussion and analysis of our financial condition and results of operations in conjunction with our financial statements and related notes included elsewhere in this report. This discussion and analysis contains forward-looking statements that involve risks, uncertainties and assumptions. Our actual results may differ materially from those anticipated in these forward-looking statements as a result of a number of factors, including, but not limited to, those set forth under “Cautionary Note Regarding Forward-Looking Statements” and “Item 1A—Risk Factors” and elsewhere in this report.
Cautionary Note Regarding Forward-Looking Statements
Management’s Discussion and Analysis of Financial Condition and Results of Operations (as well as other sections of this Annual Report on Form 10-K) contain forward-looking statementswithin the meaning of Section 27A of the Securities Act of 1933, as amended (the “Securities Act”), and Section 21E of the Securities Exchange Act of 1934, as amended (the “Exchange Act”). Forward-looking statements include those preceded by, followed by or including the words “will,” “expect,” “intended,” “anticipated,” “believe,” “project,” “forecast,” “propose,” “plan,” “estimate,” “enable,” and similar expressions, including, for example, statements about our business strategy, our industry, our future profitability, growth in the industry sectors we serve, our expectations, beliefs, plans, strategies, objectives, prospects and assumptions, and estimates and projections of future activity and trends in the oil and natural gas industry. These forward-looking statements are not guarantees of future performance. These statements are based on management’s expectations that involve a number of business risks and uncertainties, any of which could cause actual results to differ materially from those expressed in or implied by the forward-looking statements. These statements involve known and unknown risks, uncertainties and other factors, most of which are difficult to predict and many of which are beyond our control, including the factors described under “Item 1A -1A. Risk Factors,” that may cause our actual results and performance to be materially different from any future results or performance expressed or implied by these forward-looking statements. Such risks and uncertainties include, among other things:
| ● | decreases in oil and natural gas prices; |
| ● | decreases in oil and natural gas industry expenditure levels, which may result from decreased oil and natural gas prices or other factors; |
| ● | U.S. and international general economic conditions; |
| ● | our ability to compete successfully with other companies in our industry; |
| ● | the risk that manufacturers of the products we distribute will sell a substantial amount of goods directly to end users in the industry sectors we serve; |
| ● | unexpected supply shortages; |
| ● | cost increases by our suppliers; |
| ● | our lack of long-term contracts with most of our suppliers; |
| ● | suppliers’ price reductions of products that we sell, which could cause the value of our inventory to decline; |
| ● | decreases in steel prices, which could significantly lower our profit; |
| ● | increases in steel prices, which we may be unable to pass along to our customers which could significantly lower our profit; |
| ● | our lack of long-term contracts with many of our customers and our lack of contracts with customers that require minimum purchase volumes; |
| ● | changes in our customer and product mix; |
| ● | risks related to our customers’ creditworthiness; |
| ● | the success of our acquisition strategies; |
| ● | the potential adverse effects associated with integrating acquisitions into our business and whether these acquisitions will yield their intended benefits; |
| ● | our significant indebtedness; |
| ● | the dependence on our subsidiaries for cash to meet our obligations; |
| ● | changes in our credit profile; |
| ● | a decline in demand for or adverse change in the value of certain of the products we distribute if |
● |
| |
● | environmental, health and safety laws and regulations and the interpretation or implementation thereof; |
| ● | the sufficiency of our insurance policies to cover losses, including liabilities arising from litigation; |
25
| ● | product liability claims against us; |
| ● | pending or future asbestos-related claims against us; |
| ● | the potential loss of key personnel; |
● |
| |
● | interruption in the proper functioning of our information systems; |
| ● | the occurrence of cybersecurity incidents; |
| ● | loss of third-party transportation providers; |
| ● | potential inability to obtain necessary capital; |
| ● | risks related to adverse weather events or natural disasters; |
| ● | impairment of our goodwill or other intangible assets; |
| ● | adverse changes in political or economic conditions in the countries in which we operate; |
| ● | exposure to U.S. and international laws and regulations, including the Foreign Corrupt Practices Act and the U.K. Bribery Act and other economic sanctions programs; |
| ● | risks associated with international instability and geopolitical |
| ● | risks relating to ongoing evaluations of internal controls required by Section 404 of the Sarbanes-Oxley Act; |
| ● | our intention not to pay dividends; and |
● |
|
risks related to changing laws and regulations including trade policies and tariffs.
Undue reliance should not be placed on our forward-looking statements. Although forward-looking statements reflect our good faith beliefs, reliance should not be placed on forward-looking statements because they involve known and unknown risks, uncertainties and other factors, which may cause our actual results, performance or achievements to differ materially from anticipated future results, performance or achievements expressed or implied by such forward-looking statements. We undertake no obligation to publicly update or revise any forward-looking statement, whether as a result of new information, future events, changed circumstances or otherwise, except to the extent law requires.
Overview
We are the largest global industrial distributor based on sales, of pipe, valves, and fittings (“PVF”("PVF") and other infrastructure products and services to the energy industry, based on sales. We also sell our products and hold aprovide our services to industrial applications. We provide innovative supply chain solutions and technical product expertise to customers globally through our leading position in our industry across each of our diversified end-markets including the upstream (exploration, production and extraction of underground oil and natural gas), midstream (gathering and transmission of oil and natural gas, natural gas utilities and the storage and distribution of oil and natural gas) and downstream (crude oil refining, petrochemical and chemical, processing and general industrials) sectors. Our business is segregated into three geographic reportable segments, consisting of our U.S., Canada and International operations. We serve our customers from approximately 300 service locations. following sectors:
| ● | gas utilities (storage and distribution of natural gas) | |
| ● | downstream and industrial (crude oil refining and petrochemical and chemical processing and general industrials) | |
| ● | upstream production (exploration, production and extraction of underground oil and gas) | |
| ● | midstream pipeline (gathering, processing and transmission of oil and gas) |
We offer a wideover 200,000 SKUs, including an extensive array of PVF, oilfield supply, valve automation and oilfield supplies encompassing a complete line ofmodification, measurement, instrumentation and other general and specialty products from our global network of over 10,000 suppliers. With 100 years of history, our over 2,600 employees serve approximately 11,000 suppliers12,000 customers through approximately 230 service locations including regional distribution centers, branches, corporate offices and third party pipe yards, where we often deploy pipe near customer locations.
Our customers use the PVF and other infrastructure products that we supply in mission critical process applications that require us to provide a high degree of product knowledge, technical expertise and comprehensive value-added services to our approximately 15,000 customers. We are diversified by geography, the industry sectors we serve and the products we sell. We seek to provide best-in-class service to ourand a one-stop shop for customers by satisfying the most complex, multi-sitemulti- site needs of many of the largest companies in the energy sector as their primary PVF supplier. We believe the critical role we play in our customers’customers' supply chain, together with our extensive product and service offerings, broad global presence, customer-linked scalable information systems and efficient distribution capabilities, serve to solidify our long-standing customer relationships and drive our growth. As a result, we have an average relationship of over 25 years with our 25 largest customers.
Key Drivers of Our Business
Our revenue is predominantly derived from the sale of PVF and other oilfield and industrial supplies to the energy sector globally. OurIn addition to general economic conditions, our business is, therefore, dependent upon both the current conditions and future prospects in the energy industry and, in particular, maintenance and expansionary operating and capital expenditures by our customers in the gas utilities, downstream and industrial, upstream production and midstream and downstreampipeline sectors of the industry. Long-term growth in spending has been driven by several factors, including demand growth for petroleum and petroleum derived products, underinvestment in global energy infrastructure, growth in shale and unconventional exploration and production (“E&P”) activity, and anticipated strength in the oil, natural gas, refined products and petrochemical sectors. The outlook for future oil, natural gas, refined products and petrochemical PVF spending is influenced by numerous factors, including the following:
● |
| ||
| ● | Oil and Natural Gas
|
capital expenditures to explore for, produce and process oil, natural gas and refined products. Oil and natural gas prices, both current and projected, along with the costs necessary to produce oil and gas, impact other drivers of our business, including capital spending by customers, additions to and maintenance of pipelines, refinery utilization and petrochemical processing activity. |
● |
| Economic |
● |
| Manufacturer and Distributor Inventory Levels of PVF and Related |
● |
| Steel Prices, Availability and Supply and |
Recent Trends and Outlook
During 2018,2020, the average oil price of West Texas Intermediate (“WTI”) increaseddecreased to $65.23$39.16 per barrel compared to $50.80from $56.98 per barrel in 2017.2019. Natural gas prices increaseddecreased to an average price of $3.15/$2.03/Mcf (Henry Hub) for 20182020 compared to $2.99/$2.56/Mcf (Henry Hub) for 2017.2019. North American drilling rig activity increased 13%decreased 52% in 20182020 compared to 2017.2019. U.S. well completions were up 25%down 49% in 20182020 as compared to 2017. However, current2019.
The energy industry, and our business in turn, is cyclical in nature. In 2019, our customers demonstrated an increased focus on returns, which has affected the risk assessment related to new projects and resulted in a more disciplined approach to spending that continues to impact each of our business sectors with the exception of gas utilities. In the first half of 2020, demand for oil and natural gas prices aredeclined sharply as a result of the COVID-19 pandemic. As various governments implemented COVID-19 isolation orders, transportation use declined, energy use declined and manufacturing declined. As a result, oil consumption dropped dramatically. At the same time, OPEC and other oil producing nations were initially unable to reach an agreement on oil production levels. This lack of agreement, between Saudi Arabia and Russia in particular, escalated concerns over the potential for oversupply of oil during a period of weakened demand thereby causing a significant, sustained decline in commodity prices. Although major oil-producing nations subsequently responded by reducing oil production, the expected level of oil demand in the near term is projected to be substantially lower than 2018 averagespre-pandemic levels. Oil prices have recently improved due to near-term OPEC production cuts, but there remains significant uncertainty regarding the timing and consensus estimatesextent of a recovery. The pace of demand recovery could still possibly slow or pause as a result of additional waves of pandemic outbreak or heightened pandemic control measures. The possibility of a global recession or depression still exists and, over the longer term, we could experience a structural shift in the global economy and its demand for 2019 indicate WTI oil prices will be $50-$60 per barrel whileand natural gas will remain below $3.00/Mcf (Henry Hub).
In 2018, as compared to 2017, we saw customer spending increase by a high single digit percentage globally, including double digit growth in North America combined with more modest growth internationally. These positive macroeconomic variables combined with other favorable influences directly impacted eachresult of our business sectors. Healthy commodity prices and an emphasis on completing drilled but uncompleted wells (“DUCs”) benefited our upstream business. In addition, a more favorable regulatory environmentchanges in the United States has benefited our business, particularly in the midstream sector where we continue to see modernizationway people work, travel and integrity projects in the gas utility space, as well as increased demand for take away capacityinteract. As a result of these factors, based on an average of industry research estimates, there was a decrease in oil and gas producing basins. Our domesticindustry spending in 2020 of 32% globally, including approximately 45% in the U.S. upstream production market. These reductions in spending directly impact both the upstream production and midstream pipeline components of our business. In addition, we have seen our customers in the downstream and industrial sector has benefited fromseek to defer turnarounds and routine maintenance as well as idle facilities in order to preserve liquidity and comply with COVID-19 related limitations on employee activities. Furthermore, 79% of our business is concentrated in the improved access to and stability in pricingU.S. where the majority of industry spending reductions occurred. Given these developments, the risk of resurgence of the necessary feedstocks availableCOVID-19 virus and the continuing focus on capital discipline by oil and gas exploration and production operators, we experienced a sharp decline in sales beginning in the second quarter of 2020 and expect the market to remain challenged until there is a step-change improvement related to COVID-19 concerns, improving the outlook for global oil demand.
Notwithstanding the ongoing uncertainty, recent spending plan estimates by sell-side research analysts indicate possible outcomes ranging from increased, anda modest, single-digit improvement in some cases, newU.S. upstream production. These factors, combined withspending to a potential decline of up to 10% in 2021. While the completionmid-point of some major upstream, midstream and downstream projects, drove revenue growth of 14%this range suggests a possible year-over-year decline in 2018 compared to 2017. Early global spending surveys indicateactivity, it would represent an expectation of additional mid to high single digit growthincrease in spending in 2019activity as compared to recent pandemic-impacted quarters.
We play a critical role in supporting our customers and the energy industry throughout the cycles. We believe that carbon-based energy will continue to play a critical role in supporting economic growth, particularly in developing countries, and that oil and gas demand will continue to be significant in the coming decades. The U.S. EIA in its Reference Case published in the International Energy Outlook 2019 projects world energy consumption rising by 50% between 2018 basedand 2050. This Reference Case remains the latest EIA case for world energy markets; however, it was issued before the COVID-19 pandemic and may change to take into account energy use declines during the pandemic. Even so, we believe that oil and gas will continue to be in demand for some time. Even as the EIA projects in its Reference Case that renewables become the most used energy source by 2050, the EIA also projects petroleum and other liquids to rise more than 20% and natural gas to rise more than 40% in that timeframe. This would require an increase in oil and gas to meet the rise in demand from current levels, which would continue to provide a robust market for our existing goods and services. Furthermore, our largest customers are among the leading investors in renewable energy technology. As they further rebalance their capital investment from traditional, carbon-based energy to alternative sources, we expect to continue to supply them and enhance our product and service offering as needed to support their changing requirements.
The gas utility sector of our business which is independent of oil and gas commodity prices was also initially impacted by certain customer activity delays due to COVID-19 concerns but has not experienced any material budget cuts or project cancellations. In the second half of the year we saw a modest rebound in sales for this sector and expect this business to continue to grow in 2021 due to recent market share gains and higher activity levels as COVID-19 concerns begin to diminish.
Because of the challenging environment in 2020, we took a number of actions to further reduce our operating costs. These steps included the following:
● | A voluntary early retirement program and an involuntary reduction in force to reduce headcount |
● | Ongoing freezes on hiring and compensation increases |
● | An indefinite suspension of the company’s matching provision for the 401(k) and RSP programs for its U.S. and Canadian employees respectively |
● | Reductions in annual bonus incentive targets and resulting payouts for both executive management and eligible employees | |
| ● | A 30% reduction in 2020 equity grants to non-executive directors | |
| ● | For eligible executives and employees, a reduction in the long-term incentive awards for 2021 that the Company grants to them pursuant to the Company’s 2011 Omnibus Incentive Plan | |
| ● | Management and employee furloughs | |
| ● | Closure of certain branches and distribution centers where customer spending demand does not warrant continuation of those operations as we continue to adjust our distribution network as needed | |
| ● | Continued cost reductions and efficiency efforts throughout the Company |
In addition to these efforts, we have and continue actively managing our investment in working capital which allows us to generate cash and reduce our indebtedness. In the fourth quarter, we completed the sale leaseback of four facilities which generated $29 million of net proceeds which we also used to reduce our indebtedness. For the year, we generated $261 million of cash from operations and reduced our net debt by almost half to $264 million.
During 2020, we closed 27 facilities and took other actions to reduce our costs associated with leased branches. As a result of these actions, we incurred charges totaling $14 million related to impairment of right of use assets, lease abandonment and charges associated with contractual obligations under lease agreements. Through these facility closures and other reductions in force, we have reduced headcount by approximately 600 employees. In connection with these reductions, we have incurred severance costs of $14 million.
During the COVID-19 pandemic crisis, we have continued to operate our business. Our video and audio conferencing and enterprise resource planning and other operational systems have enabled our office employees to work from home, performing their job functions with minimal disruption or impact on our internal control environment. We required our employees to work from home as a result of governmental isolation orders and, in many cases, in advance of those orders for the health and safety of our employees. We have limited employee travel, with few exceptions, to local deliveries of our products. Our warehouses and regional distribution centers have remained open. Under various isolation orders by national, state, provincial and local governments, we have been exempted as an "essential' business as the products we sell are necessary for the maintenance and functioning of the energy infrastructure. We have taken measures to safeguard the health and welfare of our employees, including (among other things) social distancing measures while at work, certain screening, providing personal protection equipment such as face masks and hand sanitizer and providing "deep" cleaning services at Company facilities. As of February 2, 2021, of our approximate 2,600 employees, we had 10 employees with current cases of COVID-19. If we were to develop a COVID-19 outbreak at one of our facilities, we have plans to isolate those in contact with the impacted employees and to either staff the facility with employees from other facilities or supply product to customers from other facilities. We monitor guidelines of the U.S. Centers for Disease Control ("CDC") and other authorities on an assumptionongoing basis, and as various governmental isolation orders evolve, we continue to review our operational plans to continue operating our business while addressing the health and safety of $60 WTI oil prices. If oil pricesour employees and those with whom our business comes into contact.
As a distribution business, we have also closely monitored the ability of our suppliers and transportation providers to continue the functioning of our supply chain, particularly in cases where there are lower than that, spending levelslimited alternative sources of supply. While there were initially some temporary interruptions of manufacturing for some of our products in the Spring of 2020, especially those who manufacture product or components in China, South Korea and Italy, many of these manufacturers have now resumed production. We have not experienced significant delays by transportation providers. Our inventory position for most products has allowed us to continue supply to most customers with little interruption. In those instances where there is interruption, we are likelyworking with our customers to be lower. This forecasted increase in customer spending should drive a third consecutive yeardiscuss the impact of growth forthe COVID-19 delay. We continue to monitor the situation and have ongoing dialogue with our business. However, givencustomers regarding the uncertainty around oil prices and the fact that our levelstatus of major project activity will be down significantly compared to 2018, any growth in 2019 will be more muted than the previous two years.impacted orders.
In March 2018, the President ofrecent years, the United States signed a proclamation (“Section 232”) imposing a 25% tariffimposed tariffs on all steel imports and 10% on all aluminum imports into the U.S. Section 232 impacts all carbon steelof some products including pipe, fittings and flanges. Certain countries were initially exempted from the provisions of Section 232, and in certain cases, a quota system rather than tariffs has been implemented. In late September 2018, the U.S., Canada and Mexico entered into a new trade treaty to replace the North America Free Trade Agreement (“NAFTA”). The new agreement, known as the United States – Mexico – Canada Agreement (“USMCA”), does not impact Section 232 tariffs the U.S. has imposed. In July 2018, pursuant to Section 301 of the Trade Act of 1974 (“Section 301”), additional tariffs of 25% went into effect on certain Chinese goods, including valves, valve parts and gaskets that we distribute. Subsequent to July, Section 301 tariffs ranging from 10% to 25% were applied to additional tranches of products. Although these actions generally cause the price we pay for products to increase, we are generally able to leverage long-standing relationships with our suppliers and the volume of our purchases to receive market competitive pricing. In addition, our contracts with customers generally allow us to react quickly to price increases through mechanisms that enable us to pass those increases along to customers as they occur. Of course, the price increases that tariffs and quotas engender may be offset by the pricing impacts of lower demand that the COVID-19 pandemic has caused. These issues are dynamic and continue to evolve. In 2018, we saw higher revenue due to these customer contract positions and higher cost of sales for the products that we sold. To the extent our products are further impacted by higher pricespricing fluctuations caused by tariffs and quotas, the ultimate impact on our revenue and cost of sales, which is determined using the last-in, first-out (“LIFO”("LIFO") inventory costing methodology, remains subject to uncertainty and volatility.
27In January 2021, a new U.S. President took office and new U.S. Congress was seated. They have publicly made statements regarding the desire to support alternative energy sources such as solar, wind and “green” hydrogen, reduce U.S. emissions of greenhouse gases and generally address climate change. To that end, the new administration has implemented executive orders for the U.S. to rejoin the Paris Agreement, which presumably will require the U.S. to set greenhouse gas reduction goals and enact policies to meet those goals. It has also announced an aggressive policy agenda to change the tax system, increase corporate and other income taxes, modify the relationships between the United States and other countries and make changes that reverse actions taken by the prior President. While at first impression these policies could impact demand for our oil and gas customers’ product and further regulate the industry, it is not clear that these actions will actually have that impact. For instance, the new President has signed an executive order placing a moratorium on the leasing of U.S. federal lands for oil and gas exploration and production. However, given the current supply and demand for oil and gas, there does not appear to be a robust market for any such new leasing by our customers. Until specific laws are passed, executive actions are taken or federal regulatory action is enacted, it is unclear what impact these policies will have on our business.
TheEffective January 31, 2020, the United Kingdom’s exit fromKingdom formally exited the European Union (“EU”) is scheduled to become effective on March 29, 2019. Without an agreement reached. Following the exit, there was a transition period until December 31, 2020. During the transition period, the UK's trading relationship with the EU to set forthremained the termssame while the two sides negotiated a free trade deal. The EU-UK Trade and impacts of an exit thatCooperation Agreement was signed on December 30, 2020 between the EU and the United Kingdom. Although this agreement is approvedstill awaiting ratification by the U.K. parliament, uncertainty ofEuropean Parliament, it has been applied provisionally since January 1, 2021 when the impacts of the departure exists. Intransition period ended. Although we don't expect these developments to have a scenario where an agreement is not reached, the U.K. could become a third country in EU law, which could create disruptions for businesses in the EU member states as well as the U.K. It is unknown at this time how a deal, or no-deal, wouldmeaningful impact on our business, including any commodity pricing, transfer pricing, and other cross boarder issues. However, we havecontinue to maintain a physical presence in both the U.K. and EU member states that would allow us to continue to operate and to serve our customers as needed. In 2018, 3.5%2020, 3.0% of our revenue was derived from our U.K. business.
We determine backlog by the amount of unshipped customer orders, either specific or general in nature, which the customer may revise or cancel in certain instances. The table below details our backlog by segment (in millions):
|
|
|
|
|
|
|
|
|
|
| Year Ended December 31, | ||||||
|
| 2018 |
|
| 2017 |
|
| 2016 |
U.S. | $ | 426 |
| $ | 559 |
| $ | 472 |
Canada |
| 35 |
|
| 40 |
|
| 36 |
International |
| 177 |
|
| 233 |
|
| 241 |
| $ | 638 |
| $ | 832 |
| $ | 749 |
As of December 31, 2018, 2017 and 2016, respectively, approximately 7%, 23% and 33% of our ending backlog was associated with two customers in our U.S segment. In addition, approximately 5%, 14% and 10% of our ending backlog for 2018, 2017 and 2016, respectively, was associated with one customer in our International segment. In each case, these are related to significant ongoing customer projects that were substantially completed by the end of 2018.
Year Ended December 31, | ||||||||||||
2020 | 2019 | 2018 | ||||||||||
U.S. | $ | 193 | $ | 301 | $ | 426 | ||||||
Canada | 13 | 34 | 35 | |||||||||
International | 134 | 174 | 177 | |||||||||
| $ | 340 | $ | 509 | $ | 638 | |||||||
There can be no assurance that the backlog amounts will ultimately be realized as revenue or that we will earn a profit on the backlog of orders, but we expect that substantially all of the sales in our backlog will be realized within twelve months.
The following table showssets forth key industry indicators for the years ended December 31, 2018, 20172020, 2019 and 2016:
|
|
|
|
|
|
|
|
|
|
|
| Year Ended December 31, |
| ||||||
|
| 2018 |
|
| 2017 |
|
| 2016 |
|
Average Rig Count (1): |
|
|
|
|
|
|
|
|
|
United States |
| 1,032 |
|
| 876 |
|
| 509 |
|
Canada |
| 191 |
|
| 206 |
|
| 130 |
|
Total North America |
| 1,223 |
|
| 1,082 |
|
| 639 |
|
International |
| 988 |
|
| 948 |
|
| 955 |
|
Total Worldwide |
| 2,211 |
|
| 2,030 |
|
| 1,594 |
|
|
|
|
|
|
|
|
|
|
|
Average Commodity Prices (2): |
|
|
|
|
|
|
|
|
|
WTI crude oil (per barrel) | $ | 65.23 |
| $ | 50.80 |
| $ | 43.29 |
|
Brent crude oil (per barrel) | $ | 71.34 |
| $ | 54.12 |
| $ | 43.67 |
|
Natural gas ($/Mcf) | $ | 3.15 |
| $ | 2.99 |
| $ | 2.52 |
|
|
|
|
|
|
|
|
|
|
|
Average Monthly U.S. Well Permits (3) |
| 4,652 |
|
| 3,602 |
|
| 2,270 |
|
U.S. Wells Completed (2) |
| 14,561 |
|
| 11,609 |
|
| 8,105 |
|
3:2:1 Crack Spread (4) | $ | 18.09 |
| $ | 17.87 |
| $ | 15.07 |
|
_______________________ |
|
|
|
|
|
|
|
|
|
(1) Source-Baker Hughes (www.bakerhughes.com) (Total rig count includes oil, natural gas and other rigs.) | |||||||||
(2) Source-Department of Energy, EIA (www.eia.gov) |
|
|
|
| |||||
(3) Source-Evercore ISI Research |
|
|
|
|
|
|
|
|
|
(4) Source-Bloomberg |
|
|
|
|
|
|
|
|
|
|
|
|
|
|
|
|
|
|
|
282018:
Year Ended December 31, | ||||||||||||
2020 | 2019 | 2018 | ||||||||||
Average Rig Count (1): | ||||||||||||
United States | 433 | 943 | 1,032 | |||||||||
Canada | 89 | 134 | 191 | |||||||||
Total North America | 522 | 1,077 | 1,223 | |||||||||
International | 825 | 1,098 | 988 | |||||||||
Total Worldwide | 1,347 | 2,175 | 2,211 | |||||||||
Average Commodity Prices (2): | ||||||||||||
WTI crude oil (per barrel) | $ | 39.16 | $ | 56.98 | $ | 65.23 | ||||||
Brent crude oil (per barrel) | $ | 41.96 | $ | 64.28 | $ | 71.34 | ||||||
Natural gas ($/Mcf) | $ | 2.03 | $ | 2.56 | $ | 3.15 | ||||||
Average Monthly U.S. Well Permits (3) | 1,614 | 4,494 | 4,652 | |||||||||
U.S. Wells Completed (2) | 7,394 | 14,362 | 14,753 | |||||||||
3:2:1 Crack Spread (4) | $ | 11.29 | $ | 18.23 | $ | 18.09 | ||||||
(1) | Source-Baker Hughes (www.bakerhughes.com) (Total rig count includes oil, natural gas and other rigs.) |
(2) | Source-Department of Energy, EIA (www.eia.gov) (As revised) |
(3) | Source-Evercore ISI Research |
(4) | Source-Bloomberg |
Results of Operations for the Years Ended December 31, 2018, 20172020, 2019 and 20162018
The breakdown of our sales by sector for the years ended December 31, 2018, 20172020, 2019 and 20162018 was as follows (in millions):
Year Ended December 31, | ||||||||||||||||||||||||
2020 | 2019 | 2018 | ||||||||||||||||||||||
Gas utilities | $ | 832 | 33 | % | $ | 857 | 24 | % | $ | 844 | 20 | % | ||||||||||||
Downstream & industrial | 786 | 31 | % | 1,105 | 30 | % | $ | 1,209 | 29 | % | ||||||||||||||
Upstream production | 600 | 23 | % | 1,107 | 30 | % | 1,286 | 31 | % | |||||||||||||||
Midstream pipeline | 342 | 13 | % | 593 | 16 | % | 833 | 20 | % | |||||||||||||||
| $ | 2,560 | 100 | % | $ | 3,662 | 100 | % | $ | 4,172 | 100 | % | |||||||||||||
|
|
|
|
|
|
|
|
|
|
|
|
|
|
|
| Year Ended December 31, | |||||||||||||
| 2018 |
| 2017 |
| 2016 | |||||||||
Upstream | $ | 1,286 |
| 31% |
| $ | 1,049 |
| 29% |
| $ | 884 |
| 29% |
Midstream |
| 1,677 |
| 40% |
|
| 1,603 |
| 44% |
|
| 1,165 |
| 38% |
Downstream |
| 1,209 |
| 29% |
|
| 994 |
| 27% |
|
| 992 |
| 33% |
| $ | 4,172 |
| 100% |
| $ | 3,646 |
| 100% |
| $ | 3,041 |
| 100% |
Year Ended December 31, 20182020 Compared to the Year Ended December 31, 20172019
For the years ended December 31, 20182020 and 20172019, the following table summarizes our results of operations (in millions):
|
|
|
|
|
|
|
|
|
|
| ||||||||||||||||
| Year Ended December 31, |
|
|
|
|
| Year Ended December 31, | |||||||||||||||||||
| 2018 |
| 2017 |
| $ Change |
| % Change | 2020 | 2019 | $ Change | % Change | |||||||||||||||
Sales: |
|
|
|
|
|
|
|
|
|
| ||||||||||||||||
U.S. | $ | 3,321 |
| $ | 2,860 | �� | $ | 461 |
| 16% | $ | 2,023 | $ | 2,956 | $ | (933 | ) | (32 | )% | |||||||
Canada |
| 315 |
|
| 294 |
|
| 21 |
| 7% | 128 | 226 | (98 | ) | (43 | )% | ||||||||||
International |
| 536 |
|
| 492 |
|
| 44 |
| 9% | 409 | 480 | (71 | ) | (15 | )% | ||||||||||
Consolidated | $ | 4,172 |
| $ | 3,646 |
| $ | 526 |
| 14% | $ | 2,560 | $ | 3,662 | $ | (1,102 | ) | (30 | )% | |||||||
|
|
|
|
|
|
|
|
|
|
| ||||||||||||||||
Operating income (loss): |
|
|
|
|
|
|
|
|
|
| ||||||||||||||||
Operating (loss) income: | ||||||||||||||||||||||||||
U.S. | $ | 112 |
| $ | 67 |
| $ | 45 |
| 67% | $ | (207 | ) | $ | 104 | $ | (311 | ) | N/M | |||||||
Canada |
| 9 |
|
| 11 |
|
| (2) |
| (18%) | (6 | ) | (1 | ) | (5 | ) | N/M | |||||||||
International |
| 6 |
|
| (32) |
|
| 38 |
| N/M | (47 | ) | — | (47 | ) | N/M | ||||||||||
Consolidated |
| 127 |
|
| 46 |
|
| 81 |
| N/M | (260 | ) | 103 | (363 | ) | N/M | ||||||||||
|
|
|
|
|
|
|
|
|
|
| ||||||||||||||||
Interest expense |
| (38) |
|
| (31) |
|
| (7) |
| 23% | (28 | ) | (40 | ) | 12 | (30 | )% | |||||||||
Other income (expense) |
| 6 |
|
| (8) |
|
| 14 |
| N/M | ||||||||||||||||
Income tax (expense) benefit |
| (21) |
|
| 43 |
|
| (64) |
| N/M | ||||||||||||||||
Net income |
| 74 |
|
| 50 |
|
| 24 |
| 48% | ||||||||||||||||
Other income | 5 | 3 | 2 | 67 | % | |||||||||||||||||||||
| Income tax benefit (expense) | 9 | (27 | ) | 36 | N/M | |||||||||||||||||||||
| Net (loss) income | (274 | ) | 39 | (313 | ) | N/M | ||||||||||||||||||||
Series A preferred stock dividends |
| 24 |
|
| 24 |
|
| - |
| 0% | 24 | 24 | — | N/M | ||||||||||||
Net income attributable to common stockholders | $ | 50 |
| $ | 26 |
| $ | 24 |
| 92% | ||||||||||||||||
| Net (loss) income attributable to common stockholders | $ | (298 | ) | $ | 15 | $ | (313 | ) | N/M | |||||||||||||||||
|
|
|
|
|
|
|
|
|
|
| ||||||||||||||||
Gross Profit | $ | 689 |
| $ | 582 |
| $ | 107 |
| 18% | $ | 431 | $ | 653 | $ | (222 | ) | (34 | )% | |||||||
Adjusted Gross Profit (1) | $ | 819 |
| $ | 677 |
| $ | 142 |
| 21% | $ | 504 | $ | 719 | $ | (215 | ) | (30 | )% | |||||||
Adjusted EBITDA (1) | $ | 280 |
| $ | 179 |
| $ | 101 |
| 56% | $ | 97 | $ | 201 | $ | (104 | ) | (52 | )% | |||||||
(1) | Adjusted Gross Profit and Adjusted EBITDA are non-GAAP financial measures. For a reconciliation of these measures to an equivalent GAAP measure, see pages 32-34 herein. |
(1)Adjusted Gross ProfitSales. Sales reflect consideration we are entitled to for goods and Adjusted EBITDA are non-GAAP financial measures. For a reconciliationservices when control of these measuresthose goods and services is transferred to an equivalent GAAP measure, see pages 30-32 herein.
Sales. Sales include the revenue recognized from the sales of the products we distribute, services we provide and freight billings to customers, less cash discounts taken by customers in return for their early payment.our customers. Our sales were $4,172$2,560 million for the year ended December 31, 20182020 as compared to $3,646$3,662 million for the year ended December 31, 2017.2019. The $526$1,102 million, or 14%30%, increase reflected an $8decrease included a $6 million favorableunfavorable impact from the strengtheningweakening of foreign currencies in areas where we operate comparedrelative to the U.S. dollar.
U.S. Segment—Our U.S. sales increased $461decreased $933 million to $3,321$2,023 million for 20182020 from $2,860$2,956 million for 2017.2019. This 16% increase32% decrease reflected a $154$20 million increasedecrease in the gas utilities sector, a $288 million decrease in the downstream and industrial sector, a $394 million decrease in the upstream sector, a $112 million increase in the midstreamproduction sector and a $195 million increase in the downstream sector. The increase in the upstream sector is related to the increase in rig count and well completions. The increase in the midstream sector is related to increased activity in the gas utility and transmission and gathering subsectors with several of our customers. The increase in the downstream sector is primarily related to increased project work, turnaround activity and growth from new contracts.
29
Canadian Segment—Our Canadian sales increased $21 million to $315 million for 2018 from $294 million for 2017. This 7% increase reflected a $17 million increase in the upstream business due to higher levels of spending with some of our larger contract customers.
International Segment—Our International sales increased $44 million to $536 million for 2018 from $492 million for 2017. The 9%increase included the offsetting impacts of a $66 million increase in the upstream business, primarily related to project activity in Kazakhstan, and a $36$231 million decrease in the midstream business,pipeline sector. The decline in gas utilities was primarily relateddue to an Australian line pipepandemic restrictions as customers paused or slowed spending during the second quarter. The decline in the upstream production sector is a result of reduced customer spending and lower activity levels, including a 49% reduction in well completions. The decline in the midstream pipeline sector is attributable to lower production levels and reduced demand for infrastructure, as well as the timing of project activity. Downstream and industrial sales declined due to delayed or reduced maintenance spending from 2017lower demand as well as non-recurring turnarounds. All sectors were negatively impacted by the economic slowdown resulting from the COVID-19 pandemic which started in March 2020.
Canadian Segment—Our Canadian sales decreased $98 million to $128 million for 2020 from $226 million for 2019. This 43% decrease was across all sectors including a $73 million decrease in the upstream production sector, which was adversely impacted by the COVID-19 pandemic and associated reduced demand. In addition, the midstream pipeline sector declined $13 million as a result of non-recurring project work. The weakening of the Canadian dollar relative to the U.S. dollar unfavorably impacted sales by $1 million, or 1%.
International Segment—Our International sales decreased $71 million to $409 million for 2020 from $480 million for 2019. The 15% decrease is attributable to reduced spending in the upstream production sector followed by the downstream and industrial sector due to lower activity levels associated with no similarreduced demand. Upstream production sales also declined, in part, due to the 2019 completion of a multi-year project in 2018. The strengthening inKazakhstan. In addition, the weakening of foreign currencies in areas where we operate outside ofrelative to the U.S. dollar increasedunfavorably impacted sales by $8$5 million, or 2%1%.
Gross Profit. Our gross profit was $689$431 million (16.5%(16.8% of sales) for the year ended December 31, 20182020 as compared to $582$653 million (16.0%(17.8% of sales) for the year ended December 31, 2017.2019. The $107$222 million increasedecrease was primarily attributable to the increasedecrease in sales volumes. Gross profit for 2018 and 2017 was negatively impacted by higher product costs reflected inAs compared to average cost, our last-in first-out (“LIFO”) inventory costing methodology. LIFO resulted in an increase inmethodology reduced cost of sales of $62by $19 million in 20182020 compared to $28$2 million in 2017.2019. In addition, gross profit for 20172020 was negatively impacted by $6$46 million of inventory-related charges to reduce the carrying value of certain excess and obsolete inventory items to their realizable value. Excluding the impact of LIFO and the inventory-related charges, gross profit percentage improved 110 basis points. While 2018 included a higher level of low margin major project sales asvalue compared to 2017, we benefited from a lower mix$5 million of low margin line pipe sales. This combined with a favorable inflationary pricing environment drove the 110 basis point improvementsimilar charges in gross profit percentage. 2019.
Adjusted Gross Profit. Adjusted Gross Profit increaseddecreased to $819$504 million (19.7% of sales) for 2020 from $719 million (19.6% of sales) for 2018 from $677 million (18.6%2019, a decrease of sales) for 2017, an increase of $142$215 million. Adjusted Gross Profit is a non-GAAP financial measure. We define Adjusted Gross Profit as sales, less cost of sales, plus depreciation and amortization, plus amortization of intangibles, plus inventory-related charges and plus or minus the impact of our LIFO inventory costing methodology. We present Adjusted Gross Profit because we believe it is a useful indicator of our operating performance without regard to items, such as amortization of intangibles that can vary substantially from company to company depending upon the nature and extent of acquisitions. Similarly, the impact of the LIFO inventory costing method can cause results to vary substantially from company to company depending upon whether they elect to utilize LIFO and depending upon which method they may elect. We use Adjusted Gross Profit as a key performance indicator in managing our business. We believe that gross profit is the financial measure calculated and presented in accordance with U.S. generally accepted accounting principles that is most directly comparable to Adjusted Gross Profit.
The following table reconciles gross profit, as derived from our consolidated financial statements, with Adjusted Gross Profit, a non-GAAP financial measure (in millions):
|
|
|
|
|
|
|
|
| |||||||||||||||||
| Year Ended December 31, | Year Ended December 31, | |||||||||||||||||||||||
|
|
|
| Percentage |
|
|
| Percentage | Percentage | Percentage | |||||||||||||||
| 2018 |
| of Revenue* |
| 2017 |
| of Revenue | 2020 | of Revenue | 2019 | of Revenue* | ||||||||||||||
Gross profit, as reported | $ | 689 |
| 16.5% |
| $ | 582 |
| 16.0% | $ | 431 | 16.8 | % | $ | 653 | 17.8 | % | ||||||||
Depreciation and amortization |
| 23 |
| 0.6% |
| 22 |
| 0.6% | 20 | 0.8 | % | 21 | 0.6 | % | |||||||||||
Amortization of intangibles |
| 45 |
| 1.1% |
| 45 |
| 1.2% | 26 | 1.0 | % | 42 | 1.1 | % | |||||||||||
Increase in LIFO reserve |
| 62 |
| 1.5% |
|
| 28 |
| 0.8% | ||||||||||||||||
(Decrease) increase in LIFO reserve | (19 | ) | (0.7 | )% | (2 | ) | (0.1 | )% | |||||||||||||||||
| Inventory-related charges** | 46 | 1.8 | % | 5 | 0.1 | % | |||||||||||||||||||
Adjusted Gross Profit | $ | 819 |
| 19.6% |
| $ | 677 |
| 18.6% | $ | 504 | 19.7 | % | $ | 719 | 19.6 | % | ||||||||
*Does not foot due to rounding |
|
|
|
|
|
|
|
|
| ||||||||||||||||
*Does not foot due to rounding
**2019 adjustment revised to conform with current year presentation
Selling, General and Administrative (“SG&A”) Expenses. Costs such as salaries, wages, employee benefits, rent, utilities, communications, insurance, fuel and taxes (other than state and federal income taxes) that are necessary to operate our branch and corporate operations are included in SG&A. Also contained in this category are certain items that are non-operational in nature, including certain costs of acquiring and integrating other businesses. Our SG&A expenses were $562$449 million (13.5%(17.5% of sales) for the year ended December 31, 20182020 as compared to $536$550 million (14.7%(15.0% of sales) for the year ended December 31, 2017.2019. The $26$101 million increasedecrease in SG&A is primarily related to an increase in employees and employee relatedwas driven by lower employee-related costs, including wageincentives and incentive increases following three yearsbenefits, resulting from the decline in business activity. These lower personnel costs were partially offset by $14 million of wage freezesexpenses associated with facilities closures and incentive reductions as a result of the downturn in our business. Further, we have incurred incremental volume-related operating costs due to higher activity levels. SG&A for 2018 and 2017 included $4$14 million and $14million, respectively, of severance and restructuring charges resulting from reorganizationin 2020 as compared to $9 million of severance and cost reduction efforts, respectively. restructuring charges in 2019. 2020 SG&A was reduced by the $2 million recovery of supplier bad debt. 2019 SG&A included a $5 million charge associated with the doubtful collection of a product claim against a foreign supplier. Excluding the impact of these charges, SG&A decreased $113 million. The weakening of foreign currencies in areas where we operate relative to the U.S. dollar favorably impacted SG&A by $3 million.
Operating (Loss) Income (Loss). Operating incomeloss was $127$260 million for the year ended December 31, 2018,2020, as compared to an operating income of $46$103 million for the year ended December 31, 2017, an improvement2019, a decline of $81$363 million.
U.S. Segment—Our U.S. segment had an operating loss of $207 million for 2020 as compared to operating income of $112$104 million for 2018 as compared to an2019. The $311 million decrease was impacted by $202 million of goodwill and intangible asset impairments, $28 million of inventory-related charges, $8 million of severance costs, and $3 million of costs associated with facility closures. Excluding these charges, the decline in operating income of $67 million for 2017. The $45 million improvement was primarily driven by higherlower sales partially offset by the increasea reduction in SG&A.
30
Canadian Segment—Our Canadian segment had an operating incomeloss of $9$6 million for 20182020 as compared to an operating income of $11$1 million for 2017.2019. The $2$5 million decline was primarily a result of higher$2 million of inventory-related charges, $1 million of severance costs, and $1 million of costs associated with facility closures. The impact of the decline in sales was largely offset by reductions in SG&A as noted above.expenses resulting from cost reduction measures.
International Segment—Our International segment had operating incomeloss of $6$47 million for 20182020 as compared to an operating loss of $32$0 million in 2017.2019. The $38$47 million improvementdecline in operating income was primarily attributable to certain unusual charges. These included $40 million of goodwill impairment charges, $16 million of inventory-related charges, $5 million of severance and $10 million of cost reduction actions takenassociated with facility closures. Excluding these charges, operating income would have increased which was primarily attributable to cost reductions that occurred in the fourth quarter of 2017. In addition, we recorded $62019 as well as the $2 million reduction in 2020 SG&A expense resulting from the recovery of inventory-related charges to reduce the carrying value of certain obsolete and excess inventory items to their net realizable value in 2017. Severance costs included in operating expenses were $1million and $14 million for the years ended December 31, 2018 and 2017, respectively.a supplier bad debt.
Interest Expense. Our interest expense was $38$28 million for the year ended December 31, 20182020 as compared to $31$40 million for the year ended December 31, 2017.2019. The increasedecrease in interest expense was primarily attributable to higherlower average debt levels and lower interest rates in 20182020 as compared to 2017 as we invested in additional inventory to support expected revenue growth and in anticipation of rising inventory prices.2019.
Other Income (Expense).Income. Our other income was $6$5 million for the year ended December 31, 20182020 as compared to other expense of $8$3 million for the year ended December 31, 2017.2019. Other income in 2018for 2020 included among other things, $1 million of income related to the change in the fair value of derivatives and a $1$5 million gain related to thefrom a sale of an asset. In 2017, other expense included an $8million charge for the write off of debt issuance costs associated with the refinancing of our Term Loan and Global ABL Facility.leaseback transaction.
Income Tax (Expense) Benefit(Benefit) Expense. Our income tax expensebenefit was $21$9 million for the year ended December 31, 2018,2020, as compared to a benefitexpense of $43$27 million for the year ended December 31, 2017.2019. Our effective tax rates were 22%3% and (614)%41% for the years ended December 31, 20182020 and 2017,2019, respectively. Our rates generally differ from the U.S. federal statutory rates of 21% and 35% for 2018 and 2017, respectively, as a result of state income taxes and differing foreign income tax rates. In the fourth quarter of 2017, we recorded a provisional net tax benefit of $50 million associated with the passage of the Tax Cuts and Jobs Act of 2017 (the “Tax Act”). Excluding the impact of the Tax Act and $20 million of severance and restructuring and inventory related charges within our International segment, for which there was a minimal amount of tax benefit, ourThe effective tax rate would have been 26%.for the 2020 was lower primarily due to a non-tax deductible goodwill impairment charge during the second quarter.
Net (Loss) Income. Our net incomeloss was $74$274 million for the year ended December 31, 20182020 as compared to net income of $50$39 million for the year ended December 31, 2017, an improvement2019, a decrease of $24$313 million reflecting improveda decline in income before taxes for the reasons noted above.
Adjusted EBITDA. Adjusted EBITDA, a non-GAAP financial measure, was $280$97 million for the year ended December 31, 2018,2020, as compared to $179$201 million for the year ended December 31, 2017.2019. Our Adjusted EBITDA increased $101decreased $104 million over that period primarily as a result of the factors noted above.
We define Adjusted EBITDA as net income plus interest, income taxes, depreciation and amortization, amortization of intangibles and certain other expenses, including non-cash expenses (such as equity-based compensation, severance and restructuring, changes in the fair value of derivative instruments and asset impairments, including inventory) and plus or minus the impact of our LIFO inventory costing methodology.
We believe Adjusted EBITDA provides investors a helpful measure for comparing our operating performance with the performance of other companies that have different financing and capital structures or tax rates. We believe that net income is the financial measure calculated and presented in accordance with U.S. generally accepted accounting principles that is most directly comparable to Adjusted EBITDA.
31
The following table reconciles net income, as derived from our consolidated financial statements, with Adjusted EBITDA, a non-GAAP financial measure (in millions):
|
|
|
|
|
|
| Year Ended December 31, | ||||
| 2018 |
| 2017 | ||
Net income | $ | 74 |
| $ | 50 |
Income tax expense (benefit) |
| 21 |
|
| (43) |
Interest expense |
| 38 |
|
| 31 |
Depreciation and amortization |
| 23 |
|
| 22 |
Amortization of intangibles |
| 45 |
|
| 45 |
Increase in LIFO reserve |
| 62 |
|
| 28 |
Inventory-related charges |
| - |
|
| 6 |
Equity-based compensation expense |
| 14 |
|
| 16 |
Severance and restructuring charges |
| 4 |
|
| 14 |
Foreign currency gains |
| (1) |
|
| (2) |
Write off of debt issuance costs |
| 1 |
|
| 8 |
Litigation matter |
| - |
|
| 3 |
Change in fair value of derivative instruments |
| (1) |
|
| 1 |
Adjusted EBITDA | $ | 280 |
| $ | 179 |
32
Year Ended December 31, 2017 Compared to the Year Ended December 31, 2016
For the years ended December 31, 2017 and 2016 the following table summarizes our results of operations (in millions):
|
|
|
|
|
|
|
|
|
|
|
| Year Ended December 31, |
|
|
|
|
| ||||
| 2017 |
| 2016 |
| $ Change |
| % Change | |||
Sales: |
|
|
|
|
|
|
|
|
|
|
U.S. | $ | 2,860 |
| $ | 2,297 |
| $ | 563 |
| 25% |
Canada |
| 294 |
|
| 243 |
|
| 51 |
| 21% |
International |
| 492 |
|
| 501 |
|
| (9) |
| (2%) |
Consolidated | $ | 3,646 |
| $ | 3,041 |
| $ | 605 |
| 20% |
|
|
|
|
|
|
|
|
|
|
|
Operating income (loss): |
|
|
|
|
|
|
|
|
|
|
U.S. | $ | 67 |
| $ | 6 |
| $ | 61 |
|
|
Canada |
| 11 |
|
| (5) |
|
| 16 |
|
|
International |
| (32) |
|
| (57) |
|
| 25 |
|
|
Consolidated |
| 46 |
|
| (56) |
|
| 102 |
|
|
|
|
|
|
|
|
|
|
|
|
|
Interest expense |
| (31) |
|
| (35) |
|
| 4 |
|
|
Other expense |
| (8) |
|
| - |
|
| (8) |
|
|
Income tax benefit |
| 43 |
|
| 8 |
|
| 35 |
|
|
Net income (loss) |
| 50 |
|
| (83) |
|
| 133 |
|
|
Series A preferred stock dividends |
| 24 |
|
| 24 |
|
| - |
|
|
Net income (loss) attributable to common stockholders | $ | 26 |
| $ | (107) |
| $ | 133 |
|
|
|
|
|
|
|
|
|
|
|
|
|
Gross Profit | $ | 582 |
| $ | 468 |
| $ | 114 |
|
|
Adjusted Gross Profit (1) | $ | 677 |
| $ | 523 |
| $ | 154 |
|
|
Adjusted EBITDA (1) | $ | 179 |
| $ | 75 |
| $ | 104 |
|
|
(1)Adjusted Gross Profit and Adjusted EBITDA are non-GAAP financial measures. For a reconciliation of these measures to an equivalent GAAP measure, see pages 34-36 herein.
Sales. Our sales were $3,646 million for the year ended December 31, 2017 as compared to $3,041 million for the year ended December 31, 2016. The $605 million, or 20%, increase reflected an $11 million favorable impact from the strengthening of foreign currencies in areas where we operate compared to the U.S. dollar.
U.S. Segment—Our U.S. sales increased $563 million to $2,860 million for 2017 from $2,297 million for 2016. This 25% increase reflected a $152 million increase in the upstream sector, a $400 million increase in the midstream sector and an $11 million increase in the downstream sector. The increase in the midstream sector is related to increased activity in the gas utility and transmission and gathering subsectors, including some large project activity with several of our customers. The increase in the upstream sector is related to the increase in rig count and well completions.
Canadian Segment—Our Canadian sales increased $51 million to $294 million for 2017 from $243 million for 2016. This 21%increase reflected a $59 million increase in the upstream business as a result of the increase in rig count and well completions. Approximately $6 million, or 12%, of the total increase was a result of the stronger Canadian dollar relative to the U.S. dollar.
International Segment—Our International sales decreased $9 million to $492 million for 2017 from $501 million for 2016. This 2%decrease was due to a $58 million decline related to one of our project customers in Norway offset by a $50 million increase in the midstream sector related to an Australian line pipe sale. The strengthening in the foreign currencies in areas where we operate outside of the U.S. dollar increased sales by $5 million, or 1%.
Gross Profit. Our gross profit was $582 million (16.0% of sales) for the year ended December 31, 2017 as compared to $468 million (15.4% of sales) for the year ended December 31, 2016. The $114 million increase was primarily attributable to the increase in sales volumes. In addition, gross profit for 2017 and 2016 was negatively impacted by $6 million and $45 million, respectively, of inventory-related charges to reduce the carrying value of certain excess and obsolete inventory items to their realizable value. Gross profit for 2017 was also negatively impacted by higher product costs reflected in our LIFO inventory costing methodology. LIFO resulted in an increase in cost of sales of $28 million in 2017 compared to a reduction of cost of sales of $14 million in 2016.
33
Excluding the impact of LIFO and the inventory-related charges, gross profit percentage improved 50 basis points as a result of sales mix changes.
Adjusted Gross Profit. Adjusted Gross Profit increased to $677 million (18.6% of sales) for 2017 from $523 million (17.2% of sales) for 2016, an increase of $154 million. Adjusted Gross Profit for 2017 and 2016, respectively, included the impact of the $6 million and $45 million of inventory-related charges discussed above. Adjusted Gross Profit is a non-GAAP financial measure. We define Adjusted Gross Profit as sales, less cost of sales, plus depreciation and amortization, plus amortization of intangibles, and plus or minus the impact of our LIFO inventory costing methodology. We present Adjusted Gross Profit because we believe it is a useful indicator of our operating performance without regard to items, such as amortization of intangibles, that can vary substantially from company to company depending upon the nature and extent of acquisitions. Similarly, the impact of the LIFO inventory costing method can cause results to vary substantially from company to company depending upon whether they elect to utilize LIFO and depending upon which method they may elect. We use Adjusted Gross Profit as a key performance indicator in managing our business. We believe that gross profit is the financial measure calculated and presented in accordance with U.S. generally accepted accounting principles that is most directly comparable to Adjusted Gross Profit.
The following table reconciles gross profit, as derived from our consolidated financial statements, with Adjusted Gross Profit, a non-GAAP financial measure (in millions):
|
|
|
|
|
|
|
|
|
|
| Year Ended December 31, | ||||||||
|
|
|
| Percentage |
|
|
|
| Percentage |
| 2017 |
| of Revenue |
| 2016 |
| of Revenue | ||
Gross profit, as reported | $ | 582 |
| 16.0% |
| $ | 468 |
| 15.4% |
Depreciation and amortization |
| 22 |
| 0.6% |
|
| 22 |
| 0.7% |
Amortization of intangibles |
| 45 |
| 1.2% |
|
| 47 |
| 1.6% |
Increase (decrease) in LIFO reserve |
| 28 |
| 0.8% |
|
| (14) |
| (0.5%) |
Adjusted Gross Profit | $ | 677 |
| 18.6% |
| $ | 523 |
| 17.2% |
Selling, General and Administrative Expenses.Our SG&A expenses were $536 million (14.7% of sales) for the year ended December 31, 2017 as compared to $524 million (17.2% of sales) for the year ended December 31, 2016. SG&A for 2017 and 2016 included $14 million and $20 million, respectively, of severance and restructuring charges resulting from cost reduction efforts. SG&A for 2017 also included $20 million of expense related to the implementation of a new information technology system in the international segment as compared to $15 million of expense in 2016. Excluding these amounts, SG&A increased $13 million which was attributable to volume-related increases.
Operating Income (Loss).Operating income was $46 million for the year ended December 31, 2017, as compared to an operating loss of $56 million for the year ended December 31, 2016, an improvement of $102 million.
U.S. Segment—Our U.S. segment had operating income of $67 million for 2017 as compared to an operating income of $6 million for 2016. The $61 million improvement was primarily driven by higher sales. Severance costs included in operating expenses were $6million for 2016. No such expenses were incurred in 2017. In addition, in 2016, we recorded $16 million of inventory-related charges to reduce the carrying value of certain obsolete and excess inventory items to their net realizable value.
Canadian Segment—Our Canadian segment had operating income of $11 million for 2017 as compared to an operating loss of $5million for 2016. The $16 million improvement was primarily a result of higher sales volume. In addition, in 2016 severance and restructuring expenses and inventory-related charges negatively impacted operating income by $6 million.
International Segment—Our International segment incurred an operating loss of $32 million for 2017 as compared to $57 million in 2016. We recorded $6 million and $24 million of inventory-related charges to reduce the carrying value of certain obsolete and excess inventory items to their net realizable value in 2017 and 2016, respectively. Severance costs included in operating expenses were $14million and $13 million for the years ended December 31, 2017 and 2016, respectively. The improvement of $25 million was primarily due to these prior year charges combined with lower SG&A attributable to 2016 cost reduction measures including headcount reductions and associated severance costs.
Interest Expense.Our interest expense was $31 million for the year ended December 31, 2017 as compared to $35 million for the year ended December 31, 2016. The decrease can be attributed to lower average debt levels in 2017.
Other Expense.Our other expense increased to $8 million for the year ended December 31, 2017 from $0 million for the year ended December 31, 2016. In 2017, other expense included an $8 million charge for the write off of debt issuance costs associated with the refinancing of our Term Loan and Global ABL Facility.
34
Income Tax Benefit.Our income tax benefit was $43 million for the year ended December 31, 2017, as compared to benefit of $8 million for the year ended December 31, 2016. In the fourth quarter of 2017, we recorded a provisional net tax benefit of $50 million associated with the passage of the Tax Act. Excluding the impact of the Tax Act and $20 million of severance and restructuring and inventory related charges within our International segment, for which there was a minimal amount of tax benefit, our effective tax rate would have been 26%. The 2016 effective tax rate of 9% was lower than our customary effective tax rate as a result of the mix of pre-tax losses in all segments, including an increase in the relative significance of pre-tax losses in foreign jurisdictions where the losses have no corresponding tax benefit.
Net Income (Loss).Our net income was $50 million for the year ended December 31, 2017 as compared to net loss of $83 million for the year ended December 31, 2016, an improvement of $133 million, reflecting improved income before taxes and the provisional tax benefit of $50 million associated with the Tax Act.
Adjusted EBITDA. Adjusted EBITDA, a non-GAAP financial measure, was $179 million for the year ended December 31, 2017, as compared to $75 million for the year ended December 31, 2016. Our Adjusted EBITDA increased $104 million over that period primarily as a result of the factors noted above.
We define Adjusted EBITDA as net income plus interest, income taxes, depreciation and amortization, amortization of intangibles and certain other expenses, including non-cash expenses (such as equity-based compensation, severance and restructuring, changes in the fair value of derivative instruments and asset impairments, including inventory) and plus or minus the impact of our LIFO inventory costing methodology.
We believe Adjusted EBITDA provides investors a helpful measure for comparing our operating performance with the performance of other companies that have different financing and capital structures or tax rates. We believe that net income is the financial measure calculated and presented in accordance with U.S. generally accepted accounting principles that is most directly comparable to Adjusted EBITDA.
The following table reconciles net income, (loss), as derived from our consolidated financial statements, with Adjusted EBITDA, a non-GAAP financial measure (in millions):
|
|
|
|
|
|
| Year Ended December 31, | ||||
| 2017 |
| 2016 | ||
Net income (loss) | $ | 50 |
| $ | (83) |
Income tax benefit |
| (43) |
|
| (8) |
Interest expense |
| 31 |
|
| 35 |
Depreciation and amortization |
| 22 |
|
| 22 |
Amortization of intangibles |
| 45 |
|
| 47 |
Increase (decrease) in LIFO reserve |
| 28 |
|
| (14) |
Inventory-related charges |
| 6 |
|
| 40 |
Equity-based compensation expense |
| 16 |
|
| 12 |
Severance and restructuring charges |
| 14 |
|
| 20 |
Foreign currency (gains) losses |
| (2) |
|
| 4 |
Write off of debt issuance costs |
| 8 |
|
| 1 |
Litigation matter |
| 3 |
|
| - |
Change in fair value of derivative instruments |
| 1 |
|
| (1) |
Adjusted EBITDA | $ | 179 |
| $ | 75 |
Year Ended December 31, | ||||||||
2020 | 2019 | |||||||
Net income | $ | (274 | ) | $ | 39 | |||
Income tax expense | (9 | ) | 27 | |||||
Interest expense | 28 | 40 | ||||||
Depreciation and amortization | 20 | 21 | ||||||
Amortization of intangibles | 26 | 42 | ||||||
Goodwill and intangible asset impairment | 242 | — | ||||||
Inventory-related charges | 46 | 5 | ||||||
Facility closures | 17 | — | ||||||
Severance and restructuring | 14 | 9 | ||||||
Decrease increase in LIFO reserve | (19 | ) | (2 | ) | ||||
Equity-based compensation expense | 12 | 16 | ||||||
Gain on early extinguishment of debt | (1 | ) | — | |||||
Recovery of supplier bad debt and supplier bad debt | (2 | ) | 5 | |||||
Gain on sale leaseback | (5 | ) | — | |||||
Foreign currency losses (gains) | 2 | (1 | ) | |||||
Adjusted EBITDA | $ | 97 | $ | 201 | ||||
Year Ended December 31, 2019 Compared to the Year Ended December 31, 2018
For discussion and analysis of fiscal year 2019 compared to fiscal year 2018, please refer to Item 7 of Part II, “Management’s Discussion and Analysis of Financial Condition and Results of Operations” in our Annual Report on Form 10-K for the fiscal year ended December 31, 2019, which was filed with the Securities and Exchange Commission (“SEC”) on February 14, 2020 and is incorporated herein by reference.
Financial Condition and Cash Flows
Cash Flows
The following table sets forth our cash flows for the periods indicated below (in millions):
Year Ended December 31, | ||||||||
2020 | 2019 | |||||||
Net cash provided by (used in): | ||||||||
Operating activities | $ | 261 | $ | 242 | ||||
Investing activities | 19 | (16 | ) | |||||
Financing activities | (195 | ) | (238 | ) | ||||
Net cash provided (used): | $ | 85 | $ | (12 | ) | |||
Operating Activities
Net cash provided by operating activities was $261 million in 2020 compared to $242 million provided by operating activities in 2019. The change in operating cash flows was primarily the result of lower working capital requirements due to declining sales in 2020 as compared to 2019. A reduction in working capital provided cash of $220 million in 2020 compared to $118 million provided by working capital in 2019. The decline in accounts receivable generated $141 million of cash in 2020 as compared to $127 million in accounts receivable in 2019. In addition, because of the decline in sales, we have reduced inventory resulting in $173 million of cash provided from inventory in 2020 as compared to $95 million in 2019. These reductions in the use of cash were offset by $98 million of cash utilized from a reduction in accounts payable in 2020 as compared to $79 million in 2019.
|
|
|
|
|
|
|
|
|
| Year Ended December 31, | |||||||
|
| 2018 |
|
| 2017 |
|
| 2016 |
Net cash (used in) provided by: |
|
|
|
|
|
|
|
|
Operating activities | $ | (11) |
| $ | (48) |
| $ | 253 |
Investing activities |
| (14) |
|
| (27) |
|
| 16 |
Financing activities |
| 24 |
|
| 9 |
|
| (226) |
Net cash (used) provided: | $ | (1) |
| $ | (66) |
| $ | 43 |
OperatingInvesting Activities
Net cash provided by investing activities was $19 million in 2020 compared to $16 million used in 2019. In 2020, we completed sale leaseback transactions involving four of our locations which generated net proceeds of $29 million. Purchases of property, plant and equipment utilized cash of $11 million and $18 million in 2020 and 2019, respectively.
Financing Activities
Net cash used in operatingfinancing activities was $11$195 million in 2018 compared to $48 million in 2017. The decrease in cash used in operations was primarily the result of improved profitability in 2018 as compared to 2017 offset by the growth in working capital required to support the 2018 sales growth of 14%. Working capital growth used cash of $231 million in 2018 compared to $152 million in 2017. Growth in accounts receivable utilized $74 million of cash in 2018 as compared to $118 million in 2017. Growth in inventory required to support higher sales levels utilized $175 million of cash in 2018 as compared to $168 million in 2017. These amounts were more than offset by a $116 million reduction in cash generated from increases in accounts payable, accrued expenses and other current liabilities, which was primarily attributable to the timing of our purchasing activities.
Net cash used in operating activities was $48 million in 2017 compared to $253 million provided by operations in 2016. The decrease in cash provided by operations was primarily the result of working capital expansion in response to the increase in sales activity in 2017 as compared to a working capital contraction in 2016. Working capital growth used cash of $152 million in 2017 compared to the working capital contraction providing cash of $231 million in 2016. In particular, growth in accounts receivable utilized $118million of cash in 2017 as a result of the 20% increase in sales relative to 2016 when accounts receivable contraction provided cash of $128 million. Growth in inventory required to support higher sales levels utilized $168 million of cash in 2017 as compared to cash provided of $141 million in 2016. These uses of cash in 2017 were offset by $93 million generated from an increase in accounts payable, which was attributable to higher purchasing activities and the timing of payments to our suppliers.
36
Investing Activities
Net cash used in investing activities was $14 million in 2018,2020, compared to net cash used in investing activities of $27 million in 2017. The $13 million decrease in cash used in investing activities is the result of reduced capital expenditure levels in 2018 as compared to 2017. Our capital expenditures were $20 million and $30 million for the years ended December 31, 2018 and 2017, respectively.
Net cash used in investing activities was $27 million in 2017, compared to net cash provided by investing activities of $16 million in 2016. The $43 million increase in cash used in investing activities is the result of $48 million in proceeds from the 2016 disposition of our U.S. OCTG product line. Our capital expenditures were $30 million and $33 million for the years ended December 31, 2017 and 2016, respectively.
Financing Activities
Net cash provided by financing activities was $24 million in 2018, compared to net cash provided by financing activities of $9$238 million in 2017.2019. Net proceedspayments on our Global ABL Facility totaled $162$161 million in 2018,2020 compared to $129 million in the 2017.2019. In 2018, 2017 and 2016,2019, we used $125 million, $68 million and $95$75 million to fund purchases of our common stock, respectively.stock. We used $24 million to fund dividends on our preferred stock in each of 2018, 20172020 and 2016. In addition, we received $21 million in proceeds from stock option exercises in 2018 as compared to $1 million in 2017 and 2016.2019.
Liquidity and Capital Resources
Our primary credit facilities consist of a Term Loan maturing in September 2024 with an original principal amount of $400 million and an $800 million Global ABL Facility. As of December 31, 2020, the outstanding balance on our Term Loan, net of original issue discount and issuance costs, was $383 million. On an annual basis, we are required to repay an amount equal to 50% of excess cash flow, as defined in the Term Loan agreement, reducing to 25% if the Company’s senior secured leverage ratio is no more than 2.75 to 1.00. No payment of excess cash flow is required if the Company’s senior secured leverage ratio is less than or equal to 2.50 to 1.00. Under the terms of the Term Loan, the amount of cash used in the determination of the senior secured leverage ratio is limited to $75 million. For the current year, as a result of declining profitability and the generation of positive cash flow from working capital contraction, we would be required to make a repayment by April 2021 pursuant to this provision unless we obtain an amendment to the Term Loan. We are exploring the possibility of entering into such an amendment with representatives of our Term Loan lenders. If we make this payment, which we currently estimate will be approximately $105 million, we expect to source it from availability on our Global ABL Facility. As such, the payment would reduce overall liquidity and result in lower interest expense going forward.
The Global ABL Facility matures in September 2022 and provides $675 million in revolver commitments in the United States, $65 million in Canada, $18 million in Norway, $15 million in Australia, $13 million in the Netherlands, $7 million in the United Kingdom and $7 million in Belgium. The Global ABL Facility contains an accordion feature that allows us to increase the principal amount of the facility by up to $200 million, subject to securing additional lender commitments. Availability is dependent on a borrowing base comprised of a percentage of eligible accounts receivable and inventory which is subject to redetermination from time to time. As of December 31, 2020, we had no borrowings outstanding and $432 million of Excess Availability, as defined under our Global ABL Facility.
Our primary sources of liquidity consist of cash generated from our operating activities, existing cash balances and borrowings under our existing Global ABL Facility. At December 31, 2018,2020, our total liquidity, consisting of cash on hand and amounts available under our Global ABL Facility, was $492$551 million. Our ability to generate sufficient cash flows from our operating activities is primarily dependent on our sales of products to our customers at profits sufficient to cover our fixed and variable expenses. As of December31,2018 2020 and 2017,2019, we had cash and cash equivalents of $43$119 million and $48$32 million, respectively. As of December31,2018 2020 and 2017, $412019, $57 million and $48$32 million of our cash and cash equivalents were maintained in the accounts of our various foreign subsidiaries and, if those amounts were transferred among countries or repatriated to the U.S., those amounts may be subject to additional tax liabilities, which would be recognized in our financial statements in the period during which the transfer decision was made. During 2018,2020, we repatriated $51$29 million of cash from our Canadian subsidiaries.
Our primary credit facilities consist of a seven-year Term Loan maturing in September 2024 with an original principal amount of $400million and a five-year $800 million Global ABL Facility that provides $675 million in revolver commitments in the United States, $65 million in Canada, $18 million in Norway, $15 million in Australia, $13 million in the Netherlands, $7 million in the United Kingdom and $7 million in Belgium. As of December 31, 2018, the outstanding balance on our Term Loan, net of original issue discount and issuance costs, was $393 million. The Global ABL Facility matures in September 2022. The Global ABL Facility contains an accordion feature that allows us to increase the principal amount of the facility by up to $200 million, subject to securing additional lender commitments. As of December 31, 2018, we had $291 million of borrowings outstanding and $449 million of Excess Availability, as defined under our Global ABL Facility. Availability is dependent on a borrowing base comprised of a percentage of eligible accounts receivable and inventory which is subject to redetermination from time to time.
Our credit ratings are below “investment grade” and, as such, could impact both our ability to raise new funds as well as the interest rates on our future borrowings. In the second quarter of 2020, Moody’s Investor Services and S&P Global Ratings downgraded our credit ratings, from B1 to B2 and B to B-, respectively, largely due to softening demand for our products due to the COVID-19 pandemic and the reduction in our customer’s spending outlook from unusually low oil and gas prices. Our existing obligations restrict our ability to incur additional debt. We were in compliance with the covenants contained in our various credit facilities as of and during the year ended December 31, 2018. We do not believe the 2019 implementation of the new lease accounting standard will impact our compliance with debt covenants, as our2020. Our credit facilities contain provisions that grandfather our current method of accounting for leases for debt compliance purposes.address the forthcoming need to transition away from LIBOR when it is discontinued or replaced.
We believe our sources of liquidity will be sufficient to satisfy the anticipated cash requirements associated with our existing operations for at least the next twelve months. However, our future cash requirements could be higher than we currently expect as a result of various factors. Additionally, our ability to generate sufficient cash from our operating activities depends on our future performance, which is subject to general economic, political, financial, competitive and other factors beyond our control. We may, from time to time, seek to raise additional debt or equity financing or re-price or refinance existing debt in the public or private markets, based on market conditions. Any such capital markets activities would be subject to market conditions, reaching final agreement with lenders or investors, and other factors, and there can be no assurance that we would successfully consummate any such transactions.
In October 2018, our board
Contractual Obligations, Commitments and Contingencies
Contractual Obligations
The following table summarizes our minimum payment obligations as of December 31, 20182020 relating to long-term debt, interest payments, capital leases, operating leases, purchase obligations and other long-term liabilities for the periods indicated (in millions):
|
|
|
|
|
|
|
|
|
|
|
|
|
|
|
| ||||||||||||||||||||
|
|
|
|
|
|
|
|
|
|
|
|
|
| More Than | More Than | ||||||||||||||||||||
|
| Total |
| 2019 |
| 2020-2021 |
| 2022-2023 |
| 5 Years | Total | 2021 | 2022-2023 | 2024-2025 | 5 Years | ||||||||||||||||||||
Long-term debt (1) |
| $ | 684 |
| $ | 4 |
| $ | 8 |
| $ | 299 |
|
| 373 | $ | 383 | $ | 4 | $ | 8 | $ | 371 | — | |||||||||||
Interest payments (2) |
|
| 164 |
|
| 33 |
|
| 66 |
|
| 50 |
|
| 15 | 44 | 12 | 24 | 8 | — | |||||||||||||||
Operating leases |
|
| 224 |
|
| 42 |
|
| 63 |
|
| 38 |
|
| 81 | 355 | 43 | 65 | 45 | 202 | |||||||||||||||
Purchase obligations (3) |
|
| 772 |
|
| 772 |
|
| - |
|
| - |
|
| - | 337 | 337 | — | — | — | |||||||||||||||
Foreign exchange forward contracts |
|
| - |
|
| - |
|
| - |
|
| - |
|
| - | — | — | — | — | — | |||||||||||||||
Other long-term liabilities |
|
| 40 |
|
| - |
|
| - |
|
| - |
|
| 40 | 41 | — | — | — | 41 | |||||||||||||||
Total |
| $ | 1,884 |
| $ | 851 |
| $ | 137 |
| $ | 387 |
| $ | 509 | $ | 1,160 | $ | 396 | $ | 97 | $ | 424 | $ | 243 | ||||||||||
(1) | Long-term debt is based on debt outstanding at December 31, 2020. |
(2) | Interest payments are based on interest rates in effect at December 31, 2020 and assume contractual amortization payments. |
(3) |
|
We historically have been an acquisitive company. We expect to fund future acquisitions primarily from (i) borrowings, either the unused portion of our facilities or new debt issuances, (ii) cash provided by operations or (iii) the issuance of additional equity in connection with the acquisitions.
Other Commitments
In the normal course of business with customers, vendors and others, we are contingently liable for performance under standby letters of credit and bid, performance and surety bonds. We were contingently liable for approximately $42$20 million of standby letters of credit, trade guarantees that banks issue and bid, and performance and surety bonds at December 31, 2018.2020. Management does not expect any material amounts to be drawn on these instruments.
Legal Proceedings
Asbestos Claims. We are one of many defendants in lawsuits that plaintiffs have brought seeking damages for personal injuries that exposure to asbestos allegedly caused. Plaintiffs and their family members have brought these lawsuits against a large volume of defendant entities as a result of the various defendants’ manufacture, distribution, supply or other involvement with asbestos, asbestos-containing products or equipment or activities that allegedly caused plaintiffs to be exposed to asbestos. These plaintiffs typically assert exposure to asbestos as a consequence of third-party manufactured products that the Company’s subsidiary, MRC Global (US) Inc., purportedly distributed. As of December 31, 2018,2020, we are a named defendant in approximately 576578 lawsuits involving approximately 1,1661,153 claims. No asbestos lawsuit has resulted in a judgment against us to date, with the majority being settled, dismissed or otherwise resolved. Applicable third-party insurance has substantially covered these claims, and insurance should continue to cover a substantial majority of existing and anticipated future claims. Accordingly, we have recorded a liability for our estimate of the most likely settlement of asserted claims and a related receivable from insurers for our estimated recovery, to the extent we believe that the amounts of recovery are probable.
We annually conduct analyses of our asbestos-related litigation to estimate the adequacy of the reserve for pending and probable asbestos-related claims. Given these estimated reserves and existing insurance coverage that has been available to cover substantial portions of these claims, we believe that our current accruals and associated estimates relating to pending and probable asbestos-
38
relatedasbestos-related litigation likely to be asserted over the next 15 years are currently adequate. This belief, however, relies on a number of assumptions, including:
| ● | That our future settlement payments, disease mix and dismissal rates will be materially consistent with historic experience; |
| ● | That future incidences of asbestos-related diseases in the U.S. will be materially consistent with current public health estimates; |
| ● | That the rates at which future asbestos-related mesothelioma incidences result in compensable claims filings against us will be materially consistent with its historic experience; |
| ● | That insurance recoveries for settlement payments and defense costs will be materially consistent with historic experience; |
| ● | That legal standards (and the interpretation of these standards) applicable to asbestos litigation will not change in material respects; |
| ● | That there are no materially negative developments in the claims pending against us; and |
● |
|
|
If any of these assumptions prove to be materially different in light of future developments, liabilities related to asbestos-related litigation may be materially different than amounts accrued or estimated. Further, while we anticipate that additional claims will be filed in the future, we are unable to predict with any certainty the number, timing and magnitude of such future claims. In addition, applicable insurance policies are subject to overall caps on limits, which coverage may exhaust the amount available from insurers under those limits. In those cases, the Company is seeking indemnity payments from responsive excess insurance policies, but other insurers may not be solvent or may not make payments under the policies without contesting their liability. In our opinion, there are no pending legal proceedings that are likely to have a material adverse effect on our consolidated financial statements.
Other Legal Claims and Proceedings. From time to time, we have been subject to various claims and involved in legal proceedings incidental to the nature of our businesses. We maintain insurance coverage to reduce financial risk associated with certain of these claims and proceedings. It is not possible to predict the outcome of these claims and proceedings. However, in our opinion, there are no pending legal proceedings that are likely to have a material adverse effect on our consolidated financial statements. See also “Note 16—17—Commitments and Contingencies” to the audited consolidated financial statements as of December 31, 2018. 2020.
Off-Balance Sheet Arrangements
We do not have any material “off-balance sheet arrangements” as such term is defined within theSEC rules and regulations of the SEC.define that term.
Critical Accounting Estimates
We prepare our consolidated financial statements in accordance with U.S. generally accepted accounting principles. To apply these principles, management must make judgments and assumptions and develop estimates based on the best available information at the time. Actual results may differ based on the accuracy of the information utilized and subsequent events. The notes to our audited financial statements included elsewhere in this report describe our accounting policies. These critical accounting policies could materially affect the amounts recorded in our financial statements. We believe the following describes significant judgments and estimates used in the preparation of our consolidated financial statements:
Inventories:Our U.S. inventories are valued at the lower of cost (principally using the LIFO method) or market. We record an estimate each quarter, if necessary, for the expected annual effect of inflation (using period to date inflation rates) and estimated year-end inventory balances. These estimates are adjusted to actual results determined at year-end. Our inventories that are held outside of the U.S., totaling $187$145 million and $168$181 million at December 31, 20182020 and 2017,2019, respectively, were valued at the lower of weighted-average cost or estimated net realizable value.
Under the LIFO inventory valuation method, changes in the cost of inventory are recognized in cost of sales in the current period even though these costs may have been incurred at significantly different values. Since the Company values most of its inventory using the LIFO inventory costing methodology, a rise in inventory costs has a negative effect on operating results, while, conversely, a fall in inventory costs results in a benefit to operating results.
We determine reserves for inventory based on historical usage of inventory on-hand, assumptions about future demand and market conditions. Customers rely on the company to stock specialized items for certain projects and other needs. Therefore, the estimated carrying value of inventory depends upon demand driven by oil and gas spending activity, which in turn depends on oil and gas prices, the general outlook for economic growth worldwide, political stability in major oil and gas producing areas, and the potential obsolescence of various inventory items we sell.
Goodwill and Intangible Assets: We record goodwill and intangible assets in conjunction with acquisitions that we make. These assets comprise 20%28% of our total assets as of December 31, 2018.2020. We record goodwill as the excess of cost over the fair value of net assets
39
that we acquire. We record intangible assets at fair value at the date of acquisition and amortize the value of intangible assets over the assets’ estimated useful lives unless we determine that an asset has an indefinite life. We make significant judgments and estimates in both calculating the fair value of these assets and determining their estimated useful lives. The carrying values of our goodwill and intangible assets, by reporting unit, were as follows as of December 31, 20182020 (in millions):
U.S. | Canada | International | Total | |||||||||||||
Customer base intangibles | $ | 115 | $ | — | $ | 7 | $ | 122 | ||||||||
Indefinite lived trade name | 107 | — | — | 107 | ||||||||||||
Goodwill | 264 | — | — | 264 | ||||||||||||
|
|
|
|
|
|
|
|
|
|
| U.S. Eastern Region and Gulf Coast |
| U.S. Western Region |
| Canada |
| International |
| Total |
Customer base intangibles | $ 108 |
| $ 69 |
| $ 3 |
| $ 10 |
| $ 190 |
Indefinite lived trade name | 81 |
| 51 |
|
|
|
|
| 132 |
Goodwill | 289 |
| 152 |
|
|
| 43 |
| 484 |
Impairment of Long-Lived Assets:
Our long-lived assets consist primarily of:
| ● | customer base intangibles; and |
● |
|
property, plant and equipment.
The carrying value of these assets is subject to an impairment test when circumstances indicate a possible impairment. These circumstances would include significant decreases in our operating results and significant changes in market demand for our products and services. When events and circumstances indicate a possible impairment, we assess recoverability from future operations using an undiscounted cash flow analysis, derived from the lowest appropriate asset group. If the carrying value exceeds the undiscounted cash flows, we would recognize an impairment charge to the extent that the carrying value exceeds the fair value.
We group customer base intangible assets on a basis consistent with our reporting units. We determine the fair value of customer base intangibles using a discounted cash flow analysis. The most significant factor in the determination of the fair value of our customer base intangibles is forecasted sales to our customers including, in particular, our largest customers. Possible indicators of impairment could include the following:
| ● | prolonged decline in commodity oil and natural gas prices; |
| ● | the resulting decline in activity levels of many of our major customers; |
| ● | significant reductions in capital spending budgets of our customers; and |
● |
|
a pessimistic outlook for the price of oil and natural gas.
Although we determined there were no impairments of long-lived assets in 20182020 and 2017,2019, significant decreases in our forecasted sales, particularly with our largest customers, could result in future impairments of our customer base intangible assets.
The carrying value of property, plant and equipment as of December 31, 20182020 was $140$103 million, or 6% of total assets. This amount was comprised of $108$89 million, $14$2 million and $18$12 million in our U.S., Canada and International segments, respectively. We group property, plant and equipment and evaluate it for recoverability at a country or regional level. We determine the fair value of property, plant and equipment based on appraisal procedures which involve both market and cost techniques depending on the nature of the specific assets and the availability of market information. In 2018,2020, no indicators of property, plant and equipment impairment were present. Based on the nature of our property, plant and equipment and the reduction in carrying value each year through depreciation, we believe future impairments are not likely.
When testing for the impairment of the value of long-lived assets, we make forecasts of:
| ● | our future operating results; |
| ● | the extent and timing of future cash flows; |
| ● | working capital; |
| ● | profitability; and |
| ● | sales growth trends. |
We make these forecasts using the best available information at the time, including information regarding current market conditions and customer spending forecasts. While we believe our assumptions and estimates are reasonable, because of the volatile nature of the energy industry, actual results may differ materially from the projected results which could result in the recognition of additional impairment charges. Factors that could lead to actual results differing materially from projected results include, among other things, further reductions of oil and natural gas prices and changes in projected sales growth rates.
40
Impairment of Goodwill and Other Indefinite-Lived Intangible Assets: We test goodwill and intangible assets with indefinite useful lives for impairment annually, or more frequently if events and circumstances indicate that impairment may exist. We evaluate goodwill for impairment at fourthe reporting units (U.S. Eastern Region and Gulf Coast, U.S. Western Region, Canada and International).unit level. Within each reporting unit, we have elected to aggregate the component countries and regions into a single reporting unit based on their similar economic characteristics, products, customers, suppliers, methods of distribution and the manner in which we operate each segment. We perform our annual tests for indications of goodwill impairment as of October 1st of each year, updating on an interim basis should indications of impairment exist.
When we perform the goodwill impairment test, we compare the carrying value of the reporting unit that has the goodwill with the estimated fair value of that reporting unit. IfTo the extent the carrying value of a reporting unit is moregreater than theits estimated fair value, a second stepgoodwill impairment charge is performed. Inrecorded for the second step, we calculate the implied fair value of goodwill by deducting the fair value of all tangible and intangible net assets of the reporting unit from the estimated fair value of the reporting unit. We recognize impairment lossesdifference, up to the extent that recorded goodwill exceeds impliedcarrying value of goodwill. Our impairment methodology uses discounted cash flow and multiples of cash earnings valuation techniques, acquisition control premium and valuation comparisons to similar businesses to determine the fair value of a reporting unit. Each of these methods involves Level 3 unobservable market inputs and require us to make certain assumptions and estimates regarding:
| ● | future operating results, |
| ● | the extent and timing of future cash flows, |
| ● | working capital, |
| ● | sales prices, |
| ● | profitability, |
| ● | discount rates; and |
| ● | sales growth trends. |
We make these forecasts using the best available information at the time including information regarding current market conditions and customer spending forecasts. While we believe that these assumptions and estimates are reasonable, because of the volatile nature of the energy industry, actual results may differ materially from the projected results which could result in the recognition of additional impairment charges. Factors that could lead to actual results differing materially from projected results include, among other things:
| ● | reduction of oil and natural gas prices, |
| ● | changes in projected sales growth rate; and |
| ● | changes in factors affecting our discount rate including risk premiums, risk free interest rates and costs of capital. |
In connection withthe first half of 2020, demand for oil and natural gas declined sharply as a result of the COVID-19 pandemic. This disruption in demand and the resulting decline in the price of oil had a dramatic negative impact on our annualbusiness. We experienced a significant reduction in sales beginning in April 2020 which continued throughout the second quarter. At that time, there remained ongoing uncertainty around the timing and extent of any recovery. We took a more pessimistic long-term outlook due to the significant reduction in the demand for oil, the implications of that demand destruction on the price of oil for an extended period of time and actions our customers had taken to curtail costs and reduce spending. As a result of those developments, we concluded that it was more likely than not the fair values of our U.S. and International reporting units were lower than their carrying values. Accordingly, we completed an interim goodwill impairment test as of October 1, 2018, we tested the carrying valueApril 30, 2020. This test resulted in a $217 million goodwill impairment charge comprised of goodwill for$177 million in our U.S. reporting unit and $40 million in our International reporting units. Our Canada reporting unit has no goodwill. No goodwill impairments were indicated as a result of those tests as the estimated fair value of each of our reporting units substantially exceeded their carrying value.unit.
Intangible assets with indefinite useful lives are recorded in our U.S. segment. We test these assets for impairment annually or more frequently if events and circumstances indicate that impairment may exist. This test compares the carrying value of the indefinite-lived intangible assets with their estimated fair value. If the carrying value is more than the estimated fair value, we recognize impairment losses in an amount equal to the excess of the carrying value over the estimated fair value. Our impairment methodology uses discounted cash flow and estimated royalty rate valuation techniques. Utilizing these valuation methods, we make certain assumptions and estimates regarding:
| ● | future operating results, |
| ● | sales prices, |
| ● | discount rates; and |
● |
|
|
As with the goodwill impairment test described above, while we believe that our assumptions and estimates are reasonable, because of the volatile nature of the energy industry, actual results may differ materially from the projected results which could result in the recognition of additional impairment charges. The estimated fair
As a result of the same factors that necessitated an interim impairment test for goodwill, we completed an interim impairment test, as of April 30, 2020, for our U.S. indefinite-lived tradename asset. This test resulted in an impairment charge of $25 million.
In connection with our annual goodwill and indefinite-lived tradename impairment tests as of October 1, 2020, we performed a qualitative assessment of the carrying value of the goodwill for our U.S. reporting unit and U.S. indefinite-lived tradename asset. This assessment took into consideration changes in the broader economy, our industry and our business since the quantitative impairment tests completed as of April 30, 2020. Based on our assessment, we concluded that it was not more likely than not that the carrying value of the U.S. reporting unit or tradename asset exceeded their fair values. The U.S. tradename is our only indefinite-lived intangible assets substantially exceeded their carrying value.asset.
41
Income Taxes: We use the liability method for determining our income taxes, under which current and deferred tax assets and liabilities are recorded in accordance with enacted tax laws and rates. Under this method, deferred tax assets and liabilities are recorded for differences between the financial reporting and tax bases of assets and liabilities using the tax rate expected to be in effect when the taxes will actually be paid or refunds received. The effect on deferred tax assets and liabilities of a change in tax rates is recognized in earnings in the period that includes the enactment date. A valuation allowance to reduce deferred tax assets is established when it is more likely than not that some portion or all of the deferred tax assets will not be realized.
In determining the need for valuation allowances and our ability to utilize our deferred tax assets, we consider and make judgments regarding all the available positive and negative evidence, including the timing of the reversal of deferred tax liabilities, estimated future taxable income, ongoing, prudent and feasible tax planning strategies and recent financial results of operations. The amount of valuation allowances, however, could be adjusted in the future if objective negative evidence in the form of cumulative losses is no longer present in certain jurisdictions and additional weight may be given to subjective evidence such as our projections for growth.
Our tax provision is based upon our expected taxable income and statutory rates in effect in each country in which we operate. We are subject to the jurisdiction of numerous domestic and foreign tax authorities, as well as to tax agreements and treaties among these governments. Determination of taxable income in any jurisdiction requires the interpretation of the related tax laws and regulations and the use of estimates and assumptions regarding significant future events such as the amount, timing and character of deductions, permissible revenue recognition methods under the tax law and the sources and character of income and tax credits. Changes in tax laws, regulations, agreements and treaties, foreign currency exchange restrictions or our level of operations or profitability in each taxing jurisdiction could have an impact on the amount of income taxes we provide during any given year.
A tax benefit from an uncertain tax position may be recognized when it is more likely than not that the position will be sustained upon examination, including any related appeals or litigation processes, on the basis of the technical merits. We adjust these liabilities when our judgment changes as a result of the evaluation of new information not previously available. Because of the complexity of some of these uncertainties, the ultimate resolution may result in a payment that is materially different from our current estimate of the tax liabilities. These differences will be reflected as increases or decreases to income tax expense in the period in which the new information is available.
QUANTITATIVE AND QUALITATIVE DISCLOSURES ABOUT MARKET RISK |
ITEM 7A.QUANTITATIVE AND QUALITATIVE DISCLOSURES ABOUT MARKET RISK
Interest Rate Risk
As of December 31, 2018,2020, all of our outstanding debt was at floating rates. These facilities prescribe the percentage point spreads from U.S. prime, LIBOR, Canadian prime and EURIBOR. Our facilities generally allow us to fix the interest rate, at our option, for a period of 30 to 180 days. We are currently party to a $250 million interest rate swap to fix a portion of our variable rate exposure that matures in March 2023.
As of December 31, 2018,2020, a 1% increase in the LIBOR rate would result in an increase in our interest expense of approximately $4$1 million per year if the amounts outstanding under our Term Loan and Global ABL Facility remained the same for an entire year.
In the first quarter of 2018, we entered into a $250 million interest rate swap to fix a portion of our variable rate exposure.
Foreign Currency Exchange Rates
Our operations outside of the U.S. expose us to foreign currency exchange rate risk, as these transactions are primarily denominated in currencies other than the U.S. dollar, our functional currency. Our exposure to changes in foreign exchange rates is managed primarily through the use of forward foreign exchange contracts. These contracts increase or decrease in value as foreign exchange rates change, protecting the value of the underlying transactions denominated in foreign currencies. All currency contracts are entered into for the sole purpose of hedging existing or anticipated currency exposure; we do not use foreign currency contracts for trading or speculative purposes. The terms of these contracts generally do not exceed one year. We record all changes in the fair market value of forward foreign exchange contracts in income. We recorded gains related to foreign currency contracts of $1 million in the year ended December 31, 2018,2018. Gains and losses of $1 millionincurred in the yearyears ended December 31, 20172020 and gains of $1 million in the year ended December 31, 2016.2019 were not material.
Steel Prices
Our business is sensitive to steel prices, which can impact our product pricing, with carbon steel line pipe prices generally having the highest degree of sensitivity. While we cannot predict steel prices, we manage this risk by managing our inventory levels, including maintaining sufficient quantity on hand to meet demand, while reducing the risk of overstocking.
ITEM 8. FINANCIAL STATEMENTS AND SUPPLEMENTARY DATA
FINANCIAL STATEMENTS AND SUPPLEMENTARY DATA |
CHANGES IN AND DISAGREEMENTS WITH ACCOUNTANTS ON ACCOUNTING AND FINANCIAL DISCLOSURE |
43
ITEM 9. CHANGES IN AND DISAGREEMENTS WITH ACCOUNTANTS ON ACCOUNTING AND FINANCIAL DISCLOSURE
None.
ITEM 9A.CONTROLS AND PROCEDURES
CONTROLS AND PROCEDURES |
Evaluation of Disclosure Controls and Procedures
As required by the Exchange Act, we maintain disclosure controls and procedures designed to ensureprovide assurance that information we are required to disclose in reports that we file or submit under the Exchange Act, is recorded, processed, summarized and reported within the time periods specified in the SEC’s rules and forms. Our disclosure controls and procedures include, without limitation, controls and procedures designed to ensure that information we are required to disclose in reports that we file or submit under the Exchange Act is accumulated and communicated to our management, including our principal executive and principal financial officers, as appropriate to allow timely decisions regarding required disclosure. Our management, with the participation of our principal executive and financial officers, has evaluated our disclosure controls and procedures as of December 31, 20182020 and has concluded that our disclosure controls and procedures were effective as of December 31, 2018.2020.
Pursuant to section 302 of the Sarbanes-Oxley Act of 2002, our Chief Executive Officer and Chief Financial Officer have provided certain certifications to the Securities and Exchange Commission. These certifications are included herein as Exhibits 31.1 and 31.2.
Management’s Report on Internal Control Over Financial Reporting
The Company’s management report on internal control over financial reporting is set forth on page F-1 of this annual report and is incorporated herein by reference.
Attestation Report of our Registered Public Accounting Firm
The Company’s registered public accounting firm’s attestation report on our internal control over financial reporting is set forth on page F-2 of this annual report and is incorporated herein by reference.
Changes in Internal Controls Over Financial Reporting
There were no changes in our internal control over financial reporting that occurred during the quarter ended December 31, 20182020 that have materially affected, or are reasonably likely to materially affect, our internal control over financial reporting.
OTHER INFORMATION |
None.
PART III
ITEM 10.DIRECTORS, EXECUTIVE OFFICERS AND CORPORATE GOVERNANCE
DIRECTORS, EXECUTIVE OFFICERS AND CORPORATE GOVERNANCE |
The information regarding our directors and nominees for director required by Item 401 of Regulation S-K will be presented under the heading “PROPOSAL I: ELECTION OF DIRECTORS” in our Proxy Statement prepared for the solicitation of proxies in connection with our annual Meeting of Stockholders to be held April 30, 2019in 2021 (“Proxy Statement”), which information is incorporated by reference herein.
Information required by Item 405 of Regulation S-K to the extent required, will be included under the heading “Delinquent Section 16(a) Reports” in our Proxy Statement, which information is incorporated by reference herein.
Information regarding our executive officers required by Item 401(b) of Regulation S-K is presented at the end of Part I herein and captioned “Executive Officers of the Registrant” as permitted by General Instruction G(3) to Form 10-K and Instruction 3 to Item 401(b) of Regulation S-K.
Information required by Item 405 of Regulation S-K will be included under the heading “Section 16(a) Beneficial Ownership Reporting Compliance” in our Proxy Statement, which information is incorporated by reference herein.
Information required by paragraphs (c)(3), (d)(4) and (d)(5) of Item 407 of Regulation S-K will be included under the heading “QUESTIONS AND ANSWERS ABOUT THE ANNUAL MEETING AND VOTING” and “CORPORATE GOVERNANCE”GOVERNANCE MATTERS” in our Proxy Statement, which information is incorporated by reference herein.
We have adopted a Code of Ethics for Principal Executive and Senior Financial Officers (“Code of Ethics for Senior Officers”) that applies to our Chief Executive Officer, Chief Financial Officer, Chief Accounting Officer, and Controller, or persons performing similar functions. The Code of Ethics for Senior Officers, together with our Corporate Governance Guidelines, the charters for each of our board committees, and our Code of Ethics applicable to all employees are available on our Internet website at www.mrcglobal.com. We will provide, free of charge, a copy of our Code of Ethics or any of our other corporate documents listed above upon written request to our Corporate Secretary at 1301 McKinney Street, Suite 2300, Houston, Texas, 77010. We intend to disclose any amendments to or waivers of the Code of Ethics for Senior Officers on behalf of our Chief Executive Officer, Chief Financial Officer, Chief Accounting Officer, and Controller, and persons performing similar functions on our Internet website at www.mrcglobal.com under the Investor Relations page, promptly following the date of any such amendment or waiver.
ITEM 11.EXECUTIVE COMPENSATION
EXECUTIVE COMPENSATION |
The information required by Item 402 and paragraphs (e)(4) and (e)(5) of Item 407 of Regulations S-K regarding executive compensation will be presented under the headings “Compensation Discussion and Analysis,“COMPENSATION DISCUSSION AND ANALYSIS,” “Employment and Other Agreements,” “Summary Compensation Table for 2018,2020,” “Grants of Plan-Based Awards in Fiscal Year 2018,2020,” “Outstanding Equity Awards at 20182020 Fiscal Year-End,” “Option Exercises and Stock Vested During 2018,2020,” “Potential Payments upon Termination or Change in Control,” “Non-Employee Director Compensation Table,” “Compensation Committee Report,” and “Compensation Committee Interlocks and Insider Participation” in our Proxy Statement, which information is incorporated by reference herein. Notwithstanding the foregoing, the information provided under the heading “Compensation Committee Report” in our Proxy Statement is furnished and shall not be deemed to be filed for purposes of Section 18 of the Exchange Act is not subject to the liabilities of that section and is not deemed incorporated by reference in any filing under the Securities Act.
SECURITY OWNERSHIP OF CERTAIN BENEFICIAL OWNERS AND MANAGEMENT AND RELATED STOCKHOLDER MATTERS |
ITEM 12. SECURITY OWNERSHIP OF CERTAIN BENEFICIAL OWNERS AND MANAGEMENT AND RELATED STOCKHOLDER MATTERS
The information regarding the security ownership of certain beneficial owners and management required by Item 403 of Regulation S-K will be presented under the heading “Security Ownership of Officersheadings “SECURITY OWNERSHIP – Directors and Directors”Executive Owners” and “Stock Ownership of“SECURITY OWNERSHIP – Certain Beneficial Owners” in our Proxy Statement, which information is incorporated by reference herein.
The following table summarizes information, as of December 31, 2018,2020, relating to our equity compensation plans pursuant to which grants of options, restricted stock, or certain other rights to acquire our shares may be granted from time to time.
|
|
|
|
|
|
|
|
| (a) | (b) | (c) |
Plan Category
| Number of securities to
| Weighted-average
| Number of securities
|
Equity compensation plans approved by security holders: |
|
|
|
Stock options, restricted stock awards, restricted stock unit awards, and performance share unit awards | 6,846,957 | $23.81 | 1,482,029 |
|
|
|
|
Equity compensation plans not approved by security holders | None | N/A | None |
(a) | (b) | (c) | ||||||||||
Number of securities | ||||||||||||
remaining available for | ||||||||||||
Number of securities to | future issuance under | |||||||||||
be issued upon | Weighted-average | equity compensation | ||||||||||
exercise of outstanding | exercise price of | plans (excluding | ||||||||||
options, warrants and | outstanding options, | securities reflected in | ||||||||||
Plan Category | rights | warrants and rights | column (a)) | |||||||||
Equity compensation plans approved by security holders: | ||||||||||||
| Stock options, restricted stock awards, restricted stock unit awards, and performance share unit awards | 4,885,948 | $ | 17.04 | 1,828,274 | ||||||||
Equity compensation plans not approved by security holders | None | N/A | None | |||||||||
| Total | 4,885,948 | $ | 17.04 | 1,828,274 | ||||||||
ITEM 13.CERTAIN RELATIONSHIPS AND RELATED TRANSACTIONS, AND DIRECTOR INDEPENDENCE
CERTAIN RELATIONSHIPS AND RELATED TRANSACTIONS, AND DIRECTOR INDEPENDENCE |
The information regarding certain relationships and related transactions required by Item 404 and Item 407(a) of Regulation S-K will be presented under the headings “Certain Relationships and Related Transactions”, “Related Party Transaction Policy”, “Corporate Governance,” “Board and Committees,” “Board of Directors,” “Director Independence” and “Committees of the Board” in our Proxy Statement, which information is incorporated by reference herein.
ITEM 14.PRINCIPAL ACCOUNTANT FEES AND SERVICES
PRINCIPAL ACCOUNTANT FEES AND SERVICES |
The information regarding our principal accounting fees and services required by Item 9(e) of Schedule 14A will be presented under the headings “Principal Accounting Fees and Services” and “Policy on Audit Committee Pre-Approval of Audit and Non-Audit Services of Independent Auditors” in our Proxy Statement, which information is incorporated by reference herein.
PART IV
ITEM 15.EXHIBITS AND FINANCIAL STATEMENT SCHEDULES
EXHIBITS AND FINANCIAL STATEMENT SCHEDULES |
(a)Documents Filed as Part of this Annual Report:
(a) | Documents Filed as Part of this Annual Report: |
1.Financial Statements.
1. | Financial Statements. |
See “Item 8—Financial Statements and Supplementary Data.”
See “Item 8—Financial Statements and Supplementary Data.” |
2.Financial Statement Schedules.
2. | Financial Statement Schedules. |
All schedules are omitted because they are not applicable, not required or the information is included in the financial statements or the notes thereto.
3.List of Exhibits.
3. | List of Exhibits. |
Exhibit Number | Description |
3.1 | |
3.2 | |
3.3 | |
4.1 | |
10.1 | |
10.2 | |
10.2.1 |
47
48
Exhibit Number | Description |
10.4† | |
| |
10.4.2† | |
10.5† | |
| |
| 10.6† | |
10.7† | |
10.7.1† | |
10.7.2† | |
10.7.3† | |
10.8† | |
10.8.1† | |
10.8.2† |
Exhibit Number | Description |
10.8.3† | |
| |
| |
|
49
|
|
10.8.6† | |
| |
| |
| |
| Form of MRC Global Inc. Performance Share Unit Award Agreement. |
| Form of MRC Global Inc. Restricted Stock Unit Award Agreement. |
10.9† | |
| |
| |
| |
| |
|
50
|
|
| |
| |
| |
|
Exhibit Number | Description |
| |
21.1* | |
23.1* | Consent of Ernst & Young LLP, Independent Registered Public Accounting Firm. |
31.1* | |
31.2* | |
32** | |
100* | The following financial information from MRC Global Inc.’s Annual Report on Form 10-K for the period ended December 31, |
101* | Interactive data file. |
101.INS* | Inline XBRL Instance Document. |
101.SCH* | Inline XBRL Taxonomy Extension Schema. |
101.CAL* | Inline XBRL Taxonomy Extension Calculation Linkbase. |
101.DEF* | Inline XBRL Taxonomy Extension Definition Linkbase. |
51
|
|
101.LAB* | Inline XBRL Taxonomy Extension Label Linkbase. |
101.PRE* | Inline XBRL Taxonomy Extension Presentation Linkbase. |
104 | The cover page from the Company’s Annual Report on Form 10-K for the year ended December 31, 2020 formatted in Inline XBRL |
†Management contract or compensatory plan or arrangement required to be posted as an exhibit to this report.
*Filed herewith.
**Furnished herewith.
Not applicable.
FORM 10-K SUMMARY |
52None.
SIGNATURES
Pursuant to the requirements of the Securities Exchange Act of 1934, the registrant has duly caused this report to be signed on its behalf by the undersigned, thereunto duly authorized.
MRC GLOBAL INC. | ||
| ||
| By: | /s/ | |
| Andrew R. Lane President and Chief Executive Officer | |
Date: February 15, 201912, 2021
Pursuant to the requirements of the Securities Exchange Act of 1934, this report has been signed below by the following persons on behalf of the registrant and in the capacity and on the dates indicated.
The Term Loan also contains other customary restrictive covenants. The covenants are subject to various baskets and materiality thresholds, with certain of the baskets permitted by the restrictions on the repayment of subordinated indebtedness, restricted payments and investments being available only when the senior secured leverage ratio of the Company and its restricted subsidiaries is less than 3.75:3.75 to 1.00.
The Term Loan provides that the Company and its restricted subsidiaries may incur any first lien indebtedness that is pari passu to the Term Loan so long as the pro forma senior secured leverage ratio of the Company and its restricted subsidiaries is less than or equal to 4.00:4.00 to 1.00. The Company and its restricted subsidiaries may incur any second lien indebtedness so long as the pro forma junior secured leverage ratio of the Company and its restricted subsidiaries is less than or equal to 4.75:4.75 to 1.00. The Company and its restricted subsidiaries may incur any unsecured indebtedness so long as the total leverage ratio of the Company and its restricted subsidiaries is less than or equal to 5.00:1.005.00 to1.00 or the pro forma consolidated interest coverage ratio of the Company and its restricted subsidiaries is greater than or equal to 2.00 to 1.00. Additionally, under the Term Loan, the Company and its restricted subsidiaries may incur indebtedness under the Global ABL Facility (or any replacement facility) in an amount not to exceed the greater of $1.3 billion and a borrowing base (equal to, subject to certain exceptions, 85% of all accounts receivable and 65% of the book value of all inventory owned by the Company and its restricted subsidiaries).
The Term Loan contains certain customary representations and warranties, affirmative covenants and events of default, including, among other things, payment defaults, breaches of representations and warranties, covenant defaults, cross-defaults to certain indebtedness, certain events of bankruptcy, certain events under ERISA, judgment defaults, actual or asserted failure of any material guaranty or security documents supporting the Term Loan to be in full force and effect and change of control. If such an event of default occurs, the Agent under the Term Loan is entitled to take various actions, including the acceleration of amounts due under the Term Loan and all other actions that a secured creditor is permitted to take following a default.
In March 2020, we purchased and retired $3 million of the outstanding interests in the Term Loan at a cost of $2 million. We recognized a gain of $1 million on the extinguishment of the debt in the year ended December 31, 2020.
Global ABL Credit Facility: : In September 2017, the Company entered into a Third Amended and Restated Loan, Security and Guarantee Agreement (the “Global ABL Facility”) by and among the Company, the subsidiaries of the Company from time to time party thereto as borrowers and guarantors, the several lenders from time to time party thereto and Bank of America, N.A. as administrative agent, security trustee and collateral agent. As part of the amendment, the multi-currency global asset-based revolving credit facility was re-sized to $800 million from $1.05 billion and the maturity was extended to September 2022 from July 2019. This facility is comprised of $675 million in revolver commitments in the United States, $65 million in Canada, $18 million in Norway, $15 million in Australia, $13 million in the Netherlands, $7 million in the United Kingdom and $7 million in Belgium. It contains an accordion feature that allows us to increase the principal amount of the facility by up to $200 million, subject to securing additional lender commitments. As a result of the amendment, we recorded a charge of $3 million for the write-off of debt issuance costs for the year ended December 31, 2017.
Guarantees. Each of our current and future wholly owned material U.S. subsidiaries and MRC Global Inc. guarantees the obligations of our borrower subsidiaries under the Global ABL Facility. Additionally, each of our non-U.S. borrower subsidiaries guarantees the obligations of our other non-U.S. borrower subsidiaries under the Global ABL Facility. No non-U.S. subsidiary guarantees the U.S. tranche, and no property of our non-U.S. subsidiaries secures the U.S. tranche.
Security. Obligations under the U.S. tranche are primarily secured, subject to certain exceptions, by a first-priorityfirst-priority security interest in the accounts receivable, inventory and related assets of our wholly owned, material U.S. subsidiaries. The security interest in accounts receivable, inventory and related assets of the U.S. borrower subsidiaries ranks prior to the security interest in this collateral which secures the Term Loan. The obligations of any of our non-U.S. borrower subsidiaries are primarily secured, subject to certain exceptions, by a first-priorityfirst-priority security interest in the accounts receivable, inventory and related assets of the non-U.S. subsidiary and our wholly owned material U.S. subsidiaries.
F-19
Borrowing Bases. Each of our non-U.S. borrower subsidiaries has a separate standalone borrowing base that limits the non-U.S. subsidiary’s ability to borrow under its respective tranche, provided that the non-U.S. subsidiaries may utilize excess availability under the U.S. tranche to borrow amounts in excess of their respective borrowing bases (but not to exceed the applicable commitment amount for the foreign subsidiary’s jurisdiction), which utilization will reduce availability under the U.S. tranche dollar for dollar.
Subject to the foregoing, our ability to borrow in each jurisdiction, other than Belgium, under the Global ABL Facility is limited by a borrowing base in that jurisdiction equal to 85% of eligible receivables, plus the lesser of 70% of eligible inventory and 85% of appraised net orderly liquidation value of the inventory. In Belgium, our borrowing is limited by a borrowing base determined under Belgian law.
Interest Rates. U.S. borrowings under the facility bear interest at LIBOR plus a margin varying between 1.25% and 1.75% based on our fixed charge coverage ratio. Canadian borrowings under the facility bear interest at the Canadian Dollar Bankers’ Acceptances Rate (“BA Rate”) plus a margin varying between 1.25% and 1.75% based on our fixed charge coverage ratio. Borrowings by our foreign borrower subsidiaries bear interest at a benchmark rate, which varies based on the currency in which such borrowings are made, plus a margin varying between 1.25% and 1.75% based on our fixed charge coverage ratio.
Excess Availability. At December 31, 2018,2020, availability under our revolving credit facilities was $449$432 million.
Interest on Borrowings: The interest rates on our borrowings outstanding at December 31, 20182020 and 2017,2019, including a floating to fixed interest rate swap and amortization of debt issuance costs, were as follows:
|
|
|
|
|
|
|
| December 31, | |||
|
| 2018 |
|
| 2017 |
Senior Secured Term Loan B |
| 5.76% |
|
| 5.18% |
Global ABL Facility |
| 3.95% |
|
| 3.19% |
Weighted average interest rate |
| 4.99% |
|
| 4.69% |
December 31, | ||||||||
2020 | 2019 | |||||||
Senior Secured Term Loan B | 4.93 | % | 5.50 | % | ||||
Global ABL Facility | 0 | % | 3.47 | % | ||||
Weighted average interest rate | 4.93 | % | 4.91 | % | ||||
Maturities of Long-Term Debt: At December 31, 2018,2020, annual maturities of long-term debt during the next five years are as follows (in millions):
2021 | $ | 4 | ||
2022 | 4 | |||
2023 | 4 | |||
2024 | 371 | |||
2025 | 0 | |||
Thereafter | 0 |
|
|
|
|
|
|
2019 |
| $ 4 |
|
|
|
2020 |
| 4 |
|
|
|
2021 |
| 4 |
|
|
|
2022 |
| 295 |
|
|
|
2023 |
| 4 |
|
|
|
Thereafter |
| 373 |
|
|
|
|
|
|
|
|
|
NOTE 9—DERIVATIVE FINANCIAL INSTRUMENTS
NOTE 8—DERIVATIVE FINANCIAL INSTRUMENTS
We use derivative financial instruments to help manage our exposure to interest rate risk and fluctuations in foreign currencies.
Interest Rate Swap: In March 2018, we entered into a five-yearfive year interest rate swap that became effective on March 31, 2018, with a notional amount of $250 million from which we receive payments at 1-month1-month LIBOR and make monthly payments at a fixed rate of 2.7145% with settlement and reset dates on or near the last business day of each month until maturity. The fair value of the swap at inception was zero.0. The fair value of the interest rate swap was a liability of $3$14 million and $9 million as of December 31, 2018.2020 and December 31, 2019, respectively.
Foreign Exchange Forward and Option Contracts:All of our foreign exchange derivative instruments are freestanding. We have not designated our foreign exchange derivatives as hedges and, accordingly, changes in their fair market value are recorded in earnings. Foreign exchange forward contracts are reported at fair value utilizing the Level 2 inputs, as the fair value is based on broker quotes for the same or similar derivative instruments. The fair value of foreign exchange derivative instruments recorded in our consolidated balance sheets at December 31, 20182020 and 20172019 was not material. The total notional amount of outstanding forward foreign exchange contracts was approximately $22$3 million and $60$21 million at December 31, 20182020 and 2017,2019, respectively.
We recognized a gain of $1 million in the year ended December 31, 2018 a loss of $1 million in the year ended December 31, 2017 and a gain of $1 million in the year ended December 31, 2016 in our consolidated statements of operations related to our derivative instruments. For the years ended December 31, 2020 and 2019, the gain or loss was not material.
NOTE 10—INCOME TAXES
F-20
NOTE 9—INCOME TAXES
On December 22, 2017, the Tax Cuts and Jobs Act of 2017 (the “Tax Act”) was enacted. Among the significant changes to the U.S. Internal Revenue Code, the Tax Act reduced the U.S. federal corporate income tax rate from 35% to 21% effective January 1, 2018 and created a new dividend-exemption territorial system with a one-time transition tax on foreign earnings which were previously not taxed in the U.S.
We applied the guidance in Staff Accounting Bulletin (“SAB”) 118 when accounting for the enactment-date effects of the Tax Act in 2017 and throughout 2018. At December 31, 2017, we had not completed our accounting for all of the enactment-date income tax effects of the Tax Act under ASC 740, Income Taxes, including the remeasurement of deferred tax assets and liabilities and the one-time transition tax. At December 31, 2018, we have now completed our accounting for all of the enactment-date income tax effects of the Tax Act. As further discussed below, during 2018, we recognized additional tax benefit adjustments of $3 million to the provisional amounts recorded at December 31, 2017 and included these adjustments as a component of income tax expense from continuing operations.
The one-time transition tax, calculated as of December 31, 2017, is based on the total post-1986 earnings and profits of our foreign subsidiaries. We recorded a provisional amount of $7 million for the one-time transition tax liability. Upon further analyses of the Tax Act and notices and regulations issued and proposed by the U.S. Department of the Treasury and the Internal Revenue Service, we finalized our calculations of the transition tax liability during 2018. We decreased our provisional amount by $4 million, which is included as a component of income tax expense from continuing operations in 2018. We have elected to pay our transition tax over the eight-year period provided in the Tax Act.
As of December 31, 2017, we remeasured our U.S. deferred tax assets and liabilities based on the rates at which they were expected to reverse in the future (which was generally 21%), and recorded a provisional tax benefit of $57 million. Upon further analysis of certain aspects of the Tax Act and refinement of our calculations in 2018, we reduced our provisional tax benefit amount by $1 million, which is included as a component of income tax expense from continuing operations in 2018.
The components of our income (loss) before income taxes were (in millions):
Year Ended December 31, | ||||||||||||
2020 | 2019 | 2018 | ||||||||||
United States | $ | (216 | ) | $ | 86 | $ | 95 | |||||
Foreign | (67 | ) | (20 | ) | 0 | |||||||
| $ | (283 | ) | $ | 66 | $ | 95 | ||||||
|
|
|
|
|
|
|
|
|
| Year Ended December 31, | |||||||
| 2018 |
| 2017 |
| 2016 | |||
United States | $ | 95 |
| $ | 49 |
| $ | (7) |
Foreign |
| - |
|
| (42) |
|
| (84) |
| $ | 95 |
| $ | 7 |
| $ | (91) |
F-21
Income taxes included in the consolidated statements of operations consist of (in millions):
Year Ended December 31, | ||||||||||||
2020 | 2019 | 2018 | ||||||||||
Current: | ||||||||||||
| Federal | $ | 8 | $ | 22 | $ | 21 | ||||||
| State | 2 | 6 | 1 | |||||||||
| Foreign | 2 | 4 | 8 | |||||||||
| 12 | 32 | 30 | ||||||||||
Deferred: | ||||||||||||
| Federal | (20 | ) | (4 | ) | (6 | ) | ||||||
| State | 0 | 0 | (1 | ) | ||||||||
| Foreign | (1 | ) | (1 | ) | (2 | ) | ||||||
| (21 | ) | (5 | ) | (9 | ) | |||||||
Income tax (benefit) expense | $ | (9 | ) | $ | 27 | $ | 21 | |||||
|
|
|
|
|
|
|
|
|
| Year Ended December 31, | |||||||
| 2018 |
| 2017 |
| 2016 | |||
Current: |
|
|
|
|
|
|
|
|
Federal | $ | 21 |
| $ | 26 |
| $ | 13 |
State |
| 1 |
|
| 5 |
|
| 1 |
Foreign |
| 8 |
|
| 4 |
|
| 1 |
|
| 30 |
|
| 35 |
|
| 15 |
|
|
|
|
|
|
|
|
|
Deferred: |
|
|
|
|
|
|
|
|
Federal |
| (6) |
|
| (73) |
|
| (21) |
State |
| (1) |
|
| (4) |
|
| (2) |
Foreign |
| (2) |
|
| (1) |
|
| - |
|
| (9) |
|
| (78) |
|
| (23) |
Income tax expense (benefit) | $ | 21 |
| $ | (43) |
| $ | (8) |
Our effective tax rate varied from the statutory federal income tax rate for the following reasons (in millions):
|
|
|
|
|
|
|
|
| Year Ended December 31, | |||||||||||
| Year Ended December 31, | 2020 | 2019 | 2018 | ||||||||||||||||
| 2018 |
| 2017 |
| 2016 | |||||||||||||||
Federal tax expense (benefit) at statutory rates | $ | 20 |
| $ | 2�� |
| $ | (32) | ||||||||||||
| Federal tax (benefit) expense at statutory rates | $ | (60 | ) | $ | 14 | $ | 20 | |||||||||||||
State taxes |
| 2 |
|
| 2 |
|
| 1 | 0 | 4 | 2 | |||||||||
Effects of tax rate changes on existing temporary differences |
| - |
|
| (59) |
|
| - | ||||||||||||
Transition tax |
| (4) |
|
| 7 |
|
| - | 0 | 0 | (4 | ) | ||||||||
Nondeductible expenses and other |
| 2 |
|
| - |
|
| 1 | 5 | 3 | 2 | |||||||||
Foreign operations taxed at different rates |
| - |
|
| (2) |
|
| 5 | ||||||||||||
| Goodwill impairment charge | 43 | 0 | 0 | |||||||||||||||||
Change in valuation allowance related to foreign losses |
| 1 |
|
| 7 |
|
| 17 | 3 | 6 | 1 | |||||||||
Income tax expense (benefit) | $ | 21 |
| $ | (43) |
| $ | (8) | ||||||||||||
Income tax (benefit) expense | $ | (9 | ) | $ | 27 | $ | 21 | |||||||||||||
Effective tax rate |
| 22% |
|
| (614%) |
|
| 9% | 3 | % | 41 | % | 22 | % | ||||||
|
|
|
|
|
|
Significant components of our deferred tax assets and liabilities are as follows (in millions): | |||||
| December 31, | ||||
| 2018 |
| 2017 | ||
Deferred tax assets: |
|
|
|
|
|
Allowance for doubtful accounts | $ | 1 |
| $ | 1 |
Accruals and reserves |
| 21 |
|
| 20 |
Net operating loss and tax credit carryforwards |
| 54 |
|
| 57 |
Other |
| 2 |
|
| 3 |
Subtotal |
| 78 |
|
| 81 |
Valuation allowance |
| (60) |
|
| (63) |
Total |
| 18 |
|
| 18 |
|
|
|
|
|
|
Deferred tax liabilities: |
|
|
|
|
|
Inventory valuation |
| (30) |
|
| (29) |
Property, plant and equipment |
| (13) |
|
| (14) |
Intangible assets |
| (70) |
|
| (78) |
Other |
| - |
|
| (2) |
Total |
| (113) |
|
| (123) |
Net deferred tax liability | $ | (95) |
| $ | (105) |
F-22Significant components of our deferred tax assets and liabilities are as follows (in millions):
December 31, | ||||||||
2020 | 2019 | |||||||
Deferred tax assets: | ||||||||
| Allowance for credit losses | $ | 1 | $ | 1 | ||||
| Accruals and reserves | 17 | 20 | ||||||
| Net operating loss and tax credit carryforwards | 68 | 58 | ||||||
| Other | 2 | 1 | ||||||
Subtotal | 88 | 80 | ||||||
| Valuation allowance | (71 | ) | (64 | ) | ||||
Total | 17 | 16 | ||||||
Deferred tax liabilities: | ||||||||
| Inventory valuation | (23 | ) | (29 | ) | ||||
| Property, plant and equipment | (10 | ) | (13 | ) | ||||
| Intangible assets | (50 | ) | (63 | ) | ||||
Total | (83 | ) | (105 | ) | ||||
Net deferred tax liability | $ | (66 | ) | $ | (89 | ) | ||
We record a valuation allowance when it is more likely than not that some portion or all of our deferred tax assets will not be realized. The ultimate realization of the deferred tax assets depends on the ability to generate sufficient taxable income of the appropriate character in the future and in the appropriate taxing jurisdictions. If we were to determine that we would be able to realize our deferred tax assets in the future in excess of their net recorded amount, we would make an adjustment to the valuation allowance, which would reduce the provision for income taxes.
In the United States, we had approximately $18$17 million of state net operating loss (“NOL”) carryforwards as of December 31, 2018,2020, which will expire in future years through 2032 and foreign tax credit (“FTC”) carryforwards of $7$5 million, which will expire in future years through 2028.2027. In certain non-U.S. jurisdictions, we had $169$213 million of NOL carryforwards, of which $150$170 million have no expiration and $19$43 million will expire in future years through 2028.2030. We believe that it is more likely than not that the benefit from U.S. state NOL and FTC carryforwards and non-U.S. jurisdiction NOL carryforwards will not be realized. As such, we have recorded full valuation allowance on the deferred tax assets related to these NOL and FTC carryforwards.
Dividends from the earnings of our foreign subsidiaries subsequent to 2017 are eligible for a 100% dividend exclusion in determining our U.S. federal taxes. As such, we do not expect future dividends, if any, from the earnings of our foreign subsidiaries to result in U.S. federal income taxes. Deferred tax liabilities arising from the difference between the financial reporting and income tax bases inherent in these foreign subsidiaries, referred to as outside basis differences, have not been provided for U.S. income tax purposes because we do not intend to sell, liquidate or otherwise trigger the recognition of U.S. taxable income with regard to our investment in these foreign subsidiaries. Determining the amount of U.S. deferred tax liabilities associated with outside basis differences is not practicable at this time.
Our tax filings for various periods are subject to audit by the tax authorities in most jurisdictions where we conduct business. We are no longer subject to U.S. federal income tax examination for all years through 20142016 and the statute of limitations at our international locations is generally six years or seven years.
At December 31, 20182020 and 2017,2019, our unrecognized tax benefits totaled $5$1 million and $2$4 million, respectively.
NOTE 10—11—REDEEMABLE PREFERRED STOCK
Preferred Stock Issuance
In June 2015, we issued 363,000 shares of Series A Convertible Perpetual Preferred Stock (the “Preferred Stock”) and received gross proceeds of $363 million. The Preferred Stock ranks senior to our common stock with respect to dividend rights and rights on liquidation, winding-up and dissolution. The Preferred Stock has a stated value of $1,000 per share, and holders of Preferred Stock are entitled to cumulative dividends payable quarterly in cash at a rate of 6.50% per annum. In June 2018, the holders of Preferred Stock designated one member to our Boardboard of Directors.directors. If we fail to declare and pay the quarterly dividend for an amount equal to six or more dividend periods, the holders of the Preferred Stock would be entitled to designate an additional member to our Boardboard of Directors.directors. Holders of Preferred Stock are entitled to vote together with the holders of the common stock as a single class, in each case, on an as-converted basis, except where a separate class vote of the common stockholders is required by law. Holders of Preferred Stock have certain limited special approval rights, including with respect to the issuance of pari passu or senior equity securities of the Company.
The Preferred Stock is convertible at the option of the holders into shares of common stock at an initial conversion rate of 55.9284shares of common stock for each share of Preferred Stock, which represents an initial conversion price of approximately $17.88 per share of common stock, subject to adjustment. On or after Effective June 10, 2020, the Company will havehas the option to redeem, in whole but not in part, all the outstanding shares of Preferred Stock at 105% of par value, subject to certain redemption price adjustments on the basis of the date of the conversion. Prior to June 10, 2022, such redemption would be at a 5% premium on the stated value per share.adjustments. We may elect to convert the Preferred Stock, in whole but not in part, into the relevant number of shares of common stock on or after the 54thmonth after the initial issuance of the Preferred Stock if the last reported sale price of the common stock has been at least 150% of the conversion price then in effect for a specified period. The conversion rate is subject to customary anti-dilution and other adjustments.
Holders of the Preferred Stock may, at their option, require the Company to repurchase their shares in the event of a fundamental change, as defined in the shareholder agreement and related documents.agreement. The repurchase price is based on the original $1,000$1,000 per share purchase price except in the case of a liquidation in which case they would receive the greater of $1,000$1,000 per share and the amount that would be received if they held common stock converted at the conversion rate in effect at the time of the fundamental change. Because this feature could require redemption as a result of the occurrence of an event not solely within the control of the Company, the Preferred Stock is classified as temporary equity on our balance sheet.
F-23NOTE 12—STOCKHOLDERS’ EQUITY
Preferred Stock
NOTE 11—STOCKHOLDERS’ EQUITY
Preferred Stock
We have authorized 100,000,000 shares of preferred stock. Our Board of Directors has the authority to issue shares of the preferred stock. As of December 31, 20182020 and 2017,2019, the 363,000 shares of preferred stock described in Note 1011 were issued and outstanding.
Share Repurchase Programs
In November 2015,
From time to time, the Company’s board of directors has authorized a share repurchase programprograms for shares of the Company’s common stock. Under these plans, we have repurchased 24,216,330 shares of common stock up to $100 million, which was increased to $125 million in November 2016. During the first quarter of 2017, we completed the repurchase of all shares authorized under this program.
In October 2017, the Company’s board of directors authorized a new share repurchase program for common stock of up to $100 million. In the second quarter of 2018, the Company completed the repurchases of all shares authorized under this program.
In October 2018, the Company’s board of directors authorized a new share repurchase program for common stock of up to $150 million. The program is scheduled to expire December 31, 2019. The shares may be repurchased at management’s discretion in the open market. Depending on market conditions and other factors, these repurchases may be commenced or suspended from time to time without prior notice. During the fourth quarter of 2018, we repurchased 4,724,909 shares at a total cost of $75 million.
In total, as of December 31, 2018, we had repurchased 19,347,839 shares under these programs at an average price per share of $15.51$15.48 for a total cost of $300$375 million. As of December 31, 2019, there were 0 remaining authorizations outstanding under these programs. There were 85,605,85482,098,966 shares of common stock outstanding as of December 31, 2018. In January2019, we repurchased an additional 1,758,537 shares at a total cost of $25 million.
|
|
|
|
|
|
|
|
|
Summary of share repurchase activity under the repurchase program: |
|
|
|
|
|
|
|
|
| 2018 |
| 2017 |
| 2016 | |||
Number of shares acquired on the open market |
| 7,596,113 |
|
| 4,074,146 |
|
| 6,861,191 |
Average price per share | $ | 16.46 |
| $ | 16.62 |
| $ | 13.96 |
Total cost of acquired shares (in millions) | $ | 125 |
| $ | 68 |
| $ | 95 |
F-242020.
The following table summarizes the share repurchase activity:
2020 | 2019 | 2018 | ||||||||||
Number of shares acquired on the open market | 0 | 4,868,491 | 7,596,113 | |||||||||
Average price per share | $ | 0 | $ | 15.38 | $ | 16.46 | ||||||
Total cost of acquired shares (in millions) | $ | 0 | $ | 75 | $ | 125 | ||||||
Accumulated Other Comprehensive Loss
Accumulated other comprehensive loss in the accompanying consolidated balance sheets consists of the following (in millions):
|
|
|
|
|
|
|
|
|
|
|
|
| December 31, | ||||
| 2018 |
| 2017 | ||
Currency translation adjustments | $ | (229) |
| $ | (209) |
Hedge accounting adjustments |
| (2) |
|
| - |
Pension related adjustments |
| (1) |
|
| (1) |
Accumulated other comprehensive loss | $ | (232) |
| $ | (210) |
|
|
|
|
|
|
December 31, | ||||||||
2020 | 2019 | |||||||
| Currency translation adjustments | $ | (222 | ) | $ | (224 | ) | ||
| Hedge accounting adjustments | (11 | ) | (7 | ) | ||||
| Other adjustments | (1 | ) | (1 | ) | ||||
Accumulated other comprehensive loss | $ | (234 | ) | $ | (232 | ) | ||
Earnings per Share
Earnings per share are calculated in the table below (in millions, except per share amounts):
|
|
|
|
|
|
|
|
| Year Ended December 31, | |||||||||||
| Year Ended December 31, | 2020 | 2019 | 2018 | ||||||||||||||||
| 2018 |
| 2017 |
| 2016 | |||||||||||||||
Net income (loss) attributable to common stockholders | $ | 50 |
| $ | 26 |
| $ | (107) | ||||||||||||
Net (loss) income attributable to common stockholders | $ | (298 | ) | $ | 15 | $ | 50 | |||||||||||||
|
|
|
|
|
|
|
|
| ||||||||||||
Average basic shares outstanding |
| 90.1 |
|
| 94.3 |
|
| 97.3 | 82.0 | 83.0 | 90.1 | |||||||||
Effect of dilutive securities |
| 1.7 |
|
| 1.3 |
|
| - | 0 | 0.9 | 1.7 | |||||||||
Average diluted shares outstanding |
| 91.8 |
|
| 95.6 |
|
| 97.3 | 82.0 | 83.9 | 91.8 | |||||||||
|
|
|
|
|
|
|
|
| ||||||||||||
Net income per share: |
|
|
|
|
|
|
|
| ||||||||||||
Net (loss) income per share: | ||||||||||||||||||||
Basic | $ | 0.55 |
| $ | 0.28 |
| $ | (1.10) | $ | (3.63 | ) | $ | 0.18 | $ | 0.55 | |||||
Diluted | $ | 0.54 |
| $ | 0.27 |
| $ | (1.10) | $ | (3.63 | ) | $ | 0.18 | $ | 0.54 | |||||
Equity awards and shares of Preferred Stock are disregarded in this calculation if they are determined to be anti-dilutive. For the years ended December 31, 2018, 20172020, 2019 and 2016, our2018 all of the shares of Preferred Stock were anti-dilutive. We had approximately 3.6 million, 2.5 million and 3.1 million anti-dilutive stock options, approximated 3.1 million, 3.6 million and 3.6 million, respectively. There were 0.9 million anti-dilutive restricted stock restricted units, orand performance stock unit awardsunits for the yearyears ended December 31, 2016.2020, 2019, and 2018, respectively.
NOTE 12—13—EMPLOYEE BENEFIT PLANS
Equity Compensation Plans: Our 2007 Stock Option Plan (prior to its replacement) permitted the grant of stock options to our employees, directors and consultants for up to 3,750,000 shares of common stock. The options were not to be granted with an exercise price less than the fair market value of the Company’s common stock on the date of the grant, nor for a term exceeding ten years. Vesting generally occurred over a five year period on the anniversaries of the date specified in the employees’ respective option agreements, subject to accelerated vesting under certain circumstances set forth in the option agreements. During 2018, 1,162,0592020, 0 stock options were exercised, and no0 stock options were granted under this plan.
Under
Shares that do not vest and are forfeited and shares that are surrendered for the termspayment of our 2007 Restricted Stock Plan, upwithholding taxes are returned to 500,000the pool of shares of restricted stock could have been granted (prioravailable for issuance pursuant to its replacement) at the direction of the Board of Directors and vesting generally occurred in one-fourth increments on the second, third, fourth and fifth anniversaries of the date specified in the employees’ respective restricted stock agreements, subjectplan. Certain shares that are not likely to accelerated vesting under certain circumstances set forth in the restricted stock agreements. Fair value was based on the fair market value of our stock on the date of issuance. We expense the fair value of the restricted stock grants on a straight-line basis over the vesting period.be issued may also be available.
In April 2012, we replaced the our 2007 Stock Option Plan and the our 2007 Restricted Stock Plan with the 2011 Omnibus Incentive Plan. NoNaN additional shares or other equity interests will be awarded under the prior plans. The 2011 Omnibus Incentive Plan originally had 3,250,000 shares reservedavailable for issuance pursuant to the plan. In both April 2015and 2019, our shareholders approved an additional 4,250,000 shares for reservationand 2,500,000 shares, respectively, for issuance under the plan. The plan permits the issuance of stock options, stock appreciation rights, restricted stock, restricted stock units, performance shares, performance units and other stock-based and cash-based awards. Since the adoption of the 2011 Omnibus Incentive Plan, the Company’s Board of Directors has periodically granted stock options, restricted stock awards, restricted stock units and performance share units to directors and employees, but no other types of awards have been granted under the plan. Options and stock appreciation rights may not be granted at prices less than their fair market value on the date of the grant, nor for a term exceeding ten years. For employees, vesting generally occurs over a three year to five year period on the anniversaries of the date specified in the employees’ respective agreements, subject to accelerated vesting under certain circumstances set forth in the
F-25
option agreements. Vesting for directors generally occurs on the one-yearone year anniversary of the grant date. In 2018, 81,5422020, 169,603 shares of restricted stock, 222,435277,106 performance share units and 507,5071,373,575 restricted units were granted to executive management, members of our Board of Directors and employees under this plan. During 2017, 66,8092019, 74,055 shares of restricted stock, 164,098242,290 performance share units and 551,714712,600 restricted units were granted to executive management, members of our Board of Directors and employees under this plan. To date, 6,682,4149,531,643 shares have been granted under this plan. A Black-Scholes option pricing model is used to estimate the fair value of the stock options. A Monte Carlo simulation is completed to estimate the fair value of performance share unit awards with a stock price performance component. We expense the fair value of all equity grants, including performance share unit awards, on a straight line basis over the vesting period.
Stock Options
The following tables summarize award activity for stock options:
Weighted | ||||||||||||||||
Weighted | Average | |||||||||||||||
Average | Remaining | Aggregate | ||||||||||||||
Exercise | Contractual | Intrinsic | ||||||||||||||
Options | Price | Term | Value | |||||||||||||
Stock Options | (years) | (millions) | ||||||||||||||
Balance at December 31, 2019 | 2,218,906 | $ | 23.99 | 2.7 | $ | 0 | ||||||||||
| Exercised | 0 | 0 | ||||||||||||||
| Forfeited | (74,711 | ) | 23.40 | |||||||||||||
| Expired | 0 | 0 | ||||||||||||||
| Balance at December 31, 2020 | 2,144,195 | $ | 24.01 | 1.7 | $ | 0 | ||||||||||
At December 31, 2020 | ||||||||||||||||
| Options outstanding, vested and exercisable | 2,144,195 | $ | 24.01 | 1.7 | $ | 0 | ||||||||||
| Options outstanding, vested and expected to vest | 2,144,195 | $ | 24.01 | 1.7 | $ | — | ||||||||||
|
|
|
|
|
|
|
|
|
|
|
|
|
|
|
|
|
|
| Weighted |
|
|
| |
|
|
|
| Weighted |
| Average |
|
|
| ||
|
|
|
| Average |
| Remaining |
| Aggregate | |||
|
|
|
| Exercise |
| Contractual |
| Intrinsic | |||
|
| Options |
| Price |
| Term |
| Value | |||
Stock Options |
|
|
|
|
|
|
| (years) |
|
| (millions) |
Balance at December 31, 2017 |
| 3,650,245 |
| $ | 21.96 |
|
| 3.5 |
| $ | - |
Exercised |
| (1,162,059) |
|
| 18.03 |
|
|
|
|
|
|
Forfeited |
| - |
|
| - |
|
|
|
|
|
|
Expired |
| (37,813) |
|
| 23.58 |
|
|
|
|
|
|
Balance at December 31, 2018 |
| 2,450,373 |
| $ | 23.81 |
|
| 3.5 |
| $ | - |
|
|
|
|
|
|
|
|
|
|
|
|
|
|
|
|
|
|
|
|
|
|
|
|
At December 31, 2018 |
|
|
|
|
|
|
|
|
|
|
|
Options outstanding, vested and exercisable |
| 2,450,473 |
| $ | 23.81 |
|
| 3.5 |
| $ | - |
Options outstanding, vested and expected to vest |
| 2,450,473 |
|
| 23.81 |
|
| 3.5 |
|
| - |
|
|
|
|
|
|
|
|
|
|
|
|
|
|
|
| Year Ended December 31, | |||||||
|
|
|
| 2018 |
| 2017 |
| 2016 | |||
Stock Options |
|
|
|
|
|
|
|
|
|
|
|
Weighted-average, grant-date fair value of awards granted |
|
|
| $ | - |
| $ | - |
| $ | - |
Total intrinsic value of stock options exercised |
|
|
|
| 1,722,539 |
|
| 633,244 |
|
| 457,834 |
Total fair value of stock options vested |
|
|
|
| - |
|
| 10,738,309 |
|
| 3,351,797 |
Year Ended December 31, | ||||||||||||
2020 | 2019 | 2018 | ||||||||||
Stock Options | ||||||||||||
Weighted-average, grant-date fair value of awards granted | $ | 0 | $ | 0 | $ | 0 | ||||||
Total intrinsic value of stock options exercised | 0 | 767 | 1,722,539 | |||||||||
Total fair value of stock options vested | 0 | 0 | 0 | |||||||||
2625
Restricted Stock Awards
The following tables summarizes award activity for restricted stock awards:
|
|
|
|
|
| ||||||||
|
|
|
|
|
| ||||||||
|
|
|
| Weighted | Weighted | ||||||||
|
|
|
| Average | Average | ||||||||
|
|
|
| Grant-Date | Grant-Date | ||||||||
|
| Shares |
| Fair Value | Shares | Fair Value | |||||||
Restricted Stock Awards |
|
|
|
|
| ||||||||
Nonvested at December 31, 2017 |
| 286,530 |
| $ | 16.97 | ||||||||
Nonvested at December 31, 2019 | 74,055 | $ | 18.05 | ||||||||||
Granted |
| 81,542 |
|
| 19.28 | 169,603 | 4.59 | ||||||
Vested |
| (284,681) |
|
| 17.02 | (74,055 | ) | 18.05 | |||||
Forfeited |
| - |
|
| - | 0 | 0 | ||||||
Nonvested at December 31, 2018 |
| 83,391 |
| $ | 19.05 | ||||||||
Nonvested at December 31, 2020 | 169,603 | $ | 4.59 | ||||||||||
Year Ended December 31, | ||||||||||||
2020 | 2019 | 2018 | ||||||||||
Restricted Stock Awards | ||||||||||||
Weighted-average, grant-date fair value of awards granted | $ | 4.59 | $ | 18.05 | $ | 19.28 | ||||||
Total fair value of restricted stock vested | 396,935 | 1,461,431 | 4,986,620 | |||||||||
|
|
|
|
|
|
|
|
|
|
|
|
|
|
|
| Year Ended December 31, | |||||||
|
|
|
| 2018 |
| 2017 |
| 2016 | |||
Restricted Stock Awards |
|
|
|
|
|
|
|
|
|
|
|
Weighted-average, grant-date fair value of awards granted |
|
|
| $ | 19.28 |
| $ | 18.31 |
| $ | 13.24 |
Total fair value of restricted stock vested |
|
|
|
| 4,986,620 |
|
| 6,473,330 |
|
| 3,692,961 |
Restricted Stock Unit Awards
The following table summarizes award activity for restricted unit awards:
|
|
|
|
|
| ||||||||
|
|
|
| Weighted | Weighted | ||||||||
|
|
|
| Average | Average | ||||||||
|
|
|
| Grant-Date | Grant-Date | ||||||||
|
| Shares |
| Fair Value | Shares | Fair Value | |||||||
Restricted Stock Unit Awards |
|
|
|
|
| ||||||||
Nonvested at December 31, 2017 |
| 1,315,126 |
| $ | 14.08 | ||||||||
Nonvested at December 31, 2019 | 1,321,382 | $ | 15.96 | ||||||||||
Granted |
| 507,507 |
|
| 16.08 | 1,373,575 | 8.30 | ||||||
Vested |
| (549,870) |
|
| 12.50 | (729,309 | ) | 16.38 | |||||
Forfeited |
| (26,654) |
|
| 18.55 | (85,718 | ) | 11.84 | |||||
Nonvested at December 31, 2018 |
| 1,246,109 |
| $ | 15.49 | ||||||||
| Nonvested at December 31, 2020 | 1,879,930 | $ | 10.38 | ||||||||||
Year Ended December 31, | ||||||||||||
2020 | 2019 | 2018 | ||||||||||
Restricted Stock Unit Awards | ||||||||||||
Weighted-average, grant-date fair value of awards granted | $ | 8.30 | $ | 15.25 | $ | 16.08 | ||||||
| Total fair value of restricted stock units vested | 7,918,337 | 9,619,773 | 9,187,360 | |||||||||
|
|
|
|
|
|
|
|
|
|
|
|
|
|
|
| Year Ended December 31, | |||||||
|
|
|
| 2018 |
| 2017 |
| 2016 | |||
Restricted Stock Unit Awards |
|
|
|
|
|
|
|
|
|
|
|
Weighted-average, grant-date fair value of awards granted |
|
|
| $ | 16.08 |
| $ | 20.55 |
| $ | 9.56 |
Total fair value of restricted stock units vested |
|
|
|
| 9,187,360 |
|
| 6,672,405 |
|
| 298,773 |
Performance Share Unit Awards
Performance share units have been granted to certain executive officers. The performance unit awards will be earned only to the extent that MRC Global attains specified performance goals over a three-yearthree year period relating to MRC Global’s total shareholder return compared to companies within the Philadelphia Oil Service Index and specified return on average net capital employed calculation (“RANCE”)
F-27
goals set forthestablished on the date in which the award was granted. The number of shares awarded at the end of the three-yearthree year period could vary from zero,0, if performance goals are not met, to as much as 200% of target, if performance goals are exceeded.
The following tables summarizes award activity for performance unit awards:
|
|
|
|
|
| ||||||||
|
|
|
| Weighted | Weighted | ||||||||
|
|
|
| Average | Average | ||||||||
|
|
|
| Grant-Date | Grant-Date | ||||||||
|
| Shares |
| Fair Value | Shares | Fair Value | |||||||
Performance Share Unit Awards |
|
|
|
|
| ||||||||
Nonvested at December 31, 2017 |
| 704,102 |
| $ | 13.90 | ||||||||
Nonvested at December 31, 2019 | 612,049 | $ | 20.60 | ||||||||||
Granted |
| 222,435 |
|
| 18.87 | 277,106 | 12.25 | ||||||
Vested (1) |
| (97,544) |
|
| 10.71 | (147,569 | ) | 24.39 | |||||
Forfeited |
| (114,312) |
|
| 14.39 | (49,366 | ) | 18.95 | |||||
Nonvested at December 31, 2018 |
| 714,681 |
| $ | 15.80 | ||||||||
| Nonvested at December 31, 2020 | 692,220 | $ | 16.57 | ||||||||||
| (1) | Excludes |
Year Ended December 31, | ||||||||||||
2020 | 2019 | 2018 | ||||||||||
Performance Share Unit Awards | ||||||||||||
Weighted-average, grant-date fair value of awards granted | $ | 12.25 | $ | 19.40 | $ | 18.87 | ||||||
Total fair value of performance share units vested | 2,328,350 | 5,921,169 | 2,349,749 | |||||||||
|
|
|
|
|
|
|
|
|
|
|
|
|
|
|
| Year Ended December 31, | |||||||
|
|
|
| 2018 |
| 2017 |
| 2016 | |||
Performance Share Unit Awards |
|
|
|
|
|
|
|
|
|
|
|
Weighted-average, grant-date fair value of awards granted |
|
|
| $ | 18.87 |
| $ | 24.18 |
| $ | 10.02 |
Total fair value of performance share units vested |
|
|
|
| 2,349,749 |
|
| - |
|
| - |
Recognized compensation expense and related income tax benefits under our equity-based compensation plans are set forth in the table below (in millions):
|
|
|
|
|
|
|
|
|
|
|
|
|
|
|
| Year Ended December 31, | |||||||
|
|
|
| 2018 |
| 2017 |
| 2016 | |||
Equity-based compensation expense: |
|
|
|
|
|
|
|
|
|
|
|
Stock options |
|
|
| $ | - |
| $ | 2 |
| $ | 3 |
Restricted stock awards |
|
|
|
| 2 |
|
| 4 |
|
| 4 |
Restricted stock unit awards |
|
|
|
| 9 |
|
| 8 |
|
| 4 |
Performance share unit awards |
|
|
|
| 3 |
|
| 2 |
|
| 1 |
Total equity-based compensation expense |
|
|
| $ | 14 |
| $ | 16 |
| $ | 12 |
Income tax benefits related to equity-based compensation |
|
|
| $ | 3 |
| $ | 6 |
| $ | 5 |
Year Ended December 31, | ||||||||||||
2020 | 2019 | 2018 | ||||||||||
Equity-based compensation expense: | ||||||||||||
| Stock options | $ | 0 | $ | 0 | $ | 0 | ||||||
| Restricted stock awards | 1 | 1 | 2 | |||||||||
| Restricted stock unit awards | 10 | 10 | 9 | |||||||||
| Performance share unit awards | 1 | 5 | 3 | |||||||||
Total equity-based compensation expense | $ | 12 | $ | 16 | $ | 14 | ||||||
| Income tax benefits related to equity-based compensation | $ | 2 | $ | 4 | $ | 3 | ||||||
Unrecognized compensation expense under our equity-based compensation plans is set forth in the table below (in millions):
|
|
|
|
|
|
|
| Weighted- |
|
|
|
|
| Average Vesting |
| December 31, | |
|
| Period (in years) |
| 2018 | |
Unrecognized equity-based compensation expense: |
|
|
|
|
|
Stock options |
| - |
| $ | - |
Restricted stock awards |
| 0.3 |
|
| 1 |
Restricted stock unit awards |
| 1.6 |
|
| 8 |
Performance share unit awards |
| 1.8 |
|
| 5 |
Total unrecognized equity-based compensation expense |
|
|
| $ | 14 |
F-28
Weighted- | ||||||||
Average Vesting | December 31, | |||||||
Period (in years) | 2020 | |||||||
Unrecognized equity-based compensation expense: | ||||||||
Restricted stock awards | 0.3 | $ | 0 | |||||
Restricted stock unit awards | 1.0 | 8 | ||||||
Performance share unit awards | 1.2 | 1 | ||||||
Total unrecognized equity-based compensation expense | $ | 9 | ||||||
Defined Contribution Employee Benefit Plans: We maintain defined contribution employee benefit plans in a number of countries in which we operate including the U.S. and Canada. These plans generally allow employees the option to defer a percentage of their compensation in accordance with local tax laws. In addition, we make contributions under these plans ranging from 1% to 10%15.5% of eligible compensation.
In June 2020, the Company indefinitely suspended matching contributions for employees in the U.S. and Canada. Expense under defined contribution plans were $10$5 million,$9 $9 million and $9$10 million for the years ended December 31, 2018, 20172020, 2019 and 2016, respectively. 2018.
NOTE 13—14—RELATED PARTY TRANSACTIONS
Leases
We lease land and buildings at various locations from Hansford Associates Limited Partnership (“Hansford Associates”) and Prideco LLC (“Prideco”). Certain of our former directors participate in ownership of Hansford Associates and Prideco. Most of these leases are renewable for various periods through 20232024 and are renewable at our option. The renewal options are subject to escalation clauses. These leases contain clauses for payment of real estate taxes, maintenance, insurance and certain other operating expenses of the properties.
Rent expense attributable to related parties was $1 million for each of the years ended December 31, 2020 and 2019 and $2 million for the yearsyear ended December 31, 2018, 2017 and 2016, respectively.2018.
Future minimum rental payments required under operating leases with related parties that have initial or remaining non-cancelable lease terms in excess of one year are $1 million for 2019. per year from 2021 to 2023.
Customers
Certain members of our Board of Directors are also on the board of directors of certain of our customers with which we do business in the ordinary course. We recognized revenue of $34$23 million, $5$18 million and $7$34 million from these customers for the years ended December 31, 2018, 20172020, 2019 and 2016,2018, respectively. There was $5 million and $1 million of accounts receivable with these customers outstanding as of December 31, 20182020 and 2017, respectively.
F-292019.
NOTE 14—15—SEGMENT, GEOGRAPHIC AND PRODUCT LINE INFORMATION
Our business is comprised of four3 operating and reportable segments: U.S. Eastern Region and Gulf Coast, U.S. Western Region,, Canada and International. Our International segment consists of our operations outside of the U.S. and Canada. These segments represent our business of selling PVF and other infrastructure products and services to the energy sector across each of the gas utilities (storage and distribution of natural gas), downstream and industrial (crude oil refining and petrochemical and chemical processing and general industrials), upstream production (exploration, production and extraction of underground oil and gas), and midstream pipeline (gathering, processing and transmission of oil and gas, gas utilities, and the storage and distribution of oil and gas) and downstream (crude oil refining, petrochemical and chemical processing and general industrials) markets. Our two U.S. operating segments have been aggregated into a single reportable segment based on their economic similarities. As a result, we report segment information for the U.S., Canada and International.sectors.
The following table presents financial information for each segment (in millions):
Year Ended December 31, | ||||||||||||
2020 | 2019 | 2018 | ||||||||||
Sales | ||||||||||||
U.S. | $ | 2,023 | $ | 2,956 | $ | 3,321 | ||||||
Canada | 128 | 226 | 315 | |||||||||
International | 409 | 480 | 536 | |||||||||
Consolidated sales | $ | 2,560 | $ | 3,662 | $ | 4,172 | ||||||
Depreciation and amortization | ||||||||||||
U.S. | $ | 15 | $ | 15 | $ | 16 | ||||||
Canada | 1 | 1 | 1 | |||||||||
International | 4 | 5 | 6 | |||||||||
Total depreciation and amortization expense | $ | 20 | $ | 21 | $ | 23 | ||||||
Amortization of intangibles | ||||||||||||
U.S. | $ | 23 | $ | 39 | $ | 42 | ||||||
Canada | 1 | 1 | 1 | |||||||||
International | 2 | 2 | 2 | |||||||||
Total amortization of intangibles expense | $ | 26 | $ | 42 | $ | 45 | ||||||
Operating (loss) income | ||||||||||||
U.S. | $ | (207 | ) | $ | 104 | $ | 112 | |||||
Canada | (6 | ) | (1 | ) | 9 | |||||||
International | (47 | ) | 0 | 6 | ||||||||
Total operating income | (260 | ) | 103 | 127 | ||||||||
Interest expense | (28 | ) | (40 | ) | (38 | ) | ||||||
Other income (expense) | 5 | 3 | 6 | |||||||||
Income before income taxes | $ | (283 | ) | $ | 66 | $ | 95 | |||||
|
|
|
|
|
|
|
|
|
|
|
| Year Ended December 31, | |||||||
|
| 2018 |
| 2017 |
| 2016 | |||
Sales |
|
|
|
|
|
|
|
|
|
U.S. |
| $ | 3,321 |
| $ | 2,860 |
| $ | 2,297 |
Canada |
|
| 315 |
|
| 294 |
|
| 243 |
International |
|
| 536 |
|
| 492 |
|
| 501 |
Consolidated sales |
| $ | 4,172 |
| $ | 3,646 |
| $ | 3,041 |
|
|
|
|
|
|
|
|
|
|
Depreciation and amortization |
|
|
|
|
|
|
|
|
|
U.S. |
| $ | 16 |
| $ | 15 |
| $ | 13 |
Canada |
|
| 1 |
|
| 1 |
|
| 1 |
International |
|
| 6 |
|
| 6 |
|
| 8 |
Total depreciation and amortization expense |
| $ | 23 |
| $ | 22 |
| $ | 22 |
|
|
|
|
|
|
|
|
|
|
Amortization of intangibles |
|
|
|
|
|
|
|
|
|
U.S. |
| $ | 42 |
| $ | 41 |
| $ | 41 |
Canada |
|
| 1 |
|
| 2 |
|
| 2 |
International |
|
| 2 |
|
| 2 |
|
| 4 |
Total amortization of intangibles expense |
| $ | 45 |
| $ | 45 |
| $ | 47 |
|
|
|
|
|
|
|
|
|
|
Operating income (loss) |
|
|
|
|
|
|
|
|
|
U.S. |
| $ | 112 |
| $ | 67 |
| $ | 6 |
Canada |
|
| 9 |
|
| 11 |
|
| (5) |
International |
|
| 6 |
|
| (32) |
|
| (57) |
Total operating income (loss) |
|
| 127 |
|
| 46 |
|
| (56) |
|
|
|
|
|
|
|
|
|
|
Interest expense |
|
| (38) |
|
| (31) |
|
| (35) |
Other income (expense) |
|
| 6 |
|
| (8) |
|
| - |
Income (loss) before income taxes |
| $ | 95 |
| $ | 7 |
| $ | (91) |
Total assets by segment are as follows (in millions):
|
|
|
|
|
|
|
|
| December 31, | ||||
|
| 2018 |
| 2017 | ||
Total assets |
|
|
|
|
|
|
United States |
| $ | 2,088 |
| $ | 1,970 |
Canada |
|
| 124 |
|
| 162 |
International |
|
| 222 |
|
| 208 |
Total assets |
| $ | 2,434 |
| $ | 2,340 |
F-30
December 31, | ||||||||
2020 | 2019 | |||||||
Total assets | ||||||||
United States | $ | 1,506 | $ | 1,915 | ||||
Canada | 53 | 91 | ||||||
International | 222 | 319 | ||||||
Total assets | $ | 1,781 | $ | 2,325 | ||||
The percentages of our property, plant and equipment relating to the following geographic areas are as follows:
|
|
|
|
|
|
| ||||||||
|
| December 31, | December 31, | |||||||||||
|
| 2018 |
| 2017 | 2020 | 2019 | ||||||||
Property, plant and equipment |
|
|
|
|
|
| ||||||||
United States |
|
| 77% |
|
| 74% | 86 | % | 78 | % | ||||
Canada |
|
| 10% |
|
| 10% | 2 | % | 10 | % | ||||
International |
|
| 13% |
|
| 16% | 12 | % | 12 | % | ||||
Total property, plant and equipment |
|
| 100% |
|
| 100% | 100 | % | 100 | % | ||||
Our net sales and percentage of total sales by product line are as follows (in millions):
|
|
|
|
|
|
|
|
|
|
|
|
|
|
|
| ||||||||||||||||||||||||
|
| Year Ended December 31, | Year Ended December 31, | ||||||||||||||||||||||||||||||||||||
|
| 2018 |
| 2017 |
| 2016 | 2020 | 2019 | 2018 | ||||||||||||||||||||||||||||||
Line pipe |
| $ | 728 |
| 18% |
| $ | 685 |
| 19% |
| $ | 444 |
| 15% | $ | 308 | 12 | % | $ | 560 | 15 | % | $ | 728 | 18 | % | ||||||||||||
Carbon steel fittings and flanges |
|
| 683 |
| 16% |
|
| 548 |
| 15% |
|
| 460 |
| 15% | 340 | 13 | % | 565 | 16 | % | 683 | 16 | % | |||||||||||||||
Total carbon steel pipe, fittings and flanges |
|
| 1,411 |
| 34% |
|
| 1,233 |
| 34% |
|
| 904 |
| 30% | 648 | 25 | % | 1,125 | 31 | % | 1,411 | 34 | % | |||||||||||||||
Valves, automation, measurement and instrumentation |
|
| 1,553 |
| 37% |
|
| 1,319 |
| 36% |
|
| 1,161 |
| 38% | 1,018 | 40 | % | 1,434 | 39 | % | 1,553 | 37 | % | |||||||||||||||
Gas products |
|
| 561 |
| 13% |
|
| 485 | (1) | 13% |
|
| 388 | (1) | 13% | 517 | 20 | % | 551 | 15 | % | 561 | 13 | % | |||||||||||||||
Stainless steel alloy pipe and fittings |
|
| 196 |
| 5% |
|
| 183 |
| 5% |
|
| 206 |
| 7% | 128 | 5 | % | 177 | 5 | % | 196 | 5 | % | |||||||||||||||
General oilfield products |
|
| 451 |
| 11% |
|
| 426 | (1) | 12% |
|
| 382 | (1) | 12% | ||||||||||||||||||||||||
General products | 249 | 10 | % | 375 | 10 | % | 451 | 11 | % | ||||||||||||||||||||||||||||||
|
| $ | 4,172 |
|
|
| $ | 3,646 |
|
|
| $ | 3,041 |
|
| $ | 2,560 | $ | 3,662 | $ | 4,172 | ||||||||||||||||||
(1) $69 million and $55 million of sales for the years ended December 31, 2017 and 2016, respectively, have been reclassified from gas products to general oilfield products to conform with the current year presentation.
NOTE 15—16—FAIR VALUE MEASUREMENTS
With the exception of long-term debt, the fair values of our financial instruments, including cash and cash equivalents, accounts receivable, trade accounts payable and accrued liabilities approximate carrying value. The carrying value of our debt was $684$383 million and $526$551 million at December 31, 20182020 and 2017,2019, respectively.
The fair value of our debt was $675$372 million and $533$554 million at December 31, 20182020 and 2017,2019, respectively. The carrying values of amounts outstanding under our Global ABL Facility approximates itsapproximate fair value. We estimate the fair value of the Term Loan using Level 2 inputs, or quoted market prices as of December 31, 20182020 and 2017,2019, respectively.
Goodwill and other intangible assets are subject to annual impairment testing, which requires a significant degree of management judgment. If the testing results in impairment, we would measure goodwill and other intangible assets using level 3 non-recurring inputs.NOTE 17—COMMITMENTS AND CONTINGENCIES
F-31Legal Proceedings
NOTE 16—COMMITMENTS AND CONTINGENCIES
Leases
We regularly enter into operating and capital lease arrangements for certain of our facilities and equipment. Our leases are renewable at our option for various periods through 2034. Certain renewal options are subject to escalation clauses and contain clauses for payment of real estate taxes, maintenance, insurance and certain other operating expenses of the properties. Leases with escalation clauses based on an index, such as the consumer price index, are expensed based on current rates. Leases with specified escalation steps are expensed and projected based on the total lease obligation ratably over the life of the lease. We amortize leasehold improvements over the remaining life of the lease. Rental expense under our operating lease arrangements was $50 million, $45 million, and $48 million for the years ended December 31, 2018, 2017 and 2016, respectively.
Future minimum lease payments under noncancelable operating lease arrangements having initial terms of one year or more are as follows (in millions):
|
|
|
|
|
|
|
|
2019 | $ | 42 |
|
|
|
|
|
2020 |
| 34 |
|
|
|
|
|
2021 |
| 29 |
|
|
|
|
|
2022 |
| 21 |
|
|
|
|
|
2023 |
| 17 |
|
|
|
|
|
Thereafter |
| 81 |
|
|
|
|
|
Legal Proceedings
Asbestos Claims. We are one of many defendants in lawsuits that plaintiffs have brought seeking damages for personal injuries that exposure to asbestos allegedly caused. Plaintiffs and their family members have brought these lawsuits against a large volume of defendant entities as a result of the various defendants’ manufacture, distribution, supply or other involvement with asbestos, asbestos-containing products or equipment or activities that allegedly caused plaintiffs to be exposed to asbestos. These plaintiffs typically assert exposure to asbestos as a consequence of third-partythird-party manufactured products that the Company’s subsidiary, MRC Global (US) Inc., purportedly distributed. As of December 31, 2018,2020, we are a named defendant in approximately 576578 lawsuits involving approximately 1,1661,153 claims. No asbestos lawsuit has resulted in a judgment against us to date, with the majority being settled, dismissed or otherwise resolved. Applicable third-partythird-party insurance has substantially covered these claims, and insurance should continue to cover a substantial majority of existing and anticipated future claims. Accordingly, we have recorded a liability for our estimate of the most likely settlement of asserted claims and a related receivable from insurers for our estimated recovery, to the extent we believe that the amounts of recovery are probable.
We annually conduct analyses of our asbestos-related litigation to estimate the adequacy of the reserve for pending and probable asbestos-related claims. Given these estimated reserves and existing insurance coverage that has been available to cover substantial portions of these claims, we believe that our current accruals and associated estimates relating to pending and probable asbestos-related litigation likely to be asserted over the next 15 years are currently adequate. This belief, however, relies on a number of assumptions, including:
| ● | That our future settlement payments, disease mix and dismissal rates will be materially consistent with historic experience; |
| ● | That future incidences of asbestos-related diseases in the U.S. will be materially consistent with current public health estimates; |
| ● | That the rates at which future asbestos-related mesothelioma incidences result in compensable claims filings against us will be materially consistent with its historic experience; |
| ● | That insurance recoveries for settlement payments and defense costs will be materially consistent with historic experience; |
| ● | That legal standards (and the interpretation of these standards) applicable to asbestos litigation will not change in material respects; |
| ● | That there are no materially negative developments in the claims pending against us; and |
● |
|
|
If any of these assumptions prove to be materially different in light of future developments, liabilities related to asbestos-related litigation may be materially different than amounts accrued or estimated. Further, while we anticipate that additional claims will be filed in the future, we are unable to predict with any certainty the number, timing and magnitude of such future claims. In addition, applicable insurance policies are subject to overall caps on limits, which coverage may exhaust the amount available from insurers under those limits. In those cases, the Company is seeking indemnity payments from responsive excess insurance policies, but other insurers may not be solvent or may not make payments under the policies without contesting their liability. In our opinion, there are no pending legal proceedings that are likely to have a material adverse effect on our consolidated financial statements.
F-32
Other Legal Claims and Proceedings. From time to time, we have been subject to various claims and involved in legal proceedings incidental to the nature of our businesses. We maintain insurance coverage to reduce financial risk associated with certain of these claims and proceedings. It is not possible to predict the outcome of these claims and proceedings. However, in our opinion, there are no pending legal proceedings that are likely to have a material adverse effect on our consolidated financial statements.statements.
Product Claims. From time to time, in the ordinary course of our business, our customers may claim that the products we distribute are either defective or require repair or replacement under warranties that either we or the manufacturer may provide to the customer. These proceedings are, in the opinion of management, ordinary and routine matters incidental to our normal business. Our purchase orders with our suppliers generally require the manufacturer to indemnify us against any product liability claims, leaving the manufacturer ultimately responsible for these claims. claims, although we did incur a charge of $5 million related to the doubtful collection of a product claim against a foreign supplier in the year ended December 31, 2019. In many cases, state, provincial or foreign law provides protection to distributors for these sorts of claims, shifting the responsibility to the manufacturer. In some cases, we could be required to repair or replace the products for the benefit of our customer and seek our recovery from the manufacturer for our expense. In our opinion, the likelihood that the ultimate disposition of any of these claims and legal proceedings would have a material adverse effect on our consolidated financial statements is remote.
Customer Contracts
We have contracts and agreements with many of our customers that dictate certain terms of our sales arrangements (pricing, deliverables, etc.). While we make every effort to abide by the terms of these contracts, certain provisions are complex and oftenmay be subject to varying interpretations. Under the terms of these contracts, our customers have the right to audit our adherence to the contract terms. Historically, any settlements that have resulted from these customer audits have been immaterial to our consolidated financial statements.
Letters of Credit
Our letters of credit outstanding at December 31, 20182020 approximated $36$16 million.
Bank Guarantees
Certain of our international subsidiaries have trade guarantees that banks have issued on their behalf. The amount of these guarantees at December 31, 20182020 was approximately $6$4 million.
Purchase Commitments
We have purchase obligations consisting primarily of inventory purchases made in the normal course of business to meet operating needs. While our vendors often allow us to cancel these purchase orders without penalty, in certain cases, cancellations may subject us to cancellation fees or penalties depending on the terms of the contract.
Warranty Claims
We are involved from time to time in various warranty claims, which arise in the ordinary course of business. Historically, any settlements that have resulted from these warranty claims have been immaterial to our consolidated financial statements.
F-33NOTE 18—QUARTERLY INFORMATION (UNAUDITED)
NOTE 17—QUARTERLY INFORMATION (UNAUDITED)
Our quarterly financial information is presented in the table below (in millions, except per share amounts):
First | Second | Third | Fourth | Year | ||||||||||||||||
2020 | ||||||||||||||||||||
Revenue | $ | 794 | $ | 602 | $ | 585 | $ | 579 | $ | 2,560 | ||||||||||
Gross profit | 148 | 79 | 114 | 90 | 431 | |||||||||||||||
Net income (loss) attributable to common stockholders | 3 | (287 | ) | (3 | ) | (11 | ) | (298 | ) | |||||||||||
Earnings (loss) per share: | ||||||||||||||||||||
Basic | $ | 0.04 | $ | (3.50 | ) | $ | (0.04 | ) | $ | (0.13 | ) | $ | (3.63 | ) | ||||||
Diluted | $ | 0.04 | $ | (3.50 | ) | $ | (0.04 | ) | $ | (0.13 | ) | $ | (3.63 | ) | ||||||
2019 | ||||||||||||||||||||
Revenue | $ | 970 | $ | 984 | $ | 942 | $ | 766 | $ | 3,662 | ||||||||||
Gross profit | 174 | 174 | 174 | 131 | 653 | |||||||||||||||
Net income (loss) attributable to common stockholders | 12 | 18 | 15 | (30 | ) | 15 | ||||||||||||||
Earnings (loss) per share: | ||||||||||||||||||||
Basic (1) | $ | 0.14 | $ | 0.22 | $ | 0.18 | $ | (0.37 | ) | $ | 0.18 | |||||||||
Diluted (1) | $ | 0.14 | $ | 0.21 | $ | 0.18 | $ | (0.37 | ) | $ | 0.18 | |||||||||
(1) | Earnings per share does not add across due to rounding and equity-related transactions resulting in differing weighted average shares outstanding on a quarterly basis. |
|
|
|
|
|
|
|
|
|
|
|
|
|
|
|
| First |
| Second |
| Third |
| Fourth |
| Year | |||||
2018 |
|
|
|
|
|
|
|
|
|
|
|
|
|
|
Revenue | $ | 1,010 |
| $ | 1,082 |
| $ | 1,071 |
| $ | 1,009 |
| $ | 4,172 |
Gross profit |
| 169 |
|
| 177 |
|
| 172 |
|
| 171 |
|
| 689 |
Net income attributable to common stockholders |
| 12 |
|
| 16 |
|
| 18 |
|
| 4 |
|
| 50 |
Earnings per share: |
|
|
|
|
|
|
|
|
|
|
|
|
|
|
Basic (1) | $ | 0.13 |
| $ | 0.18 |
| $ | 0.20 |
| $ | 0.05 |
| $ | 0.55 |
Diluted | $ | 0.13 |
| $ | 0.17 |
| $ | 0.20 |
| $ | 0.04 |
| $ | 0.54 |
|
|
|
|
|
|
|
|
|
|
|
|
|
|
|
2017 |
|
|
|
|
|
|
|
|
|
|
|
|
|
|
Revenue | $ | 862 |
| $ | 922 |
| $ | 959 |
| $ | 903 |
| $ | 3,646 |
Gross profit |
| 140 |
|
| 149 |
|
| 152 |
|
| 141 |
|
| 582 |
Net income (loss) attributable to common stockholders |
| - |
|
| - |
|
| (3) |
|
| 29 |
|
| 26 |
Earnings (loss) per share: |
|
|
|
|
|
|
|
|
|
|
|
|
|
|
Basic | $ | - |
| $ | - |
| $ | (0.03) |
| $ | 0.31 |
| $ | 0.28 |
Diluted | $ | - |
| $ | - |
| $ | (0.03) |
| $ | 0.30 |
| $ | 0.27 |
_______________
(1)Earnings per share does not add across due to rounding and transactions resulting in differing weighted average shares outstanding on a quarterly basis.
F-34