INDEX
| Page | |||
| PART I | |||
| Item 1. | |||
| Item 1A. | |||
| Item 1B. | |||
| Item 2. | |||
| Item 3. | |||
| Item 4. | |||
| PART II | |||
| Item 5. | |||
| Item 6. | |||
| Item 7. | |||
| Item 7A. | |||
| Item 8. | |||
| Item 9. | |||
| Item 9A. | |||
| Item 9B. | |||
| PART III | |||
| Item 10. | |||
| Item 11. | |||
| Item 12. | |||
| Item 13. | |||
| Item 14. | |||
| PART IV | |||
| Item 15. | |||
| Item 16. | |||
| Exhibit | |||
| Exhibit | |||
| Exhibit 21.1 | |||
| Exhibit 23.1 | |||
| Exhibit 31.1 | |||
| Exhibit 31.2 | |||
| Exhibit 32.1 | |||
Unless the context otherwise indicates or requires, as used in this annual report on Form 10-K, references to “we,” “us,” “our” or the “Company” refer to Verisk Analytics, Inc. and its subsidiaries.
In this annual report on Form 10-K, all dollar amounts are expressed in thousands,millions, unless indicated otherwise.
SPECIAL NOTE REGARDING FORWARD-LOOKING STATEMENTS
Verisk Analytics, Inc., or Verisk, has made statements under the captions “Business,” “Risk Factors,” “Management’s Discussion and Analysis of Financial Condition and Results of Operations,” and in other sections of this annual report on Form 10-K that are forward-looking statements. In some cases, you can identify these statements by forward-looking words such as “may,” “might,” “will,” “should,” “expects,” “plans,” “anticipates,” “believes,” “estimates,” “predicts,” “potential,” or “continue,” the negative of these terms and other comparable terminology. These forward-looking statements, which are subject to risks, uncertainties and assumptions about us, may include projections of our future financial performance, our anticipated growth strategies and anticipated trends in our business. These statements are only predictions based on our current expectations and projections about future events. There are important factors that could cause our actual results, level of activity, performance or achievements to differ materially from the results, level of activity, performance or achievements expressed or implied by the forward-looking statements, including those factors discussed under the caption entitled “Risk Factors.” You should specifically consider the numerous risks outlined under “Risk Factors.”
Although we believe the expectations reflected in the forward-looking statements are reasonable, we cannot guarantee future results, level of activity, performance or achievements. Moreover, neither we nor any other person assumes responsibility for the accuracy and completeness of any of these forward-looking statements. We are under no duty to update any of these forward-looking statements after the date of this annual report on Form 10-K to conform our prior statements to actual results or revised expectations.
PART I
| Item 1. | Business |
Our Company
Verisk Analytics Inc. is a leading data analytics provider of information about risk to professionalsserving customers in insurance, healthcare,natural resources and financial services, government, supply chain, and risk management.services. Using advanced technologies to collect and analyze billions of records, we draw on industryunique data assets and deep domain expertise and unique proprietary data sets to provide innovations that may be integrated into customer workflows. We offer predictive analytics and decision-supportdecision support solutions to customers in fraud prevention, actuarial science, insurance coverages, fire protection,rating, underwriting, claims, catastrophe and weather risk, profitability optimization, data management,natural resources intelligence, economic forecasting, and many other fields. In the United States, or U.S., and around the world, we help customers protect people, property, and financial assets.
Our customers use our solutions to make better decisions about risk and opportunities with greater efficiency and discipline. We refer to these products and services as ‘solutions’solutions due to the integration among our services and the flexibility that enables our customers to purchase components or thea comprehensive package. These ‘solutions’solutions take various forms, including data, expert insight, statistical models orand tailored analytics all designed to allow our clientscustomers to make more logical decisions. We believe our solutions for analyzing risk positively impact our customers’ revenues and help them better manage their costs. In 2013,2016, our customers included all of the top 100 property and casualty, or P&C, insurance providers in the U.S. for the lines of P&C services we offer, our customers included alland 28 of the top 100 P&C insurance providers in the U.S., 24 of the top 2530 credit card issuers in North America, andthe United Kingdom and Australia, as well as 98 of the top 10 health planglobal energy providers inaround the U.S.world. We also work with a wide range of companies, governments and institutions across the energy, and metals and mining value chains. We believe that our commitment to our customers and the embedded nature of our solutions serve to strengthen and extend our relationships.
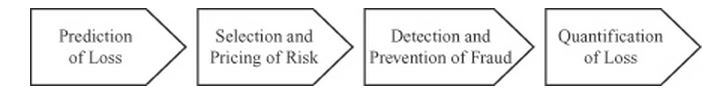
We help thosebelieve that Verisk is uniquely positioned because of the set of distinctives or competitive advantages we cultivate and continue to expand. Our existing businesses, addressin addition to new product innovations, integrate the following four singular qualities into the foundation of our strategy.
Our Distinctives
•Unique Data Assets - Data is at the core of what we believe are the four primary decision making processes essentialdo. We use our proprietary data assets to develop predictive analytics and transformative models for managingour customers.
•Deep Domain Expertise - We have specialized and in-depth knowledge in a number of defined vertical markets, including insurance, healthcare, energy, financial services, and risk as set forth belowmanagement. We understand that different verticals require different approaches, and our deep domain expertise adds value to our analytics in the Verisk Risk Analysis Framework:markets we serve.
We offer our solutions and services primarily through annual subscriptions or long-term agreements, which are typically pre-paid and represented approximately 73.6%over 80% of our revenues in 2013.2016. For the year ended December 31, 2013,2016, we had revenues of $1,595.7$1,995.2 million and net income of $348.4$591.2 million. For the five year period ended December 31, 2013,2016, our revenues and net income grew at a compound annual growth rate, or CAGR, of 15.1%13.9% and 28.8%15.8%, respectively.
Our History
We trace our history to 1971, when Insurance Services Office, Inc., or ISO, started operations as a not-for-profit advisory and rating organization providing services forto the U.S. P&C insurance industry. ISO was formed as an association of insurance companies to gather statistical data and other information from insurers and report to regulators, as required by law. ISO’s original functions also included developing programs to help insurers define and manage insurance products and providing information to help insurers determine their own independent premium rates. Insurers used and continue to use our offerings primarily in their product development, underwriting and rating functions. Today, those businesses form the core of our Risk Assessment segment.
Over the past decade,two decades, we have transformed our business beyond its original functions by deepening and broadening our data assets, developing a set of integrated risk management solutions and services and addressing new markets through our Decision Analytics segment. markets.
Our expansion into analytics began when we acquired the American Insurance Services Group, or AISG, and certain operations and assets of the National Insurance Crime Bureau in 1997 and 1998, respectively. Those organizations brought to the company large databases of insurance claims, as well as expertise in detecting and preventing claims fraud. To further expand our Decision Analytics segment,business, in 2002, we acquired AIR Worldwide, or AIR, in 2002, the technological leader in catastrophe modeling. In 2004, we entered the healthcare space by acquiring several businesses that now offer web-based analytical and reporting systems for health insurers, provider organizations and self-insured employers. In 2005, we entered the mortgage sector, acquiring the first of several businesses that now provide automated fraud detection, compliance and decision support solutions for the U.S. mortgage industry. In 2006, to bolster our position in the insurance claims field we acquired Xactware, a leading supplier of estimatingestimation software for professionals involved in building repair and reconstruction. In 2010, we acquired 3E Company, creating a scale presence in supply chain and environmental health and safety. In 2011 and 2012, we further bolstered our healthcare solutions by acquiring Health Risk Partners, LLC, or HRP, which provides solutions to optimize revenue, improve compliance and improve quality of care for Medicare Advantage health plans and MediConnect Global, Inc. or MediConnect, which provides medical record retrieval, digitization, coding, extraction, and analysis to the healthcare and property casualty industry. Also in 2012, we acquired Argus Information & Advisory Services, LLC, or Argus, to expand our global presence in providing information, competitive benchmarking, analytics, and customized services to financial institutions in the payments space globally.space. In 2015, we acquired Wood Mackenzie Limited, or Wood Mackenzie, to advance our strategy to expand internationally and position us in the global energy market.
On May 23, 2008, in contemplation of our initial public offering, or IPO, ISO formed Verisk Analytics, Inc., or Verisk, a Delaware corporation, to be the holding company for our business. Verisk was initially formed as a wholly-owned subsidiary of ISO. On October 6, 2009, in connection with our IPO, the Company effected a reorganization whereby ISO became a wholly-owned subsidiary of Verisk. Verisk Class A common stock began trading on the NASDAQ Global Select Market on October 7, 2009, under the symbol “VRSK.”
Segments
We organize our business in two segments: Risk Assessment and Decision Analytics. See “Management’s Discussion and Analysis of Financial Condition and Results of Operations” in Part II of this annual report for additional information regarding our segments. See Note 18 of our consolidated financial statements included in this annual report on Form 10-K for further information.
Risk Assessment Segment
Our Risk Assessment segment serves our P&C insurance customers and focuses on the first two decision making processes in our Risk Analysis Framework: prediction of loss, and selection and pricing of risk. Within this segment, we also provide solutions to help our insurance customers complyrisk, and compliance with their reporting requirements in each U.S. state in which they operate. Our customers include most of the P&C insurance providers in the U.S. In recent years we have expanded our offerings to also serve certain non-U.S. markets.
Industry-Standard Insurance Programs
We are the recognized leader in the U.S. for industry-standard insurance programs that help P&C insurers define coverages and issue policies. We provide policy language, prospective loss costs, policy writing rules, and a variety of other solutions for 26 lines of insurance. Our policy language, prospective loss cost information and policy writing rules can serve as integrated turnkey insurance programs for our customers. Insurance companies need to ensure that their policy language, rules, and rates comply with all applicable legal and regulatory requirements. Insurers must also make sure their policies remain competitive by promptly changing coverages in response to changes in statutes or case law. To meet their needs, we process approximately 2,400 regulatory filings and interface with state regulators in all 50 states plus the District of Columbia, Guam, Puerto Rico and the Virgin Islands in excess of 3,000 filings each year ensuringto ensure smooth implementation of our rules and forms. When insurers choose to develop their own alternative programs, our industry-standard insurance programs also help regulators make sureensure that such insurers’ policies meet basic coverage requirements.
Standardized coverage language, which has been tested in litigation and tailored to reflect judicial interpretation, helps to ensure consistent treatment of claimants. As a result, our industry-standard language also simplifies claim settlements and can reduce the occurrence of costly litigation, because our language causes the meaning of coverage terminology to become established and known. Our policy language includes standard coverage language, endorsements and policy writing support language that assist our customers in understanding the risks they assume and the coverages they are offering.offer. With these policy programs, insurers also benefit from economies of scale. We have over 200more than 120 specialized lawyers and insurance experts reviewing changes in each state’s insurance rules and regulations, including onan average over 14,000of more than 16,500 legislative bills, 1,3006,100 regulatory actions and 2,000 court cases per year, to make any required changes to our policy language and rating information.
To cover the wide variety of risks in the marketplace, we offer a broad range of policy programs. For example, in the homeowner’shomeowners line of insurance, we maintain policy language and rules for 6 basic coverages, 250289 national endorsements, and 548601 state-specific endorsements. Overall, we provide policy language, prospective loss costs, policy writing rules, and a variety of other solutions for 26 lines of insurance.
The P&C insurance industry is heavily regulated in the U.S. P&C insurers are required to collect statistical data about their premiums and losses and to report that data to regulators in every state in which they operate. Our statistical agent services have enabled P&C insurers to meet thesethose regulatory requirements for over 40more than 45 years. We aggregate the data, and as a licensed or appointed “statistical agent” in all 50 states, Puerto Rico, and the District of Columbia, we report thesethose statistics to insurance regulators. We are able to capture significant economies of scale given the level of penetration of this service within the U.S. P&C insurance industry.
To provide our customers and the regulators the information they require, we maintain one of the largest private databases in the world. Over the past four decades, we have developed core expertise in acquiring, processing, managing, and operating large and comprehensive databases that are the foundation of our Risk Assessment segment. We use our proprietary technology to assemble, organize and update vast amounts of detailed information submitted by our customers. We supplement this data with publicly available information.
Each year, P&C insurers send us approximately 2.93.5 billion detailed individual records of insurance transactions, such as insurance premiums collected or losses incurred. We maintain a database of over 17.3more than 20.0 billion statistical records, including approximately 7.08.2 billion commercial lines records and approximately 10.311.8 billion personal lines records. We collect unit-transactionunit transaction detail of each premium and loss record, which enhances the validity, reliability and accuracy of our data sets and our actuarial analyses. Our proprietary quality process includes almost 2,500more than 2,800 separate checks to ensure that the data meetmeets our high standards of quality.
We provide actuarial services to help our customers analyze and price their risks. Using our large database of premium and loss data, our actuaries are able to perform sophisticated analyses using our predictive models and analytic methods to help our P&C insurance customers with pricing, loss reserving, and marketing. We distribute a number of actuarial solutions and offer
flexible services to meet our customers’ needs. In addition, our actuarial consultants provide customized services for our clientscustomers that include assisting them with the development of independent insurance programs, analysis of their own underwriting experience, development of classification systems and rating plans, and a wide variety of other business decisions. We also supply information to a wide variety of customers in other markets including reinsurance and government agencies.
We project customers' future losses and loss expenses utilizingusing a broad set of data. TheseThose projections tend to be more reliable than if our customers used solely their own data.data exclusively. We make a number of actuarial adjustments before the data is used to estimate future costs. Our customers can use our estimates of future costs in making independent decisions about the prices charged for their policies. For most P&C insurers, in most lines of business, we believe our estimates of future costs are an essential input to rating decisions. Our actuarial products and services are also used to create the analytics underlying our industry-standard insurance programs described above.
By building on our insurance industry expertise and recent acquisitions, we have expanded our solution set to serve customers in certain non-U.S. markets.
Property-Specific Rating and Underwriting Information
We gather information on individual properties and communities so that insurers can use our information to evaluate and price personal and commercial property insurance, as well as business owners, or BOP, commercial auto and general liability insurance.insurance, and workers compensation coverages. Our property-specific rating and underwriting information allow our customers to understand, quantify, underwrite, mitigate, and avoid potential loss for residential andto commercial properties. Our databaseProMetrix operating platform contains business and risk information on 26 million entities, loss costs and other vital information on more than 3.53.7 million commercial buildings in the United StatesU.S. and also holds information on more than 6.26.5 million individual businesses occupying those buildings. We have a staff of more thanapproximately 600 field representatives strategically located around the United StatesU.S. who observe and report on conditions at commercial and residential properties, evaluate community fire-protection capabilities and assess the effectiveness of municipal building-code enforcement. Each year, our field staff visits more than over 325,000285,000 commercial properties to collect information on new buildings and verify building attributes.
We also provide proprietary analytic measures of the ability offor individual communities to mitigate losses from important perils. Nearly every property insurer in the U.S. uses our evaluations of community firefighting capabilities to help determine premiums for fire insurance throughout the country. We provide field-verified and validated data on the fire protection services for more than 47,000approximately 46,000 fire response jurisdictions. We also offer services to evaluate the effectiveness of community enforcement of building codes and the efforts of communities to mitigate damage from flooding. Further, we provide information on the insurance rating territories, premium taxes, crime risk, and hazards of windstorm, earthquake, wildfire, and other perils. To supplement our data on specific commercial properties and individual communities, we have assembled, from a variety of internal and select third-party sources, information on hazards related to geographic locations representing every postal address in the U.S. Insurers use this information not only for policy quoting but also forand analyzing risk concentration in geographical
areas. We also make our data and analytics available to commercial real estate lenders to allow them to better understand risks associated with peopleproperties they lend against.
We have begun to expand our footprint of data and solutions to include both U.S. and international markets.
Decision Analytics Segment
In the Decision Analytics segment, we support all four phases of our Risk Analysis Framework. We develop predictive models to forecast scenarios and produce both standard and customized analytics that help our customers better predictmanage their businesses, including predicting loss, selectselecting and pricepricing risk, detectdetecting fraud before and after a loss event, and quantifyquantifying losses. TheOur businesses in this segment are categorized by the primary vertical end market for their services.

Insurance
Our insurance solutions which operate both beforeprovide our customers analytics in the areas of fraud detection, catastrophe modeling, loss estimation, and after loss events.
We are a leading provider of fraud-detection tools for the P&C insurance industry. Our fraudanti-fraud solutions improve our customers’ profitability by both predicting the likelihood that fraud is occurring and detecting suspicious activity after it has occurred. When a claim is submitted, our system searches our database and returns information about other claims filed by the same individuals or businesses (either as claimants or insurers) which, that helps our customers determine if fraud has occurred. The system searches for matches in identifying informationinformational fields, such as name, address, Social Security number, vehicle identification number, driver’s license number, tax identification number, or other parties to the loss. Our system also includes advanced name and address searching to perform intelligent searches and improve the overall quality of the matches. Information from match reports speeds payment of meritorious claims while providing a defense against fraud and can lead to denial of a claim, negotiation of a reduced award, or further investigation by the insurer or law enforcement.
We have a comprehensive system used by claims adjusters and investigations professionals to process claims and fight fraud. Claims databases are one of the key tools in the fight against insurance fraud. The benefits of a single all-claims database include improved efficiency in reporting data and searching for information, enhanced capabilities for detecting suspicious claims and superior information for investigating fraudulent claims, suspicious individuals, and possible fraud rings. Our database contains information on approximately 921 million1.1 billion claims and is the world’s largest database of P&C claims information used for claims and investigations. Insurers and other participants submit new claims , more than 210,000200,000 a day on average across all categories of the U.S. P&C insurance industry.
We also provide an expert scoring system that helps distinguish between suspicious and meritorious claims;claims, and products that use link-analysislink analysis technology to help visualize and fight insurance fraud.
We are also a leader in and pioneered the field of probabilistic catastrophe modeling used by insurers, reinsurers and financial institutions to manage their catastrophe risk. Our models of global natural hazards, which form the basis of our solutions, enable companies to identify, quantify and plan for the financial consequences of catastrophic events. We have developed models, covering natural hazards, including hurricanes, earthquakes, winter storms, tornadoes, hailstorms, and flood,floods, for potential loss events in more than 90 countries.100 countries, as well as pandemics worldwide. We have also developed and introduced a probabilistic terrorism model capable of quantifying the risk in the U.S. from this emerging threat, which supports pricing and underwriting decisions down to the level of an individual policy. Our newest model also addresses cyber losses.
We also provide data, analyticanalytics and networking products for professionals involved in estimating all phases of building repair and reconstruction. We provide solutions for every phase of a building’s life, including:
quantifying the ultimate cost of repair or reconstruction of damaged or destroyed buildings;buildings,
aiding in the settlement of insurance claims; andclaims,
tracking the process of repair or reconstruction and facilitating communication among insurers, adjusters, contractors, and policyholders.
To help our customers estimate repair costs, we provide a solution that assists contractors and insurance adjusters to estimatein estimating repairs using a patented plan-sketching program. The program allows our customers to sketch floor plans, roof plans
and wall-framing plans and automatically calculates material and labor quantities for the construction of walls, floors, footings, and roofs.
We also offer our customers access to wholesale and retail price lists, which include structural repair and restoration pricing for 467468 separate economic areas in North America. We revise this information monthly, and, in the aftermath of a major disaster, we can update the price lists as often as weekly to reflect rapid price changes. Our structural repair and cleaning database contains more than 17,000approximately 21,000 unit-cost line items. For each line item such as smoke cleaning, water extraction and hazardous cleanup, we report time and material pricing, including labor, labor productivity rates (for new construction and restoration), labor burden and overhead, material costs, and equipment costs. We improve our reported pricing data by several methods including direct market surveys and an analysis of the actual claims experienceexperiences of our customers. We estimate that about 80% of insurance repair contractors and service providers in the U.S. and Canada with computerized estimating systems use our building and repair pricing data. UtilizationUse of such a large percentage of the industry’s claims data leads to accurate reporting of pricing information, which we believe is unmatched in the industry.
Our estimates allow our customers to set loss reserves, deploy field adjusters and verify internal company estimates. Our estimates also keep insurers, their customers, regulators, and other interested parties informed about the total costs of disasters. We also provide our customers access to daily reports on severe weather and catastrophes and we maintain a database of information on catastrophe losses in the U.S. sincedating back to 1950.
We also are a leading provider of solutions for the personal underwriting markets, including homeowners and auto lines. We build and maintain widely used, industry-standard tools that assist insurers in underwriting and rating, i.e., measuring and selecting risks and pricing coverage appropriately to ensure fairness to the consumer and a reasonable return for the insurer. Our solutions apply advanced predictive analytics to our deep reservoir of data and information to quickly and precisely gauge the degree and cost of risk.
Our solutions span a wide range of property/casualty insurance, encompassing personal and commercial lines of coverage that protect private residences, private and commercial vehicles, and businesses.
We continually pursue new solutions that help our customers to keep abreast of changing markets and technology. For example, we provide tools and platforms to help insurers, their customers, and providers of products and services to leverage the growing “Internet of Things.” This technology connects devices, vehicles, and homes to the Internet and generates valuable data to underwrite, rate, and manage risk while enriching customer relationships. By ingesting, storing, and normalizing this data, Verisk makes it accessible for users to extract business insights at a significantly lower cost and logistical burden than they could achieve on their own.
Financial Services
We focus on providing competitive benchmarking, scoring solutions, analytics, and customized services to financial services institutions in Norththe Americas, Europe, the Middle East, Africa and South AmericaAsia-Pacific. We work with our customers to evaluate current market and Europe.audience selection. We measure the effectiveness of campaigns across the various media and the impact of multi-channel campaigns. We also maintain the most comprehensive de-personalizeddepersonalized direct observation consortiaconsortium data sets for the payments industry. We leverage this consortiaour consortium data and provide proprietary solutions and information that enable clientscustomers to achieve higher profitability and growth through enhanced marketing and risk management decisions. We have deployed unique technology to manage vast data sets efficiently and manage vast amount of payments data. We offer services and a suite of solutions to a clientcustomer base that includes credit and debit card issuers, retail banks and other consumer financial services providers, payment processors, insurance companies, and other industry stakeholders.
Our professionals have substantialsubstantive industry knowledge inabout providing solutions to the financial services sector. We are known for our unique ability to blend the highly technical, data-centered aspects of our projects with expert communication and business knowledge. Our solutions enhance our clients’customers’ ability to manage their businessesbusinesses' profitably and position them better to handle present day challenges (competitive, regulatory, and economic). Specifically, we use comprehensive transaction, risk, behavioral, and bureau-sourced account data to assist clientscustomers in making better business decisions through analysis and analytical solutions. We maintain a comprehensive and granular direct observation financial services industry database for credit card, debit card, and deposit transactions in the industry.transactions.
We are a leading provider of solutionsdata analytics for revenue & quality intelligencethe global energy, chemicals, and compliance for certain aspectsmetals and mining industries. We provide research and consulting services focusing on exploration strategies and screening, asset development and acquisition, commodity markets, and corporate analysis. We offer consultancy in the areas of the healthcare industry.business environment, business improvement, business strategies, commercial advisory, and transaction support. We have systems, including our revenue integrity business, which analyze Medicare data for compliance with CMS (Centers for Medicare & Medicaid Services) guidelines, assist payers in payment integrity, data collection,deliver analysis and encounter data submission. By using our ReconEdge™, a web-based risk adjustment reconciliation system, healthcare payers can assess their organizations’ opportunitiesadvice on assets, companies,
governments, and compliance in payments. In addition, we offer proprietary systemsmarkets. We provide comprehensive and services that facilitate the aggregation, retrieval, coding,integrated coverage and analysis of medical records.relevant commodities across the interconnected global energy sectors. We have gathered proprietary information, insight and analysis on thousands of oil and gas fields, mines, refineries and other assets, as well as detailed assessments of the market fundamentals across each value chain. Our experts analyze the data and work directly with customers to address their business challenges. Our growing customer base includes international and national energy companies, as well as chemicals, and metals and mining companies, financial institutions and governments. We work with a repositoryrange of medical records that are digitized, indexed,diverse teams, from strategy and securely hosted online. We use custom-built, proprietary technologypolicy makers, business developers and market analysts to deliver medical records from facilitiescorporate finance, risk teams and provider locations. Our clients can access the clinical data through a cloud-based workflow management system. We are also a provider of HEDIS® (Healthcare Effectiveness Data and Information Set) software solutions. Our solution suite allows managed care
We help businesses and governments better anticipate and manage climate-andclimate and weather-related risks. We prepare certain agencies and companies to anticipate, manage, react to and profit from weatherclimate and climate relatedweather-related risk. We serve our clientscustomers by providing state-of-the-art research, development and analysis delivered in reports, databases and software solutions. We are dedicated to the advancement of scientific understanding of the atmospheric, climate and weather, ocean, and planetary sciences. Through research conducted by our in-house scientific staff, and often in collaboration with world-renowned scientists at academic and other research institutions, we have developed analytical tools to help measure and observe theenvironmental properties of the environment and to translate thesethose measurements into useful information to take action. In 2013, we formed the Verisk Climate division in response to customers' needs for new solutions to manage enterprise climate and environmental risks.actionable information.
We also offer a comprehensive suite of data and information services that enablesenable improved compliance with global Environmental Health &and Safety, or EH&S, requirements related to the safe manufacturing, distribution, transportation, usage, and disposal of chemicals and products. From the supply chain or solutions lifecycle,life cycle, we deliver a program specific to the EH&S compliance information and management needs of our customers. We have aOur full solutions lifecyclelife cycle and cross-supply chain approach that provideprovides a single, integrated solution for managing customers' EH&S capabilities, resultingwhich results in improved processes, and reduced cost, risk, and liability while improving process.liability.
Our Growth Strategy
Over the past five years, we have grown our revenues at a CAGR of 15.1%13.9% through the successful execution of our business plan. TheseThose results reflect strong organic revenue growth, new product development, and acquisitions. We have made, and continue to make, investments in people, data sets, analytic solutions, technology, and complementary businesses. The key components of our strategy include:include the following:
Increase Solution Penetration with Customers. We expect to expand the application of our solutions in insurance customers’ internal risk and underwriting processes. Building on our deep knowledge of, and embedded position in, the insurance industry,various industries, we expect to sell more solutions to existing customers tailored to individual insurancemarket segments. By increasing the breadth and relevance of our offerings, we believe that we can strengthen our relationships with customers and increase our value to their decision making in critical ways. We also have opportunities to expand solution penetration into our healthinsurance, energy and financial services customers.
Develop New, Proprietary Data Sets and Predictive Analytics. We work with our customers to understand their evolving needs. We plan to create new solutions by enriching our mix of proprietary data sets, analytic solutions and effective decision support across the markets we serve. We constantly seek to add new data sets that can further leverage our analytic methods, technology platforms and intellectual capital.
Leverage Our Intellectual Capital to Expand into Adjacent Markets and New Customer Sectors. Our organization is built on overmore than four decades of intellectual property in risk management. We believe we can continue to profitably expand the use of our intellectual capital profitably and apply our analytic methods in new markets where significant opportunities for long-term growth exist. We also continue to pursue growth through targeted international expansion. We have already demonstrated the effectiveness of this strategy with our expansion into healthcare and non-insurancenon insurance financial services.
Pursue Strategic Acquisitions that Complement Our Leadership Positions. We will continue to expand our data and analytics capabilities across industries. While we expect this will occur primarily through organic growth, we have and will continue to acquire assets and businesses that strengthen our value proposition to customers. We have developed an internal capability to source, evaluate and integrate acquisitions that have created value for shareholders.
Our Customers
Risk Assessment Customers
The customers in our Risk Assessment segment for the lines of P&C services we offer include the top 100 P&C insurance providers in the United States,U.S., as well as insurers in international markets. Our statistical agent services are used by aA substantial majority of P&C insurance providers in the U.S. use our statistical agent services to report to regulators. Our actuarial servicesregulators, and industry-standard insurance programs are used by the majority of insurers and reinsurers in the U.S. use
our actuarial services and industry-standard insurance programs. In addition, certain agencies of the federal government as well as county and state governmental agencies and organizations use our solutions to help satisfy government needs for risk assessment and emergency response information.
Decision Analytics Customers
In the Decision Analytics segment, we provide our P&C insurance solutions to the majority of the P&C insurers in the U.S. Specifically, our claims database serves thousands of customers, representing overmore than 90% of the P&C insurance industry by premium volume, 27 state workers’ compensation insurance funds, 531more than 500 self-insurers, 425more than 400 third-party administrators, several state fraud bureaus, and many law-enforcement agencies involved in the investigation and prosecution of insurance fraud. We estimate that about 80% of insurance repair contractors and service providers in the U.S. and Canada with computerized estimating systems use our building and repair pricing data. In the U.S. healthcare industry, ourOur customers include 9included 28 of the top 10 health plan providers. Our customers included 24 of the top 2530 credit card issuers in North America, the United Kingdom and United Kingdom.Australia, as well as 8 of the top 10 global energy providers around the world. We also work with a wide range of companies, governments and institutions across the energy, and metals and mining value chains.
Our Competitors
We believe no single competitor currently offers the same scope of services and market coverage we provide. The breadth of markets we serve exposes us to a broad range of competitors as described below. Businesses that we acquire may introduce us to additional competitors.
Risk Assessment Competitors
Our Risk Assessment segment operates primarily in the U.S. P&C insurance industry, where we enjoy a leading market presence. We have a number of competitors in specific lines or services.
We encounter competition from a number of sources, including insurers whothat develop internal technology and actuarial methods for proprietary insurance programs. Competitors also include other statistical agents, including the National Independent Statistical Service, the Independent Statistical Service, Inc. and other advisory organizations, providingthat provide underwriting rules, prospective loss costs, and coverage language, such as the American Association of Insurance Services, Inc. and Mutual Services Organization, althoughOrganization. However, we believe none of our competitors hashave the breadth or depth of data we have.
Competitors for our property-specific rating and underwriting information are primarily limited to a number of regional providers of commercial property inspections and surveys, including Overland Solutions, Inc. and Regional Reporting, Inc. We also compete with a variety of organizations that offer consulting services, primarily specialty technology and consulting firms. In addition, a customer may use its own internal resources rather than engage an outside firm for these services. Our competitors also include information technology product and services vendors, management and strategy consulting firms, includingsuch as Deloitte Consulting LLP, and smaller specialized information technology firms and analytical services firms, including Pinnacle Consulting and EMB, a unit of Willis Towers Watson.
Decision Analytics Competitors
In the P&C insurance claims market and catastrophe modeling market, certain products are offered by a number of companies, including Risk Management Solutions (catastrophe modeling) and, CoreLogic (property replacement value), LexisNexis® Risk Solutions (loss histories and motor vehicle records for personal lines underwriting), Decision Insight or MSB (property value and claims estimator), and Solera Holdings, Inc. (personal automobile underwriting)., and Symbility. We believe that our P&C insurance industry expertise, combined with our ability to offer multiple applications, services and integrated solutions to individual customers enhances our competitiveness against these competitors with more limited offerings.are competitive strengths. In the healthcarenatural resources commercial intelligence market, certain products are offered by a number of companies, including Computer Sciences Corporation (evaluation of bodily injuryIHS Markit (natural resources), Rystad Energy (upstream), Global Data PLC (upstream), PIRA Energy Group (oil and workers’ compensation claims)gas markets), Fair Isaac Corporation (workers’ compensation and healthcare claims cost containment)CRU Group (metals). We believe that our global integrated value chain knowledge and OptumInsight, McKesson, Truven Health Analytics, Inovalon,insight, bottom-up proprietary data, and iHealth (healthcare predictive modeling and business intelligence). Competitive factors include application features and functions, ease of delivery and integration, ability of the providerlong-term trusted relationships enhance our competitive position in relationship to maintain, enhance and support the applications or services and price.those companies.
Development of New Solutions
We take a market-focused team approach to developing our solutions. Our operating units are responsible for developing, reviewing and enhancing our various products and services. Our data management and production team designs and manages our processes and systems for market data procurement, proprietary data production, and quality control. Our Joint Development Environment, or JDE, and Enterprise Data Management, or EDM, teams support our efforts to create new information and products from available data and exploresexplore new methods of collecting data. EDM is focused on understanding and documenting business-unit and corporate data assets and data issues;issues, sharing and combining data assets across the enterprise;enterprise, creating an enterprise data strategy;strategy, facilitating research and product development;development, and promoting cross-enterprise communication. Our Verisk Innovative Analytics, or VIA, team is a corporate center of excellence for analytical methods in applying modeling techniques to predict risk outcomes.
Our software development teams build the technology used in many of our solutions. As part of our product-development process, we continually solicit feedback from our customers on the value of our products and services and the market’s needs. We have established an extensive system of customer advisory panels, whichthat meet regularly throughout the year to help us respond effectively to the needs of our markets. In addition, we use frequent sales calls, executive visits, user group meetings, and other industry forums to gather information to match our product development efforts with the needs of the market with our product development efforts.market. We also use a variety of market research techniques to enhance our understanding of our clientscustomers and the markets in which they operate.
We also add to our offerings through an active acquisition program. Since 2009,2012, we have acquired twelve15 businesses, which have allowed us to enter new markets, offer new solutions and enhance the value of existing services with additional proprietary sources of data.
When we find it advantageous, we augment our proprietary data sources and systems by forming alliances with other leading information providers and technology companies and integrating their product offerings into our offerings. This approach gives our customers the opportunity to obtain the information they need from a single source and more easily integrate the information into their workflows.
Sales, Marketing and Customer Support
We sell our productssolutions and services primarily through direct interaction with our clients.customers. We employ a three-tier sales structure that includes salespeople, product specialiststechnical consultants and sales support. As of December 31, 2013,2016, we had a sales force of 285 people.295 people in our continuing operations. Within the company, several areas have sales teams that specialize in specific products and services. TheseThose specialized sales teams sell specific, highly technical productsolution sets to targeted markets in coordination with account management.
To provide account management to our largest customers in the insurance, financial and energy markets, we segment the insurance carrier marketour customers into three groups. Tier One or “National”“Global/National” Accounts, constitutesis comprised of our largest customers,customers. Tier Two, or “Strategic” Accounts, representsrepresent both larger carrier groupslarge and middle-market carriers.customer groups. Tier Three are theis comprised of small insuranceand specialized companies that may represent one line of business and/or may be one-state or regional writers. A Sales Generalist is assignedregionally focused. In Tier One and Tier Two segments, we have sales teams organized by the following specialities: Rating, Underwriting, Claims, Catastrophe Risk, and Energy. In the Tier Three segment, we assign a sales generalist with overall account management responsibility. Our tiered approach has proven to every insurer accountbe a successful sales model and is responsible for our overall relationship with these insurance companies.approach to building customer relationships. Our senior executives are also involvedregularly engage with the senior management of our customers.customers to ensure customer satisfaction and strategic alignment and to support mutual innovation partnership opportunities.
Sales people participate in both customer-service and sales activities. They provide direct support, interacting frequently with assigned customers to assure a positivesatisfactory experience using our services. Salespeople primarily seek out new sales opportunities and work with the various sales teams to coordinate sales activityactivities and provide the best solutions for our customers. We believe our salespeople’s product knowledge, skills to develop relationships of trust, and local presence differentiatesdifferentiate us from our competition. Product specialistsTechnical consultants are subject-matter experts and work with salespeople on specific opportunities for their assigned products.products and segments. Both salespeople and product specialiststechnical consultants have responsibility for identifying new sales opportunities. A team approach and a common customer relationship management system allow for effective coordination betweenamong the two groups.
Sources of ourOur Data
The data we use to perform our analytics and power our solutions are sourced through sevensix different kinds of data arrangements. First, we gather data from our customers within agreements that also permit our customers to use the solutions
created uponfrom their data. TheseThose agreements remain in effect unless the data contributor chooses to opt out and represent our primary method of data gathering.opt. It is very rare that contributors elect not to continue providing us data. Second, we have agreements with data contributors in which we specify the particular uses of their data and provide to the data contributors their required levels of privacy, protection of data and where necessary, de-identification of data. TheseThe agreements represent no cost to us, and generally feature a specified period of time for the data contributions, and requirerequired renewal. Third, we “mine” data found inside the transactions supported by our solutions; as an example, we utilizeuse the claims settlement data generated inside our repair cost estimating solution to improve the cost factors used in our models. Again, thesethose arrangements represent no cost to us, and we obtain the consent of our customers to make use of their data in this way. Fourth, we source data generally at no cost from public sources, including federal,
state, and local governments. Fifth, we gather data about the physical characteristics of commercial properties through the direct observation of our field staff thatmembers, who also perform property surveys at the request of, and facilitated by, property insurers. Sixth,Lastly, we purchase data from data aggregators under contracts that reflect prevailing market pricing for the data elements purchased, including county tax assessor records, descriptions of hazards such as flood plains and professional licenses. Lastly, we retrieve medical records from facilities and provider locations at prevailing market prices under agreements between our insurer customers and their provider networks. In all our modes of data collection, weWe are the owners of whateverthe derivative solutions we create using the data. Our costs for data received from our customers were 1.3% and 1.4% of revenues for the years ended December 31, 2013 and 2012, respectively.we collect.
Information Technology
Technology
Our information technology systems and the more recent adoption of cloud computing are fundamental to our success. They are used for the storage, processing, access, and delivery of the data whichthat forms the foundation of our business and the development and delivery of ourthe solutions providedwe provide to our clients.customers. Much of the technology we use and provide to our customers is developed, maintained, and supported by approximately 1,289 employees.25% of our employee population. We generally own, or have secured ongoing rights to use for the purposes of our business, all the customer-facing applications, whichthat are material to our operations. We support and implement a mix of technologies, focusedand focus on implementing the most efficient technology for any given business requirement or task.
Data Centers
We have two primary data centers in Jersey City,Somerset, New Jersey and Orem,Lehi, Utah, creating redundancy and back-up capabilities. In addition, we have data centers dedicated to certain business units located in other states.
Disaster Recovery
We are committed to a framework for business continuity management and carry out annual reviews of the state of preparedness of each business unit. All of our critical databases, systems and contracted clientcustomer services are also regularly recovered. We also have documented disaster recovery plans in place for each of our major data centers and each of our solutions. Our primaryThe data center in Somerset, New Jersey is the recovery site is in New York State, approximately 50 miles northwest of Jersey City, New Jersey.for the Lehi, Utah data center and vice versa.
Security
We have adopted a wide range of measures to ensure the security of our IT infrastructure and data. Security measures generally cover the following key areas: physical security;security, logical security of the perimeter;perimeter, network security such as firewalls;firewalls, logical access to the operating systems;systems, deployment of virus detection software;software, and appropriate policies and procedures relating to removable media such as laptops. All laptops are encrypted, and media leaving our premises that isand sent to a third-party storage facility isfacilities are also encrypted. ThisOur commitment to security has led us to achieve certificationearned from CyberTrust Security Certification (an industry leader in information security certification) since 2002.
Intellectual Property
We own a significant number of intellectual property rights, including copyrights, trademarks, trade secrets, and patents. Specifically, our policy language, insurance manuals, software, and databases are protected by both registered and common law copyrights, and the licensing of those materials to our customers for their use represents a large portion of our revenue. We also own in excess of 500 trademarks in the U.S. and foreign countries, including the names of our products and services and our logos and tag lines, many of which are registered. We believe many of our trademarks, trade names, service marks, and logos to be of material importance to our business as they assist our customers in identifying our products and services and the quality that stands behind them. We consider our intellectual property to be proprietary, and we rely on a combination of statutory (e.g.,(for example, copyright, trademark, trade secret, and patent) and contractual safeguards in a comprehensive intellectual property enforcement program to protect them wherever they are used.
We also own several software method and processing patents and have several pending patent applications in the U.S. that complement our products. The patents and patent applications include claims, whichthat pertain to technology, including a patent
for our ISO Claims Outcome Advisor® software and for our Xactware Sketch® product. We believe the protection of our proprietary technology is important to our success and we will continue to seek to protect those intellectual property assets for which we have expended substantial research and development capital and whichthat are material to our business.
general practice, employees, contractors and other parties with access to our proprietary information sign agreements that prohibit the unauthorized use or disclosure of our proprietary rights, information and technology.
Employees
As of December 31, 2013,2016, we employed 6,3686,148 full-time and 727166 part-time employees.employees in our continuing operations. None of our employees are represented by unions. We consider our relationship with our employees to be good and have not experienced interruptions of operations due to labor disagreements.
Our employees include over 190more than 200 actuarial professionals, including 4939 Fellows and 2535 Associates of the Casualty Actuarial Society, as well as 158149 Chartered Property Casualty Underwriters, 1823 Certified and 23 Associate Insurance Data Managers, and 530more than 900 professionals with advanced degrees, including PhDs in mathematics and statistical modeling who review both the data and the models.
Regulation
Because our business involves the distribution of certain personal, public, and non-public data to businesses and governmental entities that make eligibility, service, and marketing decisions based on such data, certain of our solutions and services are subject to regulation under federal, state, and local laws in the United StatesU.S. and, to a lesser extent, in foreign countries. Examples of such regulation include the Fair Credit Reporting Act, which regulates the use of consumer credit report information; the Gramm-Leach-Bliley Act, which regulates the use of non-publicnon public personal financial information held by financial institutions and applies indirectly to companies that provide services to financial institutions; the Health Insurance Portability and Accountability Act, which restricts the public disclosure of patient information and applies indirectly to companies that provide services to healthcare businesses; the Drivers Privacy Protection Act, which prohibits the public disclosure, use or resale by any state’s department of motor vehicles of personal information about an individual that was obtained by the department in connection with a motor vehicle record, except for a “permissible purpose”, and various other federal, state and local laws and regulations.
We are also licensed as a rating, rate service, advisory, or statistical organization under state insurance codes in all fifty50 states, Puerto Rico, Guam, the U.S. Virgin Islands, and the District of Columbia. As such an advisory organization, we provide statistical, actuarial, policy language development, and related products and services to property/casualty insurers, including advisory prospective loss costs, other prospective cost information, manual rules, and policy language. We also serve as an officially designated statistical agent of state insurance regulators to collect policy-writingpolicy writing and loss statistics of individual insurers and compile that information into reports used by the regulators.
Many of our products, services and operations as well as insurerinsurers' use of our services are subject to state rather than federal regulation by virtue of the McCarran-Ferguson Act. As a result, many of our operations and products are subject to review and/or approval by state regulators. Furthermore, our operations involving licensed advisory organization activities are subject to periodic examinations conducted by state regulators, and our operations and products are subject to state antitrust and trade practice statutes within or outside state insurance codes, which are typically enforced by state attorneys general and/or insurance regulators.
Available Information
We maintain an Investor Relations website on the Internet at investor.verisk.com. We make available free of charge on or through this website, our annual, quarterly, and current reports and any amendments to those reports as soon as reasonably practicable following the time they are electronically filed with or furnished to the U.S. Securities and Exchange Commission, or SEC. ToFor access these,to the filings, click the “SEC Filings" link on the “Financial Information” — “SEC" link foundtab on our Investor Relations homepage. Verisk trades on the NASDAQ Global Market in the Nasdaq Global Select Market segment under the ticker symbol “VRSK.” Our stock was first publicly traded on October 7, 2009.
The public may read and copy any materials filed by Verisk with the SEC at the SEC’s Public Reference Room at 100 F Street, NE, Room 1580, Washington, DC 20549. The public may obtain information on the operation of the Public Reference Room by calling the SEC at 1-800-SEC-0330. The SEC maintains an Internet site (www.sec.gov) that contains reports, proxy and information statements and other information regarding issuers that file electronically with the SEC at www.sec.gov.SEC.
| Item 1A. | Risk Factors |
You should carefully consider the following risks and all of the other information set forth in this annual report on Form 10-K before deciding to invest in any of our securities. If any of the following risks actually occurs, our business, financial condition or results of operations would likely suffer. In such case, the trading price of our securities, including our Class A common stock, could decline due to any of these risks, and you may lose all or part of your investment.
We could lose our access to data from external sources, which could prevent us from providing our solutions.
We depend upon data from external sources, including data received from customers and various government, and public record services, for information used in our databases. In general, we do not own the information in these databases, and the participating organizations could discontinue contributing information to the databases. Our data sources could withdraw or increase the price for their data for a variety of reasons, and we could also become subject to legislative, judicial, or contractual restrictions on the use of such data, in particular if such data is not collected by the third parties in a way whichthat allows us to legally use and/or process the data. In addition, some of our customers are significant stockholders of our company. Specifically, a portion of Class A common stock is owned by insurers who are also our customers. If our customers’ percentage of ownership of our common stock decreases in the future, there can be no assurance that our customers will continue to provide data to the same extent or on the same terms. If a substantial number of data sources, or certain key sources, were to withdraw or be unable to provide their data, or if we were to lose access to data due to government regulation or if the collection of data became uneconomical, our ability to provide solutions to our customers could be impacted, which could materially adversely affect our business, reputation, financial condition, operating results, and cash flows.
Agreements with our data suppliers are short-term agreements. Some suppliers are also competitors, which may make us vulnerable to unpredictable price increases and may cause some suppliers not to renew certain agreements. Our competitors could also enter into exclusive contracts with our data sources. If our competitors enter into such exclusive contracts, we may be precluded from receiving certain data from these suppliers or restricted in our use of such data, which would give our competitors an advantage. Such a termination or exclusive contracts could have a material adverse effect on our business, financial position, and operating results if we were unable to arrange for substitute sources.
Fraudulent or unpermitted data access and other security or privacy breaches may negatively impact our business and harm our reputation.
Security breaches in our facilities, computer networks, and databases may cause harm to our business and reputation and result in a loss of customers. Our systems may be vulnerable to physical break-ins, computer viruses, attacks by hackers and similar disruptive problems. Third-party contractors also may experience security breaches involving the storage and transmission of
proprietary information. If users gain improper access to our databases, they may be able to steal, publish, delete or modify confidential third-party information that is stored or transmitted on our networks.
In addition, customers’, employees’ or other’s misuse of and/or gaining unpermitted access to or failure to properly secure our information or services could cause harm to our business and reputation and result in loss of customers. Any such misappropriation and/or misuse of or failure to properly secure our information could result in us, among other things, being in breach of certain data protection and related legislation.
A security or privacy breach may affect us in the following ways:
deterring customers from using our solutions;
deterring data suppliers from supplying data to us;
harming our reputation;
exposing us to liability;
increasing operating expenses to correct problems caused by the breach;
affecting our ability to meet customers’ expectations; and/or
causing inquiry from governmental authorities.
Incidents in which consumer data has been fraudulently or improperly acquired or viewed, or any other security or privacy breaches, may occur and could go undetected. The number of potentially affected consumers identified by any future incidents is obviously unknown. Any such incident could materially and adversely affect our business, reputation, financial condition, operating results and cash flows.
We derive a substantial portion of our revenues from U.S. P&C primary insurers. If there is a downturn in the U.S. insurance industry or that industry does not continue to accept our solutions, our revenues will decline.
Revenues derived from solutions we provide to U.S. P&C primary insurers account for a substantial portion of our total revenues. During the year ended December 31, 2016, approximately 48.9% of our revenue was derived from solutions provided to U.S. P&C primary insurers. Also, invoices for certain of our solutions are linked in part to premiums in the U.S. P&C insurance market, which may rise or fall in any given year due to loss experience and capital capacity and other factors in the insurance industry that are beyond our control. In addition, our revenues will decline if the insurance industry does not continue to accept our solutions.
Factors that might affect the acceptance of these solutions by P&C primary insurers include the following:
changes in the business analytics industry,
changes in technology,
our inability to obtain or use state fee schedule or claims data in our insurance solutions,
saturation of market demand,
loss of key customers,
industry consolidation, and
failure to execute our customer-focused selling approach.
A downturn in the insurance industry, pricing pressure or lower acceptance of our solutions by the insurance industry could result in a decline in revenues from that industry and have a material adverse effect on our financial condition, results of operations and cash flows.
Acquisitions could result in operating difficulties, dilution and other harmful consequences, and we may not be successful in achieving growth through acquisitions.
Our long-term business strategy includes growth through acquisitions. Future acquisitions may not be completed on acceptable terms and acquired assets, data or businesses may not be successfully integrated into our operations, and we may ultimately divest unsuccessful investments. Any acquisitions or investments will be accompanied by the risks commonly encountered in the acquisitions of businesses. Such risks include, among other things:
failing to implement or remediate controls, procedures and policies appropriate for a larger public company at acquired companies that prior to the acquisition lacked such controls, procedures and policies,
paying more than fair market value for an acquired company or assets,
failing to integrate the operations and personnel of the acquired businesses in an efficient, timely manner,
assuming potential liabilities of an acquired company,
managing the potential disruption to our ongoing business,
distracting management focus from our core businesses,
failing to retain management at the acquired company,
difficulty in acquiring suitable businesses, including challenges in predicting the value an acquisition will ultimately contribute to our business,
possibility of overpaying for acquisitions, particularly those with significant intangible assets that derive value using novel tools and/or are involved in niche markets,
impairing relationships with employees, customers, and strategic partners,
incurring expenses associated with the amortization of intangible assets particularly for intellectual property and other intangible assets,
incurring expenses associated with an impairment of all or a portion of goodwill and other intangible assets due to changes in market conditions, weak economies in certain competitive markets, or the failure of certain acquisitions to realize expected benefits, and
diluting the share value and voting power of existing stockholders.
The anticipated benefits of many of our acquisitions may not materialize. Future acquisitions or dispositions could result in the incurrence of debt, contingent liabilities or amortization expenses, or write-offs of goodwill and other intangible assets, any of which could harm our financial condition.
We typically fund our acquisitions through our debt facilities. Although we have capacity under committed facilities, those may not be sufficient. Therefore, future acquisitions may require us to obtain additional financing through debt or equity, which may not be available on favorable terms or at all and could result in dilution.
In addition, to the extent we cannot identify or consummate, on terms acceptable to us, acquisitions that are complementary or otherwise attractive to our business, we may experience difficulty in achieving future growth.
There may be consolidation in our end customer market, which could reduce the use of our services.
Mergers or consolidations among our customers could reduce the number of our customers and potential customers. This could adversely affect our revenues even if these events do not reduce the aggregate number of customers or the activities of the consolidated entities. If our customers merge with or are acquired by other entities that are not our customers, or that use fewer of our services, they may discontinue or reduce their use of our services. The adverse effects of consolidation will be greater in sectors that we are particularly dependent upon, for example, in the P&C insurance sector. Any of these developments could materially adversely affect our business, financial condition, operating results, and cash flows.
If we are unable to develop successful new solutions or if we experience defects, failures and delays associated with the introduction of new solutions, our business could suffer serious harm.
Our growth and success depends upon our ability to develop and sell new solutions. If we are unable to develop new solutions, or if we are not successful in introducing and/or obtaining regulatory approval or acceptance for new solutions, or products we develop face sufficient pricing pressure to make them unattractive to pursue, we may not be able to grow our business, or growth may occur more slowly than we anticipate. In addition, significant undetected errors or delays in new solutions may affect market acceptance of our solutions and could harm our business, financial condition or results of operations. In the past, we have experienced delays while developing and introducing new solutions, primarily due to difficulties in developing models, acquiring data and adapting to particular operating environments. Errors or defects in our solutions that are significant, or are perceived to be significant, could result in rejection of our solutions, damage to our reputation, loss of revenues, diversion of development resources, an increase in product liability claims, and increases in service and support costs and warranty claims.
We will continue to rely upon proprietary technology rights, and if we are unable to protect them, our business could be harmed.
Our success depends, in part, upon our intellectual property rights. To date, we have relied primarily on a combination of copyright, patent, trade secret, and trademark laws and nondisclosure and other contractual restrictions on copying and distribution to protect our proprietary technology. This protection of our proprietary technology is limited, and our proprietary technology could be used by others without our consent. In addition, patents may not be issued with respect to our pending or future patent applications, and our patents may not be upheld as valid or may not prevent the development of competitive products. Businesses we acquire also often involve intellectual property portfolios, which increase the challenges we face in protecting our strategic advantage. Any disclosure, loss, invalidity of, or failure to protect our intellectual property could negatively impact our competitive position, and ultimately, our business. Our protection of our intellectual property rights in the U.S. or abroad may not be adequate and others, including our competitors, may use our proprietary technology without our consent. Furthermore, litigation may be necessary to enforce our intellectual property rights, to protect our trade secrets, or to determine the validity and scope of the proprietary rights of others. Such litigation could result in substantial costs and diversion of resources and could harm our business, financial condition, results of operations, and cash flows.
We could face claims for intellectual property infringement, which if successful could restrict us from using and providing our technologies and solutions to our customers.
There has been substantial litigation and other proceedings, particularly in the U.S., regarding patent and other intellectual property rights in the information technology industry. There is a risk that we are infringing, or may in the future infringe, the intellectual property rights of third parties. We monitor third-party patents and patent applications that may be relevant to our technologies and solutions and we carry out freedom to operate analysis where we deem appropriate. However, such monitoring and analysis has not been, and is unlikely in the future to be, comprehensive, and it may not be possible to detect all potentially relevant patents and patent applications. Since the patent application process can take several years to complete, there may be currently pending applications, unknown to us, that may later result in issued patents that cover our products and technologies. As a result, we may infringe existing and future third-party patents of which we are not aware. As we expand our operations there is a higher risk that such activity could infringe the intellectual property rights of third parties.
Third-party intellectual property infringement claims and any resultant litigation against us or our technology partners or providers, could subject us to liability for damages, restrict us from using and providing our technologies and solutions or
operating our business generally, or require changes to be made to our technologies and solutions. Even if we prevail, litigation is time consuming and expensive to defend and would result in the diversion of management’s time and attention.
If a successful claim of infringement is brought against us and we fail to develop non-infringing technologies and solutions or to obtain licenses on a timely and cost effective basis, this could materially adversely affect our business, reputation, financial condition, operating results, and cash flows.
Regulatory developments could negatively impact our business.
Because personal, public and non-public information is stored in some of our databases, we are vulnerable to government regulation and adverse publicity concerning the use of our data. We provide many types of data and services that already are subject to regulation under the Fair Credit Reporting Act, Gramm-Leach-Bliley Act, Driver’s Privacy Protection Act, the European Union’s Data Protection Directive, the Dodd Frank Wall Street Reform and Consumer Protection Act and to a lesser extent, various other federal, state, and local laws and regulations. These laws and regulations are designed to protect the privacy of the public and to prevent the misuse of personal information in the marketplace. However, many consumer advocates, privacy advocates, and government regulators believe that the existing laws and regulations do not adequately protect privacy. They have become increasingly concerned with the use of personal information, particularly social security numbers, department of motor vehicle data and dates of birth. As a result, they are lobbying for further restrictions on the dissemination or commercial use of personal information to the public and private sectors. Similar initiatives are under way in other countries in which we do business or from which we source data. In addition, on October 6, 2015 the Court of Justice of the European Union, or E.U., invalidated the Safe Harbor provisions used by the Company and numerous other U.S. businesses to comply with E.U.’s Data Protection Directive 95/46/EC. The Company has implemented various measures to comply with the Data Protection Directive, however, there can be no assurances that such methods will not be invalidated as well. If the Company is unable to comply with the transfer mechanisms adopted pursuant to the Data Protection Directive, it will impede the ability to conduct business between the U.S. and the E.U. which could have a material adverse effect on our business, financial position, results of operations or cash flows.
The following legal and regulatory developments also could have a material adverse effect on our business, financial position, results of operations or cash flows:
amendment, enactment, or interpretation of laws and regulations which restrict the access and use of personal information and reduce the supply of data available to customers;
changes in cultural and consumer attitudes to favor further restrictions on information collection and sharing, which may lead to regulations that prevent full utilization of our solutions;
failure of our solutions to comply with current laws and regulations; and
failure of our solutions to adapt to changes in the regulatory environment in an efficient, cost-effective manner.
We typically face a long selling cycle to secure new contracts that requiresrequire significant resource commitments, which result in a long lead time before we receive revenues from new relationships.
We typically face a long selling cycle to secure a new contract and there is generally a long preparation period in order to commence providing the services. We typically incur significant business development expenses during the selling cycle and we may not succeed in winning a new customer’s business, in which case we receive no revenues and may receive no reimbursement for such expenses. Even if we succeed in developing a relationship with a potential new customer, we may not be successful in obtaining contractual commitments after the selling cycle or in maintaining contractual commitments after the implementation cycle, which may have a material adverse effect on our business, results of operations and financial condition.
We may lose key business assets, includingthrough the loss of data center capacity or the interruption of telecommunications links, the internet, or power sources, which could significantly impede our ability to do business.
Our operations depend on our ability, as well as that of third-party service providers to whom we have outsourced several critical functions, to protect data centers and related technology against damage from hardware failure, fire, flood, power loss, telecommunications failure, impacts of terrorism, breaches in security (such as the actions of computer hackers), natural disasters, or other disasters. Certain of our facilities are located in areas that could be impacted by coastal flooding, earthquakes or other disasters. The on-lineonline services we provide are dependent on links to telecommunications providers. In addition, we generate a significant amount of our revenues through telesales centers and websites that we utilize in the acquisition of new customers, fulfillment of solutions and services and responding to customer inquiries. We may not have sufficient redundant operations to cover a loss or failure in all of these areas in a timely manner. Certain of our customer contracts provide that our on-lineonline servers may not be unavailable for specified periods of time. Any damage to our data centers, failure of our telecommunications links or inability to access these telesales centers or websites could cause interruptions in operations that materially adversely affect our ability to meet customers’ requirements, resulting in decreased revenue, operating income and earnings per share.
We are subject to competition in many of the markets in which we operate and we may not be able to compete effectively.
Some markets in which we operate or which we believe may provide growth opportunities for us are highly competitive, and are expected to remain highly competitive. We compete on the basis of quality, customer service, product and service selection, and price.pricing. Our competitive position in various market segments depends upon the relative strength of competitors in the segment and the resources devoted to competing in that segment. Due to their size, certain competitors may be able to allocate greater resources to a particular market segment than we can. As a result, these competitors may be in a better position to anticipate and respond to changing customer preferences, emerging technologies and market trends. In addition, new competitors and alliances may emerge to take market share away, and as we enter into new lines of business, due to acquisition or otherwise, we face competition from new players with different competitive dynamics. We may be unable to maintain our competitive position in our market segments, especially against larger competitors. We may also invest further to upgrade our systems in order to compete. If we fail to successfully compete, our business, financial position and results of operations may be adversely affected.
To the extent the availability of free or relatively inexpensive information increases, the demand for some of our solutions may decrease.
Public sources of free or relatively inexpensive information have become increasingly available recently, particularly through the Internet, and this trend is expected to continue. Governmental agencies in particular have increased the amount of information to which they provide free public access. Public sources of free or relatively inexpensive information may reduce the demand for our solutions. To the extent that customers choose not to obtain solutions from us and instead rely on information obtained at little or no cost from these public sources, our business and results of operations may be adversely affected.
Our financial position may be impacted by audit examinations or changes in tax laws or tax rulings.
Our existing corporate structure and tax positions have been implemented in a manner in which we believe is compliant with current prevailing tax laws. However, changes in existing tax laws or rulings, including Federal, State and International, could have a significant impact on our effective tax rate, cash tax positions and deferred tax assets and liabilities. Audit examinations with an adverse outcome could have a negative effect in the jurisdictions in which we operate. Furthermore, the Organization for Economic Co-operation and Development (OECD) released its Base Erosion and Profit Shifting (BEPS) action plans which may also lead to future tax reform that could affect our results. In addition, our tax positions are impacted by fluctuations in our earnings and financial results in the various countries in which we do business.
Our senior leadership team is critical to our continued success and the loss of such personnel could harm our business.
Our future success substantially depends on the continued service and performance of the members of our senior leadership team. These personnel possess business and technical capabilities that are difficult to replace. Members of our senior management operating team have been with us for an average of over 18 years.
However, as a general practice we do not haveenter into employee contracts with the members of our senior management operating team.team, except for certain limited situations. If we lose key members of our senior management operating team, we may not be able to effectively manage our current operations or meet ongoing and future business challenges, and this may have a material adverse effect on our business, results of operations and financial condition.
We may fail to attract and retain enough qualified employees to support our operations, which could have an adverse effect on our ability to expand our business and service our customers.
Our business relies on large numbers of skilled employees and our success depends on our ability to attract, train and retain a sufficient number of qualified employees. If our attrition rate increases, our operating efficiency and productivity may decrease. We compete for employees not only with other companies in our industry, but also with companies in other industries, such as software services, engineering services and financial services companies, and there is a limited pool of employees who have the skills and training needed to do our work.
If our business continues to grow, the number of people we will need to hire will increase. We will also need to increase our hiring if we are not able to maintain our attrition rate through our current recruiting and retention policies. Increased competition for employees could have an adverse effect on our ability to expand our business and service our customers, as well as cause us to incur greater personnel expenses and training costs.
We are subject to antitrust, consumer protection and other litigation, and may in the future become further subject to further such litigation; an adverse outcome in such litigation could have a material adverse effect on our financial condition, revenues and profitability.
We participate in businesses (particularly insurance-related businesses and services) that are subject to substantial litigation, including antitrust and consumer protection litigation. In addition, our insurance specialists are in the business of providing advice on standard contract terms, which if challenged could expose us to substantial reputational harm and possible liability. We are subject to the provisions of a 1995 settlement agreement in an antitrust lawsuit brought by various state Attorneys General and private plaintiffs, which imposes certain constraints with respect to insurer involvement in our governance and business. We currently are defending against putative class action lawsuits in which it is alleged that certain of our subsidiaries failedunlawfully have conspired with insurers with respect to comply with the Fair Credit Reporting Act and related obligations.their payment of insurance claims. See “Item 3. Legal Proceedings.” Our failure to successfully defend or settle such litigation could result in liability that, to the extent not covered by our insurance, could have a material adverse effect on our financial condition, revenues and profitability. Given the nature of our business, we may be subject to similar litigation in the future. Even if the direct financial impact of such litigation is not material, settlements or judgments arising out of such litigation
could include further restrictions on our ability to conduct business, including potentially the elimination of entire lines of business, which could increase our cost of doing business and limit our prospects for future growth.
General economic, political and market forces and dislocations beyond our control could reduce demand for our solutions and harm our business.
The demand for our solutions may be impacted by domestic and international factors that are beyond our control, including macroeconomic, political and market conditions, the availability of short-term and long-term funding and capital, the level and volatility of interest rates, currency exchange rates, and inflation. The United States economy recently experienced periods of contraction and both the future domestic and global economic environments may continue to be less favorable than those of prior years. Any one or more of these factors may contribute to reduced activity and prices in the securities markets generally and could result in a reduction in demand for our solutions, which could have an adverse effect on our results of operations and financial condition. A significant additional decline in the value of assets for which risk is transferred in market transactions could have an adverse impact on the demand for our solutions.
We incurred substantial additional indebtedness in connection with the acquisition of Wood Mackenzie.
In addition,order to finance acquisitions, which are an important part of our long term growth strategy , we may incur substantial additional indebtedness and such increased leverage could adversely affect our business. In particular, the declineincreased leverage could increase our vulnerability to sustained, adverse macroeconomic weakness, limit our ability to obtain further financing and limit our ability to pursue other operational and strategic opportunities. The increased leverage, potential lack of access to financing and increased expenses could have a material adverse effect on our financial condition, results of operations and cash flows.
General economic uncertainties, including downward trends in the energy industry, could reduce demand by Wood Mackenzie’s customers for its products and services.
Demand for Wood Mackenzie’s products and services may be negatively influenced by general economic uncertainties, particularly any downward trends in the energy industry. Many factors could negatively affect the revenues, profits and discretionary spending of Wood Mackenzie’s customers. Such factors include commodity prices (in particular, oil and coal), the state of the credit markets has reducedlocal economy, interest rates, currency exchange rates, political uncertainty or restrictions and regulations, the numberavailability of mortgage originators,industry resources, and therefore,other matters. A downturn or perceived downturn in the immediate demand for our related mortgage solutions. Specifically, certain of our fraud detection and prevention solutions are directed ateconomy, particularly the mortgage market. This decline in asset value and originations and an increase in foreclosure levels has also created greater regulatory scrutiny of mortgage originations and securitizations. Any new regulatory regime may change the utilityenergy industry, could add pricing pressure, delay subscription renewals or lead to more challenging or protracted fee negotiations or generally lower acceptance of our solutions for mortgage lendersby Wood Mackenzie’s customers, which could cause a decline in our revenues and have a material adverse effect on our financial condition, results of operations and cash flows.
Our operations are subject to additional risks inherent in international operations.
Wood Mackenzie is based in the United Kingdom, or U.K., and conducts its principal operations outside the U.S. As a result, the percentage of our revenues generated outside of the U.S. has increased materially. Conducting extensive international operations subjects us to risks that are inherent in international operations, including challenges posed by different pricing environments and different forms of competition; lack of familiarity and burdens of complying with foreign laws, legal standards, regulatory requirements, tariffs and other participantsbarriers; unexpected changes in regulatory requirements, taxes, trade laws, tariffs, export quotas, custom duties, or other trade restrictions; differing technology standards; difficulties in collecting accounts receivable; difficulties in managing and staffing international operations; varying expectations as to employee standards; potentially adverse tax consequences, including possible restrictions on the repatriation of earnings; and reduced or
varied protection for intellectual property rights in some countries. Moreover, international operations could be interrupted and negatively affected by economic changes, geopolitical regional conflicts, terrorist activity, political unrest, civil strife, acts of war, and other economic or political uncertainties. All of these risks could result in increased costs or decreased revenues, either of which could have a material adverse effect on our financial condition, results of operations and cash flows.
We are subject to the increased risk of exchange rate fluctuations.
The revenues and costs of Wood Mackenzie are primarily denominated in pound sterling. As a result of the Acquisition, we face greater exposure to movements in currency exchange rates, which may cause our revenue and operating results to differ materially from expectations. Our operating results could be negatively affected depending on the amount of revenue and expense denominated in foreign currencies. As exchange rates vary, revenue, cost of revenue, operating expenses, and other operating results, when remeasured in U.S. dollars, may differ materially from expectations. Although we may apply certain strategies to mitigate foreign currency risk, these strategies may not eliminate our exposure to foreign exchange rate fluctuations and would involve costs and risks of their own, such as ongoing management time and expertise, external costs to implement the strategies and potential accounting implications.
Economic and political instability and potential unfavorable changes in laws and regulations resulting from the U.K.’s exit from the E.U. could adversely affect our financial condition, results of operations and cash flows.
The results of the referendum on June 23, 2016 in the mortgage lending industryU.K., to exit the E.U., which is commonly referred to as “Brexit,” and related derivativeto potentially significantly change the U.K.’s relationship with the E.U. and the laws and regulations impacting business conducted between the U.K. and E.U. countries could disrupt the overall stability of the E.U. given the diverse economic and political circumstances of individual E.U. countries and negatively impact our European operations. An immediate consequence of the Brexit vote was an adverse impact to global markets, or increaseincluding currency markets which experienced a sharp drop in the value of the British pound. Longer term, Brexit will require negotiations regarding the future terms of the U.K.’s relationship with the E.U., which could result in the U.K. losing access to certain aspects of the single E.U. market and the global trade deals negotiated by the E.U. on behalf of its members. The Brexit vote and the perceptions as to the impact of the withdrawal of the U.K. may adversely affect business activity, political stability and economic conditions in the U.K., the E.U. and elsewhere, the impact of which could have an adverse effect our costs as we adapt our solutions to new regulation.financial condition, results of operations and cash flows.
If there are substantial sales of our common stock, our stock price could decline.
The market price of our common stock could decline as a result of sales of a large number of shares of our common stock in the market, or the perception that these sales could occur. These sales, or the possibility that these sales may occur, also might make it more difficult for us to sell equity securities in the future at a time and at a price that we deem attractive. As of December 31, 2013,2016, our ten largest shareholders owned 46.4%39.6% of our Class A common stock, including 8.9%5.1% of our Class A common stock owned by our Employee Stock Ownership Plan or ESOP. Such stockholders are able to sell their common stock in the public market from time to time without registration, and subject to limitations on the timing, amount and method of those sales imposed by securities laws. If any of these stockholders were to sell a large number of their common stock, the market price of our common stock could decline significantly. In addition, the perception in the public markets that sales by them might occur could also adversely affect the market price of our common stock.
Pursuant to our equity incentive plans, options to purchase approximately 8,947,7278,666,698 shares of Class A common stock were outstanding as of February 21, 2014.17, 2017. We filed a registration statement under the Securities Act, which covers the shares available for issuance under our equity incentive plans (including for such outstanding options) as well as shares held for resale by our existing stockholders that were previously issued under our equity incentive plans. Such further issuance and resale of our common stock could cause the price of our common stock to decline.
Also, in the future, we may issue our securities in connection with investments and acquisitions. The amount of our common stock issued in connection with an investment or acquisition could constitute a material portion of our then outstanding common stock.
Our capital structure, level of indebtedness and the terms of anti-takeover provisions under Delaware law and in our amended and restated certificate of incorporation and bylaws could diminish the value of our common stock and could make a merger, tender offer or proxy contest difficult or could impede an attempt to replace or remove our directors.
We are a Delaware corporation and the anti-takeover provisions of the Delaware General Corporation Law may discourage, delay or prevent a change in control by prohibiting us from engaging in a business combination with an interested stockholder for a period of three years after the person becomes an interested stockholder, even if a change of control would be
beneficial to our existing stockholders. In addition, our certificate of incorporation and bylaws may discourage, delay or prevent a change in our management or control over us that stockholders may consider favorable or make it more difficult for stockholders to replace directors even if stockholders consider it beneficial to do so. Our certificate of incorporation and bylaws:
authorize the issuance of “blank check” preferred stock that could be issued by our board of directors to increase the number of outstanding shares to thwart a takeover attempt;attempt,
prohibit cumulative voting in the election of directors, which would otherwise allow holders of less than a majority of the stock to elect some directors;directors,
require that vacancies on the board of directors, including newly-created directorships, be filled only by a majority vote of directors then in office;office,
limit who may call special meetings of stockholders;stockholders,
prohibit stockholder action by written consent, requiring all stockholder actions to be taken at a meeting of the stockholders;stockholders, and
establish advance notice requirements for nominating candidates for election to the board of directors or for proposing matters that can be acted upon by stockholders at stockholder meetings.
In addition, Section 203 of the Delaware General Corporation Law may inhibit potential acquisition bids for us. As a public company, we are subject to Section 203, which regulates corporate acquisitions and limits the ability of a holder of 15.0% or more of our stock from acquiring the rest of our stock. Under Delaware law, a corporation may opt out of the anti-takeover provisions, but we do not intend to do so.
These provisions may prevent a stockholder from receiving the benefit from any premium over the market price of our common stock offered by a bidder in a potential takeover. Even in the absence of an attempt to effect a change in management or a takeover attempt, these provisions may adversely affect the prevailing market price of our common stock if they are viewed as discouraging takeover attempts in the future.
| Item 1B. | Unresolved Staff Comments |
Not Applicable.
| Item 2. | Properties |
Our headquarters are in Jersey City, New Jersey. As of December 31, 2013,2016, our principal offices consisted of the following properties:
| Location | Square Feet | Lease Expiration Date | |
| Jersey City, New Jersey | |||
| December 31, | |||
| Lehi, Utah | 200,000 | January 31, 2024 | |
| Boston, Massachusetts | 69,806 | November 30, 2020 | |
| September 29, 2021 | |||
| Houston, Texas | 56,584 | ||
We also lease offices in 2116 states in the United States,U.S., and offices outside the United StatesU.S. to support our international operations in Argentina, Australia, Bahrain, Brazil, Canada, China, Denmark, England, Germany, India, Indonesia, Ireland, Israel, Japan, Kazakhstan, Malaysia, Mexico, Nepal, Nigeria, Russia, Singapore, South Africa, South Korea, Spain, Thailand, the United Arab Emirates and Singapore.the U.K.
We believe that our properties are in good operating condition and adequately serve our current business operations. We also anticipate that suitable additional or alternative space, including those under lease options, will be available at commercially reasonable terms for future expansion.
| Item 3. | Legal Proceedings |
We are party to legal proceedings with respect to a variety of matters in the ordinary course of business, including those matters described below. With respect to the ongoing matters, we are unable, at the present time, to determine the ultimate resolution of or provide a reasonable estimate of the range of possible loss attributable to these matters or the impact they may have on our results of operations, financial position or cash flows. This is primarily because the matters are generally in early stages and discovery has either not commenced or been completed. Although we believe we have strong defenses and intend to vigorously defend these matters, we could in the future incur judgments or enter into settlements of claims that could have a material adverse effect on our results of operations, financial position or cash flows.
Intellicorp Records, Inc. Litigation and iiX Litigation
On April 20, 2012,September 9, 2015, we were served with a nationwide putative class action complaint filed in Alamedathe Court of Common Pleas, Cuyahoga County Superior Court in CaliforniaOhio naming our subsidiary Intellicorp Records, Inc. (“Intellicorp”Intellicorp.”) titled Jane RoeSherri Legrand v. Intellicorp Records, Inc. and The complaint alleged violations of the Fair Credit Reporting Act (“FCRA”) and claimed that Intellicorp failed to implement reasonable procedures to assure maximum possible accuracy of the adverse information contained in the background reports, failed to maintain strict procedures to ensure that criminal record information provided to employers is complete and up to date, and failed to notify class members contemporaneously of the fact that criminal record information was being provided to their employers and prospective employers. IntellicorpCato Corporation et al. Defendants removed the case to the United States District Court of the Northern District of California. The California Court later granted Intellicorp’s motion to transfer the case, which is now pending in the United States District Court for the Northern District of Ohio. OnOhio on October 24, 2012 plaintiffs served8, 2015. Plaintiffs filed their First Amended Class Action Complaint (the “Roeon November 5, 2015 (“Amended Complaint”) alleging, which like the prior complaint claims violations of the Fair Credit Reporting Act ("FCRA") and alleges two putative class claims against Intellicorp, namely (i) a section 1681k(a) claim on behalf of all individuals who were the subjects of consumer reports furnished by Intellicorp which contained public record information in the “Government Sanctions” section of the report on or after September 4, 2013 and continuing through the date the class list is prepared and (ii) a section 1681e(b) claim on behalf of all individuals who were the subjects of consumer reports furnished by Intellicorp which contained public record information in the “Government Sanctions” section of the report where the address or social security number of the subject of the report do not match the social security number or address contained in the government database on or after September 4, 2013 and continuing through the date the class list is prepared. Count I of the Amended Complaint alleges that defendant Cato violated the FCRA by procuring consumer reports on the plaintiff and other class members without making the stand-alone disclosure required by FCRA section 1681b(b)(2)(A)(i). Counts II and III allege that Intellicorp violated the FCRA section 1681e (b) by failing to follow reasonable procedures to assure maximum accuracy of the adverse information included in its consumer reports and FCRA section 1681k (a) by failing to maintain strict procedures to assure that the public record information reported which was likely to have an adverse effect on the consumer was complete and up to date, respectively. The Amended Complaint alleges that defendants acted willfully and seeks statutory damages for the classes in an amount not less than one hundred dollars and not more than one thousand dollars per violation, punitive damages, equitable relief, costs and attorney’s fees.
At this time, it is not possible to determine the ultimate resolution of, or estimate the liability related to this matter.
On February 1, 2016, we were served with a nationwide putative class action complaint filed in the United States District Court for the Eastern District of North Carolina naming Intellicorp. The complaint titled Frank DiSalvo v. Intellicorp Records, Inc. claims violations of the FCRA and alleges a section 1681b(b)(1) claim on behalf of all personsindividuals residing in the United States who were the subjectsubjects of a Criminal SuperSearch or other “instant” consumer background reportreports furnished to a third party by Intellicorp for employment purposes and whose report contained any negative public record of criminal arrest, charge, or convictionwithin the period prescribed by the FCRA, 15 U.S.C. Section 1681p without also disclosingfirst obtaining from the final dispositionuser of the charges duringreport a certification that such user had complied with the five (5) years precedingobligations under Section 1681b(b)(2) as to the filingsubject of this action through the dateconsumer report. The class complaint alleges that Intellicorp violated the FCRA section 1681b(b)(1) by failing to obtain the required specific certification is granted.from its customers to whom Intellicorp furnished consumer reports as to each consumer report provided before providing the specific consumer report that was the subject of the certification. The Roe Complaintcomplaint alleges that the violations were willful or in the alternative negligent and seeks statutory damages for the class in an amount not less than one hundred dollars and not more than one thousand dollars per violation, punitive damages, equitable relief, costs and attorneys’attorney’s fees. On February 4, 2013,April 18, 2016, the Court granted plaintiffs’parties filed a joint motion to amendstay all proceedings pending the Roe Complaint to eliminate the named plaintiff’s individual claim for compensatory damages. This amendment did not change the breadth or scoperesolution of the request for relief soughtUnited States Supreme Court’s decision in Spokeo v. Robins, No. 13-1339. After Spokeo was decided on behalf of the proposed class. Plaintiffs later amendedMay 16, 2016, plaintiffs voluntarily dismissed their class definitionfederal court complaint and filed a virtually identical complaint in their motion for class certificationOhio State court on May 27, 2016. Defendants removed that complaint to include only those consumers whose (1) Criminal SuperSearch returned results, but Single County search returned no result; (2) Criminal SuperSearch returned one or more criminal charges without a disposition, but the Single County search returned a disposition other than “conviction” or “guilty” and (3) Criminal SuperSearch returned a higher level of offense
On October 18, 2013, the parties filed a Stipulation of Settlement resolving the Roe, Thomas and Johnson matters which Judge Gwin approved on October 29, 2013 subject to a hearing on Final Approval. The Stipulation of Settlement provides for a payment of $18.6 million all of which is to be provided by insurance. Accordingly, if the Stipulation of Settlement is approved at the hearing on Final Approval, the settlement of these matters is not expected to have a material adverse effect on us.
infringe seven patents owned by Eagle View and Pictometry namely, Patent Nos. 436, 840, 152, 880, 770, 732 and 454 (collectively the “Patents-in-Suit”) On November 30, 2015, plaintiffs filed a First Amended Complaint (“First Amended Complaint”) adding Patent Nos. 376 and 737 to the Patents in Suit. The First Amended Complaint seeks an entry of judgment by the Court that defendants have and continue to directly infringe and/or indirectly infringe, by way of inducement the Patents in Suit, permanent injunctive relief, damages, costs and attorney’s fees.
At this time, it is not possible to determine the ultimate resolution of, or estimate the liability related to this matter.
Interthinx, Inc. Litigation
On April 20, 2015, we were served with a putative class action titled John Weber v. Interthinx, Inc. and Verisk Analytics, Inc. The plaintiff, a former employee of our former subsidiary Interthinx, Inc. in Missouri, filed the class action complaint in the United States District Court for the Eastern District of Missouri on behalf of all fraud detection employeesreview appraisers and individuals holding comparable positions with different titles who have worked forwere employed by Interthinx for the last three years in Colorado and nationwide and who were classified as exempt employees. On September 12, 2013 the plaintiffs filed a First Amended Complaint titled Celeste Shaw and Judith Verheecke v. Interthinx, Inc.,Verisk Analytics, Inc. and Jeffery Moyer (the “Amended Complaint”).not paid overtime wages. The Amended Complaint adds a Missouri class representative and similarlycomplaint claims that the fraud detectionreview appraiser employees were misclassified as exempt employees and, as a result, were denied certain wages and benefits that would have been received if they were properly classified as non-exempt employees. It pleads four causes of action against defendants: (1)a Collective Action under section 216(b) of the Fair Labor Standards Act for unpaid overtime (nationwide class); (2) Fed. R. Civ. P. 23 class action under the Colorado Wage Act and Wage Order forunpaidseeks overtime (Colorado class); (3) Fed. R. Civ. P. 23 class action under the Missouri Ann. Stat. section 290.500 et seq. for unpaid overtime (Missouri class) and (4) Fed. R. Civ. P. 23 class action under Colorado Wage Act for unpaid commissions/
Insurance Services Office, Inc. Litigation
On July 2, 2013,August 1, 2014, we were served with a putative class action titled Shabnam Shelia Dehdashtian v. Interthinx, Inc. and Verisk Analytics, Inc. in the United States District Court for the Central District of California. The plaintiff, Shabnam Shelia Dehdashtian, a former mortgage auditor at our subsidiary Interthinx, Inc. in California, filed the class action on behalf of all persons who have been employed by Interthinx as auditors, mortgage compliance underwriters and mortgage auditors nationwide claiming that the defendants failed to pay overtime compensation, to provide rest and meal periods, waiting time penalties and to provide accurate wage statements to the plaintiffs as required by federal and California law. On August 30, 2013 plaintiff filed her Firstan Amended Complaint (the “Amended Complaint”) adding Medhat Gareeb, a former mortgage auditor, as a plaintiff, limiting the alleged FLSA violations to individual claims and proceeding with the California class action on behalf of all persons who have been employed by defendants as auditors, mortgage compliance underwriters and mortgage auditors in California at any time starting 4 years prior to filing of the initial complaint until trial. The Amended Complaint pleads seven causes of action against defendants: (1) Failure to pay overtime compensation in violation of the FLSA for the individual named plaintiffs only; (2) Failure to pay overtime compensation in violation of Cal. Lab. Code sections 510, 1194 and 1198 and IWC Wage Order No. 4; (3) Failure to pay waiting time penalties in violation of Cal. Lab. Code sections 201-203; (4) Failure to provide itemized wage statements in violation of Cal. Lab. Code section 226 and IWC Order No. 4; (5) Failure to provide and or authorize meal and rest periods in violation of Cal. Lab. Code section 226.7 and IWC Order No. 4; (6) Violation of California Business and Professions Code sections 17200, et seq; and (7) a Labor Code Private Attorney General Act (PAGA) Public enforcement claim, Cal. Lab. Code section 2699 (California class). The complaint seeks compensatory damages, penalties that are associated with the various statutes, equitable and injunctive relief, interest, costs and attorneys’ fees.
At this time, it is not possible to determine the ultimate resolution of, or estimate the liability related to this matter.
On October 11, 2013,February 19, 2016, we were served with a notice of a summons and complaint in an action titled Naveen Trehan v. MediConnect Global, Inc., Amy Anderson and Verisk Health, Inc. filed on October 9, 2013January 29, 2016 against ISO in the United StatesU.S. District Court for the District of Utah. The complaint,Connecticut titled Halloran et al. v. Harleysville Preferred Insurance Co. et al. As alleged in the First Amended Complaint, the putative class action is brought by four policyholders on behalf of a former minority shareholderclass of our subsidiary, MediConnect Global, Inc.,similarly situated policyholders in eastern Connecticut who allege that their homeowner’s insurance carriers have denied or will deny their claims for damage to their homes caused by defective concrete. The lawsuit alleges four causes of action: (1)a breach of fiduciary dutycontract claim against MediConnectcertain insurers and Amy Andersonseeks declaratory relief as to more than 100 other insurers. It also alleges that ISO as the drafter of the standardized policy language at issue violated the Connecticut Unfair Trade Practices ("CUTPA") and the Connecticut Unfair Insurance Practices Act ("CUIPA"). The plaintiffs ask that the Court certify a class of persons similarly situated and seek relief in the form of the cost for failurethe replacement of their concrete foundations and a declaratory judgment that all of the defendant insurance carriers are obligated to disclose our interest in acquiring, mergingprovide coverage for claims resulting from the defective concrete as well as, attorneys’ fees, costs and interest.
On March 17, 2016 plaintiffs filed their first amended complaint asserting federal jurisdiction under the Class Action Fairness Act, adding a number of insurer defendants and amending their damages claim to include punitive damages. After defendants indicated that they would be filing motions to dismiss the first amended complaint at a Rule 16 Conference on April 12, 2016, the Court gave plaintiffs until May 6, 2016 to move for leave to file a second amended complaint. On May 6, 2016, plaintiffs filed a Motion to amend the first amended complaint with a proposed second amended complaint, which did not name ISO or investing in MediConnect priorus as a defendant. No opposition was filed to the buyoutmotion to amend, which was granted on October 4, 2016. Instead of his shares; (2) fraud against Amy Anderson and MediConnect
At this time, it is not possible to determine the ultimate resolution of, or estimate the liability related to this matter.
| Item 4. | Mine Safety Disclosures |
Not Applicable.
PART II
| Item 5. | Market for Registrant’s Common Equity, Related Stockholder Matters and Issuer Purchases of Equity Securities |
Market Information
Verisk trades under the ticker symbol “VRSK” on the NASDAQ Global Select Market. Our common stock was first publicly traded on October 7, 2009. As of February 21, 2014,17, 2017, the closing price of our Class A common stock was $65.53$84.90 per share, as reported by the NASDAQ Global Select Market. As of February 21, 2014,17, 2017, there were approximately 28 Class A40 stockholders of record. We believe the number of beneficial owners is substantially greater than the number of record holders, for Class A, because a large portion of Class A common stock is held in “street name” by brokers. We converted all Class B shares to Class A shares in 2011 and currently have no outstanding Class B shares.
We have not paid or declared any cash dividends on our Class A common stock during the two most recent fiscal years and we currently do not intend to pay dividends on our Class A common stock. We do have a publicly announced share repurchase plan and have repurchased 34,420,219a total of 50,636,328 shares since our IPO.IPO through December 31, 2016. As of December 31, 2013,2016, we had 376,545,111377,087,266 shares of treasury stock.
The following table shows the quarterly range of the closing high and low per share salestrading prices for our common stock as reported by the NASDAQ Global Select Market for the years ending December 31:
| 2013 | 2012 | 2016 | 2015 | |||||||||||||||||||||||||
| High | Low | High | Low | High | Low | High | Low | |||||||||||||||||||||
| Fourth Quarter | $ | 68.74 | $ | 61.27 | $ | 51.35 | $ | 45.95 | $ | 84.15 | $ | 79.36 | $ | 81.50 | $ | 69.03 | ||||||||||||
| Third Quarter | $ | 66.53 | $ | 60.47 | $ | 50.94 | $ | 46.39 | $ | 85.75 | $ | 79.43 | $ | 78.60 | $ | 70.77 | ||||||||||||
| Second Quarter | $ | 61.29 | $ | 57.70 | $ | 49.43 | $ | 46.34 | $ | 81.08 | $ | 76.00 | $ | 76.85 | $ | 71.53 | ||||||||||||
| First Quarter | $ | 61.62 | $ | 52.98 | $ | 47.33 | $ | 38.98 | $ | 79.92 | $ | 65.95 | $ | 72.27 | $ | 62.70 | ||||||||||||
Performance Graph
The graph below compares the cumulative total stockholder return on $100 invested in our Class A common stock, with the cumulative total return (assuming reinvestment of dividends) on $100 invested in each of the NASDAQ Composite Index, S&P 500 Index and an aggregate of peer issuers in the information industry since October 7, 2009, the date our Class A common stock was first publicly traded.industry. The peer issuers used for this graph are Dun & Bradstreet Corporation, Equifax Inc., Factset Research Systems Inc., Fair Isaac Corporation, IHS Inc, Morningstar, Inc.,Markit, MSCI Inc., Moody’s Corporation, S&P Global, and SoleraNielsen Holdings Inc.plc. Each peer issuer was weighted according to its respective market capitalization on October 7, 2009.December 31, 2011.
COMPARISON OF CUMULATIVE TOTAL RETURN
Assumes $100 Invested on October 07, 2009December 31, 2011
Assumes Dividend Reinvested
Fiscal Year Ended December 31, 20132016
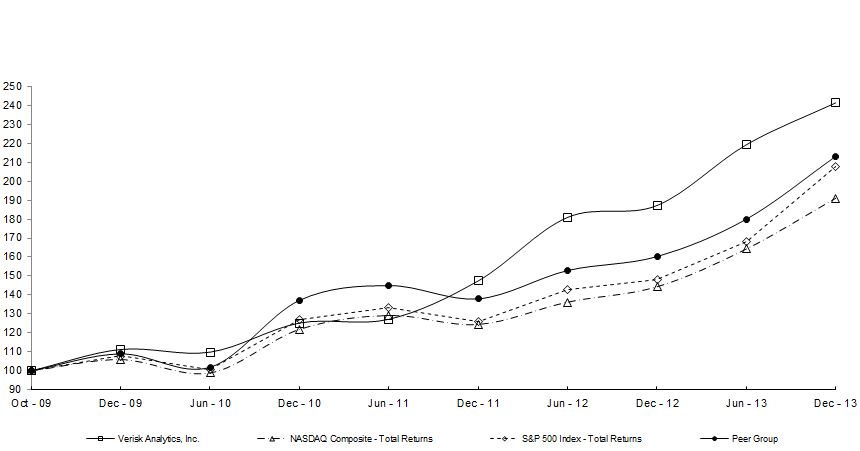

Recent Sales of Unregistered Securities
There were no unregistered sales of equity securities by the Company during 2013.2016.
Issuer Purchases of Equity Securities
Our board of directors has authorized a share repurchase program, or Repurchase Program, since May 2010, up to $1. 2$2.8 billion, including an additional authorization of which $165.3$500.0 million announced on December 8, 2016. As of December 31, 2016, $636.0 million remains available as of December 31, 2013.for share repurchases. Under the Repurchase Program, we may repurchase stock in the market or as otherwise determined by us. These authorizations have no expiration dates and may be suspended or terminated at any time. Our shares repurchased for the quarter ended December 31, 2013 is2016 are set forth below:
| Period | Total Number of Shares Purchased | Average Price Paid per Share | Total Number of Shares Purchased as Part of Publicly Announced Plans or Programs | Approximate Dollar Value of Shares that May Yet Be Purchased Under the Plans or Programs | |||||||||
| (in thousands) | |||||||||||||
| October 1, 2013 through October 31, 2013 | 253,676 | $ | 65.33 | 253,676 | $ | 265,539 | |||||||
| November 1, 2013 through November 30, 2013 | 1,144,344 | $ | 63.13 | 1,144,344 | $ | 193,296 | |||||||
| December 1, 2013 through December 31, 2013 | 426,970 | $ | 65.68 | 426,970 | $ | 165,253 | |||||||
| 1,824,990 | 1,824,990 | ||||||||||||
| Period | Total Number of Shares Purchased | Average Price Paid per Share | Total Number of Shares Purchased as Part of Publicly Announced Plans or Programs | Approximate Dollar Value of Shares that May Yet Be Purchased Under the Plans or Programs | |||||||||
| (in millions) | |||||||||||||
| October 1, 2016 through October 31, 2016 | 964,938 | $ | 80.53 | 964,938 | $ | 201.8 | |||||||
| November 1, 2016 through November 30, 2016 | 431,960 | $ | 82.51 | 431,960 | $ | 166.2 | |||||||
| December 1, 2016 through December 31, 2016 | 366,836 | $ | 82.26 | 366,836 | $ | 636.0 | |||||||
| 1,763,734 | 1,763,734 | ||||||||||||
| Item 6. | Selected Financial Data |
The following selected historical financial data should be read in conjunction with, and are qualified by reference to, Item 7. “Management’s Discussion and Analysis of Financial Condition and Results of Operations” and the consolidated financial statements and notes thereto included elsewhere in this annual report on Form 10-K. The consolidated statement of operations data for the years ended December 31, 2013, 20122016, 2015 and 20112014 and the consolidated balance sheet data as of December 31, 20132016 and 20122015 are derived from the audited consolidated financial statements included elsewhere in this annual report on Form 10-K. The consolidated statement of operations data for the years ended December 31, 20102013 and 20092012 and the consolidated balance sheet data as of December 31, 2011, 20102014, 2013 and 20092012 are derived from audited consolidated financial statements that are not included in this annual report on Form 10-K. Results for the year ended December 31, 20132016 are not necessarily indicative of results that may be expected in any other future period.
Between January 1, 20092012 and December 31, 20132016, we acquired 1215 businesses (most notably Wood Mackenzie on May 19, 2015), which may affect the comparability of our consolidated financial statements. The amountsOur consolidated financial statements have been retroactively adjusted in all periods presented to give recognition to the discontinued operations of our heathcare business and mortgage services business. The following table sets forth our statement of operations for the years ended December 31:
| 2013 | 2012 | 2011 | 2010 | 2009 | 2016 | 2015 | 2014 | 2013 | 2012 | |||||||||||||||||||||||||||||
| (In thousands, except for share and per share data) | (In millions, except for share and per share data) | |||||||||||||||||||||||||||||||||||||
| Revenues: | ||||||||||||||||||||||||||||||||||||||
| Decision Analytics | $ | 977,427 | $ | 828,342 | $ | 639,100 | $ | 461,743 | $ | 397,501 | $ | 1,270.9 | $ | 1,072.5 | $ | 780.5 | $ | 705.9 | $ | 605.4 | ||||||||||||||||||
| Risk Assessment | 618,276 | 579,506 | 552,293 | 530,542 | 512,672 | 724.3 | 688.2 | 650.6 | 618.3 | 579.5 | ||||||||||||||||||||||||||||
| Revenues | 1,595,703 | 1,407,848 | 1,191,393 | 992,285 | 910,173 | 1,995.2 | 1,760.7 | 1,431.1 | 1,324.2 | 1,184.9 | ||||||||||||||||||||||||||||
| Expenses: | ||||||||||||||||||||||||||||||||||||||
| Cost of revenues | 622,523 | 516,708 | 440,979 | 376,270 | 413,800 | |||||||||||||||||||||||||||||||||
| Cost of revenues (exclusive of items shown separately below) | 714.4 | 612.0 | 516.0 | 472.5 | 411.5 | |||||||||||||||||||||||||||||||||
| Selling, general and administrative | 228,982 | 220,068 | 199,495 | 157,596 | 154,746 | 301.6 | 278.3 | 187.3 | 186.8 | 183.8 | ||||||||||||||||||||||||||||
| Depreciation and amortization of fixed assets | 66,190 | 46,637 | 40,135 | 35,835 | 34,292 | 119.1 | 96.6 | 65.4 | 49.2 | 36.7 | ||||||||||||||||||||||||||||
| Amortization of intangible assets | 63,741 | 52,207 | 32,985 | 25,202 | 28,402 | 92.5 | 70.4 | 30.1 | 36.2 | 29.1 | ||||||||||||||||||||||||||||
| Acquisition related liabilities adjustment (1) | — | — | (3,364 | ) | (544 | ) | — | |||||||||||||||||||||||||||||||
| Total expenses | 981,436 | 835,620 | 710,230 | 594,359 | 631,240 | 1,227.6 | 1,057.3 | 798.8 | 744.7 | 661.1 | ||||||||||||||||||||||||||||
| Operating income | 614,267 | 572,228 | 481,163 | 397,926 | 278,933 | 767.6 | 703.4 | 632.3 | 579.5 | 523.8 | ||||||||||||||||||||||||||||
| Other income (expense): | ||||||||||||||||||||||||||||||||||||||
| Investment income | 701 | 438 | 193 | 279 | 186 | |||||||||||||||||||||||||||||||||
| Realized (loss) gain on available-for-sale securities, net | (92 | ) | (332 | ) | 686 | 95 | (2,332 | ) | ||||||||||||||||||||||||||||||
| Investment income and others, net | 6.1 | 16.9 | 0.2 | 0.3 | 0.1 | |||||||||||||||||||||||||||||||||
| Gain on derivative instruments | — | 85.2 | — | — | — | |||||||||||||||||||||||||||||||||
| Interest expense | (76,136 | ) | (72,508 | ) | (53,847 | ) | (34,664 | ) | (35,265 | ) | (120.0 | ) | (121.4 | ) | (70.0 | ) | (76.1 | ) | (72.5 | ) | ||||||||||||||||||
| Total other expense, net | (75,527 | ) | (72,402 | ) | (52,968 | ) | (34,290 | ) | (37,411 | ) | (113.9 | ) | (19.3 | ) | (69.8 | ) | (75.8 | ) | (72.4 | ) | ||||||||||||||||||
| Income before income taxes from continuing operations | 538,740 | 499,826 | 428,195 | 363,636 | 241,522 | 653.7 | 684.1 | 562.5 | 503.7 | 451.4 | ||||||||||||||||||||||||||||
| Provision for income taxes | (196,426 | ) | (182,363 | ) | (165,739 | ) | (148,235 | ) | (129,029 | ) | (202.2 | ) | (196.6 | ) | (208.5 | ) | (184.8 | ) | (162.7 | ) | ||||||||||||||||||
| Income from continuing operations | 342,314 | 317,463 | 262,456 | 215,401 | 112,493 | 451.5 | 487.5 | 354.0 | 318.9 | 288.7 | ||||||||||||||||||||||||||||
| Income from discontinued operations, net of tax (2) | 6,066 | 11,679 | 20,302 | 27,151 | 14,121 | |||||||||||||||||||||||||||||||||
| Income from discontinued operations, net of tax (1) | 139.7 | 20.1 | 46.0 | 29.5 | 40.4 | |||||||||||||||||||||||||||||||||
| Net income | $ | 348,380 | $ | 329,142 | $ | 282,758 | $ | 242,552 | $ | 126,614 | $ | 591.2 | $ | 507.6 | $ | 400.0 | $ | 348.4 | $ | 329.1 | ||||||||||||||||||
| Basic net income per share | ||||||||||||||||||||||||||||||||||||||
| Income from continuing operations | $ | 2.04 | $ | 1.91 | $ | 1.58 | $ | 1.21 | $ | 0.64 | $ | 2.68 | $ | 2.95 | $ | 2.14 | $ | 1.90 | $ | 1.74 | ||||||||||||||||||
| Income from discontinued operations | 0.03 | 0.07 | 0.12 | 0.15 | 0.08 | 0.83 | 0.12 | 0.27 | 0.17 | 0.24 | ||||||||||||||||||||||||||||
| Basic net income per share | $ | 2.07 | $ | 1.98 | $ | 1.70 | $ | 1.36 | $ | 0.72 | $ | 3.51 | $ | 3.07 | $ | 2.41 | $ | 2.07 | $ | 1.98 | ||||||||||||||||||
| Diluted net income per share | ||||||||||||||||||||||||||||||||||||||
| Income from continuing operations | $ | 1.99 | $ | 1.85 | $ | 1.51 | $ | 1.16 | $ | 0.62 | $ | 2.64 | $ | 2.89 | $ | 2.10 | $ | 1.85 | $ | 1.68 | ||||||||||||||||||
| Income from discontinued operations | 0.03 | 0.07 | 0.12 | 0.14 | 0.08 | 0.81 | 0.12 | 0.27 | 0.17 | 0.24 | ||||||||||||||||||||||||||||
| Diluted net income per share | $ | 2.02 | $ | 1.92 | $ | 1.63 | $ | 1.30 | $ | 0.70 | $ | 3.45 | $ | 3.01 | $ | 2.37 | $ | 2.02 | $ | 1.92 | ||||||||||||||||||
| Weighted average shares outstanding: | Weighted average shares outstanding: | |||||||||||||||||||||||||||||||||||||
| Basic | 168,031,412 | 165,890,258 | 166,015,238 | 177,733,503 | 174,767,795 | 168,248,304 | 165,090,380 | 165,823,803 | 168,031,412 | 165,890,258 | ||||||||||||||||||||||||||||
| Diluted | 172,276,360 | 171,709,518 | 173,325,110 | 186,394,962 | 182,165,661 | 171,171,572 | 168,451,343 | 169,132,423 | 172,276,360 | 171,709,518 | ||||||||||||||||||||||||||||
The financial operating data below sets forth the information we believe is useful for investors in evaluating our overall financial performance for the years ended December 31:
| 2013 | 2012 | 2011 | 2010 | 2009 | 2016 | 2015 | 2014 | 2013 | 2012 | |||||||||||||||||||||||||||||
| (In thousands) | (In millions) | |||||||||||||||||||||||||||||||||||||
| Other data: | ||||||||||||||||||||||||||||||||||||||
| EBITDA (3): | ||||||||||||||||||||||||||||||||||||||
| EBITDA (2): | ||||||||||||||||||||||||||||||||||||||
| Decision Analytics EBITDA | $ | 413,342 | $ | 379,655 | $ | 305,837 | $ | 240,623 | $ | 162,278 | $ | 835.8 | $ | 647.7 | $ | 489.8 | $ | 413.4 | $ | 379.6 | ||||||||||||||||||
| Risk Assessment EBITDA | 346,931 | 316,260 | 287,050 | 268,817 | 208,791 | 415.5 | 406.5 | 368.8 | 346.9 | 316.3 | ||||||||||||||||||||||||||||
| EBITDA | $ | 760,273 | $ | 695,915 | $ | 592,887 | $ | 509,440 | $ | 371,069 | $ | 1,251.3 | $ | 1,054.2 | $ | 858.6 | $ | 760.3 | $ | 695.9 | The following is a reconciliation of net income to EBITDA: | |||||||||||||||||
| Net income | $ | 348,380 | $ | 329,142 | $ | 282,758 | $ | 242,552 | $ | 126,614 | $ | 591.2 | $ | 507.6 | $ | 400.0 | $ | 348.4 | $ | 329.1 | ||||||||||||||||||
| Depreciation and amortization of fixed and intangible assets from continuing operations | 129,931 | 98,844 | 73,120 | 61,037 | 62,694 | 211.6 | 167.0 | 95.5 | 85.4 | 65.8 | ||||||||||||||||||||||||||||
| Interest expense from continuing operations | 76,136 | 72,508 | 53,847 | 34,664 | 35,265 | 120.0 | 121.4 | 70.0 | 76.1 | 72.5 | ||||||||||||||||||||||||||||
| Provision for income taxes from continuing operations | 196,426 | 182,363 | 165,739 | 148,235 | 129,029 | 202.2 | 196.6 | 208.5 | 184.8 | 162.7 | ||||||||||||||||||||||||||||
| Depreciation, amortization, interest and provision for income taxes from discontinued operations | 9,400 | 13,058 | 17,423 | 22,952 | 17,467 | 126.3 | 61.6 | 84.6 | 65.6 | 65.8 | ||||||||||||||||||||||||||||
| EBITDA | $ | 760,273 | $ | 695,915 | $ | 592,887 | $ | 509,440 | $ | 371,069 | $ | 1,251.3 | $ | 1,054.2 | $ | 858.6 | $ | 760.3 | $ | 695.9 | ||||||||||||||||||
The following table sets forth our consolidated balance sheet data as of the years ended December 31:
| 2013 | 2012 | 2011 | 2010 | 2009 | 2016 | 2015 | 2014 | 2013 | 2012 | |||||||||||||||||||||||||||||
| (In thousands) | (In millions) | |||||||||||||||||||||||||||||||||||||
| Balance Sheet Data: | ||||||||||||||||||||||||||||||||||||||
| Cash and cash equivalents | $ | 165,801 | $ | 89,819 | $ | 191,603 | $ | 54,974 | $ | 71,527 | $ | 135.1 | $ | 138.3 | $ | 39.3 | $ | 165.8 | $ | 89.8 | ||||||||||||||||||
| Total assets | $ | 2,504,451 | $ | 2,360,336 | $ | 1,541,106 | $ | 1,217,090 | $ | 996,953 | $ | 4,631.2 | $ | 5,593.7 | $ | 2,335.1 | $ | 2,492.8 | $ | 2,347.3 | ||||||||||||||||||
| Total debt | $ | 1,275,887 | $ | 1,461,425 | $ | 1,105,886 | $ | 839,543 | $ | 594,169 | $ | 2,387.0 | $ | 3,145.7 | $ | 1,426.7 | $ | 1,264.2 | $ | 1,448.4 | ||||||||||||||||||
| Stockholders’ equity (deficit) (5) | $ | 547,589 | $ | 255,591 | $ | (98,490 | ) | $ | (114,442 | ) | $ | (34,949 | ) | |||||||||||||||||||||||||
| Stockholders’ equity (4) | $ | 1,332.4 | $ | 1,372.0 | $ | 211.0 | $ | 547.6 | $ | 255.6 | ||||||||||||||||||||||||||||
| (1) |
| EBITDA is the financial measure |
Although EBITDA is a non-GAAP financial measure, EBITDA is frequently used by securities analysts, lenders and others in their evaluation of companies, EBITDA has limitations as an analytical tool, and should not be considered in isolation, or as a substitute for an analysis of our results of operations or cash flow from operating activities reported under GAAP. Management uses EBITDA in conjunction with traditional GAAP operating performance measures as part of its overall assessment of company performance. Some of these limitations are:
EBITDA does not reflect our cash expenditures, or future requirements for capital expenditures or contractual commitments;commitments.
| ▪ | EBITDA does not reflect changes in, or cash requirements for, our working capital |
| ▪ | Although depreciation and amortization are non-cash charges, the assets being depreciated and amortized often will have to be replaced in the future and EBITDA does not reflect any cash requirements for such |
| ▪ | Other companies in our industry may calculate EBITDA differently than we do, limiting its usefulness as a comparative measure. |
| Includes capital lease obligations. |
| Subsequent to our corporate reorganization on October 6, 2009, share repurchases are recorded as treasury stock within stockholders’ equity, |
| Item 7. | Management’s Discussion and Analysis of Financial Condition and Results of Operations |
The following discussion should be read in conjunction with our historical financial statements and the related notes included elsewhere in this annual report on Form 10-K, as well as the discussion under “Selected Consolidated Financial Data.” This discussion contains forward-looking statements that involve risks and uncertainties. Our actual results may differ materially from those discussed in or implied by any of the forward-looking statements as a result of various factors, including but not limited to those listed under “Risk Factors” and “Special Note Regarding Forward-Looking Statements.”
We enable risk-bearing businessesour customers to make better understanddecisions about risk, investments, and manage their risksoperations with greater precision, efficiency, and opportunities associated with those risks.discipline. We also help customers across the globe protect and grow the value of people, property and financial assets. We provide value to our customers by supplying proprietary data that, combined with our analytic methods, creates embedded decision support solutions. We are one of the largest aggregatoraggregators and providerproviders of data pertaining to U.S. property and casualty, or P&C, insurance risks. We offer predictive analytics and decision support solutions to customers in rating, underwriting, claims, catastrophe and weather risk, global risk analytics, natural resources intelligence, and many other fields. Refer to Item 1. Business for detecting fraud in the U.S. P&C insurance, financial services and healthcare industries and sophisticated methods to predict and quantify loss in diverse contexts ranging from natural catastrophes to supply chain to health insurance.further discussion.
Our customers use our solutions to make better risk decisions with greater efficiency and discipline. We refer to these products and services as “solutions” due to the integration among our products and the flexibility that enables our customers to purchase components or the comprehensive package of products. These solutions take various forms, including data, statistical models or tailored analytics, all designed to allow our clientscustomers to make more logical decisions. We believe our solutions for analyzing risk positively impact our customers’ revenues and help them better manage their costs.
We organize our business in two segments: Risk Assessment and Decision Analytics. Our Risk Assessment segment provides statistical, actuarial and underwriting data for the U.S. P&C insurance industry. Our Risk Assessment segment revenues represented approximately 38.7%36.3% and 41.2%39.1% of our revenues for the years ended December 31, 20132016 and 2012,2015, respectively. Effective December 31, 2012, we combined the statistical agency and data services and actuarial services into industry-standard insurance programs within our Risk Assessment segment. Our Decision Analytics segment provides solutions to our customers use
On June 1, 2016 and March 11, 2014, we entered into an agreement to acquire 100% of the stock of Eagleview Technology Corporation (“EVT”), the parent company of Pictometry International Corp.,sold our healthcare business, Verisk Health, and Eagle View Technologies, Inc. for a net cash purchase price of $650 million, which will be funded by the Company's operating cash and borrowings from our credit facility. EVT is a provider of geo-referenced aerial image capture and visual-centric data analytics and solutions to insurers, contractors, government, and commercial customers in the United States. This acquisition is expected to advance our position in the imagery analytics market, adding new municipal and commercial customers. The transaction is expected to support the aerial imagery solution development in our Decision Analytics segment. The parties expect the transaction to close by July 2014, subject to the completion of customary closing conditions, including receipt of regulatory and shareholder approvals. Once the acquisition is completed, we plan to include EVT in the insurance vertical of our Decision Analytics segment.
Executive Summary
Key Performance Metrics
We believe our business’s ability to generategrow recurring revenue and generate positive cash flow is the key indicator of the successful execution of our business strategy. We use year over yearyear-over-year revenue growth and EBITDA margingrowth as metrics to measure our performance. EBITDA and EBITDA margin are non-GAAP financial measures (see Note 3.2 within Item 6. Selected Financial Data section of Management’s Discussion and Analysis of Financial Condition and Results of Operations). The respective GAAP financial measures are net income and net income margin.
Revenue growth. We use year over yearyear-over-year revenue growth as a key performance metric. We assess revenue growth based on our ability to generate increased revenue through increased sales to existing customers, sales to new customers, sales of new or expanded solutions to existing and new customers, and strategic acquisitions of new businesses.
EBITDA growth. We use EBITDA growth as a proxy for the cash generated by the business. EBITDA growth serves as a measure of our ability to balance the size of revenue growth with cost management and investing for future growth.
EBITDA margin. We use EBITDA margin as a metric to assess segment performance and scalability of our business. We assess EBITDA margin based on our ability to increase revenues while controlling expense growth.
Revenues
We earn revenues through subscriptions, long-term agreements and on a transactional basis.basis, recurring and non-recurring. Subscriptions for our solutions are generally paid in advance of rendering services either quarterly or in full upon commencement of the subscription period, which is usually for one year and automatically renewed each year. As a result, the timing of our cash flows generally precedes our recognition of revenues and income and our cash flow from operations tends to be higher in the first quarter as we receive subscription payments. Examples of these arrangements include subscriptions that allow our customers to access our standardized coverage language, our claims fraud database or our actuarial services throughout the subscription period. In general, we experience minimal revenue seasonality within the business. Our long-term agreements are generally for periods of three to five years. We recognize revenue from subscriptions ratably over the term of the subscription and most long-term agreements are recognized ratably over the term of the agreement.
Certain of our solutions are also paid for by our customers on a transactional basis. For example, we have solutions that allow our customers to obtain property-specific rating and underwriting information to price a policy on a commercial building, or compare a P&C insurance, medical or workers’ compensation claim with information in our databases. We also provide advisory services, which help our customers get more value out of our analytics and their subscriptions. For the years ended December 31, 20132016 and 2012, 26.4%2015, 16.5% and 27.6%17.2% of our revenues respectively, were derived from providing transactional solutions.
recurring and non-recurring solutions, respectively. We earn transactionalthese revenues as our solutions are delivered or services performed. In general, transactionsthey are billed monthly at the end of each month.
Principal Operating Costs and Expenses
Personnel expenses are thea major component of both our cost of revenues and selling, general and administrative expenses. Personnel expenses, which represented 59.7%47.7% and 62.6%46.5% of our total expenses for the years ended December 31, 20132016 and 2012,2015, respectively, include salaries, benefits, incentive compensation, equity compensation costs, sales commissions, employment taxes, recruiting costs, and outsourced temporary agency costs.
We allocate personnel expenses between two categories, cost of revenues and selling, general and administrative costs, based on the actual costs associated with each employee. We categorize employees who maintain our solutions as cost of revenues, and all other personnel, including executive managers, sales people, marketing, business development, finance, legal, human resources, and administrative services, as selling, general and administrative expenses. A significant portion of our other operating costs, such as facilities and communications, are also either captured within cost of revenues or selling, general and administrative expense based on the nature of the work being performed.
While we expect to grow our headcount over time to take advantage of our market opportunities, we believe that the economies of scale in our operating model will allow us to grow our personnel expenses at a lower rate than revenues.
Historically, our EBITDA margin has improved because we have been able to increase revenues without a proportionate corresponding increase in expenses. However, part of our corporate strategy is to invest in new solutions, which may offset margin expansion.
Cost of Revenues. Our cost of revenues consists primarily of personnel expenses. Cost of revenues also includes the expenses associated with the acquisition and verification of data, the maintenance of our existing solutions and the development and enhancement of our next-generation solutions. Our cost of revenues excludes depreciation and amortization.
Selling, General and Administrative Expense. Our selling, general and administrative expense also consists primarily of personnel costs. A portion of the other operating costs such as facilities, insurance and communications are also allocated to selling, general and administrative costs based on the nature of the work being performed by the employee. Our selling, general and administrative expenses excludes depreciation and amortization.
Trends Affecting Our Business
We serve customers in three primary vertical markets: property/casualtyP&C insurance, healthcare,energy, and financial services. The industry trends in each of those markets can affect our business.
A significant change in P&C insurers’ profitability could affect the demand for our solutions. For insurers, the keys to profitability include investment income and premium growth. Investment income remains under pressure as a result of low interest rates. Growth in property/casualtyP&C insurers’ direct written premiums is cyclical, with total industry premium growth receding from a peak of 14.7%14.8% in 2002 to a trough of negative 3.1% in 2009 and subsequently recovering to 4.4% in 2012, 4.3% in 2013, 4.4% in 2014 and 4.1% through nine-months 2013.3.7% in 2015. Based on reportsour experience, insurers more closely scrutinize their spending in periods of firming in insurance markets, and assuming modest growth in the economy,more challenging growth. In recent years, we expect premium growth near recent rates through 2014. Growth or decline in premiums for the lines of insurance for which we perform services could positively or negatively affect our revenues, because premium growth can affect the volume of solutions as well as the number and types of solutions our customers buy. Also, we link the invoices of certain solutions in part to an individual customer’s premiums from prior years for a portion of our customers. The pricing for those solutions is fixed at the beginning of each calendar year. We have also signed multiyearmulti-year contracts with certain customers, and for those customers, pricing is fixed at the beginning of each multiyear period.multi-year period; pricing for other customers is still linked to prior years' premiums.
Trends in catastrophe and noncatastrophenon-catastrophe weather losses can have an effect on our customers’ profitability, and therefore, their appetite for buying analytics to help them manage their risks. The apparentAny increase or decrease in the frequency andor severity of weather events that cause losses for insurersover time could lead to an increased or decreased demand for our catastrophe modeling, catastrophe loss information, and repair cost solutions. A significant decreaseLikewise, any structural changes in the numberreinsurance and related brokerage industry from the recent influx of alternative capital or severity of catastrophesnewer technologies could negatively affect demand for our revenues.products. We also have a portion of our revenue related to the number of claims processed due to losses, which can be impacted by seasonal storm activity.
The need by our customers to fight insurance fraud —- both in claims and at policy inception —- could lead to increased demand for our underwriting and claims solutions. Additionally,
Trends in the energy, chemicals, and metals and mining sectors and activity in financial markets can influence our revenues. Movements of commodity prices affect the profitability of our customers, which include energy, chemicals, and metals and mining companies, while stock markets and mergers and acquisitions, or M&A, are some of the principal drivers affecting our financial institution customers. Among the trends influencing commodity prices are supply and demand factors, regulatory requirements, fiscal impacts, regional market structures, and geopolitical risks. Following the Organization of the Petroleum Exporting Countries, or OPEC, meeting in November 2016, oil prices have begun to recover indicating an uplift across the energy sector. After a significant changeprolonged slump in insurers’ profitability could positively or negatively affectthe metals and mining sector, there are emerging signs of optimism in the copper, aluminum and lithium markets among others. M&A activity is also beginning to improve with high profile asset sales from Shell, Total, and BP among others. In addition, we have seen some large investments being made, notably the Glencore and Qatar deal with Rosneft, and the separate GE-Baker Hughes proposed transaction. Furthermore, Wood Mackenzie expects final investment decisions in the oil and gas sector to significantly increase in 2017, albeit from recent lows. However, volatility in commodity prices means uncertainty for our customers, which can impact their demand for our solutions.
Market trends continue to influence our financial services vertical in important ways. Most notable among the recent trends affecting the vertical includes a significant increase in the Decision Analytics segment. That marketnumber of alternative lenders and alternative payment instruments in the market. We are adapting our offerings to address the needs of alternative lenders, backed by our deep expertise and datasets covering the performance of customers across a full range of credit histories. As well, our unique ability to analyze the customer adoption rates of new alternative payment instruments from our syndicated study datasets is undergoing significant changeenabling us to serve as the result“go to” solution for the industry’s analytic needs in the space. A strengthening of healthcare reform legislation. The specific trendsthe U.S. dollar relative to the currencies of our international customers and a softening of the global economy is putting an even greater level of
downward pressure on our revenues from such customers. However, we see affecting our current healthcare business include payment reform, expansion of insurance coverage, and efforts at cost containment. Payment reform will likely drive the market to value-based reimbursement and require healthcare providers to bear increased financial risk and responsibility for quality outcomes. The expansion of insurance eligibility will increase Medicaid rolls and promote participation in statewide health exchanges. And as the government seeks to control fraud, waste, and abuse, efforts to contain costs will likely become more prevalent. Although such changes have the potential to disrupt the healthcare marketplace, we believe the requirements for reform could increase demandare also observing a growing appetite for our analyticexpense-focused solutions and regulatory-focused solutions among those customers. Lastly, we are seeing a greater number of companies entering the media effectiveness space, which encourages potential competitors to challenge our position in the areas of population management, quality measurement, Medicare Advantage revenue management and compliance, risk adjustment, and detection of prepayment fraud and abuse.this space. We experience seasonality in our Medicare Advantage business tied to third and fourth quartersstand confident of our fiscal year, relatedposition at this stage, given the unique nature and strength of our partnerships coupled by the comprehensiveness of our data, particularly as it relates to CMS deadlines.seeing the full wallet spend of a consumer.
Description of Acquisitions
We acquired sixtwelve businesses since January 1, 2011. As a result2014. These acquisitions affect the comparability of these acquisitions, our consolidated results of operations may not be comparable between periods.
On December 20, 2012,November 23, 2016, we acquired the net assets of InsuranceIntelliStance, LLC, or MarketStance, a provider of market intelligence data and analytics to the property/casualty insurance market. MarketStance has become part of ISO within the Risk Management Solutions,Assessment segment. MarketStance has built a proprietary analytics model to provide actionable insights on customer's profitability and that enhances our offerings. See Note 9 to our consolidated financial statements included in this annual report on Form 10-K for further discussions.
On November 11, 2016, we acquired 100 percent of the stock of The GeoInformation Group Limited, or IRMS. IRMS provided integrated propertyGeoInformation, a provider of geographic data solutions. GeoInformation offers mapping services and geospatial data and analytic solutions to companies and public sector organizations. GeoInformation's resources complement the risk assessment technology underlying onemanagement and predictive analytics capabilities internationally within the Risk Assessment segment. See Note 9 to our consolidated financial statements included in this annual report on Form 10-K for further discussions.
On October 20, 2016, we acquired 100 percent of the stock of Analyze Re, Inc., or Analyze Re, a software analytics provider for the reinsurance and insurance industries. Analyze Re has become part of our GIS (geographic information system) underwriting solutions. Atinsurance vertical within the end of 2012,Decision Analytics segment and enables us to provide our customers with additional real-time pricing, exposure management, and enterprise portfolio roll-up capabilities. See Note 9 to our consolidated financial statements included in this long-term contract (since 1992) with IRMS was expiring and precipitated a change in our business relationship. Instead of continuing forward with a new services agreement,annual report on Form 10-K for further discussions.
On August 19, 2016, we acquired the technology and servicenet assets of IRMS as this will enable usdata and subscriptions business of Quest Offshore Resources, Inc, or Quest Offshore, which supplies market intelligence to better manage, enhancethe offshore oil and continue to use the solutions asgas sector. The data and subscriptions business has become part of Wood Mackenzie within the Decision Analytics segment and complements its existing upstream analysis expertise. See Note 9 to our consolidated financial statements included in this annual report on Form 10-K for further discussions.
On July 26, 2016,we acquired 100 percent of the stock of Greentech Media, Inc., or Greentech Media, an information services provider for the electricity and renewables sector. Greentech Media has become part of Wood Mackenzie within the Decision Analytics segment and enables Wood Mackenzie to provide its customers with market intelligence across several categories, including solar generation, energy storage, and smart grids that react to changes in supply and demand. See Note 9 to our consolidated financial statements included in this annual report on Form 10-K for further discussions.
On April 14, 2016, we acquired 100 percent of the stock of Risk Intelligence Ireland Limited, or RII, a provider of fraud detection, compliance, risk control, and process automation services to the Irish insurance industry. RII enhances the ability of the Company's Risk Assessment segment. This acquisition had minimal revenue and operating expense impactsegment to serve the international insurance market. See Note 9 to our consolidated financial statements included in this annual report on Form 10-K for the year ending December 31, 2012, given the timingfurther discussions.
On November 20, 2015, we acquired 100 percent of the acquisition.stock of The PCI Group, or PCI. PCI is a consortium of five specialist companies that offer integrated data and subscriptions research in the chemicals, fibers, films, and plastics sectors. PCI has become part of Wood Mackenzie, and continues to provide services to enhance Wood Mackenzie's chemicals capabilities in the Decision Analytics segment. See Note 9.9 to our consolidated financial statements included in this annual report on Form 10-K for the preliminaryfinal purchase allocation.price allocations.
On August 31, 2012,November 6, 2015, we acquired Argus Information & Advisory Services, LLC,100 percent of the stock of Infield Systems Limited, or Argus,Infield. Infield is a provider of information, competitive benchmarking, scoring solutions, analytics,business intelligence, analysis, and customizedresearch to the oil, gas, and associated marine industries. Infield has become part of Wood Mackenzie and continues to provide services to financial institutionsenhance Wood Mackenzie's upstream and regulatorssupply chain capabilities in North America, Latin America, and Europe. Argus leverages its comprehensive payment data sets and provides proprietary solutions to a client base that includes credit and debit card issuers, retail banks and other consumer financial services providers, payment processors, insurance companies, and other industry stakeholders. Within ourthe Decision Analytics segment, this acquisition enhances our position as a provider of data, analytics, and decision-support solutions to financial institutions globally.segment. See Note 9.9 to our consolidated financial statements included in this annual report on Form 10-K for the preliminaryfinal purchase allocation.price allocations.
On July 2, 2012,May 19, 2015, we acquired 100 percent of the net assetsstock of Aspect Loss Prevention, LLC, or ALP,Wood Mackenzie. Wood Mackenzie is a provider of loss prevention and analytic solutions to the retail, entertainment, and food industries. Within our Decision Analytics segment, this acquisition further advances our position as aglobal provider of data crime analytics and decision-support solutions.commercial intelligence for the energy, chemicals, metals and mining verticals. This acquisition advances our strategy to expand internationally and positions ourselves in the global energy market. Wood Mackenzie is included in the energy and specialized markets vertical, formerly named the specialized markets vertical, of the Decision Analytics segment. See Note 9.9 to our consolidated financial statements included in this annual report on Form 10-K for the preliminaryfinal purchase allocation.price allocations.
On March 30, 2012,December 8, 2014, we acquired 100%100 percent of the stock of MediConnect Global, Inc., or MediConnect,Maplecroft. Using a service providerproprietary data aggregation and analytical approach, Maplecroft enables its customers to assess, monitor, and forecast a growing range of medical record retrieval, digitization, coding, extraction,worldwide risks, including geopolitical and analysis.societal risks. Within our Decision Analytics segment, MediConnect further supports our objective to be the leadingthis acquisition positions us as a provider of data,value chain optimization tools, providing comprehensive quantitative risk analytics and decision-support solutions to the healthcareplatforms by which customers can visualize, quantify, mitigate, and property casualty industries.manage their risk. Maplecroft is headquartered in Bath, England. See Note 9.9 to our consolidated financial statements included in this annual report on Form 10-K for the preliminary purchase allocation.further discussions.
On June 17, 2011,October 31, 2014, we acquired the net assets of Health Risk Partners, LLC,Dart Consulting Limited, or HRP,Dart. Dart is a provider of benchmarking and advisory solutions to optimize revenue, improve compliancefinancial services institutions in Australia, New Zealand, and improve qualityother key Asia-Pacific markets. As part of care for Medicare Advantage health plans. Within our Decision Analytics segment, this acquisition further advances our position as a major providerDart provides benchmarking solutions and professional services critical to financial services institutions in the management of data, analytics,lending and decision-support solutions to the healthcare industry.payment portfolios.
On April 27, 2011,January 29, 2014, we acquired 100%the net assets of the common stockInovatus, LLC, or Inovatus. The assets primarily consisted of Bloodhound Technologies, Inc. or Bloodhound, a provider of real-time pre-adjudication medical claims editing. Withinsoftware and are embedded in our existing models focusing on reducing fraud and premium leakage for personal auto insurance carriers. The technology is included in our Decision Analytics segment Bloodhound addresses the needas part of healthcare payersits solutions to control fraudleverage data and waste in a real-time claims-processing environment, and these capabilities align with our existing fraud identification tools.analytics to help insurance companies improve results.
Description of Discontinued Operations
Year Ended December 31, 20132016 Compared to Year Ended December 31, 20122015
Consolidated Results of Continuing Operations
Revenues
Revenues were $1,595.7$1,995.2 million for the year ended December 31, 20132016 compared to $1,407.8$1,760.7 million for the year ended December 31, 2012,2015, an increase of $187.9$234.5 million or 13.3%. In 2012, we acquired MediConnect, ALP,Excluding revenues of $151.0 million from Wood Mackenzie (for the first and Argus,second quarters), Infield, PCI, RII, Greentech Media, Quest Offshore, Analyze Re, GeoInformation, and MarketStance, collectively referred to as our recent acquisitions, which we define as acquisitions not owned for a significant portion of both the current period and/our revenue growth was $83.5 million or prior period and would therefore impact the comparability of the financial results. MediConnect was included as a recent acquisition only for the first quarter of 2013; ALP was included as a recent acquisition in the first and second quarters of 2013; Argus was included as a recent acquisition in the first, second and third quarters of 2013 as full quarter comparable revenues did not exist until certain quarters of 2012 due to the timing of the acquisitions.
Cost of Revenues
Cost of revenues was $622.5$714.4 million for the year ended December 31, 20132016 compared to $516.7$612.0 million for the year ended December 31, 2012,2015, an increase of $105.8$102.4 million or 20.5% 16.7%. RecentOur recent acquisitions all within the Decision Analytics segment, accounted for an increase of $36.8$56.1 million in cost of revenues, for the year ended December 31, 2013 which were primarily related to salaries and employee benefits. Excluding the impact of our recent acquisitions, our cost of revenues increased $69.0$46.3 million or 13.4%7.8%. The increase was primarily due to increases in salaries and employee benefits cost of $36.6$27.2 million and an ESOP charge of $14.5 million. Other increases include information technology expense of $5.3 million and data costs and data processing fees of $17.7 million, information technology expense of $7.4 million, travel and travel related costs of $3.2 million and$0.9 million. These increases were offset by a decrease in other operating costs of $4.1$1.6 million.
Selling, General and Administrative Expenses
Selling, general and administrative expenses, or SGA, were $229.0$301.6 million for the year ended December 31, 20132016 compared to $220.1$278.3 million for the year ended December 31, 2012,2015, an increase of $8.9$23.3 million or 4.1%8.3%. RecentOur recent acquisitions accounted for an increase of $3.8$12.2 million which wasin SGA, primarily related to professional fees.salaries and employee benefits. Excluding costs associated withthe impact of our recent acquisitions, SGA increased $5.1$11.1 million or 2.3%4.5%. The increase was primarily due to an increaseincreases in professional fees of $3.0 million, travel and travel related items of $0.8 million, salaries and employee benefits of $0.7$5.6 million, an ESOP charge of $4.3 million, and professional consulting fees of $3.0 million. These increases were offset by a decrease in information technology expense of $0.9 million and other general and administrative expenses of $0.6$0.9 million.
Depreciation and Amortization of Fixed Assets
Depreciation and amortization of fixed assets was $66.2$119.1 million for the year ended December 31, 20132016 compared to $46.6$96.6 million for the year ended December 31, 2012,2015, an increase of $19.6$22.5 million or 41.9%23.2%. DepreciationThe increase in depreciation and amortization of fixed assets includes depreciation and amortization related to our recent acquisitions of furniture and equipment, software, computer$11.3 million. The remaining increase primarily relates to hardware and related equipment. The majority of the increase relates to software and hardwaredevelopment costs placed into production to support data capacity expansion and revenue growth.
Amortization of Intangible Assets
Amortization of intangible assets was $63.7$92.5 million for the year ended December 31, 20132016 compared to $52.2$70.4 million for the year ended December 31, 2012,2015, an increase of $11.5$22.1 million or 22.1%31.2%. The increase in amortization of intangible assets was primarily related to amortization of intangible assets associated withour recent acquisitions of $16.0 million, partially offset by $4.5 million of amortization of intangible assets associated with prior acquisitions that have been fully amortized.$20.1 million.
Investment Income and Realized (Loss) Gain on Securities,Others, Net
Investment income and realized gain on securities,others, net was a gain of $0.6$6.1 million for the year ended December 31, 2013 as2016 compared to a gain of $0.1$16.9 million for the year ended December 31, 2012, an increase2015, a decrease of $0.5$10.8 million. The decrease was primarily related to a gain of $15.6 million in connection with the exercise and payout of common stock warrants for the year ended December 31, 2015. This decrease was partially offset by increases attributable to interest income of $6.5 million generated from the subordinated promissory note related to the divestiture of our healthcare business.
Gain on Derivative Instruments
Gain on derivative instruments decreased $85.2 million or 100% due to a one-time foreign currency hedge gain realized in 2015 relating to the acquisition of Wood Mackenzie, which did not recur in 2016.
Interest Expense
Interest expense was $76.1$120.0 million for the year ended December 31, 20132016 compared to $72.5$121.4 million for the year ended December 31, 2012, an increase2015, a decrease of $3.6$1.4 million or 5.0%1.1%. This increaseThe decrease is primarily due to the issuancenet payments of our senior notes in September 2012 with an aggregate principal balancecredit facility of $350.0$770.0 million partially offsetmostly funded by the repaymentnet proceeds from the divestiture of $180.0 million of private placement debt during the year.our healthcare business.
Provision for Income Taxes
The provision for income taxes was $196.4$202.2 million for the year ended December 31, 20132016 compared to $182.4$196.6 million for the year ended December 31, 2012,2015, an increase of $14.0$5.6 million or 7.7%2.8%. The effective tax rate was 36.5%30.9% for the year ended December 31, 20132016 compared to 36.5%28.7% for the year ended December 31, 20122015.
Net Income
The net income margin for our consolidated results, including discontinued operations, was 28.1% for the year ended December 31, 2016 compared to 24.5% for the year ended December 31, 2015. Our net income margin for the year ended December 31, 2016 was positively impacted by the discontinued operations, including the gain on sale of our healthcare business of 5.5% and lowered by an ESOP charge of 0.6%. Our net income margin for the year ended December 31, 2015 was lowered by the discontinued operations of 3.2% and positively impacted by the derivative gain and the transaction costs related to the Wood Mackenzie acquisition and the gain on the exercise and payout of the common stock warrants of 3.2%.
EBITDA Margin
The EBITDA margin for our consolidated results, including discontinued operations, was 44.6%59.4% for the year ended December 31, 20132016 compared to 45.4%51.0% for the year ended December 31, 2012. For2015. Our EBITDA margin for the year ended December 31, 20132016 was positively impacted by the discontinued operations, including the gain on sale of our healthcare
business, of 10.0%, which was partially offset by the recent acquisitions mitigated ourimpacts from an ESOP charge of 0.9%. Our EBITDA margin expansionfor the year ended December 31, 2015 was lowered by 0.2%the discontinued operations of 4.2% and positively impacted by the derivative gain and the transaction costs related to the Wood Mackenzie acquisition and the warrant exercise of 3.6%.
Amortization of our mortgage services business, whichIntangible Assets
Amortization of intangible assets was part of our financial services vertical.
| 2013 | 2012 | Percentage Change | ||||||||
| (In thousands) | ||||||||||
| Insurance | $ | 539,150 | $ | 493,456 | 9.3 | % | ||||
| Financial services | 81,113 | 26,567 | 205.3 | % | ||||||
| Healthcare | 271,538 | 222,955 | 21.8 | % | ||||||
| Specialized markets | 85,626 | 85,364 | 0.3 | % | ||||||
| Total Decision Analytics | $ | 977,427 | $ | 828,342 | 18.0 | % | ||||
Investment Income and Others, Net
Investment income and others, net was a gain of revenues increased by $56.9 million or 17.1%. This increase is primarily due to a net increase in salary and employee benefits of $30.6 million. Other increases include data costs and data processing fees of $16.7 million, information technology expenses of $4.7 million, travel and travel related costs of $1.3 million, and other general expenses of $3.6 million.
| 2013 | 2012 | Percentage Change | ||||||||
| (In thousands) | ||||||||||
| Industry-standard insurance programs | $ | 471,130 | $ | 450,646 | 4.5 | % | ||||
| Property-specific rating and underwriting information | 147,146 | 128,860 | 14.2 | % | ||||||
| Total Risk Assessment | $ | 618,276 | $ | 579,506 | 6.7 | % | ||||
Net Income
The net income margin for our consolidated results, including discontinued operations, was 28.1% for the year ended December 31, 2016 compared to 24.5% for the year ended December 31, 2015. Our net income margin for the year ended December 31, 2016 was positively impacted by the discontinued operations, including the gain on sale of our healthcare business of 5.5% and employee benefits of $6.2 million, primarily related our stock option expense. Our stock option expense decreased as a result of lower accelerated vesting of equity awards granted to employees at age 62. There was also a decrease in other general expenses of $0.2 million. These decreases were offsetlowered by an increase in professional consulting feesESOP charge of $2.5 million0.6%. Our net income margin for the year ended December 31, 2015 was lowered by the discontinued operations of 3.2% and travelpositively impacted by the derivative gain and the transaction costs related to the Wood Mackenzie acquisition and the gain on the exercise and payout of $0.4 million.the common stock warrants of 3.2%.
EBITDA Margin
The EBITDA margin for our Risk Assessment segmentconsolidated results, including discontinued operations, was 56.1%59.4% for the year ended December 31, 20132016 compared to 54.6%51.0% for the year ended December 31, 2012. The increase in2015. Our EBITDA margin is primarily attributed to operating leverage in the segment as well as cost efficiencies.
business, of 10.0%, which includedwas partially offset by the impacts from an increase in our Decision Analytics segmentESOP charge of $84.1 million or 13.2% and an increase in our Risk Assessment segment of $27.2 million or 4.9%0.9%. Revenue growth within Decision Analytics was primarily driven by strong increases in our healthcare revenue category and contributions from our insurance revenue category. Revenue growth within Risk Assessment was primarily driven by our industry-standard insurance programs. Refer to the Results of Continuing Operations by Segment within this section for further information regarding our revenues.
Depreciation and Amortization of Fixed Assets
Depreciation and amortization of fixed assets was $46.6$119.1 million for the year ended December 31, 20122016 compared to $40.1$96.6 million for the year ended December 31, 2011,2015, an increase of $22.5 million or 23.2%. The increase in depreciation and amortization of fixed assets includes depreciation and amortization related to our recent acquisitions of $11.3 million. The remaining increase primarily relates to hardware and software development costs placed into production to support data capacity expansion and revenue growth.
Amortization of Intangible Assets
Amortization of intangible assets was $92.5 million for the year ended December 31, 2016 compared to $70.4 million for the year ended December 31, 2015, an increase of $22.1 million or 31.2%. The increase in amortization of intangible assets was primarily related to our recent acquisitions of $20.1 million.
Investment Income and Others, Net
Investment income and others, net was a gain of $6.1 million for the year ended December 31, 2016 compared to $16.9 million for the year ended December 31, 2015, a decrease of $10.8 million. The decrease was primarily related to a gain of $15.6 million in connection with the exercise and payout of common stock warrants for the year ended December 31, 2015. This decrease was partially offset by increases attributable to interest income of $6.5 million generated from the subordinated promissory note related to the divestiture of our healthcare business.
Gain on Derivative Instruments
Gain on derivative instruments decreased $85.2 million or 16.2%100% due to a one-time foreign currency hedge gain realized in 2015 relating to the acquisition of Wood Mackenzie, which did not recur in 2016.
Interest Expense
Interest expense was $120.0 million for the year ended December 31, 2016 compared to $121.4 million for the year ended December 31, 2015, a decrease of $1.4 million or 1.1%. The decrease is primarily due to the net payments of our credit facility of $770.0 million mostly funded by the net proceeds from the divestiture of our healthcare business.
Provision for Income Taxes
The provision for income taxes was $202.2 million for the year ended December 31, 2016 compared to $196.6 million for the year ended December 31, 2015, an increase of $5.6 million or 2.8%. The effective tax rate was 30.9% for the year ended December 31, 2016 compared to 28.7% for the year ended December 31, 2015.
Net Income
The net income margin for our consolidated results, including discontinued operations, was 28.1% for the year ended December 31, 2016 compared to 24.5% for the year ended December 31, 2015. Our net income margin for the year ended December 31, 2016 was positively impacted by the discontinued operations, including the gain on sale of our healthcare business of 5.5% and lowered by an ESOP charge of 0.6%. Our net income margin for the year ended December 31, 2015 was lowered by the discontinued operations of 3.2% and positively impacted by the derivative gain and the transaction costs related to the Wood Mackenzie acquisition and the gain on the exercise and payout of the common stock warrants of 3.2%.
EBITDA
The EBITDA margin for our consolidated results, including discontinued operations, was 59.4% for the year ended December 31, 2016 compared to 51.0% for the year ended December 31, 2015. Our EBITDA margin for the year ended December 31, 2016 was positively impacted by the discontinued operations, including the gain on sale of our healthcare
business, of 10.0%, which was partially offset by the impacts from an ESOP charge of 0.9%. Our EBITDA margin for the year ended December 31, 2015 was lowered by the discontinued operations of 4.2% and positively impacted by the derivative gain and the transaction costs related to the Wood Mackenzie acquisition and the warrant exercise of 3.6%.
Results of Continuing Operations by Segment
Decision Analytics
Revenues
Revenues for our Decision Analytics segment were $1,270.9 million for the year ended December 31, 2016 compared to $1,072.5 million for the year ended December 31, 2015, an increase of $198.4 million or 18.5% . Excluding revenues of $149.1 million from Wood Mackenzie (for the first and second quarters) and our recent acquisitions of Infield, PCI, Greentech Media, Quest Offshore, and Analyze Re, Decision Analytics revenues increased $49.3 million or 4.8%.
Our revenue by category for the periods presented is set forth below for the years ended December 31:
| 2016 | 2015 | Percentage Change | ||||||||
| (In millions) | ||||||||||
| Insurance | $ | 699.8 | $ | 647.2 | 8.1 | % | ||||
| Energy and specialized markets | 442.8 | 308.8 | 43.4 | % | ||||||
| Financial services | 128.3 | 116.5 | 10.1 | % | ||||||
| Total Decision Analytics | $ | 1,270.9 | $ | 1,072.5 | 18.5 | % | ||||
Our insurance revenue increased $52.6 million or 8.1%. Excluding revenues of $0.5 million from our recent acquisition, our insurance revenue increased $52.1 million or 8.1%. The increase was primarily due to an increase within our loss quantification solutions, underwriting solutions, insurance anti-fraud claims revenue, and catastrophe modeling services.
Our energy and specialized markets revenue increased $134.0 million or 43.4%. Excluding revenues of $148.6 million from Wood Mackenzie (for the first and second quarters) and our recent acquisitions of Infield, PCI, Greentech Media, and Quest Offshore, our energy and specialized markets revenue decreased $14.6 million or 5.5% due to the continuing end-market and currency headwinds affecting the energy business and declines in our environmental health and safety services.
Our financial services revenue increased $11.8 million or 10.1%, primarily due to the continued demand for our media effectiveness services and analytic solutions.
Cost of Revenues
Cost of revenues for our Decision Analytics segment was $490.7 million for the year ended December 31, 2016 compared to $412.0 million for the year ended December 31, 2015, an increase of $78.7 million or 19.1%. Our recent acquisitions within the Decision Analytics segment represented an increase of $54.8 million in cost of revenues, which was primarily related to salaries and employee benefits. Excluding the impact of our recent acquisitions, our cost of revenues increased $23.9 million or 6.1%. The increase was primarily due to increases in salaries and employee benefits of $16.9 million, an ESOP charge of $6.2 million, and information technology expense of $4.2 million. These increases were offset by decreases in data costs and data processing fees of $0.2 million and other operating costs of $3.2 million.
Selling, General and Administrative Expenses
Selling, general and administrative expenses for our Decision Analytics segment were $214.9 million for the year ended December 31, 2016 compared to $196.5 million for the year ended December 31, 2015, an increase of $18.4 million or 9.4%. Our recent acquisitions within the Decision Analytics segment, accounted for an increase of $11.5 million in SGA, which was primarily related to salaries and employee benefits. Excluding costs associated with our recent acquisitions, SGA increased $6.9 million or 4.2%. The increase was primarily due to increases in salaries and employee benefits of $6.8 million, an ESOP charge of $1.9 million, and professional consulting fees of $1.4 million. These increases were offset by decreases in information technology expense of $1.3 million and other general expenses of $1.9 million.
EBITDA
The EBITDA margin for our Decision Analytics segment, including our discontinued operations, was 60.4% for the year ended December 31, 2016 and 46.9% for the year ended December 31, 2015. Our EBITDA margin for the year ended December 31, 2016 was positively impacted by the discontinued operations, including the gain on sale of our healthcare business, of 15.6%, which was partially offset by the impact from an ESOP charge of 0.6%. The non-recurring derivative gain, net of transaction costs related to the Wood Mackenzie acquisition and the warrant exercise and payout, positively impacted our EBITDA margin by 5.4%, which was offset by the impact from the discontinued operations of 5.9% for year ended December 31, 2015.
Risk Assessment
Revenues
Revenues for our Risk Assessment segment were $724.3 million for the year ended December 31, 2016 compared to $688.2 million for the year ended December 31, 2015, an increase of $36.1 million or 5.2%. Excluding revenues of $1.9 million from our recent acquisitions of RII, GeoInformation and MarketStance, revenues for our Risk Assessment increased $34.2 million or 5.0% for the year ended December 31, 2016. Revenue growth within this segment primarily resulted from an increase in prices derived from continued enhancements to the content of the solutions within our industry-standard insurance programs as well as selling expanded solutions to existing customers.
Our revenue by category for the periods presented is set forth below for the years ended December 31:
| 2016 | 2015 | Percentage Change | ||||||||
| (In millions) | ||||||||||
| Industry-standard insurance programs | $ | 554.1 | $ | 524.6 | 5.6 | % | ||||
| Property-specific rating and underwriting information | 170.2 | 163.6 | 4.0 | % | ||||||
| Total Risk Assessment | $ | 724.3 | $ | 688.2 | 5.2 | % | ||||
Cost of Revenues
Cost of revenues for our Risk Assessment segment was $223.7 million for the year ended December 31, 2016 compared to $200.0 million for the year ended December 31, 2015, an increase of $23.7 million or 11.9%. Our recent acquisitions within this segment represented an increase of $1.3 million in cost of revenues, which was primarily related to salaries and employee benefits. Excluding the impact of our recent acquisitions, our cost of revenues increased $22.4 million or 11.2% The increase was primarily due to increases in salaries and employee benefit costs of $10.3 million, an ESOP charge of $8.3 million, data costs and data processing fees of $1.1 million, information technology expense of $1.1 million, and other operating costs of $1.6 million.
Selling, General and Administrative Expenses
Selling, general and administrative expenses for our Risk Assessment segment were $86.7 million for the year ended December 31, 2016 compared to $81.8 million for the year ended December 31, 2015, an increase of $4.9 million or 5.9%. Our recent acquisitions within this segment, accounted for an increase of $0.7 million in SGA, which was primarily related to salaries and employee benefits. Excluding costs associated with our recent acquisitions, SGA increased $4.2 million or 5.1%. The increase was primarily due to an ESOP charge of $2.4 million, increases in professional consulting costs of $1.6 million, information technology expenses of $0.4 million, and other general expense of $1.0 million. These increases were offset by a decrease in salaries and employee benefit costs of $1.2 million.
EBITDA
The EBITDA margin for our Risk Assessment segment was 57.4% for the year ended December 31, 2016 compared to 59.1% for the year ended December 31, 2015. The margin for the year ended December 31, 2016 was negatively impacted by an ESOP charge of 1.5%.
Year Ended December 31, 2015 Compared to Year Ended December 31, 2014
Consolidated Results of Continuing Operations
Revenues
Revenues were $1,760.7 million for the year ended December 31, 2015 compared to $1,431.1 million for the year ended December 31, 2014, an increase of $329.6 million or 23.0%. In December 2014, we acquired Maplecroft and in 2015, we acquired Wood Mackenzie, Infield, and PCI, all within our Decision Analytics segment; these comprise our recent acquisitions. These recent acquisitions provided an increase of $219.6 million in revenues for the year ended December 31, 2015. Excluding recent acquisitions, revenues increased $110.0 million or 7.7%. Revenue growth within Decision Analytics was primarily driven by our insurance and financial services categories. Both categories, industry-standard insurance programs and property-specific rating and underwriting information, within Risk Assessment contributed to its revenue growth. Refer to the Results of Continuing Operations by Segment within this section for further information regarding our revenues.
Cost of Revenues
Cost of revenues was $612.0 million for the year ended December 31, 2015 compared to $516.0 million for the year ended December 31, 2014, an increase of $96.0 million or 18.6%. Our recent acquisitions within the Decision Analytics segment accounted for an increase of $82.4 million in cost of revenues, of which $6.0 million were non-recurring equity compensation associated with the Wood Mackenzie acquisition and the remaining amount was primarily related to salaries and employee benefits. Excluding the impact of our recent acquisitions, our cost of revenues increased $13.6 million or 2.6%. The increase was primarily due to increases in salaries and employee benefits cost of $5.9 million. Other increases include data costs and data processing fees of $2.4 million, rent expense of $2.2 million, travel expense of $2.0 million, and other operating costs of $1.5 million. These increases were offset by a decrease in information technology expense of $0.4 million.
Selling, General and Administrative Expenses
Selling, general and administrative expenses, or SGA, were $278.3 million for the year ended December 31, 2015 compared to $187.3 million for the year ended December 31, 2014, an increase of $91.0 million or 48.7%. Our recent acquisitions accounted for an increase of $83.7 million in SGA, of which $20.7 million were non-recurring transaction costs associated with the Wood Mackenzie acquisition and the remaining amount was primarily related to salaries and employee benefits, rent expense and professional consulting fees. Excluding the impact of our recent acquisitions, SGA increased $7.3 million or 4.0%. The increase was primarily due to increases in salaries and employee benefits of $7.7 million, information technology expense of $1.1 million, rent expense of $1.1 million, travel expense of $0.7 million and other general and administrative of $0.3 million. These increases were offset by a decrease in professional consulting fees of $3.6 million.
Depreciation and Amortization of Fixed Assets
Depreciation and amortization of fixed assets was $96.6 million for the year ended December 31, 2015 compared to $65.4 million for the year ended December 31, 2014, an increase of $31.2 million or 47.7%. The increase in depreciation and amortization of fixed assets includes depreciation of furniture and equipment, software, computer hardware and related equipment. The majorityequipment, and depreciation and amortization related to our recent acquisitions of the increase relates to software and hardware costs to support data capacity expansion and revenue growth.$9.7 million.
Amortization of Intangible Assets
Amortization of intangible assets was $52.2$70.4 million for the year ended December 31, 20122015 compared to $33.0$30.1 million for the year ended December 31, 20111,2014, an increase of $19.2$40.3 million or 58.2%134.5%. The increase was primarily related to intangible assets associated with our recent acquisitions of $44.0 million. Excluding recent acquisitions, the amortization of intangible assets decreased $3.7 million associated with recent acquisitions of $22.1 million, partially offset by $2.9 million of amortization of intangible assets associated withfrom prior acquisitions that have been fully amortized.
Investment Income and Realized (Loss) Gain on Securities,Others, Net
Investment income and realized gain on securities,others, net was a gain of $0.1 million for the year ended December 31, 2012 as compared to a gain of $0.9 million for the year ended December 31, 2011, a decrease of $0.8 million.
Gain on Derivative instruments
Gain on derivative instruments was $85.2 million for the year ended December 31, 2015 resulting from the execution of a nonrecurring foreign currency hedging strategy in connection with the acquisition of Wood Mackenzie within our Decision Analytics segment. There was no gain on derivative instruments for the year ended December 31, 2014.
Interest Expense
Interest expense was $121.4 million for the year ended December 31, 2015 compared to $70.0 million for the year ended December 31, 2014, an increase of $51.4 million or 34.8%73.3%. ThisThe increase is primarily due to the issuanceinterest on the additional debt incurred in connection with the acquisition of our 5.800% senior notes in April 2011, 4.875% senior notes in December 2011 and 4.125% senior notes in September 2012 in aggregate principal amounts of $450.0 million, $250.0 million and $350.0 million, respectively.Wood Mackenzie as well as the bridge financing arrangement.
Provision for Income Taxes
The provision for income taxes was $182.4$196.6 million for the year ended December 31, 20122015 compared to $165.7$208.5 million for the year ended December 31, 2011, an increase2014, a decrease of $16.7$11.9 million or 10.0%5.7%. The effective tax rate was 36.5% for the year ended December 31, 2012 compared to 38.7% for the year ended December 31, 2011. The effective rate28.7% for the year ended December 31, 20122015 compared to 37.1% for the year ended December 31, 2014.
Net Income
The net income margin for our consolidated results, including discontinued operations, was lower due24.5% for the year ended December 31, 2015 compared to benefits resulting22.8% for the year ended December 31, 2014. The non-recurring derivative gain offset by the transaction costs related to the Wood Mackenzie acquisition and the warrant exercise and payout positively impacted our net income margin by 3.2%, which was offset by the impact from the successful executiondiscontinued operations of tax planning strategies, in which a portion was a non-recurring benefit.3.2% for year ended December 31, 2015. The discontinued operations, including the gain on the sale of our mortgage services business decreased our margin by 1.9% for the year ended December 31, 2014.
EBITDA Margin
The EBITDA margin for our consolidated results, including discontinued operations, was 45.4% for the year ended December 31, 2012 compared to 44.5%51.0% for the year ended December 31, 2011. For the year ended December 31, 2012, the recent acquisitions mitigated our margin expansion by 0.5%. The increase in margin is primarily attributed2015 compared to operating leverage as well as cost efficiencies achieved in 2012. For48.8% for the year ended December 31, 2011,2014. The non-recurring derivative gain, offset by the transaction costs related to the Wood Mackenzie acquisition related liability adjustmentand the warrant exercise and payout, positively impacted our EBITDA margin by 0.2%.3.6%, which was offset by the impact from the discontinued operations of 4.2% for year ended December 31, 2015. The discontinued operations, including the gain on the sale of our mortgage services business, decreased our margin by 2.1% for the year ended December 31, 2014.
Results of Continuing Operations by Segment
Decision Analytics
Revenues
Revenues for our Decision Analytics segment were $828.3$1,072.5 million for the year ended December 31, 20122015 compared to $639.1$780.5 million for the year ended December 31, 2011,2014, an increase of $189.2$292.0 million or 29.6%37.4%. RecentOur recent acquisitions accounted for an increase of $105.1$219.6 million in revenues for the year ended December 31, 2012.2015. Excluding recent acquisitions, our Decision Analytics revenue increased $84.1$72.4 million or 13.2%9.3%.
Our revenue by category for the periods presented is set forth below for the years ended December 31:
| 2012 | 2011 | Percentage Change | 2015 | 2014 | Percentage Change | |||||||||||||||
| (In thousands) | (In millions) | |||||||||||||||||||
| Insurance | $ | 493,456 | $ | 451,216 | 9.4 | % | $ | 647.2 | $ | 598.8 | 8.1 | % | ||||||||
| Energy and specialized markets | 308.8 | 84.9 | 263.6 | % | ||||||||||||||||
| Financial services | 26,567 | 5,323 | 399.1 | % | 116.5 | 96.8 | 20.5 | % | ||||||||||||
| Healthcare | 222,955 | 103,722 | 115.0 | % | ||||||||||||||||
| Specialized markets | 85,364 | 78,839 | 8.3 | % | ||||||||||||||||
| Total Decision Analytics | $ | 828,342 | $ | 639,100 | 29.6 | % | $ | 1,072.5 | $ | 780.5 | 37.4 | % | ||||||||
Our insurance revenue increased $42.2$48.4 million or 9.4%, and excluding recent acquisitions (ALP) revenue of $0.8 million within this category, our insurance revenue increased $41.4 million or 9.2%,8.1% primarily due to an increase within our loss quantification solutions, as a resultinsurance anti-fraud claims revenue, underwriting solutions, and catastrophe modeling services.
Our energy and specialized markets revenue increased $223.9 million or 263.6%, primarily due to the recent acquisitions. Excluding the recent acquisitions' revenue of new customers and an increase$219.6 million, our specialized markets revenue increased $4.3 million or 5.1%, primarily due to growth in our catastrophe modelingenvironmental health and safety services for existing customers, as well an increase in insurance fraudand weather risk solutions, revenue.and was partially offset by lower activity related to government contracts.
Our financial services revenue increased $21.3$19.7 million or 399.1%20.5%, and excluding recent acquisitions (Argus) revenue of $21.5 million within this category, our financial services revenue decreased $0.2 million or 3.8%.
Cost of Revenues
Cost of revenues for our Decision Analytics segment was $334.3$412.0 million for the year ended December 31, 20122015 compared to $254.0$307.8 million for the year ended December 31, 2011,2014, an increase of $80.3$104.2 million or 31.6%33.8%. Our recent acquisitions within the Decision Analytics segment, accounted for an increase of $82.4 million in cost of revenues of which $6.0 million were non-recurring equity compensation associated with the Wood Mackenzie acquisition and the remaining amount was primarily related to salaries and employee benefits. Excluding the impact of our recent acquisitions, of $51.5 million, our cost of revenues increased by $28.8$21.8 million or 11.4%7.1%. This increase is primarily due to a net increaseincreases in salary and employee benefits of $20.3 million. Other increases include information$14.7 million, rent expense of $2.4 million, data costs and data processing fees of $4.1 million, information technology expenses of $3.2$1.4 million, travel and travel related costsexpense of $0.7 million, rent expenses of $0.4$1.1 million, and other general expensesoperating costs of $0.1$2.3 million.
Selling, General and Administrative Expenses
Selling, general and administrative expenses for our Decision Analytics segment were $139.2$196.5 million for the year ended December 31, 20122015 compared to $117.2$113.5 million for the year ended December 31, 2011,2014, an increase of $22.0$83.0 million or 18.7%73.3%. Excluding the impact ofOur recent acquisitions within the Decision Analytics segment accounted for an increase of $11.1$83.7 million in SGA increased $10.9of which $20.7 million were non-recurring transaction costs associated with the Wood Mackenzie acquisition and the remaining amount was primarily related to salaries and employee benefits. Excluding costs associated with our recent acquisitions, SGA decreased $0.7 million or 9.5%0.5%. The increasedecrease was primarily due to an increasea decrease in salariesprofessional fees of $3.2 million. This decrease was offset by increases in salary and employee benefits of $9.3$1.1 million, costs related toinformation technology expense of $0.6 million, travel expensesexpense of $0.4 million, and professional feesrent expense of $1.8 million. These increases were offset by a decrease in$0.2 million, and other general expenses of $0.6$0.2 million.
EBITDA Margin
The EBITDA margin for our Decision Analytics segment including our discontinued operations, was 39.8%46.9% for the years ended December 31, 2012 and 2011. For the year ended December 31, 2012, the recent acquisitions mitigated our margin expansion by 0.1%. For the year ended December 31, 2011,2015 and 44.2% for the year ended December 31, 2014. The non-recurring derivative gain, net of transaction costs related to the Wood Mackenzie acquisition related liability adjustmentand the warrant exercise and payout, positively impacted our EBITDA margin by 0.4%.5.4%, which was offset by the impact from the discontinued operations of 5.9% for year ended December 31, 2015. The discontinued operations, including the gain on sale of the mortgage services business, decreased our margin by 1.8% for the year ended December 31, 2014.
Risk Assessment
Revenues
Revenues for our Risk Assessment segment were $579.5$688.2 million for the year ended December 31, 2012 as2015 compared to $552.3$650.6 million for the year ended December 31, 20112014 , an increase of $27.2$37.6 million or 4.9%5.8% . The overall increase within this segment primarily resulted from an increase in prices derived from continued enhancements to the content of our industry-standard insurance programs’ solutions as well as selling expanded solutions to existing customers.
Our revenue by category for the periods presented is set forth below for the years ended December 31:
| 2012 | 2011 | Percentage Change | 2015 | 2014 | Percentage Change | |||||||||||||||
| (In thousands) | (In millions) | |||||||||||||||||||
| Industry-standard insurance programs | $ | 450,646 | $ | 426,228 | 5.7 | % | $ | 524.6 | $ | 495.0 | 6.0 | % | ||||||||
| Property-specific rating and underwriting information | 128,860 | 126,065 | 2.2 | % | 163.6 | 155.6 | 5.1 | % | ||||||||||||
| Total Risk Assessment | $ | 579,506 | $ | 552,293 | 4.9 | % | $ | 688.2 | $ | 650.6 | 5.8 | % | ||||||||
Cost of Revenues
Cost of revenues for our Risk Assessment segment was $182.4$200.0 million for the year ended December 31, 20122015 compared to $187.0$208.2 million for the year ended December 31, 2011,2014, a decrease of $4.6$8.2 million or 2.5%. The decrease was primarily due to decrease in salaries and employee benefits costs of $3.5 million, primarily related to lower pension cost of $8.7 million, and a reallocation of certain resources to our Decision Analytics segment relating to property appraisal tools that occurred in 2012. Other decreases were related to data and consulting costs of $1.1 million, travel and travel related expenses of $0.3 million. These decreases were offset by an increase in other general expenses of $0.2 million and information technology expenses of $0.1 million.
Selling, General and Administrative Expenses
Selling, general and administrative expenses for our Risk Assessment segment were $81.8 million for the year ended December 31, 2015 compared to $73.8 million for the year ended December 31, 2014 , an increase of $8.0 million or 10.8% . The increase was primarily due to increases in salaries and employee benefits of $6.6 million, rent expense of $0.9 million, information technology expense of $0.5 million, travel expense of $0.3 million and other general expenses of $2.0$0.1 million. These increases were offset by a decrease in professional consulting fees of $0.4 million.
EBITDA Margin
The EBITDA margin for our Risk Assessment segment was 54.6%59.1% for the year ended December 31, 20122015 compared to 51.0%56.7% for the year ended December 31, 2011.2014. The increase in margin is primarily attributed to operating leverage in the segment as well as cost efficiencies achieved in 2012. In addition, we reallocated certain resources related to property appraisal tools to Decision Analytics, which partially attributed to our margin expansion.efficiencies.
Quarterly Results of Operations
The following table sets forth our quarterly unaudited consolidated statement of operations data for each of the eight quarters in the period ended December 31, 2013.2016. In management’s opinion, the quarterly data has been prepared on the same basis as the audited consolidated financial statements included in this annual report on Form 10-K, and reflects all necessary adjustments
for a fair presentation of this data. The results of historical periods are not necessarily indicative of the results of operations for a full year or any future period.
| For the Quarters Ended | For the Quarters Ended | |||||||||||||||||||||||||||||
| March 31, | June 30, | September 30, | December 31, | Full Year | March 31, | June 30, | September 30, | December 31, | Full Year | |||||||||||||||||||||
| 2013 | 2013 | 2016 | 2016 | |||||||||||||||||||||||||||
| (in thousands, except for per share data) | (in millions, except for per share data) | |||||||||||||||||||||||||||||
| Statement of operations data: | ||||||||||||||||||||||||||||||
| Revenues | $ | 376,697 | $ | 390,356 | $ | 411,927 | $ | 416,723 | $ | 1,595,703 | $ | 492.7 | $ | 498.3 | $ | 498.1 | $ | 506.1 | $ | 1,995.2 | ||||||||||
| Operating income | $ | 145,528 | $ | 146,857 | $ | 166,835 | $ | 155,047 | $ | 614,267 | $ | 192.6 | $ | 191.1 | $ | 198.4 | $ | 185.5 | $ | 767.6 | ||||||||||
| Income from continuing operations | $ | 79,445 | $ | 81,600 | $ | 94,894 | $ | 86,375 | $ | 342,314 | $ | 109.7 | $ | 106.7 | $ | 127.6 | $ | 107.5 | $ | 451.5 | ||||||||||
| Income from discontinued operations | $ | 1,066 | $ | 2,605 | $ | 1,547 | $ | 848 | $ | 6,066 | $ | (17.1 | ) | $ | 155.0 | $ | — | $ | 1.8 | $ | 139.7 | |||||||||
| Net income | $ | 80,511 | $ | 84,205 | $ | 96,441 | $ | 87,223 | $ | 348,380 | $ | 92.6 | $ | 261.7 | $ | 127.6 | $ | 109.3 | $ | 591.2 | ||||||||||
| Basic net income per share: | $ | 0.48 | $ | 0.50 | $ | 0.57 | $ | 0.52 | $ | 2.07 | $ | 0.55 | $ | 1.56 | $ | 0.76 | $ | 0.65 | $ | 3.51 | ||||||||||
| Diluted net income per share: | $ | 0.47 | $ | 0.49 | $ | 0.56 | $ | 0.51 | $ | 2.02 | $ | 0.54 | $ | 1.53 | $ | 0.74 | $ | 0.64 | $ | 3.46 | ||||||||||
| For the Quarters Ended | For the Quarters Ended | |||||||||||||||||||||||||||||
| March 31, | June 30, | September 30, | December 31, | Full Year | March 31, | June 30, | September 30, | December 31, | Full Year | |||||||||||||||||||||
| 2012 | 2012 | 2015 | 2015 | |||||||||||||||||||||||||||
| (in thousands, except for per share data) | (in millions, except for per share data) | |||||||||||||||||||||||||||||
| Statement of operations data: | ||||||||||||||||||||||||||||||
| Revenues | $ | 313,451 | $ | 339,128 | $ | 366,788 | $ | 388,481 | $ | 1,407,848 | $ | 384.3 | $ | 428.6 | $ | 470.4 | $ | 477.4 | $ | 1,760.7 | ||||||||||
| Operating income | $ | 132,416 | $ | 132,141 | $ | 150,314 | $ | 157,357 | $ | 572,228 | $ | 174.0 | $ | 146.0 | $ | 197.2 | $ | 186.2 | $ | 703.4 | ||||||||||
| Income from continuing operations | $ | 70,650 | $ | 69,556 | $ | 79,932 | $ | 97,325 | $ | 317,463 | $ | 96.4 | $ | 158.9 | $ | 124.2 | $ | 108.0 | $ | 487.5 | ||||||||||
| Income from discontinued operations | $ | 3,951 | $ | 3,775 | $ | 2,979 | $ | 974 | $ | 11,679 | $ | 2.3 | $ | 4.4 | $ | 7.6 | $ | 5.8 | $ | 20.1 | ||||||||||
| Net income | $ | 74,601 | $ | 73,331 | $ | 82,911 | $ | 98,299 | $ | 329,142 | $ | 98.7 | $ | 163.3 | $ | 131.8 | $ | 113.8 | $ | 507.6 | ||||||||||
| Basic net income per share: | $ | 0.45 | $ | 0.44 | $ | 0.50 | $ | 0.59 | $ | 1.98 | $ | 0.62 | $ | 0.99 | $ | 0.78 | $ | 0.67 | $ | 3.07 | ||||||||||
| Diluted net income per share: | $ | 0.44 | $ | 0.43 | $ | 0.48 | $ | 0.57 | $ | 1.92 | $ | 0.61 | $ | 0.97 | $ | 0.77 | $ | 0.66 | $ | 3.01 | ||||||||||