Washington, D. C. 20549
Indicate by check mark whether the registrant is a large accelerated filer, an accelerated filer, a non-accelerated filer, or a smaller reporting company. See the definitions of “large accelerated filer,” “accelerated filer,” and “smaller reporting company” in Rule 12b-2 of the Exchange Act. (Check one):
From time to time, our management or persons acting on our behalf make forward-looking statements to inform existing and potential security holders about our company. These statements may include projections and estimates concerning the timing and success of specific projects and our future backlog, revenues, income and capital spending. Forward-looking statements are generally accompanied by words such as “estimate,” “project,” “predict,” “believe,” “expect,” “anticipate,” “plan,” “intend,” “seek,” “will,” “should,” “goal” or other words that convey the uncertainty of future events or outcomes. These forward-looking statements speak only as of the date on which they are first made, which in the case of forward-looking statements made in this report is the date of this report. Sometimes we will specifically describe a statement as being a forward-looking statement and refer to this cautionary statement.
In addition, various statements contained in this Annual Report on Form 10-K, including those that express a belief, expectation or intention, as well as those that are not statements of historical fact, are forward-looking statements. Such forward-looking statements appear in Item 1—“Business” and Item 3—“Legal Proceedings” in Part I of this report; in Item 5—“Market for Registrant’s Common Equity, Related Shareholder Matters and Issuer Purchases of Equity Securities,” Item 7—“Management’s Discussion and Analysis of Financial Condition and Results of Operations,” Item 7A—“Quantitative and Qualitative Disclosures About Market Risk” and in the Notes to Consolidated Financial Statements we have included in Item 8 of Part II of this report; and elsewhere in this report. These forward-looking statements speak only as of the date of this report. We disclaim any obligation to update these statements, and we caution you not to relyplace undue reliance on them unduly.them. We have based these forward-looking statements on our current expectations and assumptions about future events. While our management considers these expectations and assumptions to be reasonable, they are inherently subject to significant business, economic, competitive, regulatory and other risks, contingencies and uncertainties, most of which are difficult to predict and many of which are beyond our control. These risks, contingencies and uncertainties relate to, among other matters, the following:
decisions about exploration and development projects to be made by oil and gas exploration and production companies;
the continued demand for drilling services or production services in the geographic areas where we operate;
our future financial performance, including availability, terms and deployment of capital;
the success or failure of our acquisition strategy, including our ability to finance acquisitions, manage growth and effectively integrate acquired businesses and manage growth;acquisitions; and
changes in, or our failure or inability to comply with, governmental regulations, including those relating to the environment.
We believe the items we have outlined above are important factors that could cause our actual results to differ materially from those expressed in a forward-looking statement contained in this report or elsewhere. We have discussed many of these factors in more detail elsewhere in this report. Unpredictable or unknown factors we have not discussed in this report could also have material adverse effects on actual results of matters that are the subject of our forward-looking statements. We do not intendundertake no duty to update our description of important factors each time a potential important factor arises,or revise any forward-looking statements, except as required by applicable securities laws and regulations. We advise our security holders that they should (1) be aware that unpredictable or unknown factors not referred to above could affect the accuracy of our forward-looking statements and (2) use caution and common sense when considering our forward-looking statements. Also, please read the risk factors set forth in Item 1A—“Risk Factors.”
From 2004 through 2008, domestic exploration and production spending increased as oil and natural gas prices increased. From late 2008 and into late 2009, there was substantial volatility and a decline in oil and natural gas prices due to the downturn in the global economic environment. In response, our customersclients curtailed their drilling programs and reduced their production activities, particularly in natural gas producing regions, which resulted in a decrease in demand and revenue rates for certain of our drilling rigs and production services equipment. Additionally, there was uncertainty in the capital markets and access to financing was limited. These conditions adversely affected our business environment.
With generally increasing oil prices in 2010 and natural gas prices during 2010,2011, exploration and production companies modestly increased their exploration and production spending for 2010 and industry rigequipment utilization and revenue rates improved, particularly in oil-producing regions and in certain shale regions. IncreasedDuring 2012, modest increases in exploration and production spending resulted in modest increases in industry equipment utilization and revenue rates during 2012, as compared to 2011. Though oil prices decreased sharply in mid-2012 for a brief period of time, they have since recovered with no meaningful upward or downward trend for the year. In addition, excess natural gas production in the U.S. shale regions continues to depress natural gas prices, butprices. If oil prices continued to increase during 2011, resulting in continued increases in exploration and production spending during 2011, as compared to 2010. As a result, we experienced continued increases in industry rig utilization and revenue rates during 2011, as compared to 2010. We expect continued modest increases in exploration and production spending for 2012, which we expect will result in modest increases in industry equipment utilization and revenue rates in 2012, as compared to 2011. However, if oil prices remain steady but natural gas prices further decline, to historically low levels for the remainder of 2012, then industry equipment utilization and revenue rates could decrease.decrease domestically and in Colombia.
For additional information concerningColombia has experienced significant growth in oil production since 2008 largely due to the effectsinfusion of capital by international exploration and production companies as a result of the volatilitycountry's improved regulation and security. Historically, Colombian oil prices have generally trended in oil and gas prices and uncertainty in capital markets, see Item 1A – “Risk Factors” in Part I of this Annual Report on Form 10-K.
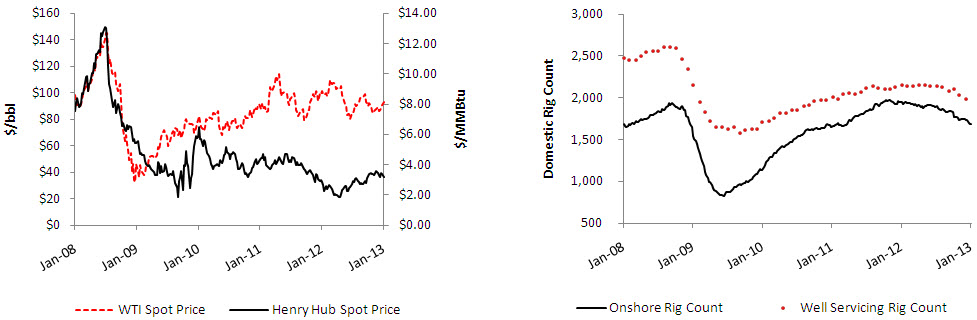
On February 10, 2012, the spot price forline with West Texas Intermediate crude(WTI) oil was prices. However, fluctuations in oil prices have a less significant impact on demand for drilling and production services in Colombia as compared to the impact on demand in North America. Demand for drilling and production services in Colombia is largely dependent upon the national oil company's long-term exploration and production programs.$98.67
, the spot price for Henry Hub natural gas was $2.51 and the Baker Hughes U.S. land rig count was 1,932, a 14%increase from 1,696 on February 4, 2011.
The average weeklytrends in spot prices of West Texas IntermediateWTI crude oil and Henry Hub natural gas, and the average weeklyresulting trends in domestic land rig count per thecounts (per Baker Hughes land rig count,Hughes) and the average monthly domestic well serviceservicing rig count for eachcounts (per Guiberson/Association of Energy Service Companies) over the last five years were:are illustrated in the graphs below.
|
| | | | | | | | | | | | | | | | | | | |
| | Year ended December 31, |
| | 2011 | | 2010 | | 2009 | | 2008 | | 2007 |
| Oil (West Texas Intermediate) | $ | 94.94 |
| | $ | 79.39 |
| | $ | 61.81 |
| | $ | 99.86 |
| | $ | 72.71 |
|
| Natural Gas (Henry Hub) | $ | 3.95 |
| | $ | 4.35 |
| | $ | 3.85 |
| | $ | 8.81 |
| | $ | 6.90 |
|
| U.S. Land Rig Count | 1,829 |
| | 1,493 |
| | 1,035 |
| | 1,792 |
| | 1,670 |
|
| U.S. Well Service Rig Count | 2,075 |
| | 1,854 |
| | 1,735 |
| | 2,514 |
| | 2,388 |
|
IncreasesAs shown in the charts above, the trends in industry rig counts are influenced by fluctuations in oil and natural gas prices, from 2004 to late 2008 resulted in corresponding increases inwhich affect the U.S. land rig countslevels of capital and U.S. well service rig counts, while declines in prices from late 2008 to late 2009 led to decreases in the U.S. land rig counts and U.S. well service rig counts. Since late 2009, increases primarily in oil prices have caused increases in exploration and production spending and the corresponding increases in drilling and well services activities are reflectedoperating expenditures made by increases in the U.S. land rig counts and the U.S. well service rig counts in 2010 and 2011.our clients.
Our business is influenced substantially by both operating and capital expenditures by exploration and production companies. Exploration and production spending is generally categorized as either a capital expenditure or operating expenditure.
Capital expenditures by oil and gas exploration and production companies tend to be relatively sensitive to volatility in oil or natural gas prices because project decisions are tied to a return on investment spanning a number of years. As such, capital expenditure economics often require the use of commodity price forecasts which may prove inaccurate in the amount of time required to plan and execute a capital expenditure project (such as the drilling of a deep well). When commodity prices are depressed for long periods of time, capital expenditure projects are routinely deferred until prices return to an acceptable level.
In contrast, both mandatory and discretionary operating expenditures are more stable than capital expenditures for exploration.exploration as these expenditures are less sensitive to commodity price volatility. Mandatory operating expenditure projects involve activities that cannot be avoided in the short term, such as regulatory compliance, safety, contractual obligations and certain projects to maintain the well and related infrastructure in operating condition. Discretionary operating expenditure projects may not be critical to the short-term viability of a lease or field but these projectsand are less sensitive to commodity price volatility as compared to capital expenditures for exploration. Discretionary operating expenditure work isgenerally evaluated according to a simple short-term payout criterion whichthat is far less dependent on commodity price forecasts.forecasts.
Because existing oil and natural gas wells require ongoing spending to maintain production, expenditures by exploration and production companies for the maintenance of existing wells are relatively stable and predictable. In contrast, capital expenditures by exploration and production companies for exploration and drilling are more directly influenced by current and expected oil and natural gas prices and generally reflect the volatility of commodity prices.
Competitive Strengths
Our competitive strengths include:
One of the Leading Providers in the Most Attractive Regions. Our 6470 drilling rigs operate in many of the most attractive producing regions in the Americas, including the Bakken, Marcellus and Eagle Ford shales, and Permian and Uintah Basins, as well as Colombia. Our drilling rigs are located in seven divisions throughout the United States and Colombia, diversifying our geographic exposure and limiting the impact of any regional slowdown. We believe the varied capabilities of our drilling rigs make them well suited to these areas where the optimal rig configuration is dictated by local geology and market conditions. Furthermore, certain of our division locations,divisions, such as Colombia, North Dakota, Utah, West Texas and parts of our South Texas division, location, are in regions with oil-focused drilling, which reduces our relative exposure to changes in natural gas drilling activity.
High Quality Assets. We have purchased 3038 new-build drilling rigs since 2001, eight of which we constructed over the majority of these constructed from 2004 to 2006,last two years, and currently have term contracts foranother tentwo new-build AC drilling rigs under construction that are fit for purpose for domestic shale plays. The majority of our drilling rig fleet is fast moving and has preferred equipment such as more efficient and lower emission engines, rounded bottom mud tanks and matched horsepower mud pumps. Approximately 80%86% of our drilling rig fleet has a horsepower rating of overat least 1000 horsepower and the majority of our fleet is equipped with top drives, allowing us to pursue opportunities in shale plays, which typically require higher specification rigs than traditional areas. Approximately 64%70% of our production services assets have been built since 2007, and all but oneof our well serviceservicing rigs have at least 550 horsepower. We believe that our modern and well maintained fleet allows us to realize higher contract and utilization rates by beingbecause we are able to offer our customersclients equipment that is more reliable and requires less downtime than older equipment.
Provide Services Throughout the Well Life Cycle. By offering our customersclients both drilling production and relatedproduction services, we capture revenue throughout the life cycle of a well and diversify our business. Our Drilling Services DivisionSegment performs work prior to initial production, and our Production Services DivisionSegment provides services such as logging, completion, perforation, workover and maintenance throughout the productive life of a well. We also provide certain end-of-well-life activities such as plugging and abandonment. Drilling and production services activity have historically exhibited different degrees of demand fluctuation, and we believe the diversity of our services reduces our exposure to decreases in demand for any single service activity. TheFurther, the diversity of our service offerings enables us to cross-sell our services, also enhances customer revenues bybenefiting our clients, allowing us to cross-sellgenerate more business from existing clients and increasing our profits as we expand our services in our various business divisions.within existing markets.
Excellent Safety Record. Our safety program called “Live Safe”“LiveSafe” focuses on creating an environment where everyone is committed to and recognizes the possibility of always working without incident or injury. We believe that by building strong relationships among our people we can achieve outstanding accomplishments. Our excellent safety record and reputation are critical to winning new business and expanding our relationships with existing customers.clients. Our commitment to safety helps us to keep our employees safe and reduces our business risk.
Experienced Management Team. We believe that important competitive factors in establishing and maintaining long-term customerclient relationships include having an experienced and skilled management team and maintaining employee continuity. Our CEO, Wm. Stacy Locke, joined Pioneer in 1995 as President and has over 2530 years of industry experience. Our two divisionsegment presidents, F.C. “Red” West and Joe Eustace, have over 7080 years of combined oilfield services experience. Our management team has operated through numerous oilfield services cycles and provides us with valuable long-term experience and a detailed understanding of customerclient requirements. We also seek to maximize employee continuity and minimize employee turnover by maintaining modern equipment, a strong safety record, ongoing growth and competitive compensation. We have devoted, and will continue to devote, substantial resources to our employee safety and training programs and maintaining low employee turnover.
Longstanding and Diversified Customers.Clients. We maintain long-standing, high quality customerclient relationships with a diverse group of majorlarge independent oil and gas exploration and production companies including EOG Resources, Inc., Cabot Oil and Gas Corporation, Whiting Petroleum Corporation, andwhich accounted for approximately 10% of our 2012 consolidated revenues, Apache Corporation, Chesapeake Energy Corporation.Corporation, Hess Corporation and Continental Resources. We also maintain a high quality relationship with Ecopetrol, which accounted for approximately 14%10% of our 20112012 consolidated revenues. No other single customer accounted for more than 11% of consolidated revenues during the same period. We believe our relationships with our customersclients are excellent and offer numerous opportunities for future growth.
Strategy
In past years, our strategy was to become a premier land drilling and production services company through steady and disciplined growth. We executed this strategy by acquiring and building a high quality drilling rig fleet and production services business thatwhich we operate in activethe most attractive drilling markets inthroughout the United States and in Colombia. Our long-term strategy is to maintain and leverage our position as a leading land drilling and production services company, continue to expand our relationships with existing customers,clients, expand our customerclient base in the areas in whichwhere we currently operate and further enhance our geographic diversification through selective international expansion. The key elements of this long-term strategy include:are focused on our:
Further Strengthen our Competitive Position in the Most Attractive Domestic Markets. Shale plays and non-shale oil or liquid rich environments are increasingly important to domestic hydrocarbon production and not all drilling rigs are capable of successfully drilling in these unconventional opportunities. We are currently operating in unconventional areas in the Bakken, Marcellus and Eagle Ford shales and Permian and Uintah Basins,Basins. All of the eight drilling rigs we have constructed over the last two years are currently operating in domestic shale plays and we intend to addexpect the remaining tentwo new-build drilling rigs that willcurrently under construction to be operating in shale or unconventional plays by the shale playsend of the first quarter of 2013. Additionally, in 2012. We also intend to continue addingrecent years, we have added significant capacity to our wireline, coiled tubing, and well servicing product offerings,production services fleets, which are well positioned to capitalize on increased shale development.
Increase our Exposure to Oil-DrivenOil and Liquids Rich Natural Gas Drilling Activity. We believe that our flexible drilling and production services fleets allow us to pursue varied opportunities, enabling us to focus on a favorable mix of natural gas, oil and liquids rich natural gas activity. In recent years, we have intentionally increased our exposure to oil-related activities by redeploying certain of our assets into predominately oil-producing regions and we continue to actively seekingseek contracts with oil-focused producers. As of February 10, 2012January 31, 2013, approximately 87%91% of our working drilling rigs and 78% of our production services assets are operating on wells that are targeting or producing oil or liquids rich natural gas. We believe that our flexible rig fleet and production services assets allow us to target opportunities focused on both natural gas and oil.
Selectively Expand our International OperationsPresence. In early 2007, we announced our intention to selectively expand internationally and began a relationship with Ecopetrol S.A. in Colombia after a comprehensive review of international opportunities wherein we determined that Colombia offered an attractive mix of favorable business conditions, political stability, and a long-term commitment to expanding national oil and gas production. We are continuously evaluating additional international expansion opportunities and intend to target international markets that share the favorable characteristicsCurrently, all of our Colombian operations andeight drilling rigs in Colombia are working, six of which would allow us to deploy sufficient assets in order to realize economiesare under term contracts that were extended through the first quarter of scale.2013.
Continue Growth withThrough Select Capital Deployment. We intend to investhave historically invested in the growth of our business by continuing to strategically upgradeupgrading our existing assets, selectively engaging in new-build opportunities, and potentially makingthrough selective acquisitions. Our capital investment decisions are determined by an analysis of the projected return on capital employed, which is based on the terms of secured contracts whenever possible, and the investment must be consistent with our strategic objectives. We currently have term contracts for ten new-build AC drilling rigs that are fit for purpose for domestic shale plays, five of which we estimate will begin workingcontinued to make significant investments in the first halfgrowth of 2012, withour business over the remaining five to begin operating by the end of 2012. Onpast several years. For example, on December 31, 2011, we acquired thea coiled tubing service company, Go-Coil,services business to complementexpand our existing production services offerings. We have also significantly increasedadded significant capacity to our other production services fleets withthrough the addition of 2157 wireline units and 1534 well serviceservicing rigs inover the last three years. In 2011, we began construction, based on term contracts, of 2011. We expect to add another 18ten wireline units,new-build AC drilling rigs, 13eight well service rigsof which are currently operating in domestic shale plays, and we expect the remaining threetwo coiled tubing units to be operating by the end of 2012the first quarter of 2013. When these capital projects are completed, we intend to shift our near-term focus toward reducing capital expenditures and using excess cash flows from operations to reduce outstanding debt balances and reposition ourselves for continued long-term growth.
Overview of Our Segments and Services
Drilling Services DivisionSegment
There are numerous factors that differentiate land drilling rigs, including their power generation systems and their drilling depth capabilities. A land drilling rig consists of engines, a hoisting system, a rotating system, pumps and related equipment to circulate drilling fluid, blowout preventers and related equipment. Generally, drilling rigs operate with crews of five to six persons.
Diesel or gas engines are typically the main power sources for a drilling rig. Power requirements for drilling jobs may vary considerably, but most land drilling rigs employ two or more engines to generate between 500 and 2,000 horsepower, depending on well depth and rig design. Most drilling rigs capable of drilling in deep formations, involving depths greater than 15,000 feet, use diesel-electric power units to generate and deliver electric current through cables to electrical switch gears, then to direct-current electric motors attached to the equipment in the hoisting, rotating and circulating systems.
Drilling rigs use long strings of drill pipe and drill collars to drill wells. Drilling rigs are also used to set heavy strings of large-diameter pipe, or casing, inside the borehole. Because the total weight of the drill string and the casing can exceed 500,000 pounds, drilling rigs require significant hoisting and braking capacities.
Generally, a drilling rig’s hoisting system is made up of a mast, or derrick, a traveling block and hook assembly that attaches to the rotating system, a mechanism known as the drawworks, a drilling line and ancillary equipment. The drawworks mechanism consists of a revolving drum, around which the drilling line is wound, and a series of shafts, clutches and chain and gear drives for generating speed changes and reverse motion. The drawworks also houses the main brake, which has the capacity to stop and sustain the weights used in the drilling process. When heavy loads are being lowered, a hydraulic or electric auxiliary brake assists
the main brake to absorb the great amount of energy developed by the mass of the traveling block, hook assembly, drill pipe, drill collars and drill bit or casing being lowered into the well.
The rotating equipment from top to bottom consists of a top drive or a swivel, the kelly, and kelly bushing, the rotary table, drill pipe, drill collars and the drill bit. We refer to the equipment between the top drive or swivel and the drill bit as the drill stem. In a top drive system, the top drive hangs from a hook at the bottom of the traveling block. The top drive has a passageway for drilling mud to get into the drill pipe, and it has a heavy-duty electric motor connected to a threaded drive shaft which connects to and rotates the drill pipe. In a kelly drive system, the swivel assembly sustains the weight of the drill stem, permits its rotation and affords a rotating pressure seal and passageway for circulating drilling fluid into the top of the drill string. The swivel also has a large handle that fits inside the hook assembly at the bottom of the traveling block. Drilling fluid enters the drill stem through a hose, called the rotary hose, attached to the side of the swivel. The kelly is a triangular, square or hexagonal piece of pipe, usually 40 feet long, that transmits torque from the rotary table to the drill stem and permits its vertical movement as it is lowered into the hole. The bottom end of the kelly fits inside a corresponding triangular, square or hexagonal opening in a device called the kelly bushing. The kelly bushing, in turn, fits into a part of the rotary table called the master bushing. As the master bushing rotates, the kelly bushing also rotates, turning the kelly, which rotates the drill pipe and thus the drill bit. Drilling fluid is pumped through the kelly on its way to the bottom. The rotary table, equipped with its master bushing and kelly bushing, supplies the necessary torque to turn the drill stem. The drill pipe and drill collars are both steel tubes through which drilling fluid can be pumped. Drill pipe, sometimes called drill string, comes in 30-foot sections, or joints, with threaded sections on each end. Drill collars are heavier than drill pipe and both are threaded on the ends. Collars are used on the bottom of the drill stem to apply weight to the drilling bit. At the end of the drill stem is the bit, which chews up the formation rock and dislodges it so that drilling fluid can circulate the fragmented material back up to the surface where the circulating system filters it out of the fluid.
Drilling fluid, often called mud, is a mixture of clays, chemicals and water or oil, which is carefully formulated for the particular well being drilled. Drilling mud accounts for a major portion of the cost incurred and equipment used in drilling a well. Bulk storage of drilling fluid materials, the pumps and the mud-mixing equipment are placed at the start of the circulating system. Working mud pits and reserve storage are at the other end of the system. Between these two points, the circulating system includes auxiliary equipment for drilling fluid maintenance and equipment for well pressure control. Within the system, the drilling mud is typically routed from the mud pits to the mud pump and from the mud pump through a standpipe and the rotary hose to the drill stem. The drilling mud travels down the drill stem to the bit, up the annular space between the drill stem and the borehole and through the blowout preventer stack to the return flow line. It then travels to a shale shaker for removal of rock cuttings, and then back to the mud pits, which are usually steel tanks. The reserve pits, usually one or two fairly shallow excavations, are used for waste material and excess water around the location.
Drilling rigs use long strings of drill pipe and drill collars to drill wells. Drilling rigs are also used to set heavy strings of large-diameter pipe, or casing, inside the borehole. Because the total weight of the drill string and the casing can exceed 500,000 pounds, drilling rigs require significant hoisting and braking capacities. The actual drilling depth capability of a rig may be less than or more than its rated depth capability due to numerous factors, including the size, weight and amount of the drill pipe on the rig. The intended well depth and the drill site conditions determine the amount of drill pipe and other equipment needed to drill a well.
In a continuing effort to improve our drilling rig fleet, we have installed top drives in 3645 rigs (with threefive additional spare top drives available for installation), iron roughnecks in 4958 rigs (with sixone additional spare iron roughnecks available for installation), walking/skidding systems in 1624 rigs and automatic catwalks in eight27 rigs. These upgrades provide our customersclients with drilling rigs that have more varied capabilities for drilling in unconventional plays, and they improve our efficiency and safety. Top drives provide maximum torque and rotational control, improved well control and better hole conditioning. In horizontal drilling, operators can utilize top drives to reach formations that may not be accessible with conventional rotary drilling. An iron roughneck is a remotely operated pipe handling feature on the rig floor, which is used to help reduce the occurrence of repetitive motion injuries and decrease drill pipe tripping time. Walking systems increase efficiency by allowing multiple wells to be drilled on the same pad site and permitting the drilling rig to move between wells while drill pipe remains in the derrick, thus reducing move times and costs. Our walking system enables the drilling rig to move forward, backward, and side to side which affords the operator additional flexibility. An automated catwalk is a drill pipe handling feature used to raise drill pipe, drill collars, casing, and other necessary items to the drilling rig floor. Its function significantly reduces pick up and lay down time, thereby decreasing operator costs for handling casing.
There are numerous factors that differentiate land drilling rigs, including their power generation systems and their drilling depth capabilities. The actual drilling depth capability of a rig may be less than or more than its rated depth capability due to numerous factors, including the size, weight and amount of the drill pipe on the rig. The intended well depth and the drill site conditions determine the amount of drill pipe and other equipment needed to drill a well. Generally, land rigs operate with crews of five to six persons.
The following table sets forth historical information regarding utilization for our drilling rig fleet:
| | | | Year ended December 31, | Year ended December 31, |
| | 2011 | | 2010 | | 2009 | | 2008 | | 2007 | 2012 | | 2011 | | 2010 | | 2009 | | 2008 |
| Average number of operating rigs for the period | 69.3 |
| | 71.0 |
| | 70.7 |
| | 67.4 |
| | 66.1 |
| 65.0 |
| | 69.3 |
| | 71.0 |
| | 70.7 |
| | 67.4 |
|
| Average utilization rate | 73 | % | | 59 | % | | 41 | % | | 89 | % | | 89 | % | 87 | % | | 73 | % | | 59 | % | | 41 | % | | 89 | % |
We believe that our drilling rigs and other related equipment are in good operating condition. Our employees perform periodic maintenance and minor repair work on our drilling rigs. We rely on various oilfield service companies for major repair work and overhaul of our drilling equipment when needed. We also engage in periodic improvement of our drilling equipment. In the event of major breakdowns or mechanical problems, our rigs could be subject to significant idle time and a resulting loss of revenue if the necessary repair services are not immediately available.
As of February 10, 2012January 31, 2013, we own a fleet of 5455 trucks and related transportation equipment that we use to transport our drilling rigs to and from drilling sites. By owning our own trucks, we reduce the overall cost of rig moves and reduce downtime between rig moves. This is most beneficial to us in periods of high rig utilization and in regions where there is less pad drilling.
We obtain our contracts for drilling oil and gas wells either through competitive bidding or through direct negotiations with customers.clients. Our drilling contracts generally provide for compensation on either a daywork, turnkey or footage basis. Contract terms generally depend on the complexity and risk of operations, the on-site drilling conditions, the type of equipment used, and the anticipated duration of the work to be performed. Generally, our contracts provide for the drilling of a single well and typically permit the customerclient to terminate on short notice. During periods of high rig demand, or for our newly constructed rigs, we enter into longer-term drilling contracts. Currently, we have contracts with terms of six months to four years in duration. As of February 10, 2012January 31, 2013, we have 4443 drilling rigs operating under term contracts. Of thesecontracts, as well as term contracts for another 44two contracts,new-build AC drilling rigs which we expect to begin working by the end of the first quarter of 2013. As of January 31, 2013, if not renewed at the end of their terms, the expiration of the 21 will expire by July 10, 2012, 22 will expire by February 10, 2013 and one will expire by February 10, 2014. We have term contracts for an additional three drilling rigs that we expect will begin operating in the first quarter of 2012 and we have ten43 term contracts for new-build AC drilling rigs, five ofunder which we estimate will begin working in the first half of 2012, with the remaining five to beginare currently operating by the end of 2012.is as follows:
|
| | | | | | | | | | | | | | | | | | |
| | | | | Term Contract Expiration by Period |
| | | Total
Term Contracts | | Within
6 Months | | 6 Months
to 1 Year | | 1 Year to
18 Months | | 18 Months
to 2 Years | | 2 to 4 Years |
| United States | | 37 |
| | 23 |
| | 6 |
| | 2 |
| | 1 |
| | 5 |
|
| Colombia | | 6 |
| | 6 |
| | — |
| | — |
| | — |
| | — |
|
| | | 43 |
| | 29 |
| | 6 |
| | 2 |
| | 1 |
| | 5 |
|
As a provider of contract land drilling services, our business and the profitability of our operations depend on the level of drilling activity by oil and gas exploration and production companies operating in the geographic markets where we operate. The oil and gas exploration and production industry is a historically cyclical industry characterized by significant changes in the levels of exploration and development activities. During periods of reduced drilling activity or excess rig capacity, price competition tends to increase and the profitability of daywork contracts tends to decrease. In this competitive price environment, we may be more inclined to enter into turnkey contracts that expose us to greater risk of loss but which offer higher potential contract profitability.
During the last three fiscal years, our drilling contracts have primarily been for daywork drilling and we have not performed any footage contract work. The following table presents, by type of contract, information about the total number of wells we completed for our customersclients during each of the last three fiscal years.
| | | | Year ended December 31, | Year ended December 31, |
| Types of Contracts | 2011 | | 2010 | | 2009 | 2012 | | 2011 | | 2010 |
| Daywork | 655 |
| | 453 |
| | 323 |
| 881 |
| | 655 |
| | 453 |
|
| Turnkey | 17 |
| | 11 |
| | 14 |
| 11 |
| | 17 |
| | 11 |
|
| Footage | — |
| | — |
| | 1 |
| |
| Total number of wells | 672 |
| | 464 |
| | 338 |
| 892 |
| | 672 |
| | 464 |
|
Daywork Contracts. Under daywork drilling contracts, we provide a drilling rig and required personnel to our customerclient who supervises the drilling of the well. We are paid based on a negotiated fixed rate per day while the rig is used. Daywork drilling contracts specify the equipment to be used, the size of the hole and the depth of the well. Under a daywork drilling contract, the customer
client bears a large portion of the out-of-pocket drilling costs and we generally bear no part of the usual risks associated with drilling, such as time delays and unanticipated costs.
Turnkey Contracts. Under a turnkey contract, we agree to drill a well for our customerclient to a specified depth and under specified conditions for a fixed price, regardless of the time required or the problems encountered in drilling the well. We provide technical expertise and engineering services, as well as most of the equipment and drilling supplies required to drill the well. We often subcontract for related services, such as the provision of casing crews, cementing and well logging. Under typical turnkey drilling arrangements, we do not receive progress payments and are paid by our customerclient only after we have performed the terms of the drilling contract in full.
The risks to us under a turnkey contract are substantially greater than on a well drilled on a daywork basis. This is primarily because under a turnkey contract we assume most of the risks associated with drilling operations generally assumed by the operator in a daywork contract, including the risk of blowout, loss of hole, stuck drill pipe, machinery breakdowns, abnormal drilling conditions and risks associated with subcontractors’ services, supplies, cost escalations and personnel. We employ or contract for engineering expertise to analyze seismic, geologic and drilling data to identify and reduce some of the drilling risks we assume. We use the results of this analysis to evaluate the risks of a proposed contract and seek to account for such risks in our bid preparation. We believe that our operating experience, qualified drilling personnel, risk management program, internal engineering expertise and access to proficient third-party engineering contractors have allowed us to reduce some of the risks inherent in turnkey drilling operations. We also maintain insurance coverage against some, but not all, drilling hazards. However, the occurrence of uninsured or under-insured losses or operating cost overruns on our turnkey jobs could have a material adverse effect on our financial position and results of operations.
Footage Contracts. Under footage contracts, we are paid a fixed amount for each foot drilled, regardless of the time required or the problems encountered in drilling the well. We typically pay more of the out-of-pocket costs associated with footage contracts as compared to daywork contracts. Similar to a turnkey contract, the risks to us on a footage contract are greater because we assume most of the risks associated with drilling operations generally assumed by the operator in a daywork contract, including loss of hole, stuck drill pipe, machinery breakdowns, abnormal drilling conditions and risks associated with subcontractors’ services, supplies, cost escalation and personnel. As with turnkey contracts, we manage this additional risk through the use of engineering expertise and bid the footage contracts accordingly. We also maintain insurance coverage against some, but not all, drilling hazards. However, the occurrence of uninsured or under-insured losses or operating cost overruns on our footage jobs could have a material adverse effect on our financial position and results of operations.
Production Services DivisionSegment
Well ServicesServicing. Our well servicesservicing rig fleet provides a range of well services,servicing, including the completion of newly-drilled wells, maintenance of existing wells,and workover of existing wells, completion of newly-drilled wells, and plugging and abandonment of wells at the end of their useful lives.
Newly drilled wells require completion services to prepare the well for production. Well servicing rigs are frequently used to complete newly drilled wells to minimize the use of higher cost drilling rigs in the completion process. The completion process may involve selectively perforating the well casing in the productive zones to allow oil or gas to flow into the well bore, stimulating and testing these zones and installing the production string and other downhole equipment. The completion process typically requires a few days to several weeks, depending on the nature and type of the completion, and generally requires additional auxiliary equipment. Accordingly, completion services require less well-to-well mobilization of equipment and can provide higher operating margins than regular maintenance work. The demand for completion services is directly related to drilling activity levels, which are sensitive to changes in oil and gas prices.
Regular maintenance is generally required throughout the life of a well to sustain optimal levels of oil and gas production. We believe regular maintenance comprises the largest portion of our work in this business segment. Common maintenance services include repairing inoperable pumping equipment in an oil well and replacing defective tubing in a gas well. Our maintenance services involve relatively low-cost, short-duration jobs which are part of normal well operating costs. The need for maintenance does not directly depend on the level of drilling activity, although it is somewhat impacted by short-term fluctuations in oil and gas prices. Accordingly, maintenance services generally experience relatively stable demand; however, when oil or gas prices are too low to justify additional expenditures, operating companies may choose to temporarily shut in producing wells rather than incur additional maintenance costs.
In addition to periodic maintenance, producing oil and gas wells occasionally require major repairs or modifications called workovers, which are typically more complex and more time consuming than maintenance operations. Workover services include extensions of existing wells to drain new formations either through perforating the well casing to expose additional productive zones not previously produced, deepening well bores to new zones or the drilling of lateral well bores to improve reservoir drainage patterns. Our well serviceservicing rigs are also used to convert former producing wells to injection wells through which water or carbon dioxide is then pumped into the formation for enhanced oil recovery operations. Workovers also include major subsurface repairs
such as repair or replacement of well casing, recovery or replacement of tubing and removal of foreign objects from the well bore. These extensive workover operations are normally performed by a well serviceservicing rig with additional specialized auxiliary equipment, which may include rotary drilling equipment, mud pumps, mud tanks and fishing tools, depending upon the particular type of workover operation. All of our well serviceservicing rigs are designed to perform complex workover operations. A workover may require a few days to several weeks and generally requires additional auxiliary equipment. The demand for workover services is sensitive to oil and gas producers’ intermediate and long-term expectations for oil and gas prices.
Completion services involve the preparation of newly drilled wells for production. The completion process may involve selectively perforating the well casing in the productive zones to allow oil or gas to flow into the well bore, stimulating and testing these zones and installing the production string and other downhole equipment. We provide well service rigs to assist in this completion process. Newly drilled wells are frequently completed by well service rigs to minimize the use of higher cost drilling rigs in the completion process. The completion process typically requires a few days to several weeks, depending on the nature and type of the completion, and generally requires additional auxiliary equipment. Accordingly, completion services require less well-to-well mobilization of equipment and generally provide higher operating margins than regular maintenance work. The demand for completion services is directly related to drilling activity levels, which are sensitive to changes in oil and gas prices.
Well serviceservicing rigs are also used in the process of permanently closing oil and gas wells no longer capable of producing in economic quantities. Many well operators bid this work on a “turnkey” basis, requiring the service company to perform the entire job, including the sale or disposal of equipment salvaged from the well as part of the compensation received, and complying with state regulatory requirements. Plugging and abandonment work can provide favorable operating margins and is less sensitive to oil and gas pricing than drilling and workover activity since well operators must plug a well in accordance with state regulations when it is no longer productive. We perform plugging and abandonment work throughout our core areas of operation in conjunction with equipment provided by other service companies.
When we provide well services, weWe typically bill customersclients for our well servicing on an hourly basis during the period that the rig providing services is actively working. As of February 10, 2012January 31, 2013, our fleet of well serviceservicing rigs totaled 91108 rigs. These rigs, are locatedwhich we operate through 12 locations, mostly in the Gulf Coast and ArkLaTex regions, though we also have 1113 rigs in North Dakota. Our fleet is among the newest in the industry, consisting primarily of premium,ninety-eight 550 horsepower and ten 600 horsepower rigs capable of working at depths of 20,000 feet.
Wireline Services. We provide both open and cased-hole wireline services with our fleetWireline trucks, like well servicing rigs, are utilized throughout the life of 109 wireline units, asa well. Wireline trucks are often used in place of February 10, 2012. We provide these servicesa well servicing rig when there is no requirement to remove tubulars from the well in Texas, Kansas, Colorado, Utah, Montana, North Dakota, Louisiana, Oklahoma, Wyoming and Mississippi. order to make repairs.
Wireline services typically utilize a single truck equipped with a spool of wireline that is used to lower and raise a variety of specialized tools in and out of the wellbore. Electric wireline contains a conduit that allows signals to be transmitted to or from tools located in the well. These tools can be used to measure pressures and temperatures as well as the condition of the casing and the cement that holds the casing in place. In order for oil and gas exploration and production companies to better understand the reservoirs they are drilling or producing, they require logging services to accurately characterize reservoir rocks and fluids. We provide both open and cased-hole logging services, including the latest pulsed-neutron technology.
Other applications for wireline tools include placing equipment in or retrieving equipment from the wellbore, orinstalling bridge plugs, perforating the casing andin order to prepare the well for production, or cutting off pipe that is stuck in the well so that the free section can be recovered. Electric
We provide both open and cased-hole logging services, including the latest pulsed-neutron technology. As of January 31, 2013, our wireline contains a conduit that allows signals to be transmitted to or from tools locatedservices fleet totaled 120 wireline units, including four offshore units, which we operate through 24 locations in the well. Wireline trucks are often used in place of a well service rig when there is no requirement to remove tubulars from the well in order to make repairs. Wireline trucks, like well service rigs, are utilized throughout the life of a well.Texas, Kansas, Colorado, Utah, Montana, North Dakota, Louisiana, Oklahoma, Wyoming and Mississippi.
Coiled Tubing Services. Coiled tubing is an important element of the well serviceproduction services industry today that allows operators to continue production during service operations without shutting in the well, thereby reducing the risk of formation damage. Coiled tubing services involve the use of a continuous metal pipe spooled on a large reel for oil and natural gas well applications, such as wellbore clean-outs, nitrogen jet lifts, through-tubing fishing, formation stimulation utilizing acid, chemical treatments and fracturing. Coiled tubing is also used for a number of horizontal well applications such as milling temporary plugs between frac stages. OurAs of January 31, 2013, our coiled tubing business consists of tennine coiled tubingonshore and four offshore units, which are currently deployed in Texas, Louisiana Oklahoma and Pennsylvania.Oklahoma.
Fishing and Rental Services. Our rentalfishing and fishingrental tool business provides a range of specialized services and equipment that are utilized on a non-routine basis for both drilling and well servicing operations. Drilling and well serviceservicing rigs are equipped with a complement of tools to complete routine operations under normal conditions for most projects in the geographic area where they are employed. When downhole problems develop with drilling or servicing operations, or conditions require non-routine equipment, our customersclients will usually rely on a provider of rental and fishing tools to augment equipment that is provided with a typical drilling or well serviceservicing rig package. The important rental tools that we offer include air drilling equipment, foam units, power swivels, and blowout preventers.
The term “fishing” applies to a wide variety of downhole operations designed to correct a problem that has developed when drilling or servicing a well. Often, the problem involves equipment that has become lodged in the well and cannot be removed without special equipment. Our customersclients employ our technicians and our tools that are specifically suited to retrieve the trapped equipment, or “fish,” in order for operations to resume.
Our Production Services
12
Seasonality
All our production services operations are impacted by seasonal factors. Our business can be negatively impacted during the winter months due to inclement weather, fewer daylight hours, and holidays. Because our well serviceservicing rigs, wireline units and coiled tubing units are mobile, during periods of heavy snow, ice or rain, we may not be able to move our equipment between locations.
CustomersClients
We provide drilling services and production services to numerous major and independent oil and gas exploration and production companies that are active in the geographic areas in which we operate. The following table shows our three largest customersclients as a percentage of our total revenue for each of our last three fiscal years.
|
| | | |
Customer | | Total Revenue Percentage |
| Fiscal year ended December 31, 2012 | | |
| Whiting Petroleum Company | | 10.1 | % |
| Ecopetrol | | 9.7 | % |
| Apache Corporation | | 5.5 | % |
| | |
| Fiscal year ended December 31, 2011 | | |
| Ecopetrol | | 13.5 | % |
| Whiting Petroleum Corporation | | 10.6 | % |
| Talisman Energy USA, Inc. | | 3.6 | % |
| | | |
| Fiscal year ended December 31, 2010 | | |
| Ecopetrol | | 17.7 | % |
| Whiting Petroleum Corporation | | 8.9 | % |
| Chesapeake Operating, Inc. | | 3.7 | % |
| | |
Fiscal year ended December 31, 2009 | |
|
Ecopetrol | | 16.2 | % |
Anadarko Petroleum Corporation | | 5.9 | % |
Cabot Oil and Gas Corporation | | 5.6 | % |
Competition
Drilling Services DivisionSegment
We encounter substantial competition from other drilling contractors. Our primary market areas are highly fragmented and competitive. The fact that drilling rigs are mobile and can be moved from one market to another in response to market conditions heightens the competition in the industry.
The drilling contracts we compete for are usually awarded on the basis of competitive bids. Our principal competitors are Helmerich & Payne, Inc., Precision Drilling Trust, Patterson-UTI Energy, Inc. and Nabors Industries, Ltd. In addition to pricing and rig availability, we believe the following factors are also important to our customersclients in determining which drilling contractors to select:
the type and condition of each of the competing drilling rigs;
the mobility and efficiency of the rigs;
the quality of service and experience of the rig crews;
the safety records of the rigs;our company;
the offering of ancillary services; and
the ability to provide drilling equipment adaptable to, and personnel familiar with, new technologies and drilling techniques.
While we must be competitive in our pricing, our competitive strategy generally emphasizes the quality of our equipment, theour safety record, of our rigs andability to offer ancillary services, the experience of our rig crews and the quality of service we provide to differentiate us from our competitors.
Drilling companies compete primarily on a regional basis, and the intensity of competition may vary significantly from region to region at any particular time. If demand for drilling services improves in a region where we operate, our competitors might respond by moving in suitable rigs from other regions. An influx of rigs from other regions could rapidly intensify competition and make any improvement in demand for drilling rigs in a particular region short-lived.
Some of our competitors have greater financial, technical and other resources than we do. Their greater capabilities in these areas may enable them to:
better withstand industry downturns;
compete more effectively on the basis of price and technology;
better retain skilled rig personnel; and
build new rigs or acquire and refurbish existing rigs so as to be able toand place rigsthem into service more quickly than us in periods of high drilling demand.
Production Services DivisionSegment
The market for production services is highly competitive. Competition is influenced by such factors as price, capacity, availability of work crews, type and condition of equipment and reputation and experience of the service provider. We believe that an important competitive factor in establishing and maintaining long-term customerclient relationships is having an experienced, skilled and well-trained work force. In recent years, many of our larger customersclients have placed increased emphasis on the safety performance and quality of the crews, equipment and services provided by their contractors. We have devoted, and will continue to devote, substantial resources toward employee safety and training programs. Although we believe customersclients consider all of these factors, price is generally the primary factor in determining which service provider is awarded the work. However, we believe that most customersclients are willing to pay a slight premium for the quality and efficient service we provide.
The largest well serviceservicing providers that we compete with are Key Energy Services, Basic Energy Services, Nabors Industries, Superior Energy Services, Inc. and CC Forbes. In addition, there are numerous smaller companies that compete in our well serviceservicing markets.
The wireline market is dominated by Schlumberger Ltd. and Halliburton Company. These companies have a substantially larger asset base than we do and operate in all major U.S. oil and natural gas producing basins. Other competitors include Weatherford International, Baker Hughes, Superior Energy Services, Basic Energy Services, and KeyC&J Energy Services. The market for wireline services is very competitive, but historically we have competed effectively with our competitors based on performance and strong customerclient service.
The market for coiled tubing has increased due to the growth in deep well and horizontal drilling. Our primary competitors in the coiled tubing services market include Schlumberger Ltd., Baker Hughes, Halliburton Company, Key Energy Services, RPC Inc. and Superior Energy Services, Inc. In addition, numerous small companies compete in our coiled tubing services markets in the United States.
The fishing and rental tools market is fragmented compared to our other product lines. Companies that provide fishing services generally compete based on the reputation of their fishing tool operators and their relationships with customers.clients. Competition for rental tools is sometimes based on price; however, in most cases, when a customerclient chooses a specific fishing tool operator for a particular job, then the necessary rental equipment will be part of that job as well. Our primary competitors in this areaservice market include Baker Hughes, Weatherford International, Basic Energy Services, Key Energy Services, Quail Tools (owned by Parker Drilling) and Knight Oil Tools.
The need for well servicing, wireline, coiled tubing, and fishing and rental services fluctuates primarily in relation to the price (or anticipated price) of oil and natural gas, which in turn is driven by the supply of and demand for oil and natural gas. Generally, as supply of thosethese commodities decreases and demand increases, service and maintenance requirements increase as oil and natural gas producers attempt to maximize the productivity of their wells in a higher priced environment.
The level of our revenues, earnings and cash flows are substantially dependent upon, and affected by, the level of domestic and international oil and gas exploration and development activity, as well as the equipment capacity in any particular region. For a more detailed discussion, see Item 7—“Management’s Discussion and Analysis of Financial Condition and Results of Operations.”
Raw Materials
The materials and supplies we use in our drilling and production services operations include fuels to operate our drilling and well service equipment, drilling mud, drill pipe, drill collars, drill bits and cement. We do not rely on a single source of supply for any of these items. While
we are not currently experiencing any shortages, from time to time there have been shortages of drilling equipment and supplies during periods of high demand. Shortages could result in increased prices for drilling equipment or supplies that we may be unable to pass on to customers.clients. In addition, during periods of shortages, the delivery times for equipment and supplies can be substantially longer. Any significant delays in our obtaining drilling equipment or supplies could limit our drilling operations and jeopardize our relations with customers.clients. In addition, shortages of drilling equipment or supplies could delay and adversely affect our ability to obtain new contracts for our drilling rigs, which could have a material adverse effect on our financial condition and results of operations.
Operating Risks and Insurance
Our operations are subject to the many hazards inherent in the contract land drilling business, including the risks of:
blowouts;
fires and explosions;
loss of well control;
collapse of the borehole;
lost or stuck drill strings; and
damage or loss from natural disasters.
Any of these hazards can result in substantial liabilities or losses to us from, among other things:
suspension of drilling operations;
damage to, or destruction of, our property and equipment and that of others;
personal injury and loss of life;
damage to producing or potentially productive oil and gas formations through which we drill; and
environmental damage.
We seek to protect ourselves from some but not all operating hazards through insurance coverage. However, some risks are either not insurable or insurance is available only at rates that we consider uneconomical. Those risks include pollution liability in excess of relatively low limits. Depending on competitive conditions and other factors, we attempt to obtain contractual protection against uninsured operating risks from our customers.clients. However, customersclients who provide contractual indemnification protection may not in all cases maintain adequate insurance to support their indemnification obligations. Our insurance or indemnification arrangements may not adequately protect us against liability or loss from all the hazards of our operations. The occurrence of a significant event that we have not fully insured or indemnified against or the failure of a customerclient to meet its indemnification obligations to us could materially and adversely affect our results of operations and financial condition. Furthermore, we may not be able to maintain adequate insurance in the future at rates we consider reasonable.
Our current insurance coverage includes property insurance on our rigs, drilling equipment, production services equipment and real property. Our insurance coverage for property damage to our rigs, drilling equipment and production services equipment is based on our estimates of the cost of comparable used equipment to replace the insured property. The policy provides for a deductible on drilling rigs of $250,000$500,000 per occurrence ($500,000($750,000 deductible for rigs with an insured value greater than $10 million), and a deductible on production services equipment of $100,000$250,000 per occurrence. Our third-party liability insurance coverage is $76$76 million per occurrence and in the aggregate, with a deductible of $260,000$260,000 per occurrence. We also carry insurance coverage for pollution liability up to $20 million with a deductible of $250,000. We believe that we are adequately insured for public liability and property damage to others with respect to our operations. However, such insurance may not be sufficient to protect us against liability for all consequences of well disasters, extensive fire damage or damage to the environment.
In addition, we generally carry insurance coverage to protect against certain hazards inherent in our turnkey contract drilling operations. This insurance covers “control-of-well,” including blowouts above and below the surface, redrilling, seepage and pollution. This policy provides coverage of $3 million, $5 million, $10 million, $15 million or $20 million depending on the area in which the well is drilled and its target depth, subject to a deductible of the greater of 15%12.5% of the well’s anticipated dry hole cost or $150,000.$150,000. This policy also provides care, custody and control insurance, with a limit of $1$1 million, subject to a $100,000$100,000 deductible.
Employees
We currently have approximately 3,3303,750 employees. Approximately 300400 of these employees are salaried administrative or supervisory employees. The rest of our employees are working in operations for our Drilling Services DivisionSegment and Production Services DivisionSegment and are primarily compensated on an hourly basis. The number of employees in operations fluctuates depending
on the utilization of our drilling rigs, well serviceservicing rigs, wireline units and coiled tubing units at any particular time. None of our employment arrangements are subject to collective bargaining arrangements.
Our operations require the services of employees having the technical training and experience necessary to obtainachieve proper operational standards. As a result, our operations depend, to a considerable extent, on the continuing availability of such personnel. Although we have not encountered material difficulty in hiring and retaining employees in our operations, shortages of qualified personnel have occurred in our industry. If we should suffer any material loss of personnel to competitors or be unable to employ additional or replacement personnel with the requisite level of training and experience to adequately operate our equipment, our operations could be materially and adversely affected. While we believe our wage rates are competitive and our relationships with our employees are satisfactory, a significant increase in the wages paid by other employers could result in a reduction in our workforce, increases in wage rates, or both. The occurrence of either of these events for a significant period of time could have a material and adverse effect on our financial condition and results of operations.
Facilities
OurWe lease our corporate office facilities are located at 1250 N.E. Loop 410, Suite 1000 San Antonio, Texas 78209 and are leased through December 2020 with payments escalating from $29,839 per month in January 2012 to $42,635 per month in December 2020, for which the lease term is cancelable as early as December 2016 with applicable penalties.
78209. We conduct our business operations through 8268 other real estate locations, of which we own 14, in the United States (Texas, Oklahoma, Colorado, Utah, Montana, North Dakota, Pennsylvania, Wyoming, Mississippi, Arkansas, Louisiana and Kansas) and internationally in Colombia. These real estate locations are primarily used for regional offices and storage and maintenance yards. We own 10 of these real estate locations and the remaining 72 real estate locations are leased with payments ranging from $250 per month to $30,966 per month with non-cancelable lease terms expiring through August 2022.
Governmental Regulation
Our operations are subject to stringent laws and regulations relating to containment, disposal and controlling the discharge of hazardous oilfield waste and other non-hazardous waste material into the environment, requiring removal and cleanup under certain circumstances, or otherwise relating to the protection of the environment. In addition, our operations are often conducted in or near ecologically sensitive areas, such as wetlands and coastal areas of the Gulf of Mexico, which are subject to special protective measures and which may expose us to additional operating costs and liabilities for accidental discharges of oil, natural gas, drilling fluids or contaminated water, or for noncompliance with other aspects of applicable laws. We are also subject to the requirements of the federal Occupational Safety and Health Act (OSHA) and comparable state statutes. The OSHA hazard communication standard, the Environmental Protection Agency (EPA) “community right-to-know” regulations under Title III of the Federal Superfund Amendment and Reauthorization Act and comparable state statutes require us to organize and report information about the hazardous materials we use in our operations to employees, state and local government authorities and local citizens.
Environmental laws and regulations are complex and subject to frequent change. In some cases, they can impose liability for the entire cost of cleanup on any responsible party, without regard to negligence or fault, and can impose liability on us for the conduct of others or conditions others have caused, or for our acts that complied with all applicable requirements when we performed them. We may also be exposed to environmental or other liabilities originating from businesses and assets that we purchased from others. Compliance with applicable environmental laws and regulations has not, to date, materially affected our capital expenditures, earnings or competitive position, although compliance measures have added to our costs of operating drilling equipment in some instances. We do not expect to incur material capital expenditures in our next fiscal year in order to comply with current environment control regulations. However, our compliance with amended, new or more stringent requirements, stricter interpretations of existing requirements or the future discovery of contamination may require us to make material expenditures or subject us to liabilities that we currently do not anticipate.
There are a variety of regulatory developments, proposals or requirements and legislative initiatives that have been introduced in the United States and international regions in which we operate that are focused on restricting the emission of carbon dioxide, methane and other greenhouse gases. Among these developments are the United Nations Framework Convention on Climate Change, also known as the “Kyoto Protocol” (an internationally applied protocol, which has been ratified in Colombia, one of our reporting segments), the Regional Greenhouse Gas Initiative or “RGGI” in the Northeastern United States, and the Western Regional Climate Action Initiative in the Western United States.
The U.S. Congress has from time to time considered legislation to reduce emissions of greenhouse gases, primarily through the development of greenhouse gas cap and trade programs. In addition, more than one-third of the states already have begun implementing legal measures to reduce emissions of greenhouse gases.
In 2007, the United States Supreme Court in Massachusetts, et al. v. EPA, held that carbon dioxide may be regulated as an “air pollutant” under the federal Clean Air Act. On December 7, 2009, the EPA responded to the Massachusetts, et al. v. EPA decision and issued a finding that the current and projected concentrations of greenhouse gases in the atmosphere threaten the public health and welfare of current and future generations, and that certain greenhouse gases from new motor vehicles and motor vehicle engines contribute to the atmospheric concentrations of greenhouse gases and hence to the threat of climate change.
Based on these findings, in 2010 the EPA adopted two sets of regulations that restrict emissions of greenhouse gases under existing provisions of the federal Clean Air Act, including one that requires a reduction in emissions of greenhouse gases from motor vehicles and another that requires certain construction and operating permit reviews for greenhouse gas emissions from certain large stationary sources. The stationary source final rule addresses the permitting of greenhouse gas emissions from stationary sources under the Clean Air Act Prevention of Significant Deterioration construction and Title V operating permit programs, pursuant to which these permit programs have been "tailored" to apply to certain stationary sources of greenhouse gas emissions in a multi-step process, with the largest sources first subject to permitting. In addition, the EPA adopted rules requiring the monitoring and reporting of greenhouse gases from certain sources, including, among others, onshore oil and natural gas production facilities.
In April 2012, the EPA issued regulations specifically applicable to the oil and gas industry that will require operators to significantly reduce volatile organic compounds, or VOC, emissions from natural gas wells that are hydraulically fractured through the use of “green completions” to capture natural gas that would otherwise escape into the air. The EPA also issued regulations that establish standards for VOC emissions from several types of equipment at natural gas well sites, including storage tanks, compressors, dehydrators and pneumatic controllers.
Although it is not possible at this time to predict whether proposed legislation or regulations will be adopted as initially written, if at all, or how legislation or new regulations that may be adopted to address greenhouse gas emissions would impact our business, any such future laws and regulations could result in increased compliance costs or additional operating restrictions. Any additional costs or operating restrictions associated with legislation or regulations regarding greenhouse gas emissions could have a material adverse effect on our operating results and cash flows. In addition, these developments could curtail the demand for fossil fuels such as oil and gas in areas of the world where our customersclients operate and thus adversely affect demand for our services, which may in turn adversely affect our future results of operations. Finally, we cannot predict with any certainty whether changes to temperature, storm intensity or precipitation patterns as a result of climate change will have a material impact on our operations.
Hydraulic fracturing is a commonly used process that involves injection of water, sand, and a minor amount of certain chemicals to fracture the hydrocarbon-bearing rock formation to allow flow of hydrocarbons into the wellbore. The federal Energy Policy Act of 2005 amended the Underground Injection Control provisions of the federal Safe Drinking Water Act (SDWA) to exclude certain hydraulic fracturing practices from the definition of "underground injection." The EPA has asserted regulatory authority over certain hydraulic fracturing activities involving diesel fuel and has begun the process of draftingdeveloped draft guidance relating to such practices. In addition, repeal of the SDWA exclusion of hydraulic fracturing has been advocated by certain advocacy organizations and others in the public. LegislationCongress has also been introduced before Congressfrom time to time considered legislation to repeal the exemption for hydraulic fracturing from the SDWA, which would have the effect of allowing the EPA to promulgate new regulations and permitting requirements for hydraulic fracturing, and to require the disclosure of the chemical constituents of hydraulic fracturing fluids to a regulatory agency, which would make the information public via the Internet.
Scrutiny of hydraulic fracturing activities continues in other ways, with the EPA having commenced a study of the potential environmental impacts of hydraulic fracturing, the initial results of which are expected to be available by late 2012 and the final results of which are expected in 2014. In addition, in April 2012, the EPA issued the first federal air standards for natural gas wells that are hydraulically fractured, which will require operators to significantly reduce VOC emissions through the use of “green completions” to capture natural gas that would otherwise escape into the air. Moreover, the EPA is developing effluent limitations for the treatment and discharge of wastewater resulting from hydraulic fracturing activities and plans to propose these standards by 2014. The U.S. Department of the Interior has also announced that it will proposeproposed regulations relating to the use of hydraulic fracturing techniques on public lands and disclosure of fracturing fluid constituents.
In addition, some states and localities have adopted, and others are considering adopting, regulations or ordinances that could restrict hydraulic fracturing in certain circumstances, that would require, with some exceptions, disclosure of constituents of hydraulic fracturing fluids, or that would impose higher taxes, fees or royalties on natural gas production. Moreover, public debate over hydraulic fracturing and shale gas production has been increasing, and has resulted in delays of well permits in some areas.
Increased regulation and attention given to the hydraulic fracturing process could lead to greater opposition, including litigation, to oil and gas production activities using hydraulic fracturing techniques. Additional legislation or regulation could also lead to operational delays or increased operating costs in the production of oil and natural gas, including from the developing shale plays, incurred by our customers.clients. The adoption of any federal, state or local laws or the implementation of regulations or ordinances restricting or increasing the costs of hydraulic fracturing could cause a decrease in the completion of new oil and natural gas wells and an associated decrease in demand for our drilling and well servicing activities, any or all of which could adversely affect our financial position, results of operations and cash flows.
In addition, our business depends on the demand for land drilling and production services from the oil and gas industry and, therefore, is affected by tax, environmental and other laws relating to the oil and gas industry generally, by changes in those laws
and by changes in related administrative regulations. It is possible that these laws and regulations may in the future add significantly to our operating costs or those of our customers,clients, or otherwise directly or indirectly affect our operations.
Our wireline operations involve the use of radioactive isotopes along with other nuclear, electrical, acoustic, and mechanical devices. Our activities involving the use of isotopes are regulated by the U.S. Nuclear Regulatory Commission and specified agencies of certain states. Additionally, we use high explosive charges for perforating casing and formations, and we use various explosive cutters to assist in wellbore cleanout. Such operations are regulated by the U.S. Department of Justice, Bureau of Alcohol, Tobacco, Firearms, and Explosives and require us to obtain licenses or other approvals for the use of densitometers as well as explosive charges. We have obtained these licenses and approvals when necessary and believe that we are in substantial compliance with these federal requirements.
Among the services we provide, we operate as a motor carrier for the transportation of our own equipment and therefore are subject to regulation by the U.S. Department of Transportation and by various state agencies. These regulatory authorities exercise broad powers, governing activities such as the authorization to engage in motor carrier operations and regulatory safety. There are additional regulations specifically relating to the trucking industry, including testing and specification of equipment and product handling requirements. The trucking industry is subject to possible regulatory and legislative changes that may affect the economics of the industry by requiring changes in operating practices or by changing the demand for common or contract carrier services or the cost of providing truckload services. Some of these possible changes include increasingly stringent environmental regulations, changes in the hours of service regulations which govern the amount of time a driver may drive in any specific period, onboard black box recorder devices or limits on vehicle weight and size.
Interstate motor carrier operations are subject to safety requirements prescribed by the U.S. Department of Transportation. To a large degree, intrastate motor carrier operations are subject to state safety regulations that mirror federal regulations. Such matters as weight and dimension of equipment are also subject to federal and state regulations.
From time to time, various legislative proposals are introduced, including proposals to increase federal, state, or local taxes, including taxes on motor fuels, which may increase our costs or adversely impact the recruitment of drivers. We cannot predict whether, or in what form, any increase in such taxes applicable to us will be enacted.
Available Information
Our Website address is www.pioneerdrlg.comwww.pioneeres.com. Our annual reports on Form 10-K, quarterly reports on Form 10-Q, current reports on Form 8-K and amendments to those reports, are available free of charge through our Website as soon as reasonably practicable after we electronically file those materials with, or furnish those materials to, the Securities and Exchange Commission. The public may read and copy these materials at the Securities and Exchange Commission’s Public Reference Room at 100 F Street, N.E., Washington, DC 20549. For additional information on the Securities and Exchange Commission’s Public Reference Room, please call 1-800-SEC-0330. In addition, the Securities and Exchange Commission maintains an Internet site at www.sec.gov that contains reports, proxy and information statements and other information regarding issuers that file electronically. We have also posted on our Website our: Charters for the Audit, Compensation, and Nominating and Corporate Governance Committees of our Board; Code of Business Conduct and Ethics; Rules of Conduct;Corporate Governance Guidelines; and Company Contact Information.
The information set forth in this Item 1A should be read in conjunction with the rest of the information included in this report, including “Management’s Discussion and Analysis of Financial Condition and Results of Operations” in Item 7 and the historical financial statements and related notes this report contains. While we attempt to identify, manage and mitigate risks and uncertainties associated with our business to the extent practical under the circumstances, some level of risk and uncertainty will always be present. Additional risks and uncertainties that are not presently known to us or that we currently believe are immaterial also may negatively impact our business, financial condition or operating results.
Set forth below are various risks and uncertainties that could adversely impact our business, financial condition, results of operations and cash flows.
Risks Relating to the Oil and Gas Industry
We derive all our revenues from companies in the oil and gas exploration and production industry, a historically cyclical industry with levels of activity that are significantly affected by the levels and volatility of oil and gas prices.
As a provider of contract land drilling services and oil and gas production services, our business depends on the level of exploration and production activity in the geographic markets where we operate. The oil and gas exploration and production industry is a historically cyclical industry characterized by significant changes in the levels of exploration and development
activities. Oil and gas prices, and market expectations of potential changes in those prices, significantly affect the levels of those activities. Worldwide political, economic, and military events as well as natural disasters have contributed to oil and gas price volatility and are likely to continue to do so in the future. Any prolonged reduction in the overall level of exploration and development activities, whether resulting from changes in oil and gas prices or otherwise, could materially and adversely affect us in many ways by negatively impacting:
our revenues, cash flows and profitability;
the fair market value of our drilling rig fleet and production service assets;services equipment;
our ability to maintain or increase our borrowing capacity;
our ability to obtain additional capital to finance our business and make acquisitions, and the cost of that capital; and
our ability to retain skilled rig personnel whom we would need in the event of an upturn in the demand for our services.
Depending on the market prices of oil and gas, oil and gas exploration and production companies may cancel or curtail their drilling programs and may lower production spending on existing wells, thereby reducing demand for our services. Many factors beyond our control affect oil and gas prices, including:
the cost of exploring for, producing and delivering oil and gas;
the discovery rate of new oil and gas reserves;
the rate of decline of existing and new oil and gas reserves;
available pipeline and other oil and gas transportation capacity;
the levels of oil and gas storage;
the ability of oil and gas exploration and production companies to raise capital;
economic conditions in the United States and elsewhere;
actions by OPEC, the Organization of Petroleum Exporting Countries;
political instability in the Middle East and other major oil and gas producing regions;
governmental regulations, both domestic and foreign;
domestic and foreign tax policy;
weather conditions in the United States and elsewhere;
the pace adopted by foreign governments for the exploration, development and production of their national reserves;
the price of foreign imports of oil and gas; and
the overall supply and demand for oil and gas.
Oil and gas prices have been volatile historically and, we believe, will continue to be so in the future. During late 2008 and continuing into late 2009, oil and natural gas prices fell significantly below the levels seen in late 2008, and whilemid-2008. While oil prices have improved during 2010 and 2011,generally recovered from the low levels in late 2008, natural gas prices have remained depressed. Future declines in and volatility in oil and gas prices could materially and adversely affect our business and financial results.
Risks Relating to Our Business
Reduced demand for or excess capacity of drilling services or production services could adversely affect our profitability.
Our profitability in the future will depend on many factors, but largely on pricing and utilization rates for our drilling and production services. A reduction in the demand for drilling rigs or an increase in the supply of drilling rigs, whether through new construction or refurbishment, could decrease the dayrates and utilization rates for our drilling services, which would adversely affect our revenues and profitability. An increase in supply of well serviceservicing rigs, wireline units, coiled tubing units, and fishing and rental tools and equipment, without a corresponding increase in demand, could similarly decrease the pricing and utilization rates of our production services, which would adversely affect our revenues and profitability. Currently, there are growing expectations of a possible downturn in the global economic environment in 2012, which could lead to a decline in oil and natural gas prices that would adversely affect our business.
We operate in a highly competitive, fragmented industry in which price competition could reduce our profitability.
We encounter substantial competition from other drilling contractors and other oilfield service companies. Our primary market areas are highly fragmented and competitive. The fact that drilling and well service rigsproduction services equipment are mobile and can
be moved from one market to another in response to market conditions heightens the competition in the industry and may result in an oversupply of rigsequipment in an area. Contract drilling companies and other oilfield service companies compete primarily on a regional basis, and the intensity of competition may vary significantly from region to region at any particular time. If demand for drilling or production services improves in a region where we operate, our competitors might respond by moving in suitable rigs and production services equipment from other regions. An influx of rigsequipment from other regions could rapidly intensify competition, reduce profitability and make any improvement in demand for drilling or production services short-lived.
Most drilling services contracts and production services contracts are awarded on the basis of competitive bids, which also results in price competition. In addition to pricing and rigequipment availability, we believe the following factors are also important to our customersclients in determining which drilling services or production services provider to select:
the type and condition of each of the competing drilling rigs, well servicing rigs, wireline units and well service rigs;coiled tubing units;
the mobility and efficiency of the rigs;equipment;
the quality of service and experience of the rig crews;
the safety recordsrecord of the rigs;company providing the services;
the offering of ancillary services; and
the ability to provide drilling and production services equipment adaptable to, and personnel familiar with, new technologies and drilling and production techniques.
While we must be competitive in our pricing, our competitive strategy generally emphasizes the quality of our equipment, theour safety record, of our rigs, our ability to offer ancillary services, the experience of our crews and the quality of service and experience of our rig crewswe provide to differentiate us from our competitors. This strategy is less effective aswhen lower demand for drilling and production services or an oversupply of drilling and well service rigs intensifies price competition and makes it more difficult for us to compete on the basis of factors other than price. In all of the markets in which we compete, an oversupply of drilling rigs or production services equipment can cause greater price competition, which can reduce our profitability.
We face competition from many competitors with greater resources.
Some of our competitors have greater financial, technical and other resources than we do. Their greater capabilities in these areas may enable them to:
better withstand industry downturns;
compete more effectively on the basis of price and technology;
retain skilled rig personnel; and
build new rigs or acquire and refurbish existing rigs so as to be able toand place rigsthem into service more quickly than us in periods of high drilling demand.
Additionally, although we take measures to ensure that we use advanced technologies for drilling and production services equipment, changes in technology or improvements in our competitors’ equipment could make our equipment less competitive or require significant capital investments to keep our equipment competitive.
Unexpected cost overruns on our turnkey drilling jobs and our footage contracts could adversely affect our financial position and our results of operations.
We have historically derived a portion of our revenues from turnkey drilling contracts, and we expect turnkey contracts will continue to represent a component of our future revenues. The occurrence of uninsured or under-insured losses or operating cost overruns on our turnkey jobs could have a material adverse effect on our financial position and results of operations. Under a typical turnkey drilling contract, we agree to drill a well for our customerclient to a specified depth and under specified conditions for a fixed price. We provide technical expertise and engineering services, as well as most of the equipment and drilling supplies required to drill the well. We often subcontract for related services, such as the provision of casing crews, cementing and well logging. Under typical turnkey drilling arrangements, we do not receive progress payments and are paid by our customerclient only after we have performed the terms of the drilling contract in full. For these reasons, the risk to us under a turnkey drilling contract is substantially greater than for a well drilled on a daywork basis because we must assume most of the risks associated with drilling operations that the operator generally assumes under a daywork contract, including the risks of blowout, loss of hole, stuck drill pipe, machinery breakdowns, abnormal drilling conditions and risks associated with subcontractors’ services, supplies, cost escalations and personnel. Similar to our turnkey contracts, under a footage contract we assume most of the risks associated with drilling operations
that the operator generally assumes under a daywork contract. In addition, since we are only paid by our customersclients after we have performed the terms of the drilling contract in full, our liquidity can be affected by the number of turnkey and footage contracts that we enter into.
Although we attempt to obtain insurance coverage to reduce certain of the risks inherent in our turnkey drilling operations, adequate coverage may be unavailable in the future and we might have to bear the full cost of such risks, which could have an adverse effect on our financial condition and results of operations.
Our operations involve operating hazards, which, if not insured or indemnified against, could adversely affect our results of operations and financial condition.
Our operations are subject to the many hazards inherent in the drilling and well servicesservicing industries, including the risks of:
blowouts;
cratering;
fires and explosions;
loss of well control;
collapse of the borehole;
damaged or lost drilling equipment; and
damage or loss from natural disasters.
Any of these hazards can result in substantial liabilities or losses to us from, among other things:
suspension of operations;
damage to, or destruction of, our property and equipment and that of others;
personal injury and loss of life;
damage to producing or potentially productive oil and gas formations through which we drill; and
environmental damage.
We seek to protect ourselves from some but not all operating hazards through insurance coverage. However, some risks are either not insurable or insurance is available only at rates that we consider uneconomical. Those risks include, among other things, pollution liability in excess of relatively low limits. Depending on competitive conditions and other factors, we attempt to obtain contractual protection against uninsured operating risks from our customers.clients. However, customersclients who provide contractual indemnification protection may not in all cases maintain adequate insurance or otherwise have the financial resources necessary to support their indemnification obligations. Our insurance or indemnification arrangements may not adequately protect us against liability or loss from all the hazards of our operations. The occurrence of a significant event that we have not fully insured or indemnified against or the failure of a customerclient to meet its indemnification obligations to us could materially and adversely affect our results of operations and financial condition. Furthermore, we may be unable to maintain adequate insurance in the future at rates we consider reasonable.
We could be adversely affected if shortages of equipment, supplies or personnel occur.
From time to time there have been shortages of drilling and production services equipment and supplies during periods of high demand which we believe could recur. Shortages could result in increased prices for drilling and production services equipment or supplies that we may be unable to pass on to customers.clients. In addition, during periods of shortages, the delivery times for equipment and supplies can be substantially longer. Any significant delays in our obtaining drilling and production services equipment or supplies could limit drilling and production services operations and jeopardize our relations with customers.clients. In addition, shortages of drilling and production services equipment or supplies could delay and adversely affect our ability to obtain new contracts for our rigs, which could have a material adverse effect on our financial condition and results of operations.
Our strategy of constructing drilling rigs during periods of peak demand requires that we maintain an adequate supply of drilling rig components to complete our rig building program. Our suppliers may be unable to continue providing us the needed drilling rig components if their manufacturing sources are unable to fulfill their commitments.
Our operations require the services of employees having the technical training and experience necessary to obtainachieve the proper operational results. As a result, our operations depend, to a considerable extent, on the continuing availability of such personnel. Shortages of qualified personnel have occurred in our industry. If we should suffer any material loss of personnel to competitors or be unable to employ additional or replacement personnel with the requisite level of training and experience to adequately operate
our equipment, our operations could be materially and adversely affected. A significant increase in the wages paid by other employers could result in a reduction in our workforce, increases in wage rates, or both. The occurrence of either of these events for a significant period of time could have a material and adverse effect on our financial condition and results of operations.
Our acquisition strategy exposes us to various risks, including those relating to difficulties in identifying suitable acquisition opportunities and integrating businesses, assets and personnel, as well as difficulties in obtaining financing for targeted acquisitions and the potential for increased leverage or debt service requirements.
As a key component of our business strategy, we have pursued and intend to continue to pursue acquisitions of complementary assets and businesses. For example, since September 1999, we have significantly expanded our drilling rig fleet through acquisitions and through the construction of rigs from new and used components, and in March 2008, we acquired two production services businesses which significantly expanded our service offerings with the acquisition of two production services businesses, which provideto include well services,servicing, wireline services and fishing and rental services. On December 31, 2011, we acquired the coiled tubing services business of Go-Coil to complement our existing production services offerings.
Our acquisition strategy in general, and our recent acquisitions in particular, involve numerous inherent risks, including:
unanticipated costs and assumption of liabilities and exposure to unforeseen liabilities of acquired businesses, including environmental liabilities;
difficulties in integrating the operations and assets of the acquired business and the acquired personnel;
limitations on our ability to properly assess and maintain an effective internal control environment over an acquired business in order to comply with applicable periodic reporting requirements;
potential losses of key employees and customersclients of the acquired businesses;
risks of entering markets in which we have limited prior experience; and
increases in our expenses and working capital requirements.
The process of integrating an acquired business may involve unforeseen costs and delays or other operational, technical and financial difficulties that may require a disproportionate amount of management attention and financial and other resources. Possible future acquisitions may be for purchase prices significantly higher than those we paid for previous acquisitions. Our failure to achieve consolidation savings, to incorporate the acquired businesses and assets into our existing operations successfully or to minimize any unforeseen operational difficulties could have a material adverse effect on our financial condition and results of operations.
In addition, we may not have sufficient capital resources to complete additional acquisitions. Historically, we have funded business acquisitions and the growth of our rig fleet through a combination of debt and equity financing. We may incur substantial additional indebtedness to finance future acquisitions and also may issue equity securities or convertible securities in connection with such acquisitions. Debt service requirements could represent a significant burden on our results of operations and financial condition and the issuance of additional equity or convertible securities could be dilutive to our existing shareholders. Furthermore, we may not be able to obtain additional financing on satisfactory terms.
Even if we have access to the necessary capital, we may be unable to continue to identify additional suitable acquisition opportunities, negotiate acceptable terms or successfully acquire identified targets.
Our indebtedness could restrict our operations and make us more vulnerable to adverse economic conditions.
Our indebtedness is primarily a result of the two production services businesses that we acquired in 2008 and more recently, the acquisition of Go-Coil in 2011. At December 31, 20112012, our total debt balance of $419.6519.6 million primarily consists of $417.7418.6 million outstanding under our Senior Notes. As of December 31, 20112012, our Revolving Credit Facility had a zero$100.0 million balance outstanding, with a current availability of $241.0141.0 million.
Our current and future indebtedness could have important consequences, including:
impairing our ability to make investments and obtain additional financing for working capital, capital expenditures, acquisitions or other general corporate purposes;
limiting our ability to use operating cash flow in other areas of our business because we must dedicate a substantial portion of these funds to make principal and interest payments on our indebtedness;
making us more vulnerable to a downturn in our business, our industry or the economy in general as a substantial portion of our operating cash flow could be required to make principal and interest payments on our indebtedness, making it more difficult to react to changes in our business, industry and market conditions;
limiting our flexibility in planning for, or reacting to, changes in our business and the industry in which we operate;
limiting our ability to obtain additional financing that may be necessary to operate or expand our business;
putting us at a competitive disadvantage to competitors that have less debt; and
increasing our vulnerability to rising interest rates.
We anticipate that our cash generated by operations and our ability to borrow under the currently unused portion of our Revolving Credit Facility should allow us to meet our routine financial obligations for at least the foreseeable future.next twelve months. However, our ability to make payments on our indebtedness, and to fund planned capital expenditures, will depend on our ability to generate cash in the future. This, to a certain extent, is subject to conditions in the oil and gas industry, general economic and financial conditions, competition in the markets where we operate, the impact of legislative and regulatory actions on how we conduct our business and other factors, all of which are beyond our control. If our business does not generate sufficient cash flow from operations to service our outstanding indebtedness, we may have to undertake alternative financing plans, such as:
refinancing or restructuring our debt;
selling assets;
reducing or delaying acquisitions or capital investments, such as refurbishments of our rigs and related equipment; or
seeking to raise additional capital.
However, we may be unable to implement alternative financing plans, if necessary, on commercially reasonable terms or at all, and any such alternative financing plans might be insufficient to allow us to meet our debt obligations. If we are unable to generate sufficient cash flow or are otherwise unable to obtain the funds required to make principal and interest payments on our indebtedness, or if we otherwise fail to comply with the various covenants in our Revolving Credit Facility or other instruments governing any future indebtedness, we could be in default under the terms of our Revolving Credit Facility or such instruments. In the event of a default, the lenders under our Revolving Credit Facility could elect to declare all the loans made under such facility to be due and payable together with accrued and unpaid interest and terminate their commitments thereunder and we or one or more of our subsidiaries could be forced into bankruptcy or liquidation. Any of the foregoing consequences could materially and adversely affect our business, financial condition, results of operations and prospects.
Our Revolving Credit Facility and our Senior Notes impose restrictions on us that may affect our ability to successfully operate our business.
Our Revolving Credit Facility limits our ability to take various actions, such as:
limitations on the incurrence of additional indebtedness;
restrictions on investments, capital expenditures, mergers or consolidations, asset dispositions, acquisitions, transactions with affiliates and other transactions without the lenders’ consent; and
limitation on dividends and distributions.
In addition, our Revolving Credit Facility requires us to maintain certain financial ratios and to satisfy certain financial conditions, which may require us to reduce our debt or take some other action in order to comply with them.
The Indenture governing our Senior Notes contains certain restrictions on our and certain of our subsidiaries’ ability to:
pay dividends on stock;
repurchase stock or redeem subordinated debt or make other restricted payments;
incur, assume or guarantee additional indebtedness or issue disqualified stock;
create liens on the our assets;
enter into sale and leaseback transactions;
pay dividends, engage in loans, or transfer other assets from certain of our subsidiaries;
consolidate with or merge with or into, or sell all or substantially all of our properties to another person;
enter into transactions with affiliates; and
enter into new lines of business.
The failure to comply with any of these restrictions or conditions would cause an event of default under our Revolving Credit Facility or our Senior Notes. An event of default, if not waived, could result in acceleration of the outstanding indebtedness, in which case the debt would become immediately due and payable. If this occurs, we may not be able to pay our debt or borrow sufficient funds to refinance it. Even if new financing is available, it may not be available on terms that are acceptable to us. These restrictions could also limit our ability to obtain future financing, make needed capital expenditures, withstand a downturn in our business or the economy in general, or otherwise conduct necessary corporate activities. We also may be prevented from taking advantage of business opportunities that arise because of the limitations imposed on us by the restrictive covenants under our Revolving Credit Facility and our Senior Notes.
Our international operations are subject to political, economic and other uncertainties not encountered in our domestic operations.
As we continue to implement our strategy of expanding into areas outside the United States, ourOur international operations will beare subject to political, economic and other uncertainties not generally encountered in our U.S. operations. These willoperations which include, among potential others:
risks of war, terrorism, civil unrest and kidnapping of employees;
expropriation, confiscation or nationalization of our assets;
renegotiation or nullification of contracts;
foreign taxation;
the inability to repatriate earnings or capital due to laws limiting the right and ability of foreign subsidiaries to pay dividends and remit earnings to affiliated companies;
changing political conditions and changing laws and policies affecting trade and investment;
concentration of customers;clients;
regional economic downturns;
the overlap of different tax structures;
the burden of complying with multiple and potentially conflicting laws;
the risks associated with the assertion of foreign sovereignty over areas in which our operations are conducted;
the risks associated with any lack of compliance with the Foreign Corrupt Practices Act of 1977 ("FCPA") or other anti-corruption laws;
the risks associated with fluctuating currency values, hard currency shortages and controls of foreign currency exchange;
difficulty in collecting international accounts receivable; and
potentially longer payment cycles.
Our international operations are concentrated in Colombia and most of our drilling contracts are with one customer,client, Ecopetrol. We believe our relationship with Ecopetrol is good; however, the loss of this large customerclient could have an adverse effect on our business, financial condition and result of operations.
Our international operations may also face the additional risks of fluctuating currency values, hard currency shortages and controls of foreign currency exchange. Additionally, in some jurisdictions, we may be subject to foreign governmental regulations favoring or requiring the awarding of contracts to local contractors or requiring foreign contractors to employ citizens of, or purchase supplies from, a particular jurisdiction. These regulations could adversely affect our ability to compete.
We are committed to doing business in accordance with applicable anti-corruption laws and our code of conduct and ethics. We are subject, however, to the risk that our employees and agents may take action determined to be in violation of anti-corruption laws, including the FCPA or other similar laws. Any violation of the FCPA or other applicable anti-corruption laws could result in substantial fines, sanctions, civil and/or criminal penalties and curtailment of operations in certain jurisdictions and might materially adversely affect our business, results of operations or financial condition. In addition, actual or alleged violations could damage our reputation and ability to do business. Further, detecting, investigating, and resolving actual or alleged violations is expensive and can consume significant time and attention of our senior management.
Our operations are subject to various laws and governmental regulations that could restrict our future operations and increase our operating costs.
Many aspects of our operations are subject to various federal, state and local laws and governmental regulations, including laws and regulations governing:
environmental quality;
pollution control;
remediation of contamination;
preservation of natural resources;
transportation, and
worker safety.
Our operations are subject to stringent federal, state and local laws, rules and regulations governing the protection of the environment and human health and safety. Some of those laws, rules and regulations relate to the disposal of hazardous substances, oilfield waste and other waste materials and restrict the types, quantities and concentrations of those substances that can be released into the environment. Several of those laws also require removal and remedial action and other cleanup under certain circumstances, commonly regardless of fault. Our operations routinely involve the handling of significant amounts of waste materials, some of which are classified as hazardous substances. Planning, implementation and maintenance of protective measures are required to prevent accidental discharges. Spills of oil, natural gas liquids, drilling fluids and other substances may subject us to penalties and cleanup requirements. Handling, storage and disposal of both hazardous and non-hazardous wastes are also subject to these regulatory requirements. In addition, our operations are often conducted in or near ecologically sensitive areas, such as wetlands, which are subject to special protective measures and which may expose us to additional operating costs and liabilities for accidental discharges of oil, gas, drilling fluids, contaminated water or other substances, or for noncompliance with other aspects of applicable laws and regulations.
The federal Clean Water Act, as amended by the Oil Pollution Act, the federal Clean Air Act, the federal Resource Conservation and Recovery Act, the federal Comprehensive Environmental Response, Compensation, and Liability Act, or CERCLA, the Safe Drinking Water Act, or SDWA, the federal Outer Continental Shelf Lands Act, the Occupational Safety and Health Act, or OSHA, and their state counterparts and similar statutes are the primary statutes that impose the requirements described above and provide for civil, criminal and administrative penalties and other sanctions for violation of their requirements. The OSHA hazard communication standard, the Environmental Protection Agency “community right-to-know” regulations under Title III of the federal Superfund Amendment and Reauthorization Act and comparable state statutes require us to organize and report information about the hazardous materials we use in our operations to employees, state and local government authorities and local citizens. In addition, CERCLA, also known as the “Superfund” law, and similar state statutes impose strict liability, without regard to fault or the legality of the original conduct, on certain classes of persons who are considered responsible for the release or threatened release of hazardous substances into the environment. These persons include the current owner or operator of a facility where a release has occurred, the owner or operator of a facility at the time a release occurred, and companies that disposed of or arranged for the disposal of hazardous substances found at a particular site. This liability may be joint and several. Such liability, which may be imposed for the conduct of others and for conditions others have caused, includes the cost of removal and remedial action as well as damages to natural resources. Few defenses exist to the liability imposed by environmental laws and regulations. It is also common for third parties to file claims for personal injury and property damage caused by substances released into the environment.
Environmental laws and regulations are complex and subject to frequent change. Failure to comply with governmental requirements or inadequate cooperation with governmental authorities could subject a responsible party to administrative, civil or criminal action. We may also be exposed to environmental or other liabilities originating from businesses and assets which we acquired from others. Our compliance with amended, new or more stringent requirements, stricter interpretations of existing requirements or the future discovery of contamination or regulatory noncompliance may require us to make material expenditures or subject us to liabilities that we currently do not anticipate.
There are a variety of regulatory developments, proposals or requirements and legislative initiatives that have been introduced in the United States and international regions in which we operate that are focused on restricting the emission of carbon dioxide, methane and other greenhouse gases. Among these developments are the United Nations Framework Convention on Climate Change, also known as the “Kyoto Protocol” (an internationally applied protocol, which has been ratified in Colombia, one of our reporting segments), the Regional Greenhouse Gas Initiative or “RGGI” in the Northeastern United States, and the Western Regional Climate Action Initiative in the Western United States.
The U.S. Congress has from time to time considered legislation to reduce emissions of greenhouse gases, primarily through the development of greenhouse gas cap and trade programs. In addition, more than one-third of the states already have begun implementing legal measures to reduce emissions of greenhouse gases.
In 2007, the United States Supreme Court in Massachusetts, et al. v. EPA, held that carbon dioxide may be regulated as an “air pollutant” under the federal Clean Air Act. On December 7, 2009, the EPA responded to the Massachusetts, et al. v. EPA decision and issued a finding that the current and projected concentrations of greenhouse gases in the atmosphere threaten the public health and welfare of current and future generations, and that certain greenhouse gases from new motor vehicles and motor vehicle engines contribute to the atmospheric concentrations of greenhouse gases and hence to the threat of climate change.
Based on these findings, in 2010 the EPA adopted two sets of regulations that restrict emissions of greenhouse gases under existing provisions of the federal Clean Air Act, including one that requires a reduction in emissions of greenhouse gases from motor vehicles and another that requires certain construction and operating permit reviews for greenhouse gas emissions from certain large stationary sources. The stationary source final rule addresses the permitting of greenhouse gas emissions from stationary sources under the Clean Air Act Prevention of Significant Deterioration construction and Title V operating permit programs, pursuant to which these permit programs have been "tailored" to apply to certain stationary sources of greenhouse gas emissions in a multi-step process, with the largest sources first subject to permitting. In addition, the EPA adopted rules requiring the monitoring and reporting of greenhouse gases from certain sources, including, among others, onshore oil and natural gas production facilities.
In April 2012, the EPA issued regulations specifically applicable to the oil and gas industry that will require operators to significantly reduce volatile organic compounds, or VOC, emissions from natural gas wells that are hydraulically fractured through the use of “green completions” to capture natural gas that would otherwise escape into the air. The EPA also issued regulations that establish standards for VOC emissions from several types of equipment at natural gas well sites, including storage tanks, compressors, dehydrators and pneumatic controllers.
Although it is not possible at this time to predict whether proposed legislation or regulations will be adopted as initially written, if at all, or how legislation or new regulations that may be adopted to address greenhouse gas emissions would impact our business, any such future laws and regulations could result in increased compliance costs or additional operating restrictions. Any additional costs or operating restrictions associated with legislation or regulations regarding greenhouse gas emissions could have a material adverse effect on our operating results and cash flows. In addition, these developments could curtail the demand for fossil fuels such as oil and gas in areas of the world where our customersclients operate and thus adversely affect demand for our services, which may in turn adversely affect our future results of operations. Finally, we cannot predict with any certainty whether changes to temperature, storm intensity or precipitation patterns as a result of climate change will have a material impact on our operations.
In addition, our business depends on the demand for land drilling and production services from the oil and gas industry and, therefore, is affected by tax, environmental and other laws relating to the oil and gas industry generally, by changes in those laws and by changes in related administrative regulations. It is possible that these laws and regulations may in the future add significantly to our operating costs or those of our customers,clients, or otherwise directly or indirectly affect our operations.
Among the services we provide, we operate as a motor carrier and therefore are subject to regulation by the U.S. Department of Transportation and by various state agencies. These regulatory authorities exercise broad powers, governing activities such as the authorization to engage in motor carrier operations and regulatory safety. There are additional regulations specifically relating to the trucking industry, including testing and specification of equipment and product handling requirements. The trucking industry is subject to possible regulatory and legislative changes that may affect the economics of the industry by requiring changes in operating practices or by changing the demand for common or contract carrier services or the cost of providing truckload services. Some of these possible changes include increasingly stringent environmental regulations, changes in the hours of service regulations which govern the amount of time a driver may drive in any specific period, onboard black box recorder devices or limits on vehicle weight and size.
Interstate motor carrier operations are subject to safety requirements prescribed by the U.S. Department of Transportation. To a large degree, intrastate motor carrier operations are subject to state safety regulations that mirror federal regulations. Such matters as weight and dimension of equipment are also subject to federal and state regulations.
From time to time, various legislative proposals are introduced, including proposals to increase federal, state, or local taxes, including taxes on motor fuels, which may increase our costs or adversely impact the recruitment of drivers. We cannot predict whether, or in what form, any increase in such taxes applicable to us will be enacted.
Federal and state legislative and regulatory initiatives related to hydraulic fracturing could result in operating restrictions or delays in the completion of oil and natural gas wells that may reduce demand for our drilling and well servicing activities and could adversely affect our financial position, results of operations and cash flows.
Hydraulic fracturing is a commonly used process that involves injection of water, sand, and a minor amount of certain chemicals to fracture the hydrocarbon-bearing rock formation to allow flow of hydrocarbons into the wellbore. The federal Energy Policy Act of 2005 amended the Underground Injection Control provisions of the federal Safe Drinking Water Act (SDWA) to exclude certain hydraulic fracturing practices from the definition of "underground injection." The EPA has asserted regulatory authority over certain hydraulic fracturing activities involving diesel fuel and has begun the process of draftingdeveloped draft guidance relating to such practices. In addition, repeal of the SDWA exclusion of hydraulic fracturing has been advocated by certain advocacy organizations and others in the public. LegislationCongress has also been introduced before Congressfrom time to time considered legislation to repeal the exemption for hydraulic fracturing from the SDWA, which would have the effect of allowing the EPA to promulgate new regulations and permitting requirements for hydraulic fracturing, and to require the disclosure of the chemical constituents of hydraulic fracturing fluids to a regulatory agency, which would make the information public via the Internet.
Scrutiny of hydraulic fracturing activities continues in other ways, with the EPA having commenced a study of the potential environmental impacts of hydraulic fracturing, the initial results of which are expected to be available by late 2012 and the final results of which are expected in 2014. In addition, in April 2012, the EPA issued the first federal air standards for natural gas wells that are hydraulically fractured, which will require operators to significantly reduce VOC emissions through the use of “green completions” to capture natural gas that would otherwise escape into the air. Moreover, the EPA is developing effluent limitations for the treatment and discharge of wastewater resulting from hydraulic fracturing activities and plans to propose these standards by 2014. The U.S. Department of the Interior has also announced that it will proposeproposed regulations relating to the use of hydraulic fracturing techniques on public lands and disclosure of fracturing fluid constituents.
In addition, some states and localities have adopted, and others are considering adopting, regulations or ordinances that could restrict hydraulic fracturing in certain circumstances, that would require, with some exceptions, disclosure of constituents of hydraulic fracturing fluids, or that would impose higher taxes, fees or royalties on natural gas production. Moreover, public debate over hydraulic fracturing and shale gas production has been increasing, and has resulted in delays of well permits in some areas.
Increased regulation and attention given to the hydraulic fracturing process could lead to greater opposition, including litigation, to oil and gas production activities using hydraulic fracturing techniques. Additional legislation or regulation could also lead to operational delays or increased operating costs in the production of oil and natural gas, including from the developing shale plays, incurred by our customers.clients. The adoption of any federal, state or local laws or the implementation of regulations or ordinances restricting or increasing the costs of hydraulic fracturing could cause a decrease in the completion of new oil and natural gas wells and an associated decrease in demand for our drilling and well servicing activities, any or all of which could adversely affect our financial position, results of operations and cash flows.
Risk Relating to Our Capitalization and Organizational Documents
We do not intend to pay dividends on our common stock in the foreseeable future, and therefore only appreciation of the price of our common stock will provide a return to our shareholders.
We have not paid or declared any dividends on our common stock and currently intend to retain any earnings to fund our working capital needs, reduce debt and fund growth opportunities. Any future dividends will be at the discretion of our board of directors after taking into account various factors it deems relevant, including our financial condition and performance, cash needs, income tax consequences and restrictions imposed by the Texas Business Organizations Code and other applicable laws and by our credit facilities.Revolving Credit Facility and Senior Notes. Our debt arrangements include provisions that generally prohibit us from paying dividends on our capital stock, including our common stock.
We may issue preferred stock whose terms could adversely affect the voting power or value of our common stock.
Our articles of incorporation authorize us to issue, without the approval of our shareholders, one or more classes or series of preferred stock having such designations, preferences, limitations and relative rights, including preferences over our common stock respecting dividends and distributions, as our board of directors may determine. The terms of one or more classes or series of preferred stock could adversely impact the voting power or value of our common stock. For example, we might grant holders of preferred stock the right to elect some number of our directors in all events or on the happening of specified events or the right to veto specified transactions. Similarly, the repurchase or redemption rights or liquidation preferences we might assign to holders of preferred stock could affect the residual value of the common stock.
Provisions in our organizational documents could delay or prevent a change in control of our company even if that change would be beneficial to our shareholders.
The existence of some provisions in our organizational documents could delay or prevent a change in control of our company even if that change would be beneficial to our shareholders. Our articles of incorporation and bylaws contain provisions that may make acquiring control of our company difficult, including:
provisions regulating the ability of our shareholders to nominate candidates for election as directors or to bring matters for action at annual meetings of our shareholders;
limitations on the ability of our shareholders to call a special meeting and act by written consent;
provisions dividing our board of directors into three classes elected for staggered terms; and
the authorization given to our board of directors to issue and set the terms of preferred stock.
| |
Item 1B. | Unresolved Staff Comments |
Not applicable.
For a description of our significant properties, see “Business—General” and “Business—Facilities” in Item 1 of this report. We consider each ofbelieve that we have sufficient properties to conduct our operations and that our significant properties to beare suitable for itstheir intended use.
Due to the nature of our business, we are, from time to time, involved in routine litigation or subject to disputes or claims related to our business activities, including workers’workers' compensation claims and employment-related disputes. In the opinion of our management, none of the pending litigation, disputes or claims against us will have a material adverse effect on our financial condition or results of operations.
| |
| Item 4. | Mine Safety Disclosures |
Not Applicable.applicable.
PART II
| |
| Item 5. | Market for Registrant’s Common Equity, Related Shareholder Matters and Issuer Purchases of Equity Securities |
As of February 10, 2012January 31, 2013, 61,828,31762,077,245 shares of our common stock were outstanding, held by 488420 shareholders of record. The number of record holders does not necessarily bear any relationship to the number of beneficial owners of our common stock.
Our common stock trades on the NYSE AmexNew York Stock Exchange under the symbol “PDC.“PES.” The following table sets forth, for each of the periods indicated, the high and low sales prices per share on the NYSE Amex:share:
| | | | Low | | High | Low | | High |
| Fiscal year ended December 31, 2012 | | | | |
| First Quarter | | $ | 8.44 |
| | $ | 10.35 |
|
| Second Quarter | | 6.54 |
| | 8.92 |
|
| Third Quarter | | 6.82 |
| | 9.14 |
|
| Fourth Quarter | | 6.02 |
| | 7.77 |
|
| Fiscal year ended December 31, 2011 | | | | | | |
| First Quarter | $ | 8.24 |
| | $ | 13.80 |
| $ | 8.24 |
| | $ | 13.80 |
|
| Second Quarter | 11.89 |
| | 16.17 |
| 11.89 |
| | 16.17 |
|
| Third Quarter | 7.18 |
| | 17.70 |
| 7.18 |
| | 17.70 |
|
| Fourth Quarter | 6.41 |
| | 11.78 |
| 6.41 |
| | 11.78 |
|
| Fiscal year ended December 31, 2010 | | | | | | |
| First Quarter | $ | 6.89 |
| | $ | 9.79 |
| $ | 6.89 |
| | $ | 9.79 |
|
| Second Quarter | 5.24 |
| | 7.92 |
| 5.24 |
| | 7.92 |
|
| Third Quarter | 5.40 |
| | 6.90 |
| 5.40 |
| | 6.90 |
|
| Fourth Quarter | 6.04 |
| | 9.03 |
| 6.04 |
| | 9.03 |
|
| Fiscal year ended December 31, 2009 | | | | |
| First Quarter | $ | 3.28 |
| | $ | 6.70 |
| |
| Second Quarter | 3.46 |
| | 6.88 |
| |
| Third Quarter | 3.96 |
| | 7.34 |
| |
| Fourth Quarter | 6.00 |
| | 8.16 |
| |
The last reported sales price for our common stock on the NYSE AmexNew York Stock Exchange on February 10, 2012January 31, 2013 was $9.297.58 per share.
We have not paid or declared any dividends on our common stock and currently intend to retain earnings to fund our working capital needs and growth opportunities. Any future dividends will be at the discretion of our board of directors after taking into account various factors it deems relevant, including our financial condition and performance, cash needs, income tax consequences and the restrictions imposed by the Texas Business Organizations Code and other applicable laws and our credit facilities then impose.Revolving Credit Facility and Senior Notes. Our debt arrangements include provisions that generally prohibit us from paying dividends, other than dividends on our preferred stock. We currently have no preferred stock outstanding.
We did not make any unregistered sales of equity securities during the quarter ended December 31, 20112012. The following table provides information relating to our repurchase of common shares during the quarter ended December 31, 2012:
| | | Period | Total Number of Shares Purchased (1) | | Average Price Paid per Share (2) | | Total Number of Shares Purchased as Part of Publicly Announced Plans or Programs | | Maximum Number of Shares that May Yet Be Purchased Under the Plans or Programs | Total Number of Shares Purchased (1) | | Average Price Paid per Share (2) | | Total Number of Shares Purchased as Part of Publicly Announced Plans or Programs | | Maximum Number of Shares that May Yet Be Purchased Under the Plans or Programs |
| October 1 - October 31 | — |
| | — |
| | — |
| | — |
| 106 |
| | $ | 6.98 |
| | — |
| | — |
|
| November 1 - November 30 | — |
| | — |
| | — |
| | — |
| — |
| | $ | — |
| | — |
| | — |
|
| December 1 - December 31 | 32,460 |
| | $8.98 | | — |
| | — |
| 318 |
| | $ | 7.36 |
| | — |
| | — |
|
| Total | 32,460 |
| | $8.98 | | — |
| | — |
| 424 |
| | $ | 7.27 |
| | — |
| | — |
|
| |
| (1) | The shares indicated consist of shares of our common stock tendered by employees to the Company during the three months ended December 31, 20112012, to satisfy the employees’ tax withholding obligations in connection with the exercisevesting of nonqualifiedrestricted stock options,unit awards, which we repurchased based on the fair market value on the date the relevant transaction occurred. |
| |
| (2) | The calculation of the average price paid per share does not give effect to any fees, commissions or other costs associated with the repurchase of such shares. |
Performance Graph
The following graph compares, for the periods from December 31, 20062007 to December 31, 20112012, the cumulative total shareholder return on our common stock with the cumulative total return on the companies that comprise the AMEXNYSE Composite Index, the Amex Composite Index and both an old and newa peer group index that includeincludes five and six companies respectively, that provide contract drilling services and / and/or production services. The comparison assumes that $100 was invested on December 31, 2006 in
In June 2012, we transferred the listing of our common stock from the companies that composeNYSE Amex to the AMEXNew York Stock Exchange. Accordingly, our performance graph includes both the Amex and NYSE Composite Index and the companies that compose the old and new peer group indexes, and further assumes all dividends were reinvested.Indexes.
The companies that comprise the old peer group index are Patterson-UTI Energy, Inc., Nabors Industries Ltd., Bronco Drilling Company, Precision Drilling Trust and Key Energy Services. During 2011, Bronco Drilling Company was acquired by a competing energy company and Union Drilling, Inc. and Basic Energy Services, Inc. were added to the peer group. Therefore, the companies that comprise the new peer group index are Patterson-UTI Energy, Inc., Nabors Industries Ltd., Union Drilling, Inc., Basic Energy Services, Inc., Precision Drilling Trust and Key Energy Services. For comparative purposes, bothUnion Drilling, Inc. was removed from the old and new peer group indexes are reflectedindex because it was acquired by a competing energy company during 2012.
The comparison assumes that $100 was invested on December 31, 2007 in our common stock, the following performance graph.companies that compose the NYSE Composite Index, the Amex Composite Index, and the companies that compose the peer group index, and further assumes all dividends were reinvested.
| |
| Item 6. | Selected Financial Data |
The following information derives from our audited financial statements. This information should be reviewed in conjunction with “Management’s Discussion and Analysis of Financial Condition and Results of Operations” in Item 7 of this report and the historical financial statements and related notes this report contains. The acquisitions of WEDGE Group Incorporated ("WEDGE") and Prairie Investors d/b/a Competition Wireline ("Competition"), effective March 1, 2008, affect the comparability from period to period of our historical results.
| | | | Year ended December 31, | | Nine months ended December 31, 2007 | Year ended December 31, |
| | 2011(1) | | 2010(1) | | 2009(1) | | 2008(1)(2) | 2012 | | 2011 | | 2010 | | 2009 | | 2008 (1) |
| | (In thousands, except per share amounts) | (In thousands, except per share amounts) |
| Statement of Operations Data: | | | | | | | | | | | | | | | | | | |
| Revenues | $ | 715,941 |
| | $ | 487,210 |
| | $ | 325,537 |
| | $ | 610,884 |
| | $ | 313,884 |
| $ | 919,443 |
| | $ | 715,941 |
| | $ | 487,210 |
| | $ | 325,537 |
| | $ | 610,884 |
|
| Income (loss) from operations | 57,458 |
| | (18,572 | ) | | (31,840 | ) | | (43,954 | ) | | 55,260 |
| 81,811 |
| | 57,458 |
| | (18,572 | ) | | (31,840 | ) | | (43,954 | ) |
| Income (loss) before income taxes | 20,833 |
| | (47,558 | ) | | (40,172 | ) | | (56,688 | ) | | 57,774 |
| 46,386 |
| | 20,833 |
| | (47,558 | ) | | (40,172 | ) | | (56,688 | ) |
| Net earnings (loss) applicable to common stockholders | 11,177 |
| | (33,261 | ) | | (23,215 | ) | | (62,745 | ) | | 39,645 |
| 30,032 |
| | 11,177 |
| | (33,261 | ) | | (23,215 | ) | | (62,745 | ) |
| Earnings (loss) per common share-basic | $ | 0.19 |
| | $ | (0.62 | ) | | $ | (0.46 | ) | | $ | (1.26 | ) | | $ | 0.80 |
| $ | 0.49 |
| | $ | 0.19 |
| | $ | (0.62 | ) | | $ | (0.46 | ) | | $ | (1.26 | ) |
| Earnings (loss) per common share-diluted | $ | 0.19 |
| | $ | (0.62 | ) | | $ | (0.46 | ) | | $ | (1.26 | ) | | $ | 0.79 |
| $ | 0.48 |
| | $ | 0.19 |
| | $ | (0.62 | ) | | $ | (0.46 | ) | | $ | (1.26 | ) |
| Other Financial Data: | | | | | | | | | | | | | | | | | | |
| Net cash provided by operating activities | $ | 144,879 |
| | $ | 98,351 |
| | $ | 123,313 |
| | $ | 186,635 |
| | $ | 115,455 |
| $ | 199,366 |
| | $ | 144,879 |
| | $ | 98,351 |
| | $ | 123,313 |
| | $ | 186,635 |
|
| Net cash used in investing activities | (307,484 | ) | | (129,481 | ) | | (113,909 | ) | | (505,615 | ) | | (123,858 | ) | (361,231 | ) | | (307,484 | ) | | (129,481 | ) | | (113,909 | ) | | (505,615 | ) |
| Net cash provided by financing activities | 226,791 |
| | 12,762 |
| | 4,154 |
| | 269,098 |
| | 161 |
| 99,401 |
| | 226,791 |
| | 12,762 |
| | 4,154 |
| | 269,098 |
|
| Capital expenditures | 237,787 |
| | 135,151 |
| | 110,453 |
| | 148,096 |
| | 128,038 |
| 379,272 |
| | 237,787 |
| | 135,151 |
| | 110,453 |
| | 148,096 |
|
| | | | As of December 31, | As of December 31, |
| | 2011(1) | | 2010(1) | | 2009(1) | | 2008(1) | | 2007 | 2012 | | 2011 | | 2010 | | 2009 | | 2008 |
| | (In thousands) | (In thousands) |
| Balance Sheet Data: | | | | | | | | | | | | | | | | | | |
| Working capital | $ | 129,932 |
| | $ | 76,142 |
| | $ | 90,336 |
| | $ | 64,372 |
| | $ | 99,807 |
| $ | 62,236 |
| | $ | 129,932 |
| | $ | 76,142 |
| | $ | 90,336 |
| | $ | 64,372 |
|
| Property and equipment, net | 793,956 |
| | 655,508 |
| | 637,022 |
| | 627,562 |
| | 417,022 |
| 1,014,340 |
| | 793,956 |
| | 655,508 |
| | 637,022 |
| | 627,562 |
|
| Long-term debt and capital lease obligations, excluding current installments | 418,728 |
| | 279,530 |
| | 258,073 |
| | 262,115 |
| | — |
| 518,725 |
| | 418,728 |
| | 279,530 |
| | 258,073 |
| | 262,115 |
|
| Shareholders’ equity | 510,445 |
| | 396,333 |
| | 421,448 |
| | 414,118 |
| | 471,072 |
| 547,680 |
| | 510,445 |
| | 396,333 |
| | 421,448 |
| | 414,118 |
|
| Total assets | 1,172,754 |
| | 841,343 |
| | 824,955 |
| | 824,479 |
| | 560,212 |
| 1,339,776 |
| | 1,172,754 |
| | 841,343 |
| | 824,955 |
| | 824,479 |
|
| |
| (1) | The statement of operations data and other financial data for the years ended December 31, 2011, 2010, 2009 and 2008 and the balance sheet data as of December 31, 2011, 2010, 2009 and 2008 include the impact of the acquisitions of WEDGE and Competition, both of which occurred on March 1, 2008. |
| |
(2) | The statement of operations data and other financial data for the year ended December 31, 2008 reflect the impact of a goodwill impairment charge of $118.6 million and an intangible asset impairment charge of $52.8 million. |
| |
Item 7. | Management’s Discussion and Analysis of Financial Condition and Results of Operations |
Item 7. Management’s Discussion and Analysis of Financial Condition and Results of Operations
Statements we make in the following discussion that express a belief, expectation or intention, as well as those that are not historical fact, are forward-looking statements that are subject to risks, uncertainties and assumptions. Our actual results, performance or achievements, or industry results, could differ materially from those we express in the following discussion as a result of a variety of factors, including general economic and business conditions and industry trends, the continued strength or weaknesslevels and volatility of the contract land drilling industry in the geographic areas in which we operate,oil and gas prices, decisions about onshore exploration and development projects to be made by oil and gas exploration and production companies, economic cycles and their impact on capital markets and liquidity, the continued demand for drilling services or production services in the geographic areas where we operate, the highly competitive nature of our business, theour future financial performance, including availability, terms and deployment of capital, our ability to effectively integrate acquired businesses, future compliance with covenants under our senior secured revolving credit facility and our senior notes, the supply of marketable drilling rigs, well servicing rigs, coiled tubing and wireline units within the industry, the continued availability of drilling rig, well servicing rig, coiled tubing and wireline unit components, the continued availability of qualified personnel, the success or failure of our acquisition strategy, including our ability to finance acquisitions, manage growth and effectively integrate acquisitions, and changes in, or our failure or inability to comply with, governmentgovernmental regulations, including those relating to the environment. We have discussed many of these factors in more detail elsewhere in this report, including under the headings “Special Note Regarding Forward-Looking Statements” in the Introductory Note to Part I and “Risk Factors” in Item 1A. These factors are not necessarily all the important factors that could affect us. Unpredictable or unknown factors we have not discussed in this report could also have material adverse effects on actual results of matters that are the subject of our forward-looking statements. All forward-looking statements speak only as the date on which they are made and we undertake no duty to update or revise any forward-looking statements. We advise our shareholders that they should (1) be aware that important factors not referred to above could affect the accuracy of our forward-looking statements and (2) use caution and common sense when considering our forward-looking statements.
Company Overview
Pioneer Drilling Company provides drilling services and production services to independent and major oil and gas exploration and production companies throughout much of the onshore oil and gas producing regions of the United States and internationally in Colombia. Pioneer Drilling Company was incorporated under the laws of the State of Texas in 1979 as the successor to a business that had been operating since 1968. Since September 1999, we have significantly expanded our drilling rig fleet through acquisitions and through the construction of rigs from new and used components. In March 2008, we acquired two production services companies which significantly expanded our service offerings with the acquisition of two production services businesses, which provideto include well services,servicing, wireline services and fishing and rental services. We have continued to invest in the growth of all our service offerings through acquisitions and organic growth. On December 31, 2011,, we acquired the coiled tubing services business of Go-Coil, LLCL.L.C. ("Go-Coil"), a coiled tubing service company based in Maurice, Louisiana, to complementexpand our existing production services offerings.
On July 30, 2012, we changed our company name from "Pioneer Drilling Company" to "Pioneer Energy Services Corp." Our common stock trades on the New York Stock Exchange under the ticker symbol "PES." Our new name reflects our strategy to expand our service offerings beyond drilling services, which has been our core, legacy business. Pioneer Energy Services provides drilling services and production services to a diverse group of independent and large oil and gas exploration and production companies throughout much of the onshore oil and gas producing regions of the United States and internationally in Colombia. We also provide coiled tubing and wireline services offshore in the Gulf of Mexico. Drilling services and production services are fundamental to establishing and maintaining the flow of oil and natural gas throughout the productive life of a well site and enable us to meet multiple needs of our customers.clients.
Business Segments
We currently conduct our operations through two operating segments: our Drilling Services DivisionSegment and our Production Services Division.Segment. The following is a description of these two operating segments. Financial information about our operating segments is included in Note 10, Segment Information, of the Notes to Consolidated Financial Statements, included in Part II, Item 8, Financial Statements and Supplementary Data, of this Annual Report on Form 10-K.10-K.
Drilling Services Division—Segment—Our Drilling Services DivisionSegment provides contract land drilling services to a diverse group of oil and gas exploration and production companies with its fleet of 6470 drilling rigs inwhich are currently assigned to the following locations:divisions:
|
| | | |
Drilling Division Locations | | Rig Count |
| South Texas | | 1514 |
|
| East Texas | | 54 |
|
| West Texas | | 1823 |
|
| North Dakota | | 912 |
|
| Utah | | 45 |
|
| Appalachia | | 54 |
|
| Colombia | | 8 |
|
| | 70 |
|
Drilling revenues and rig utilization steadily improved during 2010 and 2011, primarily due toSince late 2009, increased demand for drilling services in domestic shale plays and oil or liquid rich regions resulted in increased rig utilization and drilling revenues in these regions. We capitalized on this trend by moving drilling rigs in our fleet to these higher demand regions from lower demand regions such asregions. As a result, we closed our Oklahoma and North Texas and East Texas drilling division locations which have conventional natural gas production. During 2010divisions and2011, we moved drilling rigs into our North Dakota and Appalachia drilling division locations, both of which are shale regions, and in early 2011, we established our West Texas drilling division location where we currently have in 2011.18 drilling rigs operating.
In Septemberearly 2011,, we evaluated the drilling rigs in our fleet that had remained idle and decided to place six mechanical drilling rigs as held for sale as of September 30, 2011. Four of the held for sale drilling rigs were previously assigned to our Oklahoma drilling division location and the remaining two drilling rigs were previously assigned to our East Texas drilling division location. Sales of all six mechanical drilling rigs were completed by mid November 2011. In addition, we decided to retire another drilling rig from our fleet that was previously assigned to our Utah drilling division location, with most of its components to be used for spare equipment. We recognized an impairment charge of $0.5 million in September 2011 in association with our decision to dispose of these seven drilling rigs.
At December 31, 2011, we have 64 drilling rigs in our fleet. We currently havebegan construction, based on term contracts, forof ten new-build AC drilling rigs that are fit for purpose for domestic shale plays,plays. Construction has been completed for fiveeight of these new-build drilling rigs which we estimate will begin workingare currently operating in the first half of 2012, withshale plays, and we expect the remaining fivetwo to begin operating be completed and working under term contracts by the end of 2012the first quarter of 2013.
As of February 10, 2012January 31, 2013, 5557 drilling rigs are operating under drilling contracts, 4443 of which are under term contracts. We haveIncluded in the nine43 drilling rigs thatcurrently operating under term contracts are idle, three rigs which our client early released due to the recent decrease in demand for vertical conventional drilling in West Texas. These three drilling rigs are under term contracts and therefore we are receiving a standby dayrate for the remainder of the contract term. All our drilling rigs in Colombia are currently working, sixof which are working under contract to begin working interm contracts that were extended through the first quarter of 2012.2013. We are actively marketing all our idle drilling rigs.
In addition to our drilling rigs, we provide the drilling crews and most of the ancillary equipment needed to operate our drilling rigs. We obtain our contracts for drilling oil and natural gas wells either through competitive bidding or through direct negotiations with customers.existing or potential clients. Our drilling contracts generally provide for compensation on either a daywork, turnkey or footage basis. Contract terms generally depend on the complexity and risk of operations, the on-site drilling conditions, the type of equipment used, and the anticipated duration of the work to be performed.
Production Services Division—Segment—Our Production Services DivisionSegment provides a range of services to oil and gas exploration and production companies, including well servicing, wireline services, wireline, coiled tubing services, and fishing and rental services. Our production services operations are managed through locations concentrated in the major United States onshore oil and gas producing regions in the Mid-Continent and Rocky Mountain states and in the Gulf Coast, Mid-Continent, Rocky Mountainboth onshore and Appalachian states.offshore. We provide our services to a diverse group of oil and gas exploration and production companies. The primary production services we offer are the following:
Well Services. Existing and newly-drilled wells require aServicing. A range of services are required in order to establish production in newly-drilled wells and to maintain production over theirthe useful lives.lives of active wells. We use our premium well serviceservicing rig fleet to provide these requirednecessary services, including the completion of newly-drilled wells, maintenance of existing wells,and workover of existing wells, completion of newly-drilledactive wells, and plugging and abandonment of wells at the end of their useful lives. We acquired 15 well serviceAs of January 31, 2013, we operate ninety-eight 550 horsepower rigs during 2011 and twoten additional well service600 horsepower rigs in early 2012, resulting in a total of 91 well service rigs inthrough 12 locations, asmost of February 10, 2012. Our well service rig fleet consists of eighty-one 550 horsepower rigs, nine 600 horsepower rigs,which are in the Gulf Coast and one 400 horsepower rig. All our well service rigs are currently operating or are being actively marketed, with January 2012 utilization of approximately 86%. We plan to add another 13 well service rigs to our fleet during 2012.ArkLaTex regions.
Wireline Services. In order for oil and gas exploration and production companies to better understand the reservoirs they are drilling or producing, they require logging services to accurately characterize reservoir rocks and fluids. WhenTo
complete a producing well, is completed, they also must perforate the production casing must be perforated to establish a flow path between the reservoir and the wellbore. We use our fleet of wireline units to provide these important logging and perforating services. We provide both open and cased-hole logging services, including the latest pulsed-neutron technology. In addition, we provide services which allow oil and gas exploration and production companies to evaluate the integrity of wellbore casing, recover pipe, or install bridge plugs. We acquired 21 wireline units during 2011 and four additional wireline units in early 2012, resulting in a totalAs of 109January 31, 2013 wireline units in, we operate through 24 locations aswith a fleet of February 10, 2012. We plan to add another 18120 wireline units to our fleet during 2012.units.
Coiled Tubing Services. Coiled tubing is an important element of the well serviceservicing industry today that allows operators to continue production during service operations without shutting in the well, thereby reducing the risk of formation damage. Coiled tubing services involve the use of a continuous metal pipe spooled on a large reel for oil and natural gas well applications, such as wellbore clean-outs, nitrogen jet lifts, through-tubing fishing, formation stimulation utilizing acid, chemical treatments and fracturing. Coiled tubing is also used for a number of horizontal well applications such as milling temporary plugs between frac stages. Our coiled tubing business consists of tennine onshore and four offshore coiled tubing units which are currently deployed through four locations in Texas, Louisiana Oklahoma and Pennsylvania.Oklahoma.
Fishing and Rental Services. During drilling operations, oil and gas exploration and production companies frequently rent unique equipment such as power swivels, foam circulating units, blow-out preventers, air drilling equipment, pumps, tanks, pipe, tubing and fishing tools. We provide rental services out of four locations in Texas and Oklahoma. As of December 31, 20112012 our fishing and rental tools have a gross book value of $15.116.1 million.
Pioneer Energy Services' corporate office is located at 1250 NE Loop 410, Suite 1000, San Antonio, Texas 78209. Our phone number is (210) 828-7689 and our website address is www.pioneeres.com. We make available free of charge though our website our Annual Reports on our Form 10-K, Quarterly Reports on Form 10-Q, Current Reports on Form 8-K, and all amendments to those reports as soon as reasonably practicable after such material is electronically filed with the Securities and Exchange Commission (SEC). Information on our website is not incorporated into this report or otherwise made part of this report.
Market Conditions in Our Industry
Demand for oilfield services offered by our industry is a function of our customers’clients’ willingness to make operating expenditures and capital expenditures to explore for, develop and produce hydrocarbons, which in turn is affected by current and expected levels of oil and natural gas prices.
From 2004 through 2008, domestic exploration and production spending increased as oil and natural gas prices increased. From late 2008 and into late 2009, there was substantial volatility and a decline in oil and natural gas prices due to the downturn in the global economic environment. In response, our customersclients curtailed their drilling programs and reduced their production activities, particularly in natural gas producing regions, which resulted in a decrease in demand and revenue rates for certain of our drilling rigs and production services equipment. Additionally, there was uncertainty in the capital markets and access to financing was limited. These conditions adversely affected our business environment.
With generally increasing oil prices in 2010 and natural gas prices during 2010,2011, exploration and production companies modestly increased their exploration and production spending for 2010 and industry rigequipment utilization and revenue rates improved, particularly in oil-producing regions and in certain shale regions. IncreasedDuring 2012, modest increases in exploration and production spending resulted in modest increases in industry equipment utilization and revenue rates during 2012, as compared to 2011. Though oil prices decreased sharply in mid-2012 for a brief period of time, they have since recovered with no meaningful upward or downward trend for the year. In addition, excess natural gas production in the U.S. shale regions continues to depress natural gas prices, butprices. If oil prices continued to increase during 2011, resulting in continued increases in exploration and production spending during 2011, as compared to 2010. As a result, we experienced continued increases in industry rig utilization and revenue rates during 2011, as compared to 2010. We expect continued modest increases in exploration and production spending for 2012, which we expect will result in modest increases in industry equipment utilization and revenue rates in 2012, as compared to 2011. However, if oil prices remain steady but natural gas prices further decline, to historically low levels for the remainder of 2012, then industry equipment utilization and revenue rates could decrease.decrease domestically and in Colombia.
For additional information concerningColombia has experienced significant growth in oil production since 2008 largely due to the effectsinfusion of capital by international exploration and production companies as a result of the volatilitycountry's improved regulation and security. Historically, Colombian oil prices have generally trended in oil and gas prices and uncertainty in capital markets, see Item 1A – “Risk Factors” in Part I of this Annual Report on Form 10-K.
On February 10, 2012, the spot price forline with West Texas Intermediate crude(WTI) oil was $98.67,prices. However, fluctuations in oil prices have a less significant impact on demand for drilling and production services in Colombia as compared to the spot priceimpact on demand in North America. Demand for Henry Hub natural gas was $2.51drilling and production services in Colombia is largely dependent upon the Baker Hughes U.S. land rig count was national oil company's long-term exploration and production programs.
1,932, a 14%increase from 1,696 on February 4, 2011. The average weeklytrends in spot prices of West Texas IntermediateWTI crude oil and Henry Hub natural gas, and the average weeklyresulting trends in domestic land rig count per thecounts (per Baker Hughes land rig count,Hughes) and the average monthly domestic well serviceservicing rig count for eachcounts (per Guiberson/Association of Energy Service Companies) over the last five years were:are illustrated in the graphs below.
|
| | | | | | | | | | | | | | | | | | | |
| | Year ended December 31, |
| | 2011 | | 2010 | | 2009 | | 2008 | | 2007 |
| Oil (West Texas Intermediate) | $ | 94.94 |
| | $ | 79.39 |
| | $ | 61.81 |
| | $ | 99.86 |
| | $ | 72.71 |
|
| Natural Gas (Henry Hub) | $ | 3.95 |
| | $ | 4.35 |
| | $ | 3.85 |
| | $ | 8.81 |
| | $ | 6.90 |
|
| U.S. Land Rig Count | 1,829 |
| | 1,493 |
| | 1,035 |
| | 1,792 |
| | 1,670 |
|
| U.S. Well Service Rig Count | 2,075 |
| | 1,854 |
| | 1,735 |
| | 2,514 |
| | 2,388 |
|
IncreasesAs shown in the charts above, the trends in industry rig counts are influenced by fluctuations in oil and natural gas prices, from 2004 to late 2008 resulted in corresponding increases inwhich affect the U.S. land rig countslevels of capital and U.S. well service rig counts, while declines in prices from late 2008 to late 2009 led to decreases in the U.S. land rig counts and U.S. well service rig counts. Since late 2009, increases primarily in oil prices have caused increases in exploration and production spending and the corresponding increases in drilling and well services activities are reflectedoperating expenditures made by increases in the U.S. land rig counts and the U.S. well service rig counts in 2010 and 2011.
Our business is influenced substantially by both operating and capital expenditures by exploration and production companies. Exploration and production spending is generally categorized as either a capital expenditure or operating expenditure.
Capital expenditures by oil and gas exploration and production companies tend to be relatively sensitive to volatility in oil or natural gas prices because project decisions are tied to a return on investment spanning a number of years. As such, capital expenditure economics often require the use of commodity price forecasts which may prove inaccurate in the amount of time required to plan and execute a capital expenditure project (such as the drilling of a deep well). When commodity prices are depressed for long periods of time, capital expenditure projects are routinely deferred until prices return to an acceptable level.
In contrast, both mandatory and discretionary operating expenditures are more stable than capital expenditures for exploration.exploration as these expenditures are less sensitive to commodity price volatility. Mandatory operating expenditure projects involve activities that cannot be avoided in the short term, such as regulatory compliance, safety, contractual obligations and certain projects to maintain the well and related infrastructure in operating condition. Discretionary operating expenditure projects may not be critical to the short-term viability of a lease or field but these projectsand are less sensitive to commodity price volatility as compared to capital expenditures for exploration. Discretionary operating expenditure work isgenerally evaluated according to a simple short-term payout criterion whichthat is far less dependent on commodity price forecasts.forecasts.
Because existing oil and natural gas wells require ongoing spending to maintain production, expenditures by exploration and production companies for the maintenance of existing wells are relatively stable and predictable. In contrast, capital expenditures by exploration and production companies for exploration and drilling are more directly influenced by current and expected oil and natural gas prices and generally reflect the volatility of commodity prices.
For additional information concerning the effects of the volatility in oil and gas prices, see Item 1A – “Risk Factors” in Part I of this Annual Report on Form 10-K.
Liquidity and Capital Resources
Sources of Capital Resources
Our principal liquidity requirements have been for working capital needs, debt service, capital expenditures and selective acquisitions. Our principal sources of liquidity consist of cash and cash equivalents (which equaled $86.223.7 million as of December 31, 20112012), cash generated from operations and the unused portion of our senior secured revolving credit facility (the “Revolving Credit Facility”).
In July 20092011, we obtained $94.3 million in net proceeds from the sale of 6,900,000 shares of our common stock at $14.50 per share, less underwriters’ commissions and other offering costs, pursuant to a public offering under the shelf registration statement which we filed in July 2009. The proceeds from this offering were used to pay down the debt balance outstanding under our Revolving Credit Facility and to fund our new-build drilling rig program. In May 2012, we filed a registration statement that permits us to sell equity or debt in one or more offerings up to a total dollar amount of $300 million. InAs of November 2009January 31, 2013, we obtained the
$24.0 million in net proceeds when we sold 3,820,000 shares of our common stock at $6.75 per share, less underwriters’ discounts and commissions, pursuant to a public offering under theentire $300 million shelf registration statement. In July 2011, we obtained $94.3 million in net proceeds when we sold 6,900,000 shares of our common stock at $14.50 per share, less underwriters’ commissions and other offering costs, pursuant to a public offering under the$300 million shelf registration statement. On July 22, 2011, we used $57.0 million of these proceeds to pay down the debt balance outstanding under our Revolving Credit Facility. The current availability under the $300 million shelf registration statement is available for equity or debt is $174.2 million as of February 10, 2012.offerings. In the future, we may consider equity or debt offerings, as appropriate, to meet our liquidity needs.
On March 11, 2010, we issued $250 million of senior notes with a coupon interest rate of 9.875% that are due in 2018 (the "2010 Senior Notes"). We received $234.8 million of net proceeds from the issuance of the 2010 Senior Notes that were used to repay a portion of the borrowings outstanding under our Revolving Credit Facility. On November 21, 2011, we issued an additional $175 million of senior notes (the "2011 Senior Notes") with the same terms and conditions as the 2010 Senior Notes. We received $172.7 million of net proceeds from the issuance of the 2011 Senior Notes, a portion of which were used to fund the acquisition of Go-Coil in December 2011.
Our Revolving Credit Facility provides for a senior secured revolving credit facility, with sub-limits for letters of credit and swing-line loans, of up to an aggregate principal amount of $250 million, all of which matures on June 30, 2016. As of February 10, 2012January 31, 2013, we had a zero$100.0 million balance outstanding under our Revolving Credit Facility and $9.0 million in committed letters of credit, which resulted in borrowing availability of $241.0141.0 million under our Revolving Credit Facility. There are no limitations on our ability to access the full borrowing availability under the Revolving Credit Facility other than maintaining compliance with the covenants in the Revolving Credit Facility. Additional information regarding these covenants is provided in the Debt Requirements section below. Borrowings under the Revolving Credit Facility are available for selective acquisitions, working capital and other general corporate purposes.
We currently expect that cash and cash equivalents, cash generated from operations and available borrowings under our Revolving Credit Facility are adequate to cover our liquidity requirements for at least the next 12 months.
Uses of Capital Resources
For the years ended December 31, 20112012 and 20102011, our primary uses of capital resources were for acquisitions of production services businesses and for property and equipment additions thatwhich consisted of the following (amounts in thousands):
| | | | Year ended December 31, | Year ended December 31, |
| | 2011 | | 2010 | 2012 | | 2011 |
| Drilling Services Division: | | | | |
| Drilling Services Segment: | | | | |
| Routine | $ | 35,252 |
| | $ | 17,441 |
| $ | 39,051 |
| | $ | 35,252 |
|
| Discretionary | 67,352 |
| | 88,201 |
| 56,430 |
| | 67,352 |
|
| New-builds and acquisitions | 41,005 |
| | — |
| |
| Total Drilling Services Division | 143,609 |
| | 105,642 |
| |
| Production Services Division: | | | | |
| Fleet additions | | 162,677 |
| | 41,005 |
|
| Total Drilling Services Segment | | 258,158 |
| | 143,609 |
|
| Production Services Segment: | | | | |
| Routine | 8,168 |
| | 6,972 |
| 15,311 |
| | 8,168 |
|
| Discretionary | 31,523 |
| | 1,202 |
| 37,562 |
| | 31,523 |
|
| New-builds and acquisitions | 26,766 |
| | 17,187 |
| |
| Total Production Services Division | 66,457 |
| | 25,361 |
| |
| Fleet additions | | 53,293 |
| | 26,766 |
|
| Total Production Services Segment | | 106,166 |
| | 66,457 |
|
| Net cash used for purchases of property and equipment | 210,066 |
| | 131,003 |
| 364,324 |
| | 210,066 |
|
| Net impact of accruals | 27,721 |
| | 4,148 |
| 14,948 |
| | 27,721 |
|
| Total Capital Expenditures | $ | 237,787 |
| | $ | 135,151 |
| $ | 379,272 |
| | $ | 237,787 |
|
We capitalizedOur Drilling Services Segment incurred $2.3171.7 million and$0.5 million of interest costs in property and equipment during the years ended December 31, 2011 and 2010, respectively.
During the year ended December 31, 2011, our Drilling Services Division incurred $66.5 million of costs, including accruals for capital expenditures, on tenthe construction of our new-build drilling rigs that were under construction atduring the years ended December 31, 2012 and 2011., respectively. Additionally, during the year ended December 31, 2012, we performed significant upgrade projects on 17to our drilling rigs duringincluding, among others, the installation of nine additional automatic catwalks, one additional iron roughneck and one top drive. During the year ended December 31, 2011,, we performed significant upgrade projects including, among other things, the installation of six iron roughnecks, one top drive, two automatic catwalks and three walking/skidding systems, primarily in connection with obtaining new drilling contracts in unconventional plays and in our new West Texas drilling division location. Somewhich we established in early 2011. In connection with the construction of these projects includedour new-build drilling rigs and other drilling equipment upgrades, we capitalized $10.2 million and $2.3 million of interest costs during the installation ofyears ended sixDecember 31, 2012 iron roughnecks,and one2011, respectively.
Our Production Services Segment acquired 15 top drive,wireline units, two19 automatic catwalkswell servicing rigs and three walking/skidding systems.coiled tubing units during the year ended December 31, 2012. During the year ended December 31, 2010,2011, we performed significant upgrade projects on 24 drilling rigs, primarily in connection with obtaining new drilling contracts in unconventional plays and in Colombia. These projects included the installation of 16 top drives, five iron roughnecks, two automatic catwalks and 11 walking/skidding systems. We did not have any rigs under construction at December 31, 2010.
Our Production Services Division acquired 21 wireline units and 15 well serviceservicing rigs, during the year ended December 31, 2011, as well as ten coiled tubing units with the acquisition of Go-Coil on December 31, 2011. During the year ended December 31, 2010, we acquired 20 wireline units as well as auxiliary equipment for well service rigs.
Currently, we expect to spend approximately $300140 million to $330160 million on capital expenditures during 20122013. We expect the total capital expenditures for 20122013 will be allocated approximately 70% for our Drilling Services DivisionSegment and approximately 30% for our Production Services Division.Segment. Our planned capital expenditures for the year ending December 31, 20122013 include well services, coiled tubing and wireline fleet additions, partialthe remaining construction costs of our new-build AC drilling rigs, upgrades to certain drilling rigs, additional production services equipment and routine capital expenditures. Actual capital expenditures may vary depending on the level of new-build and other expansion opportunities that meet our strategic and return on capital employed criteria. We expect to fund these the capital expenditures partially from the proceeds from the sale of our 2011 Senior Notes in November 20112013, from operating cash flow in excess of our working capital requirements and as necessary, from borrowings under our Revolving Credit Facility.Facility if necessary.
Working Capital
Our working capital was $62.2 million at December 31, 2012, compared to $129.9 million at December 31, 2011, compared to $76.1 million at December 31, 2010. Our current ratio, which we calculate by dividing our current assets by our current liabilities, was1.4 at December 31, 2012 compared to 1.9 at December 31, 2011 compared to 2.0 at December 31, 2010.
Our operations have historically generated cash flows sufficient to meet our requirements for debt service and normal capital expenditures. However, our working capital requirements could increase during periods when higher percentages of our drilling contracts are turnkey and footage contracts our short-term working capital needs could increase.and when new-build rig construction projects are in progress.
The changes in the components of our working capital were as follows (amounts in thousands):
| | | | December 31,
2011 | | December 31,
2010 | | Change | December 31,
2012 | | December 31,
2011 | | Change |
| Cash and cash equivalents | $ | 86,197 |
| | $ | 22,011 |
| | $ | 64,186 |
| $ | 23,733 |
| | $ | 86,197 |
| | $ | (62,464 | ) |
| Short-term investments | — |
| | 12,569 |
| | (12,569 | ) | |
| Receivables: | | | | | | | | | | |
| Trade, net of allowance for doubtful accounts | 106,084 |
| | 61,345 |
| | 44,739 |
| 116,352 |
| | 106,084 |
| | 10,268 |
|
| Unbilled receivables | 31,512 |
| | 21,423 |
| | 10,089 |
| 35,140 |
| | 31,512 |
| | 3,628 |
|
| Insurance recoveries | 5,470 |
| | 4,035 |
| | 1,435 |
| 6,518 |
| | 5,470 |
| | 1,048 |
|
| Income taxes | 2,168 |
| | 2,712 |
| | (544 | ) | 834 |
| | 2,168 |
| | (1,334 | ) |
| Deferred income taxes | 15,433 |
| | 9,867 |
| | 5,566 |
| 11,058 |
| | 15,433 |
| | (4,375 | ) |
| Inventory | 11,184 |
| | 9,023 |
| | 2,161 |
| 12,111 |
| | 11,184 |
| | 927 |
|
| Prepaid expenses and other current assets | 11,564 |
| | 8,797 |
| | 2,767 |
| 13,040 |
| | 11,564 |
| | 1,476 |
|
| Current assets | 269,612 |
| | 151,782 |
| | 117,830 |
| 218,786 |
| | 269,612 |
| | (50,826 | ) |
| Accounts payable | 66,440 |
| | 26,929 |
| | 39,511 |
| 83,823 |
| | 66,440 |
| | 17,383 |
|
| Current portion of long-term debt | 872 |
| | 1,408 |
| | (536 | ) | 872 |
| | 872 |
| | — |
|
| Prepaid drilling contracts | 3,966 |
| | 3,669 |
| | 297 |
| |
| Deferred revenues | | 3,880 |
| | 3,966 |
| | (86 | ) |
| Accrued expenses: | | | | | | | | | | |
| Payroll and related employee costs | 29,057 |
| | 18,057 |
| | 11,000 |
| 27,991 |
| | 29,057 |
| | (1,066 | ) |
| Insurance premiums and deductibles | 10,583 |
| | 8,774 |
| | 1,809 |
| 9,708 |
| | 10,583 |
| | (875 | ) |
| Insurance claims and settlements | 5,470 |
| | 4,035 |
| | 1,435 |
| 6,348 |
| | 5,470 |
| | 878 |
|
| Interest | 12,283 |
| | 7,307 |
| | 4,976 |
| 12,343 |
| | 12,283 |
| | 60 |
|
| Other | 11,009 |
| | 5,461 |
| | 5,548 |
| 11,585 |
| | 11,009 |
| | 576 |
|
| Current liabilities | 139,680 |
| | 75,640 |
| | 64,040 |
| 156,550 |
| | 139,680 |
| | 16,870 |
|
| Working capital | $ | 129,932 |
| | $ | 76,142 |
| | $ | 53,790 |
| $ | 62,236 |
| | $ | 129,932 |
| | $ | (67,696 | ) |
The changedecrease in cash and cash equivalents during the year ended December 31, 20112012 is primarily due to cash provided by operations of $144.9 million, net proceeds from the sale of common stock of $94.3 million, $130.3 million in proceeds from net debt borrowings and $12.6 million net proceeds from the sale of our ARPSs in 2011, partially offset by $210.1364.3 million used for purchases of property and equipment, partially offset by $199.4 million of cash provided by operating activities and $115.599.1 million used for the acquisition of Go-Coil and other production services businesses.in net proceeds from debt borrowings.
The short-term investments balance at December 31, 2010 represented the fair value of our investment in ARPSs, which were liquidated in January 2011.
38
The increases in our trade and unbilled receivables as of December 31, 20112012 as compared to December 31, 20102011 were primarily due to the increase in revenues of $55.024.2 million, or 37%12%, for the quarter ended December 31, 20112012 as compared to the quarter ended December 31, 20102011, and due to the timing of the billing and collection cycles for long-term drilling contracts in Colombia. In addition, the acquisition of Go-Coil on December 31, 2011 resulted in approximately $8.2 million of the increase in our trade and unbilled receivables.
The increase in current deferred income taxes is primarily due to an increase in certain accrued expenses during 2011 that will be deductible for income tax purposes in 2012 and therefore, we expect to realize the tax benefit of the deferred tax assets in the short-term.
The increase in both our insurance recoveries receivables and our insurance claims and settlements accrued expenseexpenses as of December 31, 20112012 as compared to December 31, 20102011 is primarily due to an environmental liabilityincrease in our insurance claim.company's reserve for workers compensation claims in excess of our deductibles.
The increasedecrease in current deferred income taxes as of December 31, 2012 as compared to December 31, 2011 is primarily due to a decrease in the current deferred tax assets related to net operating losses in Colombia, which are no longer expected to be used in the short-term, and are therefore classified as noncurrent as of December 31, 2012.
The increase in our inventory as of December 31, 20112012 as compared to December 31, 20102011 is primarily due to the expansion of our wirelineproduction services operations during 2011 from 84 to 105 wireline units, and an increase in inventory for our Colombian operations.coiled tubing services.
The increase in prepaid expenses and other assets as of December 31, 2012 as compared to December 31, 2011is primarily due to an increase in prepaid property insurance and an increase in deferred mobilization costs for our new-build drilling rigs and other domestic drilling rigs that moved between drilling division locations, as well as an increasedivisions, partially offset by the amortization of deferred mobilization costs during 2012 associated with our long-term drilling contracts in prepaid insurance costs due to the growth of our business during 2011.Colombia.
The increase in accounts payable is primarilydue to a $14.9 millionincrease in our accruals for capital expenditures as of December 31, 2012, as compared to December 31, 2011, and due to the increase in operating costs of $34.118.5 million, or 36%14%, for the quarter ended December 31, 20112012 as compared to the quarter ended December 31, 2010, and due to a $27.7 million increase in our accruals for capital expenditures as of December 31, 2011, as compared to December 31, 2010.
The increasedecrease in accrued payroll and employee related costs is primarily due to workforce additions, accruals for our long-term compensation plans which accrue over two to three years, increased incentive compensation based on strong 2011 operating results, and fluctuations due to timingas of payroll payments.
The increase in accrued insurance premiums and deductibles at December 31, 20112012 as compared to December 31, 2010 is due to the increases in our drilling services and production services utilization and the resulting increased workforce during the quarter ended December 31, 2011 as compared to the quarter ended December 31, 2010. The increase in utilization and our workforce led to increased actuarial claims estimates for the deductibles under these insurance policies.
The increase in accrued interest expense is primarily due to lower accruals for 2012 annual bonuses as compared to 2011, and partially offset by higher payroll accruals due to workforce additions during 2012 and more payroll days reflected in the issuanceaccrued payroll at December 31, 2012, as compared to December 31, 2011, due to the timing of our 2011 Senior Notes in November 2011, for which interest is due semi-annually on March 15 and September 15.pay periods.
The increase in other accrued expenses as of December 31, 2012 as compared to December 31, 2011 is primarily due to an increase in our sales tax accrual for sales tax payable onprimarily relating to the construction of our new-build drilling rigs as well asand an increase in property tax accruals due to timing of payments. The increase is partially offset by the $1.7 million current portionfinalization of the net-worth tax accrual for our Colombian operations, which was assessed on January 1, 2011. In addition, we have recorded an estimated accrual of $1.0 million at December 31, 2011 for the net working capital adjustment which is payable towas accrued as of December 31, 2011 in connection with the former ownersacquisition of Go-Coil.
Long-term Debt and Other Contractual Obligations
The following table includes allinformation about the amount and timing of our contractual obligations at December 31, 20112012 (amounts in thousands):
| | | | Payments Due by Period | Payments Due by Period |
| Contractual Obligations | Total | | Less than 1
year | | 2-3 years | | 4-5 years | | More than 5
years | Total | | Within 1 Year | | 2 to 3 Years | | 4 to 5 Years | | Beyond 5 Years |
| Long-term debt | $ | 426,854 |
| | $ | 872 |
| | $ | 899 |
| | $ | 83 |
| | $ | 425,000 |
| $ | 525,981 |
| | $ | 872 |
| | $ | 52 |
| | $ | 100,057 |
| | $ | 425,000 |
|
| Interest on long-term debt | 272,997 |
| | 42,115 |
| | 83,985 |
| | 83,944 |
| | 62,953 |
| 241,983 |
| | 44,971 |
| | 89,869 |
| | 86,158 |
| | 20,985 |
|
| Purchase commitments | 134,859 |
| | 113,859 |
| | 21,000 |
| | — |
| | — |
| 35,353 |
| | 35,353 |
| | — |
| | — |
| | — |
|
| Operating leases | 17,407 |
| | 4,607 |
| | 5,974 |
| | 3,020 |
| | 3,806 |
| 16,379 |
| | 4,751 |
| | 6,158 |
| | 2,494 |
| | 2,976 |
|
| Restricted cash obligation | 1,300 |
| | 650 |
| | 650 |
| | — |
| | — |
| 650 |
| | 650 |
| | — |
| | — |
| | — |
|
| Other long-term liabilities | | 10,162 |
| | 4,937 |
| | 5,225 |
| | — |
| | — |
|
| Total | $ | 853,417 |
| | $ | 162,103 |
| | $ | 112,508 |
| | $ | 87,047 |
| | $ | 491,759 |
| $ | 830,508 |
| | $ | 91,534 |
| | $ | 101,304 |
| | $ | 188,709 |
| | $ | 448,961 |
|
At December 31, 20112012, long-term debt primarily consists of $425.0 million face amount outstanding under our Senior Notes, and $1.7100.0 million outstanding under subordinatedour Revolving Credit Facility and $9.0 million outstanding under other notes payable to certain employees that are former shareholders of previously acquired production services businesses. OnThe July 22, 2011$100.0 million, we repaid the entire outstanding debt balance under our Revolving Credit Facility. However, we expect to use the availability under the Revolving Credit Facility to fund our working capital needs, capital expenditures, or selective acquisitions, as necessary, through the finalis due at maturity date ofon June 30, 2016. However, we may make principal payments to reduce the outstanding balance prior to maturity when cash and working capital is sufficient. The $425.0 million face amount outstanding under our Senior Notes will mature on March 15, 2018. Our Senior Notes have a carrying value of $417.7418.6 million as of December 31, 20112012, which represents the $425.0 million face value net of the $8.97.9 million of original issue discount and $1.71.5 million of original issue premium, net of amortization, based on the effective interest method. Our subordinatedother notes payable have final maturity dates in March and April 2013.
Interest payment obligations on our Revolving Credit Facility are estimated based on (1) the 3.0% interest rate that was in effect at December 31, 2012, and (2) the outstanding balance of $100.0 million at December 31, 2012 to be paid at maturity on June 30, 2016. Interest payment obligations on our Senior Notes are calculated based on the coupon interest rate of 9.875% due semi-annually in arrears on March 15 and September 15 of each year. Interest payment obligations on our subordinatedother notes payable are based on interest rates ranging from 6% to 14%, with annual payments of principal and interest through maturity.
Purchase commitments primarily relate to tennew-build drilling rigs, equipment upgrades and purchases of other new equipment. The total estimated cost, excluding capitalized interest, for the ten new-build drilling rigs is approximately $220 million to $240 million, of which $66.5226.7 million has already been incurred, and $103.46.5 million of which is reflected in the purchase commitments included in the table above.
Operating leases consist of lease agreements for office space, operating facilities, equipment and personal property.
As of December 31, 20112012, we had restricted cash in the amount of $1.30.7 million held in an escrow account to be used for a future payments in connection with the acquisition of Competition. The former owners of Competition will receive annual installments ofpayment due $0.7 millionMarch 2013 to a former shareholder of a previously acquired production services businesses.
Other long-term liabilities include both current and noncurrent portions of our net equity tax payable overto the remaining two years fromColombian tax authority and long-term incentive compensation which is payable to our employees, generally contingent upon their continued employment through the escrow account.date of each respective award's payout.
Debt Requirements
The Revolving Credit Facility contains customary mandatory prepayments from the proceeds of certain asset dispositions or debt issuances, which are applied to reduce outstanding revolving and swing-line loans and letter of credit exposure. There are no limitations on our ability to access the $250 million borrowing capacity other than maintaining compliance with the covenants under the Revolving Credit Facility. At December 31, 20112012, we were in compliance with our financial covenants. Our total consolidated leverage ratio was 2.22.1 to 1.0, our senior consolidated leverage ratio was 0.10.4 to 1.0, and our interest coverage ratio was 6.77.0 to 1.0. The financial covenants contained in our Revolving Credit Facility include the following:
A maximum total consolidated leverage ratio that cannot exceed 4.00 to 1.00;
A maximum senior consolidated leverage ratio, which excludes unsecured and subordinated debt, that cannot exceed 2.50 to 1.00;
A minimum interest coverage ratio that cannot be less than 2.50 to 1.00; and
If our senior consolidated leverage ratio is greater than 2.00 to 1.00 at the end of any fiscal quarter, our minimum asset coverage ratio cannot be less than 1.00 to 1.00.
The Revolving Credit Facility does not restrict capital expenditures as long as (a) no event of default exists under the Revolving Credit Facility or would result from such capital expenditures, (b) after giving effect to such capital expenditures there is availability under the Revolving Credit Facility equal to or greater than $25 million and (c) the senior consolidated leverage ratio as of the last day of the most recent reported fiscal quarter is less than 2.00 to 1.00. If the senior consolidated leverage ratio as of the last day of the most recent reported fiscal quarter is equal to or greater than 2.00 to 1.00, then capital expenditures are limited to $100 million for the fiscal year. The capital expenditure threshold may be increased by any unused portion of the capital expenditure threshold from the immediate preceding fiscal year up to $30 million.
At December 31, 2011,2012, our senior consolidated leverage ratio was not greater than 2.00 to 1.00 and therefore, we were not subject to the capital expenditure threshold restrictions listed above.
The Revolving Credit Facility has additional restrictive covenants that, among other things, limit the incurrence of additional debt, investments, liens, dividends, acquisitions, redemptions of capital stock, prepayments of indebtedness, asset dispositions, mergers and consolidations, transactions with affiliates, hedging contracts, sale leasebacks and other matters customarily restricted in such agreements. In addition, the Revolving Credit Facility contains customary events of default, including without limitation, payment defaults, breaches of representations and warranties, covenant defaults, cross-defaults to certain other material indebtedness in excess of specified amounts, certain events of bankruptcy and insolvency, judgment defaults in excess of specified amounts, failure of any guaranty or security document supporting the credit agreement and change of control.
Our obligations under the Revolving Credit Facility are secured by substantially all of our domestic assets (including equity interests in Pioneer Global Holdings, Inc. and 65% of the outstanding equity interests of any first-tier foreign subsidiaries owned by Pioneer Global Holdings, Inc., but excluding any equity interest in, and any assets of, Pioneer Services Holdings, LLC) and are guaranteed by certain of our domestic subsidiaries, including Pioneer Global Holdings, Inc. Effective October 1, 2012, Pioneer Coiled Tubing Services, LLC (formerly Go-Coil, L.L.C.) was added as a subsidiary guarantor under the Revolving Credit Facility. Borrowings under the Revolving Credit Facility are available for acquisitions, working capital and other general corporate purposes.
In addition to the financial covenants under our Revolving Credit Facility, the Indenture Agreement for our Senior Notes contains certain restrictions generally on our ability to:
pay dividends on stock;
repurchase stock or redeem subordinated debt or make other restricted payments;
incur, assume or guarantee additional indebtedness or issue disqualified stock;
create liens on our assets;
enter into sale and leaseback transactions;
pay dividends, engage in loans, or transfer other assets from certain of our subsidiaries;
consolidate with or merge with or into, or sell all or substantially all of our properties to another person;
enter into transactions with affiliates; and
enter into new lines of business.
Upon the occurrence of a change of control, holders of the Senior Notes will have the right to require us to purchase all or a portion of the Senior Notes at a price equal to 101% of the principal amount of each Senior Note, together with any accrued and unpaid interest to the date of purchase. Under certain circumstances in connection with asset dispositions, we will be required to use the excess proceeds of asset dispositions to make an offer to purchase the Senior Notes at a price equal to 100% of the principal amount of each Senior Note, together with any accrued and unpaid interest to the date of purchase.
Our Senior Notes are fully and unconditionally guaranteed, jointly and severally, on a senior unsecured basis by our existing domestic subsidiaries, except for Pioneer Services Holdings, LLC, and Go-Coil, LLC, and by certain of our future domestic subsidiaries. Effective October 1, 2012, the Indenture was supplemented to add Pioneer Coiled Tubing Services, LLC (formerly Go-Coil, L.L.C.) as a subsidiary guarantor. The subsidiaries that generally operate our non-U.S. business concentrated in Colombia do not guarantee our Senior Notes. The non-guarantor subsidiaries do not have any payment obligations under the Senior Notes, the guarantees or the Indenture. In the event of a bankruptcy, liquidation or reorganization of any non-guarantor subsidiary, such non-guarantor subsidiary will pay the holders of its debt and other liabilities, including its trade creditors, before it will be able to distribute any of its assets to us. In the future, any non-U.S. subsidiaries, immaterial subsidiaries and subsidiaries that we designate as unrestricted subsidiaries under the Indenture will not guarantee the Senior Notes.
Our Senior Notes are not subject to any sinking fund requirements. As of December 31, 20112012, there were no restrictions on the ability of subsidiary guarantors to transfer funds to the parent company, and we were in compliance with all covenants pertaining to our Senior Notes.
Critical Accounting Policies and Estimates
Revenue and cost recognition—Our Drilling Services Division earns revenues by drilling oil and gas wells for our customers under daywork, turnkey or footage contracts, which usually provide for the drilling of a single well. We recognize revenues on daywork contracts for the days completed based on the dayrate each contract specifies. We recognize revenues from our turnkey and footage contracts on the percentage-of-completion method based on our estimate of the number of days to complete each contract. Individual contracts are usually completed in less than 60 days. The risks to us under a turnkey contract and, to a lesser extent, under footage contracts, are substantially greater than on a contract drilled on a daywork basis. Under a turnkey contract, we assume most of the risks associated with drilling operations that are generally assumed by the operator in a daywork contract, including the risks of blowout, loss of hole, stuck drill pipe, machinery breakdowns and abnormal drilling conditions, as well as risks associated with subcontractors’ services, supplies, cost escalations and personnel operations.
Our management has determined that it is appropriate to use the percentage-of-completion method to recognize revenue on our turnkey and footage contracts. Although our turnkey and footage contracts do not have express terms that provide us with rights to receive payment for the work that we perform prior to drilling wells to the agreed-on depth, we use this method because, as provided in applicable accounting literature, we believe we achieve a continuous sale for our work-in-progress and believe, under applicable state law, we ultimately could recover the fair value of our work-in-progress even in the event we were unable to drill to the agreed-on depth in breach of the applicable contract. However, in the event we were unable to drill to the agreed-on depth in breach of the contract, ultimate recovery of that value would be subject to negotiations with the customer and the possibility of litigation.
If a customer defaults on its payment obligation to us under a turnkey or footage contract, we would need to rely on applicable law to enforce our lien rights, because our turnkey and footage contracts do not expressly grant to us a security interest in the work we have completed under the contract and we have no ownership rights in the work-in-progress or completed drilling work, except any rights arising under the applicable lien statute on foreclosure. If we were unable to drill to the agreed-on depth in breach of the contract, we also would need to rely on equitable remedies outside of the contract available in applicable courts to recover the fair value of our work-in-progress under a turnkey or footage contract.
We accrue estimated contract costs on turnkey and footage contracts for each day of work completed based on our estimate of the total costs to complete the contract divided by our estimate of the number of days to complete the contract. Contract costs include labor, materials, supplies, repairs and maintenance, operating overhead allocations and allocations of depreciation and amortization expense. In addition, the occurrence of uninsured or under-insured losses or operating cost overruns on our turnkey and footage contracts could have a material adverse effect on our financial position and results of operations. Therefore, our actual results for a contract could differ significantly if our cost estimates for that contract are later revised from our original cost estimates for a contract in progress at the end of a reporting period which was not completed prior to the release of our financial statements.
With most drilling contracts, we receive payments contractually designated for the mobilization of rigs and other equipment. Payments received, and costs incurred for the mobilization services are deferred and recognized on a straight line basis over the related contract term. Costs incurred to relocate rigs and other drilling equipment to areas in which a contract has not been secured are expensed as incurred. Reimbursements that we receive for out-of-pocket expenses are recorded as revenue and the out-of-pocket expenses for which they relate are recorded as operating costs.
Our Production Services Division earns revenues for well services, wireline services, coiled tubing services and fishing and rental services pursuant to master services agreements based on purchase orders, contracts or other persuasive evidence of an arrangement with the customer that include fixed or determinable prices. Production service revenue is recognized when the service has been rendered and collectability is reasonably assured.
The asset “unbilled receivables” represents revenues we have recognized in excess of amounts billed on drilling contracts and for production services completed but not yet invoiced. The assets “prepaid expenses and other current assets” and “other long-term assets” include the current and long-term portions of deferred mobilization costs for certain drilling contracts. The liabilities “prepaid drilling contracts” and “other long-term liabilities” include the current and long-term portions of deferred mobilization revenues for certain drilling contracts and amounts collected on contracts in excess of revenues recognized. As of December 31, 2011, we had $4.0 million of current deferred mobilization revenues and $4.6 million of current deferred mobilization costs. Our deferred mobilization costs and revenues primarily related to long-term contracts for our Colombian operations, which are being amortized through the year ending December 31, 2012. Amortization of deferred mobilization revenues was $5.1 million and $3.0 million for the years ended December 31, 2011 and 2010, respectively.
Long-lived assets and intangible assets—We evaluate for potential impairment of long-lived assets and intangible assets subject to amortization when indicators of impairment are present. Circumstances that could indicate a potential impairment include significant adverse changes in industry trends, economic climate, legal factors, and an adverse action or assessment by a regulator. More specifically, significant adverse changes in industry trends include significant declines in revenue rates, utilization rates, oil and natural gas market prices and industry rig counts for drilling rigs and well service rigs. In performing the impairment evaluation, we estimate the future undiscounted net cash flows relating to long-lived assets and intangible assets grouped at the lowest level that cash flows can be identified. For our Production Services Division, our long-lived assets and intangible assets are grouped at the reporting unit level which is one level below the operating segment level. For our Drilling Services Division, we perform an impairment evaluation and estimate future undiscounted cash flows for individual drilling rig assets. If the sum of the estimated future undiscounted net cash flows is less than the carrying amount of the long-lived assets and intangible assets for these asset grouping levels, then we would recognize an impairment charge. The amount of an impairment charge would be measured as the difference between the carrying amount and the fair value of these assets. The assumptions used in the impairment evaluation for long-lived assets and intangible assets are inherently uncertain and require management judgment.
Goodwill—Goodwill results from business acquisitions and represents the excess of acquisition costs over the fair value of the net assets acquired. Goodwill is tested for impairment annually as of December 31 or more frequently if events or changes in circumstances indicate that the asset might be impaired. Circumstances that could indicate a potential impairment include a significant adverse change in the economic or business climate, a significant adverse change in legal factors, an adverse action or assessment by a regulator, unanticipated competition, loss of key personnel and the likelihood that a reporting unit or significant portion of a reporting unit will be sold or otherwise disposed of. These circumstances could lead to our net book value exceeding our market capitalization which is another indicator of a potential impairment in goodwill.
We use a two-step process for testing impairment of goodwill. First, the fair value of each reporting unit with goodwill is compared to its carrying value to determine whether an indication of impairment exists. Second, if impairment is indicated, then the fair value of the reporting unit's goodwill is determined by allocating the unit's fair value to its assets and liabilities (including any unrecognized intangible assets) as if the reporting unit had been acquired in a business combination on the impairment test date. The amount of impairment for goodwill is measured as the excess of the carrying value of the reporting unit over its fair value.
When estimating fair values of a reporting unit for our goodwill impairment test, we use a combination of an income approach and a market approach which incorporates both management’s views and those of the market. The income approach provides an estimated fair value based on each reporting unit’s anticipated cash flows that were discounted using a weighted average cost of capital rate. The market approach provides an estimated fair value based on our market capitalization that was computed using the prior 30-day average market price of our common stock and the number of shares outstanding as of the impairment test date. The estimated fair values computed using the income approach and the market approach are then equally weighted and combined into a single fair value. The primary assumptions used in the income approach are estimated cash flows and weighted average cost of capital. Estimated cash flows are primarily based on projected revenues, operating costs and capital expenditures and are discounted based on comparable industry average rates for weighted average cost of capital. The assumptions used in estimating fair values of reporting units and performing the goodwill impairment test are inherently uncertain and require management judgment.
Deferred taxes—We provide deferred taxes for the basis differences in our property and equipment between financial reporting and tax reporting purposes and other costs such as compensation, net operating loss carryforwards, employee benefit and other accrued liabilities which are deducted in different periods for financial reporting and tax reporting purposes. For property and equipment, basis differences arise from differences in depreciation periods and methods and the value of assets acquired in a business acquisition where we acquire an entity rather than just its assets. For financial reporting purposes, we depreciate the various components of our drilling rigs, well service rigs, wireline units and coiled tubing units over 2 to 25 years and refurbishments over 3 to 5 years, while federal income tax rules require that we depreciate drilling rigs, well service rigs, wireline units and coiled tubing units over 5 years. Therefore, in the first 5 years of our ownership of a drilling rig, well service rig, wireline unit or coiled tubing units, our tax depreciation exceeds our financial reporting depreciation, resulting in our providing deferred taxes on this depreciation difference. After 5 years, financial reporting depreciation exceeds tax depreciation, and the deferred tax liability begins to reverse.
Accounting estimates—We consider the recognition of revenues and costs on turnkey and footage contracts to be critical accounting estimates. On these types of contracts, we are required to estimate the number of days needed for us to complete the contract and our total cost to complete the contract. Our actual costs could substantially exceed our estimated costs if we encounter problems such as lost circulation, stuck drill pipe or an underground blowout on contracts still in progress subsequent to the release of the financial statements. We receive payment under turnkey and footage contracts when we deliver to our customer a well completed to the depth specified in the contract, unless the customer authorizes us to drill to a more shallow depth. Since 1995, we have completed all our turnkey or footage contracts. Although our initial cost estimates for turnkey and footage contracts do not include cost estimates for risks such as stuck drill pipe or loss of circulation, we believe that our experienced management team, our knowledge of geologic formations in our areas of operations, the condition of our drilling equipment and our experienced crews have previously enabled us to make reasonable cost estimates and complete contracts according to our drilling plan. While we do bear the risk of loss for cost overruns and other events that are not specifically provided for in our initial cost estimates, our pricing of turnkey and footage contracts takes such risks into consideration. We are more likely to encounter losses on turnkey and footage contracts in periods in which revenue rates are lower for all types of contracts. During periods of reduced demand for drilling rigs, our overall profitability on turnkey and footage contracts has historically exceeded our profitability on daywork contracts. When we encounter, during the course of our drilling operations, conditions unforeseen in the preparation of our original cost estimate, we increase our cost estimate to complete the contract. If we anticipate a loss on a contract in progress at the end of a reporting period due to a change in our cost estimate, we accrue the entire amount of the estimated loss, including all costs that are included in our revised estimated cost to complete that contract, in our consolidated statement of operations for that reporting period. We experienced a total loss of approximately $1.5 million on two of the turnkey contracts completed during 2011.
Revenues and costs during a reporting period could be affected for contracts in progress at the end of a reporting period which have not been completed before our financial statements for that period are released. We had one turnkey contract in progress at December 31, 2011, which was completed prior to the release of the financial statements included in this report.
Our unbilled receivables totaled $31.5 million at December 31, 2011. Of that amount accrued, turnkey drilling contract revenues were $0.6 million. The remaining balance of unbilled receivables related to $27.9 million of the revenue recognized but not yet billed on daywork drilling contracts in progress at December 31, 2011 and $3.0 million related to unbilled receivables for our Production Services Division.
We estimate an allowance for doubtful accounts based on the creditworthiness of our customers as well as general economic conditions. We evaluate the creditworthiness of our customers based on commercial credit reports, trade references, bank references, financial information, production information and any past experience we have with the customer. Consequently, any change in those factors could affect our estimate of our allowance for doubtful accounts. In some instances, we require new customers to establish escrow accounts or make prepayments. We typically invoice our customers at 15-day intervals during the performance of daywork contracts and upon completion of the daywork contract. Turnkey and footage contracts are invoiced upon completion of the contract. Our typical contract provides for payment of invoices in 10 to 30 days. We generally do not extend payment terms beyond 30 days and have not extended payment terms beyond 90 days for any of our contracts in the last three fiscal years. We had an allowance for doubtful accounts of $1.0 million at December 31, 2011.
Our determination of the useful lives of our depreciable assets, which directly affects our determination of depreciation expense and deferred taxes is also a critical accounting estimate. A decrease in the useful life of our property and equipment would increase depreciation expense and reduce deferred taxes. We provide for depreciation of our drilling, production, transportation and other equipment on a straight-line method over useful lives that we have estimated and that range from 2 to 25 years. We record the same depreciation expense whether a drilling rig, well service rig, wireline unit or coiled tubing unit is idle or working. Our estimates of the useful lives of our drilling, production, transportation and other equipment are based on our more than 40 years of experience in the oilfield services industry with similar equipment.
As of December 31, 2011, we had a $1.2 million deferred tax asset related to the $3.3 million impairment of our ARPSs which represents a capital loss for tax treatment purposes. We can recognize a tax benefit associated with this impairment to the extent of capital gains we expect to earn in future periods. During the year ended December 31, 2010, we recorded a valuation allowance to fully offset our deferred tax asset relating to this capital loss since we believe capital gains are not likely in future periods.
As of December 31, 2011, we had $46.1 million of deferred tax assets related to foreign and domestic net operating loss and AMT credit carryforwards available to reduce future taxable income. In assessing the realizability of our deferred tax assets, we only recognize a tax benefit to the extent of taxable income that we expect to earn in the jurisdiction in future periods. We estimate that our operations will result in taxable income in excess of our net operating losses and we expect to apply the net operating losses against the current year taxable income and taxable income that we have estimated in future periods.
Our accrued insurance premiums and deductibles as of December 31, 2011 include accruals for costs incurred under the self-insurance portion of our health insurance of approximately $1.9 million and our workers’ compensation, general liability and auto liability insurance of approximately $6.5 million. We have stop loss coverage of $150,000 per occurrence under our health insurance and a deductible of $500,000 per occurrence under our workers’ compensation insurance. We have a deductible of $250,000 per occurrence under both our general liability insurance and auto liability insurance. We accrue for these costs as claims are incurred based on historical claim development data, and we accrue the costs of administrative services associated with claims processing.
Our stock-based compensation expense includes estimates for certain of our long-term incentive compensation plans which have performance-based award components dependent upon our performance over a set performance period, as compared to the performance of a pre-defined peer group. The accruals for these awards include estimates which affect our stock-based compensation expense, employee related accruals and equity. The accruals are adjusted based on actual achievement levels at the end of the pre-determined performance periods.
Results of Operations
Statements of Operations Analysis—Year Ended December 31, 20112012 Compared with the Year Ended December 31, 20102011
The following table provides information about our operations for the years ended December 31, 20112012 and December 31, 20102011 (amounts in thousands, except average number of drilling rigs, utilization rate and revenue day information).
| | | | Year ended December 31, | Year ended December 31, |
| | 2011 | | 2010 | 2012 | | 2011 |
| Drilling Services Division: | | | | |
| Drilling Services Segment: | | | | |
| Revenues | $ | 433,902 |
| | $ | 312,196 |
| $ | 498,867 |
| | $ | 433,902 |
|
| Operating costs | 292,559 |
| | 227,136 |
| 333,846 |
| | 292,559 |
|
| Drilling Services Division margin | $ | 141,343 |
| | $ | 85,060 |
| |
| Drilling Services Segment margin | | $ | 165,021 |
| | $ | 141,343 |
|
| | | | | | | |
| Average number of drilling rigs | 69.3 |
| | 71.0 |
| 65.0 |
| | 69.3 |
|
| Utilization rate | 73 | % | | 59 | % | 87 | % | | 73 | % |
| Revenue days | 18,383 |
| | 15,182 |
| 20,728 |
| | 18,383 |
|
| | | | | | | |
| Average revenues per day | $ | 23,603 |
| | $ | 20,564 |
| $ | 24,067 |
| | $ | 23,603 |
|
| Average operating costs per day | 15,915 |
| | 14,961 |
| 16,106 |
| | 15,915 |
|
| Drilling Services Division margin per day | $ | 7,688 |
| | $ | 5,603 |
| |
| Drilling Services Segment margin per day | | $ | 7,961 |
| | $ | 7,688 |
|
| | | | | | | |
| Production Services Division: |
| |
| |
| Production Services Segment: | | | | |
| Revenues | $ | 282,039 |
| | $ | 175,014 |
| $ | 420,576 |
| | $ | 282,039 |
|
| Operating costs | 164,365 |
| | 105,295 |
| 252,775 |
| | 164,365 |
|
| Production Services Division margin | $ | 117,674 |
| | $ | 69,719 |
| |
| Production Services Segment margin | | $ | 167,801 |
| | $ | 117,674 |
|
| | | | | | | |
| Combined: |
| |
| | | |
| Revenues | $ | 715,941 |
| | $ | 487,210 |
| $ | 919,443 |
| | $ | 715,941 |
|
| Operating costs | 456,924 |
| | 332,431 |
| 586,621 |
| | 456,924 |
|
| Combined margin | $ | 259,017 |
| | $ | 154,779 |
| $ | 332,822 |
| | $ | 259,017 |
|
| Adjusted EBITDA | $ | 183,870 |
| | $ | 103,151 |
| $ | 249,283 |
| | $ | 183,870 |
|
Drilling Services DivisionSegment margin represents contract drilling revenues less contract drilling operating costs. Production Services DivisionSegment margin represents production services revenue less production services operating costs. We believe that Drilling Services Division MarginSegment margin and Production Services DivisionSegment margin are useful measures for evaluating financial performance, although they are not measures of financial performance under U.S. Generally Accepted Accounting Principles (GAAP). However, Drilling Services DivisionSegment margin and Production Services DivisionSegment margin are common measures of operating performance used by investors, financial analysts, rating agencies and Pioneer’s management. A reconciliation of Drilling Services DivisionSegment margin and Production Services Division margin to net income (loss), as reported is included in the table below. Drilling Services Division margin and Production Services DivisionSegment margin as presented may not be comparable to other similarly titled measures reported by other companies.
Adjusted EBITDA is a financial measure that is not in accordance with GAAP, and should not be considered (i)(a) in isolation of, or as a substitute for, net earningsincome (loss), (ii)(b) as an indication of operating performance or cash flows from operating activities or (iii)(c) as a measure of liquidity. In addition, Adjusted EBITDA does not represent funds available for discretionary use. We define Adjusted EBITDA as earningsincome (loss) before interest income (expense), taxes, depreciation, amortization and any impairments. We use this measure, together with our GAAP financial metrics, to assess our financial performance and evaluate our overall progress towards meeting our long-term financial objectives. We believe that this non-GAAP financial measure is useful to investors and analysts in allowing for greater transparency of our operating performance and makes it easier to compare our results with those of other companies within our industry. Adjusted EBITDA, as we calculate it, may not be comparable to Adjusted EBITDA measures reported by other companies.
A reconciliation of combined Drilling Services Segment margin and Production Services Segment margin to net income (loss), as reported, and a reconciliation of Adjusted EBITDA to net income (loss) is, as reported, are set forth in the following table.
|
| | | | | | | |
| | Year ended December 31, |
| | 2012 | | 2011 |
| | (amounts in thousands) |
| Reconciliation of combined margin and Adjusted EBITDA to net income: | | | |
| Combined margin | $ | 332,822 |
| | $ | 259,017 |
|
| General and administrative | (85,603 | ) | | (67,318 | ) |
| Bad debt recovery (expense) | 440 |
| | (925 | ) |
| Other income (expense) | 1,624 |
| | (6,904 | ) |
| Adjusted EBITDA | 249,283 |
| | 183,870 |
|
| Depreciation and amortization | (164,717 | ) | | (132,832 | ) |
| Impairment of equipment | (1,131 | ) | | (484 | ) |
| Interest expense | (37,049 | ) | | (29,721 | ) |
| Income tax expense | (16,354 | ) | | (9,656 | ) |
| Net income | $ | 30,032 |
| | $ | 11,177 |
|
Our Drilling Services Segment experienced increases in its revenues and operating costs due to higher demand for our domestic drilling services in 2012 as compared to 2011, as our industry continues to recover from the downturn that bottomed in late 2009. Domestic revenues increased as a result of increasing oil prices and rig utilization and improved revenue rates particularly in oil-producing regions and in certain shale regions. Increases in domestic revenues and operating costs were partially offset by decreases in our international revenues and operating costs due to decreased utilization in Colombia.
Our Drilling Services Segment’s revenues increased by $65.0 million, or 15%, during 2012 as compared to 2011, primarily due to an increase in domestic drilling rig utilization and the addition of seven new-build drilling rigs which began operations during 2012. With the increase in demand for our drilling services during 2012, our revenue days increased by 13%during 2012 as compared to 2011, and our revenues per day increased by 2% or $464 per day, despite a decrease in our utilization in Colombia, where we have higher revenues per day. The increase in our domestic drilling rig utilization rate was also impacted by our decision to dispose of seven drilling rigs in September 2011 and another two drilling rigs in March 2012.
Our Drilling Services Segment’s operating costs increased by $41.3 million, or 14%, during 2012 as compared to 2011, primarily due to the increase in domestic utilization and the addition of seven new-build drilling rigs which began operations during 2012. Our operating costs per day increased by 1% or $191 per day, during 2012 as compared to 2011, primarily due to increases in supplies, repair and maintenance costs and increased mobilization costs for drilling rigs that were moved between our domestic drilling divisions during 2012. The increase in our operating costs per day was partially offset by a decrease in our international operating costs due to decreased utilization in Colombia, where we have higher operating costs per day.
Demand for drilling rigs influences the types of drilling contracts we are able to obtain. As demand for drilling rigs decreases, daywork rates move down and we may switch to performing more turnkey drilling contracts to maintain higher utilization rates and to improve our Drilling Services Segment’s margins. Turnkey drilling contracts result in higher average revenues per day and higher average operating costs per day as compared to daywork drilling contracts. During the years ended December 31, 2012 and 2011, we completed 11 and 17 turnkey contracts, respectively, representing 3% and 4% of our total drilling revenues for each year, respectively.
Our Production Services Segment's revenues increased by $138.5 million, or 49%, during 2012 as compared to 2011, while operating costs increased $88.4 million, or 54%. The increases in revenues and operating costs are primarily due to the expansion of our operations through fleet additions and the acquisition of Go-Coil on December 31, 2011. Higher demand for our other production services, which resulted in higher utilization rates and higher revenue rates charged for these services during the year ended December 31, 2012, has also increased both our Production Services Segment’s revenues and operating costs during 2012 as compared to 2011.
Our general and administrative expense increased by approximately $18.3 million, or 27%, during 2012 as compared to 2011. The increase is primarily due to increases in payroll and compensation related expenses resulting from the increased demand for our services and the expansion of our operations through fleet additions and the acquisition of Go-Coil on December 31, 2011.
Our bad debt recovery for the year ended December 31, 2012 related to the collection of $0.5 million for an account receivable which had been written off prior to 2011.
Our other income for the year ended December 31, 2012 includes $0.6 million recognized for the redemption of certain Auction Rate Preferred Securities ("ARPSs") on October 1, 2012. Our other expense for the year ended December 31, 2011 primarily related to the $7.3 million net-worth tax expense for our Colombian operations, which was assessed on January 1, 2011, and was partially reduced by $0.5 million of income recognized for our ARPSs Call Option in January 2011.
Our depreciation and amortization expenses increased by $31.9 millionduring 2012 as compared to 2011. This increase resulted primarily from the expansion of our operations through the acquisition of Go-Coil, fleet additions, new-build drilling rigs that went into service in 2012 and capital expenditures for upgrades to our drilling rig fleet.
During the year ended December 31, 2012, we recorded impairment charges of $1.1 million in association with our decision to retire two drilling rigs, with most of their components to be used as spare parts, and to retire two wireline units and certain wireline equipment.
Our interest expense increased for the year ended December 31, 2012, as compared to the year ended December 31,2011, primarily due to the issuance of our Senior Notes in November 2011. The issuance of our Senior Notes in November 2011 increased our overall debt balance in 2012. The overall increase in interest expense was partially offset by $10.2 million of capitalized interest during the year ended December 31, 2012, associated with the capital expenditures for upgrades to our drilling rig fleet and for our new-build drilling rigs.
Our effective income tax rate for the year ended December 31, 2012 was 35%, which is the same as the federal statutory rate in the United States, primarily due to the impact of state income taxes that were offset by lower effective tax rates in foreign jurisdictions, the effect of foreign translation and other permanent differences.
Statements of Operations Analysis—Year Ended December 31, 2011 Compared with the Year Ended December 31, 2010
The following table provides information about our operations for the years ended December 31, 2011 and December 31, 2010 (amounts in thousands, except average number of drilling rigs, utilization rate and revenue day information).
|
| | | | | | | |
| | Year ended December 31, |
| | 2011 | | 2010 |
| Drilling Services Segment: | | | |
| Revenues | $ | 433,902 |
| | $ | 312,196 |
|
| Operating costs | 292,559 |
| | 227,136 |
|
| Drilling Services Segment margin | $ | 141,343 |
| | $ | 85,060 |
|
| | | | |
| Average number of drilling rigs | 69.3 |
| | 71.0 |
|
| Utilization rate | 73 | % | | 59 | % |
| Revenue days | 18,383 |
| | 15,182 |
|
| | | | |
| Average revenues per day | $ | 23,603 |
| | $ | 20,564 |
|
| Average operating costs per day | 15,915 |
| | 14,961 |
|
| Drilling Services Segment margin per day | $ | 7,688 |
| | $ | 5,603 |
|
| | | | |
| Production Services Segment: | | | |
| Revenues | $ | 282,039 |
| | $ | 175,014 |
|
| Operating costs | 164,365 |
| | 105,295 |
|
| Production Services Segment margin | $ | 117,674 |
| | $ | 69,719 |
|
| | | | |
| Combined: | | | |
| Revenues | $ | 715,941 |
| | $ | 487,210 |
|
| Operating costs | 456,924 |
| | 332,431 |
|
| Combined margin | $ | 259,017 |
| | $ | 154,779 |
|
| Adjusted EBITDA | $ | 183,870 |
| | $ | 103,151 |
|
Drilling Services Segment margin represents contract drilling revenues less contract drilling operating costs. Production Services Segment margin represents production services revenue less production services operating costs. We believe that Drilling Services Segment margin and Production Services Segment margin are useful measures for evaluating financial performance, although they are not measures of financial performance under U.S. Generally Accepted Accounting Principles (GAAP). However, Drilling Services Segment margin and Production Services Segment margin are common measures of operating performance used by investors, financial analysts, rating agencies and Pioneer’s management. Drilling Services Segment margin and Production Services Segment margin as presented may not be comparable to other similarly titled measures reported by other companies.
Adjusted EBITDA is a financial measure that is not in accordance with GAAP, and should not be considered (a) in isolation of, or as a substitute for, net income (loss), (b) as an indication of operating performance or cash flows from operating activities or (c) as a measure of liquidity. In addition, Adjusted EBITDA does not represent funds available for discretionary use. We define Adjusted EBITDA as income (loss) before interest income (expense), taxes, depreciation, amortization and any impairments. We use this measure, together with our GAAP financial metrics, to assess our financial performance and evaluate our overall progress towards meeting our long-term financial objectives. We believe that this non-GAAP financial measure is useful to investors and analysts in allowing for greater transparency of our operating performance and makes it easier to compare our results with those of other companies within our industry. Adjusted EBITDA, as we calculate it, may not be comparable to Adjusted EBITDA measures reported by other companies.
A reconciliation of combined Drilling Services Segment margin and Production Services Segment margin to net income (loss), as reported, and a reconciliation of Adjusted EBITDA to net income (loss), as reported, are set forth in the following table.
|
| | | | | | | |
| | Year ended December 31, |
| | 2011 | | 2010 |
| | (amounts in thousands) |
| Reconciliation of combined margin and Adjusted EBITDA to net income (loss): | | | |
| Combined margin | $ | 259,017 |
| | $ | 154,779 |
|
| General and administrative | (67,318 | ) | | (52,047 | ) |
| Bad debt expense | (925 | ) | | (493 | ) |
| Other (expense) income | (6,904 | ) | | 912 |
|
| Adjusted EBITDA | 183,870 |
| | 103,151 |
|
| Depreciation and amortization | (132,832 | ) | | (120,811 | ) |
| Impairment of equipment | (484 | ) | | — |
|
| Interest expense | (29,721 | ) | | (26,567 | ) |
| Impairment of investments | — |
| | (3,331 | ) |
| Income tax (expense) benefit | (9,656 | ) | | 14,297 |
|
| Net income (loss) | $ | 11,177 |
| | $ | (33,261 | ) |
Our Drilling Services DivisionSegment experienced increases in its revenues and operating costs due to higher demand for our drilling services in 2011 as compared to 2010, as our industry continues to recover from the downturn that bottomed in late 2009. With increasing oil prices, rig utilization and revenue rates improved, particularly in oil-producing regions and in certain shale regions.
Our Drilling Services Division’sSegment’s revenues increased by $121.7 million, or 39%, for the year ended December 31, 2011 as compared to the year ended December 31, 2010, due to an increase in utilization rates and drilling revenue rates. During the year ended December 31, 2011, our drilling rig utilization increased to 73% from 59%, and our average drilling revenues per day increased by 15%, or $3,039 per day, as compared to to the year ended December 31, 2010.
Our Drilling Services Division’sSegment’s operating costs increased by $65.4 million, or 29%, for the year ended December 31, 2011, as compared to the year ended December 31, 2010, primarily due to the increase in utilization and the increase in our operating costs per day. Our operating costs per day increased by 6%, or $954 per day, for the year ended December 31, 2011 as compared to the year ended December 31, 2010. As utilization rates increased, average operating costs per day increased due to higher wage rates and repair and maintenance expenses as drilling rigs came out of storage and began operations.
Demand for drilling rigs influences the types of drilling contracts we are able to obtain. As demand for drilling rigs decreases, daywork rates move down and we may switch to performing more turnkey drilling contracts to maintain higher utilization rates and improve our Drilling Services Division’sSegment’s margins. Turnkey drilling contracts also result in higher average revenues per day and higher average operating costs per day when compared to daywork drilling contracts. We completed 17 turnkey drilling contracts during 2011, as compared to 11 turnkey drilling contracts completed during 2010. The following table provides percentages of our drilling revenues by drilling contract type forDuring the years ended December 31, 2011 and 2010:, we completed
|
| | | | | |
| | Year ended December 31, |
| | 2011 | | 2010 |
| Daywork Contracts | 96 | % | | 95 | % |
| Turnkey Contracts | 4 | % | | 5 | % |
| Footage Contracts | — |
| | — |
|
Our Production Services Division'sSegment's revenues increased by $107.0 million, or 61%, while operating costs increased $59.1 million, or 56%. The increases in revenues and operating costs are primarily due to higher demand for our wireline services, well services and fishing and rental services, which resulted in higher utilization rates and higher revenue rates charged for these services during the year ended December 31, 2011, as compared to the year ended December 31, 2010. The expansion of our operations through the addition of 21 wireline units, or a 25% increase in units, and 15 well serviceservicing rigs, or a 20% increase in our well serviceservicing rig fleet, from December 31, 2010 to December 31, 2011 has also increased both our Production Services Division’sSegment’s revenues and operating costs for the year ended December 31, 2011, as compared to 2010.
Our general and administrative expense increased by approximately $15.3 million, or 29%, for the year ended December 31, 2011 as compared to the year ended December 31, 2010. The increase is primarily due to increases in payroll and compensation related expenses. We have seen an increase in the demand for our services as our industry continues to recover from the industry downturn in 2009. As a result, payroll and compensation related expenses increased during the year ended December 31, 2011, as compared to the year ended December 31, 2010, as we have added employees in our corporate office and have accrued for increased incentive compensation based on strong 2011 operating results. In addition, professional fees increased in 2011 as compared to 2010, primarily due to the acquisition of Go-Coil on December 31, 2011.
Our other expense increased for the year ended December 31, 2011, as compared to the year ended December 31, 2010, primarily due to the $7.3 million net-worth tax expense for our Colombian operations which was assessed on January 1, 2011.
Our depreciation and amortization expenses increased by $12.0 million for the year ended December 31, 2011, as compared to the year ended December 31, 2010. This increase resulted primarily from capital expenditures made to upgrade certain drilling rigs to meet the needs of our customersclients and obtain new contracts, as well as capital expenditures for additions to our production services fleets.
During the year ended December 31, 2011, we recorded impairment charges of $0.5 million related to our decision to place six mechanical drilling rigs as held for sale, and to retire one drilling rig with most of its components to be used as spare parts.
Our interest expense increased for the year ended December 31, 2011, as compared to the year ended December 31, 2010, primarily due to the issuance of our Senior Notes in March 2010 and November 2011. The proceeds from the issuance in March 2010 were used to repay a portion of the outstanding debt balance under the Revolving Credit Facility, which has a lower interest rate when compared to the Senior Notes. In addition, the issuance of Senior Notes in November 2011 increased our overall debt balance in 2011. The overall increase in interest expense was partially offset by $2.3 million of capitalized interest during the year ended December 31, 2011 associated with the capital expenditures for upgrades to our drilling rig fleet and for our new-build drilling rigs.
Our effective income tax rate for the year ended December 31, 2011 differs from the federal statutory rate in the United States of 35% primarily due to a lower effective tax rate in foreign jurisdictions, state income taxes, the effect of foreign translation and other permanent differences, including the effect of the non-deductible, $7.3 million net-worth tax assessed on our Colombian operations as of January 1, 2011.
Statements of Operations Analysis—Year Ended December 31, 2010 Compared with the Year Ended December 31, 2009
The following table provides information about our operations for the years ended December 31, 2010 and December 31, 2009 (amounts in thousands, except average number of drilling rigs, utilization rate and revenue day information).
|
| | | | | | | |
| | Year ended December 31, |
| | 2010 | | 2009 |
| Drilling Services Division: | | | |
| Revenues | $ | 312,196 |
| | $ | 219,751 |
|
| Operating costs | 227,136 |
| | 147,343 |
|
| Drilling Services Division margin | $ | 85,060 |
| | $ | 72,408 |
|
| Average number of drilling rigs | 71.0 |
| | 70.7 |
|
| Utilization rate | 59 | % | | 41 | % |
| Revenue days | 15,182 |
| | 10,491 |
|
| Average revenues per day | $ | 20,564 |
| | $ | 20,947 |
|
| Average operating costs per day | 14,961 |
| | 14,045 |
|
| Drilling Services Division margin per day | $ | 5,603 |
| | $ | 6,902 |
|
| Production Services Division: | | | |
| Revenues | $ | 175,014 |
| | $ | 105,786 |
|
| Operating costs | 105,295 |
| | 68,012 |
|
| Production Services Division margin | $ | 69,719 |
| | $ | 37,774 |
|
| Combined: | | | |
| Revenues | $ | 487,210 |
| | $ | 325,537 |
|
| Operating costs | 332,431 |
| | 215,355 |
|
| Combined margin | $ | 154,779 |
| | $ | 110,182 |
|
| Adjusted EBITDA | $ | 103,151 |
| | $ | 74,942 |
|
We present Drilling Services Division margin, Production Services Division margin, combined margin and earnings before interest, taxes, depreciation, amortization and impairments (Adjusted EBITDA) information because we believe it provides investors and our management additional information to assist them in assessing our business and performance in comparison to other companies in our industry. Since Drilling Services Division margin, Production Services Division margin, combined margin and Adjusted EBITDA are “non-GAAP” financial measures under the rules and regulations of the SEC, we are providing the following reconciliation of combined margin and Adjusted EBITDA to net loss, which is the nearest comparable GAAP financial measure.
|
| | | | | | | |
| | Year ended December 31, |
| | 2010 | | 2009 |
| | (amounts in thousands) |
| Reconciliation of combined margin and Adjusted EBITDA to net loss: | | | |
| Combined margin | $ | 154,779 |
| | $ | 110,182 |
|
| General and administrative | (52,047 | ) | | (37,478 | ) |
| Bad debt recovery (expense) | (493 | ) | | 1,642 |
|
| Other income | 912 |
| | 596 |
|
| Adjusted EBITDA | 103,151 |
| | 74,942 |
|
| Depreciation and amortization | (120,811 | ) | | (106,186 | ) |
| Interest income (expense), net | (26,567 | ) | | (8,928 | ) |
| Impairment of investments | (3,331 | ) | | — |
|
| Income tax benefit | 14,297 |
| | 16,957 |
|
| Net loss | $ | (33,261 | ) | | $ | (23,215 | ) |
Our Drilling Services Division’s revenues increased by $92.4 million, or 42%, for the year ended December 31, 2010, as compared to the year ended December 31, 2009, due to a 45% increase in revenue days that resulted from an increase in our rig utilization rate to 59% from 41%. We have experienced an increase in the demand for drilling services in 2010 as our industry begins to recover from the downturn that bottomed in late 2009. Consequently, utilization rates and drilling revenue rates have improved in 2010 as compared to 2009. However, when compared to 2009, our Drilling Services Division’s average revenues decreased by $383 per day, or 2%. During 2009, a significant portion of our drilling rigs were still operating or were on standby under long-term drilling contracts that were entered into when drilling rig demand was high and drilling revenues per day were at historically high levels. The positive impact of the higher revenue rates for these long-term contracts had a diminishing affect on our average revenues per day as the contracts expired ratably during 2009. In addition, a larger percentage of our Drilling Services Division’s revenues were attributed to turnkey drilling contracts in 2009 when compared to 2010, and turnkey drilling contracts result in higher average revenues per day than daywork drilling contracts. The overall decreases in our average drilling revenues per day during 2010 as compared to 2009 was partially offset by an increase in our Colombian operations during 2010, as drilling contracts in Colombia have higher revenue rates per day when compared to domestic drilling contracts.
Demand for drilling rigs influences the types of drilling contracts we are able to obtain. As demand for drilling rigs decreases, daywork rates move down and we may switch to performing more turnkey drilling contracts to maintain higher utilization rates and improve our Drilling Services Division’s margins. Turnkey drilling contracts also result in higher average revenues per day and higher average operating costs per day when compared to daywork drilling contracts. We completed 11 turnkey drilling contracts during 2010, as compared to 14 turnkey drilling contracts completed during 2009. The shift to fewer turnkey drilling contracts is due to the increase in the demand for drilling services in 2010. The following table provides percentages of our drilling revenues by drilling contract type for the years ended December 31, 2010 and 2009:
|
| | | | | |
| | Year ended December 31, |
| | 2010 | | 2009 |
| Daywork Contracts | 95 | % | | 90 | % |
| Turnkey Contracts | 5 | % | | 10 | % |
| Footage Contracts | — |
| | — |
|
Our Drilling Services Division’s operating costs increased $79.8 million, or 54%, for the year ended December 31, 2010, as compared to the corresponding period in 2009, primarily due to the increase in utilization and the increase in our operating costs of $916 per day, or 7%. The increase in operating costs per day is due to higher average drilling costs per day for our domestic operations, as well as the increase in our Colombian operations during 2010 as compared to the corresponding period in 2009, where we have a higher operating cost per day as compared to our domestic operations. We saw an increase in the demand for our services during 2010 as our industry begins to recover from the downturn that bottomed in late 2009. As utilization rates began to increase in 2010, average operating costs per day increased due to higher wage rates and repair and maintenance expenses as drilling rigs came out of storage and began operations. In addition, average operating costs per day in 2009 were lower due to a significant portion of our drilling rigs earning standby revenue rates under longer-term drilling contracts and incurring reduced operating costs. The overall increase in operating costs per day in 2010 was partially offset by a decrease in operating costs per day due to a smaller proportion of our drilling services attributable to turnkey contracts during the year ended December 31, 2010 as compared to the corresponding period in 2009.
Our Production Services Division’s revenues increased by $69.2 million, or 65%, while operating costs increased by $37.3 million, or 55%, for the year ended December 31, 2010, as compared to the corresponding period in 2009. Our Production Services Division experienced increases in its revenue and operating cost due to higher demand for our wireline services, well services and fishing and rental services during 2010 as compared to 2009. The increase in our Production Services Division’s revenues is due primarily to higher utilization rates, especially in the wireline and well services operations, and to a lesser extent, higher revenue rates charged for these services during 2010, as compared to the corresponding period in 2009. We also expanded our operations in 2010 by adding 21 wireline units resulting in an increase in both revenues and operating costs.
Our general and administrative expense increased by approximately $14.6 million, or 39%, for the year ended December 31, 2010 as compared to the corresponding period in 2009. The increase is primarily due to increases in compensation related expenses. With the industry downturn during 2009, we experienced a decrease in the demand for our services and we responded with workforce reductions, elimination of wage rate increases and reduced bonus compensation. During 2010, we saw an increase in the demand for our services as our industry began to recover from the industry downturn in 2009. Compensation related expenses increased during 2010 as we added employees in our corporate office and accrued for higher bonuses for 2010.
Bad debt recovery decreased for the year ended December 31, 2010 as compared to the corresponding period in 2009, primarily due to the collection of a customer’s past due account receivable balance in 2009 for which we had previously established a $1.3 million allowance for doubtful accounts in December 2008.
Our other income increased by $0.3 million for the year ended December 31, 2010 as compared to the corresponding period in 2009, primarily due to the increase in foreign currency translation gains in excess of losses recognized in relation to our operations in Colombia.
Our depreciation and amortization expenses increased by $14.6 million for the year ended December 31, 2010, as compared to the corresponding period in 2009. This increase resulted primarily from capital expenditures made to upgrade certain drilling rigs to meet the needs of our customers and obtain new contracts as well as capital expenditures for the acquisition of new wireline units.
Interest expense for the year ended December 31, 2010 primarily related to the outstanding debt balance for our Senior Notes, while interest expense for the year ended December 31, 2009 primarily related to the outstanding debt balance under our Revolving Credit Facility. On March 11, 2010, we issued $250 million of Senior Notes with a coupon interest rate of 9.875%. The Senior Notes were sold with an original issue discount that will result in an effective yield to maturity of approximately 10.677%. The proceeds from the issuance of the Senior Notes were immediately used to make a payment of $234.8 million to reduce the outstanding debt balance under the Revolving Credit Facility. The Revolving Credit Facility had a relatively low interest rate of 3.74% as of December 31, 2009, which was based on the LIBOR rate plus a per annum margin. The Senior Notes have a higher interest rate when compared to the Revolving Credit Facility, which resulted in the increase in interest expense during 2010. In addition, interest expense increased in 2010 as compared to 2009 due to an increase in total outstanding debt which was $280.9 million as of December 31, 2010 as compared to $262.1 million as of December 31, 2009.
During the year ended December 31, 2010, we recognized a $3.3 million other-than-temporary impairment of our ARPSs, which were liquidated in January 2011.
Our effective income tax rate for the year ended December 31, 2010 differs from the federal statutory rate in the United States of 35% primarily due to a lower effective tax rate in foreign jurisdictions, state income taxes, valuation allowances and other permanent differences.
Inflation
Wage rates for our operations personnel are impacted by inflationary pressures when the demand for drilling and production services increases and the availability of personnel is scarce. With the increase in rig counts beginning in late 2009, we saw decreased availability of personnel to operate our rigs and therefore we had wage rate increases for drilling rig personnel in certain of our locations of approximately 18% and 16% in February and July 2010, respectively. With continued increases in demand through 2011, and the resulting tightening of labor markets, we had another wage rate increase of approximately 10% across multiple divisions in January 2012 2012 and may have additional increases towards the end of the year..
Costs for rig repairs and maintenance, rig upgrades and new rig construction are also impacted by inflationary pressures when the demand for drilling services increases. We experienced an increase in these costs of approximately 5% and to 10% during 2010 and 2011, respectively,2012, and we estimate that we will experience similar increases in 20122013.
Off-Balance Sheet Arrangements
We do not currently have any off-balance sheet arrangements.
Recently IssuedCritical Accounting StandardsPolicies and Estimates
Multiple Deliverable Revenue Arrangements.and Cost Recognition In October 2009,—Our Drilling Services Segment earns revenues by drilling oil and gas wells for our clients under daywork, turnkey or footage contracts, which usually provide for the Financial Accounting Standards Board (FASB) issued Accounting Standards Update (ASU) No. 2009-13, Revenue Recognition (Topic 605): drilling of a single well. Drilling contracts for individual wells are usually completed in less thanMultiple Deliverable Revenue Arrangements – A Consensus60days. We recognize revenues on daywork contracts for the days completed based on the dayrate each contract specifies. We recognize revenues from our turnkey and footage contracts on the percentage-of-completion method based on our estimate of the FASB Emerging Issues Task Force.number of days to complete each contract.
This update provides application guidanceOur management has determined that it is appropriate to use the percentage-of-completion method to recognize revenue on whether multiple deliverables exist, howour turnkey and footage contracts. Although our turnkey and footage contracts do not have express terms that provide us with rights to receive payment for the deliverables shouldwork that we perform prior to drilling wells to the agreed-on depth, we use this method because, as provided in applicable accounting literature, we believe we achieve a continuous sale for our work-in-progress and believe, under applicable state law, we ultimately could recover the fair value of our work-in-progress even in the event we were unable to drill to the agreed-on depth in breach of the applicable contract. However, in the event we were unable to drill to the agreed-on depth in breach of the contract, ultimate recovery of that value would be separatedsubject to negotiations with the client and how the consideration should be allocatedpossibility of litigation.
If a client defaults on its payment obligation to oneus under a turnkey or more unitsfootage contract, we would need to rely on applicable law to enforce our lien rights, because our turnkey and footage contracts do not expressly grant to us a security interest in the work we have completed under the contract and we have no ownership rights in the work-in-progress or completed drilling work, except any rights arising under the applicable lien statute on foreclosure. If we were unable to drill to the agreed-on depth in breach of accounting. This update establishesthe contract, we also would need to rely on equitable remedies outside of the contract available in applicable courts to recover the fair value of our work-in-progress under a selling price hierarchy for determiningturnkey or footage contract.
The risks to us under a turnkey contract and, to a lesser extent, under footage contracts, are substantially greater than on a contract drilled on a daywork basis. Under a turnkey contract, we assume most of the selling pricerisks associated with drilling operations that are generally assumed by the operator in a daywork contract, including the risks of a deliverable. The selling price usedblowout, loss of hole, stuck drill pipe, machinery breakdowns and abnormal drilling conditions, as well as risks associated with subcontractors’ services, supplies, cost escalations and personnel operations.
We accrue estimated contract costs on turnkey and footage contracts for each deliverable will beday of work completed based on vendor-specific objective evidence, if available, third-party evidence if vendor-specific objective evidence is not available,our estimate of the total costs to complete the contract divided by our estimate of the number of days to complete the contract. Contract costs include labor, materials, supplies, repairs and maintenance, operating overhead allocations and allocations of depreciation and amortization expense. In addition, the occurrence of uninsured or estimated selling price if neither vendor-specificunder-insured losses or third-party evidence is available. We are required to apply this guidance prospectively for revenue arrangements entered into or materially modified after January 1, 2011. The adoption of this new guidance has not had an impactoperating cost overruns on our turnkey and footage contracts could have a material adverse effect on our financial position orand results of operations. Therefore, our actual results for a contract could differ significantly if our cost estimates for that contract are later revised from our original cost estimates for a contract in progress at the end of a reporting period which was not completed prior to the release of our financial statements.
Business Combinations.With most drilling contracts, we receive payments contractually designated for the mobilization of rigs and other equipment. Payments received, and costs incurred for the mobilization services are deferred and recognized on a straight line basis over the related contract term. Costs incurred to relocate rigs and other drilling equipment to areas in which a contract has not been secured are expensed as incurred. Reimbursements that we receive for out-of-pocket expenses are recorded as revenue and the out-of-pocket expenses for which they relate are recorded as operating costs.
The assets “prepaid expenses and other current assets” and “other long-term assets” include the current and long-term portions of deferred mobilization costs for certain drilling contracts. The liabilities “deferred revenues” and “other long-term liabilities” include the current and long-term portions of deferred mobilization revenues for certain drilling contracts and amounts collected on contracts in excess of revenues recognized. As ofDecember 31, 2012we had$3.9 millionand $5.2 millionof current deferred mobilization revenues and costs, respectively, and $0.6 millionand$0.9 millionof long-term deferred mobilization revenues and costs, respectively. Our deferred mobilization costs and revenues primarily related to long-term contracts for our new-build drilling rigs and long-term contracts for drilling rigs which we moved between drilling divisions. Amortization of deferred mobilization revenues was$6.3 million, $5.1 million and$3.0 millionfor the yearsendedDecember 31, 2012, 2011and2010, respectively.
Our Production Services Segment earns revenues for well servicing, wireline services, coiled tubing services and fishing and rental services pursuant to master services agreements based on purchase orders, contracts or other arrangements with the client that include fixed or determinable prices. Production service revenue is recognized when the service has been rendered and collectability is reasonably assured.
The asset “unbilled receivables” represents revenues we have recognized in excess of amounts billed on drilling contracts and production services completed but not yet invoiced. Our unbilled receivables totaled $35.1 million at December 31, 2012, of which $0.6 million related to turnkey drilling contract revenues, $31.8 million represented revenue recognized but not yet billed on daywork drilling contracts in progress at December 31, 2012 and $2.7 million related to unbilled receivables for our Production Services Segment.
Long-lived tangible and intangible assets—We evaluate for potential impairment of long-lived tangible and intangible assets subject to amortization when indicators of impairment are present. Circumstances that could indicate a potential impairment include significant adverse changes in industry trends, economic climate, legal factors, and an adverse action or assessment by a regulator. More specifically, significant adverse changes in industry trends include significant declines in revenue rates, utilization rates, oil and natural gas market prices and industry rig counts for drilling rigs and well servicing rigs. In December 2010,performing an impairment evaluation, we estimate the FASB issued ASU No. 2010-29, Business Combinations (Topic 805): Disclosurefuture undiscounted net cash flows from the use and eventual disposition of Supplementary Pro Forma Informationlong-lived tangible and intangible assets grouped at the lowest level that cash flows can be identified. For our Production Services Segment, we perform an impairment evaluation and estimate future undiscounted cash flows for Business Combinations – A consensusthe individual reporting units (well servicing, wireline, coiled tubing and fishing and rental services). For our Drilling Services Segment, we perform an impairment evaluation and estimate future undiscounted cash flows for individual drilling rig assets. If the sum of the FASB Emerging Issues Task Force. This update provides clarification requiring public companies that have completed material acquisitions to discloseestimated future undiscounted net cash flows is less than the revenue and earningscarrying amount of the combinedasset group, then we would determine the fair value of the asset group. The amount of an impairment charge would be measured as the difference between the carrying amount and the fair value of these assets. The assumptions used in the impairment evaluation for long-lived assets are inherently uncertain and require management judgment.
Goodwill—Goodwill results from business acquisitions and represents the excess of acquisition costs over the fair value of the net assets acquired. We perform a qualitative assessment of goodwill annually as of December 31 or more frequently if events or changes in circumstances indicate that the asset might be impaired. Circumstances that could indicate a potential impairment include a significant adverse change in the economic or business climate, a significant adverse change in legal factors, an adverse action or assessment by a regulator, unanticipated competition, loss of key personnel and the likelihood that a reporting unit or significant portion of a reporting unit will be sold or otherwise disposed of. These circumstances could lead to our net book value exceeding our market capitalization which is another indicator of a potential impairment of goodwill.
If our qualitative assessment of goodwill indicates a possible impairment, we test for goodwill impairment using a two-step process. First, the fair value of each reporting unit with goodwill is compared to its carrying value to determine whether an indication of impairment exists. Second, if impairment is indicated, then the fair value of the reporting unit's goodwill is determined by allocating the unit's fair value to its assets and liabilities (including any unrecognized intangible assets) as if the reporting unit had been acquired in a business combination on the impairment test date. The amount of impairment for goodwill is measured as the excess of the carrying value of the reporting unit over its fair value. The assumptions used in estimating fair values of reporting units and performing the goodwill impairment test are inherently uncertain and require management judgment.
When estimating fair values of a reporting unit for our goodwill impairment test, we use an income approach which provides an estimated fair value based on the reporting unit’s anticipated cash flows that are discounted using a weighted average cost of capital rate. The primary assumptions used in the income approach are estimated cash flows and weighted average cost of capital. Estimated cash flows are primarily based on projected revenues, operating costs and capital expenditures and are discounted at a rate that is based on our weighted average cost of capital and estimated industry average rates for cost of capital. To ensure the reasonableness of the estimated fair value of our reporting units, we consider current industry market multiples and we perform a reconciliation of our total market capitalization to the total estimated fair value of all our reporting units. The assumptions used in estimating fair values of reporting units and performing the goodwill impairment test are inherently uncertain and require management judgment.
We have goodwill of$41.7 millionas of December 31, 2012. All of this goodwill was recorded in connection with the acquisition took placeof the production services business from Go-Coil onDecember 31, 2011, as described in Note 2,Acquisitions.As a result, the goodwill has been allocated to the coiled tubing services reporting unit within our Production Services Segment. As ofDecember 31, 2012, we performed the first step of the two-step process to evaluate our goodwill for potential impairment. As a result of this test, we have concluded that the fair value of our coiled tubing services reporting unit is substantially in excess of its carrying value, including goodwill, and therefore no impairment loss on goodwill exists as ofDecember 31, 2012.
Deferred taxes—We provide deferred taxes for the basis differences in our property and equipment between financial reporting and tax reporting purposes and other costs such as compensation, net operating loss carryforwards, employee benefit and other accrued liabilities which are deducted in different periods for financial reporting and tax reporting purposes. For property and equipment, basis differences arise from differences in depreciation periods and methods and the value of assets acquired in a business acquisition where we acquire an entity rather than just its assets. For financial reporting purposes, we depreciate the various components of our drilling rigs, well servicing rigs, wireline units and coiled tubing units over 2 to 25 years and refurbishments over 3 to 5 years, while federal income tax rules require that we depreciate drilling rigs, well servicing rigs, wireline units and coiled tubing units over 5 years. Therefore, in the first 5 years of our ownership of a drilling rig, well servicing rig, wireline unit or coiled tubing unit, our tax depreciation exceeds our financial reporting depreciation, resulting in our providing deferred taxes on this depreciation difference. After 5 years, financial reporting depreciation exceeds tax depreciation, and the deferred tax liability begins to reverse.
Accounting estimates—Material estimates that are particularly susceptible to significant changes in the near term relate to our recognition of revenues and costs for turnkey contracts, our estimate of the allowance for doubtful accounts, our determination of depreciation and amortization expense, our estimates of fair value for impairment evaluations, our estimate of deferred taxes, our estimate of the liability relating to the self-insurance portion of our health and workers’ compensation insurance, and our estimate of compensation related accruals.
We consider the recognition of revenues and costs on turnkey and footage contracts to be critical accounting estimates. For these types of contracts, we recognize revenues and accrue estimated costs based on our estimate of the number of days to complete each contract and our estimate of the total costs to complete the contract. Revenues and costs during a reporting period could be affected for contracts in progress at the beginningend of a reporting period which have not been completed before our financial statements for that period are released.
Our initial cost estimates for turnkey and footage contracts do not include cost estimates for risks such as stuck drill pipe or loss of circulation. When we encounter, during the course of our drilling operations, conditions unforeseen in the preparation of our original cost estimate, we increase our cost estimate to complete the contract. If we anticipate a loss on a contract in progress at the end of a reporting period due to a change in our cost estimate, we accrue the entire amount of the comparable prior annualestimated loss, including all costs that are included in our revised estimated cost to complete that contract, in our consolidated statement of operations for that reporting period, and also expandsperiod. However, our actual costs could substantially exceed our estimated costs if we encounter problems such as lost circulation, stuck drill pipe or an underground blowout on contracts still in progress subsequent to the supplemental pro forma disclosures to include a descriptionrelease of the naturefinancial statements.
We believe that our experienced management team, our knowledge of geologic formations in our areas of operations, the condition of our drilling equipment and amountour experienced crews have previously enabled us to make reasonable cost estimates and complete contracts according to our drilling plan. While we do bear the risk of material, nonrecurring pro forma adjustments directly attributableloss for cost overruns and other events that are not specifically provided for in our initial cost estimates, our pricing of turnkey and footage contracts takes such risks into consideration. We are more likely to encounter losses on turnkey and footage contracts in periods in which revenue rates are lower for all types of contracts. However, during periods of reduced demand for drilling rigs, our overall profitability on turnkey and footage contracts has historically exceeded our profitability on daywork contracts.
During the year ended December 31, 2012, we did not experience a loss on any of the turnkey contracts completed. We experienced a total loss of approximately $1.5 million and $0.2 million, respectively, during the years ended December 31, 2011 and 2010, on two of the turnkey contracts completed during 2011 and one of the turnkey contracts completed during 2010. As of December 31, 2012, we had $0.6 million of unbilled receivables related to two turnkey contracts that were in progress at December 31, 2012, which were both completed prior to the business combination includedissuance of these financial statements.
We estimate an allowance for doubtful accounts based on the creditworthiness of our clients as well as general economic conditions. We evaluate the creditworthiness of our clients based on commercial credit reports, trade references, bank references, financial information, production information and any past experience we have with the client. Consequently, any change in those factors could affect our estimate of our allowance for doubtful accounts. In some instances, we require new clients to establish escrow accounts or make prepayments. We had an allowance for doubtful accounts of $1.0 million at December 31, 2012.
Our determination of the useful lives of our depreciable assets, which directly affects our determination of depreciation expense and deferred taxes is also a critical accounting estimate. A decrease in the reported pro forma revenueuseful life of our property and earnings.equipment would increase depreciation expense and reduce deferred taxes. We provide for depreciation of our drilling, production, transportation and other equipment on a straight-line method over useful lives that we have estimated and that range from 2 to 25 years. We record the same depreciation expense whether a drilling rig, well servicing rig, wireline unit or coiled tubing unit is idle or working. Our estimates of the useful lives of our drilling, production, transportation and other equipment are requiredbased on our more than 40 years of experience in the oilfield services industry with similar equipment.
As of December 31, 2012, we had a $1.0 million deferred tax asset related to the impairment of our ARPSs which represents a capital loss for tax treatment purposes. We can recognize a tax benefit associated with this impairment to the extent of capital gains we expect to earn in future periods. During the year ended December 31, 2011, we recorded a valuation allowance to fully offset our deferred tax asset relating to this capital loss since we believed capital gains were not likely in future periods. On October 1, 2012, we received proceeds of $0.6 million from the redemption of certain ARPSs by the original issuer of the securities. These proceeds represent a capital gain, and therefore, we have released $0.2 million of the valuation allowance.
As of December 31, 2012, we had $74.5 million of deferred tax assets related to foreign and domestic net operating loss and AMT credit carryforwards available to reduce future taxable income. In assessing the realizability of our deferred tax assets, we only recognize a tax benefit to the extent of taxable income that we expect to earn in the jurisdiction in future periods. We estimate that our operations will result in taxable income in excess of our net operating losses and we expect to apply this guidance prospectivelythe net operating losses against the current year taxable income and taxable income that we have estimated in future periods.
Our accrued insurance premiums and deductibles as of December 31, 2012 include accruals for business combinationscosts incurred under the self-insurance portion of our health insurance of approximately $2.5 million and our workers’ compensation, general liability and auto liability insurance of approximately $6.1 million. We have stop-loss coverage of $150,000 per covered individual per year under our health insurance and a deductible of $500,000 per occurrence under our workers’ compensation insurance. We have a deductible of $250,000 per occurrence under both our general liability insurance and auto liability insurance. We accrue for these costs as claims are incurred using an actuarial calculation that is based on industry and our company's historical claim development data, and we accrue the costs of administrative services associated with claims processing.
Our stock-based compensation expense includes estimates for certain of our long-term incentive compensation plans which have performance-based award components dependent upon our performance over a set performance period, as compared to the acquisition date isperformance of a pre-defined peer group. The accruals for these awards include estimates which affect our stock-based compensation expense, employee related accruals and equity. The accruals are adjusted based on or after January 1, 2011. The adoptionactual achievement levels at the end of this new guidance has not had a material impact on our financial position or results of operations.the pre-determined performance periods.
Recently Issued Accounting Standards
Fair Value Measurement. In May 2011, the FASB issued ASU No. 2011-04, Fair Value Measurement (Topic 820): Amendments to Achieve Fair Value Measurement and Disclosure Requirements in U.S. GAAP and IFRSs. This update clarifies existing guidance about how fair value should be applied where it already is required or permitted and provides wording changes that align this standard with International Financial Reporting Standards (IFRS). We are required to apply this guidance prospectively beginning with our first quarterly filing in 2012. We do not expect theThe adoption of this new guidance to have a materialhas not had an impact on our financial position or results of operations.
Comprehensive Income. In June 2011, the FASB issued ASU No. 2011-05, Comprehensive Income (Topic 220): Presentation of Comprehensive Income. This update increases the prominence of other comprehensive income in financial statements, eliminating the option of presenting other comprehensive income in the statement of changes in equity, and instead, giving companies the option to presentrequiring the components of net income and comprehensive income to be presented in either one or two consecutive financial statements. We are required to comply with this guidance prospectively beginning with our first quarterly filing in 2012. The adoption of this new guidance willhas not had an impact on our financial position or statementresults of operations, other than changes in presentation.operations.
In December 2011, the FASB issued ASU No. 2011-12, Comprehensive Income (Topic 220): Deferral of the Effective Date for Amendments to the Presentation of Reclassifications of Items Out of Accumulated Other Comprehensive Income in Accounting Standards Update No. 2011-05. This update delays the effective date of the requirement to present reclassification adjustments for each component of accumulated other comprehensive income in both net income and other comprehensive income on the face of the financial statements.
In February 2012, the FASB issued ASU No. 2013-02, Reporting of Amounts Reclassified Out of Accumulated Other Comprehensive Income. This update adds new disclosure requirements for items reclassified out of accumulated other
comprehensive income. We are required to apply this guidance prospectively beginning with our first quarterly filing in 2013. The adoption of this new guidance will not impact our financial position or statement of operations, other than changes in presentation.
Intangibles–Goodwill and Other.Other. In September 2011, the FASB issued ASU No. 2011-08, Intangibles–Intangibles–Goodwill and Other (Topic 350): Testing Goodwill for Impairment. This update allows entities testing goodwill for impairment the option of performing a qualitative assessment before calculating the fair value of the reporting unit (i.e., step one of the two-step goodwill impairment test). If entities determine, on the basis of qualitative factors, that the fair value of the reporting unit is more likely than not less than the carrying amount, the two-step impairment test would be required. The amendments are effective for annual and interim goodwill impairment tests performed for fiscal years beginning after December 15, 2011. The adoption of this new guidance willhas not had an impact on our financial position or statementresults of operations.
Recently EnactedOther Regulation
The Colombian government enacted a tax reform act which, among other things, adopted a one-time, net-worth tax for all Colombian entities, which was assessed on January 1, 2011 and is payable in eight semi-annual installments from 2011 through 2014.
Based on our Colombian operations’ net equity, measured on a Colombian tax basis as of January 1, 2011, our total net-worth tax obligation is approximately $7.3 million, which is not deductible for tax purposes. We recognized this tax obligation in full during the year ended December 31,first quarter of 2011 in other expense in our consolidated statement of operations, andoperations. As of December 31, 2012, we have a remaining obligation of $3.8 million, which is recorded in other accrued expenses and other long-term liabilities on our consolidated balance sheet. As of December 31, 2011, the remaining obligation is $5.3 million.
| |
| Item 7A. | Quantitative and Qualitative Disclosures About Market Risk |
Interest Rate Risk
We are subject to interest rate market risk on our variable rate debt. As of December 31, 20112012, we had a zero$100.0 million balance outstanding under our Revolving Credit Facility, which is our only variable rate debt. Future borrowings underThe impact of a hypothetical 1% increase or decrease in interest rates on this amount of debt would have resulted in a corresponding increase or decrease, respectively, in interest expense of approximately $1.0 million, and a corresponding increase or decrease, respectively, in net income of approximately $0.7 million during the Revolving Credit Facility would be subject toyear ended December 31, 2012. This potential increase or decrease is based on the simplified assumption that the level of variable rate debt remains constant with an immediate across-the-board interest rate market risk.increase or decrease as of January 1, 2012.
Foreign Currency Risk
While the U.S. dollar is the functional currency for reporting purposes for our Colombian operations, we enter into transactions denominated in Colombian pesos. Nonmonetary assets and liabilities are translated at historical rates and monetary assets and liabilities are translated at exchange rates in effect at the end of the period. Income statement accounts are translated at average rates for the period. As a result, Colombian Peso denominated transactions are affected by changes in exchange rates. We generally accept the exposure to exchange rate movements without using derivative financial instruments to manage this risk. Therefore, both positive and negative movements in the Colombian Peso currency exchange rate against the U.S. dollar has and will continue to affect the reported amount of revenues, expenses, profit, and assets and liabilities in the Company’sour consolidated financial statements.
The impact of currency rate changes on our Colombian Peso denominated transactions and balances resulted in foreign currency lossesgains of $0.61.0 million for the year ended December 31, 20112012.
| |
| Item 8. | Financial Statements and Supplementary Data |
PIONEER DRILLING COMPANYENERGY SERVICES CORP.
INDEX TO CONSOLIDATED FINANCIAL STATEMENTS
Report of Independent Registered Public Accounting Firm
The Board of Directors and Shareholders
Pioneer Drilling Company:Energy Services Corp.:
We have audited the accompanying consolidated balance sheets of Pioneer Energy Services Corp. (formerly Pioneer Drilling CompanyCompany) and subsidiaries as of December 31, 20112012 and 20102011, and the related consolidated statements of operations, comprehensive income, shareholders’ equity, and comprehensive income, and cash flows for each of the years in the three-year period ended December 31, 20112012. These consolidated financial statements are the responsibility of the Company’s management. Our responsibility is to express an opinion on these consolidated financial statements based on our audits.
We conducted our audits in accordance with the standards of the Public Company Accounting Oversight Board (United States). Those standards require that we plan and perform the audit to obtain reasonable assurance about whether the financial statements are free of material misstatement. An audit includes examining, on a test basis, evidence supporting the amounts and disclosures in the financial statements. An audit also includes assessing the accounting principles used and significant estimates made by management, as well as evaluating the overall financial statement presentation. We believe that our audits provide a reasonable basis for our opinion.
In our opinion, the consolidated financial statements referred to above present fairly, in all material respects, the financial position of Pioneer Drilling CompanyEnergy Services Corp. and subsidiaries as of December 31, 20112012 and 20102011, and the results of their operations and their cash flows for each of the years in the three-year period ended December 31, 20112012, in conformity with U.S. generally accepted accounting principles.
We also have audited, in accordance with the standards of the Public Company Accounting Oversight Board (United States), Pioneer Drilling Company’sEnergy Services Corp.’s internal control over financial reporting as of December 31, 20112012, based on criteria established in Internal Control—Integrated Framework issued by the Committee of Sponsoring Organizations of the Treadway Commission (COSO), and our report dated February 21, 201213, 2013 expressed an unqualified opinion on the effectiveness of the Company’s internal control over financial reporting.
/s/ KPMG LLP
San Antonio, Texas
February 21, 201213, 2013
Report of Independent Registered Public Accounting Firm
The Board of Directors and Shareholders
Pioneer Drilling Company:Energy Services Corp.:
We have audited Pioneer Drilling Company’sthe internal control over financial reporting of Pioneer Energy Services Corp. (formerly Pioneer Drilling Company) as of December 31, 20112012, based on criteria established in Internal Control—Integrated Framework issued by the Committee of Sponsoring Organizations of the Treadway Commission (COSO). Pioneer Drilling Company’sEnergy Services Corp.’s management is responsible for maintaining effective internal control over financial reporting and for its assessment of the effectiveness of internal control over financial reporting, included in the accompanying Management’s Report on Internal Control over Financial Reporting. Our responsibility is to express an opinion on the Company’s internal control over financial reporting based on our audit.
We conducted our audit in accordance with the standards of the Public Company Accounting Oversight Board (United States). Those standards require that we plan and perform the audit to obtain reasonable assurance about whether effective internal control over financial reporting was maintained in all material respects. Our audit included obtaining an understanding of internal control over financial reporting, assessing the risk that a material weakness exists, and testing and evaluating the design and operating effectiveness of internal control based on the assessed risk. Our audit also included performing such other procedures as we considered necessary in the circumstances. We believe that our audit provides a reasonable basis for our opinion.
A company’s internal control over financial reporting is a process designed to provide reasonable assurance regarding the reliability of financial reporting and the preparation of financial statements for external purposes in accordance with generally accepted accounting principles. A company’s internal control over financial reporting includes those policies and procedures that (1) pertain to the maintenance of records that, in reasonable detail, accurately and fairly reflect the transactions and dispositions of the assets of the company; (2) provide reasonable assurance that transactions are recorded as necessary to permit preparation of financial statements in accordance with generally accepted accounting principles, and that receipts and expenditures of the company are being made only in accordance with authorizations of management and directors of the company; and (3) provide reasonable assurance regarding prevention or timely detection of unauthorized acquisition, use, or disposition of the company’s assets that could have a material effect on the financial statements.
Because of its inherent limitations, internal control over financial reporting may not prevent or detect misstatements. Also, projections of any evaluation of effectiveness to future periods are subject to the risk that controls may become inadequate because of changes in conditions, or that the degree of compliance with the policies or procedures may deteriorate.
In our opinion, Pioneer Drilling CompanyEnergy Services Corp. maintained, in all material respects, effective internal control over financial reporting as of December 31, 20112012, based on criteria established in Internal Control—Integrated Framework issued by the Committee of Sponsoring Organizations of the Treadway Commission.
The Company acquired Go-Coil, LLC ("Go-Coil") on December 31, 2011 and management excluded Go-Coil's internal control over financial reporting from its assessment of the effectiveness of the Company's internal control over financial reporting as of December 31, 2011. Go-Coil contributed approximately 10% of the Company's total assets as of December 31, 2011. Our audit of internal control over financial reporting of the Company also excluded an evaluation of the internal control over financial reporting of Go-Coil.
We also have audited, in accordance with the standards of the Public Company Accounting Oversight Board (United States), the consolidated balance sheets of Pioneer Drilling CompanyEnergy Services Corp. and subsidiaries as of December 31, 20112012 and 20102011, and the related consolidated statements of operations, comprehensive income, shareholders’ equity, and comprehensive income, and cash flows for each of the years in the three-year period ended December 31, 20112012, and our report dated February 21, 201213, 2013 expressed an unqualified opinion on those consolidated financial statements.
/s/ KPMG LLP
San Antonio, Texas
February 21, 201213, 2013
PIONEER DRILLING COMPANY AND SUBSIDIARIES
CONSOLIDATED BALANCE SHEET
|
| | | | | | | |
| | December 31,
2011 | | December 31,
2010 |
| | (In thousands, except share data) |
| ASSETS | |
| Current assets: | | | |
| Cash and cash equivalents | $ | 86,197 |
| | $ | 22,011 |
|
| Short-term investments | — |
| | 12,569 |
|
| Receivables: | | | |
| Trade, net of allowance for doubtful accounts | 106,084 |
| | 61,345 |
|
| Unbilled receivables | 31,512 |
| | 21,423 |
|
| Insurance recoveries | 5,470 |
| | 4,035 |
|
| Income taxes | 2,168 |
| | 2,712 |
|
| Deferred income taxes | 15,433 |
| | 9,867 |
|
| Inventory | 11,184 |
| | 9,023 |
|
| Prepaid expenses and other current assets | 11,564 |
| | 8,797 |
|
| Total current assets | 269,612 |
| | 151,782 |
|
| Property and equipment, at cost | 1,336,926 |
| | 1,097,179 |
|
| Less accumulated depreciation | 542,970 |
| | 441,671 |
|
| Net property and equipment | 793,956 |
| | 655,508 |
|
| Intangible assets, net of amortization | 52,680 |
| | 21,966 |
|
| Goodwill | 41,683 |
| | — |
|
| Noncurrent deferred income taxes | 735 |
| | — |
|
| Other long-term assets | 14,088 |
| | 12,087 |
|
| Total assets | $ | 1,172,754 |
| | $ | 841,343 |
|
| LIABILITIES AND SHAREHOLDERS’ EQUITY | | | |
| Current liabilities: | | | |
| Accounts payable | $ | 66,440 |
| | $ | 26,929 |
|
| Current portion of long-term debt | 872 |
| | 1,408 |
|
| Prepaid drilling contracts | 3,966 |
| | 3,669 |
|
| Accrued expenses: | | | |
| Payroll and related employee costs | 29,057 |
| | 18,057 |
|
| Insurance premiums and deductibles | 10,583 |
| | 8,774 |
|
| Insurance claims and settlements | 5,470 |
| | 4,035 |
|
| Interest | 12,283 |
| | 7,307 |
|
| Other | 11,009 |
| | 5,461 |
|
| Total current liabilities | 139,680 |
| | 75,640 |
|
| Long-term debt, less current portion | 418,728 |
| | 279,530 |
|
| Noncurrent deferred income taxes | 94,745 |
| | 80,160 |
|
| Other long-term liabilities | 9,156 |
| | 9,680 |
|
| Total liabilities | 662,309 |
| | 445,010 |
|
| Commitments and contingencies (Note 11) |
| |
|
| Shareholders’ equity: | | | |
| Preferred stock, 10,000,000 shares authorized; none issued and outstanding | — |
| | — |
|
| Common stock $.10 par value; 100,000,000 shares authorized; 61,782,180 shares and 54,228,170 shares outstanding at December 31, 2011 and December 31, 2010, respectively | 6,188 |
| | 5,425 |
|
| Additional paid-in capital | 442,020 |
| | 339,105 |
|
| Treasury stock, at cost; 95,409 shares and 25,380 shares at December 31, 2011 and December 31, 2010, respectively | (904 | ) | | (161 | ) |
| Accumulated earnings | 63,141 |
| | 51,964 |
|
| Total shareholders’ equity | 510,445 |
| | 396,333 |
|
| Total liabilities and shareholders’ equity | $ | 1,172,754 |
| | $ | 841,343 |
|
See accompanying notes to consolidated financial statements.
PIONEER DRILLING COMPANY AND SUBSIDIARIES
CONSOLIDATED STATEMENTS OF OPERATIONS
|
| | | | | | | | | | | |
| | Year ended December 31, |
| | 2011 | | 2010 | | 2009 |
| | (In thousands, except per share data) |
| Revenues: | | | | | |
| Drilling services | $ | 433,902 |
| | $ | 312,196 |
| | $ | 219,751 |
|
| Production services | 282,039 |
| | 175,014 |
| | 105,786 |
|
| Total revenues | 715,941 |
| | 487,210 |
| | 325,537 |
|
| Costs and expenses: | | | | |
|
| Drilling services | 292,559 |
| | 227,136 |
| | 147,343 |
|
| Production services | 164,365 |
| | 105,295 |
| | 68,012 |
|
| Depreciation and amortization | 132,832 |
| | 120,811 |
| | 106,186 |
|
| General and administrative | 67,318 |
| | 52,047 |
| | 37,478 |
|
| Bad debt expense (recovery) | 925 |
| | 493 |
| | (1,642 | ) |
| Impairment of equipment | 484 |
| | — |
| | — |
|
| Total costs and expenses | 658,483 |
| | 505,782 |
| | 357,377 |
|
| Income (loss) from operations | 57,458 |
| | (18,572 | ) | | (31,840 | ) |
| Other (expense) income: | | | | |
|
| Interest expense | (29,721 | ) | | (26,567 | ) | | (8,928 | ) |
| Impairment of investments | — |
| | (3,331 | ) | | — |
|
| Other | (6,904 | ) | | 912 |
| | 596 |
|
| Total other expense | (36,625 | ) | | (28,986 | ) | | (8,332 | ) |
| Income (loss) before income taxes | 20,833 |
| | (47,558 | ) | | (40,172 | ) |
| Income tax (expense) benefit | (9,656 | ) | | 14,297 |
| | 16,957 |
|
| Net income (loss) | $ | 11,177 |
| | $ | (33,261 | ) | | $ | (23,215 | ) |
| | | | | | |
| Income (loss) per common share—Basic | $ | 0.19 |
| | $ | (0.62 | ) | | $ | (0.46 | ) |
| | | | | | |
| Income (loss) per common share—Diluted | $ | 0.19 |
| | $ | (0.62 | ) | | $ | (0.46 | ) |
| | | | | | |
| Weighted average number of shares outstanding—Basic | 57,390 |
| | 53,797 |
| | 50,313 |
|
| | | | | | |
| Weighted average number of shares outstanding—Diluted | 58,779 |
| | 53,797 |
| | 50,313 |
|
See accompanying notes to consolidated financial statements.
PIONEER DRILLING COMPANYENERGY SERVICES CORP. AND SUBSIDIARIES
CONSOLIDATED BALANCE SHEETS
|
| | | | | | | |
| | December 31,
2012 | | December 31,
2011 |
| | (In thousands, except share data) |
| ASSETS | |
| Current assets: | | | |
| Cash and cash equivalents | $ | 23,733 |
| | $ | 86,197 |
|
| Receivables: | | | |
| Trade, net of allowance for doubtful accounts | 116,352 |
| | 106,084 |
|
| Unbilled receivables | 35,140 |
| | 31,512 |
|
| Insurance recoveries | 6,518 |
| | 5,470 |
|
| Income taxes | 834 |
| | 2,168 |
|
| Deferred income taxes | 11,058 |
| | 15,433 |
|
| Inventory | 12,111 |
| | 11,184 |
|
| Prepaid expenses and other current assets | 13,040 |
| | 11,564 |
|
| Total current assets | 218,786 |
| | 269,612 |
|
| Property and equipment, at cost | 1,698,517 |
| | 1,336,926 |
|
| Less accumulated depreciation | 684,177 |
| | 542,970 |
|
| Net property and equipment | 1,014,340 |
| | 793,956 |
|
| Intangible assets, net of accumulated amortization | 43,843 |
| | 52,680 |
|
| Goodwill | 41,683 |
| | 41,683 |
|
| Noncurrent deferred income taxes | 5,519 |
| | 735 |
|
| Other long-term assets | 15,605 |
| | 14,088 |
|
| Total assets | $ | 1,339,776 |
| | $ | 1,172,754 |
|
| LIABILITIES AND SHAREHOLDERS’ EQUITY | | | |
| Current liabilities: | | | |
| Accounts payable | $ | 83,823 |
| | $ | 66,440 |
|
| Current portion of long-term debt | 872 |
| | 872 |
|
| Deferred revenues | 3,880 |
| | 3,966 |
|
| Accrued expenses: | | | |
| Payroll and related employee costs | 27,991 |
| | 29,057 |
|
| Insurance premiums and deductibles | 9,708 |
| | 10,583 |
|
| Insurance claims and settlements | 6,348 |
| | 5,470 |
|
| Interest | 12,343 |
| | 12,283 |
|
| Other | 11,585 |
| | 11,009 |
|
| Total current liabilities | 156,550 |
| | 139,680 |
|
| Long-term debt, less current portion | 518,725 |
| | 418,728 |
|
| Noncurrent deferred income taxes | 108,838 |
| | 94,745 |
|
| Other long-term liabilities | 7,983 |
| | 9,156 |
|
| Total liabilities | 792,096 |
| | 662,309 |
|
| Commitments and contingencies (Note 11) |
| |
|
| Shareholders’ equity: | | | |
| Preferred stock, 10,000,000 shares authorized; none issued and outstanding | — |
| | — |
|
Common stock $.10 par value; 100,000,000 shares authorized;
62,032,517 and 61,782,180 shares outstanding at December 31, 2012 and 2011, respectively | 6,217 |
| | 6,188 |
|
| Additional paid-in capital | 449,554 |
| | 442,020 |
|
| Treasury stock, at cost; 134,612 and 95,409 shares at December 31, 2012 and 2011, respectively | (1,264 | ) | | (904 | ) |
| Accumulated earnings | 93,173 |
| | 63,141 |
|
| Total shareholders’ equity | 547,680 |
| | 510,445 |
|
| Total liabilities and shareholders’ equity | $ | 1,339,776 |
| | $ | 1,172,754 |
|
See accompanying notes to consolidated financial statements.
PIONEER ENERGY SERVICES CORP. AND SUBSIDIARIES
CONSOLIDATED STATEMENTS OF OPERATIONS
|
| | | | | | | | | | | |
| | Year ended December 31, |
| | 2012 | | 2011 | | 2010 |
| | (In thousands, except per share data) |
| Revenues: | | | | | |
| Drilling services | $ | 498,867 |
| | $ | 433,902 |
| | $ | 312,196 |
|
| Production services | 420,576 |
| | 282,039 |
| | 175,014 |
|
| Total revenues | 919,443 |
| | 715,941 |
| | 487,210 |
|
| Costs and expenses: | | | | |
|
| Drilling services | 333,846 |
| | 292,559 |
| | 227,136 |
|
| Production services | 252,775 |
| | 164,365 |
| | 105,295 |
|
| Depreciation and amortization | 164,717 |
| | 132,832 |
| | 120,811 |
|
| General and administrative | 85,603 |
| | 67,318 |
| | 52,047 |
|
| Bad debt expense (recovery) | (440 | ) | | 925 |
| | 493 |
|
| Impairment of equipment | 1,131 |
| | 484 |
| | — |
|
| Total costs and expenses | 837,632 |
| | 658,483 |
| | 505,782 |
|
| Income (loss) from operations | 81,811 |
| | 57,458 |
| | (18,572 | ) |
| Other (expense) income: | | | | |
|
| Interest expense | (37,049 | ) | | (29,721 | ) | | (26,567 | ) |
| Impairment of investments | — |
| | — |
| | (3,331 | ) |
| Other | 1,624 |
| | (6,904 | ) | | 912 |
|
| Total other expense | (35,425 | ) | | (36,625 | ) | | (28,986 | ) |
| Income (loss) before income taxes | 46,386 |
| | 20,833 |
| | (47,558 | ) |
| Income tax (expense) benefit | (16,354 | ) | | (9,656 | ) | | 14,297 |
|
| Net income (loss) | $ | 30,032 |
| | $ | 11,177 |
| | $ | (33,261 | ) |
| | | | | | |
| Income (loss) per common share—Basic | $ | 0.49 |
| | $ | 0.19 |
| | $ | (0.62 | ) |
| | | | | | |
| Income (loss) per common share—Diluted | $ | 0.48 |
| | $ | 0.19 |
| | $ | (0.62 | ) |
| | | | | | |
| Weighted average number of shares outstanding—Basic | 61,780 |
| | 57,390 |
| | 53,797 |
|
| | | | | | |
| Weighted average number of shares outstanding—Diluted | 62,762 |
| | 58,779 |
| | 53,797 |
|
See accompanying notes to consolidated financial statements.
PIONEER ENERGY SERVICES CORP. AND SUBSIDIARIES
CONSOLIDATED STATEMENTS OF COMPREHENSIVE INCOME
|
| | | | | | | | | | | |
| | Year ended December 31, |
| | 2012 | | 2011 | | 2010 |
| | (In thousands) |
| Net income (loss) | $ | 30,032 |
| | $ | 11,177 |
| | $ | (33,261 | ) |
| Other comprehensive income (loss): | | | | | |
| Impact of impairment of investments charge, before tax | — |
| | — |
| | 2,672 |
|
| Income tax benefit related to impairment of investments | — |
| | — |
| | (979 | ) |
| Other comprehensive income, net of tax | — |
| | — |
| | 1,693 |
|
| Comprehensive income (loss) | $ | 30,032 |
| | $ | 11,177 |
| | $ | (31,568 | ) |
See accompanying notes to consolidated financial statements.
PIONEER ENERGY SERVICES CORP. AND SUBSIDIARIES
CONSOLIDATED STATEMENTS OF SHAREHOLDERS’ EQUITY AND COMPREHENSIVE INCOME
| | | | Shares | | Amount | | | | | | | | | Shares | | Amount | | | | | | | | |
| Common | | Treasury | | Common | | Treasury | | Additional Paid In Capital | | Accumulated Earnings | | Accumulated Other Comprehensive Loss | | Total Shareholders’ Equity | Common | | Treasury | | Common | | Treasury | | Additional Paid In Capital | | Accumulated Earnings | | Accumulated Other Comprehensive Income (Loss) | | Total Shareholders’ Equity |
| | (In thousands) | (In thousands) |
| Balance at December 31, 2008 | 49,998 |
| | — |
| | $ | 5,000 |
| | $ | — |
| | $ | 301,923 |
| | $ | 108,440 |
| | $ | (1,245 | ) | | $ | 414,118 |
| |
| Comprehensive loss: |
| |
| |
| |
| |
| |
| |
| | | |
| Balance as of December 31, 2009 | | 54,126 |
| | (5 | ) | | $ | 5,413 |
| | $ | (31 | ) | | $ | 332,534 |
| | $ | 85,225 |
| | $ | (1,693 | ) | | $ | 421,448 |
|
| Net loss | — |
| | — |
| | — |
| | — |
| | — |
| | (23,215 | ) | | — |
| | (23,215 | ) | — |
| | — |
| | — |
| | — |
| | — |
| | (33,261 | ) | | — |
| | (33,261 | ) |
| Unrealized loss on securities | — |
| | — |
| | — |
| | — |
| | — |
| | — |
| | (448 | ) | | (448 | ) | |
| Total comprehensive loss | | | | | | | | | | | | (23,663 | ) | |
| Sale of common stock, net of offering costs | 3,820 |
| | — |
| | 382 |
| | — |
| | 23,661 |
| | — |
| | — |
| | 24,043 |
| |
| Purchase of treasury stock | — |
| | (5 | ) | | — |
| | (31 | ) | | — |
| | — |
| | — |
| | (31 | ) | |
| Income tax effect of restricted stock vesting | — |
| | — |
| | — |
| | — |
| | (235 | ) | | — |
| | — |
| | (235 | ) | |
| Issuance of restricted stock | 308 |
| | — |
| | 31 |
| | — |
| | (31 | ) | | — |
| | — |
| | — |
| |
| Stock-based compensation expense | — |
| | — |
| | — |
| | — |
| | 7,216 |
| | — |
| | — |
| | 7,216 |
| |
| Balance at December 31, 2009 | 54,126 |
| | (5 | ) | | $ | 5,413 |
| | $ | (31 | ) | | $ | 332,534 |
| | $ | 85,225 |
| | $ | (1,693 | ) | | $ | 421,448 |
| |
| Comprehensive loss: | | | | | | | | | | | | | |
| Net loss | — |
| | — |
| | — |
| | — |
| | — |
| | (33,261 | ) | | — |
| | (33,261 | ) | |
| Impact of impairment of investments charge | — |
| | — |
| | — |
| | — |
| | — |
| | — |
| | 1,693 |
| | 1,693 |
| |
| Total comprehensive loss | | | | | | | | | | | | (31,568 | ) | |
| Other comprehensive income | | — |
| | — |
| | — |
| | — |
| | — |
| | — |
| | 1,693 |
| | 1,693 |
|
| Exercise of options and related income tax effect | 63 |
| | — |
| | 6 |
| | — |
| | 248 |
| | — |
| | — |
| | 254 |
| 63 |
| | — |
| | 6 |
| | — |
| | 248 |
| | — |
| | — |
| | 254 |
|
| Purchase of treasury stock | — |
| | (20 | ) | | — |
| | (130 | ) | | — |
| | — |
| | — |
| | (130 | ) | — |
| | (20 | ) | | — |
| | (130 | ) | | — |
| | — |
| | — |
| | (130 | ) |
| Income tax effect of restricted stock vesting | — |
| | — |
| | — |
| | — |
| | (120 | ) | | — |
| | — |
| | (120 | ) | — |
| | — |
| | — |
| | — |
| | (120 | ) | | — |
| | — |
| | (120 | ) |
| Income tax effect of stock option forfeitures and expirations | — |
| | — |
| | — |
| | — |
| | (226 | ) | | — |
| | — |
| | (226 | ) | — |
| | — |
| | — |
| | — |
| | (226 | ) | | — |
| | — |
| | (226 | ) |
| Issuance of restricted stock | 64 |
| | — |
| | 6 |
| | — |
| | (6 | ) | | — |
| | — |
| | — |
| 64 |
| | — |
| | 6 |
| | — |
| | (6 | ) | | — |
| | — |
| | — |
|
| Stock-based compensation expense | — |
| | — |
| | — |
| | — |
| | 6,675 |
| | — |
| | — |
| | 6,675 |
| — |
| | — |
| | — |
| | — |
| | 6,675 |
| | — |
| | — |
| | 6,675 |
|
| Balance at December 31, 2010 | 54,253 |
| | (25 | ) | | $ | 5,425 |
| | $ | (161 | ) | | $ | 339,105 |
| | $ | 51,964 |
| | $ | — |
| | $ | 396,333 |
| |
| Comprehensive income: | | | | | | | | | | | | | |
| Balance as of December 31, 2010 | | 54,253 |
| | (25 | ) | | $ | 5,425 |
| | $ | (161 | ) | | $ | 339,105 |
| | $ | 51,964 |
| | $ | — |
| | $ | 396,333 |
|
| Net income | — |
| | — |
| | — |
| | — |
| | — |
| | 11,177 |
| | — |
| | 11,177 |
| — |
| | — |
| | — |
| | — |
| | — |
| | 11,177 |
| | — |
| | 11,177 |
|
| Total comprehensive income | | | | | | | | | | | | 11,177 |
| |
| Sale of common stock, net of offering costs | 6,900 |
| — |
| — |
| — |
| 690 |
| — |
| — |
| | 93,653 |
| — |
| — |
| — |
| — |
| | 94,343 |
| 6,900 |
| — |
| — |
| — |
| 690 |
| — |
| — |
| | 93,653 |
| — |
| — |
| — |
| — |
| | 94,343 |
|
| Exercise of options and related income tax effect | 517 |
| | — |
| | 52 |
| | — |
| | 2,832 |
| | — |
| | — |
| | 2,884 |
| 517 |
| | — |
| | 52 |
| | — |
| | 2,832 |
| | — |
| | — |
| | 2,884 |
|
| Purchase of treasury stock | — |
| | (70 | ) | | — |
| | (743 | ) | | — |
| | — |
| | — |
| | (743 | ) | — |
| | (70 | ) | | — |
| | (743 | ) | | — |
| | — |
| | — |
| | (743 | ) |
| Income tax effect of stock option forfeitures and expirations | — |
| | — |
| | — |
| | — |
| | (254 | ) | | — |
| | — |
| | (254 | ) | — |
| | — |
| | — |
| | — |
| | (254 | ) | | — |
| | — |
| | (254 | ) |
| Issuance of restricted stock | 207 |
| | — |
| | 21 |
| | — |
| | (21 | ) | | — |
| | — |
| | — |
| 207 |
| | — |
| | 21 |
| | — |
| | (21 | ) | | — |
| | — |
| | — |
|
| Stock-based compensation expense | — |
| | — |
| | — |
| | — |
| | 6,705 |
| | — |
| | — |
| | 6,705 |
| — |
| | — |
| | — |
| | — |
| | 6,705 |
| | — |
| | — |
| | 6,705 |
|
| Balance at December 31, 2011 | 61,877 |
| | (95 | ) | | $ | 6,188 |
| | $ | (904 | ) | | $ | 442,020 |
| | $ | 63,141 |
| | $ | — |
| | $ | 510,445 |
| |
| Balance as of December 31, 2011 | | 61,877 |
| | (95 | ) | | $ | 6,188 |
| | $ | (904 | ) | | $ | 442,020 |
| | $ | 63,141 |
| | $ | — |
| | $ | 510,445 |
|
| Net income | | — |
| | — |
| | — |
| | — |
| | — |
| | 30,032 |
| | — |
| | 30,032 |
|
| Exercise of options and related income tax effect | | 172 |
| | — |
| | 17 |
| | — |
| | 676 |
| | — |
| | — |
| | 693 |
|
| Purchase of treasury stock | | — |
| | (40 | ) | | — |
| | (360 | ) | | — |
| | — |
| | — |
| | (360 | ) |
| Income tax effect of stock option forfeitures and expirations | | — |
| | — |
| | — |
| | — |
| | (449 | ) | | — |
| | — |
| | (449 | ) |
| Issuance of restricted stock | | 117 |
| | — |
| | 12 |
| | — |
| | (12 | ) | | — |
| | — |
| | — |
|
| Stock-based compensation expense | | — |
| | — |
| | — |
| | — |
| | 7,319 |
| | — |
| | — |
| | 7,319 |
|
| Balance as of December 31, 2012 | | 62,166 |
| | (135 | ) | | $ | 6,217 |
| | $ | (1,264 | ) | | $ | 449,554 |
| | $ | 93,173 |
| | $ | — |
| | $ | 547,680 |
|
See accompanying notes to consolidated financial statements.
PIONEER DRILLING COMPANYENERGY SERVICES CORP. AND SUBSIDIARIES
CONSOLIDATED STATEMENTS OF CASH FLOWS
| | | | Year ended December 31, | Year ended December 31, |
| | 2011 | | 2010 | | 2009 | 2012 | | 2011 | | 2010 |
| | (In thousands) | (In thousands) |
| Cash flows from operating activities: | | | | | | | | | | |
| Net income (loss) | $ | 11,177 |
| | $ | (33,261 | ) | | $ | (23,215 | ) | $ | 30,032 |
| | $ | 11,177 |
| | $ | (33,261 | ) |
| Adjustments to reconcile net income (loss) to net cash provided by operating activities: | | | | | | | | | | |
| Depreciation and amortization | 132,832 |
| | 120,811 |
| | 106,186 |
| 164,717 |
| | 132,832 |
| | 120,811 |
|
| Allowance for doubtful accounts | 787 |
| | 521 |
| | (1,170 | ) | 76 |
| | 787 |
| | 521 |
|
| Loss (gain) on dispositions of property and equipment | 151 |
| | (1,629 | ) | | 56 |
| |
| (Gain) loss on dispositions of property and equipment | | (1,199 | ) | | 151 |
| | (1,629 | ) |
| Stock-based compensation expense | 6,705 |
| | 6,675 |
| | 7,216 |
| 7,319 |
| | 6,705 |
| | 6,675 |
|
| Amortization of debt issuance costs and discount | 3,302 |
| | 2,609 |
| | 1,547 |
| |
| Amortization of debt issuance costs, discount and premium | | 2,985 |
| | 3,302 |
| | 2,609 |
|
| Impairment of investments | — |
| | 3,331 |
| | — |
| — |
| | — |
| | 3,331 |
|
| Impairment of equipment | 484 |
| | — |
| | — |
| 1,131 |
| | 484 |
| | — |
|
| Deferred income taxes | 8,098 |
| | (13,224 | ) | | 28,400 |
| 13,303 |
| | 8,098 |
| | (13,224 | ) |
| Change in other long-term assets | 2,828 |
| | (1,373 | ) | | 69 |
| (3,865 | ) | | 2,828 |
| | (1,373 | ) |
| Change in other long-term liabilities | (623 | ) | | 3,223 |
| | (1,312 | ) | (1,173 | ) | | (623 | ) | | 3,223 |
|
| Changes in current assets and liabilities: | | | | | | | | | | |
| Receivables | (46,802 | ) | | (9,576 | ) | | 18,180 |
| (12,807 | ) | | (46,802 | ) | | (9,576 | ) |
| Inventory | (2,161 | ) | | (3,487 | ) | | (1,661 | ) | (927 | ) | | (2,161 | ) | | (3,487 | ) |
| Prepaid expenses and other current assets | (1,965 | ) | | (2,598 | ) | | 2,703 |
| (1,266 | ) | | (1,965 | ) | | (2,598 | ) |
| Accounts payable | 9,331 |
| | 7,458 |
| | (2,243 | ) | 2,431 |
| | 9,331 |
| | 7,458 |
|
| Prepaid drilling contracts | 297 |
| | 3,261 |
| | (763 | ) | |
| Deferred revenues | | (86 | ) | | 297 |
| | 3,261 |
|
| Accrued expenses | 20,438 |
| | 15,610 |
| | (10,680 | ) | (1,305 | ) | | 20,438 |
| | 15,610 |
|
| Net cash provided by operating activities | 144,879 |
| | 98,351 |
| | 123,313 |
| 199,366 |
| | 144,879 |
| | 98,351 |
|
| | | | | | | | | | | |
| Cash flows from investing activities: | | | | | | | | | | |
| Acquisition of production services business of Go-Coil | (109,035 | ) | | — |
| | — |
| — |
| | (109,035 | ) | | — |
|
| Acquisition of other production services businesses | (6,502 | ) | | (1,340 | ) | | — |
| — |
| | (6,502 | ) | | (1,340 | ) |
| Purchases of property and equipment | (210,066 | ) | | (131,003 | ) | | (114,712 | ) | (364,324 | ) | | (210,066 | ) | | (131,003 | ) |
| Proceeds from sale of property and equipment | 5,550 |
| | 2,331 |
| | 767 |
| 3,093 |
| | 5,550 |
| | 2,331 |
|
| Proceeds from sale of auction rate securities | 12,569 |
| | — |
| | — |
| — |
| | 12,569 |
| | — |
|
| Proceeds from insurance recoveries | — |
| | 531 |
| | 36 |
| — |
| | — |
| | 531 |
|
| Net cash used in investing activities | (307,484 | ) | | (129,481 | ) | | (113,909 | ) | (361,231 | ) | | (307,484 | ) | | (129,481 | ) |
| | | | | | | | | | | |
| Cash flows from financing activities: | | | | | | | | | | |
| Debt repayments | (113,158 | ) | | (256,856 | ) | | (17,298 | ) | (874 | ) | | (113,158 | ) | | (256,856 | ) |
| Proceeds from issuance of debt | 250,750 |
| | 274,375 |
| | — |
| 100,000 |
| | 250,750 |
| | 274,375 |
|
| Debt issuance costs | (7,285 | ) | | (4,865 | ) | | (2,560 | ) | (58 | ) | | (7,285 | ) | | (4,865 | ) |
| Proceeds from exercise of options | 2,884 |
| | 238 |
| | — |
| 693 |
| | 2,884 |
| | 238 |
|
| Proceeds from common stock, net of offering costs of $5,707 and $454 in 2011 and 2009, respectively | 94,343 |
| | — |
| | 24,043 |
| |
| Proceeds from common stock, net of offering costs of $5,707 | | — |
| | 94,343 |
| | — |
|
| Purchase of treasury stock | (743 | ) | | (130 | ) | | (31 | ) | (360 | ) | | (743 | ) | | (130 | ) |
| Net cash provided by financing activities | 226,791 |
| | 12,762 |
| | 4,154 |
| 99,401 |
| | 226,791 |
| | 12,762 |
|
| | | | | | | | | | | |
| Net increase (decrease) in cash and cash equivalents | 64,186 |
| | (18,368 | ) | | 13,558 |
| |
| Net (decrease) increase in cash and cash equivalents | | (62,464 | ) | | 64,186 |
| | (18,368 | ) |
| Beginning cash and cash equivalents | 22,011 |
| | 40,379 |
| | 26,821 |
| 86,197 |
| | 22,011 |
| | 40,379 |
|
| Ending cash and cash equivalents | $ | 86,197 |
| | $ | 22,011 |
| | $ | 40,379 |
| $ | 23,733 |
| | $ | 86,197 |
| | $ | 22,011 |
|
| | | | | | | | | | | |
| Supplementary disclosure: | | | | | | | | | | |
| Interest paid | $ | 26,955 |
| | $ | 17,529 |
| | $ | 7,917 |
| $ | 44,317 |
| | $ | 26,955 |
| | $ | 17,529 |
|
| Income tax paid (refunded) | $ | 952 |
| | $ | (39,778 | ) | | $ | (8,889 | ) | |
| Income tax paid | | $ | 731 |
| | $ | 952 |
| | $ | (39,778 | ) |
See accompanying notes to consolidated financial statements.
PIONEER DRILLING COMPANYENERGY SERVICES CORP. AND SUBSIDIARIES
NOTES TO CONSOLIDATED FINANCIAL STATEMENTS
| |
| 1. | Organization and Summary of Significant Accounting Policies |
Business and Principles of Consolidation
On July 30, 2012, we changed our company name from "Pioneer Drilling Company" to "Pioneer Energy Services Corp." Our common stock trades on the New York Stock Exchange under the ticker symbol "PES." Our new name reflects our strategy to expand our service offerings beyond drilling services, which has been our core, legacy business. Pioneer Drilling CompanyEnergy Services provides drilling services and production services to a diverse group of independent and majorlarge oil and gas exploration and production companies throughout much of the onshore oil and gas producing regions of the United States and internationally in Colombia.We also provide coiled tubing and wireline services offshore in the Gulf of Mexico.
Our Drilling Services DivisionSegment provides contract land drilling services with its fleet of 6470 drilling rigs inwhich are currently assigned to the following locations:divisions:
|
| | | |
Drilling Division Locations | | Rig Count |
| South Texas | | 1514 |
|
| East Texas | | 54 |
|
| West Texas | | 1823 |
|
| North Dakota | | 912 |
|
| Utah | | 45 |
|
| Appalachia | | 54 |
|
| Colombia | | 8 |
|
| | 70 |
|
Drilling revenues and rig utilization steadily improved during 2010 and 2011, primarily due toSince late 2009, increased demand for drilling services in domestic shale plays and oil or liquid rich regions resulted in increased rig utilization and drilling revenues in these regions. We capitalized on this trend by moving drilling rigs in our fleet to these higher demand regions from lower demand regions such asregions. As a result, we closed our Oklahoma and North Texas and East Texas drilling division locations which have conventional natural gas production. During 2010divisions and2011, we moved drilling rigs into our North Dakota and Appalachia drilling division locations, both of which are shale regions, and in early 2011, we established our West Texas drilling division location where we currently have 18 drilling rigs operating.in 2011.
In Septemberearly 2011,, we evaluated the drilling rigs in our fleet that had remained idle and decided to place six mechanical drilling rigs as held for sale as of September 30, 2011. Four of the held for sale drilling rigs were previously assigned to our Oklahoma drilling division location and the remaining two drilling rigs were previously assigned to our East Texas drilling division location. Sales of all six mechanical drilling rigs were completed by mid November 2011. In addition, we decided to retire another drilling rig from our fleet that was previously assigned to our Utah drilling division location, with most of its components to be used for spare equipment. We recognized an impairment charge of $0.5 million in September 2011 in association with our decision to dispose of these seven drilling rigs.
At December 31, 2011, we have 64 drilling rigs in our fleet. We currently havebegan construction, based on term contracts, forof ten new-build AC drilling rigs that are fit for purpose for domestic shale plays,plays. Construction has been completed for fiveeight of these new-build drilling rigs which we estimate will begin workingare currently operating in the first half of 2012, withshale plays, and we expect the remaining fivetwo to begin operating be completed and working under term contracts by the end of 2012the first quarter of 2013.
As of February 10, 2012January 31, 2013, 5557 drilling rigs are operating under drilling contracts, 4443 of which are under term contracts. We haveIncluded in the nine43 drilling rigs thatcurrently operating under term contracts are idle, three rigs which our client early released due to the recent decrease in demand for vertical conventional drilling in West Texas. These three drilling rigs are under term contracts and therefore we are receiving a standby dayrate for the remainder of the contract term. All our drilling rigs in Colombia are currently working, sixof which are working under contract to begin working interm contracts that were extended through the first quarter of 2012.2013. We are actively marketing all our idle drilling rigs.
In addition to our drilling rigs, we provide the drilling crews and most of the ancillary equipment needed to operate our drilling rigs. We obtain our contracts for drilling oil and natural gas wells either through competitive bidding or through direct negotiations with customers.existing or potential clients. Our drilling contracts generally provide for compensation on either a daywork, turnkey or footage basis. Contract terms generally depend on the complexity and risk of operations, the on-site drilling conditions, the type of equipment used, and the anticipated duration of the work to be performed.
Our Production Services DivisionSegment provides a range of services to exploration and production companies, including well servicing, wireline services, wireline, coilcoiled tubing services, and fishing and rental services. Our production services operations are managed through locations concentrated in the major United States onshore oil and gas producing regions in the Mid-Continent and Rocky Mountain states and in the Gulf Coast, Mid-Continent, Rocky Mountainboth onshore and Appalachian states.offshore. As of February 10, 2012January 31, 2013, we have a premium fleet of 91108 well serviceservicing rigs consisting of eighty-oneninety-eight 550 horsepower rigs and nineten 600 horsepower rigs, and one 400 horsepower rig. All our well service rigsall of which are currently operating or are being actively marketed, with January utilization of approximately 86%.marketed. We currently provide wireline services and coiled tubing services with a fleet of 109120 wireline units and ten13 wireline and coiled tubing units, respectively, and we provide rental services with approximately $15.116.1 million of fishing and rental tools. We plan to add another 13 well service rigs, 18 wireline units and three coiled tubing units by the end of 2012.
The accompanying consolidated financial statements include the accounts of Pioneer Drilling CompanyEnergy Services Corp. and our wholly owned subsidiaries. All intercompany balances and transactions have been eliminated in consolidation. The accompanying consolidated financial statements have been prepared in accordance with accounting principles generally accepted in the United States of America. In preparing the accompanying consolidated financial statements, we make various estimates and assumptions that affect the amounts of assets and liabilities we report as of the dates of the balance sheets and income and expenses we report for the periods shown in the income statements and statements of cash flows. Our actual results could differ significantly from those estimates. Material estimates that are particularly susceptible to significant changes in the near term relate to our recognition of revenues and costs for turnkey contracts, our estimate of the allowance for doubtful accounts, our determination of depreciation and amortization expense, our estimates of fair value for impairment evaluations, our estimate of deferred taxes, our estimate of the liability relating to the self-insurance portion of our health and workers’ compensation insurance, our estimate of asset impairments, our estimate of deferred taxes,and our estimate of compensation related accruals and our determination of depreciation and amortization expense.accruals.
In preparing the accompanying consolidated financial statements, we have reviewed events that have occurred after December 31, 20112012, through the filing of this Form 10-K, for inclusion as necessary.
Recently Issued Accounting Standards
Multiple Deliverable Revenue Arrangements. In October 2009, the Financial Accounting Standards Board (FASB) issued Accounting Standards Update (ASU) No. 2009-13, Revenue Recognition (Topic 605): Multiple Deliverable Revenue Arrangements – A Consensus of the FASB Emerging Issues Task Force. This update provides application guidance on whether multiple deliverables exist, how the deliverables should be separated and how the consideration should be allocated to one or more units of accounting. This update establishes a selling price hierarchy for determining the selling price of a deliverable. The selling price used for each deliverable will be based on vendor-specific objective evidence, if available, third-party evidence if vendor-specific objective evidence is not available, or estimated selling price if neither vendor-specific or third-party evidence is available. We are required to apply this guidance prospectively for revenue arrangements entered into or materially modified after January 1, 2011. The adoption of this new guidance has not had an impact on our financial position or results of operations.
Business Combinations. In December 2010, the FASB issued ASU No. 2010-29, Business Combinations (Topic 805): Disclosure of Supplementary Pro Forma Information for Business Combinations – A consensus of the FASB Emerging Issues Task Force. This update provides clarification requiring public companies that have completed material acquisitions to disclose the revenue and earnings of the combined business as if the acquisition took place at the beginning of the comparable prior annual reporting period, and also expands the supplemental pro forma disclosures to include a description of the nature and amount of material, nonrecurring pro forma adjustments directly attributable to the business combination included in the reported pro forma revenue and earnings. We are required to apply this guidance prospectively for business combinations for which the acquisition date is on or after January 1, 2011. The adoption of this new guidance has not had a material impact on our financial position or results of operations.
Fair Value Measurement. In May 2011, the FASB issued ASU No. 2011-04, Fair Value Measurement (Topic 820): Amendments to Achieve Fair Value Measurement and Disclosure Requirements in U.S. GAAP and IFRSs. This update clarifies existing guidance about how fair value should be applied where it already is required or permitted and provides wording changes that align this standard with International Financial Reporting Standards (IFRS). We are required to apply this guidance prospectively beginning with our first quarterly filing in 2012. We do not expect theThe adoption of this new guidance to have a materialhas not had an impact on our financial position or results of operations.
Comprehensive Income. In June 2011, the FASB issued ASU No. 2011-05, Comprehensive Income (Topic 220): Presentation of Comprehensive Income. This update increases the prominence of other comprehensive income in financial statements, eliminating the option of presenting other comprehensive income in the statement of changes in equity, and instead, giving companies the option to presentrequiring the components of net income and comprehensive income to be presented in either one or two consecutive financial statements. We are required to comply with this guidance prospectively beginning with our first quarterly filing in 2012. The adoption of this new guidance willhas not had an impact on our financial position or statementresults of operations, other than changes in presentation.operations.
In December 2011, the FASB issued ASU No. 2011-12, Comprehensive Income (Topic 220): Deferral of the Effective Date for Amendments to the Presentation of Reclassifications of Items Out of Accumulated Other Comprehensive Income in Accounting Standards Update No. 2011-05. This update delays the effective date of the requirement to present reclassification adjustments for each component of accumulated other comprehensive income in both net income and other comprehensive income on the face of the financial statements.
In February 2012, the FASB issued ASU No. 2013-02, Reporting of Amounts Reclassified Out of Accumulated Other Comprehensive Income. This update adds new disclosure requirements for items reclassified out of accumulated other comprehensive income. We are required to apply this guidance prospectively beginning with our first quarterly filing in 2013. The adoption of this new guidance will not impact our financial position or statement of operations, other than changes in presentation.
Intangibles–Goodwill and Other.Other. In September 2011, the FASB issued ASU No. 2011-08, Intangibles–Intangibles–Goodwill and Other (Topic 350): Testing Goodwill for Impairment. This update allows entities testing goodwill for impairment the option of performing a qualitative assessment before calculating the fair value of the reporting unit (i.e., step one of the two-step goodwill impairment test). If entities determine, on the basis of qualitative factors, that the fair value of the reporting unit is more likely than not less than the carrying amount, the two-step impairment test would be required. The amendments are effective for annual and interim goodwill impairment tests performed for fiscal years beginning after December 15, 2011. The adoption of this new guidance willhas not had an impact on our financial position or statementresults of operations.
Drilling Contracts
Our drilling contracts generally provide for compensation on either a daywork, turnkey or footage basis. Contract terms generally depend on the complexity and risk of operations, the on-site drilling conditions, the type of equipment used, and the anticipated duration of the work to be performed. Generally, our contracts provide for the drilling of a single well and typically permit the customerclient to terminate on short notice. During periods of high rig demand, or for our newly constructed rigs, we enter into longer-term drilling contracts. Currently, we have contracts with terms of six months to four years in duration. As of February 10, 2012January 31, 2013, we have 4443 drilling rigs operating under term contracts. Of thesecontracts, as well as term contracts for another 44two contracts,new-build AC drilling rigs which we expect to begin working by the end of the first quarter of 2013. As of January 31, 2013, if not renewed at the end of their terms, the expiration of the 21 will expire by July 10, 2012, 22 will expire by February 10, 2013 and one will expire by February 10, 2014. We have term contracts for an additional three drilling rigs that we expect will begin operating in the first quarter of 2012 and we have ten43 term contracts for new-build AC drilling rigs, five ofunder which we estimate will begin working in the first half of 2012, with the remaining five to beginare currently operating by the end of 2012.is as follows:
|
| | | | | | | | | | | | | | | | | | |
| | | | | Term Contract Expiration by Period |
| | | Total Term Contracts | | Within 6 Months | | 6 Months to 1 Year | | 1 Year to 18 Months | | 18 Months to 2 Years | | 2 to 4 Years |
| United States | | 37 |
| | 23 |
| | 6 |
| | 2 |
| | 1 |
| | 5 |
|
| Colombia | | 6 |
| | 6 |
| | — |
| | — |
| | — |
| | — |
|
| | | 43 |
| | 29 |
| | 6 |
| | 2 |
| | 1 |
| | 5 |
|
Foreign Currencies
Our functional currency for our foreign subsidiary in Colombia is the U.S. dollar. Nonmonetary assets and liabilities are translated at historical rates and monetary assets and liabilities are translated at exchange rates in effect at the end of the period. Income statement accounts are translated at average rates for the period. Gains and losses from remeasurement of foreign currency financial statements into U.S. dollars and from foreign currency transactions are included in other income or expense.
Revenue and Cost Recognition
Drilling Services—Our Drilling Services DivisionSegment earns revenues by drilling oil and gas wells for our customersclients under daywork, turnkey or footage contracts, which usually provide for the drilling of a single well. Drilling contracts for individual wells are usually completed in less than60days. We recognize revenues on daywork contracts for the days completed based on the dayrate each contract specifies. We recognize revenues from our turnkey and footage contracts on the percentage-of-completion method based on our estimate of the number of days to complete each contract. Individual contracts are usually completed in less than 60 days. The risks to us under a turnkey contract and, to a lesser extent, under footage contracts, are substantially greater than on a contract drilled on a daywork basis. Under a turnkey contract, we assume most of the risks associated with drilling operations that are generally assumed by the operator in a daywork contract, including the risks of blowout, loss of hole, stuck drill pipe, machinery breakdowns and abnormal drilling conditions, as well as risks associated with subcontractors’ services, supplies, cost escalations and personnel operations.
Our management has determined that it is appropriate to use the percentage-of-completion method to recognize revenue on our turnkey and footage contracts. Although our turnkey and footage contracts do not have express terms that provide us with rights to receive payment for the work that we perform prior to drilling wells to the agreed-on depth, we use this method because, as provided in applicable accounting literature, we believe we achieve a continuous sale for our work-in-progress and believe, under applicable state law, we ultimately could recover the fair value of our work-in-progress even in the event we were unable to drill to the agreed-on depth in breach of the applicable contract. However, in the event we were unable to drill to the agreed-on depth in breach of the contract, ultimate recovery of that value would be subject to negotiations with the customerclient and the possibility of litigation.
When estimating fair values of a reporting unit for our goodwill impairment test, we use a combination of an income approach and a market approach which incorporates both management’s views and those of the market. The income approach provides an estimated fair value based on eachthe reporting unit’s anticipated cash flows that wereare discounted using a weighted average cost of capital rate. The market approach provides an estimated fair value based on our market capitalization that was computed using the prior 30-day average market price of our common stock and the number of shares outstanding as of the impairment test date. The estimated fair values computed using the income approach and the market approach were then equally weighted and combined into a single fair value.
The primary assumptions used in the income approach are estimated cash flows and weighted average cost of capital. Estimated cash flows wereare primarily based on projected revenues, operating costs and capital expenditures and are discounted at a rate that is based on comparableour weighted average cost of capital and estimated industry average rates for weighted average cost of capital. The primary assumptions used in the market approach is the allocation of total market capitalization to each reporting unit, which was based on projected EBITDA percentages for each reporting unit, and control premiums, which were based on comparable industry averages. To ensure the reasonableness of the estimated fair valuesvalue of our reporting units, we performedconsider current industry market multiples and we perform a reconciliation of our total market capitalization to the total estimated fair value of all our reporting units. The assumptions used in estimating fair values of reporting units and performing the goodwill impairment test are inherently uncertain and requiredrequire management judgment.
We have goodwill of$41.7 millionas of December 31, 20112012. All of this goodwill was recorded in connection with the acquisition of the production services business from Go-Coil onDecember 31, 2011, as described in Note 2,Acquisitions.As a result, the goodwill has been allocated to the coiled tubing services reporting unit within our Production Services Division operating segment. NoSegment. As ofDecember 31, 2012, we performed the first step of the two-step process to evaluate our goodwill for potential impairment. As a result of this test, we have concluded that the fair value of our coiled tubing services reporting unit is substantially in excess of its carrying value, including goodwill, and therefore no impairment loss on goodwill was recognized during the year ended exists as ofDecember 31, 20112012.
Intangible Assets
All our intangible assets are subject to amortization and consist of customer relationships, non-compete agreements, trade marks and trade names. EssentiallySubstantially all of our intangible assets were recorded in connection with the acquisitions of the production services businesses.businesses and are subject to amortization. Intangible assets consist of the following components (amounts in thousands):
| | | | December 31, 2011 | | December 31, 2010 | December 31, 2012 | | December 31, 2011 |
| Cost: | | | | | | |
| Customer relationships | $ | 66,273 |
| | $ | 33,036 |
| |
| Client relationships | | $ | 66,273 |
| | $ | 66,273 |
|
| Non-compete agreements | 3,133 |
| | 2,024 |
| 1,355 |
| | 3,133 |
|
| Trademarks / trade names | 671 |
| | 155 |
| 568 |
| | 671 |
|
| Accumulated amortization: | | | | | | |
| Customer relationships | (15,512 | ) | | (11,462 | ) | |
| Client relationships | | (23,667 | ) | | (15,512 | ) |
| Non-compete agreements | (1,885 | ) | | (1,787 | ) | (436 | ) | | (1,885 | ) |
| Trademarks / trade names | | (250 | ) | | — |
|
| | $ | 52,680 |
| | $ | 21,966 |
| $ | 43,843 |
| | $ | 52,680 |
|
We evaluate for potential impairment of long-lived assetstangible and intangible assets subject to amortization when indicators of impairment are present. Circumstances that could indicate a potential impairment include significant adverse changes in industry trends, economic climate, legal factors, and an adverse action or assessment by a regulator. More specifically, significant adverse changes in industry trends include significant declines in revenue rates, utilization rates, oil and natural gas market prices and industry rig counts for drilling rigs and well serviceservicing rigs.
In performing thean impairment evaluation, we estimate the future undiscounted net cash flows relating tofrom the use and eventual disposition of long-lived assetstangible and intangible assets grouped at the lowest level that cash flows can be identified. Our long-lived assets and intangible assets forFor our Production Services Division are grouped one level belowSegment, we perform an impairment evaluation and estimate future undiscounted cash flows for the operating segment in the fourindividual reporting units which are well services,(well servicing, wireline, services, coiled tubing services and fishing and rental services.services). For our Drilling Services Segment, we perform an impairment evaluation and estimate future undiscounted cash flows for individual drilling rig assets. If the sum of the estimated future undiscounted net cash flows is less than the carrying amount of the long-lived assets and intangible assets in each reporting unit,asset group, then we would recognize an impairment charge.determine the fair value of the asset group. The amount of an impairment charge would be measured as the difference between the carrying amount and the fair value of these assets. The assumptions used in the impairment evaluation for long-lived assets and intangible assets are inherently uncertain and require management judgment.
The cost of our customerclient relationships, trademarks and trade names are amortized using the straight-line method over their respective estimated economic useful lives which range from two to nine years. Amortization expense for our non-compete agreements is calculated using the straight-line method over the period of the agreements which range from two to seven years.
Amortization expense was $4.38.7 million, $4.64.3 million and $4.74.6 million for the years ended December 31, 20112012, 20102011 and 20092010, respectively. Amortization expense is estimated to be approximately $8.7 million, $8.78.4 million, $8.4 million, $8.45.6 million and $5.64.2 million for the years ending December 31, 2012, 2013, 2014, 2015, 2016 and 20162017, respectively. Actual amortization amounts may be different due to future acquisitions, impairments, changes in amortization periods, or other factors.
Other Long-Term Assets
Other long-term assets consist of restricted cash held in an escrow account, cash deposits related to the deductibles on our workers’ compensation insurance policies, the long-term portion of deferred mobilization costs, the ARPSs Call Option, and debt issuance costs, net of amortization.amortization, and noncurrent prepaid taxes in Colombia which are creditable against future income taxes. Debt issuance costs are described in more detail in Note 3, Long-term Debt.
Other Long-Term Liabilities
Our other long-term liabilities consist of the noncurrent portion of deferred mobilization revenues, liabilities associated with our long-term compensation plans, the noncurrent portion of the Colombia net equity tax and other deferred liabilities. In previous years, our other long-term liabilities also included the noncurrent portion of our obligation to a former shareholder of a previously acquired production services business, for which the cash is held in escrow.
Treasury Stock
Treasury stock purchases are accounted for under the cost method whereby the cost of the acquired common stock is recorded as treasury stock. Gains and losses on the subsequent reissuance of treasury stock shares are credited or charged to additional paid in capital using the average cost method.
Income Taxes
We follow the asset and liability method of accounting for income taxes, under which we recognize deferred tax assets and liabilities for the future tax consequences attributable to differences between the financial statement carrying amounts of existing assets and liabilities and their respective tax basis. We measure our deferred tax assets and liabilities by using the enacted tax rates we expect to apply to taxable income in the years in which we expect to recover or settle those temporary differences. The effect of a change in tax rates on deferred tax assets and liabilities is reflected in income in the period during which the change occurs.
Comprehensive Income (Loss)
Comprehensive income (loss) is comprised of net income (loss) and other comprehensive loss. During the years ended December 31, 2009 and 2008, $2.7 million of the difference between the par value and fair value of the ARPSs was considered temporary and was recorded as unrealized losses, net of taxes of $1.0 million, in accumulated other comprehensive income (loss). For the year ended December 31, 2010, we recognized a $3.3 million other-than-temporary impairment of the ARPSs to earnings. The following table sets forth the components of comprehensive loss (amounts in thousands):
|
| | | | | | | | | | | |
| | Year ended December 31, |
| | 2011 | | 2010 | | 2009 |
| Net income (loss) | $ | 11,177 |
| | $ | (33,261 | ) | | $ | (23,215 | ) |
| Other comprehensive loss: unrealized losses on securities | — |
| | — |
| | (448 | ) |
| Impact of impairment of investments charge | — |
| | 1,693 |
| | — |
|
| Comprehensive income (loss) | $ | 11,177 |
| | $ | (31,568 | ) | | $ | (23,663 | ) |
Stock-based Compensation
We recognize compensation cost for stock option, restricted stock and restricted stock unit awards based on the fair value of the awards. For our awards with graded vesting, we recognize compensation expense on a straight-line basis over the service period for each separately vesting portion of the award as if the award was, in substance, multiple awards.
We receive a tax deduction for certain stock option exercises during the period the options are exercised, generally for the excess of the market price of our common stock on the exercise date over the exercise price of the stock options. We report all excess tax benefits resulting from the exercise of stock options as financing cash flows in our consolidated statement of cash flows.
ReclassificationsIncome Taxes
CertainWe follow the asset and liability method of accounting for income taxes, under which we recognize deferred tax assets and liabilities for the future tax consequences attributable to differences between the financial statement carrying amounts of existing assets and liabilities and their respective tax basis. We measure our deferred tax assets and liabilities by using the enacted tax rates we expect to apply to taxable income in the financial statements foryears in which we expect to recover or settle those temporary differences. The effect of a change in tax rates on deferred tax assets and liabilities is reflected in income in the prior years have beenperiod during which the change occurs. A recent change in Colombia tax rates is described in more detail in Note 5, Income Taxes.
Other Comprehensive Income (Loss)
During the year ended December 31, 2010, we recognized a $3.3 million other-than-temporary impairment of the ARPSs in earnings, and therefore reclassified to conform to the current year’s presentation.net loss $2.7 million of previously unrealized losses on ARPSs which had been recorded in other comprehensive income.
On December 31, 2011, we acquired the production services business of Go-Coil, LLC,L.L.C., a Louisiana limited liability company ("Go-Coil"(“Go-Coil”) which providesprovided coiled tubing services with a fleet of seven onshore units and three offshore units through its facilities in Louisiana, Texas, Oklahoma and Pennsylvania. The aggregate purchase price for the acquisition was approximately $110.4 million, which consisted of assets acquired of $114.9 million and liabilities assumed of $4.5 million. We funded the acquisition with cash on hand that was primarily generated from the proceeds of the Senior Notes issued in November 2011, as described in Note 3, Long-term Debt.
The following table summarizes the allocation of the purchase price to the estimated fair value of the assets acquired and liabilities assumed as of the date of acquisition (amounts in thousands):
|
| | | |
| Cash acquired | $ | 313 |
|
| Other current assets | 9,068 |
|
| Property and equipment | 30,103 |
|
| Intangibles and other assets | 33,695 |
|
| Goodwill | 41,683 |
|
| Total assets acquired | $ | 114,862 |
|
| Current liabilities | $ | 4,337 |
|
| Long-term debt | 131 |
|
| Total liabilities assumed | $ | 4,468 |
|
| Net assets acquired | $ | 110,394 |
|
The following unaudited pro forma consolidated summary financial information gives effect of the acquisition of the production services business from Go-Coil as though it was effective as of the beginning of the year ended December 31, 2011. Pro forma adjustments primarily relate to additional depreciation, amortization, interest and tax expenses, as well as the removal of approximately $14.1 million of nonrecurring costs, primarily related to discontinued compensation arrangements and acquisition related costs. The pro forma information reflects our company’s historical data and Go-Coil's historical data for the periods indicated. The pro forma data may not be indicative of the results we would have achieved had we completed the acquisition on January 1, 2011, or what we may achieve in the future and should be read in conjunction with the accompanying historical financial statements.
| | | | Pro Forma | Pro Forma |
| | Year ended December 31, 2011 | For the year ended December 31, 2011 |
| | (in thousands) | (in thousands) |
| Total revenues | $ | 762,978 |
| $ | 762,978 |
|
| Net earnings | $ | 8,412 |
| $ | 8,412 |
|
| Earnings per common share: | | |
| Basic | $ | 0.15 |
| $ | 0.15 |
|
| Diluted | $ | 0.14 |
| $ | 0.14 |
|
The acquisition of the productioncoiled tubing services business from Go-Coil was accounted for as an acquisition of a business in accordance with ASC Topic 805, Business Combinations. The purchase price allocation for the Go-Coil acquisition is preliminary at this time and may change once we receivewas finalized information regarding the fair value estimatesas of the assets acquired and liabilities assumed in the acquisition. In addition, we have not finalized the working capital adjustment which will be payable to the former owners of Go-Coil and is estimated to be approximately $1.0 million.June 30, 2012. Goodwill was recognized as part of the Go-Coil acquisition, since the purchase price exceeded the estimated fair value of the assets acquired and liabilities assumed. We believe that the goodwill relates to the acquired workforce, future synergies between our existing service offerings and the ability to expand our service offerings.
Prior to the Go-Coil acquisition, we completed four separate acquisitions in 2011 of other production services businesses for a total of $6.5 million in cash. The identifiable assets recorded in connection with these acquisitions included fixed assets of $5.2 million, representing six wireline units and two well serviceservicing rigs, and intangible assets of $1.3 million representing customerclient relationships and non-competition agreements. We did not recognize any goodwill in conjunction with these acquisitions and no contingent assets or liabilities were assumed. These four acquisitions have been accounted for as acquisitions of businesses in accordance with ASC Topic 805, Business Combinations.
Long-term debt consists of the following (amounts in thousands):
| | | | December 31, 2011 | | December 31, 2010 | December 31, 2012 | | December 31, 2011 |
| Senior secured revolving credit facility | $ | — |
| | $ | 37,750 |
| $ | 100,000 |
| | $ | — |
|
| Senior Notes | 417,747 |
| | 240,080 |
| |
| Subordinated notes payable and other | 1,853 |
| | 3,108 |
| |
| Senior notes | | 418,617 |
| | 417,747 |
|
| Other notes payable | | 980 |
| | 1,853 |
|
| | 419,600 |
| | 280,938 |
| 519,597 |
| | 419,600 |
|
| Less current portion | (872 | ) | | (1,408 | ) | (872 | ) | | (872 | ) |
| | $ | 418,728 |
| | $ | 279,530 |
| $ | 518,725 |
| | $ | 418,728 |
|
Senior Secured Revolving Credit Facility
We have a credit agreement, as amended on June 30, 2011, with Wells Fargo Bank, N.A. and a syndicate of lenders which provides for a senior secured revolving credit facility, with sub-limits for letters of credit and swing-line loans, of up to an aggregate principal amount of $250 million, all of which matures on June 30, 2016 (the “Revolving Credit Facility”). The Revolving Credit Facility contains customary mandatory prepayments from the proceeds of certain asset dispositions or debt issuances, which are applied to reduce outstanding revolving and swing-line loans and letter of credit exposure, but in no event will reduce the borrowing availability under the Revolving Credit Facility to less than $250 million.
Borrowings under the Revolving Credit Facility bear interest, at our option, at the LIBOR rate or at the bank prime rate, plus an applicable per annum margin that ranges from 2.50% to 3.25% and 1.50% to 2.25%, respectively. The LIBOR margin and bank prime rate margin in effect at February 10, 2012January 31, 2013 are 2.50%2.75% and 1.50%1.75%, respectively. The Revolving Credit Facility requires a commitment fee due quarterly based on the average daily unused amount of the commitments of the lenders, a fronting fee due for each letter of credit issued, and a quarterly letter of credit fee due based on the average undrawn amount of letters of credit outstanding during such period.
Our obligations under the Revolving Credit Facility are secured by substantially all of our domestic assets (including equity interests in Pioneer Global Holdings, Inc. and 65% of the outstanding equity interests of any first-tier foreign subsidiaries owned by Pioneer Global Holdings, Inc., but excluding any equity interest in, and any assets of, Pioneer Services Holdings, LLC) and are guaranteed by certain of our domestic subsidiaries, including Pioneer Global Holdings, Inc. Effective October 1, 2012, Pioneer Coiled Tubing Services, LLC (formerly Go-Coil, L.L.C.) was added as a subsidiary guarantor under the Revolving Credit Facility. Borrowings under the Revolving Credit Facility are available for acquisitions, working capital and other general corporate purposes.
As of February 10, 2012January 31, 2013, we had a zero$100.0 million balance outstanding under our Revolving Credit Facility and $9.0 million in committed letters of credit, which resulted in borrowing availability of $241.0141.0 million under our Revolving Credit Facility. There are no limitations on our ability to access this borrowing capacity other than maintaining compliance with the covenants under the Revolving Credit Facility. At December 31, 20112012, we were in compliance with our financial covenants. Our total consolidated leverage ratio was 2.22.1 to 1.0, our senior consolidated leverage ratio was 0.10.4 to 1.0, and our interest coverage ratio was 6.77.0 to 1.0. The financial covenants contained in our Revolving Credit Facility include the following:
A maximum total consolidated leverage ratio that cannot exceed 4.00 to 1.00;
A maximum senior consolidated leverage ratio, which excludes unsecured and subordinated debt, that cannot exceed 2.50 to 1.00;
A minimum interest coverage ratio that cannot be less than 2.50 to 1.00; and
If our senior consolidated leverage ratio is greater than 2.00 to 1.00 at the end of any fiscal quarter, our minimum asset coverage ratio cannot be less than 1.00 to 1.00.
The Revolving Credit Facility does not restrict capital expenditures as long as (a) no event of default exists under the Revolving Credit Facility or would result from such capital expenditures, (b) after giving effect to such capital expenditures there is availability under the Revolving Credit Facility equal to or greater than $25 million and (c) the senior consolidated leverage ratio as of the last day of the most recent reported fiscal quarter is less than 2.00 to 1.00. If the senior consolidated leverage ratio as of the last day of the most recent reported fiscal quarter is equal to or greater than 2.00 to 1.00, then capital expenditures are limited to $100 million for the fiscal year. The capital expenditure threshold may be increased by any unused portion of the capital expenditure threshold from the immediate preceding fiscal year up to $30 million.
At December 31, 2011,2012, our senior consolidated leverage ratio was not greater than 2.00 to 1.00 and therefore, we were not subject to the capital expenditure threshold restrictions listed above.
The Revolving Credit Facility has additional restrictive covenants that, among other things, limit the incurrence of additional debt, investments, liens, dividends, acquisitions, redemptions of capital stock, prepayments of indebtedness, asset dispositions, mergers and consolidations, transactions with affiliates, hedging contracts, sale leasebacks and other matters customarily restricted in such agreements. In addition, the Revolving Credit Facility contains customary events of default, including without limitation, payment defaults, breaches of representations and warranties, covenant defaults, cross-defaults to certain other material indebtedness in excess of specified amounts, certain events of bankruptcy and insolvency, judgment defaults in excess of specified amounts, failure of any guaranty or security document supporting the credit agreement and change of control.
Senior Notes
On March 11, 2010, we issued $250 million of unregistered senior notes with a coupon interest rate of 9.875% that are due in 2018 (the “ 2010“2010 Senior Notes”). The 2010 Senior Notes were sold with an original issue discount of $10.6 million that was based on 95.75% of their face value, which will result in an effective yield to maturity of approximately 10.677%. On March 11, 2010, we received $234.8 million of net proceeds from the issuance of the 2010 Senior Notes after deductions were made for the $10.6 million of original issue discount and $4.6 million for underwriters’ fees and other debt offering costs. The net proceeds were used to repay a portion of the borrowings outstanding under our Revolving Credit Facility.
In accordance with a registration rights agreement with the holders of our 2010 Senior Notes, we filed an exchange offer registration statement on Form S-4 with the Securities and Exchange Commission that became effective on September 2, 2010. This exchange offer registration statement enabled the holders of our 2010 Senior Notes to exchange their senior notes for publicly registered notes with substantially identical terms. References to the “2010 Senior Notes” herein include the senior notes issued in the exchange offer.
On November 21, 2011, we issued $175 million of unregistered Senior Notes (the "2011“2011 Senior Notes"Notes”). The 2011 Senior Notes have the same terms and conditions as the 2010 Senior Notes. The 2011 Senior Notes were sold with an original issue premium of $1.8 million that was based on 101% of their face value, which will result in an effective yield to maturity of approximately 9.66%. On November 21, 2011, we received $172.7 million of net proceeds from the issuance of the 2011 Senior Notes, including the original issue premium, and after $4.1 million of deductions were made for underwriters' fees and other debt offering costs. A portion of the net proceeds were used to fund the acquisition of Go-Coil in December 2011, as described in Note 2, Acquisitions.
In accordance with a registration rights agreement with the holders of both our 2010 Senior Notes and 2011 Senior Notes, we filed exchange offer registration statements on Form S-4 with the Securities and Exchange Commission that became effective on September 2, 2010 and July 13, 2012, respectively. These exchange offer registration statements enabled the holders of both our 2010 Senior Notes and 2011 Senior Notes to exchange their senior notes for publicly registered notes with substantially identical terms. References to the “2010 Senior Notes” and “2011 Senior Notes” herein include the senior notes issued in the exchange offers.
The 2010 and 2011 Senior Notes (the "Senior Notes"“Senior Notes”) are reflected on our condensed consolidated balance sheet at December 31, 20112012 with a total carrying value of $417.7418.6 million, which represents the $425.0 million total face value net of the $8.97.9 million unamortized portion of original issue discount and $1.71.5 million unamortized portion of original issue premium. The original issue discount and premium are being amortized over the term of the Senior Notes based on the effective interest method.
The Senior Notes will mature on March 15, 2018 with interest due semi-annually in arrears on March 15 and September 15 of each year. We have the option to redeem the Senior Notes, in whole or in part, at any time on or after March 15, 2014 in each case at the redemption price specified in the Indenture dated March 11, 2010 (the “Indenture”) together with any accrued and unpaid interest to the date of redemption. Prior to March 15, 2014, we may also redeem the Senior Notes, in whole or in part, at a “make-whole” redemption price specified in the Indenture, together with any accrued and unpaid interest to the date of redemption. In addition, prior to March 15, 2013, we may, on one or more occasions, redeem up to 35% of the aggregate principal amount of the Senior Notes at a redemption price of 109.875% of the principal amount, plus any accrued and unpaid interest to the redemption date, with the net proceeds of certain equity offerings, if at least 65% of the aggregate principal amount of the Senior Notes remains outstanding after such redemption and the redemption occurs within 120 days of the closing of the equity offering.
Upon the occurrence of a change of control, holders of the Senior Notes will have the right to require us to purchase all or a portion of the Senior Notes at a price equal to 101% of the principal amount of each Senior Note, together with any accrued and unpaid interest to the date of purchase. Under certain circumstances in connection with asset dispositions, we will be required to use the excess proceeds of asset dispositions to make an offer to purchase the Senior Notes at a price equal to 100% of the principal amount of each Senior Note, together with any accrued and unpaid interest to the date of purchase.
The Indenture contains certain restrictions generally on our and certain of our subsidiaries’ ability to:
pay dividends on stock;
repurchase stock or redeem subordinated debt or make other restricted payments;
incur, assume or guarantee additional indebtedness or issue disqualified stock;
create liens on our assets;
enter into sale and leaseback transactions;
pay dividends, engage in loans, or transfer other assets from certain of our subsidiaries;
consolidate with or merge with or into, or sell all or substantially all of our properties to another person;
enter into transactions with affiliates; and
enter into new lines of business.
We were in compliance with these covenants as of December 31, 20112012. The Senior Notes are not subject to any sinking fund requirements. The Senior Notes are fully and unconditionally guaranteed, jointly and severally, on a senior unsecured basis by certain of our existing domestic subsidiaries and by certain of our future domestic subsidiaries (seesubsidiaries. Effective October 1, 2012, Pioneer Coiled Tubing Services, LLC (formerly Go-Coil, L.L.C.) was added as a subsidiary guarantor under the Indenture. (See Note 13, Guarantor/Non-Guarantor Condensed Consolidated Financial Statements.).
SubordinatedOther Notes Payable and Other
We have two subordinated notes payable to certain employees that are former shareholders of production services businesses which we have acquired. These subordinated notes payable have interest rates of 6% and 14%, require annual payments of principal and interest and have final maturity dates in March and April 2013. We have other debt of $0.20.1 million as of December 31, 20112012 which represents a capital lease obligation for equipment, with monthly payments due through November 2016.
Debt Issuance Costs
Costs incurred in connection with the Revolving Credit Facility were capitalized and are being amortized using the straight-line method over the term of the Revolving Credit Facility which matures in June 2016. Costs incurred in connection with the issuance of our Senior Notes were capitalized and are being amortized using the straight-line method (which approximates the use of the interest method) over the term of the Senior Notes which mature in March 2018.
Capitalized debt costs related to the issuance of our long-term debt were approximately $11.69.6 million and $6.711.6 million as of December 31, 2012 and 2011, respectively. We recognized approximately $2.1 million, $1.8 million and $1.9 million of associated amortization during the years ended December 31, 2012, 2011 and 2010, respectively. We recognized approximatelyDuring the year ended $1.8 million, $1.9 million and $1.5 million of associated amortization during 2011, 2010 and 2009, respectively. In JuneDecember 31, 2011, we recognized additional amortization expense related tofor the write-off of $0.6 million of debt issuance costs representing the portion of unamortized debt issuance costs associated with certain syndicate lenders who are no longer participating in the Revolving Credit Facility as amended on June 30, 2011.
We lease our corporate office facilities in San Antonio, Texas at a payment escalating from $29,83935,694 per month in January 20122013 to $42,635 per month in December 2020 pursuant to a lease which extends through December 2020, but which is cancelable as early as December 2016 with applicable penalties. We recognize rent expense on a straight linestraight-line basis for our corporate office lease. In addition, we lease real estate at 7254 other locations under non-cancelable operating leases with payments ranging from $250380 per month to $30,96636,000 per month, pursuant to leases expiring through AugustMay 2022. These real estate locations are used primarily for divisionfield offices and storage and maintenance yards. We also lease vehicles, office and other equipment under non-cancelable operating leases expiring through January 2017December 2016.
Future lease obligations required under non-cancelable operating leases as of December 31, 20112012 were as follows (amounts in thousands):
| | | Year ended December 31, | | |
| 2012 | $ | 4,607 |
| |
| 2013 | 3,475 |
| $ | 4,751 |
|
| 2014 | 2,499 |
| 3,890 |
|
| 2015 | 1,839 |
| 2,268 |
|
| 2016 | 1,181 |
| 1,436 |
|
| 2017 | | 1,058 |
|
| Thereafter | 3,806 |
| 2,976 |
|
| | $ | 17,407 |
| $ | 16,379 |
|
Rent expense under operating leases for the years ended December 31, 20112012, 20102011 and 20092010 was $3.65.6 million, $2.93.6 million and $2.12.9 million, respectively.
The jurisdictional components of income (loss) before income taxes consist of the following (amounts in thousands):
| | | | Year ended December 31, | Year ended December 31, |
| | 2011 | | 2010 | | 2009 | 2012 | | 2011 | | 2010 |
| Domestic | $ | 23,396 |
| | $ | (48,650 | ) | | $ | (46,221 | ) | $ | 42,194 |
| | $ | 23,396 |
| | $ | (48,650 | ) |
| Foreign | (2,563 | ) | | 1,092 |
| | 6,049 |
| 4,192 |
| | (2,563 | ) | | 1,092 |
|
| Income (loss) before income tax | $ | 20,833 |
| | $ | (47,558 | ) | | $ | (40,172 | ) | $ | 46,386 |
| | $ | 20,833 |
| | $ | (47,558 | ) |
The components of our income tax expense (benefit) consist of the following (amounts in thousands):
| | | Year ended December 31, | Year ended December 31, |
| 2011 | | 2010 | | 2009 | 2012 | | 2011 | | 2010 |
| Current tax: | | | | | | | | | | |
| Federal | $ | 716 |
| | $ | (2,547 | ) | | $ | (46,073 | ) | $ | 236 |
| | $ | 716 |
| | $ | (2,547 | ) |
| State | 1,090 |
| | 32 |
| | (2,969 | ) | 1,214 |
| | 1,090 |
| | 32 |
|
| Foreign | 1,301 |
| | 931 |
| | 1,087 |
| 1,479 |
| | 1,301 |
| | 931 |
|
| | 3,107 |
| | (1,584 | ) | | (47,955 | ) | 2,929 |
| | 3,107 |
| | (1,584 | ) |
| Deferred taxes: | | | | | | | | | | |
| Federal | 7,199 |
| | (13,046 | ) | | 31,740 |
| 15,013 |
| | 7,199 |
| | (13,046 | ) |
| State | 102 |
| | 1,366 |
| | 3,390 |
| (749 | ) | | 102 |
| | 1,366 |
|
| Foreign | (752 | ) | | (1,033 | ) | | (4,132 | ) | (839 | ) | | (752 | ) | | (1,033 | ) |
| | 6,549 |
| | (12,713 | ) | | 30,998 |
| 13,425 |
| | 6,549 |
| | (12,713 | ) |
| Income tax expense (benefit) | $ | 9,656 |
| | $ | (14,297 | ) | | $ | (16,957 | ) | $ | 16,354 |
| | $ | 9,656 |
| | $ | (14,297 | ) |
The difference between the income tax expense (benefit) expense and the amount computed by applying the federal statutory income tax rate of 35% to income (loss) before income taxes consistconsists of the following (amounts in thousands):
| | | | Year ended December 31, | Year ended December 31, |
| | 2011 | | 2010 | | 2009 | 2012 | | 2011 | | 2010 |
| Expected tax expense (benefit) | $ | 7,291 |
| | $ | (16,645 | ) | | $ | (14,060 | ) | $ | 16,235 |
| | $ | 7,291 |
| | $ | (16,645 | ) |
| State income taxes | 775 |
| | 909 |
| | 274 |
| 302 |
| | 775 |
| | 909 |
|
| Incentive stock options | 41 |
| | 266 |
| | 243 |
| 43 |
| | 41 |
| | 266 |
|
| Net tax benefits and nondeductible expenses in foreign jurisdictions | 1,391 |
| | (207 | ) | | (5,162 | ) | (881 | ) | | 1,391 |
| | (207 | ) |
| Domestic production activities deduction | — |
| | — |
| | 1,130 |
| |
| Nontaxable interest income | (1 | ) | | (23 | ) | | (33 | ) | — |
| | (1 | ) | | (23 | ) |
| Nondeductible expenses for tax purposes | 567 |
| | 349 |
| | 218 |
| 770 |
| | 567 |
| | 349 |
|
| Valuation allowance | — |
| | 1,248 |
| | — |
| (206 | ) | | — |
| | 1,248 |
|
| Other, net | (408 | ) | | (194 | ) | | 433 |
| 91 |
| | (408 | ) | | (194 | ) |
| Income tax expense (benefit) | $ | 9,656 |
| | $ | (14,297 | ) | | $ | (16,957 | ) | $ | 16,354 |
| | $ | 9,656 |
| | $ | (14,297 | ) |
Income tax expense (benefit) was allocated as follows (amounts in thousands):
| | | | Year ended December 31, | Year ended December 31, |
| | 2011 | | 2010 | | 2009 | 2012 | | 2011 | | 2010 |
| Results of operations | $ | 9,656 |
| | $ | (14,297 | ) | | $ | (16,957 | ) | $ | 16,354 |
| | $ | 9,656 |
| | $ | (14,297 | ) |
| Stockholders' equity | 255 |
| | 1,332 |
| | (26 | ) | 449 |
| | 254 |
| | 1,332 |
|
| Income tax expense (benefit) | $ | 9,911 |
| | $ | (12,965 | ) | | $ | (16,983 | ) | $ | 16,803 |
| | $ | 9,910 |
| | $ | (12,965 | ) |
Deferred income taxes arise from temporary differences between the tax basesbasis of assets and liabilities and their reported amounts in the consolidated financial statements. The components of our deferred income tax assets and liabilities were as follows (amounts in thousands):
| | | | | | | Year ended December 31, |
| | December 31,
2011 | | December 31,
2010 | 2012 | | 2011 |
| Deferred tax assets: | | | | | | |
| Auction rate preferred securities | $ | 1,239 |
| | $ | 1,248 |
| $ | 1,008 |
| | $ | 1,239 |
|
| Intangibles | 20,829 |
| | 21,594 |
| 19,917 |
| | 20,829 |
|
| Employee benefits and insurance claims accruals | 9,126 |
| | 3,634 |
| 8,273 |
| | 9,126 |
|
| Accounts receivable reserve | 369 |
| | 42 |
| 370 |
| | 369 |
|
| Employee stock based compensation | 6,914 |
| | 6,099 |
| |
| Employee stock-based compensation | | 8,224 |
| | 6,914 |
|
| Accrued expenses not deductible for tax purposes | 1,149 |
| | — |
| 1,066 |
| | 1,149 |
|
| Accrued revenue not income for book purposes | 2,212 |
| | 3,393 |
| 1,399 |
| | 2,212 |
|
| Federal and state net operating loss and AMT credit carryforward | 39,310 |
| | 21,568 |
| 69,160 |
| | 39,310 |
|
| Foreign net operating loss carryforward | 6,782 |
| | 5,713 |
| 5,361 |
| | 6,782 |
|
| | 87,930 |
| | 63,291 |
| 114,778 |
| | 87,930 |
|
| Valuation allowance | (1,239 | ) | | (1,248 | ) | (1,008 | ) | | (1,239 | ) |
| Total deferred tax assets | 86,691 |
| | 62,043 |
| 113,770 |
| | 86,691 |
|
| Deferred tax liabilities: | | | | | | |
| Accrued expenses not deductible for tax purposes | — |
| | 105 |
| |
| Property and equipment | 165,268 |
| | 132,231 |
| 206,033 |
| | 165,268 |
|
| Total deferred tax liabilities | 165,268 |
| | 132,336 |
| 206,033 |
| | 165,268 |
|
| Net deferred tax liabilities | $ | 78,577 |
| | $ | 70,293 |
| $ | 92,263 |
| | $ | 78,577 |
|
In assessing the realizability of deferred tax assets, we consider whether it is more likely than not that some portion or all of the deferred tax assets will not be realized. Based on the expectation of future taxable income and that the deductible temporary differences will offset existing taxable temporary differences, we believe it is more likely than not that we will realize the benefits of these deductible temporary differences, with the exception of the valuation allowance recorded to fully offset our deferred tax asset related to the unrealized loss on the impairment of our ARPS securities.
As of December 31, 20112012, we had a $1.21.0 million deferred tax asset related to the$3.3 million impairment of our ARPSs which will represent a capital loss for tax treatment purposes. We can recognize a tax benefit associated with this impairment to the extent of capital gains we expect to earn in future periods. We recorded a valuation allowance to fully offset our deferred tax asset relating to this capital loss since we believe capital gains are not likely in future periods.
As of December 31, 20112012, we had $39.369.2 million and $6.85.4 million of deferred tax assets related to domestic and foreign net operating losses, respectively, that are available to reduce future taxable income. In assessing the realizability of our deferred tax assets, we only recognize a tax benefit to the extent of taxable income that we expect to earn in the jurisdiction in future periods. We estimate that our operations will result in taxable income in excess of our net operating losses and we expect to apply the net operating losses against taxable income that we have estimated in future periods. The domestic net operating losses can be used to offset future domestic taxable income through 20312032, while the majority of the foreign net operating losses can be carried forward indefinitely.
Deferred income taxes have not been provided on the future tax consequences attributable to difference between the financial statements carrying amounts of existing assets and liabilities and the respective tax bases of our foreign subsidiary based on the determination that such differences are essentially permanent in duration in that the earnings of the subsidiary is expected to be indefinitely reinvested in foreign operations. As of December 31, 20112012, the cumulative undistributed earnings/loss of the subsidiary was approximately a $16.722.8 million loss. If earnings were not considered indefinitely reinvested, deferred income taxes would have been recorded after consideration of foreign tax credits. It is not practicable to estimate the amount of additional tax that might be payable on earnings, if distributed.
On December 26, 2012, Colombia enacted a tax reform bill that, among other things, decreased the corporate tax rate from 33% to 25%, but also added a new 9% tax for equality, which results in a combined tax rate of 34%. Net operating losses cannot be utilized against the new 9% tax for equality, and therefore the associated deferred tax asset must now be based on the lower 25% corporate tax rate only. Other deferred tax assets and liabilities must now be based on the higher combined tax rate of 34%. Included in deferred foreign tax expense (benefit) is a $1.7 million expense to adjust our Colombian net deferred tax assets and liabilities for the change in rates.
We have no unrecognized tax benefits relating to ASC Topic 740 and no unrecognized tax benefit activity during the year ended December 31, 20112012.
We adopted a policy to record interest and penalty expense related to income taxes as interest and other expense, respectively. At December 31, 20112012, no interest or penalties have been or are required to be accrued. Our open tax years for our federal income tax returns in the United States are for the years ended December 31, 2006 to 2010.2010 and 2011. Our open tax years for our income tax returns in Colombia are for the years ended December 31, 20082007 to 20102011.
| |
| 6. | Fair Value of Financial Instruments |
ASC Topic 820, Fair Value Measurements and Disclosures, defines fair value and provides a hierarchal framework associated with the level of subjectivity used in measuring assets and liabilities at fair value.
At December 31, 2012 and December 31, 2011, our financial instruments consist primarily of cash, trade receivables, trade payables, long-term debt, and our ARPSs Call Option. At December 31, 2010, our financial instruments also included our investments in ARPSs, which were liquidated in January 2011. The carrying value of cash, trade receivables and trade payables are considered to be representative of their respective fair values due to the short-term nature of these instruments.
At December 31, 2010, our ARPSs were reported at amounts that reflected our estimate of fair value. To estimate the fair values of our ARPSs as of December 31, 2010, we used inputs defined by ASC Topic 820 as level 1 inputs which are quoted market prices in active markets for identical securities. We obtained a quoted market price and liquidated the ARPSs on January 19, 2011 based on the terms of the settlement agreement noted above. Therefore, the sales price under the settlement agreement of $12.6 million represented the fair value of the ARPSs at December 31, 2010. The $3.3 million difference between the ARPSs’ par value of $15.9 million and the sales price of $12.6 million represented an other-than-temporary impairment of the ARPSs investment which was reflected as an impairment of investments in our consolidated statement of operations for the year ended December 31, 2010.
At December 31, 2011, ourOur ARPSs Call Option is reported at an amount that reflects our current estimate of fair value. The ARPSs Call Option, which expired on January 7, 2013, had a fair value of zero as of December 31, 2012. As of December 31, 2011, the ARPSs Call Option had an estimated fair value of $0.3 million, and was included in our prepaid expenses and other current assets in our consolidated balance sheet. To estimate the value of our ARPSs Call Option as of December 31, 2011, we used inputs defined by ASC Topic 820 as level 3 inputs, which are significant unobservable inputs. The fair value of the ARPSs Call Option was estimated using a modified Black-Scholes model, based on an analysis of recent historical transactions for securities with similar characteristics to the underlying ARPSs, and an analysis of the probability that the options would be exercisable as a result of the underlying ARPSs being redeemed or traded in a secondary market at an amount greater than the option price before the expiration date. As of December 31, 2011, the ARPSs Call Option had an estimated fair value of $0.3 million, and was included in our other long-term assets in our consolidated balance sheet. Future changes in the fair values of the ARPSs Call Option will be reflected in other income (expense) in our consolidated statements of operations.
The fair value of our long-term debt at December 31, 20112012 and 20102011 is estimated using a discounted cash flow analysis, based on rates that we believe we would currently pay for similar types of debt instruments. This discounted cash flow analysis is based on inputs defined by ASC Topic 820 as level 2 inputs, which are observable inputs for similar types of debt instruments represents level 2 inputs as defined by ASC Topic 820.instruments. The following table presents the supplemental fair value information about long-term debt at December 31, 20112012 and 20102011 (amounts in thousands):
|
| | | | | | | | | | | | | | | |
| | December 31, 2011 | | December 31, 2010 |
| | Carrying Amount | | Fair Value | | Carrying Amount | | Fair Value |
| Total debt | $ | 419,600 |
| | $ | 443,309 |
| | $ | 280,938 |
| | $ | 308,630 |
|
|
| | | | | | | | | | | | | | | |
| | December 31, 2012 | | December 31, 2011 |
| | Carrying Amount | | Fair Value | | Carrying Amount | | Fair Value |
| Total debt | $ | 519,597 |
| | $ | 565,257 |
| | $ | 419,600 |
| | $ | 443,309 |
|
| |
| 7. | Earnings (loss) Per Common Share |
The following table presents a reconciliation of the numerators and denominators of the basic income (loss) per share and diluted income (loss) per share computations (amounts in thousands, except per share data):
| | | | Year ended December 31, | Year ended December 31, |
| | 2011 | | 2010 | | 2009 | 2012 | | 2011 | | 2010 |
| Basic | | | | | | | | | | |
| Net income (loss) | $ | 11,177 |
| | $ | (33,261 | ) | | $ | (23,215 | ) | $ | 30,032 |
| | $ | 11,177 |
| | $ | (33,261 | ) |
| Weighted-average shares | 57,390 |
| | 53,797 |
| | 50,313 |
| 61,780 |
| | 57,390 |
| | 53,797 |
|
| Income (loss) per share | $ | 0.19 |
| | $ | (0.62 | ) | | $ | (0.46 | ) | $ | 0.49 |
| | $ | 0.19 |
| | $ | (0.62 | ) |
| Diluted | | | | | | | | | | |
| Net income (loss) | $ | 11,177 |
| | $ | (33,261 | ) | | $ | (23,215 | ) | $ | 30,032 |
| | $ | 11,177 |
| | $ | (33,261 | ) |
| Effect of dilutive securities | — |
| | — |
| | — |
| |
| Net income (loss) available to common shareholders after assumed conversion | $ | 11,177 |
| | $ | (33,261 | ) | | $ | (23,215 | ) | |
| Weighted average shares: | | | | | | | | | | |
| Outstanding | 57,390 |
| | 53,797 |
| | 50,313 |
| 61,780 |
| | 57,390 |
| | 53,797 |
|
| Diluted effect of stock options, restricted stock, and restricted stock unit awards | 1,389 |
| | — |
| | — |
| 982 |
| | 1,389 |
| | — |
|
| | 58,779 |
| | 53,797 |
| | 50,313 |
| 62,762 |
| | 58,779 |
| | 53,797 |
|
| Income (loss) per share | $ | 0.19 |
| | $ | (0.62 | ) | | $ | (0.46 | ) | $ | 0.48 |
| | $ | 0.19 |
| | $ | (0.62 | ) |
OutstandingPotentially dilutive stock options, restricted stock and restricted stock unit awards representing a total of 852,3704,311,645, 2,430,141 and 279,9493,584,055 shares of common stock for the years ending December 31, 2012, 2011 and 2010, respectively, were excluded from the computation of diluted loss per share calculations for the years ended December 31, 2010 and 2009, respectively, because the effect ofweighted average shares outstanding due to their inclusion would be antidilutive.antidilutive effect.
| |
| 8. | Equity Transactions and Stock Based Compensation Plans |
Equity Transactions
OnIn November 10, 2009, we sold 3,820,000 shares of our common stock at $6.75 per share, less underwriters’ commissions, pursuant to a public offering under our $300 million shelf registration statement filed in July 2009.
On July 20, 2011, we obtained $94.3 million in net proceeds when we soldfrom the sale of 6,900,000 shares of our common stock at $14.50 per share, less underwriters’ commissions and other offering costs, pursuant to a public offering under ourthe shelf registration statement which we filed in July 2009.
In May 2012, we filed a registration statement that permits us to sell equity or debt in one or more offerings up to a total dollar amount of $300 million shelf registration statement. The remaining availability under. As of January 31, 2013, the entire $300 million under the shelf registration statement is available for equity or debt offerings. In the future, we may consider equity or debt offerings, is $174.2 million.as appropriate, to meet our liquidity needs.
Stock-based Compensation Plans
We have stock basedstock-based award plans that are administered by the Compensation Committee of our Board of Directors, which selects persons eligible to receive awards and determines the number of stock options, restricted stock, or restricted stock units subject to each award and the terms, conditions and other provisions of the awards. Total shares available for future stock option grants, restricted stock grants, and restricted stock unit grants to employees and directors under existing plans were 2,020,8891,098,074 at December 31, 20112012. Of the total shares available, no more than 882,903219,147 shares may be granted in the form of restricted stock.
We grant stock option and restricted stock awards with vesting based on time of service conditions and weconditions. We also grant restricted stock unit awards with vesting based on time of service conditions, and in certain cases, subject to performance and market conditions. We recognize compensation cost for stock option, restricted stock and restricted stock unit awards based on the fair value estimated in accordance with ASC Topic 718, Compensation—Stock Compensation. For our awards with graded vesting,
we recognize compensation expense on a straight-line basis over the service period for each separately vesting portion of the award as if the award was, in substance, multiple awards.
Prior to 2010, we granted stock-based compensation in the form of stock option awards and restricted stock awards with vesting based solely on time of service conditions. In 2010, we continued to grant stock option awards with vesting based on time of service conditions and we began granting restricted stock unit awards with vesting based on time of service conditions, and in certain cases, performance conditions. We recognize compensation cost for stock option, restricted stock and restricted stock unit awards based on the grant-date fair value estimated in accordance with ASC Topic 718, and utilizing the graded vesting method.
Stock Options
We grant stock option awards which generally become exercisable over a three-year period and expire ten years after the date of grant. Our stock-based compensation plans providerequire that all stock option awards must have an exercise price that is not less than the fair market value of our common stock on the date of grant. We issue shares of our common stock when vested stock option awards are exercised.
We estimate the fair value of each option grant on the date of grant using a Black-Scholes options-pricing model. The following table summarizes the assumptions used in the Black-Scholes option-pricing model based on a weighted-average calculation for the years ended December 31, 20112012, 20102011 and 20092010:
| | | | Year ended December 31, | Year ended December 31, |
| | 2011 | | 2010 | | 2009 | 2012 | | 2011 | | 2010 |
| Expected volatility | 65 | % | | 62 | % | | 58 | % | 70 | % | | 65 | % | | 62 | % |
| Risk-free interest rates | 1.5 | % | | 2.6 | % | | 2.1 | % | 0.8 | % | | 1.5 | % | | 2.6 | % |
| Expected life in years | 4.33 |
| | 5.61 |
| | 5.48 |
| 5.12 |
| | 4.33 |
| | 5.61 |
|
| Grant-date fair value | $4.69 | | $4.91 | | $2.09 | $5.02 | | $4.69 | | $4.91 |
The assumptions above are based on multiple factors, including historical exercise patterns of homogeneous groups with respect to exercise and post-vesting employment termination behaviors, expected future exercising patterns for these same homogeneous groups and volatility of our stock price. As we have not declared dividends since we became a public company, we did not use a dividend yield. In each case, the actual value that will be realized, if any, will depend on the future performance of our common stock and overall stock market conditions. There is no assurance the value an optionee actually realizes will be at or near the value we have estimated using the Black-Scholes options-pricing model.
The following table represents stock option activity from December 31, 20092010 through December 31, 20112012:
|
| | | | | |
| | Number of Shares | | Weighted-Average Exercise Price Per Share | | Weighted-Average Remaining Contract Life in Years |
| Outstanding stock options as of December 31, 2009 | 5,055,613 | | $10.17 | | |
| Granted | 787,200 | | 8.64 | | |
| Forfeited | (90,634) | | 12.84 | | |
| Exercised | (63,900) | | 3.73 | | |
| Outstanding stock options as of December 31, 2010 | 5,688,279 | | $9.98 | | |
| Granted | 602,298 | | 9.05 | | |
| Forfeited | (210,184) | | 12.41 | | |
| Exercised | (517,045) | | 5.58 | | |
| Outstanding stock options as of December 31, 2011 | 5,563,348 | | $10.20 | | 6.3 |
| Stock options exercisable as of December 31, 2011 | 4,032,111 | | $11.27 | | 5.6 |
The following table summarizes the compensation expense recognized for stock option awards during the years ended December 31, 2011, 2010 and 2009 (amounts in thousands):
|
| | | | | | | | | | | |
| | Year ended December 31, |
| | 2011 | | 2010 | | 2009 |
| General and administrative expense | $ | 3,483 |
| | $ | 4,047 |
| | $ | 4,290 |
|
| Operating costs | 237 |
| | 500 |
| | 971 |
|
| | $ | 3,720 |
| | $ | 4,547 |
| | $ | 5,261 |
|
|
| | | | | |
| | Number of Shares | | Weighted-Average Exercise Price Per Share | | Weighted-Average Remaining Contract Life in Years |
| Outstanding stock options as of December 31, 2010 | 5,688,279 | | $9.98 | | |
| Granted | 602,298 | | 9.05 | | |
| Forfeited | (210,184) | | 12.41 | | |
| Exercised | (517,045) | | 5.58 | | |
| Outstanding stock options as of December 31, 2011 | 5,563,348 | | $10.20 | | |
| Granted | 530,156 | | 8.72 | | |
| Forfeited | (271,097) | | 13.60 | | |
| Exercised | (172,416) | | 4.02 | | |
| Outstanding stock options as of December 31, 2012 | 5,649,991 | | $10.09 | | 5.8 |
| Stock options exercisable as of December 31, 2012 | 4,519,147 | | $10.41 | | 5.1 |
At December 31, 20112012, the aggregate intrinsic value of stock options outstanding was $10.14.6 million and the aggregate intrinsic value of stock options exercisable was $6.54.5 million. Intrinsic value is the difference between the exercise price of a stock option and the closing market price of our common stock, which was $9.687.26 on December 31, 20112012.
The following table summarizes our nonvested stock option activity from December 31, 2009 through December 31, 2011:
|
| | | |
| | Number of Shares | | Weighted-Average Grant-Date Fair Value Per Share |
| Nonvested stock options as of December 31, 2009 | 2,537,474 | | $3.65 |
| Granted | 787,200 | | 4.91 |
| Vested | (1,115,991) | | 4.19 |
| Forfeited | (24,000) | | 3.34 |
| Nonvested stock options as of December 31, 2010 | 2,184,683 | | $3.83 |
| Granted | 602,298 | | 4.69 |
| Vested | (1,154,360) | | 4.03 |
| Forfeited | (101,384) | | 4.34 |
| Nonvested stock options as of December 31, 2011 | 1,531,237 | | $3.98 |
At December 31, 2011, there was $1.6 million of unrecognized compensation cost relating to stock options which are expected to be recognized over a weighted-average period of 1.2 years.
We receive a tax deduction for certain stock option exercises during the period the options are exercised, generally for the excess of the fair market value of our stock on the date of exercise over the exercise price of the options. In accordance with ASC Topic 718, we reported all excess tax benefits resulting from the exercise of stock options as financing cash flows in our consolidated statement of cash flows.
The following table summarizes our nonvested stock option activity from December 31, 2010 through December 31, 2012:
|
| | | |
| | Number of Shares | | Weighted-Average Grant-Date Fair Value Per Share |
| Nonvested stock options as of December 31, 2010 | 2,184,683 | | $3.83 |
| Granted | 602,298 | | 4.69 |
| Vested | (1,154,360) | | 4.03 |
| Forfeited | (101,384) | | 4.34 |
| Nonvested stock options as of December 31, 2011 | 1,531,237 | | $3.98 |
| Granted | 530,156 | | 5.02 |
| Vested | (901,817) | | 3.42 |
| Forfeited | (28,732) | | 4.74 |
| Nonvested stock options as of December 31, 2012 | 1,130,844 | | $4.89 |
The following table summarizes the compensation expense recognized for stock option awards during the years ended December 31, 2012, 2011 and 2010 (amounts in thousands):
|
| | | | | | | | | | | |
| | Year ended December 31, |
| | 2012 | | 2011 | | 2010 |
| General and administrative expense | $ | 2,913 |
| | $ | 3,483 |
| | $ | 4,047 |
|
| Operating costs | 49 |
| | 237 |
| | 500 |
|
| | $ | 2,962 |
| | $ | 3,720 |
| | $ | 4,547 |
|
At December 31, 2012, there was $1.5 million of unrecognized compensation cost relating to stock options which is expected to be recognized over a weighted-average period of 0.7 years.
In January 20122013, our Board of Directors approved the grant of stock options representing 470,656220,656 shares of common stock to officers and employees that will vest over a three-year period.
Restricted Stock
We grant restricted stock awards that vest over a three-year period with a fair value based on the closing price of our common stock on the date of the grant. When restricted stock awards are granted, or when RSUrestricted stock unit awards are converted to restricted stock, shares of our common stock are considered issued, but subject to certain restrictions.
The following table summarizes our restricted stock activity from December 31, 20092010 through December 31, 20112012:
| | | | Number of Shares | | Weighted-Average Grant-Date Fair Value per Share | Number of Shares | | Weighted-Average Grant-Date Fair Value per Share |
| Nonvested restricted stock as of December 31, 2009 | 427,358 | | $7.48 | |
| Granted | 66,224 | | 6.04 | |
| Vested | (160,223) | | 8.52 | |
| Forfeited | (3,700) | | 9.20 | |
| Nonvested restricted stock as of December 31, 2010 | 329,659 | | $6.66 | 329,659 | | $6.66 |
| Granted | 32,360 | | 12.36 | 32,360 | | 12.36 |
| Converted from restricted stock units | 166,918 | | 8.86 | 166,918 | | 8.86 |
| Vested | (233,061) | | 8.25 | (233,061) | | 8.25 |
| Forfeited | (14,040) | | 9.16 | (14,040) | | 9.16 |
| Nonvested restricted stock as of December 31, 2011 | 281,836 | | $7.18 | 281,836 | | $7.18 |
| Granted | | 49,748 | | 8.04 |
| Vested | | (184,081) | | 6.21 |
| Forfeited | | (4,683) | | 8.86 |
| Nonvested restricted stock as of December 31, 2012 | | 142,820 | | $8.67 |
The following table summarizes the compensation expense recognized for restricted stock awards during the years ended December 31, 20112012, 20102011 and 20092010 (amounts in thousands):
| | | | Year ended December 31, | Year ended December 31, |
| | 2011 | | 2010 | | 2009 | 2012 | | 2011 | | 2010 |
| General and administrative expense | $ | 941 |
| | $ | 1,119 |
| | $ | 1,641 |
| $ | 606 |
| | $ | 941 |
| | $ | 1,119 |
|
| Operating costs | 89 |
| | 145 |
| | 314 |
| 22 |
| | 89 |
| | 145 |
|
| | $ | 1,030 |
| | $ | 1,264 |
| | $ | 1,955 |
| $ | 628 |
| | $ | 1,030 |
| | $ | 1,264 |
|
At December 31, 20112012, there was $0.60.4 million of unrecognized compensation cost relating to restricted stock awards which areis expected to be recognized over a weighted-average period of 0.91.0 years.
Restricted Stock Units
We grant restricted stock unit awards with vesting based on time of service conditions only (“time-based RSUs”), and we grant restricted stock unit awards with vesting based on time of service, which are also subject to performance and market conditions (“performance-based RSUs”). Shares of our common stock are issued to recipients of restricted stock units only when they have satisfied the applicable vesting conditions.
Our time-based RSUs generally vest over a three-year period, with fair values based on the closing price of our common stock on the date of grant. Our performance-based RSUs are granted at a target number of issuable shares, for which the final number of shares of common stock is adjusted based on our actual achievement levels that are measured against predetermined performance conditions.
Performance-based RSUs granted during2012 and 2011 will cliff vest after 39 months from the date of grant. The number of shares of common stock awarded will be based upon the Company’s achievement in certain performance conditions, as compared to a predefined peer group, over the three-year performance period from January 1, 2011 through December 31, 2013.period. Approximately one-third of the performance-based RSUs are subject to a market condition, and therefore the fair value of these awards is measured using a Monte Carlo simulation model. Compensation expense for awards with a market condition is reduced only for estimated forfeitures; no adjustment to expense is otherwise made, regardless of the number of shares issued, if any. The remaining two-thirds of the performance-based RSUs are subject to performance conditions, and therefore the fair value is based on the closing price of our common stock on the date of grant, applied to the estimated number of shares that will be awarded. Compensation expense ultimately recognized for awards with performance conditions will be equal to the fair value of the restricted stock unit award based on the actual outcome of the service and performance conditions. As of December 31, 20112012, we estimated that our actual achievement level will be approximately 150% of the predetermined performance conditions. Therefore, the outstanding 139,089355,051 restricted stock units would be adjusted to represent 185,452532,577 shares of our common stock.
Performance-based RSUs granted during 2010 have a fair value that is based on the closing price of our common stock on the date of grant. Compensation cost ultimately recognized will be equal to the fair value of the restricted stock unit award based on the actual outcome of the service and performance conditions. In April 2011, we determined that 166,918 shares, or 86.7% of the target number of shares net of forfeitures, were earned based on the Company’s achievement of certain performance measures, as compared to the predefined peer group, over the performance period from January 1, 2008 through December 31, 2010. After the earned number of shares was determined, the performance-based RSUs were converted to 166,918 shares of restricted stock, subject to graded vesting over a three-year period. The first tranche of 55,618 shares vested in April 2011.
The following table summarizes our restricted stock unit activity duringfrom 2011December 31, 2010 andthrough 2010December 31, 2012:
| | | | Time-Based Award | | Performance-Based Award | Time-Based Award | | Performance-Based Award |
| | Number of Time-Based Award Units | | Weighted-Average Grant-Date Fair Value per Unit | | Number of Performance-Based Award Units | | Weighted-Average Grant-Date Fair Value per Unit | Number of Time-Based Award Units | | Weighted-Average Grant-Date Fair Value per Unit | | Number of Performance-Based Award Units | | Weighted-Average Grant-Date Fair Value per Unit |
| Nonvested restricted stock units as of December 31, 2009 | — |
| | — |
| | — |
| | — |
| |
| Granted | 72,120 |
| | 8.86 | | 194,680 |
| | 8.86 | |
| Forfeited | (5,040) |
| | 8.86 | | (2,160) |
| | 8.86 | |
| Nonvested restricted stock units as of December 31, 2010 | 67,080 |
| | $8.86 | | 192,520 |
| | $8.86 | 67,080 |
| | $8.86 | | 192,520 |
| | $8.86 |
| Granted | 251,023 |
| | 11.19 | | 146,479 |
| | 10.23 | 251,023 |
| | 11.19 | | 146,479 |
| | 10.23 |
| Vested | (22,656) |
| | 8.92 | | — |
| | — |
| (22,656) |
| | 8.92 |
| | — |
| | — |
|
| Converted to restricted stock | — |
| | — |
| | (192,520) |
| | 8.86 | — |
| | — |
| | (192,520) |
| | 8.86 |
| Forfeited | (22,496) |
| | 11.74 | | (7,390) |
| | 10.23 | (22,496) |
| | 11.74 | | (7,390) |
| | 10.23 |
| Nonvested restricted stock units as of December 31, 2011 | 272,951 |
| | $10.76 | | 139,089 |
| | $10.23 | 272,951 |
| | $10.76 | | 139,089 |
| | $10.23 |
| Granted | | 356,813 |
| | 8.21 | | 221,495 |
| | 9.85 |
| Vested | | (72,259) |
| | 10.07 | | — |
| | — |
|
| Converted to restricted stock | | — |
| | — |
| | — |
| | — |
|
| Forfeited | | (25,979) |
| | 10.34 | | (5,533) |
| | 10.23 |
| Nonvested restricted stock units as of December 31, 2012 | | 531,526 |
| | $9.16 | | 355,051 |
| | $9.99 |
The following table summarizes the compensation expense recognized for restricted stock unit awards during the years ended December 31, 2012, 2011 and 2010 (amounts in thousands):
| | | | Year ended December 31, | Year ended December 31, |
| | 2011 | | 2010 | 2012 | | 2011 | | 2010 |
| General and administrative expense | $ | 1,637 |
| | $ | 748 |
| $ | 3,318 |
| | $ | 1,637 |
| | $ | 748 |
|
| Operating costs | 318 |
| | 116 |
| 411 |
| | 318 |
| | 116 |
|
| | $ | 1,955 |
| | $ | 864 |
| $ | 3,729 |
| | $ | 1,955 |
| | $ | 864 |
|
At December 31, 20112012, there was $2.64.3 million of unrecognized compensation cost relating to restricted stock unit awards which areis expected to be recognized over a weighted-average period of 1.71.3 years.
In January 20122013, our Board of Directors approved the grant of restricted stock units representing 407,448191,974 shares of common stock to officers and employees that will vest over a three-year period.
| |
| 9. | Employee Benefit Plans and Insurance |
We maintain a 401(k) retirement plan for our eligible employees. Under this plan, we may make a matching contribution, on a discretionary basis, equal to a percentage of each eligible employee’s annual contribution, which we determine annually. Our matching contributions for the years ended December 31, 20112012, 20102011 and 20092010 were $2.64.6 million, $0.92.6 million and $0.70.9 million, respectively.
We maintain a self-insurance program, for major medical and hospitalization coverage for employees and their dependents, which is partially funded by employee payroll deductions. We have provided for both reported andclaims costs as well as incurred but not reported medical costs in the accompanying consolidated balance sheets. We have a maximum liability of $150,000 per employee/dependentcovered individual per year. Amounts in excess of the stated maximum are covered under a separate policy provided by an insurance company. Insurance premiums and deductibles accruals at December 31, 20112012 and 20102011 include $1.92.5 million and $1.51.9 million, respectively, for our estimate of incurred but unpaid costs related to the self-insurance portion of our health insurance.
We are self-insured for up to $500,000 per incident for all workers’ compensation claims submitted by employees for on-the-job injuries. We have a deductible of $250,000 per occurrence under both our general liability insurance and auto liability insurance. We accrue our workers’ compensation claim cost estimates based on historical claims development data and we accrue the cost of administrative services associated with claims processing. Insurance premiums and deductibles accruals at December 31, 20112012 and 20102011 include $6.56.1 million and $6.66.5 million, respectively, for our estimate of costs relative to the self-insured portion of our workers’ compensation, general liability and auto liability insurance. Based upon our past experience, management believes that we have adequately provided for potential losses. However, future multiple occurrences of serious injuries to employees could have a material adverse effect on our financial position and results of operations.
We have two operating segments referred to as the Drilling Services DivisionSegment and the Production Services DivisionSegment which is the basis management uses for making operating decisions and assessing performance.
Drilling Services Division—Segment—Our Drilling Services DivisionSegment provides contract land drilling services to a diverse group of oil and gas exploration and production companies with its fleet of 6470 drilling rigs thatwhich are currently assigned to the following locations:divisions:
|
| | | |
Drilling Division Locations | | Rig Count |
| South Texas | | 1514 |
|
| East Texas | | 54 |
|
| West Texas | | 1823 |
|
| North Dakota | | 912 |
|
| Utah | | 45 |
|
| Appalachia | | 54 |
|
| Colombia | | 8 |
|
| | 70 |
|
Production Services DivisionSegment—Our Production Services DivisionSegment provides a range of services to oil and gas exploration and production companies, including well servicing, wireline services, wireline, coiled tubing services, and fishing and rental services. Our production services operations are managed through locations concentrated in the major United States onshore oil and gas producing regions in the Mid-Continent and Rocky Mountain states and in the Gulf Coast, Mid-Continent, Rocky Mountainboth onshore and Appalachian states.offshore. We currently have a premium fleet of 91108 well serviceservicing rigs consisting of eighty-oneninety-eight 550 horsepower rigs and nineten 600 horsepower rigs and one 400 horsepower rig.rigs. We currently provide wireline services and coiled tubing services with a fleet of 109120 wireline units and ten13 wireline and coiled tubing units, respectively, and we provide rental services with approximately $15.116.1 million of fishing and rental tools.
The following tables set forth certain financial information for our two operating segments and corporate as of and for the years ended ending December 31, 20112012, 20102011 and 20092010 (amounts in thousands):
| | | | As of and for the year ended December 31, 2011 | As of and for the year ended December 31, 2012 |
| | Drilling Services Division | | Production Services Division | | Corporate | | Total | Drilling Services Segment | | Production Services Segment | | Corporate | | Total |
| Identifiable assets | $ | 667,588 |
| | $ | 398,128 |
| | $ | 107,038 |
| | $ | 1,172,754 |
| $ | 867,526 |
| | $ | 439,113 |
| | $ | 33,137 |
| | $ | 1,339,776 |
|
| Revenues | $ | 433,902 |
| | $ | 282,039 |
| | $ | — |
| | $ | 715,941 |
| $ | 498,867 |
| | $ | 420,576 |
| | $ | — |
| | $ | 919,443 |
|
| Operating costs | 292,559 |
| | 164,365 |
| | — |
| | 456,924 |
| 333,846 |
| | 252,775 |
| | — |
| | 586,621 |
|
| Segment margin | $ | 141,343 |
| | $ | 117,674 |
| | $ | — |
| | $ | 259,017 |
| $ | 165,021 |
| | $ | 167,801 |
| | $ | — |
| | $ | 332,822 |
|
| Depreciation and amortization | $ | 99,302 |
| | $ | 32,683 |
| | $ | 847 |
| | $ | 132,832 |
| $ | 108,151 |
| | $ | 55,693 |
| | $ | 873 |
| | $ | 164,717 |
|
| Capital expenditures | $ | 168,120 |
| | $ | 68,908 |
| | $ | 759 |
| | $ | 237,787 |
| $ | 265,966 |
| | $ | 110,813 |
| | $ | 2,493 |
| | $ | 379,272 |
|
| | | | As of and for the year ended December 31, 2010 | As of and for the year ended December 31, 2011 |
| | Drilling Services Division | | Production Services Division | | Corporate | | Total | Drilling Services Segment | | Production Services Segment | | Corporate | | Total |
| Identifiable assets | $ | 542,242 |
| | $ | 261,777 |
| | $ | 37,324 |
| | $ | 841,343 |
| $ | 667,588 |
| | $ | 398,128 |
| | $ | 107,038 |
| | $ | 1,172,754 |
|
| Revenues | $ | 312,196 |
| | $ | 175,014 |
| | $ | — |
| | $ | 487,210 |
| $ | 433,902 |
| | $ | 282,039 |
| | $ | — |
| | $ | 715,941 |
|
| Operating costs | 227,136 |
| | 105,295 |
| | — |
| | 332,431 |
| 292,559 |
| | 164,365 |
| | — |
| | 456,924 |
|
| Segment margin | $ | 85,060 |
| | $ | 69,719 |
| | $ | — |
| | $ | 154,779 |
| $ | 141,343 |
| | $ | 117,674 |
| | $ | — |
| | $ | 259,017 |
|
| Depreciation and amortization | $ | 92,800 |
| | $ | 26,740 |
| | $ | 1,271 |
| | $ | 120,811 |
| $ | 99,302 |
| | $ | 32,683 |
| | $ | 847 |
| | $ | 132,832 |
|
| Capital expenditures | $ | 109,261 |
| | $ | 25,411 |
| | $ | 479 |
| | $ | 135,151 |
| $ | 168,120 |
| | $ | 68,908 |
| | $ | 759 |
| | $ | 237,787 |
|
| | | | As of and for the year ended December 31, 2009 | As of and for the year ended December 31, 2010 |
| | Drilling Services Division | | Production Services Division | | Corporate | | Total | Drilling Services Segment |
| | Production Services Segment |
| | Corporate | | Total |
| Identifiable assets | $ | 536,858 |
| | $ | 234,920 |
| | $ | 53,177 |
| | $ | 824,955 |
| $ | 542,242 |
| | $ | 261,777 |
| | $ | 37,324 |
| | $ | 841,343 |
|
| Revenues | $ | 219,751 |
| | $ | 105,786 |
| | $ | — |
| | $ | 325,537 |
| $ | 312,196 |
| | $ | 175,014 |
| | $ | — |
| | $ | 487,210 |
|
| Operating costs | 147,343 |
| | 68,012 |
| | — |
| | 215,355 |
| 227,136 |
| | 105,295 |
| | — |
| | 332,431 |
|
| Segment margin | $ | 72,408 |
| | $ | 37,774 |
| | $ | — |
| | $ | 110,182 |
| $ | 85,060 |
| | $ | 69,719 |
| | $ | — |
| | $ | 154,779 |
|
| Depreciation and amortization | $ | 81,078 |
| | $ | 23,893 |
| | $ | 1,215 |
| | $ | 106,186 |
| $ | 92,800 |
| | $ | 26,740 |
| | $ | 1,271 |
| | $ | 120,811 |
|
| Capital expenditures | $ | 94,887 |
| | $ | 15,162 |
| | $ | 404 |
| | $ | 110,453 |
| $ | 109,261 |
| | $ | 25,411 |
| | $ | 479 |
| | $ | 135,151 |
|
The following table reconciles the segment profits reported above to income from operations as reported on the consolidated statements of operations for the years ended December 31, 20112012, 20102011 and 20092010 (amounts in thousands):
| | | | Year ended December 31, | Year ended December 31, |
| | 2011 | | 2010 | | 2009 | 2012 | | 2011 | | 2010 |
| Segment margin | $ | 259,017 |
| | $ | 154,779 |
| | $ | 110,182 |
| $ | 332,822 |
| | $ | 259,017 |
| | $ | 154,779 |
|
| Depreciation and amortization | (132,832 | ) | | (120,811 | ) | | (106,186 | ) | (164,717 | ) | | (132,832 | ) | | (120,811 | ) |
| General and administrative | (67,318 | ) | | (52,047 | ) | | (37,478 | ) | (85,603 | ) | | (67,318 | ) | | (52,047 | ) |
| Bad debt (expense) recovery | (925 | ) | | (493 | ) | | 1,642 |
| |
| Bad debt recovery (expense) | | 440 |
| | (925 | ) | | (493 | ) |
| Impairment of equipment | (484 | ) | | — |
| | — |
| (1,131 | ) | | (484 | ) | | — |
|
| Income (loss) from operations | $ | 57,458 |
| | $ | (18,572 | ) | | $ | (31,840 | ) | $ | 81,811 |
| | $ | 57,458 |
| | $ | (18,572 | ) |
The following table sets forth certain financial information for our international operations in Colombia as of and for the years ended December 31, 20112012, 20102011 and 20092010 which is included in our Drilling Services Division (amounts in thousands):
| | | | As of and for the years ended December 31, | As of and for the year ended December 31, |
| | 2011 | | 2010 | | 2009 | 2012 | | 2011 | | 2010 |
| Identifiable assets | $ | 151,448 |
| | $ | 157,509 |
| | $ | 120,319 |
| $ | 148,567 |
| | $ | 151,448 |
| | $ | 157,509 |
|
| Revenues | $ | 109,539 |
| | $ | 86,432 |
| | $ | 56,617 |
| $ | 95,338 |
| | $ | 109,539 |
| | $ | 86,432 |
|
Identifiable assets as of December 31, 2011 and 2010for our international operations in Colombia include five drilling rigs that are owned by our Colombia subsidiary and three drilling rigs that are owned by one of our domestic subsidiaries and leased to our Colombia subsidiary. As of December 31, 2009, identifiable assets include five drilling rigs that are owned by our Colombia subsidiary and one drilling rig that is owned by one of our domestic subsidiaries and leased to our Colombia subsidiary.
| |
| 11. | Commitments and Contingencies |
In connection with our expansion into international markets,operations in Colombia, our foreign subsidiaries have obtained bonds for bidding on drilling contracts, performing under drilling contracts, and remitting customs and importation duties. We have guaranteed payments of $54.938.8 million relating to our performance under these bonds.
The Colombian government enacted a tax reform act which, among other things, adopted a one-time, net-worth tax for all Colombian entities, which was assessed on January 1, 2011 and is payable in eight semi-annual installments from 2011 through 2014. Based on our Colombian operations’ net equity, measured on a Colombian tax basis as of January 1, 2011, our total net-worth tax obligation is approximately $7.3 million, which is not deductible for tax purposes. We recognized this tax obligation in full during the first quarter of 2011 in other expense in our condensed consolidated statement of operations, andoperations. As of December 31, 2012, we have a remaining obligation of $3.8 million, which is recorded in other accrued expenses and other long-term liabilities on our consolidated balance sheet as of December 31, 2011. As of December 31, 2011, the remaining obligation is $5.3 million.sheet.
Due to the nature of our business, we are, from time to time, involved in litigation or subject to disputes or claims related to our business activities, including workers’ compensation claims and employment-related disputes. Legal costs relating to these matters are expensed as incurred. In the opinion of our management, none of the pending litigation, disputes or claims against us will have a material adverse effect on our financial condition, results of operations or cash flow from operations.
| |
| 12. | Quarterly Results of Operations (unaudited) |
The following table summarizes quarterly financial data for the years ended December 31, 20112012 and 20102011 (in thousands, except per share data):
| | | | | First Quarter | | Second Quarter | | Third Quarter | | Fourth Quarter | | Total |
| Year ended December 31, 2012 | | | | | | | | | | |
| Revenues | | $ | 231,978 |
| | $ | 229,824 |
| | $ | 229,773 |
| | $ | 227,868 |
| | $ | 919,443 |
|
| Income from operations | | 29,748 |
| | 23,312 |
| | 13,222 |
| | 15,529 |
| | 81,811 |
|
| Income tax (expense) benefit | | (6,953 | ) | | (5,997 | ) | | (1,461 | ) | | (1,943 | ) | | (16,354 | ) |
| Net income (loss) | | 14,172 |
| | 9,685 |
| | 2,615 |
| | 3,560 |
| | 30,032 |
|
| Earnings (loss) per share: | | | | | | | | | | |
| Basic | | $ | 0.23 |
| | $ | 0.16 |
| | $ | 0.04 |
| | $ | 0.06 |
| | $ | 0.49 |
|
| Diluted | | $ | 0.23 |
| | $ | 0.15 |
| | $ | 0.04 |
| | $ | 0.06 |
| | $ | 0.48 |
|
| Year ended December 31, 2011 | First Quarter | | Second Quarter | | Third Quarter | | Fourth Quarter | | Total | | | | | | | | | |
| Revenues | $ | 153,349 |
| | $ | 171,285 |
| | $ | 187,651 |
| | $ | 203,656 |
| | $ | 715,941 |
| $ | 153,349 |
| | $ | 171,285 |
| | $ | 187,651 |
| | $ | 203,656 |
| | $ | 715,941 |
|
| Income from operations | 5,919 |
| | 11,918 |
| | 19,324 |
| | 20,297 |
| | 57,458 |
| 5,919 |
| | 11,918 |
| | 19,324 |
| | 20,297 |
| | 57,458 |
|
| Income tax (expense) benefit | 2,102 |
| | (1,039 | ) | | (5,250 | ) | | (5,469 | ) | | (9,656 | ) | 2,102 |
| | (1,039 | ) | | (5,250 | ) | | (5,469 | ) | | (9,656 | ) |
| Net income (loss) | (6,035 | ) | | 3,650 |
| | 6,744 |
| | 6,818 |
| | 11,177 |
| (6,035 | ) | | 3,650 |
| | 6,744 |
| | 6,818 |
| | 11,177 |
|
| Earnings (loss) per share: | | | | | | | | | | | | | | | | | | |
| Basic | $ | (0.11 | ) | | $ | 0.07 |
| | $ | 0.11 |
| | $ | 0.11 |
| | $ | 0.19 |
| $ | (0.11 | ) | | $ | 0.07 |
| | $ | 0.11 |
| | $ | 0.11 |
| | $ | 0.19 |
|
| Diluted | $ | (0.11 | ) | | $ | 0.07 |
| | $ | 0.11 |
| | $ | 0.11 |
| | $ | 0.19 |
| $ | (0.11 | ) | | $ | 0.07 |
| | $ | 0.11 |
| | $ | 0.11 |
| | $ | 0.19 |
|
| Year ended December 31, 2010 | | | | | | | | | | |
| Revenues | $ | 86,021 |
| | $ | 117,027 |
| | $ | 135,544 |
| | $ | 148,618 |
| | $ | 487,210 |
| |
| Income (loss) from operations | (20,116 | ) | | (7,856 | ) | | 2,536 |
| | 6,864 |
| | (18,572 | ) | |
| Income tax (expense) benefit | 9,159 |
| | 4,498 |
| | 1,612 |
| | (972 | ) | | 14,297 |
| |
| Net loss | (14,547 | ) | | (10,142 | ) | | (2,580 | ) | | (5,992 | ) | | (33,261 | ) | |
| Loss per share: | | | | | | | | | | |
| Basic | $ | (0.27 | ) | | $ | (0.19 | ) | | $ | (0.05 | ) | | $ | (0.11 | ) | | $ | (0.62 | ) | |
| Diluted | $ | (0.27 | ) | | $ | (0.19 | ) | | $ | (0.05 | ) | | $ | (0.11 | ) | | $ | (0.62 | ) | |
| |
| 13. | Guarantor/Non-Guarantor Condensed Consolidated Financial Statements |
Our Senior Notes are fully and unconditionally guaranteed, jointly and severally, on a senior unsecured basis by ourall existing domestic subsidiaries, except for Pioneer Services Holdings, LLC, Go-Coil, LLC, and certain of our future domestic subsidiaries. Effective October 1, 2012, the Indenture was supplemented to add Pioneer Coiled Tubing Services, LLC (formerly Go-Coil, L.L.C.) as a subsidiary guarantor. The subsidiaries that generally operate our non-U.S. business concentrated in Colombia do not guarantee our Senior Notes. The non-guarantor subsidiaries do not have any payment obligations under the Senior Notes, the guarantees or the Indenture.
In the event of a bankruptcy, liquidation or reorganization of any non-guarantor subsidiary, such non-guarantor subsidiary will pay the holders of its debt and other liabilities, including its trade creditors, before it will be able to distribute any of its assets to us. In the future, any non-U.S. subsidiaries, immaterial subsidiaries and subsidiaries that we designate as unrestricted subsidiaries under the Indenture will not guarantee the Senior Notes. As of December 31, 20112012, there were no restrictions on the ability of subsidiary guarantors to transfer funds to the parent company.
As a result of the guarantee arrangements, we are presenting the following condensed consolidated balance sheets, statements of operations and statements of cash flows of the issuer, the guarantor subsidiaries and the non-guarantor subsidiaries.
CONDENSED CONSOLIDATED BALANCE SHEETS
(Unaudited, in thousands)
| | | | December 31, 2011 | December 31, 2012 |
| | Parent | | Guarantor Subsidiaries | | Non-Guarantor Subsidiaries | | Eliminations | | Consolidated | Parent | | Guarantor Subsidiaries | | Non-Guarantor Subsidiaries | | Eliminations | | Consolidated |
| ASSETS | | | | | | | | | | | | | | | | | | |
| Current assets: | | | | | | | | | | | | | | | | | | |
| Cash and cash equivalents | $ | 91,932 |
| | $ | (13,879 | ) | | $ | 8,144 |
| | $ | — |
| | $ | 86,197 |
| $ | 18,479 |
| | $ | (5,401 | ) | | $ | 10,655 |
| | $ | — |
| | $ | 23,733 |
|
| Receivables, net of allowance for doubtful accounts | (2 | ) | | 112,531 |
| | 32,724 |
| | (19 | ) | | 145,234 |
| |
| Receivables, net of allowance | | 440 |
| | 129,570 |
| | 29,128 |
| | (294 | ) | | 158,844 |
|
| Intercompany receivable (payable) | (122,552 | ) | | 131,585 |
| | (9,033 | ) | | — |
| | — |
| (124,516 | ) | | 146,652 |
| | (22,136 | ) | | — |
| | — |
|
| Deferred income taxes | 1,408 |
| | 8,644 |
| | 5,381 |
| | — |
| | 15,433 |
| 869 |
| | 8,162 |
| | 2,027 |
| | — |
| | 11,058 |
|
| Inventory | — |
| | 4,533 |
| | 6,651 |
| | — |
| | 11,184 |
| — |
| | 5,956 |
| | 6,155 |
| | — |
| | 12,111 |
|
| Prepaid expenses and other current assets | 285 |
| | 6,304 |
| | 4,975 |
| | — |
| | 11,564 |
| 655 |
| | 9,163 |
| | 3,222 |
| | — |
| | 13,040 |
|
| Total current assets | (28,929 | ) | | 249,718 |
| | 48,842 |
| | (19 | ) | | 269,612 |
| (104,073 | ) | | 294,102 |
| | 29,051 |
| | (294 | ) | | 218,786 |
|
| Net property and equipment | 1,605 |
| | 675,679 |
| | 117,422 |
| | (750 | ) | | 793,956 |
| 3,474 |
| | 921,393 |
| | 90,223 |
| | (750 | ) | | 1,014,340 |
|
| Investment in subsidiaries | 932,237 |
| | 221,201 |
| | — |
| | (1,153,438 | ) | | — |
| 1,122,814 |
| | 114,416 |
| | — |
| | (1,237,230 | ) | | — |
|
| Intangible assets, net of amortization | 171 |
| | 18,829 |
| | 33,680 |
| | — |
| | 52,680 |
| |
| Intangible assets, net of accumulated amortization | | 68 |
| | 43,775 |
| | — |
| | — |
| | 43,843 |
|
| Goodwill | — |
| | — |
| | 41,683 |
| | — |
| | 41,683 |
| — |
| | 41,683 |
| | — |
| | — |
| | 41,683 |
|
| Noncurrent deferred income taxes | 30,835 |
| | — |
| | 735 |
| | (30,835 | ) | | 735 |
| 51,834 |
| | — |
| | 5,519 |
| | (51,834 | ) | | 5,519 |
|
| Other long-term assets | 11,949 |
| | 2,124 |
| | 15 |
| | — |
| | 14,088 |
| 9,582 |
| | 2,340 |
| | 3,683 |
| | — |
| | 15,605 |
|
| Total assets | $ | 947,868 |
| | $ | 1,167,551 |
| | $ | 242,377 |
| | $ | (1,185,042 | ) | | $ | 1,172,754 |
| $ | 1,083,699 |
| | $ | 1,417,709 |
| | $ | 128,476 |
| | $ | (1,290,108 | ) | | $ | 1,339,776 |
|
| LIABILITIES AND SHAREHOLDERS’ EQUITY | | | | | | | | | | | | | | | | | | |
| Current liabilities: | | | | | | | | | | | | | | | | | | |
| Accounts payable | $ | 1,090 |
| | $ | 57,150 |
| | $ | 8,200 |
| | — |
| | $ | 66,440 |
| $ | 1,558 |
| | $ | 76,828 |
| | $ | 5,437 |
| | — |
| | $ | 83,823 |
|
| Current portion of long-term debt | — |
| | 850 |
| | 22 |
| | — |
| | 872 |
| — |
| | 872 |
| | — |
| | — |
| | 872 |
|
| Prepaid drilling contracts | — |
| | 1,297 |
| | 2,669 |
| | — |
| | 3,966 |
| |
| Deferred revenues | | — |
| | 1,954 |
| | 1,926 |
| | — |
| | 3,880 |
|
| Accrued expenses | 16,779 |
| | 45,012 |
| | 6,631 |
| | (20 | ) | | 68,402 |
| 14,905 |
| | 48,892 |
| | 4,472 |
| | (294 | ) | | 67,975 |
|
| Total current liabilities | 17,869 |
| | 104,309 |
| | 17,522 |
| | (20 | ) | | 139,680 |
| 16,463 |
| | 128,546 |
| | 11,835 |
| | (294 | ) | | 156,550 |
|
| Long-term debt, less current portion | 417,747 |
| | 850 |
| | 131 |
| | — |
| | 418,728 |
| 518,618 |
| | 107 |
| | — |
| | — |
| | 518,725 |
|
| Noncurrent deferred income taxes | 921 |
| | 124,659 |
| | — |
| | (30,835 | ) | | 94,745 |
| (4 | ) | | 160,676 |
| | — |
| | (51,834 | ) | | 108,838 |
|
| Other long-term liabilities | 137 |
| | 5,496 |
| | 3,523 |
| | — |
| | 9,156 |
| 192 |
| | 5,566 |
| | 2,225 |
| | — |
| | 7,983 |
|
| Total liabilities | 436,674 |
| | 235,314 |
| | 21,176 |
| | (30,855 | ) | | 662,309 |
| 535,269 |
| | 294,895 |
| | 14,060 |
| | (52,128 | ) | | 792,096 |
|
| Total shareholders’ equity | 511,194 |
| | 932,237 |
| | 221,201 |
| | (1,154,187 | ) | | 510,445 |
| 548,430 |
| | 1,122,814 |
| | 114,416 |
| | (1,237,980 | ) | | 547,680 |
|
| Total liabilities and shareholders’ equity | $ | 947,868 |
| | $ | 1,167,551 |
| | $ | 242,377 |
| | $ | (1,185,042 | ) | | $ | 1,172,754 |
| $ | 1,083,699 |
| | $ | 1,417,709 |
| | $ | 128,476 |
| | $ | (1,290,108 | ) | | $ | 1,339,776 |
|
| | | | | | | | | | | | | | | | | | | |
| | December 31, 2010 | December 31, 2011 |
| | Parent | | Guarantor Subsidiaries | | Non-Guarantor Subsidiaries | | Eliminations | | Consolidated | Parent | | Guarantor Subsidiaries | | Non-Guarantor Subsidiaries | | Eliminations | | Consolidated |
| ASSETS | | | | | | | | | | | | | | | | | | |
| Current assets: | | | | | | | | | | | | | | | | | | |
| Cash and cash equivalents | $ | 15,737 |
| | $ | (1,840 | ) | | $ | 8,114 |
| | $ | — |
| | $ | 22,011 |
| $ | 91,932 |
| | $ | (13,879 | ) | | $ | 8,144 |
| | $ | — |
| | $ | 86,197 |
|
| Short-term investments | 12,569 |
| | — |
| | — |
| | — |
| | 12,569 |
| |
| Receivables, net of allowance for doubtful accounts | — |
| | 78,575 |
| | 10,940 |
| | — |
| | 89,515 |
| |
| Receivables, net of allowance | | (2 | ) | | 112,531 |
| | 32,724 |
| | (19 | ) | | 145,234 |
|
| Intercompany receivable (payable) | (80,900 | ) | | 80,942 |
| | (42 | ) | | — |
| | — |
| (122,552 | ) | | 131,585 |
| | (9,033 | ) | | — |
| | — |
|
| Deferred income taxes | 178 |
| | 4,167 |
| | 5,522 |
| | — |
| | 9,867 |
| 1,408 |
| | 8,644 |
| | 5,381 |
| | — |
| | 15,433 |
|
| Inventory | — |
| | 2,874 |
| | 6,149 |
| | — |
| | 9,023 |
| — |
| | 4,533 |
| | 6,651 |
| | — |
| | 11,184 |
|
| Prepaid expenses and other current assets | 263 |
| | 4,604 |
| | 3,930 |
| | — |
| | 8,797 |
| 285 |
| | 6,304 |
| | 4,975 |
| | — |
| | 11,564 |
|
| Total current assets | (52,153 | ) | | 169,322 |
| | 34,613 |
| | — |
| | 151,782 |
| (28,929 | ) | | 249,718 |
| | 48,842 |
| | (19 | ) | | 269,612 |
|
| Net property and equipment | 1,601 |
| | 562,390 |
| | 92,267 |
| | (750 | ) | | 655,508 |
| 1,605 |
| | 675,679 |
| | 117,422 |
| | (750 | ) | | 793,956 |
|
| Investment in subsidiaries | 714,292 |
| | 114,483 |
| | — |
| | (828,775 | ) | | — |
| 932,237 |
| | 221,201 |
| | — |
| | (1,153,438 | ) | | — |
|
| Intangible assets, net of amortization | 235 |
| | 21,731 |
| | — |
| | — |
| | 21,966 |
| |
| Intangible assets, net of accumulated amortization | | 171 |
| | 18,829 |
| | 33,680 |
| | — |
| | 52,680 |
|
| Goodwill | | — |
| | — |
| | 41,683 |
| | — |
| | 41,683 |
|
| Noncurrent deferred income taxes | 14,632 |
| | — |
| | — |
| | (14,632 | ) | | — |
| 30,835 |
| | — |
| | 735 |
| | (30,835 | ) | | 735 |
|
| Other long-term assets | 6,739 |
| | 2,844 |
| | 2,504 |
| | — |
| | 12,087 |
| 11,949 |
| | 2,124 |
| | 15 |
| | — |
| | 14,088 |
|
| Total assets | $ | 685,346 |
| | $ | 870,770 |
| | $ | 129,384 |
| | $ | (844,157 | ) | | $ | 841,343 |
| $ | 947,868 |
| | $ | 1,167,551 |
| | $ | 242,377 |
| | $ | (1,185,042 | ) | | $ | 1,172,754 |
|
| LIABILITIES AND SHAREHOLDERS’ EQUITY | | | | | | | | | | | | | | | | | | |
| Current liabilities: | | | | | | | | | | | | | | | | | | |
| Accounts payable | $ | 242 |
| | $ | 20,134 |
| | $ | 6,553 |
| | $ | — |
| | $ | 26,929 |
| $ | 1,090 |
| | $ | 57,150 |
| | $ | 8,200 |
| | $ | — |
| | $ | 66,440 |
|
| Current portion of long-term debt | 63 |
| | 1,345 |
| | — |
| | — |
| | 1,408 |
| — |
| | 850 |
| | 22 |
| | — |
| | 872 |
|
| Prepaid drilling contracts | — |
| | 1,000 |
| | 2,669 |
| | — |
| | 3,669 |
| |
| Deferred revenues | | — |
| | 1,297 |
| | 2,669 |
| | — |
| | 3,966 |
|
| Accrued expenses | 9,861 |
| | 30,786 |
| | 2,987 |
| | — |
| | 43,634 |
| 16,779 |
| | 45,012 |
| | 6,631 |
| | (20 | ) | | 68,402 |
|
| Total current liabilities | 10,166 |
| | 53,265 |
| | 12,209 |
| | — |
| | 75,640 |
| 17,869 |
| | 104,309 |
| | 17,522 |
| | (20 | ) | | 139,680 |
|
| Long-term debt, less current portion | 277,830 |
| | 1,700 |
| | — |
| | — |
| | 279,530 |
| 417,747 |
| | 850 |
| | 131 |
| | — |
| | 418,728 |
|
| Noncurrent deferred income taxes | — |
| | 94,769 |
| | 23 |
| | (14,632 | ) | | 80,160 |
| 921 |
| | 124,659 |
| | — |
| | (30,835 | ) | | 94,745 |
|
| Other long-term liabilities | 267 |
| | 6,744 |
| | 2,669 |
| | — |
| | 9,680 |
| 137 |
| | 5,496 |
| | 3,523 |
| | — |
| | 9,156 |
|
| Total liabilities | 288,263 |
| | 156,478 |
| | 14,901 |
| | (14,632 | ) | | 445,010 |
| 436,674 |
| | 235,314 |
| | 21,176 |
| | (30,855 | ) | | 662,309 |
|
| Total shareholders’ equity | 397,083 |
| | 714,292 |
| | 114,483 |
| | (829,525 | ) | | 396,333 |
| 511,194 |
| | 932,237 |
| | 221,201 |
| | (1,154,187 | ) | | 510,445 |
|
| Total liabilities and shareholders’ equity | $ | 685,346 |
| | $ | 870,770 |
| | $ | 129,384 |
| | $ | (844,157 | ) | | $ | 841,343 |
| $ | 947,868 |
| | $ | 1,167,551 |
| | $ | 242,377 |
| | $ | (1,185,042 | ) | | $ | 1,172,754 |
|
CONDENSED CONSOLIDATED STATEMENTS OF OPERATIONS
(Unaudited, in thousands)
| | | | Year ended December 31, 2011 | Year ended December 31, 2012 |
| | Parent | | Guarantor Subsidiaries | | Non-Guarantor Subsidiaries | | Eliminations | | Consolidated | Parent | | Guarantor Subsidiaries | | Non-Guarantor Subsidiaries | | Eliminations | | Consolidated |
| Revenues: | $ | — |
| | $ | 606,402 |
| | $ | 109,539 |
| | $ | — |
| | $ | 715,941 |
| |
| Revenues | | $ | — |
| | $ | 779,163 |
| | $ | 140,280 |
| | $ | — |
| | $ | 919,443 |
|
| Costs and expenses: | | | | | | | | | | | | | | | | | | |
| Operating costs | — |
| | 372,945 |
| | 83,979 |
| | — |
| | 456,924 |
| — |
| | 485,342 |
| | 101,279 |
| | — |
| | 586,621 |
|
| Depreciation and amortization | 847 |
| | 119,520 |
| | 12,465 |
| | — |
| | 132,832 |
| 873 |
| | 142,972 |
| | 20,872 |
| | — |
| | 164,717 |
|
| General and administrative | 19,797 |
| | 45,152 |
| | 2,921 |
| | (552 | ) | | 67,318 |
| 22,212 |
| | 54,715 |
| | 9,228 |
| | (552 | ) | | 85,603 |
|
| Intercompany leasing | — |
| | (4,860 | ) | | 4,857 |
| | 3 |
| | — |
| — |
| | (4,860 | ) | | 4,860 |
| | — |
| | — |
|
| Bad debt expense | — |
| | 925 |
| | — |
| | — |
| | 925 |
| |
| Bad debt expense (recovery) | | — |
| | (612 | ) | | 172 |
| | — |
| | (440 | ) |
| Impairment of equipment | — |
| | 484 |
| | — |
| | — |
| | 484 |
| — |
| | 1,131 |
| | — |
| | — |
| | 1,131 |
|
| Total costs and expenses | 20,644 |
| | 534,166 |
| | 104,222 |
| | (549 | ) | | 658,483 |
| 23,085 |
| | 678,688 |
| | 136,411 |
| | (552 | ) | | 837,632 |
|
| Income (loss) from operations | (20,644 | ) | | 72,236 |
| | 5,317 |
| | 549 |
| | 57,458 |
| (23,085 | ) | | 100,475 |
| | 3,869 |
| | 552 |
| | 81,811 |
|
| Other (expense) income: | | | | | | | | | | | | | | | | | | |
| Equity in earnings of subsidiaries | 43,182 |
| | (2,982 | ) | | — |
| | (40,200 | ) | | — |
| 68,352 |
| | 4,029 |
| | — |
| | (72,381 | ) | | — |
|
| Interest expense | (29,497 | ) | | (248 | ) | | 24 |
| | — |
| | (29,721 | ) | (37,011 | ) | | (59 | ) | | 21 |
| | — |
| | (37,049 | ) |
| Other | 311 |
| | 1,163 |
| | (7,829 | ) | | (549 | ) | | (6,904 | ) | 268 |
| | 940 |
| | 968 |
| | (552 | ) | | 1,624 |
|
| Total other expense | 13,996 |
| | (2,067 | ) | | (7,805 | ) | | (40,749 | ) | | (36,625 | ) | |
| Total other (expense) income | | 31,609 |
| | 4,910 |
| | 989 |
| | (72,933 | ) | | (35,425 | ) |
| Income (loss) before income taxes | (6,648 | ) | | 70,169 |
| | (2,488 | ) | | (40,200 | ) | | 20,833 |
| 8,524 |
| | 105,385 |
| | 4,858 |
| | (72,381 | ) | | 46,386 |
|
| Income tax (expense) benefit | 17,825 |
| | (26,987 | ) | | (494 | ) | | — |
| | (9,656 | ) | |
| Income tax expense (benefit) | | 21,508 |
| | (37,033 | ) | | (829 | ) | | — |
| | (16,354 | ) |
| Net income (loss) | $ | 11,177 |
| | $ | 43,182 |
| | $ | (2,982 | ) | | $ | (40,200 | ) | | $ | 11,177 |
| $ | 30,032 |
| | $ | 68,352 |
| | $ | 4,029 |
| | $ | (72,381 | ) | | $ | 30,032 |
|
| | | | | | | | | | | Year ended December 31, 2011 |
| | Year ended December 31, 2010 | Parent | | Guarantor Subsidiaries | | Non-Guarantor Subsidiaries | | Eliminations | | Consolidated |
| | Parent | | Guarantor Subsidiaries | | Non-Guarantor Subsidiaries | | Eliminations | | Consolidated | |
| Revenues: | $ | — |
| | $ | 400,778 |
| | $ | 86,432 |
| | $ | — |
| | $ | 487,210 |
| |
| Revenues | | $ | — |
| | $ | 606,402 |
| | $ | 109,539 |
| | $ | — |
| | $ | 715,941 |
|
| Costs and expenses: | | | | | | | | | | | | | | | | | | |
| Operating costs | — |
| | 263,649 |
| | 68,782 |
| | — |
| | 332,431 |
| — |
| | 372,945 |
| | 83,979 |
| | — |
| | 456,924 |
|
| Depreciation and amortization | 1,271 |
| | 109,971 |
| | 9,569 |
| | — |
| | 120,811 |
| 847 |
| | 119,520 |
| | 12,465 |
| | — |
| | 132,832 |
|
| General and administrative | 15,337 |
| | 34,177 |
| | 2,959 |
| | (426 | ) | | 52,047 |
| 19,797 |
| | 45,152 |
| | 2,921 |
| | (552 | ) | | 67,318 |
|
| Intercompany leasing | — |
| | (4,323 | ) | | 4,323 |
| | — |
| | — |
| — |
| | (4,860 | ) | | 4,857 |
| | 3 |
| | — |
|
| Bad debt expense | — |
| | 493 |
| | — |
| | — |
| | 493 |
| |
| Bad debt expense (recovery) | | — |
| | 925 |
| | — |
| | — |
| | 925 |
|
| Impairment of equipment | | — |
| | 484 |
| | — |
| | — |
| | 484 |
|
| Total costs and expenses | 16,608 |
| | 403,967 |
| | 85,633 |
| | (426 | ) | | 505,782 |
| 20,644 |
| | 534,166 |
| | 104,222 |
| | (549 | ) | | 658,483 |
|
| Income (loss) from operations | (16,608 | ) | | (3,189 | ) | | 799 |
| | 426 |
| | (18,572 | ) | (20,644 | ) | | 72,236 |
| | 5,317 |
| | 549 |
| | 57,458 |
|
| Other income (expense): | | | | | | | | | | |
| Other (expense) income: | | | | | | | | | | |
| Equity in earnings of subsidiaries | | 43,182 |
| | (2,982 | ) | | — |
| | (40,200 | ) | | — |
|
| Interest expense | | (29,497 | ) | | (248 | ) | | 24 |
| | — |
| | (29,721 | ) |
| Other | | 311 |
| | 1,163 |
| | (7,829 | ) | | (549 | ) | | (6,904 | ) |
| Total other (expense) income | | 13,996 |
| | (2,067 | ) | | (7,805 | ) | | (40,749 | ) | | (36,625 | ) |
| Income (loss) before income taxes | | (6,648 | ) | | 70,169 |
| | (2,488 | ) | | (40,200 | ) | | 20,833 |
|
| Income tax expense (benefit) | | 17,825 |
| | (26,987 | ) | | (494 | ) | | — |
| | (9,656 | ) |
| Net income (loss) | | $ | 11,177 |
| | $ | 43,182 |
| | $ | (2,982 | ) | | $ | (40,200 | ) | | $ | 11,177 |
|
| | | Year ended December 31, 2010 |
| | | Parent | | Guarantor Subsidiaries | | Non-Guarantor Subsidiaries | | Eliminations | | Consolidated |
| Revenues | | $ | — |
| | $ | 400,778 |
| | $ | 86,432 |
| | $ | — |
| | $ | 487,210 |
|
| Costs and expenses: | | | | | | | | | | |
| Operating costs | | — |
| | 263,649 |
| | 68,782 |
| | — |
| | 332,431 |
|
| Depreciation and amortization | | 1,271 |
| | 109,971 |
| | 9,569 |
| | — |
| | 120,811 |
|
| General and administrative | | 15,337 |
| | 34,177 |
| | 2,959 |
| | (426 | ) | | 52,047 |
|
| Intercompany leasing | | — |
| | (4,323 | ) | | 4,323 |
| | — |
| | — |
|
| Bad debt expense (recovery) | | — |
| | 493 |
| | — |
| | — |
| | 493 |
|
| Total costs and expenses | | 16,608 |
| | 403,967 |
| | 85,633 |
| | (426 | ) | | 505,782 |
|
| Income (loss) from operations | | (16,608 | ) | | (3,189 | ) | | 799 |
| | 426 |
| | (18,572 | ) |
| Other (expense) income: | | | | | | | | | | |
| Equity in earnings of subsidiaries | (1,982 | ) | | 1,335 |
| | — |
| | 647 |
| | — |
| (1,982 | ) | | 1,335 |
| | — |
| | 647 |
| | — |
|
| Interest expense | (26,240 | ) | | (333 | ) | | 6 |
| | — |
| | (26,567 | ) | (26,240 | ) | | (333 | ) | | 6 |
| | — |
| | (26,567 | ) |
| Impairment of investments | (3,331 | ) | | — |
| | — |
| | — |
| | (3,331 | ) | (3,331 | ) | | — |
| | — |
| | — |
| | (3,331 | ) |
| Other | — |
| | 953 |
| | 385 |
| | (426 | ) | | 912 |
| — |
| | 953 |
| | 385 |
| | (426 | ) | | 912 |
|
| Total other income (expense) | (31,553 | ) | | 1,955 |
| | 391 |
| | 221 |
| | (28,986 | ) | |
| Total other (expense) income | | (31,553 | ) | | 1,955 |
| | 391 |
| | 221 |
| | (28,986 | ) |
| Income (loss) before income taxes | (48,161 | ) | | (1,234 | ) | | 1,190 |
| | 647 |
| | (47,558 | ) | (48,161 | ) | | (1,234 | ) | | 1,190 |
| | 647 |
| | (47,558 | ) |
| Income tax (expense) benefit | 14,900 |
| | (748 | ) | | 145 |
| | — |
| | 14,297 |
| |
| Net earnings (loss) | $ | (33,261 | ) | | $ | (1,982 | ) | | $ | 1,335 |
| | $ | 647 |
| | $ | (33,261 | ) | |
| | | | | | | | | | | |
| | Year ended December 31, 2009 | |
| | Parent | | Guarantor Subsidiaries | | Non-Guarantor Subsidiaries | | Eliminations | | Consolidated | |
| Revenues: | $ | — |
| | $ | 268,920 |
| | $ | 56,617 |
| | $ | — |
| | $ | 325,537 |
| |
| Costs and expenses: | | | | | | | | | | |
| Operating costs | — |
| | 174,579 |
| | 41,091 |
| | (315 | ) | | 215,355 |
| |
| Depreciation and amortization | 1,215 |
| | 97,015 |
| | 7,956 |
| | — |
| | 106,186 |
| |
| General and administrative | 12,222 |
| | 25,293 |
| | 1,379 |
| | (1,416 | ) | | 37,478 |
| |
| Bad debt recovery | — |
| | (1,642 | ) | | — |
| | — |
| | (1,642 | ) | |
| Total costs and expenses | 13,437 |
| | 295,245 |
| | 50,426 |
| | (1,731 | ) | | 357,377 |
| |
| Income (loss) from operations | (13,437 | ) | | (26,325 | ) | | 6,191 |
| | 1,731 |
| | (31,840 | ) | |
| Other income (expense): | | | | | | | | | | |
| Equity in earnings of subsidiaries | (2,250 | ) | | 9,245 |
| | — |
| | (6,995 | ) | | — |
| |
| Interest expense | (8,584 | ) | | (444 | ) | | 100 |
| | — |
| | (8,928 | ) | |
| Other | 1,056 |
| | 1,362 |
| | (91 | ) | | (1,731 | ) | | 596 |
| |
| Total other expense | (9,778 | ) | | 10,163 |
| | 9 |
| | (8,726 | ) | | (8,332 | ) | |
| Income (loss) before income taxes | (23,215 | ) | | (16,162 | ) | | 6,200 |
| | (6,995 | ) | | (40,172 | ) | |
| Income tax (expense) benefit | — |
| | 13,912 |
| | 3,045 |
| | — |
| | 16,957 |
| |
| Net earnings (loss) | $ | (23,215 | ) | | $ | (2,250 | ) | | $ | 9,245 |
| | $ | (6,995 | ) | | $ | (23,215 | ) | |
| Income tax expense (benefit) | | 14,900 |
| | (748 | ) | | 145 |
| | — |
| | 14,297 |
|
| Net income (loss) | | $ | (33,261 | ) | | $ | (1,982 | ) | | $ | 1,335 |
| | $ | 647 |
| | $ | (33,261 | ) |
CONDENSED CONSOLIDATED STATEMENTS OF CASH FLOWS
(Unaudited, in thousands)
| | | | Year ended December 31, 2011 | Year ended December 31, 2012 |
| | Parent | | Guarantor Subsidiaries | | Non-Guarantor Subsidiaries | | Eliminations | | Consolidated | Parent | | Guarantor Subsidiaries | | Non-Guarantor Subsidiaries | | Eliminations | | Consolidated |
| Cash flows from operating activities: | $ | (164,032 | ) | | $ | 300,198 |
| | $ | 8,713 |
| | $ | — |
| | $ | 144,879 |
| |
| Cash flows from operating activities | | $ | (171,541 | ) | | $ | 338,418 |
| | $ | 32,489 |
| | $ | — |
| | $ | 199,366 |
|
| Cash flows from investing activities: | | | | | | | | | | |
| Purchases of property and equipment | | (2,187 | ) | | (332,082 | ) | | (30,055 | ) | | — |
| | (364,324 | ) |
| Proceeds from sale of property and equipment | | — |
| | 2,998 |
| | 95 |
| | — |
| | 3,093 |
|
| | | (2,187 | ) | | (329,084 | ) | | (29,960 | ) | | — |
| | (361,231 | ) |
| Cash flows from financing activities: | | | | | | | | | | |
| Debt repayments | | — |
| | (856 | ) | | (18 | ) | | — |
| | (874 | ) |
| Proceeds from issuance of debt | | 100,000 |
| | — |
| | — |
| | — |
| | 100,000 |
|
| Debt issuance costs | | (58 | ) | | — |
| | — |
| | — |
| | (58 | ) |
| Proceeds from exercise of options | | 693 |
| | — |
| | — |
| | — |
| | 693 |
|
| Purchase of treasury stock | | (360 | ) | | — |
| | — |
| | — |
| | (360 | ) |
| | | 100,275 |
| | (856 | ) | | (18 | ) | | — |
| | 99,401 |
|
| Net increase (decrease) in cash and cash equivalents | | (73,453 | ) | | 8,478 |
| | 2,511 |
| | — |
| | (62,464 | ) |
| Beginning cash and cash equivalents | | 91,932 |
| | (13,879 | ) | | 8,144 |
| | — |
| | 86,197 |
|
| Ending cash and cash equivalents | | $ | 18,479 |
| | $ | (5,401 | ) | | $ | 10,655 |
| | $ | — |
| | $ | 23,733 |
|
| | | Year ended December 31, 2011 |
| | | Parent | | Guarantor Subsidiaries | | Non-Guarantor Subsidiaries | | Eliminations | | Consolidated |
| Cash flows from operating activities | | $ | (164,032 | ) | | $ | 300,198 |
| | $ | 8,713 |
| | $ | — |
| | $ | 144,879 |
|
| Cash flows from investing activities: | | | | | | | | | | | | | | | | | | |
| Acquisition of production services business of Go-Coil | — |
| | (109,035 | ) | | — |
| | — |
| | (109,035 | ) | — |
| | (109,035 | ) | | — |
| | — |
| | (109,035 | ) |
| Acquisition of other production services businesses | — |
| | (6,502 | ) | | — |
| | — |
| | (6,502 | ) | — |
| | (6,502 | ) | | — |
| | — |
| | (6,502 | ) |
| Purchases of property and equipment | (485 | ) | | (200,887 | ) | | (8,694 | ) | | — |
| | (210,066 | ) | (485 | ) | | (200,887 | ) | | (8,694 | ) | | — |
| | (210,066 | ) |
| Proceeds from sale of property and equipment | 7 |
| | 5,532 |
| | 11 |
| | — |
| | 5,550 |
| 7 |
| | 5,532 |
| | 11 |
| | — |
| | 5,550 |
|
| Proceeds from sale of auction rate securities | 12,569 |
| | — |
| | — |
| | — |
| | 12,569 |
| 12,569 |
| | — |
| | — |
| | — |
| | 12,569 |
|
| | 12,091 |
| | (310,892 | ) | | (8,683 | ) | | — |
| | (307,484 | ) | 12,091 |
| | (310,892 | ) | | (8,683 | ) | | — |
| | (307,484 | ) |
| Cash flows from financing activities: | | | | | | | | | | | | | | | | | | |
| Debt repayments | (111,813 | ) | | (1,345 | ) | | — |
| | — |
| | (113,158 | ) | (111,813 | ) | | (1,345 | ) | | — |
| | — |
| | (113,158 | ) |
| Proceeds from issuance of debt | 250,750 |
| | — |
| | — |
| | — |
| | 250,750 |
| 250,750 |
| | — |
| | — |
| | — |
| | 250,750 |
|
| Debt issuance costs | (7,285 | ) | | — |
| | — |
| | — |
| | (7,285 | ) | (7,285 | ) | | — |
| | — |
| | — |
| | (7,285 | ) |
| Proceeds from exercise of options | 2,884 |
| | — |
| | — |
| | — |
| | 2,884 |
| 2,884 |
| | — |
| | — |
| | — |
| | 2,884 |
|
| Proceeds from common stock, net of offering costs | 94,343 |
| | — |
| | — |
| | — |
| | 94,343 |
| |
| Proceeds from common stock, net of offering costs of $5,707 | | 94,343 |
| | — |
| | — |
| | — |
| | 94,343 |
|
| Purchase of treasury stock | (743 | ) | | — |
| | — |
| | — |
| | (743 | ) | (743 | ) | | — |
| | — |
| | — |
| | (743 | ) |
| | 228,136 |
| | (1,345 | ) | | — |
| | — |
| | 226,791 |
| 228,136 |
| | (1,345 | ) | | — |
| | — |
| | 226,791 |
|
| Net increase (decrease) in cash and cash equivalents | 76,195 |
| | (12,039 | ) | | 30 |
| | — |
| | 64,186 |
| 76,195 |
| | (12,039 | ) | | 30 |
| | — |
| | 64,186 |
|
| Beginning cash and cash equivalents | 15,737 |
| | (1,840 | ) | | 8,114 |
| | — |
| | 22,011 |
| 15,737 |
| | (1,840 | ) | | 8,114 |
| | — |
| | 22,011 |
|
| Ending cash and cash equivalents | $ | 91,932 |
| | $ | (13,879 | ) | | $ | 8,144 |
| | $ | — |
| | $ | 86,197 |
| $ | 91,932 |
| | $ | (13,879 | ) | | $ | 8,144 |
| | $ | — |
| | $ | 86,197 |
|
| | | | | | | | | | | Year ended December 31, 2010 |
| | Year ended December 31, 2010 | Parent | | Guarantor Subsidiaries | | Non-Guarantor Subsidiaries | | Eliminations | | Consolidated |
| | Parent | | Guarantor Subsidiaries | | Non-Guarantor Subsidiaries | | Eliminations | | Consolidated | |
| Cash flows from operating activities: | $ | (31,841 | ) | | $ | 115,650 |
| | $ | 14,542 |
| | $ | — |
| | $ | 98,351 |
| |
| Cash flows from operating activities | | $ | (31,841 | ) | | $ | 115,650 |
| | $ | 14,542 |
| | $ | — |
| | $ | 98,351 |
|
| Cash flows from investing activities: | | | | | | | | | | | | | | | | | | |
| Acquisition of other production services businesses | — |
| | (1,340 | ) | | — |
| | — |
| | (1,340 | ) | — |
| | (1,340 | ) | | — |
| | — |
| | (1,340 | ) |
| Purchases of property and equipment | (478 | ) | | (114,313 | ) | | (16,212 | ) | | — |
| | (131,003 | ) | (478 | ) | | (114,313 | ) | | (16,212 | ) | | — |
| | (131,003 | ) |
| Proceeds from sale of property and equipment | — |
| | 2,290 |
| | 41 |
| | — |
| | 2,331 |
| — |
| | 2,290 |
| | 41 |
| | — |
| | 2,331 |
|
| Proceeds from insurance recoveries | — |
| | 531 |
| | — |
| | — |
| | 531 |
| — |
| | 531 |
| | — |
| | — |
| | 531 |
|
| | (478 | ) | | (112,832 | ) | | (16,171 | ) | | — |
| | (129,481 | ) | (478 | ) | | (112,832 | ) | | (16,171 | ) | | — |
| | (129,481 | ) |
| Cash flows from financing activities: | | | | | | | | | | | | | | | | | | |
| Debt repayments | (254,914 | ) | | (1,942 | ) | | — |
| | — |
| | (256,856 | ) | (254,914 | ) | | (1,942 | ) | | — |
| | — |
| | (256,856 | ) |
| Proceeds from issuance of debt | 274,375 |
| | — |
| | — |
| | — |
| | 274,375 |
| 274,375 |
| | — |
| | — |
| | — |
| | 274,375 |
|
| Debt issuance costs | (4,865 | ) | | — |
| | — |
| | — |
| | (4,865 | ) | (4,865 | ) | | — |
| | — |
| | — |
| | (4,865 | ) |
| Proceeds from exercise of options | 238 |
| | — |
| | — |
| | — |
| | 238 |
| 238 |
| | — |
| | — |
| | — |
| | 238 |
|
| Purchase of treasury stock | (130 | ) | | — |
| | — |
| | — |
| | (130 | ) | (130 | ) | | — |
| | — |
| | — |
| | (130 | ) |
| | 14,704 |
| | (1,942 | ) | | — |
| | — |
| | 12,762 |
| 14,704 |
| | (1,942 | ) | | — |
| | — |
| | 12,762 |
|
| Net increase (decrease) in cash and cash equivalents | (17,615 | ) | | 876 |
| | (1,629 | ) | | — |
| | (18,368 | ) | (17,615 | ) | | 876 |
| | (1,629 | ) | | — |
| | (18,368 | ) |
| Beginning cash and cash equivalents | 33,352 |
| | (2,716 | ) | | 9,743 |
| | — |
| | 40,379 |
| 33,352 |
| | (2,716 | ) | | 9,743 |
| | — |
| | 40,379 |
|
| Ending cash and cash equivalents | $ | 15,737 |
| | $ | (1,840 | ) | | $ | 8,114 |
| | $ | — |
| | $ | 22,011 |
| $ | 15,737 |
| | $ | (1,840 | ) | | $ | 8,114 |
| | $ | — |
| | $ | 22,011 |
|
| | | | | | | | | | | |
| | Year ended December 31, 2009 | |
| | Parent | | Guarantor Subsidiaries | | Non-Guarantor Subsidiaries | | Eliminations | | Consolidated | |
| Cash flows from operating activities: | $ | 26,598 |
| | $ | 91,432 |
| | $ | 5,283 |
| | $ | — |
| | $ | 123,313 |
| |
| Cash flows from investing activities: | | | | | | | | | | |
| Purchases of property and equipment | (404 | ) | | (106,628 | ) | | (7,680 | ) | | — |
| | (114,712 | ) | |
| Proceeds from sale of property and equipment | — |
| | 694 |
| | 73 |
| | — |
| | 767 |
| |
| Proceeds from insurance recoveries | — |
| | 36 |
| | — |
| | — |
| | 36 |
| |
| | (404 | ) | | (105,898 | ) | | (7,607 | ) | | — |
| | (113,909 | ) | |
| Cash flows from financing activities: | | | | | | | | | | |
| Debt repayments | (15,152 | ) | | (2,146 | ) | | — |
| | — |
| | (17,298 | ) | |
| Debt issuance costs | (2,560 | ) | | — |
| | — |
| | — |
| | (2,560 | ) | |
| Proceeds from common stock, net of offering costs | 24,043 |
| | — |
| | — |
| | — |
| | 24,043 |
| |
| Purchase of treasury stock | (31 | ) | | — |
| | — |
| | — |
| | (31 | ) | |
| | 6,300 |
| | (2,146 | ) | | — |
| | — |
| | 4,154 |
| |
| Net increase (decrease) in cash and cash equivalents | 32,494 |
| | (16,612 | ) | | (2,324 | ) | | — |
| | 13,558 |
| |
| Beginning cash and cash equivalents | 858 |
| | 13,896 |
| | 12,067 |
| | — |
| | 26,821 |
| |
| Ending cash and cash equivalents | $ | 33,352 |
| | $ | (2,716 | ) | | $ | 9,743 |
| | $ | — |
| | $ | 40,379 |
| |
| |
Item 9. | Changes in and Disagreements With Accountants on Accounting and Financial Disclosure |
Not applicable.
| |
| Item 9A. | Controls and Procedures |
In accordance with Exchange Act Rules 13a-15 and 15d-15, we carried out an evaluation, under the supervision and with the participation of management, including our Chief Executive Officer and Chief Financial Officer, of the effectiveness of our disclosure controls and procedures as of the end of the period covered by this report. Based upon that evaluation, our Chief Executive Officer and Chief Financial Officer concluded that our disclosure controls and procedures were effective as of December 31, 20112012, to ensure that information required to be disclosed in our reports filed or submitted under the Exchange Act is (1) recorded, processed, summarized and reported within the time periods specified in the Securities and Exchange Commission’s rules and forms and (2) accumulated and communicated to our management, including our Chief Executive Officer and Chief Financial Officer, as appropriate to allow timely decisions regarding required disclosure.
There has been no change in our internal control over financial reporting that occurred during the three months ended December 31, 20112012 that has materially affected, or is reasonably likely to materially affect, our internal control over financial reporting.
Management’s Report on Internal Control Over Financial Reporting
The management of Pioneer Drilling CompanyEnergy Services Corp. is responsible for establishing and maintaining adequate internal control over financial reporting. Pioneer Drilling Company'sEnergy Services Corp.'s internal control over financial reporting is a process designed to provide reasonable assurance regarding the reliability of financial reporting and the preparation of financial statements for external purposes in accordance with generally accepted accounting principles. A company's internal control over financial reporting includes those policies and procedures that: (1) pertain to the maintenance of records that, in reasonable detail, accurately and fairly reflect the transactions and dispositions of the assets of the company; (2) provide reasonable assurance that transactions are recorded as necessary to permit preparation of financial statements in accordance with generally accepted accounting principles, and that receipts and expenditures of Pioneer Drilling CompanyEnergy Services Corp. are being made only in accordance with authorizations of management and directors of the company; and (3) provide reasonable assurance regarding prevention or timely detection of unauthorized acquisition, use, or disposition of the company’s assets that could have a material effect on the financial statements. Because of its inherent limitations, internal control over financial reporting may not prevent or detect misstatements. Also, projections of any evaluation of effectiveness to future periods are subject to the risk that controls may become inadequate because of changes in conditions, or that the degree of compliance with the policies or procedures may deteriorate.
Pioneer Drilling Company’sEnergy Services Corp.’s management assessed the effectiveness of Pioneer Drilling Company’sEnergy Services Corp.’s internal control over financial reporting as of December 31, 20112012. In making this assessment, it used the criteria set forth by the Committee of Sponsoring Organizations of the Treadway Commission (COSO) in Internal Control-Integrated Framework. Based on our assessment we have concluded that, as of December 31, 20112012, Pioneer Drilling Company’sEnergy Services Corp.’s internal control over financial reporting was effective based on those criteria.
Management's evaluation of and conclusion regarding the effectiveness of its internal control over financial reporting excludes the internal control over financial reporting of Go-Coil, LLC ("Go-Coil"), which was acquired on December 31, 2011 (as described in Note 2 of Notes to Consolidated Financial Statements). Go-Coil contributed approximately 10% of the Company's total assets as of December 31, 2011.
KPMG LLP, the independent registered public accounting firm that audited the consolidated financial statements of Pioneer Drilling CompanyEnergy Services Corp. included in this Annual Report on Form 10-K, has issued an attestation report on the effectiveness of Pioneer Drilling Company’sEnergy Services Corp.’s internal control over financial reporting as of December 31, 20112012. This report appears on page 53.is included in Item 8, Financial Statements and Supplementary Data.
| |
| Item 9B. | Other Information |
Not applicable.Applicable.
PART III
In Items 10, 11, 12, 13 and 14 below, we are incorporating by reference the information we refer to in those Items from the definitive proxy statement for our 20122013 Annual Meeting of Shareholders. We intend to file that definitive proxy statement with the SEC on or about April 10, 20122013.
| |
| Item 10. | Directors, Executive Officers and Corporate Governance |
Please see the information appearing under the headings “Proposal 1—Election of Directors,” “Executive Officers,” “Information Concerning Meetings and Committees of the Board of Directors,” “Code of Business Conduct and Ethics”Ethics and Corporate Governance Guidelines” and “Section 16(a) Beneficial Ownership Reporting Compliance” in the definitive proxy statement for our 20122013 Annual Meeting of Shareholders for the information this Item 10 requires.
| |
| Item 11. | Executive Compensation |
Please see the information appearing under the headings “Compensation Discussion and Analysis,” “Compensation of Directors,“Director Compensation,” “Compensation of Executive Officers,“Executive Compensation,” “Compensation Committee Interlocks and Insider Participation” and “Compensation Committee Report”“Report of the Compensation Committee” in the definitive proxy statement for our 20122013 Annual Meeting of Shareholders for the information this Item 11 requires.
| |
| Item 12. | Security Ownership of Certain Beneficial Owners and Management and Related Shareholder Matters |
Please see the information appearing under the headings “Equity Compensation Plan Information” and “Security Ownership of Certain Beneficial Owners and Management” in the definitive proxy statement for our 20122013 Annual Meeting of Shareholders for the information this Item 12 requires.
| |
| Item 13. | Certain Relationships and Related Transactions, and Director Independence |
Please see the information appearing under the headings “Proposal 1—Election of Directors” and “Certain Relationships and Related Transactions” in the definitive proxy statement for our 20122013 Annual Meeting of Shareholders for the information this Item 13 requires.
| |
| Item 14. | Principal Accountant Fees and Services |
Please see the information appearing under the heading “Proposal 2—3—Ratification of Appointment of Independent Auditors” in the definitive proxy statement for our 20122013 Annual Meeting of Shareholders for the information this Item 14 requires.
PART IV
| |
| Item 15. | Exhibits and Financial Statement Schedules |
(1) Financial Statements.
See Index to Consolidated Financial Statements on page 51.included in Item 8, Financial Statements and Supplementary Data.
(2) Financial Statement Schedules
No financial statement schedules are submitted because either they are inapplicable or because the required information is included in the consolidated financial statements or notes thereto.
(3) Exhibits.
The following exhibits are filed as part of this report:
|
| | | | |
Exhibit
Number
| | | | Description |
3.1* | | - |
| 3.1* | - | Restated Articles of Incorporation of Pioneer Drilling CompanyEnergy Services Corp. (Form 10-K for the year ended December 31, 20088-K date July 30, 2012 (File No. 1-8182, Exhibit 3.1)). |
| | | | | |
| 3.2* | | - | | Amended and Restated Bylaws of Pioneer Drilling CompanyEnergy Services Corp. (Form 8-K dated December 15, 2008July 30, 2012 (File No. 1-8182, Exhibit 3.1)3.2)). |
| | | | |
| 4.1* | | - | | Form of Certificate representing Common Stock of Pioneer Drilling CompanyEnergy Services Corp. (Form S-8 filed November 18, 2003 (Reg.10-Q dated August 7, 2012 (File No. 333-110569,1-8182, Exhibit 4.3)4.1)). |
| | | | |
| 4.2* | | - | | Indenture, dated March 11, 2010, by and among Pioneer Drilling Company, the subsidiary guarantors party thereto and Wells Fargo Bank, National Association, as trustee (Form 8-K dated March 12, 2010 (File No. 1-8182, Exhibit 4.1)). |
| | | | | |
| 4.3* | | - | | Registration Rights Agreement, dated March 11, 2010, by and among Pioneer Drilling Company, the subsidiary guarantors party thereto and the initial purchasers party thereto (Form 8-K dated March 12, 2010 (File No. 1-8182, Exhibit 4.2)). |
| | | | | |
| 4.4* | | - | | First Supplemental Indenture, dated November 21, 2011, by and among Pioneer Drilling Company, the subsidiary guarantors party thereto and Wells Fargo Bank, National Association, as trustee (Form 8-K dated November 21, 2011 (File No. 1-8182, Exhibit 4.2)).
|
| | | | |
| 4.5* | | - | | Registration Rights Agreement, dated November 21, 2011, by and among Pioneer Drilling Company, the subsidiary guarantors party thereto and the initial purchasers party thereto (Form 8-K dated November 21, 2011 (File No. 1-8182, Exhibit 4.3)).
|
| | | |
| 4.6* | - | Second Supplemental Indenture, dated October 1, 2012, among Pioneer Coiled Tubing Services, LLC, Pioneer Energy Services Corp., the other subsidiary guarantors and Wells Fargo Bank, National Association, as trustee (Form 10-Q dated November 1, 2012 (File No. 1-8182, Exhibit 4.6)).
|
| | | |
| 10.1* | | - | | Purchase Agreement, dated March 4, 2010, by and among Pioneer Drilling Company, the subsidiary guarantors party thereto and the initial purchasers party thereto (Form 8-K dated March 5, 2010 (File No. 1-8182, Exhibit 10.1)). |
| | | | | |
| 10.2* | | - | | Purchase Agreement, dated November 15, 2011, by and among Pioneer Drilling Company, the subsidiary guarantors party thereto and the initial purchasers party thereto (Form 8-K dated November 16, 2011 (File No. 1-8182, Exhibit 10.1)).
|
| | | | |
| 10.3* | | - | | Pioneer Drilling Company 2007 Incentive Plan Form of Long-Term Incentive Cash Award Agreement (Form 10-Q dated August 5, 2010 (File No. 1-8182, Exhibit 10.1)). |
| | | | | |
| 10.4+* | | - | | Pioneer Drilling Company 2007 Incentive Plan Form of Long-Term Incentive Cash Award Agreement (Form 10-Q dated August 5, 2010 (File No. 1-8182, Exhibit 10.2)). |
| | | | | |
| 10.5+* | | - | | Pioneer Drilling Company 2007 Incentive Plan Form of Long-Term Incentive Restricted Stock Award Agreement (Form 10-Q dated August 5, 2010 (File No. 1-8182, Exhibit 10.3)). |
| | | | | |
| 10.6+* | | - | | Pioneer Drilling Company 2007 Incentive Plan Form of Restricted Stock Unit Agreement (Form 10-Q dated August 5, 2010 (File No. 1-8182, Exhibit 10.4)). |
|
| | | | |
Exhibit
Number
| | | | Description |
| 10.7+* | | - | | Pioneer Drilling Services, Ltd. Annual Incentive Compensation Plan dated August 5, 2005 (Form 8-K dated August 5, 2005 (File No. 1-8182, Exhibit 10.1)). |
| | | |
|
| | |
| 10.8+* | | - | | Pioneer Drilling Company Amended and Restated Key Executive Severance Plan dated December 10, 2007 (Form 10-Q for the quarter ended March 31, 2008 (File No. 1-8182, Exhibit 10.4)). |
| | | | | |
| 10.9+* | | - | | Pioneer Drilling Company’s 1995 Stock Plan and form of Stock Option Agreement (Form 10-K for the year ended March 31, 2001 (File No. 1-8182, Exhibit 10.5)). |
| | | | | |
| 10.10+* | | - | | Pioneer Drilling Company’s 1999 Stock Plan and form of Stock Option Agreement (Form 10-K for the year ended March 31, 2001 (File No. 1-8182, Exhibit 10.7)). |
| | | | | |
| 10.11+* | | - | | Pioneer Drilling Company 2003 Stock Plan (Form S-8 filed November 18, 2003 (File No. 333-110569, Exhibit 4.4)). |
| | | | | |
| 10.12+* | | - | | Pioneer Drilling Company Amended and Restated 2007 Incentive Plan (Form 10-Q for the quarter ended September 30, 2011 (File No. 1-8182, Exhibit 10.1)). |
| | | | | |
| 10.13+* | | - | | Pioneer Drilling Company 2007 Incentive Plan Form of Stock Option Agreement (Form 8-K dated September 4, 2008 (File No. 1-8182, Exhibit 10.1)). |
| | | | | |
| 10.14+* | | - | | Pioneer Drilling Company 2007 Incentive Plan Form of Employee Restricted Stock Award Agreement (Form 8-K dated September 4, 2008 (File No. 1-8182, Exhibit 10.2)). |
| | | | | |
| 10.15+* | | - | | Pioneer Drilling Company 2007 Incentive Plan Form of Non-Employee Director Restricted Stock Award Agreement (Form 8-K dated September 4, 2008 (File No. 1-8182, Exhibit 10.3)). |
| | | | | |
| 10.16+* | | - | | Pioneer Drilling Company Form of Indemnification Agreement (Form 8-K dated August 8, 2007 (File No. 1-8182, Exhibit 10.1)). |
| | | | | |
| 10.17+* | | - | | Pioneer Drilling Company Employee Relocation Policy Executive Officers – Package A (Form 8-K dated August 8, 2007 (File No. 1-8182, Exhibit 10.3)). |
|
| | | | |
Exhibit
Number
| | | | Description |
| 10.18* | | - | | Amended and Restated Credit Agreement, dated as of June 30, 2011 among Pioneer Drilling Company, the lenders party thereto, and Wells Fargo Bank, N.A., as administrative agent, issuing lender and swing line lender (Form 8-K dated July 5, 2011 (File No. 1-8182, Exhibit 10.1)).
|
| | | | |
| 10.19+* | | - | | Employment Letter, effective March 1, 2008, from Pioneer Drilling Company to Joseph B. Eustace (Form 8-K dated March 5, 2008 (File No. 1-8182, Exhibit 10.1)). |
| | | | | |
| 10.20+* | | - | | Confidentiality and Non-Competition Agreement, dated February 29, 2008, by and between Pioneer Drilling Company, Pioneer Production Services, Inc. and Joe Eustace (Form 8-K dated March 5, 2008 (File No. 1-8182, Exhibit 10.2)). |
| | | | | |
| 10.21+* | | - | | Employment Letter, effective January 7, 2009, from Pioneer Drilling Company to Lorne E. Phillips (Form 8-K dated January 14, 2009 (File No. 1-8182, Exhibit 10.1)). |
| | | |
| 10.22+* | - | Pioneer Energy Services Corp. Nonqualified Retirement Savings and Investment Plan (Form 8-K dated January 30, 2013 (File No. 1-8182, Exhibit 10.1)). |
| | |
| 12.1** | | - | | Computation of ratio of earnings to fixed charges. |
| | | | | |
21.1# | 21.1** | - | | Subsidiaries of Pioneer Drilling Company.Energy Services Corp. |
| | | | | |
23.1# | 23.1** | - | | Consent of Independent Registered Public Accounting Firm. |
| | | | | |
| 31.1** | | - | | Certification by Wm. Stacy Locke, President and Chief Executive Officer, pursuant to Rule 13a-14(a) or Rule 15d-14(a) under the Securities Exchange Act of 1934. |
| | | | | |
| 31.2** | | - | | Certification by Lorne E. Phillips, Executive Vice President and Chief Financial Officer, pursuant to Rule 13a-14(a) or Rule 15d-14(a) under the Securities Exchange Act of 1934. |
| | | | | |
| 32.1# | | - | | Certification by Wm. Stacy Locke, President and Chief Executive Officer, pursuant to Section 906 of the Sarbanes-Oxley Act of 2002 (Subsections (a) and (b) of Section 1350, Chapter 63 of Title 18, United States Code).2002. |
| | | | |
| 32.2# | | - | | Certification by Lorne E. Phillips, Executive Vice President and Chief Financial Officer, pursuant to Section 906 of the Sarbanes-Oxley Act of 2002 (Subsections (a) and (b) of Section 1350, Chapter 63 of Title 18, United States Code).2002. |
| | | |
|
| | |
| 101# | | - | | The following financial statements from Pioneer Drilling Company’sEnergy Services Corp.’s Form 10-K for the year ended December 31, 2011,2012, formatted in XBRL (eXtensible Business Reporting Language): (i) Consolidated Balance Sheets, (ii) Consolidated Statements of Operations, (iii) Consolidated Statements of Shareholders' Equity and Comprehensive Income, (iv) Consolidated Statements of Shareholders' Equity, (v) Consolidated Statements of Cash Flows, and (v)(vi) Notes to Condensed Consolidated Financial Statements, tagged in detail.Statements. Information is furnished and not filed and is not incorporated by reference in any registration statement or prospectus for purposes of sections 11 or 12 of the Securities Act of 1933, as amended, is deemed not filed for purposes of section 18 of the Securities Exchange Act of 1934, as amended, and otherwise is not subject to liability under those sections.
|
_______________
| |
| * | Incorporated by reference to the filing indicated. |
| |
| + | Management contract or compensatory plan or arrangement. |
SIGNATURES
Pursuant to the requirements of Section 13 or 15(d) of the Securities Exchange Act of 1934, the registrant has duly caused this report to be signed on its behalf by the undersigned, thereunto duly authorized.
|
| | |
| | | PIONEER DRILLING COMPANYENERGY SERVICES CORP. |
| | | |
February 21, 201213, 2013 | | BY: /S/ WM. STACY LOCKE |
| | | Wm. Stacy Locke Chief Executive Officer and President |
Pursuant to the requirements of the Securities Exchange Act of 1934, this report has been signed below by the following persons on behalf of the registrant and in the capacities and on the dates indicated.
|
| | | | |
| | | | | |
| Signature | | Title | | Date |
/S/ DEAN A. BURKHARDT | | Chairman | | February 21, 201213, 2013 |
| Dean A. Burkhardt | | | | |
/S/ WM. STACY LOCKE | | President, Chief Executive Officer and Director (Principal (Principal Executive Officer) | | February 21, 201213, 2013 |
| Wm. Stacy Locke | | | | |
/S/S/ LORNE E. PHILLIPS | | Executive Vice President and Chief Financial Officer (Principal Accounting Officer) | | February 21, 201213, 2013 |
| Lorne E. Phillips | | | | |
/S/ C. JOHN THOMPSON | | Director | | February 21, 201213, 2013 |
| C. John Thompson | | | | |
/S/ JOHN MICHAEL RAUH | | Director | | February 21, 201213, 2013 |
| John Michael Rauh | | | | |
/S/ SCOTT D. URBAN | | Director | | February 21, 201213, 2013 |
| Scott D. Urban | | | | |
Index to Exhibits
|
| | | | |
Exhibit Number | | Description |
| | | Description |
| 3.1* | | - | | Restated Articles of Incorporation of Pioneer Drilling CompanyEnergy Services Corp. (Form 10-K for the year ended December 31, 20088-K date July 30, 2012 (File No. 1-8182, Exhibit 3.1)). |
| | | | | |
| 3.2* | | - | | Amended and Restated Bylaws of Pioneer Drilling CompanyEnergy Services Corp. (Form 8-K dated December 15, 2008July 30, 2012 (File No. 1-8182, Exhibit 3.1)3.2)). |
| | | | |
| 4.1* | | - | | Form of Certificate representing Common Stock of Pioneer Drilling CompanyEnergy Services Corp. (Form S-8 filed November 18, 2003 (Reg.10-Q dated August 7, 2012 (File No. 333-110569,1-8182, Exhibit 4.3)4.1)). |
| | | | |
| 4.2* | | - | | Indenture, dated March 11, 2010, by and among Pioneer Drilling Company, the subsidiary guarantors party thereto and Wells Fargo Bank, National Association, as trustee (Form 8-K dated March 12, 2010 (File No. 1-8182, Exhibit 4.1)). |
| | | | | |
| 4.3* | | - | | Registration Rights Agreement, dated March 11, 2010, by and among Pioneer Drilling Company, the subsidiary guarantors party thereto and the initial purchasers party thereto (Form 8-K dated March 12, 2010 (File No. 1-8182, Exhibit 4.2)). |
| | | | | |
| 4.4* | | - | | First Supplemental Indenture, dated November 21, 2011, by and among Pioneer Drilling Company, the subsidiary guarantors party thereto and Wells Fargo Bank, National Association, as trustee (Form 8-K dated November 21, 2011 (File No. 1-8182, Exhibit 4.2)).
|
| | | | |
| 4.5* | | - | | Registration Rights Agreement, dated November 21, 2011, by and among Pioneer Drilling Company, the subsidiary guarantors party thereto and the initial purchasers party thereto (Form 8-K dated November 21, 2011 (File No. 1-8182, Exhibit 4.3)). |
| | | |
| 4.6* | - | Second Supplemental Indenture, dated October 1, 2012, among Pioneer Coiled Tubing Services, LLC, Pioneer Energy Services Corp., the other subsidiary guarantors and Wells Fargo Bank, National Association, as trustee (Form 10-Q dated November 1, 2012 (File No. 1-8182, Exhibit 4.6)).
|
| | |
| 10.1* | | - | | Purchase Agreement, dated March 4, 2010, by and among Pioneer Drilling Company, the subsidiary guarantors party thereto and the initial purchasers party thereto (Form 8-K dated March 5, 2010 (File No. 1-8182, Exhibit 10.1)). |
| | | | | |
| 10.2* | | - | | Purchase Agreement, dated November 15, 2011, by and among Pioneer Drilling Company, the subsidiary guarantors party thereto and the initial purchasers party thereto (Form 8-K dated November 16, 2011 (File No. 1-8182, Exhibit 10.1)).
|
| | | | | |
| 10.3* | | - | | Pioneer Drilling Company 2007 Incentive Plan Form of Long-Term Incentive Cash Award Agreement (Form 10-Q dated August 5, 2010 (File No. 1-8182, Exhibit 10.1)). |
| | | | | |
| 10.4+* | | - | | Pioneer Drilling Company 2007 Incentive Plan Form of Long-Term Incentive Cash Award Agreement (Form 10-Q dated August 5, 2010 (File No. 1-8182, Exhibit 10.2)). |
| | | | | |
| 10.5+* | | - | | Pioneer Drilling Company 2007 Incentive Plan Form of Long-Term Incentive Restricted Stock Award Agreement (Form 10-Q dated August 5, 2010 (File No. 1-8182, Exhibit 10.3)). |
| | | | | |
|
| | | | |
Exhibit
Number
| | | | Description |
| 10.6+* | | - | | Pioneer Drilling Company 2007 Incentive Plan Form of Restricted Stock Unit Agreement (Form 10-Q dated August 5, 2010 (File No. 1-8182, Exhibit 10.4)). |
| | | | | |
| 10.7+* | | - | | Pioneer Drilling Services, Ltd. Annual Incentive Compensation Plan dated August 5, 2005 (Form 8-K dated August 5, 2005 (File No. 1-8182, Exhibit 10.1)). |
| | | | | |
| 10.8+* | | - | | Pioneer Drilling Company Amended and Restated Key Executive Severance Plan dated December 10, 2007 (Form 10-Q for the quarter ended March 31, 2008 (File No. 1-8182, Exhibit 10.4)). |
| | | | | |
| 10.9+* | | - | | Pioneer Drilling Company’s 1995 Stock Plan and form of Stock Option Agreement (Form 10-K for the year ended March 31, 2001 (File No. 1-8182, Exhibit 10.5)). |
| | | | | |
| 10.10+* | | - | | Pioneer Drilling Company’s 1999 Stock Plan and form of Stock Option Agreement (Form 10-K for the year ended March 31, 2001 (File No. 1-8182, Exhibit 10.7)). |
| | | | | |
| 10.11+* | | - | | Pioneer Drilling Company 2003 Stock Plan (Form S-8 filed November 18, 2003 (File No. 333-110569, Exhibit 4.4)). |
| | | | | |
| 10.12+* | | - | | Pioneer Drilling Company Amended and Restated 2007 Incentive Plan (Form 10-Q for the quarter ended September 30, 2011 (File No. 1-8182, Exhibit 10.1)). |
| | | |
|
| | |
| 10.13+* | | - | | Pioneer Drilling Company 2007 Incentive Plan Form of Stock Option Agreement (Form 8-K dated September 4, 2008 (File No. 1-8182, Exhibit 10.1)). |
| | | | | |
| 10.14+* | | - | | Pioneer Drilling Company 2007 Incentive Plan Form of Employee Restricted Stock Award Agreement (Form 8-K dated September 4, 2008 (File No. 1-8182, Exhibit 10.2)). |
| | | | | |
| 10.15+* | | - | | Pioneer Drilling Company 2007 Incentive Plan Form of Non-Employee Director Restricted Stock Award Agreement (Form 8-K dated September 4, 2008 (File No. 1-8182, Exhibit 10.3)). |
| | | | | |
| 10.16+* | | - | | Pioneer Drilling Company Form of Indemnification Agreement (Form 8-K dated August 8, 2007 (File No. 1-8182, Exhibit 10.1)). |
| | | | | |
| 10.17+* | | - | | Pioneer Drilling Company Employee Relocation Policy Executive Officers – Package A (Form 8-K dated August 8, 2007 (File No. 1-8182, Exhibit 10.3)). |
| | | | | |
|
| | | | |
Exhibit
Number
| | | | Description |
| 10.18* | | - | | Amended and Restated Credit Agreement, dated as of June 30, 2011 among Pioneer Drilling Company, the lenders party thereto, and Wells Fargo Bank, N.A., as administrative agent, issuing lender and swing line lender (Form 8-K dated July 5, 2011 (File No. 1-8182, Exhibit 10.1)).
|
| | | | |
| 10.19+* | | - | | Employment Letter, effective March 1, 2008, from Pioneer Drilling Company to Joseph B. Eustace (Form 8-K dated March 5, 2008 (File No. 1-8182, Exhibit 10.1)). |
| | | | | |
| 10.20+* | | - | | Confidentiality and Non-Competition Agreement, dated February 29, 2008, by and between Pioneer Drilling Company, Pioneer Production Services, Inc. and Joe Eustace (Form 8-K dated March 5, 2008 (File No. 1-8182, Exhibit 10.2)). |
| | | | | |
| 10.21+* | | - | | Employment Letter, effective January 7, 2009, from Pioneer Drilling Company to Lorne E. Phillips (Form 8-K dated January 14, 2009 (File No. 1-8182, Exhibit 10.1)). |
| | | |
| 10.22+* | - | Pioneer Energy Services Corp. Nonqualified Retirement Savings and Investment Plan (Form 8-K dated January 30, 2013 (File No. 1-8182, Exhibit 10.1)). |
| | |
| 12.1** | | - | | Computation of ratio of earnings to fixed charges. |
| | | | | |
21.1# | 21.1** | - | | Subsidiaries of Pioneer Drilling Company.Energy Services Corp. |
| | | | | |
23.1# | 23.1** | - | | Consent of Independent Registered Public Accounting Firm. |
| | | | | |
| 31.1** | | - | | Certification by Wm. Stacy Locke, President and Chief Executive Officer, pursuant to Rule 13a-14(a) or Rule 15d-14(a) under the Securities Exchange Act of 1934. |
| | | | | |
| 31.2** | | - | | Certification by Lorne E. Phillips, Executive Vice President and Chief Financial Officer, pursuant to Rule 13a-14(a) or Rule 15d-14(a) under the Securities Exchange Act of 1934. |
| | | | | |
| 32.1# | | - | | Certification by Wm. Stacy Locke, President and Chief Executive Officer, pursuant to Section 906 of the Sarbanes-Oxley Act of 2002 (Subsections (a) and (b) of Section 1350, Chapter 63 of Title 18, United States Code).2002. |
| | | | |
| 32.2# | | - | | Certification by Lorne E. Phillips, Executive Vice President and Chief Financial Officer, pursuant to Section 906 of the Sarbanes-Oxley Act of 2002 (Subsections (a) and (b) of Section 1350, Chapter 63 of Title 18, United States Code).2002. |
| | | | |
| 101# | | - | | The following financial statements from Pioneer Drilling Company’sEnergy Services Corp.’s Form 10-K for the year ended December 31, 2011,2012, formatted in XBRL (eXtensible Business Reporting Language): (i) Consolidated Balance Sheets, (ii) Consolidated Statements of Operations, (iii) Consolidated Statements of Shareholders' Equity and Comprehensive Income, (iv) Consolidated Statements of Shareholders' Equity, (v) Consolidated Statements of Cash Flows, and (v)(vi) Notes to Condensed Consolidated Financial Statements, tagged in detail.Statements. Information is furnished and not filed and is not incorporated by reference in any registration statement or prospectus for purposes of sections 11 or 12 of the Securities Act of 1933, as amended, is deemed not filed for purposes of section 18 of the Securities Exchange Act of 1934, as amended, and otherwise is not subject to liability under those sections.
|
_______________
| |
* | Incorporated by reference to the filing indicated. |
| |
+ | * Incorporated by reference to the filing indicated. ** Filed herewith. # Furnished herewith. + Management contract or compensatory plan or arrangement. |