UNITED STATES
SECURITIES AND EXCHANGE COMMISSION
Washington, D.C. 20549
FORM 10-K
|
| | |
(Mark One) |
þx | ANNUAL REPORT PURSUANT TO SECTION 13 OR 15(d) OF THE SECURITIES EXCHANGE ACT OF 1934 |
For the fiscal year ended December 31, 20112013
Or
|
| | |
or |
| ¨ | TRANSITION REPORT PURSUANT TO SECTION 13 OR 15(d) OF THE SECURITIES EXCHANGE ACT OF 1934 |
For the transition period from to .
|
For the transition period from to
Commission file number: 000-53206File Number: 001-35568 (Healthcare Trust of America, Inc.)
Commission File Number: 333-190916 (Healthcare Trust of America Holdings, LP)
HEALTHCARE TRUST OF AMERICA, INC.
HEALTHCARE TRUST OF AMERICA HOLDINGS, LP
(Exact name of registrant as specified in its charter)
|
| |
| Maryland (Healthcare Trust of America, Inc.) | 20-4738467 |
Delaware (Healthcare Trust of America Holdings, LP) | 20-4738347 |
| (State or other jurisdiction of incorporation or organization) | (I.R.S. Employer Identification No.) |
| |
16435 N. Scottsdale Road, Suite 320, Scottsdale, Arizona | 85254 |
| (Address of principal executive offices) | 85254
(Zip Code) |
Registrant’s telephone number, including area code: (480) 998-3478
Securities registered pursuant to Section 12(b) of the Act:
|
| |
| Title of each class | Name of each exchange on which registered |
NoneClass A common stock, par value $0.01 per share | NoneNew York Stock Exchange |
Securities registered pursuant to Section 12(g) of the Act:
Common Stock, $0.01 par value per shareNone
(TitleIndicate by check mark if the registrant is a well-known seasoned issuer, as defined in Rule 405 of Class)the Securities Act.
|
| | | |
Indicate by check mark if the registrant is a well-known seasoned issuer, as defined in Rule 405Healthcare Trust of the Securities Act.America, Inc. | Yesx ¨Yes
| No¨ þNo
| |
| Healthcare Trust of America Holdings, LP | ¨ Yes | x No | |
Indicate by check mark if the registrant is not required to file reports pursuant to Section 13 or Section 15(d) of the Act.
|
| | | |
Indicate by check mark if the registrant is not required to file reports pursuant to Section 13 or Section 15(d)Healthcare Trust of the Act.America, Inc. | Yes¨ ¨Yes
| Nox þNo
| |
| Healthcare Trust of America Holdings, LP | ¨ Yes | x No | |
Indicate by check mark whether the registrant: (1) has filed all reports required to be filed by Sections 13 or 15(d) of the Securities Exchange Act of 1934 during the preceding 12 months (or for such shorter period that the registrant was required to file such reports), and (2) has been subject to such filing requirements for the past 90 days.
|
| | | |
Indicate by check mark whether the registrant (1) has filed all reports required to be filed by Section 13 or 15(d)Healthcare Trust of the Securities Exchange Act of 1934 during the preceding 12 months (or for such shorter period that the registrant was required to file such reports), and (2) has been subject to such filing requirements for the past 90 days.America, Inc. | Yesx þYes
| No¨ ¨No
| |
| Healthcare Trust of America Holdings, LP | x Yes | ¨ No | |
Indicate by check mark whether the registrant has submitted electronically and posted on its corporate Web site, if any, every Interactive Data File required to be submitted and posted pursuant to Rule 405 of Regulation S-T (§ 232.405 of this chapter) during the preceding 12 months (or for such shorter period that the registrant was required to submit and post such files).
|
| | | |
Indicate by check mark whether the registrant has submitted electronically and posted on its corporate Web site, if any, every Interactive Data File required to be submitted and posted pursuant to Rule 405Healthcare Trust of Regulation S-T (§ 232.405 of this chapter) during the preceding 12 months (or for such shorter period that the registrant was required to submit and post such files).America, Inc. | Yesx þYes
| ¨ No | |
| Healthcare Trust of America Holdings, LP | x Yes | ¨ No | |
Indicate by check mark if disclosure of delinquent filers pursuant to Item 405 of Regulation S-K (§ 229.405 of this chapter) is not contained herein, and will not be contained, to the best of registrant’s knowledge, in definitive proxy or information statements incorporated by reference in Part III of this Form 10-K or any amendment to this Form 10-K. ¨
|
| |
Indicate by check mark if disclosure of delinquent filers pursuant to Item 405 of Regulation S-K (§ 229.405 of this chapter) is not contained herein, and will not be contained, to the best of registrant’s knowledge, in definitive proxy or information statements incorporated by reference in Part III of this Form 10-K or any amendment to this Form 10-K. | þ |
Indicate by check mark whether the registrant is a large accelerated filer, an accelerated filer, a non-accelerated filer, or a smaller reporting company. See the definitions of “large accelerated filer,” “accelerated filer” and “smaller reporting company” in Rule 12b-2 of the Exchange Act.
|
| | | |
Large accelerated filer | ¨ | Accelerated filer | ¨ |
Non-accelerated filerHealthcare Trust of America, Inc. | þLarge-accelerated filer (Dox
| Accelerated filer ¨ | Non-accelerated filer ¨ | Smaller reporting company ¨ |
| | | (Do not check if a smaller reporting company) | |
| Healthcare Trust of America Holdings, LP | Large-accelerated filer ¨ | Accelerated filer ¨ | Non-accelerated filer x | Smaller reporting company¨ |
| ¨ | | (Do not check if a smaller reporting company) | |
Indicate by check mark whether the registrant is a shell company (as defined in Rule 12b-2 of the Exchange Act).
|
| | | |
Indicate by check mark whether the registrant is a shell company (as defined in Rule 12b-2Healthcare Trust of the Act).America, Inc. | Yes¨ ¨Yes
| Nox þNo
| |
| Healthcare Trust of America Holdings, LP | ¨ Yes | x No | |
While there is no established market for the registrant’s common stock, theThe aggregate market value of the registrant’sHealthcare Trust of America, Inc.’s Class A common stock held by non-affiliates of the registrant as of June 30, 2011,28, 2013, the last business day of the registrant’s most recently completed second fiscal quarter, was approximately $1,624,601,000, assuming a market value of $10.00 per share which was$1,879,465,000, computed by reference to the closing price per share in our recently-completed offering.as reported on the New York Stock Exchange.
As of March 23, 2012February 19, 2014, there were 229,502,006237,291,846 shares of Class A common stock of the registrantHealthcare Trust of America, Inc. outstanding.
DOCUMENTS INCORPORATED BY REFERENCE
Portions of the Registrant'sRegistrant’s definitive Proxy Statementstatement for the Annual Meeting of Stockholders to be held in July 2012 are incorporated by reference into Part III, Items 10 through 1410-14 of this Annual Report on Form 10-K.
Explanatory Note
This report combines the Annual Reports on Form 10-K for the year ended December 31, 2013 of Healthcare Trust of America, Inc., a Maryland corporation, and Healthcare Trust of America Holdings, LP, a Delaware limited partnership. Unless otherwise indicated or unless the context requires otherwise, all references in this report to “we,” “us,” “our,” “the Company” or “our Company” refer to Healthcare Trust of America, Inc. and Healthcare Trust of America Holdings, LP, collectively.
Healthcare Trust of America, Inc. (“HTA”) operates as a real estate investment trust, or REIT, and is the general partner of Healthcare Trust of America Holdings, LP (“HTALP”). As of December 31, 2013, HTA owned a 98.94% partnership interest in HTALP, and other limited partners, including some of HTA’s directors, executive officers and their affiliates, owned the remaining partnership interest (including the long term incentive plan, or LTIP, units) in HTALP. As the sole general partner of HTALP, HTA has the full, exclusive and complete responsibility for HTALP’s day-to-day management and control, including its compliance with Securities and Exchange Commission filing requirements.
We believe it is important to understand the few differences between HTA and HTALP in the context of how we operate as an integrated consolidated company. HTA operates in an umbrella partnership REIT structure in which HTALP and its subsidiaries hold substantially all of the assets. HTA’s only material asset is its ownership of partnership interests of HTALP. As a result, HTA does not conduct business itself, other than acting as the sole general partner of HTALP, issuing public equity from time to time and guaranteeing certain debts of HTALP. HTALP conducts the operations of the business and has no publicly traded equity. Except for net proceeds from public equity issuances by HTA, which are generally contributed to HTALP in exchange for partnership units, HTALP generates the capital required through its operations, and by direct or indirect incurrence of indebtedness or through the issuance of partnership units.
Redeemable noncontrolling interests of limited partners, stockholders’ equity and partners’ capital are the primary areas of difference between the consolidated financial statements of HTA and HTALP. Limited partner units in HTALP are accounted for as partners’ capital in HTALP’s consolidated balance sheets and as noncontrolling interest reflected within equity or redeemable noncontrolling interest of limited partners reflected outside of equity in HTA’s consolidated balance sheets. The differences between HTA’s stockholders’ equity and HTALP’s partners’ capital is due to the differences in the equity issued by HTA and HTALP, respectively.
The Company believes combining the Annual Reports on Form 10-K of HTA and HTALP, including the notes to the consolidated financial statements, into this single report results in the following benefits:
enhances stockholders’ understanding of HTA and HTALP by enabling stockholders to view the business as a whole in the same manner that management views and operates the business;
eliminates duplicative disclosure and provides a more streamlined and readable presentation since a substantial portion of the disclosure in this report applies to both HTA and HTALP; and
creates time and cost efficiencies through the preparation of a single combined report instead of two separate reports.
In order to highlight the material differences between HTA and HTALP, this report includes sections that separately present and discuss areas that are materially different between HTA and HTALP, including:
the market for registrant’s common equity, related stockholder matters and issuer purchase of equity securities in Item 5 of this report;
the selected financial data in Item 6 of this report;
the funds from operations and normalized funds from operations in Item 7 of this report;
the controls and procedures in Item 9A of this report;
the consolidated financial statements in Item 15 of this report;
certain accompanying notes to the consolidated financial statements, including Note 3 - Business Combinations, Note 11 - Stockholders’ Equity and Partners’ Capital, Note 13 - Per Share Data of HTA, Note 14 - Per Unit Data of HTALP, Note 18 - Selected Quarterly Financial Data of HTA and Note 19 - Selected Quarterly Financial Data of HTALP;
the certifications of the Chief Executive Officer and the Chief Financial Officer included as Exhibits 31 and 32 to this report; and
the statement regarding the computation of the ratio of earnings to fixed charged included as Exhibit 12.1 to this report.
In the sections of this report that combine disclosure for HTA and HTALP, this report refers to actions or holdings as being actions or holdings of the Company. Although HTALP (directly or indirectly through one of its subsidiaries) is generally the entity that enters into contracts, holds assets, and issues or incurs debt, management believes this presentation is appropriate for the reasons set forth above and because the business of the Company is a single integrated enterprise operated through HTALP.
Healthcare Trust of America, Inc.
(A Maryland Corporation)
HEALTHCARE TRUST OF AMERICA, INC. AND HEALTHCARE TRUST OF AMERICA HOLDINGS, LP
TABLE OF CONTENTS
|
| | |
| | | Page |
|
| | |
| | |
| | |
| | |
| | |
| | |
| | |
|
| | |
| | |
| | |
| | |
| | |
| | |
| | |
| | |
| | |
|
| | |
| | |
| | |
| | |
| | |
| | | |
|
| | |
| |
EX-21.1 |
EX-23.1 |
EX-31.1 |
EX-31.2 |
EX-32.1 |
EX-32.2 |
PART I
The use of the words “we,” “us” or “our” refers to Healthcare Trust of America, Inc. (“HTA”), a Maryland corporation, and its subsidiaries, including Healthcare Trust of America Holdings, LP (“HTALP”), a Delaware limited partnership, were incorporated or our operating partnership, except where the context otherwise requires.formed, as applicable, on April 20, 2006.
BUSINESS OVERVIEW
We areHTA is a fully integrated, self-administered and self-managed real estate investment trust, or REIT. We acquire, ownREIT, and operate medical office buildingsone of the largest dedicated owners and other facilities that serve the healthcare industry. Since January 2007, we have been an active, disciplined buyeroperators of medical office buildings in the United States. Our primary objective is to generate stockholder value through consistent and other facilities that serve the healthcare industry, acquiring properties with an aggregate purchase pricegrowing dividends and appreciation of real property value. The Company has invested approximately $2.3$3.0 billion and building key industry relationships with significant healthcare systems and quality tenants. We are one to form a portfolio of the largest owners ofpredominately medical office buildings based onlocated in core, critical locations in key markets throughout the United States that we believe are positioned to provide healthcare services over the long term.
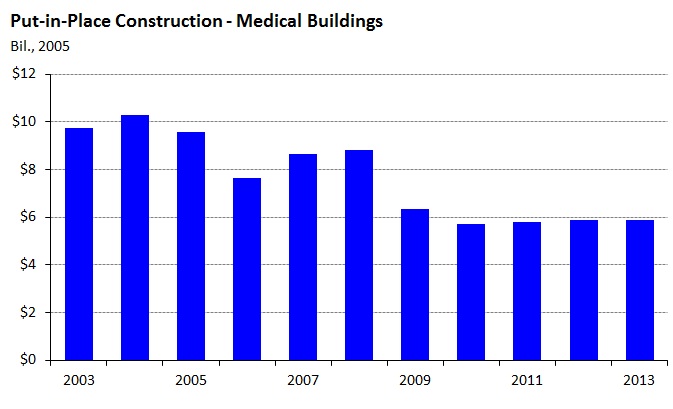
We invest in medical office buildings because we believe they provide stable cash flows with relatively low vacancy risk, while still allowing for potentially higher returns through their exposure to the fast growing healthcare sector. Healthcare is the fastest growing segment of the U.S. economy with expenditures expected to grow 5.9% per annum and account for 19.2% of gross domestic product, or GDP, by 2020 according to the U.S. Centers for Medicare & Medicaid Services. Similarly, healthcare is experiencing the fastest employment growth in the U.S., a trend that is expected to continue through 2020. These high levels of demand are driven by the aging of the U.S. population and the long term impact of the Affordable Care Act. As importantly, these healthcare services are increasingly being provided in the lower cost and more convenient outpatient settings such as medical office buildings.
As of December 31, 2013, our portfolio consisted of 14.1 million square feet of gross leasable area, or GLA, inGLA. Approximately 96% of our portfolio is located on the United States. Ourcampuses of or affiliated with nationally or regionally recognized healthcare systems. We believe these key locations and affiliations create significant demand from healthcare related tenants for our properties. Further, the portfolio is primarily concentrated within major U.S. metropolitan areas and located primarily on or adjacent to campuses of nationally recognized healthcare systems.
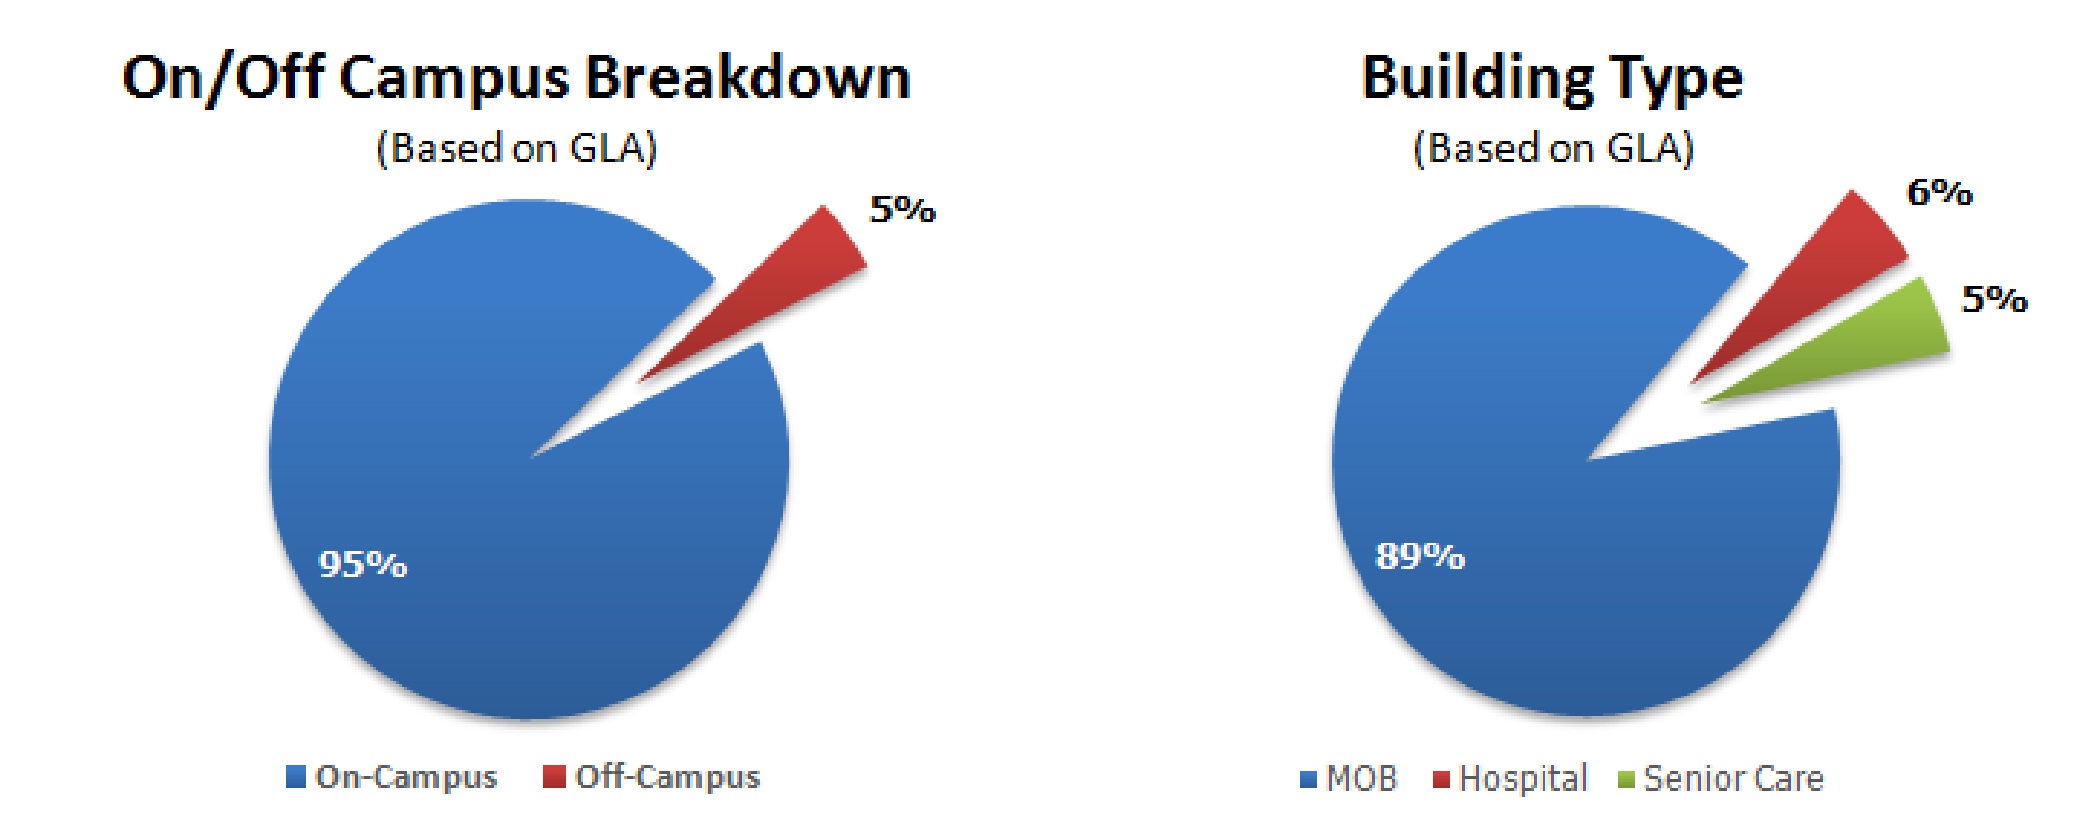
As of December 31, 2011, approximately 57% of our annualized base rent was derived from tenants or their parent companies that have a credit rating as determined by a nationally recognized rating agency. Approximately 38% of our annualized base rent was derived from tenants that have an investment grade credit rating as determined by nationally recognized rating agencies, including, but not limited to, Greenville Hospital System, Community Health Systems, Aurora Healthcare, West Penn Allegheny Health System, Indiana University Health, Hospital Corporation of America, and Banner Health. As of December 31, 2011, our portfolio contains approximately 11.2 million square feet of GLA with an occupancy rate of approximately 91%, including leases signed but which have not yet commenced. Approximately 95% of our portfolio (based on GLA) is located on, adjacent to, or anchored by the campuses of nationally and regionally recognized healthcare systems. Our portfolio is diversified geographically, across 25 states, with no state having more than 13% of the GLA of our portfolio. As of December 31, 2011, none of our tenants at our properties accounted for 7.0% or more of our aggregate annual rental revenue. Our portfolio consisted of 248 medical office buildings and other facilities that serve the healthcare industry, as well as two mortgage loans receivable.
We invest primarily in medical office buildings based on fundamental healthcare and real estate economics. Medical office buildings serve a critical role in the national healthcare delivery system, and we believe there are key dynamics within the healthcare industry that increase the need for, and the value of, medical office buildings. As hospitals and other facilities that serve the healthcare industry and physicians continue to collaborate, we believe an increasing number of healthcare services will be undertaken in medical offices. Further, with healthcare reform projected to expand coverage to over 30 million additional patients by 2019, we believe the performance of office-based services will play a key role in providing quality healthcare while also allowing for the recognition of cost efficiencies. In addition, as the emphasis within the healthcare industry moves toward preventative care, rather than responsive care, we expect that more healthcare services will be undertaken at medical offices.
Another key reason that we invest in medical office buildings is that we believe there is generallywill grow economically and demographically over the potential for higher returns with lower vacancy risk relative to other types of real estate investing. Like traditional commercial office property, as we renew leases and lease new space, we expect that the recovering economy will allow us to earn higher rents. Unlike commercial office space, however, medical office tenants, primarily physicians, hospitals and other healthcare providers, typically do not move or relocate, thus providing for stable tenancies and an ongoing demand for medical office space.coming years.
We are a Maryland corporation, formed in April 2006. Since that time, we have raised equity capital to finance our real estate investment activities through two public offerings of our common stock. Our offerings raised an aggregate of approximately $2.2 billion in gross offering proceeds, excluding proceeds associated with shares issued under our distribution reinvestment plan, or DRIP. Our principal executive offices are located at 16435 North Scottsdale Road, Suite 320, Scottsdale, AZ 85254 and our telephone number is (480) 998-3478. We maintain a web site at www.htareit.com at which there isyou may find additional information about us. The contents of that site are not incorporated by reference in, or otherwise a part of this filing. We make our periodic and current reports, as well as any amendments to such reports, available at www.htareit.com as soon as reasonably practicable after such materials are electronically filed with the Securities Exchange Commission, or the SEC. They are also available for printing forin hard copy to any stockholder upon request.
HIGHLIGHTS
During the year ended December 31, 2013, we acquired $397.8 million of high quality medical office buildings, representing an expansion of almost 15% by investment, based on purchase price. These acquisitions totaled approximately 1.5 million square feet of GLA. These properties are located in the key markets of Dallas, Denver, Miami, Tampa and West Palm Beach.
In 2013, we consistently achieved Same-Property Adjusted NOI growth of 3% or more each quarter.
In December 2013, our credit rating was upgraded which decreased the interest rate on our variable rate term loans and revolving credit facility. Taking into account the January 2014 amendment to the unsecured credit agreement, the total interest expense savings based on the current outstanding balances on these facilities is expected to be approximately $2.5 million in 2014.
During 2013, HTA generated returns that exceeded the SNL US REIT Healthcare Index by approximately 1,100 basis points and the MSCI US REIT (RMS) Index by approximately 230 basis points.
During 2013, we declared cash dividends of $0.575 per share that were paid to stockholders in equal quarterly installments.
During the year ended December 31, 2013, HTA issued and sold approximately 21.9 million shares of Class A common stock at an average price of $11.22 per share under HTA’s equity at-the-market, or ATM, program.
In March 2013, we issued and sold $300.0 million of 10-year unsecured senior notes at a rate of 3.70% per annum.
In November 2013, the last of HTA’s shares of Class B common stock converted to shares of Class A common stock, providing full liquidity to all of our stockholders.
As of December 31, 2013, we had a strong and flexible balance sheet with total liquidity of $613.1 million, including cash and cash equivalents of $18.1 million and $595.0 million available on our unsecured revolving credit facility. Our leverage ratio of total debt to total capitalization was 34.0%.
The occupancy rate on our portfolio increased 50 basis points during the year, ending at approximately 91.6% as of December 31, 2013. This included month-to-month leases and leases that have been executed, but which have not yet commenced.
In 2013, we consistently achieved tenant retention of 82% or more each quarter, and tenant retention for the year of 85%.
BUSINESS STRATEGIES
Our primary objectiveCorporate Strategies
Invest in and maintain a portfolio of properties that are well positioned for the long term future of healthcare delivery
The Company is focused on building and maintaining a portfolio of primarily medical office buildings that allow for the efficient delivery of healthcare over the long term. We believe that properties that are well located and efficient should increase in value over the long term. To date, we have invested over $3.0 billionto enhance stockholder value with disciplined growth through strategic investments and to provide an attractive total risk-adjusted return for our stockholders by consistently increasing our cash flow. The strategies we intend to execute to achieve this objective include:
Achieve Growth through Targeted Acquistions. We employ an acquisition philosophy that focuses primarilycreate one of the largest portfolios of healthcare real estate focused on mid-sized, relationship-driventhe medical office building targetssector in the United States. As a result, we look to allocate capital to properties that are located in established markets and that complement our existing portfolio. We emphasize building long-term relationships with healthcare systems, owners, operators, and otherexhibit the following key industry participants as a core aspect of our acquisition strategy. We believe our focusattributes:
Located on building such a strong, relationship-based network fosters opportunities for future growth of our company. We intend to grow through the strategic acquisition of high-quality medical office buildings and other facilities that serve the healthcare industry:
with stabilized occupancy that are located on or adjacent to the campuses of nationally recognizedor affiliated with leading healthcare systems in major U.S. metropolitan areas. On-campus locations provide for better tenant retention rates and rental rate growth as comparedthe United States. We seek to unaffiliated facilities;
that are affiliatedinvest with the country's top healthcare systems, which attract the top physicians. We will seek healthcare systems with dominant market share, and high credit quality;quality and those who are investing capital into their campuses. We believe our affiliations with these health systems help ensure long term tenant demand. At December 31, 2013, approximately 96% of our portfolio was located on-campus or affiliated with these health systems.
that are locatedIn attractive markets. We seek to own MOBs in high-growth primary and secondary markets with attractive demographics and favorable regulatory environments in business-friendly states or those with high barriers to entry;entry, especially those in which we can achieve operational and leasing efficiency. At December 31, 2013, over 50% of our GLA was located in 12 key markets throughout the U.S.
Well occupied with limited near term leasing risks. We have elected not to have an active development platform. As a result, we seek to invest in and maintain well occupied properties that create anbenefit from existing demand. We believe this positions us for long term value as hospitals and physicians are reluctant to move or relocate, as evidenced by our 2013 retention rate of 85%.
Occupied by credit-worthy tenants. Our primary tenants are the healthcare systems which maintain credit ratings with national rating agencies. At December 31, 2013, approximately 56% of our annual base rent comes from credit-rated tenants. A significant amount of our remaining rent comes from physicians and physician groups that are credit-worthy but do not have the size to benefit from a credit rating. We believe this helps ensure the stability of our rental income, and that we are invested in buildings that are attractive to the long term providers of healthcare.
Provide balanced mix of credit-rated tenants with long-term, triple-nettenants. We actively invest in both multi-tenant properties, which have shorter leases with fixed, scheduled rental growthon smaller spaces, and multi-tenantsingle-tenant properties, which have longer term leases. The multi-tenanted buildings with greater market-driven growth opportunities.
provide for lower lease rollover risks in any particular year and regularly allow for rents to be re-set to current market rates. We believe we have relationships and a proven track record of acquiring properties in off-market transactions at accretive cap rates. We will continue to focus our acquisition activity primarily on high quality medical officesingle tenanted buildings which we believe comprise the majority of our current property portfolio. We believe our pure focus on the medical office building sector of healthcare related real estate will provide insulation from the impact of certain governmental regulatory actions, such as the recently-passed cut in 2012 Medicare payments to skilled nursing facilities. This is because medical office buildings typically have a diversified payer mix composed largely of private health insurance companies.
Actively Manage Our Balance Sheet Strength and Flexibility. Our conservative balance sheet, with approximately 27.9% leverage as of December 31, 2011, and flexibility with our unused $575 million unsecured credit facility is crucial to our strategic growth. We actively manage our balance sheet to maintain conservative leverage with carefully staged debt maturities. This positions us to take advantage of strategic investment opportunities. We intend to utilize our unsecured line of credit for acquisition opportunities on a short-term basis. We have a number of sources of liquidity available to effectively manage our long-term leverage strategy, such as unsecured bank debt, mortgage financing, public debt, and private equity. We may also attempt to access the public equity markets to repay our secured debt maturities orsteady long term cash flow, but generally provide for future acquisition opportunities.more limited long term growth.
Maximize Internal Growth through Proactive Asset Management, Leasing and Property Management Oversight. Oversight
Our internal asset management focuses onteam operates approximately 85% of our total portfolio, a definedsignificant increase from approximately 70% a year ago. We believe this direct approach allows us to maximize our internal growth strategy, seizing on opportunities to achieve more profitable internal and external growth. Our strategy focuses on increasingby improving occupancy, optimizing rental rates, while maximizingand improving operating efficiencies at our properties. Specific components of our overall strategy include:
migrating towardMaintaining regional offices in markets where we have a significant presence, which enables our HTA-dedicatedin-house property management and leasing platform to (i) create closer relationships with national and regional healthcare systems and other tenants, and (ii) better respond to their needs. Our regional offices are located in geographic areas in which we have significant portfolio concentrations;Albany, Atlanta, Boston, Charleston, Dallas, Indianapolis, Pittsburgh and Scottsdale.
obtaining accretiveIncreasing our average rental rates, on our lease rolloversmaintaining or increasing renewal rates and actively leasing our vacant space, at a time when there is limited supply of medical office space in a slow-recovering economy;which contributed to our 3% or more Same-Property Adjusted NOI growth each quarter during 2013.
leveraging and proactively managing the best property management and leasing companies in markets not currently managed by our property management platform;
improvingImproving the quality of service provided to our tenants by being attentive to their needs, managing expenses, and strategically investing capital;capital. During 2013, we consistently achieved tenant retention of 82% or more each quarter, and tenant retention for the year of 85%.
maintainingMaintaining the high quality of our properties and building on our marketing initiative to brand our companyreputation as the landlord of choice;
maintaining regional offices in markets in which we have a significant presence;desirable and
purchasing in volume and using market expertise to continually reduce our operating costs.
COMPANY HIGHLIGHTS
In May 2011, we successfully increased our unsecured revolving credit facility to an aggregate maximum principal amount of $575,000,000 from $275,000,000 as well as extended its maturity date from November 2013 to May 2014.
As of December 31, 2011, we had a strong, flexible balance sheet with total assets of $2,291,629,000, cash on hand of $69,491,000, and a leverage ratio of our mortgage and secured term loans payable debt to total assets of approximately 27.9%.
In July 2011, we received ratings by two nationally recognized rating agencies. We believe these ratings, along with our strong balance sheet and conservative leverage, will allow us access to multiple sources of liquidity, such as unsecured bank debt, mortgage financing, and public debt.
We completed the sale of 21,564,900 shares of our common stock for $215,649,000 during the first quarter of 2011 pursuant to our follow-on offering and closed this offering on February 28, 2011, except for the DRIP.
For the year ended December 31, 2011, net income increased by 170.6% to $5,593,000 from a loss of $7,919,000 for the year ended December 31, 2010, and by 122.6% from a loss of $24,773,000 for the year ended December 31, 2009.
For the year ended December 31, 2011, Funds from Operations, or FFO, has increased by 60.2% to $113,135,000 from $70,642,000 for the year ended December 31, 2010, and by 292.5% from $28,822,000 for the year ended December 31, 2009. FFO is a non-GAAP financial measure. For a reconciliation of FFO to net income (loss), see Item 7, Management's Discussion and Analysis of Financial Condition and Results of Operations, "Funds from Operations and Normalized Funds from Operations".
During the year ended December 31, 2011, we transitioned a significant portion of our Indiana property portfolios to a regionally-focused property management platform with HTA-dedicated property management personnel. The addition of this market complemented the 34% of our overall portfolio that we had already been successfully managing with our asset management team. We believe such a platform provides us with the potential to reduce costs while enhancing our relationships with our hospital systems and physician tenants. Further, it allows us to improve the efficiency and effectiveness of property management and leasing. Following the success experienced with transitioning our Indiana portfolios, based on cost savings and enhanced tenant relations, we have begun the transition of properties in Arizona as well as in several east coast markets to our HTA-dedicated property management platform. Upon completion of these markets currently in transition, approximately 61% of our portfolio will be managed internally. We will continue to evaluate additional markets in which to expand our internal property management migration efforts in the future, based on concentrations of properties.
Our total portfolio of properties achieved an occupancy rate, including leases signed but not yet commenced, of approximately 91% as of December 31, 2011.
During the year ended December 31, 2011, we completed two new portfolio acquisitions and expanded two of our existing portfolios through the purchase of additional medical office buildings within each for an aggregate purchase price of $68,314,000. These purchases consist of six buildings comprised of approximately 306,000 square feet of GLA, bringing our total portfolio value, based on purchase price, to $2,334,673,000 as of December 31, 2011. These acquisitions possessed a weighted average acquisition-day occupancy rate of approximately 90%.
In February 2012, J.P. Morgan Securities, LLC, Deutsche Bank Securities Inc., and Wells Fargo Securities, LLC signed engagement letters to serve as Joint Lead Arrangers for a new credit facility of at least $825,000,000. As of March 23, 2012, the Joint Lead Arrangers and other additional lenders had committed in excess of that amount to the new credit facility. The credit facility, which will replace our existing credit facility, will have an initial term of four years, with one twelve-month extension. We anticipate closing the facility in the near future. The terms of this facility have not been finalized and there can be no assurance that we will enter into such facility on the terms or timing described herein or at all.landlord.
On February 14, 2012,Using market knowledge and economies of scale to seek to continually reduce our operating costs.
Achieve External Growth through Targeted Acquisitions
We plan to grow externally through targeted acquisitions that improve the quality of our portfolio and are accretive to our cost of capital. To achieve this growth in competitive markets, we completed the acquisitionseek:
| |
| ▪ | Mid-sized acquisitions in the $25 million to $75 million range. These transactions tend to be less competitive than larger transactions, but also allow us to exhibit meaningful growth given our current mid-market size. |
| |
| ▪ | Long term relationships with key industry participants. We plan to continue to emphasize building long-term relationships, cultivated by our senior management team, with key industry participants, including health systems and local and regional developers, which have traditionally provided us with valuable sources of potential investment opportunities. In this regard, approximately 73% of our acquisitions since January 2009, based on purchase price, were either sourced directly from hospitals and developers or were not marketed for sale. |
| |
| ▪ | Local knowledge through our internal asset management platform. Our local personnel are able to stay in touch with local industry activities which can provide insightful information on potential opportunities. |
Actively Maintain Strong, Flexible Capital Structure and Balance Sheet
We seek to actively manage our balance sheet to maintain our investment grade credit rating, to maintain conservative leverage, and to preserve financing flexibility. This positioning will allow us to take advantage of St. John Providence MOB, an approximately 203,000 square foot on-campus medical office building locatedstrategic investment opportunities. We have access to multiple forms of capital, including public debt and equity, unsecured bank loans and secured property-level debt. In addition, we may also pursue dispositions of properties that we believe no longer align with our strategic objectives in Novi, Michiganorder to redeploy capital. The strength of our balance sheet is demonstrated by our investment grade credit ratings, which we first received in an all-cash transaction for approximately $51,320,000. The St. John Providence MOB,July 2011 and which was 99% leasedmost recently upgraded in December 2013. To maintain our strong and flexible balance sheet, we:
Continue to maintain high liquidity primarily through our unsecured revolving credit facility. During 2013, we increased our unsecured revolving credit facility to $650.0 million, of which $595.0 million was available as of December 31, 2013.
Limit the dateamount of acquisition, is connected directlysecured debt. During 2013, the percentage of secured debt, including net premiums to the Providence Park Hospital via an enclosed walkway. Providence Park Hospital is parttotal capitalization decreased to 11.4% from 16.1% in 2012.
Maintain a low leverage ratio. Our leverage ratio of Ascension Health Systems (Moody's Investors Services rated Aa1).
On March 6, 2012, we completed the acquisition of Penn Avenue Place in Pittsburgh, Pennsylvania for a purchase price of approximately $54,000,000 in an all-cash transaction. Penn Avenue Place is an eight story, 558,000 square foot, Class A office building whichtotal debt to total capitalization was completely renovated in 1997. The building was approximately 99.6% occupied34.0% as of December 31, 2013.
Maintain well laddered debt maturities. As of December 31, 2013, we had $7.7 million, $74.0 million and $477.5 million of debt principal payments due in 2014, 2015 and 2016, respectively. After refinancing our $300.0 million term loan in January 2014, our principal payments due in 2016 was reduced to $177.5 million. During 2013, we increased the dateweighted average remaining term of acquisition and is anchored by Highmark, Inc. (Standard & Poor's Rating Services rated A). Highmark, Inc., which leases and occupies 92.4% of the building, is one of the largest Blue Cross affiliates in the nation. On January 1, 2012, Highmark, Inc. renewed its lease for an additional 10-year term.
On March 9, 2012, we entered into a purchase and sale agreement for a medical office buildingour debt portfolio located in the eastern United States for an aggregate purchase price of $100,000,000. The portfolio, which is expected to be master leased on a triple net basis, consists of a combination of on-campus assets and off-campus medical office buildings. We anticipate closing this acquisition in the near future, though there can be no assurance that the acquisition will close on our expected schedule, if at all.5.2 years, including extension options.
HEALTHCARE INDUSTRY
Healthcare Sector Growth
We operate in the healthcare industry because we believe this sector is benefiting from several macroeconomic events, including the demandAffordable Care Act, aging population, increases in healthcare employment, and increased healthcare spending.
The Affordable Care Act is a broad-based initiative that has the potential to expand health insurance coverage for healthcare real estatemany Americans, further increasing the number of people who are able to utilize medical services. The Congressional Budget Office estimates an additional 25 million individuals will continuegain access to insurance coverage by 2016 as a result of this reform. The Affordable Care Act’s focus on preventative care is expected to increase consistent with health spending in the United States. According toutilization of outpatient care into the U.S. Departmentfuture.
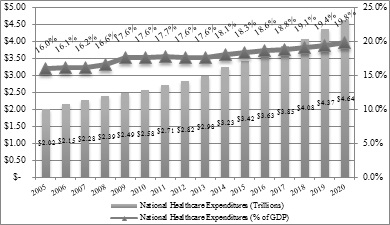
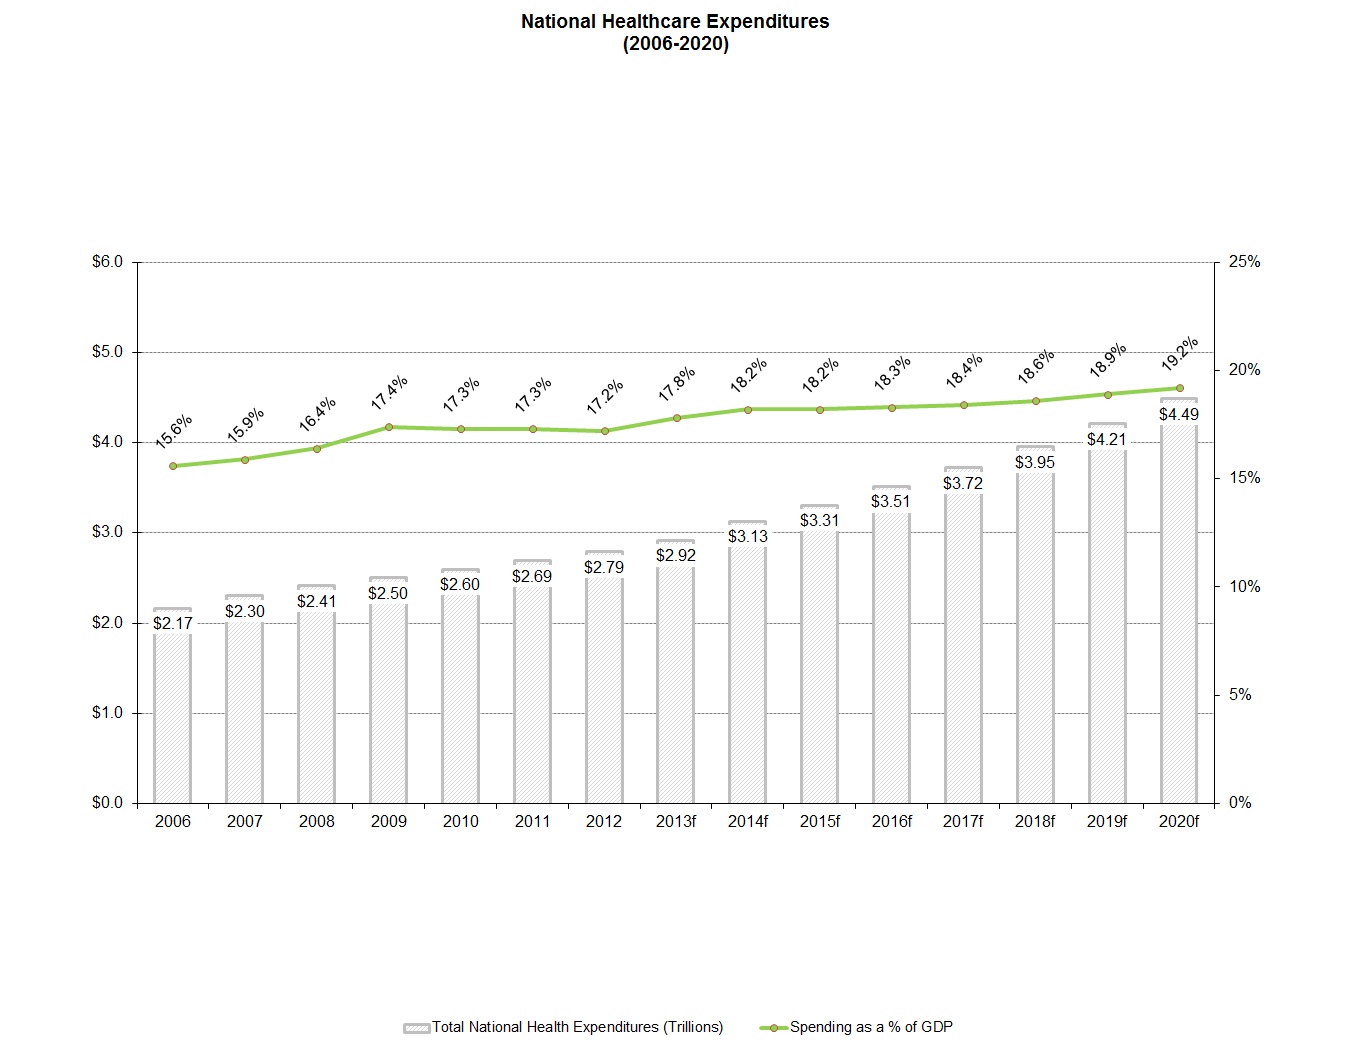
National Healthcare Expenditures
(2005-2020)
Source: U.S. Department of HealthCongressional Budget Office and Human Services. Centers for Medicare & Medicaid Services. Office of the Actuary. National Health ExpendituresRosen Consulting Group.
Advancements in medical technology and Selected Economic Indicators. Levelschanges in treatment methods have enabled people to live longer and Annual Percent Change: Calendar Years 2005-2020 (based on the version of the National Health Expenditures releasedhas resulted in January 2011).
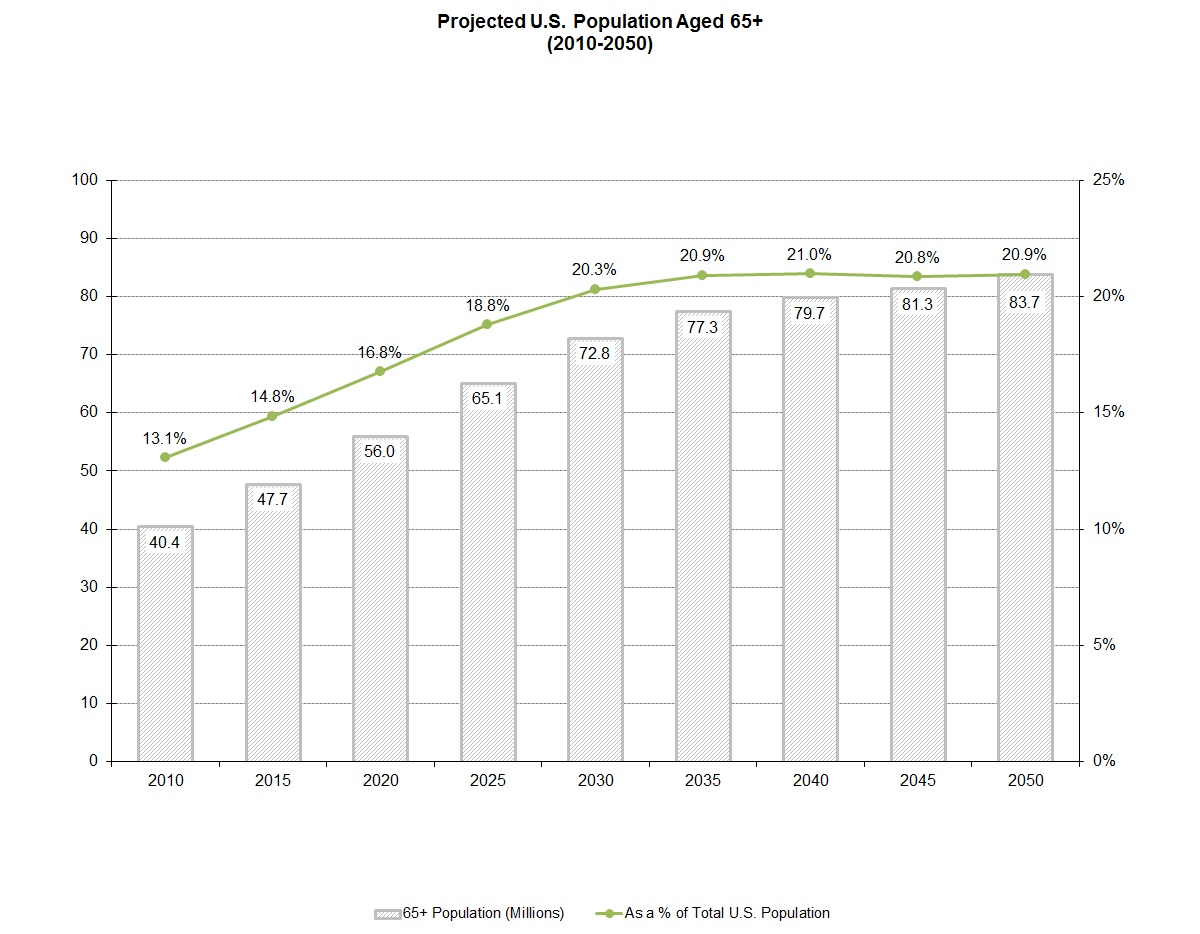
a growing elderly population. Between 2010 and 2050, the U.S. population over 65 years of age is projected to more than double from 40.240.4 million to nearly 88.583.7 million people, as reflected in the below chart. Similarly, the 85 and older population is expected to more than triple, from 5.7 million in 2010 to 19.0 million between 2010 and 2050. The number of older Americans is also growing as a percentage of the total U.S. population as the “baby boomers” enter their 60s.people. The number of persons older than 65 years of age was estimated to comprise 13.0%13.1% of the total U.S. population in 2010 and is projected to grow to 20.2%20.9% by 2050, as reflected in the below chart.
Projected U.S. Population Aged 65+
(2010-2050)
Source: U.S. Census Bureau, Population Division, August 14, 2008.
Based on the information above, we believe that healthcare expenditures for the population over 65 years of age will continue to rise as a disproportionate share of healthcare dollars is spent on older Americans.2050. According to the 20102012 Consumer Expenditure Survey, persons agedbetween 65 toand 74 years of age spent the highest amount annually for healthcare with more than $4,900$5,200 in annual personal expenditures including health insurance premiums. Those agedpersons more than 75 years of age followed closely with nearly $4,800$4,900 spent on healthcare per year. In contrast, persons aged less than 25 years of age spent only $775approximately $1,000 per year on healthcare. The older population group will increasingly require treatment and management of chronic and acute health ailments. We believe that this increased demand for healthcare services will create a substantial need for the development of additional medical office buildings and other facilities that serve the healthcare industry in many regions of the United States. Additionally, we believe that there will likely be a focus on lower cost outpatient care to support the aging U.S. population, which will continue to support medical office building demand in the long term.
Source: U.S. Census Bureau and Rosen Consulting Group.
Employment in the healthcare industry has steadily increased for at least 20 years despite three recessions. Healthcare-related jobs are among the fastest growing occupations, projected to increase 22% between 2012 and 2022, significantly higher than the general U.S. employment growth of 10.8% according to the Bureau of Labor Statistics. Additionally, healthcare related jobs are projected to account for eleven of the twenty fastest growing occupations. These occupations are estimated to grow by between 36% and 48% between 2012 and 2022, according to the most recent Bureau of Labor Statistics projections. Additionally, the Bureau of Labor Statistics projects seven out of the top twelve occupations with the highest demand for workers will be in the healthcare sector. We expect the increased growth in the healthcare industry will correspond with a growth in demand for medical office buildings and other facilities that serve the healthcare industry.
Source: Bureau of Labor Statistics and Rosen Consulting Group.
According to the latest data from 2012, Americas spent nearly $2.8 trillion, or 17.2% of total GDP, on healthcare expenditures, an increase of 3.7% from the previous year. The U.S. Centers for Medicare & Medicaid Services project that the total healthcare expenditures will reach approximately $5.0 trillion by 2022. Healthcare expenditures are projected to grow by 5.9% annually through 2022 and account for 19.2% of GDP by 2020. With healthcare costs remaining high, we believe thisinsurance providers will result in a substantial increase in suitable, quality properties meeting our acquisition criteria.encourage patients to transition to cost efficient, outpatient settings.
Source: U.S. Centers for Medicare & Medicaid Services and Rosen Consulting Group.
Medical Office Building Supply and Demand
We invest primarily in medical office buildings. We believe that healthcare-related real estate rents and valuations are less susceptible to changes in the general economy than general commercial real estate due to demographic trends and the resistance of rising healthcare expenditures to economic downturns. For this reason, we believe medical office building investments could potentially offer a more stable return to investors compared to other types of real estate investments. We believe that demand for medical office buildings and other facilities that serve the healthcare industry will increase due to a number of factors, including:
Evolution in the healthcare industry is a contributing factor, with procedures that have traditionally been performed in hospitals, such as surgery, moving to outpatient facilities as a result of shifting consumer preferences, limited space in hospitals, and lower costs. In addition, increased specialization within the medical field is driving the demand for medical office buildings suited specifically toward a particular specialty. Finally, some hospital systems have begun divesting their real estate holdings in order to better focus on the delivery of care.
An increase in medical office visits due to the overall rise in healthcare utilization has in turn driven hiring within the healthcare sector. This has increased the need for expansion of medical office facilities. Additionally, the increased dissemination of health research through media outlets, marketing of healthcare products, and availability of advanced screening techniques and medical procedures have contributed to a more engaged population of healthcare users. This has created a surge in demand for customized facilities providing specialized, preventive, and integrative medicine. Additionally, the rate of employment growth in physicians'physicians’ offices and outpatient care facilities has outpaced employment growth in hospitals during the past decade, further supporting the trend of increased utilization of healthcare services outside of the hospital. These factors, in combination with changing consumer preferences and limitations on hospital expansion, have resulted in the increased utilization of medical office space, a trend which is expected to continue over the long term. According to the Bureau of Labor Statistics, employment in physicians'physicians’ offices is expected to increase by a cumulative 36.4%38.4% from 20102012 to 2020, as compared with a projected 25.9%21.5% increase in all healthcare professions and a forecasted increase of 14.3%10.8% in total employment.employment during this time.
Advances in medical technology will continue to enable healthcare providers to identify and treat once fatal ailments and will improve the survival rate of critically ill and injured patients who will require continuing medical care. Along with these technical innovations, the U.S. population is growing older and living longer. In addition, according to the Centers for Disease Control and Prevention,Census Bureau, from 19501980 to 2005,2012, the average life expectancy at birth increased from 68.274 years to 77.978 years. By 2050,2020, the average life expectancy at birth is projected to increase to 82.680 years, according to the U.S. Census Bureau.
Construction of medical office buildings has been relatively constrained with little developable land and high-cost barriers to development.
Strong rent growth is forecasted as market conditions tighten due to limited development, a decline in vacancy rates, growth in healthcare employment, and a larger number of baby boomers entering retirement age. Beginning in 2013, rent growth for medical office buildings is expected to outpace rent growth for traditional office properties as healthcare employment increases at a faster pace than employment in traditional office-using industries.
Healthcare Industry TrendsSource: U.S. Census Bureau (as of Q3 2013) and OutlookRosen Consulting Group.
The current healthcare environment is impacted by several factors, each of which will inform the industry outlook over the long term:
According to the United States Department of Labor’s Bureau of Labor Statistics, the healthcare industry was the largest industry in the United States in 2006, providing 14 million jobs. Healthcare-related jobs are among the fastest growing occupations, accounting for ten of the 20 fastest growing occupations. The Bureau of Labor and Statistics estimates that healthcare will generate three million new wage and salary jobs between 2008 and 2018, more than any other industry. Wage and salary employment in the healthcare industry is projected to increase 22% through 2018, compared with 11% for all industries combined. Despite the downturn in the economy and widespread job losses in most industries, the healthcare industry has not been impacted. We expect the increased growth in the healthcare industry will correspond with a growth in demand for medical office buildings and other facilities that serve the healthcare industry.
Complex state and federal regulations govern physician hospital referrals. Patients typically are referred to particular hospitals by their physicians. To restrict hospitals from inappropriately influencing physicians to refer patients to them, federal and state governments adopted Medicare and Medicaid anti-fraud laws and regulations. One aspect of these complex laws and regulations addresses the leasing of medical office space by hospitals to physicians. One intent of the regulations is to restrict medical institutions from providing facilities to physicians at below market rates or on other terms that may present an opportunity for undue influence on physician referrals. The regulations are complex, and adherence to the regulations is time consuming and requires significant documentation and extensive reporting to regulators. The costs associated with regulatory compliance have encouraged many hospital and physician groups to seek third-party ownership and/or management of their healthcare-related facilities.
Physicians are increasingly forming group practices. To increase the numbers of patients they can see and thereby increase market share, physicians have formed and are forming group practices. By doing so, physicians can gain greater influence in negotiating rates with managed care companies and hospitals in which they perform services. Also, the creation of these groups allows for the dispersion of overhead costs over a larger revenue base and gives physicians the financial ability to acquire new and expensive diagnostic equipment. Moreover, certain group practices may benefit from certain exceptions to federal and state self-referral laws, permitting them to offer a broader range of medical services within their practices and to participate in the facility fee related to medical procedures. This increase in the number of group practices has led to the construction of new medical facilities in which the groups are housed and medical services are provided.
We believe that healthcare-related real estate rents and valuations are less susceptible to changes in the general economy than general commercial real estate due to demographic trends and the resistance of rising healthcare expenditures to economic downturns. For this reason, we believe healthcare-related real estate investments could potentially offer a more stable return to investors compared to other types of real estate investments.
We believe the confluence of these factors over the last several years, in combination with low interest rates and continued increases in the selling price of medical office buildings, has led to the following trends, which encourage third-party ownership of existing and newly developed medical properties:
Decentralization and Specialization. There is a continuing evolution toward delivery of medical services through smaller outpatient facilities located near patients and designed to treat specific diseases and conditions. In order to operate profitably within a managed care environment, physician practice groups and other medical services providers are aggressively trying to increase patient populations, while maintaining lower overhead costs by building new healthcare facilities in areas of population or patient growth. Continuing population shifts and ongoing demographic changes create a demand for additional properties, including an aging population requiring and demanding more medical services.
Hospital Consolidation and Recapitalization. Hospitals continue to consolidate in an effort to secure or expand market share, gain access to capital, and/or to achieve various economies of scale. Historically, these have been in the form of the expansion of investor-owned health systems through acquisitions or the merger of one or more tax-exempt health systems. Recently, new entrants include private equity firms that have either acquired hospital assets or are investing capital into existing tax-exempt organizations. We believe that accessing capital will continue to be a major area of focus for healthcare organizations, both in the short and long term.
Increasing Regulation. Evolving regulatory factors affecting healthcare delivery create an incentive for providers of medical services to focus on patient care, leaving real estate ownership and operation to third-party real estate professionals. Third-party ownership and management of hospital-affiliated medical office buildings substantially reduces the risk that hospitals will violate complex Medicare and Medicaid fraud and abuse statutes.
Modernization. Hospitals are modernizing by renovating existing properties and building new properties and becoming more efficient in the face of declining reimbursement and changing patient demographics. This trend has led to the development of new, smaller, specialty healthcare-related facilities as well as improvements to existing general acute care facilities. As a result, we believe hospitals will monetize their assets to redeploy needed capital.
Redeployment of Capital. Medical providers are increasingly focused on wisely investing their capital in their medical business. A growing number of medical providers have determined that third-party ownership of real estate with long term leases is an attractive alternative to investing their capital in bricks-and-mortar. Increasing use of expensive medical technology has placed additional demands on the capital requirements of medical services providers and physician practice groups. By selling their real estate assets and relying on third-party ownership of new healthcare properties, medical services providers and physician practice groups can generate the capital necessary to acquire the medical technology needed to provide more comprehensive services to patients and improve overall patient care.
Physician Practice Ownership. Many physician groups have reacquired their practice assets and real estate from national physician management companies or otherwise formed group practices to expand their market share. Other physicians have left hospital-based or HMO-based practices to form independent group practices. These physician groups are interested in new healthcare properties that will house medical businesses that regulations permit them to own. In addition to existing group practices, there is a growing trend for physicians in specialties, including cardiology, oncology, women’s health, orthopedics and urology, to enter into joint ventures and partnerships with hospitals, operators and financial sponsors to form specialty hospitals for the treatment of specific diseases. In general, we believe a significant number of these types of organizations have a limited interest in owning real estate and are aggressively looking for third-parties to own their healthcare properties.
The current regulatory environment remains an ongoing challenge for healthcare providers, who are under pressure to comply with complex healthcare laws and regulations designed to prevent fraud and abuse. These regulations, for example, prohibit physicians from referring patients to entities in which they have ownership or investment interests and prohibit hospitals from leasing space to physicians at below market rates. As a result, healthcare providers seek reduced liability costs and have an incentive to dispose of real estate to third parties, thus reducing the risk of violating fraud and abuse regulations. This environment creates investment opportunities for owners, acquirers and joint venture partners of healthcare real estate who understand the needs of healthcare professionals and can help keep tenant costs low. While the current regulatory environment is positive for healthcare operators, there is uncertainty as to the future of government policies and its potential impact on healthcare provider profitability.
PORTFOLIO OF PROPERTIES
As of December 31, 2011,2013, our portfolio consisted of 229269 medical office buildings and 19 other facilities that serve the healthcare industry, as well as two mortgage loans receivable.real estate notes receivable secured by medical office buildings. Our portfolio consistedis comprised of approximately 11.214.1 million square feet of GLA, with an occupancy rate of approximately 91.6%, including month-to-month leases signedand leases we have executed, but which have not yet commenced,commenced.
Our properties are primarily located onon-campus or adjacent to, or are anchored by, the campuses ofaligned with nationally and regionally recognized healthcare systems in the United States, including some of the largest in the United States,healthcare systems, such as AdventistForest Park Medical Center, Greenville Hospital System, Highmark, Hospital Corporation of America, Indiana University Health, Systems, AscensionPiedmont Healthcare, Steward Health Banner HealthCare System, Catholic Healthcare Partners, Catholic Healthcare West, Community Health Systems, HCA, Inc. and Tenet Healthcare Corporation.System. As of December 31, 2011,2013, approximately 95%96% of our portfolio, based on GLA, is located onon-campus or adjacent to, or was anchored by, the campuses of suchaligned with nationally and regionally recognized healthcare systems.
The following charts depict 1) the proportion of our portfolio that is located on or is aligned with the campuses of nationally recognized healthcare systems; and 2) the composition of our overall portfolio as of December 31, 2011:
|
| | | | | | | | | | | | | | | | | |
| Portfolio by Type | # of Buildings | | Annualized Base Rent (1) | | % of Total
Annualized Base Rent | | Purchase Price | | % of
Aggregate
Purchase Price | | Number of States |
| Medical office buildings | | | |
| | |
| | |
| | |
| | |
| Single-tenant, net lease | 55 | | $ | 41,205,000 |
| | 19.9 | % | | $ | 488,915,000 |
| | 20.9 | % | | 15 |
| Single-tenant, gross lease | 7 | | $ | 6,308,000 |
| | 3.1 | % | | $ | 70,504,000 |
| | 3.0 | % | | 4 |
| Multi-tenant, net lease | 73 | | $ | 52,558,000 |
| | 25.4 | % | | $ | 650,411,000 |
| | 27.9 | % | | 15 |
| Multi-tenant, gross lease | 94 | | $ | 77,765,000 |
| | 37.6 | % | | $ | 739,388,000 |
| | 31.7 | % | | 16 |
| Other facilities that serve the healthcare industry | | | |
| | |
| | |
| | |
| | |
| Hospitals, single-tenant, net lease | 10 | | $ | 20,692,000 |
| | 10.0 | % | | $ | 241,720,000 |
| | 10.4 | % | | 4 |
| Seniors housing, single-tenant, net lease | 9 | | $ | 8,236,000 |
| | 4.0 | % | | $ | 91,600,000 |
| | 3.9 | % | | 3 |
| Mortgage loans receivable | | | N/A |
| | N/A |
| | $ | 52,135,000 |
| | 2.2 | % | | 2 |
| TOTALS | 248 | | $ | 206,764,000 |
| | 100.0 | % | | $ | 2,334,673,000 |
| | 100.0 | % | | |
|
| | | | | | | | | | | |
| Portfolio Diversification by Type | | Number of Buildings | | GLA (1) | | Percent of
Total GLA | | Number of States |
| Medical office buildings: | | |
| | |
| | |
| | |
| Single-tenant | | 76 |
| | 3,159 |
| | 22.4 | % | | 17 |
| Multi-tenant | | 193 |
| | 9,685 |
| | 68.8 |
| | 23 |
| Other healthcare facilities: | | | | | | |
| | |
| Hospitals | | 10 |
| | 655 |
| | 4.7 |
| | 4 |
| Seniors housing | | 9 |
| | 581 |
| | 4.1 |
| | 3 |
| Total | | 288 |
| | 14,080 |
| | 100.0 | % | | |
________________________
SIGNIFICANT TENANTS
As of December 31, 2013, none of the tenants at our properties accounted for more than 6% of our annualized base rent. The table below depicts our top 15 health system relationships.
|
| | | | | | | | | | | | | | | | |
| Tenant | | Weighted Average Remaining Years in Lease Term | | Total Leased GLA (1) | | Percent of Leased GLA | | Annualized Base Rent (1) (2) | | Percent of Annualized Base Rent |
| Highmark | | 8 |
| | 856 |
| | 6.6 | % | | $ | 15,713 |
| | 5.7 | % |
| Greenville Hospital System | | 10 |
| | 761 |
| | 5.9 |
| | 13,724 |
| | 5.0 |
|
| Hospital Corporation of America | | 5 |
| | 329 |
| | 2.5 |
| | 7,583 |
| | 2.8 |
|
| Community Health Systems | | 5 |
| | 327 |
| | 2.5 |
| | 7,128 |
| | 2.6 |
|
| Steward Health Care System | | 13 |
| | 317 |
| | 2.5 |
| | 7,124 |
| | 2.6 |
|
| Aurora Health Care | | 10 |
| | 315 |
| | 2.4 |
| | 6,684 |
| | 2.4 |
|
| Indiana University Health | | 4 |
| | 294 |
| | 2.3 |
| | 4,739 |
| | 1.7 |
|
| Deaconess Health System | | 10 |
| | 261 |
| | 2.0 |
| | 4,011 |
| | 1.5 |
|
| Banner Health | | 2 |
| | 201 |
| | 1.6 |
| | 4,599 |
| | 1.7 |
|
| Capital District Physicians Health Plan | | 3 |
| | 198 |
| | 1.5 |
| | 3,026 |
| | 1.1 |
|
| Catholic Health Partners | | 4 |
| | 177 |
| | 1.4 |
| | 2,770 |
| | 1.0 |
|
| Wellmont Health System | | 9 |
| | 160 |
| | 1.2 |
| | 2,694 |
| | 1.0 |
|
| Rush University Medical Center | | 6 |
| | 137 |
| | 1.1 |
| | 4,425 |
| | 1.6 |
|
| Diagnostic Clinic Medical Group | | 16 |
| | 119 |
| | 0.9 |
| | 3,173 |
| | 1.2 |
|
| Forest Park Medical Center | | 7 |
| | 112 |
| | 0.9 |
| | 3,090 |
| | 1.1 |
|
| Total | | | | 4,564 |
| | 35.3 | % | | $ | 90,483 |
| | 33.0 | % |
________________________
| |
| (2) | Annualized base rent is based on thecalculated by multiplying contractual base rent in effect as of December 31, 2011, excluding2013 by 12 (excluding the impact of renewals, future step-ups in rent, abatements, concessions, and straight-line rent.rent). |
SIGNIFICANT TENANTS
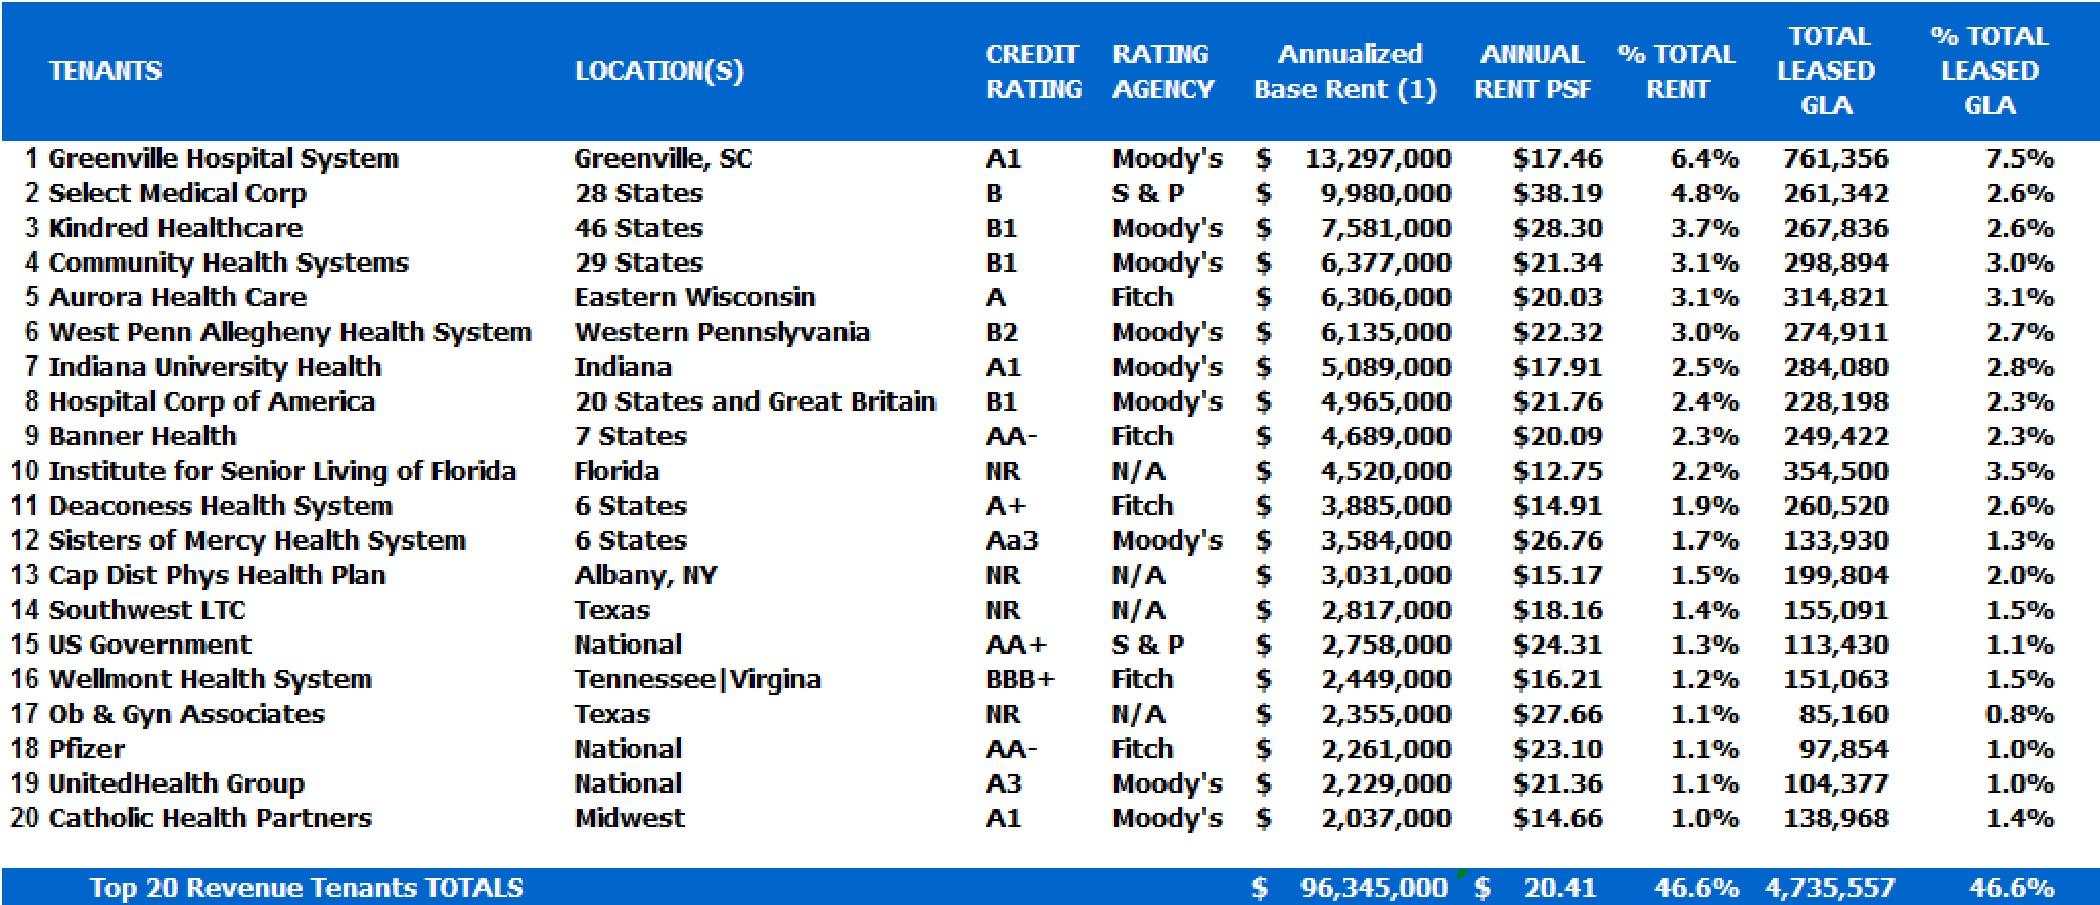
As of December 31, 2011, none of our tenants at our properties accounted for 10.0% or more of our aggregate annual rental revenue. The chart below depicts credit rating, annual rent, and GLA information for our top 20 tenants as determined by annualized base rent:
| |
(1) | Annualized base rent is based on the contractual base rent in effect as of December 31, 2011, excluding the impact of renewals, future step-ups in rent, abatements, concessions, and straight-line rent. |
| |
(2) | Credit ratings of our tenants or their parent companies. |
GEOGRAPHIC CONCENTRATION
As of December 31, 2011,2013, our portfolio was comprised of approximately 11.214.1 million square feet of GLA and was concentrated in locationskey markets that we have determined to be strategic based on demographic trends and projected demand for healthcare. We have concentrations in the following key markets: Phoenix, Arizona; Greenville, South Carolina; Indianapolis, Indiana; Albany, New York; Houston, Texas; Atlanta, Georgia; Pittsburgh, Pennsylvania; Dallas, Texas; Raleigh, North Carolina and Oklahoma City, Oklahoma.
The chart belows depicts our geographic presence based on GLA as of December 31, 2011: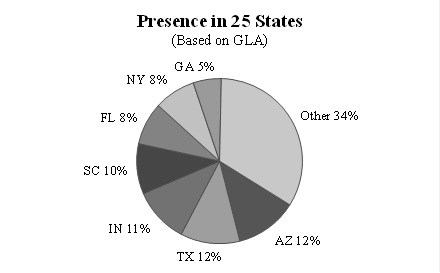
|
| | | | | | |
| Market | | GLA (1) | | Percent of Portfolio |
| Phoenix, AZ | | 1,152 |
| | 8.2 | % |
| Pittsburgh, PA | | 1,094 |
| | 7.8 |
|
| Greenville, SC | | 965 |
| | 6.9 |
|
| Albany, NY | | 879 |
| | 6.3 |
|
| Indianapolis, IN | | 850 |
| | 6.1 |
|
| Houston, TX | | 692 |
| | 4.9 |
|
| Dallas, TX | | 682 |
| | 4.8 |
|
| Atlanta, GA | | 597 |
| | 4.2 |
|
| Miami, FL | | 591 |
| | 4.2 |
|
| Boston, MA | | 359 |
| | 2.5 |
|
| Total | | 7,861 |
| | 55.9 | % |
________________________
FINANCIAL INFORMATION ABOUT INDUSTRY SEGMENTS
Financial Accounting Standards Board, or FASB, Accounting Standard Codification, or ASC, 280, Segment Reporting, or ASC 280, establishes standards for reporting financial and descriptive information about an enterprise’s reportable segment.segments. We have determined that we have one reportable segment, with activities related to investing in medical office buildings, healthcare-related facilities and other facilities that serve the healthcare industry, and mortgage loans receivable.real estate related assets. Our investments in real estate and other real estate relatedestate-related assets are geographically diversified and our chief operating decision maker evaluates operating performance on an individual asset level. As each of our assets has similar economic characteristics, tenants, and products and services, our assets have been aggregated into one reportable segment. See our accompanying consolidated financial statements for further information.
COMPETITION
We compete with many other real estate investment entities, including financial institutions, institutional pension funds, real estate developers, other REITs, other public and private real estate companies and private real estate investors for the acquisition of medical office buildings and other facilities that serve the healthcare industry. During the acquisition process, we compete with others who may have a comparativecompetitive advantage in terms of size, capitalization, depth of experience, local knowledge of the marketplace, and extended contacts throughout the region. Any combination of these factors may result in an increased purchase price for real properties or other real estate related assets which may reduce the number of opportunities available to us that meet our investment criteria. If the number of opportunities that meet our investment criteria are limited, our ability to increase stockholder value may be adversely impacted.
We face competition in leasing available medical office buildings and other facilities that serve the healthcare industry to prospective tenants. As a result, we may have to provide rent concessions, incur charges for tenant improvements, offer other inducements, or we may be unable to timely lease vacant space in our properties, all of which may have an adverse impact on our results of operations. At the time we elect to dispose of our properties, we will also be in competition with sellers of similar properties to locate suitable purchasers.purchase opportunities.
We believe our focus on medical office buildings, and other facilities that serve the healthcare industry, our experience and expertise, and our ongoing relationships with healthcare providers provide us with a competitive advantage. We have established an asset identification and acquisition network with healthcare providers and local developers, which provides for the early identification of and access to acquisition opportunities. In addition, we believe this broad network allows for us to effectively lease available medical office space, retain our tenants, and maintain and improve our assets.
GOVERNMENT REGULATIONS
Healthcare-relatedHealthcare-Related Regulations
Overview. The healthcare industry is heavily regulated by federal, state and local governmental bodies. Our tenants generally are subject to laws and regulations covering, among other things, licensure, certification for participation in government programs, and relationships with physicians and other referral sources. Changes in these laws and regulations could negatively affect the ability of our tenants to satisfy their contractual obligations, including making lease payments to us.
Healthcare Legislation. On March 23, 2010, the President signed into law theThe Patient Protection and Affordable Care Act of 2010, or the Patient Protection and Affordable Care Act, and on March 30, 2010, the President signed into law the Health Care and Education Reconciliation Act of 2010, or the Reconciliation Act, which in part modified the Patient Protection and Affordable Care Act. Together, the two lawsAct, together serve as the primary vehicle for comprehensive healthcare reform in the U.S.United States and will become effective through a phased approach, which began in 2010 and will conclude in 2018. The laws are intended to reduce the number of individuals in the United States without health insurance and significantly change the means by which healthcare is organized, delivered and reimbursed. The Patient Protection and Affordable Care Act includes program integrity provisions that both create new authorities and expand existing authorities for federal and state governments to address fraud, waste and abuse in federal healthcare programs. In addition, the Patient Protection and Affordable Care Act expandsexpanded reporting requirements and responsibilities related to facility ownership and management, patient safety and care quality.quality of care. In the ordinary course of their businesses, our tenants may be regularly subjected to inquiries, investigations and audits by federal and state agencies that oversee these laws and regulations. If they do not comply with the additional reporting requirements and responsibilities, our tenants’ ability to participate in federal healthcare programs may be adversely affected. Moreover, there may be other aspects of the comprehensive healthcare reform legislation for which regulations have not yet been adopted, which, depending on how they are implemented, could materially and adversely affect our tenants and their ability to meet their lease obligations.obligations to us.
On June 28, 2012, the U.S. Supreme Court ruled on the constitutionality of the two laws generally upholding the entirety of the Patient Protection and Affordable Care Act, including holding that the “individual mandate” -- the centerpiece of the legislation that requires all individuals to purchase some form of health insurance -- is permissibly construed as a tax imposed on those who do not obtain health insurance. Notably, the portions of the health reform laws addressing fraud, waste and abuse remain intact. The only aspect of the two laws that was held unconstitutional is the mandated Medicaid expansion that would have required states to cover nonelderly persons with incomes up to 133% of the poverty level. The Supreme Court held that Congress could not require states to implement such an expansion or risk losing all federal Medicaid funding. As a result of the Supreme Court’s decision, states may opt to expand Medicaid coverage in accordance with the two laws, but they are not required to do so. In fact, more than one dozen states have decided to opt out of the Medicaid expansion. Despite the Supreme Court’s decision, it remains difficult to predict the impact of these laws on us due to their complexity, lack of implementing regulations or interpretive guidance, and the gradual implementation of the laws over a multi-year period. In addition, there have been numerous Congressional attempts to amend and repeal the laws both prior to and subsequent to the Supreme Court’s ruling; we cannot predict whether any of these attempts to repeal or amend the laws will be successful. Moreover, the launch of the federal and state health exchanges on October 1, 2013, received significant public scrutiny for perceived technical shortcomings affecting the ability of individuals to enroll in health plans as mandated by the Affordable Care Act. Consequently, it remains difficult to foresee how individuals and business will respond to the choices afforded them by law. Because of the many variables involved, we are unable to predict how these laws may impact our tenants’ operations or the net effect of these laws on us. Both our tenants and us may be adversely affected by these laws.
Reimbursement Programs. Sources of revenue for our tenants may include the federal Medicare program, state Medicaid programs, private insurance carriers, health maintenance organizations, preferred provider arrangements, self-insured employers and the patients themselves, among others. Medicare and Medicaid programs, as well as numerous private insurance and managed care plans, generally require participating providers to accept government-determined reimbursement levels as payment in full for services rendered, without regard to a facility’s charges. Changes in the reimbursement rate or methods of payment from third-party payors, including Medicare and Medicaid, could result in a substantial reduction in our tenants’ revenues. In fact, legislation governing Medicare physician fee-for-service reimbursements has, for a number of years, called for significant reductions in such rates. Congress, however, has repeatedly enacted superseding legislation postponing the implementation of physician rate cuts, most recently postponing the effective date of such cuts until April 1, 2014. There are a number of Congressional proposals to further postpone implementation of the cuts or to permanently address the issue, however, we cannot predict whether any of these attempts will be successful. Efforts by such payors to reduce healthcare costs will likely continue, which may result in reductions or slower growth in reimbursement for certain services provided by some of our tenants. Further, revenue realizable under third-party payor agreements can change after examination and retroactive adjustment by payors during the claims settlement processes or as a result of post-payment audits. Payors may disallow requests for reimbursement based on determinations that certain costs are not reimbursable or reasonable or because additional documentation is necessary or because certain services were not covered or were not medically necessary. The recently enacted healthcare reform law and regulatory changes could impose further limitations on government and private payments to healthcare providers. In some cases, states have enacted or are considering enacting measures designed to reduce their Medicaid expenditures and to make changes to private healthcare insurance. In addition, the failure of any of our tenants to comply with various laws and regulations could jeopardize their ability to continue participating in Medicare, Medicaid and other government sponsored payment programs. The financial impact on our tenants could restrict their ability to make rent payments to us.
Fraud and Abuse Laws. There are various federal and state laws prohibiting fraudulent and abusive business practices by healthcare providers who participate in, receive payments from or are in a position to make referrals in connection with government-sponsored healthcare programs, including the Medicare and Medicaid programs. Our lease arrangements with certain tenants may also be subject to these fraud and abuse laws. These laws include, but are not limited to:
the Federal Anti-Kickback Statute, which prohibits, among other things, the offer, payment, solicitation or receipt of any form of remuneration in return for, or to induce, the referral or recommendation for the ordering of any item or service reimbursed by a federal healthcare program, including Medicare or Medicaid;
the Federal Physician Self-Referral Prohibition, commonly referred to as the Stark Law, which, subject to specific exceptions, restricts physicians from making referrals for specifically designated health services for which payment may be made under Medicare or Medicaid programs to an entity with which the physician, or an immediate family member, has a financial relationship;
the False Claims Act, which prohibits any person from knowingly presenting or causing to be presented false or fraudulent claims for payment to the federal government, including claims paid by the Medicare and Medicaid programs;
the Civil Monetary Penalties Law, which authorizes the U.S. Department of Health and Human Services to impose monetary penalties for certain fraudulent acts and to exclude violators from participating in federal healthcare programs; and
the Health Insurance Portability and Accountability Act, as amended by the Health Information Technology for Economic and Clinical Health Act of the American Recovery and Reinvestment Act of 2009, which protects the privacy and security of personal health information.
In the ordinary course of their business, our tenants may be subject to inquiries, investigations and audits by federal and state agencies that oversee applicable laws and regulations. Private enforcement of healthcare fraud has also increased, due in large part to amendments to the civil False Claims Act that were designed to encourage private individuals to sue on behalf of the government. These whistleblower suits, known as qui tam suits, may be filed by almost anyone, including present and former employees or patients. Each of these laws includes criminal and/or civil penalties for violations that range from punitive sanctions, damage assessments, penalties, imprisonment, denial of Medicare and Medicaid payments and/or exclusion from the Medicare and Medicaid programs. Certain laws, such as the False Claims Act, allow for individuals to bring whistleblower actions on behalf of the government for violations thereof. Additionally, states in which the facilities are located may have similar fraud and abuse laws. Investigation by a federal or state governmental body for violation of fraud and abuse laws or imposition of any of these penalties upon one of our tenants could jeopardize that tenant’s ability to operate or to make rent payments to us.
Healthcare Licensure and Certification. Some of our medical properties and theirour tenants may require a license or multiple licenses or a certificate of need, or a CON, to operate. Failure to obtain a license or a CON, or loss of a required license or a CON would prevent a facility from operating in the manner intended by the tenant. TheseThis event could adversely affect our tenants’ ability to make rent payments to us. State and local laws also may regulate plant expansion, including the addition of new beds or services or acquisition of medical equipment, and the construction of healthcare-related facilities, by requiring a CON or other similar approval. State CON laws are not uniform throughout the United States and are subject to change. We cannot predict the impact of state CON laws on our development of facilities or the operations of our tenants.
Real Estate Ownership-Related Regulations
Many laws and governmental regulations are applicable to our properties and changes in these laws and regulations, or their interpretation by agencies and the courts, occur frequently.
Costs of Compliance with the Americans with Disabilities Act. Under the Americans with Disabilities Act of 1990, as amended, or the ADA, all places of public accommodation are required to comply with federal requirements related to access and use by disabled persons. Although we believe that we are in substantial compliance with present requirements of the ADA, none of our properties have been audited and we have only conducted investigations of a few of our properties to determine compliance. We may incur additional costs in connection with compliance with the ADA. Additional federal, state and local laws also may require modifications to our properties or restrict our ability to renovate our properties. We cannot predict the cost of compliance with the ADA or other legislation. We may incur substantial costs to comply with the ADA or any other legislation.
Costs of Government Environmental Regulation and Private Litigation. Environmental laws and regulations hold us liable for the costs of removal or remediation of certain hazardous or toxic substances which may be on our properties. These laws could impose liability on us without regard to whether we are responsible for the presence or release of the hazardous materials. Government investigations and remediation actions may havecause substantial costs and the presence of hazardous substances on a property could result in personal injury or similar claims by private plaintiffs. Various laws also impose liability on persons who arrange for the disposal or treatment of hazardous or toxic substances and such person oftenpersons oftentimes must incur the cost of removal or remediation of hazardous substances at the disposal or treatment facility. These laws often impose liability whether or not the person arranging for the disposal ever owned or operated the disposal facility. As the owner and operator of our properties, we may be deemed to have arranged for the disposal or treatment of hazardous or toxic substances.
Use of Hazardous Substances by Some of Our Tenants. Some of our tenants routinely handle hazardous substances and wastes on our properties as part of their routine operations. Environmental laws and regulations subject these tenants, and potentially us, to liability resulting from such activities. We require our tenants in their leases with us to comply with these environmental laws and regulations and to indemnify us for any related liabilities. We are unaware of any material noncompliance, liability or claim relating to hazardous or toxic substances or petroleum products in connection with any of our properties.
Other Federal, State and Local Regulations. Our properties are subject to various federal, state and local regulatory requirements, such as state and local fire and life safety requirements. If we fail to comply with these various requirements, we may incur governmental fines or private damage awards. While we believe that our properties are currently in material compliance with all of these regulatory requirements, we do not know whether existing requirements will change or whether future requirements will require us to make significant unanticipated expenditures that will adversely affect our ability to make distributions to our stockholders. We believe, based in part on engineering reports which are generally obtained at the time we acquire the properties, that all of our properties comply in all material respects with current regulations. However, if we were required to make significant expenditures under applicable regulations, our financial condition, results of operations, cash flow and ability to satisfy our debt service obligations and to pay distributions could be adversely affected.
EMPLOYEES
As of December 31, 2011,2013, we had approximately 60160 employees, none of whom iswhich approximately 1% are subject to a collective bargaining agreement.
TAX STATUSMATTERS
The following discussion addresses U.S.We filed an election with our 2007 federal income tax considerations related to our electionreturn to be subject to taxationtaxed as a REIT and the ownership and disposition of our common stock that may be material to holders of our stock. This discussion does not address any foreign, state, or local tax consequences of holding our stock. The provisions ofunder the Internal Revenue Code of 1986, as amended, or the Code, concerning the U.S. federal income tax treatment of a REIT are highly technical and complex; the following discussion sets forth only certain aspects of those provisions. This discussion is intended to provide you with general information only and is not intended as a substitute for careful tax planning.
This summary is based on provisions of the Code, applicable final and temporary Treasury Regulations, judicial decisions, and administrative rulings and practice, all in effect as of the date of this prospectus, and should not be construed as legal or tax advice. No assurance can be given that future legislative or administrative changes or judicial decisions will not affect the accuracy of the descriptions or conclusions contained in this summary. In addition, any such changes may be retroactive and apply to transactions entered into prior to the date of their enactment, promulgation or release.
Federal Income Taxation of HTA
We believe that we have qualified to be taxed as a REIT beginning with our taxable year ended December 31, 2007 under Sections 856 through 860 of the Code for U.S. federal income tax purposes and we intend to continue to qualify to be taxed as a REIT. To continue to qualify as a REIT for U.S. federal income tax purposes, we must meet certain organizational and operational requirements, including a requirement to pay distributions to our stockholders of at least 90% of our annual taxable income (computed without regard to the dividends paid deduction and excluding net capital gains). As a REIT, we generally are not subject to U.S. federal income tax on net income that we distribute to our stockholders.
If we fail to qualify as a REIT in any taxable year, we will then be subject to U.S. federal income taxes on our taxable income and will not be permitted to qualify for treatment as a REIT for U.S. federal income tax purposes for four years following the year during which qualification is lost unless the Internal Revenue Service, or the IRS, grants us relief under certain statutory provisions. Such an event could have a material adverse effect on our results of operations and net cash available for distribution to stockholders.
Notwithstanding the foregoing, even if we qualify for taxation as a REIT, we nonetheless may be subject to tax in certain circumstances, including the following:
we will be required to pay U.S. federal income tax on our undistributed REIT taxable income, including net capital gain;
we may be subject to the “alternative minimum tax;”
we may be subject to tax at the highest corporate rate on certain income from “foreclosure property” (generally, property acquired by reason of default on a lease or indebtedness held by us);
we will be subject to a 100% tax on net income from “prohibited transactions” (generally, certain sales or other dispositions of property, sometimes referred to as “dealer property,” held primarily for sale to customers in the ordinary course of business, other than foreclosure property) unless the gain is realized in a “taxable REIT subsidiary,” or TRS, or such property has been held by us for two years and certain other requirements are satisfied;
if we fail to satisfy the 75% gross income test or the 95% gross income test (discussed below), but nonetheless maintain our qualification as a REIT pursuant to certain relief provisions, we will be subject to a 100% tax on the greater of (i) the amount by which we fail the 75% gross income test or (ii) the amount by which we fail the 95% gross income test, in either case, multiplied by a fraction intended to reflect our profitability;
if we fail to satisfy any of the asset tests, other than the 5% or the 10% asset tests that qualify under a de minimis exception, and the failure qualifies under the general exception, as described below under “— Qualification as a REIT — Asset Tests,” then we will have to pay an excise tax equal to the greater of (i) $50,000 and (ii) an amount determined by multiplying the net income generated during a specified period by the assets that caused the failure by the highest U.S. federal income tax applicable to corporations;
if we fail to satisfy any REIT requirements other than the income test or asset test requirements, described below under “— Qualification as a REIT — Income Tests” and “— Qualification as a REIT — Asset Tests,” respectively, and we qualify for a reasonable cause exception, then we will have to pay a penalty equal to $50,000 for each such failure;
we will be subject to a 4% excise tax if certain distribution requirements are not satisfied;
we may be required to pay monetary penalties to the IRS in certain circumstances, including if we fail to meet record-keeping requirements intended to monitor our compliance with rules relating to the composition of a REIT’s stockholders, as described below in “— Recordkeeping Requirements;”
if we dispose of an asset acquired by us from a C corporation in a transaction in which we took the C corporation’s tax basis in the asset,future. As a qualified REIT, with limited exceptions, we may be subject to tax at the highest regular corporate rate on the appreciation inherent in such asset as of the date of acquisition by us;
we will be required to pay a 100% tax on any redetermined rents, redetermined deductions, and excess interest. In general, redetermined rents are rents from real property that are overstated as a result of services furnished to any of our non-TRS tenants by one of our TRSs. Redetermined deductions and excess interest generally represent amounts that are deducted by a TRS for amounts paid to us that are in excess of the amounts that would have been deducted based on arm’s-length negotiations; and
income earned by our TRSs or any other subsidiaries that are taxable as C corporations will be subject to tax at regular corporate rates.
No assurance can be given that the amount of any such taxes will not be substantial. In addition, wetaxed under federal and our subsidiaries may be subject to a variety of taxes, including payroll taxes andcertain state local and foreign income, property and other taxes on assets and operations. We could also be subject to tax in situations and on transactions not presently contemplated.
Qualification as a REIT
In General
The REIT provisions of the Code apply to a domestic corporation, trust, or association (i) that is managed by one or more trustees or directors, (ii) the beneficial ownership of which is evidenced by transferable shares or by transferable certificates of beneficial interest, (iii) that properly elects to be taxed as a REIT and such election has not been terminated or revoked, (iv) that is neither a financial institution nor an insurance company, (v) that uses a calendar year for U.S. federal income tax purposes and complies with applicable recordkeeping requirements, and (vi) that meetslaws at the additional requirements discussed below.
Preferential dividends cannot be used to satisfy the REIT distribution requirements. In 2007, 2008 and through July 2009, shares of common stock issued pursuant to our DRIP were treated as issued as of the first day following the close of the month for which the distributions were declared, and notcorporate level on the date that the cash distributions were paid to stockholders not participating in our DRIP. Because we declare distributions on a daily basis, including with respect to shares of common stock issued pursuant to our DRIP, the IRS could take the position that distributions paid by us during these periods were preferential. In addition, during the six months beginning September 2009 through February 2010, we paid certain IRA custodial fees with respect to IRA accounts that invested in our shares. The payment of such amounts could also be treated as dividend distributions to the IRAs, and therefore could result in our being treated as having made additional preferential dividends to our stockholders.
We have entered into a closing agreement with the IRS, or the Closing Agreement, pursuant to which (i) IRS agreed not to challenge the Company's dividends as preferential for its taxable years 2007, 2008, 2009, and 2010 as a result of the matters described above, and (ii) the Company paid a compliance fee in an immaterial amount, to the IRS. In accordance with the terms of the Closing Agreement, any reimbursement to the Company for its payment of this compliance fee will be considered gross income to the Company. As a result of the Closing Agreement, we continue to qualify as a REIT and to satisfy our distribution requirements.
Ownership Tests
In order to qualify as a REIT, commencing with our second REIT taxable year, (i) the beneficial ownership of our stock must be held by 100 or more persons during at least 335 days of a 12-month taxable year (or during a proportionate part of a taxable year of less than 12 months) for each of our taxable years and (ii) during the last half of each taxable year, no more than 50% in value of our stock may be owned, directly or indirectly, by or for five or fewer individuals (the “5/50 Test”). Stock ownership for purposes of the 5/50 Test is determined by applying the constructive ownership provisions of Section 544(a) of the Code, subject to certain modifications. The term “individual” for purposes of the 5/50 Test includes a private foundation, a trust providing for the payment of supplemental unemployment compensation benefits, and a portion of a trust permanently set aside or to be used exclusively for charitable purposes. A “qualified trust” described in Section 401(a) of the Code and exempt from tax under Section 501(a) of the Code generally is not treated as an individual; rather, stock held by it is treated as owned proportionately by its beneficiaries.
We believe that we have satisfied and will continue to satisfy the above ownership requirements. In addition, our charter restricts ownership and transfers of our stock that would violate these requirements, although these restrictions may not be effective in all circumstances to prevent a violation. We will be deemed to have satisfied the 5/50 Test for a particular taxable year if we have complied with all the requirements for ascertaining the ownership of our outstanding stock in that taxable year and have no reason to know that we have violated the 5/50 Test.
Income Tests
In order to maintain qualification as a REIT, we must annually satisfy two gross income requirements:
(1) first, at least 75% of our gross income (excluding gross income from prohibited transactions and certain other income and gains as described below) for each taxable year must be derived, directly or indirectly, from investments relating to real property or mortgages on real property or from certain types of temporary investments (or any combination thereof). Qualifying income for purposes of this 75% gross income test generally includes: (a) rents from real property, (b) interest on obligations secured by mortgages on real property or on interests in real property, (c) dividends or other distributions on, and gain from the sale of, shares in other REITs, (d) gain from the sale of real estate assets (other than gain from prohibited transactions), (e) income and gain derived from foreclosure property, and (f) qualified temporary investment income (see “Qualified Temporary Investment Income” below); and
(2) second, in general, at least 95% of our gross income (excluding gross income from prohibited transactions and certain other income and gains as described below) for each taxable year must be derived from sources qualifying under the 75% gross income test and from other types of dividends and interest, gain from the sale or disposition of stock or securities that are not dealer property, or any combination of the above.
Rents we receive will qualify as rents from real property only if several conditions are met. First, the amount of rent generally must not be based in whole or in part on the income or profits of any person. However, an amount received or accrued generally will not be excluded from the term “rents from real property” solely by reason of being based on a fixed percentage or percentages of receipts or sales. Second, rents received from a “related party tenant” will not qualify as rents from real property in satisfying the gross income tests unless the tenant is a TRS and either (i) at least 90% of the property is leased to unrelated tenants and the rent paid by the TRS is substantially comparable to the rent paid by the unrelated tenants for comparable space, or (ii) the property leased is a “qualified lodging facility,” as defined in Section 856(d)(9)(D) of the Code, or a “qualified health care property,” as defined in Section 856(e)(6)(D)(i), and certain other conditions are satisfied. A tenant is a related party tenant if the REIT, or an actual or constructive owner of 10% or more of the REIT, actually or constructively owns 10% or more of the tenant. Third, if rent attributable to personal property, leased in connection with a lease of real property, is greater than 15% of the total rent received under the lease, then the portion of rent attributable to the personal property will not qualify as rents from real property.
Generally, for rents to qualify as rents from real property, we may provide directly only an insignificant amount of services, unless those services are “usually or customarily rendered” in connection with the rental of real property and not otherwise considered “rendered to the occupant” under the applicable tax rules. Accordingly, we may not provide “impermissible services” to tenants (except through an independent contractor from whom we derive no revenue and that meets other requirements or through a TRS) without giving rise to “impermissible tenant service income.” Impermissible tenant service income is deemed to be at least 150% of the direct cost to us of providing the service. If the impermissible tenant service income exceeds 1% of our total income from a property, then all of the income from that property will fail to qualify as rents from real property. If the total amount of impermissible tenant service income from a property does not exceed 1% of our total income from the property, the services will not disqualify any other income from the property that qualifies as rents from real property, but the impermissible tenant service income will not qualify as rents from real property.
We do not intend to charge significant rent that is based in whole or in part on the income or profits of any person, derive significant rents from related party tenants, derive rent attributable to personal property leased in connection with real property that exceeds 15% of the total rents from that property, or derive impermissible tenant service income that exceeds 1% of our total income from any property if the treatment of the rents from such property as nonqualified rents could cause us to fail to qualify as a REIT.
Distributions that we receive from a TRS will be classified as dividendnet income to the extent oftaxable net income is distributed to our stockholders. We expect to make sufficient distributions to avoid income tax at the earningscorporate level. While we believe that we are organized and profits of the TRS. Such distributions will generally constitute qualifying income for purposes of the 95% gross income test, but not under the 75% gross income test. Any dividends received by us from a REIT will be qualifying income for purposes of both the 95% and 75% gross income tests.
If we fail to satisfy one or both of the 75% or the 95% gross income tests, we may nevertheless qualifyqualified as a REIT for a particular year if we are entitled to relief under certain provisions of the Code. Those relief provisions generally will be available if our failure to meet such tests is due to reasonable cause and not due to willful neglect and we file a schedule describing each item of our gross income for such year(s) in accordance with the applicable Treasury Regulations. It is not possible, however, to state whether in all circumstances we would be entitled to the benefit of these relief provisions.
Foreclosure property. Foreclosure property is real property (including interests in real property) and any personal property incident to such real property (1) that is acquired by a REIT as a result of the REIT having bid in the property at foreclosure, or having otherwise reduced the property to ownership or possession by agreement or process of law, after there was a default (or default was imminent) on a lease of the property or a mortgage loan held by the REIT and secured by the property, (2) for which the related loan or lease was made, entered into or acquired by the REIT at a time when default was not imminent or anticipated and (3) for which such REIT makes an election to treat the property as foreclosure property. REITs generally are subject to tax at the maximum corporate rate (currently 35%) on any net income from foreclosure property, including any gain from the disposition of the foreclosure property, other than income that would otherwise be qualifying income for purposes of the 75% gross income test. Any gain from the sale of property for which a foreclosure property election has been made will not be subject to the 100% tax on gains from prohibited transactions described above, even if the property is held primarily for sale to customers in the ordinary course of a trade or business.
Hedging transactions. We may enter into hedging transactions with respect to one or more of our assets or liabilities. Hedging transactions could take a variety of forms, including interest rate swaps or cap agreements, options, futures contracts, forward rate agreements or similar financial instruments. Except to the extent as may be provided by future Treasury Regulations, any income from a hedging transaction which is clearly identified as such before the close of the day on which it was acquired, originated or entered into, including gain from the disposition or termination of such a transaction, will not constitute gross income for purposes of the 95% and 75% gross income tests, provided that the hedging transaction is entered into (i) in the normal course of our business primarily to manage risk of interest rate or price changes or currency fluctuations with respect to indebtedness incurred or to be incurred by us to acquire or carry real estate assets or (ii) primarily to manage the risk of currency fluctuations with respect to any item of income or gain that would be qualifying income under the 75% or 95% income tests (or any property which generates such income or gain). To the extent we enter into other types of hedging transactions, the income from those transactions is likely to be treated as non-qualifying income for purposes of both the 75% and 95% gross income tests. We intend to structure and monitor our hedging transactions so that such transactions do not jeopardize our ability to qualify as a REIT.
Qualified temporary investment income. Income derived from certain types of temporary stock and debt investments made with the proceeds of this offering, not otherwise treated as qualifying income for the 75% gross income test, generally will nonetheless constitute qualifying income for purposes of the 75% gross income test for the year following this offering. More specifically, qualifying income for purposes of the 75% gross income test includes “qualified temporary investment income,” which generally means any income that is attributable to stock or a debt instrument, is attributable to the temporary investment of new equity capital and certain debt capital, and is received or accrued during the one-year period beginning on the date on which the REIT receives such new capital. After the one year period following this offering, income from investments of the proceeds of this offering will be qualifying income for purposes of the 75% income test only if derived from one of the other qualifying sources enumerated above.
Asset Tests
At the close of each quarter of each taxable year, we must also satisfy four tests relating to the nature of our assets. First, real estate assets, cash and cash items, and government securities must represent at least 75% of the value of our total assets. Second, not more than 25% of our total assets may be represented by securities other than those in the 75% asset class. Third, of the investments that are not included in the 75% asset class and that are not securities of our TRSs, (i) the value of any one issuer’s securities owned by us may not exceed 5% of the value of our total assets and (ii) we may not own more than 10% by vote or by value of any one issuer’s outstanding securities. For purposes of the 10% value test, debt instruments issued by a partnership are not classified as “securities” to the extent of our interest as a partner in such partnership (based on our proportionate share of the partnership’s equity interests and certain debt securities) or if at least 75% of the partnership’s gross income, excluding income from prohibited transactions, is qualifying income for purposes of the 75% gross income test. For purposes of the 10% value test, the term “securities” also does not include debt securities issued by another REIT, certain “straight debt” securities (for example, qualifying debt securities of a corporation of which we own no more than a de minimis amount of equity interest), loans to individuals or estates, and accrued obligations to pay rent. Fourth, securities of our TRSs cannot represent more than 25% of our total assets. Although we intend to meet these asset tests, no assurance can be given that we will be able to do so. For purposes of these asset tests, we are treated as holding our proportionate share of our subsidiary partnerships’ assets. Also, for purposes of these asset tests, the term “real estate assets” includes any property that is not otherwise a real estate asset and that is attributable to the temporary investment of new capital, but only if such property is stock or a debt instrument, and only for the one-year period beginning on the date the REIT receives such capital. “Real estate assets” include our investments in stocks of other REITs but do not include stock of any real estate company, or other company, that does not qualify as a REIT (unless eligible for the special rule for temporary investment of new capital).
We will monitor the status of our assets for purposes of the various asset tests and will endeavor to manage our portfolio in order to comply at all times with such tests. If we fail to satisfy the asset tests at the end of a calendar quarter, we will not lose our REIT status if one of the following exceptions applies:
we satisfied the asset tests at the end of the preceding calendar quarter, and the discrepancy between the value of our assets and the asset test requirements arose from changes in the market values of our assets and was not wholly or partly caused by the acquisition of one or more non-qualifying assets; or
we eliminate any discrepancy within 30 days after the close of the calendar quarter in which it arose.
Moreover, if we fail to satisfy the asset tests at the end of a calendar quarter during a taxable year, we will not lose our REIT status if one of the following additional exceptions applies:
De Minimis Exception: The failure is due to a violation of the 5% or 10% asset tests referenced above and is “de minimis” (meaning that the failure is one that arises from our ownership of assets the total value of which does not exceed the lesser of 1% of the total value of our assets at the end of the quarter in which the failure occurred and $10 million), and we either dispose of the assets that caused the failure or otherwise satisfy the asset tests within six months after the last day of the quarter in which our identification of the failure occurred; or
General Exception: All of the following requirements are satisfied: (i) the failure is not due to the above De Minimis Exception, (ii) the failure is due to reasonable cause and not willful neglect, (iii) we file a schedule in accordance with Treasury Regulations providing a description of each asset that caused the failure, (iv) we either dispose of the assets that caused the failure or otherwise satisfy the asset tests within six months after the last day of the quarter in which our identification of the failure occurred, and (v) we pay an excise tax as described above in “— Taxation of Our Company.”
Annual Distribution Requirements
In order to qualify as a REIT, each taxable year we must distribute dividends (other than capital gain dividends) to our stockholders in an amount at least equal to (A) the sum of (i) 90% of our REIT taxable income, determined without regard to the dividends paid deduction and by excluding any net capital gain, and (ii) 90% of the net income (after tax), if any, from foreclosure property, minus (B) the sum of certain items of non-cash income. We generally must pay such distributions in the taxable year to which they relate, or in the following taxable year if declared before we timely file our tax return for such year and if paid on or before the first regular dividend payment after such declaration. For these purposes, if we declare a dividend in October, November, or December, payable to stockholders of record on a day in such months, and distribute such dividend in the following January, it will be treated as having been paid on December 31 of the year in which it was declared.
To the extent that we do not distribute all of our net capital gain and taxable income, we will be subject to U.S. federal, state and local tax on the undistributed amount at regular corporate income tax rates. Furthermore, if we should fail to distribute during each calendar year at least the sum of (i) 85% of our REIT taxable income (subject to certain adjustments) for such year, (ii) 95% of our capital gain net income for such year, and (iii) 100% of any corresponding undistributed amounts from prior periods, we will be subject to a 4% nondeductible excise tax on the excess of such required distribution over the sum of amounts actually distributed plus retained income from such taxable year on which we paid corporate income tax.
Under certain circumstances, we may be able to rectify a failure to meet the distribution requirement for a year by paying “deficiency dividends” to our stockholders in a later year that may be included in our deduction for dividends paid for the earlier year. Thus, we may be able to avoid being taxed on amounts distributed as deficiency dividends; however, we will be required to pay interest based upon the amount of any deduction taken for deficiency dividends. Amounts paid as deficiency dividends are generally treated as taxable income for U.S. federal income tax purposes.
In order to satisfy the REIT distribution requirements, the dividends we pay must not be “preferential” within the meaning of the Code. A dividend determined to be preferential will not qualify for the dividends paid deduction. To avoid paying preferential dividends, we must treat every stockholder of a class of stock with respect to which we make a distribution the same as every other stockholder of that class, and we must not treat any class of stock other than according to its dividend rights as a class. Pursuant to an IRS ruling, the prohibition on preferential dividends does not prohibit REITs from offering shares under a dividend reinvestment plan at discounts of up to 5% of fair market value, but a discount in excess of 5% of the fair market value of the shares would be considered a preferential dividend.
We may retain and pay income tax on net long-term capital gains we received during the tax year. To the extent we so elect, (i) each stockholder must include in its income (as long-term capital gain) its proportionate share of our undistributed long-term capital gains, (ii) each stockholder is deemed to have paid, and receives a credit for, its proportionate share of the tax paid by us on the undistributed long-term capital gains, and (iii) each stockholder’s basis in its stock is increased by the included amount of the undistributed long-term capital gains less their share of the tax paid by us.
To qualify as a REIT, we may not have, at the end of any taxable year, any undistributed earnings and profits accumulated in any non-REIT taxable year. We believe that we have not had any non-REIT earnings and profits at the end of any taxable year and we intend to distribute any non-REIT earnings and profits that we accumulate before the end of any taxable year in which we accumulate such earnings and profits.
Failure to Qualify
If we fail to qualify as a REIT and such failure is not an asset test or income test failure subject to the cure provisions described above, we generally will be eligible for a relief provision if the failure is due to reasonable cause and not willful neglect and we pay a penalty of $50,000 with respect to such failure.
If we fail to qualify for taxation as a REIT in any taxable year and no relief provisions apply, we generally will be subject to tax (including any applicable alternative minimum tax) on our taxable income at regular corporate rates. Distributions to our stockholders in any year in which we fail to qualify as a REIT will not be deductible by us nor will they be required to be made. In such event, to the extent of our current or accumulated earnings and profits, all distributions to our stockholders will be taxable as dividend income. Subject to certain limitations in the Code, corporate stockholders may be eligible for the dividends received deduction, and individual, trust and estate stockholders may be eligible to treat the dividends received from us as qualified dividend income taxable as net capital gains, under the provisions of Section 1(h)(11) of the Code, through the end of 2012. Unless entitled to relief under specific statutory provisions, we also will be ineligible to elect to be taxed as a REIT again prior to the fifth taxable year following the first year in which we failed to qualify as a REIT under the Code.
Our qualification as a REIT for U.S. federal income tax purposes will depend on our continuing to meet the various requirements summarized above governing the ownership of our outstanding stock, the nature of our assets, the sources of our income, and the amount of our distributions to our stockholders. Although we intend to operate in a manner that will enableallow us to comply with such requirements,continue to qualify as a REIT, there can be no certaintyassurance that such intentionwe will be realized. In addition, because the relevant laws may change, compliance with one or more of the REIT requirements may become impossible or impracticable for us.
Taxation of U.S. Stockholders
The term “U.S. stockholder” means an investorsuccessful in our stock that, for U.S. federal income tax purposes, is (i) a citizen or resident of the United States, (ii) a corporation or other entity treatedthis regard. Qualification as a corporation that is created or organized in or underREIT involves the lawsapplication of the United States, any of its states or the District of Columbia, (iii) an estate, the income of which is subject to U.S. federal income taxation regardless of its source, or (iv) a trust (a) if a court within the United States is able to exercise primary supervision over the administration of the trusthighly technical and one or more U.S. persons have the authority to control all substantial decisions of the trust or (b) that has a valid election in effect under the applicable Treasury Regulations to be treated as a U.S. person under the Code. If a partnership, including any entity treated as a partnership for U.S. federal income tax purposes, holds our stock, the U.S. federal income tax treatment of a partner in the partnership will generally depend on the status of the partner and the activities of the partnership. If you are a partner in a partnership holding our stock, you are urged to consult your tax advisor regarding the consequences of the ownership and disposition of shares of our stock by the partnership. This summary assumes that stockholders hold our stock as capital assets for U.S. federal income tax purposes, which generally means property held for investments.
This discussion does not address all aspects of federal income taxation that may apply to persons that are subject to special treatment under the Code, such as (i) insurance companies; (ii) financial institutions or broker-dealers; (iii) persons who mark-to-market our stock; (iv) subchapter S corporations; (v) U.S. stockholders whose functional currency is not the U.S. dollar; (vi) regulated investment companies; (x) holders who receive our stock through the exercise of employee stock options or otherwise as compensation; (vii) persons holding shares of our stock as part of a “straddle,” “hedge,” “conversion transaction,” “synthetic security” or other integrated investment; and (viii) persons subject to the alternative minimum tax provisions of the Code.
Distributions
Distributions by us, other than capital gain dividends, will constitute ordinary dividends to the extent of our current or accumulated earnings and profits as determined for U.S. federal income tax purposes. In general, these dividends will be taxable as ordinary income and will not be eligible for the dividends-received deduction for corporate stockholders. Our ordinary dividends generally will not qualify as “qualified dividend income” currently taxed as net capital gain for U.S. stockholders that are individuals, trusts, or estates. However, provided we properly designate the distributions, distributions to U.S. stockholders that are individuals, trusts, or estates generally will constitute qualified dividend income to the extent the U.S. stockholder satisfies certain holding period requirements and to the extent the dividends are attributable to (i) qualified dividend income we receive from other corporations during the taxable year, including from our TRSs, and (ii) our undistributed earnings or built-in gains taxed at the corporate level during the immediately preceding year. We do not anticipate distributing a significant amount of qualified dividend income. Absent an extension, the favorable rates for qualified dividend income will not apply for taxable years beginning after December 31, 2012.
To the extent that we make a distribution in excess of our current and accumulated earnings and profits (a “return of capital distribution”), the distribution will be treated first as a tax-free return of capital, reducing the tax basis in a U.S. stockholder’s stock. To the extent a return of capital distribution exceeds a U.S. stockholder’s tax basis in its stock, the distribution will be taxable as capital gain realized from the sale of such stock.
Dividends declared by us in October, November or December and payable to a stockholder of record on a specified date in any such month shall be treated both as paid by us and as received by the stockholder on December 31, provided that the dividend is actually paid by us during January of the following calendar year.
We will be treated as having sufficient earnings and profits to treat as a dividend any distribution up to the amount required to be distributed in order to avoid imposition of the 4% excise tax generally applicable to REITs if certain distribution requirements are not met. Moreover, any deficiency dividend will be treated as an ordinary or a capital gain dividend, as the case may be, regardless of our earnings and profits at the time the distribution is actually made. As a result, stockholders may be required to treat certain distributions as taxable dividends that would otherwise result in a tax-free return of capital.
Distributions that are properly designated as capital gain dividends will be taxed as long-term capital gains (to the extent they do not exceed our actual net capital gain for the taxable year) without regard to the period for which the stockholder has held its stock. However, corporate stockholders may be required to treat up to 20% of certain capital gain dividends as ordinary income. In addition, U.S. stockholders may be required to treat a portion of any capital gain dividend as “unrecaptured Section 1250 gain,” taxable at a maximum rate of 25%, if we incur such gain. Capital gain dividends are not eligible for the dividends-received deduction for corporations.
The REITcomplex provisions of the Code do not require us to distribute our long-term capital gain,for which there are limited judicial and we may elect to retainadministrative interpretations and pay income tax on our net long-term capital gains received duringinvolves the taxable year. If we so elect for a taxable year, our stockholders would include in income as long-term capital gains their proportionate share of designated retained net long-term capital gains for the taxable year. A U.S. stockholder would be deemed to have paid its share of the tax paid by us on such undistributed capital gains, which would be credited or refunded to the stockholder. The U.S. stockholder’s basis in its stock would be increased by the amount of undistributed long-term capital gains (less the capital gains tax paid by us) included in the U.S. stockholder’s long-term capital gains.
Passive Activity Loss and Investment Interest Limitations; No Pass Through of Losses
Our distributions and gain from the disposition of our stock will not be treated as passive activity income and, therefore, U.S. stockholders will not be able to apply any “passive losses” against such income. With respect to non-corporate U.S. stockholders, our distributions (to the extent they do not constitute a return of capital) that are taxed at ordinary income rates will generally be treated as investment income for purposes of the investment interest limitation; however, net capital gain from the disposition of our stock (or distributions treated as such), capital gain dividends, and dividends taxed at net capital gains rates generally will be excluded from investment income except to the extent the U.S. stockholder elects to treat such amounts as ordinary income for U.S. federal income tax purposes. U.S. stockholders may not include in their own U.S. federal income tax returns any of our net operating or net capital losses.
Sale or Disposition of Stock
In general, any gain or loss realized upon a taxable disposition of shares of our stock by a stockholder that is not a dealer in securities will be a long-term capital gain or loss if the stock has been held for more than one year and otherwise will be a short-term capital gain or loss. However, any loss upon a sale or exchange of the stock by a stockholder who has held such stock for six months or less (after applying certain holding period rules) will be treated as a long-term capital loss to the extent of our distributions or undistributed capital gains required to be treated by such stockholder as long-term capital gain. All or a portion of any loss realized upon a taxable disposition of shares of our stock may be disallowed if the taxpayer purchases other shares of our common stock within 30 days before or after the disposition.
Medicare Tax on Unearned Income
For taxable years beginning after December 31, 2012, certain U.S. stockholders that are individuals, estates or trusts and have modified adjusted gross income exceeding certain thresholds will be required to pay an additional 3.8% tax (the “Medicare Tax”) on, among other things, certain dividends on and capital gains from the sale or other disposition of stock. U.S. stockholders that are individuals, estates or trusts should consult their tax advisors regarding the effect, if any, of the Medicare Tax on their ownership and disposition of our stock.
Taxation of U.S. Tax-Exempt Stockholders
In General
In general, a U.S. tax-exempt organization is exempt from U.S. federal income tax on its income, except to the extent of its “unrelated business taxable income” or UBTI, which is defined by the Code as the gross income derived from any trade or business which is regularly carried on by a tax-exempt entity and unrelated to its exempt purposes, less any directly connected deductions and subject to certain modifications. For this purpose, the Code generally excludes from UBTI any gain or loss from the sale or other disposition of property (other than stock in trade or property held primarily for sale in the ordinary coursedetermination of a trade or business), dividends, interest, rents from real property,variety of factual matters and certain other items. However, a portion of any such gains, dividends, interest, rents, and other items generally is UBTI to the extent derived from debt-financed property, based on the amount of “acquisition indebtedness” with respect to such debt-financed property.
Distributions we make to a tax-exempt employee pension trust or other domestic tax-exempt stockholder or gains from the disposition of our stock held as capital assets generally will not constitute UBTI unless the exempt organization’s stock is debt-financed property (e.g., the stockholder has incurred “acquisition indebtedness” with respect to such stock). However, if we are a “pension-held REIT,” this general rule may not apply to distributions to certain pension trusts that are qualified trusts and that hold more than 10% (by value) of our stock. We will be treated as a “pension-held REIT” if (i) treating qualified trusts as individuals would cause us to fail the 5/50 Test (as defined above) and (ii) we are “predominantly held” by qualified trusts. We will be “predominantly held” by qualified trusts if either (i) a single qualified trust holds more than 25% by value of our stock or (ii) one or more qualified trusts, each owning more than 10% by value of our stock, hold in the aggregate more than 50% by value of our stock. In the event we are a pension-held REIT, the percentage of any dividend received from us treated as UBTI would be equal to the ratio of (a) the gross UBTI (less certain associated expenses) earned by us (treating us as if we were a qualified trust and, therefore, subject to tax on UBTI) to (b) our total gross income (less certain associated expenses). A de minimis exception applies where the ratio set forth in the preceding sentence is less than 5% for any year; in that case, no dividends are treated as UBTI. We cannot assure you that we will not be treated as a pension-held REIT.
Special Issues
Social clubs, voluntary employee benefit associations, supplemental unemployment benefit trusts, and qualified group legal services plans that are exempt from taxation under paragraphs (7), (9), (17), and (20), respectively, of Section 501(c) of the Code are subject to different UBTI rules, which generally will require them to characterize distributions from us as UBTI.
Taxation of Non-U.S. Stockholders
The rules governing U.S. federal income taxation of non-U.S. stockholders, such as nonresident alien individuals, foreign corporations, and foreign trusts and estates (“non-U.S. stockholders”), are complex. This section is only a partial discussion of such rules. This discussion does not attempt to address the considerations that may be relevant for non-U.S. stockholders that are partnerships or other pass-through entities, that hold their stock through intermediate entities, that have special statuses (such as sovereigns), or that otherwise are subject to special rules. Prospective non-U.S. stockholders are urged to consult their tax advisors to determine the impact of U.S. federal, state, local and foreign income tax laws on their ownership of our stock, including any reporting requirements.
Distributions
A non-U.S. stockholder that receives a distribution that is not attributable to gain from our sale or exchange of “United States real property interests” (as defined below) and that we do not designate as a capital gain dividend generally will recognize ordinary income to the extent that we pay the distribution out of our current or accumulated earnings and profits. A withholding tax equal to 30% of the gross amount of the distribution ordinarily will apply unless an applicable tax treaty reduces or eliminates the tax. Under some treaties, lower withholding rates do not apply to dividends from REITs or are available in limited circumstances. However, if a distribution is treated as effectively connected with the non-U.S. stockholder’s conduct of a U.S. trade or business, the non-U.S. stockholder generally will be subject to U.S. federal income tax on the distribution at graduated rates (in the same manner as U.S. stockholders are taxed on distributions) and also may be subject to the 30% branch profits tax in the case of a corporate non-U.S. stockholder. We plan to withhold U.S. income tax at the rate of 30% on the gross amount of any distribution paid to a non-U.S. stockholder that is neither a capital gain dividend nor a distribution that is attributable to gain from the sale or exchange of “United States real property interests” unless either (i) a lower treaty rate or special provision of the Code (e.g., Section 892) applies and the non-U.S. stockholder files with us any required IRS Form W-8 (for example, an IRS Form W-8BEN) evidencing eligibility for that reduced rate or (ii) the non-U.S. stockholder files with us an IRS Form W-8ECI claiming that the distribution is effectively connected income.
A non-U.S. stockholder generally will not incur tax on a return of capital distribution in excess of our current and accumulated earnings and profits that is not attributable to the gain from our disposition of a “United States real property interest” if the excess portion of the distribution does not exceed the adjusted basis of the non-U.S. stockholder’s stock. Instead, the excess portion of the distribution will reduce the
adjusted basis of the stock. However, a non-U.S. stockholder will be subject to tax on such a distribution that exceeds both our current and accumulated earnings and profits and the non-U.S. stockholder’s adjusted basis in the stock, if the non-U.S. stockholder otherwise would be subject to tax on gain from the sale or disposition of its stock, as described below. Because we generally cannot determine at the time we make a distribution whether or not the distribution will exceed our current and accumulated earnings and profits, we normally will withhold tax on the entire amount of any distribution at the same rate as we would withhold on a dividend. However, a non-U.S. stockholder may file a U.S. federal income tax return and obtain a refund from the IRS of amounts that we withhold if we later determine that a distribution in fact exceeded our current and accumulated earnings and profits.
We may be required to withhold 10% of any distribution that exceeds our current and accumulated earnings and profits. Consequently, although we intend to withhold at a rate of 30% on the entire amount of any distribution that is neither attributable to the gain from our disposition of a “United States real property interest” nor designated by us as a capital gain dividend, to the extent that we do not do so, we will withhold at a rate of 10% on any portion of a distribution not subject to withholding at a rate of 30%.
Subject to the exception discussed below for 5% or smaller holders of regularly traded classes of stock, a non-U.S. stockholder will incur tax on distributions that are attributable to gain from our sale or exchange of “United States real property interests” under special provisions of the Foreign Investment in Real Property Tax Act of 1980, or FIRPTA, regardless of whether we designate such distributions as capital gain distributions. The term “United States real property interests” includes interests in U.S. real property and stock in U.S. corporations at least 50% of whose assets consist of interests in U.S. real property. Under those rules, a non-U.S. stockholder is taxed on distributions attributable to gain from sales of United States real property interests as if the gain were effectively connected with the non-U.S. stockholder’s conduct of a U.S. trade or business. A non-U.S. stockholder thus would be required to file a U.S. federal income tax return to report such income and would be taxed on such a distribution at the normal capital gain rates applicable to U.S. stockholders, subject to applicable alternative minimum tax and a special alternative minimum tax in the case of a nonresident alien individual. A corporate non-U.S. stockholder not entitled to treaty relief or exemption also may be subject to the 30% branch profits tax on such a distribution. We generally must withhold 35% of any distribution subject to these rules (“35% FIRPTA Withholding”). A non-U.S. stockholder may receive a credit against its tax liability for the amount we withhold.
A non-U.S. stockholder that owns no more than 5% of our stock at all times during the one-year period ending on the date of a distribution would not be subject to FIRPTA, branch profits tax or 35% FIRPTA Withholding with respect to a distribution on stock that is attributable to gain from our sale or exchange of United States real property interests, if our stock were regularly traded on an established securities market in the United States. Instead, any such distributions made to such non-U.S. stockholder would be subject to the general withholding rules discussed above, which generally impose a withholding tax equal to 30% of the gross amount of each distribution (unless reduced by treaty). Our shares are not traded on an established securities market.
Distributions that are designated by us as capital gain dividends, other than those attributable to the disposition of a U.S. real property interest, generally should not be subject to U.S. federal income taxation unless:
such distribution is effectively connected with the non-U.S. stockholder’s U.S. trade or business and, if certain treaties apply, is attributable to a U.S. permanent establishment maintained by the non-U.S. stockholder, in which case the non-U.S. stockholder will be subject to tax on a net basis in a manner similar to the taxation of U.S. stockholders with respect to such gain, except that a holder that is a foreign corporation may also be subject to the additional 30% branch profits tax; or
the non-U.S. stockholder is a nonresident alien individual who is present in the United States for 183 days or more during the taxable year and has a “tax home” in the United States, in which case such nonresident alien individual generally will be subject to a 30% tax on the individual’s net U.S. source capital gain.
It iscircumstances not entirely clear to what extent we are required to withhold on distributions to non-U.S. stockholders that are not treated as ordinary income and are not attributable to the disposition of a United States real property interest. Unless the law is clarified to the contrary, we will generally withhold and remit to the IRS 35% of any distribution to a non-U.S. stockholder that is designated as a capital gain dividend (or, if greater, 35% of a distribution that could have been designated as a capital gain dividend). Distributions can be designated as capital gain dividends to the extent ofwithin our net capital gain for the taxable year of the distribution. The amount withheld is creditable against the non-U.S. stockholder’s U.S. federal income tax liability.control.
Dispositions
If gain on the sale of the stock were taxed under FIRPTA, a non-U.S. stockholder would be taxed on that gain in the same manner as U.S. stockholders with respect to that gain, subject to applicable alternative minimum tax, and a special alternative minimum tax in the case of nonresident alien individuals. A non-U.S. stockholder generally will not incur tax under FIRPTA on a sale or other disposition of our stock if we are a “domestically controlled qualified investment entity,” which requires that, during the shorter of the period since our formation and the five-year period ending on the date of the distribution or disposition, non-U.S. stockholders hold, directly or indirectly, less than 50% in value of our stock and we are qualified as a REIT. We cannot assure you that we will be a domestically controlled qualified investment entity. In addition, the gain from a sale of our stock by a non-U.S. stockholder will not be subject to tax under FIRPTA if (i) our stock is considered regularly traded under applicable Treasury Regulations on an established securities market, such as the New York Stock Exchange, and (ii) the non-U.S. stockholder owned, actually or constructively, 5% or less of our stock at all times during a specified testing period. Our shares are not traded on an established securities market.
In addition, even if we are a domestically controlled qualified investment entity, upon a disposition of our stock, a non-U.S. stockholder may be treated as having gain from the sale or exchange of a United States real property interest if the non-U.S. stockholder (i) disposes of an interest in our stock during the 30-day period preceding the ex-dividend date of a distribution, any portion of which, but for the disposition, would have been treated as gain from sale or exchange of a United States real property interest, and (ii) directly or indirectly acquires, enters into a contract or option to acquire, or is deemed to acquire, other shares of our stock within 30 days before or after such ex-dividend date. The foregoing rule does not apply if the exception described above for dispositions by 5% or smaller holders of regularly traded classes of stock is satisfied.
Furthermore, a non-U.S. stockholder generally will incur tax on gain not subject to FIRPTA if (i) the gain is effectively connected with the non-U.S. stockholder’s U.S. trade or business and, if certain treaties apply, is attributable to a U.S. permanent establishment maintained by the non-U.S. stockholder, in which case the non-U.S. stockholder will be subject to the same treatment as U.S. stockholders with respect to such gain, or (ii) the non-U.S. stockholder is a nonresident alien individual who was present in the United States for 183 days or more during the taxable year and has a “tax home” in the United States, in which case the non-U.S. stockholder will generally incur a 30% tax on his or her net U.S. source capital gains.
Purchasers of our stock from a non-U.S. stockholder generally will be required to withhold and remit to the IRS 10% of the purchase price unless at the time of purchase (i) any class of our stock is regularly traded on an established securities market in the United States (subject to certain limits if the stock sold are not themselves part of such a regularly traded class) or (ii) we are a domestically controlled qualified investment entity. The non-U.S. stockholder may receive a credit against its tax liability for the amount withheld.
Information Reporting Requirements and Backup Withholding Tax
We will report to our U.S. stockholders and to the IRS the amount of distributions paid during each calendar year, and the amount of tax withheld, if any. Under the backup withholding rules, a U.S. stockholder may be subject to backup withholding at the current rate of 28% with respect to distributions paid, unless such stockholder (i) is a corporation or other exempt entity and, when required, proves its status or (ii) certifies under penalties of perjury that the taxpayer identification number the stockholder has furnished to us is correct and the stockholder is not subject to backup withholding and otherwise complies with the applicable requirements of the backup withholding rules. A U.S. stockholder that does not provide us with its correct taxpayer identification number also may be subject to penalties imposed by the IRS.
We will also report annually to the IRS and to each non-U.S. stockholder the amount of dividends paid to such holder and the tax withheld with respect to such dividends, regardless of whether withholding was required. Copies of the information returns reporting such dividends and withholding may also be made available to the tax authorities in the country in which the non-U.S. stockholder resides under the provisions of an applicable income tax treaty. A non-U.S. stockholder may be subject to back-up withholding unless applicable certification requirements are met.
New reporting requirements generally will apply with respect to dispositions of REIT shares acquired after 2010 (2011 in the case of shares acquired in connection with a distribution reinvestment plan). Brokers that are required to report the gross proceeds from a sale of shares on Form 1099-B will also be required to report the customer’s adjusted basis in the shares and whether any gain or loss with respect to the shares is long-term or short-term. In some caes, there may be alternative methods of determining the basis in shares that are disposed of, in which case your broker will apply a default method of its choosing if you do not indicate which method you choose to have applied. You should consult with your own tax advisor regarding the new reporting requirements and your election options.
Backup withholding is not an additional tax. Any amounts withheld under the backup withholding rules may be allowed as a refund or a credit against such holder’s U.S. federal income tax liability, provided the required information is furnished to the IRS.
Additional U.S. Federal Income Tax Withholding Rules
Additional U.S. federal income tax withholding rules apply to certain payments made after December 31, 2013 to foreign financial institutions and certain other non-U.S. entities. A withholding tax of 30% would apply to dividend payments made after December 31, 2013 and the gross proceeds of a disposition of our stock paid to certain foreign entities after December 31, 2014, unless various information reporting requirements are satisfied. For these purposes, a foreign financial institution generally is defined as any non-U.S. entity that (i) accepts deposits in the ordinary course of a banking or similar business, (ii) as a substantial portion of its business, holds financial assets for the account of others, or (iii) is engaged or holds itself out as being engaged primarily in the business of investing, reinvesting, or trading in securities, partnership interests, commodities, or any interest in such assets. Prospective investors are encouraged to consult their tax advisors regarding the implications of these rules with respect to their investment in our stock, as well as the status of any related federal regulations.
Sunset of Reduced Tax Rate Provisions
Several of the tax considerations described herein are subject to a sunset provision. The sunset provisions generally provide that for taxable years beginning after December 31, 2012, certain provisions that are currently in the Code will revert back to a prior version of those provisions. These provisions include provisions related to the reduced maximum U.S. federal income tax rate for long-term capital gains of 15% (rather than 20%) for taxpayers taxed at individual rates, the application of the 15% U.S. federal income tax rate for qualified dividend income, and certain other tax rate provisions described herein. The impact of this reversion generally is not discussed herein. Prospective stockholders are urged to consult their tax advisors regarding the effect of sunset provisions on an investment in our stock.
Legislative or Other Actions Affecting REITs
The rules dealing with U.S. federal income taxation are constantly under review by persons involved in the legislative process and by the IRS and the U.S. Treasury Department. No assurance can be given as to whether, when, or in what form, the U.S. federal income tax laws applicable to us and our stockholders may be enacted. Changes to the U.S. federal tax laws and interpretations of federal tax laws could adversely affect an investment in our stock.
State, Local and Foreign Tax
We may be subject to state, local and foreign tax in states, localities and foreign countries in which we do business or own property. The tax treatment applicable to us and our stockholders in such jurisdictions may differ from the U.S. federal income tax treatment described above.
BOARD REVIEW OF OUR INVESTMENT POLICIES
Our board of directors has established written policies on investments and borrowing. Our board is responsible for monitoring the administrative procedures, investment operations and performance of our company and our management to ensure such policies are carried out, and that such policies are updated and adjusted consistent with our charter, our strategic plan and business model, and any changes in law or regulation. Our charter requires that our independent directors review our investment policies at least annually to determine that our policies are in the best interest of our stockholders. Each determination and the basis thereof is required to be set forth in the minutes of our applicable meetings of our directors. Implementation of our investment policies also may vary as new investment techniques are developed.
As required by our charter, our independent directors have reviewed our policies referred to above and determined that they are in the best interest of our stockholders because they provide the basis for and increase the likelihood that we will be able to acquire a diversified portfolio of stable income producing properties, thereby properly managing risk and creating stable yield and long term value in our portfolio, and they define the attributes we seek when evaluating the sufficiency of our acquisition opportunities. Our implementation of and commitment to these policies is further enhanced by the facts that (1) our executive officers, directors and management have expertise with the type of real estate investments we seek to acquire and own, and (2) our liquidity and borrowings have enabled us to purchase assets in both strong and challenging economic environments and to timely earn short and long term rental income, thereby increasing our likelihood of generating income for our stockholders and preserving stockholder capital.
EXECUTIVE OFFICERS OF THE REGISTRANT
The information regarding our executive officers included in Part III, Item 10 of this Annual Report on Form 10-K is incorporated herein by reference.
Item 1A. Risk Factors
Risks Related to Our Common Stock
There is currently no public market for shares of our common stock. Therefore, it will be difficult for stockholders to sell their shares and, if they are able to sell their shares, they will likely sell them at a discount.
There currently is no public market for shares of our common stock. We do not expect a public market for our stock to develop prior to the listing of our shares on a national securities exchange, which may not occur in the near future or at all. Additionally, our charter contains restrictions on the ownership and transfer of our shares, and these restrictions may inhibit our stockholders' ability to sell their shares. We have adopted a share repurchase plan, however, it is limited in terms of the amount of shares which may be repurchased quarterly and annually and may be limited, suspended, terminated or amended at any time by our board of directors, in its sole discretion, upon 30 days' notice. On November 24, 2010, we, with the approval of our board of directors, elected to amend and restate our share repurchase plan effective January 1, 2011. Under our share repurchase plan, we expect to fund a maximum of $10 million of share repurchase requests per quarter, subject to available funding. Funding for our repurchase program each quarter will come exclusively from and will be limited to the sale of shares under our DRIP during such quarter. These limits have prevented us from accommodating all repurchase requests in the past and are likely to do so in the future. In addition, with the termination of our follow-on offering on February 28, 2011, except for the DRIP, we are conducting an ongoing review of potential alternatives for our share repurchase plan, including the suspension or termination of the plan.
Therefore, it may be difficult for our stockholders to sell their shares promptly or at all. If our stockholders are able to sell their shares, they may only be able to sell them at a substantial discount from the price they paid. This may be the result, in part, of the fact that at the time we make our investments, the amount of funds available for investment has been reduced by approximately 11.5% of the gross offering proceeds that was used to pay selling commissions, the dealer manager fee and organizational and offering expenses. We also are required to use gross offering proceeds to pay acquisition expenses. Unless our aggregate investments increase in value to compensate for these fees and expenses, which may not occur, it is unlikely that our stockholders will be able to sell their shares without incurring a substantial loss. We cannot assure our stockholders that their shares will ever appreciate in value equal to the price they paid for their shares. Thus, stockholders should consider their investment in our common stock as illiquid and a long-term investment, and stockholders must be prepared to hold their shares for an indefinite length of time.
Stockholders may be unable to sell their shares because their ability to have shares repurchased pursuant to our amended and restated share repurchase plan has been limited.
Even though our share repurchase plan may provide stockholders with a limited opportunity to sell shares to us after they have held them for a period of one year or in the event of death or qualifying disability, stockholders should be fully aware that our share repurchase plan contains significant restrictions and limitations. Repurchases of shares, when requested, will generally be made quarterly. Our board may limit, suspend, terminate or amend any provision of the share repurchase plan upon 30 days' notice. Repurchases will be limited to 5.0% of the weighted average number of shares outstanding during the prior calendar year, subject to available funding from the DRIP. Further, we expect to fund a maximum of $10 million of share repurchase requests per quarter, subject to available funding. Funding for quarterly repurchases of shares will come exclusively from and will be limited to the net proceeds from the sale of shares under the DRIP in the applicable quarter. In addition, stockholders must present at least 25.0% of their shares for repurchase and until they have held shares for at least four years, repurchases will be made for less than stockholders paid for their shares. Therefore, stockholders should not assume that they will be able to sell any of their shares back to us pursuant to our amended and restated share repurchase plan at any particular time or at all.
The availability and timing of cash distributions to our stockholders is uncertain.
In the past we have made monthly distributions to our stockholders. However, we bear all expenses incurred in our operations, which are deducted from cash funds generated by operations prior to computing the amount of cash distributions to our stockholders. In the future, we will be restricted by the terms of our credit agreement for our unsecured credit facility from paying distributions in excess of our FFO, as adjusted pursuant to the terms of the credit agreement, or a percentage of such adjusted FFO. In addition, our board of directors, in its discretion, may retain any portion of such funds for working capital. We cannot assure our stockholders that sufficient cash will be available to make distributions or that the amount of distributions will increase over time. If we fail for any reason to distribute at least 90.0% of our ordinary taxable income, we would not qualify for the favorable tax treatment accorded to REITs.
We may not have sufficient cash available from operations to pay distributions and, therefore, distributions may include a return of capital.
Distributions payable to stockholders may include a return of capital, rather than a return on capital. It is our present intention to continue to make monthly distributions to our stockholders. However, the actual amount and timing of distributions will be determined by our board of directors in its discretion and typically will depend on the amount of funds available for distribution, which will depend on items such as current and projected cash requirements and tax considerations. As a result, our distribution rate and payment frequency may vary from time to time. We may not have sufficient cash available from operations to pay distributions required to maintain our status as a REIT and may need to use borrowed funds to make such cash distributions, which may reduce the amount of proceeds available for investment and operations. Additionally, if the aggregate amount of cash distributed in any given year exceeds the amount of our “REIT taxable income” generated during the year, the excess amount will be deemed a return of capital, which will decrease our stockholders' tax basis in their investment in shares of our common stock. Our organizational documents do not establish a limit on the amount of net proceeds we may use to fund distributions.
We may not have sufficient cash available from operations to pay distributions and, therefore, distributions may be paid, without limitation, with borrowed funds.
The amount of the distributions we make to our stockholders will be determined by our board of directors, at its sole discretion, and is dependent on a number of factors, including funds available for payment of distributions, our financial condition, and capital expenditure requirements and annual distribution requirements needed to maintain our status as a REIT, as well as any liquidity event alternatives we may pursue. On February 14, 2007, our board of directors approved a 7.25% per annum, or $0.725 per common share, distribution based on a $10.00 share price, to be paid to our stockholders beginning with our February 2007 monthly distribution, and we have continued to declare distributions at that rate through the first quarter of 2012. However, our board may reduce our distribution rate and we cannot guarantee the amount and timing of distributions paid in the future, if any.
If our cash flow from operations is less than the distributions our board of directors determines to pay, we would be required to pay our distributions, or a portion thereof, with borrowed funds. As a result, the amount of proceeds available for investment and operations would be reduced, or we may incur additional interest expense as a result of borrowed funds.
In the past we have paid a portion of our distributions using offering proceeds or borrowed funds, and we may continue to use borrowed funds in the future to pay distributions. For the year ended December 31, 2011, we paid distributions of $160,664,000 ($84,800,000 in cash and $75,864,000 in shares of our common stock pursuant to the DRIP), as compared to cash flow from operations of $111,807,000. The remaining $48,857,000 of distributions paid in excess of our cash flow from operations, or 30%, was paid using proceeds of our offerings or proceeds of debt financing. In addition, the DRIP may be terminated at any time by our board of directors and may be amended at any time by our board of directors, at its sole discretion, upon 10 days notice.
We presently intend to effect a liquidity event by September 20, 2013, however, we cannot assure our stockholders that we will effect a liquidity event by such time or at all. If we do not effect a liquidity event as presently intended, it will be very difficult for our stockholders to have liquidity for their investment in shares of our common stock.
On a limited basis, our stockholders may be able to sell shares through our share repurchase plan. We may amend or terminate our share repurchase plan with 30 days notice. We may also consider various forms of liquidity events, including, without limitation (1) a Listing, (2) a sale or merger in a transaction that provides our stockholders with a combination of cash and/or securities of a publicly traded company, and (3) the sale of all or substantially all of our real property for cash or other consideration. We presently intend to effect a liquidity event by September 20, 2013, however, we cannot assure our stockholders that we will effect a liquidity event within such time or at all. If we do not effect a liquidity event as presently intended, it will be very difficult for our stockholders to have liquidity for their investment in shares of our common stock.
Because a portion of the offering price from the sale of shares was used to pay expenses and fees, the full offering price paid by our stockholders was not invested in real estate investments. As a result, our stockholders will only receive a full return of their invested capital if we either (1) sell our assets or our company for a sufficient amount in excess of the original purchase price of our assets, or (2) the market value of our company after a Listing is substantially in excess of the original purchase price of our assets.
In the event our shares of common stock are listed on a national securities exchange, our common stock will be converted into shares of Class A and Class B common stock, the shares of Class B common stock would not immediately be listed on such exchange and there would be no public market for the shares of Class B common stock.
Our charter provides that in the event our shares of common stock are listed on a national securities exchange, our common stock will automatically be reclassified and converted into shares of Class A common stock and Class B common stock immediately prior to a Listing. The shares of Class A common stock would be listed on a national securities exchange upon a Listing. The shares of Class B common stock would not be listed. Rather, those shares would convert into shares of Class A common stock and become listed in defined phases, over a defined period of time. We believe all shares of Class B common stock would convert into shares of Class A common stock within 18 months of a Listing, with individual classes of Class B common stock converting into Class A common stock and becoming listed every six months. If we pursue a Listing, the ultimate length of the overall phased in liquidity program and the timing of each of the phases will depend on a number of factors, including the timing of the Listing. As a result, there would be no public market for the shares of Class B common stock. Until the shares of Class B common stock convert into Class A common stock and become listed, they cannot be traded on a national securities exchange. As a result, after a Listing, our stockholders will have very limited, if any, liquidity with respect to their shares of Class B common stock. Further, the trading price per share of Class A common stock when each class of Class B common stock converts into Class A common stock could be very different than the trading price per share of the Class A common stock on the date of a Listing. As a result, our stockholders may receive less consideration for their shares than they may have received if they had been able to sell immediately upon the effectiveness of a Listing.
Risks Related to Our Business
We are dependent on investments in a single industry,the healthcare property sector, making our profitability more vulnerable to a downturn or slowdown in that sector than if we were investing in multiple industries.
We concentrate our investments in the healthcare property sector. As a result, we are subject to risks inherent to investments in a single industry. A downturn or slowdown in the healthcare property sector would have a greater adverse impact on our business than if we had investments in multiple industries. Specifically, a downturn in the healthcare property sector could negatively impact the ability of our tenants to make loan or lease payments to us as well as our ability to maintain rental and occupancy rates, which could adversely affect our business, financial condition and results of operations, as well asand our ability to make distributions to our stockholders.
We face competition for the acquisition of medical office buildings and other facilities that serve the healthcare industry, which may impede our ability to make future acquisitions or may increase the cost of these acquisitions.
We compete with many other entities engaged in real estate investment activities for acquisitions of medical office buildings and other facilities that serve the healthcare industry, including national, regional and local operators, acquirers and developers of healthcare real estate properties. The competition for healthcare real estate properties may significantly increase the price we must pay for medical office buildings and other facilities that serve the healthcare industry or other real estate related assets we seek to acquire. Our competitorsThe competition may succeed in acquiring thosealso generally limit the number of suitable investment opportunities offered to us or the number of properties or assets themselves. In addition, ourthat we are able to acquire, and may increase the bargaining power of property owners seeking to sell to us, making it more difficult for us to acquire new properties on attractive terms. Our potential acquisition targets may find our competitors to be more attractive because they may have greater resources, may be willing to pay more forto acquire the properties or may have a more compatible operating philosophy. In particular, larger healthcare REITs may enjoy significant competitive advantages over us that result from, among other things, a lower cost of capital and enhanced operating efficiencies. Moreover, these entities generally may be able to accept more risk than we can prudently manage or are willing to accept. In addition, the number of entities and the amount of funds competing for suitable investment properties may increase, which could result in increased demand for these properties and, therefore, increased prices paid forto acquire them. Because of an increased interest in single-property acquisitions among tax-motivated individual purchasers, we may pay higher prices if wefor the purchase of single properties in comparison with portfolio acquisitions.the purchase of multi-property portfolios. If we pay higher prices for medical office buildings and other facilities that serve the healthcare industry, our business, financial condition and results of operations and our ability to make distributions to our stockholders may be adversely affected.
We may not be successful in identifying and completing off-market acquisitions directly from hospitals and developers and other suitable acquisitions or investment opportunities, which may impede our growth and adversely affect our business, financial condition and results of operations, and our ability to make distributions to our stockholders.
A key component of our growth strategy is to acquire properties before they are widely marketed by the owners, or "off-market."directly from hospitals and developers. Facilities that are acquired off-marketdirectly from hospitals and developers are typically more attractive to us as a purchaser because of the absence of a formal marketing process, which could lead to higher prices. If we cannot obtain off-market deal flowattractive acquisition opportunities directly from hospitals and developers in the future, our ability to locate and acquire facilities at attractive prices could be adversely affected. We expect to compete for investment opportunities with entities that may have substantially greater financial resources than we have. These entities generally may be
able to accept more risk than we can prudently manage. This competition may generally limit the number of suitable investment opportunities offered to us or the number of facilities that we are able to acquire. This competition may also increase the bargaining power of facility owners seeking to sell to us, making it more difficult for us to acquire new facilities on attractive terms.
We may not be able to maintain or expand our relationships with our existing and future hospital and healthcare system clients.
The success of our business depends to a large extent on our past, current and future relationships with hospital and healthcare system clients. We invest a significant amount of time to develop and maintain these relationships, and theythese relationships have helped us to secure acquisition and development opportunities, with both new and existing clients. If any of our relationships with hospital or healthcare system clients deteriorates, or if a conflict of interest or non-compete arrangement prevents us from expanding these relationships, our ability to secure new acquisition and development opportunities could be adversely impactedaffected and our professional reputation within the industry could be damaged.
If we are unable to find suitable investments, we may not be able to achieve our investment objectives.
We may not be able to achieve our investment objectives or may be unable to locate or acquire suitable investments. We cannot assure our stockholders that acquisitions of real estate or other real estate related assets will produce a return on our investment or will generate cash flow to enable us to make distributions to our stockholders.
We may be unable to acquire any of the properties that we have in our acquisition pipelineare pursuing or underwhich are subject to non-binding letters of intent, which could adversely affect our business, results of operations and our ability to make distributions to our stockholders.
As of the date of this Annual Report on Form 10-K,At any given time, we may be pursuing property acquisitions or have additional properties in our acquisition pipeline and undersubject to non-binding letters of intent. We cannot assure you that we will acquire any of thesuch properties in our acquisition pipeline or under these letters of intent because the letters of intent are non-binding and each of these transactions ispotential transaction opportunities are subject to a variety of factors, including: (i) the willingness of the current property owner to proceed with a transaction,potential transaction; (ii) our completion of satisfactory due diligence that is satisfactory to us and our receipt of internal approvals; (iii) the negotiation and execution of a mutually acceptable binding definitive purchase agreementagreement; and (iv) the satisfaction of closing conditions, including theour receipt of third-party consents and approvals. Accordingly, we cannot assure you that we will be in a position to acquire any of the properties in our acquisition pipeline or under non-binding letters of intent.such properties. We may incur significant costs and divert management attention in connection with the evaluation and negotiation of potential acquisitions, including onespotential transactions that we are subsequently unable to complete. If we are unsuccessful in completing the acquisition of additional properties in the future, our business, results of operations and our ability to make distributions to our stockholders will be adversely affected.
Our results of operations, our ability to pay distributions to our stockholders, and our ability to dispose of our investments are subject to general economic conditions affecting the commercial real estate and credit markets.
Our business is sensitive to national, regional and local economic conditions, as well as the commercial real estate and credit markets. For example, the financial disruption and accompanying credit crisis negatively impacted the value of commercial real estate assets, contributing to a general slowdown in our industry, which may continue in some or all of our markets through 2012.the year ending December 31, 2014. The financial markets are still recovering from a recession, which created volatile market conditions, and resulted in a decrease in the availability of business credit, and led to the insolvency, closure or acquisition of a number of financial institutions. A slow economic recovery could continue or accelerate the reduction in overall transaction volume and size of sales and leasing activities of the type that we have already experienced, and would continue to put downward pressure on our revenues and operating results. We are unable to predict future changes in national, regional or local economic, demographic or real estate market conditions.
Adverse economic conditions in the commercial real estate and credit markets may result in:
defaults by tenants of our properties due to bankruptcy, lack of liquidity or operational failures;
rent concessions or reduced rental rates for our tenants to maintain or increase occupancy levels;
levels at our properties;
reduced values of our properties, thereby limiting our ability to dispose of our assets at attractive prices or obtain debt financing secured by our properties as well as reducing the availability of unsecured loans;
the value and liquidity of our short-term investments and cash deposits being reduced as a result of a deterioration of the financial condition of the institutions that hold our cash deposits or the institutions or assets in which we have made short-term investments, the dislocation of the markets for our short-term investments, increased volatility in market rates for such investment orand other factors;
one or more lenders under our unsecured credit facilityfacilities refusing to fund their financing commitment to us whichand, in such caseevent, we may not be ableare unable to replace the financing commitment of any such lender or lenders on favorable terms, or at all;
a recession or rise in interest rates, which could make it more difficult for us to lease realour properties or dispose of themour properties or make alternative interest-bearing and other investments more attractive, thereby lowering the relative value of our existing real estate investments;
one or more counter partiescounterparties to our interest rate swaps defaultingdefault on their obligations to us, thereby increasing the risk that we may not realize the benefits of these instruments;
increases in the supply of competing properties or decreases in the demand for our properties, which may impact our ability to maintain or increase occupancy levels and rents at our properties or to dispose of our investments;
constricted access to credit, which may result in tenant defaults or non-renewals under leases;leases with our tenants; and
increased insurance premiums, real estate taxes or energy or other expenses, which may reduce funds available for distribution to our stockholders or, to the extent such increases are passed through to our tenants, may lead to tenant defaults or make it difficult for us to increase rents to tenants on turnover, which may limit our ability to increase our returns.
Our business, financial condition, results of operations and our ability to pay distributions to our stockholders may be negatively impactedadversely affected to the extent an economic slowdown or downturn is prolonged or becomes more severe.
Our property investmentsgrowth depends on external sources of capital that are geographically concentrated in certain states and subject to economic fluctuations in those states.
As of December 31, 2011, we had interests in 26 buildings located in Texas, which accounted for 15.0%outside of our annualized rental income, interests in 44 buildings in Arizona,control, which accounted for 12.1%may affect our ability to seize strategic opportunities, satisfy debt obligations and make distributions to our stockholders.
In order to qualify as a REIT, we must distribute to our stockholders, on an annual basis, at least 90% of our annualized rentalREIT taxable income, interests in 22 buildings located in South Carolina, which accounteddetermined without regard to the deduction for 9.6%dividends paid and excluding net capital gains. Because of these distribution requirements, we may not be able to fund future capital needs, including any necessary acquisition financing, from operating cash flow. Consequently, we may need to rely on third-party sources to fund our annualized rental income, interests in 20 buildings in Florida, which accounted for 8.7% ofcapital needs, meet our annualized rental income, and interests in 44 buildings in Indiana, which accounted for 8.1% of our annualized rental income. This rental income is based on contractual base rent from leases in effect as of December 31, 2011. As a result, our business, financial condition, results of operations, and ability todebt service obligations, make distributions to our stockholders, couldor make future investments necessary to implement our business strategy. We may not be disproportionately affected by an economic downturnable to obtain financing on favorable terms, in the time period we desire, or other events affectingat all. Our access to third-party sources of capital depends, in part, on: general market conditions; the economies in these states.
market's perception of our growth potential; our current debt levels; our current and expected future earnings; our cash flow and cash distributions; and the market price per share of our Class A common stock. If we cannot obtain capital from third-party sources, we may not be able to acquire properties when strategic opportunities exist, satisfy our principal and interest obligations, or make the cash distributions to our stockholders necessary to maintain our qualification as a REIT.
Our success depends to a significant degree upon the continued contributions of certain key personnel, each of whom would be difficult to replace. If we were to lose the benefit of the experience, efforts and abilities of one or more of these individuals, our operating results could suffer.
Our ability to achieve our investment objectives and to pay distributions is dependent upon the performance of our boardBoard of directors,Directors, Scott D. Peters as our Chief Executive Officer, President and Chairman of the Board, Kellie S. Pruitt as our Chief Financial Officer, Treasurer and Secretary, Mark D. Engstrom as our Executive Vice President - Acquisitions, Amanda L. Houghton, as our Executive Vice President - Asset Management, and our other employees, in the identification and acquisition of investments, the determination of any financing arrangements, the asset management of our investments and operation of our day-to-day activities. Our stockholders will have no opportunity to evaluate the terms of transactions or other economic or financial data concerning our investments that are not described in this Annual Report on Form 10-K or other periodic filings with the SEC. We rely primarily on the management ability of our Chief Executive Officer and other executive officers and the governance by the members of our boardBoard of directors,Directors, each of whom would be difficult to replace. We do not have any key mankey-person life insurance on Messrs. Peters and Engstrom or Mses. Pruitt and Houghton. Although we have entered into employment agreements with each of Messrs. Peters and Engstrom and Mses. Pruitt and Houghton, the employment agreements contain various termination rights. If we were to lose the benefit of theirthe experience, efforts and abilities of these executives, our operating results could suffer. In addition, if any member of our boardBoard of directorsDirectors were to resign, we would lose the benefit of such director'sdirector’s governance, experience and experience.familiarity with us and the sector within which we operate. As a result of the foregoing, we may be unable to achieve our investment objectives or to pay distributions to our stockholders.
Compliance with changing government regulations may result in additional expenses.
During JulyThe 2010 the Dodd-Frank Wall Street Reform and Consumer Protection Act, or the Dodd-Frank Act, was signed into federal law. The provisions of the Dodd-Frank Act includeincludes new regulations for over-the-counter derivatives and substantially increased regulation and risk of liability for credit rating agencies, all of which could increase our cost of capital. The Dodd-Frank Act also includes provisions concerning corporate governance and executive compensation which, among other things, require additional executive compensation disclosures and enhanced independence requirements for board compensation committees and related advisors, as well as provide explicit authority for the SEC to adopt proxy access, all of which could result in additional expenses in order to maintain compliance. The Dodd-Frank Act is wide-ranging, and the provisions are broad with significant discretion given to the many and varied agencies tasked with adopting and implementing the act.Act. The majority of the provisions of the Dodd-Frank Act did not go into effect immediately and may be adopted and implemented over many months or years. As such, we cannot predict the full impact of the Dodd-Frank Act on our business, financial condition, results of operations and our ability to pay distributions to our stockholders.
Failure to maintain effective internal control over financial reporting could harm our business, results of operations and financial condition.
Pursuant to the Sarbanes-Oxley Act of 2002, we are required to provide a report by management on internal control over financial reporting, including management's assessment of the effectiveness of such control. Changes to our business will necessitate ongoing changes to our internal control systems and processes. Internal control over financial reporting may not prevent or detect misstatements because of its inherent limitations, including the possibility of human error, the circumvention or overriding of controls, or fraud. Therefore, even effective internal controls can provide only reasonable assurance with respect to the preparation and fair presentation of financial statements. If we fail to maintain the adequacy of our internal controls, including any failure to implement required new or improved controls, or if we experience difficulties in their implementation, our business, results of operations and financial condition could be adversely harmed and we could fail to meet our reporting obligations.
Risks Related to our Organizational Structure
We may structure acquisitions of property in exchange for limited partnership units inof our operating partnership on terms that could limit our liquidity or our flexibility.
We may continue to acquire properties by issuing limited partnership units in our operating partnership in exchange for a property owner contributing property. For example, approximately 0.07% of our operating partnership, is owned by individual physician investors that elected to exchange their partnership interests in the partnership that owns the 7900 Fannin medical office building for limited partner units of our operating partnership. We may continue to acquire properties by issuing limited partnership units in our operating partnershipHTALP, in exchange for a property owner contributing property to the partnership.us. If we continue to enter into such transactions, in order to induce the contributors of such properties to accept units inof our operating partnership rather than cash in exchange for their properties, it may be necessary for us to provide themsuch additional incentives. For instance, our operating partnership'spartnership’s limited partnership agreement provides that any holder of units may exchange limited partnership units on a one-for-one basis for, shares of our common stock, or, at our option, cash equal to the value of an equivalent number of our shares.shares of common stock. We may, however, enter into additional contractual arrangements with contributors of property under which we would agree to repurchase a contributor'scontributor’s units for shares of our common stock or cash, at the option of the contributor, at set times. If the contributor required us to repurchase units for cash pursuant to such a provision, it would limit our liquidity and, thus, our ability to use cash to make other investments, satisfy other obligations or make distributions to stockholders. Moreover, if we were required to repurchase units for cash at a time when we did not have sufficient cash to fund the repurchase, we might be required to sell one or more of our properties to raise funds to satisfy this obligation. Furthermore, we might agree that if distributions the contributor received as a limited partner in our operating partnership did not provide the contributor with a definedan established return level, then upon redemption of the contributor'scontributor’s units we would pay the contributor an additional amount necessary to achieve that return. Such a provision could further negatively impact our liquidity and flexibility. Finally, in order to allow a contributor of a property to defer taxable gain on the contribution of property to our operating partnership, we might agree not to sell a contributed property for a defined period of time or until the contributor exchanged the contributor'scontributor’s units for cash or shares. Such an agreement would prevent us from selling those properties, even if market conditions madewould cause such a sale to be favorable to us.
Future offeringsOur Board of debt securities, which would be senior to our existing stockholders, or equity securities, which would dilute our existing stockholders and may be senior to our existing stockholders, may adversely affect holders of common stock.
In the future, we may issue debt or equity securities, including medium term notes, senior or subordinated notes and classes of preferred or common stock. Debt securities or shares of preferred stock will generally be entitled to receive distributions, both current and in connection with any liquidation or sale, prior to the holders of our common stock. Our board of directors may issue such securities without stockholder approval and under Maryland law may amend our charter to increase the aggregate number of authorized shares of capital stock or the number of authorized shares of capital stock of any class or series without stockholder approval. We are not required to offer any such additional debt or equity securities to existing common stockholders on a preemptive basis. Therefore, offerings of common stock or other equity securities may dilute the percentage ownership interest of our existing stockholders. To the extent we issue additional equity interests, our stockholders' percentage ownership interest in us will be diluted. Depending upon the terms and pricing of any additional offerings and the value of our real properties and other real estate related assets, our stockholders may also experience dilution in both the book value and fair market value of their shares. As a result, future offerings of debt or equity securities, or the perception that such offerings may occur, may reduce the market price of our common stock and/or the distributions that we pay with respect to our common stock. The issuance of preferred stock or classes of common stock may also render more difficult or tend to
discourage a change of control which could be in the best interest of stockholders.
Our board of directorsDirectors may change our investment objectives and major strategies and take other actions without seeking stockholder approval.
Our boardBoard of directorsDirectors determines our investment objectives and major strategies, including our strategies regarding investments, financing, growth, debt capitalization, REIT qualification, and distributions. Our boardBoard of directorsDirectors may amend or revise these and other strategies without a vote of the stockholders. Under our charter and Maryland law, our stockholders will have a right to vote only on the following matters:
the election or removal of directors;
our dissolution;
certain mergers, consolidations, statutory share exchanges and sales or other dispositions of all or substantially all of our assets; and
any amendmentamendments of our charter, except that our boardBoard of directorsDirectors may amend our charter without stockholder approval to change our name or the name or other designation or the par value of any class or series of our stock and the aggregate par value of our stock, increase or decrease the aggregate number of our shares of stock or the number of our shares of any class or series that we have the authority to issue, or effect certain reverse stock splits.
As a result, our stockholders will not have thea right to approve most actions taken by our boardBoard of directors.Directors.
The limit on the percentage of shares of our common stock that any person may own may discourage a takeover or business combination that may benefit our stockholders.
Our charter restricts the direct or indirect ownership by one person or entity to no more than 9.8% of the value of our then outstanding capital stock (which includes common stock and any preferred stock we may issue) and no more than 9.8% of the value or number of shares, whichever is more restrictive, of our then outstanding common stock. This restriction may discourage a change of control of us and may deter individuals or entities from making tender offers for shares of our common stock on terms that might be financially attractive to stockholders or which may cause a change in our management. This ownership restriction may also prohibit business combinations that would have otherwise been approved by our boardBoard of directorsDirectors and our stockholders. In addition to deterring potential transactions that may be favorable to our stockholders, these provisions may also decrease our stockholders'stockholders’ ability to sell their shares of our common stock.
Our charter includes a provision that may discourage a stockholder from launching a tender offer for shares of our common stock.
Our charter requires that any tender offer made by a person, including any “mini-tender” offer, must comply with Regulation 14D of the Securities Exchange Act of 1934, as amended. The offeror must provide us notice of the tender offer at least ten business days before initiating the tender offer. If the offeror does not comply with these requirements, we will have the right to repurchase that person's shares of our common stock and any shares of our common stock acquired in such tender offer. In addition, the non-complying offeror shall be responsible for all of our expenses in connection with that stockholder's noncompliance. This provision of our charter does not apply to any shares of our common stock that are listed on a national securities exchange. This provision of our charter may discourage a person from initiating a tender offer for shares of our common stock and prevent you from receiving a premium price for your shares of our common stock in such a transaction.
Maryland law and our organizational documents limit our stockholders'stockholders’ right to bring claims against our officers and directors.
Maryland law provides that a director will not have any liability as a director so long as he or shethe director performs his or her duties in good faith, in a manner he or she reasonably believes to be in theour best interest of our stockholders,interests, and with the care that an ordinarily prudent person in a like position would use under similar circumstances. In addition, our charter provides that, subject to the applicable limitations set forth therein or under Maryland law, no director or officer will be liable to us or our stockholders for monetary damages. Our charter also requires us to indemnify and, without requiring a preliminary determination of the ultimate entitlement to indemnification, pay or reimburse reasonable expenses in advance of final disposition of a proceeding to any individual who is a present or former director officer or any individual who while a director or officer and at our request serves or has served as a director, officer, partner or trustee of another corporation, real estate investment trust, partnership, joint venture, trust, employee benefit plan, or other enterprise and who is made or threatened to be made a party to the proceeding by reason of his or her service in that capacity. Moreover, we have entered into separate indemnification agreements with each of our directors and all of our executive officers. As a result, we and our stockholders may have more limited rights against these persons than might otherwise exist under common law. In addition, our charter provides that we are required to pay or reimburse expenses incurred by these persons in advance of final disposition of a proceeding, without requiring a preliminary determination of the ultimate entitlement to indemnification. Our charter also provides that current and former directors and
officers are entitled to indemnification for acts or omissions that occurred while a director or officer and at our request serves or has served as a director, officer, partner, or trustee of our corporation, real estate investment trust, partnership, joint venture, trust, employee benefit plan, or other enterprise and who is made or threatened to be made a party to the proceeding by reason of his or her service in that capacity.
Certain provisions of Maryland law could inhibit changes in control of us, which could lower the value of our Class A Common Stock.
common stock.
Certain provisionprovisions of the Maryland General Corporation Law, or MGCL, applicable to us or MGCL, may have the effect of inhibiting or deterring a third party from making a proposal to acquire us or of delaying or preventing a change of control under circumstancecircumstances that otherwise could provide our stockholders with the opportunity to realize a premium over the then-prevailing market price of such shares, including:
provisions of the MGCL permitsthat permit our boardBoard of directors,Directors, without our stockholder approval and regardless of what is currently provided in our charter or bylaws, to implement certain takeover defenses, including adopting a classified board;
"“business combination"combination” provisions that, subject to limitations, prohibit certain business combinations, asset transfers and equity security issuanceissuances or Reclassificationsreclassifications between us and an "interested stockholder" (define“interested stockholder” (defined generally as any person who beneficially owns 10% or more of the voting power of our sharesoutstanding voting stock or an affiliate or associate of ours who, at any time within the two-year period prior to the date in question, was the beneficial owner of 10% or more of our then outstanding voting shares)stock) or an affiliate of an interested stockholder for five years after the most recent date on which the stockholder becomes an interested stockholder, and thereafter may impose special stockholdersupermajority voting requirements unless certain minimum price conditions are satisfied.satisfied; and
"“control share"share” provisions that provide that "control shares"“control shares” of our company (defined as shares which, when aggregated with other shares controlled by the stockholder, entitle the stockholder to exercise one of three increasing ranges of voting power in electing directors) acquired in a "control“control share acquisition"acquisition” (defined as the direct or indirect acquisition of ownership or control of issued and outstanding "control shares"“control shares”) have no voting rights except to the extent approved by our stockholders by the affirmative vote of at least two-thirds of all the votes entitled to be cast on the matter, excluding all interested shares.
Our boardBoard of directorsDirectors has adopted a resolution providing that any business combination between us and any other person is exempted from this statute, provided that such business combination is first approved by our board. This resolution, however, may be altered or repealed in whole or in part at any time. In the case of the control share provisions of the MGCL, we have opted out of these provisions pursuant to a provision in our bylaws. We may, only upon the approval of our stockholders,however, by amendment to our bylaws, opt in to the control share provisions of the MGCL. We may also choose to adopt a classified board or other takeover defenses in the future. Any such actions could deter a transaction that may otherwise be in the interest of stockholders.
These prohibitions last for five years after the most recent date on which the interested stockholder became an interested stockholder. Thereafter, any business combination with the interested stockholder must be recommended by our board of directors and approved by the affirmative vote of at least 80.0% of the votes entitled to be cast by holders of our outstanding shares of our voting stock and two-thirds of the votes entitled to be cast by holders of shares of our voting stock other than shares held by the interested stockholder or by an affiliate or associate of the interested stockholder. These requirements could have the effect of inhibiting a change in control even if a change in control were in our stockholders' interest. These provisions of Maryland law do not apply, however, to business combinations that are approved or exempted by our board of directors prior to the time that someone becomes an interested stockholder. Our board of directors has adopted a resolution providing that any business combination between us and any other person is exempted from this statute, provided that such business combination is first approved by our board. This resolution, however, may be altered or repealed in whole or in part at any time.
Our stockholders approved amendments to our charter which provide that certain provisions of our charter will not remain in effect in the event our shares of common stock are listed on a national securities exchange.
The provisions of the Statement of Policy Regarding Real Estate Investment Trusts adjusted by the North American Securities Administrators Association, or the NASAA Guidelines, apply to REITs with shares of common stock that are publicly registered with the SEC but are not listed on a national securities exchange. In the event of a Listing, there are certain provisions of our charter that will no longer be required to be included pursuant to the NASAA Guidelines. At our 2010 annual meeting, our stockholders approved amendments to our charter which provided that certain provisions of our charter will not remain in effect in the event of a Listing, including but not limited to provisions which:stockholders.
limit the voting rights per share of stock sold in a private offering;
prohibit distributions in kind, except for distributions of readily marketable securities, distributions of beneficial interests in a liquidity trust or distributions in which each stockholder is advised of the risks of direct ownership of property and offered the election of receiving such distributions;
place limits on incentive fees;
place limits on our organizational and offering expenses;
place limits on our total operating expenses;
place limits on our acquisition fees and expenses;
relate to the requirement that a special meeting of stockholders be called upon the request of stockholders holding 10% of our shares entitled to vote;
relate to the restrictions on amending our charter in certain circumstances without prior stockholder approval;
relate to inspection of our stockholder list and receipt of reports;
relate to restrictions on exculpation, indemnification and the advancement of expenses to our directors; and
relate to prohibitions on roll-up transactions.
Risks Related to Investments in Real Estate
Increasing vacancy rates for commercial real estate resulting from a slow economic recovery could result in increased vacancies at some or all of our properties, which may result in reduced revenue and resale value.
We may experience vacancies byas a defaultresult of tenantstenant defaults under theirtenant leases with us or the expiration or termination of tenant leases, and such vacancies may continue for a long period of time. Recent disruptions in the financial markets and the slow economic recovery have resulted in a trend toward increasing vacancy rates for virtually all classes of commercial real estate, including medical office buildings and other facilities that serve the healthcare industry, due to generally lower demand for rentable space, as well asand the potential oversupply of rentable space. Uncertain economic conditions and related levels of unemployment have led to reduced demand for medical services, causing physician groups and hospitals to delay expansion plans, leaving a growing number of vacancies in new buildings. Reduced demand for medical office buildings and other facilities that serve the healthcare industry could require us to increase concessions,tenant inducements, make tenant improvement expenditures or reduce rental rates to maintain occupancies. WeAs a result, we may suffer reduced revenues resulting in less cash distributions to our stockholders. In addition, the resale value of the propertyour properties could be diminished because the market value of a particular propertyour properties will depend principally upon the value of the leases of such property.
at our properties.
We are dependent on the financial stability of our tenants.
Lease payment defaults by our tenants would cause us to lose the revenue associated with such leases, and we may incur significant litigation costs in enforcing our rights as a landlord against the defaulting tenant causing us to reduce the amount of distributions to our stockholders. Although approximately 56% of our annualized base rent was derived from tenants (or their parent companies) that have a credit rating, a credit rating is no guarantee of a tenant’s ability to perform its lease obligations and a parent company may choose not to satisfy the obligations of a subsidiary that fails to perform its obligations. If the property is subject to a mortgage, a default by a significant tenant on its lease payments to us may result in a foreclosure on the property if we are unable to find an alternative source of revenue to meet mortgage payments. In the event of a tenant default, we may experience delays in enforcing our rights as a landlord and may incur substantial costs in protecting our investment and re-leasing our property, and may not be able to re-lease the property for the rent previously received, if at all. Lease terminations could also reduce the value of theour properties.
We face potential adverse consequences of bankruptcy or insolvency by our tenants.
We are exposed to the risk that our tenants could become bankrupt or insolvent. This risk would be magnified to the extent that a tenant leased or managed multiple facilities.facilities from us. The bankruptcy and insolvency laws afford certain rights to a party that has filed for bankruptcy or reorganization. For example, a debtor-lesseedebtor-tenant may reject its lease with us in a bankruptcy proceeding. In such a case, our claim against the debtor-lesseedebtor-tenant for unpaid and future rents would be limited by the statutory cap of the U.S. Bankruptcy Code. This statutory cap might be substantially less than the remaining rent actually owed to us under the lease, and it is quite likely that any claim we might have against the tenant for unpaid rent would not be paid in full. In addition, a debtor-lesseedebtor-tenant may assert in a bankruptcy proceeding that its lease should be re-characterized as a financing agreement. If such a claim is successful, our rights and remedies as a lender, compared to our rights and remedies as a landlord, would generally be more limited.
Our tenant base may not remain stable or could become more concentrated which could harm our operating results and financial condition.
Our tenant base may not remain stable or could become more concentrated among particular physicians and physician groups with varying practices and other medical service providers in the future. Subject to the terms of the applicable leases, our tenants could decide to leave our properties for numerous reasons, including, but not limited to, financial stress or changes in the tenant's ownership or management. Our tenants service the healthcare industry and our tenant mix could become even more concentrated if a preponderance of our tenants practice in a particular medical field or are reliant upon a particular healthcare delivery system. If any of our tenants become financially unstable, our operating results and prospects could suffer, particularly if our tenants become more concentrated.
Our medical office buildings, other facilities that serve the healthcare industry and tenants may be subject to competition.
Our medical office buildings and other facilities that serve the healthcare industry often face competition from nearby hospitals and other medical office buildings that provide comparable services. Some of those competing facilities are owned by governmental agencies and supported by tax revenues, and others are owned by nonprofit corporations and may be supported to a large extent by endowments and charitable contributions. These types of support are not available to our buildings.
Similarly, our tenants face competition from other medical practices in nearby hospitals and other medical facilities. Further, referral sources, including physicians and managed care organizations, may change their lists of hospitals or physicians to which they refer patients. Competition and loss of referrals could adversely affect our tenants'tenants’ ability to make rental payments, which could adversely affect our rental revenues. Any reduction in rental revenues resulting from the inability of our medical office buildings and our other facilities that serve the healthcare industry and our tenants to compete successfully may have an adverse effect on our business, financial condition and results of operations, and our ability to make distributions to our stockholders.
The hospitals on whose campuses our medical office buildings are located and their affiliated healthcare systems could fail to remain competitive or financially viable, which could adversely impact their ability to attract physicians and physician groups to our medical office buildings.
buildings and our other facilities that serve the healthcare industry.
Our medical office building operations and other facilities that serve the healthcare industry depend on the viability of the hospitals on or near whose campuses our medical office buildings are located and their affiliated healthcare systems in order to attract physicians and other healthcare-related clients. The viability of these hospitals, in turn, depends on factors such as the quality and mix of healthcare services provided, competition, demographic trends in the surrounding community, market position and growth potential, as well as the ability of the affiliated healthcare systems to provide economies of scale and access to capital. If a hospital on or near whose campus one of our medical office buildings is located is unable to meet its financial obligations, and if an affiliated healthcare system is unable to support that hospital, the hospital may not be able to compete successfully or could be forced to close or relocate, which could adversely impact its ability to attract physicians and other healthcare-related clients. Because we rely on our proximity to and affiliations with these hospitals to create demand for space in our medical office buildings, their inability to remain competitive or financially viable, or to attract physicians and physician groups, could adversely affect our medical office building operations and have an adverse effect on us.
The unique nature of certain orof our properties, including our senior healthcare properties, may make it difficult to lease or transfer our property or find replacement tenants, which could require us to spend considerable capital to adapt the property to an alternative use or otherwise negatively affect our performance.
Some of the properties we seek to acquire are specialized medical facilities or otherwise designed or built for a particular tenant of a specific type of use known as a single use facility. For example, senior healthcare facilities present unique challenges with respect to leasing and transferring the same.transfer. Skilled nursing, assisted living and independent living facilities are typically highly customized and may not be easily modified to accommodate non-healthcare-related uses. The improvements generally required to conform a property to healthcare use, such as upgrading electrical, gas and plumbing infrastructure, are costly and often times operator-specific. As a result, these property types may not be suitable for lease to traditional office tenants or other healthcare tenants with unique needs without significant expenditures or renovations. A new or replacement tenant may require different features in a property, depending on that tenant'stenant’s particular operations.
If we or our tenants terminate or do not renew the leases for our properties or our tenants lose their regulatory authority to operate such properties or default on their lease obligations for any reason, we may not be able to locate, or may incur additional costs to locate, suitable replacement tenants to lease the properties for their specialized uses. Alternatively, we may be required to spend substantial amounts to modify a property for a new tenant, or for multiple tenants with varying
infrastructure requirements, before we are able to re-lease the space or we could otherwise incur re-leasing costs. Furthermore, because transfers of healthcare facilities may be subject to regulatory approvals not required for transfers of other types of property, there may be significant delays in transferring operations of senior healthcare facilities to successor operators. Any loss of revenues or additional capital expenditures required as a result may have an adverse effect on our business, financial condition and results of operations and our ability to make distributions to our stockholders.
Uninsured losses relating to real estate and lender requirements to obtain insurance may reduce stockholder returns.
There are types of losses relating to real estate, generally catastrophic in nature, such as losses due to wars, acts of terrorism, earthquakes, floods, hurricanes, pollution or environmental matters, for which we do not intend to obtain insurance unless we are required to do so by mortgage lenders. If any of our properties incurs a casualty loss that is not fully covered by insurance, the value of our assets will be reduced by any such uninsured loss. In addition, other than any reserves we may establish, we have no source of funding to repair or reconstruct any uninsured damaged property, and we cannot assure our stockholders that any such sources of funding will be available to us for such purposes in the future. Also, to the extent we must pay unexpectedly large amounts for uninsured losses, we could suffer reduced earnings that would result in less cash to be distributed to stockholders. In cases where we are required by mortgage lenders to obtain casualty loss insurance for catastrophic events or terrorism, such insurance may not be available, or may not be available at a reasonable cost, which could inhibit our ability to finance or refinance our properties. Additionally, if we obtain such insurance, the costs associated with owning a property would increase and could have an adverse effect on the net income from the property, and, thus, the cash available for distribution to our stockholders.
We may obtain only limited warranties when we purchase a property and would have only limited recourse in the event our due diligence did not identify any issues that lower the value of our property.
The seller of a property often sells such property in its “as is” condition on a “where is” basis and “with all faults,” without any warranties of merchantability or fitness for a particular use or purpose. In addition, purchase and sale agreements may contain only limited warranties, representations and indemnifications that will only survive for a limited period after the closing. The purchase of properties with limited warranties increases the risk that we may lose some or all of our invested capital in the property, as well as the loss of rental income from that property.
Even if acquisitions are completed, weWe may fail to successfully operate acquired properties.
Our ability to successfully operate any acquired properties are subject to the following risks:
we may acquire properties that are not initially accretive to our results upon acquisition, and we may not successfully manage and lease those properties to meet our expectations;
we may be unable to finance the acquisition on favorable terms in the time period we desire, or at all;
even if we are able to finance the acquisition, our cash flow may be insufficient to meet our required principal and interest payments;
we may spend more than budgeted to make necessary improvements or renovations to acquired properties;
we may be unable to quickly and efficiently integrate new acquisitions, particularly acquisitionacquisitions of portfolios of properties, into our existing operations and, as a result, our results of operations and financial condition could be adversely affected;
market conditions may result in higher than expected vacancy rates and lower than expected rental rates; and
we may acquire properties subject to liabilities, including contingent liabilities, and without any recourse, or with only limited recourse, with respect to unknown liabilities for the clean-up of undisclosed environmental contamination, claims by tenants or other persons dealing with former owners of the properties, liabilities, claims, and litigation, including indemnification obligations, whether or not incurred in the ordinary course of business, relating to periods prior to or following our acquisitions, claims for indemnification by general partners, directors, officers and others indemnified by the former owners of the properties.
properties, and liabilities for taxes relating to periods prior to our acquisitions.
If we are unable to successfully operate acquired properties, our financial condition, results of operations, cash flow and ability to satisfy our principal and interest obligations and to make distributions to our stockholders could be adversely affected.
Our ownership of certain medical office building properties isand other facilities are subject to ground leaseleases or other similar agreements which limit our uses of these properties and may restrict our ability to sell or otherwise transfer such properties.
We holdAs of December 31, 2013, we held interests in certain89 of our medical office building properties and other facilities that serve the healthcare industry through leasehold interests in the land on which the buildings are located and we may acquire additional medical office building properties in the future that are subject to ground leases or other similar agreements. As of December 31, 2013, these properties represented 34.7% of our total GLA. Many of our ground leases and other similar agreements limit our uses of these properties and may restrict our ability to sell or otherwise transfer such properties, which may impair their value.
Uncertain market conditions relating to the future disposition of properties could cause us to sell our properties at a loss in the future.
We intend to hold our various real estate investments until such time as we determine that a sale or other disposition appears to be advantageous to achieve our investment objectives. Our Chief Executive Officer and our boardBoard of directorsDirectors may exercise their discretion as to whether and when to sell a property, and we will have no obligation to sell properties at any particular time. We generally intend to hold properties for an extended period of time, and we cannot predict with any certainty the various market conditions affecting real estate investments that will exist at any particular time in the future. Because of the uncertainty of market conditions that may affect the future disposition of our properties, we may not be able to sell our properties at a profit in the future or at all. Additionally, we may incur prepayment penalties in the event we sell a property subject to a mortgage earlier than we otherwise had planned. Accordingly, the extent to which our stockholders will receive cash distributions and realize potential appreciation on our real estate investments will, among other things, be dependent upon fluctuating market conditions. Any inability to sell a property could adversely impact our business, financial condition, results of operation and ability to pay distributions to our stockholders.
Our stockholders may not receive any profits resulting from the saleIf we sell one of our properties during liquidation, our stockholders may experience a delay before receiving their share of the proceeds of such liquidation. In a forced or voluntary liquidation, we may sell our properties either subject to or upon the assumption of any then outstanding mortgage debt or, alternatively, may provide financing to purchasers. We may take a purchase money obligation secured by a mortgage as partial payment. We do not have any limitations or restrictions on our taking such purchase money obligations. To the extent we receive promissory notes or other property instead of cash from sales, such proceeds, other than any interest payable on those proceeds, will not be included in net sale proceeds until and to the extent the promissory notes or other property are actually paid, sold, refinanced or otherwise disposed of. In many cases, we will receive initial down payments in the year of sale in an amount less than the selling price and subsequent payments will be spread over a number of years. Therefore, stockholders may experience a delay in the distribution of the proceeds of a sale until such time.
Lease rates under our long-term leases may be lower than fair market lease rates over time.
We have entered into and may in the future enter into long-term leases with tenants ofat certain of our properties. Certain of our long-term leases provide for rent to increase over time. However, if we do not accurately judge the potential for increases in market rental rates, we may set the terms of these long-term leases at levels such that even after contractual rental increases, the rent under our long-term leases is less than then-current market rental rates. Further, we may have no ability to terminate those leases or to adjust the rent to then-prevailing market rates. As a result, our income and distributions could be lower than if we did not enter into long-term leases.
Rents associated with new leases for properties in our portfolio may be less than expiring rents (lease roll-down), which may adversely affect our financial condition, results of operations and cash flow.
Our operating results depend upon our ability to maintain and increase rental rates at our properties while also maintaining or increasing occupancy. The rental rates for expiring leases may be higher than starting rental rates for new leases and we may also be required to offer greater rental concessions than we have historically. The rental rate spread between expiring leases and new leases may vary both from property to property and among different leased spaces within a single property. If we are unable to obtain sufficient rental rates across our portfolio, our business, financial condition, results of operation and ability to pay distributions to our stockholders could be adversely affected.
We may not be able to control our operating costs or our expenses may remain constant or increase, even if our revenue does not increase, which could cause our results of operations to be adversely affected.
Factors that may adversely affect our ability to control operating costs include the need to pay for insurance and other operating costs, including real estate taxes, which could increase over time, the need periodically to repair, renovate and re-let space, the cost of compliance with governmental regulation, including zoning and tax laws, the potential for liability under applicable laws, interest rate levels and the availability of financing. If our operating costs increase as a result of any of the foregoing factors, our results of operations may be adversely affected. The expenses of owning and operating medical office buildings and other facilities that serve the healthcare industry are not necessarily reduced when circumstances such as market factors and competition cause a reduction in income from the property. As a result, if revenue declines, we may not be able to reduce our expenses accordingly. Certain costs associated with real estate investments may not be reduced even if a property is not fully occupied or other circumstances cause our revenues to decrease. If a property is mortgaged and we are unable to meet the mortgage payments, the lender could foreclose on the mortgage and take possession of the property, resulting in a further reduction in our net income.
Increases in property taxes could adversely affect our cash flow.
Our real properties are subject to real and personal property taxes that may increase as tax rates change and as the real properties are assessed or reassessed by taxing authorities. Some of our leases generally provide that the property taxes or increases therein are charged to the tenants as an expense related to the real properties that they occupy while other leases provide that we are generally responsible for such taxes. We are also generally responsible for real property taxes related to any vacant space. In any case, as the owner of the properties, we are ultimately responsible for payment of the taxes to the applicable government authorities. If real property taxes increase, our tenants may be unable to make the required tax payments, ultimately requiring us to pay the taxes even if the tenant is obligated to do so under the terms of the lease. If we fail to pay any such taxes, the applicable taxing authority may place a lien on the real property and the real property may be subject to a tax sale.
We face possible liability for environmental cleanup costs and damages for contamination related to properties we acquire, which could substantially increase our costs and reduce our liquidity and cash distributions to stockholders.
Because we own and operate real estate, we are subject to various federal, state and local environmental laws, ordinances and regulations. Under these laws, ordinances and regulations, a current or previous owner or operator of real estate may be liable for the cost of removal or remediation of hazardous or toxic substances on, under or in such property. The costs of removal or remediation could be substantial. Such laws often impose liability whether or not the owner or operator knew of, or was responsible for, the presence of such hazardous or toxic substances. Environmental laws also may impose restrictions on the manner in which property may be used or businesses may be operated, and these restrictions may require substantial expenditures. Environmental laws provide for sanctions in the event of noncompliance and may be enforced by governmental agencies or, in certain circumstances, by private parties. Certain environmental laws and common law principles could be used to impose liability for release of and exposure to hazardous substances, including the release of asbestos-containing materials into the air, and third parties may seek recovery from owners or operators of real estate for personal injury or property damage
associated with exposure to released hazardous substances. In addition, new or more stringent laws or stricter interpretations of existing laws could increase the cost of compliance or liabilities and restrictions arising out of such laws. The cost of defending against these claims, complying with environmental regulatory requirements, conducting remediation of any contaminated property, or of paying personal injury or other claims or fines could be substantial, which would reduce our liquidity and cash available for distribution to our stockholders. In addition, the presence of hazardous substances on a property or the failure to meet environmental regulatory requirements may materially impair our ability to use, lease or sell a property, or to use the property as collateral for borrowing. Our tenants'tenants’ operations, the existing condition of land when we buy it, operations in the vicinity of our real properties, such as the presence of underground storage tanks, or activities of unrelated third parties may also adversely affect our real properties.
Costs associated with complying with the Americans with Disabilities Act of 1990 may result in unanticipated expenses.
Under the Americans with Disabilities Act of 1990, or the ADA, all places of public accommodation are required to meet certain U.S. federal requirements related to access and use by disabled persons. A number of additional U.S. federal, state and local laws may also require modifications to our properties, or restrict certain further renovations of the properties, with respect to access thereto by disabled persons. Noncompliance with the ADA could result in the imposition of fines or an award of damages to private litigants and/or an order to correct any non-complying feature, which could result in substantial capital expenditures. We have not conducted an audit or investigation of all of our properties to determine our compliance and we cannot predict the ultimate cost of compliance with the ADA or other legislation. If one or more of our properties is not in compliance with the ADA or other related legislation, then we would be required to incur additional costs to bring the facility into compliance. If we incur substantial costs to comply with the ADA or other related legislation, our business, financial condition, results of operations, ability to make distributions to our stockholders and the trading price of our Class A common stock may be adversely affected.
Risks Related to the Healthcare Industry
New laws or regulations affecting the heavily regulated healthcare industry, changes to existing laws or regulations, loss of licensure or failure to obtain licensure could result in the inability of our tenants to make rent payments to us.
The healthcare industry is heavily regulated by federal, state and local governmental bodies. Our tenants generally are subject to laws and regulations covering, among other things, licensure, certification for participation in government programs, and relationships with physicians and other referral sources. Changes in these laws and regulations could negatively affect the ability of our tenants to make lease payments to us and our ability to make distributions to our stockholders.
Many of our medical properties and theirour tenants may require a license or multiple licenses or a certificate of need, or a CON, to operate. Failure to obtain a license or a CON, or loss of a required license or a CON would prevent a facility from operating in the manner intended by the tenant. These events could adversely affect our tenants'tenants’ ability to make rent payments to us. State and local laws also may regulate expansion, including the addition of new beds or services or acquisition of medical equipment, and the construction of healthcare-related facilities that serve the healthcare industry, by requiring a CON or other similar approval. State CON laws are not uniform throughout the United States and are subject to change. We cannot predict the impact of state CON laws on our development of facilities or the operations of our tenants.
In limited circumstances, loss of state licensure or certification or closure of a facility could ultimately result in loss of authority to operate the facility and require new CON authorization to re-institute operations. As a result, a portion of the value of the facility may be reduced, which would adversely impact our business, financial condition and results of operations and our ability to make distributions to our stockholders.
Recently enacted comprehensiveComprehensive healthcare reform legislation could adversely affect our business, financial condition and results of operations and our ability to pay distributions to stockholders.
On March 23, 2010, the President signed into law theThe Patient Protection and Affordable Care Act of 2010, or the Patient Protection and Affordable Care Act, and on March 30, 2010, the President signed into law the Health Care and Education Reconciliation Act of 2010, or the Reconciliation Act, which in part modified the Patient Protection and Affordable Care Act. Together, the two lawsAct, together serve as the primary vehicle for comprehensive healthcare reform in the U.S.United States and will become effective through a phased approach, which began in 2010 and will conclude in 2018. The laws are intended to reduce the number of individuals in the United States without health insurance and significantly change the means by which healthcare is organized, delivered and reimbursed. The Patient Protection and Affordable Care Act includes program integrity provisions that both create new authorities and expand existing authorities for federal and state governments to address fraud, waste and abuse in federal healthcare programs. In addition, the Patient Protection and Affordable Care Act expands reporting requirements and responsibilities related to facility ownership and management, patient safety and care quality.quality of care. In the ordinary course of their businesses, our tenants may be regularly subjected to inquiries, investigations and audits by federal and state agencies that oversee these laws and regulations. If theyour tenants do not comply with the additional reporting requirements and responsibilities, our tenants'their ability to participate in federal healthcare programs may be adversely affected. Moreover, there may be other aspects of the comprehensive healthcare reform legislation for which regulations have not yet been adopted, which, depending on how they are implemented, could adversely affect our tenants and therefore our business, financial condition, results of operations andtheir ability to pay distributionsmeet their lease obligations to us. On June 28, 2012, the U.S. Supreme Court ruled on the constitutionality of the two laws generally upholding the entirety of the Patient Protection and Affordable Care Act, including holding that the “individual mandate”-- the centerpiece of the legislation that requires all individuals to purchase some form of health insurance -- is permissibly construed as a tax imposed on those who do not obtain health insurance. Notably, the portions of the health reform laws addressing fraud, waste and abuse remain intact. The only aspect of the laws that were held unconstitutional is the mandated Medicaid expansion that would have required states to cover nonelderly persons with incomes up to 133 percent of the poverty level. The Supreme Court held that Congress could not require states to implement such an expansion or risk losing all federal Medicaid funding. As a result of the Supreme Court's decision, states may opt to expand Medicaid coverage in accordance with the laws but are not required to do so. In fact, more than one dozen states have decided to opt out of the Medicaid expansion. Despite the Supreme Court's decision, it remains difficult to predict the impact of these laws on us due to their complexity, lack of implementing regulations or interpretive guidance, and the gradual implementation of the laws over a multi-year period. In addition, there have been numerous Congressional attempts to amend and repeal the laws both prior to and subsequent to the Supreme Court's ruling; we cannot predict whether any of these attempts to repeal or amend the laws will be successful. Moreover, the launch of the federal and state health exchanges on October 1, 2013, received significant public scrutiny for perceived technical shortcomings affecting the ability of individuals to enroll in health plans as mandated by the Affordable Care Act. Consequently, it remains difficult to foresee how individuals and business will respond to the choices afforded them by law. Because of the many variables involved, we are unable to predict how these laws may impact our stockholders.
Reductions in reimbursement from third party payors, including Medicare and Medicaid, could adversely affect the profitability of our tenants and hinder their ability to make rent payments to us.
Sources of revenue for our tenants may include the federal Medicare program, state Medicaid programs, private insurance carriers, health maintenance organizations, preferred provider arrangements, self-insured employers and the patients themselves, among others. Medicare and Medicaid programs, as well as numerous private insurance and managed care plans, generally require participating providers to accept government-determined reimbursement rates as payment in full for services rendered, without regard to a provider'sprovider’s charges. Changes in the reimbursement rate or methods of payment from third-party payors, including Medicare and Medicaid, could result in a substantial reduction in our tenants'tenants’ revenues. In fact, legislation governing Medicare physician fee-for-service reimbursement has, for a number of years, called for a significant reduction in such rates. Congress, however, has repeatedly enacted superseding legislation postponing the implementation of physician rate cuts, most recently postponing the effective date of such cuts until April 1, 2014. There are a number of Congressional proposals to further postpone implementation of the cuts or to permanently address the issue, but we cannot predict whether any of these attempts will be successful. Efforts by such payors to reduce healthcare costs will likely continue, which may result in reductions or slower growth in reimbursement for certain services provided by some of our tenants. Further, revenue realizable under third-party payor agreements can change after examination and retroactive adjustment by payors during the claims settlement processes or as a result of post-payment audits. Payors may disallow requests for reimbursement based on determinations that certain costs are not reimbursable or reasonable or because additional documentation is necessary or because certain services were not covered or were not medically necessary. The recently enacted healthcare reform law and regulatory changes could impose further limitations on government and private payments to healthcare providers. In some cases, states have enacted, or are considering enacting, measures designed to reduce their Medicaid expenditures and to make changes to private healthcare insurance. In addition, the failure of any of our tenants to comply with various laws and regulations could jeopardize their ability to continue participating in Medicare, Medicaid and other government sponsored payment programs.
The healthcare industry continues to face various challenges, including increased government and private payor pressure on healthcare providers to control or reduce costs. It is possible that our tenants will continue to experience a shift in payor mix away from fee-for-service payors, resulting in an increase in the percentage of revenues attributable to managed care payors, and general industry trends that include pressures to control healthcare costs. Pressures to control healthcare costs and a shift away from traditional health insurance reimbursement to managed care plans have resulted in an increase in the number of patients whose healthcare coverage is provided under managed care plans, such as health maintenance organizations and preferred provider organizations. These changes could have an adverse effect on the financial condition of some or all of our tenants. The financial impact on our tenants could restrict their ability to make rent payments to us, which would have an adverse effect on our business, financial condition and results of operations, and our ability to make distributions to our stockholders.
Government budget deficits could lead to a reduction in Medicaid and Medicare reimbursement, which could adversely affect the financial condition of our tenants.
Adverse U.S. economic conditions have negatively affected state budgets, which may put pressure on states to decrease reimbursement rates with the goal of decreasing state expenditures under state Medicaid programs. The need to control Medicaid expenditures may be exacerbated by the potential for increased enrollment in state Medicaid programs due to unemployment, declines in family incomes, and eligibility expansions required by the recently enacted healthcare reform law. These potential reductions could be compounded by the potential for federal cost-cutting efforts that could lead to reductions in reimbursement rates under both the federal Medicare program and state Medicaid programs. Potential reductions in reimbursements under these programs could negatively impact the ability of our tenants and their ability to meet their obligations to us, which could, in turn, have an adverse effect on our business, financial condition, and results of operations, and our ability to make distributions to our stockholders.
Some tenants of our medical office buildings and our other facilities that serve the healthcare industry are subject to fraud and abuse laws, the violation of which by a tenant may jeopardize the tenant'stenant’s ability to make rent payments to us.
There are various federal and state laws prohibiting fraudulent and abusive business practices by healthcare providers who participate in, receive payments from, or are in a position to make referrals in connection with, government-sponsored healthcare programs, including the Medicare and Medicaid programs. These laws include, but are not limited to:
the Federal Anti-Kickback Statute, which prohibits, among other things, the offer, payment, solicitation or receipt of any form of remuneration in return for, or to induce, the referral or recommendation for the ordering of any item or service reimbursed by Medicare or Medicaid;
the Federal Physician Self-Referral Prohibition, which, subject to specific exceptions, restricts physicians from making referrals for specifically designated health services for which payment may be made under Medicare or Medicaid programs to an entity with which the physician, or an immediate family member, has a financial relationship;
the False Claims Act, which prohibits any person from knowingly presenting or causing to be presented false or fraudulent claims for payment to the federal government, including claims paid by the Medicare and Medicaid programs; and
the Civil Monetary Penalties Law, which authorizes the U.S.United States Department of Health and Human Services to impose monetary penalties for certain fraudulent acts; and
the Health Insurance Portability and Accountability Act, as amended by the Health Information Technology for Economic and Clinical Health Act of the American Recovery and Reinvestment Act of 2009, which protects the privacy and security of personal health information.
In the ordinary course of their business, our tenants may be subject to inquiries, investigations and audits by federal and state agencies that oversee applicable laws and regulations. Private enforcement of healthcare fraud has also increased, due in large part to amendments to the civil False Claims Act that were designed to encourage private individuals to sue on behalf of the government. These whistleblower suits, known as qui tam suits, may be filed by almost anyone, including present and former employees or patients. Each of these laws includes criminal and/or civil penalties for violations that range from punitive sanctions, damage assessments, penalties, imprisonment, denial of Medicare and Medicaid payments and/or exclusion from the Medicare and Medicaid programs. Certain laws, such as the False Claims Act, allow for individuals to bring whistleblower actions on behalf of the government for violations thereof. Additionally, states in which the facilities are located may have similar fraud and abuse laws. Investigation by a federal or state governmental body for violation of fraud and abuse laws or imposition of any of these penalties upon one of our tenants could jeopardize that tenant'stenant’s ability to operate or to make rent payments, which may have an adverse effect on our business, financial condition and results of operations, and our ability to make distributions to our stockholders.
Our tenants may be subject to significant legal actions that could subject them to increased operating costs and substantial uninsured liabilities, which may affect their ability to pay their rent payments to us.
As is typical in the healthcare industry, our tenants may often become subject to claims that their services have resulted in patient injury or other adverse effects. Many of these tenants may have experienced an increasing trend in the frequency and severity of professional liability and general liability insurance claims and litigation asserted against them. The insurance coverage maintained by these tenants may not cover all claims made against them nor continue to be available at a reasonable cost, if at all. In some states, insurance coverage for the risk of punitive damages arising from professional liability and general liability claims and/or litigation may not, in certain cases, be available to these tenants due to state law prohibitions or limitations of availability. As a result, these types of tenants of our medical office buildings and other facilities that serve the healthcare industry operating in these states may be liable for punitive damage awards that are either not covered or are in excess of their insurance policy limits. There has been, and will continue to be, an increase in governmental investigations of certain healthcare providers, particularly in the area of Medicare/Medicaid false claims and quality of care, as well as an increase in enforcement actions resulting from these investigations. Insurance is not available to cover such losses. Any adverse determination in a legal proceeding or governmental investigation, whether currently asserted or arising in the future, could lead to potential termination from government programs, large penalties and fines and otherwise have an adverse effect on a tenant'stenant’s financial condition. If a tenant is unable to obtain or maintain insurance coverage, if judgments are obtained in excess of the insurance coverage, if a tenant is required to pay uninsured punitive damages, or if a tenant is subject to an uninsurable government enforcement action, the tenant could be exposed to substantial additional liabilities, which may affect the tenant'stenant’s ability to pay rent to us, which in turn could have an adverse effect on our business, financial condition and results of operations, and our ability to make distributions to our stockholders.
We may experience adverse effects as a result of potential financial and operational challenges faced by the operators of our senior healthcare facilities.
Operators of our senior healthcare facilities may face operational challenges from potentially reduced revenue streams and increased demands on their existing financial resources.
Changes in reimbursement policies. Our skilled nursing operators'operators’ revenues are primarily derived from governmentally-funded reimbursement programs, such as Medicare and Medicaid. Accordingly, our facility operators are subject to the potential negative effects of decreased reimbursement rates offered through such programs.
Impact of general economic conditions. Our operators'operators’ revenue may also be adversely affected as a result of falling occupancy rates or slow lease-ups for assisted and independent living facilities due to the recent turmoil in the capital debt and real estate markets. The economic deterioration of an operator could cause such an operator to file for bankruptcy protection. The bankruptcy or insolvency of an operator may adversely affect the income produced by the property or properties it operates.
Compliance costs. Our operators'operators’ performance and economic condition may be negatively affected if they fail to comply with various complex federal and state laws that govern a wide array of referrals, relationships, reimbursement and licensure requirements in the senior healthcare industry. The violation of any of these laws or regulations by a senior healthcare facility operator may result in the imposition of fines or other penalties that could jeopardize that operator'soperator’s ability to make payment obligations to us or to continue operating its facility. Compliance with the requirements in the healthcare reform law could increase costs as well. Increased costs could limit our healthcare operator'soperator’s ability to meet their obligations to us, potentially decreasing our revenue and increasing our collection and litigation costs.
Legal actions. Moreover, advocacy groups that monitor the quality of care at healthcare facilities have sued healthcare facility operators and called upon state and federal legislators to enhance their oversight of trends in healthcare facility ownership and quality of care. In response, the recently enacted healthcare reform law imposes additional reporting requirements and responsibilities for healthcare facility operators. Patients have also sued healthcare facility operators and have, in certain cases, succeeded in winning very large damage awards for alleged abuses. This litigation and potential litigation in the future has materially increased the costs incurred by our operators for monitoring and reporting quality of care compliance.
Insurance. In addition, the cost of medical malpractice and liability insurance has increased and may continue to increase so long as the present litigation environment affecting the operations of healthcare facilities continues. To the extent we are required to remove or replace a healthcare operator, our revenue from the affected property could be reduced or eliminated for an extended period of time.
New or future legislative proposals. In addition, legislative proposals are commonly being introduced or proposed in federal and state legislatures that could affect major changes in the senior healthcare sector, either nationally or at the state level. It is impossible to say with any certainty whether this proposed legislation will be adopted or, if adopted, what effect such legislation would have on our facility operators and our senior healthcare operations.
Increased operating expenses. In addition, our facility operators may incur additional demands on their existing financial resources as a result of increases in senior healthcare operator liability, insurance premiums and other operational expenses. Our financial position could be weakened and our ability to make distributions could be limited if any of our senior healthcare facility operators were unable to meet their financial obligations to us.
Any of these factors could adversely affect the ability of our tenants to pay rent to us, diminish the value of our properties or otherwise have an adverse effect on our business, financial condition and results of operations, and our ability to make distributions to our stockholders.
Risks Related to Investments in Other Real Estate Related Assets
Real estate related equity securities in which we may invest are subject to specific risks relating to the particular issuer of the securities and may be subject to the general risks of investing in subordinated real estate securities.
We may invest in the common and preferred stock of both publicly traded and private real estate companies, which involves a higher degree of risk than debt securities due to a variety of factors, including the fact that such investments are subordinate to creditors and are not secured by the issuer's property. Our investments in real estate related equity securities will involve special risks relating to the particular issuer of the equity securities, including the financial condition and business outlook of the issuer. Issuers of real estate related common equity securities generally invest in real estate or other real estate related assets and are subject to the inherent risks associated with other real estate related assets discussed in this Annual Report on Form 10-K, including risks relating to rising interest rates.
The mortgage or other real estate-related loans in which we have in the past, and may in the future, invest may be impacted by unfavorable real estate market conditions, which could decrease their value.
As of December 31, 2011,2013, we had acquired two mortgage loans.have invested in real estate notes receivable. If we make additional investments in mortgage loans,real estate notes receivable, we will be at risk of loss on those investments, including losses as a result of defaults on mortgage loans. These losses may be caused by many conditions beyond our control, including economic conditions affecting real estate values, tenant defaults and lease expirations, interest rate levels and the other economic and liability risks associated with real estate described above under the heading “- Risks Related to Investments in Real Estate.” If we acquire property by foreclosure following defaults under our mortgage loan investments, we will have the economic and liability risks as the owner described above. We do not know
whether the values of the property securing any of our investments in other real estate related assets will remain at the levels existing on the dates we initially make the related investment. If the values of the underlying properties drop,decline, our risk will increase and the valuesvalue of our interests may decrease.
Delays in liquidating defaulted mortgage loan investments could reduce our investment returns.
If there are defaults under our mortgage loan investments, we may not be able to foreclose on or obtain a suitable remedy with respect to such investments. Specifically, we may not be able to repossess and sell the underlying properties quickly which could reduce the value of our investment. For example, an action to foreclose on a property securing a mortgage loan is regulated by state statutes and rules and is subject to many of the delays and expenses of lawsuits if the defendant raises defenses or counterclaims. Additionally, in the event of default by a mortgagor, these restrictions, among other things, may impede our ability to foreclose on or sell the mortgaged property or to obtain proceeds sufficient to repay all amounts due to us on the mortgage loan.
We expect a portion of our investments in other real estate related assets to be illiquid and we may not be able to adjust our portfolio in response to changes in economic and other conditions.
We may purchase other real estate related assets in connection with privately negotiated transactions which are not registered under the relevant securities laws, resulting in a prohibition against their transfer, sale, pledge or other disposition except in a transaction that is exempt from the registration requirements of, or is otherwise in accordance with, those laws. As a result, our ability to vary our portfolio in response to changes in economic and other conditions may be relatively limited.
Interest rate and related risks may cause the value of our investments in other real estate related assets to be reduced.
Interest rate risk is the risk that fixed income securities such as preferred and debt securities and, to a lesser extent, dividend paying common stock, will decline in value because of changes in market interest rates. Generally, when market interest rates rise, the market value of such securities will decline, and vice versa. Our investment in such securities means that the net asset value may tend to decline if market interest rates rise.
During periods of rising interest rates, the average life of certain types of securities may be extended because of slower than expected principal payments. This may lock in a below-market interest rate, increase the security'ssecurity’s duration and reduce the value of the security. During periods of declining interest rates, an issuer may be able to exercise an option to prepay principal earlier than scheduled, which may force us to reinvest in lower yielding securities. Preferred and debt securities frequently have call features that allow the issuer to repurchase the security prior to its stated maturity. An issuer may redeem an obligation if the issuer can refinance the debt at a lower cost due to declining interest rates or an improvement in the credit standing of the issuer. These risks may reduce the value of our investments in other real estate related assets.
If we liquidate prior to the maturity of our investments in real estate assets, we may be forced to sell those investments on unfavorable terms or at a loss.
Our boardBoard of directorsDirectors may choose to effect a liquidity event in which we liquidate our assets, including our investments in other real estate related assets. If we liquidate those investments prior to their maturity, we may be forced to sell those investments on unfavorable terms or at a loss. For instance, if we are required to liquidate mortgage loans at a time when prevailing interest rates are higher than the interest rates of such mortgage loans, we would likely sell such loans at a discount to their stated principal values.
Risks Related to Debt Financing
We have and intend to incur mortgage indebtedness and other borrowings, which may increase our business risks, could hinder our ability to make distributions and could decrease the value of our company.Company.
As of December 31, 2011,2013, we had fixed and variable rate debt of $639.1 million$1.2 billion outstanding, including a net premium of $2.6 million.$0.6 million. We intend to continue to finance a portion of the purchase price of our investments in real estate and other real estate related assets by borrowing funds. In addition, we may incur mortgage debt and pledge some or all of our real properties as security for that debt to obtain funds to acquire additional real properties or for working capital. We may also borrow funds to satisfy the REIT tax qualification requirement that we distribute at least 90% of our annual ordinary taxable income to our stockholders. Furthermore, we may borrow if we otherwise deem it necessary or advisable to ensure that we maintain our qualification as a REIT for U.S. federal income tax purposes. We anticipate thatgenerally expect our overall leverage the ratio of our debt to total assets, will fluctuate within approximatelyrange between 35% to 40%and 45%.
High debt levels will cause us to incur higher interest charges, which would result in higher debt service payments and could be accompanied by restrictive covenants. If there is a shortfall between the cash flow from a property and the cash flow needed to service mortgage debt on that property, then the amount available for distributions to our stockholders may be reduced. In addition, incurring mortgage debt increases the risk of loss since defaults on indebtedness secured by a property may result in lenders initiating foreclosure actions. In that case, we could lose the property securing the loan that is in default, thus reducing the value of our company.the Company. For tax purposes, a foreclosure on any of our properties will be treated as a sale of the property for a purchase price equal to the outstanding balance of the debt secured by the mortgage. If the outstanding balance of the debt secured by the mortgage exceeds our tax basis in the property, we will recognize taxable income on foreclosure, but we would not receive any cash proceeds. We may give full or partial guarantees to lenders of mortgage debt to the entities that own our properties. When we give a guaranty on behalf of an entity that owns one of our properties, we will be responsible to the lender for satisfaction of the debt if it is not paid by such entity. If any mortgage contains cross collateralization or cross default provisions, a default on a single property could affect multiple properties. If any of our properties are foreclosed upon due to a default, our ability to pay cash distributions to our stockholders will be adversely affected.
Higher mortgage rates may make it more difficult for us to finance or refinance properties,our mortgage loans, which could reduce the number of properties we can acquire and the amount of cash distributions we can make to our stockholders.
As of December 31, 2011,2013, we had $79.6$7.7 million principal amount of debt maturing in the year ending December 31, 2012.2014. If mortgage debt is unavailable on reasonable terms as a result of increased interest rates or other factors, we may not be able to utilize financing in our initial purchase of properties. In addition, if we place or assume mortgage debt on properties, we run the risk of being unable to refinance such debt when the loans come due,mature, or of being unable to refinance the debt on favorable terms.terms or at all. If interest rates are higher when we refinance debt, our income could be reduced. We may be unable to refinance debt at appropriate times, which may require us to sell properties on terms that are not advantageous to us, or could result in the foreclosure of such properties. If any of these events occur, our cash flow would be reduced. This, in turn, would reduce cash available for distribution to our stockholders and may hinder our ability to raise more capital by issuing securities or by borrowing more money.
Increases in interest rates could increase the amount of our debt payments and, therefore, negatively impact our operating results.
Interest we pay on our debt obligations reduces cash available for distributions. Whenever we incur variable rate debt, increases in interest rates would increase our interest costs, which would reduce our cash flows and our ability to make distributions to our stockholders. As of December 31, 2011,2013, we had $175.3$539.9 million outstanding of variable rate debt.debt outstanding. If we need to repay existing debt during periods of rising interest rates, we could be required to liquidate one or more of our investments in properties at times which may not permit realization of the maximum return on such investments.
Covenants in the instruments governing our existing indebtedness limit our operational flexibility, and a covenant breach could adversely affect our operations.
The terms of the instruments governing our existing indebtedness require us to comply with a number of customary financial and other covenants. These provisions include, among other things: a limitation on the incurrence of additional indebtedness; limitations on mergers, investments, acquisitions, redemptions of capital stock, and transactions with affiliates; and maintenance of specified financial ratios. Our continued ability to incur debt and operate our business is subject to compliance with these covenants, which limit operational flexibility. Breaches of these covenants could result in defaults under applicable debt instruments, even if payment obligations are satisfied. Financial and other covenants that limit our operational flexibility, as well as defaults resulting from a breach of any of these covenants in our debt instruments, could have an adverse effect on our financial condition and results of operations.
Adverse changes in our credit ratings could impair our ability to obtain additional debt and equity financing on favorable terms, if at all, and negatively impact the market price of our securities, including our common stock.
The credit ratings of our senior unsecured debt are based on our operating performance, liquidity and leverage ratios, overall financial position and other factors employed by the credit rating agencies in their rating analysis of us. Our credit ratings can affect the amount and type of capital we can access, as well as the terms of any financings we may obtain. There can be no assurance that we will be able to maintain our current credit ratings and in the event that our current credit ratings deteriorate, we would likely incur higher borrowing costs and it may be more difficult or expensive to obtain additional financing or refinance existing obligations and commitments. Also, a downgrade in our credit ratings would trigger additional costs or other potentially negative consequences under our current and future credit facilities and debt instruments.
Risks Related to Joint Ventures
The terms of joint venture agreements or other joint ownership arrangements into which we have entered and may enter could impair our operating flexibility and our results of operations.
In connection with the purchase of real estate, we have entered and may continue to enter into joint ventures with third parties. We may also purchase or develop properties in co-ownership arrangements with the sellers of the properties, developers or other persons. These structures involve participation in the investment by other parties whose interests and rights may not be the same as ours. Our joint venture partners may have rights to take some actions over which we have no control and may take actions contrary to our interests. Joint ownership of an investment in real estate may involve risks not associated with direct ownership of real estate, including the following:
a venture partner may at any time have economic or other business interests or goals which become inconsistent with our business interests or goals, including inconsistent goals relating to the sale of properties held in a joint venture or the timing of the termination and liquidation of the venture;
a venture partner might become bankrupt and such proceedings could have an adverse impact on the operation of the partnership or joint venture;
actions taken by a venture partner might have the result of subjecting the property to liabilities in excess of those contemplated; and
a venture partner may be in a position to take action contrary to our instructions or requests or contrary to our policies or objectives, including our policy with respect to qualifying and maintaining our qualification as a REIT.
Under certain joint venture arrangements, neither venture partner may have the power to control the venture and an impasse could occur, which might adversely affect the joint venture and decrease potential returns to our stockholders. If we have a right of first refusal or buy/sell right to buy out a venture partner, we may be unable to finance such a buy-out or we may be forced to exercise those rights at a time when it would not otherwise be in our best interest to do so. If our interest is subject to a buy/sell right, we may not have sufficient cash, available borrowing capacity or other capital resources to allow us to purchase an interest of a venture partner subject to the buy/sell right, in which case we may be forced to sell our interest when we would otherwise prefer to retain our interest. In addition, we may not be able to sell our interest in a joint venture on a timely basis or on acceptable terms if we desire to exit the venture for any reason, particularly if our interest is subject to a right of first refusal of our venture partner.
We may structure our joint venture relationships in a manner which may limit the amount we participate in the cash flow or appreciation of an investment.
We may enter into joint venture agreements, the economic terms of which may provide for the distribution of income to us otherwise than in direct proportion to our ownership interest in the joint venture. For example, while we and a co-venturer may invest an equal amount of capital in an investment, the investment may be structured such that we have a right to priority distributions of cash flow up to a certain target return while the co-venturer may receive a disproportionately greater share of cash flow than we are to receive once such target return has been achieved. This type of investment structure may result in the coventurerco-venturer receiving more of the cash flow, including appreciation, of an investment than we would receive. If we do not accurately judge the appreciation prospects of a particular investment or structure the venture appropriately, we may incur losses on joint venture investments or have limited participation in the profits of a joint venture investment, either of which could reduce our ability to make cash distributions to our stockholders.
Federal Income Tax Risks
Failure to qualify as a REIT for U.S. federal income tax purposes would subject us to federal income tax on our taxable income at regular corporate rates, which would substantially reduce our ability to make distributions to our stockholders.
We elected to be taxed as a REIT for U.S. federal income tax purposes beginning with our taxable year ended December 31, 2007 and we believe that our current and intended manner of operation will enable us to continue to meet the qualificationsrequirements to be taxed as a REIT. To qualify as a REIT, we must meet various requirements set forth in the Code concerning, among other things, the ownership of our outstanding common stock, the nature of our assets, the sources of our income and the amount of our distributions to our stockholders. The REIT qualification requirements are extremely complex, and interpretations of the federal income tax laws governing qualification as a REIT are limited. Accordingly, we cannot be certain that we will be successful in operating so as to qualify as a REIT. At any time, new laws, interpretations or court decisions may change the federal tax laws relating to, or the federal income tax consequences of, qualification as a REIT. It is possible that future economic, market, legal, tax or other considerations may cause our boardBoard of directorsDirectors to revoke our REIT election, which it may do without stockholder approval.
If we were to fail to qualify as a REIT for any taxable year, we would be subject to U.S. federal income tax on our taxable income at corporate rates. In addition, we would generally be disqualified from treatment as a REIT for the four taxable years following the year in which we lose our qualification as a REIT. Losing our qualification as a REIT would reduce our net earnings available for investment or distribution to stockholders because of the additional tax liability. In addition, distributions to stockholders would no longer be deductible in computing our taxable income, and we would no longer be required to make distributions. To the extent that distributions had been made in anticipation of our qualifying as a REIT, we might be required to borrow funds or liquidate some investments in order to pay the applicable corporate income tax. In addition, although we intend to operate in a manner intended to qualify as a REIT, it is possible that future economic, market, legal, tax or other considerations may cause our board of directors to recommend that we revoke our REIT election.
As a result of all these factors, our failure to qualify as a REIT could impair our ability to expand our business and raise capital, and would substantially reduce our ability to make distributions to our stockholders.
To continue to qualify as a REIT and to avoid the payment of U.S. federal income and excise taxes, and maintain our REIT status, we may be forced to borrow funds, use proceeds from the issuance of securities, or sell assets to pay distributions, which may result in our distributing amounts that may otherwise be used for our operations.
To obtain the favorable tax treatment accorded to REITs, we normally will be required each year to distribute to our stockholders at least 90.0% of our REIT taxable income, determined without regard to the deduction for dividends paid and by excluding net capital gains. We will be subject to U.S. federal income tax on our undistributed taxable income and net capital gain and to a 4.0% nondeductible excise tax on any amount by which distributions we pay with respect to any calendar year are less than the sum of: (1)(a) 85.0% of our ordinary income; (2)(b) 95.0% of our capital gain net income; and (3)(c) 100% of our undistributed income from prior years. These requirements could cause us to distribute amounts that otherwise would be spent on acquisitions of properties and it is possible that we might be required to borrow funds, use proceeds from the issuance of securities or sell assets in order to distribute enough of our taxable income to maintain our qualification as a REIT status and to avoid the payment of federal income and excise taxes.
Investors may have a current tax liability on distributions they elect to reinvest in shares of our common stock.
If our stockholders participate in our DRIP, they will be deemed to have received, and for income tax purposes will be taxed on, the value of the shares received to the extent the amount reinvested was not a tax-free return of capital. As a result, except in the case of tax-exempt entities, our stockholders may have to use funds from other sources to pay their tax liability on the value of the common stock received.
Dividends paid by REITs do not qualify for the reduced tax rates that apply to other corporate dividends.
The maximum tax rate for “qualified dividends” paid by corporations to individuals is 15% through 2012, as extended by recent tax legislation. Dividends paid by REITs, however, generally continue to be taxed at the normal ordinary income rate applicable to the individual recipient (subject to a maximum rate of 35% through 2012), rather than the 15% preferential rate. The more favorable rates applicable to regular corporate dividends could cause potential investors who are individuals to perceive investments in REITs to be relatively less attractive than investments in the stocks of non-REIT corporations that pay qualified dividends, which could adversely affect the value of the stock of REITs, including our common stock.
In certain circumstances, we may be subject to U.S. federal and state income taxes as a REIT, which would reduce our cash available for distribution to our stockholders.
Even if we qualify and maintain our status as a REIT, we may be subject to U.S. federal income taxes or state taxes. For example, net income from a “prohibited transaction” will be subject to a 100% tax. We may not be able to make sufficient distributions to avoid excise taxes applicable to REITs. We may also decide to retain capital gains we earn from the sale or other disposition of our property and pay income tax directly on such income. In that event, our stockholders would be treated as if they earned that income and paid the tax on it directly. We may also be subject to state and local taxes on our income or property, either directly or at the level of the companies through which we indirectly own our assets. Any U.S. federal or state taxes we pay will reduce our cash available for distribution to our stockholders.
Distributions to certain tax-exempt stockholders may be classified as unrelated business taxable income.
Neither ordinary nor capital gain distributions with respect to our common stock nor gain from the sale of common stock should generally constitute unrelated business taxable income to a tax-exempt stockholder. However, there are certain exceptions to this rule. In particular:
part of the income and gain recognized by certain qualified employee pension trusts with respect to our common stock may be treated as unrelated business taxable income if shares of our common stock are predominantly held by qualified employee pension trusts, and we are required to rely on a special look-through rule for purposes of meeting one of the REIT share ownership tests, and we are not operated in a manner to avoid treatment of such income or gain as unrelated business taxable income;
part of the income and gain recognized by a tax exempt stockholder with respect to our common stock would constitute unrelated business taxable income if the stockholder incurs debt in order to acquire the common stock; and
part or all of the income or gain recognized with respect to our common stock by social clubs, voluntary employee benefit associations, supplemental unemployment benefit trusts and qualified group legal services plans which are exempt from U.S. federal income taxation under Sections 501(c)(7), (9), (17) or (20) of the Code may be treated as unrelated business taxable income.
Complying with the REIT requirements may cause us to forego otherwise attractive opportunities.
To continue to qualify as a REIT for U.S. federal income tax purposes, we must continually satisfy tests concerning, among other things, the sources of our income, the nature and diversification of our assets, the amounts we distribute to our stockholders and the ownership of shares of our common stock. We may be required to make distributions to our stockholders at disadvantageous times or when we do not have funds readily available for distribution, or we may be required to liquidate otherwise attractive investments in order to comply with the REIT tests. Thus, compliance with the REIT requirements may hinder our ability to operate solely on the basis of maximizing profits.
Changes to U.S. federal income tax laws or regulations could adversely affect stockholders.
In recent years, numerous legislative, judicial and administrative changes have been made to the federal income tax laws applicable to investments in REITs and similar entities. Additional changes to tax laws are likely to continue to occur in the future, and we cannot assure our stockholders that any such changes will not adversely affect the taxation of a stockholder. Any such changes could have an adverse effect on an investment in shares of our common stock. We urge prospective investors to consult with their own tax advisor with respect to the status of legislative, regulatory or administrative developments and proposals and their potential effect on an investment in shares of our common stock.
Foreign purchasers of shares of our common stock may be subject to FIRPTA tax upon the sale of their shares of our common stock.
A foreign person disposing of a U.S. real property interest, including shares of stock of a U.S. corporation whose assets consist principally of U.S. real property interests, is generally subject to U.S. tax pursuant to the Foreign Investment in Real Property Tax Act of 1980, as amended, or FIRPTA. FIRPTA does not apply, however, to the disposition of stock in a REIT if the REIT is “domestically controlled.” A REIT is “domestically controlled” if less than 50.0% of the REIT's stock, by value, has been owned directly or indirectly by persons who are not qualifying U.S. persons during a continuous five-year period ending on the date of disposition or, if shorter, during the entire period of the REIT's existence. We cannot assure our stockholders that we will continue to qualify as a “domestically controlled” REIT.
Foreign stockholders may be subject to FIRPTA tax upon the payment of a capital gains dividend.
A foreign stockholder also may be subject to U.S. tax pursuant to FIRPTA upon the payment of any dividend is attributable to gain from sales or exchanges of U.S. real property interests.
If investors fail to meet the fiduciary and other standards under ERISA or the Code as a result of an investment in our common stock, they could be subject to criminal and civil penalties.
We, and our stockholders that are employee benefit plans or individual retirement accounts, or IRAs, will be subject to risks relating specifically to our having employee benefit plans and IRAs as stockholders, which risks are discussed below. There are special considerations that apply to pension, profit-sharing trusts of IRAs investing in our common stock. If investors are investing the assets of a pension, profit sharing or 401(k) plan, health or welfare plan, or an IRA in us, they should consider:
whether the investment is consistent with the applicable provisions of ERISA and the Code, or any other applicable governing authority in the case of a government plan;
whether the investment is made in accordance with the documents and instruments governing their plan or IRA, including their plan'splan’s investment policy;
whether the investment satisfies the prudence and diversification requirements of Sections 404(a)(1)(B) and 404(a)(1)(C) of ERISA;
whether the investment will impair the liquidity of the plan or IRA;
whether the investment will produce unrelated business taxable income, referred to as UBTI and as defined in Sections 511 through 514 of the Code, to the plan or IRA; and
their need to value the assets of the plan annually in accordance with ERISA and the Code.
In addition to considering their fiduciary responsibilities under ERISA and the prohibited transaction rules of ERISA and the Code, trustees or others purchasing shares should consider the effect of the plan asset regulations of the U.S. Department of Labor. To avoid our assets from being considered plan assets under those regulations, our charter prohibits “benefit plan investors” from owning 25.0% or more of our common stock prior to the time that the common stock qualifies as a class of publicly-offered securities, within the meaning of the ERISA plan asset regulations. However, we cannot assure our stockholders that those provisions in our charter will be effective in limiting benefit plan investor ownership to less than the 25.0% limit. For example, the limit could be unintentionally exceeded if a benefit plan investor misrepresents its status as a benefit plan. Even if our assets are not considered to be plan assets, a prohibited transaction could occur if we or any of our affiliates is a fiduciary (within the meaning of ERISA) with respect to an employee benefit plan or IRA purchasing shares, and, therefore, in the event any such persons are fiduciaries (within the meaning of ERISA) of a plan or IRA, investors should not purchase shares unless an administrative or statutory exemption applies to the purchase.
Governmental plans, church plans, and foreign plans generally are not subject to ERISA or the prohibited transaction rules of the Code, but may be subject to similar restrictions under other laws. A plan fiduciary making an investment in our shares on behalf of such a plan should consider whether the investment is in accordance with applicable law and governing plan documents.
To preserve our qualification as a REIT, our charter contains ownership limits with respect to our capital stock that may delay, defer or prevent a change of control of HTA. |
| |
Item 1B. | Unresolved Staff Comments. |
To assist us in preserving our qualification as a REIT, our charter contains a limitation on ownership that prohibits any individual, entity or group from directly acquiring beneficial ownership of more than 9.8% of the value of HTA’s then outstanding capital stock (which includes common stock and any preferred stock HTA may issue) or more than 9.8% of the value or number of shares, whichever is more restrictive, of HTA’s then outstanding common stock.Not applicable.Any attempted transfer of HTA’s stock which, if effective, would result in HTA’s stock being beneficially owned by fewer than 100 persons will be null and void. Any attempted transfer of HTA’s stock which, if effective, would result in violation of the ownership limits discussed above or in HTA being “closely held” under Section 856(h) of the Code or otherwise failing to qualify as a REIT, will cause the number of shares causing the violation (rounded up to the nearest whole share) to be automatically transferred to a trust for the exclusive benefit of one or more charitable beneficiaries, and the proposed transferee will not acquire any rights in the shares.
The trustee of the trust will be empowered to sell the shares-in-trust to a qualified person selected by the trustee and to distribute to the applicable prohibited owner an amount equal to the lesser of (1) the sales proceeds received by the trust for such shares-in-trust or (2) (A) if the prohibited owner was a transferee for value, the price paid by the prohibited owner for such shares-in-trust or (B) if the prohibited owner was not a transferee or was a transferee but did not give value for the shares-in-trust, the market price on the day of the event causing the shares to be held in trust. In addition, all shares-in-trust will be deemed to have been offered for sale to us or our designee, at a price per share equal to the lesser of (1) the price per share in the transaction that created such shares-in-trust (or, in the case of a devise, gift, or other event other than a transfer for value, the market price of such shares at the time of such devise, gift, or other event) and (2) the market price on the date we, or our designee, accepts such offer. The trustee or we may reduce the amount payable to the prohibited owner by the amount of dividends and other distributions that have been paid to the prohibited owner and are owed by the prohibited owner to the trustee. Any amount received by the trustee in excess of the amount to be paid to the prohibited owner will be distributed to the beneficiary of the trust.
These ownership limits could delay, defer or prevent a transaction or a change of control that might involve a premium price for our common stock or might otherwise be in the best interests of our stockholders.
Risks Related to Our Common Stock
The price of our Class A common stock has and may continue to fluctuate, which may make it difficult for you to sell our Class A common stock when you want or at prices you find attractive.
The price of our Class A common stock on the NYSE constantly changes and has been subject to price fluctuations. We expect that the market price of our Class A common stock will continue to fluctuate. Our stock price can fluctuate as a result of a variety of factors, many of which are beyond our control. These factors may include:
actual or anticipated variations in our quarterly operating results;
changes in our earnings estimates or publication of research reports about us or the real estate industry, although no assurance can be given that any research reports about us will be published;
future sales of substantial amounts of Class A common stock by our existing or future stockholders;
increases in market interest rates, which may lead purchasers of our stock to demand a higher yield;
changes in market valuations of similar companies;
adverse market reaction to any increased indebtedness we incur in the future;
additions or departures of key personnel;
actions by institutional stockholders;
speculation in the press or investment community; and
general market and economic conditions.
In addition, the stock market in general may experience extreme volatility that may be unrelated to the operating performance of a particular company. These broad market fluctuations may adversely affect the market price of our Class A common stock.
Future offerings of debt securities, which would be senior to our common stock, or equity securities, which would dilute our existing stockholders and may be senior to our common stock, may adversely affect the market price of our common stock.
In the future, we may issue debt or equity securities, including medium term notes, senior or subordinated notes and classes of preferred or common stock. Debt securities or shares of preferred stock will generally be entitled to receive distributions, both current and in connection with any liquidation or sale, prior to the holders of our common stock. Our Board of Directors may issue such securities without stockholder approval and under Maryland law may amend our charter to increase the aggregate number of authorized shares of capital stock or the number of authorized shares of capital stock of any class or series without stockholder approval. We are not required to offer any such additional debt or equity securities to existing common stockholders on a preemptive basis. Therefore, offerings of common stock or other equity securities may dilute the percentage ownership interest of our existing stockholders. To the extent we issue additional equity interests, our stockholders' percentage ownership interest in us will be diluted. Depending upon the terms and pricing of any additional offerings and the value of our real properties and other real estate related assets, our stockholders may also experience dilution in both the book value and fair market value of their shares. As a result, future offerings of debt or equity securities, or the perception that such offerings may occur, may reduce the market price of our common stock and/or the distributions that we pay with respect to our common stock.
Our distributions to stockholders may change, which could adversely affect the market price of our common stock.
All distributions will be at the sole discretion of our Board of Directors and will depend upon our actual and projected financial condition, results of operations, cash flows, liquidity and funds from operations, maintenance of our REIT qualification and such other matters as our Board of Directors may deem relevant from time to time. We may not be able to make distributions in the future or may need to fund such distributions from external sources, as to which no assurances can be given. In addition, we may choose to retain operating cash flow for investment purposes, working capital reserves or other purposes, and these retained funds, although increasing the value of our underlying assets, may not correspondingly increase the market price of our common stock. Our failure to meet the market's expectations with regard to future cash distributions likely would adversely affect the market price of our common stock.
The availability and timing of cash distributions to our stockholders is uncertain.
We bear all expenses incurred in our operations, which are deducted from cash funds generated by operations prior to computing the amount of cash distributions to our stockholders. We are also restricted by the terms of our existing debt instruments from paying distributions in excess of certain financial metrics. In addition, our Board of Directors, in its discretion, may retain any portion of such funds for working capital. We cannot assure our stockholders that sufficient cash will be available to make distributions or that the amount of distributions will increase over time. If we fail for any reason to distribute at least 90% of our ordinary taxable income, we would not qualify for the favorable tax treatment accorded to REITs.
We may not have sufficient cash available from operations to pay distributions and, therefore, distributions may include a return of capital.
Distributions payable to stockholders may include a return of capital, rather than a return on capital. It is our present intention to make quarterly distributions to our stockholders. However, the actual amount and timing of distributions will be determined by our Board of Directors in its discretion and typically will depend on the amount of funds available for distribution which will depend on items such as current and projected cash requirements and tax considerations. As a result, our distribution rate and payment frequency may vary from time to time. We may not have sufficient cash available from operations to pay distributions required to maintain our qualification as a REIT and may need to use borrowed funds to make such cash distributions, which may reduce the amount of proceeds available for investment and operations. Additionally, if the aggregate amount of cash distributed in any given year exceeds the amount of our “REIT taxable income” generated during the year, the excess amount will be deemed a return of capital, which will decrease our stockholders' tax basis in their investment in shares of our common stock. Our organizational documents do not establish a limit on the amount of net proceeds we may use to fund distributions.
Increases in market interest rates may result in a decrease in the value of our common stock.
One of the factors that may influence the price of our common stock will be the dividend distribution rate on our common stock (as a percentage of the price of our common stock) relative to market interest rates. If market interest rates rise, prospective purchasers of common stock may expect a higher distribution rate. Higher interest rates would not, however, result in more funds being available for distribution and, in fact, would likely increase our borrowing costs and might decrease our funds available for distribution. We therefore may not be able, or we may not choose, to provide a higher distribution rate. As a result, prospective purchasers may decide to purchase other securities rather than our common stock, which would reduce the demand for, and result in a decline in the market price of, our common stock.
If securities analysts do not publish research or reports about our business or if they downgrade our common stock or the healthcare property sector, the price of our common stock could decline.
The trading market for our common stock will rely in part upon the research and reports that industry or financial analysts publish about us or our business. We have no control over these analysts. Furthermore, if one or more of the analysts who do cover us downgrades our stock or our industry, or the stock of any of our competitors, the price of our common stock could decline. If one or more of these analysts ceases coverage of our company, we could lose attention in the market, which in turn could cause the price of our common stock to decline.
Our Board of Directors could increase or decrease the number of authorized shares of stock and issue stock without stockholder approval.
Our charter authorizes our Board of Directors, without stockholder approval, to amend the charter from time to time to increase or decrease the aggregate number of authorized shares of stock or the number of authorized shares of stock of any class or series, to issue shares of our common stock or preferred stock and to classify or reclassify any unissued shares of our common stock or preferred stock into other classes or series and set the preferences, rights and other terms of such classified or reclassified shares. Although our Board of Directors has no such intention at the present time, it could establish a class or series of preferred stock that could, depending on the terms of such class or series, delay, defer or prevent a transaction or a change of control that might be in the best interest of stockholders.
Item 1B. Unresolved Staff Comments
Not applicable.
Item 2. Properties
We have invested $3.0 billion in high-quality medical office buildings and other facilities that serve the healthcare industry through December 31, 2013. As of December 31, 2011, we leased2013, our principal executive offices located at 16435 North Scottsdale Road, Suite 320, Scottsdale, AZ 85254. Additionally, we lease regional offices in Indianapolis, INportfolio consisted of 269 medical office buildings and in Charleston, SC.19 other facilities that serve the healthcare industry. Our Indianapolis regional officeportfolio is located at 201 N. Pennsylvania Parkway, Suite 201, Indianapolis, IN 46280. Our Charleston regional office is located at 463 King Street, Suite B, Charleston, SC 29403.
We have built a portfoliocomprised of acquisitions comprising 248 buildings with approximately 11.214.1 million square feet of GLA, for an aggregate purchase price of $2,334,673,000 as of December 31, 2011. Our portfolio is geographically diverse, with property portfolios located in 25 states. Each of our properties is 100% owned by our operating partnership, except for the 7900 Fannin medical office building in which we own an approximate 84% interest through our operating partnership. As of December 31, 2011, our property portfolio had an occupancy rate of approximately 91%91.6%, including month-to-month leases signedand leases we have executed, but which have not yet commenced. Approximately 96% of our portfolio, based on GLA, is located on or aligned with campuses of nationally or regionally recognized healthcare systems. Our portfolio is diversified geographically across 27 states, with no state having more than 13% of the total GLA as of December 31, 2013. All of our properties are 100% owned, except for one medical office building.
Our properties include medical office buildings, specialty inpatient facilities (long term acute care hospitals or rehabilitation hospitals), and skilled nursing and assisted living facilities.
As of December 31, 2011,2013, we owned fee simple interests in 175199 of the 248288 buildings comprising our portfolio. These 175199 buildings represent approximately 67.7%65.3% of our total portfolio’s GLA. We hold long-term leasehold interests in the remaining 7389 buildings within our portfolio, which represent approximately 32.3%34.7% of our total GLA. As of December 31, 2011,2013, these leasehold interests had an average remaining term of approximately 68.553.9 years.
The following information generally applies to our properties:
we believe all of our properties are adequately covered by insurance and are suitable for their intended purposes;
our properties are located in markets where we are subject to competition in attracting new tenants and retaining current tenants; and
depreciation is provided on a straight-line basis over the estimated useful lives of the buildings, up to 39 years, and over the shorter of the lease term or useful lives of the tenant improvements.
Lease Expirations
The following table presents the sensitivity of our annualized base rent due to lease expirations for existing leases for the next 10 years at our properties, by number, square feet, percentage of leased area, annualized base rent, and percentage of annualized base rent as of December 31, 2011:years:
| | Year Ending December 31(2) | Number of Leases Expiring | | Total Sq. Ft.
of Expiring Leases | | % of Leased
Area
Represented
by Expiring Leases | | Annualized
Base
Rent Under
Expiring Leases (1) | | % of Total
Annualized
Base Rent
Represented by Expiring Leases(1) | |
| 2012 | 280 |
| | 749,075 |
| | 7.2 | % | | $ | 15,433,628 |
| | 7.2 | % | |
| 2013 | 251 |
| | 1,049,859 |
| | 10.1 |
| | 20,875,270 |
| | 9.7 |
| |
| Expiration (1) | | | Number of Leases Expiring | | Total GLA
of Expiring Leases (2) | | Percent of GLA Represented by Expiring Leases | | Annualized Base Rent (2) (3) | | Percent of Total Annualized Base Rent |
| Month-to-month | | | 107 |
| | 181 |
| | 1.4 | % | | $ | 3,353 |
| | 1.2 | % |
| 2014 | 199 |
| | 955,059 |
| | 9.2 |
| | 17,609,997 |
| | 8.2 |
| | 335 |
| | 857 |
| | 6.6 |
| | 18,228 |
| | 6.6 |
|
| 2015 | 209 |
| | 861,155 |
| | 8.3 |
| | 18,451,461 |
| | 8.6 |
| | 279 |
| | 955 |
| | 7.4 |
| | 21,673 |
| | 7.9 |
|
| 2016 | 186 |
| | 1,033,905 |
| | 10.0 |
| | 21,730,754 |
| | 10.1 |
| | 274 |
| | 1,252 |
| | 9.7 |
| | 25,332 |
| | 9.2 |
|
| 2017 | 165 |
| | 816,087 |
| | 7.9 |
| | 16,181,483 |
| | 7.5 |
| | 287 |
| | 1,249 |
| | 9.7 |
| | 25,570 |
| | 9.3 |
|
| 2018 | 116 |
| | 707,052 |
| | 6.8 |
| | 14,731,741 |
| | 6.8 |
| | 260 |
| | 1,522 |
| | 11.8 |
| | 31,022 |
| | 11.3 |
|
| 2019 | 69 |
| | 546,533 |
| | 5.3 |
| | 12,321,079 |
| | 5.7 |
| | 126 |
| | 855 |
| | 6.6 |
| | 20,348 |
| | 7.4 |
|
| 2020 | 82 |
| | 473,373 |
| | 4.6 |
| | 9,126,161 |
| | 4.2 |
| | 141 |
| | 713 |
| | 5.5 |
| | 15,211 |
| | 5.5 |
|
| 2021 | 70 |
| | 452,468 |
| | 4.4 |
| | 9,393,342 |
| | 4.4 |
| | 131 |
| | 1,240 |
| | 9.6 |
| | 24,147 |
| | 8.8 |
|
| 2022 | | | 92 |
| | 724 |
| | 5.6 |
| | 17,414 |
| | 6.3 |
|
| 2023 | | | 43 |
| | 639 |
| | 5.0 |
| | 11,847 |
| | 4.3 |
|
| Thereafter | 136 |
| | 2,710,444 |
| | 26.2 |
| | 59,722,860 |
| | 27.6 |
| | 146 |
| | 2,716 |
| | 21.1 |
| | 60,345 |
| | 22.2 |
|
| Total | 1,763 |
| | 10,355,010 |
| | 100.0 | % | | $ | 215,577,776 |
| | 100.0 | % | | 2,221 |
| | 12,903 |
| | 100.0 | % | | $ | 274,490 |
| | 100.0 | % |
| |
| (1) | The annualized base rent percentage is based on the total annual contractual base rent as of December 31, 2011, excluding the impact of renewals, future step-ups in rent, abatements, concessions, and straight-line rent. Amounts include any contractual rent increases over the life of the lease. |
| |
(2) | Leases scheduled to expire on December 31 of a given year are included within that year in the table. |
| |
| (3) | Annualized base rent is calculated by multiplying contractual base rent as of December 31, 2013 by 12 (excluding the impact of abatements, concessions, and straight-line rent). |
Geographic Diversification/Concentration Table
The following table lists the states in which our properties are located and provides certain information regarding our portfolio’s geographic diversification/concentration as of December 31, 2011:2013:
| | | State | Number of Buildings(1) | | | GLA (Square Feet) | | % of GLA | | 2011 Annualized Base Rent(2) | | % of 2011 Annualized Base Rent | | Number of Buildings | | GLA (1) | | Percent of GLA | | Annualized Base Rent (1) (2) | | Percent of Annualized Base Rent |
| Arizona | 44 |
| (3) | | 1,363,000 |
| | 12.1 | % | | $ | 25,042,000 |
| | 12.1 | % | | 45 |
| | 1,366 |
| | 9.7 | % | | $ | 26,013 |
| | 9.5 | % |
| California | 5 |
| | | 287,000 |
| | 2.5 | % | | 5,061,000 |
| | 2.4 |
| | 5 |
| | 284 |
| | 2.0 |
| | 4,926 |
| | 1.8 |
|
| Colorado | 3 |
| | | 145,000 |
| | 1.3 | % | | 2,940,000 |
| | 1.4 |
| | 4 |
| | 260 |
| | 1.9 |
| | 5,789 |
| | 2.1 |
|
| Florida | 20 |
| (3) | | 940,000 |
| | 8.4 | % | | 17,950,000 |
| | 8.7 |
| | 32 |
| | 1,699 |
| | 12.1 |
| | 34,351 |
| | 12.5 |
|
| Georgia | 12 |
| | | 615,000 |
| | 5.5 | % | | 12,303,000 |
| | 6.0 |
| | 14 |
| | 669 |
| | 4.8 |
| | 13,929 |
| | 5.1 |
|
| Illinois | | | 1 |
| | 139 |
| | 1.0 |
| | 4,487 |
| | 1.6 |
|
| Indiana | 44 |
| (3) | | 1,220,000 |
| | 11.2 | % | | 16,751,000 |
| | 8.1 |
| | 45 |
| | 1,270 |
| | 9.0 |
| | 18,199 |
| | 6.6 |
|
| Kansas | 1 |
| | | 63,000 |
| | 0.5 | % | | 1,610,000 |
| | 0.8 |
| | 1 |
| | 64 |
| | 0.4 |
| | 1,662 |
| | 0.6 |
|
| Maryland | 2 |
| | | 164,000 |
| | 1.5 | % | | 3,497,000 |
| | 1.7 |
| | 2 |
| | 163 |
| | 1.2 |
| | 3,445 |
| | 1.2 |
|
| Massachusetts | 1 |
| | 47,000 |
| | 0.4 | % | | 635,000 |
| | 0.3 |
| | 13 |
| | 406 |
| | 2.9 |
| | 8,522 |
| | 3.1 |
|
| Michigan | | | 1 |
| | 203 |
| | 1.4 |
| | 4,848 |
| | 1.8 |
|
| Minnesota | 2 |
| | | 155,000 |
| | 1.4 | % | | 1,695,000 |
| | 0.8 |
| | 2 |
| | 158 |
| | 1.1 |
| | 1,636 |
| | 0.6 |
|
| Missouri | 5 |
| | | 297,000 |
| | 2.6 | % | | 6,944,000 |
| | 3.4 |
| | 5 |
| | 296 |
| | 2.1 |
| | 7,335 |
| | 2.7 |
|
| North Carolina | 10 |
| | | 241,000 |
| | 2.1 | % | | 4,808,000 |
| | 2.3 |
| |
| Nevada | | | 1 |
| | 73 |
| | 0.5 |
| | 1,594 |
| | 0.6 |
|
| New Hampshire | 1 |
| | | 70,000 |
| | 0.6 | % | | 1,210,000 |
| | 0.6 |
| | 1 |
| | 72 |
| | 0.5 |
| | 1,259 |
| | 0.5 |
|
| New Mexico | 2 |
| | | 54,000 |
| | 0.5 | % | | 1,263,000 |
| | 0.6 |
| | 2 |
| | 54 |
| | 0.4 |
| | 1,325 |
| | 0.5 |
|
| Nevada | 1 |
| | | 73,000 |
| | 0.6 | % | | 1,110,000 |
| | 0.5 |
| |
| New York | 8 |
| | | 909,000 |
| | 8.1 | % | | 16,444,000 |
| | 8.0 |
| | 8 |
| | 909 |
| | 6.5 |
| | 17,245 |
| | 6.3 |
|
| North Carolina | | | 10 |
| | 245 |
| | 1.7 |
| | 4,518 |
| | 1.6 |
|
| Ohio | 13 |
| | | 525,000 |
| | 4.7 | % | | 5,817,000 |
| | 2.8 |
| | 13 |
| | 526 |
| | 3.7 |
| | 6,057 |
| | 2.2 |
|
| Oklahoma | 2 |
| | | 186,000 |
| | 1.6 | % | | 3,392,000 |
| | 1.6 |
| | 2 |
| | 186 |
| | 1.3 |
| | 3,717 |
| | 1.3 |
|
| Pennsylvania | 3 |
| | | 530,000 |
| | 4.7 | % | | 11,113,000 |
| | 5.4 |
| | 6 |
| | 1,204 |
| | 8.6 |
| | 21,580 |
| | 7.9 |
|
| South Carolina | 22 |
| (3) | | 1,104,000 |
| | 9.8 | % | | 19,880,000 |
| | 9.6 |
| | 22 |
| | 1,103 |
| | 7.8 |
| | 20,473 |
| | 7.5 |
|
| Tennessee | 11 |
| | | 442,000 |
| | 3.9 | % | | 8,058,000 |
| | 3.9 |
| | 11 |
| | 441 |
| | 3.1 |
| | 7,994 |
| | 2.9 |
|
| Texas | 26 |
| (3) | | 1,304,000 |
| | 11.6 | % | | 31,019,000 |
| | 15.0 |
| | 32 |
| | 1,800 |
| | 12.8 |
| | 44,397 |
| | 16.2 |
|
| Utah | 1 |
| | | 112,000 |
| | 1.0 | % | | 1,800,000 |
| | 0.9 |
| | 1 |
| | 112 |
| | 0.8 |
| | 1,919 |
| | 0.7 |
|
| Virginia | 3 |
| | | 64,000 |
| | 0.6 | % | | 116,000 |
| | 0.1 |
| | 3 |
| | 63 |
| | 0.5 |
| | 586 |
| | 0.2 |
|
| Wisconsin | 6 |
| | | 315,000 |
| | 2.8 | % | | 6,306,000 |
| | 3.0 |
| | 6 |
| | 315 |
| | 2.2 |
| | 6,684 |
| | 2.4 |
|
| Total | 248 |
| | | 11,225,000 |
| | 100 | % | | $ | 206,764,000 |
| | 100.0 | % | | 288 |
| | 14,080 |
| | 100.0 | % | | $ | 274,490 |
| | 100.0 | % |
| |
| (1) | Represents the number of buildings acquired within each particular state as of December 31, 2011.Amounts in thousands. |
| |
| (2) | Annualized base rent is based oncalculated by multiplying contractual base rent from leases in effect as of December 31, 2011, excluding2013 by 12 (excluding the impact of renewals, future step-ups in rent, abatements, concessions, and straight-line rent. |
| |
(3) | As further discussed in Note 19, Concentration of Credit Risk, to our accompanying consolidated financial statements, we had the greatest geographic concentration as of December 31, 2011 within the following states: Texas (26 buildings), Arizona (44 buildings), South Carolina (22 buildings), Florida (20 buildings), and Indiana (44 buildings)rent). |
Indebtedness
Item 3. Legal Proceedings
See Note 7, Mortgage Loans Payable, Net, Note 8, Derivative Financial Instruments, Note 9, Revolving Credit Facility,We are subject to claims and Note 22, Subsequent Events, tolitigation arising in the ordinary course of business. We do not believe any liability from any reasonably foreseeable disposition of such claims and litigation, individually or in the aggregate, would have a material adverse effect on our accompanying consolidated financial statements for further discussions of our indebtedness.statements.
|
| |
Item 3. | Legal Proceedings. |
None.
|
| |
Item 4. | Mine Safety Disclosures |
Item 4. Mine Safety Disclosures Not applicable.
PART II
Item 5. Market for Registrant’s Common Equity, Related Stockholder Matters and Issuer Purchases of Equity Securities
Market Information
On June 6, 2012, HTA listed its Class A common stock, par value $0.01, on the NYSE. In accordance with an amendment to HTA’s charter approved by its stockholders, all of HTA’s common stock was converted into Class A, Class B-1, Class B-2 and Class B-3 common stock. The Class B common stock was identical to the Class A common stock except that the Class B common stock was not listed on a national securities exchange. The shares of the Class B-1, Class B-2 and Class B-3 common stock converted into shares of our Class A common stock on December 6, 2012, June 6, 2013, and November 7, 2013, respectively. As of December 31, 2013, there were no shares of Class B common stock outstanding.
The following table sets forth for the periods subsequent to HTA’s listing, the high and low sales prices of its Class A common stock as reported on the NYSE.
|
| | | | | | | | |
| | | High | | Low |
| Second Quarter 2012 | | $ | 10.05 |
| | $ | 9.75 |
|
| Third Quarter 2012 | | 10.21 |
| | 9.07 |
|
| Fourth Quarter 2012 | | 11.68 |
| | 9.61 |
|
| First Quarter 2013 | | 12.21 |
| | 9.90 |
|
| Second Quarter 2013 | | 13.34 |
| | 10.80 |
|
| Third Quarter 2013 | | 11.40 |
| | 9.93 |
|
| Fourth Quarter 2013 | | 11.75 |
| | 9.71 |
|
There is no established market for trading HTALP’s common units.
Stock Performance Graph
The graph below compares the cumulative returns of HTA, MSCI US REIT (RMS) Index, SNL US REIT Healthcare Index and the S&P 500 Index from the date of our listing on the NYSE on June 6, 2012 through December 31, 2013. The total returns assume dividends are reinvested.
|
| |
Item 5. | Market for Registrant’s Common Equity, Related Stockholder Matters and Issuer Purchases of Equity Securities. |
Market Information
There is no established public trading market for shares of our common stock.
In order for members of the Financial Industry Regulatory Authority, or FINRA, and their associated persons to participate in our offerings of shares of our common stock, we are required to disclose in each annual report distributed to stockholders a per share estimated value of the shares, the method by which it was developed, and the date of the data used to develop the estimated value. In addition, we will prepare annual statements of estimated share values to assist fiduciaries of retirement plans subject to the annual reporting requirements of ERISA in the preparation of their reports relating to an investment in shares of our common stock. For these purposes, management’s estimated value of the shares is $10.00 per share as of December 31, 2011. The basis for this valuation is the fact that the public offering price for shares of our common stock in our recently completed follow-on public offering was $10.00 per share (ignoring purchase price discounts for certain categories of purchasers). However, there is no public trading market for the shares of our common stock at this time, and there can be no assurance that stockholders could receive $10.00 per share if such a market did exist and they sold their shares of our common stock or that they will be able to receive such amount for their shares of our common stock in the future. Until August 28, 2012 (18 months after the completion of our follow-on offering of shares of our common stock), we intend to continue to use the offering price of shares of our common stock in our most recent offering as the estimated per share value reported in our Annual Reports on Form 10-K distributed to stockholders. Beginning 18 months after the last offering of shares of our common stock, the value of the properties and our other assets will be determined in a manner deemed appropriate by our board of directors, and we will disclose the resulting estimated per share value in a Current Report on Form 8-K and in our subsequent Annual Reports on Form 10-K distributed to stockholders.
Stockholders
As of March 23, 2012, weFebruary 19, 2014, HTA had 55,543approximately 4,250 stockholders of record.
Distributions
In order to continue to qualify as a REIT for federal income tax purposes, among other things, we must distribute at least 90.0% of our annual taxable income to our stockholders. The amount of distributions we pay to our stockholders is determined by our board of directors, at its sole discretion, and is dependent on a number of factors, including funds available for the payment of distributions, our financial condition, capital expenditure requirements and annual distribution requirements needed to maintain our status as a REIT under the Code, as well as any liquidity alternative we may pursue. We have paid distributions monthly since February 2007 and if our investments produce sufficient cash flow, we expect to continue to pay distributions to our stockholders on a monthly basis. However, our board of directors could, at any time, elect to pay distributions quarterly to reduce administrative costs. Because our cash available for distribution in any year may be less than 90.0% of our taxable income for the year, we may obtain the necessary funds by borrowing, issuing new securities or selling assets to pay out enough of our taxable income to satisfy the distribution requirement. Our organizational documents do not establish a limit on the amount of any offering proceeds we may use to fund distributions.
For the years ended December 31, 2011 and 2010, our board of directors authorized, and we declared and paid, monthly distributions to our stockholders, based on daily record dates, at a rate that would equal a 7.25% annualized rate, or $0.725 per common share based on a $10.00 per share price. It is our intent to continue to pay distributions. However, our board may reduce our distribution rate and we cannot guarantee the timing and amount of distributions paid in the future, if any.
If distributions are in excess of our taxable income, such distributions will result in a return of capital to our stockholders. Our distribution of amounts in excess of our taxable income has historically resulted in a return of capital to our stockholders.
Dividends
The following presentswere the amount of our distributions and the source of payment of such distributions for each of the last four quarters in the years ended December 31, 2011 and 2010:
dividends declared per share by HTA: |
| | | | | | | | | | | | | | | |
| | Three Months Ended |
| | December 31, 2011 |
| | September 30, 2011 |
| | June 30, 2011 |
| | March 31, 2011 |
|
| Distributions paid in cash | $ | 21,799,000 |
| | $ | 21,990,000 |
| | $ | 21,691,000 |
| | $ | 19,320,000 |
|
| Distributions reinvested | 19,244,000 |
| | 19,477,000 |
| | 19,492,000 |
| | 17,651,000 |
|
| Total distributions | $ | 41,043,000 |
| | $ | 41,467,000 |
| | $ | 41,183,000 |
| | $ | 36,971,000 |
|
| Source of distributions: | |
| | |
| | |
| | |
|
| Cash flow from operations | $ | 25,547,000 |
| | $ | 25,474,000 |
| | $ | 35,676,000 |
| | $ | 25,110,000 |
|
| Offering proceeds | 15,496,000 |
| | 15,993,000 |
| | 5,507,000 |
| | 11,861,000 |
|
| Total sources | $ | 41,043,000 |
| | $ | 41,467,000 |
| | $ | 41,183,000 |
| | $ | 36,971,000 |
|
|
| | | | | | | |
| | 2013 | | 2012 |
| First Quarter | $ | 0.143750 |
| | $ | 0.180753 |
|
| Second Quarter | 0.143750 |
| | 0.169064 |
|
| Third Quarter | 0.143750 |
| | 0.143750 |
|
| Fourth Quarter | 0.143750 |
| | 0.143750 |
|
| Total | $ | 0.575000 |
| | $ | 0.637317 |
|
|
| | | | | | | | | | | | | | | |
| | Three Months Ended |
| | December 31, 2010 |
| | September 30, 2010 |
| | June 30, 2010 |
| | March 31, 2010 |
|
| Distributions paid in cash | $ | 17,306,000 |
| | $ | 15,666,000 |
| | $ | 14,366,000 |
| | $ | 12,838,000 |
|
| Distributions reinvested | 15,995,000 |
| | 14,490,000 |
| | 13,544,000 |
| | 12,522,000 |
|
| Total distributions | $ | 33,301,000 |
| | $ | 30,156,000 |
| | $ | 27,910,000 |
| | $ | 25,360,000 |
|
| Source of distributions: | |
| | |
| | |
| | |
|
| Cash flow from operations | $ | 8,880,000 |
| | $ | 17,847,000 |
| | $ | 19,230,000 |
| | $ | 12,546,000 |
|
| Debt financing | 24,421,000 |
| | 12,309,000 |
| | 8,680,000 |
| | 12,814,000 |
|
| Offering proceeds | — |
| | — |
| | — |
| | — |
|
| Total sources | $ | 33,301,000 |
| | $ | 30,156,000 |
| | $ | 27,910,000 |
| | $ | 25,360,000 |
|
For the year ended December 31, 2011, we paid distributions of $160,664,000 ($84,800,000 in cash and $75,864,000 in shares of our common stock pursuantThe dividend HTA pays to its stockholders is equal to the DRIP), as compared to cash flowsdistributions received from operations of $111,807,000 and FFO of $113,135,000. From inception through December 31, 2011, we paid cumulative distributions of $402,897,000 ($209,795,000 in cash and $193,102,000 in shares of our common stock pursuantHTALP according to the DRIP),terms of HTALP’s partnership agreement. Therefore, the distribution amounts for HTALP are the same as compared to cumulative cash flows from operations of $219,620,000 and cumulative FFO of $223,704,000. The difference between our cumulative distributions paid and our cumulative cash flows from operations is indicative of our high volume of acquisitions completed since our date of inception. The distributions paid in excess of our cash flows from operations in 2011 were paid using proceeds from our offerings, including the DRIP, and proceeds of debt financing.
FFO is a non-GAAP measure. See our disclosure regarding FFO in Item 7, Management’s Discussion and Analysis of Financial Condition and Results of Operations — Funds from Operations and Normalized Funds from Operations. Note that our computation of FFO changed in 2009 as a result of a change in GAAP that required, effective January 1, 2009, that acquisition-related expenditures be expensed. As a result, acquisition-related expenditures, which had previously been capitalized and added back to FFO through depreciation, are now expensed immediately and not adjusted through FFO. The cumulative amount of acquisition-related expenses incurred since January 1, 2009 was approximately $29.4 million.
Use of Public Offering Proceedsdividend amounts above for HTA.
On September 20, 2006, we commencedFebruary 17, 2014, HTA’s Board of Directors authorized a best efforts initial public offering, or our initial offering, in which we offered up to 200,000,000 sharesquarterly cash dividend of our common stock for $10.00$0.14375 per share in a primary offering and up to 21,052,632 sharesbe paid on April 3, 2014 to stockholders of our common stock pursuant to our distribution reinvestment plan, or the DRIP, at $9.50 per share, aggregating up to $2,200,000,000. Onrecord on March 19, 2010, we terminated our initial offering and commenced a best efforts follow-on public offering, or our follow-on offering, in which we offered up to 200,000,000 shares of our common stock for $10.00 per share in a primary offering and up to 21,052,632 shares of our common stock pursuant to the DRIP at $9.50 per share, aggregating up to $2,200,000,000. We stopped offering shares in the primary offering on February 28, 2011. In aggregate, we received and accepted subscriptions in our initial and follow-on offerings for 220,673,545 shares of our common stock, or $2,195,655,000, excluding shares of our common stock issued under the DRIP.
The ratio of the costs we incurred in connection with our offerings as of December 31, 2011 to the total amount of capital we raised in the offerings as of December 31, 2011 was approximately 10.0%.s of December 31, 2011, we have used $1,760,763,000 in offering proceeds to make our 79 geographically diverse portfolio acquisitions and repay debt incurred in connection with such acquisitions. We also used a portion of these proceeds to pay distributions.27, 2014.
Purchases of Equity Securities by the Issuer and Affiliated Purchasers
Our share repurchase plan allows for share repurchases by us when certain criteria are met by our stockholders. Share repurchases will be made at the sole discretion of our board of directors.
During the three months ended December 31, 2011, we2013, HTA repurchased shares of ourits common stock as follows:
|
| | | | | | | | | | | | | |
| Period | | Total Number of Shares Purchased | | Average Price Paid per Share | | Total Number of
Shares Purchased
as Part of
Publicly Announced Plan or Program(1) | | Maximum
Approximate
Dollar Value
of Shares that May
Yet be Purchased
Under the
Plans or Programs |
| October 1, 2011 to October 31, 2011 | | 997,415 |
| | $ | 9.78 |
| | 997,415 |
| | (2 | ) |
| November 1, 2011 to November 30, 2011 | | 13,510 |
| | $ | 9.97 |
| | 13,510 |
| | (2 | ) |
| December 1, 2010 to December 31, 2011 | | 7,000 |
| | $ | 10.00 |
| | 7,000 |
| | (2 | ) |
|
| | | | | | | | | | | | | |
| Period | | Total Number of Shares Purchased (1) (2) | | Average Price Paid per Share (1) (2) | | Total Number of
Shares Purchased
as Part of
Publicly Announced Plan or Program | | Maximum Approximate Dollar Value of Shares that May Yet be Purchased Under the Plans or Programs |
| October 1, 2013 to October 31, 2013 | | — |
| | $ | — |
| | — |
| | (3 | ) |
| November 1, 2013 to November 30, 2013 | | — |
| | — |
| | — |
| | (3 | ) |
| December 1, 2013 to December 31, 2013 | | 23,475 |
| | 9.99 |
| | — |
| | (3 | ) |
____________________
| |
| (1) | Our boardPurchases represent shares withheld to satisfy withholding obligations on the vesting of directors adopted arestricted shares. The price paid per share repurchase plan effective September 20, 2006. Our board of directors adopted, and we publicly announced, an amended share repurchase plan effective August 25, 2008. On November 24, 2010, we amended and restated our share repurchase plan again, with an effective date of January 1, 2011. From inception through December 31, 2011, we had repurchased approximately 11,170,600 shareswas the then closing price of our Class A common stock pursuant to our share repurchase plan. Our share repurchase plan does not have an expiration date but may be suspended or terminated at our board of directors’ discretion.on the NYSE. |
| |
| (2) | RepurchasesFor each share of common stock redeemed by HTA, HTALP redeems a corresponding number of units in the operating partnership. Therefore, the units in the operating partnership repurchased by HTALP are the same as the shares of common stock repurchased by HTA above. |
| |
| (3) | On August 6, 2012, HTA’s Board of Directors approved a stock repurchase program of up to $100.0 million of its Class A common stock from time to time prior to August 5, 2014. There have been no repurchases under our sharethe program and $100.0 million of repurchase plan are subject tocapacity remains available under the program. Share repurchases will be made at the sole discretion of our boardHTA’s Board of directors. The plan provides that repurchases are subject to funds being available and are limited in any calendar year to 5.0% of the weighted average number of shares of our common stock outstanding during the prior calendar year. The plan also provides that we will fund a maximum of $10 million of share repurchase requests per quarter, subject to available funding, and that funding for repurchases will come exclusively from and will be limited to proceeds we receive from the sale of shares under our DRIP during such quarter.Directors. |
Securities Authorized for Issuance under Equity Compensation Plans
The Amended and Restated 2006 Incentive Plan authorizes the granting of awards in any of the following forms: options,options; stock appreciation rights,rights; restricted stock,stock; restricted or deferred stock units,units; performance awards,awards; dividend equivalents,equivalents; other stock-based awards, including units in operating partnership,partnership; and cash-based awards. Subject to adjustment as provided in the Amended and Restated 2006 Incentive Plan, the aggregate number of shares of our common stock reserved and available for issuance pursuant to awards granted under the Amended and Restated 2006 Incentive Plan is 10,000,000 (which includes 2,000,000 shares originally reserved for issuance under the plan and 8,000,000 new shares added pursuant to the amendment and restatement).10,000,000.
|
| |
Item 6. | Selected Financial Data. |
Item 6. Selected Financial DataThe following should be read with Item 1A.1A Risk Factors, and Item 7 Management’s Discussion and Analysis of Financial Condition and Results of Operations, and our accompanying consolidated financial statements and the notes thereto.thereto, as acquisitions, changes in accounting policies and other items impact the comparability of our financial data. Our historical results are not necessarily indicative of results for any future period.
The following tables present summarized consolidated financial information, including balance sheet data, statement of operations data reflecting the results of our operating properties, and statement of cash flows data in a format consistent with our consolidated financial statements under Item 15. Exhibits, Financial Statement Schedules.
Healthcare Trust of America, Inc.
|
| | | | | | | | | | | | | | | | | | | |
| | December 31, |
| | 2011 | | 2010 | | 2009 | | 2008 | | 2007 |
| BALANCE SHEET DATA: | |
| | |
| | |
| | |
| | |
|
| Real estate assets, net | $ | 1,863,930,000 |
| | $ | 1,854,554,000 |
| | $ | 1,204,552,000 |
| | $ | 826,280,000 |
| | $ | 352,994,000 |
|
| Total assets | $ | 2,291,629,000 |
| | $ | 2,271,795,000 |
| | $ | 1,673,535,000 |
| | $ | 1,113,923,000 |
| | $ | 431,612,000 |
|
| Mortgage loans payable, net | $ | 639,149,000 |
| | $ | 699,526,000 |
| | $ | 540,028,000 |
| | $ | 460,762,000 |
| | $ | 185,801,000 |
|
| Stockholders’ equity | $ | 1,567,340,000 |
| | $ | 1,487,246,000 |
| | $ | 1,071,317,000 |
| | $ | 599,320,000 |
| | $ | 175,590,000 |
|
|
| | | | | | | | | | | | | | | | | | | |
| | As of December 31, |
| (In thousands) | 2013 | | 2012 | | 2011 | | 2010 | | 2009 |
| Balance Sheet Data: | |
| | |
| | |
| | |
| | |
|
| Real estate investments, net | $ | 2,526,991 |
| | $ | 2,231,530 |
| | $ | 2,038,339 |
| | $ | 2,057,814 |
| | $ | 1,319,976 |
|
| Total assets | 2,752,334 |
| | 2,414,090 |
| | 2,291,629 |
| | 2,271,795 |
| | 1,673,535 |
|
| Debt, net | 1,214,241 |
| | 1,037,359 |
| | 639,149 |
| | 706,526 |
| | 540,028 |
|
| Total equity | 1,399,749 |
| | 1,264,595 |
| | 1,567,340 |
| | 1,487,246 |
| | 1,071,317 |
|
|
| | | | | | | | | | | | | | | | | | | |
| | Years Ended December 31, |
| | 2011 | | 2010 | | 2009 | | 2008 | | 2007 |
| STATEMENT OF OPERATIONS DATA: | |
| | |
| | |
| | |
| | |
|
| Total revenues | $ | 274,438,000 |
| | $ | 203,081,000 |
| | $ | 129,486,000 |
| | $ | 80,418,000 |
| | $ | 17,626,000 |
|
| Net income (loss) | $ | 5,593,000 |
| | $ | (7,919,000 | ) | | $ | (24,773,000 | ) | | $ | (28,409,000 | ) | | $ | (7,674,000 | ) |
| Net income (loss) attributable to controlling interest | $ | 5,541,000 |
| | $ | (7,903,000 | ) | | $ | (25,077,000 | ) | | $ | (28,448,000 | ) | | $ | (7,666,000 | ) |
| Income (loss) per share — basic and diluted(1): | |
| | |
| | |
| | |
| | |
|
| Net income (loss) | $ | 0.02 |
| | $ | (0.05 | ) | | $ | (0.22 | ) | | $ | (0.66 | ) | | $ | (0.77 | ) |
| Net income (loss) attributable to controlling interest | $ | 0.02 |
| | $ | (0.05 | ) | | $ | (0.22 | ) | | $ | (0.66 | ) | | $ | (0.77 | ) |
| STATEMENT OF CASH FLOWS DATA: | |
| | |
| | |
| | |
| | |
|
| Cash flows provided by operating activities | $ | 111,807,000 |
| | $ | 58,503,000 |
| | $ | 21,628,000 |
| | $ | 20,677,000 |
| | $ | 7,005,000 |
|
| Cash flows used in investing activities | $ | (65,958,000 | ) | | $ | 626,849,000 |
| | $ | 455,105,000 |
| | $ | 526,475,000 |
| | $ | 385,440,000 |
|
| Cash flows provided by financing activities | $ | (5,628,000 | ) | | $ | 378,615,000 |
| | $ | 524,147,000 |
| | $ | 628,662,000 |
| | $ | 383,700,000 |
|
| OTHER DATA: | |
| | |
| | |
| | |
| | |
|
| Distributions declared | $ | 162,597,000 |
| | $ | 120,507,000 |
| | $ | 82,221,000 |
| | $ | 31,180,000 |
| | $ | 7,250,000 |
|
| Distributions declared per share | $ | 0.73 |
| | $ | 0.73 |
| | $ | 0.73 |
| | $ | 0.73 |
| | $ | 0.73 |
|
| Distributions paid in cash to stockholders | $ | 84,800,000 |
| | $ | 60,176,000 |
| | $ | 39,500,000 |
| | $ | 14,943,000 |
| | $ | 3,323,000 |
|
| Distributions reinvested | $ | 75,864,000 |
| | $ | 56,551,000 |
| | $ | 38,559,000 |
| | $ | 13,099,000 |
| | $ | 2,673,000 |
|
| Funds from operations(2) | $ | 113,135,000 |
| | $ | 70,642,000 |
| | $ | 28,822,000 |
| | $ | 8,989,000 |
| | $ | 2,116,000 |
|
| Normalized funds from operations(2) | $ | 114,704,000 |
| | $ | 84,250,000 |
| | $ | 42,716,000 |
| | $ | 21,592,000 |
| | $ | 2,113,000 |
|
| Net operating income(3) | $ | 185,678,000 |
| | $ | 137,419,000 |
| | $ | 84,462,000 |
| | $ | 52,244,000 |
| | $ | 11,589,000 |
|
|
| | | | | | | | | | | | | | | | | | | |
| | Year Ended December 31, |
| (In thousands, except per share data) | 2013 | | 2012 | | 2011 | | 2010 | | 2009 |
| Statement of Operations Data: | |
| | |
| | |
| | |
| | |
|
| Total revenues | $ | 319,899 |
| | $ | 297,380 |
| | $ | 272,177 |
| | $ | 200,665 |
| | $ | 127,053 |
|
| Rental expenses | 97,053 |
| | 95,046 |
| | 88,483 |
| | 65,307 |
| | 44,616 |
|
| Income (loss) from continuing operations attributable to common stockholders | 23,154 |
| | (24,992 | ) | | 5,121 |
| | (8,092 | ) | | (24,918 | ) |
| Net income (loss) attributable to common stockholders | 24,261 |
| | (24,424 | ) | | 5,541 |
| | (7,903 | ) | | (25,077 | ) |
| Income (loss) from continuing operations attributable to common stockholders per share - basic | 0.10 |
| | (0.11 | ) | | 0.02 |
| | (0.05 | ) | | (0.22 | ) |
| Income (loss) from continuing operations attributable to common stockholders per share - diluted | 0.10 |
| | (0.11 | ) | | 0.02 |
| | (0.05 | ) | | (0.22 | ) |
| Statement of Cash Flows Data: | | | | | | | |
| | |
|
| Cash flows provided by operating activities | $ | 147,824 |
| | $ | 116,785 |
| | $ | 111,807 |
| | $ | 58,503 |
| | $ | 21,628 |
|
| Cash flows used in investing activities | (374,700 | ) | | (283,545 | ) | | (65,958 | ) | | (626,849 | ) | | (455,105 | ) |
| Cash flows provided by (used in) financing activities | 229,001 |
| | 113,225 |
| | (5,628 | ) | | 378,615 |
| | 524,147 |
|
| Other Data: | | | | | | | | | |
| Dividends declared to stockholders | $ | 132,680 |
| | $ | 142,044 |
| | $ | 162,597 |
| | $ | 120,507 |
| | $ | 82,221 |
|
| Dividends declared per share | 0.58 |
| | 0.64 |
| | 0.73 |
| | 0.73 |
| | 0.73 |
|
| Dividends paid in cash to stockholders | 129,360 |
| | 93,273 |
| | 84,800 |
| | 60,176 |
| | 39,500 |
|
| Dividends reinvested | — |
| | 31,916 |
| | 75,864 |
| | 56,551 |
| | 38,559 |
|
| FFO (1) | 145,908 |
| | 91,994 |
| | 113,083 |
| | 70,658 |
| | 28,518 |
|
| Normalized FFO (1) | 147,834 |
| | 135,262 |
| | 116,378 |
| | 84,407 |
| | 42,412 |
|
| NOI (2) | 224,285 |
| | 204,337 |
| | 185,678 |
| | 137,419 |
| | 84,462 |
|
| |
| (1) | NetFor additional information on FFO and Normalized FFO, see “Funds from Operations (FFO) and Normalized FFO” in Item 7, which includes a reconciliation to net income (loss) per share is based upon the weighted average numberor loss attributable to common stockholders and an explanation of shares of our common stock outstanding. Distributions by us of our current and accumulated earnings and profits for federal income tax purposes are taxable to stockholders as ordinary income. Distributions in excess ofwhy we present these earnings and profits generally are treated as a non-taxable reduction of the stockholder’s basis in the shares of our common stock to the extent thereof (a return of capital for tax purposes) and, thereafter, as taxable gain. These distributions in excess of earnings and profits will have the effect of deferring taxation of the distributions until the sale of the stockholder’s common stock.non-GAAP financial measure. |
| |
| (2) | For additional information on NOI, see “Net Operating Income (NOI), Adjusted NOI and Same-Property Adjusted NOI” in Item 7, which includes a reconciliation to net income or loss and an explanation of why we present these non-GAAP financial measure. |
Healthcare Trust of America Holdings, LP
|
| | | | | | | | | | | | | | | | | | | |
| | As of December 31, |
| (In thousands) | 2013 | | 2012 | | 2011 | | 2010 | | 2009 |
| Balance Sheet Data: | |
| | |
| | |
| | |
| | |
|
| Real estate investments, net | $ | 2,526,991 |
| | $ | 2,231,530 |
| | $ | 2,038,339 |
| | $ | 2,057,814 |
| | $ | 1,319,976 |
|
| Total assets | 2,752,334 |
| | 2,414,090 |
| | 2,291,629 |
| | 2,271,795 |
| | 1,673,535 |
|
| Debt, net | 1,214,241 |
| | 1,037,359 |
| | 639,149 |
| | 706,526 |
| | 540,028 |
|
| Total partners’ capital | 1,401,294 |
| | 1,266,199 |
| | 1,568,927 |
| | 1,488,811 |
| | 1,071,513 |
|
|
| | | | | | | | | | | | | | | | | | | |
| | Year Ended December 31, |
| (In thousands, except per unit data) | 2013 | | 2012 | | 2011 | | 2010 | | 2009 |
| Statement of Operations Data: | |
| | |
| | |
| | |
| | |
|
| Total revenues | $ | 319,899 |
| | $ | 297,380 |
| | $ | 272,177 |
| | $ | 200,665 |
| | $ | 127,053 |
|
| Rental expenses | 97,053 |
| | 95,046 |
| | 88,483 |
| | 65,307 |
| | 44,616 |
|
| Income (loss) from continuing operations attributable to common unitholders | 23,526 |
| | (24,976 | ) | | 5,143 |
| | (8,083 | ) | | (24,918 | ) |
| Net income (loss) attributable to common unitholders | 24,633 |
| | (24,408 | ) | | 5,563 |
| | (7,894 | ) | | (25,077 | ) |
| Income (loss) from continuing operations attributable to common unitholders per unit - basic | 0.10 |
| | (0.11 | ) | | 0.02 |
| | (0.05 | ) | | (0.22 | ) |
| Income (loss) from continuing operations attributable to common unitholders per unit - diluted | 0.10 |
| | (0.11 | ) | | 0.02 |
| | (0.05 | ) | | (0.22 | ) |
| Statement of Cash Flows Data: | | | | | | | |
| | |
|
| Cash flows provided by operating activities | $ | 147,824 |
| | $ | 116,785 |
| | $ | 111,807 |
| | $ | 58,503 |
| | $ | 21,628 |
|
| Cash flows used in investing activities | (374,700 | ) | | (283,545 | ) | | (65,958 | ) | | (626,849 | ) | | (455,105 | ) |
| Cash flows provided by (used in) financing activities | 229,001 |
| | 113,225 |
| | (5,628 | ) | | 378,615 |
| | 524,147 |
|
| Other Data: | | | | | | | | | |
| Distributions declared to general partner | $ | 132,680 |
| | $ | 141,944 |
| | $ | 162,483 |
| | $ | 120,451 |
| | $ | 82,221 |
|
| Distributions declared per unit | 0.58 |
| | 0.64 |
| | 0.73 |
| | 0.73 |
| | 0.73 |
|
| Distributions paid in cash to general partner | 129,360 |
| | 93,273 |
| | 84,800 |
| | 60,176 |
| | 39,500 |
|
| Distributions reinvested | — |
| | 31,916 |
| | 75,864 |
| | 56,551 |
| | 38,559 |
|
| FFO (1) | 146,280 |
| | 92,010 |
| | 113,105 |
| | 70,667 |
| | 28,518 |
|
| Normalized FFO (1) | 147,835 |
| | 135,262 |
| | 116,378 |
| | 84,416 |
| | 42,412 |
|
| NOI (2) | 224,285 |
| | 204,337 |
| | 185,678 |
| | 137,419 |
| | 84,462 |
|
| |
| (1) | For additional information on FFO and normalized funds from operations, or Normalized FFO, see “Funds from Operations (FFO) and Normalized FFO” in Item 7, which includes a reconciliation to net income or loss attributable to common unitholders and an explanation of why we present these non-GAAP financial measure. |
| |
| (2) | For additional information on NOI, see “Net Operating Income (NOI), Adjusted NOI and Same-Property Adjusted NOI” in Item 7, which includes a reconciliation to net income or loss and an explanation of why we present these non-GAAP financial measure. |
Item 7. Management’s Discussion and Analysis of Financial Condition and Results of Operations
— Funds from Operations and Normalized Funds From Operations, which includes a reconciliation of our GAAP net loss to FFO and Normalized FFO for the years ended December 31, 2011, 2010 and 2009. Neither FFO nor Normalized FFO should be considered as alternatives to net loss or other measurements under GAAP as indicators of our operating performance, nor should they be considered as alternatives to cash flow from operating activities or other measurements under GAAP as indicators of our liquidity. | |
(3) | For additional information on net operating income, see Item 7. Management’s Discussion and Analysis of Financial Condition and Results of Operations — Net Operating Income, which includes a reconciliation of our GAAP net income(loss) to net operating income for the years ended December 31, 2011, 2010 and 2009. |
|
| |
Item 7. | Management’s Discussion and Analysis of Financial Condition and Results of Operations. |
The use of the words “we,” “us” or “our” refers to Healthcare Trust of America, Inc., or HTA, and its subsidiaries, including Healthcare Trust of America Holdings, LP, except where the context otherwise requires.or HTALP, collectively.
The following discussion should be read in conjunction with our consolidated financial statements and notes appearing elsewhere in this Annual Report on Form 10-K. Such consolidated financial statements and information have been prepared to reflect ourHTA’s and HTALP’s financial position as of December 31, 20112013 and 2010,2012, together with our results of operations and cash flows for the years ended December 31, 2011, 2010,2013, 2012 and 2009.2011. The information set forth is intended to provide readers with an understanding of our financial condition, changes in financial condition and results of operations.
Forward-Looking Statements;
Executive Summary;
Company Highlights;
Critical Accounting Policies;
Recently Issued or Adopted Accounting Pronouncements;
Factors Which May Influence Results of Operations;
Results of Operations;
Non-GAAP Financial Measures;
Liquidity and Capital Resources;
Commitments and Contingencies;
Debt Service Requirements;
Contractual Obligations;
Off-Balance Sheet Arrangements; and
Inflation.
Forward-Looking Statements
Historical results and trends should not be taken as indicative of future operations. OurCertain statements contained in this report that are not historical facts areAnnual Report on Form 10-K constitute forward-looking statements within the meaning of the safe harbor from civil liability provided for such statements by the Private Securities Litigation Reform Act of 1995 (set forth in Section 27A of the Securities Act of 1933, as amended, and Section 21E of the Securities Exchange Act of 1934, as amended, or the Exchange Act. Actual results may differ materially from those includedAct). Such statements include, in the forward-looking statements. We intend those forward-lookingparticular, statements to be covered by the safe-harbor provisions for forward-looking statements contained in the Private Securities Litigation Reform Act of 1995, and are including this statement for purposes of complying with those safe-harbor provisions. Forward-looking statements, which are based on certain assumptions and describe futureabout our plans, strategies and expectations,prospects and estimates regarding future medical office building market performance. Additionally, such statements are subject to certain risks and uncertainties, as well as known and unknown risks, which could cause actual results to differ materially and in adverse ways from those projected or anticipated. Therefore, such statements are not intended to be a guarantee of our performance in future periods. Forward-looking statements are generally identifiable by the use of thesuch terms such as “expect,” “project,” “may,” “will,” “should,” “could,” “would,” “intend,” “plan,” “anticipate,” “estimate,” “believe,” “continue,” “opinion,” “predict,” “potential”“potential,” “pro forma” or the negative of such terms and other comparable terminology. OurReaders are cautioned not to place undue reliance on these forward-looking statements, which speak only as of the date this Annual Report on Form 10-K is filed with the SEC. We cannot guarantee the accuracy of any such forward-looking statements contained in this Annual Report on Form 10-K, and we do not intend to publicly update or revise any forward-looking statements, whether as a result of new information, future events, or otherwise, except as required by law.
Any such forward-looking statements reflect our current views about future events, are subject to unknown risks, uncertainties, and other factors, and are based on a number of assumptions involving judgments with respect to, among other things, future economic, competitive and market conditions, all of which are difficult or impossible to predict accurately. To the extent that our assumptions differ from actual results, our ability to predict results ormeet such forward-looking statements, including our ability to generate positive cash flow from operations, provide dividends to stockholders, and maintain the actual effectvalue of our real estate properties, may be significantly hindered. Factors that might impair our ability to meet such forward-looking statements include, without limitation, those discussed in Part I, Item 1A “Risk Factors” are included herein and other filings with the SEC.
Forward-looking statements express expectations of future plansevents. All forward-looking statements are inherently uncertain as they are based on various expectations and assumptions concerning future events and they are subject to numerous known and unknown risks and uncertainties that could cause actual events or strategies is inherently uncertain. Factors which could have a material adverse effectresults to differ materially from those projected. Due to these inherent uncertainties, our stockholders are urged not to place undue reliance on our operations and future prospects on a consolidated basis include, but are not limited to: changes in economic conditions generally andforward-looking statements. Forward-looking statements speak only as of the real estate market specifically; legislative and regulatory changes, includingdate made. In addition, we undertake no obligation to update or revise forward-looking statements to reflect changed assumptions, the occurrence of unanticipated events or changes to laws governing the taxation of REITs and changes to laws governing the healthcare industry; the success of our assessment of strategic alternatives, including potential liquidity alternatives; the availability of capital; changes in interest rates; competition in the real estate industry; the supply and demand for operating properties in our proposed market areas; changes in accounting principles generally accepted in the United States of America, or GAAP, policies and guidelines applicable to REITs; the availability of properties to acquire; and the availability of financing. projections over time, except as required by law.
These risks and uncertainties should be considered in evaluating forward-looking statements and undue reliance should not be placed on such statements. Additional information concerning us and our business, including additional factors that could materially affect our financial results, including but not limited to the risks described under Part I, Item 1A. Risk Factors, is included herein and in our other filings with the SEC.
Overview and BackgroundExecutive Summary
Healthcare Trust of America, Inc., a Maryland corporation, was incorporated on April 20, 2006. We were initially capitalized on April 28, 2006, and consider that our date of inception.
We areHTA is a fully integrated, self-administered and self-managed REIT. Accordingly, our internal management team employs a hands-on approach to managing our day-to-day operations.internally managed REIT and conducts substantially all of its operations through HTALP. HTA is one of the largest publicly-traded REITs focused on medical office buildings in the United States based on GLA. We have approximately 60 employeesare primarily focused on acquiring, owning and operating high-quality medical office buildings that are predominantly located on, or aligned with, campuses of nationally or regionally recognized healthcare systems. In addition, we have strong industry relationships, a stable and diversified tenant mix, and an extensive and active acquisition network. Our primary objective is to maximize stockholder value with disciplined growth through strategic investments and to provide an attractive risk-adjusted return for our stockholders by consistently increasing our cash flow. In pursuing this objective, we (i) target mid-sized acquisitions of high-quality on-campus or aligned medical office buildings in markets with dominant healthcare systems, in major U.S. metropolitan areas. We are a full-service real estate companyattractive demographics and that complement our existing portfolio, (ii) actively manage our balance sheet to maintain flexibility with acquisitionslow leverage, and (iii) seek internal growth through proactive asset management, services performed internally, with certain monitored services provided by third parties at market rates. leasing and property management.
We do not pay acquisition, disposition or asset management fees to an external advisor, and we have not and will not pay any internalization fees.
Through our management's experience and our portfolio acquisitions, we have developed numerous long-term relationships with healthcare systems, physician groups, developers, lenders, brokers, and other real estate professionals. We believe these strong relationships with our hospital systems and physician tenants drive incremental demand for ourinvest primarily in high-quality medical office building spacebuildings in our target markets, and increased tenant retention rates, as well as serve to further our efforts of being the landlord of choice for our tenants. Additionally, we believe these relationships will provide us with further investment opportunities. We provide our stockholders the potential for income and growth through our investment in a diversified portfolio of real estate properties. We focus primarily onhave acquired high-quality medical office buildings and other facilities that serve the healthcare industry. We also invest to a limited extent in other real estate-related assets, such as mortgage loans receivable. However, we do not presently intend to invest more than 15%industry with an aggregate purchase price of $3.0 billion through December 31, 2013. As of December 31, 2013, our total assets in such other real estate-related assets. We focus on investments that produce recurring income. We conduct substantially allportfolio consisted of our operations through Healthcare Trust of America Holdings, LP, or our operating partnership.
We are one of the largest public healthcare REITs, based on GLA, focused primarily on high-quality269 medical office buildings inand 19 other facilities that serve the United States, and we own an approximately $2.3 billion healthcare industry, as well as real estate portfolio (based on purchase price) consisting predominantly of institutional qualitynotes receivable secured by medical office buildings. Our portfolio is comprised of 11.2approximately 14.1 million square feet of GLA, with an occupancy rate of approximately 91.6%, including month-to-month leases and leases we have executed, but which have not yet commenced. Approximately 96% of our portfolio, based on GLA, is focusedlocated on, strategically-located medical office buildingsor aligned with, campuses of nationally or regionally recognized healthcare systems. Investment grade rated tenants as a percent of annualized base rent was approximately 40% at December 31, 2013. We continue to focus on building relationships with strong tenants and healthcare systems that are on the campusesleaders in their markets. As of or are adjacent to/aligned with recognized healthcare systems situated in locations with high barriers to entry. Approximately 57%December 31, 2013, approximately 56% of our annualized base rent iswas derived from tenants that have (or whose parent companies have) a credit rating as determined byfrom a nationally recognized rating agency, and approximately 38% of our annualized base rent is derived from tenants that have an investment grade credit rating as determined by nationally recognized rating agencies, including, but not limited to, Greenville Hospital System, Community Health Systems, Aurora Healthcare, West Penn Allegheny Health System, Indiana University Health, Hospital Corporation of America, and Banner Health. As of December 31, 2011, none of our tenants at our consolidated properties accounted for 7% or more of our aggregate annual rental revenue. Our existing lease fundamentals provide for stable in-place revenue and rent growth. With our stable occupancy rate and minimal near-term lease rollover, our portfolio allows for a good balance of growth through increased occupancy and stability within our existing tenant base.
Our business strategy consists of the following: (1) achieve growth through targeted acquisition; (2) actively manage our balance sheet to maintain flexibility with conservative leverage; and (3) maximize internal growth through proactive asset management, leasing and property management oversight. We believe that these strategies allow us to proactively identify and undertake actions that drive growth and enhance stockholder value. We believe our mission is to maintain a strong balance sheet and to buy, own and operate assets in an optimal manner. Our overall philosophy is to undertake actions which are in the best interests of our stockholders. In moving to our self-management model, we put our stockholders first and put the focus on performance-based behavior, which has saved costs and increased productivity at all levels of our company.agency.
We own a national portfolio of high-quality medical office buildings that are geographically diversified in 25 states. Our portfolio is compriseddiversified geographically across 27 states, with no state having more than 13% of 11.2 millionthe total GLA as of square feet of GLA and it isDecember 31, 2013. We are concentrated in locations that we have determined to be strategic based on demographic trends and projected demand for healthcare.medical office buildings, and we expect to continue to invest in these markets. We have concentrations in the following key markets: Phoenix, Arizona; Pittsburgh, Pennsylvania; Greenville, South Carolina; Indianapolis, Indiana; Albany, New York; Indianapolis, Indiana; Houston, Texas; Dallas, Texas; Atlanta, Georgia; Pittsburgh, Pennsylvania; Dallas, Texas;Miami, Florida; Boston, Massachusetts; Denver, Colorado and Raleigh, North Carolina; and Oklahoma City, Oklahoma. We believe our portfolio provides stable and growing in-place revenue. With occupancy, including leases signed, but which have not yet commenced, of approximately 91% as of December 31, 2011, our portfolio also provides built-in value-add opportunities, including increased occupancy and future development opportunities. Growth opportunities are complemented and enhanced by our proven and disciplined acquisition capability, high-quality and stable existing tenant base, conservative and 27.9% leveraged balance sheet, experienced senior management team, and strong degree of financial flexibility.Carolina.
During the year ended December 31, 2011, we completed the acquisition of two new, two-building portfolios and expanded two of our existing portfolios through the purchase of an additional building in each. The aggregate purchase price of these acquisitions was $68,314,000, and they had a weighted average acquisition-day capitalization rate of 8.04%. Capitalization rates are calculated by dividing the property's estimated annualized first year net operating income, existing at the date of acquisition, by the contract purchase price of the property, excluding closing costs and acquisition expenses. Estimated first year net operating income on our real estate investments represents total estimated gross income (rental income, tenant reimbursements, and other property-related income) derived from the terms of in-place leases at the time we acquire the property, less property and related expenses (including property operating and maintenance expenses, real estate taxes, property insurance, and management fees) based on the operating history of the property. Estimated first year net operating income on new acquisitions excludes other non-property income and expenses, interest expense from financings, depreciation and amortization, and our company-level general and administrative expenses. Historical operating income for these properties is not necessarily indicative of future operating results.
On September 20, 2006, we commenced a best efforts initial public offering, or our initial offering, in which we offered up to 200,000,000 shares of our common stock for $10.00 per share in a primary offering and up to 21,052,632 shares of our common stock pursuant to our distribution reinvestment plan, or the DRIP, at $9.50 per share, aggregating up to $2,200,000,000. On March 19, 2010, we terminated our initial offering and commenced a best efforts follow-on public offering, or our follow-on offering, in which we offered up to 200,000,000 shares of our common stock for $10.00 per share in a primary offering and up to 21,052,632 shares of our common stock pursuant to the DRIP at $9.50 per share, aggregating up to $2,200,000,000. We stopped offering shares in the primary offering on February 28, 2011. In aggregate, we received and accepted subscriptions in our initial and follow-on offerings for 220,673,545 shares of our common stock, or $2,195,655,000, excluding shares of our common stock issued under the DRIP. We continue to offer shares pursuant to the DRIP; however, we may terminate the DRIP at any time.
Company Highlights
Portfolio Operating Performance
For the year ended December 31, 2011, our cash flow from operations was $111,807,000 representing an 91.1% increase over our cash flow from operations2013, we had net income of $58,503,000$24.7 million, compared to a net loss of $24.4 million for the year ended December 31, 20102012. The increase is primarily due to the net gains on the change in the fair value of our derivative financial instruments during 2013 and a 417.0% increase over our cash flow from operations of $21,628,000 forexpenses associated with the listing during 2012.
For the year ended December 31, 2009.
For2013, HTA’s Normalized FFO was $0.64 per diluted share or $147.8 million, an increase of $0.03 per diluted share, or 4.9%, compared to the year ended December 31, 2011, net income increased by 170.6% to $5,593,000 from a loss of $7,919,000 for2012. For the year ended December 31, 2010, and by 122.6% from a loss2013, HTALP’s Normalized FFO was $0.64 per diluted unit or $147.8 million, an increase of $24,773,000 for$0.04 per diluted unit, or 6.7%, compared to the year ended December 31, 2009.2012.
Our portfolio performance, coupled with our disciplined acquisition activity, forFor additional information on Normalized FFO, see “Funds from Operations (FFO) and Normalized FFO” below, which includes a reconciliation to net income or loss attributable to common stockholders/unitholders and an explanation of why we present this non-GAAP financial measure.
For the year ended December 31, 2011 has resulted in net operating income,2013, our total revenue increased 7.6%, or NOI, growth of approximately 35.1%$22.5 million, to $319.9 million, as compared to the year ended December 31, 2010, and of approximately 119.8%2012.
For the year ended December 31, 2013, NOI increased9.8%, or $19.9 million, to $224.3 million, as compared to the year ended December 31, 2009. NOI is a non-GAAP financial measure. For a reconciliation of NOI to net income (loss), see "Net Operating Income" below.2012.
For the year ended December 31, 2011, Funds from Operations,2013, our Same-Property Adjusted NOI increased 2.9%, or FFO, increased by 60.2%$5.1 million, to $113,135,000 from $70,642,000 for$180.2 million, as compared to the year ended December 31, 2010,2012.
With respect to the last two bullets above, for additional information on NOI, see “Net Operating Income (NOI), Adjusted NOI and by 292.5% from $28,822,000 for the year ended December 31, 2009. FFO isSame-Property Adjusted NOI” below, which includes a non-GAAP financial measure. For a reconciliation of FFO to net income (loss), see "Funds from Operationsor loss and Normalized Funds from Operations" below.
For the year ended December 31, 2011, our normalized funds from operations, or Normalized FFO, was $114,704,000, compared to $84,250,000 for the prior year, and increasean explanation of 36.1%. Normalized FFO is awhy we present these non-GAAP financial measure. For a reconciliation of Normalized FFO to net income (loss), see "Funds from Operations and Normalized Funds from Operations" below.measures.
Maximize Internal Growth through Proactive Asset Management Leasing and Property Management
TheOur occupancy rate on our portfolio of properties, including leases signed, but which have not yet commenced, was approximately 91%increased 50 basis points during the year to 91.6% as of December 31, 2011. Approximately two-thirds of our portfolio is leased to tenants under triple net leases.2013.
Our portfolio of 11.2During the year ended December 31, 2013, we transitioned 3.2 million square feet to our in-house property management and leasing platform, which operated 12.0 million square feet, or 85%of gross leasable areaour current GLA as of year-end.
We entered into new or renewal leases on approximately 1.4 million square feet during the year ended December 31, 2013.
Tenant retention for the portfolio was approximately 85% for the year, which we believe is focused on strategically located on-campusindicative of our commitment to maintaining high-quality buildings in desirable locations and fostering strong tenant relationships. Tenant retention is calculated by taking the sum of the total GLA of tenants that renew an expiring lease divided by the total GLA of expiring leases.
Relationship-Focused Growth Strategy
We have been one of the most active investors in the medical office sector over the last seven years and have developed significant industry relationships with health systems, physician practices, and regional medical office developers and management firms. These relationships are the source of the majority of our acquisition opportunities, including more than 90% of our 2013 acquisitions.
We completed $397.8 million of investments in medical office buildings during the year, an increase in locations with high barriers to entry. As of December 31, 2011,our portfolio size by approximately 95%15% based on purchase price.
All of our portfolio, based on GLA, was2013 acquisitions are affiliated with leading health systems, with 92% of the properties located directly on or adjacent to or anchored byhealth system campuses. The occupancy at closing for these properties was approximately 95%.
Approximately 95% of the campusestotal GLA of nationallyour 2013 acquisitions is in multi-tenanted buildings and regionally recognizedincludes an attractive mix of credit-rated health systems, independent physician practices, and other healthcare systems.
We have implemented integrated asset management, budgeting, and reporting systems in order to allow us to take a tenant-focused approach in monitoring our portfolio. Additionally, during the year ended December 31, 2011, we expanded our geographic reach and increased access to our tenants by opening regional offices in Indianapolis, Indiana and Charleston, South Carolina.
During the year ended December 31, 2011, we transitioned the managementrelated entities. This provides for a significant portionwell-balanced rental dynamic that we expect will result in stable and growing rental income over time. In fact, we believe this multi-tenanted mix provides for greater stability in cash flows and income over the long term than would a portfolio of single tenant, triple net leased buildings with 100% credit tenants.
Approximately 80% of our Indiana property portfolios to a regionally-focused property management platform with HTA-dedicated property management personnel.2013 acquisitions by GLA were located in our target markets of Florida and Texas. The additionremaining properties are located in existing markets of this market complemented the 34%Pittsburgh, Denver, and Atlanta and allows for an efficient expansion of our overall portfolio that we had already been successfully managing with ourin-house asset management team. We believe such a platform provides us with the potential to reduce costs while enhancing our relationships with our hospital systems and physician tenants. Further, it allows us to improve the efficiency and effectiveness of property management and leasing. Following the success experienced with transitioning our Indiana portfolios, we have begun the transition of properties in Arizona as well as in several east coast markets to our HTA-dedicated property managementleasing platform. Upon completion of these markets currently in transition, approximately 61% of our portfolio will be managed internally. We will continue to evaluate additional markets in which to expand our internal migration efforts in the future.
As a result of the successes achieved with respect to effectively managing our portfolio of assets and in leading the transition of several of our markets toward a regionally-focused property management platform with HTA-dedicated property management personnel, on December 7, 2011, our board of directors approved the appointment of Amanda Houghton, previously our Senior Vice President--Asset Management and Finance, as our Executive Vice President--Asset Management.
Conservative Financial Strategy and Balance Sheet Flexibility
AsIn December 2013, our credit rating was upgraded which decreased the interest rate on our variable rate term loans and revolving credit facility. Taking into account the January 2014 amendment to the unsecured credit agreement, the total interest expense savings on the current outstanding balances on these facilities is expected to be approximately $2.5 million in 2014.
In January 2013, HTA launched a $250.0 million equity ATM offering of its Class A common stock. In November 2013, HTA terminated the previous program and commenced a new ATM offering with an aggregate sales price of up to $300.0 million of its Class A common stock. During the year ended December 31, 2011,2013, HTA issued and sold approximately 21.9 million shares of its Class A common stock, at an average price of $11.22 per share.
In March 2013, we hadissued and sold $300.0 million of 10-year unsecured senior notes at a strong, flexible balance sheet with total assetsrate of $2,291,629,000, cash on hand3.70% per annum. We used some of $69,491,000, and a leverage ratiothe proceeds to pay-off the $125.5 million secured real estate term loan. This increased the weighted average remaining term of our mortgagedebt portfolio to 5.2 years including extension options and decreased the percentage of secured term loans payable debt, including net premiums to total assets of 27.9%capitalization, to 11.4%.
In May 2011,March 2013, we successfully increased our liquidity by expanding our unsecured revolving credit facility by $75.0 millionto an aggregate maximum principal$650.0 million.
As of $575,000,000 from $275,000,000 as well as extended its maturity date from November 2013 to May 2014.
In July 2011, we received ratings by two nationally recognized rating agencies. We believe these ratings, along with our strong balance sheet and conservative leverage, will allow us access to multiple sources of liquidity, such as unsecured bank debt, mortgage financing, and public debt.
We completed the sale of 21,564,900 shares of our common stock for $215,649,000 during the first quarter of 2011 pursuant to our follow-on offering and closed this offering on February 28, 2011, except for the DRIP.
During the year ended December 31, 2011,2013, we repaid fourhad total liquidity of our variable rate secured loans, which had an aggregate principal balance$613.1 million, including cash and cash equivalents of $83,886,000 at December 31, 2010. Going forward, we continue to focus on migrating our capital structure toward a higher volume of unsecured debt, which will be used to pay down our secured debt maturities$18.1 million and for future acquisitions.
Based$595.0 million available on our conservative and low-leveraged balance sheet with modest intermediate debt maturities, strong cash position, and full access to our $575,000,000 unsecured credit facility, as discussed below under "Financing", we have the capital capacity with increased leverage to acquire over $1,000,000,000 of medical office buildings and healthcare-related facilities (based on the current covenant requirements of our unsecured credit facility and assuming we utilize all of our cash, fully access our unsecured credit facility, and enter into new debt facilities on additional asset purchases). This strong degree of financial flexibility provides us the capacity to continue to execute a prudent growth strategy through disciplined selection of acquisition opportunities. However, there can be no assurancewe will be able to obtain such leverage or acquire such properties on attractive terms or at all.
In February 2012, JP Morgan, Deutsche Bank, and Wells Fargo signed engagement letters to serve as Joint Lead Arrangers for a new unsecured credit facility of at least $825,000,000, consisting of a $575,000,000 revolving tranche and a $250,000,000 term loan tranche. As of March 23, 2012, the Joint Lead Arrangers and other additional lenders had committed in excess of that amount to the new credit facility. This credit facility will replace our existing credit facility. It will have an initial termOur leverage ratio of 4 years, with one twelve-month extension. We anticipate closing the facility in the near future. The terms of this facility have not been finalized and there can be no assurance that we will enter into such facility on the terms or timing described herein or at all.
Execution of Relationship-Focused Growth Strategy
During the year ended December 31, 2011, we completed two new portfolio acquisitions and expanded two of our existing portfolios through the purchase of additional medical office buildings within each for an aggregate purchase price of $68,314,000. These purchases consist of six buildings comprised of approximately 306,000 square feet of GLA, bringing our total portfolio value, based on purchase price,debt to $2,334,673,000 as of December 31, 2011.
On February 14, 2012, we completed the acquisition of St. John Providence MOB, an approximately 203,000 square foot on-campus medical office building located in Novi, Michigan in an all-cash transaction for approximately $51,320,000. The St. John Providence MOB, whichtotal capitalization was 99% leased as of the date of acquisition, is connected directly to the Providence Park Hospital via an enclosed walkway. Providence Park Hospital is part of Ascension Health Systems (Moody's Investors Servies rated Aa1)34.0%.
On March 6, 2012, we completed the acquisition of Penn Avenue Place in Pittsburgh, Pennsylvania for a purchase price of approximately $54,000,000 in an all-cash transaction. Penn Avenue Place is an eight story, 558,000 square foot, Class A office building which was completely renovated in 1997. The building is approximately 99.6% occupied as of the date of acquisition and is anchored by Highmark, Inc. (Standard & Poor's Rating Service rated A). Highmark, Inc., which leases and occupies 92.4% of the building, is one of the largest Blue Cross affiliates in the nation. On January 1, 2012, Highmark, Inc. renewed its lease for an additional 10-year term.
On March 9, 2012, we entered into a purchase and sale agreement for a medical office building portfolio located in the eastern United States for an aggregate purchase price of $100,000,000. The portfolio, which is expected to be master leased on a triple net basis, consists of a combination of on-campus assets and off-campus medical office buildings. We anticipate closing this acquisition in the near future, though there can be no assurance that the acquisition will close on the expected schedule, if at all.
Critical Accounting Policies
We believe that our critical accounting policies are those that require significant judgments and estimates such as those related to revenue recognition, allowance for uncollectible accounts, capitalization of expenditures, depreciation of assets, impairment of real estate, properties held for sale, purchase price allocation, and qualification as a REIT. These estimates are made and evaluated on an on-going basis using information that is currently available as well as recent various other assumptions believed to be reasonable under the circumstances.
Use of Estimates
The preparation of our consolidated financial statements in conformity with GAAPaccounting principles generally accepted in the United States of America requires management to makeuse judgment in the application of accounting principles, including making estimates and assumptions. We base our estimates on experience and various other assumptions thatwe believe are reasonable under the circumstances. These estimates affect the reported amountsamount of assets and liabilities, revenues and expenses, and relatedthe disclosure of contingent assets and liabilities. Theseliabilities at the date of the financial statements and the reported amount of revenues and expenses during the reporting periods. However, if our judgment or interpretation of the facts and circumstances relating to the various transactions or other matters had been different, it is possible that different accounting would have been applied, resulting in different presentation of our financial statements. We periodically reevaluate our estimates are made and evaluated on an on-going basis using information that is currently available as well as various other assumptions, believedand in the event they prove to be reasonable underdifferent from actual results, we make adjustments in subsequent periods to reflect more current estimates and assumptions about matters that are inherently uncertain. Below is a discussion of accounting policies that we consider critical as they may require more complex judgment in their application or require estimates about matters that are inherently uncertain. For more information regarding all our significant accounting policies, see Note 2 to the circumstances. Actual results could differ from those estimates, perhaps in adverse ways,accompanying consolidated financial statements.
Basis of Presentation
Our accompanying consolidated financial statements include our accounts and those estimates could be different under different assumptionsof our subsidiaries and any consolidated variable interest entities, or conditions.VIEs. All inter-company balances and transactions have been eliminated in the accompanying consolidated financial statements.
Revenue Recognition, Tenant Receivables and Allowance for Uncollectible Accounts
In accordance with ASC 840, Leases, orASC 840, minimumMinimum annual rental revenue is recognized on a straight-line basis over the term of the related lease (including rent holidays). Differences between rental income recognized and amountsamount contractually due under the lease agreements are credited or charged, as applicable, to straight-line rent receivable.receivables. Tenant reimbursement revenue, which is comprised of additional amounts recoverable from tenants for common area maintenance expenses and certain other recoverable expenses, is recognized as revenue in the period in which the related expenses are incurred. Tenant reimbursements are recognized and presented in accordance with ASC 605-45, Revenue — Principal Agent Considerations. This guidance requires that these reimbursements be recorded on a gross basis, as we are generally the primary obligor with respect to purchasing goods and services from third-party suppliers, have discretion in selecting the supplier and have credit risk. We recognize lease termination fees ifwhen there is a signed termination letter agreement, all of the conditions of the agreement have been met, and the tenant is no longer occupying the property. Rental income is reported net of amortization recorded on lease inducements.
Tenant receivables and unbilled deferredstraight-line rent receivables are carried net of the allowances for uncollectible current tenant receivables and unbilled deferred rent.amounts. An allowance is maintained for estimated losses resulting from the inability of certain tenants to meet the contractual obligations under their leases. We also maintain an allowance for deferred rent receivables arising from the straight-lining of rents. Such allowance is charged to bad debt expense which is included in general and administrative expenses on our accompanying consolidated statement of operations. Our determination of the adequacy of these allowances requires judgment and is based primarily upon evaluations of historical loss experience, the tenant’s financial condition, security deposits, letters of credit, lease guarantees and current economic conditions and other relevant factors. Our estimates may differ from actual results, which could significantly impact our consolidated financial statements.
CapitalizationReal Estate Acquisitions
With the assistance of Expendituresindependent valuation specialists, we record the purchase price of completed business acquisitions associated with tangible and Depreciationintangible assets and liabilities based on their fair values. Our method for recording the purchase price requires us to make significant estimates, which directly impacts our results of Assetsoperations, as amounts allocated to certain assets and liabilities have different depreciation and amortization lives. In addition, the amortization and depreciation of these assets and liabilities are recorded in different line items in our accompanying consolidated statements of operations.
The value of tangible assets (building and land) is based upon our determination of the value of the property as if it were to be replaced or as if it were vacant using discounted cash flow models similar to those used by market participants. Factors considered by us include an estimate of carrying costs during the expected lease-up periods considering current market conditions and costs to execute similar leases. Additionally, the purchase price of the applicable completed acquisition property is inclusive of above or below market leases, above or below market leasehold interests, in place leases, tenant relationships, above or below market debt assumed, interest rate swaps assumed and any contingent consideration.
The value of above or below market leases is determined based upon the present value (using a discount rate which reflects the risks associated with the acquired leases) of the difference between: (1) the contractual amounts to be received pursuant to the lease over its remaining term; and (2) our estimate of the amounts that would be received using fair market rates over the remaining term of the lease including any bargain renewal periods. The amounts associated with above market leases are included in other intangibles, net in our accompanying consolidated balance sheets and amortized to rental income over the remaining non-cancelable lease term of the acquired leases with each property. The amounts associated to below market leases are included in intangible liabilities, net in our accompanying consolidated balance sheets and amortized to rental income over the remaining non-cancelable lease term plus any below market renewal options of the acquired leases with each property.
The value associated with above or below market leasehold interests is determined based upon the present value (using a discount rate which reflects the risks associated with the acquired leases) of the difference between: (1) the contractual amounts to be paid pursuant to the lease over its remaining term; and (2) our estimate of the amounts that would be paid using fair market rates over the remaining term of the lease including any bargain renewal periods. The amounts recorded for above market leasehold interests are included in intangible liabilities, net in our accompanying consolidated balance sheets and amortized to rental expense over the remaining non-cancelable lease term of the acquired leases with each property. The amounts recorded for below market leasehold interests are included in other intangibles, net in our accompanying consolidated balance sheets and amortized to rental expense over the remaining non-cancelable lease term plus any below market renewal options of the acquired leases with each property.
The total amount of other intangible assets includes in place leases and tenant relationships based on our evaluation of the specific characteristics of each tenant’s lease and our overall relationship with that respective tenant. Characteristics considered by us in allocating these values include the nature and extent of the credit quality and expectations of lease renewals, among other factors. The amounts recorded to in place leases are included in lease intangibles in our accompanying consolidated balance sheets and will be amortized over the average remaining non-cancelable lease term of the acquired leases with each property. The amounts recorded to tenant relationships are included in lease intangible in our accompanying consolidated balance sheets and are amortized over the average remaining non-cancelable lease term of the acquired leases plus a market lease term.
The value recorded for above or below market debt is determined based upon the present value of the difference between the cash flow stream of the assumed mortgage and the cash flow stream of a market rate mortgage. The amounts recorded to above or below market debt are included in debt, net on our accompanying consolidated balance sheets and are amortized to interest expense over the remaining term of the assumed debt.
The value recorded to interest rate swaps is based upon a discounted cash flow analysis on the expected cash flows, taking into account interest rate curves and the period to maturity.
We record contingent consideration at fair value as of the acquisition date and reassess the fair value as of the end of each reporting period, with any changes being recognized in earnings.
Real Estate Investments
Operating properties are carried at the lower of historical cost less accumulated depreciation or fair value less costs to sell. The cost of operating properties includes the cost of land and completed buildings and related improvements. Expenditures that increase the service life of properties are capitalized and the cost of maintenance and repairs is charged to expense as incurred. The cost of building and improvementsbuildings is depreciated on a straight-line basis over the estimated useful lives of the buildings up to 39 years and for tenant improvements, the shorter of the lease term or useful life, ranging from one month to 240 months, respectively. Furniture, fixtures and equipment is depreciated over five years. When depreciable property is retired, replaced or disposed of, the related costs and accumulated depreciation are removed from the accounts and any gain or loss is reflected in operations.
InvestmentsReal Estate Held-for-Sale
We consider properties as held for sale once management commits to a plan to sell the property and has determined that the sale is probable and expected to occur within one year. Upon designation as held for sale, we record the property at the lower of its carrying amount or fair value, less costs to sell, and cease depreciation and amortization. The fair value is based on discounted cash flow analyses, which involve management’s best estimate of market participants’ holding period, market comparables, future occupancy levels, rental rates, capitalization rates, lease-up periods, and capital requirements. The results of operations of properties classified as held for sale are reflected as discontinued operations for all periods reported and the major classes of assets and liabilities are presented separately in the balance sheet.
Recoverability of Real Estate and Real Estate Related Assets
Our properties are carried at the lower of historical cost less accumulated depreciation or fair value less costs to sell (if classified as held-for-sale). We assess the impairment of a real estate asset when events or changes in circumstances indicate its carrying amount may not be recoverable. Indicators we consider important and that we believe could trigger an impairment review include the following:
significant negative industry or economic trends;
significant underperformance relative to historical or projected future operating results; and
a significant change in the manner in which the asset is used.
In the event that the carrying amount of a property exceeds the sum of the undiscounted cash flows (excluding interest) that would be expected to result from the use and eventual disposition of the property, we would recognize an impairment loss to the extent the carrying amount exceeds the estimated fair value of the asset group related to the property. The fair value of the property is based on discounted cash flow analyses, which involve management’s best estimate of market participants’ holding periods, market comparables, future occupancy levels, rental rates, capitalization rates, lease-up periods, and capital requirements. The estimation of expected future net cash flows is inherently uncertain and relies on subjective assumptions dependent upon future and current market conditions and events that affect the ultimate value of the property. It will require us to make assumptions related to future rental rates, tenant allowances, operating expenditures, property taxes, capital improvements, occupancy levels, and the estimated proceeds generated from the future sale of the property.
Also, we evaluate the carrying values of mortgage loansreal estate notes receivable on an individual basis. Management periodically evaluates the realizability of future cash flows from the mortgage loanreal estate notes receivable when events or circumstances, such as the non-receipt of principal and interest payments and/or significant deterioration of the financial condition of the borrower, indicate that the carrying amount of the mortgage loanreal estate notes receivable may not be recoverable. An impairment charge is recognized in current period earnings and is calculated as the difference between the carrying amount of the mortgage loanreal estate notes receivable and the discounted cash flows expected to be received, or if foreclosure is probable, the fair value of the collateral securing the mortgage.
Investment in Real Estate Held-for-Sale
We evaluate the held-for-sale classification of our owned real estate each quarter. Assets that are classified as held-for-sale are recorded atnotes receivable. For the lower of their carrying amount or fair value less cost to sell. The fair value is based on discounted cash flow analyses, which involve management’s best estimate of market participants’ holding period, market comparables, future occupancy levels, rental rates, capitalization rates, lease-up periods, and capital requirements. Assets are generally classified as held-for-sale once management commits to a plan to sell the properties and has determined that the sale of the asset is probable and transfer of the asset is expected to occur within one year. The results of operations of these real estate properties are reflected as discontinued operations in all periods reported, and the properties are presented separately on our balance sheet at the lower of their carrying value or their fair value less costs to sell. As ofyears ended December 31, 2013, 2012 and 2011, we determined thatthere were no building within our portfolio should be classified as held-for-sale.
Purchase Price Allocation
In accordance with ASC 805, Business Combinations, or ASC 805, we, with assistance from independent valuation specialists, allocate the purchase price of acquired properties to tangible and identified intangible assets and liabilities based on their respective fair values. The allocation to tangible assets (building and land) is based upon our determination of the value of the property as if it were to be replaced and vacant using discounted cash flow models similar to those used by independent appraisers. Factors considered by us include an estimate of carrying costs during the expected lease-up periods considering current market conditions and costs to execute similar leases. Additionally, the purchase price of the applicable property is allocated to the above or below market value of in place leases, the value of in place leases, tenant relationships and above or below market debt assumed.
The value allocable to the above or below market component of the acquired in place leases is determined based upon the present value (using a discount rate which reflects the risks associated with the acquired leases) of the difference between: (1) the contractual amounts to be paid pursuant to the lease over its remaining term; and (2) management’s estimate of the amounts that would be paid using fair market rates over the remaining term of the lease including any bargain renewal periods, with respect to a below market lease. The amounts allocated to above market leases are included in identified intangible assets, net in our accompanying consolidated balance sheets and amortized to rental income over the remaining non-cancelable lease term of the acquired leases with each property. The amounts allocated to below market lease values are included in identified intangible liabilities, net in our accompanying consolidated balance sheets and amortized to rental income over the remaining non-cancelable lease term plus any below market renewal options of the acquired leases with each property.impairment losses.
The total amount of other intangible assets acquired is further allocated to in place lease costs and the value of tenant relationships based on management’s evaluation of the specific characteristics of each tenant’s lease and our overall relationship with that respective tenant. Characteristics considered by us in allocating these values include the nature and extent of the credit quality and expectations of lease renewals, among other factors. The amounts allocated to in place lease costs are included in identified intangible assets, net in our accompanying consolidated balance sheets and will be amortized over the average remaining non-cancelable lease term of the acquired leases with each property. The amounts allocated to the value of tenant relationships are included in identified intangible assets, net in our accompanying consolidated balance sheets and are amortized over the average remaining non-cancelable lease term of the acquired leases plus a market lease term.
The value allocable to aboveRecently Issued or below market debt is determined based upon the present value of the difference between the cash flow stream of the assumed mortgage and the cash flow stream of a market rate mortgage. The amounts allocated to above or below market debt are included in mortgage loans payable, net on our accompanying consolidated balance sheets and amortized to interest expense over the remaining term of the assumed mortgage.
These allocations are subject to change based on information received within one year of the purchase related to one or more events identified at the time of purchase which confirm the value of an asset or liability received in an acquisition of property.
On January 1, 2009, in accordance with the provisions of ASC 805, Business Combinations, we began to expense acquisition-related costs for acquisitions. Prior to this date, acquisition-related expenses had been capitalized as part of the purchase price allocations. We expensed $2,130,000, $11,317,000 and $15,997,000 for acquisition related expenses during the years ended December 31, 2011, 2010, and 2009 respectively.
Qualification as a REIT
We believe that we have qualified to be taxed as a REIT under Sections 856 through 860 of the Code beginning with our taxable year ended December 31, 2007 and that our current and intended ownership and manner of operation will enable us to continue to meet the requirements for qualification and taxation as a REIT for U.S. federal income tax purposes. To continue to qualify as a REIT for federal income tax purposes, we must meet certain organizational and operational requirements, including a requirement to pay distributions to our stockholders of at least 90.0% of our annual taxable income. As a REIT, we generally are not subject to federal income tax on net income that we distribute to our stockholders.
As part of the process of preparing our consolidated financial statements, significant management judgment is required to evaluate our compliance with REIT requirements. Our determinations are based on interpretation of tax laws, and our conclusions may have an impact on income tax expense recognized. Adjustments to income tax expense recognized may be required as a result of, among other things, changes in tax laws or our ability to qualify as a REIT. If we fail to qualify as a REIT in any taxable year, we will then be subject to U.S. federal income taxes on our taxable income and will not be permitted to qualify for treatment as a REIT for U.S. federal income tax purposes for four years following the year during which qualification is lost unless the IRS grants us relief under certain statutory provisions. Such an event could have a material adverse effect on our business, financial condition, results of operations and net cash available for distribution to our stockholders.
Recently IssuedAdopted Accounting Pronouncements
See Note 2 Summary of Significant Accounting Policies, to our accompanying consolidated financial statements for a discussion of recently issued or adopted accounting pronouncements.
Acquisitions
See Note 3, Real Estate Investments, Net, and Note 22, Subsequent Events, to our accompanying consolidated financial statements for a discussion of our acquisitions during 2011 and 2010.
Status and Performance of Our Offerings
On February 28, 2011, we terminated our follow-on offering, except for the DRIP. In aggregate, we have accepted subscriptions in our initial and follow-on offerings for 220,673,545 shares of our common stock, for a total of $2,195,655,000, excluding shares of our common stock issued under the DRIP. We continue to offer shares pursuant to the DRIP; however, we may terminate the DRIP at any time.
Financing
Unsecured Credit Facility
On May 13, 2011, we increased the maximum aggregate principal amount available under our unsecured revolving credit facility, or the unsecured credit facility, from $275,000,000 to $575,000,000. Additionally, we extended the maturity date of the unsecured credit facility from November 2013 to May 2014. See Note 9, Revolving Credit Facility, to our accompanying consolidated financial statements, for further information regarding our unsecured revolving credit and term loan facility.
On July 21, 2011, we were assigned an investment-grade, BBB- corporate credit rating by Standard & Poor's Rating Services with a stable outlook. On July 21, 2011, our operating partnership was assigned a Baa3 issuer rating by Moody's Investors Service with a stable outlook. The ratings have changed the interest rate structure under our unsecured credit facility to one based on a corporate ratings-based pricing grid, with the potential to reduce borrowing costs. If our ratings are upgraded or downgraded, however, our interest rates and borrowing costs could be favorably or negatively impacted by such changes.
Secured Real Estate Term Loan
On February 1, 2011, we closed a senior secured real estate term loan in the amount of $125,500,000 from Wells Fargo Bank, National Association, or Wells Fargo Bank. The primary purposes of the term loan included refinancing four Wells Fargo Bank loans totaling approximately $89,969,000 and providing new financing on three of our existing properties. Interest is payable monthly at a rate of one-month LIBOR plus 2.35%, which equated to 2.67% as of December 31, 2011. Including the impact of the interest rate swap discussed below, the weighted average rate associated with this term loan is 3.10% per annum. This is lower than the weighted average rate of 4.18% per annum (including the impact of interest rate swaps) on the four refinanced loans. The term loan matures on December 31, 2013 and includes two 12-month extension options, subject to the satisfaction of certain conditions. The loan agreement for the term loan includes customary financial covenants for loans of this type, including a maximum ratio of total indebtedness to total assets, a minimum ratio of EBITDA to fixed charges, and a minimum level of tangible net worth. We believe we were in compliance with these financial covenants as of December 31, 2011. In addition, the term loan agreement for this secured term loan includes events of default that we believe are usual for loans and transactions of this type. The term loan is secured by 25 buildings within 12 property portfolios in 13 states and has a two year period in which no prepayment is permitted. Our operating partnership has guaranteed 25% of the principal balance and 100% of the interest under the term loan.
We have an interest rate swap with Wells Fargo Bank as counterparty for a notional amount of $75,000,000. The interest rate swap is secured by the pool of assets collateralizing the secured term loan. The effective date of the swap is February 1, 2011, and it matures no later than December 31, 2013. The swap serves to fix one-month LIBOR at 1.0725%, which when added to the spread of 2.35%, will result in a total interest rate of approximately 3.42% per annum for $75,000,000 of the term loan during the initial term.
Factors Which May Influence Results of Operations
We are not aware of any material trends or uncertainties, other than national economic conditions affecting real estate generally and those risks listed in Part I, Item 1A.1A Risk Factors, that may reasonably be expected to have a material impact, favorable or unfavorable, on revenues or income from the acquisition, management and operation of our properties.
Rental Income
The amount of rental income generated by our properties depends principally on our ability to maintain the occupancy rates of currently leased space and to lease currently available space and space that will become available from unscheduled lease terminations at the existing rental rates. Negative trends in one or more of these factors could adversely affect our rental income in future periods.
Offering ProceedsAcquisitions
WithDuring the terminationyear ended December 31, 2013, we completed ten acquisitions for an aggregate purchase price of our follow-on offering as$397.8 million. During the year ended year ended December 31, 2012, we completed six acquisitions for an aggregate purchase price of February 28, 2011, except for$294.9 million. During the DRIP, we will use other means such as debt financing, to finance our acquisition of new real estate assets. To the extent our portfolio is not sufficiently diversified, we could have increased exposure to local and regional economic downturns and the poor performance of one or more of our properties and, therefore, expose our stockholders to increased risk.
General and Administrative Expenses
Some of our general and administrative expenses are fixed regardless of the size of our real estate portfolio. Therefore, we could spend a larger portion of our income on operating expenses. This would reduce our profitability and, in turn, the amount of net income available for distribution to our stockholders.
Scheduled Lease Expirations
As ofyear ended December 31, 2011, the occupancy ratewe completed four acquisitions for an aggregate purchase price of $68.3 million. The amount of additional acquisitions could have a significant impact on our portfolioresults of properties, including leases signed, but which have not yet commenced, was 91%. Our leasing strategy for 2012 focuses on negotiating renewals for leases scheduled to expire during the remainder of the year. If we are unable to negotiate such renewals, we will try to identify new tenants or collaborate with existing tenants who are seeking additional space to occupy. Of the leases expiringoperations in 2012, we anticipate, but cannot provide assurance, that a majority of the tenants will renew for another term.future periods.
Results of Operations
Comparison of the Years Ended December 31, 2011, 2010,2013, 2012 and 20092011
Our operating results, as presented below, are primarily comprised of income derived from our portfolio of properties.
Except where otherwise noted, the change in our results of operations is primarily due to the aggregateincrease in the number of geographically diverse portfolio acquisitionsproperties that we had completed since our inception throughowned and operated. As of December 31, 2013, we owned and operated 269 medical office buildings and 19 other facilities that serve the endhealthcare industry, comprised of eachapproximately 14.1 million square feet of GLA. As of December 31, 2012, we owned and operated 247 medical office buildings and 19 other facilities that serve the periods discussed below: 79, 77 and 53 ashealthcare industry, comprised of approximately 12.6 million square feet of GLA. As of December 31, 2011, 2010,we owned and 2009, respectively. In addition,operated 230 medical office buildings and 19 other facilities that serve the healthcare industry, comprised of approximately $463,179,000, or 57%,11.2 million square feet of the $806,048,000 portfolio acquisitions that occurred during 2010 were completed during the fourth quarter of that year. Based on the timing of acquisitions over the past three years, our average invested assets (based on aggregate purchase price)GLA. Our occupancy rate as of December 31, 2013, 2012 and 2011 2010,was 91.6%, 91.1% and 2009 were $2,300,516,000, $1,863,335,000,91.1%, respectively. All explanations are applicable to both HTA and $1,230,416,000, respectively.HTALP unless otherwise noted.
NOI and Same-Property Adjusted NOI
In addition, at the beginning of the three year period discussed below, we were initially an externally managed company until we completed our transitionNOI increased $19.9 million to self-management in the third quarter of 2009. The transition to self management significantly decreased our overall cost structure by eliminating the acquisition, asset management and property management fees we previously paid our former advisor. Such transition resulted in adding costs related to management and employee salaries, share-based compensation and corporate office overhead to our general and administrative cost structure. Such costs were approximately 53% and 58% of our total general and administrative expense$224.3 million for the yearsyear ended December 31, 20112013, as compared to the year ended December 31, 2012. The increase was primarily due to the $10.2 million of NOI from our 2013 acquisitions and 2010, respectively.the decrease in operating expenses as a result of operating efficiencies from the transition of additional properties to our in-house property management and leasing platform. Same-Property Adjusted NOI increased $5.1 million to $180.2 million for the year ended December 31, 2013, as compared to the year ended December 31, 2012. The increase was primarily the result of rent escalators and the decrease in property operating expenses as a result of operating efficiencies from the transition of additional properties to our in-house property management and leasing platform.
NOI increased $18.7 million to $204.3 million for the year ended December 31, 2012, as compared to the year ended December 31, 2011. The increase was primarily due to the $17.6 million of NOI from our 2012 acquisitions. Same-Property Adjusted NOI increased $3.4 million to $172.6 million for the year ended December 31, 2012, as compared to the year ended December 31, 2011. The increase was primarily the result of rent escalators and the decrease in property operating expenses as a result of operating efficiencies from the transition of additional properties to our in-house property management and leasing platform.
Rental Income
For the years ended December 31, 2011, 2010,2013, 2012 and 2009,2011, rental income attributable to our properties was $269,646,000, $195,496,000,$317.3 million, $293.1 million and $126,333,000, respectively. For$267.4 million, respectively, and was comprised of the following (in thousands):
|
| | | | | | | | | | | |
| | Year Ended December 31, |
| | 2013 | | 2012 | | 2011 |
| Contractual rental income | $ | 307,734 |
| | $ | 282,213 |
| | $ | 252,988 |
|
| Straight-line rent | 8,146 |
| | 9,892 |
| | 12,425 |
|
| Other operating revenue | 1,461 |
| | 971 |
| | 1,972 |
|
| Total | $ | 317,341 |
| | $ | 293,076 |
| | $ | 267,385 |
|
Contractual rental income for the year ended December 31, 2011,2013 increased $25.5 million as compared to 2012, primarily due to $14.3 million of contractual revenue from the 2013 acquisitions and contractual rent increases, partially offset by a decrease in reimbursement revenue due to the decrease in rental expenses as discussed below. Contractual rental income was primarily comprised of contractual rental income of $255,398,000, straight-line rent of $12,345,000 and other operating revenue of $1,903,000. Forfor the year ended December 31, 2010, rental income was2012 increased $29.2 million, as compared to 2011, primarily compriseddue to $24.8 million of contractual rental income of $187,880,000, straight-linerevenue from the 2012 acquisitions and contractual rent of $8,154,000 and other operating revenue of $462,000. For the year ended December 31, 2009, rental income was primarily comprised of contractual rental income of $120,043,000, straight-line rent of $5,517,000 and other operating revenue of $773,000. The increase in rental income from period to period is due to the increase in the number of properties in our portfolio discussed above.
The aggregate occupancy for our operating properties was approximately 91% as of December 31, 2011, 2010, and 2009.increases.
Rental Expenses
For the years ended December 31, 2011, 2010,2013, 2012 and 2009,2011, rental expenses attributable to our properties were $88,760,000, $65,662,000,$97.1 million, $95.0 million and $45,024,000,$88.5 million, respectively. The $2.0 million increase in rental expenses from periodfor the year ended December 31, 2013, as compared to period2012, is primarily due to the $5.2 million of rental expenses associated with the 2013 acquisitions, partially offset by operating efficiencies as a result of transition of additional properties to our in-house asset management platform and the movement of certain operating expenses to direct tenant obligations. The $6.6 million increase in the number of properties in our portfolio discussed above. Rentalrental expenses as a percentage of rental income were 32.9%, 33.6% and 35.6% for the yearsyear ended December 31, 2012, as compared to 2011, 2010, and 2009. The decrease inis primarily due to the $9.2 million of rental expenseexpenses associated with the 2012 acquisitions, partially offset by operating efficiencies as a percentage of rental income is generally due to bringing more of our properties into our regionally-focused property management platform with HTA-dedicated property management personnel.
Rental expenses consistedresult of the following for the periods then ended:
|
| | | | | | | | | | | | | | | | | | | | | |
| | | Years Ended December 31, | | |
| | | 2011 | | % of Total | | 2010 | | % of Total | | 2009 | | % of Total |
| Real estate taxes | | $ | 29,606,000 |
| | 33.3 | % | | $ | 19,857,000 |
| | 30.2 | % | | $ | 14,571,000 |
| | 32.3 | % |
| Utilities | | 19,142,000 |
| | 21.5 |
| | 14,679,000 |
| | 22.4 |
| | 9,771,000 |
| | 21.7 |
|
| Building maintenance | | 17,205,000 |
| | 19.4 |
| | 15,461,000 |
| | 23.5 |
| | 9,099,000 |
| | 20.2 |
|
| Property management fees | | 3,692,000 |
| | 4.2 |
| | 2,786,000 |
| | 4.2 |
| | 3,042,000 |
| | 6.7 |
|
| Administration | | 4,547,000 |
| | 5.1 |
| | 4,186,000 |
| | 6.4 |
| | 3,273,000 |
| | 7.3 |
|
| Grounds maintenance | | 4,522,000 |
| | 5.1 |
| | 3,530,000 |
| | 5.4 |
| | 2,058,000 |
| | 4.6 |
|
| Non-recoverable operating expenses | | 7,702,000 |
| | 8.7 |
| | 3,370,000 |
| | 5.1 |
| | 2,061,000 |
| | 4.6 |
|
| Insurance | | 1,405,000 |
| | 1.6 |
| | 1,292,000 |
| | 2.0 |
| | 982,000 |
| | 2.2 |
|
| Other | | 939,000 |
| | 1.1 |
| | 501,000 |
| | 0.8 |
| | 167,000 |
| | 0.4 |
|
| Total rental expenses | | $ | 88,760,000 |
| | 100.0 | % | | $ | 65,662,000 |
| | 100.0 | % | | $ | 45,024,000 |
| | 100.0 | % |
transition of additional properties to our in-house asset management platform.
General and Administrative Expenses
For the years ended December 31, 2011, 2010,2013, 2012 and 2009,2011, general and administrative expenses were $28,695,000, $18,753,000,$24.4 million, $21.7 million and $12,285,000,$20.9 million, respectively. General and administrative expenses include such costs as salaries, share-based compensation expense, corporate office overhead, professional and legal fees, and investor services expense, among others.
In 2010, as noted above, we completed $806,048,000 in acquisitions, increasing the size of our company by 55%. More than half of the acquisitions were made in the fourth quarter of 2010. As a result, $7,132,000 of theThe increase in general and administrative expenses for the year ended December 31, 2013, as compared to 2012, is primarily related to certain expenses associated with our transition to a publicly traded company and some additional expense associated with the transition of seven new markets to our in-house leasing platform. The increase in general and administrative expenses for the year ended December 31, 2012, as compared to 2011, was primarily related to the significant organizational growth and expansion of our operations. In addition, during 2011, we focused on developing our HTA dedicated property management platform and established our regional offices in Indianapolis and Charleston to support our national platform. Also during 2011, we experienced a one-time change in accounting for our investor services costs in the amount of approximately $2,811,000 due to the close of the primary offering component of our follow-on offering in February 2011. These non-traded REIT-related investor services costs were included in general and administrativecertain expenses rather than in offering costs within equity in 2011 as compared to 2010. We believe our general and administrative expenses as a percentage of our net operating income, on average, are consistentassociated with the other medical office building-focused public company peers.
For the year ended December 31, 2010, as compared to the year ended December 31, 2009, the increase in total general and administrative expenses of $6,468,000 was driven primarily by having a full year of organizational costs resulting from our transition to self-management compared to only a partial year of self-managementpublicly traded company. We became a publicly traded company in 2009.June 2012.
Asset Management FeesNon-Traded REIT Expenses
For the years ended December 31, 2013, 2012 and 2011, 2010,non-traded REIT expenses were $0.0 million, $4.3 million and 2009, asset management fees attributable to our properties were $0, $0,$7.8 million, respectively. Non-traded REIT expenses primarily included stockholder services costs and $3,783,000, respectively.share-based compensation expense. Stockholder services included the printing and mailing of stockholder statements, the maintenance of an online investor portal, and other significant mailings and promotional investor materials traditionally borne by an advisor, which we did not have. The decrease in asset management fees fornon-traded REIT expenses year to year is a result of HTA’s listing on the years ended December 31, 2011 and 2010, as comparedNYSE in June 2012. The listing allowed our individual stockholders to transfer their shares of HTA common stock to their personal brokerage accounts. As a result of the year ended December 31, 2009, was duetransfer of the shares of common stock to brokerage accounts, we no longer needed to provide stockholder services. Share-based compensation expense of awards to our transitionexecutives and Directors were recorded in non-traded REIT expenses as those awards were applicable to a self-managed cost structure from an externally managed cost structure. We no longer pay asset management feespast service relative to our former advisor pursuant tonon-traded REIT status. Upon the advisory agreement, which expired on September 20, 2009.listing, all unvested awards were accelerated and the associated expense was recorded in listing expense.
Acquisition-Related Expenses
For the years ended December 31, 2011, 2010,2013, 2012 and 2009,2011, acquisition-related expenses attributablewere $7.5 million, $8.8 million and $2.1 million, respectively. The decrease in acquisition-related expenses for the year ended December 31, 2013, as compared to our properties were $2,130,000, $11,317,0002012, is primarily due to certain acquisition related payments in 2012, partially offset by increased acquisition activity in 2013. The increase in acquisition-related expenses activity for the year ended December 31, 2012, compared to 2011, is primarily due to increased acquisition activity and $15,997,000, respectively. Acquisition-related expenses were expensed as incurred for acquisitions forcertain acquisition related payments in 2012. During the years ended December 31, 2013, 2012 and 2011, 2010, and 2009 in accordance with ASC 805 and relate specifically to the number ofwe completed acquisitions in each year as discussed above.
Depreciation and Amortization Expense
For the years ended December 31, 2011, 2010,2013, 2012 and 2009,2011, depreciation and amortization attributable to our propertiesexpense was $107,542,000, $78,561,000$121.5 million, $115.5 million and $53,595,000, respectively. See Note 3, Real Estate Investments, Net to our accompanying consolidated financial statements for further information on depreciation of our properties. For information regarding the amortization recorded on our identified intangible assets and lease commissions, see Note 5, Identified Intangible Assets, Net and Note 6, Other Assets, Net, to our accompanying consolidated financial statements$106.6 million, respectively. The increase in depreciation and amortization expense from periodyear to periodyear was primarily due to the increase in the size of our portfolio over the respective periods, as discussed above.portfolio.
Listing Expenses
One-time Redemption, Termination, and Release Payment Made to Former Advisor
For the yearyears ended December 31, 2010, we recorded a one-time redemption, termination,2013, 2012 and release payment made to our former advisor,2011, listing expenses were $4.4 million, $22.6 million and $0.0 million, respectively. Listing expenses primarily included professional fees and share-based compensation expense associated with the LTIP awards that were granted in connection with the listing and the acceleration of which $7,285,000 was charged to operating expense. This pertained to an agreement entered into with our former advisor that served to purchaseequity awards as discussed above in non-traded REIT expenses. As result of the limited partner interest held by our former advisor, including all associated rights, as well as resolve all remaining issues between the parties. See Note 12, Related Party Transactions, to our accompanying consolidated financial statements for further information regarding this agreement and associated payment to our former advisor.
listing in June 2012, listing expenses were higher 2012 than in 2013.
Interest Expense and Net Change in Fair Value of Derivative Financial Instruments
For the years ended December 31, 2011, 2010, and 2009, interestInterest expense which included amortization of deferred financing costs and debt premium/discount, and net change in the fair value of derivative financial instruments associated with our properties were $41,892,000, $29,541,000for the years ended December 31, 2013, 2012 and $23,824,000, respectively. Interest2011, consisted of the following (in thousands):
|
| | | | | | | | | | | |
| | Year Ended December 31, |
| | 2013 | | 2012 | | 2011 |
| Interest expense related to our derivative financial instruments | $ | 5,314 |
| | $ | 4,944 |
| | $ | 1,423 |
|
| Net (gain) loss on change in fair value of derivative financial instruments | (10,796 | ) | | 7,667 |
| | 856 |
|
| Total | (5,482 | ) | | 12,611 |
| | 2,279 |
|
| Interest expense related to our debt | 40,791 |
| | 34,010 |
| | 33,563 |
|
| Amortization of deferred financing costs and debt discount/premium | 3,747 |
| | 3,673 |
| | 3,089 |
|
| Unused credit facility fees | 2,403 |
| | 2,185 |
| | 2,388 |
|
| Total | 46,941 |
| | 39,868 |
| | 39,040 |
|
| Total interest expense and net change in fair value of derivative financial instruments | $ | 41,459 |
| | $ | 52,479 |
| | $ | 41,319 |
|
Total interest expense and net change in the fair value of derivative financial instruments associated with our properties consisted ofdecreased during the following for the periods then ended:
|
| | | | | | | | | | | | |
| | | Years Ended December 31, |
| | | 2011 | | 2010 | | 2009 |
| Interest expense on our mortgage and secured term loans payable and credit facility | | $ | 34,048,000 |
| | $ | 23,892,000 |
| | $ | 16,835,000 |
|
| Amortization of deferred financing costs associated with our mortgage loans payable | | 2,001,000 |
| | 1,693,000 |
| | 1,504,000 |
|
| Amortization of deferred financing fees associated with our credit facility | | 1,627,000 |
| | 501,000 |
| | 381,000 |
|
| Amortization of debt discount/premium | | (451,000 | ) | | 395,000 |
| | 276,000 |
|
| Unused credit facility fees | | 2,388,000 |
| | 244,000 |
| | 150,000 |
|
| Total interest expense | | 39,613,000 |
| | 26,725,000 |
| | 19,146,000 |
|
| Interest expense related to our derivative financial instruments and net change in fair value of derivative financial instruments | | 2,279,000 |
| | 2,816,000 |
| | 4,678,000 |
|
| Total interest expense and net change in fair value of derivative financial instruments | | $ | 41,892,000 |
| | $ | 29,541,000 |
| | $ | 23,824,000 |
|
The increase in interest expense for the year ended December 31, 20112013, as compared to 2012, primarily due to the net change in the fair value of derivative financial instruments, partially offset due to the increase in debt. During the year ended December 31, 20102013, the fair market value of our derivatives increased $10.8 million, as compared to net decreases of $7.7 million during 2012. This was due to an increase in average outstanding mortgage loans payable and outstanding balance on our unsecured revolving credit facilityprimarily the result of $669,338,000a higher LIBOR yield curve during 2013, which favorably impacted the fair market value. Debt as of December 31, 20112013 increased by $176.9 million compared to $619,777,000 as of December 31, 2010. Additionally,2012. Total interest expense and net change in the fair value of derivative financial instruments increased during the year ended December 31, 2012, as compared to 2011, we incurred higher unused credit facility fees as a result of the higher maximum principal amount of $575,000,000 on our unsecured credit facility relativeprimarily due to the prior year. Finally, during the year ended December 31, 2011, we recognized a net loss on the change in the fair value of derivative financial instruments due to a net non-cash mark to market adjustment we made to our derivative financial instruments of $(856,000) as compared to a net gain onand the changeincrease in fair value of our derivative financial instruments of $6,095,000 duringdebt. During the year ended December 31, 2010.
The increase in interest expense for2012, the year ended December 31, 2010fair market value of our derivatives decreased $7.7 million as compared to the year ended December 31, 2009 was due to an increase in average outstanding mortgage loans payable and outstanding balance on our unsecured revolving credit facility of $619,777,000$0.9 million during 2011. Debt as of December 31, 20102012 increased by $398.2 million, as compared to $500,395,000debt as of December 31, 2009. Additionally, during the year ended December 31, 2010, we terminated two of our interest rate swap derivative financial instruments with an aggregate notional amount of $27,200,000 in conjunction with our prepayment of certain loan balances. There was no earnings impact to these terminations since they had previously been adjusted to their fair value in a prior quarter.2011.
We use interest rate swaps in order to minimize the impact of fluctuations in interest rates. To achieve our objectives, we borrow at fixed rates and variable rates. We also enter into derivative financial instruments, such as interest rate swaps, in order to mitigate our interest rate risk on a related financial instrument. We do not enter into derivative or interest rate transactions for speculative purposes. Derivatives not designated as hedges are not speculative and are used to manage our exposure to interest rate movements.
Interest and Dividend IncomeDebt Extinguishment Costs
For the years ended December 31, 2011, 2010, and 2009, interest and dividend income was $174,000, $119,000 and $249,000, respectively. For the years ended December 31, 2011 and 2010, interest and dividend income was related primarily to interest earned on our money market and cash accounts. For the year ended December 31, 2009,2012, debt extinguishment costs were $1.9 million as a result of the early retirement of certain mortgage loans during 2012. There were no debt extinguishment costs during 2013 or 2011.
Non-GAAP Financial Measures
Funds from Operations (FFO) and Normalized FFO
We compute FFO in accordance with the current standards established by the National Association of Real Estate Investment Trusts, or NAREIT. NAREIT defines FFO, as net income or loss attributable to common stockholders/unitholders (computed in accordance with GAAP), excluding gains or losses from sales of property and impairment write-downs of depreciable assets, plus depreciation and amortization, and after adjustments for unconsolidated partnerships and joint ventures. We present this non-GAAP financial measure because we consider it an important supplemental measure of our operating performance and believe it is frequently used by securities analysts, investors and other interested parties in the evaluation of REITs. Historical cost accounting assumes that the value of real estate assets diminishes ratably over time. Since real asset values have historically risen or fallen based on market conditions, many industry investors have considered presentation of operating results for real estate companies that use historical cost accounting to be insufficient by themselves. Because FFO excludes depreciation and amortization unique to real estate, among other items, it provides a perspective not immediately apparent from net income or loss attributable to common stockholders/unitholders.
Our methodology for calculating FFO may be different from methods utilized by other REITs and, accordingly, may not be comparable to such other REITs. FFO should not be considered as an alternative to net income or loss attributable to common stockholders/unitholders (computed in accordance with GAAP) as an indicator of our financial performance or to cash flow from operating activities (computed in accordance with GAAP) as an indicator of our liquidity, nor is it indicative of sufficient cash flow to fund all of our needs. FFO should be reviewed in connection with other GAAP measurements.
We also compute Normalized FFO, which excludes from FFO acquisition-related expenses, listing expenses, net gain or loss on change in fair value of derivative financial instruments, noncontrolling income from partnership units included in diluted shares (only applicable to HTA), transitional expenses, debt extinguishment costs and other normalizing items. We present this non-GAAP financial measure because it allows for the comparison of our operating performance to other REITs and between periods on a consistent basis. Our methodology for calculating Normalized FFO may be different from the methods utilized by other REITs and, accordingly, may not be comparable to such other REITs. Normalized FFO should not be considered as an alternative to net income or loss attributable to common stockholders/unitholders (computed in accordance with GAAP) as an indicator of our financial performance or to cash flows from operating activities (computed in accordance with GAAP) as an indicator of our liquidity, nor is it indicative of sufficient cash flow to fund our needs. Normalized FFO should be reviewed in connection with other GAAP measurements.
The amounts included in the calculation of FFO and Normalized FFO are generally the same for HTALP and HTA, except for net income or loss attributable to common stockholders/unitholders, noncontrolling income from partnership units included in diluted shares (only applicable to HTA) and the weighted average number of shares or units outstanding.
The following is the reconciliation of HTA’s FFO and Normalized FFO to net income or loss attributable to common stockholders for the years ended December 31, 2013, 2012 and 2011 (in thousands, except per share data): |
| | | | | | | | | | | |
| | Year Ended December 31, |
| | 2013 | | 2012 | | 2011 |
| Net income (loss) attributable to common stockholders | $ | 24,261 |
| | $ | (24,424 | ) | | $ | 5,541 |
|
| Depreciation and amortization expense (including amounts in discontinued operations) | 121,647 |
| | 116,418 |
| | 107,542 |
|
| FFO | $ | 145,908 |
| | $ | 91,994 |
| | $ | 113,083 |
|
| FFO per share - basic | $ | 0.64 |
| | $ | 0.41 |
| | $ | 0.51 |
|
| FFO per share - diluted | $ | 0.63 |
| | $ | 0.41 |
| | $ | 0.50 |
|
| Acquisition-related expenses | 7,523 |
| | 8,843 |
| | 2,130 |
|
| Listing expenses | 4,405 |
| | 22,573 |
| | — |
|
| Net (gain) loss on change in fair value of derivative financial instruments | (10,796 | ) | | 7,667 |
| | 856 |
|
| Noncontrolling income from partnership units included in diluted shares | 371 |
| | 16 |
| | 22 |
|
| Transitional expenses | — |
| | 2,197 |
| | — |
|
| Debt extinguishment costs | — |
| | 1,886 |
| | — |
|
| Other normalizing items | 423 |
| | 86 |
| | 287 |
|
| Normalized FFO | $ | 147,834 |
| | $ | 135,262 |
| | $ | 116,378 |
|
| Normalized FFO per share - basic | $ | 0.65 |
| | $ | 0.61 |
| | $ | 0.52 |
|
| Normalized FFO per share - diluted | $ | 0.64 |
| | $ | 0.61 |
| | $ | 0.52 |
|
| Weighted average number of common shares outstanding - basic | 228,075 |
| | 222,713 |
| | 223,900 |
|
| Weighted average number of common shares outstanding - diluted | 229,939 |
| | 222,869 |
| | 224,392 |
|
The following is the reconciliation of HTALP’s FFO and Normalized FFO to net income or loss attributable to common unitholders for the years ended December 31, 2013, 2012 and 2011 (in thousands, except per unit data): |
| | | | | | | | | | | |
| | Year Ended December 31, |
| | 2013 | | 2012 | | 2011 |
| Net income (loss) attributable to common unitholders | $ | 24,633 |
| | $ | (24,408 | ) | | $ | 5,563 |
|
| Depreciation and amortization expense (including amounts in discontinued operations) | 121,647 |
| | 116,418 |
| | 107,542 |
|
| FFO | $ | 146,280 |
| | $ | 92,010 |
| | $ | 113,105 |
|
| FFO per unit - basic | $ | 0.63 |
| | $ | 0.41 |
| | $ | 0.50 |
|
| FFO per unit - diluted | $ | 0.63 |
| | $ | 0.41 |
| | $ | 0.50 |
|
| Acquisition-related expenses | 7,523 |
| | 8,843 |
| | 2,130 |
|
| Listing expenses | 4,405 |
| | 22,573 |
| | — |
|
| Net (gain) loss on change in fair value of derivative financial instruments | (10,796 | ) | | 7,667 |
| | 856 |
|
| Transitional expenses | — |
| | 2,197 |
| | — |
|
| Debt extinguishment costs | — |
| | 1,886 |
| | — |
|
| Other normalizing items | 423 |
| | 86 |
| | 287 |
|
| Normalized FFO | $ | 147,835 |
| | $ | 135,262 |
| | $ | 116,378 |
|
| Normalized FFO per unit - basic | $ | 0.64 |
| | $ | 0.60 |
| | $ | 0.52 |
|
| Normalized FFO per unit - diluted | $ | 0.64 |
| | $ | 0.60 |
| | $ | 0.52 |
|
| Weighted average number of units outstanding - basic | 231,130 |
| | 224,681 |
| | 224,056 |
|
| Weighted average number of units outstanding - diluted | 231,130 |
| | 224,681 |
| | 224,056 |
|
Net Operating Income (NOI), Adjusted NOI and Same-Property Adjusted NOI
NOI is a non-GAAP financial measure that is defined as net income or loss (computed in accordance with GAAP), generated from our total portfolio of properties before general and administrative expenses, non-traded REIT expenses, acquisition-related expenses, depreciation and amortization expense, listing expenses, interest expense and dividendnet gain or loss on change in fair value of derivative financial instruments, debt extinguishment costs and other income was related primarilyor expense. We believe that NOI provides an accurate measure of the operating performance of our operating assets because NOI excludes certain items that are not associated with management of the properties. Additionally, we believe that NOI is a widely accepted measure of comparative operating performance of REITs. However, our use of the term NOI may not be comparable to that of other REITs as they may have different methodologies for computing this amount. NOI should be reviewed in connection with other GAAP measurements.
Adjusted NOI is a non-GAAP financial measure which excludes from NOI straight-line rent adjustments, amortization of acquired below and above market leases and lease termination fees. We believe that Adjusted NOI provides another measurement of the operating performance of our operating assets. Additionally, we believe that Adjusted NOI is a widely accepted measure of comparative operating performance of REITs. However, our use of the term Adjusted NOI may not be comparable to that of other REITs as they may have different methodologies for computing this amount. Adjusted NOI should not be considered as an alternative to net income or loss (computed in accordance with GAAP) as an indicator of our financial performance. Adjusted NOI should be reviewed in connection with other GAAP measurements.
To facilitate the comparison of Adjusted NOI between periods, we calculate comparable amounts for a subset of our owned properties referred to as “same-property.” Same-Property Adjusted NOI excludes properties recently acquired, disposed of, held for sale, notes receivable interest earned onincome and certain non-routine items. Same-Property Adjusted NOI should not be considered as an alternative to net income or loss (computed in accordance with GAAP) as an indicator of our money market accountsfinancial performance. Same-Property Adjusted NOI should be reviewed in connection with other GAAP measurements.
The following is the reconciliation of HTA’s and U.S. Treasury Bills.HTLPA’s NOI and Adjusted NOI to net income or loss for the years ended December 31, 2013, 2012 and 2011 (in thousands):
|
| | | | | | | | | | | |
| | Year Ended December 31, |
| | 2013 | | 2012 | | 2011 |
| Net income (loss) | $ | 24,684 |
| | $ | (24,368 | ) | | $ | 5,593 |
|
| General and administrative expenses | 24,448 |
| | 21,741 |
| | 20,879 |
|
| Non-traded REIT expenses | — |
| | 4,340 |
| | 7,816 |
|
| Acquisition-related expenses | 7,523 |
| | 8,843 |
| | 2,130 |
|
| Depreciation and amortization expense (including amounts in discontinued operations) | 121,647 |
| | 116,418 |
| | 107,542 |
|
| Listing expenses | 4,405 |
| | 22,573 |
| | — |
|
| Interest expense and the net change in fair value of derivative financial instruments (including amounts in discontinued operations) | 41,620 |
| | 52,993 |
| | 41,892 |
|
| Debt extinguishment costs | — |
| | 1,886 |
| | — |
|
| Other (income) expense | (42 | ) | | (89 | ) | | (174 | ) |
| NOI | $ | 224,285 |
| | $ | 204,337 |
| | $ | 185,678 |
|
| Straight-line rent adjustments, net | (6,553 | ) | | (7,857 | ) | | (9,112 | ) |
| Amortization of acquired below and above market leases, net | 2,118 |
| | 2,203 |
| | 2,683 |
|
| Lease termination fees | (36 | ) | | (114 | ) | | (1,417 | ) |
| Adjusted NOI | $ | 219,814 |
| | $ | 198,569 |
| | $ | 177,832 |
|
The following is the reconciliation of HTA’s and HTLPA’s Same-Property Adjusted NOI to Adjusted NOI for the years ended December 31, 2013 and 2012 (in thousands):
|
| | | | | | | |
| | Year Ended December 31, |
| | 2013 | | 2012 |
| Adjusted NOI | $ | 219,814 |
| | $ | 198,569 |
|
| Notes receivable interest income | (2,267 | ) | | (4,164 | ) |
| Non Same-Property Adjusted NOI | (37,355 | ) | | (19,303 | ) |
| Same-Property Adjusted NOI | $ | 180,192 |
| | $ | 175,102 |
|
The following is the reconciliation of HTA’s and HTLPA’s Same-Property Adjusted NOI to Adjusted NOI for the years ended December 31, 2012 and 2011 (in thousands):
|
| | | | | | | |
| | Year Ended December 31, |
| | 2012 | | 2011 |
| Adjusted NOI | $ | 198,569 |
| | $ | 177,832 |
|
| Notes receivable interest income | (4,164 | ) | | (4,424 | ) |
| Non Same-Property Adjusted NOI | (21,828 | ) | | (4,216 | ) |
| Same-Property Adjusted NOI | $ | 172,577 |
| | $ | 169,192 |
|
Liquidity and Capital Resources
We are dependent upon the proceeds from our operating cash flows the proceeds from debt, and the net proceeds from our offeringsdebt and equity to conduct our activities. We stopped offering shares in our primary offering as of February 28, 2011. We continue to offer shares pursuant to our DRIP; however, we may terminate our DRIP at any time. We may also conduct additional public offerings of our common stock in the future. Our ability to raise funds is dependent on general economic conditions, general market conditions for REITs, and our operating performance. Our total capacity to purchase real estate and other related assets is a function of our current cash position, our borrowing capacity on our unsecured revolving credit facility and from any from any future indebtedness that we may incur, and any possible future equity offerings. BecauseAs of December 31, 2013, we are no longer receiving offering proceeds from our primary offering, we will increasingly relyhad $595.0 million available on our operating cash flowsunsecured revolving credit facility. In January 2013, HTA commenced an equity ATM offering of its Class A common stock with an aggregate sales price of up to $250.0 million. During the year ended December 31, 2013, approximately 21.9 million shares of HTA’s Class A common stock were issued and borrowingssold, at an average price of $11.22 per share. In November 2013, HTA terminated the previous program and commenced a new ATM offering with an aggregate sales price of up to fund our acquisitions$300.0 million of its Class A common stock. As of December 31, 2013, $300.0 million remained available for sale under the new ATM offering program. Pursuant to HTALP’s partnership agreement, each time that HTA issues shares of common stock pursuant to an equity offering, HTALP issues to HTA an equal number of partnership units and satisfy our other capital needs.HTA contributes the net proceeds of such offerings to HTALP. In March 2013, we issued $300.0 million of unsecured senior notes bearing interest at 3.70% per annum, payable semi-annually, which were offered at 99.186% of the principal amount thereof.
Our principal demands for funds continuecontinues to be for acquisitions of real estatemedical office buildings and other real estate related assets, to payfacilities that serve the healthcare industry, and the payment of operating expenses, debt service payments, and principaldividends to our stockholders. Our credit rating upgrade in December 2013 reduced the borrowing rate and interestfacility fees on our outstanding indebtedness,variable rate term loans and revolving credit facility. The interest rate on $300.0 million of variable rate term loans was further reduced as a result of the amendment to repay our debt as appropriate, and to make distributions to our stockholders.the unsecured credit agreement that we executed in January 2014.
Generally, cash needs for items other than acquisitions of real estatemedical office buildings and other real estate related assetsfacilities that serve the healthcare industry continue to be met from operations and borrowings. We believe that these cash resources will be sufficient to satisfy our cash requirements for the foreseeable future, including our requirements to meet our debt maturities coming due during the year ending December 31, 2012, and we do not anticipate a need to, though we may, raise funds from other than these sources within the next 12 months.2014.
When we acquire a property, we prepare a capital plan that contemplates the estimated capital needs of that investment. In addition to operating expenses, capital needs may also include costs of refurbishment, tenant improvements or other major capital expenditures. The capital plan also sets forth the anticipated sources of the necessary capital, which may include a credit facility or other loan established with respect to the investment, operating cash generated by the investment, additional equity investments from us or joint venture partners or, when necessary, capital reserves. Any capital reserve would be established from the net proceeds of our offerings, proceeds from sales of other investments, operating cash generated by other investments, or other cash on hand. In some cases, a lender may require us to establish capital reserves for a particular investment. The capital plan for each investment will be adjusted through ongoing, regular reviews of our portfolio or as necessary to respond to unanticipated additional capital needs.
Other Liquidity Needs
In the event that there is a shortfall in net cash available due to various factors, including, without limitation, the timing of distributionsdividends or the timing of the collections of receivables, we may seek to obtain capital to pay distributionsdividends by means of secured or unsecured debt financing through one or more third parties or through offering proceeds, including DRIP proceeds. We may also pay distributionsdividends from cash from capital transactions, including, without limitation, the sale of one or more of our properties.
As of December 31, 2011,2013, we estimate that our expenditures for capital improvements for 2014 will require uprange from approximately $15.0 million to approximately $28,606,000, $14,000,000 of which is attributable to tenant improvements, for the coming 12 months.$25.0 million depending on leasing activity. As of December 31, 2011,2013, we had $8,979,000$9.5 million of restricted cash in loan impounds and reserve accounts for such capital expenditures. We cannot provide assurance, however, that we will not exceed these estimated expenditure levels or be able to obtain additional sources of financing on commercially favorable terms or at all. As of December 31, 2011,2013, we had $7.7 million of debt maturing in 2014. We will use cash flows from operations, cash on hand, our unsecured revolving credit facility, and any possible future debt or equity offerings to fund these debt maturities. As of December 31, 2013, we had cash and cash equivalents of approximately $69,491,000$18.1 million and had full access to$595.0 million available on our unsecured revolving credit facility in the amount of $575,000,000.facility. Additionally, as of December 31, 2011,2013, we had unencumbered properties with a gross book value of approximately $1,113,714,000$2.3 billion that may be used as collateral to secure additional financingfinancings in future periods or as additional collateral to facilitate the refinancing of current mortgage debt as it becomes due.
If we experience lower occupancy levels, reduced rental rates, reduced revenues as a result of asset sales, or increased capital expenditures and leasing costs compared to historical levels due to competitive market conditions for new and renewal leases, the effect would be a reduction of net cash provided by operating activities. If such a reduction of net cash provided by operating activities is realized, we may have a cash flow deficit in subsequent periods. Our estimate of net cash available is based on various assumptions which are difficult to predict, including the levels of leasing activity and related leasing costs. Any changes in these assumptions could impact our financial results and our ability to fund working capital and unanticipated cash needs.
Cash Flows
The following table sets forthis a summary of our sources and uses of cash flows for the yearsyear ended December 31, 20112013 and 2010:
|
| | | | | | | | | | |
| | Years Ended December 31, | | Change |
| | 2011 | 2010 | | $ |
| Cash and cash equivalents, beginning of period | $ | 29,270,000 |
| $ | 219,001,000 |
| | $ | (189,731,000 | ) |
| Net cash provided by operating activities | 111,807,000 |
| 58,503,000 |
| | (53,304,000 | ) |
| Net cash used in investing activities | (65,958,000 | ) | (626,849,000 | ) | | (560,891,000 | ) |
| Net cash provided by (used in) financing activities | (5,628,000 | ) | 378,615,000 |
| | 384,243,000 |
|
| Cash and cash equivalents, end of period | $ | 69,491,000 |
| $ | 29,270,000 |
| | $ | (40,221,000 | ) |
|
| | | | | | | | | | | |
| | Year Ended December 31, | | |
| | 2013 | | 2012 | | Change |
| Cash and cash equivalents - beginning of year | $ | 15,956 |
| | $ | 69,491 |
| | $ | (53,535 | ) |
| Net cash provided by operating activities | 147,824 |
| | 116,785 |
| | 31,039 |
|
| Net cash used in investing activities | (374,700 | ) | | (283,545 | ) | | (91,155 | ) |
| Net cash provided by financing activities | 229,001 |
| | 113,225 |
| | 115,776 |
|
| Cash and cash equivalents - end of year | $ | 18,081 |
| | $ | 15,956 |
| | $ | 2,125 |
|
CashNet cash provided by operating activities increased in 2013 primarily due to the $397.8 million of completed acquisitions during 2013, the full year impact of the $294.9 million of 2012 acquisitions and the costs incurred in 2012 associated with the listing. We anticipate cash flows from operating activities primarily increased in 2011 due to the operating income from our significant 2010 acquisitions being fully reflectedincrease with contractual rent increases and continued leasing activity in our operations for 2011. In addition, dueexisting portfolio and as we continue to a lower volume of acquisitions in 2011, acquisition costs were lower in 2011 compared to 2010. The increase in cash flows from operations in 2010 were primarily related to including the full year's impact of 2009 acquisitions and a partial year of 2010 acquisitions and partially offset by the one-time redemption, termination, and release payment made to our former advisor in the amount of $7,285,000.acquire more properties.
For the year ended December 31, 2011,2013, net cash flows used in investing activities primarily related primarily to the acquisition of real estate operating properties in the amountand other assets of $61,385,000$340.3 million and capital expenditures of $16,034,000, offset by the release of $14,463,000 in restricted cash related to our repayment of a mortgage loan payable and to the reimbursement of a deposit placed for one of our interest rate swaps upon collateralization of the underlying secured loan.$25.4 million. For the year ended December 31, 2010,2012, net cash flows used in investing activities primarily related primarily to cash paid for the acquisitionsacquisition of our 24 new property portfolios totaling $597,097,000.real estate operating properties and other assets of $257.4 million and capital expenditures of $22.9 million. We anticipate cash flows used in investing activities to increase as we purchase more properties.
For the year ended December 31, 2011,2013, net cash flows used inprovided by financing activities primarily related primarily to principal repaymentsnet proceeds from the issuance of $192,083,000unsecured senior notes of $297.6 million and from the net proceeds of shares of Class A common stock issued through the ATM of $240.7 million, partially offset by payments on our secured real estate term loan and mortgage loans payable,of $157.0 million, net payments made on our unsecured revolving credit facility of $7,000,000,$17.0 million, and dividends to holders of our common stock of $129.4 million. For the year ended December 31, 2012, net cash provided by financing activities primarily related to borrowings on our unsecured term loan of $455.0 million, partially offset by payment on our mortgage loans of offering costs$128.6 million, dividends to holders of $21,137,000 for our offerings, distributions to our stockholderscommon stock of $84,800,000,$93.3 million, and repurchase of common stock of $37,680,000, offset$182.6 million.
Dividends
The amount of dividends HTA pays to its stockholders is determined by its Board of Directors, in its sole discretion, and is dependent on a number of factors, including funds available, our financial condition, capital expenditure requirements and annual dividend distribution requirements needed to maintain our status as a REIT under the issuanceInternal Revenue Code of common stock1986, as amended. HTA has paid dividends monthly or quarterly since February 2007 and if our investments produce sufficient cash flow, we expect to continue to pay dividends to our stockholders. Because our cash available for dividend distributions in any year may be less than 90% of our taxable income for the year, we may obtain the necessary funds by borrowing, issuing new securities or selling assets to pay out enough of our taxable income to satisfy the dividend distribution requirement. HTA’s organizational documents do not establish a limit on dividends that may constitute a return of capital for federal income tax purposes. The dividend HTA pays to its stockholders is equal to the distributions received from HTALP according to the terms of HTALP’s partnership agreement.
In May 2012, HTA’s Board of Directors determined that it was in the best interest of our stockholders to pay quarterly dividends at an annualized rate of $0.575 per share. It is HTA’s intent to continue to pay dividends. However, our Board of Directors may reduce our dividend rate and HTA cannot guarantee the timing and amount of $214,641,000 and borrowings on our secured term loandividends paid in the amount of $125,500,000. Additional cash outflows related to debt financing costs of $3,401,000 in connection with the debt financing for our acquisitions and with the increase in our credit facility's aggregate maximum principal from $275,000,000 to $575,000,000, which occurred in May 2011. future, if any.
For the year ended December 31, 2010,2013, HTA paid cash flows provided by financing activities related primarilydividends of $129.4 million. On January 3, 2014, HTA paid cash dividends of $34.1 million for the quarter ending December 31, 2013. On February 17, 2014, HTA’s Board of Directors authorized a quarterly cash dividend of $0.14375 per share to funds raised from investors inbe paid on April 3, 2014 to stockholders of record on March 27, 2014.
Financing
We have historically maintained a low leveraged balance sheet and intend to maintain this structure over the amountlong run. However, our total leverage may fluctuate on a short term basis as we execute our business strategy. As of $594,677,000, borrowings on mortgage loans payableDecember 31, 2013, our leverage ratio of $79,125,000,total debt to total capitalization was 34.0%.
As of December 31, 2013, we had net debt outstanding of $1.2 billion and the payment of offering costs of $56,621,000 for our offerings, distributions of $60,176,000, and principal and demand note repayments of $123,117,000 on mortgage loans payable and demand notes payable. Additional cash outflows related to our purchasesweighted average interest rate, inclusive of the noncontrolling interests held by our former advisor and held by the joint venture entity that owns Chesterfield Rehabilitation for an aggregate amount of $4,097,000, as well as to debt financing costs of $7,507,000.
Distributions
The income tax treatment for distributions reportable for the years ended December 31, 2011, 2010, and 2009 was as follows:
|
| | | | | | | | | | | | | | | | | | | | | |
| | | Years Ended December 31, |
| | | 2011 | | 2010 | | 2009 |
| Ordinary income | | $ | 65,712,000 |
| | 40.9 | % | | $ | 47,041,000 |
| | 40.3 | % | | $ | 2,836,000 |
| | 3.6 | % |
| Return of capital | | 94,952,000 |
| | 59.1 |
| | 69,686,000 |
| | 59.7 |
| | 75,223,000 |
| | 96.4 |
|
| Total | | $ | 160,664,000 |
| | 100.0 | % | | $ | 116,727,000 |
| | 100.0 | % | | $ | 78,059,000 |
| | 100.0 | % |
See Item 5. Market for Registrant’s Common Equity, Related Stockholder Matters and Issuer Purchases of Equity Securities — Distributions, for a further discussionimpact of our distributions.
Capital Resources
Financing
We anticipate that our aggregate borrowings, both secured and unsecured, will approximate 30%-40% of allinterest rate swaps, was 3.95% per annum. The following is a summary of our properties’unsecured and mortgage loans receivables' combined fair market values, as determined at the end of each calendar year. For these purposes, the fair market value of each asset will be equal to the purchase price paid for the asset or, if the asset was appraised subsequent to the date of purchase, then the fair market value will be equal to the value reported in the most recent independent appraisal of the asset. Our policies do not limit the amount we may borrow with respect to any individual investment. As of December 31, 2011, our aggregate borrowings were 27.9% of net assets at December 31, 2011. Additionally, the $17,935,000 of mortgage notes payable on various of our properties which will mature in 2012 have a one-year extension option available, and the $125,500,000 secured real estate term loan, which matures in 2013, has two one-year extension options available. We anticipate utilizing the extensions available to us.
Our charter precludes us, until our shares are listed on a national securities exchange, from borrowing in excess of 300% of the value of our net assets, unless approved by a majority of our independent directors and the justification for such excess borrowing is disclosed to our stockholders in our next quarterly report. For purposes of this determination, net assets are our total assets, other than intangibles, calculated at cost before deducting depreciation, bad debt, and other similar non-cash reserves, less total liabilities and computed at least quarterly on a consistently-applied basis. Generally, the preceding calculation is expected to approximate 75.0% of the sum of the aggregate cost of our real estate and mortgage loans receivable before depreciation, amortization, bad debt, and similar non-cash reserves. As of March 23, 2012 and December 31, 2011, our leverage did not exceed 300% of the value of our net assets.
Mortgage Loans Payable, Net and Secured Real Estate Term Loan
debt. See Note 7, Mortgage Loans Payable, Net and Secured Real Estate Term Loan,8 to our accompanying consolidated financial statements, for a further discussion of our mortgagedebt.
Unsecured Revolving Credit Facility
In March 2013, we executed an amendment to our unsecured revolving credit agreement pursuant to an existing provision thereof and increased the amount available under our unsecured revolving credit facility by $75.0 million to $650.0 million. As of December 31, 2013, $595.0 million was available on our unsecured revolving credit facility. The unsecured revolving credit facility matures in March 2016 and includes a one-year extension, subject to certain conditions.
Unsecured Term Loans
As of December 31, 2013, we had $455.0 million of unsecured term loans outstanding, of which $300.0 million matures in March 2016 and $155.0 million matures in July 2019. Subsequent to December 31, 2013, the maturity of the $300.0 million term loan was extended to January 2018 and still includes a one-year extension, subject to certain conditions.
Unsecured Senior Notes
In March 2013, we issued $300.0 million of unsecured senior notes that mature in April 2023. The $300.0 million of unsecured senior notes bear interest at 3.70% per annum, payable netsemi-annually, and were offered at 99.186% of the principal amount thereof.
Secured Real Estate Term Loan and Mortgage Loans
In March 2013, we repaid in full and terminated our $125.5 million secured real estate term loan, which was obtained on February 1, 2011.
Revolving Credit Facility
See Note 9, Revolving Credit Facility, to our accompanying consolidated financial statements, for a further discussion of our unsecured revolving credit and term loan facility.
REIT Requirements
In order remain qualified as a REIT for federal income tax purposes, we are required to make annual distributions to our stockholders of at least 90.0% of REIT taxable income (determined beforeloan. During the deduction for dividends paid and excluding any net capital gain). In the event that there is a shortfall in net cash available due to factors including, without limitation, the timing of such distributions or the timing of the collections of receivables, we may seek to obtain capital to pay distributions by means of secured debt financing through one or more third parties. We may also pay distributions from cash from capital transactions including, without limitation, the sale of one or more of our properties. See Note 11, Commitments and Contingencies, to our accompanying consolidated financial statements regarding the closing agreement we entered into with the IRS.
Limitation on Total Operating Expenses
Our charter provides that our total operating expenses during any four consecutive fiscal quarters cannot exceed the greater of: (1) 2.0% of our average invested assets, as defined in our charter, or (2) 25.0% of our net income, as defined in our charter, for such year. Our board of directors is responsible for limiting our total operating expenses to that amount, unless a majority of our independent directors determine that such excess expenses are justified based on unusual and non-recurring factors and such excess expenses, if any, are disclosed in writing to our stockholders, together with an explanation of the factors the independent directors considered in determining that such excess amount was justified. Our total operating expenses did not exceed this limitation in 2011. Our total operating expenses as a percentage of our average invested assets for the year ended December 31, 2010 was 1.2%.2013, we made principal payments of $31.5 million on our mortgage loans and we have $7.7 million of principal payments due in 2014. During 2013, we assumed $52.7 million of mortgage loans as part of our acquisitions.
Commitments and Contingencies
See Note 11, Commitments and Contingencies,10 to our accompanying consolidated financial statements, for a further discussion of our commitments and contingencies.
Debt Service Requirements
One of our principal liquidity needs is the payment of principal and interest on outstanding indebtedness. As of December 31, 2011, we had fixed and variable rate mortgage loans payable and our secured real estate term loan outstanding in the aggregate principal amount of $639,149,000, including a premium of $2,591,000. We are required by the terms of theour applicable loan documents to meet certain financial covenants, such as a minimum net worth and liquidity, amount, as well asand reporting requirements. As of December 31, 2011,2013, we believe that we were in compliance with all such covenants and requirements on our mortgage loans payable and term loan.
Aswe are not aware of December 31, 2011, the balance on our unsecured revolving credit facility was zero. See Note 22, Subsequent Events, to our accompanying consolidated financial statements for information regarding our January and February draws of $27,000,000 and $55,000,000, respectively, on our unsecured revolving credit facility. Additionally, see Note 22 for discussion of our new proposed credit facility. As of December 31, 2011, we believeany covenants that it is reasonably likely that we were in compliance with all such covenants and requirements on our unsecured revolving credit facility.
As of December 31, 2011, the weighted average interest rate on our outstanding debt was 5.05% per annum.will not be able to meet.
Contractual Obligations
The table below presents our obligations and commitments to make future payments under our debt obligations and lease agreements as of December 31, 2011:2013 (in thousands):
|
| | | | | | | | | | | | | | | | | | | | |
| | | Payment Due by Period |
| | | Less than 1 Year | | 1-3 Years | | 3-5 Years | | More than 5 Years | | Total |
| Long-term debt | | |
| | |
| | |
| | |
| | |
|
| Fixed rate(1) | | $ | 39,606,000 |
| | $ | 76,984,000 |
| | $ | 177,321,000 |
| | $ | 167,337,000 |
| | $ | 461,248,000 |
|
| Variable rate(1) | | 39,955,000 |
| | 135,355,000 |
| | — |
| | — |
| | 175,310,000 |
|
| Interest(2) | | 31,755,000 |
| | 51,986,000 |
| | 32,354,000 |
| | 18,026,000 |
| | 134,121,000 |
|
| Credit facility borrowings | | — |
| | — |
| | — |
| | — |
| | — |
|
| Ground lease and other operating lease obligations(3) | | 3,062,000 |
| | 6,211,000 |
| | 5,422,000 |
| | 210,603,000 |
| | 225,298,000 |
|
| Total | | $ | 114,378,000 |
| | $ | 270,536,000 |
| | $ | 215,097,000 |
| | $ | 395,966,000 |
| | $ | 995,977,000 |
|
|
| | | | | | | | | | | | | | | | | | | |
| | Payment Due by Period |
| | Less than 1 Year | | 1-3 Years | | 3-5 Years | | More than 5 Years | | Total |
| Debt (1) | $ | 7,729 |
| | $ | 551,478 |
| | $ | 113,941 |
| | $ | 540,528 |
| | $ | 1,213,676 |
|
| Interest (2) | 43,442 |
| | 76,967 |
| | 52,033 |
| | 59,192 |
| | 231,634 |
|
| Ground lease and other operating lease obligations | 4,230 |
| | 8,425 |
| | 8,680 |
| | 272,992 |
| | 294,327 |
|
| Total | $ | 55,401 |
| | $ | 636,870 |
| | $ | 174,654 |
| | $ | 872,712 |
| | $ | 1,739,637 |
|
________________________
| |
| (1) | Long-termThe table does not reflect the one year extension on $355.0 million of our debt obligations are related to our fixed rate and variable rate mortgage loans payable.that matures in 2016. |
| |
| (2) | Interest on variable rate debt is calculated using the rates in effect at December 31, 2011.2013 and excludes the impact of our interest rate swaps. |
| |
(3) | Operating lease obligations include our corporate office location in Scottsdale, Arizona and our regional office location in Charleston, South Carolina. |
With respect to the debt service obligations shown above, the table does not reflect available extension options. We have a one-year extension available on the $17,935,000 of our debt that matures in 2012, and we have two one-year extensions available on the $125,500,000 of our debt that matures in 2013.
Off-Balance Sheet Arrangements
As of and during the year ended December 31, 2011 and 2010,2013, we had no off-balance sheet transactions nor do we currently have any such arrangements or obligations.arrangements.
Inflation
We are exposed to inflation risk as income from future long-term leases is the primary source of our cash flows from operations. There are provisions in the majority of our tenant leases that protect us from the impact of normal inflation. These provisions include rent escalations, reimbursement billings for operating expense pass-through charges, real estate tax and insurance reimbursements on a per square foot allowance. However, due to the long-term nature of the leases, among other factors, the leases may not re-set frequently enough to cover inflation.
Funds from Operations and Normalized Funds from Operations
We define funds from operations, or FFO, a non-GAAP measure, as net income or loss computed in accordance with GAAP, excluding gains or losses from sales of property and impairment write downs of depreciable assets, plus depreciation and amortization, and after adjustments for unconsolidated partnerships and joint ventures. Adjustments for unconsolidated partnerships and joint ventures are calculated to reflect FFO. We present FFO because we consider it an important supplemental measure of our operating performance and believe it is frequently used by securities analysts, investors and other interested parties in the evaluation of REITs, many of which present FFO when reporting their results. FFO is intended to exclude GAAP historical cost depreciation and amortization of real estate and related assets, which assumes that the value of real estate diminishes ratably over time. Historically, however, real estate values have risen or fallen with market conditions. Because FFO excludes depreciation and amortization unique to real estate, gains and losses from property dispositions and extraordinary items, it provides a performance measure that, when compared year over year, reflects the impact to operations from trends in occupancy rates, rental rates, operating costs, development activities and interest costs, providing perspective not immediately apparent from net income.
We compute FFO in accordance with the current standards established by the Board of Governors of the National Association of Real Estate Investment Trusts, or NAREIT, which may differ from the methodology for calculating FFO utilized by other equity REITs and, accordingly, may not be comparable to such other REITs. NAREIT recently issued updated reporting guidance that directs companies, for the computation of NAREIT FFO, to exclude impairments of depreciable real estate and impairments to investments in affiliates when write-downs are driven by measurable decreases in the fair value of depreciable real estate held by the affiliate. FFO does not represent amounts available for management's discretionary use because of needed capital replacement or expansion, debt service obligations or other commitments and uncertainties. FFO should not be considered as an alternative to net income (computed in accordance with GAAP) as an indicator of our financial performance or to cash flow from operating activities (computed in accordance with GAAP) as an indicator of our liquidity, nor is it indicative of funds available to fund our cash needs, including our ability to pay distributions.
Changes in the accounting and reporting rules under GAAP have prompted a significant increase in the amount of non-operating items included in FFO, as defined. Therefore, we use normalized funds from operations, or Normalized FFO, which excludes from FFO transition charges, acquisition-related expenses the net change in fair value of derivative financial instruments, and proceeds received from lease terminations, to further evaluate how our portfolio might perform after our acquisition stage is complete and the sustainability of our distributions in the future. Normalized FFO should not be considered as an alternative to net income or to cash flows from operating activities and is not intended to be used as a liquidity measure indicative of cash flow available to fund our cash needs, including our ability to make distributions. Normalized FFO should be reviewed in connection with other GAAP measurements. Management considers the following items in the calculation of Normalized FFO:
Acquisition-related expenses: Prior to 2009, acquisition-related expenses were capitalized and have historically been added back to FFO over time through depreciation; however, beginning in 2009, acquisition-related expenses related to business combinations are expensed. These acquisition-related expenses have been and will continue to be funded from the proceeds of our debt and our offerings and not from operations. We believe by excluding expensed acquisition-related expenses Normalized FFO provides useful supplemental information that is comparable for our real estate investments.
Transition-related charges: FFO includes certain charges related to the cost of our transition to self-management. These items include, but are not limited to, the majority of the one-time redemption and termination payment made to our former advisor, as further discussed in Note 12, Related Party Transactions, to our consolidated financial statements, as well as additional legal expenses, system conversion costs and non-recurring employment costs. Because Normalized FFO excludes such costs, management believes Normalized FFO provides useful supplemental information by focusing on the changes in our
fundamental operations that will be comparable rather than on such transition charges. We do not believe such costs will recur now that our transition to a self-management infrastructure has been completed.
Net change in fair value of derivative financial instruments: FFO includes a noncash charge representing the net change in fair value of our derivative financial instruments. Because Normalized FFO excludes this item, management believes Normalized FFO provides useful supplemental information as it allows for greater focus on the year over year changes that result from our core operational performance.
Lease termination fee revenue: FFO includes proceeds received as a result of early lease termination arrangements. Because Normalized FFO excludes this item, management believes Normalized FFO provides useful supplemental information as it allows for greater focus on the year over year changes that result from our core operational performance.
Our calculation of Normalized FFO may have limitations as an analytical tool because it reflects the costs unique to our transition to a self-management model, which may be different from that of other healthcare REITs. Additionally, Normalized FFO reflects features of our ownership interests in our medical office buildingsItem 7A. Quantitative and other facilities that serve the healthcare industry that are unique to us. Companies that are considered to be in our industry may not have similar ownership structures; and therefore those companies may not calculate Normalized FFO in the same manner that we do, or at all, limiting its usefulness as a comparative measure. We compensate for these limitations by relying primarily on our GAAP and FFO results and using our Normalized FFO as a supplemental measure.
The following is the calculation of FFO and Normalized FFO for the years ended December 31, 2011, 2010, and 2009:
|
| | | | | | | | | | | |
| | Years Ended December 31, |
| | 2011 | | 2010 | | 2009 |
| Net income (loss) | $ | 5,593,000 |
| | $ | (7,919,000 | ) | | $ | (24,773,000 | ) |
| Depreciation and amortization — consolidated properties | 107,542,000 |
| | 78,561,000 |
| | 53,595,000 |
|
| FFO | $ | 113,135,000 |
| | $ | 70,642,000 |
| | $ | 28,822,000 |
|
| FFO per share — basic | $ | 0.51 |
| | $ | 0.43 |
| | $ | 0.26 |
|
| FFO per share — diluted | $ | 0.50 |
| | $ | 0.43 |
| | $ | 0.26 |
|
| Acquisition-related expenses | 2,130,000 |
| | 11,317,000 |
| | 15,997,000 |
|
| Transition-related charges | — |
| | 8,400,000 |
| | 3,718,000 |
|
| Net change in fair value of derivative financial instruments | 856,000 |
| | (6,095,000 | ) | | (5,523,000 | ) |
| Lease termination fee revenue | (1,417,000 | ) | | (14,000 | ) | | (298,000 | ) |
| Normalized FFO | $ | 114,704,000 |
| | $ | 84,250,000 |
| | $ | 42,716,000 |
|
| Normalized FFO per share — basic and diluted | $ | 0.51 |
| | $ | 0.51 |
| | $ | 0.38 |
|
| Weighted average common shares outstanding — basic | 223,900,167 |
| | 165,952,860 |
| | 112,819,638 |
|
| Weighted average common shares outstanding — diluted | 224,391,553 |
| | 165,952,860 |
| | 112,819,638 |
|
For the years ended December 31, 2010 and 2009, Normalized FFO per share was impacted by the increase in net proceeds realized from our initial and follow-on offerings. For the year ended December 31, 2010, we sold 61,191,096 shares of our common stock, increasing our outstanding shares by 43.5%, and for the year ended December 31, 2009, we sold 62,696,254 shares of our common stock, increasing our outstanding shares by 83.1%.
Net Operating Income
Net operating income is a non-GAAP financial measure that is defined as net income (loss), computed in accordance with GAAP, generated from our total portfolio of properties before interest expense, general and administrative expenses, depreciation, amortization, acquisition-related expenses, and interest and dividend income. We believe that net operating income provides an accurate measure of the operating performance of our operating assets because net operating income excludes certain items that are not associated with management of the properties. Additionally, we believe that net operating income is a widely accepted measure of comparative operating performance in the real estate community. However, our use of the term net operating income may not be comparable to that of other real estate companies as they may have different methodologies for computing this amount.
To facilitate understanding of this financial measure, a reconciliation of net loss to net operating income has been provided for the years ended December 31, 2011, 2010, and 2009:
|
| | | | | | | | | | | | |
| | | Years Ended December 31, |
| | | 2011 | | 2010 | | 2009 |
| Net income (loss) | | $ | 5,593,000 |
| | $ | (7,919,000 | ) | | $ | (24,773,000 | ) |
| Add: | | |
| | |
| | |
|
| General and administrative expense | | 28,695,000 |
| | 18,753,000 |
| | 12,285,000 |
|
| Asset management fees | | — |
| | — |
| | 3,783,000 |
|
| Acquisition-related expenses | | 2,130,000 |
| | 11,317,000 |
| | 15,997,000 |
|
| Depreciation and amortization | | 107,542,000 |
| | 78,561,000 |
| | 53,595,000 |
|
| Interest expense | | 41,892,000 |
| | 29,541,000 |
| | 23,824,000 |
|
| One-time redemption, termination, and release payment to former advisor | | — |
| | 7,285,000 |
| | — |
|
| Less: | | |
| | |
| | |
|
| Interest and dividend income | | (174,000 | ) | | (119,000 | ) | | (249,000 | ) |
| Net operating income | | $ | 185,678,000 |
| | $ | 137,419,000 |
| | $ | 84,462,000 |
|
Subsequent Events
See Note 22, Subsequent Events, to our accompanying consolidated financial statements, for a further discussion of our subsequent events.
|
| |
Item 7A. | Quantitative and Qualitative Disclosures about Market Risk. |
Qualitative Disclosures About Market RiskMarket risk includes risks that arise from changes in interest rates, foreign currency exchange rates, commodity prices, equity prices and other market changes that affect market sensitive instruments. In pursuing our business plan, we believe the primary market risk to which we are exposedhave exposure to is interest rate risk.
We are exposed to the effects of interest rate changes primarily as a result of borrowings used to maintain liquidity and fund expansion and refinancing ofon our real estate investment portfolio and operations.variable rate debt. Interest rate changes on our fixed rate debt will generally not affect our future earnings or cash flows unless such instruments mature or are otherwise terminated. Our interest rate risk management objectives areis monitored using a variety of techniques. In order to limit the impact ofmitigate our interest rate changes on earnings, prepayment penalties and cash flows and to lower overall borrowing costs while taking into account variable interest rate risk. To achieve our objectives,risk, we borrow at fixed rates and variable rates.
We may also enter into derivative financial instruments such as interest rate swaps and caps in order to mitigate our interest rate risk on a related financial instrument.caps. To the extent we enter into such derivative financial instruments, we are exposed to credit risk and market risk. Credit risk is the failure of the counterparty to perform under the terms of the derivative contract. When the fair value of a derivative contract is positive, the counterparty owes us, which creates credit risk for us. When the fair value of a derivative contract is negative, we owe the counterparty and, therefore, it does not possess credit risk. It is our policy to enter into these transactions with the same party providing the underlying financing. In the alternative, we will seek to minimize the credit risk associated with derivative instruments by entering into transactions with what we believe are high-quality counterparties.counterparties, including those with whom we have a lending relationship. We believe the likelihood of realized losses from counterparty non-performance is remote. Market risk is the adverse effect on the value of a financial instrument that results from a change in interest rates. We manage the market risk associated with interest rate contractsswaps or caps by establishing and monitoring parameters that limit the types and degree of market risk that may be undertaken. We do not enter into derivative or interest rate transactions for speculative purposes.
We have, and may in the future enter into, derivative instruments for which we have not and may not elect hedge accounting treatment. Because we have not elected to apply hedge accounting treatment to these derivatives, the gains or losses resulting from their mark-to-market at the end of each reporting period are recognized as an increase or decrease in interest expense onin our accompanying consolidated statements of operations.
Our interest rate risk is monitored using a variety of techniques.
The table below presents, as of December 31, 2011,2013, the principal amounts of our fixed and variable debt and the weighted average interest rates excluding the impact of interest rate swaps by year of expected maturity to evaluate the expected cash flows and sensitivity to interest rate changes:changes (in thousands, except interest rates):
|
| | | | | | | | | | | | | | | | | | | | | | | | | | | |
| | Expected Maturity Date |
| | 2012 | | 2013 | | 2014 | | 2015 | | 2016 | | Thereafter | | Total |
| Fixed rate debt — principal payments | $ | 39,606,000 |
| | $ | 26,993,000 |
| | $ | 49,991,000 |
| | $ | 72,625,000 |
| | $ | 104,696,000 |
| | $ | 167,337,000 |
| | $ | 461,248,000 |
|
| Weighted average interest rate on maturing debt | 6.46 | % | | 5.81 | % | | 6.42 | % | | 5.41 | % | | 5.99 | % | | 6.12 | % | | 6.02 | % |
| Variable rate debt — principal payments | $ | 39,955,000 |
| | $ | 126,365,000 |
| | $ | 8,990,000 |
| | $ | — |
| | $ | — |
| | $ | — |
| | $ | 175,310,000 |
|
| Weighted average interest rate on maturing debt (based on rates in effect as of December 31, 2011) | 2.33 | % | | 2.92 | % | | 2.35 | % | | — | % | | — | % | | — | % | | 2.75 | % |
|
| | | | | | | | | | | | | | | | | | | | | | | | | | | |
| | Expected Maturity Date |
| | 2014 | | 2015 | | 2016 | | 2017 | | 2018 | | Thereafter | | Total |
| Fixed rate debt | $ | 7,222 |
| | $ | 73,436 |
| | $ | 121,907 |
| | $ | 100,314 |
| | $ | 12,309 |
| | $ | 358,563 |
| | $ | 673,751 |
|
| Weighted average interest rate on fixed rate debt (per annum) | 5.44 | % | | 5.38 | % | | 5.16 | % | | 5.91 | % | | 6.43 | % | | 4.15 | % | | 4.90 | % |
| Variable rate debt | $ | 507 |
| | $ | 546 |
| | $ | 355,589 |
| | $ | 634 |
| | $ | 684 |
| | $ | 181,965 |
| | $ | 539,925 |
|
| Weighted average interest rate on variable rate debt based on forward rates in effect as of December 31, 2013 (per annum) | 1.79 | % | | 2.35 | % | | 4.18 | % | | 4.57 | % | | 5.27 | % | | 6.08 | % | | 2.75 | % |
Mortgage loans and secured term loan payable were $636,558,000 ($639,149,000, including premium)Our total debt was $1.2 billion (excluding net premium/discount) as of December 31, 2011. As of December 31, 2011, we2013. We had fixed and variable rate mortgage loans and our secured real estate term loandebt with effective interest rates ranging from 1.77%1.62% to 12.75% per annum and a weighted average effective interest rate of 5.05%3.49% per annum.annum as of December 31, 2013. We had $461,248,000 ($463,839,000, including premium)$673.8 million (excluding net premium/discount) of fixed rate debt, or 72.5%55.5% of mortgage loans and secured term loan payable,total debt, at a weighted average interest rate of 6.02%4.90% per annum and $175,310,000$539.9 million of variable rate debt, or 27.5%44.5% of mortgage loans and secured term loan payable,total debt, at a weighted average interest rate of 2.49%1.73% per annum as of December 31, 2011.2013. The $112.6 million decrease in our variable rate debt during 2013 is primarily due to the pay-off of the $125.5 million secured real estate term loan.
As of December 31, 2011,2013, the fair value of our fixed rate debt was $513,372,000$694.3 million and the fair value of our variable rate debt was $174,490,000.$543.4 million based upon prevailing market rates as of December 31, 2013.
As of December 31, 2011,2013, we had fixed rate interest rate swaps or capsoutstanding that effectively fix $484.9 million of variable rate debt. Including the impact of these interest rate swaps, the effective rate on three of our variable mortgage loans, thereby effectively fixing our interest rate on those mortgage loans payable.
As of December 31, 2011, the outstanding balance on our unsecured revolving credit facility was zero. As discussed within Note 22, Subsequent Events, in the notes to our accompanying consolidated financial statements, in January and February 2012, we drew $27,000,000 and $55,000,000, respectively, on this credit facility in order to fund the acquisition of operating properties.debt is 2.75% per annum.
In addition to changes in interest rates, the value of our future properties is subject to fluctuations based on changes in local and regional economic conditions and changes in the creditworthiness of tenants, which may affect our ability to refinance our debt if necessary.
|
| |
Item 8. | Financial Statements and Supplementary Data. |
Item 8. Financial Statements and Supplementary DataSee the disclosure listed at Item 15.15 Exhibits, Financial Statement Schedules subsections (a)(1) and (a)(2).
|
| |
Item 9. | Changes in and Disagreements with Accountants on Accounting and Financial Disclosure. |
Item 9. Changes in and Disagreements With Accountants on Accounting and Financial DisclosureNone.
Item 9A. Controls and Procedures |
| |
Item 9A. | Controls and Procedures. |
Healthcare Trust of America, Inc. (“HTA”)(a) Evaluation of disclosure controls and procedures. We maintainHTA maintains disclosure controls and procedures that are designed to ensure that information required to be disclosed in ourits reports pursuant to the Securities Exchange Act of 1934, as amended, or the Exchange Act, is recorded, processed, summarized and reported within the time periods specified in the SEC rules and forms, and that such information is accumulated and communicated to us,management, including ourHTA’s Chief Executive Officer and Chief Financial Officer as appropriate, to allow timely decisions regarding required disclosure.disclosures.
As of December 31, 2011,2013, an evaluation was conducted under the supervision and with the participation of ourHTA’s management, including ourits Chief Executive Officer and Chief Financial Officer, of the effectiveness of ourHTA’s disclosure controls and procedures (as defined in Rules 13a-15(e) and 15d-15(e) under the Exchange Act). Based on this evaluation, theHTA’s Chief Executive Officer and the Chief Financial Officer concluded that ourits disclosure controls and procedures were effective as of December 31, 2011.2013.
(b) Management’s report on internal control over financial reporting. OurHTA’s management is responsible for establishing and maintaining adequate internal control over financial reporting, as such term is defined in Exchange Act Rules 13a-15(f) and 15d-15(f). Under the supervision and with the participation of ourHTA’s management, including ourits Chief Executive Officer and Chief Financial Officer, weHTA conducted an evaluation of the effectiveness of ourits internal control over financial reporting based on the frameworkcriteria in the 1992 Internal Control-Integrated Framework issued by the Committee of Sponsoring Organizations of the Treadway Commission, or COSO.
Because of its inherent limitations, internal control over financial reporting may not prevent or detect misstatements. Therefore, even those systems determined to be effective can only provide reasonable assurance with respect to financial statement preparation and presentation.
Based on ourthis evaluation, under the Internal Control-Integrated Framework, our managementHTA’s Chief Executive Officer and Chief Financial Officer concluded that ourHTA’s internal control over financial reporting was effective as of December 31, 2013.
Our independent registered public accounting firm, Deloitte & Touche LLP, independently assessed the effectiveness of HTA’s internal control over financial reporting. Deloitte & Touche LLP has issued a report, which is included at the reasonable assurance level asend of December 31, 2011.Part II, Item 9A of this Annual Report on Form 10-K.
(c) Changes in internal control over financial reporting. There were no changes in our internal control over financial reporting that occurred during the fourth quarter of 2011ended December 31, 2013, that have materially affected, or are reasonably likely to materially affect, ourHTA’s internal control over financial reporting.
Healthcare Trust of America Holdings, LP (“HTALP”)
(a) Evaluation of disclosure controls and procedures. HTALP maintains disclosure controls and procedures that are designed to ensure that information required to be disclosed in its reports pursuant to the Securities Exchange Act of 1934, as amended, or the Exchange Act, is recorded, processed, summarized and reported within the time periods specified in the SEC rules and forms, and that such information is accumulated and communicated to management, including HTA’s Chief Executive Officer and Chief Financial Officer as appropriate, to allow timely decisions regarding required disclosures.
As of December 31, 2013, an evaluation was conducted under the supervision and with the participation of management, including HTA’s Chief Executive Officer and Chief Financial Officer, of the effectiveness of HTA’s disclosure controls and procedures (as defined in Rules 13a-15(e) and 15d-15(e) under the Exchange Act). Based on this evaluation, HTA’s Chief Executive Officer and Chief Financial Officer concluded that HTALP’s disclosure controls and procedures were effective as of December 31, 2013.
(b) Management’s report on internal control over financial reporting. HTALP’s management is responsible for establishing and maintaining adequate internal control over financial reporting, as such term is defined in Exchange Act Rules 13a-15(f) and 15d-15(f). Under the supervision and with the participation of its management, including HTA’s Chief Executive Officer and Chief Financial Officer, HTALP conducted an evaluation of the effectiveness of its internal control over financial reporting based on the criteria in the 1992 Internal Control-Integrated Framework issued by COSO. Based on this evaluation, HTALP’s management, including HTA’s Chief Executive Officer and Chief Financial Officer, concluded that HTALP’s internal control over financial reporting was effective as of December 31, 2013.
This Annual Report on Form 10-Kannual report does not include an attestation report of ourHTALP’s independent registered public accounting firm, regardingDeloitte & Touche LLP, pursuant to rules of the SEC applicable to “non-accelerated filers.”
(c) Changes in internal control over financial reporting. There were no changes in our internal control over financial reporting that occurred during the quarter ended December 31, 2013, that have materially affected, or are reasonably likely to materially affect, HTALP’s internal control over financial reporting.
REPORT OF INDEPENDENT REGISTERED PUBLIC ACCOUNTING FIRM
To the Board of Directors and Stockholders of
Healthcare Trust of America, Inc.
Scottsdale, Arizona
We have audited the internal control over financial reporting of Healthcare Trust of America, Inc. and subsidiaries (the “Company”) as of December 31, 2013, based on the criteria established in Internal Control - Integrated Framework (1992) issued by the Committee of Sponsoring Organizations of the Treadway Commission. The Company's management is responsible for maintaining effective internal control over financial reporting and for its assessment of the effectiveness of internal control over financial reporting, included in the accompanying Management’s reportReport on Internal Control Over Financial Reporting. Our responsibility is not required to be subjectedexpress an opinion on the Company’s internal control over financial reporting based on our audit.
We conducted our audit in accordance with the standards of the Public Company Accounting Oversight Board (United States). Those standards require that we plan and perform the audit to attestationobtain reasonable assurance about whether effective internal control over financial reporting was maintained in all material respects. Our audit included obtaining an understanding of internal control over financial reporting, assessing the risk that a material weakness exists, testing and evaluating the design and operating effectiveness of internal control based on the assessed risk, and performing such other procedures as we considered necessary in the circumstances. We believe that our audit provides a reasonable basis for our opinion.
A company’s internal control over financial reporting is a process designed by, our independent registered publicor under the supervision of, the company’s principal executive and principal financial officers, or persons performing similar functions, and effected by the company’s board of directors, management, and other personnel to provide reasonable assurance regarding the reliability of financial reporting and the preparation of financial statements for external purposes in accordance with generally accepted accounting firm pursuantprinciples. A company’s internal control over financial reporting includes those policies and procedures that (1) pertain to the Dodd-Frank Wall Streetmaintenance of records that, in reasonable detail, accurately and Consumer Protection Act, which exempts non-accelerated filers fromfairly reflect the auditor attestation requirement of section 404(b)transactions and dispositions of the Sarbanes-Oxley Act.assets of the company; (2) provide reasonable assurance that transactions are recorded as necessary to permit preparation of financial statements in accordance with generally accepted accounting principles, and that receipts and expenditures of the company are being made only in accordance with authorizations of management and directors of the company; and (3) provide reasonable assurance regarding prevention or timely detection of unauthorized acquisition, use, or disposition of the company’s assets that could have a material effect on the financial statements.
Because of the inherent limitations of internal control over financial reporting, including the possibility of collusion or improper management override of controls, material misstatements due to error or fraud may not be prevented or detected on a timely basis. Also, projections of any evaluation of the effectiveness of the internal control over financial reporting to future periods are subject to the risk that the controls may become inadequate because of changes in conditions, or that the degree of compliance with the policies or procedures may deteriorate.
In our opinion, the Company maintained, in all material respects, effective internal control over financial reporting as of December 31, 2013, based on the criteria established in Internal Control - Integrated Framework (1992) issued by the Committee of Sponsoring Organizations of the Treadway Commission.
We have also audited, in accordance with the standards of the Public Company Accounting Oversight Board (United States), the consolidated financial statements and financial statement schedules as of and for the year ended December 31, 2013 of the Company and our report dated February 25, 2014 expressed an unqualified opinion on those financial statements and financial statement schedules.
/s/ DELOITTE & TOUCHE LLP
Phoenix, Arizona
February 25, 2014
|
| |
Item 9B. | Other Information. |
Item 9B. Other InformationNone.
PART III
|
| |
Item 10. | Directors, Executive Officers and Corporate Governance. |
Item 10. Directors, Executive Officers and Corporate GovernanceThe information required by this Item 10 is incorporated by reference to the material under the headings "Proposal“Proposal 1: Election of Directors," "Executive” “Executive Officers," "Corporate Governance"” “Corporate Governance,” and "Section“Section 16(a) Beneficial Ownership Reporting Compliance"Compliance,” in ourHTA’s definitive Proxy Statement for the 20122014 Annual Meeting of Stockholders, which weit will file with the SEC not later than April 29, 2012.30, 2014.
|
| |
Item 11. | Executive Compensation. |
Item 11. Executive CompensationThe information required by this Item 11 is incorporated by reference to the material under the headings "Compensation“Compensation Discussion and Analysis," "Compensation” “Compensation Committee Report,"” and "Compensation“Compensation of Directors and Executive Officers"Officers” in ourHTA’s definitive Proxy Statement for the 20122014 Annual Meeting of Stockholders, which weit will file with the SEC not later than April 29, 2012.30, 2014.
|
| |
Item 12. | Security Ownership of Certain Beneficial Owners and Management and Related Stockholder Matters. |
Item 12. Security Ownership of Certain Beneficial Owners and Management and Related Stockholder MattersThe information required by this Item 12 is incorporated by reference to the material under the headings "Equity“Equity Compensation Plans"Plans” and "Security“Security Ownership of Certain Beneficial Owners and Management"Management” in ourHTA’s definitive Proxy Statement for the 20122014 Annual Meeting of Stockholders, which weit will file with the SEC not later than April 29, 2012.30, 2014.
|
| |
Item 13. | Certain Relationships and Related Transactions, and Director Independence. |
Item 13. Certain Relationships and Related Transactions, and Director IndependenceThe information required by this Item 13 is incorporated by reference to the material under the heading "Certain“Certain Relationships and Related Party Transactions"Transactions” in ourHTA’s definitive Proxy Statement for the 20122014 Annual Meeting of Stockholders, which weit will file with the SEC not later than April 29, 2012.30, 2014.
|
| |
Item 14. | Principal Accounting Fees and Services. |
Item 14. Principal Accounting Fees and ServicesThe information required by this Item 14 is incorporated by reference to the material under the heading "Relationship“Relationship with Independent Registered Public Accounting Firm: Audit and Non-Audit Fees"Fees” in ourHTA’s definitive Proxy Statement for the 20122014 Annual Meeting of Stockholders, which weit will file with the SEC not later than April 29, 2012.30, 2014.
PART IV
Item 15. Exhibits, Financial Statement Schedules |
| |
Item 15. | Exhibits, Financial Statement Schedules. |
INDEX TO CONSOLIDATED FINANCIAL STATEMENTS
(a)(1) Financial Statements:
INDEX TO CONSOLIDATED FINANCIAL STATEMENTS
|
| | |
| | Page |
| |
| | |
| | |
| Financial Statements of Healthcare Trust of America, Inc. | |
| | |
| | |
| | |
| | |
| Financial Statements of Healthcare Trust of America Holdings, LP | |
| | |
| | |
| | |
| | |
| Notes for Healthcare Trust of America, Inc. and Healthcare Trust of America Holdings, LP | |
| | |
(a)(2) Financial Statement Schedules:
The following financial statement schedules for the year ended December 31, 2011 are submitted herewith:
|
| | |
| | Page |
| Financial Statement Schedules of Healthcare Trust of America, Inc. and Healthcare Trust of America Holdings, LP | |
| | |
| | |
| | |
All other schedules have been omitted because they are inapplicable.
(a)(3) Exhibits:
The exhibits listed on the Exhibit Index (following the signaturessignature section of this report) are incorporated by reference into this annual report.Annual Report.
(b) Exhibits:Exhibits:
See Item 15(a)(3)(1) above.
(c) Financial Statement Schedule:Schedules:
See Item 15(a)(2) above.
REPORT OF INDEPENDENT REGISTERED PUBLIC ACCOUNTING FIRM
To the Board of Directors and Stockholders of
Healthcare Trust of America, Inc.
Scottsdale, Arizona
We have audited the accompanying consolidated balance sheets of Healthcare Trust of America, Inc. and subsidiaries (the “Company”) as of December 31, 20112013 and 2010,2012, and the related consolidated statements of income, stockholders’operations, equity, and cash flows for each of the three years in the period ended December 31, 2011.2013. Our audits also included the financial statement schedules listed in the Index at Item 15. These financial statements and financial statement schedules are the responsibility of the Company's management. Our responsibility is to express an opinion on the financial statements and financial statement schedules based on our audits.
We conducted our audits in accordance with the standards of the Public Company Accounting Oversight Board (United States). Those standards require that we plan and perform the audit to obtain reasonable assurance about whether the financial statements are free of material misstatement. An audit includes examining, on a test basis, evidence supporting the amounts and disclosures in the financial statements. An audit also includes assessing the accounting principles used and significant estimates made by management, as well as evaluating the overall financial statement presentation. We believe that our audits provide a reasonable basis for our opinion.
In our opinion, such consolidated financial statements present fairly, in all material respects, the financial position of Healthcare Trust of America, Inc. and subsidiaries as of December 31, 2013 and 2012, and the results of their operations and their cash flows for each of the three years in the period ended December 31, 2013, in conformity with accounting principles generally accepted in the United States of America. Also, in our opinion, such financial statement schedules, when considered in relation to the basic consolidated financial statements taken as a whole, present fairly, in all material respects, the information set forth therein.
We have also audited, in accordance with the standards of the Public Company Accounting Oversight Board (United States), the Company’s internal control over financial reporting as of December 31, 2013, based on the criteria established in Internal Control - Integrated Framework (1992) issued by the Committee of Sponsoring Organizations of the Treadway Commission and our report dated February 25, 2014 expressed an unqualified opinion on the Company's internal control over financial reporting.
/s/ DELOITTE & TOUCHE LLP
Phoenix, Arizona
February 25, 2014
REPORT OF INDEPENDENT REGISTERED PUBLIC ACCOUNTING FIRM
To the Board of Directors and Stockholders of
Healthcare Trust of America Holdings, LP
Scottsdale, Arizona
We have audited the accompanying consolidated balance sheets of Healthcare Trust of America Holdings, LP and subsidiaries (the “Company”) as of December 31, 2013 and 2012, and the related consolidated statements of operations, partners’ capital, and cash flows for each of the three years in the period ended December 31, 2013. Our audits also included the financial statement schedules listed in the Index at Item 15. These financial statements and financial statement schedules are the responsibility of the Company's management. Our responsibility is to express an opinion on the financial statements and financial statement schedules based on our audits.
We conducted our audits in accordance with the standards of the Public Company Accounting Oversight Board (United States). Those standards require that we plan and perform the audit to obtain reasonable assurance about whether the financial statements are free of material misstatement. The Company is not required to have, nor were we engaged to perform, an audit of its internal control over financial reporting. Our audits included consideration of internal control over financial reporting as a basis for designing audit procedures that are appropriate in the circumstances, but not for the purpose of expressing an opinion on the effectiveness of the Company’sCompany's internal control over financial reporting. Accordingly, we express no such opinion. An audit also includes examining, on a test basis, evidence supporting the amounts and disclosures in the financial statements, assessing the accounting principles used and significant estimates made by management, as well as evaluating the overall financial statement presentation. We believe that our audits provide a reasonable basis for our opinion.
In our opinion, such consolidated financial statements present fairly, in all material respects, the financial position of Healthcare Trust of America Inc.Holdings, LP and subsidiaries as of December 31, 20112013 and 2010,2012, and the results of their operations and their cash flows for each of the three years in the period ended December 31, 2011,2013, in conformity with accounting principles generally accepted in the United States of America. Also, in our opinion, such financial statement schedules, when considered in relation to the basic consolidated financial statements taken as a whole, present fairly in all material respects the information set forth therein.
/s/ DeloitteDELOITTE & ToucheTOUCHE LLP
Phoenix, Arizona
March 26, 2012February 25, 2014
Healthcare Trust of America, Inc.HEALTHCARE TRUST OF AMERICA, INC.
CONSOLIDATED BALANCE SHEETS
As of December 31, 2011 and 2010(In thousands, except share data)
| | | | December 31, | | | | | |
| | 2011 | | 2010 | | December 31, 2013 | | December 31, 2012 |
| ASSETS | ASSETS | | | | |
| Real estate investments: | | | | | |
| Land | | | $ | 197,892 |
| | $ | 183,651 |
|
| Building and improvements | | | 2,339,774 |
| | 2,044,113 |
|
| Lease intangibles | | | 409,356 |
| | 352,884 |
|
| Property held for sale, net | | | 21,138 |
| | — |
|
| | | | 2,968,160 |
| | 2,580,648 |
|
| Accumulated depreciation and amortization | | | (441,169 | ) | | (349,118 | ) |
| Real estate investments, net | $ | 1,806,471,000 |
| | $ | 1,797,463,000 |
| | 2,526,991 |
| | 2,231,530 |
|
| Real estate notes receivable, net | 57,459,000 |
| | 57,091,000 |
| |
| Real estate notes receivable | | | 28,520 |
| | 20,000 |
|
| Cash and cash equivalents | 69,491,000 |
| | 29,270,000 |
| | 18,081 |
| | 15,956 |
|
| Accounts and other receivables, net | 12,658,000 |
| | 16,385,000 |
| |
| Restricted cash and escrow deposits | 16,718,000 |
| | 26,679,000 |
| | 18,114 |
| | 17,623 |
|
| Identified intangible assets, net | 272,390,000 |
| | 304,355,000 |
| |
| Other assets, net | 56,442,000 |
| | 40,552,000 |
| |
| Receivables and other assets, net | | | 109,337 |
| | 84,970 |
|
| Other intangibles, net | | | 50,343 |
| | 44,011 |
|
| Non-real estate assets of property held for sale, net | | | 948 |
| | — |
|
| Total assets | $ | 2,291,629,000 |
| | $ | 2,271,795,000 |
| | $ | 2,752,334 |
| | $ | 2,414,090 |
|
| LIABILITIES AND EQUITY | LIABILITIES AND EQUITY | | | | |
| Liabilities: | |
| | |
| | | | |
| Mortgage and secured term loans payable, net | $ | 639,149,000 |
| | $ | 699,526,000 |
| |
| Outstanding balance on unsecured revolving credit facility | — |
| | 7,000,000 |
| |
| Debt, net | | | $ | 1,214,241 |
| | $ | 1,037,359 |
|
| Accounts payable and accrued liabilities | 47,801,000 |
| | 43,033,000 |
| | 82,893 |
| | 63,443 |
|
| Derivative financial instruments — interest rate swaps | 1,792,000 |
| | 1,527,000 |
| |
| Derivative financial instruments - interest rate swaps | | | 5,053 |
| | 9,370 |
|
| Security deposits, prepaid rent and other liabilities | 19,930,000 |
| | 16,168,000 |
| | 35,339 |
| | 24,450 |
|
| Identified intangible liabilities, net | 11,832,000 |
| | 13,428,000 |
| |
| Intangible liabilities, net | | | 11,797 |
| | 11,309 |
|
| Total liabilities | 720,504,000 |
| | 780,682,000 |
| | 1,349,323 |
| | 1,145,931 |
|
| Commitments and contingencies (Note 11) |
|
| |
|
| |
| Redeemable noncontrolling interest of limited partners (Note 13) | 3,785,000 |
| | 3,867,000 |
| |
| Commitments and contingencies | | |
| |
|
| Redeemable noncontrolling interest of limited partners | | | 3,262 |
| | 3,564 |
|
| Equity: | |
| | |
| | | | |
| Stockholders’ equity: | |
| | |
| |
| Preferred stock, $0.01 par value; 200,000,000 shares authorized; none issued and outstanding | — |
| | — |
| | — |
| | — |
|
| Common stock, $0.01 par value; 1,000,000,000 shares authorized; 228,491,312 and 202,643,705 shares issued and outstanding as of December 31, 2011 and 2010, respectively | 2,284,000 |
| | 2,026,000 |
| |
| Class A common stock, $0.01 par value; 1,000,000,000 and 700,000,000 shares authorized as of December 31, 2013 and 2012, respectively; 236,880,614 and 100,086,387 shares issued and outstanding as of December 31, 2013 and 2012, respectively | | | 2,369 |
| | 1,001 |
|
| Class B common stock, $0.01 par value; 0 and 300,000,000 shares authorized as of December 31, 2013 and 2012, respectively; 0 and 114,566,254 shares issued and outstanding as of December 31, 2013 and 2012, respectively | | | — |
| | 1,146 |
|
| Additional paid-in capital | 2,032,305,000 |
| | 1,795,413,000 |
| | 2,126,897 |
| | 1,885,836 |
|
| Accumulated deficit | (467,249,000 | ) | | (310,193,000 | ) | |
| Cumulative dividends in excess of earnings | | | (742,060 | ) | | (633,717 | ) |
| Total stockholders’ equity | 1,567,340,000 |
| | 1,487,246,000 |
| | 1,387,206 |
| | 1,254,266 |
|
| Noncontrolling interest | | | 12,543 |
| | 10,329 |
|
| Total equity | | | 1,399,749 |
| | 1,264,595 |
|
| Total liabilities and equity | $ | 2,291,629,000 |
| | $ | 2,271,795,000 |
| | $ | 2,752,334 |
| | $ | 2,414,090 |
|
The accompanying notes are an integral part of these consolidated financial statements.
HEALTHCARE TRUST OF AMERICA, INC.
CONSOLIDATED STATEMENTS OF OPERATIONS
(In thousands, except per share data)
|
| | | | | | | | | | | |
| | Year Ended December 31, |
| | 2013 | | 2012 | | 2011 |
| Revenues: | | | | | |
| Rental income | $ | 317,341 |
| | $ | 293,076 |
| | $ | 267,385 |
|
| Interest income from real estate notes receivable | 2,558 |
| | 4,304 |
| | 4,792 |
|
| Total revenues | 319,899 |
| | 297,380 |
| | 272,177 |
|
| Expenses: | | | | | |
| Rental | 97,053 |
| | 95,046 |
| | 88,483 |
|
| General and administrative | 24,448 |
| | 21,741 |
| | 20,879 |
|
| Non-traded REIT | — |
| | 4,340 |
| | 7,816 |
|
Acquisition-related | 7,523 |
| | 8,843 |
| | 2,130 |
|
| Depreciation and amortization | 121,476 |
| | 115,497 |
| | 106,551 |
|
| Listing | 4,405 |
| | 22,573 |
| | — |
|
| Total expenses | 254,905 |
| | 268,040 |
| | 225,859 |
|
| Income (loss) before other income (expense) | 64,994 |
| | 29,340 |
| | 46,318 |
|
| Other income (expense): | | | | | |
| Interest expense: | | | | | |
| Interest related to derivative financial instruments | (5,314 | ) | | (4,944 | ) | | (1,423 | ) |
| Net gain (loss) on change in the fair value of derivative financial instruments | 10,796 |
| | (7,667 | ) | | (856 | ) |
| Total interest related to derivative financial instruments, including net change in the fair value of derivative financial instruments | 5,482 |
| | (12,611 | ) | | (2,279 | ) |
| Interest related to debt | (46,941 | ) | | (39,868 | ) | | (39,040 | ) |
| Debt extinguishment costs | — |
| | (1,886 | ) | | — |
|
| Other income (expense) | 42 |
| | 89 |
| | 174 |
|
| Income (loss) from continuing operations | 23,577 |
| | (24,936 | ) | | 5,173 |
|
| Income from discontinued operations | 1,107 |
| | 568 |
| | 420 |
|
| Net income (loss) | $ | 24,684 |
| | $ | (24,368 | ) | | $ | 5,593 |
|
| Net income attributable to noncontrolling interests | (423 | ) | | (56 | ) | | (52 | ) |
| Net income (loss) attributable to common stockholders | $ | 24,261 |
| | $ | (24,424 | ) | | $ | 5,541 |
|
| Earnings (losses) per common share - basic: | | | | | |
| Income (loss) from continuing operations attributable to common stockholders | $ | 0.10 |
| | $ | (0.11 | ) | | $ | 0.02 |
|
| Discontinued operations | 0.00 |
| | 0.00 |
| | 0.00 |
|
| Net income (loss) attributable to common stockholders | $ | 0.10 |
| | $ | (0.11 | ) | | $ | 0.02 |
|
| Earnings (losses) per common share - diluted: | | | | | |
| Income (loss) from continuing operations attributable to common stockholders | $ | 0.10 |
| | $ | (0.11 | ) | | $ | 0.02 |
|
| Discontinued operations | 0.00 |
| | 0.00 |
| | 0.00 |
|
| Net income (loss) attributable to common stockholders | $ | 0.10 |
| | $ | (0.11 | ) | | $ | 0.02 |
|
| Weighted average number of common shares outstanding: | | | | | |
| Basic | 228,075 |
| | 222,713 |
| | 223,900 |
|
| Diluted | 229,939 |
| | 222,713 |
| | 224,392 |
|
The accompanying notes are an integral part of these consolidated financial statements.
HEALTHCARE TRUST OF AMERICA, INC.
CONSOLIDATED STATEMENTS OF EQUITY
(In thousands)
|
| | | | | | | | | | | | | | | | | | | | | | | | | | | | | | | | |
| | Common Stock Issued | | Par Value | | Additional Paid-In Capital | | Cumulative Dividends in Excess of Earnings | | Total Stockholders’ Equity | | Noncontrolling Interest | | Total Equity |
| | Common Stock | | Class A | | Class B | | | | | | |
| Balance as of December 31, 2010 | 202,644 |
| | — |
| | — |
| | $ | 2,026 |
| | $ | 1,795,413 |
| | $ | (310,193 | ) | | $ | 1,487,246 |
| | $ | — |
| | $ | 1,487,246 |
|
| Issuance of common stock | 21,682 |
| | — |
| | — |
| | 216 |
| | 214,425 |
| | — |
| | 214,641 |
| | — |
| | 214,641 |
|
| Offering costs | — |
| | — |
| | — |
| | — |
| | (18,896 | ) | | — |
| | (18,896 | ) | | — |
| | (18,896 | ) |
| Share-based award transactions, net | 62 |
| | — |
| | — |
| | 1 |
| | 3,220 |
| | — |
| | 3,221 |
| | — |
| | 3,221 |
|
| Issuance of common stock under the DRIP | 7,986 |
| | — |
| | — |
| | 80 |
| | 75,784 |
| | — |
| | 75,864 |
| | — |
| | 75,864 |
|
| Repurchase and cancellation of common stock | (3,883 | ) | | — |
| | — |
| | (39 | ) | | (37,641 | ) | | — |
| | (37,680 | ) | | — |
| | (37,680 | ) |
| Dividends ($0.725 per common share) | — |
| | — |
| | — |
| | — |
| | — |
| | (162,597 | ) | | (162,597 | ) | | — |
| | (162,597 | ) |
| Net income (loss) | — |
| | — |
| | — |
| | — |
| | — |
| | 5,541 |
| | 5,541 |
| | — |
| | 5,541 |
|
| Balance as of December 31, 2011 | 228,491 |
| | — |
| | — |
| | 2,284 |
| | 2,032,305 |
| | (467,249 | ) | | 1,567,340 |
| | — |
| | 1,567,340 |
|
| Share-based award transactions, net | 626 |
| | 333 |
| | 12 |
| | 10 |
| | 6,954 |
| | — |
| | 6,964 |
| | 10,444 |
| | 17,408 |
|
| Issuance of common stock under the DRIP | 3,362 |
| | — |
| | — |
| | 34 |
| | 31,882 |
| | — |
| | 31,916 |
| | — |
| | 31,916 |
|
| Repurchase and cancellation of common stock | (3,070 | ) | | (14,958 | ) | | (144 | ) | | (181 | ) | | (185,305 | ) | | — |
| | (185,486 | ) | | — |
| | (185,486 | ) |
| Conversion | (229,409 | ) | | 114,711 |
| | 114,698 |
| | — |
| | — |
| | — |
| | — |
| | — |
| | — |
|
| Dividends ($0.637 per common share) | — |
| | — |
| | — |
| | — |
| | — |
| | (142,044 | ) | | (142,044 | ) | | (115 | ) | | (142,159 | ) |
| Net income (loss) | — |
| | — |
| | — |
| | — |
| | — |
| | (24,424 | ) | | (24,424 | ) | | — |
| | (24,424 | ) |
| Balance as of December 31, 2012 | — |
| | 100,086 |
| | 114,566 |
| | 2,147 |
| | 1,885,836 |
| | (633,717 | ) | | 1,254,266 |
| | 10,329 |
| | 1,264,595 |
|
| Issuance of common stock | — |
| | 21,873 |
| | — |
| | 219 |
| | 239,115 |
| | — |
| | 239,334 |
| | — |
| | 239,334 |
|
| Share-based award transactions, net | — |
| | 422 |
| | (15 | ) | | 4 |
| | 2,467 |
| | 76 |
| | 2,547 |
| | 3,177 |
| | 5,724 |
|
| Repurchase and cancellation of common stock | — |
| | (52 | ) | | — |
| | (1 | ) | | (521 | ) | | — |
| | (522 | ) | | — |
| | (522 | ) |
| Conversion | — |
| | 114,551 |
| | (114,551 | ) | | — |
| | — |
| | — |
| | — |
| | — |
| | — |
|
| Dividends ($0.575 per common share) | — |
| | — |
| | — |
| | — |
| | — |
| | (132,680 | ) | | (132,680 | ) | | (1,304 | ) | | (133,984 | ) |
| Net income (loss) | — |
| | — |
| | — |
| | — |
| | — |
| | 24,261 |
| | 24,261 |
| | 341 |
| | 24,602 |
|
| Balance as of December 31, 2013 | — |
| | 236,880 |
| | — |
| | $ | 2,369 |
| | $ | 2,126,897 |
| | $ | (742,060 | ) | | $ | 1,387,206 |
| | $ | 12,543 |
| | $ | 1,399,749 |
|
The accompanying notes are an integral part of these consolidated financial statements.
HEALTHCARE TRUST OF AMERICA, INC.
CONSOLIDATED STATEMENTS OF CASH FLOWS
(In thousands)
|
| | | | | | | | | | | |
| | Year Ended December 31, |
| | 2013 | | 2012 | | 2011 |
| Cash flows from operating activities: | | | | | |
| Net income (loss) | $ | 24,684 |
| | $ | (24,368 | ) | | $ | 5,593 |
|
| Adjustments to reconcile net income (loss) to net cash provided by operating activities: | | | | | |
| Depreciation, amortization and other | 119,904 |
| | 114,575 |
| | 104,045 |
|
| Share-based compensation expense | 5,648 |
| | 17,408 |
| | 3,221 |
|
| Bad debt expense | 453 |
| | 1,064 |
| | 1,447 |
|
| Change in fair value of derivative financial instruments | (10,796 | ) | | 7,667 |
| | 856 |
|
| Changes in operating assets and liabilities: | | | | | |
| Receivables and other assets, net | (15,931 | ) | | (4,765 | ) | | (2,964 | ) |
| Accounts payable and accrued liabilities | 14,789 |
| | 2,684 |
| | 295 |
|
| Security deposits, prepaid rent and other liabilities | 9,073 |
| | 2,520 |
| | (686 | ) |
| Net cash provided by operating activities | 147,824 |
| | 116,785 |
| | 111,807 |
|
| Cash flows from investing activities: | | | | | |
| Acquisition of real estate operating properties and other assets | (340,307 | ) | | (257,386 | ) | | (61,385 | ) |
| Capital expenditures | (25,382 | ) | | (22,909 | ) | | (16,034 | ) |
| Issuance of real estate notes receivable | (8,520 | ) | | — |
| | — |
|
| Restricted cash, escrow deposits and notes receivable | (491 | ) | | (4,830 | ) | | (4,502 | ) |
| Release of restricted cash | — |
| | 580 |
| | 14,463 |
|
| Real estate deposits paid | — |
| | (3,810 | ) | | (4,500 | ) |
| Real estate deposits used | — |
| | 4,810 |
| | 6,000 |
|
| Net cash used in investing activities | (374,700 | ) | | (283,545 | ) | | (65,958 | ) |
| Cash flows from financing activities: | | | | | |
| Proceeds from unsecured senior notes | 297,558 |
| | — |
| | — |
|
| Borrowings on unsecured revolving credit facility | 158,000 |
| | 360,000 |
| | — |
|
| Payments on unsecured revolving credit facility | (175,000 | ) | | (288,000 | ) | | (7,000 | ) |
| Borrowings on unsecured term loans | — |
| | 455,000 |
| | — |
|
| Borrowings on secured real estate term loan and mortgage loans | — |
| | — |
| | 125,500 |
|
| Payments on secured real estate term loan and mortgage loans | (156,963 | ) | | (128,601 | ) | | (192,083 | ) |
| Deferred financing costs | (3,651 | ) | | (6,436 | ) | | (3,401 | ) |
| Derivative financial instrument termination payments | (1,195 | ) | | — |
| | — |
|
| Security deposits | 1,225 |
| | 765 |
| | 596 |
|
| Proceeds from issuance of common stock, net | 240,657 |
| | — |
| | 214,641 |
|
| Repurchase and cancellation of common stock | (522 | ) | | (182,602 | ) | | (37,680 | ) |
| Payment of offering costs | — |
| | (2,884 | ) | | (21,137 | ) |
| Dividends | (129,360 | ) | | (93,273 | ) | | (84,800 | ) |
| Payment on earnout liability | (92 | ) | | (328 | ) | | — |
|
| Distributions to noncontrolling interest of limited partners | (1,656 | ) | | (416 | ) | | (264 | ) |
| Net cash provided by (used in) financing activities | 229,001 |
| | 113,225 |
| | (5,628 | ) |
| Net change in cash and cash equivalents | 2,125 |
| | (53,535 | ) | | 40,221 |
|
| Cash and cash equivalents - beginning of period | 15,956 |
| | 69,491 |
| | 29,270 |
|
| Cash and cash equivalents - end of period | $ | 18,081 |
| | $ | 15,956 |
| | $ | 69,491 |
|
The accompanying notes are an integral part of these consolidated financial statements.
HEALTHCARE TRUST OF AMERICA HOLDINGS, LP
CONSOLIDATED BALANCE SHEETS
(In thousands, except unit data)
|
| | | | | | | | |
| | | December 31, 2013 | | December 31, 2012 |
| ASSETS | | | | |
| Real estate investments: | | | | |
| Land | | $ | 197,892 |
| | $ | 183,651 |
|
| Building and improvements | | 2,339,774 |
| | 2,044,113 |
|
| Lease intangibles | | 409,356 |
| | 352,884 |
|
| Property held for sale, net | | 21,138 |
| | — |
|
| | | 2,968,160 |
| | 2,580,648 |
|
| Accumulated depreciation and amortization | | (441,169 | ) | | (349,118 | ) |
| Real estate investments, net | | 2,526,991 |
| | 2,231,530 |
|
| Real estate notes receivable | | 28,520 |
| | 20,000 |
|
| Cash and cash equivalents | | 18,081 |
| | 15,956 |
|
| Restricted cash and escrow deposits | | 18,114 |
| | 17,623 |
|
| Receivables and other assets, net | | 109,337 |
| | 84,970 |
|
| Other intangibles, net | | 50,343 |
| | 44,011 |
|
| Non-real estate assets of property held for sale, net | | 948 |
| | — |
|
| Total assets | | $ | 2,752,334 |
| | $ | 2,414,090 |
|
| LIABILITIES AND PARTNERS’ CAPITAL | | | | |
| Liabilities: | | | | |
| Debt, net | | $ | 1,214,241 |
| | $ | 1,037,359 |
|
| Accounts payable and accrued liabilities | | 82,893 |
| | 63,443 |
|
| Derivative financial instruments - interest rate swaps | | 5,053 |
| | 9,370 |
|
| Security deposits, prepaid rent and other liabilities | | 35,339 |
| | 24,450 |
|
| Intangible liabilities, net | | 11,797 |
| | 11,309 |
|
| Total liabilities | | 1,349,323 |
| | 1,145,931 |
|
| Commitments and contingencies | |
|
| |
|
|
| Redeemable noncontrolling interest of limited partners | | 1,717 |
| | 1,960 |
|
| Partners’ Capital: | | | | |
| Limited partners’ capital, 3,052,918 and 3,055,718 units issued and outstanding as of December 31, 2013 and 2012, respectively | | 13,818 |
| | 11,663 |
|
| General partners’ capital, 236,880,614 and 214,652,641 units issued and outstanding as of December 31, 2013 and 2012, respectively | | 1,387,476 |
| | 1,254,536 |
|
| Total partners’ capital | | 1,401,294 |
| | 1,266,199 |
|
| Total liabilities and partners’ capital | | $ | 2,752,334 |
| | $ | 2,414,090 |
|
The accompanying notes are an integral part of these consolidated financial statements.
Healthcare Trust of America, Inc.HEALTHCARE TRUST OF AMERICA HOLDINGS, LP
CONSOLIDATED STATEMENTS OF OPERATIONS
For the Years Ended December 31, 2011, 2010 and 2009(In thousands, except per unit data)
|
| | | | | | | | | | | |
| | Years Ended December 31, |
| | 2011 | | 2010 | | 2009 |
| Revenues: | |
| | |
| | |
|
| Rental income | $ | 269,646,000 |
| | $ | 195,496,000 |
| | $ | 126,333,000 |
|
| Interest income from mortgage notes receivable and other income | 4,792,000 |
| | 7,585,000 |
| | 3,153,000 |
|
| Total revenues | 274,438,000 |
| | 203,081,000 |
| | 129,486,000 |
|
| Expenses: | |
| | |
| | |
|
| Rental expenses | 88,760,000 |
| | 65,662,000 |
| | 45,024,000 |
|
| General and administrative expenses | 28,695,000 |
| | 18,753,000 |
| | 12,285,000 |
|
| Asset management fees to former advisor (Note 12) | — |
| | — |
| | 3,783,000 |
|
| Acquisition-related expenses (Note 2) | 2,130,000 |
| | 11,317,000 |
| | 15,997,000 |
|
| Depreciation and amortization | 107,542,000 |
| | 78,561,000 |
| | 53,595,000 |
|
| Redemption, termination, and release payment to former advisor (Note 12) | — |
| | 7,285,000 |
| | — |
|
| Total expenses | 227,127,000 |
| | 181,578,000 |
| | 130,684,000 |
|
| Income (loss) before other income (expense) | 47,311,000 |
| | 21,503,000 |
| | (1,198,000 | ) |
| Other income (expense): | |
| | |
| | |
|
| Interest expense (including amortization of deferred financing costs and debt premium/discount): | |
| | |
| | |
|
| Interest expense related to mortgage and secured term loans payable and credit facility | (39,613,000 | ) | | (26,725,000 | ) | | (19,146,000 | ) |
| Interest expense related to derivative financial instruments and net change in fair value of derivative financial instruments | (2,279,000 | ) | | (2,816,000 | ) | | (4,678,000 | ) |
| Interest and dividend income | 174,000 |
| | 119,000 |
| | 249,000 |
|
| Net income (loss) | $ | 5,593,000 |
| | $ | (7,919,000 | ) | | $ | (24,773,000 | ) |
| Less: Net (income) loss attributable to noncontrolling interest of limited partners | (52,000 | ) | | 16,000 |
| | (304,000 | ) |
| Net income (loss) attributable to controlling interest | $ | 5,541,000 |
| | $ | (7,903,000 | ) | | $ | (25,077,000 | ) |
| Net income (loss) per share attributable to controlling interest on distributed and undistributed earnings — basic: | $ | 0.02 |
| | $ | (0.05 | ) | | $ | (0.22 | ) |
| Net income (loss) per share attributable to controlling interest on distributed and undistributed earnings — diluted: | $ | 0.02 |
| | $ | (0.05 | ) | | $ | (0.22 | ) |
| Weighted average number of shares outstanding | |
| | |
| | |
|
| Basic | 223,900,167 |
| | 165,952,860 |
| | 112,819,638 |
|
| Diluted | 224,391,553 |
| | 165,952,860 |
| | 112,819,638 |
|
|
| | | | | | | | | | | |
| | Year Ended December 31, |
| | 2013 | | 2012 | | 2011 |
| Revenues: | | | | | |
| Rental income | $ | 317,341 |
| | $ | 293,076 |
| | $ | 267,385 |
|
| Interest income from real estate notes receivable | 2,558 |
| | 4,304 |
| | 4,792 |
|
| Total revenues | 319,899 |
| | 297,380 |
| | 272,177 |
|
| Expenses: | | | | | |
| Rental | 97,053 |
| | 95,046 |
| | 88,483 |
|
| General and administrative | 24,448 |
| | 21,741 |
| | 20,879 |
|
| Non-traded REIT | — |
| | 4,340 |
| | 7,816 |
|
Acquisition-related | 7,523 |
| | 8,843 |
| | 2,130 |
|
| Depreciation and amortization | 121,476 |
| | 115,497 |
| | 106,551 |
|
| Listing | 4,405 |
| | 22,573 |
| | — |
|
| Total expenses | 254,905 |
| | 268,040 |
| | 225,859 |
|
| Income (loss) before other income (expense) | 64,994 |
| | 29,340 |
| | 46,318 |
|
| Other income (expense): | | | | | |
| Interest expense: | | | | | |
| Interest related to derivative financial instruments | (5,314 | ) | | (4,944 | ) | | (1,423 | ) |
| Net gain (loss) on change in the fair value of derivative financial instruments | 10,796 |
| | (7,667 | ) | | (856 | ) |
| Total interest related to derivative financial instruments, including net change in the fair value of derivative financial instruments | 5,482 |
| | (12,611 | ) | | (2,279 | ) |
| Interest related to debt | (46,941 | ) | | (39,868 | ) | | (39,040 | ) |
| Debt extinguishment costs | — |
| | (1,886 | ) | | — |
|
| Other income (expense) | 42 |
| | 89 |
| | 174 |
|
| Income (loss) from continuing operations | 23,577 |
| | (24,936 | ) | | 5,173 |
|
| Income from discontinued operations | 1,107 |
| | 568 |
| | 420 |
|
| Net income (loss) | $ | 24,684 |
| | $ | (24,368 | ) | | $ | 5,593 |
|
| Net income attributable to noncontrolling interests | (51 | ) | | (40 | ) | | (30 | ) |
| Net income (loss) attributable to common unitholders | $ | 24,633 |
| | $ | (24,408 | ) | | $ | 5,563 |
|
| Earnings (losses) per common unit - basic: | | | | | |
| Income (loss) from continuing operations attributable to common unitholders | $ | 0.10 |
| | $ | (0.11 | ) | | $ | 0.02 |
|
| Discontinued operations | 0.00 |
| | 0.00 |
| | 0.00 |
|
| Net income (loss) attributable to common unitholders | $ | 0.10 |
| | $ | (0.11 | ) | | $ | 0.02 |
|
| Earnings (losses) per common unit - diluted: | | | | | |
| Income (loss) from continuing operations attributable to common unitholders | $ | 0.10 |
| | $ | (0.11 | ) | | $ | 0.02 |
|
| Discontinued operations | 0.00 |
| | 0.00 |
| | 0.00 |
|
| Net income (loss) attributable to common unitholders | $ | 0.10 |
| | $ | (0.11 | ) | | $ | 0.02 |
|
| Weighted average number of common units outstanding: | | | | | |
| Basic | 231,130 |
| | 224,681 |
| | 224,056 |
|
| Diluted | 231,130 |
| | 224,681 |
| | 224,056 |
|
The accompanying notes are an integral part of these consolidated financial statements.
HEALTHCARE TRUST OF AMERICA HOLDINGS, LP
CONSOLIDATED STATEMENTS OF CHANGES IN PARTNERS’ CAPITAL
(In thousands)
|
| | | | | | | | | | | | | | | | | |
| | General Partners’ Capital | | Limited Partners’ Capital | | Total Partners’ Capital |
| | Units | | Amount | | Units | | Amount | |
| Balance as of December 31, 2010 | 202,644 |
| | $ | 1,487,301 |
| | 156 |
| | $ | 1,510 |
| | $ | 1,488,811 |
|
| Issuance of general partner units | 21,682 |
| | 214,641 |
| | — |
| | — |
| | 214,641 |
|
| Offering costs | — |
| | (18,896 | ) | | — |
| | — |
| | (18,896 | ) |
| Issuance of units under the DRIP | 7,986 |
| | 75,864 |
| | — |
| | — |
| | 75,864 |
|
| Redemptions of general partner units | (3,883 | ) | | (37,680 | ) | | — |
| | — |
| | (37,680 | ) |
| Share-based award transactions, net | 62 |
| | 3,221 |
| | — |
| | — |
| | 3,221 |
|
| Distributions ($0.725 per common unit) | — |
| | (162,483 | ) | | — |
| | (114 | ) | | (162,597 | ) |
| Net income (loss) attributable to common unitholders | — |
| | 5,542 |
| | — |
| | 21 |
| | 5,563 |
|
| Balance as of December 31, 2011 | 228,491 |
| | 1,567,510 |
| | 156 |
| | 1,417 |
| | 1,568,927 |
|
| Issuance of units under the DRIP | 3,362 |
| | 31,916 |
| | — |
| | — |
| | 31,916 |
|
| Redemptions of general partner units | (18,172 | ) | | (185,486 | ) | | — |
| | — |
| | (185,486 | ) |
| Share-based award transactions, net | 971 |
| | 6,964 |
| | 2,900 |
| | 10,444 |
| | 17,408 |
|
| Distributions ($0.637 per common unit) | — |
| | (141,944 | ) | | — |
| | (214 | ) | | (142,158 | ) |
| Net income (loss) attributable to common unitholders | — |
| | (24,424 | ) | | — |
| | 16 |
| | (24,408 | ) |
| Balance as of December 31, 2012 | 214,652 |
| | 1,254,536 |
| | 3,056 |
| | 11,663 |
| | 1,266,199 |
|
| Issuance of general partner units | 21,873 |
| | 239,334 |
| | — |
| | — |
| | 239,334 |
|
| Redemptions of general partner units | (52 | ) | | (522 | ) | | — |
| | — |
| | (522 | ) |
| Share-based award transactions, net | 407 |
| | 2,547 |
| | (3 | ) | | 3,177 |
| | 5,724 |
|
| Distributions ($0.575 per common unit) | — |
| | (132,680 | ) | | — |
| | (1,394 | ) | | (134,074 | ) |
| Net income (loss) attributable to common unitholders | — |
| | 24,261 |
| | — |
| | 372 |
| | 24,633 |
|
| Balance as of December 31, 2013 | 236,880 |
| | $ | 1,387,476 |
| | 3,053 |
| | $ | 13,818 |
| | $ | 1,401,294 |
|
The accompanying notes are an integral part of these consolidated financial statements.
Healthcare Trust of America, Inc.HEALTHCARE TRUST OF AMERICA HOLDINGS, LP
CONSOLIDATED STATEMENTS OF STOCKHOLDERS’ EQUITYCASH FLOWS
For the Years Ended December 31, 2011, 2010 and 2009(In thousands)
|
| | | | | | | | | | | | | | | | | | |
| | Common Stock | | | | | | Total Stockholders’
Equity |
| | Number of Shares | | Amount | | Additional Paid-In Capital | | Accumulated Deficit | |
| BALANCE — December 31, 2008 | 75,465,437 |
| | 755,000 |
| | 673,351,000 |
| | (74,786,000 | ) | | 599,320,000 |
|
| Issuance of common stock | 62,696,254 |
| | 627,000 |
| | 622,025,000 |
| | — |
| | 622,652,000 |
|
| Offering costs | — |
| | — |
| | (64,793,000 | ) | | — |
| | (64,793,000 | ) |
| Issuance of restricted common stock | 100,000 |
| | — |
| | — |
| | — |
| | — |
|
| Amortization of nonvested share-based compensation | — |
| | — |
| | 816,000 |
| | — |
| | 816,000 |
|
| Issuance of common stock under the DRIP | 4,059,006 |
| | 40,000 |
| | 38,519,000 |
| | — |
| | 38,559,000 |
|
| Repurchase of common stock | (1,730,011 | ) | | (17,000 | ) | | (16,249,000 | ) | | — |
| | (16,266,000 | ) |
| Distributions | — |
| | — |
| | — |
| | (82,221,000 | ) | | (82,221,000 | ) |
| Adjustment to redeemable noncontrolling interests | — |
| | — |
| | (1,673,000 | ) | | — |
| | (1,673,000 | ) |
| Net loss attributable to controlling interest | — |
| | — |
| | — |
| | (25,077,000 | ) | | (25,077,000 | ) |
| BALANCE — December 31, 2009 | 140,590,686 |
| | $ | 1,405,000 |
| | $ | 1,251,996,000 |
| | $ | (182,084,000 | ) | | $ | 1,071,317,000 |
|
| Issuance of common stock | 61,191,096 |
| | 615,000 |
| | 594,062,000 |
| | — |
| | 594,677,000 |
|
| Offering costs | — |
| | — |
| | (56,621,000 | ) | | — |
| | (56,621,000 | ) |
| Issuance of restricted common stock | 357,500 |
| | — |
| | — |
| | — |
| | — |
|
| Amortization of nonvested share-based compensation | — |
| | — |
| | 1,313,000 |
| | — |
| | 1,313,000 |
|
| Issuance of common stock under the DRIP | 5,952,683 |
| | 60,000 |
| | 56,491,000 |
| | — |
| | 56,551,000 |
|
| Repurchase of common stock | (5,448,260 | ) | | (54,000 | ) | | (51,802,000 | ) | | — |
| | (51,856,000 | ) |
| Distributions | — |
| | — |
| | — |
| | (120,507,000 | ) | | (120,507,000 | ) |
| Adjustment to redeemable noncontrolling interests | — |
| | — |
| | (26,000 | ) | | 301,000 |
| | 275,000 |
|
| Net loss attributable to controlling interest | — |
| | — |
| | — |
| | (7,903,000 | ) | | (7,903,000 | ) |
| BALANCE — December 31, 2010 | 202,643,705 |
| | $ | 2,026,000 |
| | $ | 1,795,413,000 |
| | $ | (310,193,000 | ) | | $ | 1,487,246,000 |
|
| Issuance of common stock | 21,682,071 |
| | 216,000 |
| | 214,425,000 |
| | — |
| | 214,641,000 |
|
| Offering costs | — |
| | — |
| | (18,896,000 | ) | | — |
| | (18,896,000 | ) |
| Issuance of restricted common stock | 62,500 |
| | 1,000 |
| | (1,000 | ) | | — |
| | — |
|
| Amortization of nonvested share-based compensation | — |
| | — |
| | 3,221,000 |
| | — |
| | 3,221,000 |
|
| Issuance of common stock under the DRIP | 7,985,655 |
| | 80,000 |
| | 75,784,000 |
| | — |
| | 75,864,000 |
|
| Repurchase of common stock | (3,882,619 | ) | | (39,000 | ) | | (37,641,000 | ) | | — |
| | (37,680,000 | ) |
| Distributions | — |
| | — |
| | — |
| | (162,597,000 | ) | | (162,597,000 | ) |
| Net income attributable to controlling interest | — |
| | — |
| | — |
| | 5,541,000 |
| | 5,541,000 |
|
| BALANCE — December 31, 2011 | 228,491,312 |
| | $ | 2,284,000 |
| | $ | 2,032,305,000 |
| | $ | (467,249,000 | ) | | $ | 1,567,340,000 |
|
|
| | | | | | | | | | | |
| | Year Ended December 31, |
| | 2013 | | 2012 | | 2011 |
| Cash flows from operating activities: | | | | | |
| Net income (loss) | $ | 24,684 |
| | $ | (24,368 | ) | | $ | 5,593 |
|
| Adjustments to reconcile net income (loss) to net cash provided by operating activities: | | | | | |
| Depreciation, amortization and other | 119,904 |
| | 114,575 |
| | 104,045 |
|
| Share-based compensation expense | 5,648 |
| | 17,408 |
| | 3,221 |
|
| Bad debt expense | 453 |
| | 1,064 |
| | 1,447 |
|
| Change in fair value of derivative financial instruments | (10,796 | ) | | 7,667 |
| | 856 |
|
| Changes in operating assets and liabilities: | | | | | |
| Receivables and other assets, net | (15,931 | ) | | (4,765 | ) | | (2,964 | ) |
| Accounts payable and accrued liabilities | 14,789 |
| | 2,684 |
| | 295 |
|
| Security deposits, prepaid rent and other liabilities | 9,073 |
| | 2,520 |
| | (686 | ) |
| Net cash provided by operating activities | 147,824 |
| | 116,785 |
| | 111,807 |
|
| Cash flows from investing activities: | | | | | |
| Acquisition of real estate operating properties and other assets | (340,307 | ) | | (257,386 | ) | | (61,385 | ) |
| Capital expenditures | (25,382 | ) | | (22,909 | ) | | (16,034 | ) |
| Issuance of real estate notes receivable | (8,520 | ) | | — |
| | — |
|
| Restricted cash, escrow deposits and notes receivable | (491 | ) | | (4,830 | ) | | (4,502 | ) |
| Release of restricted cash | — |
| | 580 |
| | 14,463 |
|
| Real estate deposits paid | — |
| | (3,810 | ) | | (4,500 | ) |
| Real estate deposits used | — |
| | 4,810 |
| | 6,000 |
|
| Net cash used in investing activities | (374,700 | ) | | (283,545 | ) | | (65,958 | ) |
| Cash flows from financing activities: | | | | | |
| Proceeds from unsecured senior notes | 297,558 |
| | — |
| | — |
|
| Borrowings on unsecured revolving credit facility | 158,000 |
| | 360,000 |
| | — |
|
| Payments on unsecured revolving credit facility | (175,000 | ) | | (288,000 | ) | | (7,000 | ) |
| Borrowings on unsecured term loans | — |
| | 455,000 |
| | — |
|
| Borrowings on secured real estate term loan and mortgage loans | — |
| | — |
| | 125,500 |
|
| Payments on secured real estate term loan and mortgage loans | (156,963 | ) | | (128,601 | ) | | (192,083 | ) |
| Deferred financing costs | (3,651 | ) | | (6,436 | ) | | (3,401 | ) |
| Derivative financial instrument termination payments | (1,195 | ) | | — |
| | — |
|
| Security deposits | 1,225 |
| | 765 |
| | 596 |
|
| Proceeds from issuance of general partner units, net | 240,657 |
| | — |
| | 214,641 |
|
| Repurchase and cancellation of general partner units | (522 | ) | | (182,602 | ) | | (37,680 | ) |
| Payment of offering costs | — |
| | (2,884 | ) | | (21,137 | ) |
| Distributions to general partner | (129,360 | ) | | (93,273 | ) | | (84,800 | ) |
| Payment on earnout liability | (92 | ) | | (328 | ) | | — |
|
| Distributions to limited partners and redeemable noncontrolling interests | (1,656 | ) | | (416 | ) | | (264 | ) |
| Net cash provided by (used in) financing activities | 229,001 |
| | 113,225 |
| | (5,628 | ) |
| Net change in cash and cash equivalents | 2,125 |
| | (53,535 | ) | | 40,221 |
|
| Cash and cash equivalents - beginning of period | 15,956 |
| | 69,491 |
| | 29,270 |
|
| Cash and cash equivalents - end of period | $ | 18,081 |
| | $ | 15,956 |
| | $ | 69,491 |
|
The accompanying notes are an integral part of these consolidated financial statements.
Healthcare Trust of America, Inc.
CONSOLIDATED STATEMENTSHEALTHCARE TRUST OF CASH FLOWSAMERICA, INC. AND HEALTHCARE TRUST OF AMERICA HOLDINGS, LP
For the Years Ended December 31, 2011, 2010 and 2009
|
| | | | | | | | | | | |
| | | | | | |
| | Years Ended December 31, |
| | 2011 | | 2010 | | 2009 |
| CASH FLOWS FROM OPERATING ACTIVITIES | |
| | |
| | |
|
| Net income (loss) | $ | 5,593,000 |
| | $ | (7,919,000 | ) | | $ | (24,773,000 | ) |
| Adjustments to reconcile net income (loss) to net cash provided by operating activities: | |
| | |
| | |
|
| Depreciation and amortization (including deferred financing costs, above/below market leases, debt premium/discount, leasehold interests, deferred rent receivable, note receivable closing costs and discount, and lease inducements) | 104,045,000 |
| | 72,678,000 |
| | 48,808,000 |
|
| Share-based compensation, net of forfeitures | 3,221,000 |
| | 1,313,000 |
| | 816,000 |
|
| Loss on property insurance settlements | — |
| | — |
| | 6,000 |
|
| Bad debt expense | 1,447,000 |
| | 1,022,000 |
| | 965,000 |
|
| Change in fair value of derivative financial instruments | 856,000 |
| | (6,095,000 | ) | | (5,523,000 | ) |
| Changes in operating assets and liabilities: | |
| | |
| | |
|
| Accounts and other receivables, net | 2,424,000 |
| | (7,102,000 | ) | | (5,167,000 | ) |
| Other assets | (5,388,000 | ) | | (3,207,000 | ) | | (3,332,000 | ) |
| Accounts payable and accrued liabilities | 295,000 |
| | 7,815,000 |
| | 4,856,000 |
|
| Accounts payable due to affiliates, net | — |
| | (4,776,000 | ) | | 3,631,000 |
|
| Security deposits, prepaid rent and other liabilities | (686,000 | ) | | 4,774,000 |
| | 1,341,000 |
|
| Net cash provided by operating activities | 111,807,000 |
| | 58,503,000 |
| | 21,628,000 |
|
| CASH FLOWS FROM INVESTING ACTIVITIES | |
| | |
| | |
|
| Acquisition of real estate operating properties | (61,385,000 | ) | | (597,097,000 | ) | | (402,268,000 | ) |
| Acquisition of real estate notes receivable | — |
| | — |
| | (37,135,000 | ) |
| Acquisition costs related to real estate notes receivable | — |
| | — |
| | (555,000 | ) |
| Capital expenditures | (16,034,000 | ) | | (14,888,000 | ) | | (9,060,000 | ) |
| Restricted cash and escrow deposits | (4,502,000 | ) | | (12,614,000 | ) | | (6,318,000 | ) |
| Release of restricted cash | 14,463,000 |
| | — |
| | — |
|
| Real estate deposits | — |
| | (2,250,000 | ) | | (250,000 | ) |
| Real estate deposits paid | (4,500,000 | ) | | — |
| | — |
|
| Real estate deposits used | 6,000,000 |
| | — |
| | — |
|
| Proceeds from insurance settlement | — |
| | — |
| | 481,000 |
|
| Net cash used in investing activities | (65,958,000 | ) | | (626,849,000 | ) | | (455,105,000 | ) |
| CASH FLOWS FROM FINANCING ACTIVITIES | |
| | |
| | |
|
| Borrowings on mortgage loans payable and secured real estate term loan | 125,500,000 |
| | 79,125,000 |
| | 37,696,000 |
|
| Purchase of noncontrolling interest | — |
| | (4,097,000 | ) | | — |
|
| (Payments) borrowings under the unsecured revolving credit facility | (7,000,000 | ) | | 7,000,000 |
| | — |
|
| Payments on mortgage loans payable and demand note | (192,083,000 | ) | | (123,117,000 | ) | | (11,671,000 | ) |
| Derivative financial instrument termination payments | — |
| | (793,000 | ) | | — |
|
| Proceeds from issuance of common stock | 214,641,000 |
| | 594,677,000 |
| | 622,652,000 |
|
| Deferred financing costs | (3,401,000 | ) | | (7,507,000 | ) | | (792,000 | ) |
| Security deposits | 596,000 |
| | 2,144,000 |
| | 767,000 |
|
| Repurchase of common stock | (37,680,000 | ) | | (51,856,000 | ) | | (16,266,000 | ) |
| Payment of offering costs | (21,137,000 | ) | | (56,621,000 | ) | | (68,360,000 | ) |
| Distributions | (84,800,000 | ) | | (60,176,000 | ) | | (39,500,000 | ) |
| Distributions to noncontrolling interest of limited partners | (264,000 | ) | | (164,000 | ) | | (379,000 | ) |
| Net cash used in financing activities | (5,628,000 | ) | | 378,615,000 |
| | 524,147,000 |
|
| NET CHANGE IN CASH AND CASH EQUIVALENTS | 40,221,000 |
| | (189,731,000 | ) | | 90,670,000 |
|
| CASH AND CASH EQUIVALENTS — Beginning of period | 29,270,000 |
| | 219,001,000 |
| | 128,331,000 |
|
| CASH AND CASH EQUIVALENTS — End of period | $ | 69,491,000 |
| | $ | 29,270,000 |
| | $ | 219,001,000 |
|
| SUPPLEMENTAL DISCLOSURE OF CASH FLOW INFORMATION: | |
| | |
| | |
|
| Cash paid for: | |
| | |
| | |
|
| Interest | $ | 38,288,000 |
| | $ | 30,438,000 |
| | $ | 27,623,000 |
|
| Income taxes | $ | 1,045,000 |
| | $ | 345,000 |
| | $ | 337,000 |
|
| SUPPLEMENTAL DISCLOSURE OF NONCASH ACTIVITIES: | |
| | |
| | |
|
| Investing Activities: | |
| | |
| | |
|
| Accrued capital expenditures | $ | 5,448,000 |
| | $ | 2,768,000 |
| | $ | 1,783,000 |
|
| The following represents the significant increase in certain assets & liabilities in connection with our acquisitions of real estate investments & notes receivable: | |
| | |
| | |
|
| Assumed mortgage loan payable, net | $ | 6,657,000 |
| | $ | 190,294,000 |
| | $ | 52,965,000 |
|
|
| | | | | | | | | | | |
| Net change in security deposits, prepaid rent, and other liabilities | $ | — |
| | $ | 14,552,000 |
| | $ | — |
|
| Issuance of operating partnership units in connection with Fannin acquisition | $ | — |
| | $ | 1,557,000 |
| | $ | — |
|
| Financing Activities: | |
| | |
| | |
|
| Issuance of common stock under the DRIP | $ | 75,864,000 |
| | $ | 56,551,000 |
| | $ | 38,559,000 |
|
| Distributions declared but not paid including stock issued under the DRIP | $ | 14,120,000 |
| | $ | 12,317,000 |
| | $ | 8,555,000 |
|
| Adjustment to redeemable noncontrolling interests | $ | — |
| | $ | (275,000 | ) | | $ | 1,673,000 |
|
The accompanying notes are an integral part of these consolidated financial statements.
Healthcare Trust of America, Inc.
NOTES TO CONSOLIDATED FINANCIAL STATEMENTS
ForUnless otherwise indicated or unless the Years Ended December 31, 2011, 2010, and 2009
Thecontext requires otherwise the use of the words “we,” “us” or “our” refers to Healthcare Trust of America, Inc. and its subsidiaries, including Healthcare Trust of America Holdings, LP, except where the context otherwise requires.collectively.
1. Organization and Description of Business
Healthcare Trust of America, Inc., a Maryland corporation, wasand Healthcare Trust of America Holdings, LP, a Delaware limited partnership, were incorporated or formed, as applicable, on April 20, 2006. We were initially capitalized onHealthcare Trust of America, Inc., or HTA, operates as a real estate investment trust, or REIT, and is the general partner of Healthcare Trust of America Holdings, LP, or HTALP, which is the operating partnership. As of April 28, 2006December 31, 2013, HTA owned a 98.94% partnership interest and consider thatother limited partners, including some of HTA’s directors, executive officers and their affiliates, owned the remaining partnership interest (including the long term incentive plan, or LTIP, units) in HTALP. As the sole general partner of HTALP, HTA has the full, exclusive and complete responsibility for HTALP’s day-to-day management and control. HTA operates in an umbrella partnership REIT structure in which HTALP and its subsidiaries hold substantially all of the assets. HTA’s only material asset is its ownership of partnership interests of HTALP. As a result, HTA does not conduct business itself, other than acting as the sole general partner of HTALP, issuing public equity from time to be our datetime and guaranteeing certain debts of inception.HTALP. HTALP conducts the operations of the business and has no publicly traded equity.
We areHTA is a fully integrated, self-administered and self-managed real estate investment trust, or REIT. Accordingly, our internal management team manages our day-to-day operationsinternally managed REIT and oversees and supervises our employees and outside service providers. Acquisitions and asset management services are performed in-house by our employees, with certain monitored services provided by third parties at market rates. We do not pay acquisition, disposition, or asset management fees to an external advisor, and we have not and will not pay any internalization fees.
We provide stockholdersis one of the potential for income and growth through investment in a diversified portfolio of real estate properties. We focus primarilylargest publicly-traded REITs focused on medical office buildings in the United States based on gross leasable area, or GLA. We are primarily focused on acquiring, owning and other facilitiesoperating high-quality medical office buildings that serve theare predominantly located on, or aligned with, campuses of nationally or regionally recognized healthcare industry. We also invest to a limited extent in other real estate-related assets, such as mortgage loans receivable. However, we do not presently intend to invest more than 15.0% of our total assets in such other real estate-related assets. We focus primarily on investments that produce recurring income. Subject to the discussion in Note 11, Commitments and Contingencies, we believe thatsystems. In addition, we have strong industry relationships, a stable and diversified tenant mix, and an extensive and active acquisition network. Our primary objective is to maximize stockholder value with disciplined growth through strategic investments and to provide an attractive risk-adjusted return for our stockholders by consistently increasing our cash flow. In pursuing this objective, we (i) target mid-sized acquisitions of high-quality medical office buildings in markets with dominant healthcare systems, attractive demographics and that complement our existing portfolio, (ii) actively manage our balance sheet to maintain flexibility with conservative leverage, and (iii) seek internal growth through proactive asset management, leasing and property management oversight. HTA has qualified to be taxed as a REIT for federal income tax purposes and we intendintends to continue to be taxed as a REIT. We conduct substantially all of our operations through Healthcare Trust of America Holdings, LP, or our operating partnership.
We invest primarily in high-quality medical office buildings in our target markets, and have acquired high-quality medical office buildings and other facilities that serve the healthcare industry with an aggregate purchase price of approximately $3.0 billion through December 31, 2013. As of December 31, 20112013, we had madeour portfolio consisted of 79269 portfolio acquisitions, which includes 248medical office buildings and two mortgage loans receivable. The aggregate purchase price of these acquisitions was $2,334,673,000.19 other facilities that serve the healthcare industry, as well as real estate notes receivables secured by medical office buildings.
On September 20, 2006June 6, 2012, we commencedHTA listed its Class A common stock on the New York Stock Exchange, or the NYSE, or the Listing. In accordance with an amendment to HTA’s charter approved by stockholders on December 20, 2010, all of HTA’s common stock was converted into shares of Class A, Class B-1, Class B-2 and Class B-3 common stock. The Class B common stock was identical to the Class A common stock except that the Class B common stock was not listed on a best efforts initial public offering, or our initial offering, in which we offered up to 200,000,000national securities exchange. The shares of the Class B-1, Class B-2 and Class B-3 common stock converted into shares of our Class A common stock foron $10.00December 6, 2012 per share, June 6, 2013, and up toNovember 7, 2013, respectively. As of 21,052,632December 31, 2013, there were no shares of ourClass B common stock pursuant to our distribution reinvestment plan, or the DRIP, at $9.50 per share, aggregating up to $2,200,000,000. On March 19, 2010, we commenced a best efforts follow-on public offering, or our follow-on offering, in which we offered up to 200,000,000 shares of our common stock for $10.00 per share in our primary offering and up to 21,052,632 shares of our common stock pursuant to the DRIP at $9.50 per share, aggregating up to $2,200,000,000. We stopped offering shares in the primary offering on February 28, 2011. We continue to offer shares pursuant to the DRIP; however, we may terminate the DRIP at any time. In aggregate, we received and accepted subscriptions in our initial and follow-on offerings for 220,673,545 shares of our common stock, or $2,195,655,000, excluding shares of our common stock issued under the DRIP.outstanding.
Our principal executive offices are located at 16435 N. Scottsdale Road, Suite 320, Scottsdale, Arizona, 85254. Our telephone number is (480) 998-3478. For investor services, contact DST Systems, Inc. by telephone at (888) 801-0107.
2. Summary of Significant Accounting Policies
The summary of significant accounting policies presented below is designed to assist in understanding our consolidated financial statements. Such consolidated financial statements and the accompanying notes are the representations of our management, who are responsible for their integrity and objectivity. These accounting policies conform to accounting principles generally accepted in the United States of America, or GAAP, in all material respects, and have been consistently applied in preparing our accompanying consolidated financial statements.
Basis of Presentation
Our accompanying consolidated financial statements include our accounts and those of our operating partnership, the wholly-owned subsidiaries of our operating partnership and any consolidated variable interest entities, or VIEs, as defined in the Financial Accounting Standards Board, or the FASB, Accounting Standard Codification, or ASC, 810, Consolidation, or ASC 810.VIEs. All significant intercompanyinter-company balances and transactions have been eliminated in the accompanying consolidated financial statements. We operate in an umbrella partnership REIT, or UPREIT, structure in which wholly-owned subsidiaries of our operating partnership own all of the properties acquired on our behalf. We are the sole general partner of our operating partnership and as of December 31, 2011 and December 31, 2010, we owned an approximately 99.93% and an approximately 99.92%, respectively, general partner interest in our operating partnership. As of December 31, 2011 and 2010, approximately 0.07% and 0.08%, respectively, of our operating partnership was owned by certain physician investors who obtained limited partner interests in connection with the Fannin acquisition (see Note 13).
HEALTHCARE TRUST OF AMERICA, INC. AND HEALTHCARE TRUST OF AMERICA HOLDINGS, LP
NOTES TO CONSOLIDATED FINANCIAL STATEMENTS —– (Continued)
BecauseReclassifications
To better present our real estate related balances, we have chosen to break out the details of real estate investments (net) in our balance sheet as opposed to disclosing the details in a footnote. In addition, we have reclassified certain accounts, as further discussed below, in HTA’s previously issued balance sheet to conform to current period presentation. In place leases and tenant relationship intangibles are now included in real estate investments (net) as lease intangibles. In addition, accounts and other receivables (net) have been combined with receivables and other assets (net). None of the sole general partnerrevised reclassifications reflect corrections of any amounts. The following table presents the previously reported balances and the reclassified balances for the impacted line items of the December 31, 2012 balance sheet (in thousands):
|
| | | | | | | | |
| | | December 31, 2012 |
| | | As Previously Reported | | As Reclassified |
| Real estate investments: | | | | |
| Land | | $ | — |
| | $ | 183,651 |
|
| Building and improvements | | — |
| | 2,044,113 |
|
| Lease intangibles | | — |
| | 352,884 |
|
| | | — |
| | 2,580,648 |
|
| Accumulated depreciation and amortization | | — |
| | (349,118 | ) |
| Real estate investments, net | | 1,992,607 |
| | 2,231,530 |
|
| Accounts and other receivables, net | | 13,317 |
| | — |
|
| Receivables and other assets, net | | 71,653 |
| | 84,970 |
|
| Other intangibles, net | | 282,934 |
| | 44,011 |
|
During 2013, we classified one of our operating partnership and have unilateral control over its management and major operating decisions (even if additional limited partners are admitted to our operating partnership), the accounts of our operating partnership are consolidated in our consolidated financial statements.
In our previously issuedproperties as held for sale. The statements of operations for the years ended December 31, 20102012 and 2009, interest expense related to our derivative financial instruments in the amounts of $8,911,000 and $10,201,000, respectively, was presented within the line item entitled "Interest expense related to mortgage loans payable, credit facility, and derivative instruments". These amounts2011 have been reclassified to conform with current year presentation with respect to current-period presentation and are now included within the line item entitled "Interest expense related to derivative financial instruments and net change in fair valueoperations of derivative financial instruments" in our consolidated statements of operations.the property classified as held for sale. See Note 7 for further discussion.
Use of Estimates
The preparation of our consolidated financial statements in conformity with GAAP requires management to make estimates and assumptions that affect the reported amounts of assets, liabilities, revenues and expenses, and related disclosure of contingent assets and liabilities. These estimates are made and evaluated on an on-goingongoing basis using information that is currently available as well as various other assumptions believed to be reasonable under the circumstances. Actual results could differ from those estimates, perhaps in adverse ways, and those estimates could be different under different assumptions or conditions.
Cash and Cash Equivalents
Cash and cash equivalents consist of all highly liquid investments with a maturity of three months or less when purchased.
Restricted Cash
Restricted cash is comprised of impound reserve accounts for property taxes, insurance, capital improvements and tenant improvements as well as collateral accounts for debt and interest rate swaps.
Revenue Recognition, Tenant Receivables and Allowance for Uncollectible Accounts
In accordance with ASC 840, Leases, or ASC 840, minimumMinimum annual rental revenue is recognized on a straight-line basis over the term of the related lease (including rent holidays). Differences between rental income recognized and amount contractually due under the lease agreements will beare credited or charged, as applicable, to straight-line rent receivable.receivables. Tenant reimbursement revenue, which is comprised of additional amounts recoverable from tenants for common area maintenance expenses and certain other recoverable expenses, is recognized as revenue in the period in which the related expenses are incurred. Tenant reimbursements are recognized and presented in accordance with ASC 605-45, Revenue — Principal Agent Considerations. This guidance requires that these reimbursements be recorded on a gross basis, as we are generally the primary obligor with respect to purchasing goods and services from third-party suppliers, have discretion in selecting the supplier, and have credit risk. We recognize lease termination fees ifwhen there is a signed termination letter agreement, all of the conditions of the agreement have been met, and the tenant is no longer occupying the property. Rental income is reported net of amortization recorded on lease inducements.
HEALTHCARE TRUST OF AMERICA, INC. AND HEALTHCARE TRUST OF AMERICA HOLDINGS, LP
NOTES TO CONSOLIDATED FINANCIAL STATEMENTS – (Continued)
Tenant receivables and unbilled deferredstraight-line rent receivables are carried net of the allowances for uncollectible current tenant receivables and unbilled deferred rent.amounts. An allowance is maintained for estimated losses resulting from the inability of certain tenants to meet the contractual obligations under their leases. We maintain an allowance for deferred rent receivables arising from the straight-lining of rents. Such allowance is charged to bad debt expense which is included in general and administrative expense onin our accompanying consolidated statementstatements of operations. Our determination of the adequacy of these allowances is based primarily upon evaluations of historical loss experience, the tenant’s financial condition, security deposits, letters of credit, lease guarantees and current economic conditions and other relevant factors. As of December 31, 2011, 2010,2013, 2012 and 2009,2011, we had $1,498,000, $1,926,000$2.1 million, $2.2 million and $1,222,000,$1.5 million, respectively, in allowances for uncollectible accounts as determined to be necessary to reduce receivables to our estimate of the amount recoverable.accounts. During the years ended December 31, 2011, 20102013, 2012 and 2009, $1,447,000, $1,022,000 and $965,000, respectively, of receivables was directly written off to2011, we recorded bad debt expense.expense of $0.5 million, $1.1 million and $1.4 million, respectively.
Purchase Price AllocationReal Estate Acquisitions
In accordance with ASC 805, Business Combinations, or ASC 805, we, withWith the assistance of independent valuation specialists, allocatewe record the purchase price of acquired properties tocompleted business acquisitions associated with tangible and identified intangible assets and liabilities based on their respective fair values. The allocation to tangible assets (building and land) isare determined based upon our determination of the value of the property as if it were to be replaced andor as if it were vacant using discounted cash flow models similar to those used by independent
Healthcare Trust of America, Inc.
NOTES TO CONSOLIDATED FINANCIAL STATEMENTS — (Continued)
appraisers.market participants. Factors considered by us include an estimate of carrying costs during the expected lease-up periods considering current market conditions and costs to execute similar leases. Additionally, the purchase price of the applicable completed acquisition property is allocated to theinclusive of above or below market value of in place leases, the value ofabove or below market leasehold interests, in place leases, tenant relationships, and above or below market debt assumed.assumed, interest rate swaps assumed and any contingent consideration.
The value allocable to theof above or below market componentleases is determined based upon the present value (using a discount rate which reflects the risks associated with the acquired leases) of the difference between: (1) the contractual amounts to be received pursuant to the lease over its remaining term; and (2) our estimate of the amounts that would be received using fair market rates over the remaining term of the lease including any bargain renewal periods. The amounts associated with above market leases are included in other intangibles, net in our accompanying consolidated balance sheets and amortized to rental income over the remaining non-cancelable lease term of the acquired leases with each property. The amounts allocated to below market leases are included in placeintangible liabilities, net in our accompanying consolidated balance sheets and amortized to rental income over the remaining non-cancelable lease term plus any below market renewal options of the acquired leases with each property.
The value associated with above or below market leasehold interests is determined based upon the present value (using a discount rate which reflects the risks associated with the acquired leases) of the difference between: (1) the contractual amounts to be paid pursuant to the lease over its remaining term,term; and (2) our estimate of the amounts that would be paid using fair market rates over the remaining term of the lease including any bargain renewal periods, with respect to a below market lease.periods. The amounts allocated torecorded for above market leasesleasehold interests are included in identified intangible assets,liabilities, net in our accompanying consolidated balance sheets and amortized to rental incomeexpense over the remaining non-cancelable lease term of the acquired leases with each property. The amounts allocated to below market lease valuesleasehold interests are included in identified intangible liabilities,other intangibles, net in our accompanying consolidated balance sheets and amortized to rental incomeexpense over the remaining non-cancelable lease term plus any below market renewal options of the acquired leases with each property.
The total amount of other intangible assets acquired is further allocated toincludes in place lease costsleases and the value of tenant relationships based on our evaluation of the specific characteristics of each tenant’s lease and our overall relationship with that respective tenant. Characteristics considered by us in allocating these values include the nature and extent of the credit quality and expectations of lease renewals, among other factors. The amounts allocated torecorded for in place lease costsleases are included in identified intangible assets, netlease intangibles in our accompanying consolidated balance sheets and will be amortized to amortization expense over the average remaining non-cancelable lease term of the acquired leases with each property. The amounts allocated to the value ofrecorded for tenant relationships are included in identified intangible assets, netlease intangibles in our accompanying consolidated balance sheets and are amortized to amortization expense over the average remaining non-cancelable lease term of the acquired leases plus a market lease term.
The value allocable torecorded for above or below market debt is determined based upon the present value of the difference between the cash flow stream of the assumed mortgage and the cash flow stream of a market rate mortgage. The amounts allocated torecorded for above or below market debt are included in mortgage loans payable,debt, net on our accompanying consolidated balance sheets and are amortized to interest expense over the remaining term of the assumed mortgage.debt.
These allocations are subjectThe value recorded for interest rate swaps is based upon a discounted cash flow analysis on the expected cash flows, taking into account interest rate curves and the period to change based on information received within one yearmaturity. See derivative financial instruments below for further discussion.
We record contingent consideration at fair value as of the purchase related to one or more events identified atacquisition date and reassess the time of purchase which confirm thefair value of an asset or liability received in an acquisition of property.
On January 1, 2009, in accordance with the provisions of ASC 805, Business Combinations, we began to expense acquisition-related costs for acquisitions. Prior to this date, acquisition-related expenses had been capitalized as part of the purchase price allocations. We expensed $2,130,000, end of each reporting period, with any changes being recognized in earnings.
HEALTHCARE TRUST OF AMERICA, INC. AND HEALTHCARE TRUST OF AMERICA HOLDINGS, LP
$11,317,000 and $15,997,000 for acquisition related expenses during the years ended December 31, 2011, 2010, and 2009 respectively.NOTES TO CONSOLIDATED FINANCIAL STATEMENTS – (Continued)
Real Estate Investments Net
Operating properties are carried at the lower of historical cost less accumulated depreciation or fair value less costs to sell. The cost of operating properties includes the cost of land and completed buildings and related improvements. Expenditures that increase the service life of properties are capitalized and the cost of maintenance and repairs is charged to expense as incurred. The cost of buildings is depreciated on a straight-line basis over the estimated useful lives of the buildings up to 39 years and for tenant improvements, the shorter of the lease term or useful life, ranging from one month to 240 months, respectively. Furniture, fixtures and equipment is depreciated over five years. When depreciable property is retired, replaced or disposed of, the related costs and accumulated depreciation are removed from the accounts and any gain or loss is reflected in operations. Depreciation expense of buildings and improvements for the years ended December 31, 2013, 2012 and 2011, was $75.5 million, $71.4 million and $64.4 million, respectively.
Investment in Real Estate Held-for-SaleHeld For Sale
We evaluateconsider properties as held for sale once management commits to a plan to sell the held-for-sale classification of our owned real estate each quarter. Assetsproperty and has determined that are classifiedthe sale is probable and expected to occur within one year. Upon designation as held-for-sale are recordedheld for sale, we record the property at the lower of theirits carrying amount or fair value, less costcosts to sell.sell, and cease depreciation and amortization. The fair value is generally based on discounted cash flow analyses, which involve management’s best estimate of market participants’ holding period, market comparables, future occupancy levels, rental rates, capitalization rates, lease-up periods, and capital requirements. Assets are generally classified as held-for-sale once management commits to a plan to sell the properties and has determined that the sale of the asset is probable and transfer of the asset is expected to occur within one year. The results of operations of these real estate properties classified as held for sale are reflected as discontinued operations infor all periods reported and the propertiesmajor classes of assets and liabilities are presented separately on ourin the balance sheet at the lower of their carrying value or their fair value less costs to sell.sheet. As of December 31, 20112013, we determined that no buildinghad one property within our portfolio should be classified as held-for-sale.held-for-sale, see Note 7.
Healthcare Trust of America, Inc.
NOTES TO CONSOLIDATED FINANCIAL STATEMENTS — (Continued)
Recoverability of Real Estate Investments
An operating property isOperating properties are evaluated for potential impairment whenever events or changes in circumstances indicate that its carrying amount may not be recoverable. Impairment losses are recorded on an operating property when indicators of impairment are present and the carrying amount of the asset is greater than the sum of the future undiscounted cash flows expected to be generated by that asset.asset over the remaining expected hold period. We would recognize an impairment loss when the carrying amount is not recoverable to the extent the carrying amount exceeded the fair value of the property. The fair value of the property is generally based on discounted cash flow analyses, which involve management’s best estimate of market participants’ holding periods, market comparables, future occupancy levels, rental rates, capitalization rates, lease-up periods, and capital requirements. For the years ended December 31, 20112013, 2010,2012 and 2009,2011, there were no impairment losses recorded.losses.
Real Estate Notes Receivable Net
RealWe evaluate the carrying values of real estate notes receivable consiston an individual basis. Management periodically evaluates the realizability of mortgage loans. Interest incomefuture cash flows from loans is recognizedreal estate notes receivable when events or circumstances, such as earned based upon the non-receipt of principal amount outstanding. Mortgage loans are collateralized by interests in real property. We record loans at cost. We evaluateand interest payments and/or significant deterioration of the collectabilityfinancial condition of both interest and principal for each of our loans to determine whether they are impaired. A loan is considered impaired when, based on current information and events, it is probablethe borrower, indicate that we will be unable to collect all amounts due according to the existing contractual terms. When a loan is considered to be impaired, thecarrying amount of the allowancereal estate notes receivable may not be recoverable. An impairment loss is recognized in current period earnings and is calculated by comparingas the recorded investment to eitherdifference between the value determined by discountingcarrying amount of the expected futurereal estate notes receivable and the discounted cash flows using the loans effective interest rateexpected to be received, or toif foreclosure is probable, the fair value of the collateral ifsecuring the loan is collateral dependent.real estate notes receivable. For the years ended December 31, 2013, 2012 and 2011, there were no impairment losses.
Derivative Financial Instruments
We are exposed to the effect of interest rate changes in the normal course of business. We seek to mitigate these risks by following established risk management policies and procedures which include the occasional use of derivatives. Our primary strategy in entering into derivative contracts is to add stability to interest expense and to manage our exposure to interest rate movements. We utilize derivative instruments, including interest rate swaps and caps,swap, to effectively convert a portion of our variable rate debt to fixed rate debt. We do not enter into derivative instruments for speculative purposes.
Derivatives are recognized as either assets or liabilities in our consolidated balance sheets and are measured at fair value in accordance with ASC 815, Derivatives and Hedging, or ASC 815.value. Since our derivative instruments are not designated as hedge instruments, they do not qualify for hedge accounting, under ASC 815, and accordingly, changes in fair value are included as a component of interest expense in our consolidated statements of operations in the period of change.
Fair Value Measurements
ASC 820, Fair Value Measurements and Disclosures, or ASC 820, defines fair value, establishes a framework for measuring fair value, and expands disclosures about fair value measurements. ASC 820 applies to reported balances that are required or permitted to be measured at fair value under existing accounting pronouncements; accordingly, the standard does not require any new fair value measurements of reported balances. We have provided these disclosures in Note 15, Fair Value of Financial Instruments.
Other Assets, Net
Other assets consist primarily of deferred rent receivables, lease inducements, leasing commissions, prepaid expenses, deposits and deferred financing costs. Costs incurred for property leasing have been capitalized as deferred assets. Deferred leasing costs include leasing commissions that are amortized using the straight-line method over the term of the related lease. Deferred financing costs include amounts paid to lenders and others to obtain financing. Such costs are amortized using the straight-line method over the term of the related loan, which approximates the effective interest rate method. Amortization of deferred financing costs is included in interest expense in our accompanying consolidated statements of operations. This section also includes depreciation of fixed assets not associated with our portfolio of properties.
Stock Compensation
We follow ASC 718, Compensation — Stock Compensation, to account for our stock compensation pursuant to our 2006 Incentive Plan and the 2006 Independent Directors Compensation Plan, a sub-plan of our 2006 Incentive Plan. See Note 14, Stockholders’ Equity — 2006 Incentive Plan and Independent Directors Compensation Plan, for a further discussion of grants under our 2006 Incentive Plan.
HEALTHCARE TRUST OF AMERICA, INC. AND HEALTHCARE TRUST OF AMERICA HOLDINGS, LP
NOTES TO CONSOLIDATED FINANCIAL STATEMENTS —– (Continued)
Redeemable Noncontrolling Interests
Redeemable noncontrolling interests relate toThe valuation of these instruments is determined with the interests in our consolidated entitiesassistance of an independent valuation specialist using a proprietary model that are not wholly owned by us. As these redeemable noncontrolling interests provide for redemption features not solely withinutilizes widely accepted valuation techniques, including discounted cash flow analysis on the controlexpected cash flows of each derivative, and observable inputs. The proprietary model reflects the contractual terms of the issuer, we classify such interests outside of permanent equity in accordance with ASC 480-10, Distinguishing Liabilities from Equity.
Income Taxes
Subjectderivatives, including the period to the discussion in Note 11, Commitmentsmaturity, and Contingencies, regarding the closing agreement that we have entered into with the IRS, we believe that we have qualified to be taxed as a REIT beginning with our taxable year ended December 31, 2007 under Sections 856 through 860 of the Code, for federal income tax purposes and we intend to continue to qualify to be taxed as a REIT. To continue to qualify as a REIT for federal income tax purposes, we must meet certain organizational and operational requirements,uses observable market-based inputs, including a requirement to pay distributions to our stockholders of at least 90.0% of our annual taxable income (computed without regard to the dividends paid deduction and excluding net capital gain). As a REIT, we generally are not subject to federal income tax on net income that we distribute to our stockholders.
If we fail to qualify as a REIT in any taxable year, we will then be subject to federal income taxes on our taxable income and will not be permitted to qualify for treatment as a REIT for federal income tax purposes for four years following the year during which qualification is lost unless the Internal Revenue Service grants us relief under certain statutory provisions. Such an event could have a material adverse effect on our results of operations and net cash available for distribution to stockholders.
We follow ASC 740-10, Income Taxes, or ASC 740-10, and requires us to recognize, measure, present and disclose in our consolidated financial statements uncertain tax positions that we have taken or expect to take on. We do not have any liability for uncertain tax positions that we believe should be recognized in our consolidated financial statements.
Segment Disclosure
ASC 280, Segment Reporting, or ASC 280, which establishes standards for reporting financial and descriptive information about an enterprise’s reportable segment. We have determined that we have one reportable segment, with activities related to investing in medical office buildings, healthcare-related facilities, commercial office properties and other real estate- related assets. Our investments in real estate and other real estate-related assets are geographically diversified and our chief operating decision maker evaluates operating performance on an individual asset level. As each of our assets has similar economic characteristics, tenants, and products and services, our assets have been aggregated into one reportable segment.
Recently Issued Accounting Pronouncements
Below are the recently issued accounting pronouncements and our evaluation of the impact of such pronouncements.
Fair Value Pronouncements
In January 2010, the FASB issued Accounting Standards Update 2010-06, Fair Value Measurements and Disclosures (Topic 820), or ASU 2010-06, which provides amendments to Subtopic 820-10 that require new disclosures and that clarify existing disclosures in order to increase transparency in financial reporting with regard to recurring and nonrecurring fair value measurements. ASU 2010-06 requires new disclosures with respect to the amounts of significant transfers in and out of Level 1 and Level 2 fair value measurements and the reasons for those transfers, as well as separate presentation about purchases, sales, issuances, and settlements in the reconciliation for fair value measurements using significant unobservable inputs (Level 3). In addition, ASU 2010-06 provides amendments that clarify existing disclosures, requiring a reporting entity to provide fair value measurement disclosures for each class of assets and liabilities as well as disclosures about the valuation techniques and inputs used to measure fair value for both recurring and nonrecurring fair value measurements that fall in either Level 2 or Level 3. Finally, ASU 2010-06 amends guidance on employers’ disclosures about postretirement benefit plan assets under ASC 715 to require that disclosures be provided by classes of assets instead of by major categories of assets. ASU 2010-06 is effective for the interim and annual reporting periods beginning after December 15, 2009, except for the disclosures about purchases, sales, issuances, and settlements in the rollforward of activity in Level 3 fair value measurements, which are effective for fiscal years beginning after December 15, 2010. Accordingly, ASU 2010-06 became effective for us on January 1, 2010 (except for the Level 3 activity disclosures, which became effective for us on January 1, 2011). The adoption of ASU 2010-06 has not had a material impact on our consolidated financial statements.
In May 2011, the FASB issued Accounting Standards Update 2011-04, Amendments to Achieve Common Fair Value Measurement and Disclosure Requirements in U.S. GAAP and IFRS (Included in ASC 820, Fair Value Measurement), or ASU 2011-04, which amends existing guidance to provide common fair value measurements and related disclosure requirements between GAAP and International Financial Reporting Standards, or IFRS. Additional disclosure requirements in the
Healthcare Trust of America, Inc.
NOTES TO CONSOLIDATED FINANCIAL STATEMENTS — (Continued)
amendment include: (1) for Level 3 fair value measurements, a description of the valuation processes used by the entity and a discussion of the sensitivity of the fair value measurements to changes in unobservable inputs; (2) discussion of the use of a nonfinancial asset that differs from the asset's highest and best use; and (3) the level of the fair value hierarchy of financial instruments for items that are not measured at fair value but for which disclosure of fair value is required. ASU 2011-04 is effective for interim and annual periods beginning after December 15, 2011, with early adoption not permitted. We will adopt ASU 2011-04 in fiscal 2012. We are currently evaluating the impact ASU 2011-04 will have on our consolidated financial statements.
Business Combination Pronouncements
On December 21, 2010, the FASB issued ASU 2010-29, Disclosure of Supplementary Pro Forma Information for Business Combinations, to address differences in the ways entities have interpreted the requirements of ASC 805, Business Combinations, or ASC 805, for disclosures about pro forma revenue and earnings in a business combination. The ASU states that “if a public entity presents comparative financial statements, the entity should disclose revenue and earnings of the combined entity as though the business combination(s) that occurred during the current year had occurred as of the beginning of the comparable prior annual reporting period only.” In addition, the ASU “expand[s] the supplemental pro forma disclosures under ASC 805 to include a description of the nature and amount of material, nonrecurring pro forma adjustments directly attributable to the business combination included in the reported pro forma revenue and earnings.” The amendments in this ASU are effective prospectively for business combinations for which the acquisition date is on or after the beginning of the first annual reporting period beginning on or after December 15, 2010. The adoption of ASU 2010-29 has not had a material impact on our consolidated financial statements.
Other Pronouncements
In December 2011, the FASB issued ASU 2011-11, Balance Sheet (Topic 210) Disclosures about Offsetting Assets and Liabilities, or ASU 2011-11, the intention of which is to enhance current disclosures with respect to offsetting (netting) assets and liabilities and to minimize differences in presentation on the statement of financial position prepared in accordance with U.S. GAAP as compared to the statement of financial position prepared in accordance with International Financial Reporting Standards, or IFRS. Entities are required to disclose both gross information and net information about both instruments and transactions eligible for offset in the statement of financial position and instruments and transactions subject to an agreement similar to a master netting agreement. This scope would include derivatives, sale and repurchase agreements and reverse sale and repurchase agreements, and securities borrowing and securities lending arrangements. The amendments in ASU 2011-11 will require an entity to provide enhanced disclosures of information about offsetting and related arrangements to enable users of its financial statements to understand the effect of those arrangements on its financial position. Entities are required to apply the amendments for annual reporting periods beginning on or after January 1, 2013, and interim periods within those annual periods. An entity must provide the disclosures required by those amendments retrospectively for all comparative periods presented. We will adopt ASU 2011-11 in fiscal 2013. We are currently evaluating the impact ASU 2011-11 will have on our consolidated financial statements.
3. Real Estate Investments, Net
Investment in Operating Properties
Our investments in our consolidated properties consisted of the following as of December 31, 2011 and 2010:
|
| | | | | | | |
| | December 31, |
| | 2011 | | 2010 |
| Land | $ | 168,065,000 |
| | $ | 167,123,000 |
|
| Building and improvements | 1,803,174,000 |
| | 1,735,453,000 |
|
| Furniture and equipment | 15,000 |
| | 10,000 |
|
| | 1,971,254,000 |
| | 1,902,586,000 |
|
| Less: accumulated depreciation | (164,783,000 | ) | | (105,123,000 | ) |
| Total | $ | 1,806,471,000 |
| | $ | 1,797,463,000 |
|
Depreciation expense related to our portfolio of properties for the years ended December 31, 2011, 2010, and 2009 was $65,053,000, $48,724,000, and $32,456,000, respectively. Additionally, for the years ended December 31, 2011, 2010, and 2009, we recorded $513,000, $105,000, and $31,000, respectively, in depreciation expense related to furniture and equipment used in our corporate and regional offices.
Healthcare Trust of America, Inc.
NOTES TO CONSOLIDATED FINANCIAL STATEMENTS — (Continued)
At December 31, 2010, we determined that four buildings within our Senior Care 1 portfolio, which is a portfolio consisting of six buildings located in various cities throughout Texas and California, met the criteria for classification as held for sale properties. Accordingly, we separately presented the assets and liabilities of these buildings on our consolidated balance sheet and included the operations of such properties within discontinued operations on our consolidated statement of operations for all periods presented. Additionally, we ceased recording depreciation and amortization related to these properties following their held for sale designation. During the third quarter of 2011, further communication with the potential buyer indicated that the buyer was not going to purchase the properties, and we were not actively marketing these properties for sale to other third parties.
Based on these circumstances, on September 30, 2011, we deemed it appropriate to reclassify the assets and liabilities of these properties out of held for sale on our consolidated balance sheet and to include the results of their operations within those of our operating properties on our consolidated statement of operations for all periods presented. We measured the assets to be reclassified at the lower of their carrying amounts before they were classified as held for sale (adjusted for any depreciation and amortization expense that would have been recognized had the assets been continuously classified as held and used) or their fair value at the date of the subsequent decision not to sell. As a result of this reclassification, on September 30, 2011, we recorded catch-up depreciation and amortization expense of $851,000, which represented depreciation and amortization on these properties from January 1, 2011 through September 30, 2011.
Property Acquisitions in 2011
During the year ended December 31, 2011, we completed the acquisition of two new property portfolios as well as purchased additional buildings within two of our existing portfolios. The aggregate purchase price of these properties was $68,314,000. See Note 18, Business Combinations, for the allocation of the purchase price of the acquired properties to tangible assets and to identified intangible assets and liabilities based on their respective fair values. A portion of the aggregate purchase price for these acquisitions was initially financed or subsequently secured by $6,581,000 in mortgage loans payable. Total acquisition-related expenses of $2,130,000 include amounts for legal fees, closing costs, due diligence and other costs. Acquisitions completed during the year ended December 31, 2011 are set forth below:
|
| | | | | | | | | | | | | | |
| Property | | Property Location | | Date Acquired | | Ownership Percentage | | Purchase Price | | Mortgage
Loans Payable(1) |
| Phoenix Portfolio--Paseo (2) |
| Phoenix, AZ |
| 2/11/2011 |
| 100% |
| $ | 3,762,000 |
|
| $ | 2,147,000 |
|
| Columbia Portfolio--Northern Berkshire (2) |
| North Adams, MA |
| 2/16/2011 |
| 100 |
| 9,182,000 |
|
| 4,434,000 |
|
| Holston Medical Portfolio |
| Bristol, TN |
| 3/24/2011 |
| 100 |
| 23,370,000 |
|
| — |
|
| Desert Ridge Portfolio |
| Phoenix, AZ |
| 10/4/2011 |
| 100 |
| 32,000,000 |
|
| — |
|
| | | | | | | | | $ | 68,314,000 |
| | $ | 6,581,000 |
|
| |
(1) | Represents the amount of the mortgage loan payable assumed or newly placed on the property in connection with the acquisition or secured by the property subsequent to acquisition. |
| |
(2) | Represent purchases of additional medical office buildings during the year ended December 31, 2011 that are within portfolios we had previously acquired.
|
Property Acquisitions in 2010
During the year ended December 31, 2010, we completed the acquisition of 24 new property portfolios as well as purchased additional buildings within six of our existing portfolios. Additionally, we purchased the remaining 20.0% interest that we previously did not own in HTA-Duke Chesterfield Rehab, LLC, the JV Company that owns Chesterfield Rehabilitation Center. The aggregate purchase price of these properties was $806,048,000. A portion of the aggregate purchase price for these acquisitions was initially financed or subsequently secured by $218,538,000 in mortgage loans payable. Total acquisition-related expenses of $11,317,000 include amounts for legal fees, closing costs, due diligence and other costs. Acquisitions completed during the year ended December 31, 2010 are set forth below:
Healthcare Trust of America, Inc.
NOTES TO CONSOLIDATED FINANCIAL STATEMENTS — (Continued)
|
| | | | | | | | | | | | | | | | |
| Property | | Property Location | | Date Acquired | | Ownership Percentage | | Purchase Price | | Mortgage
Loans Payable(1) | |
| Camp Creek |
| Atlanta, GA |
| 3/2/2010 |
| 100 | % |
| $ | 19,550,000 |
|
| $ | — |
| |
| King Street |
| Jacksonville, FL |
| 3/9/2010 |
| 100 |
|
| 10,775,000 |
|
| 6,602,000 |
| |
| Sugarland |
| Houston, TX |
| 3/23/2010 |
| 100 |
|
| 12,400,000 |
|
| — |
| |
| Deaconess |
| Evansville, IN |
| 3/23/2010 |
| 100 |
|
| 45,257,000 |
|
| 21,250,000 |
| |
| Chesterfield Rehabilitation Center(2) |
| Chesterfield, MO |
| 3/24/2010 |
| 100 |
|
| 3,900,000 |
|
| — |
| |
| Pearland — Cullen |
| Pearland, TX |
| 3/31/2010 |
| 100 |
|
| 6,775,000 |
|
| — |
| |
| Hilton Head — Heritage |
| Hilton Head, SC |
| 3/31/2010 |
| 100 |
|
| 8,058,000 |
|
| — |
| |
| Triad Technology Center |
| Baltimore, MD |
| 3/31/2010 |
| 100 |
|
| 29,250,000 |
|
| 12,000,000 |
| |
| Mt. Pleasant (E. Cooper) |
| Mount Pleasant, SC |
| 3/31/2010 |
| 100 |
|
| 9,925,000 |
|
| — |
| |
| Federal North |
| Pittsburgh, PA |
| 4/29/2010 |
| 100 |
|
| 40,472,000 |
|
| — |
| |
| Balfour Concord Portfolio |
| Lewisville, TX |
| 6/25/2010 |
| 100 |
|
| 4,800,000 |
|
| — |
| |
| Cannon Park Place |
| Charleston, SC |
| 6/28/2010 |
| 100 |
|
| 10,446,000 |
|
| — |
| |
| 7900 Fannin(3) |
| Houston, TX |
| 6/30/2010 |
| 84 |
|
| 38,100,000 |
|
| 22,687,000 |
| |
| Balfour Concord Portfolio(4) |
| Denton, TX |
| 6/30/2010 |
| 100 |
|
| 8,700,000 |
|
| 4,657,000 |
| |
| Pearland — Broadway(4) |
| Pearland, TX |
| 6/30/2010 |
| 100 |
|
| 3,701,000 |
|
| 2,381,000 |
| |
| Overlook |
| Stockbridge, GA |
| 7/15/2010 |
| 100 |
|
| 8,140,000 |
|
| 5,440,000 |
| |
| Sierra Vista |
| San Luis Obispo, CA |
| 8/4/2010 |
| 100 |
|
| 10,950,000 |
|
| — |
| |
| Hilton Head — Moss Creek(4) |
| Hilton Head, SC |
| 8/12/2010 |
| 100 |
|
| 2,652,000 |
|
| — |
| |
| Orlando Portfolio |
| Orlando & Oviedo, FL |
| 9/29/2010 |
| 100 |
|
| 18,300,000 |
|
| — |
| |
| Santa Fe Portfolio — Building 440 |
| Santa Fe, NM |
| 9/30/2010 |
| 100 |
|
| 9,560,000 |
|
| — |
| |
| Rendina Portfolio — San Martin and St. Francis |
| Las Vegas, NV and Poughkeepsie, NY |
| 9/30/2010 |
| 100 |
|
| 40,204,000 |
|
| — |
| |
| Allegheny Admin Headquarters |
| Pittsburgh, PA |
| 10/29/2010 |
| 100 |
|
| 39,000,000 |
|
| — |
| |
| Rendina Portfolio — Des Peres(4) |
| St. Louis, MO |
| 11/12/2010 |
| 100 |
|
| 14,034,000 |
|
| — |
| |
| Raleigh Medical Center |
| Raleigh, NC |
| 11/12/2010 |
| 100 |
|
| 16,500,000 |
|
| — |
| |
| Columbia Portfolio — Washington Medical Arts I & II |
| Albany, NY |
| 11/19/2010 |
| 100 |
|
| 23,533,000 |
|
| — |
| |
| Columbia — 1092 Madison & Patroon Creek(4) |
| Albany, NY |
| 11/22/2010 |
| 100 |
|
| 36,254,000 |
|
| 26,057,000 |
| |
| Columbia Portfolio — Capital Region Health Park & FL Orthopaedic(4) |
| Latham, NY and Temple Terrace, FL |
| 11/23/2010 |
| 100 |
|
| 63,254,000 |
|
| 29,432,000 |
| |
| Rendina Portfolio — Gateway(4) |
| Tucson, AZ |
| 12/7/2010 |
| 100 |
|
| 16,349,000 |
|
| 10,613,000 |
| |
| Florida Orthopaedic ASC |
| Temple Terrace, FL |
| 12/8/2010 |
| 100 |
|
| 5,875,000 |
|
| — |
| |
| Select Medical LTACH Portfolio |
| Orlando and Tallahassee, FL, Augusta, GA, and Dallas, TX |
| 12/17/2010 |
| 100 |
|
| 102,045,000 |
|
| — |
| |
| Santa Fe Portfolio — Building 1640(4) |
| Santa Fe, NM |
| 12/22/2010 |
| 100 |
|
| 6,232,000 |
|
| 3,555,000 |
| |
| Phoenix Portfolio — Estrella & MOB IV |
| Phoenix, AZ |
| 12/22/2010 |
| 100 |
|
| 35,809,000 |
|
| 25,050,000 |
| |
| Rendina Portfolio — Wellington(4) |
| Wellington, FL |
| 12/23/2010 |
| 100 |
|
| 12,825,000 |
|
| 8,303,000 |
| |
| Columbia Portfolio — Putnam(4) |
| Carmel, NY |
| 12/29/2010 |
| 100 |
|
| 28,216,000 |
|
| 19,329,000 |
| |
| Columbia Portfolio — CDPHP Corporate Headquarters(4) |
| Albany, NY |
| 12/30/2010 |
| 100 |
|
| 36,207,000 |
|
| 21,182,000 |
| |
| Medical Park of Cary |
| Cary, NC |
| 12/30/2010 |
| 100 |
|
| 28,000,000 |
|
| — |
| |
| Total | | | | | | |
| | $ | 806,048,000 |
| | $ | 218,538,000 |
| |
| |
(1) | Represents the amount of the mortgage loan payable assumed or newly placed on the property in connection with the acquisition or secured by the property subsequent to acquisition. |
| |
(2) | Represents our purchase of the remaining 20% interest we previously did not own in the JV Company that owns Chesterfield Rehabilitation Center. |
| |
(3) | Represents our purchase of the majority interest in the Fannin partnership, which owns the 7900 Fannin medical office building, the value of which is approximately $38,100,000. We acquired both the general partner interest and the majority of the limited partner interests in the Fannin partnership. The transaction provided the original physician |
Healthcare Trust of America, Inc.
NOTES TO CONSOLIDATED FINANCIAL STATEMENTS — (Continued)
investors with the right to remain in the Fannin partnership, to receive limited partnership units in our operating partnership, and/or receive cash. Ten investors elected to remain in the Fannin partnership, which represents a 16% noncontrolling interest in the property.
| |
(4) | Represent purchases of additional medical office buildings during the year ended December 31, 2010 that are within portfolios we had previously acquired. |
4. Real Estate Notes Receivable, Net
On December 1, 2009, we acquired a note receivable secured by the Rush Medical Office Building, or the Rush Presbyterian Note Receivable, for a total purchase price of $37,135,000, plus closing costs. The note may be repaid within ninety days prior to the maturity date or during a thirty-day period occurring during June 2012 for $37,135,000. Otherwise, it may be repaid for the full face amount of $41,150,000. We acquired this asset from an unaffiliated third party. We have determined that this note receivable is due from a variable interest entity for which we hold a significant variable interest but for which we are not the primary beneficiary. Therefore, we do not consolidate the entity. We do not expect to incur any losses based on our variable interest and any potential exposure to loss on this variable interest is limited to a 30-day period during which we could be required to purchase the property. Additionally, we do not expect to have any variable interest loss exposures on our other Notes Receivable.
On December 31, 2008, we acquired four notes receivable secured by two buildings located in Phoenix, Arizona and Berwyn, Illinois, or the Presidential Note Receivable, for a total purchase price of $15,000,000, plus closing costs. We acquired these assets from an unaffiliated third party. On November 1, 2011, we entered into amendments to extend the maturity dates of these notes from November 1, 2011 to May 1, 2012. We expect that we will collect the aggregate principal balance of these notes in full upon the maturity date of May 1, 2012.
Real estate notes receivable, net consisted of the following as of December 31, 2011 and 2010:
|
| | | | | | | | | | | | | | | | |
| Property Name | | | | Contractual | | | | | December 31, |
| Location of Property | | Property Type | | Interest Rate | | | Maturity Date | | 2011 | | 2010 |
MacNeal Hospital Medical Office Building Berwyn, Illinois | | Medical Office
Building | | 10.95 | % | (1) | | 5/1/2012 | | $ | 7,500,000 |
| | $ | 7,500,000 |
|
MacNeal Hospital Medical Office Building Berwyn, Illinois | | Medical Office
Building | | 10.95 | % | (1) | | 5/1/2012 | | 7,500,000 |
| | 7,500,000 |
|
St. Luke’s Medical Office Building Phoenix, Arizona | | Medical Office
Building | | 10.85 | % | (2) | | 5/1/2012 | | 3,750,000 |
| | 3,750,000 |
|
St. Luke’s Medical Office Building Phoenix, Arizona | | Medical Office
Building | | 10.85 | % | (2) | | 5/1/2012 | | 1,250,000 |
| | 1,250,000 |
|
Rush Presbyterian Medical Office Building Oak Park, Illinois | | Medical Office
Building | | 7.76 | % | (3) | | 12/1/2014 | | 41,150,000 |
| | 41,150,000 |
|
| Total real estate note receivable | | | | |
| | | | | 61,150,000 |
| | 61,150,000 |
|
| Add: Note receivable closing costs, net | | | | |
| | | | | 324,000 |
| | 540,000 |
|
| Less: discount, net (4) | | | | |
| | | | | (4,015,000 | ) | | (4,599,000 | ) |
| Real estate notes receivable, net | | | | |
| | | | | $ | 57,459,000 |
| | $ | 57,091,000 |
|
| |
(1) | The effective interest rate associated with these interest-only notes as of December 31, 2011 is 8.77%.
|
| |
(2) | The effective interest rate associated with these interest-only notes as of December 31, 2011 is 8.63%.
|
| |
(3) | Represents an average contractual interest rate for the life of this interest-only note with an effective interest rate of 8.60%. |
| |
(4) | The closing costs and discount are amortized on a straight-line basis over the respective life, and impact the yield, of each note. |
We monitor the credit quality of our real estate notes receivable portfolio on an ongoing basis by tracking possible credit quality indicators. As of December 31, 2011, all of our real estate notes receivable are current and we have not provided for any allowance for losses on notes receivable, and as of December 31, 2011 we have had no impairment with respect to our notes receivable. We made no significant purchases or sales of notes or other receivables during the year ended December 31, 2011.
5. Identified Intangible Assets, Net
Healthcare Trust of America, Inc.
NOTES TO CONSOLIDATED FINANCIAL STATEMENTS — (Continued)
Identified intangible assets, net for our properties consisted of the following as of December 31, 2011 and 2010:
|
| | | | | | | | |
| | | December 31, |
| | | 2011 | | 2010 |
| In place leases, net of accumulated amortization of $47,243,000 and $43,185,000 as of December 31, 2011 and 2010, respectively, (with a weighted average remaining life of 146 months and 154 months as of December 31, 2011 and 2010, respectively). | | $ | 109,335,000 |
| | $ | 124,330,000 |
|
| Above market leases, net of accumulated amortization of $8,040,000 and $5,971,000 as of December 31, 2011 and 2010, respectively, (with a weighted average remaining life of 81 months and 89 months as of December 31, 2011 and 2010, respectively). | | 14,545,000 |
| | 17,943,000 |
|
| Tenant relationships, net of accumulated amortization of $41,309,000 and $23,937,000 as of December 31, 2011 and 2010, respectively, (with a weighted average remaining life of 164 months and 168 months as of December 31, 2011 and 2010, respectively). | | 122,533,000 |
| | 136,021,000 |
|
| Below market leasehold interests, net of accumulated amortization of $1,346,000 and $526,000 as of December 31, 2011 and 2010, respectively, (with a weighted average remaining life of 834 months and 855 months as of December 31, 2011 and 2010, respectively). | | 25,977,000 |
| | 26,061,000 |
|
| Total | | $ | 272,390,000 |
| | $ | 304,355,000 |
|
Amortization expense recorded on the identified intangible assets related to our operating properties for the years ended December 31, 2011, 2010, and 2009 was $45,264,000, $32,479,000, and $22,724,000, respectively, which included $3,607,000, $3,046,000, and $1,889,000, respectively, of amortization recorded against rental income for above market leases and $820,000, $423,000, and $58,000, respectively, of amortization recorded against rental expenses for below market leasehold interests.
Estimated amortization expense on the identified intangible assets associated with our operating properties for each of the next five years and thereafter is as follows:
|
| | | | |
| Year | | Amount |
| 2012 | | $ | 38,597,000 |
|
| 2013 | | 32,340,000 |
|
| 2014 | | 28,893,000 |
|
| 2015 | | 25,467,000 |
|
| 2016 | | 22,169,000 |
|
| Thereafter | | 124,924,000 |
|
| Total | | $ | 272,390,000 |
|
6. Other Assets, Net
Other assets, net for our operating properties consisted of the following as of December 31, 2011 and 2010:
|
| | | | | | | | |
| | | December 31, |
| | | 2011 | | 2010 |
| Deferred financing costs, net of accumulated amortization of $4,710,000 and $5,015,000 as of December 31, 2011 and 2010, respectively | | $ | 8,473,000 |
| | $ | 8,620,000 |
|
| Lease commissions, net of accumulated amortization of $2,006,000 and $1,132,000 as of December 31, 2011 and 2010, respectively | | 7,755,000 |
| | 4,275,000 |
|
| Lease inducements, net of accumulated amortization of $654,000 and $527,000 as of December 31, 2011 and 2010, respectively | | 1,166,000 |
| | 1,284,000 |
|
| Deferred rent receivable (net of allowance) | | 29,627,000 |
| | 17,422,000 |
|
| Prepaid expenses, deposits, and other assets | | 9,421,000 |
| | 8,951,000 |
|
| Total | | $ | 56,442,000 |
| | $ | 40,552,000 |
|
Amortization expense recorded on deferred financing costs, lease commissions, lease inducements and note receivable
Healthcare Trust of America, Inc.
NOTES TO CONSOLIDATED FINANCIAL STATEMENTS — (Continued)
closing costs for the years ended December 31, 2011, 2010, and 2009 was $5,002,000, $3,163,000, and $2,064,000, respectively, of which $3,628,000, $2,195,000, and $1,885,000, respectively, of amortization was recorded as interest expense for deferred financing costs and $235,000, $248,000, and $153,000, respectively, of amortization was recorded against rental income for lease inducements.
Estimated amortization expense on the deferred financing costs, lease commissions and lease inducements for each of the next five years ending December 31 and thereafter is as follows:
|
| | | | |
| Year | | Amount |
| 2012 | | $ | 4,769,000 |
|
| 2013 | | 4,371,000 |
|
| 2014 | | 2,371,000 |
|
| 2015 | | 1,482,000 |
|
| 2016 | | 1,130,000 |
|
| Thereafter | | 3,271,000 |
|
| Total | | $ | 17,394,000 |
|
7. Mortgage Loans Payable, Net
Mortgage Loans Payable, Net
Mortgage loans payable were $636,558,000 ($639,149,000, including premium) and $696,558,000 ($699,526,000, net of discount) as of December 31, 2011 and 2010, respectively. As of December 31, 2011, we had fixed and variable rate mortgage loans with effective interest rates ranging from 1.77% to 12.75% per annum and a weighted average effective interest rate of 5.05% per annum. As of December 31, 2011, we had $461,248,000 ($463,839,000, including premium) of fixed rate debt, or 72.5% of mortgage loans payable, at a weighted average interest rate of 6.02% per annumcurves, foreign exchange rates, and $175,310,000 of variable rate debt, or 27.5% of mortgage loans payable, at a weighted average interest rate of 2.51% per annum. As of December 31, 2010, we had fixed and variable rate mortgage loans with effective interest rates ranging from 1.61% to 12.75% per annum and a weighted average effective interest rate of 4.95% per annum. As of December 31, 2010, we had $470,815,000 ($473,783,000, including premium) of fixed rate debt, or 67.6% of mortgage loans payable, at a weighted average interest rate of 6.02% per annum and $225,743,000 of variable rate debt, or 32.4% of mortgage loans payable, at a weighted average interest rate of 2.72% per annum.
On February 1, 2011, we closed a senior secured real estate term loan in the amount of $125,500,000 from Wells Fargo Bank, National Association, or Wells Fargo Bank.implied volatilities. The primary purposes of the term loan included refinancing four Wells Fargo Bank loans totaling approximately $89,969,000 and providing new financing on three of our existing properties. Interest is payable monthly at a rate of one-month LIBOR plus 2.35%, which, as of December 31, 2011, equated to 2.65%. Including the impact of the interest rate swap discussed below, the weighted average rate associated with this term loan is 3.10%. The weighted average rate on these four loans prior to the refinancing was 4.18% (including the impactfair values of interest rate swaps).swaps are determined using the market standard methodology of netting the discounted future fixed cash payments and the discounted expected variable cash receipts. The term loan maturesvariable cash receipts are based on December 31, 2013 and includes two 12-month extension options, subject to the satisfactionan expectation of certain conditions. The loan agreement for the term loan includes customary financial covenants for loans of this type, including a maximum ratio of total indebtedness to total assets, a minimum ratio of EBITDA to fixed charges, and a minimum level of tangible net worth. In addition, the term loan agreement for this secured term loan includes events of default that we believe are usual for loans and transactions of this type. The term loan is secured by 25 buildings within 12 property portfolios in 13 states and has a two year period in which no prepayment is permitted. Our operating partnership has guaranteed 25% of the principal balance and 100% of thefuture interest under the term loan.rates (forward curves) derived from observable market interest rate curves.
We are required by the terms of the applicable loan documents related to our mortgage loans payable and secured term loan to meet certain financial covenants, such as debt service coverage ratios, rent coverage ratios and reporting requirements. As of December 31, 2011, we believe that we were in compliance with all such financial covenants and requirements on our mortgage loans payable and secured term loan. As of December 31, 2010, we were in compliance with all such financial covenants and requirements on $638,558,000 of our mortgage loans payable and had made appropriateincorporate credit valuation adjustments to comply with such covenants on $58,000,000 ofappropriately reflect both our mortgage loans payable by maintaining a deposit of $12,000,000 within a restricted collateral account. On May 3, 2011, we paid off this $58,000,000 principal balanceown nonperformance risk and thus withdrew our deposit of $12,000,000 from the restricted collateral account.
Healthcare Trust of America, Inc.
NOTES TO CONSOLIDATED FINANCIAL STATEMENTS — (Continued)
Mortgage loans payable, net consisted of the following as of December 31, 2011 and 2010:
|
| | | | | | | | | | | | | | |
| | | | | | | December 31, |
| Property | | Interest Rate | | Maturity Date | | 2011 | | 2010 | |
| Fixed Rate Debt: | | |
| | | | |
| | |
| |
| Southpointe Office Parke and Epler Parke I | | 6.11 | % | | 9/1/2016 | | $ | 9,017,000 |
| | $ | 9,121,000 |
| |
| Crawfordsville Medical Office Park and Athens Surgery Center | | 6.12 |
| | 10/1/2016 | | 4,208,000 |
| | 4,256,000 |
| |
| The Gallery Professional Building | | 5.76 |
| | 3/1/2017 | | 5,948,000 |
| | 6,000,000 |
| |
| Lenox Office Park, Building G | | 5.88 |
| | 2/1/2017 | | 11,881,000 |
| | 12,000,000 |
| |
| Commons V Medical Office Building | | 5.54 |
| | 6/11/2017 | | 9,528,000 |
| | 9,672,000 |
| |
| Yorktown Medical Center and Shakerag Medical Center | | 5.52 |
| | 5/11/2017 | | 13,257,000 |
| | 13,434,000 |
| |
| Thunderbird Medical Plaza | | 5.67 |
| | 6/11/2017 | | 13,553,000 |
| | 13,740,000 |
| |
| Gwinnett Professional Center | | 5.88 |
| | 1/1/2014 | | 5,311,000 |
| | 5,417,000 |
| |
| Northmeadow Medical Center | | 5.99 |
| | 12/1/2014 | | 7,375,000 |
| | 7,545,000 |
| |
| Medical Portfolio 2 | | 5.91 |
| | 7/1/2013 | | 13,813,000 |
| | 14,024,000 |
| |
| Renaissance Medical Centre | | 5.38 |
| | 9/1/2015 | | 18,118,000 |
| | 18,464,000 |
| |
| Renaissance Medical Centre | | 12.75 |
| | 9/1/2015 | | 1,237,000 |
| | 1,240,000 |
| |
| Medical Portfolio 4 | | 5.50 |
| | 6/1/2019 | | 6,202,000 |
| | 6,404,000 |
| |
| Medical Portfolio 4 | | 6.18 |
| | 6/1/2019 | | 1,593,000 |
| | 1,625,000 |
| |
| Marietta Health Park | | 5.11 |
| | 11/1/2015 | | 7,200,000 |
| | 7,200,000 |
| |
| Hampden Place | | 5.98 |
| | 1/1/2012 | | — |
| | 8,551,000 |
| |
| Greenville — Patewood | | 6.18 |
| | 1/1/2016 | | 35,157,000 |
| | 35,609,000 |
| |
| Greenville — Greer | | 6.00 |
| | 2/1/2017 | | 8,304,000 |
| | 8,413,000 |
| |
| Greenville — Memorial | | 6.00 |
| | 2/1/2017 | | 4,396,000 |
| | 4,454,000 |
| |
| Greenville — MMC | | 6.25 |
| | 6/1/2020 | | 22,467,000 |
| | 22,743,000 |
| |
| Sun City-Note B | | 6.54 |
| | 9/1/2014 | | 14,598,000 |
| | 14,819,000 |
| |
| Sun City-Note C | | 6.50 |
| | 9/1/2014 | | 4,291,000 |
| | 4,412,000 |
| |
| Sun City Note D | | 6.98 |
| | 9/1/2014 | | 13,657,000 |
| | 13,839,000 |
| |
| King Street | | 5.88 |
| | 3/5/2017 | | 6,185,000 |
| | 6,429,000 |
| |
| Wisconsin MOB II — Mequon | | 6.25 |
| | 7/10/2017 | | 9,832,000 |
| | 9,952,000 |
| |
| Balfour Concord — Denton | | 7.95 |
| | 8/10/2012 | | 4,454,000 |
| | 4,592,000 |
| |
| Pearland-Broadway | | 5.57 |
| | 9/1/2012 | | 2,318,000 |
| | 2,361,000 |
| |
| 7900 Fannin-Note A | | 7.30 |
| | 1/1/2021 | | 21,571,000 |
| | 21,783,000 |
| |
| 7900 Fannin-Note B | | 7.68 |
| | 1/1/2016 | | 812,000 |
| | 819,000 |
| |
| Deaconess — Evansville | | 4.90 |
| | 8/6/2015 | | 20,842,000 |
| | 21,151,000 |
| |
| Overlook | | 6.00 |
| | 11/5/2016 | | 5,324,000 |
| | 5,408,000 |
| |
| Triad | | 5.60 |
| | 9/1/2022 | | 11,800,000 |
| | 11,961,000 |
| |
| Santa Fe — Building 1640 | | 5.57 |
| | 7/1/2015 | | 3,489,000 |
| | 3,555,000 |
| |
| Rendina — Wellington | | 5.97 |
| | 12/1/2016 | | 8,201,000 |
| | 8,296,000 |
| |
| Rendina — Gateway | | 6.49 |
| | 9/1/2018 | | 10,397,000 |
| | 10,596,000 |
| |
| Columbia — Patroon Creek Note A | | 6.10 |
| | 6/1/2016 | | 22,732,000 |
| | 23,123,000 |
| |
| Columbia — Patroon Creek Note B | | 6.10 |
| | 6/1/2016 | | 841,000 |
| | 890,000 |
| |
| Columbia — 1092 Madison | | 6.25 |
| | 2/1/2018 | | 1,964,000 |
| | 2,006,000 |
| |
| Columbia — FL Orthopaedic | | 5.45 |
| | 7/10/2013 | | 6,795,000 |
| | 7,041,000 |
| |
| Columbia — Capital Region Health Park | | 6.51 |
| | 7/10/2012 | | 21,535,000 |
| | 22,309,000 |
| |
| Columbia — Putnam | | 5.33 |
| | 5/1/2015 | | 19,005,000 |
| | 19,329,000 |
| |
| Columbia — CDPHP | | 5.40 |
| | 6/1/2016 | | 20,851,000 |
| | 21,182,000 |
| |
| Phoenix — Estrella | | 6.26 |
| | 8/1/2017 | | 20,449,000 |
| | 20,695,000 |
| |
| Phoenix — MOB IV | | 6.01 |
| | 6/11/2017 | | 4,291,000 |
| | 4,355,000 |
| |
| Phoenix — Paseo | | 6.32 |
| | 10/11/2016 | | 2,118,000 |
| | — |
| |
| Columbia — N. Berkshire | | 6.01 |
| | 12/11/2012 | | 4,331,000 |
| | — |
| |
| Total fixed rate debt | | |
| | | | 461,248,000 |
| | 470,815,000 |
| |
Healthcare Trust of America, Inc.
NOTES TO CONSOLIDATED FINANCIAL STATEMENTS — (Continued)
|
| | | | | | | | | | | | | | | | |
| | | | | | | December 31, | |
| Property | | Interest Rate | | Maturity Date | | 2011 (a) | | 2010 (b) | |
| Variable Rate Debt: | | |
| | | | | | |
| | |
| |
| Chesterfield Rehabilitation Center |
| 1.95 | % | | (c) | | 12/30/2012 | | 21,120,000 |
| | 22,000,000 |
| |
| Park Place Office Park |
| 1.85 |
| | (c) | | 12/31/2010 | | — |
| (d) | 10,943,000 |
| |
| Highlands Ranch Medical Plaza |
| 1.85 |
| | (c) | | 12/31/2010 | | — |
| (e) | 8,853,000 |
| |
| Medical Portfolio 1 |
| 1.98 |
| | (c) | | 2/28/2011 | | — |
| (e) | 19,580,000 |
| |
| Medical Portfolio 3 |
| 2.55 |
| | (c) | | 6/26/2011 | | — |
| (d) | 58,000,000 |
| |
| SouthCrest Medical Plaza |
| 2.50 |
| | (c) | | 6/30/2011 | | — |
| (e) | 12,870,000 |
| |
| Wachovia Pool Loans(d) |
| 4.65 |
| | (c) | | 6/30/2011 | | — |
| (e) | 48,666,000 |
| |
| Cypress Station Medical Office Building |
| 2.05 |
| | (c) | | 9/1/2011 | | — |
| (d) | 7,043,000 |
| |
| Decatur Medical Plaza |
| 2.30 |
| | (c) | | 9/26/2011 | | — |
| (d) | 7,900,000 |
| |
| Mountain Empire Portfolio |
| 2.48 |
| | (c) | | 9/27/2012 | | 17,935,000 |
| | 18,408,000 |
| |
| Wells Fargo Secured Real Estate Term Loan |
| 2.65 |
| | (c) | | 12/31/2013 | | 125,500,000 |
|
| — |
| |
| Sun City-Sun 1 |
| 1.77 |
| | (c) | | 12/31/2014 | | 1,438,000 |
| | 2,000,000 |
| |
| Sun City-Sun 2 |
| 1.77 |
| | (c) | | 12/31/2014 | | 9,317,000 |
| | 9,480,000 |
| |
| Total variable rate debt | | |
| | | | | | 175,310,000 |
| | 225,743,000 |
| |
| Total fixed and variable debt | | |
| | | | | | 636,558,000 |
| | 696,558,000 |
| |
| Add: Net premium | | |
| | | | | | 2,591,000 |
| | 2,968,000 |
| |
| Mortgage loans payable, net | | |
| | | | | | $ | 639,149,000 |
| | $ | 699,526,000 |
| |
| |
(a) | As of December 31, 2011, we had variable rate mortgage loans on three of our properties with effective interest rates ranging from 1.77% to 2.67% per annum and a weighted average effective interest rate of 2.51% per annum. As of December 31, 2011, we had fixed rate interest rate swaps and caps on the entire principal balances of our Mountain Empire and Sun City-Sun 2 variable rate mortgage loans payable as well as on $75,000,000 of our Wells Fargo secured real estate term loan, thereby effectively fixing our interest rates on those mortgage loans payable at 5.87%, 2.00%, and 3.42% respectively.
|
| |
(b) | As of December 31, 2010, we had variable rate mortgage loans on 15 of our properties with effective interest rates ranging from 1.76% to 4.65% per annum and a weighted average effective interest rate of 2.72% per annum. As of December 31, 2010, we had fixed rate interest rate swaps and caps on our Medical Portfolio 1, Decatur, Mountain Empire, and Sun City-Sun 2 variable rate mortgage loans payable, thereby effectively fixing our interest rates on those mortgage loans payable at 5.23%, 5.16%, 5.87%, and 2.00%, respectively.
|
| |
(c) | Represents the interest rate in effect as of December 31, 2011.
|
| |
(d) | Represent loan balances that have matured or that we have paid off during the year ended December 31, 2011.
|
| |
(e) | Represent bank loans, the aggregate principal balance of, which as of December 31, 2010, was $89,969,000, which were refinanced using the proceeds of our $125,500,000 senior secured real estate term loan. We closed on this term loan with Wells Fargo Bank, N.A., on February 1, 2011, as discussed above within this Note 7. |
The principal payments due on our mortgage loans payable for each of the next five years ending December 31 and thereafter is as follows:
|
| | | | |
| Year | | Amount |
| 2012 | | $ | 79,561,000 |
|
| 2013 | | 153,358,000 |
|
| 2014 | | 58,981,000 |
|
| 2015 | | 72,625,000 |
|
| 2016 | | 104,696,000 |
|
| Thereafter | | 167,337,000 |
|
| Total | | $ | 636,558,000 |
|
The table above does not reflect all available extension options. Of the amounts maturing in 2012, $17,935,000 have a one year extension option available. Of the amounts maturing in 2013, $125,500,000 have a one year extension available.
Healthcare Trust of America, Inc.
NOTES TO CONSOLIDATED FINANCIAL STATEMENTS — (Continued)
8. Derivative Financial Instruments
ASC 815, Derivatives and Hedging, or ASC 815, establishes accounting and reporting standards for derivative instruments, including certain derivative instruments embedded in other contracts, and for hedging activities. We utilize derivatives such as fixed interest rate swaps and interest rate caps to add stability to interest expense and to manage our exposure to interest rate movements. Consistent with ASC 815, we record derivative financial instruments on our accompanying consolidated balance sheets as either an asset or a liability measured at fair value. ASC 815 permits special hedge accounting if certain requirements are met. Hedge accounting allows for gains and losses on derivatives designated as hedges to be offset by the change in value of the hedged item(s) or to be deferred in other comprehensive income.
In anticipation of the $125,500,000 senior secured real estate term loan that we closed on February 1, 2011, we purchased an interest rate swap with Wells Fargo Bank as counterparty, for a notional amount of $75,000,000. The interest rate swap was amended on January 25, 2011. The interest rate swap is secured by the pool of assets collateralizing the secured term loan. The effective date of the swap is February 1, 2011, and matures no later than December 31, 2013. The swap will fix one-month LIBOR at 1.0725%, which, when added to the spread of 2.35%, will result in a total interest rate of approximately 3.42% for $75,000,000 of the term loan during the initial term. We have not designated this swap as an accounting hedge. As of December 31, 2010, we had $2,400,000 on deposit in a collateral account related to this interest rate swap. This amount was reimbursed to us in full upon the closing of the term loan on February 1, 2011.
As of December 31, 2011 and December 31, 2010, no derivatives were designated as fair value hedges or cash flow hedges. Derivatives not designated as hedges are not speculative and are used to manage our exposure to interest rate movements, but do not meet the strict hedge accounting requirements of ASC 815. Changesrespective counterparty’s nonperformance risk in the fair value of derivative financial instruments are recorded in the line item entitled "Interest expense related to derivative financial instruments and net change in fair value of derivative financial instruments" in our accompanying consolidated statements of operations.
The following table lists the derivative financial instruments held by us as of December 31, 2011:
|
| | | | | | | | | | | | | | | |
| Notional Amount | | Index | | Rate | | Fair Value | | Instrument | | Maturity |
| $16,578,000 |
| | LIBOR | | 5.87 | % | | $ | (946,000 | ) | | Swap | | 9/28/2013 |
| 75,000,000 |
| | LIBOR | | 3.42 |
| | (846,000 | ) | | Swap | | 12/31/2013 |
| 9,330,000 |
| | LIBOR | | 2.00 |
| | 89,000 |
| | Cap | | 12/31/2014 |
The following table lists the derivative financial instruments held by us as of December 31, 2010:
|
| | | | | | | | | | | | | | | |
| Notional Amount | | Index | | Rate | | Fair Value | | Instrument | | Maturity |
| $19,507,000 |
|
| LIBOR |
| 5.23 | % |
| $ | (109,000 | ) |
| Swap |
| 1/31/2011 |
| 7,900,000 |
|
| LIBOR |
| 5.16 |
|
| (185,000 | ) |
| Swap |
| 9/26/2011 |
| 16,912,000 |
|
| LIBOR |
| 5.87 |
|
| (1,233,000 | ) |
| Swap |
| 9/28/2013 |
| 75,000,000 |
|
| LIBOR |
| 3.42 |
|
| 297,000 |
|
| Swap |
| 12/31/2013 |
| 9,480,000 |
|
| LIBOR |
| 2.00 |
|
| 383,000 |
|
| Cap |
| 12/31/2014 |
As of December 31, 2011 and December 31, 2010,measurements. In adjusting the fair value of our derivative financial instruments was as follows:
|
| | | | | | | | | | | | | | | | | | | | | | | | |
| | | Asset Derivatives | | Liability Derivatives |
| Derivatives Not | | December 31, 2011 | | December 31, 2010 | | December 31, 2011 | | December 31, 2010 |
| Designated as | | Balance Sheet | | | | Balance Sheet | | | | Balance Sheet | | | | Balance Sheet | | |
| Hedging Instruments: | | Location | | Fair Value | | Location | | Fair Value | | Location | | Fair Value | | Location | | Fair Value |
| Interest Rate Swaps | | Other Assets | | $ | — |
| | Other Assets | | $ | 297,000 |
| | Derivative Financial Instruments | | $ | 1,792,000 |
| | Derivative Financial Instruments | | $ | 1,527,000 |
|
| Interest Rate Cap | | Other Assets | | $ | 89,000 |
| | Other Assets | | $ | 383,000 |
| | | | |
| | | | |
|
Healthcare Trustcontracts for the effect of America, Inc.
NOTES TO CONSOLIDATED FINANCIAL STATEMENTS — (Continued)
For the years ended December 31, 2011, 2010, and 2009, the derivative financial instruments associated with our operating properties had the following effect on our consolidated statements of operations:
|
| | | | | | | | | | | | | | |
| | | | | Recognized |
| Derivatives Not Designated | | Location of Gain (Loss) | | For the Year Ended |
| as Hedging Instruments Under: | | Recognized: | | December 31, 2011 | | December 31, 2010 | | December 31, 2009 |
| Interest Rate Swaps | | Interest expense related to derivative financial instruments and net change in fair value of derivative financial instruments | | $ | (562,000 | ) | | $ | 6,461,000 |
| | $ | 5,279,000 |
|
| Interest Rate Cap | | Interest expense related to derivative financial instruments and net change in fair value of derivative financial instruments | | $ | (294,000 | ) | | $ | (507,000 | ) | | $ | — |
|
Wenonperformance risk, we have agreements with each of our interest rate swap derivative counterparties that contain a provision whereby if we default on certain of our unsecured indebtedness, then we could also be declared in default on our interest rate swap derivative obligations resulting in an acceleration of payment. In addition, we are exposed to credit risk in the event of non-performance by our derivative counterparties. We believe we mitigate our credit risk by entering into agreements with credit-worthy counterparties. We record counterparty credit risk valuation adjustments on interest rate swap derivative assets in order to properly reflect the credit quality of the counterparty. In addition, our fair value of interest rate swap derivative liabilities is adjusted to reflectconsidered the impact of ournetting and any applicable credit quality. As of December 31, 2011 and December 31, 2010, there have been no termination events or events of default related to the interest rate swaps.
9. Revolving Credit Facility
On November 22, 2010, we entered into a credit agreement, or the credit agreement, with JPMorgan Chase Bank, N.A., as administrative agent, or JPMorgan, Wells Fargo Bank and Deutsche Bank Securities Inc., as syndication agents, U.S. Bank National Association and Fifth Third Bank, as documentation agents, and the lenders named therein to obtain an unsecured revolving credit facility in an aggregate maximum principal amount of $275,000,000, or the unsecured credit facility. In anticipation of this new credit facility, on August 19, 2010, we voluntarily closed the $80,000,000 secured revolving facility we originally entered into in 2007. No borrowings were made on this previous credit facility during the years ended December 31, 2010 or 2009.
On May 13, 2011, we increased the unsecured credit facility from an aggregate maximum principal amount of $275,000,000 to $575,000,000 as well as extended its maturity date from November 2013 to May 2014, pursuant to an amendment to the credit agreement.
The actual amount of credit available under the credit agreement is a function of certain loan-to-cost, loan-to-value and debt service coverage ratios contained in the credit agreement. Subject to the terms of the credit agreement, the maximum principal amount of the credit agreement may be increased, subject to such additional financing being offered and provided by existing lenders under the credit agreement. Borrowings under this unsecured credit facility accrue interest at a rate per annum equal to the Adjusted LIBO Rate plus a margin ranging from 2.50% to 3.50% based on our operating partnership's total leverage ratio, which we refer to as Eurodollar loans. Our operating partnership is required to pay a fee on the unused portion of the lenders' commitments under the credit agreement at a rate dependent on the proportion of the average daily used amount to the lenders' commitments. The margin associated with borrowings during the year ended December 31, 2011 was 2.50% and the average daily commitment fee for both the year ended December 31, 2011 was 0.5%. As of December 31, 2011 and December 31, 2010, we had $0 and $7,000,000, respectively, outstanding on our unsecured revolving credit facility. The $7,000,000 drawn as of December 31, 2010 for the purpose of funding the acquisition of operating properties was repaid in full on January 31, 2011.
The credit agreement contains various affirmative and negative covenants that we believe are usual and customary for facilities and transactions of this type, including limitations on the incurrence of debt by us, our operating partnership and its subsidiaries that own unencumbered assets, limitations on the nature of our operating partnership's business, and limitations on distributions by our operating partnership and its subsidiaries that own unencumbered assets. Pursuant to the credit agreement, beginning with the quarter ending September 30, 2011, our operating partnership may not make cash distribution payments to us and we may not make cash distributions to our stockholders in excess of the greater of: (i) 100% of normalized adjusted FFO (as defined in the credit agreement) for the period of four quarters ending September 30, 2011 and December 31, 2011, (ii) 95% of normalized adjusted FFO for the period of four quarters ending March 31, 2012 and (iii) 90% of normalized
Healthcare Trust of America, Inc.
NOTES TO CONSOLIDATED FINANCIAL STATEMENTS — (Continued)
adjusted FFO for the period of four quarters ending June 30, 2012 and thereafter. Shares of our common stock issued under the DRIP are not subject to the limitation on distribution payments. Additionally, the credit agreement also imposes a number of financial covenants on us and our operating partnership, including: a maximum ratio of total indebtedness to total asset value; a minimum ratio of EBITDA to fixed charges; a minimum tangible net worth covenant; a maximum ratio of unsecured indebtedness to unencumbered asset value; a minimum ratio of unencumbered net operating income to unsecured indebtedness; and a minimum ratio of unencumbered asset value to total commitments. As of December 31, 2011 and December 31, 2010, we were in compliance with all applicable covenants. In addition, the credit agreement includes events of default that we believe are usual for facilities and transactions of this type, including restricting us from making distributions to our stockholders in the event we are in default under the credit agreement, except to the extent necessary for us to maintain our REIT status.
See Note 22, Subsequent Events, for information regarding our January and February 2012 draws of $27,000,000 and $55,000,000, respectively, on our unsecured revolving credit facility. Additionally, see Note 22 for discussion of our proposed new credit facility.
10. Identified Intangible Liabilities, Net
Identified intangible liabilities, net for our properties consisted of the following as of December 31, 2011 and 2010:
|
| | | | | | | | |
| | | December 31, |
| | | 2011 | | 2010 |
| Below market leases, net of accumulated amortization of $4,214,000 and $4,735,000 as of December 31, 2011 and 2010, respectively, (with a weighted average remaining life of 208 months and 213 months as of December 31, 2011 and 2010, respectively). | | $ | 8,164,000 |
| | $ | 9,640,000 |
|
| Above market leasehold interests, net of accumulated amortization of $159,000 and $40,000 as of December 31, 2010 and 2009, respectively, (with a weighted average remaining life of 730 months and 738 months as of December 31, 2011 and 2010, respectively). | | 3,668,000 |
| | 3,788,000 |
|
| Total | | $ | 11,832,000 |
| | $ | 13,428,000 |
|
Amortization expense recorded on the identified intangible liabilities attributable to our properties for the years ended December 31, 2011, 2010 and 2009 was $1,744,000, $1,737,000, and $1,783,000, respectively. Of these amounts, for the years ended December 31, 2011, 2010, and 2009, $1,624,000, $1,697,000, and $1,783,000, respectively was recorded to rental income and $120,000, $40,000, and $0, respectively was recorded against rental expense in our accompanying consolidated statements of operations.
Estimated amortization expense on the identified intangible liabilities associated with our properties for each of the next five years ending December 31 and thereafter is as follows:
|
| | | | |
| Year | | Amount |
| 2012 | | $ | 1,459,000 |
|
| 2013 | | 1,259,000 |
|
| 2014 | | 861,000 |
|
| 2015 | | 683,000 |
|
| 2016 | | 572,000 |
|
| Thereafter | | 6,998,000 |
|
| Total | | $ | 11,832,000 |
|
11. Commitments and Contingencies
Litigation
We are not presently subject to any material litigation nor, to our knowledge, is any material litigation threatened against us, which if determined unfavorably to us, would have a material effect on our consolidated financial position, results of operations or cash flows.
Environmental Matters
We follow the policy of monitoring our properties for the presence of hazardous or toxic substances. While there can be no assurance that a material environmental liability does not exist at our properties, we are not currently aware of any environmental liability with respect to our properties that would have a material effect on our consolidated financial position,
Healthcare Trust of America, Inc.
NOTES TO CONSOLIDATED FINANCIAL STATEMENTS — (Continued)
results of operations or cash flows. Further, we are not aware of any material environmental liability or any unasserted claim or assessment with respect to an environmental liability that we believe would require additional disclosure or the recording of a loss contingency.
Other Organizational and Offering Expenses
During the time that we were offering shares under our initial and follow-on offerings as a self-managed company, we were responsible for all of our organizational and offering expenses. These other organizational and offering expenses included all expenses (other than selling commissions and dealer manager fees, which generally represented 7.0% and 3.0% of our gross offering proceeds, respectively) paid by us in connection with our initial and follow-on offerings.
Tax Status
We have entered into a closing agreement with the IRS, or the Closing Agreement, pursuant to which (i) the IRS agreed not to challenge our dividends as preferential for our taxable years 2007, 2008, 2009, and 2010, and (ii) we paid a compliance fee in an immaterial amount to the IRS. In accordance with the terms of the Closing Agreement, any reimbursement to us for our payment of this compliance fee will be considered gross income. As a result of the Closing Agreement, we continue to qualify as a REIT and to satisfy our distribution requirements.
Other
Our other commitments and contingencies include the usual obligations of real estate owners and operators in the normal course of business. In our opinion, these matters are not expected to have a material adverse effect on our consolidated financial position, results of operations or cash flows.
12. Related Party Transactions
Transition: Self-Management
Upon the effectiveness of our initial offering on September 20, 2006, we entered into an advisory agreement with our former advisor, or the Advisory Agreement, and Grubb & Ellis Realty Investors, LLC, or GERI, and a dealer manager agreement with Grubb & Ellis Securities, Inc., our former dealer manager. These agreements entitled our former advisor, our former dealer manager and their affiliates to specified compensation for certain services as well as reimbursement of certain expenses.
In 2008, we announced our plans to transition to a self-managed company. As part of our transition to self management, on November 14, 2008, we amended and restated the Advisory Agreement effective as of October 24, 2008, to reduce acquisition and asset management fees, eliminate the need to pay disposition or internalization fees, to set the framework for our transition to self-management and to create an enterprise value for our company. On November 14, 2008, we also amended the partnership agreement for our operating partnership. Pursuant to the terms of the partnership agreement as amended, our former advisor had the ability to elect to defer its right, if applicable, to receive a subordinated distribution from our operating partnership after the termination or expiration of the advisory agreement upon certain liquidity events if specified stockholder return thresholds were met. This right was subject to a number of conditions and had been the subject of dispute between the parties, as well as monetary and other claims.
On May 21, 2009, we provided notice to Grubb & Ellis Securities that we would proceed with a dealer manager transition pursuant to which Grubb & Ellis Securities ceased to serve as our dealer manager for our initial offering at the end of the day on August 28, 2009. Commencing August 29, 2009, Realty Capital Securities, LLC, or RCS, an unaffiliated third party, assumed the role of dealer manager for the remainder of the offering period. The Advisory Agreement expired in accordance with its terms on September 20, 2009.
On October 18, 2010, we and our former advisor and certain of its affiliates entered into a redemption, termination and release agreement, or the Redemption Agreement. Pursuant to the Redemption Agreement, we purchased the limited partner interest, including all rights with respect to a subordinated distribution upon the occurrence of specified liquidity events and other rights held by our former advisor in our operating partnership, for $8,000,000, of which $7,285,000 is reflected in our Consolidated Statement of Operations for the year ended December 31, 2010. In addition, pursuant to the Redemption Agreement the parties resolved all monetary claims and other matters between them, and entered into certain mutual and other releases of the parties. We believe that the execution of the Redemption Agreement represented the final stage of our successful separation from our former advisor.
Healthcare Trust of America, Inc.
NOTES TO CONSOLIDATED FINANCIAL STATEMENTS — (Continued)
Fees and Expenses Paid to Former Affiliates
In the aggregate, for the years ended December 31, 2011, 2010, and 2009, we incurred fees to our former advisor and its affiliates of $0, $0, and $71,194,000, respectively.
Offering Stage
Selling Commissions
Prior to the transition of the dealer manager function to RCS, our former dealer manager received selling commissions of up to 7.0% of the gross offering proceeds from the sale of shares of our common stock in our initial offering other than shares of our common stock sold pursuant to the DRIP. Our former dealer manager re-allowed all or a portion of these fees to participating broker-dealers. For the years ended December 31, 2011, 2010, and 2009, we incurred $0, $0, and $35,337,000, respectively, in selling commissions to our former dealer manager. Such selling commissions are charged to stockholders’ equity as such amounts were reimbursed to our former dealer manager from the gross proceeds of our initial offering.
Marketing Support Fees and Due Diligence Expense Reimbursements
Our former dealer manager received non-accountable marketing support fees of up to 2.5% of the gross offering proceeds from the sale of shares of our common stock in our initial offering other than shares of our common stock sold pursuant to the DRIP. Our former dealer manager re-allowed a portion up to 1.5% of the gross offering proceeds for non-accountable marketing fees to participating broker-dealers. In addition, in our initial offering, we reimbursed our former dealer manager or its affiliates an additional 0.5% of the gross offering proceeds for accountable bona fide due diligence expenses, all or a portion of which could be re-allowed to participating broker-dealers. For the years ended December 31, 2011, 2010, and 2009, we incurred $0, $0, and $12,786,000, respectively, in marketing support fees and due diligence expense reimbursements to our former dealer manager. Such fees and reimbursements are charged to stockholders’ equity as such amounts are reimbursed to our former dealer manager or its affiliates from the gross proceeds of our initial offering.
Other Organizational and Offering Expenses
Our other organizational and offering expenses were paid by our former advisor or its affiliates, who we generally refer to as our former advisor, on our behalf. Our former advisor was reimbursed for actual expenses incurred up to 1.5% of the gross offering proceeds from the sale of shares of our common stock in our initial offering other than shares of our common stock sold pursuant to the DRIP. For the years ended December 31, 2011, 2010, and 2009, we incurred $0, $0, and $2,557,000, respectively, in offering expenses to our former advisor. Other organizational expenses are expensed as incurred, and offering expenses are charged to stockholders’ equity as such amounts are reimbursed to our former advisor from the gross proceeds of our initial offering.
Acquisition and Development Stage
Acquisition Fee
We paid our former advisor acquisition fees for properties and other real estate related assets acquired with funds raised in our initial offering by our former dealer manager for such acquisitions completed after the expiration of the Advisory Agreement. We are no longer required to pay such fees to our former advisor.
For the years ended December 31, 2011, 2010, and 2009, we incurred $0, $0, and $10,738,000, respectively, in acquisition fees to our former advisor. Acquisition fees are included in acquisition-related expenses in our accompanying consolidated statements of operations for the years ended December 31, 20112010, and 2009.
Operational Stage
Asset Management Fee
Prior to our transition to self-management, our former advisor was paid a monthly fee for services rendered in connection with the management of our assets. As part of our transition to self-management, this fee to our former advisor was eliminated in connection with the expiration of the Advisory Agreement.
For the years ended December 31, 2011, 2010, and 2009, we incurred $0, $0, and $3,783,000, respectively, in asset management fees to our former advisor.
Healthcare Trust of America, Inc.
NOTES TO CONSOLIDATED FINANCIAL STATEMENTS — (Continued)
Property Management Fee
Our former advisor was paid a monthly property management fee equal to 4.0% of the gross cash receipts of our properties through August 31, 2009. For properties managed by other third parties besides our former advisor, our former advisor was paid up to 1.0% of the gross cash receipts from the property as a monthly oversight fee. For the years ended December 31, 2011, 2010, and 2009, we incurred $0, $0, and $2,289,000, respectively, in property management fees and oversight fees to our former advisor, which is included in rental expenses in our accompanying consolidated statements of operations. As part of our transition to self-management, this fee to our former advisor was eliminated in connection with the expiration of the Advisory Agreement. Under self-management, we pay property management fees to third parties at market rates.
Lease Fee
Our former advisor, as the property manager, was paid a separate fee for leasing activities in an amount not to exceed the fee customarily charged in arm’s length transactions by others rendering similar services in the same geographic area for similar properties, as determined by a survey of brokers and agents in such area ranging between 3.0% and 8.0% of gross revenues generated from the initial term of the lease. For the years ended December 31, 2011, 2010, and 2009, we incurred $0, $0, and $1,665,000, respectively, to Triple Net Properties Realty, Inc., or Realty and its affiliates in lease fees, which are capitalized and included in other assets, net, in our accompanying consolidated balance sheets.
On-site Personnel and Engineering Payroll
For the years ended December 31, 2011, 2010, and 2009, GERI incurred $0, $0, and $1,827,000 respectively, in on-site personnel and engineering payroll, which is included in rental expenses in our accompanying consolidated statements of operations.
Operating Expenses
We reimbursed our former advisor for operating expenses incurred in rendering its services to us, subject to certain limitations on our operating expenses. We did not reimburse our former advisor for operating expenses that exceeded the greater of: (1) 2.0% of our average invested assets, as defined in the Advisory Agreement, or (2) 25.0% of our net income, as defined in the Advisory Agreement, unless a majority of our independent directors determined that such excess expenses were justified based on unusual and non-recurring factors. Our operating expenses did not exceed this limitation during the term of the Advisory Agreement.
For the years ended December 31, 2011, 2010, and 2009, GERI incurred on our behalf $0, $0, and $35,000, respectively, in operating expenses which is included in general and administrative expenses in our accompanying consolidated statements of operations.
Related Party Services Agreement
We entered into a services agreement, effective January 1, 2008, with GERI for subscription agreement processing and investor services. The services agreement had an initial one year term and was subject to successive one year renewals. On March 17, 2009, GERI provided notice of its termination of the services agreement. The termination was to be effective September 20, 2009; however as part of our transition to self-management, we transitioned to DST Systems, Inc., our transfer agent and provider of subscription processing and investor relations services, as of August 10, 2009. Accordingly, the services agreement with GERI terminated on August 9, 2009.
For the years ended December 31, 2011, 2010, and 2009, we incurred $0, $0, and $177,000, respectively, for investor services that GERI provided to us, which is included in general and administrative expenses in our accompanying consolidated statements of operations.
Liquidity Stage
Disposition Fee
We paid no disposition fees to our former advisor under the terms of the Advisory Agreement. In addition, we have no obligation to pay any disposition fees to our former advisor in the future.
Healthcare Trust of America, Inc.
NOTES TO CONSOLIDATED FINANCIAL STATEMENTS — (Continued)
Subordinated Participation Interest
Pursuant to the terms of the partnership agreement for our operating partnership, as amended on November 14, 2008, our former advisor had the right to receive a subordinated distribution upon the occurrence of certain liquidity events based on the value of our assets owned at the time the Advisory Agreement was terminated plus any assets acquired after such termination for which our former advisor received an acquisition fee. On October 18, 2010, this right was purchased along with our former advisor’s partnership units in our operating partnership pursuant to the Redemption Agreement as discussed above. As a result, our former advisor no longer has the right to receive any subordinated distribution.
13. Redeemable Noncontrolling Interest of Limited Partners
As of December 31, 2011 and 2010, we owned an approximately 99.93% and an approximately 99.92%, respectively, general partner interest in our operating partnership. As of December 31, 2011, and December 31, 2010, approximately 0.07% and 0.08% of our operating partnership was owned by individual investors that elected to exchange their partnership interests in the partnership that owns the 7900 Fannin Medical Office Building for limited partner units of our operating partnership. We acquired the majority interest in the Fannin partnership on June 30, 2010. In aggregate, as of December 31, 2011, approximately 0.07% of the earnings of our operating partnership are allocated to the redeemable noncontrolling interest of limited partners.
On June 30, 2010, we completed the acquisition of the majority interest in the Fannin partnership, which owns the 7900 Fannin Medical Office Building located in Houston, Texas on the Texas Medical Center campus. At closing, we acquired the general partner interest and 84% of the limited partner interests in the Fannin partnership. The original investors, each of whom was a physician practicing at the Fannin medical office building at the time of acquisition, were provided the right to remain in the Fannin partnership, receive limited partner units in our operating partnership, and/or receive cash. Some of the original investors elected to remain in the Fannin partnership post-closing as limited partners. Those investors electing to remain in the Fannin partnership or to receive limited partner units in our operating partnership were provided opportunities for future redemption of their interests/units, exercisable at the option of the holder during periods specified within the agreement.
As of December 31, 2009, we owned an 80.0% interest in the JV Company that owns the Chesterfield Rehabilitation Center, which was originally purchased on December 20, 2007. The redeemable noncontrolling interest balance related to this arrangement at December 31, 2009 was comprised of the noncontrolling interest's initial contribution, 20.0% of the earnings at the Chesterfield Rehabilitation Center, and accretion of the change in the redemption value over the period from the purchase date to January 1, 2011, the earliest redemption date. On March 24, 2010, our subsidiary exercised its call option to buy, for $3,900,000, 100% of the interest owned by its joint venture partner, BD St. Louis, in the JV Company. As a result of the closing of the purchase on March 24, 2010, we own a 100% interest in the Chesterfield Rehabilitation Center, and the associated redeemable noncontrolling interest balance related to this entity was reduced to zero.
Redeemable noncontrolling interests are accounted for in accordance with ASC 480, Distinguishing Liabilities From Equity, or ASC 480, at the greater of their carrying amount or redemption value at the end of each reporting period. Changes in the redemption value from the purchase date to the earliest redemption date are accreted using the straight-line method. Additionally, as the noncontrolling interests provide for redemption features not solely within the control of the issuer, we classify such interests outside of permanent equity. As of December 31, 2011 and 2010, redeemable noncontrolling interest of limited partners was $3,785,000 and $3,867,000, respectively. Below is a table reflecting the activity of the redeemable noncontrolling interests.
Healthcare Trust of America, Inc.
NOTES TO CONSOLIDATED FINANCIAL STATEMENTS — (Continued)
|
| | | |
| Balance as of December 31, 2009 | $ | 3,549,000 |
|
| Net loss attributable to noncontrolling interest of limited partners | (16,000 | ) |
| Distributions | (145,000 | ) |
| Valuation adjustments to noncontrolling interests | 570,000 |
|
| Redemption of limited partner interest of former advisor | (197,000 | ) |
| Purchase of Chesterfield 20% interest | (3,900,000 | ) |
| Addition of noncontrolling interest attributable to the Fannin acquisition | 4,006,000 |
|
| Balance as of December 31, 2010 | $ | 3,867,000 |
|
| | |
| Balance as of December 31, 2010 | $ | 3,867,000 |
|
| Net income attributable to noncontrolling interest of limited partners | 52,000 |
|
| Distributions | (134,000 | ) |
| Balance as of December 31, 2011 | $ | 3,785,000 |
|
For the year ended December 31, 2011, the $52,000 in net income attributable to noncontrolling interest shown on our December 31, 2011 consolidated statement of operations reflects net income attributable to the Fannin partnership. For the year ended December 31, 2010, the ($16,000) in net loss attributable to noncontrolling interest shown on our December 31, 2010 consolidated statement of operations reflects $64,000 in net income earned by the noncontrolling interest in the JV Company prior to our purchase of this noncontrolling interest on March 24, 2010 and $18,000 in net income attributable to our former advisor's limited partner interest, offset by a net loss of ($98,000) attributable to the Fannin partnership following our purchase of the majority interest in this partnership on June 30, 2010.
14. Stockholders’ Equity
Common Stock
Through December 31, 2011, we granted an aggregate of 961,687 shares of restricted common stock to our independent directors, Chief Executive Officer, Chief Financial Officer, Executive Vice President — Acquisitions, Executive Vice President — Asset Management, and other employees pursuant to the terms and conditions of our 2006 Incentive Plan, Employment Agreements, and the employee retention program described below. Through December 31, 2011, we issued 219,394,430 shares of our common stock in connection with our initial offering and follow-on offering and 19,657,520 shares of our common stock under the DRIP, and we repurchased 11,170,638 shares of our common stock under our share repurchase plan. As of December 31, 2011 and 2010, we had 228,491,312 and 202,643,705 shares of our common stock outstanding, respectively.
Pursuant to our follow-on offering, we offered to the public up to 200,000,000 shares of our $0.01 par value common stock for $10.00 per share and up to 21,052,632 shares of our $0.01 par value common stock pursuant to the DRIP at $9.50 per share. Our charter authorizes us to issue 1,000,000,000 shares of our common stock. On February 28, 2011, we stopped offering shares in our primary offering. However, for noncustodial accounts, subscription agreements signed on or before February 28, 2011 with all documents and funds received by end of business March 15, 2011 were accepted. For custodial accounts, subscription agreements signed on or before February 28, 2011 with all documents and funds received by end of business March 31, 2011 were accepted.
On December 20, 2010, our stockholders approved an amendment to our charter to provide for the reclassification and conversion of our common stock in the event our shares are listed on a national securities exchange to implement a phased in liquidity program. We proposed these amendments and submitted them for approval by our stockholders to prepare our company in the event we pursue a listing. Under the phased in liquidity program, our common stock would reclassify and convert into shares of Class A common stock and Class B common stock immediately prior to a listing. In the event of a listing, the shares of Class A common stock would be immediately listed on a national securities exchange. The shares of Class B common stock would not be listed. Rather, those shares would convert into shares of Class A common stock and become listed in defined phases, over a defined period of time within 18 months of a listing. The phased in liquidity program is intended to provide for our stock to be transitioned into the public market in a way that minimizes the stock-pricing instability that could result from concentrated sales of our stock.
Healthcare Trust of America, Inc.
NOTES TO CONSOLIDATED FINANCIAL STATEMENTS — (Continued)
Preferred Stock
Our charter authorizes us to issue 200,000,000 shares of our $0.01 par value preferred stock. As of December 31, 2011 and 2010, no shares of preferred stock were issued and outstanding.
Distribution Reinvestment Plan
We adopted the DRIP that allows stockholders to purchase additional shares of common stock through the reinvestment of distributions, subject to certain conditions. We registered and reserved 21,052,632 shares of our common stock for sale pursuant to the DRIP in our initial offering and we registered and reserved 21,052,632 shares of our common stock for sale pursuant to the DRIP in our follow-on offering. For the years ended December 31, 2011, 2010 and 2009, $75,864,000, $56,551,000, and $38,559,000, respectively, in distributions were reinvested and 7,985,655, 5,952,683, and 4,059,006 shares of our common stock, respectively, were issued under the DRIP. With the termination of our follow-on offering on February 28, 2011, except for the DRIP, we will periodically review potential alternatives for our DRIP, including the amendment, suspension or termination of the plan.
On August 1, 2011, our board of directors adopted an amended and restated distribution reinvestment plan, or the amended DRIP, which became effective August 11, 2011.
The DRIP originally provided that the purchase price for shares under the DRIP be offered at $9.50 per share for up to 12 months subsequent to the close of our last public offering of shares prior to the potential listing of the shares on a national securities exchange, or a listing. Certain rules and regulations promulgated by the Financial Industry Regulatory Authority, Inc., or FINRA, require that we or a third party firm establish a per share estimated valuation not based on the price to acquire our shares in a public offering not later than 18 months after the conclusion of a public offering.
Our board has determined that it is in the best interests of the company and its stockholders to ensure that we have adequate time to undertake procedures necessary to calculate an estimated value per share as required by FINRA. Accordingly, the amended DRIP provides that the purchase price for shares under the DRIP will initially be offered at $9.50 per share for up to 18 months subsequent to the close of our last public offering of shares prior to a listing. We stopped offering shares in our follow-on offering on February 28, 2011 and therefore we currently anticipate that we will establish a per share valuation for our shares by August 28, 2012. After we publish such valuation, under the amended DRIP participants may acquire shares at 95% of the per share valuation determined by the Company or another firm chosen for that purpose until a listing. From and after the date of a listing, participants may acquire shares at a price equal to 100% of the average daily open and close price per share on the distribution payment date, as reported by the national securities exchange on which the shares are traded.
Share Repurchase Plan
Our board of directors has approved a share repurchase plan. On August 24, 2006, we received SEC exemptive relief from rules restricting issuer purchases during distributions. The share repurchase plan allows for share repurchases by us when certain criteria are met by the requesting stockholders. Share repurchases will be made at the sole discretion of our board of directors. On November 24, 2010, we, with the approval of our board of directors, elected to amend and restate our share repurchase plan. Starting in the first calendar quarter of 2011, we will fund a maximum of $10 million of share repurchase requests per quarter, subject to available funding. Funds for the repurchase of shares of our common stock will come exclusively from the proceeds we receive from the sale of shares of our common stock under the DRIP. In addition, with the termination of our follow-on offering on February 28, 2011, except for the DRIP, we are conducting an ongoing review of potential alternatives for our share repurchase plan, including the suspension or termination of the plan.
For the year ended December 31, 2011, we repurchased 3,882,619 shares of our common stock, at an average price of $9.70 per share, for an aggregate amount of $37,680,000. For the year ended December 31, 2010, we repurchased 5,448,260 shares of our common stock, at an average price of $9.52 per share, for an aggregate amount of $51,856,000. For the year ended December 31, 2009, we repurchased 1,730,011 shares of our common stock, at an average price of $9.40 per share, for an aggregate amount of $16,266,000. As of December 31, 2011 and 2010, we had repurchased a total of 11,170,638 shares of our common stock, at an average price of $9.57 per share, for an aggregate amount of $106,879,000 and 7,288,019 shares of our common stock, at an average price of $9.49 per share, for an aggregate amount of $69,199,000, respectively.
Healthcare Trust of America, Inc.
NOTES TO CONSOLIDATED FINANCIAL STATEMENTS — (Continued)
Amended and Restated 2006 Incentive Plan and 2006 Independent Directors Compensation Plan
On February 24, 2011, as a result of our compensation committee's and board of directors' comprehensive review of our compensation structure, our board of directors amended and restated our 2006 Incentive Plan, or the Amended and Restated 2006 Plan. Consistent with the original plan, the Amended and Restated 2006 Plan permits the grant of incentive awards to our employees, officers, non-employee directors, and consultants as selected by our board or the compensation committee. Our philosophy regarding compensation is to structure employee compensation to promote and reward performance-based behavior, which results in risk-managed, added value to our company and stockholders. The plan is designed to provide maximum flexibility to our company consistent with our current size, the stage of our life cycle, and our overall strategic plan. As and when our board and compensation committee determine various performance-based awards, the details of such awards,enhancements, such as vesting termscollateral postings, thresholds, mutual puts, and post-termination exercise periods, will be addressed in the individual award agreements.guarantees.
The Amended and Restated 2006 Incentive Plan authorizes the granting of awards in any of the following forms: options, stock appreciation rights, restricted stock, restricted or deferred stock units, performance awards, dividend equivalents, other stock-based awards, including units in operating partnership, and cash-based awards. Subject to adjustment as provided in the Amended and Restated 2006 Incentive Plan, the aggregate number of shares of our common stock reserved and available for issuance pursuant to awards granted under the Amended and Restated 2006 Incentive Plan is 10,000,000 (which includes 2,000,000 shares originally reserved for issuance under the plan and 8,000,000 new shares added pursuant to the amendment and restatement).
During the years ended December 31, 2011 and 2010, we granted an aggregate of 37,500 and 37,500 shares, respectively, to our independent directors. Each of these restricted stock awards vested 20.0% on the grant date and 20.0% will vest on each of the first four anniversaries of the date of grant.
On November 14, 2008, we granted Mr. Peters 40,000 shares of restricted common stock under, and pursuant to the terms and conditions of our 2006 Incentive Plan. The shares of restricted common stock vested and became non-forfeitable in equal annual installments of 33.3% each, on the first, second and third anniversaries of the grant date. Pursuant to the terms of his new employment agreement, on July 1, 2009, Mr. Peters was entitled to receive 50,000 shares of fully vested stock under, and pursuant to, the terms and conditions of our 2006 Incentive plan and his employment agreement. Pursuant to the terms of his new employment agreement, on July 1, 2009, Mr. Peters was also entitled to receive an annual award of 100,000 shares of restricted common stock with three additional annual awards of 100,000 shares beginning July 1, 2010, subject to board approval, under, and pursuant to, the terms and conditions of our 2006 Incentive plan and his employment agreement. On May 20, 2010, the Board approved an amendment to Mr. Peters’ employment agreement with the Company to increase the number of restricted shares Mr. Peters is entitled to receive on each of the first three anniversaries of the effective date of his employment agreement from 100,000 to 120,000. The share awards will vest and become non-forfeitable over the balance of the term of his employment agreement. The terms of his employment agreement provide Mr. Peters with the option to receive cash in lieu of stock for up to 50% of the grants made under his employment agreement at the time of issuance at the common stock fair value on the grant date, which option has been exercised with respect to all grants under his agreement. Accordingly, Mr. Peters received grants of 120,000 shares on July 1, 2011 and 2010, respectively, and elected to receive a restricted cash award in lieu of 60,000 shares during each of those years.
Employee Retention Program
On May 20, 2010, the Board approved the adoption of an employee retention program pursuant to which the Company will grant its executive officers and employees restricted shares of the Company’s common stock. The purpose of this program is to incentivize the Company’s executive officers and employees to remain with the Company for a minimum of three years, subject to meeting the Company’s performance standards.
As part of the first stage of this program, on May 24, 2010, our named executive officers were entitled to receive grants aggregating to 200,000 shares of restricted stock. Mr. Peters elected to receive a restricted cash award in lieu of half of his total grant. Additionally, on January 3, 2011, Mr. Peters, Ms. Pruitt, Mr. Engstrom, and other key employees, were entitled to receive grants of 200,000, 80,000, 80,000, and 10,000 shares of restricted stock, respectively. Mr. Peters elected to receive a restricted cash award in lieu of 100,000 shares. The restricted shares and the restricted cash award granted to Mr. Peters on January 3, 2011 vested one-fourth upon grant, and the remaining shares and cash award will vest in thirds on each anniversary of the grant date, provided that he is employed by the Company on such date. All of the shares granted to Ms. Pruitt, Mr. Engstrom, and the other employees will vest 100% on the third anniversary of the grant date, provided that the grantee is employed by the Company on such date.
In December 2010 and January 2011, we granted 110,000 and 16,000 shares, respectively, to other employees as part of the second stage of this program. Each of these grants will vest 100% on the third anniversary of the grant date, provided that the grantee is employed by the Company on such date.
Healthcare Trust of America, Inc.
NOTES TO CONSOLIDATED FINANCIAL STATEMENTS — (Continued)
Share-Based Compensation
The fair value of each share of restricted common stock and restricted common stock unit that has been granted under the plan is estimated at the date of grant at $10.00 per share, the per share price of shares in our initial and follow-on offerings, and is amortized on a straight-line basis over the vesting period. Shares of restricted common stock and restricted common stock units may not be sold, transferred, exchanged, assigned, pledged, hypothecated or otherwise encumbered. Such restrictions expire upon vesting. For the years ended December 31, 2011, 2010, and 2009 we recognized compensation expense of $3,221,000, $1,313,000, and $816,000, respectively, related to the restricted common stock grants. Such compensation expense is included in general and administrative expenses in our accompanying consolidated statements of operations. Shares of restricted common stock have full voting rights and rights to dividends. Shares of restricted common stock units do not have voting rights or rights to dividends.
A portion of our awards may be paid in cash in lieu of stock in accordance with the respective employment agreement and vesting schedule of such awards. These awards are revalued every reporting period end with the cash redemption liability reflected on our consolidated balance sheets, if material. For the year ended December 31, 2011, 104,167 shares were settled in cash for approximately $1,042,000. For the year ended December 31, 2010, 32,500 shares were settled in cash for approximately $325,000. For the year ended December 31, 2009, 37,500 shares were settled in cash for approximately $375,000. As of December 31, 2011 and 2010, the liability balances associated with the cash awards were $663,000 and $263,000, respectively.
As of December 31, 2011 and 2010, there was approximately $3,962,000 and $4,143,000, respectively, of total unrecognized compensation expense net of estimated forfeitures, related to nonvested shares of restricted common stock. As of December 31, 2011, this expense is expected to be recognized over a remaining weighted average period of 2.3 years.
As of December 31, 2011 and 2010, the fair value of the nonvested shares of restricted common stock and restricted common stock units was $6,165,000 and $4,352,000, respectively. A summary of the status of the nonvested shares of restricted common stock and restricted common stock units as of December 31, 2011, 2010, and 2009 is presented below:
|
| | | | | | |
| | Restricted Common Stock/Units | | Weighted Average Grant Date Fair Value |
| Balance — December 31, 2008 | 68,500 |
| | $ | 10.00 |
|
| Granted, net | 165,000 |
| | 10.00 |
|
| Vested | (65,833 | ) | | 10.00 |
|
| Balance — December 31, 2009 | 167,667 |
| | $ | 10.00 |
|
| Nonvested shares expected to vest — December 31, 2009 | 167,667 |
| | $ | 10.00 |
|
| Granted, net | 357,500 |
| | $ | 10.00 |
|
| Vested | (85,157 | ) | | 10.00 |
|
| Forfeited | (4,842 | ) | | — |
|
| Balance — December 31, 2010 | 435,168 |
| | $ | 10.00 |
|
| Nonvested shares expected to vest — December 31, 2010 | 435,168 |
| | $ | 10.00 |
|
| Granted, net | 383,500 |
| | $ | 10.00 |
|
| Vested | (163,681 | ) | | 10.00 |
|
| Forfeited | (38,481 | ) | | 10.00 |
|
| Balance — December 31, 2011 | 616,506 |
| | $ | 10.00 |
|
| Nonvested shares expected to vest — December 31, 2011 | 616,506 |
| | $ | 10.00 |
|
Healthcare Trust of America, Inc.
NOTES TO CONSOLIDATED FINANCIAL STATEMENTS — (Continued)
15. Fair Value of Financial Instruments
ASC 820, Fair Value Measurements and Disclosures, or ASC 820, defines fair value, establishes a framework for measuring fair value in GAAP and expands disclosures about fair value measurements. ASC 820 emphasizes that fair
Fair value is a market-based measurement as opposed to a transaction-specific measurement and most of the provisions were effective for our consolidated financial statements beginning January 1, 2008.
Fair value is defined by ASC 820 as the price that would be received to sell an asset or paid to transfer a liability in an orderly transaction between market participants at the measurement date. Depending on the nature of the asset or liability, various techniques and assumptions can be used to estimate the fair value. Financial assets and liabilities are measured using inputs from three levels of the fair value hierarchy, as follows:
Level 1 — Inputs are quoted prices (unadjusted) in active markets for identical assets or liabilities that we have the ability to access at the measurement date. An active market is defined as a market in which transactions for the assets or liabilities occur with sufficient frequency and volume to provide pricing information on an ongoing basis.
Level 2 — Inputs include quoted prices for similar assets and liabilities in active markets, quoted prices for identical or similar assets or liabilities in markets that are not active (markets with few transactions), inputs other than quoted prices that are observable for the asset or liability (i.e., interest rates, yield curves, etc.), and inputs that derived principally from or corroborated by observable market data correlation or other means (market corroborated inputs).
Level 3 — Unobservable inputs, only used to the extent that observable inputs are not available, reflect our assumptions about the pricing of an asset or liability.
ASC 825, Financial Instruments, ASC 825, requires disclosure of fair value of financial instruments in interim financial statements as well as in annual financial statements.
We use fair value measurements to record the fair value of certain assets and to estimate fair value of financial instruments not recorded at fair value but required to be disclosed at fair value.
Receivables and Other Assets
Receivables and other assets consist of accounts and other receivables, tenant note receivable, deferred financing costs, deferred leasing costs, lease inducements, straight-line rent receivables, prepaid expenses, deposits, equipment and other and derivative financial instruments - interest rate swaps. Management periodically evaluates the realizability of future cash flows from tenant notes receivable when events or circumstances, such as the non-receipt of principal and interest payments and/or significant deterioration of the financial condition of the borrower, indicate that the carrying amount of the tenant note receivable may not be recoverable. An impairment charge is recognized in current period earnings and is calculated as the difference between the carrying amount of the tenant note receivable and the discounted cash flows expected to be received. Deferred financing costs include amounts paid to lenders and others to obtain financing and are amortized to interest expense on a straight-line basis over the term of the related loan which approximates the effective interest method. Deferred leasing costs are amounts incurred in executing a lease, both for external broker and marketing costs, plus a portion of internal leasing related costs. Deferred leasing costs are amortized on a straight-line basis method over the term of the applicable lease. Deferred leasing costs are included in operating activities in our consolidated statements of cash flows. Lease inducements are amortized on a straight-line basis against rental income over the term of the applicable lease.
Share-Based Compensation
We calculate the fair value of share-based awards on the date of grant. Restricted common stock is valued based on the closing price of our Class A common stock on the NYSE. The LTIP units were valued using a Monte Carlo simulation which took into account volatility, dividend yield, expected term, risk-free rate and stock price. We amortize the share-based compensation expense over the period that the awards are expected to vest, net of estimated forfeitures. See Note 11 for further discussion.
HEALTHCARE TRUST OF AMERICA, INC. AND HEALTHCARE TRUST OF AMERICA HOLDINGS, LP
NOTES TO CONSOLIDATED FINANCIAL STATEMENTS – (Continued)
Noncontrolling Interests
HTA’s net income attributable to noncontrolling interests in the accompanying consolidated statements of operations relate to both noncontrolling interest reflected within equity and redeemable noncontrolling interest of limited partners reflected outside of equity in the accompanying consolidated balance sheets. Limited partner units, including LTIP awards, in HTALP are accounted for as partners’ capital in HTALP’s accompanying consolidated balance sheets and as noncontrolling interest reflected within equity or redeemable noncontrolling interest of limited partners reflected outside of equity in HTA’s accompanying consolidated balance sheets.
Redeemable noncontrolling interests relate to the interests in our consolidated entities that are not wholly owned by us. As these redeemable noncontrolling interests provide for redemption features not solely within the control of the issuer, we classify such interests outside of permanent equity or partners’ capital.
Listing Expenses
Listing expenses primarily included fees associated with the Listing and share-based compensation expense associated with the LTIP awards that we granted in connection with the Listing.
Non-Traded REIT Expenses
Non-traded REIT expenses included stockholder services, including the printing and mailing of stockholder statements, the maintenance of an online investor portal, and other significant mailings and promotional investor materials traditionally borne by an advisor, which we did not have. As a result of our individual stockholders transferring their shares of HTA stock to brokers as a result of the Listing, we no longer incur these costs. Additionally, these expenses included share-based compensation expense attributable to our executives and Board of Directors. These related shares were accelerated pursuant to the Listing and were applicable to past services relative to our non-traded REIT status.
Income Taxes
HTA believes that it has qualified to be taxed as a REIT under the provisions of the Internal Revenue Code of 1986, as amended or the Code, beginning with the taxable year ending December 31, 2007 and it intends to continue to qualify to be taxed as a REIT. To continue to qualify as a REIT for federal income tax purposes, HTA must meet certain organizational and operational requirements, including a requirement to pay dividend distributions to its stockholders of at least 90% of its annual taxable income. As a REIT, HTA is generally not subject to federal income tax on net income that it distributes to its stockholders, but it may be subject to certain state or local taxes on its income and property.
If HTA fails to qualify as a REIT in any taxable year, it will then be subject to U.S. federal income taxes on our taxable income and will not be permitted to qualify for treatment as a REIT for U.S. federal income tax purposes for four years following the year during which qualification is lost unless the IRS grants it relief under certain statutory provisions. Such an event could have a material adverse effect on its business, financial condition, results of operations and net cash available for dividend distributions to its stockholders.
As discussed in Note 1, HTA conducts substantially all of its operations through HTALP. As a partnership, HTALP generally is not liable for federal income taxes. The income and loss from the operations of HTALP is included in the tax returns of its partners, including HTA, who are responsible for reporting their allocable share of the partnership income and loss. Accordingly, no provision for income taxes has been made on the accompanying consolidated financial statements.
We do not have any liability for uncertain tax positions that we believe should be recognized in our accompanying consolidated financial statements. The tax basis exceeded the carrying amount of the net assets reported in our consolidated balance sheet by approximately $254.7 million as of December 31, 2013.
Concentration of Credit Risk
We maintain the majority of our cash and cash equivalents at major financial institutions in the United States and deposits with these financial institutions may exceed the amount of insurance provided on such deposits; however, we regularly monitor the financial stability of these financial institutions and believe we are not currently exposed to any significant default risk with respect to these deposits. As of December 31, 2013, we had cash balances of $19.9 million in excess of Federal Deposit Insurance Corporation insured limits.
HEALTHCARE TRUST OF AMERICA, INC. AND HEALTHCARE TRUST OF AMERICA HOLDINGS, LP
NOTES TO CONSOLIDATED FINANCIAL STATEMENTS – (Continued)
Segment Disclosure
We have determined that we have one reportable segment, with activities related to investing in medical office buildings, healthcare-related facilities and other real estate-related assets. Our investments in real estate and other real estate-related assets are geographically diversified and our chief operating decision maker evaluates operating performance on an individual asset level. As each of our assets has similar economic characteristics, tenants, and products and services, our assets have been aggregated into one reportable segment.
Recently Issued or Adopted Accounting Pronouncements
In January 2013, the Financial Accounting Standards Board issued Accounting Standards Update, or ASU, 2013-01, Balance Sheet (Topic 210) - Clarifying the Scope of Disclosures about Offsetting Assets and Liabilities, or ASU 2013-01, which clarifies the scope of ASU 2011-11, Balance Sheet (Topic 210) - Disclosures about Offsetting Assets and Liabilities. ASU 2013-01 requires entities to disclose both gross and net information about derivatives, including bifurcated embedded derivatives, repurchase agreements and reverse purchase agreements and securities borrowing and securities lending transactions that are subject to an agreement similar to a master netting arrangement. Entities are required to apply these disclosures for annual reporting periods beginning on or after January 1, 2013, and interim periods within those annual periods. An entity must provide the disclosures required by those amendments retrospectively for all comparative periods presented. We adopted ASU 2011-11 and ASU 2013-01 in the first quarter of fiscal 2013, see Note 9.
3. Business Combinations
For the year ended December 31, 2013, we completed ten acquisitions for an aggregate purchase price of $397.8 million. We incurred $4.8 million of costs attributable to these completed acquisitions. As part of the acquisitions we assumed mortgage loans with a fair value of $53.4 million.
The aggregate net purchase price of the 2013 acquisitions was allocated in the amounts set forth in the table below. Due to the recent timing of certain acquisitions, we have not yet finalized our purchase price allocation. Since the acquisitions were determined to be individually not significant, but material on a collective basis, the allocations for these acquisitions are set forth below in the aggregate (in thousands):
|
| | | | |
| 2013 Acquisitions | | Total |
| Land | | $ | 16,192 |
|
| Building and improvements | | 292,037 |
|
| Below market leasehold interests | | 10,317 |
|
| Above market leases | | 2,999 |
|
| In place leases | | 52,845 |
|
| Tenant relationships | | 25,119 |
|
| Below market leases | | (2,104 | ) |
| Above market debt | | (694 | ) |
| Interest rate swap | | (2,600 | ) |
| | | 394,111 |
|
| Contingencies and other, net | | 3,715 |
|
| Aggregate purchase price | | $ | 397,826 |
|
The weighted average lives of the above acquired intangible assets and liabilities were 16.0 years and 5.6 years, respectively.
The following is a brief description of each of the 2013 acquisitions.
On March 11, 2013, we completed the acquisition of a medical office building located in Dallas, Texas for $48.7 million.
On March 22, 2013, we completed the acquisition of a medical office building located in Bryan/College Station, Texas for $39.8 million.
On June 18, 2013, we completed the acquisition of a medical office building located in Atlanta, Georgia for $5.6 million.
HEALTHCARE TRUST OF AMERICA, INC. AND HEALTHCARE TRUST OF AMERICA HOLDINGS, LP
NOTES TO CONSOLIDATED FINANCIAL STATEMENTS – (Continued)
On July 12, 2013, we completed the acquisition of a medical office property located in Monroeville, Pennsylvania for $15.1 million.
On July 29, 2013, we completed the acquisition of a medical office building located in Denver, Colorado for $42.0 million.
On August 30, 2013, we completed the acquisition of a medical office building located in Dallas, Texas for $27.7 million.
On September 20, 2013, we completed the acquisition of a portfolio of medical office buildings located in Miami/West Palm Beach, Florida for $62.9 million. As part of the acquisition, we assumed $18.0 million of fixed rate mortgage loans.
On November 13, 2013, we completed the acquisition of a medical office building located in Austin, Texas for $9.6 million.
On December 10, 2013, we completed the acquisition of a medical office building located in Austin, Texas for $19.7 million. As part of the acquisition, we assumed a $4.8 million fixed rate mortgage loan.
On December 13, 2013, we completed the acquisition of a portfolio of medical office buildings located in Tampa/Jupiter, Florida for $126.7 million. As part of the acquisition, we assumed a $29.9 million variable rate mortgage loan with an associated interest rate swap.
The aggregate net purchase price of the 2012 acquisitions was allocated in the amounts set forth in the table below. Since the acquisitions were determined to be individually not significant, but material on a collective basis, the allocations for these acquisitions are set forth below in the aggregate (in thousands):
|
| | | | |
| 2012 Acquisitions | | Total |
| Land | | $ | 13,479 |
|
| Building and improvements | | 225,924 |
|
| Below market leasehold interests | | 3,284 |
|
| Above market leases | | 4,199 |
|
| In place leases | | 27,136 |
|
| Tenant relationships | | 22,100 |
|
| Below market leases | | (1,472 | ) |
| | | 294,650 |
|
| Contingencies and other, net | | 287 |
|
| Aggregate purchase price | | $ | 294,937 |
|
The weighted average lives of the above acquired intangible assets and liabilities were 14.2 years and 7.6 years, respectively.
We recorded the below revenues and net income (loss) for the year ended December 31, 2013 related to the 2013 acquisitions and for the year ended December 31, 2012 related to the 2012 acquisitions (in thousands): |
| | | | | | | |
| | 2013 Acquisitions | | 2012 Acquisitions |
| | Year Ended | | Year Ended |
| | December 31, 2013 | | December 31, 2012 |
| Revenues | $ | 15,361 |
| | $ | 26,717 |
|
| Net income (loss) | 206 |
| | 7,537 |
|
HEALTHCARE TRUST OF AMERICA, INC. AND HEALTHCARE TRUST OF AMERICA HOLDINGS, LP
NOTES TO CONSOLIDATED FINANCIAL STATEMENTS – (Continued)
Supplementary Pro Forma Information of HTA
The following pro forma consolidated results of operations of HTA for the years ended December 31, 2013 and 2012, assumes that all 2013 acquisitions occurred on January 1, 2012 and excludes $4.8 million of acquisition-related expenses (in thousands, except per share data): |
| | | | | | | |
| | Year Ended December 31, |
| | 2013 | | 2012 |
| Revenues | $ | 349,813 |
| | $ | 342,655 |
|
| Net income (loss) attributable to common stockholders | 28,017 |
| | (25,294 | ) |
| | | | |
| Net income (loss) per share attributable to common stockholders - basic | $ | 0.12 |
| | $ | (0.10 | ) |
| Net income (loss) per share attributable to common stockholders - diluted | 0.12 |
| | (0.10 | ) |
The following pro forma consolidated results of operations of HTA for the years ended December 31, 2012 and 2011, assumes that all 2012 acquisitions occurred on January 1, 2011 and excludes $3.0 million of acquisition-related expenses (in thousands, except per share data): |
| | | | | | | |
| | Year Ended December 31, |
| | 2012 | | 2011 |
| Revenues | $ | 306,420 |
| | $ | 307,246 |
|
| Net income (loss) attributable to common stockholders | (21,928 | ) | | 6,736 |
|
| | | | |
| Net income (loss) per share attributable to common stockholders - basic | $ | (0.10 | ) | | $ | 0.03 |
|
| Net income (loss) per share attributable to common stockholders - diluted | (0.10 | ) | | 0.03 |
|
The pro forma results are not necessarily indicative of the operating results that would have been obtained had the acquisitions occurred at the beginning of the periods presented, nor are they necessarily indicative of future operating results.
Supplementary Pro Forma Information of HTALP
The following pro forma consolidated results of operations of HTALP for the years ended December 31, 2013 and 2012, assumes that all 2013 acquisitions occurred on January 1, 2012 and excludes $4.8 million of acquisition-related expenses (in thousands, except per unit data): |
| | | | | | | |
| | Year Ended December 31, |
| | 2013 | | 2012 |
| Revenues | $ | 349,813 |
| | $ | 342,655 |
|
| Net income (loss) attributable to common unitholders | 28,389 |
| | (25,278 | ) |
| | | | |
| Net income (loss) per unit attributable to common unitholders - basic | $ | 0.12 |
| | $ | (0.10 | ) |
| Net income (loss) per unit attributable to common unitholders - diluted | 0.12 |
| | (0.10 | ) |
HEALTHCARE TRUST OF AMERICA, INC. AND HEALTHCARE TRUST OF AMERICA HOLDINGS, LP
NOTES TO CONSOLIDATED FINANCIAL STATEMENTS – (Continued)
The following pro forma consolidated results of operations of HTALP for the years ended December 31, 2012 and 2011, assumes that all 2012 acquisitions occurred on January 1, 2011 and excludes $3.0 million of acquisition-related expenses (in thousands, except per unit data): |
| | | | | | | |
| | Year Ended December 31, |
| | 2012 | | 2011 |
| Revenues | $ | 306,420 |
| | $ | 307,246 |
|
| Net income (loss) attributable to common unitholders | (21,912 | ) | | 6,758 |
|
| | | | |
| Net income (loss) per unit attributable to common unitholders - basic | $ | (0.10 | ) | | $ | 0.03 |
|
| Net income (loss) per unit attributable to common unitholders - diluted | (0.10 | ) | | 0.03 |
|
The pro forma results are not necessarily indicative of the operating results that would have been obtained had the acquisitions occurred at the beginning of the periods presented, nor are they necessarily indicative of future operating results.
4. Real Estate Notes Receivable
Real estate notes receivable includes four promissory notes totaling $20.0 million as of December 31, 2013 and 2012. The promissory notes are secured by medical office buildings, with interest rates ranging from 10.85% to 10.95% per annum. The promissory notes matured on November 1, 2013, but subsequent to December 31, 2013 were extended to June 25, 2014. We might extend the notes again if they are not repaid by the maturity date. The associated medical office buildings are being actively marketed for sale and the notes will be repaid upon any sale. The promissory notes have sufficient collateral coverage based on the value of the medical office buildings. The promissory notes continue to accrue interest at the same per annum rates and as of December 31, 2013 all interest payments were current.
In addition, we originated two promissory notes in September 2013 totaling $8.5 million. The promissory notes are secured by medical office buildings in South Florida, each with an interest rate of 7.0% per annum. The properties are being actively marketed for sale and the notes will be repaid upon any sale. The promissory notes mature on October 1, 2016.
We monitor the credit quality of our real estate notes receivable on an ongoing basis by tracking possible credit quality indicators. As of December 31, 2013, all of our real estate notes receivable are current and we have not provided for any allowance for losses or recorded any impairments. We made no purchases or sales of real estate notes receivable during the years ended December 31, 2013 and 2012.
HEALTHCARE TRUST OF AMERICA, INC. AND HEALTHCARE TRUST OF AMERICA HOLDINGS, LP
NOTES TO CONSOLIDATED FINANCIAL STATEMENTS – (Continued)
5. Intangible Assets and Liabilities
Intangible assets and liabilities consisted of the following as of December 31, 2013 and 2012 (in thousands, except weighted average remaining amortization period):
|
| | | | | | | | | | | | | |
| | December 31, 2013 | | December 31, 2012 | | |
| | Balance | | Weighted Average Remaining Amortization Period in Years | | Balance | | Weighted Average Remaining Amortization Period in Years | | Balance Sheet Classification |
| Assets: | | | | | | | | | |
| In place leases | $ | 212,142 |
| | 8.8 | | $ | 174,615 |
| | 9.7 | | Lease intangibles |
| Tenant relationships | 197,214 |
| | 10.5 | | 178,269 |
| | 11.6 | | Lease intangibles |
| Above market leases | 26,799 |
| | 6.3 | | 25,387 |
| | 6.9 | | Other intangibles, net |
| Below market leasehold interests | 37,640 |
| | 68.9 | | 30,587 |
| | 69.4 | | Other intangibles, net |
| | 473,795 |
| | | | 408,858 |
| | | | |
| Accumulated amortization | (150,207 | ) | | | | (125,924 | ) | | | | |
| Total | $ | 323,588 |
| | 15.9 | | $ | 282,934 |
| | 15.9 | | |
| | | | | | | | | | |
| Liabilities: | | | | | | | | | |
| Below market leases | $ | 13,989 |
| | 12.4 | | $ | 12,823 |
| | 13.7 | | Intangible liabilities, net |
| Above market leasehold interests | 3,827 |
| | 33.1 | | 3,827 |
| | 34.0 | | Intangible liabilities, net |
| | 17,816 |
| | | | 16,650 |
| | | | |
| Accumulated amortization | (6,019 | ) | | | | (5,341 | ) | | | | |
| Total | $ | 11,797 |
| | 18.4 | | $ | 11,309 |
| | 19.5 | | |
The following is a summary of the net intangible amortization for the years ended December 31, 2013, 2012 and 2011 (in thousands): |
| | | | | | | | | | | |
| | Year Ended December 31, |
| | 2013 | | 2012 | | 2011 |
| Amortization recorded against rental income related to above or below market leases | $ | 1,772 |
| | $ | 1,682 |
| | $ | 1,983 |
|
| Rental expense related to above or below market leasehold interests | 346 |
| | 521 |
| | 700 |
|
| Amortization expense related to in place leases and tenant relationships | 42,820 |
| | 41,643 |
| | 40,489 |
|
As of December 31, 2013, the amortization of intangible assets and liabilities for each of the next five years and thereafter is as follows (in thousands): |
| | | | | | | | |
| Year | | Assets | | Liabilities |
| 2014 | | $ | 49,888 |
| | $ | 1,492 |
|
| 2015 | | 43,841 |
| | 1,274 |
|
| 2016 | | 38,424 |
| | 1,073 |
|
| 2017 | | 32,390 |
| | 792 |
|
| 2018 | | 26,575 |
| | 736 |
|
| Thereafter | | 132,470 |
| | 6,430 |
|
| Total | | $ | 323,588 |
| | $ | 11,797 |
|
HEALTHCARE TRUST OF AMERICA, INC. AND HEALTHCARE TRUST OF AMERICA HOLDINGS, LP
NOTES TO CONSOLIDATED FINANCIAL STATEMENTS – (Continued)
6. Receivables and Other Assets
Receivables and other assets consisted of the following as of December 31, 2013 and 2012 (in thousands):
|
| | | | | | | |
| | December 31, 2013 | | December 31, 2012 |
| Accounts and other receivables, net | $ | 22,847 |
| | $ | 13,317 |
|
| Tenant note receivable | 3,173 |
| | 3,287 |
|
| Deferred financing costs, net | 10,921 |
| | 11,006 |
|
| Deferred leasing costs, net | 12,954 |
| | 10,554 |
|
| Lease inducements, net | 759 |
| | 880 |
|
| Straight-line rent receivables, net | 46,957 |
| | 39,095 |
|
| Prepaid expenses, deposits, equipment and other, net | 6,653 |
| | 6,831 |
|
| Derivative financial instruments - interest rate swaps | 5,073 |
| | — |
|
| Total | $ | 109,337 |
| | $ | 84,970 |
|
The tenant note receivable is for a loan to a tenant for building improvements. The interest rate thereon is 9.0% per annum and requires monthly principal and interest payments from the tenant through July 2027. As of December 31, 2013, the tenant note receivable is current and we have not provided any allowance for losses or recorded any impairments.
The following is a summary of amortization of deferred leasing costs, deferred financing costs, and lease inducements for the years ended December 31, 2013, 2012 and 2011 (in thousands): |
| | | | | | | | | | | |
| | Year Ended December 31, |
| | 2013 | | 2012 | | 2011 |
| Amortization expense related to deferred leasing costs | $ | 2,636 |
| | $ | 1,868 |
| | $ | 1,139 |
|
| Interest expense related to deferred financing costs | 3,837 |
| | 3,861 |
| | 3,540 |
|
| Amortization recorded against rental income related to lease inducements | 208 |
| | 269 |
| | 165 |
|
As of December 31, 2013, the amortization of deferred leasing costs, deferred financing costs, and lease inducements for each of the next five years and thereafter is as follows (in thousands): |
| | | | |
| Year | | Amount |
| 2014 | | $ | 6,118 |
|
| 2015 | | 5,638 |
|
| 2016 | | 3,599 |
|
| 2017 | | 2,593 |
|
| 2018 | | 2,071 |
|
| Thereafter | | 4,615 |
|
| Total | | $ | 24,634 |
|
HEALTHCARE TRUST OF AMERICA, INC. AND HEALTHCARE TRUST OF AMERICA HOLDINGS, LP
NOTES TO CONSOLIDATED FINANCIAL STATEMENTS – (Continued)
7. Assets Held for Sale and Discontinued Operations
During 2013, we classified one of our properties as held for sale as we committed to an approved plan to seek to dispose of the property. The sale of the property is expected to occur within one year. The property is being marketed at a price we believe is consistent with its fair value. We will re-assess the classification as held for sale if it has not sold by the end of the first quarter of 2014. As of December 31, 2012, there were no properties held for sale. The following table represents the major classes of assets and liabilities, and the balance sheet classification as of December 31, 2013 (in thousands):
|
| | | | |
| | | December 31, 2013 |
| Land | | $ | 5,109 |
|
| Building and improvements, net | | 15,181 |
|
| Lease intangibles, net | | 848 |
|
| Property held for sale, net | | $ | 21,138 |
|
| | | |
| Receivables and other assets, net | | $ | 948 |
|
| Non-real estate assets of property held for sale, net | | $ | 948 |
|
| | | |
| Security deposits, prepaid rent and other liabilities | | $ | 200 |
|
| Security deposits, prepaid rent and other liabilities | | $ | 200 |
|
The table below reflects the results of operations of the property classified as held for sale, which are included in discontinued operations for the years ended December 31, 2013, 2012 and 2011 (in thousands):
|
| | | | | | | | | | | |
| | Year Ended December 31, |
| | 2013 | | 2012 | | 2011 |
| Revenues | $ | 1,702 |
| | $ | 2,264 |
| | $ | 2,261 |
|
| Expenses | 434 |
| | 1,182 |
| | 1,268 |
|
| Income before other income (expense) | 1,268 |
| | 1,082 |
| | 993 |
|
| Interest expense related to debt | (161 | ) | | (514 | ) | | (573 | ) |
| Income from discontinued operations | $ | 1,107 |
| | $ | 568 |
| | $ | 420 |
|
8. Debt
Debt consisted of the following as of December 31, 2013 and 2012 (in thousands):
|
| | | | | | | | |
| | | December 31, 2013 | | December 31, 2012 |
| Unsecured revolving credit facility | | $ | 55,000 |
| | $ | 72,000 |
|
| Unsecured term loans | | 455,000 |
| | 455,000 |
|
| Unsecured senior notes | | 300,000 |
| | — |
|
| Fixed rate mortgages | | 373,751 |
| | 382,456 |
|
| Variable rate mortgages | | 29,925 |
| | — |
|
| Secured real estate term loan | | — |
| | 125,500 |
|
| | | 1,213,676 |
| | 1,034,956 |
|
| Net premium (discount) | | 565 |
| | 2,403 |
|
| Total | | $ | 1,214,241 |
| | $ | 1,037,359 |
|
Unsecured Credit Agreement
On March 29, 2012, HTA and HTALP entered into an unsecured credit agreement to obtain a $575.0 million unsecured revolving credit facility and a $300.0 million unsecured term loan.
HEALTHCARE TRUST OF AMERICA, INC. AND HEALTHCARE TRUST OF AMERICA HOLDINGS, LP
NOTES TO CONSOLIDATED FINANCIAL STATEMENTS – (Continued)
Unsecured Revolving Credit Facility
On March 7, 2013, we executed an amendment to the unsecured credit agreement pursuant to an existing provision therein to increase the principal amount of the unsecured revolving credit facility. This amendment added an additional lender and increased the unsecured revolving credit facility by $75.0 million to $650.0 million. The other existing terms of the unsecured credit agreement were unchanged except for those relating to the unsecured term loan as discussed below. The unsecured revolving credit facility matures on March 29, 2016 and includes a one-year extension option, subject to certain conditions.
The actual amount of credit available is a function of certain loan-to-value and debt service coverage ratios. The maximum principal amount may be increased, subject to such additional financing being provided by our existing lenders or new lenders added to the unsecured revolving credit facility.
Borrowings under the $650.0 million unsecured revolving credit facility accrue interest equal to adjusted LIBOR plus a margin ranging from 1.10% to 1.75% per annum based on our credit rating. We also pay a facility fee ranging from 0.20% to 0.50% per annum on the aggregate commitments under the unsecured revolving credit facility. As of December 31, 2013, the margin associated with our borrowings was 1.30% per annum and the facility fee was 0.25% per annum.
Unsecured Term Loan
Borrowings under the $300.0 million unsecured term loan accrue interest equal to adjusted LIBOR plus a margin ranging from 1.30% to 2.25% per annum based on our credit rating. The margin associated with our borrowings as of December 31, 2013 was 1.55% per annum. We have interest rate swaps in place that fix the interest rate at 2.60% per annum, based on our current credit rating. The unsecured term loan matures on March 29, 2016 and includes a one-year extension option, subject to certain conditions.
On January 7, 2014, we executed an amendment to the unsecured credit agreement that decreased the interest rate on the unsecured term loan to adjusted LIBOR plus a margin ranging from 1.05% to 1.95% per annum based on our current credit rating. The margin associated with our borrowing as of the amendment date was 1.20%. In addition, the maturity date was extended to January 31, 2018. The other existing terms of the unsecured credit agreement were unchanged.
$155.0 million Unsecured Term Loan
On July 20, 2012, HTALP entered into a $155.0 million unsecured term loan that is guaranteed by HTA. The loan matures on July 19, 2019 and the interest rate thereon is equal to LIBOR plus a margin ranging from 1.55% to 2.40% per annum based on our credit rating. The margin associated with the borrowings as of December 31, 2013 was 1.70% per annum. We have interest rate swaps in place that fix the interest rate at 2.99% per annum, based on our current credit rating. The maximum principal amount may be increased by us, subject to such additional financing being provided by our existing lender.
$300.0 million Unsecured Senior Notes
On March 28, 2013, HTALP issued $300.0 million of unsecured senior notes guaranteed by HTA that mature on April 15, 2023. The unsecured senior notes bear interest at 3.70% per annum payable semi-annually and were offered at 99.186% of the principal amount thereof, with an effective yield to maturity of 3.80% per annum. HTALP completed the exchange offer of the unsecured senior notes which are now registered under the Securities Act of 1933, as amended, on November 21, 2013.
Fixed and Variable Rate Mortgages
As of December 31, 2013, HTALP and its subsidiaries had fixed and variable rate mortgages with interest rates ranging from 1.62% to 12.75% per annum and a weighted average interest rate of 5.56% per annum. Including the impact of the interest rate swap associated with our variable rate mortgage, the weighted average interest rate was 5.80% per annum. During the year, we assumed three fixed rate and one variable rate mortgage loans; see Note 3.
Secured Real Estate Term Loan
On March 28, 2013, we repaid in full the $125.5 million secured real estate term loan. In connection with that repayment, we terminated the secured real estate term loan (and the commitments thereunder) and the related security documents and guarantees. In addition, we terminated the $75.0 million interest rate swap associated with the secured real estate term loan.
HEALTHCARE TRUST OF AMERICA, INC. AND HEALTHCARE TRUST OF AMERICA HOLDINGS, LP
NOTES TO CONSOLIDATED FINANCIAL STATEMENTS – (Continued)
Future Debt Maturities
As of December 31, 2013, the principal payments due on our debt for each of the next five years and thereafter, is as follows (in thousands): |
| | | | |
| Year | | Amount |
| 2014 | | $ | 7,729 |
|
| 2015 | | 73,982 |
|
| 2016 | | 477,496 |
|
| 2017 | | 100,948 |
|
| 2018 | | 12,993 |
|
| Thereafter | | 540,528 |
|
| Total | | $ | 1,213,676 |
|
The above scheduled debt maturities do not include the available extension under the unsecured credit agreement as discussed above.
We are required by the terms of our applicable debt agreements to meet various affirmative and negative covenants that we believe are customary for these types of facilities, such as limitations on the incurrence of debt by us, and our subsidiaries that own unencumbered assets, limitations on the nature of HTALP’s business, and limitations on distributions by HTALP and its subsidiaries that own unencumbered assets. Our debt agreements also impose various financial covenants on us, such as a maximum ratio of total indebtedness to total asset value, a minimum ratio of EBITDA to fixed charges, a minimum tangible net worth covenant, a maximum ratio of unsecured indebtedness to unencumbered asset value, rent coverage ratios, and a minimum ratio of unencumbered net operating income to unsecured interest expense. As of December 31, 2013, we believe that we were in compliance with all such financial covenants and reporting requirements. In addition, certain of our debt agreements include events of default provisions that we believe are customary for these types of facilities, including restricting HTA from making dividend distributions to our stockholders in the event we are in default, except to the extent necessary for HTA to maintain its REIT status.
9. Derivative Financial Instruments
The following table lists the derivative financial instrument assets and (liabilities) held by us as of December 31, 2013 (in thousands):
|
| | | | | | | | | | | | | | | |
| Notional Amount |
| | Index | | Rate | | Fair Value | | Instrument | | Maturity |
| $ | 200,000 |
| | LIBOR | | 1.23 | % | | $ | (2,078 | ) | | Swap | | 3/29/2017 |
| 100,000 |
| | LIBOR | | 0.86 |
| | (729 | ) | | Swap | | 6/15/2016 |
| 50,000 |
| | LIBOR | | 1.39 |
| | 1,350 |
| | Swap | | 7/17/2019 |
| 105,000 |
| | LIBOR | | 1.24 |
| | 3,723 |
| | Swap | | 7/17/2019 |
| 27,618 |
| (a) | LIBOR | | 4.98 |
| | (2,246 | ) | | Swap | | 5/1/2020 |
The following table lists the derivative financial instrument assets and (liabilities) held by us as of December 31, 2012 (in thousands):
|
| | | | | | | | | | | | | | | |
| Notional Amount | | Index | | Rate | | Fair Value | | Instrument | | Maturity |
| $ | 17,304 |
| (b) | LIBOR | | 3.79 | % | | $ | (459 | ) | | Swap | | 9/28/2013 |
| 75,000 |
| (b) | LIBOR | | 1.07 |
| | (659 | ) | | Swap | | 12/31/2013 |
| 200,000 |
| | LIBOR | | 1.23 |
| | (5,180 | ) | | Swap | | 3/29/2017 |
| 100,000 |
| | LIBOR | | 0.86 |
| | (1,310 | ) | | Swap | | 6/15/2016 |
| 50,000 |
| | LIBOR | | 1.39 |
| | (909 | ) | | Swap | | 7/17/2019 |
| 105,000 |
| | LIBOR | | 1.24 |
| | (853 | ) | | Swap | | 7/17/2019 |
(a) We assumed the interest rate swap in December 2013 as part of an acquisition, see Note 3.
(b) We terminated the interest rate swaps in March 2013.
HEALTHCARE TRUST OF AMERICA, INC. AND HEALTHCARE TRUST OF AMERICA HOLDINGS, LP
NOTES TO CONSOLIDATED FINANCIAL STATEMENTS – (Continued)
As of December 31, 2013 and 2012, the gross fair value of our derivative financial instruments was as follows (in thousands):
|
| | | | | | | | | | | | | | | | | | | | | | |
| | | Asset Derivatives | | Liability Derivatives |
| | December 31, 2013 | | December 31, 2012 | | December 31, 2013 | | December 31, 2012 |
| Derivatives Not Designated as Hedging Instruments: | | Balance Sheet Location | | Fair Value | | Balance Sheet Location | | Fair Value | | Balance Sheet Location | | Fair Value | | Balance Sheet Location | | Fair Value |
| Interest rate swaps | | Receivables and other assets | | $ | 5,073 |
| | n/a | | n/a | | Derivative
financial
instruments | | $ | 5,053 |
| | Derivative
financial
instruments | | $ | 9,370 |
|
There were no derivatives offset in our accompanying consolidated balance sheets as of December 31, 2013 and 2012. As of December 31, 2013 and 2012, we had derivatives subject to enforceable master netting arrangements which allow for net cash settlement with the respective counterparties (in thousands):
|
| | | | | | | | | | | | | | | | | | | | | | | |
| | December 31, 2013 | | December 31, 2012 |
| | Gross Amounts | | Amounts Subject to Enforceable Master Netting Arrangements | | Net Amounts | | Gross Amounts | | Amounts Subject to Enforceable Master Netting Arrangements | | Net Amounts |
| Asset derivatives | $ | 5,073 |
| | $ | (2,078 | ) | | $ | 2,995 |
| | $ | — |
| | $ | — |
| | $ | — |
|
| Liability derivatives | 5,053 |
| | (2,078 | ) | | 2,975 |
| | 9,370 |
| | — |
| | 9,370 |
|
For the years ended December 31, 2013, 2012 and 2011, the derivative financial instruments had the following effect on our accompanying consolidated statements of operations (in thousands):
|
| | | | | | | | | | | | | | |
| Derivatives Not Designated as Hedging Instruments: | | Location of Gain (Loss) Recognized | | Year Ended December 31, |
| | 2013 | | 2012 | | 2011 |
| Interest rate swaps | | Net gain (loss) on change in the fair value of derivative financial instruments | | $ | 10,796 |
| | $ | (7,578 | ) | | $ | (562 | ) |
| Interest rate cap | | Net gain (loss) on change in the fair value of derivative financial instruments | | — |
| | (89 | ) | | (294 | ) |
We have agreements with each of our interest rate swap derivative counterparties that contain a provision whereby if we default on certain of our unsecured indebtedness, then our counterparties could declare us in default on our interest rate swap derivative obligations resulting in an acceleration of the indebtedness. In addition, we are exposed to credit risk in the event of non-performance by our derivative counterparties. We believe we mitigate the credit risk by entering into agreements with credit-worthy counterparties. We record counterparty credit risk valuation adjustments on interest rate swap derivative assets in order to properly reflect the credit quality of the counterparty. In addition, our fair value of interest rate swap derivative liabilities is adjusted to reflect the impact of our credit quality. As of December 31, 2013, there have been no termination events or events of default related to our interest rate swaps, except for our voluntary terminations as discussed above.
10. Commitments and Contingencies
Litigation
We are not presently subject to any material litigation nor, to our knowledge, is any material litigation threatened against us, which if determined unfavorably to us, would have a material effect on our consolidated financial position, results of operations or cash flows.
Environmental Matters
We follow the policy of monitoring our properties for the presence of hazardous or toxic substances. While there can be no assurance that a material environmental liability does not exist at our properties, we are not currently aware of any environmental liability with respect to our properties that would have a material effect on our consolidated financial position, results of operations or cash flows. Further, we are not aware of any material environmental liability or any unasserted claim or assessment with respect to an environmental liability at our properties that we believe would require additional disclosure or the recording of a loss contingency.
HEALTHCARE TRUST OF AMERICA, INC. AND HEALTHCARE TRUST OF AMERICA HOLDINGS, LP
NOTES TO CONSOLIDATED FINANCIAL STATEMENTS – (Continued)
Rental Expense
We have ground leases and other operating leases with landlords that generally require fixed annual rental payments and may also include escalation clauses and renewal options. These leases have terms up to 99 years, excluding extension options. Future minimum lease obligations under non-cancelable ground leases and other operating leases as of December 31, 2013 for each of the next five years and thereafter is as follows (in thousands): |
| | | | |
| Year | | Amount |
| 2014 | | $ | 4,230 |
|
| 2015 | | 4,218 |
|
| 2016 | | 4,207 |
|
| 2017 | | 4,323 |
|
| 2018 | | 4,357 |
|
| Thereafter | | 272,992 |
|
| Total | | $ | 294,327 |
|
During the years ended December 31, 2013, 2012 and 2011, rental expense was $4.3 million, $4.2 million and $3.6 million, respectively. The amount of contingent rent and sublease rent was not significant.
Other
Our other commitments and contingencies include the usual obligations of real estate owners and operators in the normal course of business. In our opinion, these matters are not expected to have a material effect on our consolidated financial position, results of operations or cash flows.
11. Stockholders’ Equity and Partners’ Capital
HTALP’s partnership agreement provides that it will distribute cash flows from operations and net sale proceeds to its partners in accordance with their overall ownership interests at such times and in such amounts as the general partner determines. Except for certain LTIP units that have not vested, dividend distributions are made such that a holder of one unit will receive annual distributions from HTALP in an amount equal to the annual dividend distributions paid to the holder of one of HTA’s shares of common stock. In addition, for each share of common stock issued or redeemed by HTA, HTALP issues or redeems a corresponding number of units.
Common Stock Offerings
On January 7, 2013, HTA commenced an equity at-the-market, or ATM, offering of its Class A common stock with an aggregate sales price of up to $250.0 million. On November 1, 2013, HTA terminated this ATM offering and commenced a new ATM offering of its Class A common stock with an aggregate sales price of up to $300.0 million. During the year ended December 31, 2013, HTA issued and sold 21,873,013 shares of its Class A common stock, at an average price of $11.22 per share.
Stock Repurchase Plan
In August 2012, HTA’s Board of Directors authorized a stock repurchase program of $100.0 million. During the years ended December 31, 2013 and 2012, HTA did not repurchase any shares of its Class A common stock. As of December 31, 2013, $100.0 million of repurchase capacity remained available under the program.
Common Stock Dividends
See consolidated statements of equity for the dividends declared during 2013, 2012 and 2011. On February 17, 2014, HTA declared a quarterly cash dividend of $0.14375 per share to be paid on April 3, 2014 to stockholders of record on March 27, 2014.
HEALTHCARE TRUST OF AMERICA, INC. AND HEALTHCARE TRUST OF AMERICA HOLDINGS, LP
NOTES TO CONSOLIDATED FINANCIAL STATEMENTS – (Continued)
Incentive Plan
HTA’s Amended and Restated 2006 Plan, or the Plan, permits the grant of incentive awards to our employees, officers, non-employee directors, and consultants as selected by our Board of Directors or the Compensation Committee. The Plan authorizes the granting of awards in any of the following forms: options; stock appreciation rights; restricted stock; restricted or deferred stock units; performance awards; dividend equivalents; other stock-based awards, including units in HTALP; and cash-based awards. Subject to adjustment as provided in the Plan, the aggregate number of awards reserved and available for issuance under the Plan is 10,000,000. As of December 31, 2013, there were 5,101,800 awards available for grant under the Plan.
LTIP Units
Awards under the LTIP consist of Series C units in HTALP, and are subject to the achievement of certain performance and market conditions in order to vest. The contractual term of the awards is four years. Once vested, the Series C units are converted into common units of HTALP, which may be converted into shares of HTA’s Class A common stock. LTIP units were only granted in 2012 and as of December 31, 2012 all units were unvested. The fair value for the LTIP units for which the restrictions lapsed during 2013 was $13.2 million. With the assistance of our independent valuation specialists, we utilized a Monte Carlo simulation to calculate the 2012 weighted average grant date fair value of $6.25 per unit using the following assumptions:
|
| | |
| Volatility | 21.25% - 22.64% |
|
| Dividend yield | 5.80 | % |
| Expected term in years | 0.61 - 0.82 |
|
| Risk-free rate | 0.436% - 0.576% |
|
| Stock price (per share) | $9.92 - $9.97 |
|
For the years ended December 31, 2013, 2012 and 2011, we recognized compensation expense related to LTIP awards of $3.2 million, $10.4 million and $0.0 million, respectively, which was recorded in listing expenses. As of December 31, 2013, there was approximately $4.5 million of unrecognized expense associated with 450,000 units that will only vest as a result of a change in control. We will not recognize any expense associated with these units until such event occurs or is probable.
The following is a summary of the activity in our LTIP units during 2013: |
| | | | | | |
| | LTIP Units | | Weighted Average Grant Date Fair Value |
| Balance as of December 31, 2012 | 2,900,000 |
| | $ | 6.25 |
|
| Granted | — |
| | — |
|
| Vested | (2,380,700 | ) | | 5.56 |
|
| Forfeited | (2,800 | ) | | 5.70 |
|
| Balance as of December 31, 2013 | 516,500 |
| | $ | 9.43 |
|
Restricted Common Stock and Units
The weighted average fair value of restricted common stock and units granted during the years ended December 31, 2013, 2012 and 2011 was $10.49, $9.98 and $10.00, respectively. The fair value of restricted common stock and restricted common stock units for which the restriction lapsed during the years ended December 31, 2013, 2012 and 2011 was $1.4 million, $8.7 million and $1.6 million, respectively.
We recognized compensation expense, equal to the fair market value of HTA’s stock on the grant date, over the service period which is generally three to four years. For the year ended December 31, 2013, we recognized compensation expense of $2.5 million, of which $1.9 million was recorded in general and administrative expenses and $0.6 million was recorded in listing expenses. For the year ended December 31, 2012, we recognized compensation expense of $7.0 million, of which $0.8 million was recorded in general and administrative expenses, $4.7 million in listing expenses, and $1.5 million in non-traded REIT expenses. For the year ended December 31, 2011, we recognized compensation expense of $3.2 million, which was recorded in non-traded REIT expense. The expense associated with equity awards to executives and Directors prior to the listing were recorded in non-traded REIT expense as those awards were applicable to past service relative to our non-traded REIT status. The expense associated with equity awards accelerated or granted upon the listing was recorded in listing expense.
HEALTHCARE TRUST OF AMERICA, INC. AND HEALTHCARE TRUST OF AMERICA HOLDINGS, LP
NOTES TO CONSOLIDATED FINANCIAL STATEMENTS – (Continued)
As of December 31, 2013, there was approximately $3.7 million of unrecognized compensation expense net of estimated forfeitures, which will be recognized over a remaining weighted average period of 2.1 years.
The following is a summary of the activity in our restricted common stock during 2013:
|
| | | | | | |
| | Restricted Common Stock | | Weighted Average Grant Date Fair Value |
| Balance as of December 31, 2012 | 376,500 |
| | $ | 9.98 |
|
| Granted | 475,500 |
| | 10.49 |
|
| Vested | (142,500 | ) | | 10.01 |
|
| Forfeited | (68,500 | ) | | 10.06 |
|
| Balance as of December 31, 2013 | 641,000 |
| | $ | 10.34 |
|
12. Fair Value of Financial Instruments
Financial Instruments Reported at Fair ValueRental Expense
CashWe have ground leases and Cash Equivalents
We invest in money market funds which are classified within Level 1 of the fair value hierarchy because they are valued using unadjusted quoted market prices in active markets for identical securities.
Derivative Financial Instruments
Currently, we use interest rate swaps and interest rate caps to manage interest rate risk associatedother operating leases with floating rate debt. The valuation of these instruments is determined using widely accepted valuation techniques including discounted cash flow analysis on the expected cash flows of each derivative. This analysis reflects the contractual terms of the derivatives, including the period to maturity, and uses observable market-based inputs, including interest rate curves, foreign exchange rates, and implied volatilities. The fair values of interest rate swaps and interest rate caps are determined using the market standard methodology of netting the discounted futurelandlords that generally require fixed cashannual rental payments and the discounted expected variable cash receipts. The variable cash receipts are based on an expectation of future interest rates (forward curves) derived from observable market interest rate curves.
To comply with the provisions of ASC 820, we incorporate credit valuation adjustmentsmay also include escalation clauses and renewal options. These leases have terms up to appropriately reflect both our own nonperformance risk99 years, excluding extension options. Future minimum lease obligations under non-cancelable ground leases and the respective counterparty’s nonperformance risk in the fair value measurements. In adjusting the fair value of our derivative contracts for the effect of nonperformance risk, we have considered the impact of netting and any applicable credit enhancements, suchother operating leases as collateral postings, thresholds, mutual puts, and guarantees.
Although we have determined that the majority of the inputs used to value our interest rate swap and interest rate cap derivatives fall within Level 2 of the fair value hierarchy, the credit valuation adjustments associated with these instruments utilize Level 3 inputs, such as estimates of current credit spreads to evaluate the likelihood of default by us and our counterparties. However, as of December 31, 2011, we have assessed the significance of the impact of the credit valuation adjustments on the overall valuation of our interest rate swap and interest rate cap derivative positions and have determined that the credit valuation adjustments are not significant to their overall valuation. As a result, we have determined that our interest rate swap and interest rate cap derivative valuations in their entirety are classified in Level 2 of the fair value hierarchy.
Healthcare Trust of America, Inc.
NOTES TO CONSOLIDATED FINANCIAL STATEMENTS — (Continued)
Earnout Liability
As of December 31, 2011, we owned one property, purchased during the third quarter of 2010, that is subject to an earnout provision obligating us to pay additional consideration to the seller contingent on the future leasing and occupancy of vacant space at the property. This earnout payment is based on a predetermined formula and has a set 24-month time period regarding the obligation to make these payments. If, at the end of this time period, certain space has not been leased and occupied, we will have no further obligation. Its fair value is based upon the expected probability of lease-up and subsequent payment of the earnout through the expiration of the earnout period, which ends in August 2012.
As such, valuation of this liability required utilization of Level 3 inputs, including management estimates of the timing and likelihood of lease-up, as there is no public market for this item and thus Level 1 and Level 2 inputs are unavailable for an item of this nature. As a result, we have determined that the valuation of the earnout is classified within Level 3 of the fair value hierarchy. During the year ended December 31, 2011, there have been no purchases, sales, issuances, or settlements with respect to this earnout liability.
As of December 31, 2011, there have been no transfers of assets or liabilities between levels.
Assets and Liabilities at Fair Value
The table below presents our assets and liabilities measured at fair value on a recurring basis as of December 31, 2011, aggregated by the level in the fair value hierarchy within which those measurements fall:
|
| | | | | | | | | | | | | | | |
| | Quoted Prices in Active Markets for Identical Assets and Liabilities (Level 1 ) | | Significant Other Observable Inputs (Level 2) | | Significant Unobservable Inputs (Level 3) | | Total |
| Assets | |
| | |
| | |
| | |
|
| Derivative financial instruments | $ | — |
| | $ | 89,000 |
| | $ | — |
| | $ | 89,000 |
|
| Total assets at fair value | $ | — |
| | $ | 89,000 |
| | $ | — |
| | $ | 89,000 |
|
| Liabilities | |
| | |
| | |
| | |
|
| Derivative financial instruments | $ | — |
| | $ | (1,792,000 | ) | | $ | — |
| | $ | (1,792,000 | ) |
| Earnout liability | $ | — |
| | $ | — |
| | $ | (2,481,000 | ) | | $ | (2,481,000 | ) |
| Total liabilities at fair value | $ | — |
| | $ | (1,792,000 | ) | | $ | (2,481,000 | ) | | $ | (4,273,000 | ) |
The table below presents our assets and liabilities measured at fair value on a recurring basis as of December 31, 2010, aggregated by the level in the fair value hierarchy within which those measurements fall:
|
| | | | | | | | | | | | | | | |
| | Quoted Prices in Active Markets for Identical Assets and Liabilities (Level 1 ) | | Significant Other Observable Inputs (Level 2) | | Significant Unobservable Inputs (Level 3) | | Total |
| Assets | |
| | |
| | |
| | |
|
| Money market funds | $ | 43,000 |
| | $ | — |
| | $ | — |
| | $ | 43,000 |
|
| Derivative financial instruments(a) | — |
| | 680,000 |
| | — |
|
| 680,000 |
|
| Total assets at fair value | $ | 43,000 |
| | $ | 680,000 |
| | $ | — |
|
| $ | 723,000 |
|
| Liabilities | |
| | |
| | |
| | |
|
| Derivative financial instruments | $ | — |
| | $ | (1,527,000 | ) | | $ | — |
| | $ | (1,527,000 | ) |
| Earnout liability | $ | — |
| | $ | — |
| | $ | (2,481,000 | ) | | $ | (2,481,000 | ) |
| Total liabilities at fair value | $ | — |
| | $ | (1,527,000 | ) | | $ | (2,481,000 | ) | | $ | (4,008,000 | ) |
Financial Instruments Disclosed at Fair Value
ASC 825 requires disclosure of the fair value of financial instruments, whether or not recognized on the face of the balance sheet. Fair value is defined under ASC 820.
Our accompanying consolidated balance sheets include the following financial instruments: real estate notes receivable, net, cash and cash equivalents, restricted cash, accounts and other receivables, net, accounts payable and accrued liabilities, accounts payable due to affiliates, net, mortgage loans payable, net, and borrowings under the credit facility.
Healthcare Trust of America, Inc.
NOTES TO CONSOLIDATED FINANCIAL STATEMENTS — (Continued)
We consider the carrying values of cash and cash equivalents, restricted cash, accounts and other receivables, net, and accounts payable and accrued liabilities to approximate fair value for these financial instruments because of the short period of time between origination of the instruments and their expected realization.
The fair value of the mortgage loan payable is estimated using borrowing rates available to us for mortgage loans payable with similar terms and maturities. As of December 31, 2011, the fair value of the mortgage loans payable was $687,862,000 compared to the carrying value of $639,149,000. As of December 31, 2010, the fair value of the mortgage loans payable was $727,370,000, compared to the carrying value of $699,526,000.
The fair value of the notes receivable is estimated by discounting the expected cash flows on the notes at current rates at which management believes similar loans would be made. As of December 31, 2011, the fair value of these notes was approximately $64,046,000 compared to the carrying value of $57,459,000. As of December 31, 2010, the fair value of these notes was approximately $67,540,000 compared to the carrying value of $57,091,000.
16. Tax Treatment of Distributions
The income tax treatment for stockholder distributions reportable for the years ended December 31, 2011, 2010, and 2009 was as follows:
|
| | | | | | | | | | | | | | | | | | | | | |
| | | Years Ended December 31, |
| | | 2011 | | 2010 | | 2009 |
| Ordinary income | | $ | 65,712,000 |
| | 40.9 | % | | $ | 47,041,000 |
| | 40.3 | % | | $ | 2,836,000 |
| | 3.6 | % |
| Return of capital | | 94,952,000 |
| | 59.1 |
| | 69,686,000 |
| | 59.7 |
| | 75,223,000 |
| | 96.4 |
|
| | | $ | 160,664,000 |
| | 100.0 | % | | $ | 116,727,000 |
| | 100.0 | % | | $ | 78,059,000 |
| | 100.0 | % |
17. Future Minimum Rent
Rental Income
We have operating leases with tenants that expire at various dates through 2037 and in some cases subject to scheduled fixed increases or adjustments based on the consumer price index. Generally, the leases grant tenants renewal options. Leases also provide for additional rents based on certain operating expenses. Future minimum rent contractually due under operating leases, excluding tenant reimbursements of certain costs, as of December 31, 20112013 for each of the next five years ending December 31 and thereafter is as follows:follows (in thousands):
| | | Year | Amount | | Amount |
| 2012 | $ | 211,029,000 |
| |
| 2013 | 195,055,000 |
| |
| 2014 | 178,568,000 |
| | $ | 4,230 |
|
| 2015 | 161,815,000 |
| | 4,218 |
|
| 2016 | 145,674,000 |
| | 4,207 |
|
| 2017 | | | 4,323 |
|
| 2018 | | | 4,357 |
|
| Thereafter | 672,733,000 |
| | 272,992 |
|
| Total | $ | 1,564,874,000 |
| | $ | 294,327 |
|
A certain amount of our rental income is from tenants with leases which are subject to contingent rent provisions. These contingent rents are subject to the tenant achieving periodic revenues in excess of specified levels. ForDuring the years ended December 31, 2013, 2012 and 2011, rental expense was $4.3 million, 2010$4.2 million and 2009$3.6 million, therespectively. The amount of contingent rent earned by usand sublease rent was not significant.
Other
Our other commitments and contingencies include the usual obligations of real estate owners and operators in the normal course of business. In our opinion, these matters are not expected to have a material effect on our consolidated financial position, results of operations or cash flows.
11. Stockholders’ Equity and Partners’ Capital
HTALP’s partnership agreement provides that it will distribute cash flows from operations and net sale proceeds to its partners in accordance with their overall ownership interests at such times and in such amounts as the general partner determines. Except for certain LTIP units that have not vested, dividend distributions are made such that a holder of one unit will receive annual distributions from HTALP in an amount equal to the annual dividend distributions paid to the holder of one of HTA’s shares of common stock. In addition, for each share of common stock issued or redeemed by HTA, HTALP issues or redeems a corresponding number of units.
Common Stock Offerings
On January 7, 2013, HTA commenced an equity at-the-market, or ATM, offering of its Class A common stock with an aggregate sales price of up to $250.0 million. On November 1, 2013, HTA terminated this ATM offering and commenced a new ATM offering of its Class A common stock with an aggregate sales price of up to $300.0 million. During the year ended December 31, 2013, HTA issued and sold 21,873,013 shares of its Class A common stock, at an average price of $11.22 per share.
Stock Repurchase Plan
In August 2012, HTA’s Board of Directors authorized a stock repurchase program of $100.0 million. During the years ended December 31, 2013 and 2012, HTA did not repurchase any shares of its Class A common stock. As of December 31, 2013, $100.0 million of repurchase capacity remained available under the program.
Common Stock Dividends
See consolidated statements of equity for the dividends declared during 2013, 2012 and 2011. On February 17, 2014, HTA declared a quarterly cash dividend of $0.14375 per share to be paid on April 3, 2014 to stockholders of record on March 27, 2014.
HEALTHCARE TRUST OF AMERICA, INC. AND HEALTHCARE TRUST OF AMERICA HOLDINGS, LP
NOTES TO CONSOLIDATED FINANCIAL STATEMENTS —– (Continued)
Incentive Plan
HTA’s Amended and Restated 2006 Plan, or the Plan, permits the grant of incentive awards to our employees, officers, non-employee directors, and consultants as selected by our Board of Directors or the Compensation Committee. The Plan authorizes the granting of awards in any of the following forms: options; stock appreciation rights; restricted stock; restricted or deferred stock units; performance awards; dividend equivalents; other stock-based awards, including units in HTALP; and cash-based awards. Subject to adjustment as provided in the Plan, the aggregate number of awards reserved and available for issuance under the Plan is 10,000,000. As of December 31, 2013, there were 5,101,800 awards available for grant under the Plan.
LTIP Units
Awards under the LTIP consist of Series C units in HTALP, and are subject to the achievement of certain performance and market conditions in order to vest. The contractual term of the awards is four years. Once vested, the Series C units are converted into common units of HTALP, which may be converted into shares of HTA’s Class A common stock. LTIP units were only granted in 2012 and as of December 31, 2012 all units were unvested. The fair value for the LTIP units for which the restrictions lapsed during 2013 was $13.2 million. With the assistance of our independent valuation specialists, we utilized a Monte Carlo simulation to calculate the 2012 weighted average grant date fair value of $6.25 per unit using the following assumptions:
|
| | |
| Volatility | 21.25% - 22.64% |
|
| Dividend yield | 5.80 | % |
| Expected term in years | 0.61 - 0.82 |
|
| Risk-free rate | 0.436% - 0.576% |
|
| Stock price (per share) | $9.92 - $9.97 |
|
For the years ended December 31, 2013, 2012 and 2011, we recognized compensation expense related to LTIP awards of $3.2 million, $10.4 million and $0.0 million, respectively, which was recorded in listing expenses. As of December 31, 2013, there was approximately $4.5 million of unrecognized expense associated with 450,000 units that will only vest as a result of a change in control. We will not recognize any expense associated with these units until such event occurs or is probable.
The following is a summary of the activity in our LTIP units during 2013: |
| | | | | | |
| | LTIP Units | | Weighted Average Grant Date Fair Value |
| Balance as of December 31, 2012 | 2,900,000 |
| | $ | 6.25 |
|
| Granted | — |
| | — |
|
| Vested | (2,380,700 | ) | | 5.56 |
|
| Forfeited | (2,800 | ) | | 5.70 |
|
| Balance as of December 31, 2013 | 516,500 |
| | $ | 9.43 |
|
Restricted Common Stock and Units
The weighted average fair value of restricted common stock and units granted during the years ended December 31, 2013, 2012 and 2011 was $10.49, $9.98 and $10.00, respectively. The fair value of restricted common stock and restricted common stock units for which the restriction lapsed during the years ended December 31, 2013, 2012 and 2011 was $1.4 million, $8.7 million and $1.6 million, respectively.
We recognized compensation expense, equal to the fair market value of HTA’s stock on the grant date, over the service period which is generally three to four years. For the year ended December 31, 2013, we recognized compensation expense of $2.5 million, of which $1.9 million was recorded in general and administrative expenses and $0.6 million was recorded in listing expenses. For the year ended December 31, 2012, we recognized compensation expense of $7.0 million, of which $0.8 million was recorded in general and administrative expenses, $4.7 million in listing expenses, and $1.5 million in non-traded REIT expenses. For the year ended December 31, 2011, we recognized compensation expense of $3.2 million, which was recorded in non-traded REIT expense. The expense associated with equity awards to executives and Directors prior to the listing were recorded in non-traded REIT expense as those awards were applicable to past service relative to our non-traded REIT status. The expense associated with equity awards accelerated or granted upon the listing was recorded in listing expense.
HEALTHCARE TRUST OF AMERICA, INC. AND HEALTHCARE TRUST OF AMERICA HOLDINGS, LP
NOTES TO CONSOLIDATED FINANCIAL STATEMENTS – (Continued)
As of December 31, 2013, there was approximately $3.7 million of unrecognized compensation expense net of estimated forfeitures, which will be recognized over a remaining weighted average period of 2.1 years.
The following is a summary of the activity in our restricted common stock during 2013:
|
| | | | | | |
| | Restricted Common Stock | | Weighted Average Grant Date Fair Value |
| Balance as of December 31, 2012 | 376,500 |
| | $ | 9.98 |
|
| Granted | 475,500 |
| | 10.49 |
|
| Vested | (142,500 | ) | | 10.01 |
|
| Forfeited | (68,500 | ) | | 10.06 |
|
| Balance as of December 31, 2013 | 641,000 |
| | $ | 10.34 |
|
12. Fair Value of Financial Instruments
Rental Expense
We have ground leases and other operating leases with landlords that generally require fixed annual rental payments and may also include escalation clauses and renewal options. These leases have terms up to 99 years, excluding extension options. Operating lease obligations include our corporate office location in Scottsdale, Arizona and our regional office location in Charleston, South Carolina. Future minimum lease obligations under non-cancelable ground leases and other operating leases as of December 31, 2011 are2013 for each of the next five years and thereafter is as follows:
| | | Year | Amount | | Amount |
| 2012 | $ | 3,062,000 |
| |
| 2013 | 3,111,000 |
| |
| 2014 | 3,100,000 |
| | $ | 4,230 |
|
| 2015 | 2,745,000 |
| | 4,218 |
|
| 2016 | 2,677,000 |
| | 4,207 |
|
| 2017 | | | 4,323 |
|
| 2018 | | | 4,357 |
|
| Thereafter | 210,603,000 |
| | 272,992 |
|
| Total | $ | 225,298,000 |
| | $ | 294,327 |
|
During the years ended December 31, 2013, 2012 and 2011, rental expense was $4.3 million, $4.2 million and $3.6 million, respectively. The amount of contingent rent and sublease rent was not significant.
Other
Our other commitments and contingencies include the usual obligations of real estate owners and operators in the normal course of business. In our opinion, these matters are not expected to have a material effect on our consolidated financial position, results of operations or cash flows.
18. Business Combinations11. Stockholders’ Equity and Partners’ Capital
HTALP’s partnership agreement provides that it will distribute cash flows from operations and net sale proceeds to its partners in accordance with their overall ownership interests at such times and in such amounts as the general partner determines. Except for certain LTIP units that have not vested, dividend distributions are made such that a holder of one unit will receive annual distributions from HTALP in an amount equal to the annual dividend distributions paid to the holder of one of HTA’s shares of common stock. In addition, for each share of common stock issued or redeemed by HTA, HTALP issues or redeems a corresponding number of units.
Common Stock Offerings
ForOn January 7, 2013, HTA commenced an equity at-the-market, or ATM, offering of its Class A common stock with an aggregate sales price of up to $250.0 million. On November 1, 2013, HTA terminated this ATM offering and commenced a new ATM offering of its Class A common stock with an aggregate sales price of up to $300.0 million. During the year ended December 31, 20112013, we completedHTA issued and sold 21,873,013 shares of its Class A common stock, at an average price of $11.22 per share.
Stock Repurchase Plan
In August 2012, HTA’s Board of Directors authorized a stock repurchase program of $100.0 million. During the acquisition of two new property portfolios as well as purchased additional medical office buildings within two of our existing portfolios. The aggregate purchase price for these acquisitions was $68,314,000 plus closing costs of $851,000. See Note 3, Real Estate Investments, for a listing of the properties acquired and the dates of acquisition. Results of operations for the property acquisitions are reflected in our consolidated statements of operations for the year years ended December 31, 20112013 and 2012 for the periods subsequent to the acquisition dates.
, HTA did not repurchase any shares of its Class A common stock. As of December 31, 2011,2013, $100.0 million of repurchase capacity remained available under the program.
Common Stock Dividends
See consolidated statements of equity for the dividends declared during 2013, 2012 and 2011. On February 17, 2014, HTA declared a quarterly cash dividend of $0.14375 per share to be paid on April 3, 2014 to stockholders of record on March 27, 2014.
HEALTHCARE TRUST OF AMERICA, INC. AND HEALTHCARE TRUST OF AMERICA HOLDINGS, LP
NOTES TO CONSOLIDATED FINANCIAL STATEMENTS – (Continued)
Incentive Plan
HTA’s Amended and Restated 2006 Plan, or the Plan, permits the grant of incentive awards to our employees, officers, non-employee directors, and consultants as selected by our Board of Directors or the Compensation Committee. The Plan authorizes the granting of awards in any of the following forms: options; stock appreciation rights; restricted stock; restricted or deferred stock units; performance awards; dividend equivalents; other stock-based awards, including units in HTALP; and cash-based awards. Subject to adjustment as provided in the Plan, the aggregate purchase price was allocatednumber of awards reserved and available for issuance under the Plan is 10,000,000. As of December 31, 2013, there were 5,101,800 awards available for grant under the Plan.
LTIP Units
Awards under the LTIP consist of Series C units in HTALP, and are subject to the amounts shownachievement of certain performance and market conditions in the table below. As the acquisitions that occurred in 2011 were determinedorder to be individually not significant but material collectively, the allocations for these acquisitions are presented in the aggregate, in accordance with the guidance prescribed by ASC 805.vest. The allocable portioncontractual term of the aggregate purchase price does not include $348,000awards is four years. Once vested, the Series C units are converted into common units of HTALP, which may be converted into shares of HTA’s Class A common stock. LTIP units were only granted in certain credits representative2012 and as of certain purchase price adjustments and liabilities assumed by us that servedDecember 31, 2012 all units were unvested. The fair value for the LTIP units for which the restrictions lapsed during 2013 was $13.2 million. With the assistance of our independent valuation specialists, we utilized a Monte Carlo simulation to reducecalculate the total cash tendered for these acquisitions.2012 weighted average grant date fair value of $6.25 per unit using the following assumptions:
|
| | | |
| 2011 Acquisitions | Total |
| Land | $ | 945,000 |
|
| Building as vacant | 49,631,000 |
|
| Site improvements | 1,784,000 |
|
| Unamortized tenant improvement costs | 2,657,000 |
|
| Leasehold interest in land, net | 603,000 |
|
| Above market debt | (76,000 | ) |
| Above market leases | 209,000 |
|
| Below market leases | (149,000 | ) |
| Unamortized lease origination costs | 1,235,000 |
|
| In place leases | 6,436,000 |
|
| Tenant relationships | 4,691,000 |
|
| Net assets acquired | $ | 67,966,000 |
|
|
| | |
| Volatility | 21.25% - 22.64% |
|
| Dividend yield | 5.80 | % |
| Expected term in years | 0.61 - 0.82 |
|
| Risk-free rate | 0.436% - 0.576% |
|
| Stock price (per share) | $9.92 - $9.97 |
|
For the yearyears ended December 31, 2013, 2012 and 2011, we recognized compensation expense related to LTIP awards of $3.2 million, $10.4 million and $0.0 million, respectively, which was recorded in listing expenses. As of December 31, 20102013, there was approximately $4.5 million of unrecognized expense associated with 450,000 units that will only vest as a result of a change in control. We will not recognize any expense associated with these units until such event occurs or is probable.
The following is a summary of the activity in our LTIP units during 2013: |
| | | | | | |
| | LTIP Units | | Weighted Average Grant Date Fair Value |
| Balance as of December 31, 2012 | 2,900,000 |
| | $ | 6.25 |
|
| Granted | — |
| | — |
|
| Vested | (2,380,700 | ) | | 5.56 |
|
| Forfeited | (2,800 | ) | | 5.70 |
|
| Balance as of December 31, 2013 | 516,500 |
| | $ | 9.43 |
|
Restricted Common Stock and Units
The weighted average fair value of restricted common stock and units granted during the years ended December 31, 2013, 2012 and 2011 was $10.49, $9.98 and $10.00, respectively. The fair value of restricted common stock and restricted common stock units for which the restriction lapsed during the years ended December 31, 2013, 2012 and 2011 was $1.4 million, $8.7 million and $1.6 million, respectively.
We recognized compensation expense, equal to the fair market value of HTA’s stock on the grant date, over the service period which is generally three to four years. For the year ended December 31, 2013, we completedrecognized compensation expense of $2.5 million, of which $1.9 million was recorded in general and administrative expenses and $0.6 million was recorded in listing expenses. For the acquisitionyear ended December 31, 2012, we recognized compensation expense of 24 property portfolios, as well as purchased additional medical office buildings within six$7.0 million, of our existing property portfolios. In addition, we purchased the remaining 20% interestwhich $0.8 million was recorded in the JV Company that owns Chesterfield Rehabilitation Center. The aggregate purchase price for these acquisitions was $806,048,000 plus closing costs of $6,253,000. The aggregate purchase price was allocatedgeneral and administrative expenses, $4.7 million in the amount of $44,050,000 to land, $608,708,000 to buildinglisting expenses, and improvements, $28,093,000 to tenant improvements, $22,291,000 to lease commissions, $39,713,000 to leases$1.5 million in place, $57,066,000 to tenant relationships, $2,004,000 to leasehold interest in land, $(272,000) to lease fee interest in land, $(5,005,000) to above market debt, $8,608,000 to above market leases, and $(4,112,000) to below market leases. Amounts presented in the allocations pertain to all acquisitions completed duringnon-traded REIT expenses. For the year ended December 31, 2010 except for2011, we recognized compensation expense of $3.2 million, which was recorded in non-traded REIT expense. The expense associated with equity awards to executives and Directors prior to the Chesterfield Rehabilitation Center noncontrolling interest purchase; this purchase oflisting were recorded in non-traded REIT expense as those awards were applicable to past service relative to our non-traded REIT status. The expense associated with equity awards accelerated or granted upon the listing was recorded in listing expense.
HEALTHCARE TRUST OF AMERICA, INC. AND HEALTHCARE TRUST OF AMERICA HOLDINGS, LP
NOTES TO CONSOLIDATED FINANCIAL STATEMENTS —– (Continued)
the remaining 20% interest in the joint venture entity that owns the Chesterfield Rehabilitation Center was accounted for as an equity transaction and thus not included within the aggregate purchase price allocation. Additionally, the allocable portion of the aggregate purchase price did not include $1,004,000 in certain credits representative of contingent purchase price adjustments and liabilities assumed by us that served to reduce the total cash tendered for these acquisitions.
In accordance with ASC 805, Business Combinations (“ASC 805”), we, with assistance from independent valuation specialists, allocate the purchase price of acquired properties to tangible and identified intangible assets and liabilities based on their respective fair values. The allocation to tangible assets (building and land) is based upon our determination of the value of the property as if it were to be replaced and vacant using discounted cash flow models similar to those used by independent appraisers. Factors considered by us include an estimate of carrying costs during the expected lease-up periods considering current market conditions and costs to execute similar leases. Additionally, the purchase price of the applicable property is allocated to the above or below market value of in place leases, the value of in place leases, tenant relationships, above or below market debt assumed, and any contingent consideration transferred in the combination.
As of December 31, 20112013, we owned one property, purchasedthere was approximately $3.7 million of unrecognized compensation expense net of estimated forfeitures, which will be recognized over a remaining weighted average period of 2.1 years.
The following is a summary of the activity in our restricted common stock during the third quarter2013:
|
| | | | | | |
| | Restricted Common Stock | | Weighted Average Grant Date Fair Value |
| Balance as of December 31, 2012 | 376,500 |
| | $ | 9.98 |
|
| Granted | 475,500 |
| | 10.49 |
|
| Vested | (142,500 | ) | | 10.01 |
|
| Forfeited | (68,500 | ) | | 10.06 |
|
| Balance as of December 31, 2013 | 641,000 |
| | $ | 10.34 |
|
12. Fair Value of 2010, that is subject to an earnout provision obligating us to pay additional consideration to the seller contingent on the future leasingFinancial Instruments
Financial Instruments Reported at Fair Value
The table below presents our assets and occupancy of vacant spaceliabilities measured at the property. This earnout payment is basedfair value on a predetermined formularecurring basis as of December 31, 2013, aggregated by the Level in the fair value hierarchy (in thousands):
|
| | | | | | | | | | | | | | | | |
| | | Quoted Prices in Active Markets for Identical Assets and Liabilities (Level 1 ) | | Significant Other Observable Inputs (Level 2) | | Significant Unobservable Inputs (Level 3) | | Total |
| Assets: | | | | | | | | |
| Derivative financial instruments | | $ | — |
| | $ | 5,073 |
| | $ | — |
| | $ | 5,073 |
|
| Total assets at fair value | | $ | — |
| | $ | 5,073 |
| | $ | — |
| | $ | 5,073 |
|
| Liabilities: | | | | | | | | |
| Derivative financial instruments | | $ | — |
| | $ | 5,053 |
| | $ | — |
| | $ | 5,053 |
|
| Total liabilities at fair value | | $ | — |
| | $ | 5,053 |
| | $ | — |
| | $ | 5,053 |
|
The table below presents our assets and hasliabilities measured at fair value on a set 24-month time period regardingrecurring basis as of December 31, 2012, aggregated by the obligation to make these payments. If,Level in the fair value hierarchy (in thousands):
|
| | | | | | | | | | | | | | | | |
| | | Quoted Prices in Active Markets for Identical Assets and Liabilities (Level 1 ) | | Significant Other Observable Inputs (Level 2) | | Significant Unobservable Inputs (Level 3) | | Total |
| Assets: | | | | | | | | |
| Derivative financial instruments | | $ | — |
|
| $ | — |
|
| $ | — |
| | $ | — |
|
| Total assets at fair value | | $ | — |
| | $ | — |
| | $ | — |
| | $ | — |
|
| Liabilities: | | | | | | | | |
| Derivative financial instruments | | $ | — |
| | $ | 9,370 |
| | $ | — |
| | $ | 9,370 |
|
| Total liabilities at fair value | | $ | — |
| | $ | 9,370 |
| | $ | — |
| | $ | 9,370 |
|
There have been no transfers of assets or liabilities between Levels. We will record any such transfers at the end of this timethe reporting period certain space has not been leased and occupied,in which a change of event occurs that results in a transfer. Although we will have no further obligation. The total liability balancedetermined that the majority of the inputs used to value our interest rate swap derivatives fall within Level 2 of the fair value hierarchy, the credit valuation adjustments associated with these instruments utilize Level 3 inputs, such as estimates of current credit spreads to evaluate the earnout at December 31, 2011, which is recorded within "Security deposits, prepaid rent,likelihood of default by us and other liabilities" in our consolidated balance sheet, was $2,481,000.
Brief descriptionscounterparties. However, we have assessed the significance of the property acquisitions completed in 2011 are as follows:
Medical office building located in Phoenix, Arizona, which was purchasedimpact of the credit valuation adjustments on February 11, 2011 for $3,762,000. This acquisition represented the final buildingoverall valuation of three in our existing Phoenix portfolio;interest rate swap derivative positions and have determined that the other two buildings comprising this portfolio were purchased during the fourth quarter of 2010.
Building located in North Adams, Massachusetts, which was purchased on February 16, 2011 for $9,182,000. This building was the final building within a portfolio of nine medical office buildings located in Albany and Carmel, New York, North Adams, Massachusetts, and Temple Terrace, Florida; the other eight buildings comprising the portfolio were purchased during the fourth quarter of 2010.
A two-building portfolio located in Bristol, Tennessee, which was purchased on March 24, 2011 for an aggregate price of $23,370,000. The first building was purchased for $5,925,000 and the second was purchased for $17,445,000. Both buildings within this portfolio are located near the campus of Wellmont Health System's Bristol Regional Medical Center.
A two-building portfolio located in Phoenix, Arizona, which was purchased on October 4, 2011 for $32,000,000. This portfolio consists of two Class A medical office buildings, comprising a total of approximately 118,000 rentable square feet (unaudited).
We recorded revenues and net losses for the year ended December 31, 2011 of approximately $4,903,000 and $(498,000), respectively, related to the above acquisitions. Net losses include $283,000 in closing cost expenses related to the acquisitions.
Supplementary Pro Forma Information
Assuming the 2011 property acquisitions discussed above had occurred on January 1, 2010, for the year ended December 31, 2011, pro forma revenues, net income attributable to controlling interest and net income per basic and diluted share would have been $273,512,000, $5,890,000 and $0.03, respectively. Supplemental pro forma earnings for the year ended December 31, 2011 were adjusted to exclude $283,000 of acquisition-related costs incurred during the year ended December 31, 2011.
Also, assuming the 2011 property acquisitions discussed above had occurred on January 1, 2010, for the year ended December 31, 2010, pro forma revenues, net income (loss) attributable to controlling interest and net income (loss) per basic and diluted share would have been $204,265,000, $(7,821,000) and $(0.05), respectively. Supplemental pro forma earnings for the year ended December 31, 2010 were adjusted to exclude $283,000 of acquisition-related costs incurred during the year ended December 31, 2011.
The pro forma resultscredit valuation adjustments are not necessarily indicativesignificant to their overall valuation. As a result, we have determined that our interest rate swap derivative valuations in their entirety are classified in Level 2 of the operating results that would have been obtained had the acquisitions occurred at the beginning of the periods presented, nor are they necessarily indicative of future operating results.
fair value hierarchy.
HEALTHCARE TRUST OF AMERICA, INC. AND HEALTHCARE TRUST OF AMERICA HOLDINGS, LP
NOTES TO CONSOLIDATED FINANCIAL STATEMENTS —– (Continued)
19. ConcentrationFinancial Instruments Disclosed at Fair Value
We consider the carrying values of Credit Risk
Financial instruments that potentially subject us to a concentration of credit risk are primarily cash and cash equivalents, accounts and other receivables (net), restricted cash and escrow deposits, and accounts receivable from tenants. On July 21, 2010, President Obama signed into law the sweepingpayable and accrued liabilities to approximate fair value for these financial regulatory reform act entitled the “Dodd-Frank Wall Street Reform and Consumer Protection Act”, which implements changes to the regulationinstruments because of the short period of time between origination of the instruments and their expected realization. All of these financial services industry, including provisions that made permanentinstruments are considered Level 2. The following table sets forth the $250,000 limit for federal deposit insurancecarrying value and increased the cash limit of Securities Investor Protection Corporation, or SIPC, protection from $100,000 to $250,000, and provided unlimited federal deposit insurance until January 1, 2013, for non-interest bearing demand transaction accounts at all insured depository institutions. As of December 31, 2011, we had bank cash balances of $3.1 million in excess of Federal Deposit Insurance Corporation, or FDIC, insured limits. Our concentration of credit risk with respect to accounts receivable from tenants is limited. We perform credit evaluations of prospective tenants, and security deposits are obtained upon lease execution. In addition, we evaluate tenants in connection with the acquisition of a property.
As of December 31, 2011, we had interests in 26 buildings located in Texas, which accounted for 15.0%fair value of our annualized rental income, interests in 44 buildings in Arizona, which accounted for 12.1% of our annualized rental income, interests in 22 buildings located in South Carolina, which accounted for 9.6% of our annualized rental income, interests in 20 buildings in Florida, which accounted for 8.7% of our annualized rental income,real estate notes receivable, tenant note receivable and interests in 44 buildings in Indiana, which accounted for 8.1% of our annualized rental income. This rental income is based on contractual base rent from leases in effect as of December 31, 2011. Accordingly, there is a geographic concentration of risk subject to fluctuations in each of these states’ economies.debt (net) (in thousands):
As of December 31, 2010, we had interests in 26 buildings located in Texas, which accounted for 15.3% of our total annualized rental income, interests in 36 consolidated properties in Arizona, which accounted for 11.7% of our total annualized rental income, interests in 22 consolidated properties located in South Carolina, which accounted for 9.7% of our total annualized rental income, interests in 20 consolidated properties in Florida, which accounted for 8.8% of our total annualized rental income, and interests in 44 consolidated properties in Indiana, which accounted for 8.5% of our total annualized rental income. This rental income is based on contractual base rent from leases in effect as of December 31, 2010. Accordingly, there is a geographic concentration of risk subject to fluctuations in each of these states’ economies.As of December 31, 2009, we had interests in 19 buildings located in Texas, which accounted for 16.9% of our total rental income, interests in 18 buildings located in South Carolina, which accounted for 13.0% of our total rental income, and interests in 33 buildings located in Arizona, which accounted for 12.2% of our total rental income. This rental income is based on contractual base rent from leases in effect as of December 31, 2009. Accordingly, there is a geographic concentration of risk subject to fluctuations in each state’s economy.
For the years ended December 31, 2011, 2010, and 2009, none of our tenants at our consolidated properties accounted for 10.0% or more of our aggregate annual rental income. |
| | | | | | | | | | | | | | | | | |
| | | | December 31, 2013 | | December 31, 2012 |
| | Fair Value Level | | Carrying Amount | | Fair Value | | Carrying Amount | | Fair Value |
| Real estate notes receivable | 2 | | $ | 28,520 |
| | $ | 28,520 |
| | $ | 20,000 |
| | $ | 20,000 |
|
| Tenant note receivable | 2 | | 3,173 |
| | 3,013 |
| | 3,287 |
| | 3,337 |
|
| Debt, net | 2 | | 1,214,241 |
| | 1,237,699 |
| | 1,037,359 |
| | 1,087,168 |
|
20.13. Per Share Data of HTA
We report earnings (loss) per share pursuant to ASC 260, Earnings Per Share, or ASC 260. We includeHTA includes unvested share-based payment awards that contain non-forfeitable rights to dividends or dividend equivalents as “participating securities” in the computation of basic and diluted income per share pursuant to the two-class method as described in ASC 260. We have two classes of common stock for purposes of calculating our earnings per share. Thesemethod. The resulting classes are our common stock and our restricted stock. For the years ended December 31, 2011, 2010,2013, 2012 and 2009,2011, all of ourHTA’s earnings were distributed and the calculated earnings (losses) per share amount would be the same for both classes as they all have the same rights to distributed earnings.classes.
Basic earnings (loss) per share attributable for all periods presented are computed by dividing net income (loss) by the weighted average number of shares of our common stock outstanding during the period. Diluted earnings (loss) per share are computed based on the weighted average number of shares of our common stock and all potentially dilutive securities, if any. For the year ended December 31, 2012, approximately 156,000 shares were excluded from the computation of diluted shares as their impact would have been anti-dilutive. The following is the reconciliation of the numerator and denominator used in basic and diluted earnings (losses) per share of HTA for the years ended December 31, 2013, 2012 and 2011 (in thousands, except per share data):
|
| | | | | | | | | | | |
| | Year Ended December 31, |
| | 2013 | | 2012 | | 2011 |
| Numerator: | | | | | |
| Income (loss) from continuing operations | $ | 23,577 |
| | $ | (24,936 | ) | | $ | 5,173 |
|
| Income from continuing operations attributable to noncontrolling interests | (423 | ) | | (56 | ) | | (52 | ) |
| Income (loss) from continuing operations attributable to common stockholders | 23,154 |
| | (24,992 | ) | | 5,121 |
|
| Income from discontinued operations | 1,107 |
| | 568 |
| | 420 |
|
| Net income (loss) attributable to common stockholders | $ | 24,261 |
| | $ | (24,424 | ) | | $ | 5,541 |
|
| Denominator: | | | | | |
| Weighted average number of shares outstanding - basic | 228,075 |
| | 222,713 |
| | 223,900 |
|
| Dilutive shares | 1,864 |
| | — |
| | 492 |
|
| Weighted average number of shares outstanding - diluted | 229,939 |
| | 222,713 |
| | 224,392 |
|
| Earnings (losses) per common share - basic: | | | | | |
| Income (loss) from continuing operations attributable to common stockholders | $ | 0.10 |
| | $ | (0.11 | ) | | $ | 0.02 |
|
| Discontinued operations | 0.00 |
| | 0.00 |
| | 0.00 |
|
| Net income (loss) attributable to common stockholders | $ | 0.10 |
| | $ | (0.11 | ) | | $ | 0.02 |
|
| Earnings (losses) per common share - diluted: | | | | | |
| Income (loss) from continuing operations attributable to common stockholders | $ | 0.10 |
| | $ | (0.11 | ) | | $ | 0.02 |
|
| Discontinued operations | 0.00 |
| | 0.00 |
| | 0.00 |
|
| Net income (loss) attributable to common stockholders | $ | 0.10 |
| | $ | (0.11 | ) | | $ | 0.02 |
|
HEALTHCARE TRUST OF AMERICA, INC. AND HEALTHCARE TRUST OF AMERICA HOLDINGS, LP
NOTES TO CONSOLIDATED FINANCIAL STATEMENTS – (Continued)
14. Per Unit Data of HTALP
The following is the reconciliation of the numerator and denominator used in basic and diluted earnings (losses) per unit of HTALP for the years ended December 31, 2013, 2012 and 2011 (in thousands, except per unit data):
|
| | | | | | | | | | | |
| | Year Ended December 31, |
| | 2013 | | 2012 | | 2011 |
| Numerator: | | | | | |
| Income (loss) from continuing operations | $ | 23,577 |
| | $ | (24,936 | ) | | $ | 5,173 |
|
| Income from continuing operations attributable to noncontrolling interests | (51 | ) | | (40 | ) | | (30 | ) |
| Income (loss) from continuing operations attributable to common unitholders | 23,526 |
| | (24,976 | ) | | 5,143 |
|
| Income from discontinued operations | 1,107 |
| | 568 |
| | 420 |
|
| Net income (loss) attributable to common unitholders | $ | 24,633 |
| | $ | (24,408 | ) | | $ | 5,563 |
|
| Denominator: | | | | | |
| Weighted average number of units outstanding - basic | 231,130 |
| | 224,681 |
| | 224,056 |
|
| Dilutive units | — |
| | — |
| | — |
|
| Weighted average number of units outstanding - diluted | 231,130 |
| | 224,681 |
| | 224,056 |
|
| Earnings (losses) per common unit - basic: | | | | | |
| Income (loss) from continuing operations attributable to common unitholders | $ | 0.10 |
| | $ | (0.11 | ) | | $ | 0.02 |
|
| Discontinued operations | 0.00 |
| | 0.00 |
| | 0.00 |
|
| Net income (loss) attributable to common unitholders | $ | 0.10 |
| | $ | (0.11 | ) | | $ | 0.02 |
|
| Earnings (losses) per common unit - diluted: | | | | | |
| Income (loss) from continuing operations attributable to common unitholders | $ | 0.10 |
| | $ | (0.11 | ) | | $ | 0.02 |
|
| Discontinued operations | 0.00 |
| | 0.00 |
| | 0.00 |
|
| Net income (loss) attributable to common unitholders | $ | 0.10 |
| | $ | (0.11 | ) | | $ | 0.02 |
|
HEALTHCARE TRUST OF AMERICA, INC. AND HEALTHCARE TRUST OF AMERICA HOLDINGS, LP
NOTES TO CONSOLIDATED FINANCIAL STATEMENTS – (Continued)
15. Supplemental Cash Flow Information
The following is the supplemental cash flow information for the years ended December 31, 2013, 2012 and 2011 (in thousands):
|
| | | | | | | | | | | |
| | Year Ended December 31, |
| | 2013 | | 2012 | | 2011 |
| Interest paid | $ | 41,460 |
| | $ | 38,560 |
| | $ | 38,288 |
|
| Income taxes paid | 669 |
| | 1,090 |
| | 1,045 |
|
| | | | | | |
| Supplemental Disclosure of Noncash Activities: | | | | | |
| Investing Activities: | | | | | |
| Accrued capital expenditures | $ | 1,783 |
| | $ | 1,575 |
| | $ | 5,448 |
|
| Note receivable included in the consideration for the acquisition of a building | — |
| | 37,264 |
| | — |
|
| The following represents the significant increase (decrease) in certain assets and liabilities in connection with our acquisition of operating properties: | | | | | |
| Debt and interest rate swaps | $ | 55,977 |
| | $ | — |
| | $ | 6,657 |
|
| Financing Activities: | | | | | |
| Issuances under the DRIP | $ | — |
| | $ | 31,916 |
| | $ | 75,864 |
|
| Dividend distributions declared, but not paid, including under the DRIP | 34,177 |
| | 30,959 |
| | 14,120 |
|
| Offering costs transferred to equity/partners’ capital | 1,323 |
| | — |
| | — |
|
HEALTHCARE TRUST OF AMERICA, INC. AND HEALTHCARE TRUST OF AMERICA HOLDINGS, LP
NOTES TO CONSOLIDATED FINANCIAL STATEMENTS – (Continued)
16. Tax Treatment of Dividends of HTA (Unaudited)
The following is the income tax treatment of dividend distributions for the years ended December 31, 2013, 2012 and 2011:
|
| | | | | | | | | |
| | | Year Ended December 31, |
| | | 2013 | | 2012 | | 2011 |
| Ordinary income | | 62.02 | % | | 46.93 | % | | 40.88 | % |
| Return of capital | | 37.83 |
| | 53.07 |
| | 59.12 |
|
| Capital gain | | 0.15 |
| | 0.00 |
| | 0.00 |
|
| Total | | 100 | % | | 100 | % | | 100 | % |
17. Future Minimum Rent
We have operating leases with tenants that expire at various dates through 2037 which generally include fixed increases or adjustments based on the consumer price index. Generally, the leases grant tenants renewal options. Leases also provide for additional rents based on certain operating expenses. Future minimum rent contractually due under operating leases, excluding tenant reimbursements of certain costs, as of December 31, 2013 for each of the next five years and thereafter is as follows (in thousands):
|
| | | | |
| Year | | Amount |
| 2014 | | $ | 266,075 |
|
| 2015 | | 250,484 |
|
| 2016 | | 232,728 |
|
| 2017 | | 208,175 |
|
| 2018 | | 177,280 |
|
| Thereafter | | 790,739 |
|
| Total | | $ | 1,925,481 |
|
A certain amount of our potentially dilutive securities did not have a material impactrental income is from tenants with leases which are subject to our earnings per share.contingent rent provisions. These contingent rents are subject to the tenant achieving periodic revenues in excess of specified levels. For the years ended December 31, 20102013, 2012 and 2009, we did2011, the amount of contingent rent earned by us was not have any securities that gave rise to potentially dilutive shares of our common stock.significant.
HEALTHCARE TRUST OF AMERICA, INC. AND HEALTHCARE TRUST OF AMERICA HOLDINGS, LP
NOTES TO CONSOLIDATED FINANCIAL STATEMENTS —– (Continued)
|
| | | | | | | | | | | |
| | Years Ended December 31, |
| | 2011 | | 2010 | | 2009 |
| Numerator: | | | | | |
| Net income (loss) | $ | 5,593,000 |
| | $ | (7,919,000 | ) | | $ | (24,773,000 | ) |
| (Income) loss attributable to noncontrolling interest of limited partners | (52,000 | ) | | 16,000 |
| | (304,000 | ) |
| Net income (loss) attributable to controlling interest | 5,541,000 |
| | (7,903,000 | ) | | (25,077,000 | ) |
| Denominator: | | | | | |
| Weighted average number of shares outstanding--basic | 223,900,167 |
| | 165,952,860 |
| | 112,819,638 |
|
| Dilutive restricted stock | 491,386 |
| | — |
| | — |
|
| Weighted average number of shares outstanding--diluted | 224,391,553 |
| | 165,952,860 |
| | 112,819,638 |
|
| Basic earnings per common share: | | | | | |
| Net income per share attributable to controlling interest | $ | 0.02 |
| | $ | (0.05 | ) | | $ | (0.22 | ) |
| Diluted earnings per common share: | | | | | |
| Net income per share attributable to controlling interest | $ | 0.02 |
| | $ | (0.05 | ) | | $ | (0.22 | ) |
21.18. Selected Quarterly Financial Data of HTA (Unaudited)
Set forth below is the unaudited selected quarterly financial data.data of HTA for 2013 and 2012. We believe that all necessary adjustments, consisting only of normal recurring adjustments, have been included (in thousands, except per share data). The sum of the individual quarterly amounts may not agree to the annual amounts included in the amounts stated belowconsolidated statements of operations due to present fairly, and in accordance with GAAP, the unaudited selected quarterly financial data when read in conjunction with our consolidated financial statements.rounding.
|
| | | | | | | | | | | | | | | |
| | Quarters Ended |
| | December 31, 2011 | | September 30, 2011 | | June 30, 2011 | | March 31, 2011 |
| Revenues | $ | 65,532,000 |
| | $ | 69,940,000 |
| | $ | 68,074,000 |
| | $ | 70,892,000 |
|
| Expenses | (53,801,000 | ) | | (58,807,000 | ) | | (55,541,000 | ) | | (58,978,000 | ) |
| Income before other income | 11,731,000 |
| | 11,133,000 |
| | 12,533,000 |
| | 11,914,000 |
|
| Other expense, net | (9,724,000 | ) | | (10,899,000 | ) | | (11,371,000 | ) | | (9,724,000 | ) |
| Net income | 2,007,000 |
|
| 234,000 |
|
| 1,162,000 |
|
| 2,190,000 |
|
| Less: net (income) loss attributable to noncontrolling interest of limited partners | (12,000 | ) | | (9,000 | ) | | 9,000 |
| | (40,000 | ) |
| Net income attributable to controlling interest | $ | 1,995,000 |
| | $ | 225,000 |
| | $ | 1,171,000 |
| | $ | 2,150,000 |
|
| Net income per share — basic and diluted: | |
| | |
| | |
| | |
|
| Net income per share attributable to controlling interest | $ | — |
| | $ | — |
| | $ | 0.01 |
| | $ | 0.01 |
|
| Weighted average number of shares outstanding — | |
| | |
| | |
| | |
|
| Basic | 227,825,381 |
| | 229,390,941 |
| | 228,340,776 |
| | 214,797,450 |
|
| Diluted | 228,316,767 |
| | 229,568,328 |
| | 228,800,828 |
| | 214,996,502 |
|
|
| | | | | | | | | | | | | | | | |
| | | Quarter Ended |
| 2013 | | March 31 | | June 30 | | September 30 | | December 31 |
| Revenues | | $ | 76,427 |
| | $ | 77,244 |
| | $ | 82,541 |
| | $ | 83,687 |
|
| Income (loss) from continuing operations | | 1,347 |
| | 13,925 |
| | 4,625 |
| | 3,680 |
|
| Income from discontinued operations | | 37 |
| | 308 |
| | 380 |
| | 382 |
|
| Net income (loss) | | 1,384 |
| | 14,233 |
| | 5,005 |
| | 4,062 |
|
| Net income (loss) attributable to common stockholders | | 1,351 |
| | 14,025 |
| | 4,823 |
| | 4,062 |
|
| Earnings (losses) per common share - basic: | | | | | | | | |
| Income (loss) from continuing operations attributable to common stockholders | | $ | 0.01 |
| | $ | 0.06 |
| | $ | 0.02 |
| | $ | 0.02 |
|
| Discontinued operations | | 0.00 |
| | 0.00 |
| | 0.00 |
| | 0.00 |
|
| Net income (loss) attributable to common stockholders | | $ | 0.01 |
| | $ | 0.06 |
| | $ | 0.02 |
| | $ | 0.02 |
|
| Earnings (losses) per common share - diluted: | | | | | | | | |
| Income (loss) from continuing operations attributable to common stockholders | | $ | 0.01 |
| | $ | 0.06 |
| | $ | 0.02 |
| | $ | 0.02 |
|
| Discontinued operations | | 0.00 |
| | 0.00 |
| | 0.00 |
| | 0.00 |
|
| Net income (loss) attributable to common stockholders | | $ | 0.01 |
| | $ | 0.06 |
| | $ | 0.02 |
| | $ | 0.02 |
|
Healthcare Trust of America, Inc.
NOTES TO CONSOLIDATED FINANCIAL STATEMENTS — (Continued)
|
| | | | | | | | | | | | | | | |
| | Quarters Ended |
| | December 31, 2010 | | September 30, 2010 | | June 30, 2010 | | March 31, 2010 |
| Revenues | $ | 57,504,000 |
| | $ | 52,496,000 |
| | $ | 47,328,000 |
| | $ | 45,753,000 |
|
| Expenses | (58,598,000 | ) | | (43,806,000 | ) | | (40,363,000 | ) | | (38,811,000 | ) |
| Income (loss) before other income (expense) | (1,094,000 | ) | | 8,690,000 |
| | 6,965,000 |
| | 6,942,000 |
|
| Other expense, net | (7,596,000 | ) | | (7,682,000 | ) | | (6,720,000 | ) | | (7,424,000 | ) |
| Net income (loss) | (8,690,000 | ) | | 1,008,000 |
| | 245,000 |
| | (482,000 | ) |
| Less: net (income) loss attributable to noncontrolling interest of limited partners | (44,000 | ) | | 125,000 |
| | (1,000 | ) | | (64,000 | ) |
| Net income (loss) attributable to controlling interest | $ | (8,734,000 | ) | | $ | 1,133,000 |
| | $ | 244,000 |
| | $ | (546,000 | ) |
| Net income (loss) per share — basic and diluted: | |
| | |
| | |
| | |
|
| Net loss per share attributable to controlling interest | $ | (0.05 | ) | | $ | — |
| | $ | — |
| | $ | — |
|
| Weighted average number of shares outstanding — | |
| | |
| | |
| | |
|
| Basic | 191,583,752 |
| | 166,281,800 |
| | 154,594,418 |
| | 145,335,661 |
|
| Diluted | 191,583,752 |
| | 166,480,852 |
| | 154,815,137 |
| | 145,335,661 |
|
|
| | | | | | | | | | | | | | | | |
| | | Quarter Ended |
| 2012 (a) | | March 31 | | June 30 | | September 30 | | December 31 |
| Revenues | | $ | 70,676 |
| | $ | 75,697 |
| | $ | 77,532 |
| | $ | 73,475 |
|
| Income (loss) from continuing operations | | (430 | ) | | (19,458 | ) | | (3,074 | ) | | (1,975 | ) |
| Income from discontinued operations | | 123 |
| | 144 |
| | 143 |
| | 158 |
|
| Net income (loss) | | (307 | ) | | (19,314 | ) | | (2,931 | ) | | (1,817 | ) |
| Net income (loss) attributable to common stockholders | | (315 | ) | | (19,322 | ) | | (2,952 | ) | | (1,836 | ) |
| Earnings (losses) per common share - basic: | | | | | | | | |
| Income (loss) from continuing operations attributable to common stockholders | | $ | 0.00 |
| | $ | (0.08 | ) | | $ | (0.01 | ) | | $ | (0.01 | ) |
| Discontinued operations | | 0.00 |
| | 0.00 |
| | 0.00 |
| | 0.00 |
|
| Net income (loss) attributable to common stockholders | | $ | 0.00 |
| | $ | (0.08 | ) | | $ | (0.01 | ) | | $ | (0.01 | ) |
| Earnings (losses) per common share - diluted: | |
|
| |
|
| |
|
| |
|
|
| Income (loss) from continuing operations attributable to common stockholders | | $ | 0.00 |
| | $ | (0.08 | ) | | $ | (0.01 | ) | | $ | (0.01 | ) |
| Discontinued operations | | 0.00 |
| | 0.00 |
| | 0.00 |
| | 0.00 |
|
| Net income (loss) attributable to common stockholders | | $ | 0.00 |
| | $ | (0.08 | ) | | $ | (0.01 | ) | | $ | (0.01 | ) |
________________________
22. Subsequent Events
The significant events that occurred subsequent to the balance sheet date but prior to the filing of this report that would have a material impact on the consolidated financial statements are summarized below.
Share Repurchases
In January 2012, we repurchased 1,006,188 shares of our common stock at an average price of $9.80 per share, for an aggregate amount of $9,861,000, under our share repurchase plan.
Completed Acquisitions
On January 12, 2012, we purchased a medical office building located in Novi, Michigan for $51,320,000.
On January 31, 2012, we purchased a medical office building located in Atlanta, Georgia for approximately $8,867,000.
On March 1, 2012, we purchased a medical office building located in Pittsburgh, Pennsylvania for $54,000,000.
Pending Acquisitions
On March 9, 2012, we entered into a purchase and sale agreement for a medical office building portfolio located in the eastern United States for an aggregate purchase price of $100,000,000. The portfolio, which is expected to be master leased on a triple net basis, consists of a combination of on-campus assets and off-campus medical office buildings. There can be no assurance that the acquisition will close on the expected schedule, if at all.
Financing
In February 2012, JP Morgan, Deutsche Bank, and Wells Fargo signed engagement letters to serve as Joint Lead Arrangers for a new unsecured credit facility of at least $825,000,000, consisting of a $575,000,000 revolving tranche and a $250,000,000 term loan tranche. As of March 23, 2012, the Joint Lead Arrangers and other additional lenders had committed in excess of that amount to the new credit facility. This credit facility will replace our existing credit facility. It will have an initial term of 4 years, with one twelve-month extension. We anticipate closing the facility in the near future.
| |
| (a) | The quarterly amounts differ from the previously reported amounts in our Annual Report on Form 10-K for the year ended December 31, 2012 as a result of discontinued operations of one property classified as held for sale during 2013. |
Healthcare Trust of America, Inc.
NOTES TO CONSOLIDATED FINANCIAL STATEMENTS — (Continued)
Credit Facility Borrowing
In January and February, 2012, we drew $27,000,000 and $55,000,000, respectively, on our unsecured revolving credit facility in order to fund the acquisition of operating properties.
Distributions
On January 3, 2012, for the month ended December 31, 2011, we paid distributions of $14,100,000 ($7,562,000 in cash and $6,538,000 in shares of our common stock) pursuant to the DRIP.
On February 1, 2012, for the month ended January 31, 2012, we paid distributions of $14,099,000 ($7,580,000 in cash and $6,519,000 in shares of our common stock) pursuant to the DRIP.
On March 1, 2012, for the month ended February 29, 2012, we paid distributions of $13,229,000 ($7,138,000 in cash and $6,091,000 in shares of our common stock) pursuant to the DRIP.
In December, 2011, our board of directors authorized distributions for the months of January, February, and March 2012. These distributions will be calculated based on stockholders of record each day during each such month at a rate of $0.00198630 per share per day and will equal a daily amount that, if paid each day for a 365-day period, would equal a 7.25% annualized rate based on a share price of $10.00. These distributions will be paid in February, March, and April 2012, respectively, in cash or reinvested in stock for those participating in the DRIP.
HEALTHCARE TRUST OF AMERICA, INC. AND HEALTHCARE TRUST OF AMERICA HOLDINGS, LP
NOTES TO CONSOLIDATED FINANCIAL STATEMENTS – (Continued)
19. Selected Quarterly Financial Data of HTALP (Unaudited)
Set forth below is the unaudited selected quarterly financial data of HTALP for 2013 and 2012. We believe that all necessary adjustments, consisting only of normal recurring adjustments, have been included (in thousands, except per unit data). The sum of the individual quarterly amounts may not agree to the annual amounts included in the consolidated statements of operations due to rounding.
|
| | | | | | | | | | | | | | | | |
| | | Quarter Ended |
| 2013 | | March 31 | | June 30 | | September 30 | | December 31 |
| Revenues | | $ | 76,427 |
| | $ | 77,244 |
| | $ | 82,541 |
| | $ | 83,687 |
|
| Income (loss) from continuing operations | | 1,347 |
| | 13,925 |
| | 4,625 |
| | 3,680 |
|
| Income from discontinued operations | | 37 |
| | 308 |
| | 380 |
| | 382 |
|
| Net income (loss) | | 1,384 |
| | 14,233 |
| | 5,005 |
| | 4,062 |
|
| Net income (loss) attributable to common unitholders | | 1,359 |
| | 14,228 |
| | 4,996 |
| | 4,050 |
|
| Earnings (losses) per common unit - basic: | | | | | | | | |
| Income (loss) from continuing operations attributable to common unitholders | | $ | 0.01 |
| | $ | 0.06 |
| | $ | 0.02 |
| | $ | 0.02 |
|
| Discontinued operations | | 0.00 |
| | 0.00 |
| | 0.00 |
| | 0.00 |
|
| Net income (loss) attributable to common unitholders | | $ | 0.01 |
| | $ | 0.06 |
| | $ | 0.02 |
| | $ | 0.02 |
|
| Earnings (losses) per common unit - diluted: | | | | | | | | |
| Income (loss) from continuing operations attributable to common unitholders | | $ | 0.01 |
| | $ | 0.06 |
| | $ | 0.02 |
| | $ | 0.02 |
|
| Discontinued operations | | 0.00 |
| | 0.00 |
| | 0.00 |
| | 0.00 |
|
| Net income (loss) attributable to common unitholders | | $ | 0.01 |
| | $ | 0.06 |
| | $ | 0.02 |
| | $ | 0.02 |
|
Healthcare Trust of America, Inc. |
| | | | | | | | | | | | | | | | |
| | | Quarter Ended |
| 2012 | | March 31 | | June 30 | | September 30 | | December 31 |
| Revenues | | $ | 70,676 |
| | $ | 75,697 |
| | $ | 77,532 |
| | $ | 73,475 |
|
| Income (loss) from continuing operations | | (430 | ) | | (19,458 | ) | | (3,074 | ) | | (1,975 | ) |
| Income from discontinued operations | | 123 |
| | 144 |
| | 143 |
| | 158 |
|
| Net income (loss) | | (307 | ) | | (19,314 | ) | | (2,931 | ) | | (1,817 | ) |
| Net income (loss) attributable to common unitholders | | (310 | ) | | (19,319 | ) | | (2,951 | ) | | (1,829 | ) |
| Earnings (losses) per common unit - basic: | | | | | | | | |
| Income (loss) from continuing operations attributable to common unitholders | | $ | 0.00 |
| | $ | (0.08 | ) | | $ | (0.01 | ) | | $ | (0.01 | ) |
| Discontinued operations | | 0.00 |
| | 0.00 |
| | 0.00 |
| | 0.00 |
|
| Net income (loss) attributable to common unitholders | | $ | 0.00 |
| | $ | (0.08 | ) | | $ | (0.01 | ) | | $ | (0.01 | ) |
| Earnings (losses) per common unit - diluted: | | | | | | | | |
| Income (loss) from continuing operations attributable to common unitholders | | $ | 0.00 |
| | $ | (0.08 | ) | | $ | (0.01 | ) | | $ | (0.01 | ) |
| Discontinued operations | | 0.00 |
| | 0.00 |
| | 0.00 |
| | 0.00 |
|
| Net income (loss) attributable to common unitholders | | $ | 0.00 |
| | $ | (0.08 | ) | | $ | (0.01 | ) | | $ | (0.01 | ) |
HEALTHCARE TRUST OF AMERICA, INC. AND HEALTHCARE TRUST OF AMERICA HOLDINGS, LP
SCHEDULE II —- VALUATION AND QUALIFYING ACCOUNTS
December 31, 2011(In thousands)
|
| | | | | | | | | | | | | | | | | | | | |
| | | Balance at Beginning of Period | | Charged to Expenses | | Adjustments to Valuation Accounts | | Deductions | | Balance at End of Period |
| Year Ended December 31, 2009 | | |
| | |
| | |
| | |
| | |
|
| Allowance for doubtful accounts | | $ | 398,000 |
| | $ | 965,000 |
| | $ | — |
| | $ | 141,000 |
| | $ | 1,222,000 |
|
| Year Ended December 31, 2010 | | |
| | |
| | |
| | |
| | |
|
| Allowance for doubtful accounts | | $ | 1,222,000 |
| | $ | 1,022,000 |
| | $ | — |
| | $ | 318,000 |
| | $ | 1,926,000 |
|
| Year Ended December 31, 2011 | | |
| | |
| | |
| | |
| | |
|
| Allowance for doubtful accounts | | $ | 1,926,000 |
| | $ | 1,447,000 |
| | $ | — |
| | $ | 1,875,000 |
| | $ | 1,498,000 |
|
|
| | | | | | | | | | | | | | | | | | | |
| | Balance at Beginning of Period | | Charged to Expenses | | Adjustments to Valuation Accounts | | Deductions | | Balance at End of Period |
| 2013 - Allowance for doubtful accounts | $ | 2,168 |
| | $ | 453 |
| | $ | — |
| | $ | (500 | ) | | $ | 2,121 |
|
| 2012 - Allowance for doubtful accounts | 1,498 |
| | 1,064 |
| | — |
| | (394 | ) | | 2,168 |
|
| 2011 - Allowance for doubtful accounts | 1,926 |
| | 1,447 |
| | — |
| | (1,875 | ) | | 1,498 |
|
Healthcare Trust of America, Inc.
HEALTHCARE TRUST OF AMERICA, INC. AND HEALTHCARE TRUST OF AMERICA HOLDINGS, LP
SCHEDULE III — REAL ESTATE INVESTMENTS AND
ACCUMULATED DEPRECIATION
December 31, 2011
The following schedule presents our total real estate investments and accumulated depreciation for both our operating properties and those properties classified as held for sale as of December 31, 20112013 (in thousands):
|
| | | | | | | | | | | | | | | | | | | | | | | | | | | | | | | | | | | |
| | | | | Initial Cost to Company | | Cost
Capitalized Subsequent to Acquisition(a) | | Gross Amount at Which Carried at Close of Period | | | | | | |
| | | Encumbrances | | Land | | Buildings, Improvements and Fixtures | | | Land | | Buildings, Improvements and Fixtures | | Total(b) | | Accumulated Depreciation(d)(e) | | Date of construction | | Date acquired |
| Southpointe Office Parke and Epler Parke I (Medical Office) | Indianapolis, IN | $ | 9,017,000 |
| | $ | 2,889,000 |
| | $ | 10,015,000 |
| | $ | 190,000 |
| | $ | 2,889,000 |
| | $ | 10,205,000 |
| | $ | 13,094,000 |
| | (1,724,000 | ) | | 1991 &1996/2002 | | 1/22/2007 |
| Crawfordsville Medical Office Park and Athens Surgery Center (Medical Office) | Crawfordsville, IN | 4,209,000 |
| | 699,000 |
| | 5,474,000 |
| | 102,000 |
| | 699,000 |
| | 5,576,000 |
| | 6,275,000 |
| | (948,000 | ) | | 1998/2000 | | 1/22/2007 |
| The Gallery Professional Building (Medical Office) | St. Paul, MN | 5,948,000 |
| | 1,157,000 |
| | 5,009,000 |
| | 2,909,000 |
| | 1,157,000 |
| | 7,918,000 |
| | 9,075,000 |
| | (1,568,000 | ) | | 1979 | | 3/9/2007 |
| Lenox Office Park, Building G (Office) | Memphis, TN | 11,881,000 |
| | 1,670,000 |
| | 13,626,000 |
| | (959,000 | ) | | 1,670,000 |
| | 12,667,000 |
| | 14,337,000 |
| | (1,898,000 | ) | | 2000 | | 3/23/2007 |
| Commons V Medical Office Building (Medical Office) | Naples, FL | 9,528,000 |
| | 4,173,000 |
| | 9,070,000 |
| | 84,000 |
| | 4,173,000 |
| | 9,154,000 |
| | 13,327,000 |
| | (1,276,000 | ) | | 1991 | | 4/24/2007 |
| Yorktown Medical Center and Shakerag Medical Center (Medical Office) | Peachtree City and Fayetteville, GA | 13,257,000 |
| | 3,545,000 |
| | 15,792,000 |
| | 1,882,000 |
| | 3,545,000 |
| | 17,674,000 |
| | 21,219,000 |
| | (2,995,000 | ) | | 1987/1994 | | 5/2/2007 |
| Thunderbird Medical Plaza (Medical Office) | Glendale, AZ | 13,553,000 |
| | 3,842,000 |
| | 19,680,000 |
| | 1,782,000 |
| | 3,842,000 |
| | 21,462,000 |
| | 25,304,000 |
| | (3,569,000 | ) | | 1975, 1983, 1987 | | 5/15/2007 |
| Triumph Hospital Northwest and Triumph Hospital Southwest (Healthcare Related Facility) | Houston and Sugarland, TX | — |
| | 3,047,000 |
| | 28,550,000 |
| | 257,000 |
| | 3,047,000 |
| | 28,807,000 |
| | 31,854,000 |
| | (5,294,000 | ) | | 1986/1989 | | 6/8/2007 |
| Gwinnett Professional Center (Medical Office) | Lawrenceville, GA | 5,311,000 |
| | 1,290,000 |
| | 7,246,000 |
| | 990,000 |
| | 1,290,000 |
| | 8,236,000 |
| | 9,526,000 |
| | (1,312,000 | ) | | 1985 | | 7/27/2007 |
| 1 and 4 Market Exchange (Medical Office) | Columbus, OH | 10,093,000 |
| | 2,326,000 |
| | 17,208,000 |
| | 1,138,000 |
| | 2,326,000 |
| | 18,346,000 |
| | 20,672,000 |
| | (2,139,000 | ) | | 2001/2003 | | 8/15/2007 |
| Kokomo Medical Office Park (Medical Office) | Kokomo, IN | 8,147,000 |
| | 1,779,000 |
| | 9,613,000 |
| | 314,000 |
| | 1,779,000 |
| | 9,927,000 |
| | 11,706,000 |
| | (1,773,000 | ) | | 1992, 1994, 1995, 2003 | | 8/30/2007 |
| St. Mary Physicians Center (Medical Office) | Long Beach, CA | — |
| | 1,815,000 |
| | 10,242,000 |
| | 162,000 |
| | 1,815,000 |
| | 10,404,000 |
| | 12,219,000 |
| | (1,211,000 | ) | | 1992 | | 9/5/2007 |
| 2750 Monroe Boulevard (Office) | Valley Forge, PA | — |
| | 2,323,000 |
| | 22,631,000 |
| | 4,864,000 |
| | 2,323,000 |
| | 27,495,000 |
| | 29,818,000 |
| | (3,072,000 | ) | | 1985 | | 9/10/2007 |
| East Florida Senior Care Portfolio (Healthcare Related Facility) | Jacksonville, Winter Park and Sunrise,FL | — |
| | 10,078,000 |
| | 34,870,000 |
| | — |
| | 10,078,000 |
| | 34,870,000 |
| | 44,948,000 |
| | (6,417,000 | ) | | 1985, 1988, 1989 | | 9/28/2007 |
| Northmeadow Medical Center (Medical Office) | Roswell, GA | 7,375,000 |
| | 1,245,000 |
| | 9,109,000 |
| | 174,000 |
| | 1,245,000 |
| | 9,283,000 |
| | 10,528,000 |
| | (1,553,000 | ) | | 1999 | | 11/15/2007 |
| Tucson Medical Office Portfolio (Medical Office) | Tucson, AZ | — |
| | 1,309,000 |
| | 17,574,000 |
| | 374,000 |
| | 1,309,000 |
| | 17,948,000 |
| | 19,257,000 |
| | (2,666,000 | ) | | 1979, 1980, 1994 1970, 1985, 1990, | | 11/20/2007 |
| Lima Medical Office Portfolio (Medical Office) | Lima, OH | — |
| | 701,000 |
| | 19,052,000 |
| | 87,000 |
| | 701,000 |
| | 19,139,000 |
| | 19,840,000 |
| | (3,055,000 | ) | | 1996, 2004, 1920 | | 12/7/2007 |
| Highlands Ranch Park Plaza (Medical Office) | Highlands Ranch, CO | 8,114,000 |
| | 2,240,000 |
| | 10,426,000 |
| | 1,103,000 |
| | 2,240,000 |
| | 11,529,000 |
| | 13,769,000 |
| | (1,859,000 | ) | | 1983, 1985 | | 12/19/2007 |
| Park Place Office Park (Medical Office) | Dayton, OH | — |
| | 1,987,000 |
| | 11,341,000 |
| | 1,087,000 |
| | 1,987,000 |
| | 12,428,000 |
| | 14,415,000 |
| | (2,160,000 | ) | | 1987, 1988, 2002 | | 12/20/2007 |
| Chesterfield Rehabilitation Center (Medical Office) | Chesterfield, MO | 21,120,000 |
| | 4,212,000 |
| | 27,901,000 |
| | 770,000 |
| | 4,313,000 |
| | 28,570,000 |
| | 32,883,000 |
| | (3,290,000 | ) | | 2007 | | 12/20/2007 |
| Medical Portfolio 1 (Medical Office) | Overland, KS and Largo, Brandon, and Lakeland, FL | 21,439,000 |
| | 4,206,000 |
| | 28,373,000 |
| | 1,446,000 |
| | 4,206,000 |
| | 29,819,000 |
| | 34,025,000 |
| | (4,501,000 | ) | | 1978, 1986, 1997, 1995 | | 2/1/2008 |
|
| | | | | | | | | | | | | | | | | | | | | | | | | | | | | | | | | | | | | |
| | | | | Initial Cost to Company | | Cost
Capitalized Subsequent to Acquisition (a) | | Gross Amount at Which Carried at Close of Period | | | | | | | | |
| | | Encumbrances | | Land | | Buildings, Improvements and Fixtures | | | Land | | Buildings, Improvements and Fixtures | | Total (c) | | Accumulated Depreciation(f) | | Date of Construction | | Date Acquired | | Life on Which Building Depreciation in Income Statement is Computed (h) |
| Phoenix Med Center | Glendale, AZ | $ | 2,049 |
| | $ | 453 |
| | $ | 2,768 |
| | $ | 194 |
| | $ | 453 |
| | $ | 2,962 |
| | $ | 3,415 |
| | (388 | ) | | 1989 | | 2011 | | 39 |
| Thunderbird MOP | Glendale, AZ | 13,148 |
| | 3,842 |
| | 19,679 |
| | 3,116 |
| | 3,842 |
| | 22,795 |
| | 26,637 |
| | (5,541 | ) | | 1976 - 1987 | | 2007 | | 39 |
| Peoria MOB | Peoria, AZ | 4,151 |
| | 605 |
| | 4,394 |
| | 268 |
| | 605 |
| | 4,662 |
| | 5,267 |
| | (621 | ) | | 2000 | | 2010 | | 39 |
| Baptist MC | Phoenix, AZ | 7,242 |
| | — |
| | 12,637 |
| | 1,241 |
| | — |
| | 13,878 |
| | 13,878 |
| | (2,184 | ) | | 1973 | | 2008 | | 39 |
| Desert Ridge MOB | Phoenix, AZ | — |
| | — |
| | 27,738 |
| | 503 |
| | — |
| | 28,241 |
| | 28,241 |
| | (1,988 | ) | | 2004 - 2006 | | 2011 | | 39 |
| Estrella Med Center | Phoenix, AZ | 19,909 |
| | — |
| | 24,703 |
| | 747 |
| | — |
| | 25,450 |
| | 25,450 |
| | (2,888 | ) | | 2004 | | 2010 | | 39 |
| Sun City Boswell MOBs | Sun City, AZ | — |
| | — |
| | 20,290 |
| | 1,300 |
| | — |
| | 21,590 |
| | 21,590 |
| | (4,779 | ) | | 1971 - 2001 | | 2009 | | 39 |
| Sun City Boswell West | Sun City, AZ | — |
| | — |
| | 6,610 |
| | 864 |
| | — |
| | 7,474 |
| | 7,474 |
| | (1,272 | ) | | 1992 | | 2009 | | 39 |
| Sun City Webb MP | Sun City, AZ | — |
| | — |
| | 29,669 |
| | 710 |
| | — |
| | 30,379 |
| | 30,379 |
| | (5,079 | ) | | 1997 - 2004 | | 2009 | | 39 |
| Sun City West MOBs | Sun City, AZ | — |
| | 744 |
| | 13,466 |
| | 860 |
| | 744 |
| | 14,326 |
| | 15,070 |
| | (2,857 | ) | | 1987 - 2002 | | 2009 | | 39 |
| Gateway Med Plaza | Tucson, AZ | 9,960 |
| | — |
| | 14,005 |
| | (94 | ) | | — |
| | 13,911 |
| | 13,911 |
| | (1,341 | ) | | 2008 | | 2010 | | 39 |
| Tucson Academy MOP | Tucson, AZ | — |
| | 1,193 |
| | 6,107 |
| | 1,153 |
| | 1,193 |
| | 7,260 |
| | 8,453 |
| | (1,698 | ) | | 1978 | | 2008 | | 39 |
| Tucson Desert Life MOP | Tucson, AZ | — |
| | 1,309 |
| | 17,572 |
| | 706 |
| | 1,309 |
| | 18,278 |
| | 19,587 |
| | (4,010 | ) | | 1980 - 1984 | | 2007 | | 39 |
| Senior Care El Monte | El Monte, CA | — |
| | 1,534 |
| | 3,545 |
| | (17 | ) | | 1,534 |
| | 3,528 |
| | 5,062 |
| | (585 | ) | | 1964 | | 2008 | | 39 |
| Senior Care Lomita | Lomita, CA | — |
| | 1,035 |
| | 2,083 |
| | (8 | ) | | 1,035 |
| | 2,075 |
| | 3,110 |
| | (371 | ) | | 1959 | | 2008 | | 39 |
| St. Mary Physician's Center | Long Beach, CA | — |
| | 1,815 |
| | 10,242 |
| | 471 |
| | 1,815 |
| | 10,713 |
| | 12,528 |
| | (1,890 | ) | | 1992 | | 2007 | | 39 |
| San Luis Obispo MOB | San Luis Obispo, CA | — |
| | — |
| | 11,900 |
| | 1,469 |
| | — |
| | 13,369 |
| | 13,369 |
| | (1,523 | ) | | 2009 | | 2010 | | 39 |
| Hampden Place MOB | Englewood, CO | — |
| | 3,032 |
| | 12,553 |
| | 13 |
| | 3,032 |
| | 12,566 |
| | 15,598 |
| | (1,832 | ) | | 2004 | | 2009 | | 39 |
| Highlands Ranch MOP | Highlands Ranch, CO | — |
| | 2,240 |
| | 10,426 |
| | 1,516 |
| | 2,240 |
| | 11,942 |
| | 14,182 |
| | (2,724 | ) | | 1983 - 1985 | | 2007 | | 39 |
| Lincoln Medical Center | Parker, CO | — |
| | 5,142 |
| | 28,638 |
| | — |
| | 5,142 |
| | 28,638 |
| | 33,780 |
| | (424 | ) | | 2008 | | 2013 | | 39 |
| Brandon MOP | Brandon, FL | — |
| | 901 |
| | 6,946 |
| | 534 |
| | 901 |
| | 7,480 |
| | 8,381 |
| | (1,536 | ) | | 1997 | | 2008 | | 39 |
| Orlando Rehab Hospital | Edgewood, FL | — |
| | 2,600 |
| | 20,256 |
| | 3,000 |
| | 2,600 |
| | 23,256 |
| | 25,856 |
| | (1,884 | ) | | 2007 | | 2010 | | 39 |
| Palmetto MOB | Hialeah, FL | 5,924 |
| | — |
| | 15,512 |
| | 26 |
| | — |
| | 15,538 |
| | 15,538 |
| | (246 | ) | | 1980 | | 2013 | | 39 |
| East FL Senior Jacksonville | Jacksonville, FL | — |
| | 4,291 |
| | 9,220 |
| | — |
| | 4,291 |
| | 9,220 |
| | 13,511 |
| | (2,773 | ) | | 1985 | | 2007 | | 39 |
| King Street MOB | Jacksonville, FL | 5,653 |
| | — |
| | 7,232 |
| | (70 | ) | | — |
| | 7,162 |
| | 7,162 |
| | (881 | ) | | 2007 | | 2010 | | 39 |
| Jupiter MP | Jupiter, FL | — |
| | 1,204 |
| | 11,778 |
| | — |
| | 1,204 |
| | 11,778 |
| | 12,982 |
| | — |
| | 1996 - 1997 | | 2013 | | 39 |
| Central FL SC | Lakeland, FL | — |
| | 768 |
| | 3,002 |
| | 233 |
| | 768 |
| | 3,235 |
| | 4,003 |
| | (607 | ) | | 1995 | | 2008 | | 39 |
| Vista Pro Center MOP | Lakeland, FL | — |
| | 1,082 |
| | 3,587 |
| | 75 |
| | 1,082 |
| | 3,662 |
| | 4,744 |
| | (830 | ) | | 1996 - 1999 | | 2007 - 2008 | | 39 |
| Largo, Medical Center | Largo, FL | 29,925 |
| | — |
| | 51,045 |
| | — |
| | — |
| | 51,045 |
| | 51,045 |
| | — |
| | 2009 | | 2013 | | 39 |
| Largo MOP | Largo, FL | — |
| | 729 |
| | 8,908 |
| | 411 |
| | 729 |
| | 9,319 |
| | 10,048 |
| | (1,872 | ) | | 1975 - 1986 | | 2008 | | 39 |
| FL Family Medical Center | Lauderdale Lakes, FL | — |
| | — |
| | 4,257 |
| | 9 |
| | — |
| | 4,266 |
| | 4,266 |
| | (97 | ) | | 1978 | | 2013 | | 39 |
| Northwest Medical Park | Margate, FL | — |
| | — |
| | 9,525 |
| | — |
| | — |
| | 9,525 |
| | 9,525 |
| | — |
| | 2009 | | 2013 | | 39 |
| North Shore MOB | Miami, FL | — |
| | — |
| | 4,942 |
| | — |
| | — |
| | 4,942 |
| | 4,942 |
| | (101 | ) | | 1978 | | 2013 | | 39 |
| Common V MOB | Naples, FL | 9,214 |
| | 4,173 |
| | 9,070 |
| | 229 |
| | 4,173 |
| | 9,299 |
| | 13,472 |
| | (1,826 | ) | | 1990 | | 2007 | | 39 |
Healthcare Trust of America, Inc.HEALTHCARE TRUST OF AMERICA, INC. AND HEALTHCARE TRUST OF AMERICA HOLDINGS, LP
SCHEDULE III — REAL ESTATE INVESTMENTS AND
ACCUMULATED DEPRECIATION — (Continued)
|
| | | | | | | | | | | | | | | | | | | | | | | | | | | | | | | | | | |
| | | | | Initial Cost to Company | | Cost
Capitalized Subsequent to Acquisition(a) | | Gross Amount at Which Carried at Close of Period | | | | | | |
| | | Encumbrances | | Land | | Buildings, Improvements and Fixtures | | | Land | | Buildings, Improvements and Fixtures | | Total(b) | | Accumulated Depreciation(d)(e) | | Date of construction | | Date acquired |
| Fort Road Medical Building (Medical Office) | St. Paul, MN | $ | — |
| | $ | 1,571,000 |
| | $ | 5,786,000 |
| | 235,000 |
| | $ | 1,571,000 |
| | $ | 6,021,000 |
| | $ | 7,592,000 |
| | (798,000 | ) | | 1981 | | 3/6/2008 |
| Liberty Falls Medical Plaza (Medical Office) | Liberty Township, OH | — |
| | 842,000 |
| | 5,640,000 |
| | 613,000 |
| | 842,000 |
| | 6,253,000 |
| | 7,095,000 |
| | (982,000 | ) | | 2008 | | 3/19/2008 |
| Epler Parke Building B (Medical Office) | Indianapolis, IN | 3,100,000 |
| | 857,000 |
| | 4,461,000 |
| | (135,000 | ) | | 857,000 |
| | 4,326,000 |
| | 5,183,000 |
| | (867,000 | ) | | 2004 | | 3/24/2008 |
| Cypress Station Medical Office Building (Medical Office) | Houston, TX | — |
| | 1,345,000 |
| | 8,312,000 |
| | 636,000 |
| | 1,345,000 |
| | 8,948,000 |
| | 10,293,000 |
| | (1,230,000 | ) | | 1981/2004-2006 | | 3/25/2008 |
| Vista Professional Center (Medical Office) | Lakeland, FL | — |
| | 1,082,000 |
| | 3,588,000 |
| | 3,000 |
| | 1,082,000 |
| | 3,591,000 |
| | 4,673,000 |
| | (659,000 | ) | | 1996/1998 | | 3/27/2008 |
| Senior Care Portfolio 1 (Healthcare Related Facility) | Arlington, Galveston, Port Arthur and Texas City, TX and Lomita and El Monte, CA | — |
| | 4,871,000 |
| | 30,002,000 |
| | — |
| | 4,871,000 |
| | 30,002,000 |
| | 34,873,000 |
| | (3,547,000 | ) | | 1993, 1994, 1994, 1994/1996 1964/1969 1959/1963 | | Various |
| Amarillo Hospital (Healthcare Related Facility) | Amarillo, TX | — |
| | 1,110,000 |
| | 17,688,000 |
| | 5,000 |
| | 1,110,000 |
| | 17,693,000 |
| | 18,803,000 |
| | (1,825,000 | ) | | 2007 | | 5/15/2008 |
| 5995 Plaza Drive (Office) | Cypress, CA | 14,645,000 |
| | 5,109,000 |
| | 17,961,000 |
| | 315,000 |
| | 5,109,000 |
| | 18,276,000 |
| | 23,385,000 |
| | (2,449,000 | ) | | 1986 | | 5/29/2008 |
| Nutfield Professional Center (Medical Office) | Derry, NH | 9,169,000 |
| | 1,075,000 |
| | 10,320,000 |
| | 104,000 |
| | 1,075,000 |
| | 10,424,000 |
| | 11,499,000 |
| | (1,082,000 | ) | | 1963/1990 & 1996 | | 6/3/2008 |
| SouthCrest Medical Plaza (Medical Office) | Stockbridge, GA | 10,917,000 |
| | 4,259,000 |
| | 14,636,000 |
| | 119,000 |
| | 4,259,000 |
| | 14,755,000 |
| | 19,014,000 |
| | (2,258,000 | ) | | 2005-2006 | | 6/24/2008 |
| Medical Portfolio 3 (Medical Office) | Indianapolis, IN | — |
| | 9,355,000 |
| | 70,259,000 |
| | 7,249,000 |
| | 9,355,000 |
| | 77,508,000 |
| | 86,863,000 |
| | (12,508,000 | ) | | 1995, 1993, 1994, 1996, 1993, 1995, 1989, 1988, 1989, 1992, 1989 | | 6/26/2008 |
| Academy Medical Center (Medical Office) | Tucson, AZ | 3,166,000 |
| | 1,193,000 |
| | 6,106,000 |
| | 822,000 |
| | 1,193,000 |
| | 6,928,000 |
| | 8,121,000 |
| | (1,055,000 | ) | | 1975-1985 | | 6/26/2008 |
| Decatur Medical Plaza (Medical Office) | Decatur, GA | — |
| | 3,166,000 |
| | 6,862,000 |
| | 343,000 |
| | 3,166,000 |
| | 7,205,000 |
| | 10,371,000 |
| | (888,000 | ) | | 1976 | | 6/27/2008 |
| Medical Portfolio 2 (Medical Office) | O’Fallon and St. Louis, MO and Keller and Wichita Falls, TX | 24,829,000 |
| | 5,360,000 |
| | 33,506,000 |
| | 190,000 |
| | 5,360,000 |
| | 33,696,000 |
| | 39,056,000 |
| | (4,679,000 | ) | | 2001, 2001, 2006, 1957/1989/2003 & 2003 | | Various |
| Renaissance Medical Centre (Medical Office) | Bountiful, UT | 19,354,000 |
| | 3,701,000 |
| | 24,442,000 |
| | 65,000 |
| | 3,701,000 |
| | 24,507,000 |
| | 28,208,000 |
| | (2,318,000 | ) | | 2004 | | 6/30/2008 |
| Oklahoma City Medical Portfolio (Medical Office) | Oklahoma City, OK | — |
| | |
| | 25,976,000 |
| | 1,474,000 |
| | |
| | 27,450,000 |
| | 27,450,000 |
| | (2,915,000 | ) | | 1991, 1996/2007 | | 9/16/2008 |
| Medical Portfolio 4 (Medical Office) | Phoenix, AZ, Parma and Jefferson West, OH, and Waxahachie, Greenville, and Cedar Hill, TX | 7,795,000 |
| | 2,632,000 |
| | 38,652,000 |
| | 1,377,000 |
| | 2,632,000 |
| | 40,029,000 |
| | 42,661,000 |
| | (4,726,000 | ) | | 1972/1980 & 2006, 1977, 1984, 2006, 2007, 2007 | | Various |
| Mountain Empire Portfolio (Medical Office) | Kingsport and Bristol, TN and Pennington Gap and Norton, VA | 17,935,000 |
| | 804,000 |
| | 20,149,000 |
| | 730,000 |
| | 804,000 |
| | 20,879,000 |
| | 21,683,000 |
| | (3,256,000 | ) | | 1986/1991/1993/1982/1990,1997/1976 & 2007, 1986, 1993 & 1995, 1981 & 1987/1999 | | 9/12/2008 |
| Mountain Plains — TX (Medical Office) | San Antonio and Webster, TX | — |
| | 1,248,000 |
| | 34,857,000 |
| | 36,000 |
| | 1,248,000 |
| | 34,893,000 |
| | 36,141,000 |
| | (3,566,000 | ) | | 1998, 2005, 2006, 2006 | | 12/18/2008 |
| Marietta Health Park (Medical Office) | Marietta, GA | 7,200,000 |
| | 1,276,000 |
| | 12,197,000 |
| | 215,000 |
| | 1,276,000 |
| | 12,412,000 |
| | 13,688,000 |
| | (1,516,000 | ) | | 2000 | | 12/22/2008 |
| Wisconsin Medical Portfolio 1 | Milwaukee, WI | — |
| | 1,980,000 |
| | 26,032,000 |
| | — |
| | 1,980,000 |
| | 26,032,000 |
| | 28,012,000 |
| | (3,351,000 | ) | | 1964/1969, 1983-1997 & 2007 | | 2/27/2009 |
| Wisconsin Medical Portfolio 2 | Franklin, WI | 9,832,000 |
| | 1,574,000 |
| | 31,655,000 |
| | — |
| | 1,574,000 |
| | 31,655,000 |
| | 33,229,000 |
| | (3,275,000 | ) | | 2001-2004 | | 5/28/2009 |
| Greenville Hospital Portfolio | Greenville, SC | 70,323,000 |
| | 3,952,000 |
| | 135,776,000 |
| | 92,000 |
| | 3,948,000 |
| | 137,222,000 |
| | 139,820,000 |
| | (9,169,000 | ) | | 1974, 1982-1999, & 2004-2009 | | 9/18/2009 |
|
| | | | | | | | | | | | | | | | | | | | | | | | | | | | | | |
| | | | | Initial Cost to Company | | Cost
Capitalized
Subsequent
to
Acquisition (a) | | Gross Amount at Which Carried at Close of Period | | | | | | | | |
| | | Encumbrances | | Land | | Buildings, Improvements and Fixtures | | | Land | | Buildings, Improvements and Fixtures | | Total (c) | | Accumulated Depreciation(f) | | Date of Construction | | Date Acquired | | Life on Which Building Depreciation in Income Statement is Computed (h) |
| Orlando Lake Underhill MOB | Orlando, FL | — |
| | — |
| | 8,515 |
| | 492 |
| | — |
| | 9,007 |
| | 9,007 |
| | (1,082 | ) | | 2000 | | 2010 | | 39 |
| Orlando Oviedo MOB | Oviedo, FL | — |
| | — |
| | 5,711 |
| | 163 |
| | — |
| | 5,874 |
| | 5,874 |
| | (668 | ) | | 1998 | | 2010 | | 39 |
| Heart & Family Health MOB | Port St. Lucie, FL | — |
| | 686 |
| | 8,102 |
| | — |
| | 686 |
| | 8,102 |
| | 8,788 |
| | — |
| | 2008 | | 2013 | | 39 |
| St. Lucie MC | Port St. Lucie, FL | — |
| | — |
| | 6,127 |
| | — |
| | — |
| | 6,127 |
| | 6,127 |
| | — |
| | 2008 | | 2013 | | 39 |
| East FL Senior Sunrise | Sunrise, FL | — |
| | 2,947 |
| | 12,825 |
| | — |
| | 2,947 |
| | 12,825 |
| | 15,772 |
| | (3,265 | ) | | 1989 | | 2007 | | 39 |
| Tallahassee Rehab Hospital | Tallahassee, FL | — |
| | 7,142 |
| | 18,691 |
| | 2,400 |
| | 7,142 |
| | 21,091 |
| | 28,233 |
| | (1,831 | ) | | 2007 | | 2010 | | 39 |
| FL Ortho Institute | Temple Terrace, FL | — |
| | 2,923 |
| | 17,647 |
| | — |
| | 2,923 |
| | 17,647 |
| | 20,570 |
| | (1,763 | ) | | 2001 - 2003 | | 2010 | | 39 |
| Wellington MAP III | Wellington, FL | 7,977 |
| | — |
| | 10,511 |
| | (85 | ) | | — |
| | 10,426 |
| | 10,426 |
| | (994 | ) | | 2006 | | 2010 | | 39 |
| Victor Farris MOB | West Palm Beach, FL | 11,942 |
| | — |
| | 23,052 |
| | — |
| | — |
| | 23,052 |
| | 23,052 |
| | (281 | ) | | 1988 | | 2013 | | 39 |
| East FL Senior Winter Park | Winter Park, FL | — |
| | 2,840 |
| | 12,825 |
| | — |
| | 2,840 |
| | 12,825 |
| | 15,665 |
| | (3,591 | ) | | 1988 | | 2007 | | 39 |
| Augusta Rehab Hospital | Augusta, GA | — |
| | 1,059 |
| | 20,899 |
| | — |
| | 1,059 |
| | 20,899 |
| | 21,958 |
| | (1,880 | ) | | 2007 | | 2010 | | 39 |
| Austell Medical Park | Austell, GA | — |
| | 432 |
| | 4,057 |
| | — |
| | 432 |
| | 4,057 |
| | 4,489 |
| | (83 | ) | | 2007 | | 2013 | | 39 |
| Camp Creek Med Center | Atlanta, GA | — |
| | 2,961 |
| | 19,688 |
| | (179 | ) | | 2,961 |
| | 19,509 |
| | 22,470 |
| | (2,754 | ) | | 2006 - 2010 | | 2010 - 2012 | | 39 |
| Decatur MP | Decatur, GA | — |
| | 3,166 |
| | 6,862 |
| | 340 |
| | 3,153 |
| | 7,215 |
| | 10,368 |
| | (1,384 | ) | | 1976 | | 2008 | | 39 |
| Yorktown MC | Fayetteville, GA | — |
| | 2,802 |
| | 12,502 |
| | 2,171 |
| | 2,802 |
| | 14,673 |
| | 17,475 |
| | (3,418 | ) | | 1987 | | 2007 | | 39 |
| Gwinett MOP | Lawrenceville, GA | — |
| | 1,290 |
| | 7,246 |
| | 1,210 |
| | 1,290 |
| | 8,456 |
| | 9,746 |
| | (1,901 | ) | | 1985 | | 2007 | | 39 |
| Marietta Health Park | Marietta, GA | 7,200 |
| | 1,276 |
| | 12,197 |
| | 417 |
| | 1,276 |
| | 12,614 |
| | 13,890 |
| | (2,552 | ) | | 2000 | | 2008 | | 39 |
| Shakerag MC | Peachtree City, GA | 12,875 |
| | 743 |
| | 3,290 |
| | 1,171 |
| | 743 |
| | 4,461 |
| | 5,204 |
| | (1,025 | ) | | 1994 | | 2007 | | 39 |
| Northmeadow Medical Center | Roswell, GA | — |
| | 1,245 |
| | 9,109 |
| | 104 |
| | 1,245 |
| | 9,213 |
| | 10,458 |
| | (1,976 | ) | | 1999 | | 2007 | | 39 |
| Overlook at Eagle's Landing | Stockbridge, GA | 5,143 |
| | 638 |
| | 6,685 |
| | 79 |
| | 638 |
| | 6,764 |
| | 7,402 |
| | (852 | ) | | 2004 | | 2010 | | 39 |
| SouthCrest MOP | Stockbridge, GA | — |
| | 4,260 |
| | 14,636 |
| | 390 |
| | 4,260 |
| | 15,026 |
| | 19,286 |
| | (3,411 | ) | | 2005 | | 2008 | | 39 |
| Rush Oak Park MOB | Oak Park, IL | — |
| | 1,096 |
| | 38,550 |
| | — |
| | 1,096 |
| | 38,550 |
| | 39,646 |
| | (1,874 | ) | | 2000 | | 2012 | | 39 |
| Brownsburg MOB | Brownsburg, IN | — |
| | 431 |
| | 639 |
| | 164 |
| | 431 |
| | 803 |
| | 1,234 |
| | (316 | ) | | 1989 | | 2008 | | 39 |
| Athens SC | Crawfordsville, IN | — |
| | 381 |
| | 3,575 |
| | 117 |
| | 381 |
| | 3,692 |
| | 4,073 |
| | (831 | ) | | 2000 | | 2007 | | 39 |
| Crawfordsville MOB | Crawfordsville, IN | 4,104 |
| | 318 |
| | 1,899 |
| | 50 |
| | 318 |
| | 1,949 |
| | 2,267 |
| | (510 | ) | | 1997 | | 2007 | | 39 |
| Deaconess Clinic Downtown | Evansville, IN | — |
| | 1,748 |
| | 21,963 |
| | 60 |
| | 1,748 |
| | 22,023 |
| | 23,771 |
| | (3,097 | ) | | 1952 - 1967 | | 2010 | | 39 |
| Deaconess Clinic Westside | Evansville, IN | 20,178 |
| | 360 |
| | 3,265 |
| | 166 |
| | 360 |
| | 3,431 |
| | 3,791 |
| | (468 | ) | | 2005 | | 2010 | | 39 |
| Dupont MOB | Fort Wayne, IN | — |
| | — |
| | 8,246 |
| | — |
| | — |
| | 8,246 |
| | 8,246 |
| | — |
| | 2004 | | 2013 | | 39 |
| Ft. Wayne MOB | Fort Wayne, IN | — |
| | — |
| | 6,579 |
| | — |
| | — |
| | 6,579 |
| | 6,579 |
| | (763 | ) | | 2008 | | 2009 | | 39 |
| Community MP | Indianapolis, IN | — |
| | 560 |
| | 3,581 |
| | 192 |
| | 560 |
| | 3,773 |
| | 4,333 |
| | (796 | ) | | 1995 | | 2008 | | 39 |
| Eagle Highlands MOP | Indianapolis, IN | — |
| | 2,216 |
| | 11,154 |
| | 4,128 |
| | 2,216 |
| | 15,282 |
| | 17,498 |
| | (2,931 | ) | | 1988 - 1989 | | 2008 | | 39 |
| Epler Parke MOP | Indianapolis, IN | — |
| | 1,556 |
| | 6,928 |
| | (44 | ) | | 1,556 |
| | 6,884 |
| | 8,440 |
| | (1,748 | ) | | 2002 - 2003 | | 2007 - 2008 | | 39 |
| Glendale Prof Plaza | Indianapolis, IN | — |
| | 570 |
| | 2,739 |
| | 711 |
| | 570 |
| | 3,450 |
| | 4,020 |
| | (969 | ) | | 1993 | | 2008 | | 39 |
| MMP Eagle Highlands | Indianapolis, IN | — |
| | 1,044 |
| | 13,548 |
| | 1,755 |
| | 1,044 |
| | 15,303 |
| | 16,347 |
| | (3,304 | ) | | 1993 | | 2008 | | 39 |
| MMP East | Indianapolis, IN | — |
| | 1,236 |
| | 9,840 |
| | 1,580 |
| | 1,236 |
| | 11,420 |
| | 12,656 |
| | (3,297 | ) | | 1996 | | 2008 | | 39 |
| MMP North | Indianapolis, IN | — |
| | 1,518 |
| | 15,460 |
| | 3,259 |
| | 1,427 |
| | 18,810 |
| | 20,237 |
| | (3,556 | ) | | 1995 | | 2008 | | 39 |
| MMP South | Indianapolis, IN | — |
| | 1,127 |
| | 10,414 |
| | 843 |
| | 1,127 |
| | 11,257 |
| | 12,384 |
| | (2,672 | ) | | 1994 | | 2008 | | 39 |
Healthcare Trust of America, Inc.HEALTHCARE TRUST OF AMERICA, INC. AND HEALTHCARE TRUST OF AMERICA HOLDINGS, LP
SCHEDULE III — REAL ESTATE INVESTMENTS AND
ACCUMULATED DEPRECIATION — (Continued)
|
| | | | | | | | | | | | | | | | | | | | | | | | | | | | | | | | | | | | |
| | | | | Initial Cost to Company | | Cost
Capitalized Subsequent to Acquisition(a) | | Gross Amount at Which Carried at Close of Period | | | | | | |
| | | Encumbrances | | Land | | Buildings, Improvements and Fixtures | | | Land | | Buildings, Improvements and Fixtures | | Total(b) | | Accumulated Depreciation(d)(e) | | Date of construction | | Date acquired |
| Mary Black Medical Office Building | Spartanburg, SC | — |
| | |
| | 12,523,000 |
| | (3,000 | ) | | |
| | 12,520,000 |
| | 12,520,000 |
| | (968,000 | ) | | 2006 | | 12/11/2009 |
| Hampden Place Medical Office Building | Englewood, CO | — |
| | 3,032,000 |
| | 12,553,000 |
| | (110,000 | ) | | 3,032,000 |
| | 12,443,000 |
| | 15,475,000 |
| | (925,000 | ) | | 2004 | | 12/21/2009 |
| Dallas LTAC Hospital | Dallas, TX | — |
| | 2,301,000 |
| | 20,627,000 |
| | — |
| | 2,301,000 |
| | 20,627,000 |
| | 22,928,000 |
| | (1,203,000 | ) | | 2007 | | 12/23/2009 |
| Smyth Professional Building | Baltimore, MD | — |
| | |
| | 7,760,000 |
| | (118,000 | ) | | |
| | 7,642,000 |
| | 7,642,000 |
| | (621,000 | ) | | 1984 | | 12/30/2009 |
| Atlee Medical Portfolio | Coriscana, TX and Ft. Wayne, IN and San Angelo, TX | — |
| | |
| | 17,267,000 |
| | — |
| | |
| | 17,267,000 |
| | 17,267,000 |
| | (1,177,000 | ) | | 2007-2008 | | 12/30/2009 |
| Denton Medical Rehabilitation Hospital | Denton, TX | — |
| | 2,000,000 |
| | 11,704,000 |
| | — |
| | 2,000,000 |
| | 11,704,000 |
| | 13,704,000 |
| | (805,000 | ) | | 2008 | | 12/30/2009 |
| Banner Sun City Medical Portfolio | Sun City, AZ and Sun City West, AZ | 43,302,000 |
| | 744,000 |
| | 70,035,000 |
| | 2,090,000 |
| | 744,000 |
| | 72,125,000 |
| | 72,870,000 |
| | (7,329,000 | ) | | 1971-1997 & 2001-2004 | | 12/31/2009 |
| Camp Creek | Atlanta, GA | |
| | 2,022,000 |
| | 12,965,000 |
| | (42,000 | ) | | 2,022,000 |
| | 12,923,000 |
| | 14,945,000 |
| | (1,168,000 | ) | | 2006 | | 3/2/2010 |
| King Street | Jacksonville, GA | 6,185,000 |
| | — |
| | 7,232,000 |
| | (283,000 | ) | | — |
| | 6,949,000 |
| | 6,949,000 |
| | (404,000 | ) | | 2007 | | 3/9/2010 |
| Deaconess Evansville Clinic Portfolio | Evansville, IN | 20,842,000 |
| | 2,109,000 |
| | 36,180,000 |
| | 15,000 |
| | 2,109,000 |
| | 36,195,000 |
| | 38,304,000 |
| | (2,266,000 | ) | | 1952-2006/1994 | | 3/23/2010 |
| Sugar Land II Medical Office Building | Sugar Land, TX | |
| | — |
| | 9,648,000 |
| | 80,000 |
| | — |
| | 9,728,000 |
| | 9,728,000 |
| | (720,000 | ) | | 1999 | | 3/23/2010 |
| East Cooper Medical Center | Mount Pleasant, SC | |
| | 2,073,000 |
| | 5,939,000 |
| | 2,000 |
| | 2,073,000 |
| | 5,941,000 |
| | 8,014,000 |
| | (476,000 | ) | | 1992 | | 3/31/2010 |
| Pearland Medical Portfolio | Pearland, TX | 2,318,000 |
| | 1,602,000 |
| | 7,017,000 |
| | 47,000 |
| | 1,602,000 |
| | 7,064,000 |
| | 8,666,000 |
| | (578,000 | ) | | 2003-2007 | | 3/31/2010 |
| Hilton Head Medical Portfolio | Hilton Head Island, SC | |
| | 1,333,000 |
| | 7,463,000 |
| | — |
| | 1,333,000 |
| | 7,463,000 |
| | 8,796,000 |
| | (440,000 | ) | | 1996-2010 | | 3/31/2010 |
| NIH @ Triad Technology Center | Baltimore, MD | 11,800,000 |
| | — |
| | 26,548,000 |
| | — |
| | — |
| | 26,548,000 |
| | 26,548,000 |
| | (1,276,000 | ) | | 1989 | | 3/31/2010 |
| Federal North Medical Office Building | Pittsburgh, PA | |
| | 2,489,000 |
| | 30,268,000 |
| | 8,000 |
| | 2,489,000 |
| | 30,276,000 |
| | 32,765,000 |
| | (1,481,000 | ) | | 1999 | | 4/29/2010 |
| Balfour Concord Portfolio | Denton,TX and Lewisville,TX | 4,454,000 |
| | 452,000 |
| | 11,384,000 |
| | — |
| | 452,000 |
| | 11,384,000 |
| | 11,836,000 |
| | (594,000 | ) | | 2000 | | 6/25/2010 |
| Cannon Park Place | Charleston, SC | |
| | 425,000 |
| | 8,651,000 |
| | — |
| | 425,000 |
| | 8,651,000 |
| | 9,076,000 |
| | (378,000 | ) | | 1998 | | 6/28/2010 |
| 7900 Fannin | Houston, TX | 22,383,000 |
| | — |
| | 34,764,000 |
| | 54,000 |
| | — |
| | 34,818,000 |
| | 34,818,000 |
| | (1,519,000 | ) | | 2005 | | 6/30/2010 |
| Overlook at Eagle’s Landing | Stockbridge, GA | 5,324,000 |
| | 638,000 |
| | 6,685,000 |
| | 34,000 |
| | 638,000 |
| | 6,719,000 |
| | 7,357,000 |
| | (363,000 | ) | | 2004 | | 7/15/2010 |
| Sierra Vista Medical Office Building | San Luis Obispo, CA | |
| | — |
| | 11,900,000 |
| | 1,160,000 |
| | — |
| | 13,060,000 |
| | 13,060,000 |
| | (575,000 | ) | | 2009 | | 8/4/2010 |
| Orlando Medical Portfolio | Orlando, FL | |
| | — |
| | 14,226,000 |
| | 329,000 |
| | — |
| | 14,555,000 |
| | 14,555,000 |
| | (722,000 | ) | | 1998-2000 | | 9/29/2010 |
| Santa Fe Medical Portfolio | Sante Fe, NM | 3,490,000 |
| | 1,539,000 |
| | 11,716,000 |
| | — |
| | 1,539,000 |
| | 11,716,000 |
| | 13,255,000 |
| | (497,000 | ) | | 1978/2010-1985/2004 | | 9/30/2010 |
| Rendina Medical Portfolio | Las Vegas, NV and Poughkeepsie, NY and St. Louis, MO and Tucson, AZ and Wellington, FL | 18,598,000 |
| | — |
| | 68,488,000 |
| | 524,000 |
| | — |
| | 69,012,000 |
| | 69,012,000 |
| | (2,493,000 | ) | | 2006-2008 | | 9/30/2010 |
| Allegheny HQ Building | Pittsburgh, PA | |
| | 1,514,000 |
| | 32,368,000 |
| | (19,000 | ) | | 1,514,000 |
| | 32,349,000 |
| | 33,863,000 |
| | (1,170,000 | ) | | 2002 | | 10/29/2010 |
| Raleigh Medical Center | Raleigh, NC | |
| | 1,281,000 |
| | 12,530,000 |
| | 259,000 |
| | 1,281,000 |
| | 12,789,000 |
| | 14,070,000 |
| | (552,000 | ) | | 1989 | | 11/12/2010 |
| Columbia Medical Portfolio | Albany, NY, and Latham, NY, and Temple Terrace, FL, Carmel NY, and N. Adams, MA | 98,055,000 |
| | 9,567,000 |
| | 160,696,000 |
| | 566,000 |
| | 9,567,000 |
| | 161,262,000 |
| | 170,829,000 |
| | (5,488,000 | ) | | 1964-2007 | | 11/19/2010 |
| Florida Orthopedic ASC | Temple Terrace, FL | |
| | 752,000 |
| | 4,211,000 |
| | — |
| | 752,000 |
| | 4,211,000 |
| | 4,963,000 |
| | (167,000 | ) | | 2001 | | 12/8/2010 |
| Select Medical LTACH | Augusta, GA and Dallas, TX and Orlando, FL, and Tallahassee, FL | |
| | 12,719,000 |
| | 76,186,000 |
| | — |
| | 12,719,000 |
| | 76,186,000 |
| | 88,905,000 |
| | (2,382,000 | ) | | 2006-2007 | | 12/17/2010 |
| Phoenix MOB Portfolio | Phoenix, AZ | 26,857,000 |
| | 1,058,000 |
| | 31,865,000 |
| | 868,000 |
| | 1,058,000 |
| | 32,733,000 |
| | 33,790,000 |
| | (1,280,000 | ) | | 1989-2004 | | 12/22/2010 |
| Medical Park of Cary | Cary, NC | |
| | 2,931,000 |
| | 19,855,000 |
| | 140,000 |
| | 2,931,000 |
| | 19,995,000 |
| | 22,926,000 |
| | (824,000 | ) | | 1996 | | 12/30/2010 |
| Holston Medical Portfolio | Bristol, TN |
|
|
| 492,000 |
|
| 16,374,000 |
|
|
|
|
| 492,000 |
|
| 16,374,000 |
|
| 16,866,000 |
|
| (509,000 | ) |
| 1983 |
| 3/24/2011 |
| Desert Ridge Portfolio | Phoenix, AZ |
|
|
| — |
|
| 27,738,000 |
|
| 60,000 |
|
|
|
|
| 27,798,000 |
|
| 27,798,000 |
|
| (235,000 | ) |
| 2004-2006 |
| 10/4/2011 |
| | | $ | 636,558,000 |
| | $ | 167,968,000 |
| | $ | 1,763,031,000 |
| | $ | 38,905,000 |
| | $ | 168,065,000 |
| | $ | 1,803,189,000 |
| | $ | 1,969,904,000 |
| | $ | (164,784,000 | ) | | | | |
|
| | | | | | | | | | | | | | | | | | | | | | | | | | | | | | |
| | | | | Initial Cost to Company | | Cost
Capitalized
Subsequent
to
Acquisition (a) | | Gross Amount at Which Carried at Close of Period | | | | | | | | |
| | | Encumbrances | | Land | | Buildings, Improvements and Fixtures | | | Land | | Buildings, Improvements and Fixtures | | Total (c) | | Accumulated Depreciation(f) | | Date of Construction | | Date Acquired | | Life on Which Building Depreciation in Income Statement is Computed (h) |
| Southpointe MOP | Indianapolis, IN | 8,791 |
| | 2,190 |
| | 7,548 |
| | 901 |
| | 2,190 |
| | 8,449 |
| | 10,639 |
| | (1,970 | ) | | 1996 | | 2007 | | 39 |
| Kokomo MOP | Kokomo, IN | — |
| | 1,779 |
| | 9,614 |
| | 483 |
| | 1,779 |
| | 10,097 |
| | 11,876 |
| | (2,387 | ) | | 1992 - 1994 | | 2007 | | 39 |
| Deaconess Clinic Gateway | Newburgh, IN | — |
| | — |
| | 10,952 |
| | (9 | ) | | — |
| | 10,943 |
| | 10,943 |
| | (1,303 | ) | | 2006 | | 2010 | | 39 |
| Zionsville MC | Zionsville, IN | — |
| | 655 |
| | 2,877 |
| | 430 |
| | 664 |
| | 3,298 |
| | 3,962 |
| | (813 | ) | | 1992 | | 2008 | | 39 |
| KS Doctors MOB | Overland Park, KS | — |
| | 1,808 |
| | 9,517 |
| | 850 |
| | 1,808 |
| | 10,367 |
| | 12,175 |
| | (2,150 | ) | | 1978 | | 2008 | | 39 |
| Nashoba Valley Med Center MOB | Ayer, MA | — |
| | — |
| | 5,529 |
| | 299 |
| | 299 |
| | 5,529 |
| | 5,828 |
| | (339 | ) | | 1976 - 2007 | | 2012 | | 31 |
| St. Elizabeth's Med Center | Brighton, MA | — |
| | — |
| | 20,929 |
| | 3,663 |
| | 1,379 |
| | 23,213 |
| | 24,592 |
| | (1,186 | ) | | 1965 - 1988 | | 2012 | | 31 |
| Good Samaritan Cancer Center | Brockton, MA | — |
| | — |
| | 4,171 |
| | 10 |
| | — |
| | 4,181 |
| | 4,181 |
| | (188 | ) | | 2007 | | 2012 | | 31 |
| Good Samaritan Med Center MOB | Brockton, MA | — |
| | — |
| | 11,716 |
| | 144 |
| | 144 |
| | 11,716 |
| | 11,860 |
| | (686 | ) | | 1980 | | 2012 | | 31 |
| Carney Hospital MOB | Dorchester, MA | — |
| | — |
| | 7,250 |
| | 530 |
| | 530 |
| | 7,250 |
| | 7,780 |
| | (423 | ) | | 1978 | | 2012 | | 31 |
| Norwood Hospital MOB | Fall River and Foxborough, MA | — |
| | — |
| | 9,489 |
| | 128 |
| | 2,295 |
| | 7,322 |
| | 9,617 |
| | (458 | ) | | 1930 - 2000 | | 2012 | | 31 |
| St. Anne's Hospital MOB | Fall River, MA | — |
| | — |
| | 9,304 |
| | 40 |
| | 40 |
| | 9,304 |
| | 9,344 |
| | (418 | ) | | 2011 | | 2012 | | 31 |
| Holy Family Hospital MOB | Methuen, MA | — |
| | — |
| | 4,502 |
| | 179 |
| | 168 |
| | 4,513 |
| | 4,681 |
| | (316 | ) | | 1988 | | 2012 | | 31 |
| N. Berkshire MOB | North Adams, MA | — |
| | — |
| | 7,259 |
| | 231 |
| | — |
| | 7,490 |
| | 7,490 |
| | (768 | ) | | 2002 | | 2011 | | 39 |
| Morton Hospital MOB | Taunton, MA | — |
| | — |
| | 15,317 |
| | 549 |
| | 502 |
| | 15,364 |
| | 15,866 |
| | (1,344 | ) | | 1988 | | 2012 | | 31 |
| Smyth MOB | Baltimore, MD | — |
| | — |
| | 7,760 |
| | 48 |
| | — |
| | 7,808 |
| | 7,808 |
| | (1,209 | ) | | 1984 | | 2009 | | 39 |
| Triad Tech Center | Baltimore, MD | 11,450 |
| | — |
| | 26,548 |
| | — |
| | — |
| | 26,548 |
| | 26,548 |
| | (2,734 | ) | | 1989 | | 2010 | | 39 |
| St. John Providence MOB | Novi, MI | — |
| | — |
| | 42,371 |
| | — |
| | — |
| | 42,371 |
| | 42,371 |
| | (3,283 | ) | | 2007 | | 2012 | | 39 |
| Fort Road MOB | St. Paul, MN | — |
| | 1,571 |
| | 5,786 |
| | 541 |
| | 1,571 |
| | 6,327 |
| | 7,898 |
| | (1,232 | ) | | 1981 | | 2008 | | 39 |
| Gallery Professional Building | St. Paul, MN | 5,793 |
| | 1,157 |
| | 5,009 |
| | 3,242 |
| | 1,157 |
| | 8,251 |
| | 9,408 |
| | (2,629 | ) | | 1979 | | 2007 | | 39 |
| Chesterfield Rehab Hospital | Chesterfield, MO | — |
| | 4,213 |
| | 27,900 |
| | 770 |
| | 4,313 |
| | 28,570 |
| | 32,883 |
| | (4,935 | ) | | 2007 | | 2007 | | 39 |
| BJC West County MOB | Creve Coeur, MO | — |
| | 2,242 |
| | 13,130 |
| | 571 |
| | 2,242 |
| | 13,701 |
| | 15,943 |
| | (2,722 | ) | | 1978 | | 2008 | | 39 |
| Winghaven MOB | O'Fallon, MO | — |
| | 1,455 |
| | 9,708 |
| | 514 |
| | 1,455 |
| | 10,222 |
| | 11,677 |
| | (2,104 | ) | | 2001 | | 2008 | | 39 |
| BJC MOB | St. Louis, MO | — |
| | 304 |
| | 1,552 |
| | — |
| | 304 |
| | 1,552 |
| | 1,856 |
| | (302 | ) | | 2001 | | 2008 | | 39 |
| Des Peres MAP II | St. Louis, MO | — |
| | — |
| | 11,386 |
| | 644 |
| | — |
| | 12,030 |
| | 12,030 |
| | (1,280 | ) | | 2007 | | 2010 | | 39 |
| San Martin MAP | Las Vegas, NV | — |
| | — |
| | 14,777 |
| | (155 | ) | | — |
| | 14,622 |
| | 14,622 |
| | (1,446 | ) | | 2007 | | 2010 | | 39 |
| Nutfield Professional Center | Derry, NH | — |
| | 1,075 |
| | 10,320 |
| | 745 |
| | 1,075 |
| | 11,065 |
| | 12,140 |
| | (1,716 | ) | | 1963 | | 2008 | | 39 |
| Santa Fe 1640 MOB | Santa Fe, NM | 3,348 |
| | 697 |
| | 4,268 |
| | 35 |
| | 697 |
| | 4,303 |
| | 5,000 |
| | (481 | ) | | 1985 | | 2010 | | 39 |
| Santa Fe 440 MOB | Santa Fe, NM | — |
| | 842 |
| | 7,448 |
| | 9 |
| | 842 |
| | 7,457 |
| | 8,299 |
| | (882 | ) | | 1978 | | 2010 | | 39 |
| Madison Ave MOB | Albany, NY | 1,871 |
| | 83 |
| | 2,759 |
| | 12 |
| | 83 |
| | 2,771 |
| | 2,854 |
| | (280 | ) | | 1964 | | 2010 | | 39 |
| Patroon Creek HQ | Albany, NY | 20,135 |
| | 1,870 |
| | 29,453 |
| | — |
| | 1,870 |
| | 29,453 |
| | 31,323 |
| | (2,827 | ) | | 2001 | | 2010 | | 39 |
Healthcare Trust of America, Inc.HEALTHCARE TRUST OF AMERICA, INC. AND HEALTHCARE TRUST OF AMERICA HOLDINGS, LP
SCHEDULE III — REAL ESTATE INVESTMENTS AND
ACCUMULATED DEPRECIATION — (Continued)
(a) The cost capitalized subsequent to acquisition is net of dispositions.
(b) The changes in total real estate for the years ended December 31, 2011, 2010 and 2009 are as follows:
|
| | | |
| | Amount |
| Balance as of December 31, 2008 | $ | 835,570,000 |
|
| Acquisitions | 363,679,000 |
|
| Additions | 7,556,000 |
|
| Dispositions | (327,000 | ) |
| Balance as of December 31, 2009 | 1,206,478,000 |
|
| Acquisitions | 683,055,000 |
|
| Additions | 13,358,000 |
|
| Dispositions | (305,000 | ) |
| Balance as of December 31, 2010 | 1,902,586,000 |
|
| Acquisitions | 55,017,000 |
|
| Additions | 19,157,000 |
|
| Dispositions | (5,506,000 | ) |
| Balance as of December 31, 2011 | $ | 1,971,254,000 |
|
|
| | | | | | | | | | | | | | | | | | | | | | | | | | | | | | |
| | | | | Initial Cost to Company | | Cost
Capitalized Subsequent to Acquisition (a) | | Gross Amount at Which Carried at Close of Period | | | | | | | | |
| | | Encumbrances | | Land | | Buildings, Improvements and Fixtures | | | Land | | Buildings, Improvements and Fixtures | | Total (c) | | Accumulated Depreciation(f) | | Date of Construction | | Date Acquired | | Life on Which Building Depreciation in Income Statement is Computed (h) |
| Patroon Creek MOB | Albany, NY | 22,616 |
| | 1,439 |
| | 27,639 |
| | 124 |
| | 1,439 |
| | 27,763 |
| | 29,202 |
| | (2,719 | ) | | 2007 | | 2010 | | 39 |
| Washington Ave MOB | Albany, NY & Scottsdale, AZ | — |
| | 1,699 |
| | 18,440 |
| | 184 |
| | 1,699 |
| | 18,624 |
| | 20,323 |
| | (2,075 | ) | | 1998 - 2000 | | 2010 | | 39 |
| Putnam MOB | Carmel, NY | 18,304 |
| | — |
| | 24,216 |
| | — |
| | — |
| | 24,216 |
| | 24,216 |
| | (2,055 | ) | | 2000 | | 2010 | | 39 |
| Capital Region Health Park | Latham, NY | — |
| | 2,305 |
| | 37,494 |
| | 564 |
| | 2,305 |
| | 38,058 |
| | 40,363 |
| | (3,900 | ) | | 2001 | | 2010 | | 39 |
| St. Francis MAP | Poughkeepsie, NY | — |
| | — |
| | 17,810 |
| | 1,363 |
| | — |
| | 19,173 |
| | 19,173 |
| | (2,296 | ) | | 2006 | | 2010 | | 39 |
| Medical Park of Cary | Cary, NC | — |
| | 2,931 |
| | 19,855 |
| | 1,041 |
| | 2,931 |
| | 20,896 |
| | 23,827 |
| | (2,440 | ) | | 1994 | | 2010 | | 39 |
| Raleigh Medical Center | Raleigh, NC | — |
| | 1,281 |
| | 12,530 |
| | 2,093 |
| | 1,281 |
| | 14,623 |
| | 15,904 |
| | (1,728 | ) | | 1989 | | 2010 | | 39 |
| Liberty Falls MP | Liberty, OH | — |
| | 842 |
| | 5,640 |
| | 624 |
| | 842 |
| | 6,264 |
| | 7,106 |
| | (1,519 | ) | | 2008 | | 2008 | | 39 |
| Lima MOP | Lima, OH | — |
| | 700 |
| | 19,053 |
| | 978 |
| | 700 |
| | 20,031 |
| | 20,731 |
| | (4,253 | ) | | 1970 - 2004 | | 2007 | | 39 |
| Market Exchange MOP | Columbus, OH | — |
| | 2,326 |
| | 17,207 |
| | 2,393 |
| | 2,326 |
| | 19,600 |
| | 21,926 |
| | (3,166 | ) | | 2001 - 2003 | | 2007 - 2010 | | 39 |
| Park Place MOP | Kettering, OH | — |
| | 1,987 |
| | 11,341 |
| | 1,212 |
| | 1,987 |
| | 12,553 |
| | 14,540 |
| | (3,186 | ) | | 1998 - 2002 | | 2007 | | 39 |
| Parma Ridge MOB | Parma, OH | — |
| | 372 |
| | 3,636 |
| | 595 |
| | 372 |
| | 4,231 |
| | 4,603 |
| | (856 | ) | | 1977 | | 2008 | | 39 |
| Deaconess MOP | Oklahoma City, OK | — |
| | — |
| | 25,975 |
| | 2,123 |
| | — |
| | 28,098 |
| | 28,098 |
| | (4,997 | ) | | 1991 - 1996 | | 2008 | | 39 |
| Monroeville MOB | Monroeville, PA | — |
| | 3,264 |
| | 7,038 |
| | 41 |
| | 3,264 |
| | 7,079 |
| | 10,343 |
| | (284 | ) | | 1985 - 1989 | | 2013 | | 39 |
| 2750 Monroe MOB | Norristown, PA | — |
| | 2,323 |
| | 22,631 |
| | 5,423 |
| | 2,323 |
| | 28,054 |
| | 30,377 |
| | (5,292 | ) | | 1985 | | 2007 | | 39 |
| Federal North MOB | Pittsburgh, PA | — |
| | 2,489 |
| | 30,268 |
| | 80 |
| | 2,489 |
| | 30,348 |
| | 32,837 |
| | (3,259 | ) | | 1999 | | 2010 | | 39 |
| Highmark Penn Ave | Pittsburgh, PA | — |
| | 1,774 |
| | 38,921 |
| | 141 |
| | 1,774 |
| | 39,062 |
| | 40,836 |
| | (2,536 | ) | | 1907 | | 2012 | | 39 |
| WP Allegheny HQ MOB | Pittsburgh, PA | — |
| | 1,514 |
| | 32,368 |
| | 330 |
| | 1,514 |
| | 32,698 |
| | 34,212 |
| | (3,068 | ) | | 2002 | | 2010 | | 39 |
| Cannon Park Place | Charleston, SC | — |
| | 425 |
| | 8,651 |
| | 44 |
| | 425 |
| | 8,695 |
| | 9,120 |
| | (884 | ) | | 1998 | | 2010 | | 39 |
| GHS Memorial | Greenville, SC | 4,269 |
| | — |
| | 8,301 |
| | 115 |
| | — |
| | 8,416 |
| | 8,416 |
| | (1,030 | ) | | 1992 | | 2009 | | 39 |
| GHS MMC | Greenville, SC | 21,859 |
| | 995 |
| | 39,158 |
| | 769 |
| | 995 |
| | 39,927 |
| | 40,922 |
| | (4,832 | ) | | 1987 - 1998 | | 2009 | | 39 |
| GHS MOBs I | Greenville, SC | — |
| | 1,644 |
| | 9,144 |
| | 505 |
| | 1,644 |
| | 9,649 |
| | 11,293 |
| | (1,300 | ) | | 1974 - 1990 | | 2009 | | 39 |
| GHS Patewood MOP | Greenville, SC | 34,164 |
| | — |
| | 64,537 |
| | 415 |
| | — |
| | 64,952 |
| | 64,952 |
| | (8,081 | ) | | 1983 - 2007 | | 2009 | | 39 |
| GHS Greer MOBs | Greenville, Travelers Res and Greer, SC & Scottsdale, AZ | 8,064 |
| | 1,309 |
| | 14,639 |
| | 13 |
| | 1,309 |
| | 14,652 |
| | 15,961 |
| | (1,830 | ) | | 1992 - 2008 | | 2009 | | 39 |
| Hilton Head Heritage MOP | Hilton Head Island, SC | — |
| | 1,125 |
| | 5,398 |
| | 3 |
| | 1,125 |
| | 5,401 |
| | 6,526 |
| | (757 | ) | | 1996 | | 2010 | | 39 |
| Hilton Head Moss Creek MOB | Hilton Head Island, SC | — |
| | 209 |
| | 2,066 |
| | — |
| | 209 |
| | 2,066 |
| | 2,275 |
| | (211 | ) | | 2010 | | 2010 | | 39 |
| East Cooper Medical Center | Mt. Pleasant, SC | — |
| | 2,073 |
| | 5,939 |
| | 197 |
| | 2,073 |
| | 6,136 |
| | 8,209 |
| | (1,008 | ) | | 1992 | | 2010 | | 39 |
| Mary Black MOB | Spartanburg,SC | — |
| | — |
| | 12,523 |
| | 65 |
| | — |
| | 12,588 |
| | 12,588 |
| | (1,901 | ) | | 2006 | | 2009 | | 39 |
| Lenox Office Park | Memphis, TN | 11,578 |
| | 1,670 |
| | 13,626 |
| | (795 | ) | | 1,670 |
| | 12,831 |
| | 14,501 |
| | (2,708 | ) | | 2000 | | 2007 | | 39 |
| Mountain Empire MOBs | Rogersville, Kingsport and Bristol, TN & Norton and Pennington Gap, VA | — |
| | 1,296 |
| | 36,523 |
| | 1,370 |
| | 1,296 |
| | 37,893 |
| | 39,189 |
| | (6,953 | ) | | 1976 - 2006 | | 2008 - 2011 | | 39 |
| Amarillo Hospital | Amarillo, TX | — |
| | 1,110 |
| | 17,688 |
| | 6 |
| | 1,110 |
| | 17,694 |
| | 18,804 |
| | (2,820 | ) | | 2007 | | 2008 | | 39 |
| Senior Care- Meadowview | Arlington, TX | — |
| | 350 |
| | 2,066 |
| | 15 |
| | 350 |
| | 2,081 |
| | 2,431 |
| | (480 | ) | | 1993 | | 2008 | | 39 |
| Austin Heart MOB | Austin,TX | 4,775 |
| | — |
| | 15,172 |
| | — |
| | — |
| | 15,172 |
| | 15,172 |
| | (38 | ) | | 1999 | | 2013 | | 39 |
HEALTHCARE TRUST OF AMERICA, INC. AND HEALTHCARE TRUST OF AMERICA HOLDINGS, LP
SCHEDULE III — REAL ESTATE AND ACCUMULATED DEPRECIATION — (Continued)
|
| | | | | | | | | | | | | | | | | | | | | | | | | | | | | | | | | | | | | | |
| | | | | Initial Cost to Company | | Cost
Capitalized
Subsequent
to
Acquisition (a) | | Gross Amount at Which
Carried at Close of Period | | | | | | | | |
| | | Encumbrances | | Land | | Buildings,
Improvements and
Fixtures | | | Land | | Buildings,
Improvements and
Fixtures | | Total (c) | | Accumulated
Depreciation(f) | | Date of Construction | | Date
Acquired | | Life on Which Building Depreciation in Income Statement is Computed (h) |
| Post Oak North MC | Austin,TX | — |
| | 887 |
| | 7,011 |
| | — |
| | 887 |
| | 7,011 |
| | 7,898 |
| | (45 | ) | | 2007 | | 2013 | | 39 |
| Texas A&M Health Science Center | Bryan, TX | — |
| | — |
| | 32,494 |
| | — |
| | — |
| | 32,494 |
| | 32,494 |
| | (843 | ) | | 2011 | | 2013 | | 39 |
| Dallas Rehab Hospital | Carrollton, TX | — |
| | 1,919 |
| | 16,341 |
| | — |
| | 1,919 |
| | 16,341 |
| | 18,260 |
| | (1,550 | ) | | 2006 | | 2010 | | 39 |
| Cedar Hill MOB | Cedar Hill, TX | — |
| | 778 |
| | 4,830 |
| | 113 |
| | 778 |
| | 4,943 |
| | 5,721 |
| | (972 | ) | | 2007 | | 2008 | | 39 |
| Corsicana MOB | Corsicana, TX | — |
| | — |
| | 6,781 |
| | — |
| | — |
| | 6,781 |
| | 6,781 |
| | (1,013 | ) | | 2007 | | 2009 | | 39 |
| Dallas LTAC Hospital | Dallas, TX | — |
| | 2,301 |
| | 20,627 |
| | — |
| | 2,301 |
| | 20,627 |
| | 22,928 |
| | (2,406 | ) | | 2007 | | 2009 | | 39 |
| Forest Park Pavilion | Dallas, TX | — |
| | 9,670 |
| | 11,152 |
| | 153 |
| | 9,670 |
| | 11,305 |
| | 20,975 |
| | (508 | ) | | 2010 | | 2012 | | 39 |
| Forest Park Tower | Dallas, TX | — |
| | 3,340 |
| | 35,071 |
| | 4 |
| | 3,340 |
| | 35,075 |
| | 38,415 |
| | (1,032 | ) | | 2011 | | 2013 | | 39 |
| Denton Med Rehab Hospital | Denton, TX | — |
| | 2,000 |
| | 11,704 |
| | — |
| | 2,000 |
| | 11,704 |
| | 13,704 |
| | (1,610 | ) | | 2008 | | 2009 | | 39 |
| Denton MOB | Denton, TX | — |
| | — |
| | 7,543 |
| | — |
| | — |
| | 7,543 |
| | 7,543 |
| | (874 | ) | | 2000 | | 2010 | | 39 |
| Forest Park Frisco MC | Frisco, TX | — |
| | 1,238 |
| | 19,979 |
| | 313 |
| | 1,238 |
| | 20,292 |
| | 21,530 |
| | (211 | ) | | 2012 | | 2013 | | 39 |
| Senior Care Galveston | Galveston, TX | — |
| | 966 |
| | 7,195 |
| | 6 |
| | 966 |
| | 7,201 |
| | 8,167 |
| | (1,219 | ) | | 1993 | | 2008 | | 39 |
| Greenville MOB | Greenville, TX | — |
| | 616 |
| | 10,822 |
| | 277 |
| | 616 |
| | 11,099 |
| | 11,715 |
| | (2,015 | ) | | 2007 | | 2008 | | 39 |
| 7900 Fannin MOB | Houston, TX | 21,898 |
| | — |
| | 34,764 |
| | 134 |
| | — |
| | 34,898 |
| | 34,898 |
| | (3,571 | ) | | 2005 | | 2010 | | 39 |
| Cypress Station MOB | Houston, TX | — |
| | 1,345 |
| | 8,312 |
| | 655 |
| | 1,345 |
| | 8,967 |
| | 10,312 |
| | (1,899 | ) | | 1981 | | 2008 | | 39 |
| Triumph Hospital NW | Houston, TX | — |
| | 1,377 |
| | 14,531 |
| | 239 |
| | 1,377 |
| | 14,770 |
| | 16,147 |
| | (3,710 | ) | | 1986 | | 2007 | | 39 |
| Lone Star Endoscopy MOB | Keller, TX | — |
| | 622 |
| | 3,502 |
| | (5 | ) | | 622 |
| | 3,497 |
| | 4,119 |
| | (661 | ) | | 2006 | | 2008 | | 39 |
| Lewisville MOB | Lewisville, TX | — |
| | 452 |
| | 3,841 |
| | — |
| | 452 |
| | 3,841 |
| | 4,293 |
| | (512 | ) | | 2000 | | 2010 | | 39 |
| Pearland MOB | Pearland, TX | — |
| | 1,602 |
| | 7,017 |
| | 9 |
| | 1,602 |
| | 7,026 |
| | 8,628 |
| | (1,114 | ) | | 2003 - 2007 | | 2010 | | 39 |
| Senior Care Port Arthur | Port Arthur, TX | — |
| | 521 |
| | 7,368 |
| | 4 |
| | 521 |
| | 7,372 |
| | 7,893 |
| | (1,296 | ) | | 1994 | | 2008 | | 39 |
| San Angelo MOB | San Angelo, TX | — |
| | — |
| | 3,907 |
| | — |
| | — |
| | 3,907 |
| | 3,907 |
| | (577 | ) | | 2007 | | 2009 | | 39 |
| Mtn Plains Pecan Valley | San Antonio, TX | — |
| | 416 |
| | 13,690 |
| | 993 |
| | 416 |
| | 14,683 |
| | 15,099 |
| | (2,247 | ) | | 1998 | | 2008 | | 39 |
| Sugar Land II MOB | Sugar Land, TX | — |
| | — |
| | 9,648 |
| | 154 |
| | — |
| | 9,802 |
| | 9,802 |
| | (1,654 | ) | | 1999 | | 2010 | | 39 |
| Triumph Hospital SW | Sugar Land, TX | — |
| | 1,670 |
| | 14,018 |
| | — |
| | 1,670 |
| | 14,018 |
| | 15,688 |
| | (3,542 | ) | | 1989 | | 2007 | | 39 |
| Senior Care Texas City | Texas City, TX | — |
| | 465 |
| | 7,744 |
| | 3 |
| | 465 |
| | 7,747 |
| | 8,212 |
| | (1,307 | ) | | 1993 | | 2008 | | 39 |
| Baylor MP | Waxahachie, TX | — |
| | 865 |
| | 6,728 |
| | 289 |
| | 865 |
| | 7,017 |
| | 7,882 |
| | (1,315 | ) | | 2006 | | 2008 | | 39 |
| Mtn Plains Clear Lake | Webster, TX | — |
| | 832 |
| | 21,168 |
| | 11 |
| | 832 |
| | 21,179 |
| | 22,011 |
| | (3,470 | ) | | 2006 | | 2008 | | 39 |
| N. Texas Neurology MOB | Wichita Falls, TX | — |
| | 736 |
| | 5,611 |
| | (6 | ) | | 736 |
| | 5,605 |
| | 6,341 |
| | (1,035 | ) | | 1957 | | 2008 | | 39 |
| Renaissance MC | Bountiful, UT | 18,599 |
| | 3,701 |
| | 24,442 |
| | 210 |
| | 3,701 |
| | 24,652 |
| | 28,353 |
| | (3,701 | ) | | 2004 | | 2008 | | 39 |
| Aurora - Franklin | Franklin, WI | — |
| | 945 |
| | 15,336 |
| | — |
| | 945 |
| | 15,336 |
| | 16,281 |
| | (2,817 | ) | | 2003 | | 2009 | | 39 |
| Aurora - Menomenee | Menomonee Falls, WI | — |
| | 1,055 |
| | 14,998 |
| | — |
| | 1,055 |
| | 14,998 |
| | 16,053 |
| | (3,123 | ) | | 1964 | | 2009 | | 39 |
| Aurora - Mequon | Mequon, WI | 9,568 |
| | 950 |
| | 19,027 |
| | — |
| | 950 |
| | 19,027 |
| | 19,977 |
| | (3,611 | ) | | 1992 - 2001 | | 2009 | | 39 |
| Aurora - Milwaukee | Milwaukee, WI | — |
| | 350 |
| | 5,508 |
| | — |
| | 350 |
| | 5,508 |
| | 5,858 |
| | (1,125 | ) | | 1983 | | 2009 | | 39 |
| Aurora - Richfield | Richfield, WI | — |
| | 255 |
| | 2,818 |
| | — |
| | 255 |
| | 2,818 |
| | 3,073 |
| | (707 | ) | | 1996 | | 2009 | | 39 |
| Total | | 403,676 |
| | 192,530 |
| | 2,263,032 |
| | 82,104 |
| | 197,892 |
| | 2,339,774 |
| | 2,537,666 |
| | (305,056 | ) | | | | | | |
| Assets held for sale | — |
| | 5,109 |
| | 17,961 |
| | 336 |
| | 5,109 |
| | 15,181 |
| | 20,290 |
| | — |
| | | | | | |
| Total real estate | | $ | 403,676 |
|
| $ | 197,639 |
|
| $ | 2,280,993 |
|
| $ | 82,440 |
|
| $ | 203,001 |
|
| $ | 2,354,955 |
|
| $ | 2,557,956 |
|
| $ | (305,056 | ) | | | | | | |
HEALTHCARE TRUST OF AMERICA, INC. AND HEALTHCARE TRUST OF AMERICA HOLDINGS, LP
SCHEDULE III — REAL ESTATE AND ACCUMULATED DEPRECIATION — (Continued)
| |
| (a) | The cost capitalized subsequent to acquisition is net of dispositions. |
| |
| (b) | The above table excludes lease intangibles, see (d) and (g). |
| |
| (c) | The changes in total real estate for the years ended December 31, 2013, 2012 and 2011 are as follows (in thousands): |
|
| | | | | | | | | | | |
| | Year Ended December 31, |
| | 2013 | | 2012 | | 2011 |
| Balance as of the beginning of the year | $ | 2,227,764 |
| | $ | 1,971,254 |
| | $ | 1,902,586 |
|
| Acquisitions | 308,229 |
| | 239,403 |
| | 55,017 |
|
| Additions | 27,787 |
| | 18,761 |
| | 19,157 |
|
| Dispositions | (2,707 | ) | | (1,654 | ) | | (5,506 | ) |
| Reclassification of accumulated depreciation for assets held for sale | (3,117 | ) | | — |
| | — |
|
| Balance as of the end of the year (d) | $ | 2,557,956 |
| | $ | 2,227,764 |
| | $ | 1,971,254 |
|
| |
| (d) | The balances as of December 31, 2013, 2012 and 2011 exclude gross lease intangibles of $410.2 million, $352.9 million and $320.4 million, respectively. |
| |
| (e) | The aggregate cost of our real estate for federal income tax purposes was $2,325,377,000.$3.1 billion. |
| |
(d)(f) | The changes in accumulated depreciation for the years ended December 31, 20112013, 20102012 and 20092011 are as follows:follows (in thousands): |
| | | | Amount | Year Ended December 31, |
| Balance as of December 31, 2008 | $ | 24,650,000 |
| |
| | | 2013 | | 2012 | | 2011 |
| Balance as of the beginning of the year | | $ | 235,157 |
| | $ | 164,783 |
| | $ | 105,123 |
|
| Additions | 32,189,000 |
| 75,656 |
| | 72,028 |
| | 65,158 |
|
| Dispositions | (150,000 | ) | (2,640 | ) | | (1,654 | ) | | (5,498 | ) |
| Balance as of December 31, 2009 | 56,689,000 |
| |
| Additions | 48,737,000 |
| |
| Dispositions | (303,000 | ) | |
| Balance as of December 31, 2010 | 105,123,000 |
| |
| Additions | 65,158,000 |
| |
| Dispositions | (5,497,000 | ) | |
| Balance as of December 31, 2011 | $ | 164,784,000 |
| |
| Reclassification of accumulated depreciation for assets held for sale | | (3,117 | ) | | — |
| | — |
|
| Balance as of the end of the year (g) | | $ | 305,056 |
| | $ | 235,157 |
| | $ | 164,783 |
|
| |
(e)(g) | The costbalances as of buildingDecember 31, 2013, 2012 and 2011 exclude accumulated amortization of lease intangibles of $136.1 million, $114.0 million and $88.6 million, respectively. |
| |
| (h) | Tenant improvements isare depreciated on a straight-line basis over the estimated useful lives of 39 years and the shorter of the lease term or useful life, ranging from one month to 240 months, respectively. Furniture, fixtures and equipment isare depreciated over five years. |
Healthcare Trust of America, Inc.HEALTHCARE TRUST OF AMERICA, INC. AND HEALTHCARE TRUST OF AMERICA HOLDINGS, LP
SCHEDULE IV —- MORTGAGE LOANS ON REAL ESTATE ASSETS
The following is a summary of our mortgage loans receivable as of December 31, 20112013 (in thousands):
|
| | | | | | | | | | | | | | | | | | | | | |
| Mortgage Loans | Description | | Security | | Interest Rate | | | | Maturity Date | | Periodic
Payment Terms(4) | | Face Amount of Mortgages | | Carrying
Amount of Mortgages |
| MacNeal Hospital Medical Office Building Berwyn, Illinois | Medical Office Building | | Property | | 10.95 | % | | (1 | ) | | 5/1/2012 | | I | | $ | 7,500,000 |
| | $ | 7,500,000 |
|
| MacNeal Hospital Medical Office Building Berwyn, Illinois | Medical Office Building | | Property | | 10.95 | % | | (1 | ) | | 5/1/2012 | | I | | 7,500,000 |
| | 7,500,000 |
|
| St. Luke’s Medical Office Building Phoenix, Arizona | Medical Office Building | | Property | | 10.85 | % | | (2 | ) | | 5/1/2012 | | I | | 3,750,000 |
| | 3,750,000 |
|
| St. Luke’s Medical Office Building Phoenix, Arizona | Medical Office Building | | Property | | 10.85 | % | | (2 | ) | | 5/1/2012 | | I | | 1,250,000 |
| | 1,250,000 |
|
| Rush Presbyterian Medical Office Building Oak Park, Illinois | Medical Office Building | | Property | | 7.76 | % | | (3 | ) | | 12/1/2014 | | I | | 41,150,000 |
| | 37,459,000 |
|
| Total | | | | | |
| | | | | | | | $ | 61,150,000 |
| | $ | 57,459,000 |
|
|
| | | | | | | | | | | | | | | | | | | |
| Description | | Interest Rate | | Maturity Date | | Periodic
Payment Terms | | Prior Liens | | Face Amount of Mortgages | | Carrying
Amount of Mortgages | | Principal Amount of Loans Subject to Delinquent Principal or Interest |
| Note receivable secured by medical office building in Illinois | | 10.95 | % | | 6/25/2014 | | (1) | | (3) | | $ | 7,500 |
| | $ | 7,500 |
| | (4) |
| Note receivable secured by medical office building in Illinois | | 10.95 |
| | 6/25/2014 | | (1) | | (3) | | 7,500 |
| | 7,500 |
| | (4) |
| Note receivable secured by medical office building in Arizona | | 10.85 |
| | 6/25/2014 | | (1) | | (3) | | 3,750 |
| | 3,750 |
| | (4) |
| Note receivable secured by medical office building in Arizona | | 10.85 |
| | 6/25/2014 | | (1) | | (3) | | 1,250 |
| | 1,250 |
| | (4) |
| Note receivable secured by medical office building in Florida | | 7.00 |
| | 10/1/2016 | | (2) | | (3) | | 4,262 |
| | 4,262 |
| | (4) |
| Note receivable secured by medical office building in Florida | | 7.00 |
| | 10/1/2016 | | (2) | | (3) | | 4,258 |
| | 4,258 |
| | (4) |
| | | |
| | | | | | | | $ | 28,520 |
| | $ | 28,520 |
| | |
| |
| (1) | The effective interest rate associatedInterest due monthly, with these notes as of December 31, 2011 is 8.77%.
principal due on maturity. |
| |
| (2) | Interest of 6% due monthly and borrower must pay $0.3 million of the principal on November 1, 2014. The effectiveremaining principal and the interest rate associated with these notes as of December 31, 2011that is 8.63%. not paid monthly is due on maturity. |
| |
| (3) | Represents an average interest rate for the lifeThere are no prior liens on any of the note with an effective interest rate of 8.60%.mortgage loans. |
| |
| (4) | I = Interest onlyNo mortgage loans are delinquent with respect to principal or interest. |
The following shows changes in the carrying amounts of mortgage loans receivableon real estate assets during the period:years ended December 31, 2013, 2012 and 2011 (in thousands):
|
| | | |
| Balance at December 31, 2010 | $ | 57,091,000 |
|
| Additions: | |
|
| New mortgage loans | — |
|
| Amortization of discount | 368,000 |
|
| Deductions: | |
|
| Collections of principal | — |
|
| Balance at December 31, 2011 | $ | 57,459,000 |
|
| |
(1) | See Note 4, Real Estate Notes Receivable, Net, to our accompanying consolidated financial statements for further discussion of the reversal of the previously-recognized amortization on this mortgage loan. |
|
| | | | | | | | | | | |
| | Year Ended December 31, |
| | 2013 | | 2012 | | 2011 |
| Balance as of the beginning of the year | $ | 20,000 |
| | $ | 57,459 |
| | $ | 57,091 |
|
| Additions: | | | | | |
| New mortgage loans | 8,520 |
| | — |
| | — |
|
| Amortization of discount and capitalized loan costs, net | — |
| | — |
| | 368 |
|
| Deductions: | | | | | |
| Mortgage loan included in the consideration for the acquisition of a building | — |
| | (37,264 | ) | | — |
|
| Write-off of capitalized closing costs | — |
| | (195 | ) | | — |
|
| Balance as of the end of the year | $ | 28,520 |
| | $ | 20,000 |
| | $ | 57,459 |
|
SIGNATURES
Pursuant to the requirements of Section 13 or 15(d) of the Securities Exchange Act of 1934, the registrant has duly caused this report to be signed on its behalf by the undersigned thereunto duly authorized.
|
| | | |
| | Healthcare Trust of America, Inc.HEALTHCARE TRUST OF AMERICA, INC. |
| | | |
| (Registrant)
| | |
ByBy: | /s/ Scott D. Peters | | Chief Executive Officer, President and Chairman of the Board (principal executive officer)
|
| | Scott D. Peters
| |
Date | March 26, 2012 | | |
ByDate: | February 25, 2014 | | |
| | | |
| By: | /s/ Kellie S. Pruitt | | Chief Financial Officer (principal financial officer and principal
accounting officer)
|
| | Kellie S. Pruitt
| | |
DateDate: | March 26, 2012February 25, 2014 | | |
| | | |
Pursuant to the requirements of the Securities Exchange Act of 1934, this report has been signed below by the following persons on behalf of the registrant and in the capacities and on the dates indicated.
|
| | | |
ByBy: | /s/ Scott D. Peters | | Chief Executive Officer, President and Chairman of the Board (principal executive officer)
(Principal Executive Officer) |
| | Scott D. Peters
| |
DateDate: | March 26, 2012February 25, 2014 | | |
By | | | |
| By: | /s/ Kellie S. Pruitt | | Chief Financial Officer (principal financial officer (Principal Financial Officer and principal
accounting officer)
Principal Accounting Officer) |
| | Kellie S. Pruitt
| |
DateDate: | March 26, 2012February 25, 2014 | | |
By | | | |
| By: | /s/ Maurice J. DeWald | | Director |
| | Maurice J. DeWald
| | |
DateDate: | March 26, 2012February 25, 2014 | | |
By | | | |
| By: | /s/ W. Bradley Blair, II | | Director |
| | W. Bradley Blair, II
| | |
DateDate: | March 26, 2012February 25, 2014 | | |
By | | | |
| By: | /s/ Warren D. Fix | | Director |
| | Warren D. Fix
| | |
DateDate: | March 26, 2012February 25, 2014 | | |
By | | | |
| By: | /s/ Larry L. Mathis | | Director |
| | Larry L. Mathis
| | |
DateDate: | March 26, 2012February 25, 2014 | | |
By | | | |
| By: | /s/ Gary T. Wescombe | | Director |
| | Gary T. Wescombe
| | |
DateDate: | March 26, 2012February 25, 2014 | | |
SIGNATURES
Pursuant to the requirements of the Securities Exchange Act of 1934, the registrant has duly caused this report to be signed on its behalf by the undersigned thereunto duly authorized.
|
| | | |
| HEALTHCARE TRUST OF AMERICA HOLDINGS, LP |
| | | |
| By: | HEALTHCARE TRUST OF AMERICA, INC., |
| its General Partner | | |
| | | |
| By: | /s/ Scott D. Peters | | Chief Executive Officer, President and Chairman |
| Scott D. Peters | | |
| Date: | February 25, 2014 | | |
| | | |
| By: | /s/ Kellie S. Pruitt | | Chief Financial Officer |
| Kellie S. Pruitt | | |
| Date: | February 25, 2014 | | |
Pursuant to the requirements of the Securities Exchange Act of 1934, this report has been signed below by the following persons on behalf of the registrant and in the capacities and on the dates indicated.
|
| | | |
| By: | /s/ Scott D. Peters | | Chief Executive Officer, President and Chairman (Principal Executive Officer) of Healthcare Trust of America, Inc., general partner of Healthcare Trust of America Holdings, LP |
| Scott D. Peters | |
| Date: | February 25, 2014 | | |
| | | |
| By: | /s/ Kellie S. Pruitt | | Chief Financial Officer (Principal Financial Officer and Principal Accounting Officer) of Healthcare Trust of America, Inc., general partner of Healthcare Trust of America Holdings, LP |
| Kellie S. Pruitt | |
| Date: | February 25, 2014 | | |
| | | |
| By: | /s/ Maurice J. DeWald | | Director of Healthcare Trust of America, Inc., general partner of Healthcare Trust of America Holdings, LP |
| Maurice J. DeWald | |
| Date: | February 25, 2014 | | |
| | | |
| By: | /s/ W. Bradley Blair, II | | Director of Healthcare Trust of America, Inc., general partner of Healthcare Trust of America Holdings, LP |
| W. Bradley Blair, II | |
| Date: | February 25, 2014 | | |
| | | |
| By: | /s/ Warren D. Fix | | Director of Healthcare Trust of America, Inc., general partner of Healthcare Trust of America Holdings, LP |
| Warren D. Fix | |
| Date: | February 25, 2014 | | |
| | | |
| By: | /s/ Larry L. Mathis | | Director of Healthcare Trust of America, Inc., general partner of Healthcare Trust of America Holdings, LP |
| Larry L. Mathis | |
| Date: | February 25, 2014 | | |
| | | |
| By: | /s/ Gary T. Wescombe | | Director of Healthcare Trust of America, Inc., general partner of Healthcare Trust of America Holdings, LP |
| Gary T. Wescombe | |
| Date: | February 25, 2014 | | |
EXHIBIT INDEX
Following the consummation of the merger of NNN Realty Advisors, Inc., which previously served as our sponsor, with and into a wholly owned subsidiary of Grubb & Ellis Company on December 7, 2007, NNN Healthcare/Office REIT, Inc., NNN Healthcare/Office REIT Holdings, L.P., NNN Healthcare/Office REIT Advisor, LLC and NNN Healthcare/Office Management, LLC changed their names to Grubb & Ellis Healthcare REIT, Inc., Grubb & Ellis Healthcare REIT Holdings, L.P.,LP, Grubb & Ellis Healthcare REIT Advisor, LLC, and Grubb & Ellis Healthcare Management, LLC, respectively.
Following the Registrant’s transition to self-management, on August 24, 2009, Grubb & Ellis Healthcare REIT, Inc. and Grubb & Ellis Healthcare REIT Holdings, L.P.LP changed their names to Healthcare Trust of America, Inc. and Healthcare Trust of America Holdings, LP, respectively.
The following Exhibit List refers to the entity names used prior to such name changes in order to accurately reflect the names of the parties on the documents listed.
Pursuant to Item 601(a)(2) of Regulation S-K, this Exhibit Index immediately precedes the exhibits.
The following exhibits are included, or incorporated by reference, in this Annual Report on Form 10-K for the fiscal year ended December 31, 20112013 (and are numbered in accordance with Item 601 of Regulation S-K).
|
| | | |
| 3.1 |
| | Fourth Articles of Amendment and Restatement (included as Exhibit 3.1 to our Current Report on Form 8-K filed on December 20,22, 2010 and incorporated herein by reference). |
| 3.2 |
| | Bylaws of NNN Healthcare/Office REIT, Inc. (included as Exhibit 3.2 to our Registration Statement on Form S-11 (Commission File. No. 333-133652) filed on April 28, 2006 and incorporated herein by reference). |
| 3.3 |
| | Amendment to the Bylaws of Grubb & Ellis Healthcare REIT, Inc., effective April 21, 2009 (included as Exhibit 3.4 to Post-Effective Amendment No. 11 to our Registration Statement on Form S-11 (File No. 333-133652) filed on April 21, 20092009. |
| 3.4 |
| | Amendment to the Bylaws of Grubb & Ellis Healthcare REIT, Inc., effective January 1, 2011 (included as Exhibit 3.2 to our Current Report on Form 8-K filed August 27, 2009 and incorporated herein by reference). |
4.13.5 |
| | Amended and Restated Bylaws of Healthcare Trust of America, Inc. Share Repurchase Plan,, effective August 25, 2008December 19, 2012 (included as Exhibit C3.1 to our Post-Effective Amendment No. 14 to theCurrent Report on Form S-118-K filed on October 23, 2009December 19, 2012 and incorporated herein by reference). |
4.23.6 |
| | Healthcare Trust of America, Inc. Distribution Reinvestment Plan, effective September 20, 2006 (included as Exhibit B to our Post-Effective Amendment No. 14 to the Form S-11 filed on October 23, 2009 and incorporated herein by reference) |
10.1 |
| | AgreementCertificate of Limited Partnership of NNN Healthcare/Office REIT Holdings, L.P. (included as Exhibit 10.2 to our Quarterly Report on Form 10-Q for the quarter ended September 30, 2006 and incorporated herein by reference) |
10.23.7 |
Certificate of Correction to Certificate of Limited Partnership of NNN Healthcare/Office REIT Holdings, L.P. |
| 3.8 | Certificate of Amendment to Certificate of Limited Partnership of NNN Healthcare/Office REIT Holdings, L.P. |
| 3.9 | Amendment No. 1 to Agreementthe Certificate of Limited Partnership of NNN Healthcare/Office REIT Holdings, L.P. |
| 3.10 | Certificate of Amendment to Certificate of Limited Partnership of Grubb & Ellis Healthcare REIT Holdings, LP. |
| 3.11 | Certificate of Amendment to Certificate of Limited Partnership of Healthcare Trust of America Holdings, LP. |
| 3.12 | Amended and Restated Agreement of Limited Partnership of Healthcare Trust of America Holdings, LP (included as Exhibit 10.210.1 to Healthcare Trust of America, Inc.'s Current Report on Form 8-K filed December 21, 2012 and incorporated herein by reference). |
| 4.1 | Indenture, dated March 28, 2013, among Healthcare Trust of America Holdings, LP, Healthcare Trust of America, Inc. and U.S. Bank National Association, as trustee, including the form of 3.70% Senior Notes due 2013 and the guarantee thereof (included as Exhibit 4.1 to our Current Report on Form 8-K filed on November 19, 2008March 28, 2013 and incorporated herein by reference). |
10.3 |
| | Amendment No. 2 to Agreement of Limited Partnership of Grubb & Ellis Healthcare REIT Holdings, LP by Healthcare Trust of America, Inc. (formerly known as Grubb & Ellis Healthcare REIT, Inc.) dated as of August 24, 2009 (included as Exhibit 10.1 to our Current Report on Form 8-K filed August 27, 2009 and incorporated herein by reference) |
10.4† |
| 10.1† | NNN Healthcare/Office REIT, Inc. 2006 Incentive Plan (including the 2006 Independent Directors Compensation Plan) (included as Exhibit 10.3 to our Registration Statement on Form S-11 (Commission File No. 333-133652) filed on April 28, 2006 and incorporated herein by reference). |
10.5† |
| 10.2† | Amendment to the NNN Healthcare/Office REIT, Inc. 2006 Incentive Plan (including the 2006 Independent Directors Compensation Plan) (included as Exhibit 10.4 to Amendment No. 6 to our Registration Statement on Form S-11 (Commission File No. 333-133652) filed on September 12, 2006 and incorporated herein by reference). |
|
10.6† |
|
| 10.3† | Amendment to the Grubb & Ellis Healthcare REIT, Inc. 2006 Independent Directors’ Compensation Plan, effective January 1, 2009 (included as Exhibit 10.68 in our Annual Report ofon Form 10-K filed March 27, 2009 and incorporated herein by reference). |
10.7† |
| 10.4† | Amendment to the Healthcare Trust of America, Inc. 2006 Independent Directors Compensation Plan, effective as of May 20, 2010 (included as Exhibit 10.1 to our Quarterly Report on Form 10-Q filed August 16, 2010 and incorporated herein by reference). |
10.8† |
| 10.5† | Healthcare Trust of America, Inc. Amended and Restated 2006 Incentive Plan, dated February 24, 2011 (included as Exhibit 10.1 to our Current Report on Form 8-K filed March 2, 2011 and incorporated herein by reference). |
|
| | | |
10.9† |
| 10.6† | Employment Agreement between Grubb & Ellis Healthcare REIT, Inc. and Scott D. Peters, effective as of July 1, 2009 (included as Exhibit 10.1 to our Current Report on Form 8-K filed July 8, 2009 and incorporated herein by reference). |
10.10† |
| 10.7† | Amendment to Employment Agreement with Scott D. Peters, effective as of May 20, 2010 (included as Exhibit 10.2 to our Quarterly Report on Form 10-Q filed August 16, 2010 and incorporated herein by reference). |
10.11† |
| 10.8† | Employment Agreement between Grubb & Ellis Healthcare REIT, Inc. and Mark Engstrom, effective as of July 1, 2009 (included as Exhibit 10.2 to our Current Report on Form 8-K filed July 8, 2009 and incorporated herein by reference). |
10.12† |
| 10.9† | Employment Agreement between Grubb & Ellis Healthcare REIT, Inc. and Kellie S. Pruitt effective as of July 1, 2009 (included as Exhibit 10.3 to our Current Report on Form 8-K filed July 8, 2009 and incorporated herein by reference). |
10.13 |
| 10.10 | Form of Amended and Restated Indemnification Agreement executed by Scott D. Peters, W. Bradley Blair, II, Maurice J. DeWald, Warren D. Fix, Larry L. Mathis and Gary T. Wescombe (included as Exhibit 10.1 to our Current Report on Form 8-K filed December 20,22, 2010 and incorporated herein by reference). |
10.14 |
| 10.11 | Form of Indemnification Agreement executed by Kellie S. Pruitt and Mark D. Engstrom (included as Exhibit 10.2 to our Current Report on Form 8-K filed December 20,22, 2010 and incorporated herein by reference). |
10.15 |
| 10.12 | Purchase and Sale Agreement by and between Greenville Hospital System and HTA Greenville, LLC, dated July 15, 2009 (included as Exhibit 10.1 to our Current Report on Form 8-K filed July 16, 2009 and incorporated herein by reference). |
10.16 |
| 10.13 | First Amendment to Purchase and Sale Agreement by and between Greenville Hospital System and HTA Greenville, LLC, dated August 14, 2009 (included as Exhibit 10.1 to our Current Report on Form 8-K filed August 20, 2009 and incorporated herein by reference). |
10.17 |
| 10.14 | Second Amendment to Agreement of Sale and Purchase by and between Greenville Hospital System and HTA Greenville, LLC, dated August 21, 2009 (included as Exhibit 10.2 to our Current Report on Form 8-K filed August 27, 2009 and incorporated herein by reference). |
10.18 |
| 10.15 | Third Amendment to Agreement of Sale and Purchase by and between Greenville Hospital System and HTA Greenville, LLC, dated August 26, 2009 (included as Exhibit 10.3 to our Current Report on Form 8-K filed August 27, 2009 and incorporated herein by reference). |
10.19 |
| 10.16 | Fourth Amendment to Agreement of Sale and Purchase by and between Greenville Hospital System and HTA — Greenville, LLC, dated September 4, 2009 (included as Exhibit 10.1 to our Current Report on Form 8-K filed September 11, 2009 and incorporated herein by reference). |
10.20 |
| 10.17 | Future Development Agreement by and between HTA — Greenville, LLC and Greenville Hospital System, dated September 9, 2009 (included as Exhibit 10.1 to our Current Report on Form 8-K filed September 22, 2009 and incorporated herein by reference). |
10.21 |
| 10.18 | Right of First Opportunity by and between HTA — Greenville, LLC and Greenville Hospital System, dated September 9, 2009 (included as Exhibit 10.2 to our Current Report on Form 8-K filed September 22, 2009 and incorporated herein by reference) |
10.22 |
| | Credit Agreement by and among Healthcare Trust of America Holdings, LP, Healthcare Trust of America, Inc., JPMorgan Chase Bank, N.A., Wells Fargo Bank, N.A., Deutsche Bank Securities Inc., U.S. Bank National Association and Fifth Third Bank and the Lenders Party Hereto, dated November 22, 2010 (included as Exhibit 10.1 to our Current Report on Form 8-K filed November 23, 2010 and incorporated herein by reference). |
10.23 |
| | Guaranty for the benefit of JPMorgan Chase Bank, N.A. dated November 22, 2010 by Healthcare Trust of America, Inc. and certain Subsidiaries of Healthcare Trust of America, Inc. named therein (included as Exhibit 10.2 to our Current Report on Form 8-K filed November 23, 2010 and incorporated herein by reference). |
10.24 |
| 10.19 | Purchase and Sale Agreement dated October 26, 2010 by and between COLUMBIA NAH GROUP, LLC and HTA — NORTHERN BERKSHIRE, LLC (included as Exhibit 10.7 to Post-Effective Amendment No. 1 to the Company’s Form S-11 Registration Statement (Commission File No. 333-158418), filed on December 27, 2010 and incorporated herein by reference). |
10.25 |
| 10.20 | Purchase and Sale Agreement dated October 26, 2010 by and between COLUMBIA 90 ASSOCIATES, LLC and HTA — REGION HEALTH, LLC (included as Exhibit 10.8 to Post-Effective Amendment No. 1 to the Company’s Form S-11 Registration Statement (Commission File No. 333-158418), filed on December 27, 2010 and incorporated herein by reference). |
10.26 |
|
|
| 10.21 | Purchase and Sale Agreement dated October 26, 2010 by and between WASHINGTON AVE. CAMPUS, LLC and HTA — 1223 WASHINGTON, LLC (included as Exhibit 10.9 to Post-Effective Amendment No. 1 to the Company’s Form S-11 Registration Statement (Commission File No. 333-158418), filed on December 27, 2010 and incorporated herein by reference). |
|
| | | |
10.27 |
| 10.22 | Purchase and Sale Agreement dated October 26, 2010 by and between COLUMBIA TEMPLE TERRACE, LLC and HTA — 13020 TELECOM, LLC (included as Exhibit 10.10 to Post-Effective Amendment No. 1 to the Company’s Form S-11 Registration Statement (Commission File No. 333-158418), filed on December 27, 2010 and incorporated herein by reference). |
10.28 |
| 10.23 | Purchase and Sale Agreement dated October 26, 2010 by and between PATROON CREEK BLVD, LLC and HTA — PATROON CREEK, LLC (included as Exhibit 10.11 to Post-Effective Amendment No. 1 to the Company’s Form S-11 Registration Statement (Commission File No. 333-158418), filed on December 27, 2010 and incorporated herein by reference). |
10.29 |
| 10.24 | Purchase and Sale Agreement dated October 26, 2010 by and between COLUMBIA PHC GROUP, LLC and HTA — PUTNAM CENTER, LLC (included as Exhibit 10.12 to Post-Effective Amendment No. 1 to the Company’s Form S-11 Registration Statement (Commission File No. 333-158418), filed on December 27, 2010 and incorporated herein by reference). |
10.30 |
| 10.25 | Purchase and Sale Agreement dated October 26, 2010 by and between PINSTRIPES, LLC and HTA — 1092 MADISON, LLC (included as Exhibit 10.13 to Post-Effective Amendment No. 1 to the Company’s Form S-11 Registration Statement (Commission File No. 333-158418), filed on December 27, 2010 and incorporated herein by reference). |
10.31 |
| 10.26 | Purchase and Sale Agreement dated October 26, 2010 by and between COLUMBIA WASHINGTON VENTURES, LLC and HTA — WASHINGTON MEDICAL ARTS I, LLC (included as Exhibit 10.14 to Post-Effective Amendment No. 1 to the Company’s Form S-11 Registration Statement (Commission File No. 333-158418), filed on December 27, 2010 and incorporated herein by reference). |
10.32 |
| 10.27 | Purchase and Sale Agreement dated October 26, 2010 by and between 1375 ASSOCIATES, LLC, ERLY REALTY DEVELOPMENT, INC, and HTA — WASHINGTON MEDICAL ARTS II, LLC (included as Exhibit 10.15 to Post-Effective Amendment No. 1 to the Company’s Form S-11 Registration Statement (Commission File No. 333-158418), filed on December 27, 2010 and incorporated herein by reference). |
10.3310.28 |
| | Amendment No. 1 to Credit Agreement by and among Healthcare Trust of America Holdings, LP, Healthcare Trust of America, Inc., Compass Bank, The Bank of Nova Scotia, UnionJPMorgan Chase Bank, N.A., as administrative agent, Wells Fargo Bank, N.A. and Sumitomo Mitsui Banking CorporationDeutsche Bank Securities Inc., as syndication agents, U.S. Bank National Association, Fifth Third Bank, Capital One, N.A., Regions Bank, and Compass Bank, as documentation agents, and the Lenders Party Hereto dated May 13, 2011March 29, 2012 (included as Exhibit 10.1 to our Current Report on Form 8-K filed May 16, 2011on April 2, 2012 and incorporated herein by reference)
. |
| 10.29 | Guaranty by Healthcare Trust of America, Inc. for the benefit of JPMorgan Chase Bank, N.A., as administrative agent, the Lenders, the Issuing Bank and the Swingline Lender dated March 29, 2012 (included as Exhibit 10.2 to our Current Report on Form 8-K filed on April 2, 2012 and incorporate herein by reference). |
| 10.30 | Leasehold Purchase and Sale Agreement is made and entered into as of March 9, 2012, by and between Steward Health Care System LLC and Healthcare Trust of America, Inc. (included as Exhibit 10.3 to our Quarterly Report on Form 10-Q filed May 15, 2012 and incorporated herein by reference). |
| 10.31† | Employment Agreement between Healthcare Trust of America, Inc. and Amanda Houghton effective as of March 24, 2011 (included as Exhibit 10.4 to our Quarterly Report on Form 10-Q filed May 15, 2012 and incorporated herein by reference). |
| 10.32 | Amended and Restated Agreement of Limited Partnership of Healthcare Trust of America Holdings, LP (included as Exhibit 10.1 to our Current Report on Form 8-K filed on May 18, 2012 and incorporated herein by reference). |
| 10.33† | Form of LTIP Award Agreement (CEO Version) (included as Exhibit 10.2 to our Current Report on Form 8-K filed on May 18, 2012 and incorporated herein by reference). |
| 10.34† | Form of LTIP Award Agreement (Executive Version) (included as Exhibit 10.3 to our Current Report on Form 8-K filed on May 18, 2012 and incorporated herein by reference). |
| 10.35† | Form of LTIP Award Agreement (Director Version) (included as Exhibit 10.4 to our Current Report on Form 8-K filed on May 18, 2012 and incorporated herein by reference). |
| 10.36† | Amendment to Employment Agreement with Scott D. Peters, effective as of May 16, 2012 (included as Exhibit 10.5 to our Current Report on Form 8-K filed on May 18, 2012 and incorporated herein by reference). |
| 10.37† | Amendment to Employment Agreement with Kellie S. Pruitt, effective as of May16, 2012 (included as Exhibit 10.6 to our Current Report on Form 8-K filed on May 18, 2012 and incorporated herein by reference). |
| 10.38† | Amendment to Employment Agreement with Mark D. Engstrom, effective as of May 16, 2012 (included as Exhibit 10.7 to our Current Report on Form 8-K filed on May 18, 2012 and incorporated herein by reference). |
|
| |
| 10.39 | Credit Agreement by and among Healthcare Trust of America Holdings, LP, Wells Fargo Bank, N.A., as administrative agent, Wells Fargo Securities, LLC, as lead arranger, and the Lenders Party Hereto, dated July 20, 2012 (included as Exhibit 10.8 to our Quarterly Report on Form 10-Q filed on August 9, 2012 and incorporated herein by reference). |
21.1*10.40 | Guaranty by Healthcare Trust of America, Inc. in favor of Wells Fargo Bank, N.A., as administrative agent dated July 20, 2012 (included as Exhibit 10.9 to our Quarterly Report on Form 10-Q filed on August 9, 2012 and incorporated herein by reference). |
| 10.41 | SubsidiariesAmended and Restated Agreement of Limited Partnership of Healthcare Trust of America Holdings, LP (included as Exhibit 10.1 to our Current Report on Form 8-K filed December 21, 2012 and incorporated herein by reference). |
| 10.42† | Amended and Restated Employment Agreement between Healthcare Trust of America, Inc. and Scott D. Peters, effective January 1, 2013 (included as Exhibit 10.45 to our Annual Report on Form 10-K filed on March 1, 2013 and incorporated herein by reference). |
| 10.43† | Amended and Restated Employment Agreement between Healthcare Trust of America, Inc. and Kellie S. Pruitt, effective January 1, 2013 (included as Exhibit 10.46 to our Annual Report on Form 10-K filed on March 1, 2013 and incorporated herein by reference). |
| 10.44† | Amended and Restated Employment Agreement between Healthcare Trust of America, Inc. and Mark Engstrom, effective January 1, 2013 (included as Exhibit 10.47 to our Annual Report on Form 10-K filed on March 1, 2013 and incorporated herein by reference). |
| 10.45† | Amended and Restated Employment Agreement between Healthcare Trust of America, Inc. and Amanda Houghton, effective January 1, 2013 (included as Exhibit 10.48 to our Annual Report on Form 10-K filed on March 1, 2013 and incorporated herein by reference). |
| 10.46 | Form of Indemnification Agreement executed by Amanda Houghton (included as Exhibit 10.49 to our Annual Report on Form 10-K filed on March 1, 2013 and incorporated herein by reference). |
| 10.47 | Form of Indemnification Agreement executed by Robert Milligan (included as Exhibit 10.50 to our Annual Report on Form 10-K filed on March 1, 2013 and incorporated herein by reference). |
| 10.48 | Amendment No. 1 to Revolving Credit and Term Loan Agreement (included as Exhibit 10.1 to our Current Report on Form 8-K filed on March 13, 2013 and incorporated herein by reference). |
| 10.49 | Purchase Agreement, dated March 21, 2013, among Healthcare Trust of America Holdings, LP, Healthcare Trust of America, Inc., Wells Fargo Securities, LLC, J.P. Morgan Securities LLC and U.S. Bancorp Investments, Inc. (included as Exhibit 10.1 to our Current Report on Form 8-K filed on March 27, 2013 and incorporated herein by reference). |
| 10.50 | Registration Rights Agreement, dated March 28, 2013, among Healthcare Trust of America Holdings, LP, Healthcare Trust of America, Inc., Wells Fargo Securities, LLC, J.P. Morgan Securities LLC and U.S. Bancorp Investments, Inc.(included as Exhibit 4.2 to our Current Report on Form 8-K filed on March 28, 2013 and incorporated herein by reference). |
| 10.51 | Amendment No. 2 to Revolving Credit and Term Loan Agreement (included as Exhibit 10.1 to our Current Report on Form 8-K filed on January 9, 2014 and incorporated herein by reference). |
| 10.52 | Term Loan Note (included as Exhibit 10.2 to our Current Report on Form 8-K filed on January 9, 2014 and incorporated herein by reference). |
| 10.53 | First Modification to Credit Agreement (included as Exhibit 10.3 to our Current Report on Form 8-K filed on January 9, 2014 and incorporated herein by reference). |
| 10.54 | Equity Distribution Agreement, dated November 1, 2013, among Healthcare Trust of America, Inc., Healthcare Trust of America Holdings, LP and Wells Fargo Securities, LLC (included as Exhibit 1.1 to our Current Report on Form 8-K filed on November 1, 2013 and incorporated herein by reference). |
| 12.1* | Statement Regarding Computation of Ratio of Earnings to Fixed Charges. |
| 21.1* | Subsidiaries |
| 23.1* | | Consent of Independent Registered Public Accounting FirmFirm. |
| 31.1* | | Certification of Chief Executive Officer, pursuant to Section 302 of the Sarbanes-Oxley Act of 2002 for Healthcare Trust of America, Inc. |
| 31.2* | | Certification of Chief Financial Officer, pursuant to Section 302 of the Sarbanes-Oxley Act of 2002 for Healthcare Trust of America, Inc. |
| 31.3* | Certification pursuant to Section 302 of the Sarbanes-Oxley Act of 2002 for Healthcare Trust of America Holdings, LP. |
| 31.4* | Certification pursuant to Section 302 of the Sarbanes-Oxley Act of 2002 for Healthcare Trust of America Holdings, LP. |
|
| |
| 32.1* | * | Certification of Chief Executive Officer, pursuant to 18 U.S.C. Section 1350, as created by Section 906 of the Sarbanes-Oxley Act of 2002 for Healthcare Trust of America Inc. |
| 32.2* | * | Certification of Chief Financial Officer, pursuant to 18 U.S.C. Section 1350, as created by Section 906 of the Sarbanes-Oxley Act of 2002 for Healthcare Trust of America, Inc. |
| 32.3** | Certification of Chief Executive Officer, pursuant to 18 U.S.C. Section 1350, as created by Section 906 of the Sarbanes-Oxley Act of 2002 for Healthcare Trust of America Holdings, LP. |
| 32.4** | Certification of Chief Financial Officer, pursuant to 18 U.S.C. Section 1350, as created by Section 906 of the Sarbanes-Oxley Act of 2002 for Healthcare Trust of America Holdings, LP. |
101.INS** | | XBRL Instance Document |
101.SCH** | | XBRL TaxomonyTaxonomy Extension Schema Document |
101.CAL** | | XBRL TaxomonyTaxonomy Extension Calculation Linkbase Document |
101.LAB** | 101.DEF* | XBRL Taxonomy Extension LabelsDefinition Linkbase Document |
101.PRE**101.LAB* | XBRL Taxonomy Extension Label Linkbase Document |
| 101.PRE* | XBRL Taxonomy Extension Presentation Linkbase Document |
101.DEF** | | XBRL Taxonomy Extension Definition Linkbase Document |
|
| | |
| * | | Filed herewith. |
| ** | | Furnished herewith. |
| † | | Compensatory plan or arrangement. |
| |