UNITED STATES
SECURITIES AND EXCHANGE COMMISSION
Washington, D.C. 20549
FORM 10-K
|
| |
| (Mark One) | |
| ý | ANNUAL REPORT PURSUANT TO SECTION 13 OR 15(d) OF THE SECURITIES EXCHANGE ACT OF 1934 |
FOR THE FISCAL YEAR ENDED DECEMBER 28, 201331, 2016 |
| OR |
| o | TRANSITION REPORT PURSUANT TO SECTION 13 OR 15(d) OF THE SECURITIES EXCHANGE ACT OF 1934 |
| FOR THE TRANSITION PERIOD FROM TO |
Commission File No. 001-15943
CHARLES RIVER LABORATORIES INTERNATIONAL, INC.
(Exact Name of Registrant as Specified in Its Charter)
|
| | |
| Delaware | | 06-1397316 |
(State or Other Jurisdiction of Incorporation or Organization) | | (I.R.S. Employer Identification No.) |
251 Ballardvale Street Wilmington, Massachusetts | | 01887 |
| (Address of Principal Executive Offices) | | 01887
(Zip Code) |
(Registrant'sRegistrant’s telephone number, including area code):(781) 222-6000
Securities registered pursuant to Section 12(b) of the Act:
|
| | |
| Title of each class | | Name of each exchange on which registered |
| Common Stock, $0.01 par value | | New York Stock Exchange |
Securities registered pursuant to Section 12(g) of the Act: None
Indicate by check mark whether the registrant is a well-known seasoned issuer, as defined in Rule 405 of the Securities Act. Yes ý No o
Indicate by check mark if the registrant is not required to file reports pursuant to Section 13 or Section 15(d) of the Act. Yes o No ý
Indicate by check mark whether the Registrant (1) has filed all reports required to be filed by Section 13 or 15(d) of the Securities Exchange Act of 1934 during the preceding 12 months (or for such shorter period that the Registrant was required to file such reports), and (2) has been subject to such filing requirements for the past 90 days. Yes ý No o
Indicate by check mark whether the registrant has submitted electronically and posted on its corporate Website, if any, every Interactive DateData File required to be submitted and posted pursuant to Rule 405 of Regulation S-T (§ 232.405 of this chapter) during the preceding 12 months (or for such shorter period that the registrant was required to submit and post such files.) Yes ý No o
Indicate by check mark if disclosure of delinquent filers pursuant to Item 405 of Regulation S-K is not contained herein, and will not be contained, to the best of the Registrant'sRegistrant’s knowledge, in definitive proxy or information statements incorporated by reference in Part III of this Form 10-K or any amendment to this Form 10-K. ý
Indicate by check mark whether the Registrant is a large accelerated filer, an accelerated filer, a non-accelerated filer, or a smaller reporting company. See the definitions of "large“large accelerated filer," "accelerated filer"” “accelerated filer” and "smaller“smaller reporting company"company” in Rule 12b-2 of the Exchange Act.
|
| | | | | | |
Large accelerated filer ý | | Accelerated filer o | | Non-accelerated filer o (Do not check if smaller reporting company) | | Smaller reporting company o |
Indicate by check mark whether the registrant is a shell company (as defined in Rule 12b-2 of the Exchange Act). Yes o No ý
On June 29, 2013,25, 2016, the aggregate market value of the Registrant'sRegistrant’s voting common stock held by non-affiliates of the Registrant was approximately $2,012,149,235.$3,735,593,230. As of February 16, 2014,January 27, 2017, there were 47,659,40047,372,995 shares of the Registrant'sRegistrant’s common stock outstanding, $0.01 par value per share.
DOCUMENTS INCORPORATED BY REFERENCE
Portions of the Registrant's DefinitiveRegistrant’s definitive Proxy Statement for its 20142017 Annual Meeting of Shareholders scheduled to be held on May 6, 2014,9, 2017, which will be filed with the Securities and Exchange Commission (SEC) not later than 120 days after December 28, 2013,31, 2016, are incorporated by reference into Part III of this Annual Report on Form 10-K. With the exception of the portions of the 20132017 Proxy Statement expressly incorporated into this Annual Report on Form 10-K by reference, such document shall not be deemed filed as part of this Form 10-K.
CHARLES RIVER LABORATORIES INTERNATIONAL, INC.
ANNUAL REPORT ON FORM 10-K
FOR FISCAL YEAR 2016
TABLE OF CONTENTS
| | | Item | | Page | | Page |
| | PART I | | PART I | |
| 1 | | | | |
| 1A | | | | |
| 1B | | | | |
| 2 | | | | |
| 3 | | | | |
| 4 | Mine Safety Disclosure | | Mine Safety Disclosures | |
| | | | |
| | PART II | | PART II | |
| 5 | | | Market for Registrant’s Common Equity, Related Stockholder Matters and Issuer Purchases of Equity Securities | |
| 6 | | | | |
| 7 | | | | |
| 7A | | | | |
| 8 | | | | |
| 9 | | | | |
| 9A | | | | |
| 9B | | | | |
| | PART III | | PART III | |
| 10 | | | | |
| 11 | | | | |
| 12 | | | | |
| 13 | | | | |
| 14 | | | | |
| | PART IV | | PART IV | |
| 15 | | | | |
| 16 | | Form 10-K Summary | |
| | | |
| Signatures | | Signatures | |
| Exhibit Index | | Exhibit Index | |
PART I
Item 1. Business
General
This Annual Report on Form 10-K contains forward-looking statements regarding future events and the future results of Charles River Laboratories International, Inc. that are based on our current expectations, estimates, forecasts and projections about the industries in which we operate and the beliefs and assumptions of our management. Words such as “expect,” “anticipate,” “target,” “goal,” “project,” “intend,” “plan,” “believe,” “seek,” “estimate,” “will,” “likely,” “may,” “designed,” “would,” “future,” “can,” “could” and other similar expressions that are predictions, of or indicate future events and trends or which do not relate to historical matters are intended to identify such forward-looking statements. These statements are based on our current expectations and beliefs and involve a number of risks, uncertainties and assumptions that are difficult to predict. For example, we may use forward-looking statements when addressing topics such as: the pursuit of our initiatives to optimize returns for shareholders, including efforts to improve our operating margins, improve free cash flow, invest in growth businesses and return value to shareholders; goodwill and asset impairments still under review; future demand for drug discovery and development products and services, and in particular non-regulated discovery, including the outsourcing of these services and spending trends by our clients;services; our expectations regarding stock repurchases, including the number of shares to be repurchased, expected timing and duration, the amount of capital that may be expended and the treatment of repurchased shares; present spending trends and other cost reduction activities by our clients; future actions by our management; the outcome of contingencies; changes in our business strategy; changes in ourstrategy, business practices and methods of generating revenue; the development and performance of our services and products; market and industry conditions, including competitive and pricing trends; our strategic relationships with leading pharmaceutical companies and venture capital limited partnerships, and opportunities for future similar arrangements; changes in the composition or level of our revenues; our cost structure; the impact of completed and in-process acquisitions (including Argenta, BioFocus, VivoPath, ChanTest, Sunrise, Celsis, Oncotest, WIL Research, Blue Stream, and dispositions;Agilux) and the timing of closing of in-process acquisitions; our expectations with respect to salesrevenue growth and operating synergies (including the impact of specific actions intended to cause related improvements); the impact of specific actions intended to improve overall operating efficiencies and profitability (and our ability to accommodate future demand with our infrastructure), including gains and losses attributable to businesses we plan to close, consolidate or divest; changes in our expectations regarding future stock option, restricted stock, performance share units and other equity grants to employees and directors; expectations with respect to foreign currency exchange; assessing (or changing our assessment of) our tax positions for financial statement purposes; and our cash flow and liquidity. In addition, these statements include the impact of economic and market conditions on us and our clients; the effects of our cost-saving actions and the steps to optimize returns to shareholders on an effective and timely basis and our ability to withstand the current market conditions. basis.
You should not rely on forward-looking statements because they are predictions and are subject to risks, uncertainties and assumptions that are difficult to predict. Therefore, actual results may differ materially and adversely from those expressed in any forward-looking statements. You are cautioned not to place undue reliance on these forward-looking statements, which speak only as of the date of this document or in the case of statements incorporated by reference, on the date of the document incorporated by reference. Factors that might cause or contribute to such differences include, but are not limited to, those discussed in this Form 10-K under the sectionsections entitled “Our Strategy,” the section entitled “Risks Related to Our Business and Industry,“Risk Factors,” the section entitled “Management's"Management's Discussion and Analysis of Financial Condition and Results of Operations” andOperations,” in our press releases and other financial filings with the Securities and Exchange Commission.SEC. We have no obligation to publicly update or revise any forward-looking statements, whether as a result of new information, future events or risks. New information, future events or risks may cause the forward-looking events we discuss in this report not to occur.
Corporate History
We began operating in 1947 and since then, we have undergone several changes to our business structure. Charles River Laboratories International, Inc. was incorporated in 1994 and in 2000 we completed our initial public offering. Our stock is traded on the New York Stock Exchange under the symbol “CRL” and is included in the Standard & Poor's MidCap 400 and Composite 1500 indices, the Dow Jones USU.S. Biotechnology Index, the NYSE Arca Biotechnology Index, the NYSE Composite and Healthcare Sector indices, and many of the Russell indices, among others. We are headquartered in Wilmington, Massachusetts. Our headquarters mailing address is 251 Ballardvale Street, Wilmington, MA, 01887, and the telephone number at that location is (781) 222-6000. Our Internet site is www.criver.com.www.criver.com. Material contained on our Internet site is not incorporated by reference into this Form 10-K. Unless the context otherwise requires, references in this Form 10-K to “Charles River,” “we,” “us” “the Company” or “our” refer to Charles River Laboratories International, Inc. and its subsidiaries.
This Form 10-K, as well as all other reports filed with the Securities and Exchange Commission, areSEC, is available free of charge through the Investor Relations section of our Internet site as soon as practicable after we electronically file such material with, or furnish it to, the SEC. You may read and copy any materials we file with the SEC at the SEC's Public Reference Room at 100 F Street, NE, Washington,
DC 20549. In addition, you may obtain information on the operation of the Public Reference
Room by calling the SEC at 1-800-SEC-0330. The SEC maintains an Internet site (http:(http://www.sec.gov)www.sec.gov) that contains reports, proxy and information statements, and other information regarding issuers that file electronically with the SEC.
Overview
Overview
We are a leading global providerfull service, early-stage contract research organization (CRO). We have built upon our core competency of solutions that accelerate the early-stage druglaboratory animal medicine and science (research model technologies) to develop a diverse portfolio of discovery and development process. The focussafety assessment services, both Good Laboratory Practice (GLP) and non-GLP, which is able to support our clients from target identification through non-clinical development. We also provide a suite of our business is in vivo biology; our portfolio includes research modelsproducts and services required to enable in vivosupport our clients’ manufacturing activities. Utilizing our broad portfolio of products and services enables our clients to create a more flexible drug discoverydevelopment model, which reduces their costs, enhances their productivity and development.effectiveness, and increases speed to market.
Discovery represents the earliest stages of research in the life sciences, directed at the identification, screening, and selection of a lead compoundmolecule for future drug development. Discovery activities typically extend anywhere from 4-64 to 6 years in conventional pharmaceutical research and development timelines.
Development activities, which follow, and which can take up to 7-107 to10 years, are directed at demonstrating the safety, tolerability, and clinical efficacy of the selected drug candidates. During the preclinicalnon-clinical stage of the development process, a drug candidate is tested in vitro (typically(non-animal, typically on a cellular or sub-cellular level in a test tube or multi-well petri plate) and in vivo (in research models) to support planned or on-going human clinical trials.
The development of new drugs requires the steadily increasing investment of time and money. Various studies and reports estimate that it takes between 10-1510 to 15 years, up to $2.0 billion excluding time costs, and exploration of more thanbetween 10,000 and 15,000 drug compoundsmolecules to produce a single FDA-approvedFood and Drug Administration (FDA)-approved drug. We are positioned to leverage our core competencyleading portfolio in in vivo biologyearly-stage drug research in an efficient and cost-effective way to aid our clients in bringing their drugs to market faster. Our clients reduce their costs, increase their speed, and improve their productivity and effectiveness in early-stage discovery and development by using our broad portfolio of products and services.
For over 6570 years, we have been in the business of providing the research models required in research and development of new drugs, devices, and therapies. Over this time, we have built upon our core competency of in vivo biology to develop a diverse and expanding portfolio of products and services.services, which now encompasses the broader early-stage drug research process. Our client base includes global pharmaceutical companies, biotechnology companies, government agencies, and leading hospitals and academic institutions around the world. We currently operate approximately 6875 facilities in 1623 countries worldwide.worldwide, which numbers exclude our Insourcing Solutions (IS) sites. Our products and services, supported by our global infrastructure and deep scientific expertise, enable our clients to meetovercome many of the challenges of early-stage life sciences research. In 2013,2016, our net sales from continuing operations were $1.2total revenue was $1.7 billion and our operating income from continuing operations, before income taxes, was $151.4$222.9 million.
We have twothree reporting segments: Research Models and Services (RMS), Discovery and Preclinical Services (PCS)Safety Assessment (DSA), and Manufacturing Support (Manufacturing).
In April 2016, we acquired WRH, Inc. (WIL Research). WIL Research’s safety assessment business is reported in our DSA reportable segment and its contract development and manufacturing (CDMO) services business created a new operating segment, Contract Manufacturing, which is reported as part of our Manufacturing reportable segment. We divested the CDMO business on February 10, 2017.
The revised reportable segments are as follows:
|
| | |
| Research Models and Services | Discovery and Safety Assessment | Manufacturing Support |
| Research Models | Discovery Services | Microbial Solutions |
| Research Model Services | Safety Assessment | Avian |
| | Biologics |
| | Contract Manufacturing |
Through our RMS segment, we have been supplying research models to the drug development industry since 1947. With over 150 different strains, we continue to maintain our position as the global leader in the production and sale of the most widely used rodent research model strains, principally genetically and microbiologically defined purpose-bred rats and mice. We also provide a variety of related services that are designed to assist our clients in supporting the use of research models in drug discovery and development. WithWe maintain multiple facilities located on three continents (North America, Europe and Asia), we maintain production centers, including barrier rooms and/or isolator facilities.facilities, on three
continents (North America, Europe, and Asia). In 2013,2016, RMS accounted for 60.7%29.4% of our total net sales from continuing operationsrevenue and approximately 52%3,200 of our employees, including approximately 108110 science professionals with advanced scientific degrees.
Our PCSDSA business segment provides services that enable our clients to outsource their critical,innovative drug discovery research, their related drug development activities, and regulatory-required safety assessment of potential new drugs, industrial chemicals, and related drug development activitiesagrochemicals to us. The demand for these services has historically been driven by the needs of large global pharmaceutical companies that have exceeded their internal capacity and by the needs of biotechnology companies and non-governmental organizations (NGOs) who traditionally outsourced allmost of their discovery, development and safety testing programs. Global pharmaceutical, biotechnology, and biotechnologychemical companies choose to outsource their discovery, development, and safety activities because aoutsourcing reduces the significant investment in personnel and facilities and other capital resources is requirednecessary to efficiently and effectively conduct these required scientific studies. Outsourcing allows themAdditionally, outsourcing to focus on their core competencies of innovation, early drug discovery, promotion and market distribution.Charles River provides companies access to scientific expertise that they may not have internally or available to them.
We are onethe largest provider of the two largest providers of preclinical (including bothdrug discovery, non-clinical development, and development)safety testing services worldwide and offer particulara comprehensive portfolio of services required for regulatory submission of pharmaceuticals, chemicals, and agrochemicals. We have extensive expertise in the discovery of small molecule clinical candidates and in the design, execution, and reporting of safety assessment studies especially those dealing withfor both small and large molecule (biologics)molecules and other innovative therapies.argochemicals. We currently provide preclinicaldiscovery and safety assessment services at multiple facilities located in the United States (U.S.), Canada, and Europe. Our PCSDSA segment represented 39.3%49.8% of our total net sales from continuing operationsrevenue in 20132016 and employed 44%approximately 5,900 of our employees including approximately 365960 science professionals with advanced scientific degrees.
We provide discovery servicesThrough our Manufacturing segment, we help ensure the safe production and release of products manufactured by our clients. Our Microbial Solutions business provides in both our RMSvitro methods for conventional and PCSrapid quality control testing of sterile and non-sterile pharmaceuticals and consumer products. Our Biologics Testing Solutions business segments. The biopharmaceutical industry continues to reduce infrastructureprovides specialized testing of biologics and search for more efficient and cost-effective models of drug discovery and development. In particular, largedevices frequently outsourced by global pharmaceutical and biotechnology companies are outsourcing drug discovery research, an area they historically considered a core competency. These services, which are generally non-regulated, arecompanies. Our Avian Vaccine Services business provides specific-pathogen-free (SPF) fertile chicken eggs and chickens used by sponsors to screen moleculesin the manufacture of live viruses.
In 2016, Manufacturing accounted for 20.9% of our total revenue from continuing operations and make earlier “go-no go” decisions as to which molecules should be selected for continued investment.approximately 1,400 of our employees, including approximately 140 science professionals with advanced degrees.
In recent years, we have focused our efforts on unifying our businesses and improving the efficiency of our global operations to enhance our ability to support our key clients. Our key pharmaceutical and biotechnology clients are increasingly seeking full service, “one-stop” global partners to whom they can outsource more of their drug discovery and development efforts. It is estimated that the market for regulated safety assessment services is approximately 40% toat least 50% outsourced, while emerging growth areas such as early and in vivo discovery and certain research model services are currently believed to be less outsourced.
Research Models and Services (RMS).. Our RMS segment is comprised of (1) Research Models and (2) Research Model Services and (3) Endotoxin and Microbial Detection.Services.
Research Models.Models. Our Research Models business is comprisedof the production and sale of research models and avian vaccine services.models.
Research Models. A significant portion of this business is comprised of the commercial production and sale of research models, principally purpose-bred rats and mice for use by researchers. We provide our rodent models to numerous clients around the world, including most pharmaceutical companies, a broad range of biotechnology companies, and many government agencies, and leading hospitals, and academic institutions. We have a global footprint with production facilities strategically located in 8 countries, in close proximity to our clients. Our research models include both standard stocks and strains and disease models such as those with compromised immune systems, which are in demand as early-stage research tools. The United States Food and Drug Administration (FDA)FDA and foreign regulatory bodiesagencies typically require that the safety and efficacy of new drug candidates be tested on research models like ours prior to testing in humans. As a result, our research models are an essential part of the drug discovery and development process.
Our rodent species have been, and continue to be, some of the most extensively used research models in the world, largely as a result of our geographic footprint and continuous commitment to innovation and quality. Our research models are bred and maintained in a variety of controlled environments, which are designed to ensure that the models are free of specific viral and bacterial agents and other contaminants that can disrupt research operations and distort research results. With our barrier room production capabilities, we are able to deliver consistently high-quality research models worldwide.
Our research models include:
outbred, which are purposefully bred for heterogeneity;
inbred, which are bred to be genetically identical;homogeneous;
spontaneous mutant, which containwhose genotype results in a naturally occurring genetic mutation (such as immune deficiency);
hybrid, which are the offspring of two different inbred parents; and
other genetically modified research models, includingsuch as knock-out models with one or more disabled genes and transgenic models.
Certain of our research models are proprietary, disease-specific mouse and ratrodent models used to find newresearch treatments for diseases such as diabetes, obesity, cardiovascular and kidney disease. We are presently focusing our disease model program on five areas of research: oncology, central nervous system, metabolic, cardiovascular and renal diseases.
We are also a premier provider of high quality, purpose bred, specific-pathogen-free (SPF)SPF large research models to the biomedical research community.
Avian Vaccine Services We are the global leaderfor the supply of SPF fertile chicken eggs and chickens. SPF chicken embryos are used by animal health companies as self-contained “bioreactors” for the manufacture of live viruses. These viruses are used as a raw material primarily in poultry as well as human and veterinary vaccine applications. The production of SPF eggs is performed under biosecure conditions, similar in many ways to our research model production. We have a worldwide presence, with several SPF egg production facilities in the United States, contracted production capabilities in Hungary, and franchise operations in India. We also operate a specialized avian laboratory in the United States, which provides in-house quality control testing of the SPF flocks, offers testing services to vaccine companies and commercial poultry operations, and manufactures poultry diagnostics and bulk antigens for poultry vaccines.
Research Model Services. RMS also offers a variety of services designed to support our clients' use of research models in basic research and screening non-clinical drug candidates. These services capitalize on the technologies and relationships developed through our research model business, and address the need among pharmaceutical and biotechnology companies to outsource the non-core aspects of their drug discovery activities. TheseOur services include those which are related to the maintenance and monitoring of research models, and those which are designed to implement efficacy screening protocols to improve the client's drug evaluation process.managing research operations for government entities, academic organizations, and commercial clients. We currently offer four major categories ofhave three service offerings in research models services-services: Genetically Engineered Models and Services, Insourcing Solutions, Discovery Research Services and Research Animal Diagnostic Services.
Genetically Engineered Models and Services (GEMS).. We breed and maintain research models purchased or purposefully created by our clients for biomedical research activities. The creation of a genetically engineered model (GEM) is a critical scientific event, but it is only the first step in the discovery process. Productive utilization of GEMs requires significant additional technical expertise in order to properly support basic and early discovery research. We provide breeding expertise and colony development, quarantine, health and genetic testing and monitoring, germplasm cryopreservation, and rederivation including assisted reproduction and model creation. Our team of project managers is supported by a technologically advanced internet based colony managementInternet Colony Management (ICM™) system that allows for real timereal-time data exchange. We also provide breeding expertise and colony development, quarantine, health and genetic monitoring, germplasm cryopreservation, and rederivation including assisted reproduction. We provide these services to clients around the world, fromincluding pharmaceutical and biotechnology companies, to hospitals, universities, and universities.government agencies.
Insourcing Solutions (IS).. We manage research operations (including recruitment, training, staffing, and management services) for government entities, academic organizations, and commercial clients. ResearchSome research institutions prefer to outsource staffing and management while retainingretain certain elements of their research in-house, while outsourcing staffing and management, thus driving demand for our services. We believe that our expertise in in vivo biology,early-stage drug research, and in particular research model care, scientific and technical support, facility operations, and discovery and development services, enhances the productivity and quality of our clients' research programs.
Research Animal Diagnostic Services (RADS). We monitor and analyze the health profiles of research models and cell lines used by our clients. We developed this capability internally in order to address the diagnostic needs of our own research model business. We are able to serve as their sole-source testing laboratory, or as an alternative source supporting our clients’ internal laboratory capabilities. We believe we are the reference laboratory of choice for health testing of laboratory research models and an industry leader in the field of animal diagnostics.
Discovery Researchand Safety Assessment (DSA)
We currently offer discovery and safety assessment services, both regulated and non-regulated, in which we include both in vitro and in vivo studies, supporting laboratory services, and strategic non-clinical consulting and program management to support product development.
Discovery Services (DRS). We offer a full spectrum of discovery services from identification of a novel druggable target, followed by high-throughput screening and medical chemistry, through delivery of non-clinical drug and therapeutic candidates ready for safety assessment. Our Early Discovery and DRS representsIn Vivo Discovery businesses are integrated into a single business line - Discovery Services - as evidence of our efforts to streamline and enhance the support we can provide for clients’ integrated drug discovery programs. One seamless discovery organization allows us to better engage with clients at the earliest stages of researchdrug discovery and support their complex scientific needs. We support a variety of therapeutic areas including oncology, central nervous system, bone and musculoskeletal, inflammation, metabolic diseases, respiratory and fibrotic diseases, cardiovascular, gastrointestinal, genito-urinary, anti-infectives, and ophthalmology. We also provide expertise in the life sciences,growing area of rare and orphan diseases, which are typically diseases of high unmet medical need in smaller patient populations, such as myotonic dystrophy, cystic fibrosis, and Huntington’s Disease. We believe there are emerging opportunities to assist our clients in a variety of drug discovery applications and platforms from target discovery to candidate selection.
Early Discovery. We are a global leader in integrated drug discovery services, with a predominant focus on in vitro biology capabilities and medicinal chemistry. Our knowledge and expertise allow us to support our clients as they drive their molecules forward through design and implementation of clear program plans. Our full suite of service offerings allows us to support our clients at the earliest stages of their research, and to stay with them through the entire early-stage process. Our Early Discovery service capabilities include: target discovery and validation, hit identification, medicinal chemistry, and testing how a drug is absorbed, distributed in the body, metabolized, and excreted (ADME). We also offer ion channel testing and in vitro cardiac safety assessment services, for both discovery and non-clinical purposes. In addition, we offer custom in vivo and in vitro genome editing. With this technology, we are able to develop more translational research models designed to improve the efficiency and effectiveness of the drug discovery process. These services extend from the early discovery screening process through to in vitro GLP safety assessment testing.
In Vivo Discovery Services. In Vivo Discovery Services are essential in early stage, non-clinical discovery, directed at the identification, screening, and selection of a lead compound for future drug development. DRS In vivo activities typically extend anywhere from 4-64 to 6 years in conventional pharmaceutical research and development timelines. We offer research and development expertise, capabilities, and services globally to accelerate our clients' drug discovery pipelines from lead generation to candidate selection.selection and on occasion, complete in vivo studies in support of clinical efforts or post-marketing work. We complement and extend clients' capabilities and expertise to improve their decision-making, increase their flexibility, and reduce their internal costs and product development timelines. We support a variety of therapeutic areas including oncology, CNS, bone and muscoskeletal, inflammation, metabolic diseases, respiratory, cardiovascular and ophthalmology. In addition, we provide in vitro and in vivo assays in support of lead optimization to candidate selection activities. Examples of this include early pharmacokinetic and pharmocodynamicpharmacodynamic studies andin vitro and in vivo assays to assess mechanism, bioavailability, metabolism, efficacy, and safety pharmacology.
In September 2016, we acquired Agilux Laboratories, Inc. (Agilux), a CRO that provides a suite of integrated discovery small and large molecule bioanalytical services, drug metabolism and pharmacokinetic services, and pharmacology services. This acquisition supports our strategy to offer clients a broader, integrated portfolio that provides services continuously from the earliest stages of drug research through the non-clinical development process.
Safety Assessment. We offer a full range of safety assessment studies required for regulatory submission on a global basis.
Bioanalysis, Drug Metabolism and Pharmacokinetics. In support of non-clinical drug safety testing, our clients are required to demonstrate appropriate exposure, stability in the collected sample, pharmacokinetics of their drug or compound in circulation, the presence of metabolites, and, with biologics, the presence or absence of anti-drug antibodies. We have scientific depth in the sophisticated bioanalytical techniques required to satisfy these requirements for a number of drug classes. After performing sample analysis in support of non-clinical studies, we have the opportunity to capture the benefits of bridging the non-clinical bioanalysis with subsequent clinical development. Once the analysis is complete, our scientists evaluate the data to provide information on the pharmacokinetics and/or toxicokinetics of the drug, and complete an evaluation of the biologic disposition of the drug and its potential metabolites. Pharmacokinetics refers to understanding what the body does to a drug or compound once administered, including the process by which the drug is absorbed, distributed in the body, metabolized and excreted (ADME); toxicokinetics refers to the same understanding as applied at higher doses that may result in adverse effects. These studies are required for the full non-clinical assessment of the disposition of the drug and the results are used in the final non-clinical safety evaluation of the compound to support the start of clinical trials.
Safety Pharmacology. In support of non-clinical drug safety testing, our clients are required to demonstrate that the test article as formulated does not have the potential to prolong the cardiac QT interval. We have the assays (both in vitro and in vivo) and can perform the screening for this demonstration that is required for an investigational new drug submission.
Toxicology. We have expertise in the design and execution of development programs in support of both chemically-derived (small molecule) and biotechnology-derived (large molecule) pharmaceuticals. Once a lead molecule is selected, toxicology studies are required to support clinical trials in humans and new drug registrations. These toxicology studies focus on assessing the safety of the molecule to determine if administration of the molecules to humans might cause any unintended harmful effects. These studies are typically performed in research models to identify any potential adverse effects that a compound has on an organism over a variety of doses and over various time periods.
Our toxicology services feature:
a broad offering of in vitro and in vivo assayscapabilities and study types designed to assess mechanism, bioavailability, metabolism,identify possible safety risks for potential therapeutics, industrial chemicals, and agrochemicals as they transition from discovery into regulated drug development, toxicology, and human clinical testing, or as they are submitted for regulatory registration;
all the standard in vitro and in vivo studies in support of general toxicology (acute, sub-acute, and chronic studies), genetic toxicology, safety pharmacology. pharmacology, and carcinogenicity bioassays that are required for either regulatory submissions supporting “first-in-human” to “first-to-the-market” strategies, or for national chemical registration;
all the standardAs we look forward, we believe there in vitro and in vivo studies in support of general toxicology (acute, sub-acute, and chronic studies), genetic toxicology, reproductive and developmental toxicology, environmental toxicology, and carcinogenicity bioassays that are emerging opportunitiesrequired for regulatory submissions supporting the registration of industrial chemicals, food additives, agrochemicals, and biocides;
expertise in standard and specialty routes of administration (e.g., infusion, intravitreal, intrathecal, and inhalation) that are important not only for the testing of potential pharmaceuticals and biopharmaceuticals, but also for the safety testing of medical devices, nutraceuticals, animal health products, and other materials;
expertise in the conduct and assessment of reproductive, developmental, and juvenile toxicology studies (in support of larger-scale and later-stage human clinical trials or chemical registration);
expertise in environmental toxicology (aquatic and terrestrial) and regulatory submissions required for chemical registration;
services in important specialty areas such as ocular, bone, juvenile/neonatal, immune-toxicology, photobiology, inhalation, and dermal testing;
expertise in all major therapeutic areas;
study design and strategic advice to assistour clients based on our wealth of experience and scientific expertise in support of drug development and chemical registration; and
a strong history of assisting our clients in achieving their regulatory and/or internal milestones for the safety testing of numerous therapy types including stem cells, vaccines, proteins, antibodies, drug conjugates, oligonucleotide biotherapeutics, small molecules, medical devices, chemicals, and agrochemicals.
Our safety assessment facilities comply with GLP to the extent required by the FDA, Environmental Protection Agency, USDA, European Medicines Agency, European Chemicals Agency, Organization for Economic Co-operation and Development (OECD), as well as other international regulatory agencies. Furthermore, our early-stage discovery work, which is not subject to GLP standards, is typically carried out under a variety of drug discovery applicationsquality management system such as ISO 9100 or similarly constructed internally developed quality systems. Our facilities are regularly inspected by U.S. and platforms from target validation to candidate selection. Sites that perform only discovery research services are reported inother regulatory compliance monitoring authorities, our RMS segment.clients' quality assurance departments, and our own internal quality assessment program.
Research Animal Diagnostic Services (RADS).Pathology Services. We monitorThe ability to identify and analyzecharacterize clinical and anatomic pathologic changes is critical in determining the health profilessafety and efficacy of potential new therapeutics and agrochemicals. Key “go/no-go” decisions regarding continued product development are typically dependent on the research modelsidentification, characterization and cell linesevaluation of fluid, tissue, and cellular changes that our experts identify and interpret for our clients. We developed this capability internally by building upon the scientific foundation created by the diagnostic needsemploy a large number of our research model business. We are ablehighly trained veterinary anatomic and clinical pathologists and other scientists who use state-of-the-art techniques to serveidentify potential test compound-related changes within tissues, fluids, and cells. In addition to all standard anatomic and clinical pathology techniques, we provide specialized evaluations such as our clients' sole-source testing laboratory, or as an alternative source supporting our clients internal laboratory capabilities . We believe we are the reference laboratory of choice for health testing of laboratory research modelscytology, platelet function, assay development, immunohistochemistry, in situ blood hybridization electron microscopy, tissue morphometry, and an industry leader in the field of animal diagnostics. We also offer non-GLP biomarker assay platforms and services to support early stage discovery studies. Across these platforms, we can provide both standard as well as customized biomarker testing, including serum and urine chemistries.stereology services.
Manufacturing Support (Manufacturing)
Endotoxin and Microbial Detection(EMD) Solutions(f/k/a In Vitro). Our EMDMicrobial Solutions business provides non-animal, or in vitro methods for conventional and rapid quality control testing of sterile and non-sterile biopharmaceutical and consumer products. Our legacy business provided lot release testing of medical devices and injectable drugs for endotoxin contamination. Our Celsis business provides rapid microbial detection systems for quality control testing in the pharmaceutical and consumer products industries. Our Accugenix subsidiarybusiness provides state-of-the-art microbial identification and genetic sequencing services for manufacturing in the biopharmaceutical, medical device, nutraceutical, and consumer care industries.
Endotoxin testing is an in vitro process which uses a processed extract from the bloodraw materials of the horseshoe crab, known as limulus amebocyte lysate (LAL). The LAL test is the first and most successful FDA-validated alternative to an animal modelin vivo test to date. The extraction of bloodthe raw materials for LAL does not harm the crabs, which are subsequently returned to their natural ocean environment. Our EMDMicrobial Solutions business produces and distributes a comprehensive portfolio of endotoxin testing, microbial detection and identification kits, reagents, software, accessories, instruments, and associated microbial quality control
laboratory services to a broad range of companies manufacturing and releasing products from the pharmaceutical, biotechnology, consumer products, and biotechnology companiesdairy industries worldwide. We are a market leader in endotoxin testing products and services, which are used for FDA-required quality control testing of injectable drugs and medical devices, their components, and the processes by which they are manufactured.
The growth in our EMDMicrobial Solutions business is driven by our FDA approvedFDA-approved line of next-generation endotoxin testing products, which areproducts. This line is based on the Endosafe Portable Testing System (Endosafe®-PTS™) technology, thatwhich allows rapid endotoxin testing in the
central laboratory or manufacturing environment. In recent years, we expanded the PTS product portfolio to include a multiple sample testing system known as the Endosafe®-MCS™ (multi cartridge(multi-cartridge system) to satisfy the demand of our clients who haverequire higher volumes of tests to perform.sample throughput. We anticipate our clients' demand for rapid testing methods of testing will continue to increase as they respond to the FDA's Process Analytical Technology (PAT) Initiative.Initiative, as well as move to faster, simpler testing methods for their technicians. In 2012,2013, we introducedlaunched the first fully automated robotic system developed specifically for high-volume endotoxin testing,testing: Endosafe®-Nexus™, which we launched in 2013. . We expect to see expanded use of this rapid endotoxin testing technology in non-traditional areas such as renal dialysis, nuclear and compounding pharmacies, and cellular therapy.
Celsis’ systems are principally used for product-release testing to help ensure the safe manufacture of pharmaceutical, pharmaceutical, and consumer products. The Advance II™, Accel™ and Innovate™ systems for non-sterile applications complement our PTS-Micro™, a rapid bacterial (bioburden) detection system for sterile biopharmaceutical applications. We expect our comprehensive portfolio to drive increased adoption of our quality control testing solutions across both sterile and non-sterile applications.
Our Accugenix subsidiary is the premier global provider of cGMP- compliantcurrent ISO 17025 and Good Manufacturing Practice (cGMP)-compliant contract microbial identification and genetic sequencing testing. Accugenix is an acknowledged industry leader in species-level identification and strain typing of bacteria and fungi that are recovered from manufacturing facilities. Utilizing state-of-the-art and proprietary in vitro technologies, coupled with scientific expertise and analysis, Accugenix excels in providing accurate, timely, and cost-effective microbial identification services required to meet internal quality standards and government regulations.
Preclinical Services (PCS)
We currently offer preclinical services, both regulated and non-regulated, in which we include both in vivo and in vitro studies, supporting laboratory services, and strategic preclinical consulting and program management to support product development. Sites that perform a variety of services in addition to discovery research services are reported in our PCS segment.
Safety Assessment. We offer a full range of preclinical studies required for regulatory submission on a global basis.
Bioanalysis, Pharmacokinetics, and Drug Metabolism. In support of preclinical drug safety testing, our clients are required to demonstrate appropriate exposure, stability in the collected sample, kinetics of their drug or compound in circulation, the presence of metabolites, and, with biologics, the presence or absence of anti-drug antibodies. We have scientific depth in the sophisticated bioanalytical techniques required to satisfy these requirements for a number of drug classes. After performing sample analysis in support of preclinical studies, we have the opportunity to capture the benefits of bridging the preclinical bioanalysis with subsequent clinical development. Once the analysis is complete, our scientists evaluate the data to provide information on the pharmacokinetics and/or toxicokinetics of the drug, and complete an evaluation of the distribution of the drug or metabolites. Pharmacokinetics refers to understanding what the body does to a drug or compound once administered, including the process by which the drug is absorbed, distributed in the body, metabolized, and excreted (ADME); toxicokinetics refers to the same understanding as applied at higher doses that may result in adverse effects. These studies are required for the full preclinical assessment of the disposition of the drug and the results are used in the final preclinical safety evaluation of the compound.
Toxicology. Toxicology is one of our core preclinical competencies and a competitive strength. We have expertise in the design and execution of development programs in support of both traditional, “small molecule” pharmaceuticals and biotechnology-derived pharmaceuticals. Once a lead molecule is selected, toxicology studies are required to support clinical trials in humans. These toxicology studies focus on assessing the safety of the molecule to determine if administration of the molecules to humans might cause any unintended harmful effects. These studies are typically performed in research models to identify any potential adverse effects that a compound has on an organism over a variety of doses and over various time periods. Our toxicology services feature:
all the standard protocols for general toxicity testing (genotoxicity, safety pharmacology, acute, sub-acute, chronic toxicity and carcinogenicity bioassays) required for regulatory submissions supporting “first-in-human” to “first-to-the-market” strategies;
expertise in specialty routes of administration and modes of administration (e.g., infusion, intravitreal, intrathecal, and inhalation), which are important not only for the testing of potential pharmaceuticals and biopharmaceuticals, but also for the safety testing of medical devices, industrial chemicals, food additives, agrochemicals, biocides, nutraceuticals, animal health products and other materials;
expertise in the conduct and assessment of reproductive and developmental toxicology studies (in support of larger scale and later-stage human clinical trials);
services in important specialty areas such as ocular, bone, juvenile/neonatal, immuno-toxicity, photobiology and dermal testing;
expertise in all major therapeutic areas;
study design and strategic advice to our clients based on our wealth of experience and scientific expertise in support of drug development; and
a strong history of assisting our clients in achieving their regulatory or internal milestones for safety testing, including studies addressing stem cell therapies, DNA vaccines, protein biotherapeutics, small molecules and medical devices.
Our preclinical facilities comply with Good Laboratory Practices (GLPs) to the extent required by the FDA as well as other international regulatory bodies. Our facilities are regularly inspected by U.S. and other regulatory compliance monitoring authorities, our clients' quality assurance departments and our own internal quality assessment program.
Pathology Services. The ability to identify and characterize clinical and anatomic pathologic changes is critical in determining the safety of potential new therapeutics. Key “go/no-go” decisions regarding continued product development are typically dependent on the identification, characterization and evaluation of gross and microscopic pathology changes that our experts identify and interpret for our clients. We employ a large number of highly trained veterinary anatomic and clinical pathologists and other scientists who use state-of-the-art techniques to identify potential test article-related changes within tissues, fluids and cells. In addition to all standard anatomic and clinical pathology techniques, we provide specialized evaluations such as immunohistochemistry evaluations that are often required in the development of monoclonal antibodies.
Biologics Testing Solutions (f/k/a Biopharmaceutical Services).. We perform specialized testing of biologics and devices frequently outsourced by global pharmaceutical and biotechnology companies. Our laboratories in the United States,U.S., Germany, Scotland, Ireland, and IrelandFrance provide timely and compliantregulatory-compliant molecular biology, virology, bioanalysis, immunochemistry, microbiology, and related services. We confirm that biological processes and the drug candidates and drugs produced are consistent, correctly defined, stable, and essentially contaminant free. This testing is required by the FDA and other international regulatory authorities for our clients to obtain new drug approvals, to maintain government licensed manufacturing facilities, and to release approved therapeutic products for patient treatment.
Our manufacturing services group grows and stores well-characterized early-stage client cell lines for later development or manufacture of therapeutic proteins and vaccines for clinical trials. We further design and provide viral clearance projects for Phase I, II, and III studies in our German and USU.S. facilities.
In June 2016, we acquired Blue Stream Laboratories, Inc. (Blue Stream), an analytical CRO supporting the development of complex biologics and biosimilars.
Avian Vaccine Services. We are the global leader for the supply of SPF fertile chicken eggs and chickens. SPF chicken embryos are used by animal health companies as self-contained “bioreactors” for the manufacture of live viruses. These viruses are used as a raw material primarily in poultry as well as human and veterinary vaccine applications. The production of SPF eggs is performed under biosecure conditions, similar in many ways to our research model production. We have a worldwide presence, with several SPF egg production facilities in the U.S., and contracted production capabilities in Hungary. We also operate a specialized avian laboratory in the U.S., which provides in-house quality control testing of the SPF flocks, offers testing services to vaccine companies and commercial poultry operations, and manufactures poultry diagnostics and bulk antigens for poultry vaccines.
Contract Manufacturing. Through our acquisition of WIL Research in April 2016, we acquired its QS Pharma subsidiary. This business specializes in contract formulation development and manufacturing (including analytical services and stability testing) with a focus on high potency compounds, oral solid and liquid dose formulations, and manufacturing. On February 10, 2017, we divested this business. For additional information, see Note 17, “Subsequent Events” included in Item 8, “Financial Statements and Other Supplementary Data” in this Annual Report on Form 10-K.
Our Strategy
Our objective is to be the preferred strategic global partner for our clients. We drive our growth by providing our clients superior, flexible and tailored solutions to help them accelerate and enhance the efficiency of their drug research and development efforts. Our strategy is to deliver a comprehensive and integrated portfolio of early-stage/drug discovery and non-clinical development products, services, and solutions to support our clients' goal to maintain the flexible infrastructure that they requirediscovery and early-stage drug research, process development, scale up, and manufacturing efforts, and enable them to bring new and improved therapies to market faster and more cost effectively. In addition, we believe we can improve and augment drug discovery and early-stage development effectiveness by coordinating the dialog between large pharmaceutical, biotechnology, academic and non-governmental organizations, and venture capitalists. Separately, through our various Manufacturing segment businesses, we aim to be the premier provider of products and services that ensure our clients produce and release their products safely. As these groups increasingly rely on and interact with one another in this field, we assist them in working together by developing deeper strategic relationships with each of these constituencies.
We believe we have certain competitive advantages in executing this strategy, as a result of our continuing focus on the following:
Integrated Early-Stage Portfolio.Portfolio. We are the only large, global contract research organization (CRO)CRO with a portfolio of products, services, and solutions that focuses almost exclusively on early-stage drug discovery and preclinicalearly-stage development. We provide research models and associated services, discovery research studies and services, and comprehensive safety assessment and toxicology studies in both regulated and non-regulated environments. As such, we are able to collaborate with clients from early lead generationtarget discovery through candidate selection. When critical decisions are made regarding which therapiestherapeutics will progress or remain infrom discovery to development, we continue to work alongside themour clients as the drug candidates move downstream through the preclinical development process and post-candidate selection.downstream. Our recognized expertise in in vivo biologyearly-stage drug research and pharmacology provides us with a competitive advantage. We understand our clients' therapies and the challenges they face during the discovery and development process, including mechanism of action, efficacy, drug metabolism, and safety assessment, and toxicological testing critical for making “go/no-go” decisions.
Pharmaceutical Manufacturing Support Portfolio. We also offer a portfolio of products, services, and solutions that supports the process development, scale up, and quality control efforts of the biopharmaceutical industry. We provide products and services that support the development and release of commercialized biologics products. In particular, we are an industry leader in the areas of microbial detection and microbial identification to support process development and ongoing commercial production. Our portfolio spans a broad range of traditional and rapid methods, which provide the highest testing quality, enhance productivity, and reduce cycle time.
Deep Scientific Expertise.Expertise. We provide a breadth and depth of scientific expertise across a broad range of therapeutic areas which may be too costly for our clients to build and/or maintain in-house. We provide essential capabilities, that our clients demand but are not perceived as strategic differentiators for their businesses. These includeincluding biomarkers, biologics, medicinal chemistry, in vitro screening, in vivo pharmacology, immunology, pathology, biologics process development testing, microbial detection and identification, and other specialty service areas that have high infrastructure costs or are cost-prohibitive for clients to maintain in-house. We continue to increaseexpand our portfolio in key therapeutic and pharmacology areas to align with our clients' internal drug discovery and development areas of focus. These areas of disease focus and expertise include oncology, metabolism and obesity, immunology, respiratory, bone and musculoskeletal, diabetes, cardiovascular, infectious disease, and central nervous system. In the areas of functional expertise, it includes synthetic and medicinal chemistry, library design, cell line development, in vitro and in vivo assay development screening, non-clinical imaging, structural biology, process chemistry, toxicology, veterinary pathology, bioanalysis, scale up, and formulation development. We also continue to enhance our small molecule and biologics manufacturing portfolio in areas of greatest industry need, where outsourcing provides major benefits for our clients and where we could provide significant benefits given our unique early development portfolio and global footprint.
Commitment to Animal Welfare. Welfare. We are committed to being the worldwide leader in the humane care of laboratory animals.animals and implementation of the “3Rs” (Replacement, Reduction, and Refinement). As animal caregivers and researchers, we are responsible to our clients and the public for the health and well-being of the animals in our care. We work hand-in-hand with the scientific community to understand how living conditions, handling procedures, and reduction of stress play an important role in the quality and efficiency of research.
Superior Quality and Client Support. Support. We maintain scientific rigor and high quality standards through management of key performance indicators and an intense focus on biosecurity. These standards allow clients to access our global
portfolio of products and services with the confidence that they will obtain consistent results no matter where they choose to obtain their products or conduct their research.
Flexible and Customized Environment to Provide the Right Solutions. SolutionsAll. Each of our clients are different. Each hasis different, with unique needs and specific requirements. We understand the importance of flexibility, and we can deliver customized work based upon the breadth and depth of our capabilities, expertise and services. We help clients improve their workload and staffing requirements by drawing upon the higher utilization and streamlined efficiencies of our facilities. This allows our clients to reduce internal capacity and/or staff. We leverage the expertise embedded in our integrated early-stage portfolio to provide customized solutions tailored to fit the specific need or therapeutic area for a particular client. By utilizing our streamlined and efficient facilities, we help clients create a flexible infrastructure in order to improve their workload and staffing requirements. This allows our clients to reduce internal capacity and/or staff. We provide enhanced value to clients who use us as a full-service integrated partner over a longer period of time.
Large, Global Partner.Partner. We believe there is a particular advantage in being a full service, high-quality provider of research models and associated services, discovery and preclinicalnon-clinical in vivo products and in vitroservices, and manufacturing support on a global scale. Many of our clients, especially large biopharmaceutical companies, have decided to limit the number of suppliers with which they work. Their preference is to partner with large Tier 1 CROs who can bring experience in project management to a portfolio of projects. Large CROs like Charles River, who can presentoffer clients with access to greater value through economiessupport across the early-stage drug research process as a result of scalebroader portfolios and scope.experience in project management. This includes extensive scientific, technical, and therapeutic area expertise, real-time access to data through secure portals, a global footprint, and streamlined and simplified processes and communications including professional project and relationship management. We are focused on leveraging our competitive advantages to ensure we are recognized as the premier preferred provider, by building and expandingthereby enabling us to build broader and deeper long-term strategic relationships with our clients.
Global biopharmaceutical companies are continuing to make the decision to outsource more significant tranches of their drug discovery, development, and developmentmanufacturing processes. For example, overOver the past few years we have entered into strategic relationships with leading global pharmaceuticalbiopharmaceutical companies and we have expanded existing preferred provider agreements with other leading global pharmaceuticalbiopharmaceutical companies. For example, in 2016, we extended the term of our longstanding integrated drug discovery alliance with Genentech, a member of the Roche Group. Through this alliance, we provide Genentech early discovery services, including medicinal chemistry, in vitro and in vivo biology, structural biology, and computer-aided drug design to help identify promising candidates for non-clinical development. And, in 2015, we extended the term of our collaboration with AstraZeneca for outsourced regulated safety assessment, and development drug metabolism and pharmacokinetics until 2020. For some of theseour partners, we provide a broad suite of our research models and preclinicaldiscovery and safety assessment services and for others we provide a customized and select array of preclinicaldiscovery and safety assessment services and /orand/or research models. Utilizing our capabilitiesOffering flexibility enables our clients to create a flexible research platformutilize our products and services to deliver innovative health solutions.
We believe it is critical to participatesolutions in that process now, because these relationships are likely to extend for lengthy periods of time, from three to five years. Furthermore, both the client and the CRO invest heavily in the initial phases of the relationship to successfully transfer work streams and establish governance processes. Given this investment, clients are less likely to change CROs at the conclusion of the initial relationship. Our goal is to prevail in the majority of these opportunities. To do this, we are positioning ourselves as the preferred partner for outsourced early-stage drug discovery and development products and services.
We developed this strategy and focus in recognition of our clients'a manner which best suits their individual needs. Biopharmaceutical companies continue to face increasing pressure to innovate and to better manage their pipelines. Accordingly, our clients have reduced their infrastructure while simultaneously they search for improved ways to identify and develop innovative new therapies. Clients are reducing historical fixed costs in favor of a more flexible business model, with an aim to accelerate their discovery and development activities. As a consequence, our pharmaceutical and biotechnology clients have been looking to outsource these services to high quality, full-service providers like us. Our business prospects are driven primarily by this trend towards the virtualization and externalization of our clients through partnering and outsourcing. Client spending is not just influenced by the levels of research and development at these pharmaceutical and biotechnology companies, but also by spending of all the sponsors including federal and state governments and other non-profit organizations. By providing clients with an outsourced suite of robust services from drug discovery to post-IND, we allow them to concentrate their internal expertise and resources on areas that provide true differentiation and advance their pipelines. This creates opportunities for us to help optimize our clients' pipelines and be a true partner in accelerating their drug discovery and development process.
In recent years, the pharmaceutical and biotechnology industries have faced a collection of challenges. This involves scientific, public-perception, economic and regulatory challenges that all have negatively affected demand (and pricing) for outsourced discovery and preclinical development services. These challenges included:
patent expirations of “blockbuster” therapies;
intensified actions designed to reduce costs and improve research and development innovation and productivity, including cost-cutting, workforce reductions, rationalization of capacity and other efficiency initiatives;
rationalization of drug pipelines to focus on a smaller number of programs and high-potential therapeutic areas;
changes to government healthcare policies and funding;
a stronger emphasis on delivering later-stage programs to accelerate drugs in clinical trials to market;
increased pharmaceutical merger activity and the associated integration issues;
fluctuations in the biotech funding environment; and
the uncertain global economy.
As a result, thereThere have been fundamental changes in our clients' research and development needs, particularly with regard to the large pharmaceutical industry. First, these clients are increasingly emphasizing studies that have greater translation to the clinic so that they can make appropriate decisions regarding the progression of potential therapeutic entities earlier in the development process. This has reduced the number of compounds moving into preclinical and clinical development and results in fewer molecules undergoing regulated safety assessment. The result is a greater focus on discovery research services, including in vivo pharmacology studies consisting of efficacy and non-regulatednon-GLP DMPK (drug metabolism and pharmacokinetics) studies. Second, these clients are choosing to outsource additional discovery researchand safety assessment services in order to increase the efficiency and effectiveness of their drug research decisionselection processes.
We believe that this changing environment will provide enhanced outsourcing opportunities for us in the future. We remain optimistic that our clients are increasingly receptive to partnering with CROs as a means toof meeting their discovery programand non-clinical support needs. With the stabilization of factors addressed above, as well asWe believe that the successful launchdevelopment of new therapies and the need to advance early-stage pipelines, we believe outsourcing by the pharmaceutical industry will continue to be a positive driver. drivers of demand for our products and services.
We also believe that larger biopharmaceutical companies will increasingly focus on efficiencies and execution. They will continue to reassess what are core differentiators from research and development to commercialization. We expect they will also continue to be conservative in re-building infrastructure and expertise. This should lead to more opportunities for strategic outsourcing as clients choose to utilize external resources rather than invest in internal infrastructure. In the aggregate, we believe that the evolving large biopharmaceutical research and development business model will make our essential products and services even more relevant to our clients, and allow them to leverage our integrated offerings and expertise to drive their research, non-clinical development, and developmentmanufacturing efficiency and cost effectiveness.
To addressWe believe it is critical to participate in the challenging market conditionsstrategic partnering process because these relationships are likely to extend for lengthy periods of time - three to five years. Furthermore, both the client and the CRO invest heavily in the initial phases of the relationship to successfully transfer work streams and establish governance processes. Given this investment, clients are less likely to change CROs at the conclusion of the initial relationship. Our goal is to prevail in the majority of these opportunities.
We also believe that our portfolio provides flexible solutions that meet the customized needs for virtual and small biotechnology companies, which have persisted over the last few years, we have taken significant steps to better support ourlimited or no infrastructure. These clients identify new strategies to enhance client satisfaction, improve operating efficiency, and generally strengthen our business model:
Our sales force is aligned to enhancealso value our ability to supportprovide a broad range
of services and integrated services where we work hand in hand with our customers to design, plan, and manage integrated projects and programs. This includes classically outsourced services, “insourced” services, and hybrid offerings blending resources from both our clients and toour staff. Our clients have utilized this capability, which blends resources both inside and outside their walls.
We maintain an intense focus on three particular client segments: global biopharmaceutical companies, mid-tier biopharmaceutical companies, and academic/government institutions.
Our PCS business is also aligned along functional lines to continue the process of standardizing and harmonizing our procedures. This has enabled clients to place work with us at multiple locations with the knowledge that procedures are consistently performed and data delivered in standard formats.
In 2011, we integrated our businesses by unifying each of RMS and PCS globally. We did this to strengthen the linkage between the businesses, which enables us to offer clients more seamless access to our broad portfolio and scientific expertise. Most recently in late 2013, we announced a number of organizational changes designed to continue to improve our operating efficiency across our global portfolio and to enhance our ability to meet the needs of our clients.
Dr. Jorg Geller, previously Corporate Executive Vice President and President, European & Asian Operations, is now directly overseeing a global initiative to enhance efficiency and drive increased productivity across all of our businesses worldwide. In his new role of Corporate Executive Vice President, Global Productivity and Efficiency, Dr. Geller leads a cross-functional team of our staff and business-unit leaders tasked with the critical initiative to drive increased productivity and efficiency at an accelerated pace.
In conjunction with Dr. Geller assuming this new role, Dr. Davide Molho, previously Corporate Executive Vice President and President, North American Operations, has assumed a broader range of responsibilities with global oversight of the RMS and PCS businesses. In his revised role of Corporate Executive Vice President and President, Global Research Models & Services and Preclinical Services Operations, Dr. Molho
is responsible for transitioning from the unified, regional business alignment, which was implemented in 2011, to a more fully integrated, global organizational structure across North America, Europe and Asia.
In addition to these actions, over the past few years we have taken decisive actions to reduce costs and improve operating efficiency, such as Lean Six Sigma, the Profit Improvement Program and enhanced focus on procurement, general and administrative expenses and operations. These actions were designed to streamline and optimize our operating processes and infrastructure to allow us to support our clients more efficiently and at a lower cost. We have an intensified focus on four key initiatives designed to allow us to drive profitable growth and maximize value for shareholders, and thus better position ourselves to operate successfully in the current and future business environment. We have continued to make progress in 2013 on these key initiatives which include (1) improving our consolidated operating margin, (2) improving our free cash flow generation, (3) investing in those businesses with the greatest potential for growth and (4) returning value to shareholders.
WeAs a result, we believe that we are well positioned to exploit both existing and new outsourcing opportunities in light of our actions and intensified focus. As clients, particularly larger pharmaceutical companies, increase their outsourcing, we believe that our expertise allows us to provide a more flexible, efficient and cost-effective alternative for them. We are able to build and maintain expertise and achieve economies of scale that are difficult for our clients to match within their internal infrastructures because these products and services are the core of our business.opportunities.
We intend to continue to broaden the scope of the products and services we provide across the early-stage drug discovery and early-stage development continuum primarily through internal development, and, as needed, through focused acquisitions and alliances. Acquisitions are an integral part of our growth strategy, but weboth to expand our portfolio and broaden our geographic footprint. We are committed to a disciplined approach that seeks to target businesses that are a sound strategic fit and that offer the prospect of enhancing shareholder value, typically including the achievement of a hurdle rate onfor return on invested capital above our weighted average cost of capital. For example, in each of 2015 and 2016, we completed significant strategic acquisitions. In 2015, we acquired Celsis Group Limited., a leading provider of rapid bacterial detection systems for sterile and non-sterile quality control testing in the biopharmaceutical and consumer products industries. In 2016, we made three acquisitions. In April, we acquired WIL Research, a premier provider of safety assessment and contract development and manufacturing services to biopharmaceutical and agricultural and industrial chemical companies worldwide. In June, we acquired Blue Stream, an analytical CRO supporting the development of complex biologics and biosimilars. In September, we acquired Agilux, a CRO that provides a suite of integrated discovery small and large molecule bioanalytical services, drug metabolism and pharmacokinetic services, and pharmacology services.
ThisOur acquisition strategy may includealso takes into account geographic as well as strategic expansion of existing core services. For example, in January 2013,2015, we acquired 75% ownershipOncotest, a Germany-based CRO providing discovery services for oncology, which complements our existing In Vivo Discovery businesses in the U.S. and Finland, and Sunrise, a producer of Vital River,SPF fertile chicken eggs and chickens used in the premier commercial providermanufacture of research models and related services in China. As a result of this acquisition, we now provide more of our high-quality research models and associated services to emerging Asian markets for drug discovery and development. Our strategy also includes strengthening the depth and expanding the breadth of our core capabilities and services in a related or adjacent business, such as the Accugenix acquisition in 2012.live viruses.
We are also partnering with a limited number of venture capital firms primarily investing in life sciences, health carehealthcare, and technology companies with an emphasis on early stageearly-stage emerging growth companies. Through these partnerships and leveraging our core competencies, we are able to promote contract research services for discovery and preclinical servicessafety assessment to these companies. For example, in 2016, we committed to invest $10 million in BioMotiv, LLC, the therapeutic accelerator company associated with The Harrington Project for Discovery and Development. Through this agreement, we will be the preferred drug discovery and non-clinical development partner for BioMotiv’s portfolio of technologies and companies. This offers us the opportunity to establish ourselves as a provider of choice for a unique client group which has emerged as biopharmaceutical companies rationalize and prioritize their development pipelines.
Customers
We maintain a three-pronged sales organization with a focus on:
global biopharmaceutical companies;
small and mid-sized pharmaceutical, biotechnology, agrochemical, industrial chemical, and veterinary medicine companies, and biotechnology companies;as well as contract research organizations; and
academic and government institutions.
We also maintain several sales specialists which either have specific technical expertise (often degreed scientists) or cover unique markets.
Our clients continue to consist primarily of all of the major pharmaceutical companies,biopharmaceutical companies; many biotechnology, companies, contract research organizations, agricultural and chemical, companies, life science, companies, veterinary medicine, companies,medical device, diagnostic, and consumer product companies; contract research and contract manufacturing organizations, medical device companies, diagnosticorganizations; and other commercial entities, as well as leading hospitals, academic institutions, and government agencies. We have stable, long-term relationships with many of our clients. During 2013,2016, no single commercial client accounted for more than 5%3% of our total net sales.
revenue and no single customer accounted for more than 10% of the revenue of any of our three business segments.
We continue to pursue a goal of expanding our relationships with our large biopharmaceutical clients, and with many of our larger mid-tiermid-market clients. These relationships take different forms, from preferred provider arrangements to strategic partnerships. These structuredThe structure of these relationships incentivizeincentivizes clients to purchase more products and services across our early-stage portfolio, and in total, the strategic relationships in which we are now engaged represent slightly more than 25% of our total revenues. This provides us with better visibility than in the past, and becauseearly-
stage portfolio. Because of the strength of these relationships, we have better insight into our clients' planning processes.processes, and therefore, better visibility than in the past. For information regarding net sales and long-lived assetsrevenue attributable to botheach of our business segments for the last three fiscal years, please see Note 1115, “Segment and Geographic Information” included in the Notes to Consolidated Financial Statements included elsewhere in this Form 10-K. For information regarding net salesrevenue and long-lived assets attributable to operations in the United
States, Europe, Canada, Japan, and other countries for each of the last three fiscal years, please review Note 1115, “Segment and Geographic Information” included in the Notes to Consolidated Financial Statements included elsewhere in this Form 10-K.
Sales, Marketing and Customer Support
We have designated dedicated sales people for each of our three client segments (i.e. global(global biopharmaceutical, small and mid-sized pharmaceutical and biotechnology companies, and academic and government institutions). This enhances our ability to meet client needs by offering customized, tailored solutions across our entire portfolio. In addition, our mid-market pharmaceutical and biotechnology clients benefit by additional support from a combination of account managers with broad portfolio knowledge and specialists with specific scientific expertise. This allows us to provide comprehensive coverage of all of the market segments among our diverse client population. We also apply the use of dedicated sales specialists for certain technical product lines, such as in our Manufacturing business.
We sell our products and services principally through our direct sales force and account management teams who work in North America, Europe, and the Asia-Pacific countries. In addition to interactions with our direct sales force, our primary promotional activities include organizing scientific symposia, publishing scientific papers and newsletters, hosting webinars and making presentations at, and participating in, scientific conferences and trade shows in North America, Europe, and Asia. We supplement these scientifically based marketing activities with internet-based marketing, advertising, and direct mail. In certain areas, our direct sales force is supplemented by international distributors and agents, particularly with respect to our EMDand Biologics Testing Solutions businesses.agents.
Our internal marketing/product management teams support the field sales staff and account management teams while developing and implementing programs to create close working relationships with our clients in the biomedical research industry. We maintain customer service, technical assistance, and consulting service departments (in addition to project managers for our service businesses), which address both our clients' routine and more specialized needs and generally serve as a scientific resource for them. We frequently assist our clients in solving problems related to animal husbandry, health and genetics, biosecurity, preclinicalnon-clinical study design, regulatory consulting, protocol development, and other areas in which our expertise is widely recognized as a valuable resource by our clients.
Our marketing efforts are focused on stimulating demand for further outsourcing across our entire services portfolio. We believe that our ability to provide solutions that address all aspects of in vivo biologyearly-stage drug research are increasingly attractive to our clients, and we continue to design and market our commercial activities to deliver flexible, customized programs designed by segment to meet our clients' global and site-specific needs.
Competition
Competition
Our goal is to be a leader in each of the markets in which we participate. We compete in the marketplace on the basis of our therapeutic and scientific expertise in in vivo biology,early-stage drug research, quality, reputation, flexibility, responsiveness, pricing, innovation, and global capabilities. We are able to offer a unique portfolio of early-stage products and services to support drug discovery and development.
We encounter a broad range of competitors of different sizes and capabilities in each of our three businesses segments, although the largest competitors within any segment vary. We also face competition from the internal discovery and development resources of our clients.
The competitive landscape for our two business segments varies.
For RMS, ourwe have five main competitors include three smaller companies in North America (each of whom has a global scope), and several smaller competitors in Europe and in Japan.Of our main U.S. competitors, two are privately held businesses and the thirdwhich one is a government funded, not-for-profit institution.entity; one is part of a large public company; two are privately held in Europe and one is privately held in the U.S. We believe that none of these competitors compares to us in global reach, financial strength, breadth of product and services offerings, technical expertise, or pharmaceutical and biotechnology industry relationships.
For PCS, we believe we areDSA, both our Discovery Services and Safety Assessment businesses have numerous competitors. Discovery has hundreds of competitors, as it is a highly competitive and fragmented market. Safety Assessment has seven main competitors; one is part of the two largest providers of preclinical servicesa large public company in the world, based on net service revenue. U.S.; one is a privately held company in the U.K.; one is a public company in China; two are privately held companies in the U.S.; one is privately held in Canada; and one is privately held in France. Our commercial competitors for preclinical services consist of both publicly held and privately owned companies, and it is estimated that the top ten participants (including us) account for a significant portion of the global outsourced preclinical market, with the rest of the market remaining highly fragmented. Our PCSDSA segment also competes with in-house departments of pharmaceutical and biotechnology companies, universities, and teaching hospitals.
We believe that the barriers to entry in a majority
For Manufacturing, each of our underlying businesses has several competitors. In addition to many smaller competitors, Biologics has five main competitors, of which two are public companies in Europe, one is a private company in the U.S., one is a public company in China, and one is a public company in the U.S. Avian has one main competitor to its SPF eggs business, unitswhich is privately held in Europe, and numerous competitors for services provided through our specialized avian laboratory. Microbial Solutions has five main competitors, of which three are generally highpublic companies in Europe and present a significant impediment for new market participants, particularlytwo are privately held in those areasthe U.S. Contract Manufacturing has five main competitors, of which require substantial capital expenditures, trainedtwo are public companies in the U.S. and specialized personnel, and mandate GLP-compliant practices.three are privately held in Europe.
Industry Support and Animal Welfare
One of our core values is a concern for, and commitment to, animal welfare. We have been in the forefront of animal welfare improvements in our industry, and continue to show our commitment with special recognition programs for employees who demonstrate an extraordinary commitment in this critical aspect of our business. We created our own Humane Care Initiative, which is directed by our Animal Welfare and Training Group. The goal of the initiative is to assure that we continue as a worldwide leader in the humane care of laboratory animals.animals and implementation of the 3Rs (Replacement, Reduction and Refinement). Laboratory animals are an important resource that further our knowledge of living systems and contribute to the discovery of life-saving drugs and procedures. We work hand-in-hand with the scientific community to understand how living conditions, handling procedures and stress play a role in the quality and efficiency of research. As animal caregivers and researchers, we are responsible to our clients and the public for the health and well-being of the animals in our care.
We are firmly committed to the 3Rs (Replacement, Reduction, and Refinement) and help to reducereducing the number of animals used by emphasizing health and genetic integrity to decrease study data variability. Whenever possible, we use technological advances such as new diagnostic tests for screening pathogens in laboratory rodents, microsampling and in vitro assays. We also partner with customers to develop study designs decreasing the number of animals needed and suggesting pilot studies where appropriate. We also maintain a quarterly award recognizing our employees’ efforts to continually implement the 3Rs at our sites globally.
We support a wide variety of organizations and individuals working to further animal welfare as well as the interests of the biomedical research community. We fund scholarships to laboratory animal training programs, provide financial support to non-profit institutions that educate the public about the benefits of animal research and provide awards and prizes to outstanding leaders in the laboratory animal medicine field.field and the supporters of 3Rs.
Employees
As of December 28, 2013,31, 2016, we had approximately 7,70011,000 employees (including approximately 6601,200 science professionals with advanced scientific degrees, including Ph.D.s, D.V.M.s and M.D.s). Our employees are not unionized in the United States, although employees are unionizedU.S. Employees at some of our European facilities are represented by works councils and/or unions, which is consistent with local customs for our industry. We believe we have good relationships with our employees, based on a number of factors including employee retention and employee surveys.
survey results.
Backlog
Our backlog for our PCS business segment from continuing operationsRMS, DSA and Manufacturing reportable segments was $213.8$88.0 million, at$551.8 million and $39.5 million, respectively, as of December 28, 2013,31, 2016, as compared to $213.9$106.6 million, at$327.8 million and $36.2 million, respectively, as of December 29, 2012. Our preclinical26, 2015. Related services are performed over varying durations, from short to extended periods of time, which may be as long as several years. We maintain an order backlog to track anticipated revenue from studies and projects that either have not started, but are anticipated to begin in the near future, or are in process and have not been completed. We only recognize a study or project in backlog after we have received written evidence of a client's intention to proceed. We do not recognize verbal orders as backlog. Canceled studies or projects are removed from backlog. We do not report backlog for our RMS business segment because turnaround time from order placement to fulfillment, both for products and services, is rapid.
We believe our aggregate backlog as of any date is not necessarily a meaningful indicator of our future results for a variety of reasons. First, studies vary in duration (i.e., some studies or projects that are included in 2013December 31, 2016 backlog may be completed in 2014,2017, while others may be completed in later years). Second, the scope of studies or projects may change, which may either increase or decrease their value. Third, studies or projects included in backlog may be subject to bonus or penalty payments. Fourth, studies or projects may be terminated or delayed at any time by the client or regulatory authorities for a number of reasons, including the failure of a drug to satisfy safety and efficacy requirements, or a sponsor making a strategic decision that a study or service is no longer necessary. Delayed contracts remain in our backlog until a determination of whether to continue, modify, or cancel the study has been made. We cannot provide any assurance that we will be able to realize all or most of the net revenues included in backlog or estimate the portion to be filled in the current year.
Regulatory Matters
Regulatory Matters
As our business operates in a number of distinct operating environments and in a variety of locations worldwide, we are subject to numerous, and sometimes overlapping, regulatory environments.
The Animal Welfare Act (AWA) governs the care and use of certain species of animals used for research in the United StatesU.S. other than laboratory rats, mice and chickens. As a result, most of our U.S. small animal research models activities and our avian vaccine services operations are not subject to regulation under the AWA. For regulated species, the AWA and the associated Animal Care regulations require producers and users of regulated species to provide veterinary care and to utilize specific husbandry practices such as cage size, shipping conditions, sanitation and for certain species, environmental enrichment to assure the welfare of these animals. Separately, facilities using live vertebrate animals in research funded by the U.S. Public Health Service (PHS) must also adhere to the PHS Policy on Humane Care and Use of Laboratory Animals and follow the Guide for the Care and Use of Laboratory Animals produced by the Institute for Laboratory Animal Research (ILAR).Research.
We comply with licensing and registration requirement standards set by the United States Department of Agriculture (USDA) and similar agencies in other countries such as the European Union, China, Japan, and Canada for the care and use of regulated species. Our animal production facilities in the U.S. and Canada and, our preclinicalDSA facilities in the U.S. and Canada, and most of our DSA and RMS sites in the Europe are accredited by the Association for Assessment and Accreditation of Laboratory Animal Care International, (AAALAC), a private, nonprofit, international organization that promotes the humane treatment of animals in science through voluntary accreditation and assessment programs.
Our import and export of animals and our operations in foreign countries are subject to international agreements and conventions, as well as a variety of national, regional, and local laws and regulations, which establish the standards for the humane treatment, care, handling, and transport of animals by dealers and research facilities.
We conduct nonclinicalnon-clinical safety assessment studies to support the submissions for approval or licensing of our clients' products throughout the world. Many of these studies must comply with national statutory or regulatory requirements for Good Laboratory Practice (GLP). GLP regulations describe a quality system for the organizational process and the conditions under which nonclinicalnon-clinical studies are planned, performed, monitored, recorded, reported and archived. GLP compliance is required by such regulatory agencies as the FDA, United States Environmental Protection Agency, European Medicines Agency, (EMA), Medicines and Healthcare Products Regulatory Agency (MHRA) in the United Kingdom (U.K.), Health Products Regulatory Authority in Ireland, Health Canada and other similar agenciesmonitoring authorities in the countries where we operate. GLP requirements are significantly harmonized throughout the world and our laboratories are capable of conducting studies in compliance with all necessary requirements.
Our manufacturingManufacturing businesses produce endotoxin test kits, reagents, cell banks used in research and biopharmaceutical production, clinical trial vaccines, and vaccine support products and provided GMP contract manufacturing of clinical and marketed products. Additionally, several of our laboratories conduct analytical testing such as identity, stability, sterility and potency testing in support of our clients' manufacturing programs.programs working with our clients to fulfill their validation requirements as applicable. These activities are subject to regulation and consequently require these businesses to be inspected by the FDA and other national regulatory agencies under their respective current Good Manufacturing Practice (cGMP) regulations. These regulations require that we manufacture our products or perform testing in a prescribed manner with respect to cGMP compliance, and maintain records of our manufacturing, testing and control activities. In addition, the specific activities of some of our businesses require us to hold specialized licenses for the manufacture, distribution and/or marketing of particular productsproducts.
All of our sites are subject to licensing and regulation under international treaties and conventions, including national, regional and local laws relating to to:
the surface and air transportation of chemicals, biological reagents and laboratory specimens, specimens;
the handling, use, storage, and disposal of chemicals (including narcotics and psychotropic drugs), biological reagents, laboratory specimens, hazardous waste, and radioactive materials,materials;
the procurement, handling, use, storage, and disposal of human cells, tissues, and cellular and tissue based products for research purposes;
the safety and health of laboratory employees.employees and visitors to our facilities; and
Toprotection of the environment and general public.
Global compliance programs are centralized under a single group responsible for global quality programs and systems to ensure that all business sectors comply with applicable statutory and regulatory requirements and satisfy our clientclients’ expectations for
quality and regulatory compliance, we established a corporate regulatory affairs and compliance organization that oversees our corporate quality system and conducts regular audits of our quality assurance functions.compliance. To assure these compliance obligations, we established quality assurance units (QAU)(QAUs) in each of our nonclinical laboratories.regulated businesses that require independent oversight. The QAUs operate independently from those individuals that direct and conduct studies.
studies, manufacturing or analytical testing that studies that supports manufacturing.
Intellectual Property
We develop and implement computer software and technically derived procedures and products intended to maximize the quality and effectiveness of our services. Although our intellectual property rights are valuable to our success, we believe that such factors as the technical expertise, proprietary know-how, ability, and experience of our professionals are more important, and that, overall, these technological capabilities provide significant benefits to our clients. Where we consider it appropriate, steps are taken to protect our know-how through confidentiality agreements and registrations. In addition, we in-license technology and products from other companies when it enhances both our product and services businesses. In the future, in-licensing may become a larger initiative to enhance our offerings, particularly as we focus on therapeutic area expertise. With the exception of technology related to our EMDMicrobial Solutions testing business, including Accugenix and the Endosafe-PTS, we have no patents, trademarks, licenses, franchises, or concessions which are material and upon which any of our products or services are dependent.
Corporate Governance
We are committed to operating our business with integrity and accountability. We strive to meet or exceed all of the corporate governance standards established by the New York Stock Exchange, the Securities and Exchange Commission,SEC, and the Federal government as implemented by the Sarbanes-Oxley Act of 2002 and the Dodd-Frank Wall Street Reform and Consumer Protection Act of 2010. Eight of the nine members of our Board of Directors are independent and have no significant financial, business, or personal ties to us or management and all of our board committees (with the exception of our Executive Committee and our Strategic Planning and Capital Allocation Committee) are composed entirely of independent directors. The Board adheres to our Corporate Governance Guidelines and a Code of Business Conduct and Ethics which has been communicated to
employees and posted on our website. We are diligent in complying with established accounting principles and are committed to providing financial information that is transparent, timely, and accurate. We have a Related Person Transactions Policy designed to promote the timely identification of such transactions and to ensure we give appropriate consideration to any real or perceived conflicts in our commercial arrangements. We have a global process through which employees, either directly or anonymously, can notify management (and the Audit Committee of the Board of Directors) of alleged accounting and auditing concerns or violations including fraud. Our internal Disclosure Committee meets regularly and operates pursuant to formal disclosure procedures and guidelines which help to ensure that our public disclosures are accurate and timely. Copies of our Corporate Governance Guidelines, Code of Business Conduct and Ethics, and Related Person Transactions Policy are available on our website at www.criver.com underwww.ir.criver.com.
Executive Officers of the “Investor Relations-Corporate Governance” caption.Registrant (pursuant to Instruction 3 to Item 401(b) of Regulation S-K)
Below are the names, ages and principal occupations of each of our current executive officers. All such persons have been elected to serve until their successors are elected and qualified or until their earlier resignation or removal.
James C. Foster, age 66, joined us in 1976 as General Counsel. During his tenure, Mr. Foster has held various staff and managerial positions, and was named our President in 1991, Chief Executive Officer in 1992 and our Chairman in 2000.
William D. Barbo, age 56, joined us in 1982 as a laboratory technician. Between 1982 and 2005, Mr. Barbo served in a variety of positions of increasing responsibilities. He was named Corporate Vice President of Research Models and Services in 2005, Corporate Senior Vice President of Global Sales and Marketing in 2010, and Corporate Executive Vice President and Chief Commercial Officer in October 2016.
David P. Johst, age 55, joined us in 1991 as Corporate Counsel and was named Vice President, Human Resources in 1995. He became Vice President, Human Resources and Administration in 1996, a Senior Vice President in 1999, and a Corporate Executive Vice President in 2005. He currently serves as our General Counsel and Chief Administrative Officer and is responsible for overseeing our corporate legal function, Human Resources department, and several other corporate staff departments. Prior to joining us, Mr. Johst was in private practice at the law firm of Hale and Dorr (now WilmerHale). Mr. Johst currently serves as a trustee of Mt. Ida College.
Davide Molho, age 47, joined our Italian operations in 1999 and was promoted to Director of Operations for RMS Italy in 2002. In 2005, his role was expanded to include French RMS operations and in 2007, he became Corporate Vice President, European Research Models and Services with responsibility for all European RMS operations. In July 2009, Dr. Molho was promoted to Corporate Senior Vice President, North American and European Research Models and Services. He was subsequently promoted to Corporate Executive Vice President and President, Global Research Models and Services in
December 2010. In 2011, Dr. Molho was named Corporate Executive Vice President, North America Operations and in December 2013, he was named Corporate Executive Vice President and President, Global RMS and DSA Operations.
David R. Smith, age 51, has served as our Corporate Executive Vice President and Chief Financial Officer since August 2015. He joined us as Corporate Vice President, Discovery Services through our acquisition of Argenta and BioFocus from Galapagos NV in March 2014 and was promoted to Corporate Senior Vice President, Global Discovery Services, in October 2014. At Galapagos, he served in various capacities, including as Chief Executive Officer of its Galapagos Services division and as Chief Financial Officer. Mr. Smith served as Chief Financial Officer for Cambridge University Hospitals from 2007 to 2013. Mr. Smith spent eight years at PricewaterhouseCoopers prior to joining AstraZeneca in 1997, where he spent the next nine years in various finance and business roles of increasingly greater responsibility.
Item 1A. Risk Factors
Set forth below, elsewhere in this Form 10-K and in other documents we file with the SEC are risks and uncertainties that could cause actual results to differ materially from the results contemplated by the forward-looking statements contained in this Form 10-K. We note that factors set forth below, individually or in the aggregate, may cause our actual results to differ materially from expected and historical results. We note these factors for investors as permitted by the Private Securities Litigation Reform Act of 1995. You should understand that it is not possible to predict or identify all such factors. Consequently, you should not consider the following to be a complete discussion of all potential risks or uncertainties.
The outsourcing trend in the preclinicalnon-clinical (discovery and safety assessment) stages of drug discovery and development may decrease, which could impair our growth.
Over the past decade, pharmaceutical and biotechnology companies have generally increased their outsourcing of preclinicalnon-clinical research support activities.activities, such as discovery and safety assessment. While many industry analysts expect the outsourcing trend to continue to increase for the next several years (although with different growth rates for different phases of drug discovery and development),decreases in preclinicalsuch outsourcing activity may result in a diminished growth rate in the sales of any one or more of our service lines and may adversely affect our financial condition and results of operations. For additional discussion of the factors that we believe have recently been influencing outsourcing demand from our clients, please see the section entitled “Our Strategy” included elsewhere in this Form 10-K. Furthermore, our client contracts are generally terminable on little or no notice. Termination of a large contract or multiple contracts could adversely affect our sales and profitability. Our operations and financial results could be significantly affected by these risks.
A reduction in research and development budgets at pharmaceutical and biotechnology companies may adversely affect our business.
Our clients include researchers at pharmaceutical and biotechnology companies. Our ability to continue to grow and win new business is dependent in large part upon the ability and willingness of the pharmaceutical and biotechnology industries to continue to spend on molecules in the preclinical phasenon-clinical phases of research and development (and in particular discovery and safety assessment) and to outsource the products and services we provide. Fluctuations in the expenditure amounts in each phase of the research and development budgets of these researchers and their organizations could have a significant effect on the demand for our products and services. Research and development budgets fluctuate due to changes in available resources, mergers of pharmaceutical and biotechnology companies, spending priorities (including available resources of our biotechnology clients, particularly those that are cash-negative, who may be highly focused on rationing their liquid assets in a challenging funding environment), general economic conditions, and institutional budgetary policies. Available funding for biotechnology clients in particular may be affected by the capital markets, investment objectives of venture capital investors, and priorities of biopharmaceutical industry sponsors.
Our business could be adversely affected by any significant decrease in drug research and development expenditures by pharmaceutical and biotechnology companies, as well as by academic institutions, government laboratories, or private foundations. In particular, studies in recent years have indicated that a majority of academic researchers are anticipating reductions in their budgets. Similarly, economic factors and industry trends that affect our clients in these industries also affect their research and development budgets and, consequentially, our business as well. The economic downturn has also negatively affected us to the extent that the spending by our global pharmaceutical clients has been directed towards their therapies in late-stage clinical rather than early-stage preclinical development as they work to replenish drug pipelines to offset the effect of patent expirations on sales. Furthermore, our clients (particularly larger biopharmaceutical companies) continue to search for ways to maximize the return on their investments with a focus on leaner research and development costs per drug candidate. For additional discussion of the factors that we believe have recently been influencing research and development budgets at our clients, please see the sections entitled “Our Strategy” and "Management's Discussion and Analysis of Financial Condition and Results of Operations" included elsewhere in this Form 10-K.
A reduction or delay in government funding of research and development may adversely affect our business.
A portion of net salesrevenue in our RMS segment is derived from clients at academic institutions and research laboratories whose funding is partially dependent on both the level and timing of funding from government sources such as the U.S. National Institutes of Health (NIH) and similar domestic and international agencies, which can be difficult to forecast. Government
funding of research and development is subject to the political process, which is inherently fluid and unpredictable. Our salesrevenue may be adversely affected if our clients delay purchases as a result of uncertainties surrounding the approval of government budget proposals. Also, government proposals to reduce or eliminate budgetary deficits have sometimes included reduced allocations to the NIH and other government agencies that fund research and development activities. Other programs, such as homeland security or defense, or general efforts to reduce the federal budget deficit could be viewed by the U.S. government as a higher priority. These budgetary pressures may result in reduced allocations in the future to government agencies that fund research and development activities. Although the Obama administration's stimulus packages in 2009, 2010 and 2014 included increases in NIH funding, NIH funding had otherwise remained fairly flat in recent years. A reduction in government funding for the NIH or other government research agencies could adversely affect our business and our financial results as it did in 2013. results. Also, there is no guarantee that NIH funding will be directed towards projects and studies that require use of our products and services.
Changes in government regulation or in practices relating to the pharmaceutical or biotechnology industries, including potential health carehealthcare reform, could decrease the need for the services we provide .provide.
Governmental agencies throughout the world, but particularly in the U.S., strictly regulate the drug development process. Our business involves helping pharmaceutical and biotechnology companies, among others, navigate the regulatory drug approval process. Accordingly, many regulations, and often new regulations, are expected to result in higher regulatory standards and often additional revenues for companies that service these industries. However, some changes in regulations, such as a relaxation in regulatory requirements or the introduction of streamlined or expedited drug approval procedures, or an increase in regulatory requirements that we have difficulty satisfying or that make our services less competitive, could eliminate or substantially reduce the demand for our services.
Although we believe we are currently in compliance in all material respects with national, regional, and local laws, as well as other accepted guidance used by oversight bodies (which include the USDA, the standards set by the International Air Transport Association, the Convention on International Trade in Endangered Species of Wild Fauna and Flora, U.S. Fish and Wildlife Service, The Centers for Disease Control, the Department of Transportation, the Department of State, the office of Laboratory Animal Welfare of NIH, the Drug Enforcement Agency, as well as numerous other oversight agencies in Canada, Europe, and European oversight agencies)Asia), failure to comply could subject us to denial of the right to conduct business, fines, criminal penalties, and other enforcement actions. In addition, if regulatory authorities were to mandate a significant reduction in safety assessment procedures which utilize laboratory animals (as has been advocated by certain groups), certain segments of our business could be materially adversely affected.
In March 2010, the U.S. Congress enacted health carehealthcare reform legislation intended over time to expand health insurance coverage and impose health industry cost containment measures. In June 2012, the U.S. Supreme Court upheld the constitutionality of this legislation. The Court’s decision allows implementation of key provisions impacting drug manufacturers going forward, including, but not limited to, (1) expansion of access to health insurance coverage, (2) expansion of the Medicaid program, (3) enactment of an industry fee on pharmaceutical companies, and (4) imposition of an excise tax on the sale of medical devices. Since the law and its implementation continue to face challenges in Congress and federal courts, and from certain state governments, conservativeopposition advocacy groups, and some small business organizations, as well as from the incoming president and his administration, we are uncertain as to the ultimate effects of this legislation on our business and are unable to predict what legislative proposals will be adopted in the future.
Implementation of health carehealthcare reform legislation may have certain benefits, but also may contain costs that could limit the profits that can be made from the development of new drugs. This could adversely affect research and development expenditures by pharmaceutical and biotechnology companies, which could in turn decrease the business opportunities available to us both in the U.S. and abroad. In addition, new laws or regulations may create a risk of liability, increase our costs, or limit our service offerings. Furthermore, if health insurers were to change their practices with respect to reimbursements for pharmaceutical products, our clients may spend less, or reduce their growth in spending on research and development.
The FDA isIn addition, the recent presidential and congressional elections in the processU.S. may result in significant changes in, and uncertainty with respect to, legislation, regulation and government policy. While it is not possible to predict whether and when any such changes will occur, changes at the local, state or federal level may significantly impact our domestic and foreign businesses and/or those of reviewingour clients. Specific legislative and modernizingregulatory proposals discussed during and after the GLP regulationselection that may have a material impact on us or our clients include, but are not limited to, reflect current industry standards. As this may change someappeal or reform of the GLPHealth Care Reform Act; and modifications to international trade policy, public company reporting requirements, the regulatory impact will not be known until the final regulations are issued.environmental regulation and antitrust enforcement.
Contaminations in our animal populations can damage our inventory, harm our reputation for contaminant-free production, result in decreased sales and cause us to incur additional costs.
Our research models and fertile chicken eggs must be free of certain infectious agents such as certain viruses and bacteria because the presence of these contaminants can distort or compromise the quality of research results and could adversely
impact human or animal health. The presence of these infectious agents in our animal production facilities and certain service operations could disrupt our contaminant-free research model and fertile egg production as well as our animal services businesses including GEMS, harm our reputation for contaminant-free production, and result in decreased sales.
ContaminationsIf they occur, contaminations typically require cleaning up, renovating, disinfecting, retesting, and restarting production or services. Such clean-ups result in inventory loss, clean-up and start-up costs, and reduced sales as a result of lost client orders and potentially credits for prior shipments. In addition to microbiological contaminations, the potential for genetic mix-ups or mis-matings also exists and may require the restarting of the applicable colonies. While this does not require the complete clean-up, renovation, and disinfection of the barrier room, it would likely result in inventory loss, additional start-up costs and possibly reduced sales. Contaminations also expose us to risks that clients will request compensation for damages in excess of our contractual indemnification requirements. There also exists a risk that contaminations from models that we produce may affect our client's facilities, with similar impact to them.them for which we could be liable for damages. In some cases, we may produce or import animals carrying infectious agents capable of causing disease in humans; and in the case of such a contamination or undiagnosed infection, there could be a possible risk of human exposure and infection.
We are also subject to similar contamination risks with respect to our large research models. While often we own these models, they may be maintained on our behalf at a site operated by the original provider. Accordingly, risk of contamination may be outside of our control, and we depend on the practices and protocols of third parties to ensure a contamination-free environment. A contamination may require extended CDC quarantine with subsequent reduced sales as a result of lost client orders as well as the potential for complete inventory loss and disinfection of the affected quarantine rooms. Furthermore, while we often negotiate for contractual risk indemnification, we may be exposed in the event of such contaminations if the third party does not fulfill its indemnification obligation or is unable to as a result of insolvency or other impediments.
All such contaminations described above are unanticipated and difficult to predict and could adversely impact our financial results. Many of our operations are comprised of complex mechanical systems which are subject to periodic failure, including aging fatigue. Such failures are unpredictable, and while we have made significant capital expenditures designed to create redundancy within these mechanical systems, strengthen our biosecurity, improve our operating procedures to protect against such contaminations, and replace impaired systems and equipment in advance of such events, failures and/or contaminations may still occur.
Any failure by us to comply with applicable regulations and related guidance could harm our reputation and operating results, and compliance with new regulations and guidance may result in additional costs.
Any failure on our part to comply with applicable regulations could result in the termination of ongoing research or the disqualification of data for submission to regulatory authorities. This could harm our reputation, our prospects for future work and our operating results. For example, the issuance of a notice of objectionable observations or a warning from the FDA based on a finding of a material violation by us for Good Laboratory PracticeGLP or current Good Manufacturing PracticecGMP requirements could materially and adversely affect us. In recent years, the FDA has significantly increased the number of warning letters regarding drug products. If our operations are found to violate any applicable law or other governmental regulations, we might be subject to civil and criminal penalties, damages and fines. Any action against us for violation of these laws, even if we successfully defend against it, could cause us to incur significant legal expenses, divert our management's attention from the operation of our business and damage our reputation.
In addition, regulations and guidance worldwide concerning the production and use of laboratory animals for research purposes continuescontinue to be updated. Notably, the European Directive 2010/63/EU requires new standards for animal housing and accommodations that require implementation by 2017. Some of these new standards require additional operating and capital expenses that will impact not only us and our industry competitors, but clients in the biomedical research community through both changes in the pricing of goods and services and changes in their own operations.
Similarly, guidance has been and continues to be developed for other areas that impact the biomedical research community on both a national and international basis including transportation, mandated contingency planning, euthanasia guidance, import and export requirements of biological materials, health monitoring requirements and the use of disinfectants.
We could experience a breach of the confidentiality of the information we hold or of the security of our computer systems.
We operate large and complex computer systems that contain significant amounts of client data. As a routine element of our business, we collect, analyze, and retain substantial amounts of data pertaining to the non-clinical studies we conduct for our clients. Unauthorized third parties could attempt to gain entry to such computer systems for the purpose of stealing data or disrupting the systems. We believe that we have taken appropriate measures to protect them from intrusion, and we continue to improve and enhance our systems in this regard, but in the event that our efforts are unsuccessful, we could suffer significant harm. Our contracts with our clients typically contain provisions that require us to keep confidential the information generated from these studies. In the event the confidentiality of such information was compromised, we could suffer significant harm.
Our revenue generating agreements contain termination and service reduction provisions or may otherwise terminate according to their term, which may result in less contract revenue than we anticipate.
Many of our agreements with both large and small clients, including those which underlie our strategic relationships with some of our more significant customers, provide for termination or reduction in scope with little or no notice. In addition, we sell our products and services to our competitors, and similarly they sell products and services to us. For instance, we have historically entered into, and currently are party to, contracts with certain of our competitors to distribute specialty research models in locations where our competitors may not have distribution capabilities.
Clients and/or competitors may elect to terminate their agreements with us for various reasons including:
the products being tested fail to satisfy safety requirements;
unexpected or undesired study results;
production problems resulting in shortages of the drug being tested;
a client's decision to forego or terminate a particular study;
establishment of alternative distribution channels by our competitors;
the loss of funding for the particular research study; or
general convenience/counterparty preference.
If a client or competitor terminates a contract with us, we are typically entitled under the terms of the contract to receive revenue earned to date as well as certain other costs and, in some cases, termination fees. Cancellation of a large contract or proximate delay, cancellation or conclusion of multiple contracts could materially adversely affect our business and, therefore, may adversely affect our operating results.
Many of our contracts are fixed price and may be delayed or terminated or reduced in scope for reasons beyond our control, or we may under‑price or overrun cost estimates with these contracts, potentially resulting in financial losses.
Many of our contracts provide for services on a fixed price or fee-for-service with a cap basis and, accordingly, we bear the financial risk if we initially under-price our contracts or otherwise overrun our cost estimates. In addition, these contracts may be terminated or reduced in scope either immediately or upon notice. Cancellations may occur for a variety of reasons, and often at the discretion of the client. The loss, reduction in scope or delay of a large contract or the loss or delay of multiple contracts could materially adversely affect our business, although our contracts frequently entitle us to receive the costs of winding down the terminated projects, as well as all fees earned by us up to the time of termination. Some contracts also entitle us to a predetermined termination fee and irrevocably committed costs/expenses.
We could experience a breach of the confidentiality of the information we hold or of the securitySeveral of our computer systems.product and service offerings are dependent on a limited source of supply, which if interrupted could adversely affect our business.
We operatedepend on a limited international source of supply for certain products, such as large and complex computer systems that contain significant amountsresearch models. Disruptions to their continued supply may arise from health problems, export or import laws/restrictions or embargoes, international trade regulations, foreign government or economic instability, severe weather conditions, increased competition among suppliers for models, disruptions to the air travel system, activist campaigns, commercial disputes, supplier insolvency, or other normal-course or unanticipated events. Any disruption of client data. As a routine element ofsupply could harm our business if we collect, analyzecannot remove the disruption or are unable to secure an alternative or secondary supply source on comparable commercial terms.
If we are not successful in selecting and retain substantial amounts of data pertaining tointegrating the preclinical studiesbusinesses and technologies we conduct foracquire, or in managing our clients. Unauthorized third parties could attempt to gain entry to such computer systems forcurrent and future divestitures, our business may suffer.
During the purpose of stealing data or disrupting the systems. We believe thatpast fifteen years, we have taken appropriate measuressteadily expanded our business through numerous acquisitions. We plan to protect them from intrusion, and we continue to improveacquire businesses and enhancetechnologies and form strategic alliances. However, businesses and technologies may not be available on terms and conditions we find acceptable. We risk spending time and money investigating and negotiating with potential acquisition or alliance partners, but not completing transactions.
In April 2016, we acquired WIL Research, a premier provider of safety assessment and contract development manufacturing services to biopharmaceutical, agricultural, and industrial chemical companies worldwide. This transaction was our largest acquisition in over ten years.
Acquisitions and alliances involve numerous risks which may include:
difficulties in achieving business and financial success;
difficulties and expenses incurred in assimilating and integrating operations, services, products, technologies, or pre-existing relationships with our customers, distributors, and suppliers;
challenges with developing and operating new businesses, including those which are materially different from our existing businesses and which may require the development or acquisition of new internal capabilities and expertise;
potential losses resulting from undiscovered liabilities of acquired companies that are not covered by the indemnification we may obtain from the seller or the insurance we acquire in connection with the transaction;
loss of key employees;
the presence or absence of adequate internal controls and/or significant fraud in the financial systems in this regard, butof acquired companies;
diversion of management's attention from other business concerns;
becoming subject to a more expansive regulatory environment;
acquisitions could be dilutive to earnings, or in the event of acquisitions made through the issuance of our common stock to the shareholders of the acquired company, dilutive to the percentage of ownership of our existing shareholders;
risks of not being able to overcome differences in foreign business practices, customs, and importation regulations, language, and other cultural barriers in connection with the acquisition of foreign companies;
new technologies and products may be developed which cause businesses or assets we acquire to become less valuable; and
risks that disagreements or disputes with prior owners of an acquired business, technology, service, or product may result in litigation expenses and diversion of our efforts are unsuccessful we could suffer significant harm. Our contracts with our clients typically contain provisions that require us to keep confidential the information generated from these studies. management's attention.
In the event that an acquired business, technology, or an alliance does not meet our expectations, our results of operations may be adversely affected.
Some of the confidentialitysame risks exist when we decide to sell a business, site, or product line. In addition, divestitures could involve additional risks, including the following:
difficulties in the separation of such information was compromised,operations, services, products, and personnel;
diversion of management's attention from other business concerns; and
the need to agree to retain or assume certain current or future liabilities in order to complete the divestiture.
We continually evaluate the performance and strategic fit of our businesses. These and any divestitures may result in significant write-offs, including those related to goodwill and other intangible assets, which could have an adverse effect on our results of operations and financial condition. In addition, we could suffermay encounter difficulty in finding buyers, or, alternative exit strategies at acceptable prices and terms, and in a timely manner. We may not be successful in managing these or any other significant harm.risks that we encounter in divesting a business, site, or product line, and as a result, we may not achieve some or all of the expected benefits of the divestiture.
Impairment of goodwill or other intangible assets may adversely impact future results of operations.
We have intangible assets, including goodwill, and other identifiable and indefinite-lived acquired intangibles on our balance sheet due to our acquisitions of businesses. The initial identification and valuation of these intangible assets and the determination of the estimated useful lives at the time of acquisition involve use of management judgments and estimates. These estimates are based on, among other factors, input from accredited valuation consultants, reviewsprojections of projected future income cash flows that arise from identifiable intangible assets of acquired businesses and statutory regulations. The use of alternative estimates and assumptions might have increased or decreased the estimated fair valuediscount rates based on an analysis of our goodwillweighted average cost of capital, adjusted for specific risks associated with the assets. Disruptions in global financial markets and deterioration of economic conditions could, among other things, impact the discount rate and other assumptions used in the valuations and actual cash flows arising from a particular intangible assets thatasset could potentiallyvary from projected cash flows, which could imply different carrying values from those established at the dates of acquisition and which could result in a different impact to our resultsimpairment of operations.such assets.
If the future growth and operating results of our business are not as strong as anticipated, overall macroeconomic or industry conditions deteriorate and/or our market capitalization declines, this could impact the assumptions used in calculatingestablishing the faircarrying value of goodwill.goodwill or other intangible assets. To the extent goodwill isor other intangible assets are impaired, itstheir carrying value will be written down to itstheir implied fair valuevalues and a charge will be made to our income from continuing operations. Such an impairment charge could materially and adversely affect our operating results. As of December 28, 2013,31, 2016, the carrying amount of goodwill and other intangibles was $315.2 million on theour consolidated balance sheet.sheet was $1,182.0 million.
Our business is subject to risks relating to operating internationally.
A significant part of our net salesrevenue is derived from operations outside the U.S. Our international revenues, which include revenues from our non-U.S. subsidiaries, haverevenue represented approximately one-half of our total net salesrevenue in recent years.We expect that international revenuesrevenue will continue to account for a significant percentage of our revenuestotal revenue for the foreseeable future. There are a number of risks associated with our international business including:
foreign currencies we receive for sales and in which we record expenses outside the U.S. could be subject to unfavorable exchange rates with the U.S. dollar and reduce the amount of revenue and cash flow (and increase the amount of expenses) that we recognize and cause fluctuations in reported financial results;
certain contracts, particularly in Canada, are frequently denominated in currencies other than the currency in which we incur expenses related to those contracts, and where expenses are incurred in currencies other than those in which contracts are priced, fluctuations in the relative value of those currencies could have a material adverse effect on our results of operations;
general economic and political conditions in the markets in which we operate;
potential international conflicts, including terrorist acts;
potential trade restrictions, exchange controls, adverse tax consequences, and legal restrictions on the repatriation of funds into the U.S.;
difficulties and costs associated with staffing and managing foreign operations, including risks of work stoppages and/or strikes, as well as violations of local laws or anti-bribery laws such as the U.S. Foreign Corrupt Practices Act, the UK Bribery Act, and the OECD Convention on Combating Bribery of Foreign Public Officials in International Business Transactions;
unexpected changes in regulatory requirements;
the difficulties of compliance with a wide variety of foreign laws and regulations;
unfavorable labor regulations in foreign jurisdictions;
potentially negative consequences from changes in or interpretations of USU.S. and foreign tax laws;
exposure to business disruption or property damage due to geographically unique natural disasters;
longer accounts receivable cycles in certain foreign countries; and
import and export licensing requirements.
These risks, individually or in the aggregate, could have an adverse effect on our results of operations and financial condition. For example, as mentioned above, we are subject to compliance with the United StatesU.S. Foreign Corrupt Practices Act and similar anti-bribery laws, which generally prohibit companies and their intermediaries from making improper payments to foreign
government officials for the purpose of obtaining or retaining business. While our employees, distributors and agents are required to comply with these laws, we cannot be sure that our internal policies and procedures will always protect us from violations of these laws despite our commitment to legal compliance and corporate ethics. The occurrence or allegation of these types of risks may adversely affect our business, performance, prospects, value, financial condition, and results of operations.
New technologies may be developed, validated, and increasingly used in biomedical research that could reduce demand for some of our products and services.
The scientific and research communities continue to explore methods to develop improved models and systems that would improve the translation of cellular and animal models to human studies and vice-versa and possibly replace or supplement the use of traditional living animals as test platforms in biomedical research. Some companies have developed techniques in these areas that may have scientific merit to improve translation between species. In addition, technological improvements to existing or new processes, such as imaging and other translational biomarker technologies, could result in the refinement and utility for the number of animal research models necessary to improve the translation from non-clinical to clinical studies. There is an increasing push to focus on in vitro technologies such that employ human materials, stem cell technology, and other model creation technology. However, the increasing availability and utility of these in vitro models is partially offset by these technologies facilitating the creation of humanized, highly specialized and specific disease-mimicking models we can produce.
It is our strategy to explore these in vitro technologies to refine and potentially reduce the utilization of animal models as these new methods become validated. For example, ChanTest Corporation has a well-developed program to evaluate the cardiac properties of induced pluripotent stem cell-derived cardiomyocytes. We may not be successful in commercializing these methods, and, furthermore, revenues from these new models and approaches if successfully developed may not offset reduced sales or profits from research models. In addition, alternative research methods could decrease the need for future research models, and we may not be able to develop new products effectively or in a timely manner to replace any lost sales. Lastly, other companies or entities may develop research models with characteristics different than the ones that we produce, and which may be viewed as more desirable by some of our clients.
Negative attention from special interest groups may impair our business.
The products and services which we provide our clients are essential to the drug discovery, development and manufacturing process,processes, and are almost universally mandated by law. Notwithstanding, certain special interest groups categorically object to the use of animals for valid research purposes. Historically, our core research model activities with rats, mice and other rodents have not been the subject of significant animal rights media attention. However, research activities with animals have been the subject of adverse attention, including shareholder proposals and attempts to disrupt air carriers from transporting research models, impacting the industry. This has included periodic demonstrations near facilities operated by us and at our annual meetings, as well as shareholder proposals we received for some of our 2012 and 2013past Annual Meetings. In some instances, periodic demonstrations at our operating sites occur.Meetings of Shareholders. Any negative attention, threats or acts of vandalism directed against either our animal research activities or our third party service providers such as our airline carriers in the future could impair our ability to operate our business efficiently.
Our debt level could adversely affect our business and growth prospects.
As of December 31, 2016, we had $1.2 billion of debt. Our debt could have significant adverse effects on our business, including making it more difficult for us to obtain additional financing on favorable terms; requiring us to dedicate a substantial portion of our cash flows from operations to the repayment of debt and the interest on this debt; limiting our ability to capitalize on significant business opportunities; and making us more vulnerable to rising interest rates. For additional information regarding our debt, please see Note 7, “Long-Term Debt and Capital Lease Obligations”, included in the Notes to Consolidated Financial Statements included elsewhere in this Form 10-K.
The drug discovery, and development services industry isand manufacturing support industries are highly competitive.
The drug discovery, non-clinical development, and developmentmanufacturing support services industry isindustries are highly competitive. We often compete for business not only with other CROs, but also with internal discovery and development departments within our larger clients, who may have greater resources than ours. We also compete with universities and teaching hospitals for outsourced services. We compete on a variety of factors, including:
reputation for on-time quality performance;
reputation for regulatory compliance;
expertise and experience in multiple specialized areas;
scope and breadth of service and product offerings across the drug discovery and development spectrum;
scope and breadth of service and product offerings across the manufacturing support spectrum;
ability to provide flexible and customized solutions to support our clients' drug discovery, non-clinical development, and developmentmanufacturing support needs;
broad geographic availability (with consistent quality);
price/value;
technological expertise and efficient drug development processes;
quality of facilities;
financial stability;
size;
ability to acquire, process, analyze, and report data in an accurate manner; and
accessibility of client data through secure portals
portals.
If we do not compete successfully, our business will suffer. Increased competition might lead to price and other concessions that mightcould adversely affect our operating results. The drug discovery and development services industry has continued to see a trend towards consolidation, particularly among the biotechnology companies, who are targets for each other and for larger pharmaceutical companies. If this trend continues, it is likely to produce more competition among the larger companies and CROs generally, with respect to both clients and acquisition candidates. In addition, while there are substantial barriers to entry for large, global competitors with broad-based services, small, specialized entities considering entering the CRO industryindustries will continue to find lower barriers to entry, and private equity firms may determine that there are opportunities to acquire and consolidate these companies, thus further increasing possible competition. Furthermore, between 2006 and 2008, both Charles River and our competitors, particularly in the preclinical services area, invested significantly in capital projects to increase capacity. An ongoing challenge for all participants is balancing existing capacity and market demand. Where capacity has been increased too much, pressure to lower prices or to take on lower-margin studies and projects can occur. More generally, our competitors or others might develop technologies, services or products that are more effective or commercially attractive than our current or future technologies, services, or products, or that render our technologies, services, or products less competitive or obsolete. If competitors introduce superior technologies, services, or products and we cannot make enhancements to ours to remain competitive, our competitive position, and in turn our business, revenue, and financial condition, would be materially and adversely affected. In the aggregate, these competitive pressures may affect the attractiveness of our technologies, services, or products and could adversely affect our financial results.
Potential Changes in U.S. and International Tax Law.
In the U.S., there are several proposals to reform corporate tax law that are currently under consideration. These proposals include reducing the corporate statutory tax rate, broadening the corporate tax base through the elimination or reduction of deductions, exclusions, and credits, implementing a territorial regime of taxation, limiting the ability of U.S. corporations to deduct interest expense, associated with offshore earnings, modifying the foreign tax credit rules, and reducing the ability to defer U.S. tax on offshore earnings. These or other changes in the U.S. tax laws could increase our effective tax rate which would affect our profitability.
We could be adversely affected by tax law changes in Canada and the United Kingdom.
We have substantial operations in Canada and the United Kingdom which currently benefit from favorable corporate tax arrangements. We receive substantial tax credits in Canada, from both the Canadian federal and Quebec governments, and the United Kingdom.U.K. Any reduction in the availability or amount of these tax credits due to tax law changes or outcomes of tax controversies could have a material adverse effect on our profits, cash flow, and effective tax rate.
Currently, the OECD has developed an action plan to address concerns regarding base erosion and profit shifting (BEPS). This initiative has resulted in proposed and enacted changes to tax laws in various countries including France, Germany, and the U.K. Future changes to tax laws or interpretation of tax laws resulting from the BEPS project could increase our effective tax rate, which would affect our profitability.
Contract research services create a risk of liability.
As a CRO, we face a range of potential liabilities which may include:
errors or omissions in reporting of study detail in preclinicalnon-clinical studies that may lead to inaccurate reports, which may undermine the usefulness of a study or data from the study, or which may potentially advance studies absent the necessary support or inhibit studies from proceeding to the next level of testing;
risks associated with our possible failure to properly care for our clients' property, such as research models and samples, study compounds, records, work in progress, other archived materials, or goods and materials in transit, while in our possession;
risks that models in our breeding facilities or in facilities that we manage may be infected with diseases that may be harmful and even lethal to themselvesthem or humans, despite preventive measures contained in our policies for the quarantine and handling of imported animals; and
risks that we may have errors and omissions and/or product liabilities related to our products designed to conduct lot release testing of medical devices, and injectable drugs, food, beverages, and home and beauty products (primarily through our EMDMicrobial Solutions business), or in the testing of biologics and other services performed by our biopharmaceutical servicesBiologics business, which could result in us or our clients failing to identify unsafe or contaminated materials.
WeWhile we attempt to mitigate these risks through a variety of methods. Nonetheless,methods, it is impossible to completely eradicate such risks. In our RMS business, we mitigate these risks to the best of our abilities through our regimen of animal testing, quarantine procedures, and veterinary staff vigilance, through which we seek to control the exposure of animal related disease or infections. In our PCS business,DSA and Manufacturing businesses, we attempt to reduce these risks by contractcontractual risk transfer provisions entitling us to be indemnified or entitling ussubject to a limitation of liability, by insurance maintained by our clients andand/or by us, and by various regulatory requirements we must follow in connection with our business.
In both our RMS and PCS businesses, contractualContractual risk transfer indemnifications generally do not protect us against liability arising from certain of our own actions, such as negligence or misconduct. We could be materially and adversely affected if we are required to pay damages or bear the costs of defending any claim whichthat is not covered by aoutside any contractual indemnification provision, or if a party does not fulfill its indemnification obligations, or the damage is beyond the scope or level of insurance coverage. We also often contractually indemnify our clients (subject to a limitation of liability), similar to the way they indemnify us, and we may be materially adversely affected if we have to fulfill our indemnity obligations. Furthermore, there can be no assurance that neither we ornor a party required to indemnify us will be able to maintain such insurance coverage (either at all or on terms acceptable to us.
New technologies may be developed, validated and increasingly used in biomedical research that could reduce demand for some of our products and services.
The scientific and research communities continue to explore methods to develop improved models and systems that would replace or supplement the use of living animals as test platforms in biomedical research as well as improve the translation of cellular and animal models to human studies and vice-versa. Some companies have developed techniques in these areas that may have scientific merit. In addition, technological improvements to existing or new processes, such as imaging and other translational biomarker technologies, could result in the refinement and utility for the number of animal research models necessary to improve the translation from preclinical to human studies. It is our strategy to explore non-animal approaches to reduce the need for animal models as these new methods become validated. We may not be successful in commercializing these methods, and, furthermore, revenues from these new models and approaches if successfully developed may not offset reduced sales or profits from research models. In addition, alternative research methods could decrease the need for future research models, and we may not be able to develop new products effectively or in a timely manner to replace any lost sales. Lastly, other companies or entities may develop research models with characteristics different than the ones that we produce, and which may be viewed as more desirable by some of our clients.us).
Upgrading and integrating our business systems could result in implementation issues and business disruptions.
In recent years we implemented a project to replace many of our numerous legacy business systems at certain different sites worldwide with an enterprise wide, integrated enterprise resource planning (ERP) system. The expansion of the ERP system to other international locations may occur at a future date based on value to the business. In general, the process of planning and preparing for these types of integrated, wide-scale implementations is extremely complex and we are required to address a number of challenges including data conversion, system cutover, and user training. Problems in any of these areas could cause operational problems during implementation including delayed shipments, missed sales, billing and accounting errors, and other operational issues. There have been numerous, well-publicized instances of companies experiencing difficulties with the implementation of ERP systems, which resulted in negative business consequences.
The drug discovery and development industry has a history of patent and other intellectual property litigation, and we might be involved in costly intellectual property lawsuits.
The drug discovery and development industry has a history of patent and other intellectual property litigation and these lawsuits will likely continue. Accordingly,
In July 2015, IDEXX Laboratories, Inc. and IDEXX Distribution, Inc. (collectively, IDEXX) filed a complaint in the United States District Court for the District of Delaware alleging we face potential patent infringement suits by companies that have infringed three (3) recently issued patents for similar products and methodsrelated to a blood spot sample collection method used in businessdetermining the presence or other suits alleging infringementabsence of an infectious disease in a population of rodents. We filed our answer to the complaint on July 21, 2016. In addition, on July 29, 2016, we initiated an inter partes review (IPR) procedure with the United States Patent and Trademark Office challenging the validity of the IDEXX patents. On February 6, 2017, we entered into a settlement agreement with IDEXX, which involved the withdrawal by IDEXX of their intellectual property rights. complaint and withdrawal by us of the IPR.
Legal proceedings relating to intellectual property could beare expensive, take significant time, and divert management's attention from other business concerns, whether we win or lose. If we do not prevail in an infringement lawsuit brought against us, we might
have to pay substantial damages, including treble damages, and we could be required to stop the infringing activity or obtain a license to use technology on unfavorable terms.
Failure to achieve and maintain effective internal controls in accordance with Section 404 of the Sarbanes-Oxley Act of 2002, and delays in completing our internal controls and financial audits, could adversely affect our operating results, and investor, supplier and client confidence in our reported financial information.
If we fail to achieve and maintain effective internal controls, we may be unable to provide holders of our securities with the required financial information in a timely and reliable manner and we may incorrectly report financial information, either of which could subject us to regulatory enforcement and other actions, and could have a material adverse effect on our operations, investor, supplier and customer confidence in our reported financial information and the trading price of our common stock. Our management assessment as of December 29, 2012 revealed a material weakness in our internal controls over financial reporting due to the design and operation of certain controls over information technology, business processes and financial reporting. Specifically, we identified deficiencies with respect to controls over segregation of duties, restricted access, changes to vendor and customer master data, transaction level and financial close controls. We have since changed our internal controls to address this material weakness and concluded as of December 28, 2013 that our internal controls related to our internal control over financial reporting were operating effectively.
Although there can be no assurances, we believe these enhancements and improvements as described in detail in Item 9A of Part II of this Form 10-K, when repeated in future periods, will allow us to maintain effective controls over financial reporting. Nevertheless, we may identify other significant deficiencies or material weaknesses which we may not be able to remediate in timely manner or at all.
We may not be able to successfully develop and market new services and products.
We may seek to develop and market new services and products that complement or expand our existing business or service offerings. We believe our ability to in-license new technologies from third-partiesthird parties will be critical to our ability to offer new products and services to our customers. Our ability to gain access to technologies that we need for new products and services depends, - in part, - on our ability to convince inventors and their agents or assignees that we can successfully commercialize their inventions. We cannot guarantee that we will be able to identify new technologies of interest to our customers. Even if we are able to identify new technologies of interest, we may not be able to negotiate license agreements on acceptable terms, or at all. If we are unable to develop new services and products and/or create demand for those newly developed services and products, our future business, results of operations, financial condition, and cash flows could be adversely affected.
Several of our product and service offerings are dependent on a limited source of supply, which if interrupted could adversely affect our business.
We depend on a limited international source of supply for certain products, such as large research models. Disruptions to their continued supply may arise from health problems, export or import laws/restrictions or embargoes, international trade regulations, foreign government or economic instability, severe weather conditions, increased competition amongst suppliers for models, disruptions to the air travel system, commercial disputes, supplier insolvency, or other normal-course or unanticipated events. Any disruption of supply could harm our business if we cannot remove the disruption or are unable to secure an alternative or secondary supply source on comparable commercial terms.
Our debt level could adversely affect our business and growth prospects.
At December 28, 2013, we had approximately $664 million of debt. This debt could have significant adverse effects on our business, including making it more difficult for us to obtain additional financing on favorable terms; requiring us to dedicate a substantial portion of our cash flows from operations to the repayment of debt and the interest on this debt; limiting our ability to capitalize on significant business opportunities; and making us more vulnerable to rising interest rates. For additional information regarding our debt, please see Note 5 included in the Notes to Consolidated Financial Statements elsewhere in this Form 10-K.
If we are not successful in selecting and integrating the businesses and technologies we acquire, or in managing our current and future divestitures, our business may suffer.
During the past decade, we have expanded our business through numerous acquisitions. We plan to continue to acquire businesses and technologies and form strategic alliances. However, businesses and technologies may not be available on terms
and conditions we find acceptable. We risk spending time and money investigating and negotiating with potential acquisition or alliance partners, but not completing transactions.
Even if completed, acquisitions and alliances involve numerous risks which may include:
difficulties and expenses incurred in assimilating and integrating operations, services, products or technologies;
challenges with developing and operating new businesses, including those which are materially different from our existing businesses and which may require the development or acquisition of new internal capabilities and expertise;
diversion of management's attention from other business concerns;
potential losses resulting from undiscovered liabilities of acquired companies that are not covered by the indemnification we may obtain from the seller;
acquisitions could be dilutive to earnings, or in the event of acquisitions made through the issuance of our common stock to the shareholders of the acquired company, dilutive to the percentage of ownership of our existing shareholders;
loss of key employees;
risks of not being able to overcome differences in foreign business practices, customs and importation regulations, language and other cultural barriers in connection with the acquisition of foreign companies;
risks that disagreements or disputes with prior owners of an acquired business, technology, service or product may result in litigation expenses and distribution of our management's attention;
integration and support of preexisting supplier, distribution and customer relationships;
the presence or absence of adequate internal controls and/or significant fraud in the financial systems of acquired companies;
difficulties in achieving business and financial success; and
new technologies and products may be developed which cause businesses or assets we acquire to become less valuable.
In the event that an acquired business or technology or an alliance does not meet our expectations, our results of operations may be adversely affected.
Some of the same risks exist when we decide to sell a business, site, or product line. In addition, divestitures could involve additional risks, including the following:
difficulties in the separation of operations, services, products and personnel; and
the need to agree to retain or assume certain current or future liabilities in order to complete the divestiture.
We continually evaluate the performance and strategic fit of our businesses. These and any divestitures may result in significant write-offs, including those related to goodwill and other intangible assets, which could have an adverse effect on our results of operations and financial condition. In addition, we may encounter difficulty in finding buyers or alternative exit strategies at acceptable prices and terms and in a timely manner. We may not be successful in managing these or any other significant risks that we encounter in divesting a business, site or product line, and as a result, we may not achieve some or all of the expected benefits of the divestiture.
We depend on key personnel and may not be able to retain these employees or recruit additional qualified personnel, which would harm our business.
Our success depends to a significant extent on the continued services of our senior management and other members of management. James C. Foster, our Chief Executive Officer since 1992 and Chairman since 2000, has held various positions with us for 37 years.four decades. We have no employment agreement with Mr. Foster or other members of our non-European based senior management. If Mr. Foster or other members of senior management do not continue in their present positions, our business may suffer.
Because of the specialized scientific nature of our business, we are highly dependent upon attracting and retaining qualified scientific, technical, and managerial personnel. While we have a strong record of employee retention, there is still significant
competition for qualified personnel in the veterinary, pharmaceutical, and biotechnology fields. Therefore, we may not be able to attract and retain the qualified personnel necessary for the development of our business. The loss of the services of existing personnel, as well as the failure to recruit additional key scientific, technical, and managerial personnel in a timely manner, could harm our business.
Our quarterly operating results may vary, which could negatively affect the market price of our common stock.
Our results of operations in any quarter may vary from quarter to quarter and are influenced by such factors as:
changes in the general global economy;
the number and scope of ongoing client engagements;
the commencement, postponement, delay, progress, completion, or cancellation of client contracts in the quarter;
changes in the mix of our products and services;
competitive pricing pressures;
the extent of cost overruns;
holiday buying patterns of our clients;
budget cycles of our clients;
changes in tax laws, rules, regulations, and tax rates in the locations in which we operate;
the timing and charges associated with completed acquisitions and other events;
the financial performance of the limited partnerships in which we invest;
the occasional extra “53rd week” that we recognize in a fiscal year (and 4th fiscal quarter thereof) due to our fiscal year ending on the last Saturday in December; andventure capital investments;
| |
| • | the occasional extra week (“53rd week”) that we recognize in a fiscal year (and fourth fiscal quarter thereof) due to our fiscal year ending on the last Saturday in December; and |
exchange rate fluctuations.
We believe that operating results for any particular quarter are not necessarily a meaningful indication of future results. Nonetheless, fluctuations in our quarterly operating results could negatively affect the market price of our common stock.
Referendum on the United Kingdom’s membership in the European Union (“Brexit”) may adversely affect our business.
On June 23, 2016, the U.K. held a referendum in which voters approved an exit from the European Union (E.U.), referred to as “Brexit.” As a result of the referendum, it is expected that the British government will begin negotiating the terms of the U.K.’s future relationship with the E.U. The decision by referendum to withdraw the U.K. from the E.U. has caused significant
volatility in global stock markets and currency exchange rate fluctuations, including the strengthening of the U.S. dollar against foreign currencies. The execution of Brexit also may create global economic uncertainty, which may cause our customers and potential customers to monitor their costs and reduce their budgets for our products and services. In addition, Brexit could lead to legal uncertainty and potentially divergent national laws and regulations as the U.K. determines which E.U. laws to replace or replicate. Given that we conduct a substantial portion of our business in the E.U. and the U.K., these effects of Brexit, among others, could adversely affect our business, business opportunities, results of operations, financial condition, and cash flows.
Our industry has a history of patent and other intellectual property litigation, which can be costly.
Our industry has a history of intellectual property litigation. On July 31, 2015, IDEXX Laboratories, Inc. and IDEXX Distribution, Inc. filed a complaint in the United States District Court for the District of Delaware alleging we infringed three recently issued patents related to a dried blood spot sample collection method used in determining the presence or absence of an infectious disease in a population of rodents. Legal proceedings relating to intellectual property can be expensive, take significant time, and divert management’s attention from other business concerns, regardless of the outcome of the litigation. On February 6, 2017, we entered into a settlement agreement with IDEXX, which involved the withdrawal by IDEXX of their complaint and withdrawal by us of the IPR.
Since we do not expect to pay any cash dividends for the foreseeable future, our shareholders will benefit from an investment in our common stock only if it appreciates in value.
We have not declared or paid any cash dividends on our common stock, and do not anticipate that we will pay any dividends to holders of our common stock for the foreseeable future. Any payment of cash dividends will be at the discretion of our Board of Directors and will depend on our financial condition, capital requirements, legal requirements, earnings and other factors. Consequently, our shareholders should not rely on dividends to receive a return on their investment.
Item 1B. Unresolved Staff Comments
There are no unresolved comments to be reported in response to Item 1B.
Item 2. Properties
We own or lease the land and buildings where we have facilities. We own large facilities (facilities over 50,000 square feet) for our PCSDSA businesses in Canada, France, Ireland, Netherlands, Scotland, and the United StatesU.S. and lease large facilities in England and the United States.U.S. We own large RMS facilities in Canada, China, France, Germany, Italy, Japan, England, and the United States.U.S. We own large Manufacturing segment facilities in the U.S. and China. None of our leases is individually material to our business operations. Many of our leases have an option to renew,, and we believe that we will be able to successfully renew expiring leases on terms satisfactory to us.We believe that our facilities in each of our reportable segments are adequate for our operations and that suitable additional space will be available when needed.For additional information, see Note 10 to the Consolidated Financial7, “Long-Term Debt and Capital Lease Obligations” and Note 13, “Commitments and Contingencies” included in Item 8, “Financial Statements included elsewhereand Other Supplementary Data” in this Annual Report on Form 10-K.
In fiscal 2013, we initiated minor expansionsCapacity at certain domestic PCS sites,our Safety Assessment businesses within our DSA segment is primarily based on physical room infrastructure designed towards meeting specific scientific and regulatory requirements. We track room utilization on an international Biologics Testing Solutions site, certain international EMD sites, an international RMS siteongoing basis and a domestic Avian site and we consolidated certain domestic RMS sites. We have adequate capacity to meetdepending on the current needs of our PCSclients at given times, we may need to execute on contingent plans for expansion, which average between six and RMS clients, and we do not currently anticipate significant expansion requirements. However, many of our facilities are built for specific purposes. Thus, underutilized capacity may not be usable other than for the specific purposes without significant renovation and expense. We may expand at specific sites if we determine that it is not feasiblefifteen months to utilize available capacity at existing or suspended sites. complete.
We may also expand at specific sites in order to accommodate needs resulting from any consolidation strategy. We continue to employ a master site planning strategy to proactively evaluate our real estate needs. In certain circumstances, we dispose of or consolidate operations, which could result in impairment charges. In situations where the associated real estate is leased, and depending on the resolution of these situations, we may be encumbered with the remaining real estate lease obligations.
Item 3. Legal Proceedings
We are not party to any material legal proceedings, other than ordinary routine litigation incidental to our business that is not material to our business or financial condition.
In early May 2013, with the assistance of the law firm of Davis Polk & Wardwell LLP, the Companywe commenced an investigation ofinto inaccurate billing with respect to certain government contracts. This issue had been reported to the Company’sour senior management by a Charles River employee. The CompanyWe promptly reported these matters to the relevant government contracting officers, the Department of Health and Human Services'Services’ Office of the Inspector General, and the Department of Justice, and iswe are cooperating with these agencies to ensure the proper repayment and resolution of this matter.
The investigation to date has confirmed that the Company’sour RMS business
segment billed the Department of Health and Human Services for certain work that had not been performed with respect to a small subset of the Company’sour government contracts. It has been determined that when employees regularly assigned to work in research model barrier rooms associated with these contracts were absent, other employees' names would be substituted on time-keeping records associated with the relevant contracts. The CompanyWe billed the government for the hours associated with these substitute employees, despite the fact that, in many cases, these employees did not perform any services in connection with the relevant government contracts. Based on the findings of the investigation to date, the Company believeswe believe that this conduct was limited to the Company’sour research model facilities in Raleigh, North Carolina, and Kingston. The Company hasKingston, New York. We previously identified approximately $1.5 million inof excess amounts billed on these contracts, since January 1, 2007 and has reservedrecorded a liability for such amount. Because of the preliminary stage ofBased on our ongoing discussions with the government, we have recorded an additional charge of $0.3 million during the fiscal year 2016. Our best estimate, which totals $1.8 million, may be subject to change based on the terms of any final settlement with the Department of Justice and complex naturethe Department of this matter, the Company cannot at this time make a reasonable estimateHealth and Human Services’ Office of the potential range of loss beyond such reserve.
The Company hasInspector General. We have already taken appropriate steps to prevent this conduct from recurring, and will consider additional remedial measures following the conclusion of the investigation.matter.
In July 2015, IDEXX filed a complaint in the United States District Court for the District of Delaware alleging we have infringed three (3) recently issued patents related to a blood spot sample collection method used in determining the presence or absence of an infectious disease in a population of rodents. On September 21, 2015, we timely filed a motion to dismiss the complaint on the grounds that all of the claims are directed to unpatentable subject matter and therefore are invalid. On October 7, 2015, IDEXX filed an amended complaint, which substantially asserted the same patents and infringement allegations as asserted in the original complaint, and on October 26, 2015, we timely filed a motion to dismiss this amended complaint. The hearing on the motion to dismiss was held on January 12, 2016. On July 1, 2016, the Court issued an opinion denying the motion to dismiss. We filed our answer to the complaint on July 21, 2016. In addition, on July 29, 2016, we initiated an inter partes review (IPR) procedure with the United States Patent and Trademark Office, challenging the validity of the IDEXX patents. On February 6, 2017, we entered into a settlement agreement with IDEXX, which involved the withdrawal by IDEXX of their complaint and withdrawal by us of the IPR.
Item 4. Mine Safety Disclosures
Not Applicableapplicable.
Supplementary Item. Executive Officers of the Registrant (pursuant to Instruction 3 to Item 401(b) of Regulation S-K).
Below are the names, ages and principal occupations of each of our current executive officers. All such persons have been elected to serve until their successors are elected and qualified or until their earlier resignation or removal.
Thomas F. Ackerman, age 59, joined us in 1988 with over eleven years of combined public accounting and international finance experience. He was named Controller, North America in 1992 and became our Vice President and Chief Financial Officer in 1996. In 1999, he was named a Senior Vice President and in 2005 he was named a Corporate Executive Vice President. He is currently responsible for overseeing our Accounting and Finance Department and several other corporate staff departments. Prior to joining us, Mr. Ackerman was an accountant at Arthur Andersen & Co.
James C. Foster, age 63, joined us in 1976 as General Counsel. During his tenure, Mr. Foster has held various staff and managerial positions, and was named our President in 1991, Chief Executive Officer in 1992 and our Chairman in 2000.
Jörg M. Geller, age 59, joined our German operation in 1986 as production manager. In 1994, he was promoted to Vice President and in 2007, he was named a Senior Vice President. In 2011, Dr. Geller was promoted to Corporate Executive Vice President, European & Asian Operations and in December 2013, he was named Corporate Executive Vice President, Global Productivity and Efficiency. Prior to joining us, Dr. Geller was employed in private practice as a veterinarian.
Nancy A. Gillett, age 58, joined us in 1999 with the acquisition of Sierra Biomedical. Dr. Gillett has 29 years of experience as an ACVP board certified pathologist and scientific manager. In 1999, she became Senior Vice President and General Manager of our Sierra Biomedical division, and subsequently held a variety of managerial positions, including President and General Manager of Sierra Biomedical and Corporate Vice President and General Manager of Drug Discovery and Development (the predecessor to our PCS business segment). In 2004, Dr. Gillett was named Corporate Senior Vice President and President, Global Preclinical Services, and in 2006, she became a Corporate Executive Vice President. Currently, Dr. Gillett serves as our Corporate Executive Vice President, Chief Scientific Officer.
David P. Johst, age 52, joined us in 1991 as Corporate Counsel and was named Vice President, Human Resources in 1995. He became Vice President, Human Resources and Administration in 1996, a Senior Vice President in 1999, and a Corporate Executive Vice President in 2005. He currently serves as our General Counsel and Chief Administrative Officer and is responsible for overseeing our Corporate legal function, Human Resources department and several other corporate staff departments. Mr. Johst also currently serves as interim head of our Insourcing Solutions business. Prior to joining us, Mr. Johst was in private practice at the law firm of Hale and Dorr (now WilmerHale).
Davide Molho, age 44, joined our Italian operations in 1999 and was promoted to Director of Operations for Research Models and Services (RMS) Italy in 2002. In 2005, his role was expanded to include French RMS operations and in 2007, he became Corporate Vice President, European Research Models and Services with responsibility for all European RMS operations. In July 2009, Dr. Molho was promoted to Corporate Senior Vice President, North American and European Research Models and Services. He was subsequently promoted to Corporate Executive Vice President and President, Global Research Models and Services in December 2010. In 2011, Dr. Molho was named Corporate Executive Vice President, North America Operations and in December 2013, he was named Corporate Executive Vice President and President, Global RMS and PCS Operations.
PART II
Item 5. Market for Registrant'sRegistrant’s Common Equity, Related Stockholder Matters and Issuer Purchases of Equity Securities
Our common stock began trading on the New York Stock Exchange on June 23, 2000 under the symbol "CRL."“CRL.” The following table sets forth for the periods indicated belowshows the high and low sales prices for our common stock.stock:
| | | 2014 | High | | Low | |
| First quarter (through February 14, 2014) | $ | 59.19 |
| | $ | 52.88 |
| |
| 2013 | High | | Low | |
| Fiscal 2017 | | High | | Low |
| First quarter (through January 27, 2017) | | $ | 82.89 |
| | $ | 75.25 |
|
| Fiscal 2016 | | High | | Low |
| First quarter | $ | 46.90 |
| | $ | 36.50 |
| $ | 81.61 |
| | $ | 65.70 |
|
| Second quarter | 45.90 |
| | 40.28 |
| 87.95 |
| | 73.42 |
|
| Third quarter | 48.73 |
| | 41.05 |
| 89.18 |
| | 75.54 |
|
| Fourth quarter | 53.81 |
| | 44.12 |
| 84.53 |
| | 67.20 |
|
| 2012 | High | | Low | |
| Fiscal 2015 | | High | | Low |
| First quarter | $ | 37.02 |
| | $ | 27.39 |
| $ | 84.69 |
| | $ | 63.22 |
|
| Second quarter | 36.75 |
| | 31.82 |
| 80.30 |
| | 68.59 |
|
| Third quarter | 39.60 |
| | 32.27 |
| 78.50 |
| | 63.75 |
|
| Fourth quarter | 41.24 |
| | 35.65 |
| 80.44 |
| | 59.99 |
|
There were no equity securities that were not registered under the Securities Act of 1933, as amended, sold by the Company during the fiscal year ended December 28, 2013.2016.
Shareholders
As of January 31, 2014,27, 2017, there were approximately 442380 registered shareholders of the outstanding shares of common stock.
Dividends
Dividends
We have not declared or paid any cash dividends on shares of our common stock in the past two years and we do not intend to pay cash dividends in the foreseeable future. We currently intend to retain any earnings to finance future operations and expansion. Some of the restrictive covenants contained in our revolving credit agreement and term loan agreements limit our ability to pay dividends.
Issuer Purchases of Equity Securities
The following table provides information relating to our purchases of shares of our common stock during the fourth quarter ended of 2016:December 28, 2013.
|
| | | | | | | | | | | | | |
| Total Number of Shares Purchased |
| Average Price Paid per Share |
| Total Number of Shares Purchased as Part of Publicly Announced Plans or Programs |
| Approximate Dollar Value of Shares That May Yet Be Purchased Under the Plans or Programs |
| September 29, 2013 to October 25, 2013 | 240,040 |
| | $ | 46.81 |
| | 240,000 |
| | $ | 205,058 |
|
| October 26, 2013 to November 22, 2013 | 827,158 |
| | $ | 50.67 |
| | 827,100 |
| | $ | 163,147 |
|
| November 23, 2013 to December 28, 2013 | 455,900 |
| | $ | 52.75 |
| | 455,900 |
| | $ | 139,099 |
|
| Total: | 1,523,098 |
| | |
| | 1,523,000 |
| | |
|
|
| | | | | | | | | | | | | |
| Total Number
of Shares
Purchased |
| Average
Price Paid
per Share |
| Total Number of
Shares Purchased
as Part of Publicly
Announced Plans
or Programs |
| Approximate Dollar
Value of Shares
That May Yet Be
Purchased Under the
Plans or Programs |
| For the period | | | | | | | (in thousands) |
| September 25, 2016 to October 22, 2016 | 482 |
| | $ | 83.34 |
| | — |
| | $ | 69,694 |
|
| October 23, 2016 to November 19, 2016 | — |
| | — |
| | — |
| | 69,694 |
|
| November 20, 2016 to December 31, 2016 | 20 |
| | 71.10 |
| | — |
| | 69,694 |
|
| Total | 502 |
| | | | — |
| | |
|
On In July 29, 2010,, our Board of Directors authorized a $500$500.0 million stock repurchase program. Our Board of Directorsprogram, and subsequently approved increases to the stock repurchase program by $250 million in 2010, and by $250of $250.0 million in fiscal year 2010, $250.0 million in fiscal year 2013 and $150.0 million in fiscal year 2014, for an aggregate authorization of $1 billion.$1,150.0 million. During the fourth quarter of 2013,fiscal year 2016, we repurchased 1,523,000did not repurchase any shares of common stock for $77.2 million under our Rule 10b5-1 Purchase Plan andor in open market trading. Additionally, the Company's Incentive Plansour stock-based compensation plans permit the netting of common stock upon vesting of restricted stock, awardsperformance share units, and restricted stock units in order to satisfy individual minimum statutory tax withholding requirements. During the quarter ended December 28, 2013, the Company acquired 98 shares for a nominal amount as a result of such withholdings.
Securities Authorized for Issuance Under Equity Compensation Plans
The following table summarizes, as of December 28, 2013, the number of options issued under the Company's stock option plans and the number of options available for future issuance under these plans.
|
| | | | | | | | | | |
| Plan Category | Number of securities to be issued upon exercise of outstanding options, warrants and rights | | Weighted-average exercise price of outstanding options, warrants and rights | | Number of securities remaining available for future issuance under equity compensation plans (excluding securities reflected in column (a)) | |
| | (a) | | (b) | | (c) | |
| Equity compensation plan approved by security holders: | | | | | | |
| Charles River 2000 Incentive Plan | 588,150 |
| | $ | 46.89 |
| | 1,190,787 |
| |
| Charles River 1999 Management Incentive Plan | — |
| | $ | — |
| | 6,000 |
| |
| Inveresk 2002 Stock Option Plan | 5,233 |
| | $ | 43.03 |
| | — |
| |
| 2007 Incentive Plan | 3,175,350 |
| | $ | 39.67 |
| | 7,780,081 |
| |
| Equity compensation plans not approved by security holders | — |
| | — |
| | — |
| |
| Total | 3,768,733 |
| (1) | |
| | 8,976,868 |
| (2) |
____________________________
| |
(1) | None of the options outstanding under any of our equity compensation plans include rights to any dividend equivalents (i.e., a right to receive from us a payment commensurate to dividend payments received by holders of our common stock or our other equity instruments). |
| |
(2) | On March 22, 2007, the Board of Directors determined that, upon approval of the 2007 Incentive Plan, no future awards would be granted under the preexisting equity compensation plans, including the Charles River 1999 Management Incentive Plan and the Charles River 2000 Incentive Plan. Shareholder approval was obtained on May 8, 2007. Previously, on February 28, 2005, the Board of Directors terminated the Inveresk 2002 Stock Option Plan to the extent that no further awards would be granted thereunder. |
The following table provides additional information regarding the aggregate issuances under our existing equity compensation plans as of December 28, 2013:
|
| | | | | | | | | |
| Category | Number of securities outstanding | | Weighted average exercise price | | Weighted average term |
| | (a) | | (b) | | (c) |
| Total number of restricted shares outstanding(1) | 932,703 |
| | $ | — |
| | — |
|
| Total number of options outstanding | 3,768,733 |
| | $ | 40.80 |
| | 3.3 years |
|
| Total number of performance units outstanding | 163,847 |
| | | | |
____________________________
| |
(1) | For purposes of this table, only unvested restricted stock as of December 28, 2013 is included. Also for purposes of this table only, the total includes 123,346 restricted stock units granted to certain of our employees outside of the United States.
|
Comparison of 5-Year Cumulative Total Return
The following stock performance graph compares the annual percentage change in the Company'sCompany’s cumulative total shareholder return on its Common Stock during a period commencing on December 28, 200831, 2011 and ending on December 28, 201331, 2016 (as measured by dividing (1) the sum of (A) the cumulative amount of dividends for the measurement period, assuming dividend reinvestment, and (B) the difference between the Company'sCompany’s share price at the end and the beginning of the measurement period; by (2) the share price at the beginning of the measurement period) with the cumulative total return of the S&P 500 Index and the NASDAQ PharmaceuticalS&P 500 Health Care Index during such period. The Company has not paid any dividends on the Common Stock, and no dividends are included in the representation of the Company'sCompany’s performance. The stock price performance on the graph below is not necessarily indicative of future price performance. The graph is not “soliciting material,” is not deemed filed with the Securities and Exchange Commission and is not to be incorporated by reference in any filing of the Company under the Securities Act of 1933 or the Securities Exchange Act of 1934 whether made before or after the date hereof and irrespective of any general incorporation language in any such filing. Information used in the graph was obtained from Standards & Poor'sPoor’s Institutional Market Services, a source believed to be reliable, but the Company is not responsible for any errors or omissions in such information.information
COMPARISON OF 5 YEAR5-YEAR CUMULATIVE TOTAL RETURN
Among Charles River Laboratories International, Inc., The S&P 500 Index And
The S&P 500 Health CareIndex
And The NASDAQ Pharmaceutical Index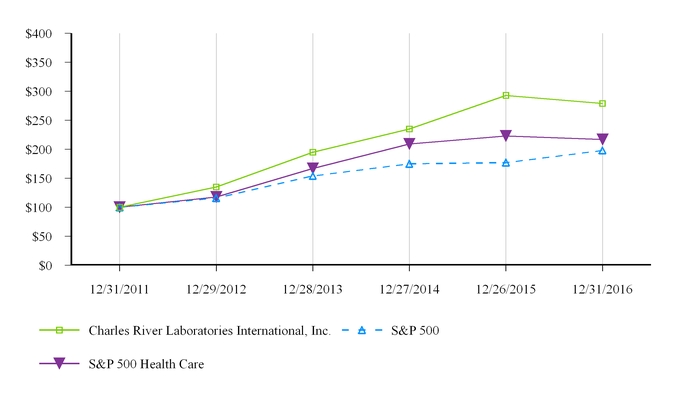
|
| | | | | | | | | | | | | | | | | | | | | | | |
| | Fiscal Year |
| | 2011 | | 2012 | | 2013 | | 2014 | | 2015 | | 2016 |
| Charles River Laboratories International, Inc. | $ | 100 |
| | $ | 135 |
| | $ | 195 |
| | $ | 235 |
| | $ | 293 |
| | $ | 279 |
|
| S&P 500 | 100 |
| | 116 |
| | 154 |
| | 175 |
| | 177 |
| | 198 |
|
| S&P 500 Health Care | 100 |
| | 118 |
| | 167 |
| | 209 |
| | 223 |
| | 217 |
|
|
| | | | | | | | | | | | | | | | | |
| | Dec. 27, 2008 | | Dec. 26, 2009 | | Dec. 25, 2010 | | Dec. 31, 2011 | | Dec. 29, 2012 | | Dec. 28,
2013 |
| Charles River Laboratories International, Inc. | 100 |
| | 131.73 |
| | 142.69 |
| | 109.23 |
| | 147.4 |
| | 213.15 |
|
| S&P 500 Index | 100 |
| | 126.46 |
| | 145.51 |
| | 148.59 |
| | 172.37 |
| | 228.19 |
|
| NASDAQ Pharmaceutical Index | 100 |
| | 104.9 |
| | 109.55 |
| | 125.16 |
| | 172.74 |
| | 284.56 |
|
Item 6. Selected Consolidated Financial Data
The following selected financial data arepresented below is derived from our Consolidated Financial Statements and notes theretoaudited consolidated financial statements and should be read in conjunction with Item 7., "Management's“Management’s Discussion and Analysis of Financial Condition and Results of Operations" and our Consolidated Financial Statements and notes theretoOperations” contained in Item 8., "Financial7 and “Financial Statements and Supplementary Data"Data” contained in Item 8 of this report.Annual Report on Form 10-K. Our fiscal year consistsis typically based on 52-weeks, with each quarter composed of 12 months13 weeks ending on the last Saturday on, or priorclosest to, March 31, June 30, September 30, and December 31. A 53rd week was included in fiscal year 2016, which is occasionally necessary to align with a December 31 calendar year-end. The additional week was included in the fourth quarter.
|
| | | | | | | | | | | | | | | | | | | |
| | Fiscal Year |
| | 2013 | | 2012 | | 2011 | | 2010 | | 2009 |
| | (dollars in thousands) |
| Statement of Income Data: | | | | | | | | | |
| Net sales | $ | 1,165,528 |
| | $ | 1,129,530 |
| | $ | 1,142,647 |
| | $ | 1,133,416 |
| | $ | 1,171,642 |
|
| Cost of products sold and services provided | 766,424 |
| | 733,901 |
| | 740,405 |
| | 748,656 |
| | 748,650 |
|
| Selling, general and administrative expenses | 225,695 |
| | 208,248 |
| | 198,648 |
| | 232,489 |
| | 227,663 |
|
| Goodwill impairment | — |
| | — |
| | — |
| | 305,000 |
| | — |
|
| Asset impairment | 4,202 |
| | 3,548 |
| | 7,492 |
| | 91,378 |
| | — |
|
| Termination fee | — |
| | — |
| | — |
| | 30,000 |
| | — |
|
| Amortization of intangibles | 17,806 |
| | 18,068 |
| | 21,796 |
| | 24,405 |
| | 25,716 |
|
| Operating income (loss) | 151,401 |
| | 165,765 |
| | 174,306 |
| | (298,512 | ) | | 169,613 |
|
| Interest income | 730 |
| | 589 |
| | 1,353 |
| | 1,186 |
| | 1,712 |
|
| Interest expense | (20,969 | ) | | (33,342 | ) | | (42,586 | ) | | (35,279 | ) | | (21,682 | ) |
| Other, net | 7,165 |
| | (3,266 | ) | | (411 | ) | | (1,477 | ) | | 1,914 |
|
| Income (loss) from continuing operations before income taxes | 138,327 |
| | 129,746 |
| | 132,662 |
| | (334,082 | ) | | 151,557 |
|
| Provision for income taxes | 32,911 |
| | 27,628 |
| | 17,140 |
| | 23 |
| | 40,354 |
|
| Income (loss) from continuing operations net of income taxes | 105,416 |
| | 102,118 |
| | 115,522 |
| | (334,105 | ) | | 111,203 |
|
| Income (loss) from discontinued businesses, net of tax | (1,265 | ) | | (4,252 | ) | | (5,545 | ) | | (8,012 | ) | | 1,399 |
|
| Net income (loss) | 104,151 |
| | 97,866 |
| | 109,977 |
| | (342,117 | ) | | 112,602 |
|
| Net income (loss) attributable to noncontrolling interests | (1,323 | ) | | (571 | ) | | (411 | ) | | 5,448 |
| | 1,839 |
|
| Net income (loss) attributable to common shareholders | $ | 102,828 |
| | $ | 97,295 |
| | $ | 109,566 |
| | $ | (336,669 | ) | | $ | 114,441 |
|
| Common Share Data: | | | | | | | | | |
| Earnings (loss) per common share | | | | | | | | | |
| Basic | | | | | | | | | |
| Continuing operations attributable to common shareholders | $ | 2.18 |
| | $ | 2.12 |
| | $ | 2.26 |
| | $ | (5.25 | ) | | $ | 1.73 |
|
| Discontinued operations | $ | (0.03 | ) | | $ | (0.09 | ) | | $ | (0.11 | ) | | $ | (0.13 | ) | | $ | 0.02 |
|
| Net income (loss) attributable to common shareholders | $ | 2.15 |
| | $ | 2.03 |
| | $ | 2.16 |
| | $ | (5.38 | ) | | $ | 1.75 |
|
| Diluted | | | | | | | | | |
| Continuing operations attributable to common shareholders | $ | 2.15 |
| | $ | 2.10 |
| | $ | 2.24 |
| | $ | (5.25 | ) | | $ | 1.72 |
|
| Discontinued operations | $ | (0.03 | ) | | $ | (0.09 | ) | | $ | (0.11 | ) | | $ | (0.13 | ) | | $ | 0.02 |
|
| Net income (loss) attributable to common shareholders | $ | 2.12 |
| | $ | 2.01 |
| | $ | 2.14 |
| | $ | (5.38 | ) | | $ | 1.74 |
|
| Other Data: | | | | | | | | | |
| Depreciation and amortization | $ | 96,636 |
| | $ | 81,275 |
| | $ | 85,230 |
| | $ | 93,649 |
| | $ | 89,962 |
|
| Capital expenditures | 39,154 |
| | 47,534 |
| | 49,143 |
| | 42,860 |
| | 79,853 |
|
| Balance Sheet Data (at end of period): | | | | | | | | | |
| Cash and cash equivalents | $ | 155,927 |
| | $ | 109,685 |
| | $ | 68,905 |
| | $ | 179,160 |
| | $ | 182,574 |
|
| Working capital | 305,516 |
| | 143,005 |
| | 209,046 |
| | 293,114 |
| | 345,828 |
|
| Goodwill, net | 230,701 |
| | 208,609 |
| | 197,561 |
| | 198,438 |
| | 508,235 |
|
| Total assets | 1,644,621 |
| | 1,586,344 |
| | 1,558,320 |
| | 1,733,373 |
| | 2,204,093 |
|
| Total debt and capital lease obligations | 663,789 |
| | 666,520 |
| | 717,945 |
| | 700,852 |
| | 492,832 |
|
| Total shareholders' equity | 640,984 |
| | 600,805 |
| | 525,583 |
| | 687,423 |
| | 1,375,243 |
|
|
| | | | | | | | | | | | | | | | | | | |
| | Fiscal Year |
| | 2016 | | 2015 | | 2014 | | 2013 | | 2012 |
| | | | | | | | | | |
| | (in thousands, except per share amounts) |
| Statement of Income Data | | | | | | | | | |
| Total revenue | $ | 1,681,432 |
| | $ | 1,363,302 |
| | $ | 1,297,662 |
| | $ | 1,165,528 |
| | $ | 1,129,530 |
|
| Income from continuing operations, net of income taxes | 156,086 |
| | 152,037 |
| | 129,924 |
| | 105,416 |
| | 102,118 |
|
| Income (loss) from discontinued operations, net of income taxes | 280 |
| | (950 | ) | | (1,726 | ) | | (1,265 | ) | | (4,252 | ) |
| Common Share Data | | | | | | | | | |
| Earnings per common share from continuing operations: | | | | | | | | | |
| Basic | $ | 3.28 |
| | $ | 3.23 |
| | $ | 2.76 |
| | $ | 2.18 |
| | $ | 2.12 |
|
| Diluted | $ | 3.22 |
| | $ | 3.15 |
| | $ | 2.70 |
| | $ | 2.15 |
| | $ | 2.10 |
|
| Other Data | | | | | | | | | |
| Depreciation and amortization | $ | 126,658 |
| | $ | 94,881 |
| | $ | 96,445 |
| | $ | 96,636 |
| | $ | 81,275 |
|
| Capital expenditures | 55,288 |
| | 63,252 |
| | 56,925 |
| | 39,154 |
| | 47,534 |
|
| Balance Sheet Data (as of period end) | | | | | | | | | |
| Cash and cash equivalents | $ | 117,626 |
| | $ | 117,947 |
| | $ | 160,023 |
| | $ | 155,927 |
| | $ | 109,685 |
|
Total assets(1) | 2,711,800 |
| | 2,068,497 |
| | 1,870,578 |
| | 1,623,438 |
| | 1,577,111 |
|
Long-term debt, net and capital leases(1) | 1,207,696 |
| | 845,997 |
| | 740,557 |
| | 635,226 |
| | 520,712 |
|
| Redeemable noncontrolling interest | 14,659 |
| | 28,008 |
| | 28,419 |
| | 20,581 |
| | — |
|
| | | | | | | | | | |
(1) During the second quarter of 2015, we elected early adoption of Accounting Standards Update (ASU) 2015-03, “Simplifying the Presentation of Debt Issuance Costs,” and applied the changes retrospectively to all prior periods. During the fourth quarter of 2015, we elected early adoption of ASU 2015-17, “Balance Sheet Classification of Deferred Taxes,” and applied the changes retrospectively to all prior periods. Prior years’ amounts have been updated to conform to current presentation. |
Refer to Note 2, “Business Acquisitions” included in Item 8, “Financial Statements and Other Supplementary Data” in this Annual Report on Form 10-K for additional information concerning the impact of our recent acquisitions.
Item 7. Management'sManagement’s Discussion and Analysis of Financial Condition and Results of Operations
The following Management's Discussion and Analysis will help you understand our financial condition and results of operations. The Management's Discussion and Analysis is a supplement to, anddiscussion should be read in conjunction with our consolidated financial statements and related notes appearing in Item 8, “Financial Statements and Supplementary Data” in this Annual Report on Form 10-K. The following discussion contains forward-looking statements. Actual results may differ significantly from those projected in the accompanying notesforward-looking statements. Factors that might cause future results to differ materially from those projected in the consolidated financial statements.forward-looking statements include, but are not limited to, those discussed in Item 1A, “Risk Factors” and elsewhere in this Annual Report on Form 10-K. Certain percentage changes from period over period may not recalculate due to rounding.
Overview
We are a leading global providerfull service, early-stage contract research organization (CRO). For 70 years, we have been in the business of solutions that advanceproviding the drug discoveryresearch models required in research and development process, including research modelsof new drugs, devices, and associated services and outsourced preclinical services. We provide our products and services to pharmaceutical and biotechnology companies, government agencies, leading hospitals and academic institutions around the world in order to bring drugs to market faster and more efficiently. Wetherapies. Over this time, we have built upon our original core competency ofin vivo biology, including laboratory animal medicine and science (research model technologies) to develop a diverse portfolio of preclinicaldiscovery and safety assessment services, both GLP (GoodGood Laboratory Practice)Practice (GLP) and non-GLP, which address drug discoveryare able to support our clients from target identification through non-clinical development. We also provide a suite of products and development.services to support our clients’ manufacturing activities. Utilizing our broad portfolio of products and services enables our clients to create a more flexible drug development model, which reduces their costs, enhances their productivity and effectiveness, and increases speed to market.
Our client base includes all of the major global biopharmaceutical companies, many biotechnology companies, CROs, agricultural and industrial chemical companies, life science companies, veterinary medicine companies, contract manufacturing organizations, medical device companies, and diagnostic and other commercial entities, as well as leading hospitals, academic institutions, and government agencies around the world. We have been in business for over 65 years and currently operate approximately 6875 facilities in 1623 countries worldwide.worldwide, which numbers exclude our Insourcing Solutions (IS) sites.
Business Trends
BeginningThe demand for our products and services increased in late 2008, largefiscal year 2016. Our pharmaceutical and biotechnology companies undertook significant changes inclients continued to intensify their operations as they endeavoreduse of strategic outsourcing to improve the productivitytheir operating efficiency and to access capabilities that they do not maintain internally. Many of our large biopharmaceutical clients have refocused on their drug discovery and early-stage development pipelines, and at the same time, streamline their infrastructures in order to improve efficiency and reduce operating costs. Our clients' efforts, had an unfavorable impact on our operations as a result of their measured research and development spending; delays in decisions and commitments; tight cost constraints and the resultant pressure on pricing and payment terms, particularly in view of excess capacity in the contract research industry; and a focus on late-stage clinical testing as our clients accelerate their efforts to bring drugs to market in the face of expiration of patents on branded drugs. There were other trends which also affected us unfavorably: biotechnology companies experiencedafter a period of decreased funding; there was uncertainty surrounding healthcare reform initiatives;greater emphasis on late-stage programs to bring new drugs to market. In addition, small and mid-size biopharmaceutical clients benefited from the pharmaceuticalcontinued strength in the biotechnology funding environment in fiscal year 2016, from capital markets, partnering with large biopharmaceutical companies, and biotechnology industries continued to consolidate.
While these factors have continued to contribute to demand uncertainty and impact sales, there have been improvements in many of them. Largeinvestment by venture capital. Academia has also benefited from partnering activities, as large biopharmaceutical companies have made progressincreasingly utilized academic research capabilities to broaden the scope of their research activities. Our full service, early-stage portfolio continued to lead to additional client discussions in fiscal year 2016 regarding strategic relationships, where clients seek to outsource larger portions of their operating efficiency, which have included closureearly-stage drug research programs to us.
The primary result of underutilized facilities. This, in turn, has led to an increase in outsourcing, as these clients have chosen to utilize our facilities and scientific expertise rather than maintaining in-house capabilities.
As part of our clients' efforts to improve pipeline productivity, pharmaceutical and biotechnology companies are emphasizing efficacy testing in order to eliminate molecules from the pipeline earlier in the drug development process. This trend is visible in increasingtrends was improved demand for our non-GLP safety assessment services in vivo pharmacologyfiscal year 2016, particularly from biotechnology clients. This improvement led to increased capacity utilization in our safety assessment facilities, with utilization approaching optimal levels. Price also improved moderately in fiscal year 2016, as industry capacity utilization continued to increase. In view of client demand, we expanded our global footprint and drug metabolism and pharmacokinetics (DMPK) services. In addition to outsourcing services to contract research organizations (CROs), large biopharmaceutical companies are also partnering with biotechnology companies and academia in order to access their novel molecules and research capabilities; as a result, there has been a significant increase in funding for biotechnology companies and research institutions. 2013 was a robust year for biotechnology funding, as improvements in the capital markets provided additional funding for these companies.
As a result of these factors, our market for products and services has stabilized. In this environment, our targeted sales strategies are resulting in sales growth.
As our clients increase focus on strategic outsourcing,reinforced our scientific expertise, operating efficiency, information technology platforms and client data portals, and ability to meet each client's individual needs strongly positions us to compete for business.leadership in safety assessment services by acquiring WRH, Inc. (WIL Research) in April 2016. We believe we continue to winalso opened small amounts of new or renewing existing strategic relationshipscapacity in a highly competitive marketplace becausefiscal year 2016, including the re-opening of the industry characteristics noted above, as well as our broad portfolio of products and services which span the early-stage drug development continuum, and our ability to develop a customized in vivo biology program to support our client's drug development efforts. Price continues to be a factor in our clients’ choice of strategic partners, but weCharles River Massachusetts facility. We believe our scientific expertise, remains aquality, and responsiveness remain key criterioncriteria when our clients make the decision to eliminate in-house capabilitiesoutsource to us.
Demand for our products and rely on a CRO.services that support our clients’ manufacturing activities was also robust in fiscal year 2016. Demand for our Microbial Solutions business remained strong as manufacturers continued to increase their use of our rapid microbial testing solutions. Our clients are at different stagesBiologics Testing Solutions (Biologics) business continued to benefit from increased demand for services associated with the growing proportion of biologic drugs in the pipeline and on the market. To enhance our ability to support biologic and biosimilar development, we acquired Blue Stream Laboratories, Inc. (Blue Stream) in June 2016.
As our clients continue to pursue their goal of more efficient and effective drug research, they are evaluating outsourcing process,new areas of their research programs, such as discovery services. We have enhanced our Discovery Services capabilities over the past three years to enable us to work with clients at the earliest stages of the discovery process. In fiscal year 2016, demand from biotechnology clients was strong for discovery services, but demand from larger biopharmaceutical clients fluctuated, particularly for our early discovery capabilities. We believe this is due to the fact that large biopharmaceutical companies have significant internal discovery capabilities, on which they can choose to rely. In order for large biopharmaceutical clients to
increasingly outsource more work to us, we must continue to demonstrate that our services can augment and accelerate our clients’ drug discovery process. We implemented business changes, including a small site consolidation and realignment of sales strategies, in fiscal year 2016 in our early discovery business to expedite this process. Demand for our in vivodiscovery services continued to increase in fiscal year 2016, and we areacquired Agilux Laboratories, Inc. (Agilux) in ongoing discussions concerning additional strategic relationships asSeptember 2016 to strengthen our clients focus onbioanalytical services offering, and reinforce the logistics of outsourcing. Additionally, we continue to expandlinkage between our relationships with our mid-tierdiscovery and academic clients through focused sales and marketing efforts in order to achieve market share gains.safety assessment capabilities.
We believe that the long-term drivers for our business as a whole will primarily emerge from our clients' continued demandDemand for research models and services EMD products,improved modestly in fiscal year 2016. We remain confident in the long-term drivers of this business because research models and both GLPservices remain essential tools for our clients’ drug discovery and non-GLP in vivo biologyearly-stage development efforts.
Acquisitions
We continued to make strategic acquisitions designed to expand our portfolio of services which are essential to support the drug discovery and early-stage development continuum and position us as a market leader in the outsourced discovery services market. Fiscal year 2016 acquisitions included:
On April 4, 2016, we acquired WIL Research, a provider of safety assessment and contract development and manufacturing (CDMO) services to biopharmaceutical and agricultural and industrial chemical companies worldwide. The acquisition enhanced our position as a leading global early-stage CRO by strengthening our ability to partner with clients across the drug discovery and development continuum. The purchase price for WIL Research was $604.8 million, including assumed liabilities of $0.4 million, and was funded by cash on hand and borrowings on our amended credit facility.
On June 27, 2016, we acquired Blue Stream, an analytical CRO supporting the development of complex biologics and biosimilars. Combining Blue Stream with our existing discovery, safety assessment, and biologics capabilities creates a leading provider with the ability to support biologic and biosimilar development from characterization through clinical testing and commercialization. The purchase price for Blue Stream was $11.7 million, including $3.0 million in contingent consideration, and was subject to certain customary adjustments. The acquisition was funded by borrowings on our revolving credit facility.
On September 28, 2016, we acquired Agilux, a CRO that provides a suite of integrated discovery small and large molecule bioanalytical services, drug metabolism and pharmacokinetic (DMPK) services, and pharmacology services. The acquisition supports our strategy to offer clients a broader, integrated portfolio that provides services continuously from the earliest stages of drug research through the nonclinical development process. However, presently it is challenging to predict the timing associated with these drivers.The purchase price for Agilux was $64.9 million in cash and was funded by borrowings on our revolving credit facility.
Segment Reporting
We continue to focus onreport our four key initiatives, which were designed to as cornerstones of the strategy to position ourselves to operate successfullyperformance in the current and future business environment, and thus drive profitable growth and maximize value for shareholders. These four initiatives are: (1) improving our consolidated operating margin; (2) improving free cash flow generation; (3) disciplined investment in growth businesses; and (4) returning value to shareholders.
Our continued actions in 2013 toward the achievement of these initiatives include the following:
Our focus on operating efficiencies is evidenced by our plan announced in the third quarter to consolidate production in our California research model facility. We expect to continue to rationalize our global production capacity to continue to achieve efficiencies and cost savings. As part of this initiative, in first quarter of 2014 we announced our plan to close our research model production facility in Michigan by the end of the 2014, which will include associated severance and accelerated depreciation charges of approximately $4 million in 2014. Other projects in support of our global efficiency initiative are expected in 2014, but as of the date of this filing no specific decisions have been made.
In the fourth quarter we announced organizational changes, including a new role for Dr. Jörg Geller who is tasked with leading a new global initiative to enhance efficiency and drive increased productivity across all of our businesses.
During 2013, we made two growth acquisitions: acquired a 75% interest in Vital River in China and purchased the business of an EMD products and services provider in Singapore.
We continue to repurchase our stock with the intent to drive immediate shareholder value and earnings per share accretion. During 2013 we repurchased 3.5 million shares on the open market based on our share buy-back program. Our weighted average shares outstanding 48.5 million for the year ending December 28, 2013 were consistent with the prior year as a result of significant stock option exercises during 2013. During 2013, our Board of Directors approved a total of $250 million in increases in our share buy-back program.
Total net sales in 2013 were $1,165.5 million, an increase of 3.2% from $1,129.5 million in 2012. Foreign currency translation had a negative impact on sales of 0.8%. We report twothree reportable segments: Research Models and Services (RMS), Discovery and Preclinical Services (PCS)Safety Assessment (DSA), and Manufacturing Support (Manufacturing). Sales increasedWe aggregate our operating segments into a reportable segment if (a) they have similar economic characteristics; (b) they are similar in boththe in the nature of the products or services, nature of the production process, type or class of customer for their products and services, methods used to distribute their products and services and nature of the regulatory environment; and (c) the aggregation helps users better understand our performance.
In the second quarter of 2016, we acquired WIL Research. WIL Research’s safety assessment business is reported in our DSA reportable segment and its CDMO business created a new operating segment, Contract Manufacturing, that is reported as part of our Manufacturing reportable segment. On February 10, 2017, we divested the CDMO business. In addition, amounts due to changes in our market strategy for certain services and resulting information provided to the Chief Operating Decision Maker were reclassified from our RMS reportable segment to our Manufacturing reportable segment, including revenue of $2.8 million and PCS$3.7 million for fiscal years 2015 and 2014, respectively, and operating income of $0.5 million and $0.6 million for fiscal years 2015 and 2014, respectively.
We reported segment results on this basis for all periods presented in this Annual Report on Form 10-K.
The revised reportable segments.segments are as follows: |
| | |
| Research Models and Services | Discovery and Safety Assessment | Manufacturing Support |
| Research Models | Discovery Services | Microbial Solutions |
| Research Model Services | Safety Assessment | Avian |
| | Biologics |
| | Contract Manufacturing |
Our RMS segment which represented 60.7% of net sales in 2013, includes three categories:the Research Models and Research Model Services and Endotoxin and Microbial Detection (EMD).businesses. Research Models includes the commercial production and sale of small and large research models, as well as avian products.the supply of large research models. Research Model Services include fourincludes three business units: Genetically Engineered Models and Services (GEMS), which performs contract breeding and other services associated services,with genetically engineered research models; Research Animal DiagnosticsDiagnostic Services (RADS), which provides health monitoring and diagnostics services Discovery Research Services (DRS), which provides non-regulated efficacy testing,related to research models; and Insourcing Solutions (IS),IS, which provides management services forof our client's in vivo operations.clients’ research operations (including recruitment, training, staffing, and management services). Our PCSDSA segment which represented 39.3% of net sales in 2013, includes services required to take a drug through the early development process including DRS,discovery services, which are non-regulated services to assist clients with the identification, screening, and selection of a lead compound for drug development, and regulated and non-regulated safety assessment services. Our Manufacturing segment includes Microbial Solutions, which includes in vitro (non-animal) lot-release testing products andbiologics microbial detection, conventional and rapid quality control testingservices. of sterile and non-sterile biopharmaceutical and consumer products, and species identification services; Biologics, which performs specialized testing of biologics; Avian Vaccine Services (Avian), which supplies specific-pathogen-free fertile chicken eggs and chickens; and Contract Manufacturing, which, until we divested this business on February 10, 2017, specialized in formulation design and development, manufacturing, and analytical and stability testing for small molecules.
Fiscal Quarters
Net sales forOur fiscal year is typically based on 52-weeks, with each quarter composed of 13 weeks ending on the RMS segment increased last Saturday on, or closest to, March 31, June 30, September 30, and December 31. A 531.7%rd week was included in 2013 comparedfiscal year 2016, which is occasionally necessary to 2012, primarily driven by the acquisition of 75% of Vital River and the resulting expansion of our research model sales in China, and by continued growth of our EMD business. RMS sales growthalign with a December 31 calendar year-end. The additional week was partially offset by foreign currency translation, which had a negative impact on sales of 1.2%, and sales declines in our legacy research model production operationsincluded in the U.S., Europe and Japan, which offset net sales growth. Net sales for the PCS segment increased 5.5% year -over-year, driven by higher demand for our preclinical services, partially offset by unfavorable foreign currency, which decreased sales growth by 0.4%.fourth quarter.
Our operating income was $151.4 million for 2013, compared to operating income of $165.8 million for 2012. The reduction in operating income was due to several factors, including accelerated depreciation expense of $15.4 million related to two facilities in the U.S. that were consolidated or vacated in 2013.
Operating income for the RMS segment was $181.3 million in 2013, compared to $202.4 million in 2012. Operating income in the current year was negatively affected by accelerated depreciation of $13.5 million related to consolidation of a research model production facility in California and lower volume of research model sales in the U.S., Europe and Japan. Operating income for the PCS segment increased to $44.1 million in 2013 compared to $34.6 million in 2012. The increase was driven by higher sales volume, a favorable mix including longer term contracts, and the benefit of efficiency initiates.
Income from continuing operations, net of tax, was $105.4 million for 2013 compared to $102.1 million for 2012. For 2013, diluted earnings per share attributable to common shareholders were $2.12 compared to $2.01 in 2012. Net income attributable
to common shareholders increased to $102.8 million in 2013, compared to $97.3 million in 2012. Cash flows provided by operating activities in 2013 were $209.0 million compared to $208.0 million in 2012.
Critical Accounting Policies and Estimates
PreparationOur discussion and analysis of our financial condition and results of operations is based upon our consolidated financial statements prepared in accordance with generally accepted accounting principles in the United States (U.S.). The preparation of these financial statements requires managementus to use judgment when makingmake certain estimates and assumptions that are involved in preparing estimates thatmay affect the reported amounts of assets and liabilities, the reported amounts of revenues and expenses during the reporting period. On an ongoing basis, management evaluates its estimatesreported periods and assumptions. Some of those estimates can be complex and require management to make estimates about the future and actual results could differ from those estimates. Management bases itsrelated disclosures. These estimates and assumptions are monitored and analyzed by us for changes in facts and circumstances, and material changes in these estimates could occur in the future. We base our estimates on our historical experience, trends in the industry, and on various other factors that are believed to be reasonable under the circumstances, thecircumstances. Actual results of which form the basis for making judgments about the carrying values of assets and liabilitiesmay differ from our estimates under different assumptions or conditions.
We believe that are not readily apparent from other sources. For any given estimate or assumption made by management, there may also be other estimates or assumptions that are reasonable.
We considerour application of the following accounting policies, each of which require significant judgments and estimates importanton the part of management, are the most critical to aid in fully understanding and evaluating our operating results andreported financial condition. For additionalresults. Our significant accounting policies see Notes to Consolidated Financial Statements-Note 1.Descriptionare more fully described in Note 1, “Description of Business and Summary of Significant Accounting Policies.Policies”, to our consolidated financial statements contained in Item 8, “Financial Statements and Other Supplementary Data” in this Annual Report on Form 10-K.
We believe the following represent our critical accounting policies and estimates used in the preparation of our financial statements:
Revenue Recognition
We recognize revenue when all of the following conditions are satisfied: persuasive evidence of an arrangement exists, delivery has occurred or services have been provided, our price to the customer is fixed or determinable, and collectibility is reasonably assured.
Service revenue is generally evidenced by client contracts, which range in duration from a few weeks to a few years and typically take the form of an agreed upon rate per unit or fixed fee arrangements. Such contracts typically do not contain acceptance provisions based upon the achievement of certain study or laboratory testing results. Revenue of agreed upon rate per unit contracts is recognized as services are performed, based upon rates specified in the contract. In cases where
Valuation
performance spans reporting periods, revenue of fixed fee contracts is recognized as services are performed, measured on the ratio of outputs or performance obligations completed to the total contractual outputs or performance obligations to be provided. Changes in estimated effort to complete the fixed fee contract are reflected in the period in which the change becomes known. Changes in scope of work are common, especially under long-term contracts, and Impairmentgenerally result in a change in contract value. Once the parties have agreed to the changes in scope and renegotiated pricing terms, the contract value is amended and revenue is typically recognized as described above.
Most contracts are terminable by the client, either immediately or upon notice. These contracts often require payment to us of expenses to wind down the project, fees earned to date or, in some cases, a termination fee. Such payments are included in revenues when earned.
We recognize product revenue, net of allowances for estimated returns, rebates and discounts, when title and risk of loss pass to customers. When we sell equipment with specified acceptance criteria, we assess our ability to meet the acceptance criteria in order to determine the timing of revenue recognition. We would defer revenue until completion of customer acceptance testing if we are not able to demonstrate the ability to meet such acceptance criteria.
A portion of our revenue is from multiple-element arrangements that include multiple products and/or services as deliverables in a single arrangement, with each deliverable, or a combination of the deliverables, representing a separate unit of accounting. We allocate revenues to each element in a multiple-element arrangement based upon the relative selling price of each deliverable. Revenue allocated to each deliverable is then recognized when all revenue recognition criteria are met. Judgments as to the identification of deliverables, units of accounting, the allocation of consideration to the deliverable, and the appropriate timing of revenue recognition are critical with respect to these arrangements.
At the inception of each arrangement that includes milestone payments, we evaluate whether each milestone is substantive. This evaluation includes an assessment of whether (a) the consideration is commensurate with either (1) our performance to achieve the milestone, or (2) the enhancement of the value of the delivered item(s) as a result of a specific outcome resulting from our performance to achieve the milestone; (b) the consideration relates solely to past performance; and (c) the consideration is reasonable relative to all of the deliverables and payment terms within the arrangement. We evaluate factors such as the scientific, clinical, regulatory, and other risks that must be overcome to achieve the respective milestone, the level of effort and investment required, and whether the milestone consideration is reasonable relative to all deliverables and payment terms in the arrangement in making this assessment. If a substantive milestone is achieved and collection of the related receivable is reasonably assured, we recognize revenue related to the milestone in its entirety in the period in which the milestone is achieved. If we were to achieve milestones that we consider substantive under any of our revenue arrangements, we may experience significant fluctuations in our revenue from quarter to quarter and year to year depending on the timing of achieving such substantive milestones. In those circumstances where a milestone is not substantive, we recognize as revenue, on the date the milestone is achieved, an amount equal to the applicable percentage of the performance period that had elapsed as of the date the milestone was achieved, with the balance being deferred and recognized over the remaining period of performance. As of December 31, 2016, we had no significant milestones that were deemed substantive.
The Company records shipping charges billed to customers in total revenue and records shipping costs in cost of revenue (excluding amortization of intangible assets) for all periods presented.
Income Taxes
We prepare and file income tax returns based on our interpretation of each jurisdiction’s tax laws and regulations. In preparing our consolidated financial statements, we estimate our income tax liability in each of the jurisdictions in which we operate by estimating our actual current tax expense together with assessing temporary differences resulting from differing treatment of items for tax and financial reporting purposes. These differences result in deferred tax assets and liabilities, which are included in our consolidated balance sheets. Significant management judgment is required in assessing the realizability of our deferred tax assets. In performing this assessment, we consider whether it is more likely than not that some portion or all of the deferred tax assets will not be realized. The ultimate realization of deferred tax assets is dependent upon the generation of future taxable income during the periods in which those temporary differences become deductible. In making this determination, under the applicable financial accounting standards, we are allowed to consider the scheduled reversal of deferred tax liabilities, projected future taxable income, and the effects of tax planning strategies. In the event that actual results differ from our estimates, we adjust our estimates in future periods and we may need to establish a valuation allowance, which could materially impact our financial position and results of operations.
We account for uncertain tax positions using a “more-likely-than-not” threshold for recognizing and resolving uncertain tax positions. We evaluate uncertain tax positions on a quarterly basis and consider various factors, that include, but are not limited
to, changes in tax law, the measurement of tax positions taken or expected to be taken in tax returns, the effective settlement of matters subject to audit, information obtained during in process audit activities and changes in facts or circumstances related to a tax position. We adjust the level of the liability to reflect any subsequent changes in the relevant facts surrounding the uncertain positions. Our liabilities for uncertain tax positions can be relieved only if the contingency becomes legally extinguished through either payment to the taxing authority or the expiration of the statute of limitations, the recognition of the benefits associated with the position meet the “more-likely-than-not” threshold or the liability becomes effectively settled through the controversy process. We consider matters to be effectively settled once the taxing authority has completed all of its required or expected examination procedures, including all appeals and administrative reviews; we have no plans to appeal or litigate any aspect of the tax position; and we believe that it is highly unlikely that the taxing authority would re-examine the related tax position. We also accrue for potential interest and penalties related to unrecognized tax benefits in income tax expense.
As of December 31, 2016, our non-U.S. subsidiaries’ undistributed foreign earnings included in consolidated retained earnings were $704.6 million. As of the end of fiscal year 2016, our policy with respect to the undistributed earnings of our non-U.S. subsidiaries is to maintain an indefinite reinvestment assertion as they are required to fund needs outside of the U.S. and cannot be repatriated in a manner that is substantially tax-free. This assertion is made on a jurisdiction by jurisdiction basis and takes into account the liquidity requirements in both the U.S. and our foreign subsidiaries. If we decide to repatriate funds to the U.S. in the future to execute our growth initiatives or to fund any other liquidity needs, the resulting tax consequences could negatively impact our results of operations through a higher effective tax rate and dilution of our earnings. On December 18, 2015, the U.S. enacted the Consolidated Appropriations Act, which reinstated and extended the controlled foreign corporation look-through rules through the fiscal year 2019. This rule allows us to access Chinese and Canadian cash in a more tax-efficient manner and utilize the cash outside of the U.S. without triggering residual U.S. tax. As such, we are accruing foreign withholding taxes to reflect this change for the years in which the rules are reinstated.
Goodwill Indefinite-Lived Intangible Assets and Definite-Lived Intangible Assets
AWe use assumptions and estimates in determining the fair value of assets acquired and liabilities assumed in a business combination. The determination of the fair value of intangible assets, which represent a significant portion of the purchase price in many of our business acquisitions, is assigned to intangible assets and goodwill. Assigning value to intangible assets requires that wethe use of significant judgment in determiningwith regard to (i) the fair valuevalue; and (ii) whether such intangibles are amortizable or non-amortizable and, if the former, the period and the method by which the intangible assetsasset will be amortized. We utilize commonly accepted valuation techniques, such as the income approach and the cost approach, as appropriate, in establishing the fair value of long-livedintangible assets. Typically, key assumptions include projected revenue and expense levels used in establishing the fair valueprojections of business acquisitionscash flows that arise from identifiable intangible assets of acquired businesses as well as discount rates based on an analysis of our weighted average cost of capital, adjusted for specific risks associated with the assets. Changes
We review definite-lived intangible assets for impairment when indication of potential impairment exists, such as a significant reduction in cash flows associated with the initial assumptionsassets. Actual cash flows arising from a particular intangible asset could lead to changesvary from projected cash flows which could imply different carrying values from those established at the dates of acquisition and which could result in amortization expense recorded in our future financial statements.impairment of such asset.
We test for goodwill impairment annually or more frequently if events or changes in circumstances indicateDuring fiscal year 2016, we determined that the carrying valuevalues of certain DSA intangible assets were not recoverable and recorded an impairment charge of $1.9 million, which was included in costs of services provided (excluding amortization of intangible assets).
We evaluate goodwill may not be recoverable. Our annual goodwillfor impairment assessment has historically been completed inannually, during the fourth quarter. We have elected not to apply the guidance available in ASU 2011-08, Testing Goodwill for Impairment, to assess purely qualitative factors to determine whether it is more likely than notquarter, and when events occur or circumstances change that may reduce the fair value of the asset below its carrying amount. Events or circumstances that might require an interim evaluation include unexpected adverse business conditions, economic factors, unanticipated technological changes or competitive activities, loss of key personnel and acts by governments and courts. Estimates of future cash flows require assumptions related to revenue and operating income growth, asset-related expenditures, working capital levels and other factors. Different assumptions from those made in our reporting units is less than their carrying amount as a basisanalysis could materially affect projected cash flows and our evaluation of goodwill for determiningimpairment.
We have the option to first assess qualitative factors to determine whether it is necessary to perform the two-step goodwill impairment test. WeIf we elect this option and believe, as a result of the qualitative assessment, that it is more-likely-than-not that the carrying value of goodwill is not recoverable, the quantitative two-step impairment test is required; otherwise, no further testing is required. Alternatively, we may elect to not first assess qualitative factors and immediately perform the quantitative two-step impairment test. In the first step, we compare the fair value of our reporting units to their carrying values. If the carrying values of the net assets assigned to the reporting units exceed the fair values of the reporting units, then the second step
of the impairment test is performed in order to determine the implied fair value of our goodwill. If the carrying value of the reporting unit’s goodwill exceeds its implied fair value, then we would record an impairment loss equal to the difference.
In fiscal years 2016, 2015 and 2014, we performed the first step of the two-step goodwill impairment test for our reporting units as of the first day of fiscal November, 2013. The first step, identifying a potential impairment, compares the fair value of the reporting unit with its carrying amount. If the carrying amount exceeds fair value, the second step would need to be performed; otherwise, no further step is required. The second step, measuring the impairment loss, compares the implied fair value of the reporting unit's goodwill with its carrying amount. Any excess of the goodwill carrying amount over the implied fair value is recognized as an impairment loss, and the carrying value of goodwill is written down to fair value. Our 2013 impairment test indicated that goodwill was not impaired for any reporting unit. Please refer to Note 3 to the consolidated financial statement for further information on goodwill.
As noted above, the goodwill impairment analysis is a two-step process. The first step is used to identify potential impairment and involves comparing each reporting unit's estimated fair value to its carrying value, including goodwill.units. Fair value iswas determined by using a weighted combination of a market-based approach and an income approach, as this combination iswas deemed to be the most indicative of our fair value in an orderly transaction between market participants. Under the market-based approach, we utilizeutilized information about our companyCompany as well as publicly available industry information to determine earnings multiples and sales multiples that are used to value our reporting units. Under the income approach, we determinedetermined fair value based on the estimated future cash flows of each reporting unit, discounted by an estimated weighted-average cost of capital, which reflects the overall level of inherent risk of the reporting unit and the rate of return an outside investor would expect to earn. Determining
Our 2016, 2015 and 2014 impairment tests indicated that goodwill was not impaired.
In the second quarter of 2016, we revised the composition of our reportable segments to align with the view of the business following our acquisition of WIL Research. See Note 1, "Description of Business and Summary of Significant Accounting Policies." As a result, goodwill was allocated from our RMS reportable segment to our Manufacturing reportable segment based on the fair value of aeach business group within its original reporting unit is judgmental in nature and requires the use of significant estimates and assumptions, including revenue growth rates, profit margin percentages, discount rates, perpetuity growth rates, future capital expenditures and future market conditions, among others. Our projections are based on our internal plans. Key assumptions, strategies, opportunities and risks from this strategic review along with a market evaluation are the basis for our assessment. If the estimated fair value of a reporting unit exceeds its carrying value, goodwill is not consideredrelative to be impaired. However, if the carrying value exceeds estimated fair value, there is an indication of potential impairment and the second step is performed to measure the amount of impairment.
The second step of the goodwill impairment process, if required, measures the goodwill impairment by calculating an implied fair value of goodwill for each reporting unit for which step one indicated impairment. The implied fair value of goodwill is
determined similar to the manner in which goodwill is calculated in a business combination: by measuring the excess of the estimated fair value of the reporting unit over the estimated fair values of the individual assets, liabilities and identifiable intangibles as if the reporting unit was being acquired in a business combination. If the carrying value of goodwill assigned to a reporting unit exceeds the implied fair value of the goodwill, an impairment charge is recorded for the excess. In determining the fair value of assets,that reporting unit. In addition, we utilize appraisalscompleted an assessment of any potential goodwill impairment for all reporting units immediately prior to the fair value of propertyreallocation and equipment and valuations of certain intangible assets, including client relationships.determined that no impairment existed.
Valuation and Impairment of Long-Lived Assets
We assess the carrying value ofLong-lived assets to be held and used, including property, plant, and equipment, and definite-lived intangible assetsare reviewed for impairment whenever events or changes in circumstances indicate that the carrying valueamount of the assets or asset group may not be recoverable. Factors we consider important which could trigger an impairment review include, but are not limited to, the following:
significant underperformance relative to expected historical or projected future operating results;
significant negative industry or economic trends; or
significant changes or developments in strategy or operations that negatively affect the utilization of our long-lived assets.
Determination of recoverability is based on an estimate of undiscounted future cash flows resulting from the use of the asset, net of any sublease income, if applicable, and its eventual disposition. Should we determineIn the event that such cash flows are not expected to be sufficient to recover the carrying valueamount of held-for-use long-livedthe assets, may not be recoverable, wethe assets are written-down to their fair values. We measure any impairment based on a projected discounted cash flow method using a discount rate determined by management to be commensurate with the risk inherent in our current business model. We may also estimate fair value based on market prices for similar assets, as appropriate. Significant judgments are required to estimate future cash flows, including the selection of appropriate discount rates and other assumptions. We may also estimate fair value based on market prices for similar assets, as appropriate. Changes in these estimates and assumptions could materially affect the determination of fair value for these assets.
Long-lived asset groups may be classified as held-for-sale when the following conditions are met: we have committed to a plan to sell the asset groupPension and it is unlikely that significant changes will be made to the plan; the asset group is available for immediate sale in its present conditionOther Post-Retirement Benefit Plans
Several of our U.S. and it is probable that the sale will be completed within one year;non-U.S. subsidiaries sponsor defined benefit pension and an active program to locate a buyer has been initiated and the asset group is being marketed at a sale price that is reasonable in relation to its current fair value. Should we determine that the carrying value of held-for-sale long-lived assets exceeds its fair value, we will measure any impairment based on this difference. Subsequent adjustments to the carrying amount of held-for-sale assets based on changes in fair value are recorded but only to the extent of the carrying amount of the asset group when it entered the held-for-sale category.
Revenue Recognition
other post-retirement benefit plans. We recognize revenue related tothe funded status of our products, which include research models, EMD technologydefined benefit pension and vaccine support products, when persuasive evidence ofother postretirement benefit plans as an arrangement exists, generally in the form of client purchase orders, title and risk of loss have transferred, which generally occurs upon delivery of the products, the sales priceasset or liability. This amount is fixed or determinable and collectability is reasonably assured. Product sales are recorded net of returns upon delivery. For large models, in some cases clients pay in advance of delivery of the product. These advances are deferred and recognizeddefined as revenue upon delivery of the product.
Our service revenue is generally evidenced by client contracts. Our service revenue is recognized upon the completion of the agreed upon performance criteria. These performance criteria are generally in the form of either study protocols or specified activities or procedures that we are engaged to perform. These performance criteria are established by our clients and do not contain acceptance provisions based upon the achievement of certain study or laboratory testing results. Revenue of agreed upon rate per unit contracts is recognized as services are performed, based upon rates specified in the contract. Revenue of fixed fee contracts is recognized as services are performed in relation to the total estimated costs to complete procedures specified by clients in the form of study protocols. In general, such amounts become billable in accordance with predetermined payment schedules, but are recognized as revenue as services are performed. Revisions in estimated effort to complete the contract are reflected in the period in which the change became known.
Deferred and unbilled revenue are recognized in our consolidated balance sheets. In some cases, a portion of the contract fee is paid at the time the study is initiated. These advances are recorded as deferred revenue and recognized as revenue as services are performed. Conversely, in some cases, revenue is recorded based on the level of service performed in advance of billing the client and recognized as unbilled receivable. As of December 28, 2013, based on the difference between the estimated levelfair value of services performedplan assets and the billing arrangements defined bybenefit obligation. We measure plan assets and benefit obligations as of the date of our service contracts, we recorded unbilled revenuefiscal year end.
The cost and obligations of $35.2 million and deferred revenue of $54.2 million in our consolidated balance sheet.
Service revenue from our businesses can be categorized as follows:
Safety assessment services provide highly specialized toxicology studies to evaluate the safety and toxicity of new pharmaceutical molecules and materials used in medical devices. It also includes pathology services, which provide the ability to identify and characterize pathologic changes within tissues and cells in determining the safety of a new compound. The safety assessment services arrangements typically range from one to six months but can range up to approximately 24 months in length. These agreements are primarily negotiated for a fixed fee and also include unit-based pricing.
RADS services monitor and analyze the health and genetics of research models used in research protocols. These laboratory servicethese arrangements are generally completed within a one-month period and are also of a fixed fee nature.
GEMS services include validating, maintaining, breeding and testing research models for biomedical research activities. These services are long-term and are recognized as revenue monthly based on agree-upon fixed price per unit.
Discovery Research Services (DRS), which provides non-GLP efficacy studies and other services required as drugs progress through the development pipeline, range between one month and five years. Revenue for these services is recognized as the services are performed.
Insourcing Solutions (IS) provides services for the management of animal care operations on behalf of government, academic, pharmaceutical and biotechnology organizations. These services are billed and recognized as revenue at a fixed rate per hour.
EMD services provide contract microbial identification testing. These services are generally completed in less than 30 days and are billed, and recognized as revenue, upon completion and billing.
Pension Plan Accounting
Our defined benefit pension plans' assets, liabilities and expenses are calculated by accredited independent actuaries using certain assumptions, which are approved by management. The actuarial computations require the use ofmany assumptions to estimate the total benefits ultimately payable to employees and to allocate this cost tothat the service periods. The keyemployee earns while working, the amount of which cannot be completely determined until the benefit payments cease. Major assumptions used to calculate pension costs are determined and reviewed annually by management after consulting with outside investment advisers and actuaries. The key assumptionsin the accounting for these employee benefit plans include the discount rate, the expected return on plan assets, and expected future rate of salary increases. In addition, our actuaries determine the expense or liability of the plan using other assumptions for future experiences such as withdrawal and mortality rate. The assumedrates, discount rate, which is intended to be the actualand rate at which benefits could effectively be settled, is adjustedof increase in employee compensation levels. Assumptions are determined based on the change in the long-term bond yieldour data and appropriate market indicators, and are evaluated each year as of the plans’ measurement date. Should any of these assumptions change, they would have an effect on net periodic pension costs and the unfunded benefit obligation.
The estimatedexpected long-term rate of return on plan assets isreflects the average returnrate of earnings expected on the funds invested, funds overor to be invested, to provide for the periodbenefits included in which future benefits are paid to pension plan participants. We estimate the future return on invested pension assets annually based on information prepared by our outside actuaries and investment advisers. We use several data points to estimateprojected benefit obligations. In determining the expected long-term investment return, including our targeted asset allocation, capital market performance estimates prepared by our outside investment advisers, survey informationrate of rates of return used by other public companies and historical return information. If the actual annual return is different from estimated long-term return on plan assets, we consider the difference is recorded in accumulatedrelative weighting of plan assets, the historical performance of total plan assets and individual asset classes and economic and other comprehensive income and is amortized to pension expense over a periodindicators of approximately 15 to 20 years. future performance.
The weighted averagediscount rate reflects the rate we would have to pay to purchase high-quality investments that would provide cash sufficient to settle our current pension obligations.
The rate of compensation increase reflects the expected long-term returnannual salary increases for the plan participants based on plan assets as of 2013, 2012 and 2011 are 6.3%, 6.6% and 6.8%, respectively. The expected return is intended to match the duration over which our pension plans will provide benefit payments to participants. The duration of our largest plans (the U.S. planhistorical experience and the U.K. plan),current employee compensation strategy.
In fiscal year 2016, new mortality improvement scales were issued in the U.S. reflecting a decline in longevity projection from the 2015 releases that we adopted, which comprise approximately 90% of global plan assetsdecreased our benefit obligations by $1.3 million as of December 28, 2013, are approximately 14 and 22 years, respectively. For the years ended 2013 and 2012, our invested funds achieved returns of 12.0% and 10.8%, respectively. We acknowledge that there are limitations to historical returns in their use to predict future performance, including annual volatility31, 2016. In fiscal year 2015, new mortality improvement scales were issued in the marketU.S. and changesthe United Kingdom (U.K.) reflecting a decline in longevity projection from the 2014 releases that we adopted, which decreased our asset allocation.benefit obligations by $3.3 million as of December 26, 2015.
Stock-basedStock-Based Compensation
We recognize compensation expense for all stock-based payment awards, includinggrant stock options, restricted stock, restricted stock units, and performance share units (PSUs) to employees, and stock options, restricted stock, and restricted stock units to non-employee directors under stock-based compensation plans. We make certain assumptions in order to value and record expense associated with awards made under our stock-based compensation arrangements. Changes in these assumptions may lead to employeesvariability with respect to the timing and directors based onamount of expense we recognize in connection with share-based payments.
Determining the appropriate valuation model and related assumptions requires judgment. The fair value of stock options granted is calculated using the Black-Scholes model and the fair value of PSUs is calculated using a lattice model with a Monte Carlo simulation, both of which require the award at grant date. All awards contain a service condition that requiresuse of subjective assumptions including volatility and expected term, among others.
Determining the employee or directorappropriate amount to provide services in order to vest in the award. Certain of our awards also contain performance and/or market conditions. For awards with performance conditions, we recognize quarterly stock-based compensationexpense based on the grant-date fair valueanticipated achievement of awards expected to vestPSU’s performance targets requires judgment, including forecasting the achievement of future financial targets. The estimate of expense is revised periodically based on the achievementprobability of achieving the required performance condition. For awards with market conditions, we calculatetargets. The cumulative impact of any changes to our estimates is reflected in the incremental fair valueperiod of the market condition at grant date.change.
Stock-based compensation is recognized on a straight-line basisWe also estimate forfeitures over the requisite service period which is generally the vesting period, net of estimated forfeiture for employee turnover. We estimate the fair value of stock options using the Black-Scholes option‑pricing model and we calculate the fair value of our restricted stock awards and restricted stock units based on the quoted market price of our common stock. Forfeiture rates are estimatedwhen recognizing share-based compensation expense based on historical pre-vesting forfeituresrates and forward looking factors; these estimates are updated on a quarterly basisadjusted to reflectthe extent that actual forfeitures of unvested awards.
Estimating the fair value for stock options requires judgment, including estimating stock-price volatility, the expected life of the award, the estimated achievement of performance conditions, and the appropriate risk-free interest rates. The expected volatility rates are estimated based on historical volatilities of our common stock over a period of time that approximates the expected term of the options. The expected life represents the average time that optionsdiffer, or are expected to be outstandingmaterially differ, from our estimates.
New Accounting Pronouncements
For a discussion of new accounting pronouncements, refer to Note 1, “Description of Business and is estimated based on the historical exercise and post-vesting cancellation patternsSummary of our stock options. The estimated achievement of performance conditions is based on our internal financial projections, and the risk-free interest rate is based on the market yield of U.S. Treasury securities for periods approximating the expected terms of the options in effect at the time of grant. These assumptions are updated at least quarterly.
We record deferred tax assets for stock-based awards based on the amount of stock-based compensation recognized in our income statement at the statutory tax rate in the jurisdiction in which we will receive a tax deduction. Differences between the deferred tax assets and the actual tax deduction reported on our income tax returns are recorded in additional paid-in capital. If the tax deduction is less than the deferred tax asset, the calculated shortfall reduces our pool of excess tax benefits. If the pool of excess tax benefits is reducedSignificant Accounting Policies” to zero, then subsequent shortfalls would increase our income tax expense. Our pool of excess tax benefits is computed in accordance with the long form method.
Income Taxes
As part of the process of preparing our consolidated financial statements we estimate our income taxescontained in eachItem 8, “Financial Statements and Other Supplementary Data,” in this Annual Report on Form 10-K.
Results of Operations
Fiscal Year 2016 Compared to Fiscal Year 2015
Revenue
The following table presents consolidated revenue by reportable segment:
|
| | | | | | | | | | | | | | | | | |
| | Fiscal Year | | | | | | |
| | 2016 | | 2015 | | $ change | | % change | | Impact of FX |
| | | | | | | | | | |
| | (in millions, except percentages) |
| RMS | $ | 494.0 |
| | $ | 470.4 |
| | $ | 23.6 |
| | 5.0 | % | | (0.2 | )% |
| DSA | 836.6 |
| | 612.2 |
| | 224.4 |
| | 36.7 | % | | (2.7 | )% |
| Manufacturing | 350.8 |
| | 280.7 |
| | 70.1 |
| | 25.0 | % | | (0.8 | )% |
| Total revenue | $ | 1,681.4 |
| | $ | 1,363.3 |
| | $ | 318.1 |
| | 23.3 | % | | (1.5 | )% |
Revenue for fiscal year 2016 increased $318.1 million, or 23.3%, compared with fiscal year 2015. The negative effect of changes in foreign currency exchange rates decreased revenue by $20.0 million, or 1.5%, when compared to the prior year.
RMS revenue increased $23.6 million due to higher research model services revenue in North America, Europe, and Japan and higher research model revenue in North America, Europe, and Asia; partially offset by the negative effect of changes in foreign currency exchange rates.
DSA revenue increased $224.4 million due to higher revenue in the Safety Assessment business, primarily as a result of the jurisdictionsWIL Research acquisition that contributed $163.5 million to revenue growth, and increased study volume, mix of services, and pricing in our legacy business; and higher revenue in Discovery Services’ In Vivo business, which we operate. This process involves estimating our current tax expenseincludes the acquisitions of Oncotest and assessing temporaryAgilux that contributed $14.6 million to revenue growth; partially offset by lower Early Discovery revenue due primarily to softer demand from global clients; and permanent differences resulting from differing treatmentthe negative effect of items for tax and financial reporting purposes. We recognize deferred tax assets and liabilities for the temporary differences using the enacted tax rates and laws that will bechanges in effect when we expect the differencesforeign currency exchange rates.
Manufacturing revenue increased $70.1 million due to reverse. We assess the realizability of our deferred tax assets based upon the weight of available evidence both positive and negative. To the extent we believe that recovery is not likely, we establish a valuation allowance. In the event that actual results differ from our estimates or we adjust our estimateshigher revenue in the future, we may needMicrobial Solutions business, which includes the acquisition of the Celsis business that contributed $17.9 million to increase or decrease income tax expense which could impact our financial position and results of operations.
As of December 28, 2013, earnings of non-U.S. subsidiaries considered to be indefinitely reinvested totaled $210.3 million. No provision for U.S. income taxes has been provided thereon. Upon distribution of those earningsrevenue growth; higher revenue in the form of dividends or otherwise, we would be subjectBiologics business, which includes the Blue Stream acquisition that contributed $4.1 million to additional U.S. Federal and state income taxes and foreign income and withholding taxes, which could be material. It is our policy to indefinitely reinvest the earnings of our non-U.S. subsidiaries unless they can be repatriated in a manner that generates a tax benefit or an unforeseen cash need arisesrevenue growth; higher revenue in the United States and the earnings can be repatriated in a manner that is substantially tax free. Determination of the amount of unrecognized deferred income tax liabilities on these earnings is not practicableAvian business, primarily due to the complexitiesacquisition of the Sunrise business that contributed $4.9 million to revenue growth; and Contract Manufacturing revenue related to the CDMO services of WIL Research acquired in April 2016 that contributed $12.6 million to revenue growth; partially offset by the negative effect of changes in foreign currency exchange rates.
The following table presents consolidated revenue by type:
|
| | | | | | | | | | | | | | |
| | Fiscal Year | | | | |
| | 2016 | | 2015 | | $ change | | % change |
| | | | | | | | |
| | (in millions, except percentages) |
| Service revenue | $ | 1,130.7 |
| | $ | 858.2 |
| | $ | 272.5 |
| | 31.7 | % |
| Product revenue | 550.7 |
| | 505.1 |
| | 45.6 |
| | 9.0 | % |
| Total revenue | $ | 1,681.4 |
| | $ | 1,363.3 |
| | $ | 318.1 |
| | 23.3 | % |
Service revenue increased $272.5 million due to higher revenue in the Safety Assessment business, primarily as a result of the WIL Research acquisition that contributed $163.5 million to service revenue growth, and increased study volume, mix of services, and pricing in our legacy business; and higher revenue in Discovery Services’ In Vivo business, which includes the acquisitions of Oncotest and Agilux that contributed $14.6 million to revenue growth; Contract Manufacturing revenue related to the CDMO services of WIL Research acquired in April 2016 that contributed $12.6 million to revenue growth; higher revenue in the Biologics business, which includes the Blue Stream acquisition that contributed $4.1 million to revenue growth; and higher research model services revenue in North America, Europe, and Japan; partially offset by lower Early Discovery revenue due primarily to softer demand from global clients; and the negative effect of changes in foreign currency exchange rates.
Product revenue increased $45.6 million due to higher revenue in Microbial Solutions and Avian, which included the acquisitions of the Celsis and Sunrise businesses, respectively, and in total contributed $22.1 million to product revenue growth; and higher research model revenue in North America, Europe, and Asia; partially offset by the negative effect of changes in foreign currency exchange rates.
Cost of Services Provided and Products Sold (Excluding Amortization of Intangible Assets)
The following table presents consolidated cost of services provided and products sold (excluding amortization of intangible assets) by reportable segment:
|
| | | | | | | | | | | | | | |
| | Fiscal Year | | | | |
| | 2016 | | 2015 | | $ change | | % change |
| | | | | | | | |
| | (in millions, except percentages) |
| RMS | $ | 292.8 |
| | $ | 284.2 |
| | $ | 8.6 |
| | 3.0 | % |
| DSA | 572.4 |
| | 407.0 |
| | 165.4 |
| | 40.6 | % |
| Manufacturing | 169.5 |
| | 141.0 |
| | 28.5 |
| | 20.3 | % |
| Total cost of services provided and products sold (excluding amortization of intangible assets) | $ | 1,034.7 |
| | $ | 832.2 |
| | $ | 202.5 |
| | 24.3 | % |
Cost of services provided and products sold (excluding amortization of intangible assets) (Costs) for fiscal year 2016 increased $202.5 million, or 24.3%, compared with fiscal year 2015. Costs as a percentage of revenue for fiscal year 2016 were 61.5%, an increase of 0.5%, from 61.0% for fiscal year 2015.
RMS Costs increased $8.6 million due primarily to the growth of the business, partially offset by cost savings achieved as a result of our efficiency initiatives. RMS Costs as a percentage of revenue for fiscal year 2016 were 59.3%, a decrease of 1.1%, from 60.4% for fiscal year 2015.
DSA Costs increased $165.4 million due primarily to an increase in Safety Assessment Costs, which included a higher cost base due to the acquisition of WIL Research, the growth of the legacy business; an increase in Discovery Services Costs, which included a higher cost base due to the acquisitions of Oncotest and Agilux; a charge of $1.9 million related to an impairment of certain intangibles; and a restructuring charge of $9.4 million related to the consolidation of small DSA facilities in the U.S., Ireland, and the U.K.; partially offset by the favorable effect of changes in foreign currency exchange rates. DSA Costs as a percentage of revenue for fiscal year 2016 were 68.4%, an increase of 1.9%, from 66.5% for fiscal year 2015, primarily due to the acquisition of WIL Research.
Manufacturing Costs increased $28.5 million due primarily to an increase in Biologics Costs resulting from the growth of the business and the acquisition of Blue Stream; an increase in Contract Manufacturing Costs related to the CDMO services of WIL Research acquired in April 2016; an increase in Microbial Solutions Costs resulting from the acquisition of Celsis and the growth of the legacy business; and an increase in Avian Costs, primarily due to the acquisition of the Sunrise business; partially offset by $4.1 million due to lower amortization of inventory fair value adjustments related to the Celsis acquisition. Manufacturing Costs as a percentage of revenue for fiscal year 2016 were 48.3%, a decrease of 1.9%, from 50.2% for fiscal year 2015.
The following table presents consolidated cost of services provided and products sold (excluding amortization of intangible assets) by type:
|
| | | | | | | | | | | | | | |
| | Fiscal Year | | | | |
| | 2016 | | 2015 | | $ change | | % change |
| | | | | | | | |
| | (in millions, except percentages) |
| Cost of services provided | $ | 757.7 |
| | $ | 568.2 |
| | $ | 189.5 |
| | 33.4 | % |
| Cost of products sold | 277.0 |
| | 264.0 |
| | 13.0 |
| | 4.9 | % |
| Total cost of services provided and products sold (excluding amortization of intangible assets) | $ | 1,034.7 |
| | $ | 832.2 |
| | $ | 202.5 |
| | 24.3 | % |
Cost of services provided increased $189.5 million due to an increase in Safety Assessment Costs, which included a higher cost base due to the acquisition of WIL Research, the growth of the legacy business; an increase in Discovery Services Costs, which included a higher cost base due to the acquisitions of Oncotest and Agilux; a charge of $1.9 million related to an impairment of certain intangibles; a restructuring charge of $9.4 million related to the consolidation of small DSA facilities in the U.S., Ireland, and the U.K.; higher Biologics Costs resulting from the growth of the business and the acquisition of Blue Stream; an increase in Contract Manufacturing Costs related to the CDMO services of WIL Research acquired in April 2016; and increased research model services costs due to growth in the business; partially offset by the favorable effect of changes in foreign currency exchange rates primarily related to the Safety Assessment and Discovery Services businesses.
Cost of products sold increased $13.0 million due primarily to higher Microbial Solutions Costs as a result of the acquisition of Celsis and the growth of the legacy business; higher Avian Costs, primarily due to the acquisition of the Sunrise business; and
higher research model costs due to growth in the business; partially offset by $4.1 million due to lower amortization of inventory fair value adjustments related to the Celsis acquisition and savings associated with global efficiency initiatives in the research models business.
Selling, General and Administrative Expenses
|
| | | | | | | | | | | | | | |
| | Fiscal Year | | | | |
| | 2016 | | 2015 | | $ change | | % change |
| | | | | | | | |
| | (in millions, except percentages) |
| RMS | $ | 62.5 |
| | $ | 62.1 |
| | $ | 0.4 |
| | 0.5 | % |
| DSA | 98.3 |
| | 69.2 |
| | 29.1 |
| | 42.0 | % |
| Manufacturing | 65.1 |
| | 57.9 |
| | 7.2 |
| | 12.5 | % |
| Unallocated corporate | 141.6 |
| | 111.2 |
| | 30.4 |
| | 27.4 | % |
| Total selling, general and administrative | $ | 367.5 |
| | $ | 300.4 |
| | $ | 67.1 |
| | 22.3 | % |
Selling, general and administrative expenses (SG&A) for fiscal year 2016 increased $67.1 million, or 22.3%, compared with fiscal year 2015. SG&A as a percentage of revenue for fiscal year 2016 was 21.9%, a decrease of 0.1%, from 22.0% for fiscal year 2015.
The increase in RMS SG&A of $0.4 million was related to an increase of $1.3 million in external consulting and other service expenses; an increase of $0.5 million in operating expenses, including information technology infrastructure and facility expenses; an increase of $0.3 million in compensation, benefits, and other employee-related expenses; and an increase of $0.2 million in stock-based compensation expense; partially offset by a decrease of $0.8 million in severance expense; a decrease of $0.3 million in costs associated with the hypothetical calculation. Additionally,evaluation and integration of acquisitions; a decrease of $0.2 million in bad debt expense; and a decrease of $0.6 million in other expenses. RMS SG&A as a percentage of revenue for fiscal year 2016 was 12.6%, a decrease of 0.6%, from 13.2% for fiscal year 2015.
The increase in DSA SG&A of $29.1 million was related to an increase of $12.5 million in compensation, benefits, and other employee-related expenses; an increase of $5.9 million in operating expenses, including information technology infrastructure and facility expenses; an increase of $5.7 million in costs associated with the amountevaluation and integration of acquisitions; an increase of $2.9 million in severance expense; an increase of $1.5 million in external consulting and other service expenses; an increase of $1.3 million in depreciation expense; an increase of $1.2 million in stock-based compensation expense; and an increase of $0.3 million in other expenses; partially offset by a decrease of $2.2 million in bad debt expense. DSA SG&A as a percentage of revenue for fiscal year 2016 was 11.8%, an increase of 0.5%, from 11.3% for fiscal year 2015.
The increase in Manufacturing SG&A of $7.2 million was related to an increase of $6.7 million in compensation, benefits, and other employee-related expenses; an increase of $1.2 million in external consulting and other service expenses; an increase of $1.0 million in operating expenses, including information technology infrastructure and facility expenses; an increase of $0.7 million in stock-based compensation; and an increase of $0.6 million in other expenses; partially offset by a decrease of $1.8 million in severance expense; a decrease of $1.0 million in costs associated with the liability is dependent uponevaluation and integration of acquisitions; and a decrease of $0.2 million in depreciation expense. Manufacturing SG&A as a percentage of revenue for fiscal year 2016 was 18.6%, a decrease of 2.0%, from 20.6% for fiscal year 2015.
The increase in unallocated corporate SG&A of $30.4 million was related to an increase of $8.0 million in external consulting and other service expenses; an increase of $6.2 million in compensation, benefits, and other employee-related expenses; an increase of $4.8 million in information technology expenses; an increase of $4.0 million in costs associated with the circumstances existing ifevaluation and whenintegration of acquisitions; an increase of $1.5 million in stock-based compensation; an increase of $1.0 million in depreciation expense; and an increase of $4.9 million in other expenses.
Amortization of Intangible Assets Amortization of intangibles for fiscal year 2016 was $41.7 million, an increase of $17.5 million, or 72.1%, from $24.2 million for fiscal year 2015, due primarily to certain intangibles acquired in connection with the remittance occurs.Agilux, Blue Stream, WIL Research, Oncotest, Celsis, and Sunrise acquisitions.
Interest Income Interest income, which represents earnings on held cash, cash equivalents, and time deposits was $1.3 million for fiscal year 2016, an increase of $0.3 million, or 26.0%, compared to $1.0 million for fiscal year 2015.
Interest Expense Interest expense for fiscal year 2016 was $27.7 million, an increase of $12.6 million, or 83.8%, compared to $15.1 million for fiscal year 2015. The increase was primarily due to the write-off of a portion of debt issuance costs in connection with the modification of our $1.3B Credit Facility, a higher average debt balance outstanding as a result of business
We are
acquisitions, a worldwide businesshigher average interest rate as a result of a higher leverage ratio, and operatean increased interest expense related to capital leases.
Other Income (Expense), Net Other income (expense), net, was a net other income of $11.9 million for fiscal year 2016, an increase of $8.9 million, or 295.5%, compared to a net other income of $3.0 million for fiscal year 2015. The increase in variousother income (expense), net was driven by the absence of an expense of $10.4 million due to a reversal of the indemnification asset associated with a previous acquisition in the corresponding period in 2015; an increase of $6.5 million in gains on our venture capital investments accounted for under the equity method; a higher net gain of $2.1 million on life insurance policy investments; a $0.7 million gain on remeasurement of previously held equity interest in an entity acquired in a step acquisition; and an increase of $0.6 million in other activity; partially offset by the absence of a bargain purchase gain of $9.9 million associated with the acquisition of Sunrise in May 2015; and a $1.5 million charge recorded in connection with the modification of the option to purchase the remaining 13% equity interest in Vital River.
Income Taxes Income tax jurisdictions where tax laws and tax rates are subjectexpense was $66.8 million for fiscal year 2016, an increase of $23.4 million, compared to change given the political and economic climate in these countries. We report and pay income taxes based upon operational results and applicable law.$43.4 million for fiscal year 2015. Our current and deferred tax provision is based upon enacted tax rates in effect for the current and future periods. Any significant fluctuation in tax rates or changes in tax laws and regulations or changes to interpretation of existing tax laws and regulations could cause our estimate of taxes to change resulting in either increases or decreases in our effective tax rate.
We recognizerate was 30.0% in the tax benefit from an uncertain tax position only if it is more likely than not thatfiscal year 2016, compared to 22.2% in the tax position will be sustained upon examinationfiscal year 2015. The increase was primarily driven by the taxing authorities based on the technical merits of the tax position. Thenon-deductible expenses associated with acquisitions and restructurings. In addition, we recognized a reduction in unrecognized tax benefits recognized in our financial statements from such positions are measured based upon the largest benefit that has a greater than 50% likelihoodand related interest of being realized upon ultimate resolution.
Due$10.4 million due to our size and the number of tax jurisdictions within which we conduct our global business operations, we are subject to income tax audits on a regular basis. As a result, we have tax reserves which are attributable to potential tax obligations around the world. We believe we have sufficiently provided for all audit exposures and assessments. Resolutions of these audits or the expiration of the statute of limitations associated with pre-acquisition tax positions on the assessmentforgiveness of income taxes for any taxdebt and a non-taxable bargain purchase gain of $9.9 million associated with the acquisition of Sunrise in the fiscal year may result in an increase or decrease2015.
Fiscal Year 2015 Compared to our effective tax rate.Fiscal Year 2014
Results of OperationsRevenue
The following table summarizes historical resultspresents consolidated revenue by reportable segment:
|
| | | | | | | | | | | | | | | | | |
| | Fiscal Year | | | | | | |
| | 2015 | | 2014 | | $ change | | % change | | Impact of FX |
| | | | | | | | | | |
| | (in millions, except percentages) |
| RMS | $ | 470.4 |
| | $ | 503.7 |
| | $ | (33.3 | ) | | (6.6 | )% | | (6.3 | )% |
| DSA | 612.2 |
| | 538.2 |
| | 74.0 |
| | 13.7 | % | | (3.4 | )% |
| Manufacturing | 280.7 |
| | 255.8 |
| | 24.9 |
| | 9.7 | % | | (7.6 | )% |
| Total revenue | $ | 1,363.3 |
| | $ | 1,297.7 |
| | $ | 65.6 |
| | 5.1 | % | | (5.3 | )% |
Revenue for fiscal year 2015 increased $65.6 million, or 5.1%, compared with fiscal year 2014. The negative effect of operationschanges in foreign currency exchange rates decreased revenue by $69.4 million, or 5.3%, when compared to the prior period.
RMS revenue decreased $33.3 million due primarily to the negative effect of changes in foreign currency exchange rates. Excluding the impact of foreign exchange rates, RMS revenue decreased slightly due to lower research model services revenue and lower research models revenue in Japan; partially offset by higher research models revenue in North America, China, and Europe.
DSA revenue increased $74.0 million due to higher revenue in the Safety Assessment business, as a result of increased study volume; higher revenue in the Discovery Services business, primarily as a result of the Argenta, BioFocus, ChanTest, and Oncotest acquisitions that contributed $27.0 million to revenue growth; partially offset by the negative effect of changes in foreign currency exchange rates.
Manufacturing revenue increased $24.9 million, as higher revenue for Microbial Solutions and Avian, which include the Celsis and Sunrise acquisitions, respectively, was partially offset by the negative effect of changes in foreign currency exchange rates.
The following table presents consolidated revenue by type:
|
| | | | | | | | | | | | | | |
| | Fiscal Year | | | | |
| | 2015 | | 2014 | | $ change | | % change |
| | | | | | | | |
| | (in millions, except percentages) |
| Service revenue | $ | 858.2 |
| | $ | 797.8 |
| | $ | 60.4 |
| | 7.6 | % |
| Product revenue | 505.1 |
| | 499.9 |
| | 5.2 |
| | 1.0 | % |
| Total revenue | $ | 1,363.3 |
| | $ | 1,297.7 |
| | $ | 65.6 |
| | 5.1 | % |
Service revenue increased $60.4 million due to higher revenue in the Safety Assessment business, as a result of increased study volume; and higher revenue in the Discovery Services business, which included the acquisitions of Argenta, BioFocus,
ChanTest, and Oncotest that contributed $27.0 million to service revenue growth; partially offset by lower revenue in our research model services and the negative effect of changes in foreign currency exchange rates.
Product revenue increased $5.2 million due to higher revenue for Microbial Solutions and Avian, which include the acquisitions of Celsis and Sunrise, respectively, that contributed $16.7 million to product revenue growth; higher research models revenue in North America, China, and Europe; partially offset by lower revenue in our research models and the negative effect of changes in foreign currency exchange rates.
Cost of Services Provided and Products Sold (Excluding Amortization of Intangible Assets)
The following table presents consolidated cost of services provided and products sold (excluding amortization of intangible assets) by reportable segment:
|
| | | | | | | | | | | | | | |
| | Fiscal Year | | | | |
| | 2015 |
| 2014 | | $ change | | % change |
| | | | | | | | |
| | (in millions, except percentages) |
| RMS | $ | 284.2 |
| | $ | 314.7 |
| | $ | (30.5 | ) | | (9.7 | )% |
| DSA | 407.0 |
| | 387.3 |
| | 19.7 |
| | 5.1 | % |
| Manufacturing | 141.0 |
| | 123.0 |
| | 18.0 |
| | 14.6 | % |
| Total cost of services provided and products sold (excluding amortization of intangible assets) | $ | 832.2 |
| | $ | 825.0 |
| | $ | 7.2 |
| | 0.9 | % |
Costs for fiscal year 2015 increased $7.2 million, or 0.9%, compared with fiscal year 2014. Costs as a percentage of net salesrevenue for the periods shown:
|
| | | | | | | | |
| | Fiscal Year Ended |
| | December 28, 2013 | | December 29, 2012 | | December 31, 2011 |
| Net sales | 100.0 | % | | 100.0 | % | | 100.0 | % |
| Cost of products sold and services provided | 65.8 | % | | 65.0 | % | | 64.8 | % |
| Selling, general and administrative expenses | 19.4 | % | | 18.4 | % | | 17.4 | % |
| Asset impairments | 0.4 | % | | 0.3 | % | | 0.7 | % |
| Amortization of other intangibles | 1.5 | % | | 1.6 | % | | 1.9 | % |
| Operating income | 13.0 | % | | 14.7 | % | | 15.3 | % |
| Interest income | 0.1 | % | | 0.1 | % | | 0.1 | % |
| Interest expense | 1.8 | % | | 3.0 | % | | 3.7 | % |
| Provision for income taxes | 2.8 | % | | 2.4 | % | | 1.5 | % |
| Discontinued operations | (0.1 | )% | | (0.4 | )% | | (0.5 | )% |
| Noncontrolling interests | (0.1 | )% | | (0.1 | )% | | — | % |
| Net income attributable to common shareholders | 8.8 | % | | 8.6 | % | | 9.6 | % |
Segment Operations
The following tables show the net sales and the percentage contributionfiscal year 2015 were 61.0%, a decrease of each of our reportable segments for the past three years. They also show cost of products sold and services provided, asset impairments, selling, general and administrative expenses, amortization of intangible assets and operating income by reportable segment and as percentages of their respective net sales. In our consolidated statements of income, we provide a breakdown of net sales and cost of sales between net products and services. Such information is reported irrespective of the business segment from which the sales were generated.
|
| | | | | | | | | | | |
| | Fiscal Year Ended |
| | December 28, 2013 | | December 29, 2012 | | December 31, 2011 |
| | (dollars in millions) |
| Net sales: | | | | | |
| Research models and services | $ | 707.1 |
| | $ | 695.1 |
| | $ | 705.4 |
|
| Preclinical services | 458.4 |
| | 434.4 |
| | 437.2 |
|
| Cost of products sold and services provided: | | | | | |
| Research models and services | 421.9 |
| | 401.8 |
| | 408.1 |
|
| Preclinical services | 344.6 |
| | 332.1 |
| | 332.3 |
|
| Asset impairment | | | | | |
| Research models and services | 0.4 |
| | 3.5 |
| | 0.7 |
|
| Preclinical services | 3.8 |
| | — |
| | 6.8 |
|
| Selling, general and administrative expenses: | | | | | |
| Research models and services | 94.7 |
| | 81.0 |
| | 83.6 |
|
| Preclinical services | 57.1 |
| | 56.0 |
| | 58.1 |
|
| Unallocated corporate overhead | 74.0 |
| | 71.2 |
| | 56.9 |
|
| Intangible amortization: | | | | | |
| Research models and services | 8.8 |
| | 6.4 |
| | 6.7 |
|
| Preclinical services | 9.0 |
| | 11.7 |
| | 15.0 |
|
| Operating income (loss): | | | | | |
| Research models and services | 181.3 |
| | 202.4 |
| | 206.3 |
|
| Preclinical services | 44.1 |
| | 34.6 |
| | 24.9 |
|
| Unallocated corporate overhead | $ | (74.0 | ) | | $ | (71.2 | ) | | $ | (56.9 | ) |
|
| | | | | | | | |
| | Fiscal Year Ended |
| | December 28, 2013 | | December 29, 2012 | | December 31, 2011 |
| Net sales: | | | | | |
| Research models and services | 60.7 | % | | 61.5 | % | | 61.7 | % |
| Preclinical services | 39.3 | % | | 38.5 | % | | 38.3 | % |
| Cost of products sold and services provided: | | | | | |
| Research models and services | 59.7 | % | | 57.8 | % | | 57.9 | % |
| Preclinical services | 75.2 | % | | 76.4 | % | | 76.0 | % |
| Asset impairment: | | | | | |
| Research models and services | 0.1 | % | | 0.5 | % | | 0.1 | % |
| Preclinical services | 0.8 | % | | — | % | | 1.6 | % |
| Selling, general and administrative expenses: | | | | | |
| Research models and services | 13.4 | % | | 11.6 | % | | 11.8 | % |
| Preclinical services | 12.4 | % | | 12.9 | % | | 13.3 | % |
| Amortization of other intangibles: | | | | | |
| Research models and services | 1.2 | % | | 0.9 | % | | 1.0 | % |
| Preclinical services | 2.0 | % | | 2.7 | % | | 3.4 | % |
| Operating income: | | | | | |
| Research models and services | 25.6 | % | | 29.1 | % | | 29.2 | % |
| Preclinical services | 9.6 | % | | 8.0 | % | | 5.7 | % |
| Unallocated corporate overhead | (6.3 | )% | | (6.3 | )% | | (5.0 | )% |
Fiscal 2013 Compared to Fiscal 2012
Net Sales. Net sales for the year ending December 28, 2013 were $1,165.5 million, an increase of $36.0 million, or 3.2%2.6%, from $1,129.563.6% for fiscal year 2014.
RMS costs decreased $30.5 million for the year ending December 29, 2012. The increase in sales was driven by increases in the PCS business segment. Foreign currency had an unfavorable impact of 0.8% on total sales growth.
Research Models and Services. For the year ending December 28, 2013, net sales for the RMS segment were $707.1 million, an increase of $12.0 million, or 1.7%, from $695.1 million for the year ending December 29, 2012. The increase was primarily due to our acquisitions of 75% of Vital River in 2013, which increased our revenue in China, the inclusion of a full year of Accugenix services (an EMD service provider acquired in 2012), and an increase in legacy EMD products globally. These increases were partially offset by decreased sales of research models in our legacy production operations in the U.S., Europe and Japan, due primarily to infrastructure reductions by our global biopharmaceutical clients. In addition, unfavorablefavorable effect of changes in foreign currency translation decreased sales by 1.2%.
Preclinical Services. For the year ending December 28, 2013, net sales for our PCS segment were $458.4 million, an increase of $24.0 million, or 5.5%, from $434.4 million for the year ending December 29, 2012. Foreign currency translation had an unfavorable impact of 0.4% on sales growth. Net sales increased due to higher demand for our services from both global pharmaceutical and mid-tier biotechnology companies, as well as a more favorable mix of longer-term services.
Cost of Products Sold and Services Provided. Cost of products sold and services provided during 2013 was $766.4 million, an increase of $32.5 million, or 4.4%, from $733.9 million in 2012. Cost of products sold and services provided for 2013 was 65.8% of net sales as compared to 65.0% for the year ending December 29, 2012.
Research Models and Services. Cost of products sold and services provided for RMS during 2013 was $421.9 million, an increase of $20.1 million, or 5.0%, compared to $401.8 million in 2012. Cost of products sold and services provided exclude asset impairment charges of $0.4 million and $3.5 million in 2013 and 2012, respectively, which are discussed below. The increase inexchange rates, cost of products sold and services provided was due to the acquisition of Vital River, which contributed $10.5 million to the increase, and the acceleration of depreciation at our California facility, which contributed $13.5 million to the increase; partially offset by declines in cost of products sold in our legacy research model operations due to lower volume.
Cost of products sold and services provided for the year ending 2013 increased to 59.7% of net sales compared to 57.8% of net sales for 2012. Gross margins were down due to a decline in units sold from our legacy research model facilities in the U.S., Europe and Japan, as well as the accelerated depreciation expenses noted above.
Preclinical Services. Cost of services provided for the PCS segment during 2013 was $344.6 million, an increase of $12.5 million, or 3.8%, compared to $332.1 million in 2012. Cost of services provided excludes asset impairments of $3.8 million in 2013 as discussed below. Cost of services provided as a percentage of net sales was 75.2% in 2013, relatively consistent compared to 76.4% for the year ending December 29, 2012. The increase in gross margin was due to higher volume of services provided and the benefit of efficiency initiatives.
Selling, General and Administrative Expenses. Selling, general and administrative expenses for the year ending December 28, 2013 were $225.7 million, an increase of $17.5 million, or 8.4%, from $208.2 million for the year ending December 29, 2012. Selling, general and administrative expenses in 2013 were 19.4% of net sales compared to 18.4% for the year ending December 29, 2012. Selling, general and administrative expenses increased by $17.5 million over the prior year due to higher compensation expenses in both reportable segments, higher unallocated corporate costs, and the inclusion of selling, general and administrative expenses of acquired businesses in 2013.
Research Models and Services. Selling, general and administrative expenses for RMS for 2013 were $94.7 million, an increase of $13.7 million, or 16.9%, compared to $81.0 million in 2012. Selling, general and administrative expenses increased as a percentage of sales to 13.4% for the year ending December 28, 2013 from 11.6% for the year ending December 29, 2012. As noted above, the primary driver of the increase in RMS selling, general and administrative expense was in inclusion of a full year of selling, general and administrative costs of both Vital River and Accugenix in 2013 as well as increases in compensation expenses.
Preclinical Services. Selling, general and administrative expenses for the PCS segment in 2013 were $57.1 million, an increase of $1.1 million, or 2.0%, compared to $56.0 million in 2012. Selling, general and administrative expenses for the year ending December 28, 2013 decreased to 12.4% of net sales, compared to 12.9% of net sales for the year ending December 29, 2012. The decrease in selling, general and administrative expenses as a percentage of sales was due to the leverage of higher sales on our fixed facility cost base and the benefit of efficiency initiatives.
Unallocated Corporate Overhead. Unallocated corporate overhead, which consists of various costs primarily associated with activities centered at our corporate headquarters, such as compensation (including stock-based compensation), information systems, compliance and facilities expenses associated with our corporate, administration and professional services functions, was $74.0 million for the year ending December 28, 2013, an increase of $2.8 million, or 3.9%, compared to $71.2 million for the year ending December 29, 2012. The increase is primarily the result of increased stock-based compensation and bonus expense and increased audit and tax fees, partially offset by lower Global IT and acquisition-related costs.
Asset Impairments. For the year ending December 28, 2013, we recorded asset impairments of $4.2 million related to our PCS Massachusetts facility and the consolidation of certain RMS Europe operations.
Research Models and Services: In 2012, we commenced a consolidation of certain research model operations in Europe. As a result, we recorded an impairment charge of $3.5 million in 2012 for the disposition of facilities that we own. Following the impairment, the long-lived asset group was classified as held-for-use as we ceased operations over the following several months. We have commenced a search for a buyer of the facility. We continue to utilize the facility in a limited capacity and, accordingly, we have not yet met the criteria for classifying the facility as held-for-sale. Once these conditions are met, we will classify the long-lived assets as held-for-sale, cease depreciation and adjust the assets to fair value quarterly. Additional asset impairment charges of $0.4 million were recorded in 2013 related to equipment no longer required.
Preclinical Services. We recorded an impairment charge of $3.8 million for our PCS Massachusetts facility, which we adjusted to an estimated fair market value of $39.5 million in the fourth quarter of 2013. In 2010, due to the decrease in demand for preclinical services and the excess capacity in the industry, we consolidated our global preclinical facilities and temporarily ceased operations at the PCS Massachusetts facility. As a result, we conducted an impairment test of the facility and adjusted the long-lived asset group to fair market value. Given the change in real estate values for similar properties in suburban Massachusetts, we performed an updated impairment test in 2013, which resulted in a $3.8 million impairment charge in the fourth quarter.
Amortization of Other Intangibles. Amortization of other intangibles for the year ending December 28, 2013 was $17.8 million, a decrease of $0.3 million, from $18.1 million for the year ending December 29, 2012. Amortization expense decreased as a percentage of sales to 1.5% for the year ending December 28, 2013, from 1.6% for the year ending December 29, 2012.
Research Models and Services. In 2013, amortization of other intangibles for our RMS segment was $8.8 million, an increase of $2.4 million from $6.4 million in December 29, 2012. The increase was due to the amortization of intangible assets acquired in recent business acquisitions.
Preclinical Services. For the year ending December 28, 2013, amortization of other intangibles for our PCS segment was $9.0 million, a decrease of $2.7 million from $11.7 million for the year ending December 29, 2012. The decrease was due to intangible assets arising from legacy business acquisitions becoming fully amortized.
Operating Income. Operating income for the year ending December 28, 2013 was $151.4 million, a decrease of $14.4 million compared to $165.8 million for the year ending December 29, 2012. Operating income as a percentage of net sales for the year ending December 28, 2013 was 13.0% compared to 14.7% the year ending December 29, 2012. The reduction in operating income was due to several factors, including accelerated depreciation expense of $15.4 million related to two facilities in the U.S. that were vacated in 2013.
Research Models and Services. For 2013, operating income for our RMS segment was $181.3 million, a decrease of $21.1 million, or 10.4%, from $202.4 million in 2012. Operating income as a percentage of net sales for the year ending December 28, 2013 was 25.6% compared to 29.1% for the year ending December 29, 2012. Operating income in 2013 was affected by accelerated depreciation charges of $13.5 million related to the consolidation of research model production in California. Operating income declined year-over-year in our legacy research model production facilities in the U.S., Europe and Japan due to lower demand for research models in these regions. These declines were partially offset by increased operating income in our global EMD business and growth in the China, driven by our acquisition of 75% of Vital River in 2013.
Preclinical Services. For the year ending December 28, 2013, operating income for our PCS segment was $44.1 million, an increase of $9.5 million, or 27.5%, compared to $34.6 million for the year ending December 29, 2012. Operating income as a percentage of net sales increased to 9.6% in 2013 compared to 8.0% of net sales in December 29, 2012. The increase was driven by increased study volume in relation to our fixed cost structure, favorable study mix, and improved operating efficiencies, all of which increased operating margins, partially offset by accelerated depreciation of $1.9 million related to a leased facility in our U.S. Biologics Testing Services business.
Unallocated Corporate Overhead. Unallocated corporate overhead was $74.0 million during the year ending December 28, 2013, compared to $71.2 million during the year ending December 29, 2012. The increase is primarily the result of increased stock-based compensation and bonus expense and increased audit and tax fees, partially offset by lower Global IT and acquisition-related costs.
Interest Expense. Interest expense for 2013 was $21.0 million, compared to $33.3 million in 2012. The decrease was due to lower interest rates on our debtsavings achieved as a result of our debt refinancingefficiency initiatives, and reduced restructuring costs. RMS costs as a percentage of revenue for fiscal year 2015 were 60.4%, a decrease of 2.1%, from 62.5% for fiscal year 2014.
DSA costs increased $19.7 million due primarily to an increase in May 2013Discovery Services costs, which included a higher cost base due to the acquisitions of Argenta, BioFocus, ChanTest, and Oncotest; partially offset by the favorable effect of changes in foreign currency exchange rates. Safety Assessment costs increased due to higher costs resulting from the growth of the business, partially offset by the favorable effect of changes in foreign currency exchanges rates. DSA costs as a percentage of revenue for fiscal year 2015 were 66.5%, a decrease of 5.5%, from 72.0% for fiscal year 2014, primarily due to improved operating leverage as a result of increased study volume in our Safety Assessment business.
Manufacturing costs increased $18.0 million due primarily to the Celsis and Sunrise acquisitions, partially offset by the favorable effect of changes in foreign currency exchange rates. Manufacturing costs as a percentage of revenue for fiscal year 2015 were 50.2%, an increase of 2.1%, from 48.1% for fiscal year 2014.
The following table presents consolidated cost of services provided and products sold (excluding amortization of intangible assets) by type:
|
| | | | | | | | | | | | | | |
| | Fiscal Year | | | | |
| | 2015 | | 2014 | | $ change | | % change |
| | | | | | | | |
| | (in millions, except percentages) |
| Cost of services provided | $ | 568.2 |
| | $ | 558.6 |
| | $ | 9.6 |
| | 1.7 | % |
| Cost of products sold | 264.0 |
| | 266.4 |
| | (2.4 | ) | | (0.9 | )% |
| Total cost of services provided and products sold (excluding amortization of intangible assets) | $ | 832.2 |
| | $ | 825.0 |
| | $ | 7.2 |
| | 0.9 | % |
Cost of services provided increased $9.6 million due to a higher cost base, as a result of the acquisitions of Argenta, BioFocus, ChanTest, and Oncotest as well as increased Safety Assessment revenues; partially offset by the favorable effect of changes in foreign currency exchange rates and lower costs for our research model services as a result of lower revenue.
Cost of products sold decreased $2.4 million due to savings associated with global efficiency initiatives, reduced restructuring costs and the favorable effect of changes in foreign currency exchange rates; partially offset by increased costs as a result of the acquisitions of Sunrise and Celsis.
Selling, General and Administrative Expenses
|
| | | | | | | | | | | | | | |
| | Fiscal Year | | | | |
| | 2015 | | 2014 | | $ change | | % change |
| | | | | | | | |
| | (in millions, except percentages) |
| RMS | $ | 62.1 |
| | $ | 65.7 |
| | $ | (3.6 | ) | | (5.5 | )% |
| DSA | 69.2 |
| | 63.1 |
| | 6.1 |
| | 9.7 | % |
| Manufacturing | 57.9 |
| | 48.1 |
| | 9.8 |
| | 20.4 | % |
| Unallocated corporate | 111.2 |
| | 92.1 |
| | 19.1 |
| | 20.7 | % |
| Total selling, general and administrative | $ | 300.4 |
| | $ | 269.0 |
| | $ | 31.4 |
| | 11.7 | % |
SG&A for fiscal year 2015 increased $31.4 million, or 11.7%, compared with fiscal year 2014. SG&A as a percentage of revenue for fiscal year 2015 was 22.0%, an increase of 1.3%, from 20.7% for fiscal year 2014.
The decrease in RMS SG&A of $3.6 million was related to a decrease of $1.4 million in external consulting and other service expenses; a decrease of $1.2 million in depreciation expense; a decrease of $1.1 million in compensation, benefits and other employee related expenses; and a decrease of $0.4 million in other expenses; partially offset by an increase of $0.5 million in stock-based compensation, primarily related to our annual stock-based grants made in the first quarter of 2015, which included a new retirement vesting provision. RMS SG&A as a percentage of revenue for fiscal year 2015 was 13.2%, an increase of 0.1%, from 13.1% for fiscal year 2014.
The increase in DSA SG&A of $6.1 million was related to an increase of $5.9 million in compensation, benefits and other employee related expenses; an increase of $1.4 million in external consulting and other service expenses; an increase of $0.4 million in operating expenses, including information technology infrastructure and facility expenses; an increase of $0.4 million in bad debt expense; and an increase of $0.3 million in depreciation expense; partially offset by a decrease of $1.8 million in severance expense and a decrease of $0.5 million in other expenses. DSA SG&A as a percentage of revenue for fiscal year 2015 was 11.3%, a decrease of 0.4%, from 11.7% for fiscal year 2014.
The increase in Manufacturing SG&A of $9.8 million was related to an increase of $4.8 million in compensation, benefits and other employee related expenses; an increase of $1.7 million in external consulting and other service expenses; an increase of $1.6 million in severance expense; an increase of $1.0 million in operating expenses, including information technology infrastructure and facility expenses; an increase of $0.9 million in depreciation expense; and an increase of $0.5 million in stock-based compensation, primarily related to our annual stock-based grants made in the first quarter of 2015, which included a new retirement vesting provision; partially offset by a decrease of $0.7 million in other expenses. Manufacturing SG&A as a percentage of revenue for fiscal year 2015 was 20.6%, an increase of 1.8% from 18.8% for fiscal year 2014.
The increase in unallocated corporate SG&A of $19.1 million was related to an increase of $7.3 million in stock-based compensation, primarily related to our annual stock-based grants made in the first quarter of 2015, which included a new retirement vesting provision and the modification of certain stock-based awards as part of executive retirement transitions; an increase of $7.3 million in costs associated retirementwith the evaluation and integration of our 2013 Notes.acquisitions and compensation costs related to business acquisitions; an increase of $2.2 million in compensation, benefits and other employee-related expenses; an increase of $2.0 million in external consulting and other service expenses; an increase of $1.9 million in information technology related expenses; and an increase of $0.4 million in other expenses; partially offset by a decrease of $2.0 million in contingent consideration related to business acquisitions.
Amortization of Intangible Assets Amortization of intangibles for fiscal year 2015 was $24.2 million, a decrease of $1.8 million, or 6.7%, from $26.0 million for fiscal year 2014, due primarily to certain intangibles acquired in connection with several Discovery Services and Safety Assessment businesses becoming fully amortized and the effect of changes in foreign currency exchange rates, partially offset by an increase due to recent acquisitions, primarily Argenta, BioFocus, ChanTest, Sunrise, Celsis and Oncotest.
Interest Income.Income Interest income, which represents earnings on held cash, cash equivalents, and time deposits, was $1.0 million for 2013 was $0.7fiscal year 2015, a decrease of $0.2 million, or 9.4%, compared to $0.6$1.2 million for fiscal year 2014.
Interest Expense 2012Interest expense for fiscal year 2015 was $15.1 million, an increase of $3.1 million, or 26.1%, compared to $12.0 million for fiscal year 2014. The increase was due primarily to the write-off of a portion of debt issuance costs in connection with the modification of our $970M Credit Facility in April 2015, interest expense related to new capital leases, and overall higher average debt due to lower cash balances and lower interest rates on invested funds.additional borrowings related to business acquisitions.
Other Income (Expense)., Net Other income (expense) includes gains, net was net other income of $3.0 million for fiscal year 2015, a decrease of $7.7 million, or 71.9%, compared to net other income of $10.7 million for fiscal year 2014. The decrease in other
income (expense), net was driven by a decrease of $10.4 million due to a reversal of the indemnification asset associated with a pre-acquisition tax position and lossescorresponding unrecognized tax benefit; a decrease of $5.5 million in income from our venture capital investments in limited partnerships accounted for under the Equity-Method, foreign currency transaction gainsequity method; and losses,the absence of a noncash gain of $2.1 million related to assets assumed at our Frederick, Maryland, facility following the termination of a customer contract, which was recorded in fiscal year 2014; partially offset by a bargain purchase gain of $9.8 million associated with the acquisition of Sunrise and changesan increase of $0.5 million from other activity.
Income Taxes Income tax expense was $43.4 million in the cash surrender valuefiscal year 2015, a decrease of investments in life insurance contracts. Other income (expense) for 2013 was $7.2$4.3 million compared to $(3.3)$47.7 million in 2012. Other income increased due to gains recognized in 2013 on our investments in limited partnerships accounted for under the equity-method.
Income Taxes. Income tax expense in 2013 was $32.9 million, compared to $27.6 million in 2012.fiscal year 2014. Our effective tax rate was 23.8%22.2% in 2013,fiscal year 2015, compared to 21.3%26.8% in 2012.fiscal year 2014. The increase of 2.5% in the effective tax rate for 2013decrease was primarily attributable to a discrete$10.4 million reduction in unrecognized tax detriment of $2.0 millionbenefits and related interest due to an adjustment related to the ongoing transfer pricing controversyexpiration of the statute of limitations associated with pre-acquisition tax positions on the Canadian Revenue Authority, a reduction in research and development tax benefits by $1.8 million arising from the adoptionforgiveness of a new refundable research and development credit provided for in a U.K. tax law change that was enacted in 2013, $1.4 million of costs from a new French tax law enacted in 2013 that applied retroactively to 2012 that limits the deductibility of interest by our French affiliates,debt and a discrete tax costnon-taxable bargain purchase gain of $0.5$9.8 million related to nondeductible transaction costs incurred in 2012 forassociated with the acquisition of Vital River, which closed in the first quarter of 2013.Sunrise. These costsbenefits were partially offset by increased benefitsa tax accrual of $6.6 million of withholding taxes in order to access cash from the domestic production deduction of $0.6 millionour Canadian and reduced unbenefitted tax losses of $0.6 million. The 2012 effective tax rate reflects a benefit from the settlementChinese operations for use outside of the tax litigation related to the 2003 and 2004 Scientific Research and Experimental Development credits (SR&ED) claimed by our Preclinical services facility in Montreal.
Fiscal 2012 Compared to Fiscal 2011
Net Sales. Net sales for the year ending December 29, 2012 were $1,129.5 million, a decrease of $13.1 million, or 1.1%, from $1,142.6 million for the year ending December 31, 2011, due primarily to unfavorable foreign currency translation of 2.0%.U.S.
Research Models and Services. For the year ending December 29, 2012, net sales for our RMS segment were $695.1 million, a decrease of $10.3 million, or 1.5%, from $705.4 million for the year ending December 31, 2011. The decrease was due primarily to unfavorable foreign currency translation which decreased sales by 2.5% and lower sales of research models partially offset by increased sales for EMD and research model services.
Preclinical Services. For the year ending December 29, 2012, net sales for our PCS segment were $434.4 million, a decrease of $2.8 million, or 0.6%, from $437.2 million for the year ending December 31, 2011. The sales decrease was driven by unfavorable foreign currency translation of 1.1% and reduced biopharmaceutial spending partially offset by increased demand for preclinical services.
Cost of Products Sold and Services Provided. Cost of products sold and services provided during 2012 was $733.9 million, a decrease of $6.5 million, or 0.9%, from $740.4 million during 2011. Cost of products sold and services provided during the year ending December 29, 2012 was 65.0% of net sales, compared to 64.8% during the year ending December 31, 2011.
Research Models and Services. Cost of products sold and services provided for RMS during 2012 was $401.8 million, a decrease of $6.3 million, or 1.5%, compared to $408.1 million in 2011. Cost of products sold and services provided for the year ending December 29, 2012 decreased to 57.8% of net sales compared to 57.9% of net sales for the year ending December 31, 2011. The decrease in cost as a percentage of sales was due primarily to the effect of our cost-savings actions partially offset by the effect of lower sales on our fixed cost base.
Preclinical Services. Cost of services provided for the PCS segment during 2012 was $332.1 million, a decrease of $0.2 million, compared to $332.3 million in 2011. Cost of services provided as a percentage of net sales was 76.4% during the year ending December 29, 2012, compared to 76.0% for the year ending December 31, 2011. The increase in cost of services provided as a percentage of net sales was primarily due to the impact of lower sales on our fixed cost base and the performance of client protocols under an expanded preferred provider agreement with a global pharmaceutical client partially offset by our cost-savings actions.
Selling, General and Administrative Expenses. Selling, general and administrative expenses for the year ending December 29, 2012 were $208.2 million, an increase of $9.6 million, or 4.8%, from $198.6 million for the year ending December 31, 2011. Selling, general and administrative expenses during 2012 were 18.4% of net sales compared to 17.4% for the year ending December 31, 2011. The increase in selling, general and administrative expenses as a percent of sales was primarily due to a prior year insurance gain of $7.7 million partially offset by the impact of our cost saving-actions.
Research Models and Services. Selling, general and administrative expenses for RMS for 2012 were $81.0 million, a decrease of $2.6 million, or 3.1%, compared to $83.6 million in 2011. Selling, general and administrative expenses decreased as a percentage of sales to 11.6% for the year ending December 29, 2012 from 11.8% for the year ending December 31, 2011. The decrease in selling, general and administrative expenses as a percent of sales was primarily due to cost-savings actions and the insurance settlement related to our Japan operations.
Preclinical Services. Selling, general and administrative expenses for the PCS segment during 2012 were $56.0 million, a decrease of $2.1 million, or 3.6%, compared to $58.1 million during 2011. Selling, general and administrative expenses for the year ending December 29, 2012 decreased to 12.9% of net sales, compared to 13.3% of net sales for the year ending December 31, 2011, due mainly to the benefit of cost-savings actions.
Unallocated Corporate Overhead. Unallocated corporate overhead, which consists of various costs primarily associated with activities centered at our corporate headquarters, such as compensation (including stock-based compensation), information systems, compliance and facilities expenses associated with our corporate, administration and professional services functions, was $71.2 million during the year ending December 29, 2012, compared to $56.9 million during the year ending December 31, 2011. The increase was primarily due to a prior year life insurance gain of $7.7 million in 2011 and higher 2012 costs related to the evaluation of acquisitions partially offset by cost-savings actions and tight expense control.
Asset Impairment. For the year ending December 29, 2012, we recorded asset impairments of $3.5 million for RMS primarily associated with the consolidation of certain RMS Europe operations. For the year ending December 31, 2011, we recorded an asset impairment of $7.5 million composed of a $6.8 million impairment of our PCS in-process research and development cost and an $0.7 impairment of an RMS facility no longer in use.
Amortization of Other Intangibles. Amortization of other intangibles for the year ending December 29, 2012 was $18.1 million, a decrease of $3.7 million, from $21.8 million for the year ending December 31, 2011. Amortization expense decreased as a percentage of sales to 1.6% for the year ending December 29, 2012, from 1.9% for the year ending December 31, 2011.
Research Models and Services. In 2012, amortization of other intangibles for our RMS segment was $6.4 million, a decrease of $0.3 million from $6.7 million in December 31, 2011.
Preclinical Services. For the year ending December 29, 2012, amortization of other intangibles for our PCS segment was $11.7 million, a decrease of $3.3 million from $15.0 million for the year ending December 31, 2011.
Operating Income. Operating income for the year ending December 29, 2012 was $165.8 million, a decrease of $8.5 million compared to $174.3 million for the year ending December 31, 2011. Operating income as a percentage of net sales for the year ending December 29, 2012 was14.7% compared to 15.3% the year ending December 31, 2011, due primarily to the impact of lower sales on our fixed cost base offset by cost savings actions.
Research Models and Services. For 2012, operating income for our RMS segment was $202.4 million, a decrease of $3.9 million, or 1.9%, from $206.3 million in 2011. Operating income as a percentage of net sales for the year ending December 29, 2012 remained essentially flat at 29.1%, compared to the year ending December 31, 2011, due primarily to the impact of lower sales on our fixed cost base offset by cost savings actions.
Preclinical Services. For the year ending December 29, 2012, operating income for our PCS segment was $34.6 million, an increase of $9.7 million compared to $24.9 million for the year ending December 31, 2011. Operating income as a percentage of net sales increased to 8.0% in 2012 compared to 5.7% of net sales in December 31, 2011. The increase in operating income as a percentage of net sales was primarily due to the cost savings actions and lower amortization.
Unallocated Corporate Overhead. Unallocated corporate overhead was $71.2 million during the year ending December 29, 2012, compared to $56.9 million during the year ending December 31, 2011. The increase was primarily due to a prior year life insurance gain of $7.7 million and costs related to the evaluation of acquisitions partially offset by cost-savings actions and tight expense control.
Interest Expense. Interest expense for 2012 was $33.3 million, compared to $42.6 million in 2011. The decrease was due to decreased debt balances and lower interest rates.
Interest Income. Interest income for 2012 was $0.6 million, compared to $1.4 million for 2011 due to lower cash balances and lower interest rates on invested funds.
Other Income (Expense). Other income (expense) includes gains and losses from investments in limited partnerships accounted for under the Equity-Method, foreign currency transaction gains and losses, and changes in the cash surrender value of investments in life insurance contracts. Other income (expense) for 2012 was $(3.3) million in 2012, compared to $(0.4) million in 2011.
Income Taxes. Income tax expense in 2012 was $27.6 million, compared to $17.1 million in December 31, 2011. Our effective tax rate was 21.3% in 2012, compared to 12.9% in 2011. The 2012 effective tax rate reflects a benefit from the settlement of the tax litigation related to the 2003 and 2004 Scientific Research and Experimental Development credits (SR&ED) claimed by our Preclinical services facility in Montreal. The effective tax rate for 2011 reflects benefits due to releasing a valuation allowance on a tax loss incurred with the disposition of the our Phase I clinical business in the first quarter of 2011, a non-taxable gain on a settlement of a life insurance policy, a settlement of a German tax audit, and the impact of declines in statutory tax rates in the United Kingdom and Japan.
Liquidity and Capital Resources
The following discussion analyzes liquidityWe currently require cash to fund our working capital needs, pension obligations, capital expansion, acquisitions, and capital resources by operating, investing and financing activities as presented into pay our consolidated statements of cash flows.
debt obligations. Our principal sources of liquidity have been our cash flowflows from operations, supplemented by long-term borrowings. On May 29, 2013,Based on our current business plan, we believe that our existing funds, when combined with cash generated from operations and our access to financing resources, are sufficient to fund our operations for the foreseeable future.
The following table presents our cash, cash equivalents and investments:
|
| | | | | | | |
| | December 31, 2016 | | December 26, 2015 |
| | | | |
| | (in millions) |
| Cash and cash equivalents: | | | |
| Held in the U.S. entities | $ | 10.6 |
| | $ | 3.6 |
|
| Held in non-U.S. entities | 107.0 |
| | 114.3 |
|
| Total cash and cash equivalents | 117.6 |
| | 117.9 |
|
| Investments: | | | |
| Held in the U.S. entities | — |
| | 4.5 |
|
| Held in non-U.S. entities | 3.8 |
| | 16.0 |
|
| Total cash, cash equivalents and investments | $ | 121.4 |
| | $ | 138.4 |
|
Borrowings
In April 2015, we amended and restated our credit agreement dated September 23, 2011$970M Credit Facility, creating a $1.3 billion facility ($1.3B Credit Facility) that provides for a $400.0 million term loan facility and a $900.0 million multi-currency revolving facility. The interest rates applicable to repayterm loans outstandingand revolving loans under the previous agreement, retireCompany’s $1.3B Credit Facility were, at our 2.25% Senior Convertible Debenturesoption, equal to either the alternate base rate (which is the higher of (1) the prime rate, (2) the federal funds rate plus 0.5% or (3) the one-month adjusted LIBOR rate plus 1%) or the adjusted LIBOR rate, plus an interest rate margin based upon our leverage ratio.
On March 30, 2016, we amended and extendrestated our $1.3B Credit Facility, creating a $1.65 billion credit facility ($1.65B Credit Facility) which (1) extends the maturity date under a new $970.0 million agreement (the $970M Credit Facility).for the credit facility and (2) makes certain other amendments in connection with our acquisition of WIL Research. The $970M$1.65B Credit Facility has a maturity date of May 2018 and provides for up to approximately $1.65 billion in financing, including a $420.0$650.0 million U.S. term loan facility and a $550.0 million$1.0 billion multi-currency revolving credit facility. The term loan facility matures in 19 quarterly installments, with the last installment due March 30, 2021. The revolving credit facility may be drawn in U.S. Dollars, Euros, Pound Sterling, or Japanese Yen, subject to sub-limits by currency.matures on March 30, 2021, and requires no scheduled payment before that date. Under specified circumstances, we have the ability to expandincrease the term loanloans and/or revolving line of credit facility by up to $350.0 million. The U.S. term loan matures$500.0 million in 20 quarterly installments through May 2018. The revolving credit facility matures in May 2018the aggregate.
Amounts outstanding under the $1.65B Credit Facility were as follows as of December 31, 2016 and requires no scheduled payment before this date. December 26, 2015:
|
| | | | | | | |
| | December 31, 2016 | | December 26, 2015 |
| | | | |
| | (in millions) |
| Term loans | $ | 633.8 |
| | $ | 390.0 |
|
| Revolving credit facility | 578.8 |
| | 446.0 |
|
| Total | $ | 1,212.6 |
| | $ | 836.0 |
|
The interest rates onapplicable to term loan and revolving loans under the $970M$1.65B Credit Facility are, variable and areat our option, equal to either the base rate (which is the higher of (1) the prime rate, (2) the federal funds rate plus 0.50%, or (3) the one-month adjusted LIBOR rate plus 1%) or the adjusted LIBOR rate, plus an interest rate margin based on various applicable published rates plus a spread determined byupon our leverage ratio.
Repurchases of Common Stock
In July 2010, our Board of Directors authorized a $500.0 million stock repurchase program, and subsequently approved increases for an aggregate authorization of $1,150.0 million. During fiscal year 2016, we did not repurchase any shares under our authorized stock repurchase program. As of December 31, 2016, we had $69.7 million remaining on the authorized stock repurchase program. Our $350.0stock-based compensation plans permit the netting of common stock upon vesting of restricted stock, PSUs, and restricted stock units in order to satisfy individual minimum statutory tax withholding requirements. During fiscal year 2016, we acquired approximately 0.2 million of 2.25% Senior Convertible Debentures matured in June 2013 and were retired with fundsshares for $12.3 million.
Cash Flows
The following table presents our net cash provided by operating activities:
|
| | | | | | | | | | | |
| | Fiscal Year |
| | 2016 | | 2015 | | 2014 |
| | | | | | |
| | (in millions) |
| Income from continuing operations | $ | 156.1 |
| | $ | 152.0 |
| | $ | 129.9 |
|
| Adjustments to reconcile net income from continuing operations to net cash provided by operating activities | 174.3 |
| | 126.6 |
| | 126.0 |
|
| Changes in assets and liabilities | (30.0 | ) | | 9.6 |
| | (3.8 | ) |
| Net cash provided by operating activities | $ | 300.4 |
| | $ | 288.2 |
| | $ | 252.1 |
|
Cash flows from operating activities represent the $970M Credit Facilitycash receipts and available cash.
Cash and cash equivalents totaled $155.9 million at December 28, 2013, compareddisbursements related to $109.7 million at December 29, 2012. At December 28, 2013, cash and cash equivalents was comprised of $8.0 million held in the United States and $147.9 million held by non-U.S. subsidiaries. The cash held by our non-U.S. subsidiaries will be used to fund working capital, capital expansion, pension obligations, and funding of future bolt-on acquisitions. We maintain liquidity in the U.S. by having the ability to borrow on our revolving line of credit. In addition to our cash and cash equivalents, as of December 28, 2013, we had $11.2 million in marketable securities, which were held by non-U.S. subsidiaries. In accordance with our policy, the undistributed earningsall of our non-U.S. subsidiaries remain indefinitely reinvestedactivities other than investing and financing activities. Operating cash flow is derived by adjusting our income from continuing operations for (1) non-cash operating items such as depreciation and amortization, stock-based compensation, gains on venture capital investments, and gains on bargain purchases, as well as (2) changes in operating assets and liabilities, which reflect timing differences between the receipt and payment of December 28, 2013 ascash associated with transactions and when they are required to fund needs outside the U.S. and cannot be repatriatedrecognized in a manner that is substantially tax free.
Netour results of operations. The increase in cash provided by operating activities for the years ending December 28, 2013from fiscal year 2015 to 2016 was primarily driven by higher income from continuing operations; and December 29, 2012an increase in non-cash adjustments, primarily an increase in depreciation and amortization as well as stock-based compensation; partially offset by a negative change in operating assets and liabilities. The increase in cash provided by operating activities from fiscal year 2014 and 2015 was $209.0 millionprimarily driven by higher income from continuing operations and $208.0 million, respectively.a positive change in operating assets and liabilities. Our days sales outstanding, (DSO) increased to 56 days as of December 28, 2013 compared to 51 days as of December 29, 2012. Our DSOwhich includes deferred revenue as an offset to accounts receivable in the calculation. The increase in our DSOcalculation, was primarily driven by slower collections. However, we do not anticipate additional credit risk due to the increase. A one-day increase or decrease in our DSO represents a change of approximately $3.2 million of cash provided by operating activities. Our allowance for doubtful accounts was $5.0 million52 days as of December 28, 201331, 2016, compared to $4.3 million51 days as of December 29, 2012.26, 2015, and 52 days as of December 27, 2014.
Net
The following table presents our net cash used in investing activities:
|
| | | | | | | | | | | |
| | Fiscal Year |
| | 2016 | | 2015 | | 2014 |
| | | | | | |
| | (in millions) |
| Acquisition of businesses and assets, net of cash acquired | $ | (648.5 | ) | | $ | (247.7 | ) | | $ | (234.3 | ) |
| Capital expenditures | (55.3 | ) | | (63.3 | ) | | (56.9 | ) |
| Investments, net | 13.7 |
| | (7.1 | ) | | (5.6 | ) |
| Other, net | 3.7 |
| | (2.2 | ) | | (1.2 | ) |
| Net cash used in investing activities | $ | (686.4 | ) | | $ | (320.3 | ) | | $ | (298.0 | ) |
The principal use of cash in investing activities in fiscal year 2016 was related to our acquisitions of WIL Research for 2013 and 2012 was $74.0$577.4 million, and $55.0 million, respectively. During 2013, we acquired two business for $29.2 million in cash, net of cash acquired: we acquired 75% of Vital Riveracquired; Agilux for $24.2$62.0 million, in cash, net of cash acquired of $2.7acquired; and Blue Stream for $8.7 million, and the business of an EMD products and service provider in Singapore for $4.9 million in cash. During 2012, we acquired Accugenix Inc., which is part of our EMD business, for $16.9 million, net of cash acquired. Ouracquired; as well as our capital expenditures during 2013 were $39.2 million,expenditures; partially offset by proceeds from the sale of which $24.4 millioninvestments and distributions from venture capital investments, net of purchases. The principal use of cash in fiscal year 2015 was related to the RMS segmentour acquisitions of Celsis for $202.0 million, net of cash acquired; Oncotest for $35.2 million, net of cash acquired; and $14.8Sunrise for $9.6 million, net of cash acquired; as well as our capital expenditures. The principal use of cash in fiscal year 2014 was primarily related to our acquisitions of Argenta and BioFocus for $182.5 million, net of cash acquired; and ChanTest for $51.1 million, net of cash acquired; as well as our capital expenditures.
The following table presents our net cash provided by financing activities:
|
| | | | | | | | | | | |
| | Fiscal Year |
| | 2016 | | 2015 | | 2014 |
| | | | | | |
| | (in millions) |
| Proceeds from long-term debt and revolving credit facility | $ | 1,044.7 |
| | $ | 492.5 |
| | $ | 298.9 |
|
| Proceeds from exercises of stock options | 23.2 |
| | 39.3 |
| | 73.7 |
|
| Payments on long-term debt, revolving credit facility, and capital lease obligations | (656.6 | ) | | (417.3 | ) | | (194.5 | ) |
| Purchase of treasury stock | (12.3 | ) | | (117.5 | ) | | (122.0 | ) |
| Other, net | (8.2 | ) | | 7.5 |
| | 5.3 |
|
| Net cash provided by financing activities | $ | 390.8 |
| | $ | 4.5 |
| | $ | 61.4 |
|
For fiscal year 2016, cash provided by financing activities reflected net borrowings of $388.0 million and proceeds from exercises of employee stock options of $23.2 million; partially offset by treasury stock purchases of $12.3 million due to the PCS segment. Capital expendituresnetting of common stock upon vesting of stock-based awards in 2012 were $47.5 million.
Netorder to satisfy individual minimum statutory tax withholding requirements and other activity. For fiscal year 2015, cash used inprovided by financing activities for 2013 and 2012 was $84.2 million and $111.1 million, respectively. For 2013 and 2012,reflected net paymentsborrowings of $75.2 million; proceeds from long-term borrowings were $11.5exercises of employee stock options of $39.3 million, and $66.2other activity; partially offset by treasury stock purchases of $117.5 million made pursuant to our authorized stock repurchase program. For fiscal year 2014, cash provided by financing activities reflected net borrowings of $104.4 million; proceeds from exercises of employee stock options of $73.7 million, and we purchased $165.9 million and $64.2 million ofother activity; partially offset by treasury stock respectively. Aspurchases of December 28, 2013, we had $139.1$122.0 million remaining for approved open market treasurymade pursuant to our authorized stock purchases.repurchase program.
Contractual Commitments and Obligations
Minimum future payments of our contractual obligations at December 28, 2013 are as follows (in millions)
|
| | | | | | | | | | | | | | | | | | | |
| Contractual Obligations (in millions) | Total | | Less than 1 Year | | 1 - 3 Years | | 3 - 5 Years | | After 5 Years |
| Debt and capital leases | $ | 663.1 |
| | $ | 21.2 |
| | $ | 89.3 |
| | $ | 552.6 |
| | $ | — |
|
| Interest payments | 37.1 |
| | 9.3 |
| | 17.0 |
| | 10.8 |
| | — |
|
| Operating leases | 55.1 |
| | 14.0 |
| | 18.7 |
| | 10.6 |
| | 11.8 |
|
| Pension and supplemental retirement benefits | 124.6 |
| | 7.6 |
| | 29.9 |
| | 18.8 |
| | 68.3 |
|
| Redeemable noncontrolling interest | 20.6 |
| | | | 20.6 |
| | | | |
| Commitment to limited partnership investments accounted for as equity-method affiliates | 22.6 |
| | 22.6 |
| | | | | | |
| Total contractual cash obligations | $ | 923.1 |
| | $ | 74.7 |
| | $ | 175.5 |
| | $ | 592.8 |
| | $ | 80.1 |
|
The estimated cash obligation for redeemable non-controlling interest, which is exercisable by the non-controlling interest holders in 2016 at fair value, is based on the estimated fair value of the interest as of December
28, 2013. The timing of the remaining capital commitment payments to limited partnership investments is subject to the procedures of the general partner and is therefore estimated by management. 31, 2016 are as follows: |
| | | | | | | | | | | | | | | | | | | |
| | Payments Due by Period |
| | Total | | Less than
1 Year | | 1 - 3 Years | | 3 - 5 Years | | More Than
5 Years |
| | | | | | | | | | |
| | (in millions) |
Notes payable (1) | $ | 1,212.7 |
| | $ | 24.6 |
| | $ | 89.4 |
| | $ | 1,098.7 |
| | $ | — |
|
Operating leases (2) | 101.3 |
| | 23.4 |
| | 37.4 |
| | 21.4 |
| | 19.1 |
|
| Capital leases | 43.2 |
| | 4.1 |
| | 6.5 |
| | 4.6 |
| | 28.0 |
|
Redeemable noncontrolling interest (3) | 14.1 |
| | — |
| | 14.1 |
| | — |
| | — |
|
Venture capital investment commitments (4) | 46.6 |
| | 29.9 |
| | 15.7 |
| | 1.0 |
| | — |
|
Contingent consideration (5) | 3.8 |
| | 3.8 |
| | — |
| | — |
| | — |
|
Unconditional purchase obligations (6) | 86.2 |
| | 79.1 |
| | 7.1 |
| | — |
| | — |
|
| Total contractual cash obligations | $ | 1,507.9 |
| | $ | 164.9 |
| | $ | 170.2 |
| | $ | 1,125.7 |
| | $ | 47.1 |
|
| |
(1) | Notes payable includes the principal payments on our debt. |
| |
(2) | We lease properties and equipment for use in our operations. In addition to rent, the leases may require us to pay additional amounts for taxes, insurance, maintenance, and other operating expenses. Amounts reflected within the table detail future minimum rental commitments under non-cancellable operating leases for each of the periods presented. |
| |
(3) | The estimated cash obligation for redeemable noncontrolling interest is based on the amount that would be paid if settlement occurred as of the balance sheet date based on the contractually defined redemption value as of December 31, 2016. |
| |
(4) | The timing of the remaining capital commitment payments to venture capital funds is subject to the procedures of the limited liability partnerships and limited liability companies; the above table reflects the earliest possible date the payment can be required under the relevant agreements. |
| |
(5) | In connection with business acquisitions, we agreed to make additional payments of up to $3.8 million based upon the achievement of certain financial targets. The contingent consideration obligation included in the table above has not been probability adjusted or discounted. |
| |
(6) | Unconditional purchase obligations include agreements to purchase goods or services that are enforceable and legally binding and that specify all significant terms, including fixed or minimum quantities to be purchased, fixed, minimum or variable price provisions, and the approximate timing of the transaction. Purchase obligations exclude agreements that are cancellable at any time without penalty. |
The above table does not reflect unrecognizedexcludes obligations related to our pension and other post-retirement benefit plans. Refer to Item 8, “Financial Statements and Other Supplementary Data,” in this Annual Report on Form 10-K for more details.
Tax Related Obligations
We excluded liabilities pertaining to uncertain tax benefits.positions from our summary of contractual obligations presented above, as we cannot make a reliable estimate of the period of cash settlement with the respective taxing authorities. As of December 31, 2016, we had $24.2 million of liabilities associated with uncertain tax positions.
Off-Balance Sheet Arrangements
We doAs of December 31, 2016, we did not have any relationships with unconsolidated entities or financial partnerships, such as entities often referred to as structured finance or special purpose entities, that would have been established for the purpose of facilitatingsignificant off-balance sheet arrangements, (as that term isas defined in Item 303(a)(4)(ii) of SEC Regulation S-K) or other contractually narrow or limited purposes. As such, we are not exposedS-K promulgated under the Exchange Act, except as disclosed below.
Venture Capital Investments
We invest in several venture capital funds that invest in start-up companies, primarily in the life sciences industry. Our total commitment to any financing, liquidity, market or credit risk that could arise ifthese entities as of December 31, 2016 was $84.8 million, of which we had engaged in those types of relationships. We include standard indemnification provisions in client contracts, which include standard provisions limitingfunded $38.2 million. Refer to Note 4, “Venture Capital Investments and Marketable Securities,” to our liability under such contracts, including our indemnification obligations, with certain exceptions.
Recent Accounting Pronouncements
There are no recent accounting pronouncements that have been issued but are not yet effective that will have a material impact our future consolidated financial statements.statements contained in Item 8, “Financial Statements and Other Supplementary Data,” in this Annual Report on Form 10-K for further details.
Letters of Credit
Our off-balance sheet commitments related to our outstanding letters of credit as of December 31, 2016 were $4.9 million.
Item 7A. Quantitative and Qualitative Disclosures about Market Risk
Certain of our financial instrumentsWe are subjectexposed to market risks, includingrisk from changes in interest rate riskrates and foreign currency exchange rates.rates, which could affect our future results of operations and financial condition. We generally do not use financial instruments for trading or other speculative purposes.manage our exposure to these risks through our regular operating and financing activities.
Interest Rate Risk
We amended and restatedare exposed to changes in interest rates while conducting normal business operations as a result of ongoing financing activities. As of December 31, 2016, our credit facility on May 29, 2013. Our primarydebt portfolio was comprised primarily of floating interest rate exposure results from changesborrowings. A 100-basis point increase in LIBOR or the base rates that are used to determine the applicable interest rates underwould increase our term loans and revolving credit agreement.
Our potential additionalannual pre-tax interest expense over one year that would result from a hypothetical, instantaneous and unfavorable change of 100 basis points in the interest rate would beby approximately $9.6 million on a pre-tax basis. The book value of our debt approximates fair value.$12.1 million.
Foreign Currency Exchange Rate Risk
We operate on a global basis and have exposure to some foreign currency exchange rate fluctuations for our earningsfinancial position, results of operations, and cash flows. This risk is mitigated by
While the fact that variousfinancial results of our global activities are reported in U.S. dollars, our foreign subsidiaries typically conduct their operations are principally conducted in their respective local currencies. A portioncurrency. The principal functional currencies of the Company’s foreign subsidiaries are the Euro, British Pound, and Canadian Dollar. During fiscal year 2016, the most significant drivers of foreign currency translation adjustment that the Company recorded as part of other comprehensive income (loss) were the Euro, British Pound, Canadian Dollar, and to a lesser extent, the Chinese Yuan Renminbi and Japanese Yen.
Fluctuations in the foreign currency exchange rates of the countries in which we do business will affect our financial position, results of operations, and cash flows. As the U.S. dollar strengthens against other currencies, particularly as a result of Brexit and other recent developments, the value of our non-U.S. revenue, from our foreign operations is denominatedexpenses, assets, liabilities, and cash flows will generally decline when reported in U.S. dollars,dollars. The impact to net income as a result of a U.S. dollar strengthening will be partially mitigated by the value of non-U.S. expense, which will also decline when reported in U.S. dollars. As the U.S. dollar weakens versus other currencies, the value of the non-U.S. revenue and expenses, assets, liabilities, and cash flows will generally increase when reported in U.S. dollars. For fiscal year 2016, our revenue would have decreased by approximately $65.9 million and our operating income would have decreased by approximately $2.8 million, respectively, if the U.S. dollar exchange rate would have strengthened by 10% with the costs accounted for in their local currencies. Additionally, we have exposure on certain intercompany loans. all other variables held constant.
We attempt to minimize this exposure by using certain financial instruments for purposes other than trading, in accordance with our overall risk management and our hedge policy. In accordance with our hedge policy, we designate such transactions as hedges.We do not enter into speculative derivative agreements.
During 2013,fiscal year 2016, we utilized foreign exchange contracts, principally to hedge the impact of currency fluctuations on client transactions and certain balance sheet items, including intercompany loans. There were no foreignexposures resulting from currency hedges outstanding as of December 28, 2013.fluctuations.
Item 8. Financial Statements and Supplementary Data
INDEX TO CONSOLIDATED FINANCIAL STATEMENTS
|
| | |
| | |
| |
Consolidated Financial Statements: | |
| | |
| | |
| 2014 | |
| 2014 | |
| 26, 2015 | |
| 2014 | |
| 2016, 2015 and 2014 | |
| | |
Supplementary Data: | |
| | |
Management's Annual Report on Internal Control Over Financial Reporting
Our management is responsible for establishing and maintaining adequate internal control over financial reporting (as defined in Rules 13a-15(f) and 15d-15(f) under the Securities Exchange Act of 1934, as amended). Our internal control over financial reporting is a process designed to provide reasonable assurance regarding the reliability of financial reporting and the preparation of financial statements for external purposes in accordance with generally accepted accounting principles. Because of its inherent limitations, internal control over financial reporting may not prevent or detect misstatements. Also, projections of any evaluation of effectiveness to future periods are subject to the risk that controls may become inadequate because of changes in conditions, or that the degree of compliance with the policies or procedures may deteriorate.
Under the supervision and with the participation of our management, including our CEO and CFO, we conducted an evaluation of the effectiveness of our internal control over financial reporting based on the framework in Internal Control-Integrated Framework(1992) issued by the Committee of Sponsoring Organizations of the Treadway Commission. Based on our assessment and those criteria, management concluded that the Company maintained effective internal control over financial reporting as of December 28, 2013.
The effectiveness of our internal control over financial reporting as of December 28, 2013 has been audited by PricewaterhouseCoopers LLP, an Independent Registered Public Accounting Firm, as stated in their report which is included herein.
Report of Independent Registered Public Accounting Firm
To the Board of Directors and Shareholders of Charles River Laboratories International, Inc.:
In our opinion, the accompanying consolidated balance sheets and the related consolidated statements of income, comprehensive income, changes in equity and cash flows present fairly, in all material respects, the financial position of Charles River Laboratories International, Inc. and its subsidiariesat December 28, 201331, 2016 and December 29, 2012,26, 2015, and the results of theiroperations and their cash flows for each of the three years in the period endedDecember 28, 201331, 2016 in conformity with accounting principles generally accepted in the United States of America. Also in our opinion, the Company maintained, in all material respects, effective internal control over financial reporting as of December 28, 201331, 2016, based on criteria established in Internal Control - Integrated Framework (1992)(2013) issued by the Committee of Sponsoring Organizations of the Treadway Commission (COSO). The Company's management is responsible for these financial statements, for maintaining effective internal control over financial reporting and for its assessment of the effectiveness of internal control over financial reporting, included in Management's Report on Internal Control over Financial Reporting appearing under Item 8.9A. Our responsibility is to express opinions on these financial statements and on the Company's internal control over financial reporting based on our integratedaudits. We conducted our audits in accordance with the standards of the Public Company Accounting Oversight Board (United States). Those standards require that we plan and perform the audits to obtain reasonable assurance about whether the financial statements are free of material misstatement and whether effective internal control over financial reporting was maintained in all material respects. Our audits of the financial statements included examining, on a test basis, evidence supporting the amounts and disclosures in the financial statements, assessing the accounting principles used and significant estimates made by management, and evaluating the overall financial statement presentation. Our audit of internal control over financial reporting included obtaining an understanding of internal control over financial reporting, assessing the risk that a material weakness exists, and testing and evaluating the design and operating effectiveness of internal control based on the assessed risk. Our audits also included performing such other procedures as we considered necessary in the circumstances. We believe that our audits provide a reasonable basis for our opinions.
A company'scompany’s internal control over financial reporting is a process designed to provide reasonable assurance regarding the reliability of financial reporting and the preparation of financial statements for external purposes in accordance with generally accepted accounting principles. A company'scompany’s internal control over financial reporting includes those policies and procedures that (i) pertain to the maintenance of records that, in reasonable detail, accurately and fairly reflect the transactions and dispositions of the assets of the company; (ii) provide reasonable assurance that transactions are recorded as necessary to permit preparation of financial statements in accordance with generally accepted accounting principles, and that receipts and expenditures of the company are being made only in accordance with authorizations of management and directors of the company; and (iii) provide reasonable assurance regarding prevention or timely detection of unauthorized acquisition, use, or disposition of the company'scompany’s assets that could have a material effect on the financial statements.
Because of its inherent limitations, internal control over financial reporting may not prevent or detect misstatements. Also, projections of any evaluation of effectiveness to future periods are subject to the risk that controls may become inadequate because of changes in conditions, or that the degree of compliance with the policies or procedures may deteriorate.
As described in Management's Report on Internal Control over Financial Reporting, management has excluded WRH, Inc., Blue Stream Laboratories, Inc., and Agilux Laboratories, Inc. from its assessment of internal control over financial reporting as of December 31, 2016 because they were acquired by the Company during 2016. We have also excluded WRH, Inc., Blue Stream Laboratories, Inc., and Agilux Laboratories, Inc. from our audit of internal control over financial reporting. WRH, Inc., Blue Stream Laboratories, Inc., and Agilux Laboratories, Inc. are wholly-owned subsidiaries whose total assets and total revenues represent 7.8 percent and 11.1 percent, respectively, of the related consolidated financial statement amounts as of and for the year ended December 31, 2016.
/s/ PricewaterhouseCoopers LLP
Boston, Massachusetts
February 25, 201414, 2017
CHARLES RIVER LABORATORIES INTERNATIONAL, INC.
CONSOLIDATED STATEMENTS OF INCOME
(dollars in thousands, except per share amounts)
| | | | Fiscal Year Ended | Fiscal Year |
| | December 28,
2013 | | December 29,
2012 | | December 31,
2011 | 2016 | | 2015 | | 2014 |
| Net sales related to products | $ | 476,362 |
| | $ | 467,944 |
| | $ | 483,309 |
| |
| Net sales related to services | 689,166 |
| | 661,586 |
| | 659,338 |
| |
| Net sales | 1,165,528 |
| | 1,129,530 |
| | 1,142,647 |
| |
| Service revenue | | $ | 1,130,733 |
| | $ | 858,244 |
| | $ | 797,765 |
|
| Product revenue | | 550,699 |
| | 505,058 |
| | 499,897 |
|
| Total revenue | | 1,681,432 |
| | 1,363,302 |
| | 1,297,662 |
|
| Costs and expenses: | | | | | | | | | | |
| Cost of products sold | 272,302 |
| | 255,409 |
| | 267,966 |
| |
| Cost of services provided | 494,122 |
| | 478,492 |
| | 472,439 |
| |
| Asset impairments (Note 4) | 4,202 |
| | 3,548 |
| | 7,492 |
| |
| Cost of services provided (excluding amortization of intangible assets) | | 757,732 |
| | 568,227 |
| | 558,578 |
|
| Cost of products sold (excluding amortization of intangible assets) | | 277,034 |
| | 263,983 |
| | 266,424 |
|
| Selling, general and administrative | 225,695 |
| | 208,248 |
| | 198,648 |
| 367,548 |
| | 300,414 |
| | 269,033 |
|
| Amortization of other intangibles | 17,806 |
| | 18,068 |
| | 21,796 |
| |
| Amortization of intangible assets | | 41,699 |
| | 24,229 |
| | 25,957 |
|
| Operating income | 151,401 |
| | 165,765 |
| | 174,306 |
| 237,419 |
| | 206,449 |
| | 177,670 |
|
| Other income (expense): | | | | | | | | | | |
| Interest income | 730 |
| | 589 |
| | 1,353 |
| 1,314 |
| | 1,043 |
| | 1,154 |
|
| Interest expense | (20,969 | ) | | (33,342 | ) | | (42,586 | ) | (27,709 | ) | | (15,072 | ) | | (11,950 | ) |
| Other, net | 7,165 |
| | (3,266 | ) | | (411 | ) | |
| Other income (expense), net | | 11,897 |
| | 3,008 |
| | 10,721 |
|
| Income from continuing operations, before income taxes | 138,327 |
| | 129,746 |
| | 132,662 |
| 222,921 |
| | 195,428 |
| | 177,595 |
|
| Provision for income taxes | 32,911 |
| | 27,628 |
| | 17,140 |
| 66,835 |
| | 43,391 |
| | 47,671 |
|
| Income from continuing operations, net of income taxes | 105,416 |
| | 102,118 |
| | 115,522 |
| 156,086 |
| | 152,037 |
| | 129,924 |
|
| Loss from discontinued operations, net of taxes | (1,265 | ) | | (4,252 | ) | | (5,545 | ) | |
| Income (loss) from discontinued operations, net of income taxes | | 280 |
| | (950 | ) | | (1,726 | ) |
| Net income | 104,151 |
| | 97,866 |
| | 109,977 |
| 156,366 |
| | 151,087 |
| | 128,198 |
|
| Less: Net loss (income) attributable to noncontrolling interests | (1,323 | ) | | (571 | ) | | (411 | ) | |
| Less: Net income attributable to noncontrolling interests | | 1,601 |
| | 1,774 |
| | 1,500 |
|
| Net income attributable to common shareholders | $ | 102,828 |
| | $ | 97,295 |
| | $ | 109,566 |
| $ | 154,765 |
| | $ | 149,313 |
| | $ | 126,698 |
|
| Earnings (loss) per common share | | | | | | | | | | |
| Basic: | | | | | | | | | | |
| Continuing operations attributable to common shareholders | $ | 2.18 |
| | $ | 2.12 |
| | $ | 2.26 |
| $ | 3.28 |
| | $ | 3.23 |
| | $ | 2.76 |
|
| Discontinued operations | $ | (0.03 | ) | | $ | (0.09 | ) | | $ | (0.11 | ) | $ | 0.01 |
| | $ | (0.02 | ) | | $ | (0.04 | ) |
| Net income attributable to common shareholders | $ | 2.15 |
| | $ | 2.03 |
| | $ | 2.16 |
| $ | 3.29 |
| | $ | 3.21 |
| | $ | 2.72 |
|
| Diluted: | | | | | | | | | | |
| Continuing operations attributable to common shareholders | $ | 2.15 |
| | $ | 2.10 |
| | $ | 2.24 |
| $ | 3.22 |
| | $ | 3.15 |
| | $ | 2.70 |
|
| Discontinued operations | $ | (0.03 | ) | | $ | (0.09 | ) | | $ | (0.11 | ) | $ | 0.01 |
| | $ | (0.02 | ) | | $ | (0.04 | ) |
| Net income attributable to common shareholders | $ | 2.12 |
| | $ | 2.01 |
| | $ | 2.14 |
| $ | 3.23 |
| | $ | 3.13 |
| | $ | 2.66 |
|
| | | | | | | |
| | | | | | | |
| | | | | | | |
| | | | | | | |
| | | | | | | |
| | | | | | | |
| | | | | | | |
| | | | | | | |
| | | | | | | |
| | | | | | | |
| | | | | | | |
| | | | | | | |
| | | | | | | |
| | | | | | | |
| See Notes to Consolidated Financial Statements. | | See Notes to Consolidated Financial Statements. |
See Notes to Consolidated Financial Statements.
CHARLES RIVER LABORATORIES INTERNATIONAL, INC.
CONSOLIDATED STATEMENTS OF COMPREHENSIVE INCOME
(dollars in thousands, except per share amounts)thousands)
|
| | | | | | | | | | | |
| | Fiscal Year Ended |
| | December 28, 2013 | | December 29, 2012 | | December 31, 2011 |
| Net income | $ | 104,151 |
| | $ | 97,866 |
| | $ | 109,977 |
|
| Foreign currency translation adjustment: | | | | | |
| Write-off of currency translation adjustment for liquidated entities | — |
| | 636 |
| | — |
|
| Foreign currency translation adjustment for the period | (15,322 | ) | | 4,682 |
| | (12,264 | ) |
| Unrealized gains (losses) on marketable securities: | | | | | |
| Unrealized gains (losses) for the period | — |
| | 209 |
| | (325 | ) |
| Add: reclassification adjustment for losses included in net income | — |
| | 712 |
| | — |
|
| Defined benefit plan gains (losses) and prior service costs not yet recognized as components of net periodic pension cost: | | | | | |
| Prior service cost and gains (losses) for the period | 19,293 |
| | (8,634 | ) | | (23,728 | ) |
| Amortization of prior service costs and net gains and losses | 3,017 |
| | 2,772 |
| | 1,068 |
|
| Comprehensive income, before tax | 111,139 |
| | 98,243 |
| | 74,728 |
|
| Income tax (benefit) related to items of other comprehensive income | 7,805 |
| | (1,677 | ) | | (6,272 | ) |
| Comprehensive income, net of tax | 103,334 |
| | 99,920 |
| | 81,000 |
|
| Less: comprehensive income related to noncontrolling interests | 1,752 |
| | 615 |
| | 476 |
|
| Comprehensive income attributable to common shareholders | $ | 101,582 |
| | $ | 99,305 |
| | $ | 80,524 |
|
|
| | | | | | | | | | | |
| | Fiscal Year |
| | 2016 | | 2015 | | 2014 |
| Net income | $ | 156,366 |
| | $ | 151,087 |
| | $ | 128,198 |
|
| Other comprehensive income (loss): | | | | | |
| Foreign currency translation adjustment and other | (73,243 | ) | | (61,982 | ) | | (48,955 | ) |
| Cumulative translation adjustment related to intercompany loan forgiveness | — |
| | (2,341 | ) | | — |
|
| Pension and other post-retirement benefit plans (Note 10): | | | | | |
| Prior service cost and gains (losses) arising during the period | (60,678 | ) | | (302 | ) | | (42,236 | ) |
| Amortization of net gains (losses) and prior service benefit included in net periodic pension cost | 1,711 |
| | 2,617 |
| | 1,234 |
|
| Comprehensive income, before income taxes | 24,156 |
| | 89,079 |
| | 38,241 |
|
Income tax expense (benefit) related to items of other comprehensive income
(Note 8) | (12,369 | ) | | 530 |
| | (9,897 | ) |
| Comprehensive income, net of income taxes | 36,525 |
| | 88,549 |
| | 48,138 |
|
| Less: Comprehensive income (loss) related to noncontrolling interests, net of income taxes | (24 | ) | | 537 |
| | 1,044 |
|
| Comprehensive income attributable to common shareholders, net of income taxes | $ | 36,549 |
| | $ | 88,012 |
| | $ | 47,094 |
|
| | | | | | |
| | | | | | |
| | | | | | |
| | | | | | |
| | | | | | |
| | | | | | |
| | | | | | |
| | | | | | |
| | | | | | |
| | | | | | |
| | | | | | |
| | | | | | |
| | | | | | |
| | | | | | |
| | | | | | |
| | | | | | |
| | | | | | |
| | | | | | |
| | | | | | |
| | | | | | |
| | | | | | |
| | | | | | |
| | | | | | |
| | | | | | |
| | | | | | |
| | | | | | |
| | | | | | |
| | | | | | |
| | | | | | |
| See Notes to Consolidated Financial Statements. |
See Notes to Consolidated Financial Statements.
CHARLES RIVER LABORATORIES INTERNATIONAL, INC.
CONSOLIDATED BALANCE SHEETS
(dollars in thousands, except per share amounts)
| | | | December 28,
2013 | | December 29,
2012 | December 31, 2016 | | December 26, 2015 |
| Assets | | | | | | |
| Current assets: | | | | | | |
| Cash and cash equivalents | $ | 155,927 |
| | $ | 109,685 |
| $ | 117,626 |
| | $ | 117,947 |
|
| Trade receivables, net | 220,630 |
| | 203,001 |
| 364,050 |
| | 270,068 |
|
| Inventories | 89,396 |
| | 88,470 |
| 95,833 |
| | 93,735 |
|
| Prepaid assets | | 34,315 |
| | 30,198 |
|
| Other current assets | 85,847 |
| | 83,601 |
| 45,008 |
| | 47,286 |
|
| Current assets of discontinued businesses | 750 |
| | 495 |
| |
| Total current assets | 552,550 |
| | 485,252 |
| 656,832 |
| | 559,234 |
|
| Property, plant and equipment, net | 676,182 |
| | 717,020 |
| 755,827 |
| | 677,959 |
|
| Goodwill, net | 230,701 |
| | 208,609 |
| |
| Goodwill | | 787,517 |
| | 438,829 |
|
| Client relationships, net | | 320,157 |
| | 213,374 |
|
| Other intangible assets, net | 84,537 |
| | 84,922 |
| 74,291 |
| | 67,430 |
|
| Deferred tax asset | 35,536 |
| | 38,554 |
| |
| Deferred tax assets | | 28,746 |
| | 40,028 |
|
| Other assets | 61,964 |
| | 48,659 |
| 88,430 |
| | 71,643 |
|
| Long-term assets of discontinued businesses | 3,151 |
| | 3,328 |
| |
| Total assets | $ | 1,644,621 |
| | $ | 1,586,344 |
| $ | 2,711,800 |
| | $ | 2,068,497 |
|
| Liabilities and Equity | | | | |
| Liabilities, Redeemable Noncontrolling Interest and Equity | | | | |
| Current liabilities: | | | | | | |
| Current portion of long-term debt and capital leases | $ | 21,437 |
| | $ | 139,384 |
| $ | 27,313 |
| | $ | 17,033 |
|
| Accounts payable | 31,770 |
| | 31,218 |
| 68,485 |
| | 36,675 |
|
| Accrued compensation | 58,461 |
| | 46,951 |
| 93,471 |
| | 72,832 |
|
| Deferred revenue | 54,177 |
| | 56,422 |
| 127,731 |
| | 81,343 |
|
| Accrued liabilities | 56,712 |
| | 45,208 |
| 84,470 |
| | 89,494 |
|
| Other current liabilities | 22,546 |
| | 21,262 |
| 26,500 |
| | 12,544 |
|
| Current liabilities of discontinued businesses | 1,931 |
| | 1,802 |
| |
| Current liabilities of discontinued operations | | 1,623 |
| | 1,840 |
|
| Total current liabilities | 247,034 |
| | 342,247 |
| 429,593 |
| | 311,761 |
|
| Long-term debt and capital leases | 642,352 |
| | 527,136 |
| |
| Long-term debt, net and capital leases | | 1,207,696 |
| | 845,997 |
|
| Deferred tax liabilities | | 55,717 |
| | 48,223 |
|
| Other long-term liabilities | 82,497 |
| | 104,966 |
| 159,239 |
| | 89,062 |
|
| Long-term liabilities of discontinued businesses | 8,080 |
| | 8,795 |
| |
| Long-term liabilities of discontinued operations | | 5,771 |
| | 7,890 |
|
| Total liabilities | 979,963 |
| | 983,144 |
| 1,858,016 |
| | 1,302,933 |
|
| Commitments and contingencies (Notes 1 and 10) |
| |
| |
| Commitments and contingencies (Notes 2, 7, 9, 10, 13, and 17) | |
| |
|
| Redeemable noncontrolling interest | 20,581 |
| | — |
| 14,659 |
| | 28,008 |
|
| Shareholders' equity: | | | | |
| Preferred stock, $0.01 par value; 20,000,000 shares authorized; no shares issued and outstanding | — |
| | — |
| |
| Common stock, $0.01 par value; 120,000,000 shares authorized; 82,522,905 issued and 47,553,841 shares outstanding at December 28, 2013 and 79,607,981 issued and 48,220,037 shares outstanding at December 29, 2012, respectively | 825 |
| | 796 |
| |
| Equity: | | | | |
| Preferred stock, $0.01 par value; 20,000 shares authorized; no shares issued and outstanding | | — |
| | — |
|
| Common stock, $0.01 par value; 120,000 shares authorized; 86,301 shares issued and 47,363 shares outstanding as of December 31, 2016 and 85,464 shares issued and 46,698 shares outstanding as of December 26, 2015 | | 863 |
| | 855 |
|
| Additional paid-in capital | 2,206,155 |
| | 2,097,316 |
| 2,477,371 |
| | 2,397,960 |
|
| Accumulated deficit | (265,473 | ) | | (368,301 | ) | |
| Treasury stock, at cost, 34,969,064 shares and 31,387,944 shares at December 28, 2013 and December 29, 2012, respectively | (1,305,880 | ) | | (1,135,609 | ) | |
| Accumulated other comprehensive income | 5,357 |
| | 6,603 |
| |
| Total shareholders' equity | 640,984 |
| | 600,805 |
| |
| Retained earnings | | 165,303 |
| | 10,538 |
|
| Treasury stock, at cost, 38,938 shares and 38,766 shares as of December 31, 2016 and December 26, 2015, respectively | | (1,553,005 | ) | | (1,540,738 | ) |
| Accumulated other comprehensive loss | | (253,764 | ) | | (135,548 | ) |
| Total equity attributable to common shareholders | | 836,768 |
| | 733,067 |
|
| Noncontrolling interests | 3,093 |
| | 2,395 |
| 2,357 |
| | 4,489 |
|
| Total equity | 664,658 |
| | 603,200 |
| 839,125 |
| | 737,556 |
|
| Total liabilities and equity | $ | 1,644,621 |
| | $ | 1,586,344 |
| |
| Total liabilities, redeemable noncontrolling interest and equity | | $ | 2,711,800 |
| | $ | 2,068,497 |
|
| See Notes to Consolidated Financial Statements. | | See Notes to Consolidated Financial Statements. |
See Notes to Consolidated Financial Statements.
CHARLES RIVER LABORATORIES INTERNATIONAL, INC.
CONSOLIDATED STATEMENTS OF CASH FLOWS
(dollars in thousands)
| | | | Fiscal Year Ended | Fiscal Year |
| | December 28,
2013 | | December 29,
2012 | | December 31,
2011 | 2016 | | 2015 | | 2014 |
| Cash flows relating to operating activities | | | | | | | | | | |
| Net income | $ | 104,151 |
| | $ | 97,866 |
| | $ | 109,977 |
| $ | 156,366 |
| | $ | 151,087 |
| | $ | 128,198 |
|
| Less: Loss from discontinued operations | (1,265 | ) | | (4,252 | ) | | (5,545 | ) | |
| Income from continuing operations | 105,416 |
| | 102,118 |
| | 115,522 |
| |
| Less: Income (loss) from discontinued operations, net of income taxes | | 280 |
| | (950 | ) | | (1,726 | ) |
| Income from continuing operations, net of income taxes | | 156,086 |
| | 152,037 |
| | 129,924 |
|
| Adjustments to reconcile net income from continuing operations to net cash provided by operating activities: | | | | | | Adjustments to reconcile net income from continuing operations to net cash provided by operating activities: |
| Depreciation and amortization | 96,636 |
| | 81,275 |
| | 85,230 |
| 126,658 |
| | 94,881 |
| | 96,445 |
|
| Amortization of debt issuance costs and discounts | 9,561 |
| | 17,622 |
| | 20,010 |
| 2,831 |
| | 2,380 |
| | 1,725 |
|
| Impairment charges | 4,202 |
| | 3,548 |
| | 7,492 |
| |
| Non-cash compensation | 24,542 |
| | 21,855 |
| | 21,706 |
| |
| Stock-based compensation | | 43,642 |
| | 40,122 |
| | 31,035 |
|
| Deferred income taxes | (846 | ) | | 1,311 |
| | (8,668 | ) | 1,945 |
| | 2,689 |
| | 7,060 |
|
| (Gain) loss on investments in limited partnerships | (5,864 | ) | | 618 |
| | (869 | ) | |
| Gain on venture capital investments | | (10,284 | ) | | (3,823 | ) | | (9,301 | ) |
| Gain on bargain purchase | | 16 |
| | (9,837 | ) | | — |
|
| Other, net | 755 |
| | 5,519 |
| | (5,797 | ) | 9,499 |
| | 168 |
| | (982 | ) |
| Changes in assets and liabilities: | | | | | | | | | | |
| Trade receivables | (19,492 | ) | | (16,266 | ) | | 7,669 |
| |
| Trade receivables, net | | (52,780 | ) | | (16,963 | ) | | (28,088 | ) |
| Inventories | (1,571 | ) | | 785 |
| | 3,766 |
| (4,021 | ) | | 3,364 |
| | (2,956 | ) |
| Other assets | 2,421 |
| | (117 | ) | | (265 | ) | (6,215 | ) | | 850 |
| | (5,145 | ) |
| Accounts payable | (7,080 | ) | | (3,257 | ) | | 2,208 |
| 22,076 |
| | 1,174 |
| | 4,599 |
|
| Accrued compensation | 11,926 |
| | 4,612 |
| | (7,412 | ) | 9,298 |
| | 8,414 |
| | 13,631 |
|
| Deferred revenue | (3,297 | ) | | (915 | ) | | (9,515 | ) | 14,580 |
| | 6,274 |
| | 22,244 |
|
| Accrued liabilities | 759 |
| | (7,050 | ) | | (1,355 | ) | (11,487 | ) | | 14,069 |
| | 8,284 |
|
| Taxes payable and prepaid taxes | (3,054 | ) | | 2,331 |
| | (13,782 | ) | (1,800 | ) | | (3,906 | ) | | (7,090 | ) |
| Other liabilities | (5,969 | ) | | (5,983 | ) | | (9,098 | ) | 331 |
| | (3,659 | ) | | (9,253 | ) |
| Net cash provided by operating activities | 209,045 |
| | 208,006 |
| | 206,842 |
| 300,375 |
| | 288,234 |
| | 252,132 |
|
| Cash flows relating to investing activities | | | | | | | | | | |
| Acquisition of businesses and assets, net of cash acquired | (29,218 | ) | | (16,861 | ) | | — |
| (648,482 | ) | | (247,651 | ) | | (234,267 | ) |
| Capital expenditures | (39,154 | ) | | (47,534 | ) | | (49,143 | ) | (55,288 | ) | | (63,252 | ) | | (56,925 | ) |
| Purchases of investments | (17,566 | ) | | (18,537 | ) | | (24,556 | ) | (40,248 | ) | | (34,235 | ) | | (26,648 | ) |
| Proceeds from sale of investments | 11,584 |
| | 25,156 |
| | 31,607 |
| |
| Proceeds from sale of investments and distributions from venture capital investments | | 53,954 |
| | 27,072 |
| | 21,000 |
|
| Other, net | 307 |
| | 2,786 |
| | 5,447 |
| 3,694 |
| | (2,221 | ) | | (1,150 | ) |
| Net cash used in investing activities | (74,047 | ) | | (54,990 | ) | | (36,645 | ) | (686,370 | ) | | (320,287 | ) | | (297,990 | ) |
| Cash flows relating to financing activities | | | | | | | | | | |
| Proceeds from long-term debt and revolving credit agreement | 511,804 |
| | 74,116 |
| | 250,708 |
| |
| Proceeds from exercises of stock options and warrants | 93,789 |
| | 18,359 |
| | 20,625 |
| |
| Payments on long-term debt, capital lease obligation and revolving credit agreement | (523,304 | ) | | (140,347 | ) | | (252,965 | ) | |
| Purchase of treasury stock and Accelerated Stock Repurchase Program | (165,932 | ) | | (64,189 | ) | | (283,795 | ) | |
| Proceeds from long-term debt and revolving credit facility | | 1,044,666 |
| | 492,514 |
| | 298,920 |
|
| Proceeds from exercises of stock options | | 23,197 |
| | 39,367 |
| | 73,688 |
|
| Payments on long-term debt, revolving credit facility, and capital lease obligations | | (656,636 | ) | | (417,331 | ) | | (194,536 | ) |
| Purchase of treasury stock | | (12,267 | ) | | (117,478 | ) | | (122,018 | ) |
| Other, net | (594 | ) | | 940 |
| | (6,359 | ) | (8,234 | ) | | 7,476 |
| | 5,360 |
|
| Net cash used in financing activities | (84,237 | ) | | (111,121 | ) | | (271,786 | ) | |
| Net cash provided by financing activities | | 390,726 |
| | 4,548 |
| | 61,414 |
|
| Discontinued operations | | | | | | | | | | |
| Net cash used in operating activities | (1,906 | ) | | (106 | ) | | (1,559 | ) | |
| Net cash used in discontinued operations | (1,906 | ) | | (106 | ) | | (1,559 | ) | |
| Net cash used in operating activities from discontinued operations | | (2,056 | ) | | (1,876 | ) | | (1,081 | ) |
| Effect of exchange rate changes on cash and cash equivalents | (2,613 | ) | | (1,009 | ) | | (7,107 | ) | (2,996 | ) | | (12,695 | ) | | (10,379 | ) |
| Net change in cash and cash equivalents | 46,242 |
| | 40,780 |
| | (110,255 | ) | (321 | ) | | (42,076 | ) | | 4,096 |
|
| Cash and cash equivalents, beginning of period | 109,685 |
| | 68,905 |
| | 179,160 |
| 117,947 |
| | 160,023 |
| | 155,927 |
|
| Cash and cash equivalents, end of period | $ | 155,927 |
| | $ | 109,685 |
| | $ | 68,905 |
| $ | 117,626 |
| | $ | 117,947 |
| | $ | 160,023 |
|
| Supplemental cash flow information | | | | | | |
| Cash paid for interest | $ | 12,029 |
| | $ | 15,145 |
| | $ | 22,321 |
| |
| Cash paid for taxes | $ | 19,139 |
| | $ | 17,032 |
| | $ | 29,124 |
| |
| Capitalized interest | $ | 243 |
| | $ | 467 |
| | $ | 298 |
| |
| Non-cash additions to property, plant and equipment | $ | 6,960 |
| | $ | 2,778 |
| | $ | 5,302 |
| |
| Assets acquired under capital lease | $ | — |
|
| $ | 69 |
|
| $ | — |
| |
| | | | | | | | | | | |
| | | | | | | |
| | | | | | | |
| | | | | | | |
| See Notes to Consolidated Financial Statements. | | See Notes to Consolidated Financial Statements. |
See Notes to Consolidated Financial Statements.CHARLES RIVER LABORATORIES INTERNATIONAL, INC.
CONSOLIDATED STATEMENTS OF CASH FLOWS (continued)
50(in thousands)
|
| | | | | | | | | | | |
| | Fiscal Year |
| | 2016 | | 2015 | | 2014 |
| Supplemental cash flow information: | | | | | |
| Cash paid for income taxes | $ | 42,868 |
| | $ | 24,436 |
| | $ | 29,704 |
|
| Cash paid for interest | $ | 22,756 |
| | $ | 11,101 |
| | $ | 10,199 |
|
| Non-cash investing and financing activities: | | | | | |
| Capitalized interest | $ | 4 |
| | $ | 424 |
| | $ | 1,032 |
|
| Additions to property, plant and equipment, net | $ | 5,333 |
| | $ | 6,720 |
| | $ | 4,355 |
|
| Assets acquired under capital lease | $ | 1,335 |
| | $ | 10,281 |
|
| $ | 18,690 |
|
| | | | | | |
| | | | | | |
| | | | | | |
| | | | | | |
| | | | | | |
| | | | | | |
| | | | | | |
| | | | | | |
| | | | | | |
| | | | | | |
| | | | | | |
| | | | | | |
| | | | | | |
| | | | | | |
| | | | | | |
| | | | | | |
| | | | | | |
| | | | | | |
| | | | | | |
| | | | | | |
| | | | | | |
| | | | | | |
| | | | | | |
| | | | | | |
| | | | | | |
| | | | | | |
| | | | | | |
| | | | | | |
| | | | | | |
| | | | | | |
| | | | | | |
| | | | | | |
| | | | | | |
| | | | | | |
| | | | | | |
| | | | | | |
| | | | | | |
| See Notes to Consolidated Financial Statements. |
CHARLES RIVER LABORATORIES INTERNATIONAL, INC.
CONSOLIDATED STATEMENTS OF CHANGES IN EQUITY
(dollars in thousands)
|
| | | | | | | | | | | | | | | | | | | | | |
| | Total | Accumulated (Deficit) Earnings | Accumulated Other Comprehensive Income | Common Stock | Additional Paid In Capital | Treasury Stock | Non-controlling Interest |
| Balance at December 25, 2010 | $ | 688,727 |
| $ | (575,162 | ) | $ | 33,635 |
| $ | 775 |
| $ | 1,996,874 |
| $ | (768,699 | ) | $ | 1,304 |
|
| Components of comprehensive income, net of tax: | | | | | | | |
| Net income | 109,977 |
| 109,566 |
| | | | | 411 |
|
| Other comprehensive income (loss) | (28,977 | ) | | (29,042 | ) | | | | 65 |
|
| Total comprehensive income | 81,000 |
| | | | | | 476 |
|
| Tax detriment associated with stock issued under employee compensation plans | (802 | ) | | | | (802 | ) | | |
| Issuance of stock under employee compensation plans | 20,527 |
| | | 10 |
| 20,517 |
| | |
| Acquisition of treasury shares | (269,655 | ) | | | | 32,766 |
| (302,421 | ) | |
| Accelerated Stock Repurchase equity instrument | (14,140 | ) | | | | (14,140 | ) | | |
| Stock-based compensation | 21,706 |
| | | | 21,706 |
| | |
| Balance at December 31, 2011 | 527,363 |
| (465,596 | ) | 4,593 |
| 785 |
| 2,056,921 |
| (1,071,120 | ) | 1,780 |
|
| Components of comprehensive income, net of tax: | | | | | | | |
| Net income | 97,866 |
| 97,295 |
| | | | | 571 |
|
| Other comprehensive income | 2,054 |
| | 2,010 |
| | | | 44 |
|
| Total comprehensive income | 99,920 |
| | | | | | 615 |
|
| Tax benefit associated with stock issued under employee compensation plans | 125 |
| | | | 125 |
| | |
| Issuance of stock under employee compensation plans | 18,426 |
| | | 11 |
| 18,415 |
| | |
| Acquisition of treasury shares | (64,489 | ) | | | | | (64,489 | ) | |
| Stock-based compensation | 21,855 |
| | | | 21,855 |
| | |
| Balance at December 29, 2012 | 603,200 |
| (368,301 | ) | 6,603 |
| 796 |
| 2,097,316 |
| (1,135,609 | ) | 2,395 |
|
| Components of comprehensive income, net of tax: | | | | | | | |
| Net income | 104,151 |
| 102,828 |
| | | | | 1,323 |
|
| Other comprehensive income | (817 | ) | | (1,246 | ) | | | | 429 |
|
| Total comprehensive income | 103,334 |
| | | | | | 1,752 |
|
| Tax benefit associated with stock issued under employee compensation plans | 1,069 |
| | | | 1,069 |
| | |
| Issuance of stock under employee compensation plans | 93,821 |
| | | 29 |
| 93,792 |
| | |
| Acquisition of treasury shares | (170,271 | ) | | | | — |
| (170,271 | ) | |
| Redeemable noncontrolling interest acquired in business combination | 8,963 |
| | | | | | 8,963 |
|
| Adjustment of redeemable noncontrolling interest to fair value. | — |
| | | | (10,564 | ) | | 10,564 |
|
| Stock-based compensation | 24,542 |
| | | | 24,542 |
| | |
| Balance at December 28, 2013 | $ | 664,658 |
| $ | (265,473 | ) | $ | 5,357 |
| $ | 825 |
| $ | 2,206,155 |
| $ | (1,305,880 | ) | $ | 23,674 |
|
|
| | | | | | | | | | | | | | | | | | | | | | | | | | | | | | | | | | | | | |
| | Common stock | | Additional Paid-In Capital | | Retained Earnings (Accumulated Deficit) | | Accumulated Other Comprehensive Income (Loss) | | Treasury Stock | | Total Equity Attributable to Common Shareholders | | Noncontrolling Interests | | Total Equity |
| Shares | | Amount | | | | | Shares | | Amount | | | |
| December 28, 2013 | 82,523 |
| | $ | 825 |
| | $ | 2,206,155 |
| | $ | (265,473 | ) | | $ | 5,357 |
| | 34,969 |
| | $ | (1,305,880 | ) | | $ | 640,984 |
| | $ | 3,093 |
| | $ | 644,077 |
|
| Net income | — |
| | — |
| | — |
| | 126,698 |
| | — |
| | — |
| | — |
| | 126,698 |
| | 645 |
| | 127,343 |
|
| Other comprehensive loss | — |
| | — |
| | — |
| | — |
| | (79,604 | ) | | — |
| | — |
| | (79,604 | ) | | (14 | ) | | (79,618 | ) |
| Adjustment of redeemable noncontrolling interest to fair value | — |
| | — |
| | (7,425 | ) | | — |
| | — |
| | — |
| | — |
| | (7,425 | ) | | — |
| | (7,425 | ) |
| Tax benefit associated with stock issued under employee compensation plans | — |
| | — |
| | 4,301 |
| | — |
| | — |
| | — |
| | — |
| | 4,301 |
| | — |
| | 4,301 |
|
| Issuance of stock under employee compensation plans | 1,980 |
| | 20 |
| | 73,574 |
| | — |
| | — |
| | — |
| | — |
| | 73,594 |
| | — |
| | 73,594 |
|
| Acquisition of treasury shares | — |
| | — |
| | — |
| | — |
| | — |
| | 2,207 |
| | (117,380 | ) | | (117,380 | ) | | — |
| | (117,380 | ) |
| Stock-based compensation | — |
| | — |
| | 31,035 |
| | — |
| | — |
| | — |
| | — |
| | 31,035 |
| | — |
| | 31,035 |
|
| December 27, 2014 | 84,503 |
| | 845 |
| | 2,307,640 |
| | (138,775 | ) | | (74,247 | ) | | 37,176 |
| | (1,423,260 | ) | | 672,203 |
| | 3,724 |
| | 675,927 |
|
| Net income | — |
| | — |
| | — |
| | 149,313 |
| | — |
| | — |
| | — |
| | 149,313 |
| | 936 |
| | 150,249 |
|
| Other comprehensive loss | — |
| | — |
| | — |
| | — |
| | (61,301 | ) | | — |
| | — |
| | (61,301 | ) | | (171 | ) | | (61,472 | ) |
| Adjustment of redeemable noncontrolling interest to fair value | — |
| | — |
| | 183 |
| | — |
| | — |
| | — |
| | — |
| | 183 |
| | — |
| | 183 |
|
| Tax benefit associated with stock issued under employee compensation plans | — |
| | — |
| | 10,608 |
| | — |
| | — |
| | — |
| | — |
| | 10,608 |
| | — |
| | 10,608 |
|
| Issuance of stock under employee compensation plans | 961 |
| | 10 |
| | 39,407 |
| | — |
| | — |
| | — |
| | — |
| | 39,417 |
| | — |
| | 39,417 |
|
| Acquisition of treasury shares | — |
| | — |
| | — |
| | — |
| | — |
| | 1,590 |
| | (117,478 | ) | | (117,478 | ) | | — |
| | (117,478 | ) |
| Stock-based compensation | — |
| | — |
| | 40,122 |
| | — |
| | — |
| | — |
| | — |
| | 40,122 |
| | — |
| | 40,122 |
|
| December 26, 2015 | 85,464 |
| | 855 |
| | 2,397,960 |
| | 10,538 |
| | (135,548 | ) | | 38,766 |
| | (1,540,738 | ) | | 733,067 |
| | 4,489 |
| | 737,556 |
|
| Net income | — |
| | — |
| | — |
| | 154,765 |
| | — |
| | — |
| | — |
| | 154,765 |
| | 924 |
| | 155,689 |
|
| Other comprehensive loss | — |
| | — |
| | — |
| | — |
| | (118,216 | ) | | — |
| | — |
| | (118,216 | ) | | (154 | ) | | (118,370 | ) |
| Dividends declared to noncontrolling interests | — |
| | — |
| | — |
| | — |
| | — |
| | — |
| | — |
| | — |
| | (2,902 | ) | | (2,902 | ) |
| Adjustment of redeemable noncontrolling interest to fair value | — |
| | — |
| | 1,690 |
| | — |
| | — |
| | — |
| | — |
| | 1,690 |
| | — |
| | 1,690 |
|
Purchase of additional equity in redeemable noncontrolling interest
| — |
| | — |
| | 1,593 |
| | — |
| | — |
| | — |
| | — |
| | 1,593 |
| | — |
| | 1,593 |
|
| Tax benefit associated with stock issued under employee compensation plans | — |
| | — |
| | 9,274 |
| | — |
| | — |
| | — |
| | — |
| | 9,274 |
| | — |
| | 9,274 |
|
| Issuance of stock under employee compensation plans | 837 |
| | 8 |
| | 23,212 |
| | — |
| | — |
| | — |
| | — |
| | 23,220 |
| | — |
| | 23,220 |
|
| Acquisition of treasury shares | — |
| | — |
| | — |
| | — |
| | — |
| | 172 |
| | (12,267 | ) | | (12,267 | ) | | — |
| | (12,267 | ) |
| Stock-based compensation | — |
| | — |
| | 43,642 |
| | — |
| | — |
| | — |
| | — |
| | 43,642 |
| | — |
| | 43,642 |
|
| December 31, 2016 | 86,301 |
| | $ | 863 |
| | $ | 2,477,371 |
| | $ | 165,303 |
| | $ | (253,764 | ) | | 38,938 |
| | $ | (1,553,005 | ) | | $ | 836,768 |
| | $ | 2,357 |
| | $ | 839,125 |
|
| | | | | | | | | | | | | | | | | | | | |
| | | | | | | | | | | | | | | | | | | | |
| | | | | | | | | | | | | | | | | | | | |
| | | | | | | | | | | | | | | | | | | | |
| | | | | | | | | | | | | | | | | | | | |
| | | | | | | | | | | | | | | | | | | | |
| See Notes to Consolidated Financial Statements. |
See Notes to Consolidated Financial Statements.
CHARLES RIVER LABORATORIES INTERNATIONAL, INC.
NOTES TO CONSOLIDATED FINANCIAL STATEMENTS
(dollars in thousands, except per share amounts)
1. DESCRIPTION OF BUSINESS AND SUMMARY OF SIGNIFICANT ACCOUNTING POLICIES
Description of Business
Charles River Laboratories International, Inc. (the "Company")Company), together with its subsidiaries, is a leading global providerfull service, early-stage contract research organization (CRO). The Company has built upon its core competency of solutions that accelerate the druglaboratory animal medicine and science (research model technologies) to develop a diverse portfolio of discovery and development process including research modelssafety assessment services, both Good Laboratory Practice (GLP) and associatednon-GLP, which are able to support its clients from target identification through non-clinical development. The Company also provides a suite of products and services and outsourced preclinical services. Our fiscal year is the twelve-month period ending the last Saturday in December.
to support its clients’ manufacturing activities.
Principles of Consolidation
The Company’s consolidated financial statements include all majority-owned subsidiaries.reflect its financial statements and those of its subsidiaries in which the Company holds a controlling financial interest. For consolidated entities in which the Company owns or is exposed to less than 100% of the economics, the Company records net income (loss) attributable to noncontrolling interests in its consolidated statements of income equal to the percentage of the economic or ownership interest retained in such entities by the respective noncontrolling parties. Intercompany accounts,balances and transactions are eliminated in consolidation.
The Company’s fiscal year is typically based on 52-weeks, with each quarter composed of 13 weeks ending on the last Saturday on, or closest to, March 31, June 30, September 30, and profits are eliminated.
December 31. A 53rd week was included in fiscal year 2016, which is occasionally necessary to align with a December 31 calendar year-end. The additional week was included in the fourth quarter.
Reclassifications
Certain reclassifications have been made to prior year statements to conform to the current year presentation. These reclassifications have no impact on period reported net income or cash flow.
Segment Reporting
The Company reports its results in three reportable segments: Research Models and Services (RMS), Discovery and Safety Assessment (DSA), and Manufacturing Support (Manufacturing). The Company aggregates its operating segments into a reportable segment if (a) they have similar economic characteristics; (b) they are similar in the in the nature of the products or services, nature of the production process, type or class of customer for their products and services, methods used to distribute their products and services and nature of the regulatory environment; and (c) the aggregation helps users better understand the Company’s performance.
During the second quarter of 2016, the Company acquired WRH, Inc. (WIL Research), a provider of safety assessment and contract development and manufacturing (CDMO) services. WIL Research’s safety assessment business is reported in the Company’s DSA reportable segment and its CDMO business created a new operating segment, Contract Manufacturing, that is reported as part of the Company’s Manufacturing reportable segment. On February 10, 2017, the Company divested the CDMO business. In addition, amounts due to changes in the Company’s market strategy for certain services and resulting information provided to the Chief Operating Decision Maker were reclassified from the Company’s RMS reportable segment to its Manufacturing reportable segment, including revenue of $2.8 million and $3.7 million for fiscal years 2015 and 2014, respectively, and operating income of $0.5 million and $0.6 million for fiscal years 2015 and 2014, respectively. The Company reported segment results on this basis for all periods presented.
The revised reportable segments are as follows: |
| | |
| Research Models and Services | Discovery and Safety Assessment | Manufacturing Support |
| Research Models | Discovery Services | Microbial Solutions |
| Research Model Services | Safety Assessment | Avian |
| | Biologics |
| | Contract Manufacturing |
CHARLES RIVER LABORATORIES INTERNATIONAL, INC.
NOTES TO CONSOLIDATED FINANCIAL STATEMENTS (Continued)
Use of Estimates
The preparation of consolidated financial statements have been prepared in conformityaccordance with generally accepted accounting principles and, as such, include amounts based on informedin the United States (U.S. GAAP) requires that the Company makes estimates and judgments that may affect the reported amounts of management with consideration givenassets, liabilities, revenues, expenses, and related disclosure of contingent assets and liabilities. On an on-going basis, the Company evaluates its estimates, judgments and methodologies. The Company bases its estimates on historical experience and on various other assumptions that are believed to materiality. Estimatesbe reasonable, the results of which form the basis for making judgments about the carrying values of assets and liabilities. Actual results may differ from these estimates under different assumptions are reviewed on an ongoing basis and the effect of revisions to theor conditions. Changes in estimates and assumptions isare reflected in the consolidated statements prospectivelyreported results in the period in which they are revised.
become known.
Cash and Cash Equivalents
Cash equivalents include money market funds, time deposits and highly liquidother investments with originalremaining maturities at the purchase date of three months or less.
Investments
Marketable securities are reported at fair value. Realized gains and losses on marketable securities are included in other income (expense), net and are determined using the specific identification method. Unrealized gains and losses on available-for-sale marketable securities are included in accumulated other comprehensive income (loss). Time deposits with original maturities of greater than three months are reported as investments.
Trade Receivables, Net
We recordThe Company records trade receivables net of an allowance for doubtful accounts. We establish anAn allowance for doubtful accounts is established based on historical collection information, a review of major client accounts receivable balances and current economic conditions in the geographies in which we operate. Provisionsit operates. Amounts determined to the allowance for doubtful accounts were $1,332 in 2013, $947 in 2012 and $426 in 2011. Write offsbe uncollectible are charged or written off against the allowance for doubtful accounts were $373 in 2013, $697 in 2012 and $1,228 in 2011.
The composition of net trade receivables is as follows:
|
| | | | | | | |
| | December 28, 2013 | | December 29, 2012 |
| Client receivables | $ | 190,423 |
| | $ | 174,774 |
|
| Unbilled revenue | 35,184 |
| | 32,494 |
|
| Total | 225,607 |
| | 207,268 |
|
| Less allowance for doubtful accounts | (4,977 | ) | | (4,267 | ) |
| Net trade receivables | $ | 220,630 |
| | $ | 203,001 |
|
allowance.
Concentrations of Credit Risk
Financial instruments that potentially subject usthe Company to concentrations of credit risk consist primarily of cash and cash equivalents, investments and trade receivables. We place ourThe Company places cash and cash equivalents and investments in various financial institutions with high credit rating and limitlimits the amount of credit exposure to any one financial institution. Our tradeTrade receivables are primarily from clients in the pharmaceutical and biotechnology industries. industries, as well as academic and government institutions. Concentrations of credit risk with respect to trade receivables, which are typically unsecured, are limited due to the wide variety of customers using the Company’s products and services as well as their dispersion across many geographic areas. No single client accounted for more than 5% of our net salesrevenue or trade receivables for any period presented.the periods ended December 31, 2016 and December 26, 2015.
Fair Value Measurements
Marketable Securities
InvestmentsThe accounting standard for fair value measurements defines fair value, establishes a framework for measuring fair value in marketable securities are reportedaccordance with U.S. GAAP, and requires certain disclosures about fair value measurements. Under this standard, fair value is the price that would be received to sell an asset or paid to transfer a liability in an orderly transaction between market participants at the measurement date. The Company has certain financial assets and liabilities recorded at fair value and consist of time deposits with original maturities of greater than three months. Realized gains and losses on these securities are included in other income (expense) andwhich have been classified as Level 1, 2 or 3 within the fair value hierarchy:
Level 1 - Fair values are determined usingutilizing prices (unadjusted) in active markets for identical assets or liabilities that the specific identification method. We currently hold no tradingCompany has the ability to access;
Level 2 - Fair values are determined by utilizing quoted prices for identical or held-to-maturity securities.similar assets and liabilities in active markets or other market observable inputs such as interest rates, yield curves and foreign currency spot rates;
Level 3 - Prices or valuations that require inputs that are both significant to the fair value measurement and unobservable.
52The fair value hierarchy level is determined by asset, liability and redeemable noncontrolling interest class based on the lowest level of significant input. The observability of inputs may change for certain assets or liabilities. This condition could cause an asset or liability to be reclassified between levels. The Company recognizes transfers between levels within the fair value hierarchy, if any, at the end of each quarter.
Valuation methodologies used for assets and liabilities measured or disclosed at fair value are as follows:
CHARLES RIVER LABORATORIES INTERNATIONAL, INC.
NOTES TO CONSOLIDATED FINANCIAL STATEMENTS (Continued)
(dollars in thousands, except per share amounts)
Cash equivalents - Valued at market prices determined through third-party pricing services;
The amortized cost, gross unrealized gains, gross unrealized lossesMutual funds - Valued at the unadjusted quoted net asset value of shares held by the Company;
Foreign currency forward contracts - Valued using readily observable market inputs, such as forward foreign exchange points and foreign exchanges rates;
Life insurance policies - Valued at cash surrender value based on the fair value for marketable securitiesof underlying investments;
Contingent consideration - Valued based on a probability weighting of the future cash flows associated with the potential outcomes;
Redeemable noncontrolling interest - Valued using the income approach based on estimated future cash flows of the underlying business discounted by major security type were as follows:
|
| | | | | | | | | | | | | | | |
| | December 28, 2013 |
| | Amortized Cost | | Gross Unrealized Gains | | Gross Unrealized Losses | | Fair Value |
| Time deposits | $ | 11,158 |
| | $ | — |
| | $ | — |
| | $ | 11,158 |
|
| | $ | 11,158 |
| | $ | — |
| | $ | — |
| | $ | 11,158 |
|
|
| | | | | | | | | | | | | | | |
| | December 29, 2012 |
| | Amortized Cost | | Gross Unrealized Gains | | Gross Unrealized Losses | | Fair Value |
| Time deposits | $ | 6,781 |
| | $ | — |
| | $ | — |
| | $ | 6,781 |
|
| | $ | 6,781 |
| | $ | — |
| | $ | — |
| | $ | 6,781 |
|
Maturitiesa weighted average cost of debt securities were as follows:
|
| | | | | | | | | | | | | | | |
| | December 28, 2013 | | December 29, 2012 |
| | Amortized Cost | | Fair Value | | Amortized Cost | | Fair Value |
| Due less than one year | $ | 11,158 |
|
| $ | 11,158 |
| | $ | 6,781 |
| | $ | 6,781 |
|
| Due after one year through five years | — |
| | — |
| | — |
| | — |
|
| Due after ten years | — |
| | — |
| | — |
| | — |
|
| | $ | 11,158 |
|
| $ | 11,158 |
| | $ | 6,781 |
| | $ | 6,781 |
|
capital.
Inventories
Inventories are stated at the lower of cost or market.net realizable value. Cost is determined on the average cost method for ourthe small model business and first-in-first-out (FIFO) for ourthe Company’s large model and EMDMicrobial Solutions businesses. For ourthe small model business, cost includes direct materials such as feed and bedding, costs of personnel directly involved in the care of the models, and an allocation of facility overhead. For ourthe large model business, cost is primarily the external cost we paypaid to acquire the model. Certain of our businesses value inventory based on standard costs, which are periodically compared to and adjusted to actual costs. We determine market value based on either replacement cost or estimated selling price less cost to sell and a normal profit margin. Inventory costs are charged to cost of salesrevenue in the period the products are sold to an external party. Inventory reserves are recorded to reduce the carrying value forThe Company analyzes its inventory levels on a quarterly basis and writes down inventory that is determined to be damaged, obsolete or otherwise unableunmarketable, with a corresponding charge to becost of products sold.
The composition of inventories is as follows:
|
| | | | | | | |
| | December 28, 2013 | | December 29, 2012 |
| Raw materials and supplies | $ | 15,028 |
| | $ | 14,525 |
|
| Work in process | 11,715 |
| | 11,082 |
|
| Finished products | 62,653 |
| | 62,863 |
|
| Inventories | $ | 89,396 |
| | $ | 88,470 |
|
CHARLES RIVER LABORATORIES INTERNATIONAL, INC.
NOTES TO CONSOLIDATED FINANCIAL STATEMENTS (Continued)
(dollars in thousands, except per share amounts)
Other Current Assets
Other current assets consist of assets we expect to settle within the next twelve months.
|
| | | | | | | |
| | December 28, 2013 | | December 29, 2012 |
| Prepaid assets | $ | 20,058 |
| | $ | 20,404 |
|
| Deferred tax asset | 29,139 |
| | 30,018 |
|
| Marketable securities | 11,158 |
| | 6,781 |
|
| Prepaid income tax | 25,247 |
| | 26,169 |
|
| Restricted cash | 245 |
| | 229 |
|
| Other current assets | $ | 85,847 |
| | $ | 83,601 |
|
Property, Plant and Equipment, Net
Property, plant and equipment, including improvements that significantly add to productive capacity or extend useful life, are recordedcarried at cost whileand are subject to review for impairment whenever events or changes in circumstances indicate that the carrying amount of the asset may not be recoverable. The cost of normal, recurring, or periodic repairs and maintenance activities related to property, plant and repairsequipment is expensed as incurred. In addition, the Company capitalizes certain internal use computer software development costs. Costs incurred during the preliminary project stage are expensed as incurred. We capitalize interest on certain capital projects which amounted to $243 in 2013, $467 in 2012 and $298 in 2011, respectively. We also capitalize internal and externalincurred, while costs incurred during the application development stage are capitalized and amortized over the estimated useful life of the software. The Company also capitalizes costs related to specific upgrades and enhancements when it is probable the expenditures will result in additional functionality. Maintenance and training costs related to software obtained for internal use software. Depreciationare expensed as incurred.
Interest costs incurred during the construction of major capital projects are capitalized until the underlying asset is calculatedready for financial reporting purposesits intended use, at which point the interest costs are amortized as depreciation expense over the life of the underlying asset.
The Company generally depreciates the cost of its property, plant and equipment using the straight-line method based onover the estimated useful lives of the respective assets as follows: buildings, 20 to 40 years; machinery and equipment, 3 to 20 years; furniture and fixtures, 5 to 10 years; vehicles, 3 to 5 years; computer hardware and software, 3 to 8 years and leaseholdfollow:
|
| |
| Estimated
Useful Lives |
| (in years) |
| Land | Indefinite |
| Buildings | 20 - 40 |
| Machinery and equipment | 3 - 20 |
| Furniture and fixtures | 5 - 10 |
| Computer hardware and software | 3 - 8 |
| Vehicles | 3 - 5 |
Leasehold improvements are amortized over the shorter of the estimated useful life of the asset or the lease periods. We begin to depreciate capital projects interm. Capital lease assets are amortized over the first full monthlease term, however, if ownership is transferred by the asset is placed in service.
The composition of net property, plant and equipment is as follows:
|
| | | | | | | |
| | December 28, 2013 | | December 29, 2012 |
| Land | $ | 40,157 |
| | $ | 40,812 |
|
| Buildings | 694,074 |
| | 697,547 |
|
| Machinery and equipment | 367,244 |
| | 356,960 |
|
| Leasehold improvements | 37,959 |
| | 34,916 |
|
| Furniture and fixtures | 24,013 |
| | 25,681 |
|
| Vehicles | 3,859 |
| | 3,736 |
|
| Computer hardware and software | 112,328 |
| | 107,171 |
|
| Construction in progress | 42,075 |
| | 46,186 |
|
| Total | 1,321,709 |
| | 1,313,009 |
|
| Less accumulated depreciation | (645,527 | ) | | (595,989 | ) |
| Net property, plant and equipment | $ | 676,182 |
| | $ | 717,020 |
|
Depreciation expense for 2013, 2012 and 2011 was $78,830, $63,207 and $63,435, respectively.
Valuation and Impairment of Goodwill and Indefinite-Lived Intangible Assets
Goodwill and other indefinite-lived intangibles are not amortized and are reviewed for impairment at least annually. Valuation of goodwill requires significant judgment. Assumptions and estimates are used in determining the fair value of assets acquired and liabilities assumed in a business acquisition. A significant portionend of the capital lease, or there is a bargain purchase price in our acquisitions is assigned to intangibleoption, such capital lease assets and goodwill. Assigning value to intangible assets requires that we use significant judgment in determining (i)are amortized over the fair value and (ii) whether such intangibles are amortizable or non-amortizable and, if the former, the period and the method by which the intangible assets will be amortized. We utilize commonly accepted valuation techniques, such as the income approach and the cost approach, as appropriate, in establishing the fair value of intangible assets. Typically, key assumptions include: projected revenues and expenses that will be generated or expended from the use of the intangible asset, costsuseful life that would be avoided due to our ownership of the asset, client turn-over in the case of client relationships intangibleassigned if such assets and the discount rate reflecting the risk associated with achieving these key assumptions.were owned.
CHARLES RIVER LABORATORIES INTERNATIONAL, INC.
NOTES TO CONSOLIDATED FINANCIAL STATEMENTS (Continued)
(dollars
When the Company disposes of property, plant and equipment, it removes the associated cost and accumulated depreciation from the related accounts on its consolidated balance sheet and includes any resulting gain or loss in thousands, except per share amounts)its consolidated statement of income.
Business Acquisitions
We test goodwillThe Company accounts for acquisitions as business combinations under the acquisition method of accounting. The Company allocates the amounts that it pays for each acquisition to the assets it acquires and liabilities it assumes based on their fair values at the dates of acquisition, including identifiable intangible assets. The Company bases the fair value of identifiable intangible assets acquired in a business combination on valuations that use information and assumptions determined by management and which consider management’s best estimates of inputs and assumptions that a market participant would use.
Contingent Consideration
The consideration for the Company’s acquisitions often includes future payments that are contingent upon the occurrence of a particular event. The Company records an obligation for such contingent payments at fair value on the acquisition date. The Company estimates the fair value of contingent consideration obligations through valuation models that incorporate probability adjusted assumptions related to the achievement of the milestones and thus likelihood of making related payments. The Company revalues these contingent consideration obligations each reporting period. Changes in the fair value of the contingent consideration obligations are recognized in the Company’s consolidated statements of income as a component of selling, general and administrative expenses. Changes in the fair value of the contingent consideration obligations can result from changes to one or multiple inputs, including adjustments to the discount rates and changes in the assumed probabilities of successful achievement of certain financial targets.
Discount rates in the Company’s valuation models represent a measure of the credit risk associated with settling the liability. The period over which the Company discounts its contingent obligations is typically based on when the contingent payments would be triggered. These fair value measurements are based on significant inputs not observable in the market. See Note 5, “Fair Value.”
Goodwill and Intangible Assets
Goodwill represents the difference between the purchase price and the fair value of the identifiable tangible and intangible net assets when accounted for using the purchase method of accounting. Goodwill is not amortized, but reviewed for impairment annuallyon an annual basis, during the fourth quarter, or more frequently if eventsan event occurs or changes in circumstances indicatechange that would more-likely-than-not reduce the carryingfair value of goodwill may not be recoverable. We have elected not apply the guidance available in ASU 2011-08, Testing Goodwill for Impairment,Company's reporting units below their carrying amounts.
The Company has the option to first assess purely qualitative factors as a basis for determiningto determine whether it is necessary to perform the two-step goodwill impairment test. WeIf the Company elects this option and believes, as a result of the qualitative assessment, that it is more-likely-than-not that the carrying value of goodwill is not recoverable, the quantitative two-step impairment test is required; otherwise, no further testing is required. Alternatively, the Company may elect to not first assess qualitative factors and immediately perform the quantitative two-step impairment test. In the first step, of the two-step goodwill impairment test for each of our reporting units as of the first day of fiscal November. The first step, identifying a potential impairment,Company compares the fair value of theits reporting unit with itsunits to their carrying amount.values. If the carrying amount exceedsvalues of the net assets assigned to the reporting units exceed the fair value,values of the reporting units, then the second step would need to be performed; otherwise, no further step is required. The second step, measuringof the impairment loss, comparestest is performed in order to determine the implied fair value of the reporting unit's goodwill with its carrying amount. Any excess of the goodwill carrying amount over the implied fair value is recognized as an impairment loss, andCompany’s goodwill. If the carrying value of the reporting unit’s goodwill is written downexceeds its implied fair value, then the Company would record an impairment loss equal to fair value. Please refer to Note 3 for the results of our 2013 goodwill impairment test.difference.
Valuation and Impairment of Long-Lived Assets
We assess the carrying value of property, plant and equipment and definite-livedDefinite-lived intangible assets, including client relationships, are amortized over the pattern in which the economic benefits of the intangible assets are utilized and reviewed for impairment whenever events or changes in circumstances indicate that the carrying valueamount of the assets or asset group may not be recoverable. Factors we consider important that could trigger an impairment review include but are not limited to the following:
significant financial underperformance relative to expected future operating results;
significant negative industry, market or economic trends; or
significant changes in our operating strategy that negatively affect the utilizationDetermination of our long-lived assets.
We assign long-lived assets to groups based on the lowest level at which cash flows are largely independent from other cash flows. Should we determine that a trigger has been met, we determine the recoverability of the long-lived asset groupis based on an estimate of undiscounted future cash flows resulting from the use of the asset, group, including its eventual disposition. Should we determine thatwhich requires the carrying valueuse of held-for-use long-lived assets may not be recoverable, we then measure any resulting impairment based on the fair value of the long-lived asset group. In some cases, fair value is based on the income approach using projected discounted cash flows and using a discount rate commensurate with the risk inherent in our current business model. We may also estimate fair value based on market prices for similar assets, as appropriate. Significant judgments are required to estimate future cash flows, including the selection of appropriate discountcustomer attribution rates and other assumptions. Changes in these estimates and assumptions could materially affectIn the determination of fair value for these assets.
Long-lived asset groupsevent that such cash flows are classified as held-for-sale when the following conditions are met: we have committednot expected to a planbe sufficient to sell the asset group and it is unlikely that significant changes will be made to the plan; the asset group is available for immediate sale in its present condition and it is probable that the sale will be completed within one year; and an active program to locate a buyer has been initiated and the asset group is being marketed at a sale price that is reasonable in relation to its current fair value. Should we determine that the carrying value of held-for-sale long-lived assets exceeds its fair value, we will measure any impairment based on this difference. Subsequent adjustments to the carrying amount of held-for-sale assets based on changes in fair value are recorded but only to the extent ofrecover the carrying amount of the definite-lived intangible assets, the definite-lived intangible assets are written-down to their fair values.
Valuation and Impairment of Long-Lived Assets
Long-lived assets to be held and used are reviewed for impairment whenever events or changes in circumstances indicate that the carrying amount of the assets or asset group when it enteredmay not be recoverable.
Determination of recoverability is based on an estimate of undiscounted future cash flows resulting from the held-for-sale category.use of the asset and its eventual disposition. In the event that such cash flows are not expected to be sufficient to recover the carrying amount of the assets, the assets are written-down to their fair values.
Other Assets
Other assets consist of assets that we do not expect to settle within the next twelve months. The composition of other assets is as follows:
|
| | | | | | | |
| | December 28, 2013 | | December 29, 2012 |
| Deferred financing costs | $ | 7,126 |
| | $ | 6,424 |
|
| Cash surrender value of life insurance policies | 26,507 |
| | 25,240 |
|
| Investments in limited partnerships | 17,911 |
| | 8,492 |
|
| Other assets | 10,420 |
| | 8,503 |
|
| Other assets | $ | 61,964 |
| | $ | 48,659 |
|
Accounting for Investments in Limited Partnerships
We have invested in a series of limited partnerships that invest in start-up companies primarily in the life sciences industry. Our total commitment to these entities as of December 28, 2013 is $35,000, of which we have funded $12,375 to date. Our ownership interest in these limited partnerships ranges from 3.8% to 12.1%. We account for these investments under the
CHARLES RIVER LABORATORIES INTERNATIONAL, INC.
NOTES TO CONSOLIDATED FINANCIAL STATEMENTS (Continued)
(dollars
Long-lived assets to be disposed of are carried at fair value less costs to sell.
Venture Capital Investments
The Company invests in thousands, except per share amounts)several venture capital funds that invest in start-up companies primarily in the life sciences industry. The Company’s ownership interest in these funds ranges from 0.7% to 12.0%. The Company accounts for such investments in limited liability partnerships (LLP), which are variable interest entities, under the equity or cost method of accounting. The Company is not the primary beneficiary because it has no power to direct the activities that most significantly affect the LLPs’ economic performance. The Company accounts for the investments in limited liability companies, which are not variable interest entities, under the equity method of accounting.
Equity-Method, whereby we record ourUnder the equity method of accounting, the Company’s portion of the investment gains and losses, ofas reported in the limited partnershipsfund’s financial statements on a quarterly lag each reporting period. Accordingly, we recognized equity income/(loss) of $5,864period, is recorded in other income (expense), $(618) and $869 fornet. In addition, the years ended December 28, 2013, December 29, 2012 and December 31, 2011 respectively, reported in Other Income (Expense), net on our consolidated statements of income. As of December 28, 2013, these investments had aCompany adjusts the carrying value of $17,911these investments to reflect its estimate of changes to fair value since the fund’s financial statements based on information from the fund’s management team, market prices of known public holdings of the fund and other information.
Under the cost method of accounting, the Company’s investment is initially measured at cost, with distributions recognized in other income (expense), whichnet. Distributions received in excess of earnings subsequent to the date of investment are considered a return of investment and are recorded as reductions of cost of the investment. The Company reviews its cost method investments to determine whether a decline in fair value below the cost basis is reportedother-than-temporary. If the decline in Other Assets onfair value is determined to be other-than-temporary, the consolidated balance sheets.cost basis of the investment is written down to fair value.
Accounting for Investment in Life Insurance Contracts
Our investmentsInvestments in life insurance contracts are recorded at cash surrender value. Accordingly, we recognize theThe initial investment at the transaction price is recognized and remeasure the investment at cash surrender valueremeasured based on fair value of underlying investments or contractual value each reporting period. Investments in and redemptions of these life insurance contracts are reported as cash flows from investing activities in the consolidated statement of cash flows. At As of December 28, 2013, we31, 2016 and December 26, 2015, the Company held 3043 and 42 contracts, respectively, with a carrying value of $26,507 and a face value of $67,482.
Restructuring$61.4 million and Contract Termination Costs
We recognize obligations associated with restructuring activities and contract termination costs by recording a liability at fair value for the costs associated with an exit or disposal activity as well as costs to terminate a contract or an operating lease. The overall purpose of our restructuring actions is to lower operating costs and improve profitability by reducing excess capacities. Restructuring charges are typically recorded in the period in which the plan is approved by our senior management and, where material, our Board of Directors, and when the liability is incurred. A liability for costs that will continue to be incurred under a contract for its remaining term without economic benefit to us is recognized and measured at its fair value when we cease using the right conveyed by the contract.
During 2013, 2012 and 2011, we implemented staffing reductions to improve operating efficiency and profitability at various sites. As a result of these actions, for the years ended December 28, 2013, December 29, 2012 and December 31, 2011, we recorded severance and retention charges as shown below. As of December 28, 2013, $1,475 was included in accrued compensation and $1,307 in other long-term liabilities on our consolidated balance sheet. As of December 29, 2012, $1,885 was included in accrued compensation and $1,751 in other long-term liabilities on our consolidated balance sheet.
The following table rolls forward our severance and retention cost liability:
|
| | | | | | | | | | | |
| | Severance and Retention Costs |
| | 2013 | | 2012 | | 2011 |
| Balance, beginning of period | $ | 3,636 |
| | $ | 3,374 |
| | $ | 10,658 |
|
| Expense | 3,223 |
| | 2,576 |
| | 5,462 |
|
| Payments/utilization | (4,077 | ) | | (2,314 | ) | | (12,746 | ) |
| Balance, end of period | $ | 2,782 |
| | $ | 3,636 |
| | $ | 3,374 |
|
The following table presents severance and retention costs by classification on the income statement:
|
| | | | | | | | | | | |
| | Fiscal Year Ended |
| | 2013 | | 2012 | | 2011 |
| Severance charges included in cost of sales | $ | 1,477 |
| | $ | 1,203 |
| | $ | 1,012 |
|
| Severance charges included in selling, general and administrative expense | 1,746 |
| | 1,373 |
| | 4,450 |
|
| Total expense | $ | 3,223 |
| | $ | 2,576 |
| | $ | 5,462 |
|
CHARLES RIVER LABORATORIES INTERNATIONAL, INC.
NOTES TO CONSOLIDATED FINANCIAL STATEMENTS (Continued)
(dollars in thousands, except per share amounts)
The following table presents severance and retention cost by segment:
|
| | | | | | | | | | | |
| | Fiscal Year Ended |
| | 2013 | | 2012 | | 2011 |
| Research models and services | $ | 2,055 |
| | $ | 1,068 |
| | $ | 1,196 |
|
| Preclinical services | 1,164 |
| | 1,508 |
| | 4,372 |
|
| Corporate | 4 |
| | — |
| | (106 | ) |
| Total expense | $ | 3,223 |
| | $ | 2,576 |
| | $ | 5,462 |
|
Other Current Liabilities
Other current liabilities consist of liabilities we intend to settle within the next twelve months.
The composition of other current liabilities is as follows:
|
| | | | | | | |
| | December 28, 2013 | | December 29, 2012 |
| Accrued income taxes | $ | 18,773 |
| | $ | 18,216 |
|
| Current deferred tax liability | 1,960 |
| | 410 |
|
| Accrued interest and other | 1,813 |
| | 2,636 |
|
| Other current liabilities | $ | 22,546 |
| | $ | 21,262 |
|
Other Long-Term Liabilities
Other long-term liabilities consist of liabilities we do not intend to settle within the next twelve months.
The composition of other long-term liabilities is as follows:
|
| | | | | | | |
| | December 28, 2013 | | December 29, 2012 |
| Deferred tax liability | $ | 14,988 |
| | $ | 13,147 |
|
| Long-term pension liability | 16,219 |
| | 44,316 |
|
| Accrued Executive Supplemental Life Insurance Retirement Plan and Deferred Compensation Plan | 28,708 |
| | 26,663 |
|
| Other long-term liabilities | 22,582 |
| | 20,840 |
|
| Other long-term liabilities | $ | 82,497 |
| | $ | 104,966 |
|
$60.5 million, respectively.
Stock-Based Compensation Plans
We grantThe Company grants stock options, restricted stock, restricted stock units, and performance share units (PSUs) to employees and stock options, restricted stock, and restricted stock units to employees and non-employee directors under our stock-based compensation plans. Stock-based compensation cost is measured at grant date,recognized as an expense in the consolidated financial statements based on the grant date fair value, of the award and is recognized as expense on a straight-line basisadjusted for estimated forfeitures, over the requisite service period. We estimate
For stock options, restricted stock and restricted stock units that vest based on service conditions, the Company uses the straight-line method to allocate compensation expense to reporting periods. Where awards are made with non-substantive vesting periods, where a portion of the award continues to vests after the employee’s retirement, the Company recognizes expense based on the period from the grant date to the date on which the employee is retirement eligible. The Company records the expense for PSU grants subject to performance and/or market conditions using the accelerated attribution method over the remaining service period when management determines that achievement of the performance-based milestone is probable.
The fair value of stock options granted is calculated using the Black-Scholes valuation model. Key inputsoption-pricing model and assumptions used to estimate the fair value of stock options includePSUs is estimated using a lattice model with a Monte Carlo simulation, both of which require the exercise priceuse of the award, the expected option term, the risk-free interest rate over the option'ssubjective assumptions including volatility and expected term, the expected annual dividend yield and the expected stock price volatility.among others. The expected stock price volatility assumption is typically determined using the historical volatility of ourthe Company’s common stock over the expected life of the option. The risk-free interest rate is based on the market yield for the five year U.S. Treasury security.stock-based award. The expected life of optionsterm is determined using historical option exercise activity.
We record deferred tax assets for stock-based awards The fair value of restricted stock and restricted stock units is based on the amountmarket value of stock-based compensation recognized in our consolidated statementsthe Company’s common stock on the date of income at the statutory tax rate for the jurisdiction in which we will receive a tax deduction. Differences between the deferred tax assets and the actual tax deduction reported on our income tax returns are recorded in additional paid-in capital. If the tax deduction is less than the deferred tax asset, the calculated shortfall reduces our pool of excess tax benefits. If the pool of excess tax benefits is reduced to zero, then subsequent shortfalls would increase our income tax expense. Our pool of excess tax benefits is computed in accordance with the long-form method.grant.
CHARLES RIVER LABORATORIES INTERNATIONAL, INC.
NOTES TO CONSOLIDATED FINANCIAL STATEMENTS (Continued)
(dollars in thousands, except per share amounts)
Revenue Recognition
We recognizeThe Company recognizes revenue related to our products, which include research models, endotoxin and microbial detection (EMD) technology and avian vaccine support products, when all of the following conditions are satisfied: persuasive evidence of an arrangement exists, generally indelivery has occurred or services have been provided, the form of client purchase orders, title and risk of loss have transferred, which generally occurs upon delivery ofprice to the products, the sales pricecustomer is fixed or determinable, and collectabilitycollectibility is reasonably assured. For large models, in some cases clients pay in advance of delivery of the product. These advances are deferred and recognized as revenue upon delivery of the product.
Our serviceService revenue is generally evidenced by client contracts, which range in duration from a few weeks to a few years and is recognized upon the completion of the agreed upon performance criteria. These performance criteria are generally intypically take the form of either study protocolsan agreed upon rate per unit or specified activities or procedures that we are engaged to perform. These performance criteria are established by our clients andfixed fee arrangements. Such contracts typically do not contain acceptance provisions based upon the achievement of certain study or laboratory testing results. Revenue of agreed upon rate per unit contracts is recognized as services are performed, based upon rates specified in the contract. Revenue of fixed fee contracts is recognized as services are performed in relation to total estimated costs to complete procedures specified by clients in the form of study protocols. In general, such amounts become billable in accordance with predetermined payment schedules, but are recognized as revenue as services are performed. Revisions in estimated effort to complete the contract are reflected in the period in which the change became known.cases where
Deferred and unbilled revenue are recognized in our consolidated balance sheets. In some cases, a portion of the contract fee is paid at the time the services are initiated. These advances are recorded as deferred revenue and recognized as revenue as services are performed. Conversely, in some cases, revenue is recorded based on the level of service performed in advance of billing the client and recognized as unbilled receivable.
Guarantees
We include standard indemnification provisions in client contracts, which include standard provisions limiting our liability under such contracts, including our indemnification obligations, with certain exceptions. In addition, we are the guarantor of certain facility leases for businesses that have been sold to other parties. When we sell the business, we recognize the retained lease guarantee as a liability on our books at fair value and we amortize the liability ratably as our obligation decreases. In addition, we record contingent losses on the guarantee when it is probable that we will be required to make lease payments in excess of the remaining carrying amount of the guarantee liability and the additional payments are reasonably estimable. See Note 12 for discussion of guarantees related to our Phase I clinical business that we discontinued in 2011.
Derivatives and Hedging Activities
During the three years ended December 28, 2013, we entered into forward foreign currency contracts in order to hedge the foreign exchange impact of cash collections at our Canadian facility related to accounts receivable denominated in U.S. dollars and an intercompany loan between two of our subsidiaries with different functional currencies. As of December 28, 2013, there were no outstanding forward contracts. We recorded losses associated with these forward foreign currency contracts of $853 in 2013, $1,260 in 2012 and $6,287 in 2011.
Fair Value
We hold cash equivalents, investments and certain other assets and liabilities that are carried at fair value. We generally determine fair value using a market approach based on quoted prices of identical instruments when available. When market quotes of identical instruments are not readily accessible or available, we determine fair value based on quoted market prices of similar instruments. As of December 28, 2013, we do not have any significant non-recurring measurements of non-financial assets and non-financial liabilities other than the adjustment of our PCS Massachusetts facility to fair value in the fourth quarter of 2013 based on an impairment charge recorded in the period.
The valuation hierarchy for disclosure of the inputs used to measure fair value prioritizes the inputs into three broad levels as follows. Level 1 inputs are quoted prices (unadjusted) in active markets for identical assets or liabilities. Level 2 inputs are quoted prices for similar assets and liabilities in active markets, quoted prices for identical or similar assets in markets that are not active, inputs other than quoted prices that are observable for the asset or liability, including interest rates, yield curves and credit risks, or inputs that are derived principally from or corroborated by observable market data through correlation. Level 3 inputs are unobservable inputs based on our own assumptions used to measure assets and liabilities at fair value. A financial asset or liability's classification within the hierarchy is determined based on the lowest level input that is significant to the fair value measurement.
CHARLES RIVER LABORATORIES INTERNATIONAL, INC.
NOTES TO CONSOLIDATED FINANCIAL STATEMENTS (Continued)
(dollars
performance spans reporting periods, revenue of fixed fee contracts is recognized as services are performed, measured on the ratio of outputs or performance obligations completed to the total contractual outputs or performance obligations to be provided. Changes in thousands, except per share amounts)estimated effort to complete the fixed fee contract are reflected in the period in which the change becomes known. Changes in scope of work are common, especially under long-term contracts, and generally result in a change in contract value. Once the client has agreed to the changes in scope and renegotiated pricing terms, the contract value is amended and revenue is typically recognized as described above.
Billing schedules and payment terms are generally negotiated on a contract-by-contract basis. Payments received in excess of revenue recognized are recorded as deferred revenue. As the contracted services are subsequently performed and the associated revenue is recognized, the deferred revenue balance is reduced by the amount of revenue recognized during the period. In other cases, services may be provided and revenue is recognized before the client is invoiced. In these cases, revenue recognized will exceed amounts billed and the difference, representing amounts which are currently unbillable to the customer pursuant to contractual terms, is recorded as an unbilled receivable. Once the client is invoiced, the unbilled receivable is reduced for the amount billed, and a corresponding trade receivable is recorded.
Most contracts are terminable by the client, either immediately or upon notice. These contracts often require payment to the Company of expenses to wind down the project, fees earned to date or, in some cases, a termination fee. Such payments are included in revenues when earned.
The valuation methodologies usedCompany recognizes product revenue net of allowances for estimated returns, rebates and discounts when title and risk of loss pass to customers. When the Company sells equipment with specified acceptance criteria, it assesses its ability to meet the acceptance criteria in order to determine the timing of revenue recognition. The Company would defer revenue until completion of customer acceptance testing if it is not able to demonstrate the ability to meet such acceptance criteria.
A portion of the Company’s revenue is from multiple-element arrangements that include multiple products and/or services as deliverables in a single arrangement with each deliverable, or a combination of the deliverables, representing a separate unit of accounting. The Company allocates revenues to each element in a multiple-element arrangement based upon the relative selling price of each deliverable. Revenue allocated to each deliverable is then recognized when all revenue recognition criteria are met. Judgments as to the identification of deliverables, units of accounting, the allocation of consideration to the deliverable, and the appropriate timing of revenue recognition are critical with respect to these arrangements.
At the inception of each arrangement that includes milestone payments, the Company evaluates whether each milestone is substantive. This evaluation includes an assessment of whether (a) the consideration is commensurate with either (1) the Company’s performance to achieve the milestone, or (2) the enhancement of the value of the delivered item(s) as a result of a specific outcome resulting from the Company’s performance to achieve the milestone; (b) the consideration relates solely to past performance; and (c) the consideration is reasonable relative to all of the deliverables and payment terms within the arrangement. If a substantive milestone is achieved and collection of the related receivable is reasonably assured, the Company recognizes revenue related to the milestone in its entirety in the period in which the milestone is achieved. In those circumstances where a milestone is not substantive, the Company recognizes as revenue, on the date the milestone is achieved, an amount equal to the applicable percentage of the performance period that had elapsed as of the date the milestone was achieved, with the balance being deferred and recognized over the remaining period of performance. As of December 31, 2016, the Company had no significant milestones that were deemed substantive.
The Company records shipping charges billed to customers in total revenue and records shipping costs in cost of revenue (excluding amortization of intangible assets) for all periods presented.
Advertising Costs
Advertising costs are expensed as incurred. For fiscal years 2016, 2015 and 2014, advertising costs totaled $1.4 million, $1.2 million and $1.3 million, respectively.
Income Taxes
The provision for income taxes includes federal, state, local and foreign taxes. Income taxes are accounted for under the liability method. Deferred tax assets and liabilities measured at fair value are as follows:
Time deposits—Valued at their ending balances as reported byrecognized for the expected future tax consequences of temporary differences between the financial institutions that hold our securities, which approximates fair value.
Investments in life insurance policies—Valued at cash surrender value based on fair value of underlying investments.
Long-livedstatements carrying amounts and their respective tax basis. The Company measures deferred tax assets impaired during the period—Valued at fair value at the date of the impairment based upon the income or market approach.
Hedge contracts (such as forward currency contracts)—Valued at fair value by management based on our foreign exchange rates and forward points provided by banks.
Redeemable noncontrolling interest—Valued using a weighted combination of a market-based approach, utilizing information about our company as well as publicly available industry information to determine revenue and earnings multiples, and an income approach based on estimated future cash flows based on projected financial data discounted by a weighted average cost of capital. Significant assumptions include a discount rate of 18.5% and a long-term pretax operating margin of approximately 31.7%.
Assets and liabilities measured at fair value onusing the enacted tax rates in effect when the temporary differences are expected to be settled. The Company evaluates the realizability of its deferred tax assets and establishes a recurring basis are summarized below:valuation allowance when it is more likely than not that all or a portion of deferred tax assets will not be realized.
|
| | | | | | | | | | | | | | | |
| | Fair Value Measurements at December 28, 2013 |
| | Quoted Prices in Active Markets for Identical Assets Level 1 | | Significant Other Observable Inputs Level 2 | | Significant Unobservable Inputs Level 3 | | Assets and Liabilities at Fair Value |
| Time deposits | $ | — |
| | $ | 11,158 |
| | $ | — |
| | $ | 11,158 |
|
| Life insurance policies | — |
| | 19,534 |
| | — |
| | 19,534 |
|
| Total assets measured at fair value | — |
| | 30,692 |
| | — |
| | 30,692 |
|
| | | | | | | | |
| Redeemable noncontrolling interest | — |
| | — |
| | 20,581 |
| | 20,581 |
|
| Total liabilities measured at fair value | $ | — |
| | $ | — |
| | $ | 20,581 |
| | $ | 20,581 |
|
|
| | | | | | | | | | | | | | | |
| | Fair Value Measurements at December 29, 2012 |
| | Quoted Prices in Active Markets for Identical Assets Level 1 | | Significant Other Observable Inputs Level 2 | | Significant Unobservable Inputs Level 3 | | Assets and Liabilities at Fair Value |
| Time deposits | $ | — |
| | $ | 6,781 |
| | $ | — |
| | $ | 6,781 |
|
| Life insurance policies | — |
| | 19,555 |
| | — |
| | 19,555 |
|
| Hedge contract | — |
| | 16 |
| | — |
| | 16 |
|
| Total assets measured at fair value | $ | — |
|
| $ | 26,352 |
|
| $ | — |
|
| $ | 26,352 |
|
The book value of our term and revolving loans, which are variable rate loans carried at amortized cost, approximates fair value based current market pricing of similar debt. We classify the fair value of our debt as Level 2 on the valuation hierarchy.
CHARLES RIVER LABORATORIES INTERNATIONAL, INC.
NOTES TO CONSOLIDATED FINANCIAL STATEMENTS (Continued)
(dollars
The Company accounts for uncertain tax positions using a “more-likely-than-not” threshold for recognizing and resolving uncertain tax positions. The Company evaluates uncertain tax positions on a quarterly basis and considers various factors, including, but not limited to, changes in thousands, except per share amounts)
tax law, the measurement of tax positions taken or expected to be taken in tax returns, the effective settlement of matters subject to audit, information obtained during in process audit activities and changes in facts or circumstances related to a tax position. The following table presents a reconciliationCompany also accrues for all liabilities measuredpotential interest and penalties related to unrecognized tax benefits in income tax expense.
Foreign Currency Contracts
Foreign currency contracts are recorded at fair value in the Company’s consolidated balance sheet and are not designated as hedging instruments. Any gains or losses on such contracts are immediately recognized in other income (expense), net.
Translation of Foreign Currencies
For the Company’s subsidiaries that transact in a recurring basis using significant unobservable inputs (Level 3) duringfunctional currency other than the years ended December 28, 2013U.S. dollar, assets and December 29, 2012.liabilities are translated at current rates of exchange as of the balance sheet date. Income and expense items are translated at the average foreign exchange rates for the period. Adjustments resulting from the translation of the financial statements of the Company’s foreign operations into U.S. dollars are excluded from the determination of net income and are recorded in accumulated other comprehensive income (loss), a separate component of equity.
Pension and Other Post-Retirement Benefit Plans |
| | | |
| | Fair Value Measurements Using Significant Unobservable Inputs (Level 3) |
| | Year ended |
| Redeemable Noncontrolling Interest (Liability) | December 28, 2013 |
| Beginning balance | $ | — |
|
| Transfers in and/or out of Level 3 | — |
|
| Purchases, issuances and settlements | 8,963 |
|
| Total gains or losses (realized/unrealized): |
|
| Included in other income (expense) | 687 |
|
| Included in other comprehensive income (CTA) | 367 |
|
| Included in additional paid-in capital | 10,564 |
|
| Ending balance | $ | 20,581 |
|
During the quarter ended December 28, 2013, we recorded an impairment charge for long-livedThe key assumptions used to calculate benefit obligations and related pension costs include expected long-term rate of return on plan assets, heldwithdrawal and used related to our PCS Massachusetts facility (see Note 4). As a result, we adjusted the carrying amountmortality rates, expected rate of this asset group, which consists of land, buildingincrease in employee compensation levels and fixtures, to fair value. Fair value wasdiscount rate. Assumptions are determined based on a weighted averagethe Company’s data and appropriate market indicators, and evaluated each year as of the replacement cost, market and income valuation approaches. In applyingplan’s measurement date.
The expected long-term rate of return on plan assets reflects the income approach, we estimatedaverage rate of earnings expected on the future net cash flows associated with leasingfunds invested, or to be invested, to provide for the asset groupbenefits included in the projected benefit obligations. In determining the expected long-term rate of return on plan assets, the Company considers the relative weighting of plan assets, the historical performance of total plan assets and individual asset classes and economic and other indicators of future performance.
In fiscal year 2016, new mortality improvement scales were issued in the U.S. reflecting a decline in longevity projection from the 2015 releases that the Company adopted, which decreased the Company’s benefit obligations by $1.3 million as of December 31, 2016. In fiscal year 2015, new mortality improvement scales were issued in the U.S. and the United Kingdom (U.K.) reflecting a decline in longevity projection from the 2014 releases that the Company adopted, which decreased the Company’s benefit obligations by $3.3 million as of December 26, 2015.
The discount rate reflects the rate the Company would have to pay to purchase high-quality investments that would provide cash sufficient to settle its current market. In applyingpension obligations.
The rate of compensation increase reflects the replacement cost approach, we estimatedexpected annual salary increases for the plan participants based on historical experience and the current estimated costemployee compensation strategy.
The Company is required to reconstruct the facility and deducted the loss in value due to depreciation and obsolesce considerations. In applying the market approach, we performed a market sales comparison and adjusted for certain criteria, such as location, age and square footage, to make for a meaningful comparison. We determined the average of the three valuation approaches and adjusted the carrying value of the asset group to its fair value of $39,500, which we classified as Level 3, whereby the inputs are based on management's internal estimates and not corroborated with observable market data.
Income Taxes
We recognize deferred tax assets and liabilities for the expected future tax consequences of temporary differences between the carrying amounts and tax basis of our assets and liabilities. We measure deferred tax assets and liabilities using the enacted tax rates and laws that will be in effect when we expect the differences to reverse. We reduce our deferred tax assets by a valuation allowance if, based upon the weight of available evidence both positive and negative, it is more likely than not that we will not realize some or all of the deferred tax assets.
As of December 28, 2013, earnings of non-U.S. subsidiaries considered to be indefinitely reinvested totaled $210,328. No provision for U.S. income taxes has been provided thereon. Upon distribution of those earnings in the form of dividends or otherwise, we would be subject to additional U.S. Federal and state income taxes and foreign income and withholding taxes, which could be material. It is our policy to indefinitely reinvest the earnings of our non-U.S. subsidiaries unless they can be repatriated in a manner that generates a tax benefit or an unforeseen cash need arises in the United States and the earnings can be repatriated in a manner that is substantially tax free. Determination of the amount of unrecognized deferred income tax liabilities on these earnings is not practicable due to the complexities with the hypothetical calculation. Additionally, the amount of the liability is dependent upon the circumstances existing if and when the remittance occurs.
We are a worldwide business and operate in various tax jurisdictions where tax laws and tax rates are subject to change given the political and economic climate in these countries. We report and pay income taxes based upon operational results and applicable law. Our current and deferred tax provision is based upon enacted tax rates in effect for the current and future periods. Any significant fluctuation in tax rates or changes in tax laws and regulations or changes to interpretation of existing tax laws and regulations could cause our estimate of taxes to change resulting in either increases or decreases in our effective tax rate.
We recognize the tax benefit from an uncertain tax position only if it is more likely than not that the tax position will be sustained upon examination by the taxing authorities, based on the technical merits of the tax position. The tax benefits
CHARLES RIVER LABORATORIES INTERNATIONAL, INC.
NOTES TO CONSOLIDATED FINANCIAL STATEMENTS (Continued)
(dollars in thousands, except per share amounts)
recognized in our financial statements from such positions are measured based upon the largest benefit that has a greater than 50% likelihood of being realized upon ultimate resolution.
Foreign Currency Translation
The functional currency of each of our operating foreign subsidiaries is local currency. The financial statements of these subsidiaries are translated into U.S. dollars as follows: assets and liabilities at year-end exchange rates; income, expenses and cash flows at average exchange rates; and equity at historical exchange rates. The resulting translation adjustment is recorded as a component of accumulated other comprehensive income, innet of tax, the accompanying balance sheet. Exchangeactuarial gains and losses on foreign currency transactions are recorded as other income or expense. We recorded an exchange gain (loss) of $136 in 2013, $(892) in 2012 and $6,237 in 2011.
Other Comprehensive Income
Our other comprehensive income (OCI) consists of unrealized gains (losses) on available-for-sale marketable securities, foreign currency translation adjustments and unrecognized pension gains and losses and prior service costs and credits. These items are presented, before tax effects, in the consolidated statements of other comprehensive income. We disclose the tax effects on each item included in Note 6.
Pension Plans
Our defined benefit pension plans' assets, liabilities and expenses are calculated using various assumptions. These assumptions are reviewed annually, or whenever otherwise required, based on reviews of current plan information and consultations with independent investment advisers and actuaries. The selection of assumptions requires a high degree of judgment and may materially change from period to period.
We recognize the funded status of our benefit plans on our consolidated balance sheets. We recognize gains, losses and prior service costs or credits that arise during the period that arebut were not previously required to be recognized as components of net periodic benefit cost as a component of accumulated othercost. Other comprehensive income netis adjusted as these amounts are later recognized in income as components of tax. We measure plan assets and obligations as of the date of our fiscal year-end balance sheet. Additional information about certain effects on net periodic benefit cost for the next fiscal year that arise from delayed recognition of the gains or losses, prior service costs or credits, and transition asset or obligation are disclosed in the Note 8 of these financial statements.
Our defined benefit pension plans' assets, liabilities and expenses are calculated by accredited independent actuaries using various assumptions, which are approved by management. The actuarial computations require the use of assumptions to estimate the total benefits ultimately payable to employees and to allocate this cost to the service periods. The key assumptions used to calculate pension costs are determined and reviewed annually by management after consulting with outside investment advisers and actuaries. The key assumptions include the discount rate, the expected return on plan assets and expected future rate of salary increases. In addition, our actuaries utilize other assumptions such as withdrawal and mortality rate. The assumed discount rate, which is intended to be the rate at which benefits could effectively be settled, is adjusted based on the change in the long-term bond yield as of the measurement date.
We estimate the future return on invested pension assets annually based on information prepared by our outside actuaries and investment advisers, our targeted asset allocations and our own assumptions about that market. Our forward-looking pension assumptions, such as the rate of return on invested assets, are approved annually by our pension committee in the first quarter of the year and are updated as needed as of year-end. The rate of return on invested plan assets is primarily based on capital market models prepared by our advisers. These models use asset-class specific expected returns, standard deviations and correlation coefficients to derive a distribution of expected average portfolio return over the future duration of the pension plan's liabilities.
Differences between actual investment returns and estimated investment returns are recorded in accumulated other comprehensive income (loss) (AOCI) and are amortized over the remaining duration of the pension plans. As of December 28, 2013, the Company's AOCI includes $39,788 of net actuarial losses, which will be amortized over approximately 22 years.cost.
Earnings Per Share
Basic earnings per share are calculated by dividing net income attributable to common shareholders by the weighted average number of common shares outstanding. Dilutedoutstanding during the period. Except where the result would be anti-dilutive to income from continuing operations, diluted earnings per common share are calculated by adjustingis computed using the weighted average numbertreasury stock method, assuming the exercise of common shares outstanding to includestock options and the numbervesting of additional common shares that would have been outstanding if the dilutive potential common shares had been issued, to the extent these additional shares are not anti-dilutive.restricted stock awards, restricted stock units, or PSUs, as well as their related income tax effects.
CHARLES RIVER LABORATORIES INTERNATIONAL, INC.
NOTES TO CONSOLIDATED FINANCIAL STATEMENTS (Continued)
(dollars
Newly Adopted Accounting Pronouncements
In July 2015, the Financial Accounting Standards Board (FASB) issued Accounting Standards Update (ASU) 2015-11, “Simplifying the Measurement of Inventory,” that simplifies the subsequent measurement of inventories by replacing the current lower of cost or market test with a lower of cost or net realizable value test. The ASU is effective for fiscal years beginning after December 15, 2016, and interim periods within those fiscal years. Early adoption is permitted. During the fourth quarter of 2016, the Company adopted this standard, which had no impact on inventories as of December 31, 2016.
In August 2014, the FASB issued ASU 2014-15, “Disclosure of Uncertainties about an Entity’s Ability to Continue as a Going Concern.” The standard requires management to assess if there is substantial doubt about an entity’s ability to continue as a going concern within one year after the issuance date and, as applicable, provide additional disclosures on management’s plan to alleviate the substantial doubt. The ASU is effective for fiscal years ending after December 15, 2016, and interim periods within annual periods beginning after December 15, 2016. Early adoption is permitted. During the fourth quarter of 2016, the Company adopted this standard, which had no impact on the Company’s consolidated financial statements and related disclosures.
Newly Issued Accounting Pronouncements
In January 2017, the FASB issued ASU 2017-04, “Simplifying the Test for Goodwill Impairment.” The standard simplifies the accounting for goodwill impairment by removing Step 2 of the goodwill impairment test, which requires a hypothetical purchase price allocation. The ASU is effective for annual or interim goodwill impairment tests in thousands, except per share amounts)fiscal years beginning after December 15, 2019, and should be applied on a prospective basis. Early adoption is permitted for interim or annual goodwill impairment tests performed on testing dates after January 1, 2017. The adoption of this standard is not expected to have a material impact on the consolidated financial statements and related disclosures.
In January 2017, the FASB issued ASU 2017-01, “Clarifying the Definition of a Business.” The standard clarifies the definition of a business by adding guidance to assist entities in evaluating whether transactions should be accounted for as acquisitions of assets or businesses. The ASU is effective for fiscal years beginning after December 15, 2017, and interim periods within those fiscal years. Early adoption is permitted for certain transactions. The Company is still evaluating the impact this standard will have on its consolidated financial statements and related disclosures.
In November 2016, the FASB issued ASU 2016-18, “Restricted Cash.” The standard addresses the classification and presentation of restricted cash and restricted cash equivalents within the statement of cash flows. The ASU is effective for fiscal years beginning after December 15, 2017, and interim periods within those fiscal years. Early adoption is permitted. The Company is still evaluating the impact this standard will have on its consolidated financial statements and related disclosures.
In October 2016, the FASB issued ASU 2016-16, “Intra-Entity Transfers of Assets Other Than Inventory.” The standard requires the immediate recognition of tax effects for an intra-entity asset transfer other than inventory. The ASU is effective for fiscal years beginning after December 15, 2017, and interim periods within those fiscal years. Early adoption is permitted. The adoption of this standard is not expected to have a material impact on the consolidated financial statements and related disclosures.
In August 2016, the FASB issued ASU 2016-15, “Classification of Certain Cash Receipts and Cash Payments.” The standard addresses the classification of certain transactions within the statement of cash flows, including cash payments for debt prepayment or debt extinguishment costs, contingent consideration payments made after a business combination, and distributions received from equity method investments. The ASU is effective for fiscal years beginning after December 15, 2017, and interim periods within those fiscal years. Early adoption is permitted. The Company is still evaluating the impact this standard will have on its consolidated financial statements and related disclosures.
In March 2016, the FASB issued ASU 2016-09, “Improvements to Employee Share-Based Payment Accounting.” The standard reduces complexity in several aspects of the accounting for employee share-based compensation, including the income tax consequences, classification of awards as either equity or liabilities and classification on the statement of cash flows. The ASU is effective for fiscal years beginning after December 15, 2016, and interim periods within those fiscal years. Early adoption is permitted. The Company is still evaluating the impact this standard will have on its consolidated financial statements and related disclosures.
In February 2016, the FASB issued ASU 2016-02, “Leases.” The standard established the principles that lessees and lessors will apply to report useful information to users of financial statements about the amount, timing and uncertainty of cash flows arising from a lease. The ASU is effective for fiscal years beginning after December 15, 2018, and interim periods within those fiscal years. Early adoption is permitted. The Company is still evaluating the full impact this standard will have on its
CHARLES RIVER LABORATORIES INTERNATIONAL, INC.
NOTES TO CONSOLIDATED FINANCIAL STATEMENTS (Continued)
Discontinued Operationsconsolidated financial statements and related disclosures but expects to recognize substantially all of its leases on the balance sheet, by recording a right-to-use asset and a corresponding lease liability.
In May 2014, the FASB issued ASU 2014-09, “Revenue from Contracts with Customers.” The standard, including subsequently issued amendments, will replace most existing revenue recognition guidance in U.S. GAAP when it becomes effective and permits the use of either the full retrospective or modified retrospective transition method. The standard will require an entity to recognize the amount of revenue to which it expects to be entitled for the transfer of promised goods or services to customers. The standard will be effective for annual and interim periods beginning after December 15, 2017. The Company has selected the modified retrospective transition method and is still evaluating the impact the adoption will have on its consolidated financial statements and related disclosures.
2. BUSINESS ACQUISITIONS
Agilux
On September 28, 2016, the Company acquired Agilux Laboratories, Inc. (Agilux), a CRO that provides a suite of integrated discovery small and large molecule bioanalytical services, drug metabolism and pharmacokinetic services, and pharmacology services. The acquisition supports the Company’s strategy to offer clients a broader, integrated portfolio that provides services continuously from the earliest stages of drug research through the non-clinical development process. The purchase price for Agilux was $64.9 million in cash and was funded by borrowings on the Company’s revolving credit facility. The business is reported as part of the Company’s DSA reportable segment.
The purchase price allocation of $62.0 million, net of $2.9 million of cash acquired, was as follows:
|
| | | |
| | September 28, 2016 |
| | (in thousands) |
| Trade receivables (contractual amount of $4,799) | $ | 4,799 |
|
| Other current assets (excluding cash) | 1,509 |
|
| Property, plant and equipment | 3,907 |
|
| Other long-term assets | 11 |
|
| Definite-lived intangible assets | 21,900 |
|
| Goodwill | 43,899 |
|
| Current liabilities | (3,987 | ) |
| Long-term liabilities | (10,013 | ) |
| Total purchase price allocation | $ | 62,025 |
|
The purchase price allocations are subject to change as additional information becomes available concerning the fair value and tax basis of the assets acquired and liabilities assumed. Any additional adjustments to the purchase price allocation will be made as soon as practicable but no later than one year from the date of acquisition.
The breakout of definite-lived intangible assets acquired was as follows:
|
| | | | | |
| | Definite-Lived Intangible Assets | | Weighted Average Amortization Life |
| | (in thousands) | | (in years) |
| Client relationships | $ | 16,700 |
| | 17 |
| Other intangible assets | 5,200 |
| | 4 |
| Total definite-lived intangible assets | $ | 21,900 |
| | 14 |
The goodwill resulting from the transaction is primarily attributable to the potential growth of the Company’s DSA businesses from customers and technology introduced through Agilux, and the assembled workforce of the acquired business. The goodwill attributable to Agilux is not deductible for tax purposes.
The Company incurred transaction and integration costs of $1.7 million in connection with the acquisition during fiscal year 2016, which were included in selling, general and administrative expenses.
CHARLES RIVER LABORATORIES INTERNATIONAL, INC.
NOTES TO CONSOLIDATED FINANCIAL STATEMENTS (Continued)
Pro forma financial information as well as actual revenue and operating income (loss) have not been included because Agilux’s financial results are non-significant when compared with the Company’s consolidated financial results.
Blue Stream
On June 27, 2016, the Company acquired Blue Stream Laboratories, Inc. (Blue Stream), an analytical CRO supporting the development of complex biologics and biosimilars. Combining Blue Stream with the Company’s existing discovery, safety assessment, and biologics capabilities creates a leading CRO that has the ability to support biologic and biosimilar development from characterization through clinical testing and commercialization. The purchase price for Blue Stream was $11.7 million, including $3.0 million in contingent consideration, and was subject to certain customary adjustments. The acquisition was funded by borrowings on the Company’s revolving credit facility. The business is reported in the Company’s Manufacturing reportable segment.
The contingent consideration is a one-time payment that could become payable based on the achievement of a revenue target. If achieved, the payment will become due in the third quarter of fiscal year 2017. The aggregate, undiscounted amount of contingent consideration that the Company may pay is $3.0 million. The Company estimated the fair value of this contingent consideration based on a probability-weighted set of outcomes.
The purchase price allocation of $11.7 million, net of a non-significant amount of cash acquired, was as follows:
|
| | | |
| | June 27, 2016 |
| | (in thousands) |
| Trade receivables (contractual amount of $1,104) | $ | 1,104 |
|
| Other current assets (excluding cash) | 15 |
|
| Property, plant and equipment | 912 |
|
| Other long-term assets | 187 |
|
| Definite-lived intangible assets | 1,230 |
|
| Goodwill | 10,477 |
|
| Current liabilities | (1,132 | ) |
| Long-term liabilities | (1,044 | ) |
| Total purchase price allocation | $ | 11,749 |
|
The purchase price allocations are subject to change as additional information becomes available concerning the fair value and tax basis of the assets acquired and liabilities assumed. From the date of the acquisition through December 31, 2016, the Company recorded a measurement-period adjustment related to the acquisition that resulted in an immaterial change to the purchase price allocation. Any additional adjustments to the purchase price allocation will be made as soon as practicable but no later than one year from the date of acquisition.
The breakout of definite-lived intangible assets acquired was as follows:
|
| | | | | |
| | Definite-Lived Intangible Assets | | Weighted Average Amortization Life |
| | (in thousands) | | (in years) |
| Client relationships | $ | 650 |
| | 10 |
| Other intangible assets | 580 |
| | 5 |
| Total definite-lived intangible assets | $ | 1,230 |
| | 7 |
The goodwill resulting from the transaction is primarily attributable to the potential growth of the Company’s Manufacturing business from customers and technology introduced through Blue Stream, the assembled workforce of the acquired business, expected synergies, and the development of future proprietary processes. The goodwill attributable to Blue Stream is not deductible for tax purposes.
The Company incurred $0.6 million of transaction and integration costs in connection with the acquisition during fiscal year 2016, which were included in selling, general and administrative expenses.
Pro forma financial information as well as actual revenue and operating income (loss) have not been included because Blue Stream’s financial results are non-significant when compared with the Company’s consolidated financial results.
CHARLES RIVER LABORATORIES INTERNATIONAL, INC.
NOTES TO CONSOLIDATED FINANCIAL STATEMENTS (Continued)
WIL Research
On April 4, 2016, the Company acquired WIL Research, a provider of safety assessment and CDMO services to biopharmaceutical and agricultural and industrial chemical companies worldwide. The acquisition enhanced the Company’s position as a leading global early-stage CRO by strengthening its ability to partner with clients across the drug discovery and development continuum. The purchase price for WIL Research was $604.8 million, including assumed liabilities of $0.4 million. The purchase price includes payment for estimated working capital, which was subject to final adjustment based on the actual working capital of the acquired business. The acquisition was funded by cash on hand and borrowings on the Company’s amended credit facility. See Note 7, “Long-Term Debt and Capital Lease Obligations.” WIL Research’s safety assessment and CDMO businesses are reported in the Company’s DSA and Manufacturing reportable segments, respectively.
The purchase price allocation of $577.4 million, net of $27.4 million of cash acquired, was as follows:
|
| | | |
| | April 4, 2016 |
| | (in thousands) |
| Trade receivables (contractual amount of $48,625) | $ | 48,157 |
|
| Inventories | 2,296 |
|
| Other current assets (excluding cash) | 3,814 |
|
| Property, plant and equipment | 129,066 |
|
| Other long-term assets | 1,060 |
|
| Definite-lived intangible assets | 164,800 |
|
| Goodwill | 330,602 |
|
| Deferred revenue | (39,103 | ) |
| Other current liabilities | (27,386 | ) |
| Long-term liabilities | (35,915 | ) |
| Total purchase price allocation | $ | 577,391 |
|
The purchase price allocations are subject to change as additional information becomes available concerning the fair value and tax basis of the assets acquired and liabilities assumed. From the date of the acquisition through December 31, 2016, the Company recorded measurement-period adjustments related to the acquisition that resulted in an immaterial change to the purchase price allocation on a consolidated basis. Any additional adjustments to the purchase price allocation will be made as soon as practicable but no later than one year from the date of acquisition.
The breakout of definite-lived intangible assets acquired was as follows:
|
| | | | | |
| | Definite-Lived Intangible Assets | | Weighted Average Amortization Life |
| | (in thousands) | | (in years) |
| Client relationships | $ | 137,500 |
| | 15 |
| Developed technology | 20,700 |
| | 3 |
| Backlog | 6,600 |
| | 1 |
| Total definite-lived intangible assets | $ | 164,800 |
| | 13 |
The goodwill resulting from the transaction, $19.0 million of which is deductible for tax purposes due to a prior asset acquisition, is primarily attributed to the potential growth of the Company’s DSA and Manufacturing businesses from clients introduced through WIL Research, the assembled workforce of the acquired business, and expected cost synergies.
The Company incurred transaction and integration costs in connection with the acquisition of $15.5 million and $3.2 million during fiscal years 2016 and 2015, respectively, which were included in selling, general and administrative expenses.
WIL Research revenue and operating income from April 4, 2016 through December 31, 2016 was $176.1 million and $12.5 million, respectively. Beginning on April 4, 2016, WIL Research has been included in the operating results of discontinuedthe Company.
The following selected unaudited pro forma consolidated results of operations less applicable income taxes (benefit) andare presented as if the WIL Research acquisition had occurred as of the beginning of the period immediately preceding the period of acquisition after giving effect to certain adjustments. For fiscal year 2016, these adjustments included additional amortization of intangible assets and liabilities, are reported as a separate componentdepreciation of
CHARLES RIVER LABORATORIES INTERNATIONAL, INC.
NOTES TO CONSOLIDATED FINANCIAL STATEMENTS (Continued)
fixed assets of $0.4 million, reversal of interest expense on borrowings of $2.6 million, elimination of intercompany activity and other one-time costs, and the tax impacts of these adjustments. For fiscal year 2015, these adjustments included additional amortization of intangible assets and depreciation of fixed assets of $13.6 million, reversal of interest expense on borrowings of $10.5 million, inclusion of acquisition-related transaction costs of $11.5 million, elimination of intercompany activity and other one-time costs, and the tax impacts of these adjustments.
|
| | | | | | | |
| | Fiscal Year |
| | 2016 | | 2015 |
| | | | |
| | (in thousands, except per share amounts) |
| | (unaudited) |
| Revenue | $ | 1,741,964 |
| | $ | 1,578,133 |
|
| Net income attributable to common shareholders | 175,779 |
| | 153,974 |
|
| Earnings per common share: | | | |
| Basic | $ | 3.74 |
| | $ | 3.31 |
|
| Diluted | $ | 3.67 |
| | $ | 3.23 |
|
These unaudited pro forma results of operations have been prepared for comparative purposes only, and they do not purport to be indicative of the results of operations that actually would have resulted had the acquisition occurred on the date indicated or that may result in the accompanyingfuture. No effect has been given for synergies, if any, that may have been realized through the acquisition.
Oncotest
On November 18, 2015, the Company acquired Oncotest GmbH (Oncotest), a German CRO providing discovery services for oncology, one of the largest therapeutic areas for biopharmaceutical research and development spending. With this acquisition, the Company has expanded its oncology services capabilities, enabling it to provide clients with access to a more comprehensive portfolio of technologies, including patient-derived xenograft (PDX) and syngeneic models. The purchase price for Oncotest was $36.0 million, including $0.3 million in contingent consideration. The acquisition was funded by borrowings on the Company's revolving credit facility. The business is reported in the Company’s DSA reportable segment.
The contingent consideration earn-out period ended in the fourth quarter of 2016. As a result, the related contingent consideration liability was reversed and a gain of $0.3 million was recorded in selling, general and administrative expenses, as no payments were expected to be made. The contingent consideration was a one-time payment that could have become payable based on the achievement of a revenue target for fiscal year 2016. If achieved, the payment would have become due in the first quarter of fiscal year 2017. The aggregate, undiscounted amount of contingent consideration that the Company could have paid was €2.0 million ($2.1 million as of December 31, 2016). The Company estimated the fair value of this contingent consideration based on a probability-weighted set of outcomes.
The purchase price allocation of $35.4 million, net of $0.6 million of cash acquired, was as follows:
|
| | | |
| | November 18, 2015 |
| | (in thousands) |
| Trade receivables (contractual amount of $3,546) | $ | 3,520 |
|
| Inventories | 129 |
|
| Other current assets (excluding cash) | 706 |
|
| Property, plant and equipment | 2,528 |
|
| Definite-lived intangible assets | 13,330 |
|
| Goodwill | 22,894 |
|
| Other long-term assets | 250 |
|
| Current liabilities | (3,456 | ) |
| Long-term liabilities | (4,470 | ) |
| Total purchase price allocation | $ | 35,431 |
|
CHARLES RIVER LABORATORIES INTERNATIONAL, INC.
NOTES TO CONSOLIDATED FINANCIAL STATEMENTS (Continued)
The breakout of definite-lived intangible assets acquired was as follows:
|
| | | | | |
| | Definite-Lived Intangible Assets | | Weighted Average Amortization Life |
| | (in thousands) | | (in years) |
| Client relationships | $ | 7,146 |
| | 19 |
| Developed technology | 5,960 |
| | 19 |
| Other intangible assets | 224 |
| | 3 |
| Total definite-lived intangible assets | $ | 13,330 |
| | 19 |
The goodwill resulting from the transaction is primarily attributed to the potential growth in the Company's DSA businesses from customers and technology introduced through Oncotest, the assembled workforce of the acquired business and expected cost synergies. The goodwill attributable to Oncotest is not deductible for tax purposes.
The Company incurred non-significant transaction and integration costs in connection with the acquisition during fiscal year 2016 and costs of $2.1 million during fiscal year 2015, which were included in selling, general and administrative expenses.
Pro forma financial information as well as actual revenue and operating income (loss) have not been included because Oncotest’s financial results are non-significant when compared with the Company’s consolidated financial results.
Celsis
On July 24, 2015, the Company acquired Celsis Group Limited (Celsis), a leading provider of rapid testing systems for non-sterile bacterial contamination for the biopharmaceutical and consumer products industries. The purpose of this acquisition was to enhance the Company’s portfolio of rapid microbial detection products and services with the addition of a rapid bioburden testing product. The purchase price for Celsis was $214.5 million, including assumed debt and certain liabilities of $10.3 million. The acquisition was funded by cash on hand and borrowings on the Company’s revolving credit facility. The business is reported in the Company’s Manufacturing reportable segment.
The purchase price allocation of $212.2 million, net of $2.3 million of cash acquired, was as follows:
|
| | | |
| | July 24, 2015 |
| | (in thousands) |
| Trade receivables (contractual amount of $5,410) | $ | 5,288 |
|
| Inventories | 10,103 |
|
| Other current assets (excluding cash) | 13,269 |
|
| Property, plant and equipment | 4,639 |
|
| Definite-lived intangible assets | 118,140 |
|
| Goodwill | 105,550 |
|
| Other long-term assets | 537 |
|
| Current debt | (9,766 | ) |
| Other current liabilities | (7,136 | ) |
| Long-term liabilities | (28,388 | ) |
| Total purchase price allocation | $ | 212,236 |
|
CHARLES RIVER LABORATORIES INTERNATIONAL, INC.
NOTES TO CONSOLIDATED FINANCIAL STATEMENTS (Continued)
The breakout of definite-lived intangible assets acquired was as follows:
|
| | | | | |
| | Definite-Lived Intangible Assets | | Weighted Average Amortization Life |
| | (in thousands) | | (in years) |
| Client relationships | $ | 71,000 |
| | 16 |
| Developed technology | 39,140 |
| | 14 |
| Trademark and trade names | 5,200 |
| | 14 |
| Non-compete | 2,800 |
| | 5 |
| Total definite-lived intangible assets | $ | 118,140 |
| | 15 |
The goodwill resulting from the transaction is primarily attributed to the potential growth of the Company’s Manufacturing business from clients introduced through Celsis, the assembled workforce of the acquired business and expected cost synergies. The goodwill attributable to Celsis is not deductible for tax purposes.
The Company incurred transaction and integration costs in connection with the acquisition of $1.0 million and $8.8 million during fiscal years 2016 and 2015, which were included in selling, general and administrative expenses.
Celsis revenue and operating loss from July 24, 2015 through December 26, 2015 was $11.1 million and $6.1 million, respectively. Beginning on July 24, 2015, Celsis has been included in the operating results of the Company.
The following selected unaudited pro forma consolidated results of operations are presented as if the Celsis acquisition had occurred as of the beginning of the period immediately preceding the period of acquisition after giving effect to certain nonrecurring costs and other adjustments, resulting in a reversal of $0.6 million and additional expenses of $13.1 million for fiscal years 2015 and 2014, respectively, related to depreciation and amortization of property, plant and equipment, inventory fair value adjustments and intangible assets.
|
| | | | | | | |
| | Fiscal Year |
| | 2015 | | 2014 |
| | | | |
| | (in thousands, except per share amounts) |
| | (unaudited) |
| Revenue | $ | 1,380,493 |
| | $ | 1,329,025 |
|
| Net income attributable to common shareholders | 162,672 |
| | 110,387 |
|
| Earnings per common share: | | | |
| Basic | $ | 3.50 |
| | $ | 2.37 |
|
| Diluted | $ | 3.42 |
| | $ | 2.32 |
|
These unaudited pro forma results of operations have been prepared for comparative purposes only, and they do not purport to be indicative of the results of operations that actually would have resulted had the acquisition occurred on the date indicated or that may result in the future. No effect has been given for synergies, if any, that may have been realized through the acquisition.
Sunrise
On May 5, 2015, the Company acquired Sunrise Farms, Inc. (Sunrise), a producer of specific-pathogen-free fertile chicken eggs and chickens used in the manufacture of live viruses. The purpose of this business acquisition was to expand the capabilities of the Company’s existing Avian Vaccine Services business. The purchase price of the acquisition was $9.6 million and was funded by cash on hand and borrowings on the Company’s revolving credit facility. The business is reported in the Company’s Manufacturing reportable segment.
The Company recorded a bargain purchase gain of $9.8 million, which represents the excess of the estimated fair value of the net assets acquired over the purchase price. The bargain purchase gain was recorded in other income (expense), net in the Company’s consolidated statement of income and consolidated balance sheetswas not recognized for tax purposes. The Company believes there were several factors that contributed to this transaction resulting in a bargain purchase gain, including the currenthighly specialized nature of Sunrise’s business falling outside of the seller’s core activities and prior periods. a limited pool of potential buyers.
CHARLES RIVER LABORATORIES INTERNATIONAL, INC.
NOTES TO CONSOLIDATED FINANCIAL STATEMENTS (Continued)
Before recognizing the gain from the bargain purchase, the Company reassessed its initial identification and valuation of assets acquired and liabilities assumed to validate that all assets and liabilities that the Company was able to identify at the acquisition date were properly recognized.
The statementpurchase price allocation of $9.6 million, net of less than $0.1 million of cash flows also reflects separate disclosureacquired, was as follows:
|
| | | |
| | May 5, 2015 |
| | (in thousands) |
| Trade receivables (contractual amount of $995) | $ | 965 |
|
| Inventories | 1,518 |
|
| Other current assets (excluding cash) | 973 |
|
| Property, plant and equipment | 13,698 |
|
| Definite-lived intangible assets | 3,400 |
|
| Current liabilities | (925 | ) |
| Long-term liabilities | (250 | ) |
| Fair value of net assets acquired | 19,379 |
|
| Bargain purchase gain | (9,821 | ) |
| Total purchase price allocation | $ | 9,558 |
|
The identifiable definite-lived intangible assets acquired represent the client relationships intangible, which is being amortized over the weighted average estimated useful life of cash flows pertaining to discontinued operations consistently for all periods presented.approximately 15 years.
The Company incurred non-significant transaction and integration costs in connection with the acquisition during fiscal year 2016 and costs of $1.5 million during fiscal year 2015, which were included in selling, general and administrative expenses.
Recent Accounting Pronouncements
TherePro forma financial information as well as actual revenue and operating income (loss) have not been included because Sunrise’s financial results are no recent accounting pronouncements that have been issued but are not yet effective that will have a material impact our futurenon-significant when compared with the Company’s consolidated financial statements.
2. BUSINESS ACQUISITIONSresults.
We completed two business acquisitions during the year ended December 28, 2013 and one business acquisition for the year end December 29, 2012. The results of operations of the acquired businesses are included in the accompanying consolidated financial statements from the dates of acquisition. During the year ended December 31, 2011 no significant business acquisitions were completed.
EMD SingaporeChanTest
On October 4, 2013, we29, 2014, the Company acquired an EMD productsChanTest Corporation (ChanTest), a leading provider of ion channel testing services to the biopharmaceutical industry. The acquisition augments the Company’s early discovery capabilities and service provider locatedenhances the Company’s ability to support clients’ target discovery and lead optimization efforts. The purchase price of the acquisition was $59.2 million, including $0.3 million in Singapore for approximately $4,934contingent consideration, and was funded by borrowings on the Company’s revolving credit facility and cash on hand. The business is reported in the Company’s DSA reportable segment.
The contingent consideration earn-out period ended in the fourth quarter of 2015. As a result, the related contingent consideration liability was reversed and a gain of $0.3 million was recorded in selling, general and administrative expenses, as no payments were expected to be made. The aggregate, undiscounted amount of contingent consideration that could have become payable was $2.0 million. The Company estimated the fair value of this contingent consideration based on a probability-weighted set of outcomes.
The purchase price allocation of $52.0 million, net of $7.2 million in cash subject to certain closing adjustments. The financial results of the acquired, entity will be included in our RMS reportable business segment.
The preliminary purchase price allocation is as follows:
| | | Current assets | $ | 300 |
| |
| | | October 29, 2014 |
| | | (in thousands) |
| Current assets (excluding cash) | | $ | 4,669 |
|
| Property, plant and equipment | 154 |
| 1,637 |
|
| Definite-lived intangible assets | 1,885 |
| 23,920 |
|
| Goodwill | 2,659 |
| 34,775 |
|
| Current liabilities | (64 | ) | (3,486 | ) |
| Long-term liabilities | | (9,486 | ) |
| Total purchase price allocation | $ | 4,934 |
| $ | 52,029 |
|
CHARLES RIVER LABORATORIES INTERNATIONAL, INC.
NOTES TO CONSOLIDATED FINANCIAL STATEMENTS (Continued)
The breakout of definite-lived intangible assets acquired is as follows:
| | | | | | | Definite-Lived Intangible Assets | | Weighted Average Amortization Life |
| | | Weighted average amortization life (in years) | (in thousands) | | (in years) |
| Client relationships | $ | 1,870 |
| 8.0 | $ | 19,000 |
| | 13 |
| Other intangible assets | 15 |
| 2.0 | 4,920 |
| | 9 |
| Total definite-lived intangible assets | $ | 1,885 |
| 8.0 | $ | 23,920 |
| | 12 |
The definite-lived intangibles are largely attributed to the expected cash flows related to client relationships existing at the acquisition closing date. The goodwill resulting from the transaction is primarily attributed to the potential growth of the business in Southeast Asia. The goodwilland is not deductible for tax purposes.
The accounting for thisCompany incurred non-significant transaction and integration costs in connection with the acquisition isduring both fiscal years 2016 and 2015, and costs of $1.1 million during fiscal year 2014, which were included in selling, general and administrative expenses.
Pro forma financial information as well as actual revenue and operating income (loss) have not yet complete duebeen included because ChanTest’s financial results are non-significant when compared with the Company’s consolidated financial results.
VivoPath
On June 16, 2014, the Company acquired substantially all of the assets of VivoPath LLC (VivoPath), a discovery services company specializing in the rapid, in vivo compound evaluation of molecules in the therapeutic areas of metabolism, inflammation and oncology. The purchase price was $2.3 million, including $1.6 million in contingent consideration, and was allocated primarily to our ongoing assessment ofthe intangible assets acquired. The Company estimated the fair value of assetsthis contingent consideration based on a probability-weighted set of outcomes. The undiscounted total amount of contingent consideration was a maximum of $2.4 million, payable over three years based on the achievement of revenue growth targets and other contractual requirements. During fiscal year 2016, the Company paid the second year tranche of the contingent consideration of $0.2 million. During fiscal year 2015, the Company paid the first year tranche of the contingent consideration of $0.6 million and recorded a gain of $0.8 million, primarily due to a decrease in the expected future contingent consideration payments. As of December 31, 2016, the remaining contingent consideration payable is a maximum of $0.2 million. The business is reported in the Company’s DSA reportable segment.
Argenta and BioFocus
On April 1, 2014, the Company acquired (1) 100% of the shares of the U.K. based entities Argenta and associated income tax accounting thereon. We expect to completeBioFocus, and (2) certain Dutch assets. These businesses have formed the core of the Company’s Early Discovery business. With this acquisition, the Company has enhanced its position as a full service, early-stage CRO, with integrated in vitro and in vivo capabilities from target discovery through non-clinical development. The purchase price of the acquisition accountingwas $191.8 million, including $0.9 million in 2014.
Vital River
In October 2012, we entered into an agreement to acquire a 75% ownership interest of Vital River, a commercial provider of research models and related services in China, for $26,890 in cash, subject to certain closing adjustments.contingent consideration. The acquisition closedwas funded by cash on hand and borrowings on the Company’s revolving credit facility. The businesses are reported in January 2013. Vital River's financial results are includedthe Company’s DSA reportable segment.
The contingent consideration earn-out period ended on April 1, 2015. As a result, the related contingent consideration liability, as adjusted for subsequent changes in our RMS reportable business segment.fair value, was reversed and a gain of $0.8 million was recorded in selling, general and administrative expenses during fiscal year 2015, as no payments were expected to be made. The contingent consideration was a one-time payment that could have become payable in the second quarter of 2015 based on the achievement of a certain revenue target for the twelve-month period following the acquisition. The aggregate, undiscounted amount of contingent consideration that the Company could have paid was €5.0 million ($5.3 million as of December 31, 2016). The Company estimated the fair value of this contingent consideration based on a probability-weighted set of outcomes.
CHARLES RIVER LABORATORIES INTERNATIONAL, INC.
NOTES TO CONSOLIDATED FINANCIAL STATEMENTS (Continued)
(dollars in thousands, except per share amounts)
The purchase price allocation of $183.6 million, net of $2,671$8.2 million of cash acquired, iswas as follows:
| | | | April 1, 2014 |
| | | | (in thousands) |
| Current assets (excluding cash) | $ | 3,092 |
| $ | 31,682 |
|
| Property, plant and equipment | 10,468 |
| 21,008 |
|
| Other long-term assets | 2,242 |
| 11,140 |
|
| Definite-lived intangible assets | 16,954 |
| 104,470 |
|
| Goodwill | 16,989 |
| 65,235 |
|
| Current liabilities | (11,303 | ) | (13,139 | ) |
| Long term liabilities | (5,260 | ) | |
| Redeemable noncontrolling interest | (8,963 | ) | |
| Long-term liabilities | | (36,802 | ) |
| Total purchase price allocation | $ | 24,219 |
| $ | 183,594 |
|
The breakout of definite-lived intangible assets acquired iswas as follows:
| | | | | | | Definite-Lived Intangible Assets | | Weighted Average Amortization Life |
| | | Weighted average amortization life (in years) | (in thousands) | | (in years) |
| Client relationships | $ | 14,741 |
| 11.7 | $ | 94,000 |
| | 18 |
| Reacquired rights | 2,053 |
| 1.3 | |
| Backlog | | 5,900 |
| | 1 |
| Trademark and trade names | | 1,170 |
| | 3 |
| Leasehold interests | | 1,000 |
| | 13 |
| Other intangible assets | 160 |
| 2.8 | 2,400 |
| | 19 |
| Total definite-lived intangible assets | $ | 16,954 |
| 10.4 | $ | 104,470 |
| | 17 |
The definite-lived intangibles are largely attributed to the expected cash flows related to client relationships existing at the acquisition closing date. In addition, the Company reacquired a right previously granted to the entity related to a royalty agreement for the distribution of products in China. The value assigned to the reacquired right is being amortized over the remaining life of the existing royalty agreement. The goodwill resulting from the transaction is primarily attributed to the potential growth of the business in China.Company’s DSA businesses from clients introduced through Argenta and BioFocus, the assembled workforce of the acquired businesses and expected cost synergies. The goodwill attributable to Argenta and BioFocus is not deductible for tax purposes.
ConcurrentThe Company incurred non-significant transaction and integration costs in connection with the acquisition during both fiscal years 2016 and 2015, and costs of $5.3 million during fiscal year 2014, which were included in selling, general and administrative expenses.
Argenta and BioFocus revenue and operating income for fiscal year 2014 were $71.4 million and $1.8 million, respectively. Beginning on April 1, 2014, Argenta and BioFocus have been included in the Company entered into a joint venture agreement with the noncontrolling interest holders that provide the Company with the right to purchase the remaining 25%operating results of the entity for cash at its then appraised value beginning in January 2016. Additionally,Company.
The following selected unaudited pro forma consolidated results of operations are presented as if the noncontrolling interest holders were granted the right to require the Company to purchase the remaining 25%Argenta and BioFocus acquisition had occurred as of the entity at its then appraised value beginning in January 2016 for cash. These rights are accelerated in certain events. As the noncontrolling interest holders can require the Company to purchase for cash the remaining 25% interest, we classify the carrying amount of the noncontrolling interest aboveperiod immediately preceding the equity sectionperiod of acquisition after giving effect to certain adjustments, including amortization of intangible assets and below liabilities on the consolidated balance sheet. The acquisition-date fair valuedepreciation of the noncontrolling interest was determined based on the fair valuefixed assets of the consideration exchanged for the 75% of Vital River. Subsequent to the acquisition, each quarter we adjust the carrying amount of the noncontrolling interest to fair value using a weighted combination of a market-based approach$3.7 million and an income approach. The income approach uses estimated future cash flows based on projected financial data discounted by a rate which considers the Company's weighted average cost of capital and the specific risks of achieving these cash flows. Adjustments to fair value are recorded through additional paid-in capital.
Accugenix
In August 2012, we acquired 100% of Accugenix Inc. (Accugenix), for $18,408 in cash, subject to adjustments. Accugenix is a global provider of cGMP-compliant contract microbial identification testing. The acquisition strengthens our EMD portfolio of products and services by providing state-of-the-art microbial detection services for the biotechnology, pharmaceutical, and medical device manufacturing industries. Accugenix is based in the U.S. and is included in our RMS reportable business segment.other nonrecurring costs.
|
| | | |
| | Fiscal Year |
| | 2014 |
| | (in thousands, except per share amounts) |
| | (unaudited) |
| Revenue | $ | 1,322,771 |
|
| Net income attributable to common shareholders | 128,195 |
|
| Earnings per common share: | |
| Basic | $ | 2.75 |
|
| Diluted | $ | 2.70 |
|
CHARLES RIVER LABORATORIES INTERNATIONAL, INC.
NOTES TO CONSOLIDATED FINANCIAL STATEMENTS (Continued)
(dollars
These unaudited pro forma results of operations have been prepared for comparative purposes only, and they do not purport to be indicative of the results of operations that actually would have resulted had the acquisition occurred on the date indicated or that may result in thousands, except per share amounts)
The purchase price allocation, net of $1,547 of cash acquired is as follows:the future. No effect has been given for synergies, if any, that may have been realized through the acquisition.
|
| | | |
| Current assets (excluding cash) | $ | 2,162 |
|
| Property, plant and equipment | 549 |
|
| Current liabilities | (911 | ) |
| Long term liabilities | (3,700 | ) |
| Definite-lived intangible assets | 8,400 |
|
| Goodwill | 10,361 |
|
| Total purchase price allocation | $ | 16,861 |
|
The definite-lived intangible assets acquired arecomposition of trade receivables, net is as follows:
|
| | | | |
| | | Weighted average amortization life (in years) |
| Client relationships | $ | 1,500 |
| 13.0 |
| Proprietary database | 4,100 |
| 11.0 |
| Standard operating procedures | 2,500 |
| 4.0 |
| Trademarks | 300 |
| 12.0 |
| Total definite-lived intangible assets | $ | 8,400 |
| 9.3 |
|
| | | | | | | |
| | December 31, 2016 | | December 26, 2015 |
| | | | |
| | (in thousands) |
| Client receivables | $ | 283,997 |
| | $ | 230,010 |
|
| Unbilled revenue | 82,203 |
| | 45,996 |
|
| Total | 366,200 |
| | 276,006 |
|
| Less: Allowance for doubtful accounts | (2,150 | ) | | (5,938 | ) |
| Trade receivables, net | $ | 364,050 |
| | $ | 270,068 |
|
The definite-lived intangibles are largely attributed to a proprietary database of thousands of species of organisms and the methods and technology to provide accurate, timely and cost-effective microbial identification services. The goodwill resulting from the transaction of $10,361 is primarily attributedRecoveries to the potentialallowance for growth ofdoubtful accounts in fiscal year 2016 were $0.5 million. Provisions to the Company's global EMD productsallowance for doubtful accounts in fiscal years 2015 and services business through the increased competitive advantage2014 were $1.8 million and market penetration provided by the services offered by Accugenix. The goodwill is not deductible for tax purposes.
3. GOODWILL AND OTHER INTANGIBLE ASSETS
$0.5 million, respectively.
The following table displays the gross carrying amount and accumulated amortizationcomposition of definite-lived intangible assets by major class:inventories is as follows:
|
| | | | | | | | | | | | | | | |
| | December 28, 2013 | | December 29, 2012 |
| | Gross carrying amount | | Accumulated amortization | | Gross carrying amount | | Accumulated amortization |
| Backlog | $ | 2,916 |
| | $ | (2,507 | ) | | $ | 2,875 |
| | $ | (2,375 | ) |
| Client relationships | 311,507 |
| | (238,002 | ) | | 305,178 |
| | (231,902 | ) |
| Client contracts | 15,633 |
| | (15,633 | ) | | 15,366 |
| | (15,366 | ) |
| Trademarks and trade names | 5,399 |
| | (4,997 | ) | | 5,326 |
| | (4,821 | ) |
| Standard operating procedures | 2,754 |
| | (1,498 | ) | | 2,751 |
| | (863 | ) |
| Other identifiable intangible assets | 10,432 |
| | (4,905 | ) | | 10,033 |
| | (4,718 | ) |
| Total definite-lived intangible assets | $ | 348,641 |
| | $ | (267,542 | ) | | $ | 341,529 |
| | $ | (260,045 | ) |
|
| | | | | | | |
| | December 31, 2016 | | December 26, 2015 |
| | | | |
| | (in thousands) |
| Raw materials and supplies | $ | 18,893 |
| | $ | 15,998 |
|
| Work in process | 13,681 |
| | 12,101 |
|
| Finished products | 63,259 |
| | 65,636 |
|
| Inventories | $ | 95,833 |
| | $ | 93,735 |
|
The composition of other current assets is as follows:
Additionally, as of December 28, 2013 and December 29, 2012, other intangible assets, net, consisted of $3,438 of indefinite-lived intangible assets. |
| | | | | | | |
| | December 31, 2016 | | December 26, 2015 |
| | | | |
| | (in thousands) |
| Investments | $ | 3,771 |
| | $ | 20,516 |
|
| Prepaid income tax | 40,705 |
| | 26,350 |
|
| Restricted cash | 532 |
| | 271 |
|
| Other | — |
| | 149 |
|
| Other current assets | $ | 45,008 |
| | $ | 47,286 |
|
CHARLES RIVER LABORATORIES INTERNATIONAL, INC.
NOTES TO CONSOLIDATED FINANCIAL STATEMENTS (Continued)
(dollars
The composition of property, plant and equipment, net is as follows:
|
| | | | | | | |
| | December 31, 2016 | | December 26, 2015 |
| | | | |
| | (in thousands) |
| Land | $ | 47,392 |
| | $ | 39,846 |
|
Buildings (1) | 784,129 |
| | 713,841 |
|
| Machinery and equipment | 403,123 |
| | 362,695 |
|
| Leasehold improvements | 47,071 |
| | 41,477 |
|
| Furniture and fixtures | 24,148 |
| | 21,783 |
|
| Computer hardware and software | 127,283 |
| | 113,466 |
|
| Vehicles | 4,118 |
| | 3,819 |
|
| Construction in progress | 24,703 |
| | 25,845 |
|
| Total | 1,461,967 |
| | 1,322,772 |
|
| Less: Accumulated depreciation | (706,140 | ) | | (644,813 | ) |
| Property, plant and equipment, net | $ | 755,827 |
| | $ | 677,959 |
|
(1) The balances as of December 31, 2016 and December 26, 2015 include capital lease buildings. See Note 7, “Long-Term Debt and Capital Lease Obligations.”
Depreciation expense in thousands, except per share amounts)fiscal years 2016, 2015 and 2014 was $85.0 million, $70.7 million and $70.5 million, respectively.
The composition of other assets is as follows:
|
| | | | | | | |
| | December 31, 2016 | | December 26, 2015 |
| | | | |
| | (in thousands) |
| Life insurance policies | $ | 29,456 |
| | $ | 27,554 |
|
| Venture capital investments | 45,331 |
| | 32,730 |
|
| Restricted cash | 1,736 |
| | 1,745 |
|
| Other | 11,907 |
| | 9,614 |
|
| Other assets | $ | 88,430 |
| | $ | 71,643 |
|
The composition of other current liabilities is as follows:
|
| | | | | | | |
| | December 31, 2016 | | December 26, 2015 |
| | | | |
| | (in thousands) |
| Accrued income taxes | $ | 25,621 |
| | $ | 12,168 |
|
| Other | 879 |
| | 376 |
|
| Other current liabilities | $ | 26,500 |
| | $ | 12,544 |
|
The composition of other long-term liabilities is as follows:
|
| | | | | | | |
| | December 31, 2016 | | December 26, 2015 |
| | | | |
| | (in thousands) |
| Long-term pension liability | $ | 89,984 |
| | $ | 34,604 |
|
| Accrued executive supplemental life insurance retirement plan and deferred compensation plan | 32,880 |
| | 30,188 |
|
| Other | 36,375 |
| | 24,270 |
|
| Other long-term liabilities | $ | 159,239 |
| | $ | 89,062 |
|
CHARLES RIVER LABORATORIES INTERNATIONAL, INC.
NOTES TO CONSOLIDATED FINANCIAL STATEMENTS (Continued)
4. VENTURE CAPITAL INVESTMENTS AND MARKETABLE SECURITIES
Venture Capital Investments
During fiscal years 2016, 2015, and 2014, the Company recognized gains related to the venture capital investments of $10.3 million, $3.8 million and $9.3 million, respectively. The Company’s total commitment to these entities as of December 31, 2016 was $84.8 million, of which the Company had funded $38.2 million as of December 31, 2016. During fiscal years 2016, 2015, and 2014, the Company received dividends totaling $7.1 million, $7.3 million, and $7.4 million, respectively. As of December 31, 2016 and December 26, 2015, the Company’s consolidated retained earnings (accumulated deficit) included $4.4 million and $2.4 million, respectively, of the undistributed earnings related to these entities.
Marketable Securities
The Company held no marketable securities as of December 31, 2016.
The following is a schedulesummary of goodwill by reportable segmentthe Company’s marketable securities, all of which are classified as available-for-sale, as of December 26, 2015:
|
| | | | | | | | | | | | | | | |
| | Amortized Cost | | Gross Unrealized Gains | | Gross Unrealized Losses | | Fair Value |
| | | | | | | | |
| | (in thousands) |
| Mutual fund | $ | 4,650 |
| | $ | — |
| | $ | (141 | ) | | $ | 4,509 |
|
| Total | $ | 4,650 |
| | $ | — |
| | $ | (141 | ) | | $ | 4,509 |
|
During fiscal year 2016, the Company realized non-significant losses and changesreceived proceeds of $4.6 million from the sale of its available-for-sale securities. There were no sales of available-for-sale securities during fiscal year 2015.
CHARLES RIVER LABORATORIES INTERNATIONAL, INC.
NOTES TO CONSOLIDATED FINANCIAL STATEMENTS (Continued)
5. FAIR VALUE
Assets, liabilities, and redeemable noncontrolling interest measured at fair value on a recurring basis are summarized below:
|
| | | | | | | | | | | | | | | |
| | December 31, 2016 |
| | Level 1 | | Level 2 | | Level 3 | | Total |
| | | | | | | | |
| | (in thousands) |
| Cash equivalents | $ | — |
| | $ | 21 |
| | $ | — |
| | $ | 21 |
|
| Other assets: | | | | | | | |
| Life insurance policies | — |
| | 22,121 |
| | — |
| | 22,121 |
|
| Total assets measured at fair value | $ | — |
| | $ | 22,142 |
| | $ | — |
| | $ | 22,142 |
|
| | | | | | | | |
| Other current liabilities: | | | | | | | |
| Contingent consideration | $ | — |
| | $ | — |
| | $ | 3,621 |
| | $ | 3,621 |
|
| Total liabilities measured at fair value | $ | — |
| | $ | — |
| | $ | 3,621 |
| | $ | 3,621 |
|
|
| | | | | | | | | | | | | | | |
| | December 26, 2015 |
| | Level 1 | | Level 2 | | Level 3 | | Total |
| | | | | | | | |
| | (in thousands) |
| Cash equivalents | $ | — |
| | $ | 190 |
| | $ | — |
| | $ | 190 |
|
| Other current assets: | | | | | | | |
| Marketable securities | 4,509 |
| | — |
| | — |
| | 4,509 |
|
| Foreign currency forward contracts | — |
| | 15 |
| | — |
| | 15 |
|
| Other assets: | | | | | | | |
| Life insurance policies | — |
| | 20,364 |
| | — |
| | 20,364 |
|
| Total assets measured at fair value | $ | 4,509 |
| | $ | 20,569 |
| | $ | — |
| | $ | 25,078 |
|
| | | | | | | | |
| Other current liabilities: | | | | | | | |
| Contingent consideration | $ | — |
| | $ | — |
| | $ | 1,172 |
| | $ | 1,172 |
|
| Other long-term liabilities: | | | | | | | |
| Contingent consideration | — |
| | — |
| | 198 |
| | 198 |
|
| Redeemable noncontrolling interest | — |
| | — |
| | 28,008 |
| | 28,008 |
|
| Total liabilities and redeemable noncontrolling interest measured at fair value | $ | — |
| | $ | — |
| | $ | 29,378 |
| | $ | 29,378 |
|
During fiscal years 2016 and 2015, there were no transfers between fair value levels.
CHARLES RIVER LABORATORIES INTERNATIONAL, INC.
NOTES TO CONSOLIDATED FINANCIAL STATEMENTS (Continued)
Contingent Consideration
The following table provides a rollforward of the contingent consideration related to previous business acquisitions. See Note 2, “Business Acquisitions.”
|
| | | | | | | |
| | Fiscal Year |
| | 2016 | | 2015 |
| | | | |
| | (in thousands) |
| Beginning balance | $ | 1,370 |
| | $ | 2,828 |
|
| Additions | 3,600 |
| | 973 |
|
| Payments | (872 | ) | | (600 | ) |
| Total gains or losses (realized/unrealized): | | | |
| Reversal of previously recorded contingent liability and change in fair value | (477 | ) | | (1,831 | ) |
| Ending balance | $ | 3,621 |
| | $ | 1,370 |
|
The unobservable inputs used in the gross carrying amountfair value measurement of the Company’s contingent consideration are the probabilities of successful achievement of certain financial targets and accumulated amortizationa discount rate. Increases or decreases in any of the probabilities of success would result in a higher or lower fair value measurement, respectively. Increases or decreases in the discount rate would result in a lower or higher fair value measurement, respectively.
Debt Instruments
The book value of the Company’s term and revolving loans, which are variable rate loans carried at amortized cost, approximates their fair value based on current market pricing of similar debt. As the fair value is based on significant other observable inputs, including current interest and foreign currency exchange rates, it is deemed to be Level 2 within the fair value hierarchy.
Redeemable Noncontrolling Interest
The Company’s redeemable noncontrolling interest resulted from the acquisition of an interest in Vital River in January 2013 and July 2016.
The following table provides a rollforward of the fair value of the Company’s redeemable noncontrolling interest for fiscal year 2015:
|
| | | |
| | Redeemable Noncontrolling Interest |
| | (in thousands) |
| December 27, 2014 | $ | 28,419 |
|
| Total gains or losses (realized/unrealized): | |
| Net income attributable to noncontrolling interest | 838 |
|
| Foreign currency translation | (1,066 | ) |
| Change in fair value, included in additional paid-in capital | (183 | ) |
| December 26, 2015 | 28,008 |
|
| Total gains or losses (realized/unrealized): | |
| Net income attributable to noncontrolling interest | 320 |
|
| Foreign currency translation | (653 | ) |
| Change in fair value, included in additional paid-in capital | (1,690 | ) |
| July 7, 2016 | $ | 25,985 |
|
Since July 7, 2016, the redeemable noncontrolling interest is no longer reported at fair value. See Note 8, “Equity and Redeemable Noncontrolling Interest.”
CHARLES RIVER LABORATORIES INTERNATIONAL, INC.
NOTES TO CONSOLIDATED FINANCIAL STATEMENTS (Continued)
6. GOODWILL AND INTANGIBLE ASSETS
Goodwill
The following table provides a rollforward of the Company’s goodwill:
|
| | | | | | | | | | | | | | | | | | | | | | | | | | | |
| | | | Adjustments to Goodwill | | | | Adjustments to Goodwill | | |
| | Balance at December 31, 2011 | | Acquisitions | | Foreign Exchange/ Impairment | | Balance at December 29, 2012 | | Acquisitions | | Foreign Exchange/ Impairment | | Balance at December 28, 2013 |
| Research Models and Services | | | | | | | | | | | | | |
| Gross carrying amount | $ | 52,681 |
| | $ | 10,361 |
| | $ | 97 |
| | $ | 63,139 |
| | $ | 19,647 |
| | $ | 765 |
| | $ | 83,551 |
|
| Preclinical Services | | | | | | | | | | | | | |
| Gross carrying amount | 1,149,880 |
| | — |
| | 590 |
| | 1,150,470 |
| | — |
| | 1,680 |
| | 1,152,150 |
|
| Accumulated impairment loss | (1,005,000 | ) | | — |
| | — |
| | (1,005,000 | ) | | — |
| | — |
| | (1,005,000 | ) |
| Total | | | | | | | | | | | | | |
| Gross carrying amount | $ | 1,202,561 |
| | $ | 10,361 |
| | $ | 687 |
| | $ | 1,213,609 |
| | $ | 19,647 |
| | $ | 2,445 |
| | $ | 1,235,701 |
|
| Accumulated impairment loss | (1,005,000 | ) | | | | — |
| | (1,005,000 | ) | | | |
|
| | (1,005,000 | ) |
| Goodwill, net | $ | 197,561 |
| | | | | | $ | 208,609 |
| | | | | | $ | 230,701 |
|
|
| | | | | | | | | | | | | | | | | | | | | | | | | | | | | | | |
| | | | Adjustments to Goodwill | | | | Adjustments to Goodwill | | |
| | December 27, 2014 | | Acquisitions | | Foreign Exchange | | December 26, 2015 | | Acquisitions | | Transfers | | Foreign Exchange | | December 31, 2016 |
| | | | | | | | | | | | | | | | |
| | (in thousands) |
| RMS | $ | 59,196 |
| | $ | — |
| | $ | (1,029 | ) | | $ | 58,167 |
| | $ | — |
| | $ | (342 | ) | | $ | (1,428 | ) | | $ | 56,397 |
|
| DSA | 1,234,302 |
| | 22,146 |
| | (4,398 | ) | | 1,252,050 |
| | 337,872 |
| | — |
| | (21,446 | ) | | 1,568,476 |
|
| Manufacturing | 32,579 |
| | 105,567 |
| | (4,534 | ) | | 133,612 |
| | 46,859 |
| | 342 |
| | (13,169 | ) | | 167,644 |
|
| Gross carrying amount | 1,326,077 |
| |
|
| |
|
| | 1,443,829 |
| |
|
| |
|
| |
|
| | 1,792,517 |
|
| Accumulated impairment loss - DSA | (1,005,000 | ) | | — |
| | — |
| | (1,005,000 | ) | | — |
| | — |
| | — |
| | (1,005,000 | ) |
| Goodwill | $ | 321,077 |
| |
|
| |
|
| | $ | 438,829 |
| |
|
| | | |
|
| | $ | 787,517 |
|
Our annualDuring the second quarter of 2016, the Company revised the composition of its reportable segments to align with the view of the business following its acquisition of WIL Research. See Note 1, "Description of Business and Summary of Significant Accounting Policies." As a result, goodwill was allocated from the Company's RMS reportable segment to its Manufacturing reportable segment, as shown in the preceding table within "transfers." The allocation was based on the fair value of each business group within its original reporting unit relative to the fair value of that reporting unit. In addition, the Company completed an assessment of any potential goodwill impairment assessment has historically been completed atfor all reporting units immediately prior to the beginning of the fourth quarter. reallocation and determined that no impairment existed.
Based on ourthe Company’s step one assessmentgoodwill impairment test for 2013, 2012fiscal years 2016, 2015 and 2011,2014, the fair value of each reporting unit exceeded the reporting unit'sunit’s book value (including allocated goodwill) and, therefore, our goodwill was not impaired.
Intangible Assets, Net
The following table displays intangible assets, net by major class:
|
| | | | | | | | | | | | | | | | | | | | | | | |
| | December 31, 2016 | | December 26, 2015 |
| | Gross | | Accumulated
Amortization | | Net | | Gross | | Accumulated
Amortization | | Net |
| | | | | | | | | | | | |
| | (in thousands) |
| Backlog | $ | 8,370 |
| | $ | (6,390 | ) | | $ | 1,980 |
| | $ | 50,568 |
| | $ | (50,554 | ) | | $ | 14 |
|
| Technology | 71,425 |
| | (14,314 | ) | | 57,111 |
| | 60,350 |
| | (5,911 | ) | | 54,439 |
|
| Trademarks and trade names | 8,177 |
| | (4,124 | ) | | 4,053 |
| | 11,495 |
| | (5,944 | ) | | 5,551 |
|
| Other | 16,775 |
| | (5,628 | ) | | 11,147 |
| | 14,711 |
| | (7,285 | ) | | 7,426 |
|
| Other intangible assets | 104,747 |
| | (30,456 | ) | | 74,291 |
| | 137,124 |
| | (69,694 | ) | | 67,430 |
|
| Client relationships | 519,123 |
| | (198,966 | ) | | 320,157 |
| | 396,537 |
| | (183,163 | ) | | 213,374 |
|
| Intangible assets | $ | 623,870 |
| | $ | (229,422 | ) | | $ | 394,448 |
| | $ | 533,661 |
| | $ | (252,857 | ) | | $ | 280,804 |
|
During fiscal year 2016, the Company determined that the carrying values of certain DSA intangible assets were not recoverable and recorded an impairment charge of $1.9 million, which was included in costs of services provided (excluding amortization of intangible assets).
CHARLES RIVER LABORATORIES INTERNATIONAL, INC.
NOTES TO CONSOLIDATED FINANCIAL STATEMENTS (Continued)
Amortization expense of definite-lived intangible assets, including client relationships, for 2013, 2012fiscal years 2016, 2015 and 20112014 was $17,806, $18,068$41.7 million, $24.2 million and $21,796,$26.0 million, respectively. Amortization of revenue-producing intangible assets is excluded from cost of services.
Estimated amortization expense for intangible assets for each of the next five fiscal years is expected to be as follows:
|
| | | |
| 2014 | $ | 16,396 |
|
| 2015 | 13,281 |
|
| 2016 | 11,351 |
|
| 2017 | 10,057 |
|
| 2018 | 9,181 |
|
|
| | | | |
| Fiscal Year | | Amortization Expense |
| | | (in thousands) |
| 2017 | | $ | 42,525 |
|
| 2018 | | 40,731 |
|
| 2019 | | 34,995 |
|
| 2020 | | 34,382 |
|
| 2021 | | 32,994 |
|
4. RESTRUCTURING AND ASSET IMPAIRMENTS
For the years ended 2013, 2012 and 2011, based on our most recent market outlook, we assessed our long-lived assets for impairment. The assessment included an evaluation of the ongoing cash flows associated with the use of the long lived assets.
In the fourth quarter of 2013, we recorded an asset impairment charge of $3,753, which was included in cost of sales, related to an adjustment to fair value of long-lived assets associated with our PCS Massachusetts facility. The long-lived assets, which include land, building and associated building improvements and equipment, were adjusted to an estimated fair market value of $39,500. In 2010, due to a decrease in demand for preclinical services and excess capacity in the industry, we consolidated our global preclinical facilities and temporarily ceased operations at this facility. As a result, we conducted an impairment test of the facility and adjusted the long-lived asset group to fair market value. We intend to maintain the space in the event additional capacity is needed in the future. Given the change in real estate values for similar properties in the surrounding area, we performed an updated asset impairment test in 2013. We calculated the fair value of the long-lived assets based upon a valuation completed by an independent third party valuation firm specializing in real estate. We utilized a weighted combination of the market value approach, cost replacement approach, and income capitalization approach. The resulting fair value of the asset group was below its book value. Accordingly, we recorded an impairment charge representing the excess of the carrying value of those assets over their respective fair market values. The decrease in fair market value was driven by a general trend in the regional real estate market, which currently favors real estate in Boston metropolitan area and is experiencing a decline in suburban markets. The long-lived assets of the facility are classified as held-for-use and we continue to depreciate these assets over their useful economic life.
During 2013, we implemented a plan to consolidate production in our U.S. research model facilities, which to date has resulted in the abandonment of certain long-lived assets, including a building at one of our facilities in California. As a result of these actions, we recorded $13,531 of accelerated depreciation to cost of sales related to the building based on its revised useful life. Also during 2013 we implemented a plan to consolidate operations within our U.S. Biologics facility, which is a leased facility, resulting in the abandonment of leasehold improvements and associated accelerated depreciation of $1,864, recorded in cost of sales, related to those leasehold improvements. We also recorded in 2013 asset impairments of $449 to cost of sales related to the consolidation of European operations noted in the following paragraph.
In 2012, we commenced a consolidation of certain research model operations in Europe. As a result, we recorded an impairment charge of $3,548 to cost of sales for the disposition of facilities that we own. Following the impairment, the long-lived asset group was classified as held-for-use as we ceased operations over the following several months. We have commenced a search for a buyer of the facility. We continue to utilize the facility in a limited capacity and, accordingly, we have not yet met the criteria for classifying the facility as held-for-sale. Once these conditions are met, we will classify the long-lived assets as held-for-sale, cease depreciation and adjust the assets to fair value quarterly.
In 2011, certain long-lived assets related to facilities in our RMS segment were no longer in use and not expected to be fully recoverable and as a result we recorded an impairment charge of $692 included in cost of sales. In addition, we sold the assets of our PCS-China facility for $4,593 and recognized a gain on the sale of $3,776. Also in 2011, we determined that the carrying value of our in process research and development acquired in the acquisition of SPC exceeded its fair value and as a result we recorded an impairment charge of $6,800 included in selling, general and administrative expenses.
5.7. LONG-TERM DEBT AND CAPITAL LEASE OBLIGATIONS
Long-Term Debt
Long-term debt, net consists of the following:
|
| | | | | | | |
| | December 28, 2013 | | December 29, 2012 |
| 2.25% Senior convertible debentures: | | | |
| Principal | $ | — |
| | $ | 349,995 |
|
| Unamortized debt discount | — |
| | (6,726 | ) |
| Net carrying amount of senior convertible debentures | — |
| | 343,269 |
|
| Term loan facility | 409,500 |
| | 290,947 |
|
| Revolving credit facility | 253,308 |
| | 32,000 |
|
| Other long-term debt | 241 |
| | 232 |
|
| Total debt | 663,049 |
| | 666,448 |
|
| Less: current portion of long-term debt | (21,241 | ) | | (139,373 | ) |
| Long-term debt | $ | 641,808 |
| | $ | 527,075 |
|
|
| | | | | | | |
| | December 31, 2016 | | December 26, 2015 |
| | | | |
| | (in thousands) |
| Term loans | $ | 633,750 |
| | $ | 390,000 |
|
| Revolving credit facility | 578,759 |
| | 446,041 |
|
| Other long-term debt | 185 |
| | 193 |
|
| Total debt | 1,212,694 |
| | 836,234 |
|
| Less: Current portion of long-term debt | (24,560 | ) | | (15,193 | ) |
| Long-term debt | 1,188,134 |
| | 821,041 |
|
| Debt discount and debt issuance costs | (7,633 | ) | | (6,805 | ) |
| Long-term debt, net | $ | 1,180,501 |
| | $ | 814,236 |
|
Minimum future principal paymentsAs of long-termDecember 31, 2016 and December 26, 2015, the weighted average interest rate on the Company’s debt was 1.89% and 1.33%, respectively.
In April 2015, the Company amended and restated the $970M Credit Facility, creating a $1.3 billion facility ($1.3B Credit Facility) that provides for a $400.0 million term loan facility and a $900.0 million multi-currency revolving facility. The interest rates applicable to term loans and revolving loans under the Company’s $1.3B Credit Facility were, at December 28, 2013the Company’s option, equal to either the alternate base rate (which is the higher of (1) the prime rate, (2) the federal funds rate plus 0.5% or (3) the one-month adjusted LIBOR rate plus 1%) or the adjusted LIBOR rate, plus an interest rate margin based upon the Company’s leverage ratio.
On March 30, 2016, the Company amended and restated its $1.3B credit facility creating a $1.65 billion credit facility ($1.65B Credit Facility) which (1) extends the maturity date for the credit facility and (2) makes certain other amendments in connection with the Company’s acquisition of WIL Research. The amendment was accounted for as a debt modification with a partial extinguishment of debt. In connection with the transaction, the Company capitalized approximately $3.3 million and expensed approximately $1.4 million of debt issuance costs.
The $1.65B Credit Facility provides for a $650.0 million term loan and a $1.0 billion multi-currency revolving facility. The term loan facility matures in 19 quarterly installments with the last installment due March 30, 2021. The revolving facility matures on March 30, 2021, and requires no scheduled payment before that date. Under specified circumstances, the Company has the ability to increase the term loan and/or revolving line of credit by up to $500 million in the aggregate.
The interest rates applicable to term loan and revolving loans under the $1.65B Credit Facility are, as follows:at the Company’s option, equal to either the base rate (which is the higher of (1) the prime rate, (2) the federal funds rate plus 0.50%, or (3) the one-month adjusted LIBOR rate plus 1%) or the adjusted LIBOR rate, plus an interest rate margin based upon the Company’s leverage ratio.
|
| | | |
| Fiscal Year | |
| 2014 | $ | 21,241 |
|
| 2015 | 42,000 |
|
| 2016 | 47,250 |
|
| 2017 | 68,250 |
|
| 2018 | 484,308 |
|
| Total | $ | 663,049 |
|
CHARLES RIVER LABORATORIES INTERNATIONAL, INC.
NOTES TO CONSOLIDATED FINANCIAL STATEMENTS (Continued)
(dollars in thousands, except per share amounts)
On May 29, 2013, we amended and restated our credit agreement dated September 23, 2011 to repay loans outstanding under the previous agreement, to retire our 2.25% Senior Convertible Debentures (the "2013 Notes") and to extend the maturity date of our credit agreement under a new $970,000 agreement (the "$970M Credit Facility"). The $970M Credit Facility provides a $420,000 U.S. term loan facility (the "Term Loan") and a $550,000 multi-currency revolving credit facility (the "Credit Facility"). The revolving credit facility may be drawn in U.S. Dollars, Euros, Pound Sterling, or Japanese Yen, subject to sub-limits by currency. Under specified circumstances, we have the ability to expand the term loan and/or revolving credit facility by up to $350,000 in the aggregate.
The $420,000 U.S. term loan matures in quarterly installments through maturity on May 29, 2018. The revolving credit facility also matures on May 29, 2018 and requires no scheduled payment before this date. The interest rates applicable to our term loans and revolving loans under the credit agreement are variable and based on an applicable rate plus a spread determined by our leverage ratio. As of December 28, 2013, the interest rate spread for adjusted LIBOR loans was 1.25%.
The $970M$1.65B Credit Facility includes certain customary representations and warranties, events of default, notices of material adverse changes to ourthe Company’s business and negative and affirmative covenants. As of December 28, 2013, we were compliant with all financial covenants. These covenants include (1) maintenance of a ratio of consolidated earnings before interest, taxes, depreciation and amortization (EBITDA) less capital expenditures to consolidated cash interest expense, for any period of four consecutive fiscal quarters, of no less than 3.53.50 to 1.0 as well as (2) maintenance of a ratio of consolidated indebtedness to consolidated earnings before interest, taxes, depreciation and amortizationEBITDA for any period of four consecutive fiscal quarters, of no more than 3.75 to 1.0. In addition, we must maintain a ratio of consolidated indebtedness to quarterly consolidated earnings before interest, taxes, depreciation and amortization of 3.54.25 to 1.0 for our first and second fiscal quarters of 2014 and of 3.25with step downs to 3.50 to 1.0 for each fiscalby the last day of the fourth quarter thereafter. Ourof 2017. As of December 31, 2016, the Company was compliant with all covenants.
The obligations of the Company under the credit agreement$1.65B Credit Facility are guaranteed by our material domestic subsidiaries and are securedcollateralized by substantially all of ourthe assets including a pledge of 100% of the capital stockCompany.
Principal maturities of our domestic subsidiaries (other thanexisting debt for the capital stock of any domestic subsidiary that is treated as a disregarded entity for U.S. federal income tax purposes) and 65% of the capital stock of certain first-tier foreign subsidiaries and domestic disregarded entities, and mortgages on owned real propertyperiods set forth in the U.S. having a book value in excesstable below, are as follows:
|
| | | | |
| | | Principal |
| | | (in thousands) |
| 2017 | | $ | 24,560 |
|
| 2018 | | 36,563 |
|
| 2019 | | 52,813 |
|
| 2020 | | 81,250 |
|
| 2021 | | 1,017,508 |
|
| Total | | $ | 1,212,694 |
|
Letters of $10,000. WeCredit
As of both December 31, 2016 and December 26, 2015, the Company had $4,855$4.9 million outstanding under letters of creditcredit.
Capital Lease Obligations
The Company acquired a build-to-suit lease as part of December 28, 2013.
As noted above, our 2013 Notes were retired fromits acquisition of Argenta and BioFocus. In accordance with accounting guidance applicable to entities involved with the proceedsconstruction of an asset that will be leased when the construction is completed, the Company was considered the owner, for accounting purposes, of this property during the construction period. Accordingly, the Company recorded an asset and a corresponding financing obligation on its consolidated balance sheet for the amount of total project costs incurred related to the construction in progress for this property through completion of the $970M Credit Facility and available cash and were done without triggering anyconstruction period. Upon completion of the conversion features. As a resultconstruction during the second quarter of fiscal year 2015, the Company determined that it was no longer considered the owner of the refinancingproperty because it did not have continuing involvement. Consequently, the Company recorded a successful sale leaseback and derecognized the property and the associated modificationfinancing obligation from the Company’s consolidated balance sheet and extinguishmentrecorded a capital lease asset and a corresponding liability of $35.8 million.
As of December 31, 2016, the previous debt agreement, we recognized an extinguishment loss of $389, which is included in interest expense.
We haveminimum lease payments under capital leases for equipment. These leases are capitalized using interest rates considered appropriate ateach of the inception of each lease. Capital lease obligations amounted to $740next five years and $72 at December 28, 2013 and December 29, 2012, respectively.total thereafter were as follows:
|
| | | | |
| | | Minimum Lease Payments |
| | | (in thousands) |
| 2017 | | $ | 4,097 |
|
| 2018 | | 3,503 |
|
| 2019 | | 3,005 |
|
| 2020 | | 2,385 |
|
| 2021 | | 2,250 |
|
| Thereafter | | 27,974 |
|
| Total | | $ | 43,214 |
|
CHARLES RIVER LABORATORIES INTERNATIONAL, INC.
NOTES TO CONSOLIDATED FINANCIAL STATEMENTS (Continued)
6.8. EQUITY
AND REDEEMABLE NONCONTROLLING INTEREST
Earnings Per Share
BasicThe following table reconciles the numerator and denominator in the computations of basic and diluted earnings per share for 2013, 2012 and 2011 was computed by dividing earnings available to common shareholders for these periods by the weighted average number of common shares outstanding in the respective periods. Diluted earnings per share for these periods was computed by dividing earnings available to common shareholders by the weighted average number of common shares outstanding for each period adjusted for the dilutive effect outstanding stock options and unvested restricted stock. share:
|
| | | | | | | | | | | |
| | Fiscal Year |
| | 2016 | | 2015 | | 2014 |
| | | | | | |
| | (in thousands) |
| Numerator: | | | | | |
| Income from continuing operations, net of income taxes | $ | 156,086 |
| | $ | 152,037 |
| | $ | 129,924 |
|
| Income (loss) from discontinued operations, net of income taxes | 280 |
| | (950 | ) | | (1,726 | ) |
| Less: Net income attributable to noncontrolling interests | 1,601 |
| | 1,774 |
| | 1,500 |
|
| Net income attributable to common shareholders | $ | 154,765 |
| | $ | 149,313 |
| | $ | 126,698 |
|
| | | | | | |
| Denominator: | | | | | |
| Weighted-average shares outstanding—Basic | 47,014 |
| | 46,496 |
| | 46,627 |
|
| Effect of dilutive securities: | | | | | |
| Stock options, restricted stock units, performance share units and restricted stock | 944 |
| | 1,138 |
| | 931 |
|
| Weighted-average shares outstanding—Diluted | 47,958 |
| | 47,634 |
| | 47,558 |
|
Options to purchase 2,288,926approximately 0.8 million shares, 4,590,9250.5 million shares, and 4,249,5640.6 million shares were outstanding at December 28, 2013for fiscal years 2016, 2015 and 2014, respectively, as well as a non-significant number of restricted stock, restricted stock units (RSUs), December 29, 2012and December 31, 2011performance share units (PSUs), respectively, but were not included in computing diluted earnings per share because their inclusion would have been anti-dilutive. In addition,Basic weighted average shares outstanding for 2013, 2012fiscal years 2016, 2015 and 20112014 excluded the weighted average impact of 1,096,550, 934,505approximately 1.1 million shares, 1.1 million shares, and 703,0111.2 million shares, respectively, of non-vested fixed restricted stock, awards.restricted stock units, and PSUs.
Treasury Shares
67In July 2010, the Company’s Board of Directors authorized a $500.0 million stock repurchase program, and subsequently approved increases to the stock repurchase program of $250.0 million in 2010, $250.0 million in 2013 and $150.0 million in 2014, for an aggregate authorization of $1,150.0 million. Under its authorized stock repurchase program, the Company did not repurchase any shares in fiscal year 2016, and repurchased approximately 1.5 million shares for $108.8 million and approximately 2.1 million shares for $110.6 million in fiscal years 2015 and 2014, respectively. As of December 31, 2016, the Company had $69.7 million remaining on the authorized stock repurchase program. In addition, the Company’s stock-based compensation plans permit the netting of common stock upon vesting of restricted stock, restricted stock units and performance share units in order to satisfy individual minimum statutory tax withholding requirements. The Company acquired approximately 0.2 million shares for $12.3 million, approximately 0.1 million shares for $8.7 million, and approximately 0.1 million shares for $6.8 million in fiscal years 2016, 2015 and 2014, respectively, to satisfy individual minimum statutory tax withholding requirements.
CHARLES RIVER LABORATORIES INTERNATIONAL, INC.
NOTES TO CONSOLIDATED FINANCIAL STATEMENTS (Continued)
(dollars in thousands, except per share amounts)
Accumulated Other Comprehensive Income (Loss)
The following table illustrates the reconciliationChanges to each component of the numerator and denominator in the computationsaccumulated other comprehensive income (loss), net of the basic and diluted earnings per share:income taxes, are as follows:
|
| | | | | | | | | | | |
| | December 28, 2013 | | December 29, 2012 | | December 31, 2011 |
| Numerator: | | | | | |
| Income from continuing operations for purposes of calculating earnings per share | $ | 104,093 |
| | $ | 101,547 |
| | $ | 115,111 |
|
| Income (loss) from discontinued businesses | $ | (1,265 | ) | | $ | (4,252 | ) | | $ | (5,545 | ) |
| Denominator: | | | | | |
| Weighted-average shares outstanding—Basic | 47,740,167 |
| | 47,912,135 |
| | 50,823,063 |
|
| Effect of dilutive securities: | | | | | |
| Stock options and contingently issued restricted stock | 749,155 |
| | 494,185 |
| | 495,179 |
|
| Weighted-average shares outstanding—Diluted | 48,489,322 |
| | 48,406,320 |
| | 51,318,242 |
|
| Basic earnings per share from continuing operations attributable to common shareholders | $ | 2.18 |
| | $ | 2.12 |
| | $ | 2.26 |
|
| Basic earnings (loss) per share from discontinued operations attributable to common shareholders | $ | (0.03 | ) | | $ | (0.09 | ) | | $ | (0.11 | ) |
| Diluted earnings per share from continuing operations attributable to common shareholders | $ | 2.15 |
| | $ | 2.10 |
| | $ | 2.24 |
|
| Diluted earnings (loss) per share from discontinued operations attributable to common shareholders | $ | (0.03 | ) | | $ | (0.09 | ) | | $ | (0.11 | ) |
|
| | | | | | | | | | | |
| | Foreign Currency Translation and Other(3) | | Pension and Other Post-Retirement Benefit Plans | | Total |
| | | | | | |
| | (in thousands) |
| December 27, 2014 | $ | (19,891 | ) | | $ | (54,356 | ) | | $ | (74,247 | ) |
Other comprehensive loss before reclassifications (1) | (60,745 | ) | | (302 | ) | | (61,047 | ) |
| Amounts reclassified from accumulated other comprehensive income (loss) | (2,341 | ) | | 2,617 |
| | 276 |
|
| Net current period other comprehensive income (loss) | (63,086 | ) | | 2,315 |
| | (60,771 | ) |
| Income tax expense | — |
| | 530 |
| | 530 |
|
| December 26, 2015 | (82,977 | ) | | (52,571 | ) | | (135,548 | ) |
Other comprehensive loss before reclassifications (2) | (71,618 | ) | | (60,678 | ) | | (132,296 | ) |
| Amounts reclassified from accumulated other comprehensive income (loss) | — |
| | 1,711 |
| | 1,711 |
|
| Net current period other comprehensive income (loss) | (71,618 | ) | | (58,967 | ) | | (130,585 | ) |
| Income tax expense (benefit) | — |
| | (12,369 | ) | | (12,369 | ) |
| December 31, 2016 | $ | (154,595 | ) | | $ | (99,169 | ) | | $ | (253,764 | ) |
(1) The impact of the foreign currency translation adjustment to other comprehensive income (loss) before reclassifications for fiscal year 2015 was primarily due to the effect of changes in foreign currency exchange rates of the Euro and Canadian Dollar and to a lesser extent due to the impact of changes in the British Pound. |
(2) The impact of the foreign currency translation adjustment to other comprehensive income (loss) before reclassifications for fiscal year 2016 was primarily due to the effect of changes in foreign currency exchange rates of the Euro, British Pound, and Canadian Dollar and to a lesser extent due to the impact of changes in the Chinese Yuan Renminbi and Japanese Yen. |
(3) Foreign currency translation and other includes a non-significant amount of unrealized gains (losses) on available-for-sale marketable securities. |
Nonredeemable Noncontrolling Interests
The sumCompany has investments in several entities, whose financial results are consolidated in the Company’s financial statements, as it has the ability to exercise control over these entities. The interests of the earnings per share from continuing operations attributable to common shareholders and the earnings (loss) per share from discontinued operations attributable to common shareholders does not necessarily equal the earnings (loss) per share from net income attributable to common shareholdersrespective noncontrolling parties in the consolidated statements of operations due to rounding.these entities have been recorded as nonredeemable noncontrolling interests.
Treasury SharesRedeemable Noncontrolling Interest
The Company's Board of Directors has authorized an aggregate stock repurchase program of $1,000,000, which includes $750,000 approved in 2010 and $250,000 approved in 2013. As of December 28,In January 2013, the Company had $139,099acquired a 75% ownership interest of remaining authorization under this stock repurchase program. In order to enable us to facilitate, onVital River, a more timelycommercial provider of research models and cost efficient basis,related services in China, for $24.2 million, net of $2.7 million of cash acquired. Concurrent with the repurchase of a substantial number of our shares pursuant to that stock repurchase authorization, we entered into a series of accelerated stock repurchase (ASR) programs in 2010 and 2011. The ASR programs are recorded as two transactions allocated betweenacquisition, the initial purchase of treasury stock and a forward contract indexed to our common stock. The treasury shares result in an immediate reduction of shares on our statement of financial position and in our EPS calculation.
On August 26, 2010, weCompany entered into an agreement with the noncontrolling interest holders that provided the Company with the right to purchase, and the noncontrolling interest holders with the right to sell, the remaining 25% of the entity for cash at its fair value beginning in January 2016.
On July 7, 2016, the Company purchased an additional 12% equity interest in Vital River for $10.8 million, resulting in total ownership of 87%. The Company recorded a third party investment bank to implement an ASR program to repurchase $300,000 of common stock. Under this ASR, we paid $300,000 on August 27, 2010 from cash on hand and available liquidity, including funds borrowed by us under our $750,000 credit facility. The ASR was settled on February 11, 2011 based on a discount$1.6 million gain in equity equal to the daily volume weighted average price (VWAP)excess fair value of our common stockthe 12% equity interest over the coursepurchase price. Concurrent with the transaction, the original agreement was amended providing the Company with the right to purchase, and the noncontrolling interest holders with the right to sell, the remaining 13% equity interest at a contractually defined redemption value, subject to a redemption floor (embedded derivative). These rights are exercisable beginning in 2019 and are accelerated in certain events. The Company recorded a charge of a calculation period. We received$1.5 million in other income (expense), net, equal to the final 871,829 sharesexcess fair value of the hybrid instrument (equity interest with an embedded derivative) over the fair value of the 13% equity interest. The redeemable noncontrolling interest is measured at the greater of the amount that would be paid if settlement occurred as of the balance sheet date based on the settlementcontractually defined redemption value ($14.1 million as of the ASR, which were recorded at $32,509.
On February 24, 2011, we entered into an ASR to repurchase $150,000 of common stock. Under the ASR, we paid $150,000 from cash on hand, including funds borrowed under our credit facility. Upon signing the ASR on February 24, 2011, we received the initial delivery of 3,759,398 shares, which was recorded at $135,860 based on the market value at the date of the transaction,December 31, 2016) and recorded $14,140 as a forward contract indexed to our common stock. The ASR was settled on May 16, 2011 based on a discountits carrying amount adjusted for net income (loss) attributable to the daily volume weighted average price (VWAP) of our common stock overnoncontrolling interest. As the course of a calculation period. We received the final 6,505 shares based on the settlement of the ASR, which were recorded at $257.
During 2013, 2012 and 2011, we repurchased 3,468,031 shares of common stock for $165,717, 1,705,521 shares of common stock for $61,442 and 3,790,762 shares of common stock for $130,853, respectively, under our Rule 10b5-1 Purchase Plans and in open market trading. The timing and amount of any future repurchases will depend on market conditions and corporate considerations.
CHARLES RIVER LABORATORIES INTERNATIONAL, INC.
NOTES TO CONSOLIDATED FINANCIAL STATEMENTS (Continued)
(dollars in thousands, except per share amounts)
Share repurchases through ASR programs and open market purchases during 2013, 2012 and 2011 were as follows:
|
| | | | | | | | | | | |
| | Fiscal Year Ended |
| | December 28, 2013 | | December 29, 2012 | | December 31, 2011 |
| Number of shares of common stock repurchased | 3,468,031 |
| | 1,705,521 |
| | 8,428,494 |
|
| Total cost of repurchase | $ | 165,717 |
| | $ | 61,442 |
| | $ | 299,479 |
|
Additionally, our 2000 Incentive Plan permits the netting of common stock upon vesting of restricted stock awards in order to satisfy individual tax withholding requirements. During the fiscal year ended December 28, 2013, December 29, 2012 and December 31, 2011, we acquired shares 113,424 for $4,554, 84,250 shares for $3,047 and 79,704 shares for $2,942, respectively, as a result of such withholdings.
Accumulated Deficit
None of our accumulated deficit is restricted due to statutory requirements in the local jurisdiction of a foreign subsidiary as of December 28, 2013 and December 29, 2012.
Accumulated Other Comprehensive Income
The composition of accumulated other comprehensive income is as follows:
|
| | | | | | | | | | | | | | | |
| | Foreign Currency Translation Adjustment | | Pension Gains/(Losses) and Prior Service (Cost)/Credit Not Yet Recognized as Components of Net Periodic Benefit Costs | | Net Unrealized Gain on Marketable Securities | | Accumulated Other Comprehensive Income |
| Balance at December 31, 2011 | $ | 38,685 |
| | $ | (33,171 | ) | | $ | (921 | ) | | $ | 4,593 |
|
| Period change | 5,274 |
| | (5,862 | ) | | 921 |
| | 333 |
|
| Tax | 98 |
| | 1,579 |
| | — |
| | 1,677 |
|
| Balance at December 29, 2012 | $ | 44,057 |
| | $ | (37,454 | ) | | $ | — |
| | $ | 6,603 |
|
| Period change | (15,751 | ) | | 22,310 |
| | — |
| | 6,559 |
|
| Tax | 197 |
| | (8,002 | ) | | — |
| | (7,805 | ) |
| Balance at December 28, 2013 | $ | 28,503 |
| | $ | (23,146 | ) | | $ | — |
| | $ | 5,357 |
|
Warrants
Separately and concurrently with the pricing of the 2013 Notes in June 2006, we issued warrants for approximately 7,200,000 shares of our common stock. The warrants give the holders the right to receive, for no additional consideration, cash or shares, at our option, with a value equal to the appreciation in the price of our shares above $59.63 and expire between September 13, 2013 and January 22, 2014 over 90 equal increments. As of December 28, 2013, warrants for approximately 1,271,459 shares were outstanding and none were subsequently exercised.
Noncontrolling Interests
A noncontrolling interest resulted from our acquisition of a 75% ownership interest in Vital River. We entered into a joint venture agreement with the noncontrolling interest holders that provides us withhave the right to purchase, and the noncontrolling interest has the rightability to require usthe Company to purchase the remaining 25% of the entity for cash at its then appraised fair value beginning in January 2016. See Note 2 for additional information. As13% interest, the noncontrolling interest holders can require us to purchaseis classified in the remaining 25% interest for cash, we classify the carrying amountmezzanine section of the noncontrolling interestconsolidated balance sheet, which is presented above the equity section and below liabilities onliabilities. The agreement does not limit the consolidated balance sheet and we adjustamount that the carrying amountCompany could be required to fair value atpay to purchase the end of each reporting period. Adjustments to fair value are recorded through additional paid-in capital. remaining 13% equity interest.
The carrying valuefollowing table provides a rollforward of the Vital RiverCompany’s redeemable noncontrolling interest is $20,581 at December 28, 2013.subsequent to the acquisition of the additional 12% equity interest on July 7, 2016:
We hold investments in several joint ventures. These joint ventures are separate legal entities whose purpose is consistent with our overall operations and represent geographic and business segment expansions of existing markets. The financial results of all joint ventures were consolidated in our results as we have |
| | | |
| | Redeemable Noncontrolling Interest |
| | (in thousands) |
| July 7, 2016 | $ | 25,985 |
|
| Purchase of 12% equity interest | (12,360 | ) |
| Total gains or losses (realized/unrealized): | |
| Net income attributable to noncontrolling interest | 357 |
|
| Foreign currency translation | (818 | ) |
| Modification of 13% purchase option | 1,495 |
|
| December 31, 2016 | $ | 14,659 |
|
See Note 5, “Fair Value,” for the ability to exercise control over these entities. The interests of
CHARLES RIVER LABORATORIES INTERNATIONAL, INC.
NOTES TO CONSOLIDATED FINANCIAL STATEMENTS (Continued)
(dollars in thousands, except per share amounts)
activity within the outside joint venture partners in these joint ventures have been recorded asredeemable noncontrolling interest totaling $3,093 and $2,395 at December 28, 2013 and December 29, 2012, respectively.prior to July 7, 2016.
7.9. INCOME TAXES
An analysis of theThe components of income from continuing operations before income taxes and the related provision for income taxes isare presented below:
| | | | Fiscal Year Ended | Fiscal Year |
| | December 28, 2013 | | December 29, 2012 | | December 31, 2011 | 2016 | | 2015 | | 2014 |
| Income from continuing operations before income taxes | | | | | | |
| | | | | | | |
| | | (in thousands) |
| Income from continuing operations before income taxes: | | |
| | | | |
| U.S. | $ | 39,900 |
| | $ | 35,504 |
| | $ | 47,158 |
| $ | 59,255 |
| | $ | 76,157 |
| | $ | 71,002 |
|
| Non-U.S. | 98,427 |
| | 94,242 |
| | 85,504 |
| 163,666 |
| | 119,271 |
| | 106,593 |
|
| | $ | 138,327 |
| | $ | 129,746 |
| | $ | 132,662 |
| $ | 222,921 |
| | $ | 195,428 |
| | $ | 177,595 |
|
| Income tax provision | | | | | | |
| Income tax provision: | | |
| | | | |
| Current: | | | | | | |
| | | | |
| Federal | $ | 10,832 |
| | $ | (1,447 | ) | | $ | 3,957 |
| $ | 18,592 |
| | $ | 23,687 |
| | $ | 13,733 |
|
| Foreign | 18,370 |
| | 26,411 |
| | 20,727 |
| 39,829 |
| | 8,572 |
| | 20,364 |
|
| State and local | 4,240 |
| | 1,353 |
| | 1,124 |
| |
| State | | 5,263 |
| | 6,819 |
| | 4,746 |
|
| Total current | $ | 33,442 |
| | $ | 26,317 |
| | $ | 25,808 |
| 63,684 |
| | 39,078 |
| | 38,843 |
|
| Deferred: | | | | | | |
| | | | |
| Federal | $ | 5,468 |
| | $ | 13,132 |
| | $ | 2,961 |
| 7,206 |
| | 1,790 |
| | 12,982 |
|
| Foreign | (6,431 | ) | | (12,683 | ) | | (11,649 | ) | (4,024 | ) | | 3,064 |
| | (4,672 | ) |
| State and local | 432 |
| | 862 |
| | 20 |
| |
| State | | (31 | ) | | (541 | ) | | 518 |
|
| Total deferred | $ | (531 | ) | | $ | 1,311 |
| | $ | (8,668 | ) | 3,151 |
| | 4,313 |
| | 8,828 |
|
| | $ | 32,911 |
| | $ | 27,628 |
| | $ | 17,140 |
| $ | 66,835 |
| | $ | 43,391 |
| | $ | 47,671 |
|
Net deferred taxes, detailed below, recognize the impact of temporary differences between the amounts of assets and liabilities recorded for financial statement purposes and such amounts measured in accordance with tax laws.
|
| | | | | | | |
| | December 28, 2013 | | December 29, 2012 |
| Compensation | $ | 38,836 |
| | $ | 52,668 |
|
| Accruals and reserves | 2,356 |
| | 2,160 |
|
| Inventory reserves and valuations | 1,696 |
| | 3,663 |
|
| Financing related | 1,594 |
| | 2,545 |
|
| Goodwill and other intangibles | (21,826 | ) | | (14,982 | ) |
| Net operating loss and credit carryforwards | 58,891 |
| | 55,067 |
|
| Depreciation related | (22,389 | ) | | (37,212 | ) |
| Non-indefinitely reinvested earnings | — |
| | (146 | ) |
| Investments in limited partnerships | (2,720 | ) | | (405 | ) |
| Other | (1,640 | ) | | (839 | ) |
| | 54,798 |
| | 62,519 |
|
| Valuation allowance | (7,071 | ) | | (7,504 | ) |
| Total deferred taxes | $ | 47,727 |
| | $ | 55,015 |
|
CHARLES RIVER LABORATORIES INTERNATIONAL, INC.
NOTES TO CONSOLIDATED FINANCIAL STATEMENTS (Continued)
(dollars in thousands, except per share amounts)
The components of deferred tax assets and liabilities are as follows:
|
| | | | | | | |
| | December 31, 2016 | | December 26, 2015 |
| | | | |
| | (in thousands) |
| Deferred tax assets: | | | |
| Compensation | $ | 70,863 |
| | $ | 55,259 |
|
| Accruals and reserves | 8,103 |
| | 8,941 |
|
| Inventory reserves and valuations | 3,447 |
| | 2,022 |
|
| Financing related | — |
| | 902 |
|
| Net operating loss and credit carryforwards | 58,081 |
| | 35,233 |
|
| Other | 2,921 |
| | 2,593 |
|
| Valuation allowance | (10,101 | ) | | (6,112 | ) |
| Total deferred tax assets | 133,314 |
| | 98,838 |
|
| Deferred tax liabilities: | | | |
| Goodwill and other intangibles | (121,256 | ) | | (73,208 | ) |
| Financing related | (854 | ) | | — |
|
| Depreciation related | (32,271 | ) | | (23,664 | ) |
| Venture capital investments | (5,084 | ) | | (3,570 | ) |
| Foreign withholding taxes | (821 | ) | | (6,590 | ) |
| Total deferred tax liabilities | (160,286 | ) | | (107,032 | ) |
| Net deferred taxes | $ | (26,972 | ) | | $ | (8,194 | ) |
Reconciliations of the statutory U.S. Federal income tax rate to effective tax rates are as follows:
| | | | | | | | | | Fiscal Year |
| | December 28, 2013 | | December 29, 2012 | | December 31, 2011 | 2016 | | 2015 | | 2014 |
| U.S. statutory income tax rate | 35.0 | % | | 35.0 | % | | 35.0 | % | 35.0 | % | | 35.0 | % | | 35.0 | % |
| Foreign tax rate differences | (8.0 | )% | | (8.0 | )% | | (6.7 | )% | (10.3 | )% | | (8.6 | )% | | (9.4 | )% |
| State income taxes, net of Federal tax benefit | 1.6 | % | | 1.5 | % | | 2.1 | % | 1.6 | % | | 1.9 | % | | 1.9 | % |
| Unbenefitted losses and changes in valuation allowance | 0.4 | % | | 0.8 | % | | 0.6 | % | |
| Impact of repatriation of non-U.S. earnings | — | % | | — | % | | 0.5 | % | |
| Research tax credits and enhanced deductions | (6.6 | )% | | (8.2 | )% | | (7.6 | )% | (3.5 | )% | | (2.6 | )% | | (4.1 | )% |
| Enacted tax rate changes | (0.4 | )% | | (0.2 | )% | | (1.0 | )% | (0.8 | )% | | (1.5 | )% | | — | % |
| Impact of tax uncertainties | 1.0 | % | | (1.2 | )% | | (1.0 | )% | 0.2 | % | | (5.2 | )% | | (0.7 | )% |
| Releasing valuation allowance on loss from disposition of the Phase 1 Clinical business | — | % | | — | % | | (8.4 | )% | |
| Non taxable gain from settlement of life insurance policy | — | % | | — | % | | (2.2 | )% | |
| Foreign withholding taxes | | 2.0 | % | | 3.4 | % | | — | % |
| Impact of acquisitions and restructuring | | 1.8 | % | | (2.0 | )% | | 1.6 | % |
| Other | 0.8 | % | | 1.6 | % | | 1.6 | % | 4.0 | % | | 1.8 | % | | 2.5 | % |
| | 23.8 | % | | 21.3 | % | | 12.9 | % | |
| Effective income tax rate | | 30.0 | % | | 22.2 | % | | 26.8 | % |
The tax rate benefit for enacted tax rate changes is primarily associated with a reduction in the U.K.’s statutory tax rates.
As of December 28, 2013, we have non-U.S.31, 2016, the Company had foreign net operating loss and tax credit carryforwards the tax effect of which is $12,951.$58.5 million, as compared to $34.6 million as of December 26, 2015. Of this amount, $524$5.2 million will expire beginning after 2016, $40.5 million will begin to expire in 2014,2028 and $218 will expire between 2014beyond, and 2031. Thethe remainder of $12,209$12.8 million can be carried forward indefinitely. We have U.S. net operating loss carryforwards at the state level, the tax effect of which is $94, which will expire between 2016 and 2031. We have U.S. foreign tax credit carryforwards of $21,733. Of this amount, $12,783 will expire in 2019, $6,255 will expire in 2020, $2,411 will expire in 2021 and the remaining $284 thereafter. We have Canadian Scientific Research and Experimental Development (SR&ED) credit carryforwards of $23,946, which will expire between 2029 and 2033. In accordance with Canadian Federal tax law, we claim SR&EDthe Company claims Scientific Research and Experimental Development (SR&ED) credits on qualified research and development costs incurred by our Preclinical servicein its Safety Assessment facility in Canada,Montreal, and currently maintains $16.8 million in credit carryforwards, which will begin to expire in 2033. Additionally, the performance of projects for non-Canadian clients. Additionally, in the first quarter of 2013, in accordance with the tax law of the United Kingdom, we claimed enhanced deductions related to qualified research and development costs incurred by our Preclinical service facility in Scotland, in the performance of certain client contracts. As of April 1, 2013, we adopted the new refundable research and development credit that was provided for in a UK tax law change that was enacted in 2013. This credit was recorded asCompany records a benefit to operating income. We have realized capital lossesincome for research and development credits in the U.S., the tax effect of which is $166, which will expire in 2017. We have realized and unrealized capital losses in Canada, the tax effect of which is $488. These losses can be carried forward indefinitely.
We record deferred tax assets for stock-based awards based on the amount of stock-based compensation recognized in our Consolidated Statements of Income at the statutory tax rate in the jurisdiction in which we will receive a tax deduction. Differences between the deferred tax assetsboth Quebec and the actual tax benefit reported on our income tax returns are recorded in additional paid-in capital. If the tax benefit is less that the deferred tax asset, the calculated shortfall reduces our pool of excess tax benefits. If the pool of excess tax benefits is reduced to zero, the subsequent shortfalls would increase our income tax expense. Our pool of excess tax benefits, which is computed in accordance with the long form method, was $7,345 as of December 28, 2013 and $9,558 as of December 29, 2012. During 2013, we recorded a tax benefit of $1,068 to additional paid-in-capitalU.K. related to the exercise of stock optionsits Safety Assessment and vesting of restricted shares.Early Discovery facilities.
We haveThe Company has fully recognized ourits deferred tax assets on the belief that it is more likely than not that they will be realized. The only exceptions at December 28, 2013relate to deferred tax assets primarily for net operating losses in France, Hong Kong, Luxembourg, and the Netherlands, capital losses in the U.S. and Canada, and fixed assets in the U.K. The valuation allowance decreased by $433 from $7,504 at December 29, 2012 to $7,071 at December 28, 2013.
At December 28, 2013, the amount recorded for unrecognized tax benefits was $18,475. At December 29, 2012 the amount recorded for unrecognized income tax benefits was $30,996. The $12,521 decrease during 2013 is primarily attributable to a settlement reached during the year with the CRA related to SR&ED credits claimed in 2005 through 2011. This reduction was partially offset by increases primarily due to a new uncertain tax position related to tax incentives claimed by Vital River in prior years, ongoing evaluation of uncertain tax positions in the current and prior periods related to the Canadian SR&ED credits claimed by our Preclinical subsidiary in Montreal, and foreign exchange movement.
CHARLES RIVER LABORATORIES INTERNATIONAL, INC.
NOTES TO CONSOLIDATED FINANCIAL STATEMENTS (Continued)
(dollars
Netherlands and Germany, capital losses in thousands, except per share amounts)the U.S., and fixed assets in the U.K. The valuation allowance increased by $4.0 million from $6.1 million as of December 26, 2015 to $10.1 million as of December 31, 2016.
A reconciliation of the Company’s beginning and ending unrecognized income tax benefits is as follows:
|
| | | | | | | | | | | |
| | Fiscal Year |
| | 2016 | | 2015 | | 2014 |
| | | | | | |
| | (in thousands) |
| Beginning balance | $ | 23,338 |
| | $ | 34,627 |
| | $ | 18,475 |
|
| Additions to tax positions for current year | 2,194 |
| | 2,362 |
| | 1,700 |
|
| Additions to tax positions for prior years | 2,035 |
| | 3,028 |
| | 18,502 |
|
| Reductions to tax positions for current year | — |
| | — |
| | — |
|
| Reductions to tax positions for prior years | (1,866 | ) | | (3,991 | ) | | (3,722 | ) |
| Settlements | (918 | ) | | (1,946 | ) | | (308 | ) |
| Expiration of statute of limitations | (597 | ) | | (10,742 | ) | | (20 | ) |
| Ending balance | $ | 24,186 |
| | $ | 23,338 |
| | $ | 34,627 |
|
The $0.8 million increase in unrecognized income tax benefits during fiscal year 2016 is primarily attributable to pre-acquisition tax positions taken by WIL Research, as well as an additional year of Canadian SR&ED credit, offset by a settlement related to the tax year ended 2014 for Canadian SR&ED credits and favorable foreign exchange movement.
The amount of unrecognized income tax benefits that, if recognized, would favorably impact the effective tax rate was $17,012$21.4 million as of December 28, 201331, 2016 and $24,386$20.1 million as of December 29, 2012.26, 2015. The $7,374 decrease$1.3 million increase is primarily attributable to the settlement reached during 2013 with the CRA related topre-acquisition tax positions taken by WIL Research, as well as an additional year of Canadian SR&ED credits claimed in 2005 through 2011, partiallycredit, offset by the new uncertain tax position related to Vital River and an increase due to the ongoing evaluation of uncertain tax positions for the current and prior periods.favorable foreign exchange movement. It is reasonably possible as of December 28, 201331, 2016 that the liability for unrecognized tax benefits for the uncertain tax position associated with an acquisition agreement termination fee couldwill decrease withinby $4.6 million over the next twelve months by approximately $11,000 due tomonth period, primarily as a result of the potential expirationoutcome of a statute of limitations.
A reconciliation of our beginningpending tax ruling and ending unrecognized income tax benefits is as follows:
|
| | | | | | | | | | | |
| | December 28, 2013 | | December 29, 2012 | | December 31, 2011 |
| Beginning balance | $ | 30,996 |
| | $ | 27,976 |
| | $ | 33,427 |
|
| Additions: |
| | | | |
| Tax positions for current year | 2,009 |
| | 1,907 |
| | 1,714 |
|
| Tax positions for prior years | 1,709 |
| | 4,196 |
| | — |
|
| Reductions: |
| | | | |
| Tax positions for current year | — |
| | — |
| | — |
|
| Tax positions for prior years | (732 | ) | | (28 | ) | | (239 | ) |
| Settlements | (15,246 | ) | | (3,055 | ) | | (6,926 | ) |
| Expiration of statute of limitations | (261 | ) | | — |
| | — |
|
| Ending balance | $ | 18,475 |
| | $ | 30,996 |
| | $ | 27,976 |
|
We continuecompetent authority proceedings. The Company continues to recognize interest and penalties related to unrecognized income tax benefits in income tax expense. The total amount of accrued interest related to unrecognized income tax benefits as of December 28, 201331, 2016 and December 29, 201226, 2015 was $691$1.7 million and $1,964,$1.0 million, respectively. The $1,273 decrease is primarily duetotal amount of accrued penalties related to the Canadian SR&ED settlement forunrecognized income tax years 2005 through 2011. We have not recorded a provision for penalties associated with uncertain tax positions.benefits as of December 31, 2016 was $0.2 million.
We conductThe Company conducts business in a number of tax jurisdictions. As a result, we areit is subject to tax audits on a regular basis including, but not limited to, such major jurisdictions as the United States,U.S., the United Kingdom,U.K., China, Japan, France, Japan, Germany, and Canada. With few exceptions, we arethe Company is no longer subject to U.S. and international income tax examinations for years before 2006.2013.
WeThe Company and certain of ourits subsidiaries are currently under audit by varioushave ongoing tax authoritiescontroversies in the U.S., Canada, Germany, and Finland. We doFrance. The Company does not anticipate resolution of these audits towill have a material impact on ourits financial statements.
We are currently under audit byDuring 2015, the Canadian Revenue Authority (CRA) for the years 2006 through 2009. In the fourth quarter of 2012, we received a draft reassessment from the CRA related to the transfer pricing in our Preclinical services operations in Montreal. The CRA proposes to disallow certain deductions related to headquarter service charges for the years 2006 through 2009. We intend to file an objectionCompany applied with the CRA upon receipt of the Notice of Reassessment and apply to the Internal Revenue Service (IRS) and the CRACanadian Revenue Authority (CRA) for relief pursuant to the competent authority procedure provided in the tax treaty between the U.S. and Canada. We believeCanada for transfer pricing tax assessments related to the tax years 2008 through 2012. The Company believes that the controversy will likely be ultimately settled via the competent authority process. In the fourth quarter of 2012, we establishedprocess and accordingly have recorded both a reserve for this uncertain tax position of $2,408 related to years 2006 through 2012 to reduce the tax benefit recognized for these deductions in Canada to the level that we believe will likely be realized upon the ultimate resolution of this controversy. Additionally, in the fourth quarter of 2012, we recognized a tax asset of $2,981, which is included in Other Assets, that represents the correlative relief that we believe will more likely than not be received in the U.S. via the competent authority process. In the third quarter of 2013, there wasCanadian liability and a U.S. tax court opinion issued that could impact our ability to recognize the full benefit of the correlative relief recorded in 2012. As a result, in the third quarter of 2013, the U.S. tax asset recorded in the fourth quarter of 2012 was reduced by $2,006 to $975.receivable. The actual amounts of the liability for Canadian taxes and the asset for the correlative relieverelief in the U.S. could be different based upon the agreement reached between the IRS and the CRA.
During 2012, the Canadian government enacted a reduction in the SR&ED credit, which is applicable for years 2014 and beyond. This change in law will reduce our SR&ED credits by 25% starting in 2014.
CHARLES RIVER LABORATORIES INTERNATIONAL, INC.
NOTES TO CONSOLIDATED FINANCIAL STATEMENTS (Continued)
(dollars in thousands, except per share amounts)
Subsequent to our December 29, 2012 year end, the French government enacted a tax law change that applies retroactively to 2012. We recorded the 2012 impact of this law change, which limits the deductibility of interest by our French affiliates for 2012 and beyond, as a discrete event in our financial statement for the first quarter ending March 30, 2013. The total 2012 impact from the tax law change is additional tax expense of $703. On December 30, 2013, the French government enacted anti hybrid provisions in an attempt to further restrict the ability of companies to deduct interest in France for 2013 and beyond. We believe that this new tax law should not apply to further restrict the deduction of interest by our French affiliates. However, future changes in or clarifications to the French anti-hybrid provisions could result in the disallowance of interest currently deducted by our French affiliates resulting in an increase to our effective tax rate in 2014 and beyond.
On February 25, 2013, the German government enacted a tax law change that restricts the deductibility of losses in Germany. As of December 28, 2013, we believe that this new tax law should not apply to restrict the deduction of losses by our German affiliates. However, future changes in or clarifications to the German tax law may result in disallowing losses currently deducted by our German affiliates and a corresponding increase to our effective tax rate in 2014 and beyond.
In accordance with ourthe Company’s policy, the remaining undistributed earnings of ourthe Company’s non-U.S. subsidiaries remain indefinitely reinvested outside of the U.S. as of the end of 20132016 as they are required to fund needs outside the U.S. and cannot be repatriated in a manner that is substantially tax free. During the third quarter of 2011, we restructured our international operations in a tax-free manner to allow us more flexibility in accessing our offshore cash to fund needs outside the U.S. As of December 28, 2013,31, 2016, the earnings of our non-U.S. subsidiaries considered to be indefinitely reinvested totaled $210,328.$704.6 million. No provision for U.S. income taxes has been provided thereon. Upon distribution of these earnings in the form of dividends or otherwise, we would be subject to additional U.S. Federal and state income taxes and foreign income and withholding taxes, which could be material.herein. Determination of the amount of unrecognized deferred income tax liabilities on these earnings is not practicable because of the complexities with the hypothetical calculation. Additionally, the amount of liability is dependent on circumstances existing if and when remittance occurs. On December 18, 2015, the U.S. enacted the Consolidated Appropriations Act, which provides for a reinstatement and extension of the controlled foreign corporation look-through rules. This rule allows the Company to access Chinese and Canadian cash in a more tax-efficient manner and utilize the cash outside of the U.S. without triggering residual U.S. tax. As such, in 2016 the Company accrued $4.5 million of foreign withholding taxes.
CHARLES RIVER LABORATORIES INTERNATIONAL, INC.
NOTES TO CONSOLIDATED FINANCIAL STATEMENTS (Continued)
8.10. EMPLOYEE BENEFIT PLANS
Pension Plans
The Charles River Laboratories, Employee SavingsInc. Pension Plan (CRL Pension Plan) is a qualified, non-contributory defined benefit plan covering certain U.S. employees. Effective 2002, the plan was amended to exclude new participants from joining and in 2008 the accrual of benefits was frozen.
OurThe Charles River Pension Plan is a defined contribution and defined benefit pension plan covering certain U.K. employees. Benefits are based on participants’ final pensionable salary and years of service. Participants’ rights vest immediately. Effective December 31, 2002, the plan was amended to exclude new participants from joining the defined benefit section of the plan and a defined contribution section was established for new entrants. Contributions under the defined contribution plan are determined as a percentage of gross salary. In the fourth quarter of 2015, the Charles River Laboratories Employee SavingsPension Plan qualifies under section 401(k)was amended such that the members of the Internal Revenue Code. It covers substantially all U.S. employeesdefined benefit section of the plan ceased to accrue additional benefits; however, their benefits continue to be adjusted for changes in their final pensionable salary or a specified inflation index, as applicable.
In addition, the Company has several defined benefit plans in certain other countries in which it maintains an operating presence, including Japan, Canada, France and contains a provision whereby we match a percentage of employee contributions. The costs associated with this defined contribution plan totaled $4,718, $4,364 and $4,178, in 2013, 2012 and 2011, respectively.
the Netherlands.
Charles River Laboratories Deferred Compensation Plan and Executive Supplemental Life Insurance Retirement Plan
The Company maintains a non-qualified deferred compensation plan, known as the Charles River Laboratories Deferred Compensation Plan (Deferred Compensation Plan) is designed for(DCP), which allows a select group of eligible employees including our Named Executive Officers. Under the Deferred Compensation Plan, participants may elect to defer bonus and salary amounts, and may select the investment returns to be applied to deferred amounts from among a numberportion of reference mutual funds as well as an interest crediting rate. The plan is not qualified under Section 401(a) of the Internal Revenue Code and is not subject to the Employee Retirement Income Security Act of 1974.their compensation. At the present time, no contributions will beare credited to the plan,DCP, except as set forth below. Participants must specify the distribution date for deferred amounts at the time of deferral, in accordance with applicable IRS regulations. Generally, amounts may be paid in lump sum or installments upon retirement or termination of employment, or later if the employee terminates employment after age 55 and before age 65. Amounts may also be distributed during employment, subject to a minimum deferral requirement of three years.
The Company provides certain active employees an annual contribution into their DCP account of 10% of the employee’s base salary plus the lesser of their target annual bonus or actual annual bonus.
In addition to the Deferred Compensation Plan,DCP, certain officers and key employees also participate, or in the past participated, in our amended and restatedthe Company’s Executive Supplemental Life Insurance Retirement Plan (ESLIRP), which is a non-funded, non-qualified arrangement. Annual benefits under this plan will equal a percentage of the highest five consecutive years of compensation, offset by amounts payable under the Charles River Laboratories, Inc.CRL Pension Plan and Social Security.
In addition, we provideconnection with the establishment of the DCP, certain active employees an annual contribution intoESLIRP participants, who agreed to convert their Deferred Compensation Plan account of 10%accrued ESLIRP benefit to a comparable deferred compensation benefit, discontinued their direct participation in the ESLIRP. Instead, the present values of the employee's base salary plus the lesseraccrued benefits of ESLIRP participants were credited to their target annual bonus or actual annual bonus. DCP accounts, and future accruals are converted to present values and credited to their DCP accounts annually.
The costs associated with these defined contribution plans, including the ESLIRP, for fiscal years 2016, 2015 and 2014 totaled $3,322, $2,930$2.2 million, $2.6 million and $2,048 in 2013, 2012 and 2011,$3.3 million, respectively.
We haveThe Company has invested in several corporate-owned key-person life insurance policies as well as mutual funds and U.S. Treasury Securities with the intention of using these investments to fund the ESLIRP and the Deferred Compensation Plan.DCP. Participants have no interest in any such investments. As of December 31, 2016 and December 26, 2015, the cash surrender value of these life insurance policies were $29.5 million and $27.6 million, respectively.
CHARLES RIVER LABORATORIES INTERNATIONAL, INC.
NOTES TO CONSOLIDATED FINANCIAL STATEMENTS (Continued)
(dollars
The following table provides a reconciliation of benefit obligations and plan assets of the Company’s pension, DCP and ESLIRP plans:
|
| | | | | | | |
| | December 31, 2016 | | December 26, 2015 |
| | | | |
| | (in thousands) |
| Change in projected benefit obligations: | |
| | |
|
| Benefit obligation at beginning of year | $ | 345,220 |
| | $ | 359,130 |
|
| Service cost | 2,453 |
| | 4,293 |
|
| Interest cost | 12,046 |
| | 12,974 |
|
| Benefit payments | (13,383 | ) | | (8,191 | ) |
| Curtailment | (279 | ) | | — |
|
| Settlements | (5,499 | ) | | — |
|
| Plan amendments | 188 |
| | — |
|
| Transfer in from acquisition | 5,271 |
| | — |
|
| Actuarial loss (gain) | 71,006 |
| | (10,362 | ) |
| Administrative expenses paid | (605 | ) | | (411 | ) |
| Effect of foreign exchange | (36,476 | ) | | (12,213 | ) |
| Benefit obligation at end of year | $ | 379,942 |
| | $ | 345,220 |
|
| Change in fair value of plan assets: | | | |
| Fair value of plan assets at beginning of year | $ | 275,480 |
| | $ | 281,290 |
|
| Actual return on plan assets | 23,388 |
| | 6,263 |
|
| Employer contributions | 10,551 |
| | 6,762 |
|
| Settlements | (5,499 | ) | | — |
|
| Transfer in from acquisition | 508 |
| | — |
|
| Benefit payments | (13,383 | ) | | (8,191 | ) |
| Administrative expenses paid | (605 | ) | | (411 | ) |
| Effect of foreign exchange | (33,537 | ) | | (10,233 | ) |
| Fair value of plan assets at end of year | $ | 256,903 |
| | $ | 275,480 |
|
| | | | |
| Net balance sheet liability | $ | 123,039 |
| | $ | 69,740 |
|
| | | | |
| Amounts recognized in balance sheet: | | | |
| Noncurrent assets | $ | — |
| | $ | 261 |
|
| Current liabilities | 1,120 |
| | 6,133 |
|
| Noncurrent liabilities | 121,919 |
| | 63,868 |
|
Amounts recognized in thousands, except per share amounts)accumulated other comprehensive loss related to the Company’s pension, DCP and ESLIRP plans are as follows:
|
| | | | | | | |
| | Fiscal Year |
| | 2016 | | 2015 |
| | | | |
| | (in thousands) |
| Net actuarial loss | $ | 123,743 |
| | $ | 73,412 |
|
| Net prior service cost (credit) | (3,300 | ) | | (4,584 | ) |
| Net amount recognized | $ | 120,443 |
| | $ | 68,828 |
|
CHARLES RIVER LABORATORIES INTERNATIONAL, INC.
NOTES TO CONSOLIDATED FINANCIAL STATEMENTS (Continued)
have no interestThe accumulated benefit obligation and fair value of plan assets for the Company’s pension, DCP and ESLIRP plans with accumulated benefit obligations in excess of plan assets are as follows:
|
| | | | | | | |
| | December 31, 2016 | | December 26, 2015 |
| | | | |
| | (in thousands) |
| Accumulated benefit obligation | $ | 346,122 |
| | $ | 306,433 |
|
| Fair value of plan assets | 242,172 |
| | 253,225 |
|
The projected benefit obligation and fair value of plan assets for the Company’s pension, DCP and ESLIRP plans with projected benefit obligations in excess of plan assets are as follows:
|
| | | | | | | |
| | December 31, 2016 | | December 26, 2015 |
| | | | |
| | (in thousands) |
| Projected benefit obligation | $ | 379,942 |
| | $ | 336,155 |
|
| Fair value of plan assets | 256,903 |
| | 266,154 |
|
The amounts in accumulated other comprehensive income expected to be recognized as components of net periodic benefit cost over the next fiscal year are as follows:
|
| | | |
| | December 31, 2016 |
| | (in thousands) |
| Amortization of net actuarial loss | $ | 3,867 |
|
| Amortization of net prior service credit | (475 | ) |
Components of net periodic benefit cost for the Company’s pension, DCP and ESLIRP plans are as follows:
|
| | | | | | | | | | | |
| | Fiscal Year |
| | 2016 | | 2015 | | 2014 |
| | | | | | |
| | (in thousands) |
| Service cost | $ | 2,453 |
| | $ | 4,293 |
| | $ | 4,155 |
|
| Interest cost | 12,046 |
| | 12,974 |
| | 13,831 |
|
| Expected return on plan assets | (14,164 | ) | | (16,987 | ) | | (17,444 | ) |
| Amortization of prior service cost (credit) | (292 | ) | | (581 | ) | | 1,211 |
|
| Amortization of net loss (gain) | 2,003 |
| | 3,198 |
| | 23 |
|
| Curtailment | (279 | ) | | — |
| | — |
|
| Settlements | 788 |
| | — |
| | — |
|
| Net periodic cost (benefit) | $ | 2,555 |
| | $ | 2,897 |
| | $ | 1,776 |
|
Assumptions
Weighted-average assumptions used to determine projected benefit obligations are as follows:
|
| | | | | |
| | December 31, 2016 | | December 26, 2015 |
| Discount rate | 3.01 | % | | 3.89 | % |
| Rate of compensation increase | 3.25 | % | | 3.17 | % |
CHARLES RIVER LABORATORIES INTERNATIONAL, INC.
NOTES TO CONSOLIDATED FINANCIAL STATEMENTS (Continued)
Weighted-average assumptions used to determine net periodic benefit cost are as follows:
|
| | | | | | | | |
| | December 31, 2016 | | December 26, 2015 | | December 27, 2014 |
| Discount rate | 3.89 | % | | 3.75 | % | | 4.44 | % |
| Expected long-term return on plan assets | 5.83 | % | | 6.24 | % | | 6.41 | % |
| Rate of compensation increase | 3.17 | % | | 3.18 | % | | 3.36 | % |
A 0.5% decrease in the expected rate of return would increase annual pension expense by $1.3 million.
Plan assets
The Company invests its pension assets with the objective of achieving a total long-term rate of return sufficient to fund future pension obligations and to minimize future pension contributions. The Company is willing to tolerate a commensurate level of risk to achieve this objective. The Company controls its risk by maintaining a diversified portfolio of assets classes. Plan assets did not include any of the Company’s common stock as of December 31, 2016 or December 26, 2015. The weighted-average target asset allocations are approximately 45.0% to equity securities, approximately 31.5% to fixed income securities and approximately 23.5% to other securities.
The fair value of the Company’s pension plan assets by asset category are as follows:
|
| | | | | | | | | | | | | | | | | | | | | | | | | | | | | | | |
| | December 31, 2016 | | December 26, 2015 |
| | Level 1 | | Level 2 | | Level 3 | | Total | | Level 1 | | Level 2 | | Level 3 | | Total |
| | | | | | | | | | | | | | | | |
| | (in thousands) |
| Cash | $ | 108 |
| | $ | — |
| | $ | — |
| | $ | 108 |
| | $ | 92 |
| | $ | — |
| | $ | — |
| | $ | 92 |
|
Equity securities(1) | 63,348 |
| | 6,252 |
| | — |
| | 69,600 |
| | 65,890 |
| | 5,941 |
| | — |
| | 71,831 |
|
Debt securities(2) | 59,294 |
| | 3,269 |
| | — |
| | 62,563 |
| | 68,489 |
| | 2,822 |
| | — |
| | 71,311 |
|
Mutual funds(3) | 64,698 |
| | 56,596 |
| | — |
| | 121,294 |
| | 63,689 |
| | 65,725 |
| | — |
| | 129,414 |
|
| Other | 1,318 |
| | 586 |
| | 1,434 |
| | 3,338 |
| | 1,021 |
| | 49 |
| | 1,762 |
| | 2,832 |
|
| Total | $ | 188,766 |
| | $ | 66,703 |
| | $ | 1,434 |
| | $ | 256,903 |
| | $ | 199,181 |
| | $ | 74,537 |
| | $ | 1,762 |
| | $ | 275,480 |
|
(1) This category comprises equity securities held by non-U.S. pension plans valued at the quoted closing price, and translated into U.S. dollars using a foreign currency exchange rate at year end. |
(2) This category comprises debt securities held by non-U.S. pension plans valued at the quoted closing price, and translated into U.S. dollars using a foreign currency exchange rate at year end. |
(3) This category comprises mutual funds valued at the net asset value of shares held at year end. |
The activity within the Level 3 pension plan assets was non-significant during the periods presented.
During fiscal year 2016, the Company contributed $4.0 million to the pension plans and expects to contribute $4.0 million to its pension plans in fiscal year 2017.
CHARLES RIVER LABORATORIES INTERNATIONAL, INC.
NOTES TO CONSOLIDATED FINANCIAL STATEMENTS (Continued)
Expected benefit payments are estimated using the same assumptions used in determining the Company’s benefit obligation as of December 31, 2016. Benefit payments will depend on future employment and compensation levels, among other factors, and changes in any such investments. At December 28, 2013 and December 29, 2012 the cash surrender value of these life insurance policies were $26,507factors could significantly affect these estimated future benefit payments. Estimated future benefit payments during the next five years and $25,240, respectively.in the aggregate for fiscal years thereafter, are as follows:
|
| | | | |
| Fiscal Year | | Pension Plans |
| | | (in thousands) |
| 2017 | | $ | 8,610 |
|
| 2018 | | 8,818 |
|
| 2019 | | 9,682 |
|
| 2020 | | 10,014 |
|
| 2021 | | 30,717 |
|
| Thereafter | | 57,705 |
|
Post-Retirement Health and Life Insurance Plans
Our MontrealThe Company’s Canadian location offers post-retirement life insurance benefits to its employees and post-retirement medical &and dental insurance coverage to certain executives. The plan is non-contributory and unfunded. As of December 28, 2013,31, 2016 and December 26, 2015, the accumulated benefit obligation related to the plan was $1,057. In addition,$1.2 million and $0.9 million, respectively. The amounts included in other accumulated other comprehensive income includes $96 of deferred gains, net of tax, as of December 28, 2013, and $105 of deferred losses, net of tax,well as of December 29, 2012. Expensesexpenses related to the plan were $84, $201non-significant for fiscal years 2016, 2015, and $188 for 2013, 2012 and 2011, respectively.2014.
Pension PlansCharles River Laboratories Employee Savings Plan
The Charles River Laboratories Inc. Pension Plan is a qualified, non-contributory defined benefit plan covering certain US employees. Effective 2002, the plan was amended to exclude new participants from joining and in 2008 the accrual of benefits was frozen.
The Charles River PensionEmployee Savings Plan is a defined contribution plan in the form of a qualified 401(k) plan in which substantially all U.S. employees are eligible to participate upon employment. The plan contains a provision whereby the Company matches a percentage of employee contributions. During fiscal years 2016, 2015 and defined benefit pension plan covering certain UK employees. Benefits are based on participants' final pensionable salary and years of service. Participants' rights vest immediately. Effective December 31, 2002,2014, the plan was amended to exclude new participants from joining the defined benefit section of the plan and a defined contribution section was established for new entrants. Contributions under thecosts associated with this defined contribution plan are determined as a percentage of gross salary.totaled $6.2 million, $5.3 million and $4.9 million, respectively.
11. STOCK-BASED COMPENSATION
The defined benefit pension plans for Japan and our Canadian RMS operation are non-contributory plans that cover substantially all employees of those respective companies. Benefits are based upon length of service and final salary. In addition, our French RMS operationCompany has a defined benefit statutory indemnity plan covering most of its employees.
CHARLES RIVER LABORATORIES INTERNATIONAL, INC.
NOTES TO CONSOLIDATED FINANCIAL STATEMENTS (Continued)
(dollars in thousands, except per share amounts)
The following tables summarize the funded status of our defined benefit plans and amounts reflected in our consolidated balance sheets.
Obligations and Funded Status:
|
| | | | | | | | | | | | | | | |
| | Pension Benefits | | Supplemental Retirement Benefits |
| | 2013 | | 2012 | | 2013 | | 2012 |
| Change in benefit obligations | | | | | | | |
| Benefit obligation at beginning of year | $ | 283,063 |
| | $ | 251,916 |
| | $ | 27,372 |
| | $ | 26,456 |
|
| Service cost | 3,368 |
| | 3,729 |
| | 643 |
| | 640 |
|
| Interest cost | 11,273 |
| | 11,289 |
| | 708 |
| | 892 |
|
| Plan participants' contributions | — |
| | 53 |
| | — |
| | — |
|
| Benefit payments | (8,300 | ) | | (6,186 | ) | | (726 | ) | | (743 | ) |
| Actuarial loss (gain) | (4,276 | ) | | 16,699 |
| | 1,501 |
| | 127 |
|
| Plan amendments | — |
| | — |
| | — |
| | — |
|
| Administrative expenses paid | (308 | ) | | (266 | ) | | — |
| | — |
|
| Effect of foreign exchange | 1,392 |
| | 5,829 |
| | — |
| | — |
|
| Benefit obligation at end of year | $ | 286,212 |
| | $ | 283,063 |
| | $ | 29,498 |
| | $ | 27,372 |
|
| Change in plan assets | | | | | | | |
| Fair value of plan assets at beginning of year | $ | 238,672 |
| | $ | 202,652 |
| | $ | — |
| | $ | — |
|
| Actual return on plan assets | 30,820 |
| | 22,467 |
| | — |
| | — |
|
| Settlements | — |
| | — |
| | — |
| | — |
|
| Employer contributions | 9,570 |
| | 14,222 |
| | 726 |
| | 743 |
|
| Plan participants' contributions | — |
| | 53 |
| | — |
| | — |
|
| Benefit payments | (8,300 | ) | | (6,186 | ) | | (726 | ) | | (743 | ) |
| Premiums paid | (308 | ) | | (266 | ) | | — |
| | — |
|
| Effect of foreign exchange | 2,205 |
| | 5,730 |
| | — |
| | — |
|
| Fair value of plan assets at end of year | $ | 272,659 |
| | $ | 238,672 |
| | $ | — |
| | $ | — |
|
| Funded status | | | | | | | |
| Projected benefit obligation | $ | 286,212 |
| | $ | 283,063 |
| | $ | 29,498 |
| | $ | 27,372 |
|
| Fair value of plan assets | 272,659 |
| | 238,672 |
| | — |
| | — |
|
| Net balance sheet liability | $ | 13,553 |
| | $ | 44,391 |
| | $ | 29,498 |
| | $ | 27,372 |
|
| Classification of net balance sheet asset / liability: | | | | | | |
| Non-current assets | $ | 2,738 |
| | $ | — |
| | $ | — |
| | $ | — |
|
| Current liabilities | 72 |
| | 75 |
| | 789 |
| | 709 |
|
| Non-current liabilities | 16,219 |
| | 44,316 |
| | 28,709 |
| | 26,663 |
|
Amounts recognized in statement of financial position as part of accumulated other comprehensive income ("AOCI"):
|
| | | | | | | | | | | | | | | |
| | Pension Benefits | | Supplemental Retirement Benefits |
| | 2013 | | 2012 | | 2013 | | 2012 |
| Net actuarial loss | $ | 35,481 |
| | $ | 58,594 |
| | $ | 4,307 |
| | $ | 3,056 |
|
| Net prior service cost/(credit) | (6,338 | ) | | (6,815 | ) | | 660 |
| | 1,320 |
|
| Total | $ | 29,143 |
| | $ | 51,779 |
| | $ | 4,967 |
| | $ | 4,376 |
|
CHARLES RIVER LABORATORIES INTERNATIONAL, INC.
NOTES TO CONSOLIDATED FINANCIAL STATEMENTS (Continued)
(dollars in thousands, except per share amounts)
Information for defined benefit plans with accumulated benefit obligation in excess of plan assets:
|
| | | | | | | | | | | | | | | |
| | Pension Benefits | | Supplemental Retirement Benefits |
| | 2013 | | 2012 | | 2013 | | 2012 |
| Projected benefit obligation | $ | 82,254 |
| | $ | 277,187 |
| | $ | 29,498 |
| | $ | 27,372 |
|
| Accumulated benefit obligation | 81,117 |
| | 271,204 |
| | 27,938 |
| | 26,495 |
|
| Fair value of plan assets | 68,430 |
| | 233,182 |
| | — |
| | — |
|
Information for defined benefit plans with projected benefit obligation in excess of plan assets:
|
| | | | | | | | | | | | | | | |
| | Pension Benefits | | Supplemental Retirement Benefits |
| | 2013 | | 2012 | | 2013 | | 2012 |
| Projected benefit obligation | $ | 99,671 |
| | $ | 283,063 |
| | $ | 29,498 |
| | $ | 27,372 |
|
| Accumulated benefit obligation | 93,307 |
| | 275,162 |
| | 27,938 |
| | 26,495 |
|
| Fair value of plan assets | 83,379 |
| | 238,672 |
| | — |
| | — |
|
Amounts in AOCI expected to be recognized as components of net periodic benefit cost over the next fiscal year:
|
| | | | | | | |
| | Pension Benefits | | Supplemental Retirement Benefits |
| Amortization of net actuarial loss | $ | 923 |
| | $ | 250 |
|
| Amortization of net prior service cost/(credit) | (637 | ) | | 660 |
|
Components of net periodic benefit cost:
|
| | | | | | | | | | | | | | | | | | | | | | | |
| | Pension Benefits | | Supplemental Retirement Benefits |
| | 2013 | | 2012 | | 2011 | | 2013 | | 2012 | | 2011 |
| Service cost | $ | 3,368 |
| | $ | 3,729 |
| | $ | 3,056 |
| | $ | 643 |
| | $ | 640 |
| | $ | 636 |
|
| Interest cost | 11,273 |
| | 11,289 |
| | 12,107 |
| | 708 |
| | 892 |
| | 1,201 |
|
| Expected return on plan assets | (14,672 | ) | | (13,799 | ) | | (13,677 | ) | | — |
| | — |
| | — |
|
| Amortization of prior service cost (credit) | 2,711 |
| | 2,461 |
| | (617 | ) | | 249 |
| | 260 |
| | 498 |
|
| Amortization of net loss (gain) | (603 | ) | | (609 | ) | | 978 |
| | 660 |
| | 660 |
| | 210 |
|
| Net periodic benefit cost | 2,077 |
| | 3,071 |
| | 1,847 |
| | 2,260 |
| | 2,452 |
| | 2,545 |
|
| Settlement | — |
| | — |
| | 23 |
| | — |
| | — |
| | (487 | ) |
| Net pension cost | $ | 2,077 |
| | $ | 3,071 |
| | $ | 1,870 |
| | $ | 2,260 |
| | $ | 2,452 |
| | $ | 2,058 |
|
CHARLES RIVER LABORATORIES INTERNATIONAL, INC.
NOTES TO CONSOLIDATED FINANCIAL STATEMENTS (Continued)
(dollars in thousands, except per share amounts)
Rollforward of accumulated other comprehensive income:
|
| | | | | | | | | | | | | | | |
| | Pension Benefits | | Supplemental Retirement Benefits |
| | 2013 | | 2012 | �� | 2013 | | 2012 |
| Beginning balance | $ | 51,779 |
| | $ | 45,267 |
| | $ | 4,376 |
| | $ | 5,171 |
|
| Amortization of prior service (cost) or credit | 603 |
| | (2,461 | ) | | (660 | ) | | (660 | ) |
| Amortization of net (loss) gain | (2,710 | ) | | 609 |
| | (250 | ) | | (260 | ) |
| Asset (gain) loss recorded during period | (20,424 | ) | | 8,030 |
| | 1,501 |
| | 125 |
|
| Currency impact | (105 | ) | | 334 |
| | — |
| | — |
|
| Ending balance | $ | 29,143 |
| | $ | 51,779 |
| | $ | 4,967 |
| | $ | 4,376 |
|
The above table excludes amortization of prior service cost of $32 and asset gains recorded during the period of $297.
Assumptions
Weighted-average assumptions used to determine benefit obligations:
|
| | | | | | | | | | | |
| | Pension Benefits | | Supplemental Retirement Benefits |
| | 2013 | | 2012 | | 2013 | | 2012 |
| Discount rate | 4.54 | % | | 4.13 | % | | 3.47 | % | | 2.63 | % |
| Rate of compensation increase | 3.39 | % | | 3.04 | % | | 3.00 | % | | 2.50 | % |
Weighted-average assumptions used to determine net periodic benefit cost:
|
| | | | | | | | | | | | | | | | | |
| | Pension Benefits | | Supplemental Retirement Benefits |
| | 2013 | | 2012 | | 2011 | | 2013 | | 2012 | | 2011 |
| Discount rate | 4.13 | % | | 4.47 | % | | 5.20 | % | | 2.63 | % | | 3.42 | % | | 4.34 | % |
| Expected long-term return on plan assets | 6.27 | % | | 6.55 | % | | 6.79 | % | | — |
| | — |
| | — |
|
| Rate of compensation increase | 3.04 | % | | 3.12 | % | | 3.48 | % | | 2.50 | % | | 2.50 | % | | 2.50 | % |
The discount rates reflect the rates at which amounts that are invested in a portfolio of high-quality debt instruments would provide the future cash flows necessary to pay benefits when they become due. The rate of compensation increase reflects the expected annual salary increases for the plan participants based on historical experience and our current employee compensation strategy.
We estimate the expected return on invested pension assets annually. The expected return is intended to match the duration over which our pension plans will provide benefit payments to participants. Each year, we use several data points to estimate the long-term investment return, including our targeted asset allocation, capital market performance estimates prepared by our outside investment advisers, survey information of rates of return used by other public companies and historical return information. The capital models that we use to estimate future market performance do not explicitly allow for historical market rate of return. Rather, these models consider the historical relationships among the economic metrics that influence investment returns, such as interest rates, inflation, price-to-earnings ratios, discounted dividends and earnings growth. The expected return for the asset portfolio is estimated using a geometric average from the expected returns of individual asset classes in the portfolio and is net of investment fees. A 0.5% decrease in the expected rate of return would increase annual pension expense by approximately $1,200.
CHARLES RIVER LABORATORIES INTERNATIONAL, INC.
NOTES TO CONSOLIDATED FINANCIAL STATEMENTS (Continued)
(dollars in thousands, except per share amounts)
Plan assets
Our pension plans' weighted-average asset allocations are as follows:
|
| | | | | | | | |
| | Target Allocation | | Pension Benefits |
| | 2014 | | 2013 | | 2012 |
| Equity securities | 60.1 | % | | 54.8 | % | | 60.0 | % |
| Fixed income | 31.2 | % | | 32.6 | % | | 36.0 | % |
| Other | 8.7 | % | | 12.6 | % | | 4.0 | % |
| Total | 100.0 | % | | 100.0 | % | | 100.0 | % |
Our investment objective is to obtain the highest possible return commensurate with the level of assumed risk. Fund performances are compared to benchmarks including the S&P 500 Index, Russell 2000, BC Aggregate Index and MSCI EAFE Index. Our Investment Committee meets on a quarterly basis to review plan assets.
Plan assets did not include any of our common stock at December 28, 2013 and December 29, 2012, respectively.
The fair value of our pension assets by asset category are as follows.
|
| | | | | | | | | | | | | | | |
| | Fair Value Measurements at December 28, 2013 |
| Asset Class | Quoted Prices in Active Markets for Identical Assets Level 1 | | Significant Other Observable Inputs Level 2 | | Significant Unobservable Inputs Level 3 | | Assets at Fair Value |
| Cash | $ | 1,004 |
| | $ | — |
| | $ | — |
| | $ | 1,004 |
|
| Common stock(a) | 97,857 |
| | 5,059 |
| | — |
| | 102,916 |
|
| Debt securities(a) | 62,717 |
| | 3,487 |
| | — |
| | 66,204 |
|
| Mutual funds(b) | 65,152 |
| | 35,610 |
| | — |
| | 100,762 |
|
| Life insurance policies(c) | — |
| | 48 |
| | — |
| | 48 |
|
| Other | 299 |
| | — |
| | 1,426 |
| (d) | 1,725 |
|
| Total | $ | 227,029 |
| | $ | 44,204 |
| | $ | 1,426 |
| | $ | 272,659 |
|
| |
(a) | This category comprises investments valued at the closing price reported on the active market on which the individual securities are traded. |
| |
(b) | This category comprises mutual funds valued at the net asset value of shares held at year end. |
| |
(c) | This category comprises life insurance policies valued at cash surrender value at year end. |
| |
(d) | This comprises annuity policies held with various insurance companies valued at face value. |
|
| | | |
| | Fair Value Measurements Using Significant Unobservable Inputs (Level 3) |
| Balance at December 29, 2012 | $ | 1,488 |
|
| Actual return on plan assets: | |
| Relating to assets still held at December 28, 2013 | — |
|
| Relating to assets sold during the period | (62 | ) |
| Purchases, sales and settlements | — |
|
| Transfers in and/or out of Level 3 | — |
|
| Balance at December 28, 2013 | $ | 1,426 |
|
CHARLES RIVER LABORATORIES INTERNATIONAL, INC.
NOTES TO CONSOLIDATED FINANCIAL STATEMENTS (Continued)
(dollars in thousands, except per share amounts)
|
| | | | | | | | | | | | | | | |
| | Fair Value Measurements at December 29, 2012 |
| Asset Class | Quoted Prices in Active Markets for Identical Assets Level 1 | | Significant Other Observable Inputs Level 2 | | Significant Unobservable Inputs Level 3 | | Assets at Fair Value |
| Cash | $ | 1,336 |
| | $ | — |
| | $ | — |
| | $ | 1,336 |
|
| Common stock(a) | 100,864 |
| | 4,261 |
| | — |
| | 105,125 |
|
| Debt securities(a) | 63,283 |
| | 3,169 |
| | — |
| | 66,452 |
|
| Mutual funds(b) | 55,453 |
| | 8,551 |
| | — |
| | 64,004 |
|
| Life insurance policies(c) | — |
| | 43 |
| | — |
| | 43 |
|
| Other | 224 |
| | — |
| | 1,488 |
| (d) | 1,712 |
|
| Total | $ | 221,160 |
| | $ | 16,024 |
| | $ | 1,488 |
| | $ | 238,672 |
|
| |
(a) | This category comprises investments valued at the closing price reported on the active market on which the individual securities are traded. |
| |
(b) | This category comprises mutual funds valued at the net asset value of shares held at year end. |
| |
(c) | This category comprises life insurance policies valued at cash surrender value at year end. |
| |
(d) | This comprises annuity policies held with various insurance companies valued at face value. |
|
| | | |
| | Fair Value Measurements Using Significant Unobservable Inputs (Level 3) |
| Balance at December 31, 2011 | $ | 1,419 |
|
| Actual return on plan assets: | |
| Relating to assets still held at December 29, 2012 | 51 |
|
| Relating to assets sold during the period | — |
|
| Purchases, sales and settlements | (78 | ) |
| Transfers in and/or out of Level 3 | 96 |
|
| Balance at December 29, 2012 | $ | 1,488 |
|
Contributions
During 2013, we contributed $9,525 to our pension plans. We expect to contribute $6,477 to our pension plan in 2014.
Estimated future benefit payments
|
| | | | | | | |
| | Pension Benefits | | Supplemental Retirement Benefits |
| 2014 | $ | 6,784 |
| | $ | 805 |
|
| 2015 | 7,461 |
| | 13,232 |
|
| 2016 | 8,470 |
| | 743 |
|
| 2017 | 8,475 |
| | 728 |
|
| 2018 | 8,914 |
| | 714 |
|
| 2019-2022 | $ | 58,164 |
| | $ | 10,152 |
|
CHARLES RIVER LABORATORIES INTERNATIONAL, INC.
NOTES TO CONSOLIDATED FINANCIAL STATEMENTS (Continued)
(dollars in thousands, except per share amounts)
9. STOCK PLANS AND STOCK BASED COMPENSATION
We have share-basedstock-based compensation plans under which employees and non-employee directors may be granted share based awards. stock-based awards such as stock options, restricted stock, restricted stock units and PSUs.
During 2013, 2012fiscal years 2016, 2015 and 2011,2014, the primary share-based awards and their general terms and conditions are as follows:
Stock options, which entitle the holder to purchase a specified number of shares of common stock at an exercise price equal to the closing market price of our common stock on the date of grant; typically vest incrementally, typically over 3 to 4 years; and generallytypically expire 75 to 107 years from date of grant.
Restricted stock grants,units, which entitle the holderrepresent an unsecured promise to receivegrant at no cost a specifiedset number of shares of common stock that vests incrementally,upon the completion of the vesting schedule, and typically vest over 2 to 4 years. With respect to restricted stock units, recipients are not entitled to cash dividends and have no voting rights on the stock during the vesting period.
Restricted stock, which is an award of common stock issued on the grant date and subject to vesting, typically over 32 to 4 years. Recipients cannot sell or transfer the shares until the restriction period has lapsed, but are entitled to forfeitable cash dividends and to vote their respective shares upon grant.
Performance based stock awards,PSUs, which entitle the holder to receive at no cost, a specified number of shares of common stock within a range of shares from zero to a specified maximum.maximum and typically vest over 3 years. Payout of this award is contingent upon achievement of targeted earnings per share with certain defined adjustmentsperformance and our relative stock price market performance.conditions.
AtIn May 2007, the Annual Meeting of Shareholders held on May 8, 2007, ourCompany’s shareholders approved the 2007 Incentive Plan, which was amended in 2009, 2011, 2013 and 2015 (2007 Plan). The 2007 Plan was subsequently amended in 2009, 2011 and 2013, and in each case the amendments were approved by our shareholders at the respective annual meeting of shareholders. The 2007 Plan provides that effective upon approval,provided no further awards willto be granted under preexisting stock option and incentive plans; provided, however, that any shares that have been forfeited or canceled in accordance with the terms of the applicable award under a preexisting plan may be subsequently awarded in accordance with the terms of the preexisting plan. The 2007 Plan allows a maximum of 18.7 million shares to be awarded, of which restricted stock grants, restricted stock units, and
CHARLES RIVER LABORATORIES INTERNATIONAL, INC.
NOTES TO CONSOLIDATED FINANCIAL STATEMENTS (Continued)
performance based stock awards count as 2.3 shares and stock options count as one share. In the past, we had various employee1.0 shares. Any stock and incentive plans under which stock options and other share-based awards were granted. Stock options and other share-based awards that were granted under prior plans and were outstanding onin May 8, 2007 continue in accordance with the terms of the respective plans.
At In May 2016, the Company’s shareholders approved the 2016 Incentive Plan (2016 Plan). The 2016 Plan provided no further awards to be granted under preexisting stock option and incentive plans; provided, however, that any shares that have been forfeited or canceled in accordance with the terms of the applicable award under a preexisting plan may be subsequently awarded in accordance with the terms of the preexisting plan. The 2016 Plan allows a maximum of 6.1 million shares to be awarded, of which restricted stock grants, restricted stock units and performance based stock awards count as 2.3 shares and stock options count as 1.0 shares. Any stock options and other share-based awards that were granted under prior plans and were outstanding in May 2016 continue in accordance with the terms of the respective plans.
As of December 28, 2013,31, 2016, approximately 9.07.3 million shares were authorized for future grants under ourthe Company’s share-based compensation plans. We settleThe Company settles employee share-based compensation awards with newly issued shares. The estimated fair value of our stock-based awards, less expected forfeitures, is amortized over the awards' vesting period on a straight-line basis. The following table presentsprovides the financial statement line items in which stock-based compensation included in our consolidated statement of income:is reflected:
|
| | | | | | | | | | | |
| | December 28, 2013 | | December 29, 2012 | | December 31, 2011 |
| Stock-based compensation expense in: | | | | | |
| Cost of sales | $ | 5,381 |
| | $ | 5,470 |
| | $ | 5,983 |
|
| Selling and administration | 19,161 |
| | 16,385 |
| | 15,723 |
|
| Income from continuing operations, before income taxes | 24,542 |
| | 21,855 |
| | 21,706 |
|
| Provision for income taxes | (8,658 | ) | | (7,793 | ) | | (7,784 | ) |
| Net income attributable to common shareholders | $ | 15,884 |
| | $ | 14,062 |
| | $ | 13,922 |
|
|
| | | | | | | | | | | |
| | Fiscal Year |
| | 2016 | | 2015 | | 2014 |
| | | | | | |
| | (in thousands) |
| Cost of revenue (excluding amortization of intangible assets) | $ | 6,508 |
| | $ | 6,511 |
| | $ | 5,382 |
|
| Selling, general and administrative | 37,134 |
| | 33,611 |
| | 25,653 |
|
| Stock-based compensation expense, before income taxes | 43,642 |
| | 40,122 |
| | 31,035 |
|
| Provision for income taxes | (15,548 | ) | | (14,225 | ) | | (11,006 | ) |
| Stock-based compensation, net of income taxes | $ | 28,094 |
| | $ | 25,897 |
| | $ | 20,029 |
|
WeDuring fiscal year 2015, the Company modified certain stock-based awards granted in previous years as part of executive retirement transitions. For the stock-based awards granted to employees during and subsequent to fiscal year 2015, the Company introduced a new retirement provision, which allows for continued vesting of such awards after the employee’s retirement if certain eligibility conditions are met. The introduction of the new retirement provision and stock-based award modifications increased the Company’s stock-based compensation expense for 2015 by $4.5 million.
The Company capitalized no stock-based compensation related costs for thefiscal years ended 2013, 20122016, 2015 and 2011.2014.
The fair valueCompany’s pool of stock-based awards granted during 2013, 2012 and 2011 was estimated on the grant date using the Black-Scholes option-pricing modelexcess tax benefits, which is computed in accordance with the long form method, was $32.2 million as of December 31, 2016, $22.3 million as of December 26, 2015, and $10.8 million as of December 27, 2014. During fiscal year 2016, the Company recorded a tax benefit of $9.3 million to additional paid-in capital related to the exercise of stock options and vesting of restricted shares and restricted stock units, compared to a tax benefit of $10.6 million in fiscal year 2015.
Stock Options
The following weighted-average assumptions:table summarizes stock option activities under the Company’s stock-based compensation plans:
|
| | | | | | | | | | | |
| | December 28, 2013 |
| | December 29, 2012 |
| | December 31, 2011 |
|
| Expected life (in years) | 4.2 |
| | 4.5 |
| | 4.2 |
|
| Expected volatility | 33 | % | | 35 | % | | 33 | % |
| Risk-free interest rate | 0.80 | % | | 0.84 | % | | 2.21 | % |
| Expected dividend yield | 0 | % | | 0 | % | | 0 | % |
| Weighted—average grant date fair value | $ | 11.17 |
| | $ | 10.94 |
| | $ | 11.32 |
|
|
| | | | | | | | | | | | |
| | Number of shares | | Weighted Average
Exercise Price | | Weighted Average
Remaining
Contractual Life
(in years) | | Aggregate
Intrinsic
Value |
| | | | | | | | |
| | (in thousands, except per share amounts) |
| Options outstanding as of December 26, 2015 | 2,066 |
| | $ | 50.62 |
| | | | |
|
| Options granted | 588 |
| | $ | 74.13 |
| | | | |
|
| Options exercised | (601 | ) | | $ | 38.52 |
| | | | |
|
| Options canceled | (83 | ) | | $ | 62.66 |
| | | | |
|
| Options outstanding as of December 31, 2016 | 1,970 |
| | $ | 60.82 |
| | 3.4 | | $ | 30,638 |
|
| Options exercisable as of December 31, 2016 | 746 |
| | $ | 48.34 |
| | 2.6 | | $ | 20,817 |
|
| Options expected to vest as of December 31, 2016 | 1,202 |
| | $ | 68.40 |
| | 3.8 | | $ | 9,690 |
|
CHARLES RIVER LABORATORIES INTERNATIONAL, INC.
NOTES TO CONSOLIDATED FINANCIAL STATEMENTS (Continued)
(dollars in thousands, except per share amounts)
Stock Options
The fair value of stock options granted was estimated using the Black-Scholes option-pricing model with the following table summarizes stock option activities under our plans:weighted-average assumptions:
|
| | | | | | | | | | | | |
| | Shares | | Weighted Average
Exercise Price | | Weighted Average
Remaining
Contractual Life
(in years) | | Aggregate
Intrinsic
Value |
| Options outstanding as of December 29, 2012 | 5,860,403 |
| | $ | 39.11 |
| | | | |
|
| Options granted | 600,249 |
| | $ | 40.63 |
| | | | |
|
| Options exercised | (2,557,744 | ) | | $ | 36.68 |
| | | | |
|
| Options canceled | (134,175 | ) | | $ | 44.73 |
| | | | |
|
| Options outstanding as of December 28, 2013 | 3,768,733 |
| | $ | 40.81 |
| | | | |
|
| Options exercisable as of December 28, 2013 | 2,188,734 |
| | $ | 42.63 |
| | 2.12 | | $ | 26,039 |
|
|
| | | | | | | | |
| | Fiscal Year |
| | 2016 | | 2015 | | 2014 |
| Expected life (in years) | 3.6 |
| | 3.6 |
| | 4.2 |
|
| Expected volatility | 25 | % | | 28 | % | | 30 | % |
| Risk-free interest rate | 1.2 | % | | 1.1 | % | | 1.5 | % |
| Expected dividend yield | 0 | % | | 0 | % | | 0 | % |
The weighted-average grant date fair value of stock options granted was $15.12, $17.24 and $15.19 for fiscal years 2016, 2015 and 2014, respectively.
As of December 28, 2013,31, 2016, the unrecognized compensation cost related to1,564,777 unvested stock options expected to vest was $10,589.$10.8 million. This unrecognized compensation will be recognized over an estimated weighted-average amortization period of 27.4 months.2.2 years.
The total intrinsic value of options exercised during the fiscal years ending December 28, 2013, December 29, 20122016, 2015 and December 31, 20112014 was $24,737, $5,135$23.0 million, $28.3 million and $7,950,$30.5 million, respectively, with intrinsic value defined as the difference between the market price on the date of exercise and the grant dateexercise price. The total amount of cash received from the exercise of options during 2013 was $93,789. The actual tax benefit realized for the tax deductions from option exercises totaled $8,983 for the year ended December 28, 2013.
The following table summarizes significant ranges of outstandingRestricted Stock and exercisable options as of December 28, 2013:Restricted Stock Units
|
| | | | | | | | | | | | | | | | | | | | | | | | | |
| | Options Outstanding | | Options Exercisable |
| Range of Exercise Prices | Number
Outstanding | | Weighted
Average
Remaining
Contractual
Life
(In years) | | Weighted
Average
Exercise
Price | | Aggregate
Intrinsic
Value | | Options
Exercisable | | Weighted
Average
Remaining
Contractual
Life
(In years) | | Weighted
Average
Exercise
Price | | Aggregate
Intrinsic
Value |
| $20.01–$30.00 | 370,567 |
| | 2.15 | | 25.62 |
| | 10,269 |
| | 368,762 |
| | 2.14 | | 25.60 |
| | 10,224 |
|
| $30.01–$40.00 | 1,674,154 |
| | 4.10 | | 36.82 |
| | 27,639 |
| | 680,617 |
| | 3.76 | | 36.71 |
| | 11,312 |
|
| $40.01–$50.00 | 1,225,667 |
| | 3.54 | | 43.64 |
| | 11,873 |
| | 641,010 |
| | 1.14 | | 46.39 |
| | 4,449 |
|
| $50.01–$60.00 | 463,105 |
| | 1.11 | | 58.17 |
| | 54 |
| | 463,105 |
| | 1.11 | | 58.17 |
| | 54 |
|
| $60.01–$70.00 | 35,240 |
| | 1.28 | | 62.78 |
| | — |
| | 35,240 |
| | 1.28 | | 62.78 |
| | — |
|
| Totals | 3,768,733 |
| | 3.33 | | $ | 40.80 |
| | $ | 49,835 |
| | 2,188,734 |
| | 2.12 | | $ | 42.63 |
| | $ | 26,039 |
|
The aggregate intrinsic value in the preceding table represents the total intrinsic value, based on a closing stock price of $53.33 as of December 28, 2013, that would have been received by the option holders had all option holders exercised their options as of that date. The total number of in-the-money options exercisable as of December 28, 2013 was 1,709,189.
The following table summarizes the non-vestedrestricted stock optionand restricted stock units activity in the equity incentive plans for the fiscal year ending December 28, 2013:2016:
|
| | | | | | |
| | Non-vested Stock Options | | Weighted Average
Exercise Price |
| December 29, 2012 | 1,989,722 |
| | $ | 34.91 |
|
| Granted | 600,249 |
| | 40.63 |
|
| Forfeited | (41,901 | ) | | 36.98 |
|
| Vested | (968,071 | ) | | 32.90 |
|
| December 28, 2013 | 1,579,999 |
| | $ | 38.26 |
|
|
| | | | | | |
| | Restricted Stock and Restricted Stock Units | | Weighted
Average
Grant Date
Fair Value |
| | (in thousands) | | |
| December 26, 2015 | 607 |
| | $ | 55.52 |
|
| Granted | 236 |
| | $ | 75.10 |
|
| Vested | (296 | ) | | $ | 49.29 |
|
| Canceled | (32 | ) | | $ | 63.36 |
|
| December 31, 2016 | 515 |
| | $ | 67.62 |
|
As of December 31, 2016, the unrecognized compensation cost related to shares of unvested restricted stock and restricted stock units expected to vest was $19.2 million, which is expected to be recognized over an estimated weighted-average amortization period of 1.2 years. The total fair value of restricted stock and restricted stock unit grants that vested during fiscal years 2016, 2015 and 2014 was $14.6 million, $15.7 million and $13.9 million, respectively.
81Performance Based Stock Award Program
The Company issues PSUs to certain corporate officers. The number of shares of common stock issued for each PSU is adjusted based on a performance condition linked to the Company’s financial performance. Certain awards are further adjusted based on a market condition, which is calculated based on the Company’s stock performance relative to a peer group over the three-year vesting period. The fair value of the market condition is reflected in the fair value of the award at grant date.
The Company utilizes a Monte Carlo simulation valuation model to value these awards. Information pertaining to the Company’s PSUs and the related estimated weighted-average assumptions used to calculate their fair value were as follows:
CHARLES RIVER LABORATORIES INTERNATIONAL, INC.
NOTES TO CONSOLIDATED FINANCIAL STATEMENTS (Continued)
(dollars in thousands, except per share amounts)
Restricted Stock
Stock compensation expense associated with restricted common stock is charged for the market value on the date of grant, less estimated forfeitures, and is amortized over the awards' vesting period on a straight-line basis.
The following table summarizes the restricted stock activity for 2013:
|
| | | | | | |
| | Restricted Stock | | Weighted
Average
Grant Date
Fair Value |
| Outstanding as of December 29, 2012 | 934,505 |
| | $ | 35.83 |
|
| Granted | 571,499 |
| | 40.60 |
|
| Vested | (373,548 | ) | | 40.41 |
|
| Canceled | (35,906 | ) | | 45.32 |
|
| Outstanding as of December 28, 2013 | 1,096,550 |
| | $ | 36.44 |
|
|
| | | | | | | | | | | |
| | Fiscal Year |
| | 2016 | | 2015 | | 2014 |
| PSUs granted | 190,628 |
| | 148,900 |
| | 214,823 |
|
| Weighted average per share fair value | $ | 80.38 |
| | $ | 88.62 |
| | $ | 67.82 |
|
| Key Assumptions: | | | | | |
| Expected volatility | 24 | % | | 23 | % | | 29 | % |
| Risk-free interest rate | 0.91 | % | | 0.96 | % | | 0.63 | % |
| Expected dividend yield | — | % | | — | % | | — | % |
| 20 trading day average stock price on grant date | (4.8 | )% | | 20.6 | % | | 13.1 | % |
AsThe maximum amount of December 28, 2013,common shares to be issued upon vesting of PSUs is approximately 0.3 million. For fiscal years 2016, 2015 and 2014, the unrecognizedCompany recognized stock-based compensation cost related to sharesPSUs of unvested restricted stock expected to vest was $28,313. This unrecognized compensation will be recognized over an estimated weighted-average amortization period of 29.7 months.$19.7 million, $14.7 million and $8.5 million, respectively. The total fair value of restricted stock grantsPSUs that vested during the fiscal years ending December 28, 20132016 and 2015 was $18.0 million and $6.6 million, respectively.
In fiscal year 2016, the Company also issued approximately 18,000 PSUs using a weighted average fair value per share of $73.70. These PSUs vest upon the achievement of financial targets and other performance measures.
12. FOREIGN CURRENCY CONTRACTS
The Company enters into foreign exchange forward contracts to limit its foreign currency exposure related to intercompany loans that are not of a long-term investment nature. These contracts are recorded at fair value in the Company’s consolidated balance sheet and are not designated as hedging instruments. Any gains or losses on such contracts are immediately recognized in other income (expense), December 29, 2012net, and are largely offset by the remeasurement of the underlying intercompany loan balances.
The Company did not have any foreign currency contracts open as of December 31, 2011 was $15,095, $10,3852016. The notional amount and $10,989, respectively. fair value of the Company’s foreign currency forward contracts as of December 26, 2015 were as follows:
|
| | | | | | | | |
| Notional Amount | | Fair Value | | Balance Sheet Location |
| | | | | |
| (in thousands) |
| $ | 88,483 |
| | $ | 15 |
| | Other current assets |
The actual tax benefit realized forfollowing table summarizes gains (losses) recognized on foreign exchange forward contracts related to intercompany loans denominated in British Pounds and Euros on the tax deductions from restricted stock grants that vested totaled $5,372 for the year ended Company’s consolidated statement of income:
|
| | | | | | | | |
| | | Fiscal Year |
| Location of Gain (Loss) | | 2016 | | 2015 |
| | | | | |
| | | (in thousands) |
| Other income (expense), net | | $ | 3,373 |
| | $ | (4,917 | ) |
The forward contracts outstanding as of December 28, 2013.26, 2015 had durations of approximately 3 months.
Performance Based Stock Award ProgramIn February 2013, we granted 163,847 performance-based stock awards ("Performance Share Units", or "PSUs") to certain executive officers. The PSUs will be paid out in our common stock based upon the results of two metrics: (1) performance based on our earnings per share with certain defined adjustments and (2) our relative stock price market performance based on a 3-year relative Total Shareholder Return calculation. Accordingly, the actual total number of our shares into which the granted PSUs will convert can range from zero shares to 327,694 shares. The PSUs will be fully vested in December 2015 and will be paid out in the form of our common stock in the first quarter of 2016.
Compensation expense associated these awards, along with performance-based awards made in prior years, was $2,171, $(28) and $188 for the years ended December 28, 2013, December 29, 2012 and December 31, 2011, respectively.
10.13. COMMITMENTS AND CONTINGENCIES
Operating Leases
We have commitments for various operating leases for machinery and equipment, vehicles, office equipment, landThe Company rents laboratory and office space. As a matter of ordinary business course, we occasionally guaranteespace, land, vehicles and certain lease commitments to landlords. Rent expense for all operating leases was $16,731, $18,246 and $18,778 in 2013, 2012 and 2011, respectively.
Future minimum payments by year and in the aggregate,equipment under non-cancellable operating leases. These lease agreements contain various clauses for renewal at the Company’s option and, in certain cases, rent escalation clauses. Rental expense under these leases with initial or remaining terms of one year or more, consist ofamounted to $21.8 million, $23.4 million and $14.2 million in fiscal years 2016, 2015 and 2014, respectively. In addition to rent, the following at December 28, 2013:leases may require the Company to pay additional amounts for taxes, insurance, maintenance and other operating expenses.
|
| | | |
| 2014 | $ | 13,978 |
|
| 2015 | 10,688 |
|
| 2016 | 8,061 |
|
| 2017 | 6,008 |
|
| 2018 | 4,544 |
|
| Thereafter | 11,839 |
|
CHARLES RIVER LABORATORIES INTERNATIONAL, INC.
NOTES TO CONSOLIDATED FINANCIAL STATEMENTS (Continued)
(dollars in thousands, except per share amounts)
As of December 31, 2016, minimum rental commitments under non-cancellable leases, net of income from subleases, for each of the next five years and total thereafter were as follows:
|
| | | | |
| | | Minimum Lease Payments |
| | | (in thousands) |
| 2017 | | $ | 23,410 |
|
| 2018 | | 20,273 |
|
| 2019 | | 17,119 |
|
| 2020 | | 13,254 |
|
| 2021 | | 8,104 |
|
| Thereafter | | 19,116 |
|
| Total | | $ | 101,276 |
|
Insurance
We maintain variousThe Company maintains certain insurance policies that maintain large deductibles up to $750,approximately $5.0 million, some with or without stop-loss limits, depending on market availability. Deductibles forInsurance policies at certain property insurance policies in the event of a catastrophic event for certain locations are based on a percentage of the insured assets, for which deductibles for certain property may exceed $750.
$5.0 million in the event of a catastrophic event.
Litigation
Various lawsuits, claims and proceedings of a nature considered normal to ourits business are pending against us. In the opinion of management,Company. While the outcome of suchany of these proceedings cannot be accurately predicted, the Company does not believe the ultimate resolution of any of these existing matters would have a material adverse effect on the Company’s business or financial condition.
In July 2015, IDEXX Laboratories, Inc. and litigation currently pending will not materially affect our consolidated financial statements. We expenseIDEXX Distribution, Inc. (collectively, IDEXX) filed a complaint in the United States District Court for the District of Delaware alleging the Company has infringed three recently issued patents related to a blood spot sample collection method used in determining the presence or absence of an infectious disease in a population of rodents. On September 21, 2015, the Company timely filed a motion to dismiss the complaint on the grounds that all of the claims are directed to unpatentable subject matter and therefore are invalid. On October 7, 2015, IDEXX filed an amended complaint, which substantially asserted the same patents and infringement allegations as incurred legal costs expectedasserted in the original complaint, and on October 26, 2015, the Company timely filed a motion to be incurred in connectiondismiss this amended complaint. The hearing on the motion to dismiss was held on January 12, 2016. On July 1, 2016, the Court issued an opinion denying the motion to dismiss. The Company filed its answer to the complaint on July 21, 2016. In addition, on July 29, 2016, the Company initiated an inter partes review (IPR) procedure with loss contingencies.the United States Patent and Trademark Office challenging the validity of the IDEXX patents. On February 6, 2017, we entered into a settlement agreement with IDEXX, which involved the withdrawal by IDEXX of their complaint and withdrawal by us of the IPR.
In May 2013, the Company commenced an investigation into inaccurate billing with respect to certain government contracts. The Company promptly reported these matters to the relevant government contracting officers, the Department of Health and Human Services'Services’ Office of the Inspector General, and the Department of Justice, and we arethe Company is cooperating with these agencies to ensure the proper repayment and resolution of this matter. The Company previously identified approximately $1,500 in$1.5 million of excess amounts billed on these contracts since January 1, 2007, and reservedrecorded a liability for such amount. Because of the preliminary stage ofBased on its ongoing discussions with the government, and complex nature of this matter, the Company believes that it is reasonably possible thathas recorded an additional lossescharge of $0.3 million during the fiscal year 2016. The Company’s best estimate, which totals $1.8 million, may be incurred. However,subject to change based on the terms of any final settlement with the Department of Justice and the Department of Health and Human Services’ Office of the Inspector General.
Guarantees
The Company enters into certain agreements with other parties in the ordinary course of business that contain indemnification provisions. These typically include agreements with directors and officers, business partners, contractors, landlords, and customers. Under these provisions, the Company cannot at this time estimategenerally indemnifies and holds harmless the indemnified party for losses suffered or incurred by the indemnified party as a result of the Company’s activities. These indemnification provisions generally survive termination of the underlying agreement. The maximum potential rangeamount of loss beyond the current reserve of $1,500.
In July 2012, a Mauritius supplier of large animal models submitted an Application for Arbitration with The Permanent Secretariat, The Permanent Court of Arbitration, The Mauritius Chamber of Commerce and Industry in Port Louis, Mauritius. The supplier asserted thatfuture payments the Company failedcould be required to pay certain invoices and the supplier was therefore permittedmake under these indemnification provisions is unlimited. However, to terminate the supply agreement. The Company filed a counterclaim asserting that the supplier had failed to meet its contractual obligations under the supply agreement. The arbitration hearing relating to this contract dispute took place in Mauritius from August 13-15, 2013. While no prediction may be made as to the outcome of arbitration,date the Company intends to defend against this proceeding vigorously and therefore an estimate of the possible loss or range of loss cannot be made.
has not incurred
11. BUSINESS SEGMENT AND GEOGRAPHIC INFORMATION
We report two business segments, Research Models and Services (RMS) and Preclinical Services (PCS). Our RMS segment includes sales of research models, genetically engineered models and services (GEMS), insourcing solutions (IS), research animal diagnostic services (RADS), discovery research services (DRS), Endotoxin and Microbial Detection (EMD) products and services and avian vaccine products and services. Our PCS segment includes services required to take a drug through the development process, which includes DRS, safety assessment and Biologics Testing Solutions.
The following table presents sales and other financial information by business segment. Net sales represent sales originating in entities primarily engaged in either provision of RMS or PCS. Long-lived assets include property, plant and equipment and other long-lived assets
CHARLES RIVER LABORATORIES INTERNATIONAL, INC.
NOTES TO CONSOLIDATED FINANCIAL STATEMENTS (Continued)
(dollars
material costs to defend lawsuits or settle claims related to these indemnification provisions. As a result, the estimated fair value of these obligations is minimal.
Purchase Obligations
The Company enters into unconditional purchase obligations, in thousands, except per share amounts)
the ordinary course of business, that include agreements to purchase goods or services that are enforceable and legally binding and that specify all significant terms including: fixed or minimum quantities to be purchased; fixed, minimum or variable price provisions; and the approximate timing of the transaction. Purchase obligations exclude agreements that are cancellable at any time without penalty. The aggregate amount of the Company’s unconditional purchase obligations totaled $86.2 million as of December 31, 2016. |
| | | | | | | | | | | |
| | 2013 | | 2012 | | 2011 |
| Research Models and Services | | | | | |
| Net sales | $ | 707,126 |
| | $ | 695,083 |
| | $ | 705,419 |
|
| Gross profit | 284,808 |
| | 289,750 |
| | 297,327 |
|
| Operating income | 181,321 |
| | 202,362 |
| | 206,319 |
|
| Total assets | 752,499 |
| | 698,134 |
| | 687,346 |
|
| Long-lived assets | 264,706 |
| | 272,559 |
| | 282,388 |
|
| Depreciation and amortization | 54,822 |
| | 37,541 |
| | 37,240 |
|
| Capital expenditures | 24,384 |
| | 36,856 |
| | 34,257 |
|
| Preclinical Services | | | |
| | |
|
| Net sales | $ | 458,402 |
| | $ | 434,447 |
| | $ | 437,228 |
|
| Gross profit | 110,093 |
| | 102,331 |
| | 104,915 |
|
| Operating income | 44,056 |
| | 34,628 |
| | 24,925 |
|
| Total assets | 892,122 |
| | 888,210 |
| | 869,881 |
|
| Long-lived assets | 473,440 |
| | 493,120 |
| | 513,302 |
|
| Depreciation and amortization | 41,814 |
| | 43,734 |
| | 47,990 |
|
| Capital expenditures | 14,770 |
| | 10,678 |
| | 14,886 |
|
A reconciliation14. RESTRUCTURING AND ASSET IMPAIRMENTS
Workforce Reductions
The Company periodically implements workforce reductions to improve operating efficiency at various sites. The following table provides a rollforward of segment operating income to consolidated operating income is as follows:the Company’s severance and retention costs liability:
|
| | | | | | | | | | | |
| | Fiscal Year Ended |
| | December 28, 2013 | | December 29, 2012 | | December 31, 2011 |
| Total segment operating income | $ | 225,377 |
| | $ | 236,990 |
| | $ | 231,244 |
|
| Unallocated corporate overhead | (73,976 | ) | | (71,225 | ) | | (56,938 | ) |
| Consolidated operating income | $ | 151,401 |
| | $ | 165,765 |
| | $ | 174,306 |
|
|
| | | | | | | | | | | |
| | December 31, 2016 | | December 26, 2015 | | December 27, 2014 |
| | | | | | |
| | (in thousands) |
| Balance, beginning of period | $ | 2,969 |
| | $ | 2,666 |
| | $ | 2,782 |
|
| Expense | 8,454 |
| | 6,173 |
| | 7,792 |
|
| Payments / utilization | (7,473 | ) | | (5,820 | ) | | (7,900 | ) |
| Foreign currency adjustments | (270 | ) | | (50 | ) | | (8 | ) |
| Balance, end of period | $ | 3,680 |
| | $ | 2,969 |
| | $ | 2,666 |
|
As of December 31, 2016 and December 26, 2015, $3.6 million and $2.6 million of severance and retention costs liability, respectively, was included in accrued compensation and $0.1 million and $0.3 million, respectively, was included in other long-term liabilities on the Company's consolidated balance sheets.
Net sales for each significant product or service offering are as follows:The following table presents severance and retention costs by classification on the consolidated statements of income:
|
| | | | | | | | | | | |
| | Fiscal Year Ended |
| | December 28, 2013 | | December 29, 2012 | | December 31, 2011 |
| Research models | $ | 381,561 |
| | $ | 381,790 |
| | $ | 401,660 |
|
| Research model services | 212,647 |
| | 219,671 |
| | 220,698 |
|
| EMD | 112,918 |
| | 93,622 |
| | 83,061 |
|
| Total research models | 707,126 |
| | 695,083 |
| | 705,419 |
|
| Total preclinical services | 458,402 |
| | 434,447 |
| | 437,228 |
|
| Total sales | $ | 1,165,528 |
| | $ | 1,129,530 |
| | $ | 1,142,647 |
|
|
| | | | | | | | | | | |
| | Fiscal Year |
| | 2016 | | 2015 | | 2014 |
| | | | | | |
| | (in thousands) |
| Cost of services provided and products sold (excluding amortization of intangible assets) | $ | 4,717 |
| | $ | 735 |
| | $ | 3,342 |
|
| Selling, general and administrative | 3,737 |
| | 5,438 |
| | 4,450 |
|
| Total severance and retention costs | $ | 8,454 |
| | $ | 6,173 |
| | $ | 7,792 |
|
The following presents severance and retention costs by reportable segment:
|
| | | | | | | | | | | |
| | Fiscal Year |
| | 2016 | | 2015 | | 2014 |
| | | | | | |
| | (in thousands) |
| RMS | $ | 759 |
| | $ | 1,338 |
| | $ | 4,593 |
|
| DSA | 7,689 |
| | 1,068 |
| | 2,912 |
|
| Manufacturing | 6 |
| | 1,639 |
| | 166 |
|
| Unallocated corporate | — |
| | 2,128 |
| | 121 |
|
| Total severance and retention costs | $ | 8,454 |
| | $ | 6,173 |
| | $ | 7,792 |
|
Facilities
In fiscal year 2016, the Company commenced a consolidation of small DSA facilities in the U.S., Ireland, and the United Kingdom. As a result, an asset impairment charge of $9.4 million was recorded related to the consolidation plans.
CHARLES RIVER LABORATORIES INTERNATIONAL, INC.
NOTES TO CONSOLIDATED FINANCIAL STATEMENTS (Continued)
(dollars
In fiscal year 2015, the Company commenced a consolidation of certain RMS facilities in thousands, except per share amounts)the U.S., Europe, and Japan. As a result, an asset impairment charge of $1.8 million was recorded related to the consolidation plans.
In fiscal year 2014, the Company committed to plans to consolidate certain research model operations in the U.S., Japan, and Europe. As a result, the Company recorded $2.2 million of asset impairments and other charges and $4.3 million of accelerated depreciation related to certain facilities impacted by the consolidation plans. Also, in fiscal year 2014, the Company recorded a gain of $1.0 million on the sale of a European facility.
15. SEGMENT AND GEOGRAPHIC INFORMATION
The Company revised its reportable segments during fiscal year 2016 to align with its view of the business following its acquisition of WIL Research. See Note 1, “Description of Business and Summary of Significant Accounting Policies.” The Company reported segment results on this basis retrospectively for all comparable prior periods. Asset information on a reportable segment basis is not disclosed as this information is not separately identified and internally reported to the Company’s Chief Operating Decision Maker.
The following table presents revenue and other financial information by reportable segment:
|
| | | | | | | | | | | |
| | Fiscal Year |
| | 2016 | | 2015 | | 2014 |
| | | | | | |
| | (in thousands) |
| RMS | | | | | |
| Revenue | $ | 494,037 |
| | $ | 470,411 |
| | $ | 503,656 |
|
| Operating income | 136,365 |
| | 120,973 |
| | 120,736 |
|
| Depreciation and amortization | 20,853 |
| | 22,526 |
| | 27,309 |
|
| Capital expenditures | 11,642 |
| | 17,398 |
| | 18,669 |
|
| DSA | | | |
| | |
|
| Revenue | $ | 836,593 |
| | $ | 612,173 |
| | $ | 538,218 |
|
| Operating income | 138,157 |
| | 121,981 |
| | 69,749 |
|
| Depreciation and amortization | 71,816 |
| | 46,812 |
| | 47,138 |
|
| Capital expenditures | 27,493 |
| | 30,333 |
| | 19,759 |
|
| Manufacturing | | | | | |
| Revenue | $ | 350,802 |
| | $ | 280,718 |
| | $ | 255,788 |
|
| Operating income | 104,543 |
| | 74,675 |
| | 79,260 |
|
| Depreciation and amortization | 25,566 |
| | 18,129 |
| | 14,295 |
|
| Capital expenditures | 12,247 |
| | 9,814 |
| | 15,621 |
|
For fiscal years ended 2016, 2015 and 2014, reconciliations of segment operating income and capital expenditures to the respective consolidated amounts are as follows:
|
| | | | | | | | | | | | | | | | | | | | | | | |
| | Operating Income | | Capital Expenditures |
| | Fiscal Year | | Fiscal Year |
| | 2016 | | 2015 | | 2014 | | 2016 | | 2015 | | 2014 |
| | | | | | | | | | | | |
| | (in thousands) |
| Total reportable segments | $ | 379,065 |
| | $ | 317,629 |
| | $ | 269,745 |
| | $ | 51,382 |
| | $ | 57,545 |
| | $ | 54,049 |
|
| Unallocated corporate | (141,646 | ) | | (111,180 | ) | | (92,075 | ) | | 3,906 |
| | 5,707 |
| | 2,876 |
|
| Total consolidated | $ | 237,419 |
| | $ | 206,449 |
| | $ | 177,670 |
| | $ | 55,288 |
| | $ | 63,252 |
| | $ | 56,925 |
|
Revenue for each significant product or service offering is as follows:
CHARLES RIVER LABORATORIES INTERNATIONAL, INC.
NOTES TO CONSOLIDATED FINANCIAL STATEMENTS (Continued)
|
| | | | | | | | | | | |
| | Fiscal Year |
| | 2016 | | 2015 | | 2014 |
| | | | | | |
| | (in thousands) |
| RMS | $ | 494,037 |
| | $ | 470,411 |
| | $ | 503,656 |
|
| DSA | 836,593 |
| | 612,173 |
| | 538,218 |
|
| Manufacturing | 350,802 |
| | 280,718 |
| | 255,788 |
|
| Total revenue | $ | 1,681,432 |
| | $ | 1,363,302 |
| | $ | 1,297,662 |
|
A summary of unallocated corporate overhead consists of the following:following:
|
| | | | | | | | | | | |
| | December 28, 2013 | | December 29, 2012 | | December 31, 2011 |
| Stock-based compensation expense | $ | 13,411 |
| | $ | 11,724 |
| | $ | 11,159 |
|
| U.S. retirement plans | 4,877 |
| | 4,831 |
| | 3,802 |
|
| Audit, tax and related expense | 4,365 |
| | 3,019 |
| | 3,069 |
|
| Salary and bonus | 21,983 |
| | 20,050 |
| | 18,421 |
|
| Global IT | 11,646 |
| | 12,622 |
| | 11,785 |
|
| Employee health, LDP and fringe benefit expense | (3,414 | ) | | (4,569 | ) | | (2,952 | ) |
| Consulting and professional services | 4,301 |
| | 4,434 |
| | 8,432 |
|
| Depreciation expense | 6,334 |
| | 6,260 |
| | 6,312 |
|
| Transaction (acquisition/disposition) costs | 1,752 |
| | 3,772 |
| | 1,329 |
|
| Contingent consideration write-down | — |
| | — |
| | (5,598 | ) |
| Other general unallocated corporate expenses | 8,721 |
| | 9,082 |
| | 1,179 |
|
| Total unallocated corporate overhead costs | $ | 73,976 |
| | $ | 71,225 |
| | $ | 56,938 |
|
|
| | | | | | | | | | | |
| | Fiscal Year |
| | 2016 | | 2015 | | 2014 |
| | | | | | |
| | (in thousands) |
| Stock-based compensation expense | $ | 27,272 |
| | $ | 25,751 |
| | $ | 18,474 |
|
| Salary, bonus, and fringe | 39,189 |
| | 33,026 |
| | 30,838 |
|
| Consulting, audit, and professional services | 23,421 |
| | 15,418 |
| | 13,431 |
|
| IT related expenses | 13,233 |
| | 8,400 |
| | 6,528 |
|
| Depreciation expense | 8,423 |
| | 7,414 |
| | 7,703 |
|
| Acquisition related adjustments | 15,608 |
| | 11,644 |
| | 6,285 |
|
| Other general unallocated corporate expenses | 14,500 |
| | 9,527 |
| | 8,816 |
|
| Total unallocated corporate overhead costs | $ | 141,646 |
| | $ | 111,180 |
| | $ | 92,075 |
|
Other general unallocated corporate expenses consist of various departmental costs including those associated with departments such as senior executives, corporate accounting, legal, tax, human resources, treasury, and investor relations.
The following table presents salesRevenue and other financial informationlong-lived assets by geographic regions. area are as follows:
|
| | | | | | | | | | | | | | | | | | | | | | | |
| | U.S. | | Europe | | Canada | | Japan | | Other Non-U.S. | | Consolidated |
| | | | | | | | | | | | |
| | (in thousands) |
| 2016 | | | | | | | | | | | |
| Revenue | $ | 850,422 |
| | $ | 520,937 |
| | $ | 194,210 |
| | $ | 46,829 |
| | $ | 69,034 |
| | $ | 1,681,432 |
|
| Long-lived assets | 462,330 |
| | 177,423 |
| | 78,866 |
| | 20,941 |
| | 16,267 |
| | 755,827 |
|
| 2015 | | | | | | | | | | | |
| Revenue | $ | 659,466 |
| | $ | 435,491 |
| | $ | 172,349 |
| | $ | 40,520 |
| | $ | 55,476 |
| | $ | 1,363,302 |
|
| Long-lived assets | 402,238 |
| | 159,445 |
| | 77,535 |
| | 22,348 |
| | 16,393 |
| | 677,959 |
|
| 2014 | | | | | | | | | | |
|
|
| Revenue | $ | 588,531 |
| | $ | 446,263 |
| | $ | 163,490 |
| | $ | 49,921 |
| | $ | 49,457 |
| | $ | 1,297,662 |
|
| Long-lived assets | 386,624 |
| | 153,203 |
| | 95,272 |
| | 23,896 |
| | 17,802 |
| | 676,797 |
|
Included in the other non-U.S. category belowabove are operations located in China, Korea, Australia, Singapore, and India. Sales to unaffiliated clientsRevenues represent net sales originating in entities physically located in the identified geographic area. Long-lived assets include property, plant, and equipment and other long-lived assets.
|
| | | | | | | | | | | | | | | | | | | | | | | |
| | U.S. | | Europe | | Canada | | Japan | | Other Non-U.S. | | Consolidated |
| 2013 | | | | | | | | | | | |
| Sales to unaffiliated clients | $ | 551,340 |
| | $ | 353,688 |
| | $ | 162,404 |
| | $ | 59,370 |
| | $ | 38,726 |
| | $ | 1,165,528 |
|
| Long lived assets | 447,829 |
| | 130,855 |
| | 109,811 |
| | 30,589 |
| | 19,062 |
| | 738,146 |
|
| 2012 | | | | | | | | | | | |
| Sales to unaffiliated clients | $ | 534,817 |
| | $ | 341,550 |
| | $ | 160,004 |
| | $ | 77,707 |
| | $ | 15,452 |
| | $ | 1,129,530 |
|
| Long lived assets | 476,927 |
| | 122,351 |
| | 124,302 |
| | 39,642 |
| | 2,457 |
| | 765,679 |
|
| 2011 | | | | | | | | | | | |
| Sales to unaffiliated clients | $ | 545,185 |
| | $ | 348,455 |
| | $ | 158,997 |
| | $ | 75,992 |
| | $ | 14,018 |
| | $ | 1,142,647 |
|
| Long lived assets | 497,197 |
| | 123,634 |
| | 127,531 |
| | 45,857 |
| | 1,470 |
| | 795,689 |
|
12. DISCONTINUED OPERATIONS
In 2011, we disposed of our Phase I clinical business for a nominal amount. As part of the disposition we remained the guarantor of the Phase I facility lease. During the second quarter of 2011, we recognized the value of the guarantee net of the buyer's related indemnity as a liability of $2,994, which we are amortizing ratably over the remaining term of the lease. The facility lease runs through January 2021 with remaining lease payments totaling $12,086 as of December 28, 2013.
In 2012, we concluded that the decreasing financial viability of the lessee increased the probability that we would be required to make future lease payments as guarantor. As a result, we recorded an additional contingent loss of $7,158 for the guarantee, reflecting our estimate of the total future lease payments less sublease income.
CHARLES RIVER LABORATORIES INTERNATIONAL, INC.
NOTES TO CONSOLIDATED FINANCIAL STATEMENTS (Continued)
(dollars
16. SELECTED QUARTERLY FINANCIAL DATA (unaudited)
The following table contains quarterly financial information for fiscal years 2016 and 2015. The operating results for any quarter are not necessarily indicative of future period results.
|
| | | | | | | | | | | | | | | |
| | First Quarter | | Second Quarter | | Third Quarter | | Fourth Quarter |
| | | | | | | | |
| Fiscal Year 2016 | (in thousands, except per share amounts) |
| Total revenue | $ | 354,868 |
| | $ | 434,055 |
| | $ | 425,720 |
| | $ | 466,789 |
|
Gross profit(1) | 140,768 |
| | 169,747 |
| | 156,270 |
| | 179,881 |
|
| Operating income | 51,472 |
| | 58,061 |
| | 58,795 |
| | 69,091 |
|
| Net income attributable to common shareholders | 37,143 |
| | 35,207 |
| | 37,735 |
| | 44,680 |
|
| Earnings (loss) per common share | | | | | | | |
| Basic: | | | | | | | |
| Continuing operations attributable to common shareholders | $ | 0.80 |
| | $ | 0.75 |
| | $ | 0.79 |
| | $ | 0.95 |
|
| Discontinued operations | $ | — |
| | $ | — |
| | $ | 0.01 |
| | $ | — |
|
| Net income attributable to common shareholders | $ | 0.80 |
| | $ | 0.75 |
| | $ | 0.80 |
| | $ | 0.95 |
|
| Diluted: | | | | | | | |
| Continuing operations attributable to common shareholders | $ | 0.78 |
| | $ | 0.73 |
| | $ | 0.78 |
| | $ | 0.93 |
|
| Discontinued operations | $ | — |
| | $ | — |
| | $ | 0.01 |
| | $ | — |
|
| Net income attributable to common shareholders | $ | 0.78 |
| | $ | 0.73 |
| | $ | 0.79 |
| | $ | 0.93 |
|
| Fiscal Year 2015 | | | | | | | |
| Total revenue | $ | 320,414 |
| | $ | 339,573 |
| | $ | 349,465 |
| | $ | 353,850 |
|
Gross profit(1) | 119,660 |
| | 132,783 |
| | 138,075 |
| | 140,574 |
|
| Operating income | 43,005 |
| | 55,735 |
| | 55,440 |
| | 52,269 |
|
| Net income attributable to common shareholders | 31,541 |
| | 48,509 |
| | 37,379 |
| | 31,884 |
|
| Earnings (loss) per common share | | | | | | | |
| Basic: | | | | | | | |
| Continuing operations attributable to common shareholders | $ | 0.67 |
| | $ | 1.04 |
| | $ | 0.81 |
| | $ | 0.71 |
|
| Discontinued operations | $ | — |
| | $ | — |
| | $ | — |
| | $ | (0.02 | ) |
| Net income attributable to common shareholders | $ | 0.67 |
| | $ | 1.04 |
| | $ | 0.81 |
| | $ | 0.69 |
|
| Diluted: | | | | | | | |
| Continuing operations attributable to common shareholders | $ | 0.66 |
| | $ | 1.02 |
| | $ | 0.79 |
| | $ | 0.69 |
|
| Discontinued operations | $ | — |
| | $ | — |
| | $ | — |
| | $ | (0.02 | ) |
| Net income attributable to common shareholders | $ | 0.66 |
| | $ | 1.02 |
| | $ | 0.79 |
| | $ | 0.67 |
|
(1) Gross profit is calculated as total revenues minus cost of revenue (excluding amortization of intangible assets). |
Full-year amounts may not sum due to rounding.
17. SUBSEQUENT EVENTS
On February 10, 2017, the Company completed the divestiture of its CDMO business to Quotient Clinical Ltd., based in thousands, except per share amounts)London, England, for $75.0 million in cash, subject to certain post-closing adjustments.
In April 2013, the buyer of our Phase I clinicalThe CDMO business, filed for Chapter 11 bankruptcy. As a result, we revised our estimatewhich represented approximately 1% of the total future lease payments, less estimated sublease income, resultingCompany’s 2016 consolidated revenue, was acquired in an additional charge of $1,316. In July 2013, the bankruptcy court approved the rejectionApril 2016 as part of the lease,acquisition of WIL Research. See Note 1, “Description of Business and effective July 1, 2013, we assumed controlSummary of Significant Accounting Policies” and Note 2, “Business Acquisitions.” Following a strategic review, the Company determined that the CDMO business was not optimized within the Company’s portfolio at its current scale, and that the capital could be better deployed in other long-term growth opportunities.
The Company is in the process of evaluating the transaction and its impact on the financial statements, including evaluating the resulting gain (loss) that will be recognized. As of December 31, 2016, the carrying amounts of the leased property and assumed obligations under the lease consistent with the guarantee. The total carrying amountmajor classes of the liability for our obligation under the lease as of December 28, 2013 is $9,787 and is reflected on the consolidated balance sheet as a liability of discontinued operations.
The consolidated financial statements have been reclassified to segregate, as discontinued operations, the assets and liabilities operating results and cash flows, ofassociated with the businesses being discontinued for all periods presented. Operating results from discontinued operations areCDMO business were as follows:
|
| | | | | | | | | | |
| | Fiscal Year Ended |
| | December 28, 2013 | | December 29, 2012 | | December 31, 2011 |
|
| Net sales | $ | — |
| | $ | — |
| | 2,112 |
|
| Income (loss) from operations of discontinued businesses, before income taxes | (2,035 | ) | | (6,986 | ) | | (8,964 | ) |
| Provision (benefit) for income taxes | (770 | ) | | (2,734 | ) | | (3,419 | ) |
| Income (loss) from operations of discontinued businesses, net of taxes | $ | (1,265 | ) | | $ | (4,252 | ) | | (5,545 | ) |
Assets and liabilities of discontinued operations at December 2013 and December 2012 consisted of the following:
|
| | | | | | | |
| | December 28,
2013 | | December 29,
2012 |
| Current assets | $ | 750 |
| | $ | 495 |
|
| Long-term assets | 3,151 |
| | 3,328 |
|
| Total assets | $ | 3,901 |
| | $ | 3,823 |
|
| Current liabilities | $ | 1,931 |
| | $ | 1,802 |
|
| Long-term liabilities | 8,080 |
| | 8,795 |
|
| Total liabilities | $ | 10,011 |
| | $ | 10,597 |
|
Current assets include a current deferred tax asset. Non-current assets include a long-term deferred tax asset. Current and long-term liabilities consist of a lease guarantee.
CHARLES RIVER LABORATORIES INTERNATIONAL, INC.
SUPPLEMENTARY DATANOTES TO CONSOLIDATED FINANCIAL STATEMENTS (Continued)
Quarterly Information (Unaudited)
|
| | | | | | | | | | | | | | | |
| | First Quarter | | Second Quarter | | Third Quarter | | Fourth Quarter |
| Fiscal Year Ended December 28, 2013 | | | | | | | |
| Total net sales | $ | 291,238 |
| | $ | 292,933 |
| | $ | 292,129 |
| | $ | 289,228 |
|
| Gross profit | 104,211 |
| | 102,570 |
| | 99,926 |
| | 88,195 |
|
| Operating income | 42,763 |
| | 43,188 |
| | 40,843 |
| | 24,607 |
|
| Income from continuing operations, net of tax | 25,926 |
| | 28,628 |
| | 31,336 |
| | 19,526 |
|
| (Loss) income from discontinued businesses, net of tax | (155 | ) | | (915 | ) | | (113 | ) | | (82 | ) |
| Net income attributable to common shareholders | 25,578 |
| | 27,284 |
| | 30,867 |
| | $ | 19,099 |
|
| Earnings (loss) per common share | | | | | | | |
| Basic | | | | | | | |
| Continuing operations attributable to common shareholders | $ | 0.54 |
| | $ | 0.58 |
| | $ | 0.65 |
| | $ | 0.41 |
|
| Discontinued operations attributable to common shareholders | — |
| | (0.02 | ) | | — |
| | — |
|
| Net income attributable to common shareholders | $ | 0.54 |
| | $ | 0.57 |
| | $ | 0.64 |
| | $ | 0.41 |
|
| Diluted | | | | | | | |
| Continuing operations attributable to common shareholders | $ | 0.53 |
| | $ | 0.58 |
| | $ | 0.64 |
| | $ | 0.40 |
|
| Discontinued operations attributable to common shareholders | — |
| | (0.02 | ) | | — |
| | — |
|
| Net income attributable to common shareholders | $ | 0.53 |
| | $ | 0.56 |
| | $ | 0.64 |
| | $ | 0.40 |
|
| Fiscal Year Ended December 29, 2012 | | | | | | | |
| Total net sales | $ | 285,981 |
| | $ | 284,723 |
| | $ | 278,686 |
| | $ | 280,140 |
|
| Gross profit | 104,212 |
| | 103,585 |
| | 93,259 |
| | 94,573 |
|
| Operating income (loss) | 43,740 |
| | 49,274 |
| | 37,682 |
| | 35,069 |
|
| Income from continuing operations, net of tax | 26,740 |
| | 30,547 |
| | 22,384 |
| | 22,717 |
|
| Income (loss) from discontinued businesses, net of tax | 77 |
| | 42 |
| | (182 | ) | | (4,189 | ) |
| Net income attributable to common shareholders | $ | 26,439 |
| | $ | 30,468 |
| | $ | 21,972 |
| | $ | 18,416 |
|
| Earnings (loss) per common share | | | | | | | |
| Basic | | | | | | | |
| Continuing operations attributable to common shareholders | $ | 0.55 |
| | $ | 0.63 |
| | $ | 0.47 |
| | $ | 0.48 |
|
| Discontinued operations attributable to common shareholders | — |
| | — |
| | — |
| | (0.09 | ) |
| Net income attributable to common shareholders | $ | 0.55 |
| | $ | 0.63 |
| | $ | 0.46 |
| | $ | 0.40 |
|
| Diluted | | | | | | | |
| Continuing operations attributable to common shareholders | $ | 0.54 |
| | $ | 0.63 |
| | $ | 0.46 |
| | $ | 0.48 |
|
| Discontinued operations attributable to common shareholders | — |
| | — |
| | — |
| | (0.09 | ) |
| Net income attributable to common shareholders | $ | 0.54 |
| | $ | 0.63 |
| | $ | 0.46 |
| | $ | 0.39 |
|
|
| | | |
| | December 31, 2016 |
| | (in thousands) |
| Assets | |
| Current assets | $ | 4,270 |
|
| Property, plant and equipment, net | 11,313 |
|
| Goodwill | 35,857 |
|
| Long-term assets | 17,332 |
|
| Total assets | $ | 68,772 |
|
| Liabilities | |
| Current liabilities | $ | 5,840 |
|
| Long-term liabilities | 7,856 |
|
| Total liabilities | $ | 13,696 |
|
As of December 31, 2016, the assets and liabilities of the CDMO business were not classified as held-for-sale as management had not committed to a formal plan to sell the business and the sale was not deemed probable.
CHARLES RIVER LABORATORIES INTERNATIONAL, INC.
SUPPLEMENTARY DATA
Quarterly Segment Information (Unaudited)
|
| | | | | | | | | | | | | | | |
| | First Quarter | | Second Quarter | | Third Quarter | | Fourth Quarter |
| Fiscal Year Ended December 28, 2013 | | | | | | | |
| Research Models and Services | | | | | | | |
| Sales | $ | 182,489 |
| | $ | 178,973 |
| | $ | 173,405 |
| | $ | 172,259 |
|
| Gross margin | 80,435 |
| | 75,771 |
| | 65,710 |
| | 62,892 |
|
| Operating income | 55,303 |
| | 49,630 |
| | 40,260 |
| | 36,128 |
|
| Depreciation and amortization | 9,873 |
| | 10,629 |
| | 16,876 |
| | 17,444 |
|
| Capital expenditures | 4,010 |
| | 6,344 |
| | 6,110 |
| | 7,920 |
|
| Preclinical Services | | | | | | | |
| Sales | $ | 108,749 |
| | $ | 113,960 |
| | $ | 118,724 |
| | $ | 116,969 |
|
| Gross margin | 23,776 |
| | 26,799 |
| | 34,216 |
| | 25,302 |
|
| Operating income | 8,060 |
| | 10,935 |
| | 18,636 |
| | 6,425 |
|
| Depreciation and amortization | 10,137 |
| | 9,781 |
| | 10,039 |
| | 11,857 |
|
| Capital expenditures | 2,418 |
| | 3,451 |
| | 2,986 |
| | 5,915 |
|
| Unallocated corporate overhead | $ | (20,600 | ) | | $ | (17,377 | ) | | $ | (18,053 | ) | | $ | (17,946 | ) |
| Total | | | | | | | |
| Sales | $ | 291,238 |
| | $ | 292,933 |
| | $ | 292,129 |
| | $ | 289,228 |
|
| Gross margin | 104,211 |
| | 102,570 |
| | 99,926 |
| | 88,194 |
|
| Operating income | 42,763 |
| | 43,188 |
| | 40,843 |
| | 24,607 |
|
| Depreciation and amortization | 20,010 |
| | 20,410 |
| | 26,915 |
| | 29,301 |
|
| Capital expenditures | 6,428 |
| | 9,795 |
| | 9,096 |
| | 13,835 |
|
| | First Quarter | | Second Quarter | | Third Quarter | | Fourth Quarter |
| Fiscal Year Ended December 29, 2012 | | | | | | | |
| Research Models and Services | | | | | | | |
| Sales | $ | 183,152 |
| | $ | 173,611 |
| | $ | 166,484 |
| | $ | 171,836 |
|
| Gross margin | 82,196 |
| | 76,266 |
| | 65,902 |
| | 65,386 |
|
| Operating income | 59,467 |
| | 55,542 |
| | 43,389 |
| | 43,964 |
|
| Depreciation and amortization | 8,942 |
| | 9,085 |
| | 9,670 |
| | 9,844 |
|
| Capital expenditures | 12,900 |
| | 7,569 |
| | 7,423 |
| | 8,964 |
|
| Preclinical Services | | | | | | | |
| Sales | $ | 102,829 |
| | $ | 111,112 |
| | $ | 112,202 |
| | $ | 108,304 |
|
| Gross margin | 22,016 |
| | 27,319 |
| | 27,358 |
| | 25,638 |
|
| Operating income | 4,174 |
| | 10,809 |
| | 10,975 |
| | 8,670 |
|
| Depreciation and amortization | 11,060 |
| | 10,980 |
| | 10,880 |
| | 10,814 |
|
| Capital expenditures | 1,211 |
| | 1,872 |
| | 2,819 |
| | 4,776 |
|
| Unallocated corporate overhead | $ | (19,901 | ) | | $ | (17,077 | ) | | $ | (16,682 | ) | | $ | (17,565 | ) |
| Total | | | | | | | |
| Sales | $ | 285,981 |
| | $ | 284,723 |
| | $ | 278,686 |
| | $ | 280,140 |
|
| Gross margin | 104,212 |
| | 103,585 |
| | 93,260 |
| | 91,024 |
|
| Operating income | 43,740 |
| | 49,274 |
| | 37,682 |
| | 35,069 |
|
| Depreciation and amortization | 20,002 |
| | 20,065 |
| | 20,550 |
| | 20,658 |
|
| Capital expenditures | 14,111 |
| | 9,441 |
| | 10,242 |
| | 13,740 |
|
Item 9. Changes in and Disagreement with Accountants on Accounting and Financial Disclosure
None.
Item 9A. Controls and Procedures
(a) Evaluation of Disclosure Controls and Procedures
Based on their evaluation, required by paragraph (b) of Rules 13a-15 or 15d-15, promulgated by the Securities Exchange Act of 1934, as amended (Exchange Act), the Company'sCompany’s principal executive officer and principal financial officer have concluded that the Company'sCompany’s disclosure controls and procedures as defined in Rules 13a-15(e) and 15d-15(e) of the Exchange Act are effective, at a reasonable assurance level, as of December 28, 201331, 2016, to ensure that information required to be disclosed by the Company in reports that it files or submits under the Exchange Act is recorded, processed, summarized, and reported within the time periods specified in Securities and Exchange Commission rules and forms. Disclosure controls and procedures include, without limitation, controls and procedures designed to ensure that information required to be disclosed by the Company in the reports that it files or submits under the Exchange Act is accumulated and communicated to the Company'sCompany’s management, including its principal executive and principal financial officers, or persons performing similar functions, as appropriate to allow timely decisions regarding required disclosure. In designing and evaluating the disclosure controls and procedures, our management recognized that any controls and procedures, no matter how well designed and operated, can provide only reasonable assurances of achieving the desired control objectives, and management necessarily was required to apply its judgment in designing and evaluating the controls and procedures.
Management’s Report on Internal Control Over Financial Reporting
Management of the CompanyOur management is responsible for establishing and maintaining adequate internal control over financial reporting. The Company’sreporting (as defined in Rules 13a-15(f) and 15d-15(f) under the Securities Exchange Act of 1934, as amended). Our internal control over financial reporting is a process under the supervision of the Chief Executive Officer and Chief Financial Officer, designed to provide reasonable assurance regarding the reliability of financial reporting and the preparation of the Company’s financial statements for external purposes in accordance with U.S. GAAP.
As of December 28, 2013, Management conducted an assessment of the effectiveness of our internal control over financial reporting and has concluded that the Company’s internal control over financial reporting was effective.
generally accepted accounting principles. Because of its inherent limitations, internal control over financial reporting may not prevent or detect misstatements. Also, projections of any evaluation of effectiveness to future periods are subject to the risk that controls may become inadequate because of changes in conditions, or that the degree of compliance with the policies or procedures may deteriorate.
Management's report onUnder the supervision and with the participation of our internal controls over financial reporting can be found in Item 8management, including our CEO and CFO, we conducted an evaluation of this report. The Independent Registered Public Accounting Firm's attestation report on the effectiveness of our internal control over financial reporting can also be found in Item 8 of this report
Remediation of Prior Material Weaknessbased on the framework in Internal Control Over Financial Reporting
ManagementControl-Integrated Framework (2013) issued by the Committee of Sponsoring Organizations of the Treadway Commission. Based on our assessment and those criteria, management concluded that the Company previously identified and disclosed a material weakness inmaintained effective internal control over financial reporting related toas of December 31, 2016.
We have excluded the designbusiness acquisitions completed during fiscal year 2016, including WRH, Inc., Blue Stream Laboratories, Inc., and operationAgilux Laboratories, Inc., from the assessment of certain controls over information technology, business processes and financial reporting. Specifically, we identified deficiencies with respect to the design and operationeffectiveness of controls over segregation of duties, restricted access, changes to vendor and customer master data, transaction level and financial close controls which aggregated to a material weakness in internal control over financial reporting. A material weakness is a deficiency, or a combination of deficiencies, in internal control over financial reporting such that there is a reasonable possibility that a material misstatement of the Company’s annual or interim financial statements will not be prevented or detected on a timely basis.
The Company has been actively engaged in the implementation of remediation efforts to address the material weakness in controls related to the design and operation of certain controls over information technology, business processes and financial reporting at December 29, 2012. These remediation efforts, outlined below, were specifically designed to address the material weakness previously identified by management.
The Company’s remediation efforts were governed by a Steering Committee, under the direction of the Company’s Chief Executive Officer and Chief Financial Officer. The status of remediation efforts was regularly reviewed with the Audit Committee at which time the committee was advised of issues encountered, progress against milestones and key decisions reached by management of the Company.
During 2013, management of the Company took the following actions to remediate this material weakness:
Identified and removed or mitigated all segregation of duties conflicts within our company’s ERP system.
Redesigned and enhanced the provisioning process for access to the Company’s ERP system and applied governance over that process.
Designed and implemented enhanced controls over the performance of transactional controls and controls to ensure the accuracy and completeness of vendor and customer master data.
Added resources and increased education in areas necessary to improve our ability to detect potential misstatements.
Assessed the design and tested the operating effectiveness of the key controls with respect to segregation of duties, restricted access, changes to vendor and customer master data, transaction level and financial close controls.
The Company continues to develop further enhancements to its controls over segregation of duties, restricted access, changes to vendor and customer master data, transaction level and financial close controls, however, based upon the significant actions taken and the testing and evaluation of the effectiveness of the controls, management of the Company has concluded the material weakness in the Company’s controls related to the design and operation of certain controls over information technology, business processes and financial reporting no longer existed as of December 28, 2013.31, 2016. The acquired businesses are wholly-owned subsidiaries whose total assets and total revenues collectively represent 7.8% and 11.1%, respectively, of the related consolidated financial statement amounts as of and for fiscal year ended December 31, 2016.
The effectiveness of our internal control over financial reporting as of December 31, 2016, has been audited by PricewaterhouseCoopers LLP, an Independent Registered Public Accounting Firm, as stated in their report which is included in Item 8, “Financial Statements and Other Supplementary Data” in this Annual Report on Form 10-K.
| |
(b) | Changes in Internal Controls |
(b) Changes in Internal Controls
During the fourth quarter of 2016, the Company continued to execute a plan to centralize certain accounting transaction processing functions to internal shared service centers. This planned effort is expected to continue in subsequent quarters. There were no other changes aside from those detailed above, in the Company'sCompany’s internal control over financial reporting identified in connection with the evaluation required by paragraph (d) of the Exchange Act Rules 13a-15 or 15d-15 that occurred during the fourth quarter ended December 28, 2013of 2016 that materially affected, or were reasonably likely to materially affect, the Company'sCompany’s internal control over financial reporting.
Item 9B. Other Information
None.
PART III
Item 10. Directors, Executive Officers and Corporate Governance
A. Directors and Compliance with Section 16(a) of the Exchange Act
| |
A. | Directors and Compliance with Section 16(a) of the Exchange Act |
The information required by this Item regarding our directors and compliance with Section 16(a) of the Exchange Act by our officers and directors will be included in the 20142017 Proxy Statement under the sections captioned “Nominees for Directors” and “Section 16(a) Beneficial Ownership Reporting Compliance” and is incorporated herein by reference thereto. The information required by this Item regarding our corporate governance will be included in the 20142017 Proxy Statement under the section captioned “Corporate Governance” and is incorporated herein by reference thereto.
B. Our Executive Officers
The information required by this Item regarding our executive officers is reported in Part I of this Form 10-K under the heading “Supplementary Item. Executive Officers of the Registrant pursuant to Instruction 3 to Item 401(b) of Regulation S-K.”“Item 1. Business”
| |
C. | Audit Committee Financial Expert |
C. Audit Committee Financial Expert
The information required by this Item regarding the audit committee of the Board of Directors and financial experts will be included in the 20142017 Proxy Statement under the section captioned “The Board of Directors and its Committees-Audit Committee and Financial Experts” and is incorporated herein by reference thereto.
D. Code of Ethics
We have adopted a Code of Business Conduct and Ethics that applies to all of our employees and directors, including our principal executive officer, principal financial officer, principal accounting officer, controller, or persons performing similar functions. Our Code of Business Conduct and Ethics is posted on our website and can be accessed by selecting the “Corporate Governance” link at http://ir.criver.com.ir.criver.com. We will provide to any person, without charge, a copy of our Code of Business Conduct and Ethics by
requestingEthics. To obtain a copy, fromplease mail a request to the Secretary, Charles River Laboratories, Inc., 251 Ballardvale Street, Wilmington, MA 01887. Information on our website is not incorporated by reference in this annual report.
| |
E. | Changes to Board Nomination Procedures |
E. Changes to Board Nomination Procedures
Since December 2008, there have been no material changes to the procedures by which security holders may recommend nominees to the our Board of Directors.
Item 11. Executive Compensation
The information required by this Item will be included in the 20142017 Proxy Statement under the sections captioned “2013“2016 Director Compensation,” “Compensation Discussion and Analysis,” “Executive Compensation and Related Information,” “Compensation Committee Interlocks and Insider Participation” and “Report of Compensation Committee”Committee,” and is incorporated herein by reference thereto.
Item 12. Security Ownership of Certain Beneficial Owners and Management and Related Stockholder Matters
The information required by this Item will be included in the 20142017 Proxy Statement under the sections captioned “Beneficial Ownership of Securities” and “Equity Compensation Plan Information” and is incorporated herein by reference thereto. See also Item 5. “Market for Registrants Common Equity, Related Stockholder Matters and Issuer Purchases of Equity Securities-Securities Authorized for Issuance Under Equity Compensation Plans” for the disclosure required by Item 201(d) of Regulation S-K promulgated under the Securities Exchange Act of 1934, as amended.
Item 13. Certain Relationships and Related Transactions, and Director Independence
The information required by this Item will be included in the 20142017 Proxy Statement under the sections captioned “Related Person Transaction Policy” and “Corporate Governance-Director Qualification Standards; Director Independence” and is incorporated herein by reference thereto.
Item 14. Principal Accountant Fees and Services
The information required by this Item will be included in the 20142017 Proxy Statement under the section captioned “Statement of Fees Paid to Independent Registered Public Accounting Firm” and is incorporated herein by reference thereto.
PART IV
Item 15. Exhibits and Financial Statement Schedules
Item 15(a)(1) and (2) Financial Statements and Schedules
See "Index to Consolidated Financial Statements and Financial Statements Schedules" at Item 8 to this Annual Report on Form 10-K. Other financial statement schedules have not been included because they are not applicable or the information is included in the financial statements or notes thereto.
Item 15(a)(3) and Item 15(b) Exhibits
The exhibits filed as part of this Annual Report on Form 10-K are listed in the Exhibit Index immediately preceding the exhibits. We have identified in the Exhibit Index each management contract and compensation plan filed as an exhibit to this Annual Report on Form 10-K in response to Item 15(c) of Form 10-K.
91Item 16. Form 10-K Summary
None.
SIGNATURES
Pursuant to the requirements of Section 13 or 15(d) of the Securities Exchange Act of 1934, the registrant has duly caused this report to be signed on its behalf by the undersigned, thereunto duly authorized.
|
| | | |
| | | CHARLES RIVER LABORATORIES INTERNATIONAL, INC. |
| | By: | /s/ DAVID R. SMITH |
| | David R. Smith |
| Date: | February 25, 2014 | By:14, 2017 | /s/ THOMAS F. ACKERMAN
Thomas F. Ackerman
Corporate Executive Vice President, and Chief Financial Officer and Chief Accounting Officer |
Pursuant to the requirements of the Securities Exchange Act of 1934, this report has been signed by the following persons on behalf of the registrant and in the capacities indicated below and on the dates indicated.
|
| | | |
| Signatures | Title | Date |
| By: | /s/ JAMES C. FOSTER | President, Chief Executive Officer and Chairman | February 25, 201414, 2017 |
| | James C. Foster | | |
| | | | |
| By: | /s/ THOMAS F. ACKERMANDAVID R. SMITH | Corporate Executive Vice President, andChief | February 25, 201414, 2017 |
| | Thomas F. AckermanDavid R. Smith | Chief Financial Officer | |
| | | |
By: | /s/ JOHN J. CROWLEY | Corporate Senior Vice President, Corporate Controller and Chief Accounting Officer | February 25, 2014 |
| John J. Crowley | | |
| | | | |
| By: | /s/ ROBERT J. BERTOLINI | Director | February 25, 201414, 2017 |
| | Robert J. Bertolini | | |
| | | | |
| By: | /s/ STEPHEN D. CHUBB | Director | February 25, 201414, 2017 |
| | Stephen D. Chubb | | |
| | | | |
| By: | /s/ GEORGE E. MASSARO | Director | February 25, 201414, 2017 |
| | George E. Massaro | | |
| | | | |
| By: | /s/ DEBORAH KOCHEVAR | Director | February 25, 201414, 2017 |
| | Deborah Kochevar | | |
| | | | |
| By: | /s/ GEORGE M. MILNE, JR. | Director | February 25, 201414, 2017 |
| | George M. Milne, Jr. | | |
| | | | |
| By: | /s/ C. RICHARD REESE | Director | February 25, 201414, 2017 |
| | C. Richard Reese | | |
| | | | |
| By: | /s/ CRAIG BB. THOMPSON | Director | February 25, 201414, 2017 |
| | Craig B. Thompson | | |
| | | | |
| By: | /s/ RICHARD F. WALLMAN | Director | February 25, 201414, 2017 |
| | Richard F. Wallman | | |
EXHIBIT INDEX
| | | Exhibit No. | Description | Filed with this Form 10-K | Incorporated by Reference | Description | Filed with this Form 10-K | Incorporation by Reference |
| Form | Filing Date | Exhibit No. | Form | Filing Date | Exhibit No. |
| 3.1 | Second Amended and Restated Certificate of Incorporation of Charles River Laboratories International, Inc. dated June 5, 2000 | | S-1/A | June 23, 2000 | 3.1 | Second Amended and Restated Certificate of Incorporation of Charles River Laboratories International, Inc. dated June 5, 2000 | | S-1/A | June 23, 2000 | 3.1 |
| 3.2 | Second Amended and Restated By-laws of Charles River Laboratories International, Inc. | | 8-K | December 5, 2008 | 3.2 | Fifth Amended and Restated By-Laws of Charles River Laboratories International, Inc. | | 8-K | May 16, 2016 | 3.2 |
| 4.1 | Form of common stock certificate, $0.01 par value, of Charles River Laboratories International, Inc. | | S-1 | June 23, 2000 | 4.1 | Form of Common Stock certificate, $0.01 par value, of Charles River Laboratories International, Inc. | | S-1 | June 23, 2000 | 4.1 |
| 4.2 | Charles River Laboratories International, Inc. as Issuer and U.S. Bank National Association as Trustee Indenture dated June 12, 2006 | | 8-K | June 12, 2006 | 4.1 | Charles River Laboratories International, Inc. Form of Performance Share Unit granted under the 2007 Incentive Plan | | 10-K | February 27, 2013 | 4.4 |
| 4.3 | Charles River Laboratories International, Inc. Form of 2.25% Convertible Senior Note due 2013 | | 8-K | June 12, 2006 | 4.1 | Charles River Laboratories International, Inc. Form of Performance Share Unit granted under the 2016 Incentive Plan | X | |
| 4.4* | Charles River Laboratories International, Inc. Form of Performance Share Unit Granted Under 2007 Incentive Plan | | 10-K | February 27, 2013 | 4.4 | |
| 10.1* | Charles River Corporate Officer Separation Plan dated April 30, 2010 | | 10-Q | August 3, 2010 | 10.1 | Charles River Laboratories International, Inc. 2007 Incentive Plan, as amended | | 10-K | February 17, 2015 | 10.13 |
| 10.2* | Charles River Laboratories Holdings 1999 Management Incentive Plan | | 10-K | March 14, 2006 | 10.6 | Charles River Laboratories International, Inc. 2016 Incentive Plan | | 10-Q | August 3, 2016 | 10.1 |
| 10.3* | Charles River Laboratories International, Inc. 2000 Incentive Plan amended May 9, 2005 | | 10-K | March 14, 2006 | 10.7 | Charles River Laboratories International, Inc. Form of Stock Option granted under the 2007 Incentive Plan, as amended | | 10-K | February 20, 2008 | 10.17 |
| 10.4* | Charles River Laboratories International, Inc. 2000 Incentive Plan Inland Revenue Approved Rules for UK Employees | | 10-Q | November 5, 2001 | 99.1 | Charles River Laboratories International, Inc. Form of Stock Option granted under the 2016 Incentive Plan | X | |
| 10.5* | Form of change in control agreement | | 10-K | February 23, 2009 | 10.7 | Charles River Laboratories International, Inc. Form of Restricted Stock Award granted under the 2007 Incentive Plan, as amended | | 10-K | February 20, 2008 | 10.18 |
| 10.6* | Executive Incentive Compensation Plan dated January 1, 2009 | | 10-K | February 23, 2009 | 10.8 | Charles River Laboratories International, Inc. Form of Restricted Stock Unit granted under the 2007 Incentive Plan | X | |
| 10.7* | Charles River Laboratories International, Inc. Form of Stock Option Award letter granted under 2000 Incentive Plan | | 10-Q | November 1, 2004 | 10.3 | Charles River Laboratories International, Inc. Form of Restricted Stock Unit granted under the 2016 Incentive Plan | X | |
| 10.8* | Charles River Laboratories International. Inc. Form of Restricted Stock Award granted under 2000 Incentive Plan | | 10-Q | November 1, 2004 | 10.4 | Charles River Corporate Officer Separation Plan dated April 30, 2010 | | 10-Q | August 3, 2010 | 10.1 |
| 10.9* | Inveresk Research Group, Inc. 2002 Stock Option and Incentive Compensation Plan amended and restated as of May 4, 2004 | | S-8 | October 20, 2004 | 99.1 | Form of Change in Control Agreement | | 10-K | February 23, 2009 | 10.7 |
| 10.10* | Charles River Laboratories, Inc. Executive Life Insurance/Supplemental Retirement Income Plan | | 10-K | March 9, 2005 | 10.23 | Executive Incentive Compensation Plan dated January 1, 2016 | | 10-K | February 12, 2016 | 10.4 |
| 10.11* | Charles River Laboratories amended and restated Deferred Compensation Plan amended December 2, 2008, July 20, 2011 and October 27, 2011 | | 10-K | February 27, 2012 | 10.11 | Charles River Laboratories International, Inc. Non-Employee Directors Deferral Plan dated April 5, 2016 | | 10-Q | May 4, 2016 | 10.1 |
| 10.12 | Charles River Laboratories International, Inc. Fourth Amended and Restated Credit Agreement dated September 23, 2011 | | 8-K | September 23, 2011 | 10.1 | |
| 10.12* | | Charles River Laboratories, Inc. Executive Life Insurance/Supplemental Retirement Income Plan | | 10-K | March 9, 2005 | 10.23 |
| 10.13* | Charles River Laboratories International, Inc. 2007 Incentive Plan amended March 18, 2009 and March 22, 2011 | | 10-K | February 27, 2012 | 10.13 | Charles River Laboratories amended and restated Deferred Compensation Plan, as amended | | 10-K | February 27, 2012 | 10.11 |
| 10.14* | Charles River Laboratories International, Inc. Form of Stock Option granted under 2007 Incentive Plan | | 10-K | February 20, 2008 | 10.17 | Amended and Restated Deferred Compensation Plan Document dated July 17, 2012 | | 10-Q | August 7, 2012 | 10.1 |
| 10.15* | Charles River Laboratories International, Inc. Form of Restricted Stock Award granted under 2007 Incentive Plan | | 10-K | February 20, 2008 | 10.18 | Letter Agreements with Davide Molho dated May 22, 2009 | | 10-K | February 23, 2011 | 10.17 |
| 10.16* | | Agreement between Thomas Ackerman and Charles River Laboratories, Inc. dated February 25, 2015 | | 8-K | February 27, 2015 | 99.10 |
| 10.17* | | Agreement between David Smith and Charles River Laboratories, Inc. dated March 3, 2015 | | 10-K | February 12, 2016 | 10.16 |
| 10.18 | | Charles River Laboratories International, Inc. Seventh Amended and Restated Credit Agreement dated March 30, 2016 | | 8-K | April 5, 2016 | 10.1 |
| 21.1 | | Subsidiaries of Charles River Laboratories International, Inc. | X | |
| 23.1 | | Consent of PricewaterhouseCoopers LLP | X | |
| 31.1 | | Rule 13a-14(a)/15d-14(a) Certification of Chief Executive Officer | X | |
| 31.2 | | Rule 13a-14(a)/15d-14(a) Certification of Chief Financial Officer | X | |
| 32.1 | | Section 1350 Certification of the Chief Executive Officer and Chief Financial Officer | X | |
| 101.INS | | eXtensible Business Reporting Language (XBRL) Instance Document | X | |
| 101.SCH | | XBRL Taxonomy Extension Schema | X | |
| 101.CAL | | XBRL Taxonomy Extension Calculation Linkbase | X | |
|
| | | | | |
10.16*Exhibit No. | Letter AgreementsDescription | Filed with Dr. Davide Molho dated May 22, 2009 | | this Form 10-K | February 23, 2011 | 10.17Incorporation by Reference |
10.17*Form | Amended and Restated Deferred Compensation Plan Document dated July 17, 2012Filing Date | | 10-Q | August 7, 2012 | 10.1 |
10.18* | Employment agreement between Dr. Jorg Geller and Charles River Germany GmbH & Co. | | 10-K | February 27, 2013 | 10.18 |
10.19* | Certificate of Life Insurance for Dr. Jorg Geller dated February 8, 1988 | | 10-Q | July 31, 2013 | 10.19 |
10.20* | Certificate of Life Insurance for Dr. Jorg Geller dated April 24, 1998 | | 10-Q | July 31, 2013 | 10.20 |
10.21* | Provision Committed by Charles River Wiga Deutschland GmbH for Dr. Jorg Geller dated December 13, 1996 | | 10-Q | July 31, 2013 | 10.21 |
10.22* | Addendum to Provision Committed by Charles River Wiga Deutschland GmbH for Dr. Jorg Geller dated March 25, 1997 | | 10-Q | July 31, 2013 | 10.22 |
21.1 | Subsidiaries of Charles River Laboratories International, Inc. | X | | | |
23.1 | Consent of PricewaterhouseCoopers LLP | X | | | |
31.1 | Rule 13a-14(a)/15d-14(a) Certification of Chief Executive Officer | X | | | |
31.2 | Rule 13a-14(a)/15d-14(a) Certification of Chief Financial Officer | X | | | |
32.1 | Section 1350 Certification of the Chief Executive Officer and Chief Financial Officer | X | | | |
101.INS | XBRL Instance Document | X | | | |
101.SCH | XBRL Taxonomy Extension Schema | X | | | |
101.CAL | XBRL Taxonomy Extension Calculation Linkbase | X | | | Exhibit No. |
| 101.DEF | XBRL Taxonomy Extension Definition Linkbase | X | | | |
| 101.LAB | XBRL Taxonomy Extension Labels Linkbase | X | | | |
| 101.PRE | XBRL Taxonomy Extension Presentation Linkbase | X | | | |
* Management contract or compensatory plan, contract or arrangement. |