UNITED STATES
SECURITIES AND EXCHANGE COMMISSION
Washington, DC 20549
FORM 10-K10-K/A
|
| |
| x | ANNUAL REPORT PURSUANT TO SECTION 13 OR 15(d) OF THE SECURITIES EXCHANGE ACT OF 1934, |
for the Fiscal Year Ended December 31, 2013,2015,
or
|
| |
| o | TRANSITION REPORT PURSUANT TO SECTION 13 OR 15(d) OF THE SECURITIES EXCHANGE ACT OF 1934, |
for the transition period from N/A to .
Commission File Number: 0-23695
BROOKLINE BANCORP, INC.
(Exact name of registrant as specified in its charter)
|
| | |
Delaware (State or other jurisdiction of incorporation of organization) | | 04-3402944 (I.R.S. Employer Identification No.) |
131 Clarendon Street, Boston, Massachusetts (Address of principal executive offices) | | 02117-917902116
(Zip Code) |
(617) 425-4600
(Registrant's telephone number, including area code)
Securities registered pursuant to Section 12(b) of the Act:
|
| | |
| Title of Each Class | | Name of Each Exchange on Which Registered |
| Common Stock, par value of $0.01 per share | | Nasdaq Global Select Market |
Securities registered pursuant to Section 12 (g) of the Act: None
Indicate by check mark if the registrant is a well-known seasoned issuer, as defined in Rule 405 of the Securities Act of 1934. YES o NO x
Indicate by check mark if the registrant is not required to file reports pursuant to Section 13 or 15(d) of the Securities Act of 1934. YES o NO x
Indicate by check mark whether the registrant (1) has filed all reports required to be filed by Section 13 or 15(d) of the Securities Exchange Act of 1934 during the preceding 12 months (or for such shorter period that the registrant was required to file such reports) and (2) has been subject to such filing requirement for the past 90 days. YES x NO o
Indicate by check mark if disclosure of delinquent filers pursuant to Item 405 of Regulation S-K (§ 229.405 of this chapter) is not contained herein, and will not be contained, to the best of the registrant's knowledge, in definitive proxy or information statements incorporated by reference in Part III of this Form 10-K or any amendments to this Form 10-K. o
Indicate by check mark whether the registrant (1) has submitted electronically and posted on its corporate Web site, if any, every Interactive Data File required to be submitted and posted pursuant to Rule 405 of Regulation S-T (§232.405 of this chapter) during the preceding 12 months (or for such shorter period that the registrant was required to submit and post such files). YES x NO o
Indicate by check mark whether the registrant is a large accelerated filer, an accelerated filer, a non-accelerated filer or a smaller reporting company. See definition of "large accelerated filer", "accelerated filer" and "smaller reporting company" in Rule 12-b of the Exchange Act (Check one).
|
| | | | | | |
Large accelerated filer x | | Accelerated filer o | | Non-accelerated filer o (Do not check if a smaller reporting company) | | Smaller reporting company o |
Indicate by check mark if the registrant is a shell company (as defined in Rule 12b-2 of the Act). YES o NO x
The numberAs of June 30, 2015, the last business day of the registrant's most recently completed second fiscal quarter, the aggregate market value of the shares of common stock held by nonaffiliates, based upon the closing price per share of the registrantregistrant's common stock as reported on NASDAQ, was approximately $776.8 million.
As of February 28, 2014 was 70,163,809 for an aggregate market value29, 2016, there were 75,744,445 and 70,396,856 shares of $632.8 million. This excludes 284,952 shares held by Brookline Bank Employee Stock Ownership Plan and Trust.
At February 28, 2014, the number of shares ofregistrant's common stock, par value $0.01 per share, issued and outstanding, were 75,744,445 and 70,572,460, respectively.
EXPLANATORY NOTE
This Amendment No. 1 to Form 10-K (this “Amendment”) amends the Annual Report on Form 10-K for the fiscal year ended December 31, 2015, originally filed with the Securities and Exchange Commission (the “SEC”) on February 29, 2016 (the “Form 10-K”), by Brookline Bancorp, Inc. (the “Company”). The sole purpose of this Amendment is to re-file Exhibit 23 due to the inadvertent omission of the electronic signature of the Company’s independent registered public accounting firm.
In addition, as required by Rule 12b-15 under the Securities Exchange Act of 1934, as amended, new certifications by the Company’s principal executive officer and principal financial officer are filed as exhibits to this Amendment.
No changes have been made in this Amendment to modify or update the other disclosures presented in the Form 10-K. This Amendment does not reflect events occurring after the filing of the Form 10-K or modify or update those disclosures that may be affected by subsequent events. This Amendment should be read in conjunction with the Form 10-K and the Company’s other filings made with the SEC.
BROOKLINE BANCORP, INC. AND SUBSIDIARIES
20132015 FORM 10-K
Table of Contents
FORWARD-LOOKING STATEMENTS
Certain statements contained in this Annual Report on Form 10-K that are not historical facts may constitute forward-looking statements within the meaning of Section 27A of the Securities Act of 1933, as amended, and Section 21E of the Securities Exchange Act of 1934, as amended, and are intended to be covered by the safe harbor provisions of the Private Securities Litigation Reform Act of 1995. Forward-looking statements involve risks and uncertainties. These statements, which are based on certain assumptions and describe Brookline Bancorp, Inc.'s (the "Company's") future plans, strategies and expectations, can generally be identified by the use of the words "may," "will," "should," "could," "would," "plan," "potential," "estimate," "project," "believe," "intend," "anticipate," "expect," "target" and similar expressions. These statements include, among others, statements regarding the Company's intent, belief or expectations with respect to economic conditions, trends affecting the Company's financial condition or results of operations, and the Company's exposure to market, liquidity, interest-rate and credit risk.
Forward-looking statements are based on the current assumptions underlying the statements and other information with respect to the beliefs, plans, objectives, goals, expectations, anticipations, estimates and intentions of managementManagement and the financial condition, results of operations, future performance and business are only expectations of future results. Although the Company believes that the expectations reflected in the Company's forward-looking statements are reasonable, the Company's actual results could differ materially from those projected in the forward-looking statements as a result of, among other factors, adverse conditions in the capital and debt markets; changes in interest rates; competitive pressures from other financial institutions; the effects of continued weakness in general economic conditions on a national basis or in the local markets in which the Company operates, including changes which adversely affect borrowers' ability to service and repay their loans and leases; changes in the value of securities and other assets in ourthe Company's investment portfolio; changes in loan and lease default and charge-off rates; the adequacy of allowances for loan and lease losses; deposit levels necessitating increased borrowing to fund loans and investments; changes in government regulation; the risk that goodwill and intangibles recorded in the Company's financial statements will become impaired; and changes in assumptions used in making such forward-looking statements, as well as the other risks and uncertainties detailed in Item 1A, "Risk Factors." Forward-looking statements speak only as of the date on which they are made. The Company does not undertake any obligation to update any forward-looking statement to reflect circumstances or events that occur after the date the forward-looking statements are made.
PART I
Item 1. Business
General
Brookline Bancorp, Inc. (the "Company"), a Delaware corporation, operates as a multi-bank holding company for Brookline Bank and its subsidiaries, Bank Rhode Island ("BankRI") and its subsidiaries, First Ipswich Bank ("First Ipswich" and formerly known as the First National Bank of Ipswich)) and its subsidiaries, and Brookline Securities Corp.
Brookline Bank, which includes its wholly-owned subsidiaries, BBS Investment Corp. and Longwood Securities Corp., and its 84.8%84.5%-owned subsidiary, Eastern Funding LLC ("Eastern Funding"), operates 2325 full-service banking offices in Brookline, Massachusetts and the greater Boston metropolitan area. Brookline Bank was established as a savings bank in 1871 under the name Brookline Savings Bank. The Company was organized in November 1997 for the purpose of acquiring all of the capital stock of Brookline Savings Bank on completion of the reorganization of Brookline Savings Bank from a mutual savings bank into a mutual holding company structure and partial public offering. In 2002, the Company became fully public. In January 2003, Brookline Savings Bank changed its name to Brookline Bank.
On February 28, 2011, the Company acquired First Ipswich Bancorp, the holding company for First Ipswich, headquartered in Ipswich, Massachusetts. First Ipswich, which includes its wholly-owned subsidiaries, First Ipswich Insurance Agency and First Ipswich Securities II Corp., First Ipswich Insurance Agency, First Ipswich Realty and FNBI Realty, operates 65 full-service banking offices on the North Shorenorth shore of eastern Massachusetts and in the Boston metropolitan area.Massachusetts. In June 2012, the First National Bank of Ipswich changed its name to First Ipswich Bank.
On January 1, 2012, the Company acquired Bancorp Rhode Island, Inc., a Rhode Island corporation and holding company for BankRI, headquartered in Providence, Rhode Island. BankRI, which includes its wholly-owned subsidiaries, Acorn Insurance Agency, BRI InvestmentRealty Corp., Macrolease Corporation ("Macrolease"), Acorn Insurance Agency and BRI RealtyInvestment Corp. and its wholly-owned subsidiary, BRI MSC Corp., operates 1819 full-service banking offices in the greater Providence, County, Kent County and Washington County, Rhode Island.Island area.
As a commercially focusedcommercially-focused financial institution with 4749 full-service banking offices throughout Greatergreater Boston, the North Shorenorth shore of Massachusetts, and Rhode Island, the Company, through Brookline Bank, BankRI and First Ipswich (individually and
collectively, the "Banks"), offers a wide range of commercial, business and retail banking services, including a full complement of cash management products, on-line banking services, consumer and residential loans and investment services, designed to
meet the financial needs of small- to mid-sized businesses and individuals throughout central New England. Specialty lending activities include indirect automobile loans as well asincluding equipment financing are focused primarily in the New York/York and New Jersey metropolitan area and elsewhere.area.
The Company focuses its business efforts on profitably growing its commercial lending businesses, both organically and through acquisitions. The Company's customer focus, multi-bank structure, and risk management are integral to its organic growth strategy and serve to differentiate the Company from its competitors. As full-service financial institutions, the Banks and their subsidiaries focus on the continued addition of well-qualified customers, the deepening of long-term banking relationships through a full complement of products and excellent customer service, and strong risk management. The Company's multi-bank structure retains the local-bank orientation while relieving local bank management of the responsibility for most back-office functions, which are consolidated at the holding company level. Branding and decision-making, including credit decisions and pricing, remain largely local in order to better meet the needs of bank customers and further motivate the Banks' commercial, business and retail bankers.
The Company, has, from time to time, acquired other business lines or financial institutions that it believes share the Company's relationship and customer service orientations and provide access to complementary markets, customers, products and/orand services. The Company expanded its geographic footprint with the acquisitions of First Ipswich in February 2011 and BankRI in January 2012.
The Company's headquarters and executive management are located at 131 Clarendon Street, Boston, Massachusetts 02117-917902116 and its telephone number is 617-425-4600.
TotalThe loan and lease portfolio grew $172.9 million, or 3.6%, to $5.0 billion as of December 31, 2015 from $4.8 billion as of December 31, 2014. The Company's commercial loan portfolios, which are comprised of commercial real estate loans and commercial loans and leases, increased $186.8continued to exhibit growth. The $403.8 million or 4.5%, at December 31, 2013, compared to 2012. Loan and lease growth from 2012 was driven by growth of $315.8 million, or 11.1%,increase in the commercial loan business. Indirectportfolios in 2015 was partially offset by a $303.3 million decrease in the indirect automobile portfolio due to the sale in the first quarter of 2015 of more than 90% of the indirect automobile portfolio. The Company's commercial loan portfolios, which totaled $4.0 billion, or 80.8% of total loans decreased $141.8and leases, as of December 31, 2015, increased $403.8 million, or 26.1%11.1%, from $3.6 billion, or 75.4% of total loans and leases, as of December 31, 2014.
Total deposits increased $347.9 million, or 8.8%, to $4.3 billion as of December 31, 2015 from $4.0 billion as of December 31, 2014. Core deposits, which include demand checking, NOW, money market and savings accounts, increased 6.9% to $3.2 billion as of December 31, 2015. The Company's core deposits decreased as a resultpercentage of the Company's decision nottotal deposits to originate such loans at very low interest rates. During the year ended74.7% as of December 31, 2013, the Company's total deposits increased $218.7 million, or 6.0%,2015 from 76.1% as compared toof December 31, 2012. The year-over-year increase in total deposits was driven by an increase in commercial and municipal deposits as the Company continues its efforts to expand customer relationships by offering a full suite of products. Core (non-certificate of deposit) deposits increased $295.0 million, or 11.3%, to $2.9 billion as the Company strategically shifts from certificates of deposit to money market accounts in an effort to reduce its cost of funds.2014.
Throughout 2013,2015, the Company added $10.7$7.4 million to its allowance for loan and lease losses and experienced net charge-offs of $3.4$4.3 million to bring the balance to $48.5$56.7 million atas of December 31, 2013.2015. The ratio of the allowance for loan and lease losses to total loans and leases was 1.11% at1.14% as of December 31, 2013, up from 0.99% at2015 compared to 1.11% as of December 31, 2012.2014. Excluding the loans acquired from BankRI and First Ipswich, the ratio of the allowance for loan and lease losses related to originated loans and leases was 1.32% at1.20% as of December 31, 20132015 and 1.33% at1.20% as of December 31, 2012.2014 respectively. Nonperforming assets atas of December 31, 20132015 were $18.1$20.7 million, downup from $23.715.2 million at the end of 2012. This decrease is the result of the Company's successful resolution of several large nonperforming loans during 2013, as discussed in the "Allowance for Credit Losses—Allowance for Loan and Lease Losses—Commercial Loans and Leases" section beginning on page 44.2014. Nonperforming assets were 0.34% and 0.26% of total assets at the endas of 2013, compared to 0.46% at the end of 2012.December 31, 2015 and December 31, 2014, respectively. The Company's credit quality is solid and compares favorably to its peers, and remains a top priority within the Company.
Net interest income decreasedincreased in 2013 by $1.22015 $5.3 million, or 0.6%2.8%, to $176.2$194.4 million compared to $177.4$189.1 million in 2012, reflecting the decline in the2014. The net interest margin to 3.64%, down 21decreased 7 basis points to 3.54% in 2015 from 2012.3.61% in 2014. Net income for 2013 decreased $1.82015 increased $6.5 million, or 4.7%15.0%, to $35.4$49.8 million from $37.1$43.3 million for 2012.2014. Basic and fully diluted earnings per common share ("EPS") decreasedincreased to $0.51$0.71 for 20132015 from $0.53$0.62 for 2012.2014.
Competition
The Company provides banking alternatives in the greater Boston, Massachusetts, and Providence, Rhode Island, metropolitan marketplaces, each of which areis dominated by several large national banking institutions. Based on total deposits at June 30, 2013,2015, the Company ranks twelftheighteenth in deposit market share among bank holding companies in the Massachusetts market area and fifth in deposit market share among bank holding companies in the Rhode Island market area. The Company faces considerable competition in its market area for all aspects of banking and related service activities. Competition from both bank and non-bank organizations is expected to continue with the Company facing strong competition in generating loans and attracting deposits.
In addition to other commercial banks, the Company's main competition for generating loans includes savings banks, credit unions, mortgage banking companies, insurance companies, and other financial services companies. Competitive factors considered for loan generation include product offerings, interest rates, terms offered, services provided and geographic locations. Lending services for the Company are concentrated in the greater Boston, Massachusetts, and Providence, Rhode
Island, metropolitan areas, eastern Massachusetts, southern New Hampshire, and other Rhode Island areas, while the Company's equipment financing activities are primarily concentrated in the greater New York and New Jersey.Jersey metropolitan markets.
In attracting deposits, theThe Company's primary competitors for attracting deposits are savings banks, commercial banks, credit unions, and other non-depository institutions such as securities and brokerage firms and insurance companies. Competitive factors considered in attracting and retaining deposits include product offerings and rate of return, convenient branch locations and automated teller machines and more recently, online access to accounts. Deposit customers are generally in communities where banking offices are located.
Market Area and Credit Risk Concentration
As of December 31, 2013,2015, the Company, through its Banks, operated 4749 full-service banking offices in greater Boston, Massachusetts, and greater Providence, Rhode Island. The Banks' deposits are gathered from the general public primarily in the communities in which itsthe banking offices are located. The deposit market in Massachusetts and Rhode Island is highly concentrated. Based on June 30, 20132015 FDIC statistics, the five largest banks in Massachusetts have an aggregate market share of approximately 62%66%, and the three largest banks in Rhode Island have an aggregate deposit market share of approximately 76%73%. The Banks' lending activities are concentrated primarily in the greater Boston, Massachusetts, and Providence, Rhode Island, metropolitan areas, eastern Massachusetts, southern New Hampshire and other Rhode Island.Island areas. In addition, the Company, through subsidiaries of Brookline Bank and BankRI, conducts equipment financing activities in the greater New York/York and New Jersey metropolitan area and elsewhere.elsewhere in the United States.
Commercial real estate loans. Multi-family and commercial real estate mortgage loans typically generate higher yields, but also involve greater credit risk. In addition, many of the Banks' borrowers have more than one multi-family or commercial real estate loan outstanding. The Banks manage this credit risk by limiting loan-to-valueprudent underwriting: conservative debt service coverage, and LTV ratios at loan origination, lending to seasoned real estate owners/managers, using reasonable capitalization and vacancy ratios, cross-collateralizing loans to one borrower when deemed prudent, and limiting the amount and types of construction lending. AtAs of December 31, 2013,2015, the largest commercial real estate loanrelationship in Brookline Bank'sthe Company’s portfolio was $14.0 million, the largest commercial real estate loan in First Ipswich's portfolio was $3.7 million, and the largest commercial real estate loan in BankRI's portfolio was $8.9$57.0 million. Many of the Banks’ commercial real estate customers have other commercial borrowing relationships with the bank.Banks.
Commercial loans and equipment leasing. Brookline Bank and First Ipswich originate commercial loans and leases for working capital and other business-related purposes, and are concentratingconcentrate such lending to companies located primarily in Massachusetts, and, in the case of Eastern Funding, in New York and New Jersey. BankRI originates commercial loans and lines of credit for various business-related purposes, for businesses located primarily in Rhode Island, and engages in equipment financing through its wholly-owned subsidiary, Macrolease.Macrolease, in New York and New Jersey.
Because commercial loans are typically made on the basis of the borrower's ability to make repayment from the cash flow of the business, the availability of funds for the repayment of commercial and industrial loans may be significantly dependent on the success of the business itself. Further, the collateral securing the loans may be difficult to value, may fluctuate in value based on the success of the business and may deteriorate over time. For this reason, these loans and leases involve greater credit risk. Loans and leases originated by Eastern Funding generally earn higher yields because the borrowers are typically small businesses with limited capital such as coin-operated laundries, dry cleaners, fitness centers, convenience stores and tow truck operators. The Macrolease equipment financing portfolio is comprised of small- to medium-sized businesses such as fitness centers, restaurants and other commercial equipment. The Banks manage the credit risk inherent in commercial lending by limiting industry concentrations, franchisee concentrations and duration of loan maturities; requiring strong debt service coverage ratios; limiting loan-to-value ratios; securing personal guarantees from borrowers; limiting industry concentrations; franchisee concentrations and duration of loan maturities; and employing adjustable rates without interest rate caps; and securing personal guarantees from borrowers. Atcaps. As of December 31, 2013,2015, the largest commercial loanrelationship in Brookline Bank'sthe Company’s portfolio was $20.1 million, the largest commercial loan in First Ipswich's portfolio was for $2.0 million, and the largest commercial loan in BankRI's portfolio was for $11.0$21.5 million.
Indirect auto loans. MostAs of December 2014, Management ceased the origination of indirect automobile loans. Until December 2014, most of Brookline Bank's indirect automobile loans arewere originated through automobile dealerships located in Massachusetts, Connecticut, Rhode Island and New Hampshire. AtIn March 2015, the Company made the decision and sold $255.2 million of the indirect automobile portfolio. As of December 31, 2013,2015, the largest indirect automobile loan in Brookline Bank's portfolio was $69,000.$42.0 thousand. For regulatory purposes, Brookline Bank's indirect automobile loan portfolio is not classified as "subprime lending."lending". Prior to Management's decision to cease originating indirect automobile loans, Brookline Bank has establishedhad in place policies and procedures for loan underwriting and monitoring. Brookline Bank continues to carefully monitor the careful monitoring of itsremaining indirect auto loan portfolio performance and the effect of economic conditions on consumers and the automobile industry. First Ipswich and BankRI do not engage in indirect automobile lending.
Consumer loans. Retail customers of Brookline Bank’sBank and First Ipswich’s retail customersIpswich live and work in the Boston metropolitan area and eastern Massachusetts, are financially active and value personalized service and easy branch access. BankRI's retailRetail customers of BankRI live and work in the Providence,throughout Rhode Island metropolitan area and value easy branch access, personalized service, and knowledge of local communities. The Banks' consumer loan portfolio, which includes residential mortgage loans, home equity loans and lines of
communities. The Banks' consumer loan portfolios, which include residential mortgage loans, home equity loans and lines of credit, and other consumer loans, caterscater to the borrowing needs of this customer base. Credit risk in these portfolios is managed by limiting loan-to-value ratios at loan origination and by requiring borrowers to demonstrate strong credit histories. AtAs of December 31, 2013,2015, the largest consumer loanrelationship in Brookline Bank'sthe Company’s portfolio was $4.0 million, the largest consumer loan in First Ipswich's portfolio was $1.5 million, and the largest consumer loan in BankRI's portfolio was $3.3$8.3 million.
Economic Conditions and Governmental Policies
Repayment of multi-family and commercial real estate loans made by the Companyis generally is dependent on the properties generating sufficient income from the properties to cover operating expenses and debt service. Repayment of commercial loans and equipment financing loans and leases generally is dependent on the demand for the borrowers' products or services and the ability of borrowers to compete and operate on a profitable basis. Repayment of residential mortgage loans, home equity loans and indirect automobile loans generally is dependent on the financial well-being of the borrowers and their capacity to service their debt levels. The asset quality of the Company's loan and lease portfolio, therefore, is greatly affected by the economy.
Economic activity in the United States has shown continuous improvement since the latter half of 2009 after slowing significantly as a result of the 2008 financial crisis. According to the Department of Labor, the national unemployment rate peaked at 10.2%10.0% in October 2009. In December 2013,2015, the unemployment rate was 6.7%5.0% nationally, down from 7.8%5.6% at the end of 2012.2014.
The Company's primary geographic footprints are the Boston, Massachusetts, and Providence, Rhode Island, metropolitan areas. According to the Bureau of Labor Statistics, the largest employment sectors in both Massachusetts and Rhode island are, in order,order: education and health services,services; business and professional services,services; and trade,trade; transportation and utilities, a sector that includes wholesale and retail trade. The unemployment rate in Massachusetts increaseddecreased to 7.0%4.7% in December 20132015 from 6.7%5.5% in December 2012,2014, slightly higherlower than the national average. The unemployment rate in Rhode Island decreased to 9.1%5.1% in December 20132015 from 10.2%6.8% in December 2012, but remains among2014, slightly higher than the highest for any state in the nation.national average.
Despite the positive trends in recent years, the economy has not fully recovered from the effects of the 2008-2009 recession, and unemployment rates remain elevated in relation to historic trends. Should there be any setback in the economy or increase in the unemployment rates in the Boston, Massachusetts, or Providence, Rhode Island, metropolitan areas, the resulting negative consequences could affect occupancy rates in the properties financed by the Company and cause certain individual and business borrowers to be unable to service their debt obligations.
The earnings and business of the Company are affected by external influences such as general economic conditions and the policies of governmental authorities, including the Board of Governors of the Federal Reserve System (the "FRB"). The FRB regulates the supply of money and bank credit to influence general economic conditions throughout the United States of America. The instruments of monetary policy employed by the FRB affect interest rates earned on investment securities and loans and interest rates paid on deposits and borrowed funds. The rate-setting actions of the Federal Open Market Committee of the FRB have a significant effect on the Company's operating results and the level of growth in its loans and leases and deposits.
Personnel
As of December 31, 2013,2015, the Company had 670675 full-time employees and 5043 part-time employees. The employees are not represented by a collective bargaining unit and the Company considers its relationship with its employees to be good.
Access to Information
As a public company, Brookline Bancorp, Inc. is subject to the informational requirements of the Securities Exchange Act of 1934, as amended (the “Exchange Act”), and in accordance therewith, files reports, proxy and information statements and other information with the Securities and Exchange Commission (the “SEC”). The Company makes available on or through its internet website, www.brooklinebancorp.com, without charge, its annual reports on Form 10-K, proxy, quarterly reports on Form 10-Q, current reports on Form 8-K and amendments to those reports filed or furnished pursuant to Section 13(a) or 15(d) of the Exchange Act, as soon as reasonably practicable after such reports are electronically filed with, or furnished to, the SEC. The Company’s reports filed with, or furnished to, the SEC are also available at the SEC’s website at www.sec.gov and on the Company’s website at www.brooklinebank.com.. Press releases are also maintained on the Company’s website. Additional information for Brookline Bank, BankRI and First Ipswich can be found at www.brooklinebank.com, www.bankri.com and www.firstipswich.com, respectively. Information on the Company’s and any subsidiary's website is not incorporated by reference into this document and should not be considered part of this Report.
The Company’s common stock is traded on the Nasdaq Global Select MarketSM under the symbol “BRKL.”
Supervision and Regulation
The following discussion addresses elements of the regulatory framework applicable to bank holding companies and their subsidiaries. This regulatory framework is intended primarily for the protection of the safety and soundness of depository institutions, the federal deposit insurance system, and depositors, rather than for the protection of shareholders of a bank holding company such as the Company.
As a bank holding company, the Company is subject to regulation, supervision and examination by the FRB under the Bank Holding Company Act of 1956, as amended (the “BHCA”), and by the Massachusetts Division of Banks (the “MDOB”) under Massachusetts General Laws Chapter 167A. The FRB is also the primary federal regulator of the Banks. In addition, Brookline Bank and First Ipswich are subject to regulation, supervision and examination by the MDOB, and BankRI is subject to regulation, supervision and examination by the Banking Division of the Rhode Island Department of Business Regulation (the “RIBD”).
The following is a summary of certain aspects of various statutes and regulations applicable to the Company and its subsidiaries. This summary is not a comprehensive analysis of all applicable law, and is qualified by reference to the applicable statutes and regulations.
The Dodd-Frank Act
The Dodd-Frank Wall Street Reform and Consumer Protection Act (the “Dodd-Frank Act”), enacted on July 21, 2010, comprehensively reformed the regulation of financial institutions, products and services. Among other things, the Dodd-Frank Act:
granted the FRB increased supervisory authority and codified the source of strength doctrine, as discussed in more detail in “-Regulation of the Company-Source of Strength” below;
provided for new capital standards applicable to the Company, as discussed in more detail in “-Capital Adequacy and Safety and Soundness-Regulatory Capital Requirements” below;
modified deposit insurance coverage, as discussed in “-Regulation of the Banks-Deposit Insurance” below;
permitted well capitalized and well managed banks to acquire other banks in any state, subject to certain deposit concentration limits and other conditions, as discussed in “-Regulation of the Banks-Acquisitions and Branching” below;
permitted the payment of interest on business demand deposit accounts;
established new minimum mortgage underwriting standards for residential mortgages, as discussed in “-Consumer Protection Regulation-Mortgage Reform” below;
established the Bureau of Consumer Financial Protection (the “CFPB”);
barred banking organizations, such as the Company, from engaging in proprietary trading and from sponsoring and investing in hedge funds and private equity funds, except as permitted under certain circumstances, as discussed in “-Regulation of Other Activities-Volcker Rule Restrictions on Proprietary Trading and Sponsorship of Hedge Funds and Private Equity Funds” below; and
established the Financial Stability Oversight Council to designate certain activities as posing a risk to the U.S. financial system and recommend new or heightened standards and safeguards for financial institutions engaging in such activities.
Regulation of the Company
The Company is subject to regulation, supervision and examination by the FRB, which has the authority, among other things, to order bank holding companies to cease and desist from unsafe or unsound banking practices; to assess civil money penalties; and to order termination of non-banking activities or termination of ownership and control of a non-banking subsidiary by a bank holding company.
Source of Strength
UnderPursuant to the BHCA, andas amended by the Dodd-Frank Act, the Company is required to serve as a source of financial strength for the Banks in the event of the financial distress of the Banks. This provision of the Dodd-Frank Act codifies the longstanding policy of the FRB. This support may be required at times when the bank holding company may not have the resources to provide it.the additional financial support required by its subsidiary banks. In the event of a bank holding company’s bankruptcy, any commitment by the bank holding company to a federal bank regulatory agency to maintain the capital of a bank subsidiary will be assumed by the bankruptcy trustee and entitled to a priority of payment.
Acquisitions and Activities
The BHCA prohibits a bank holding company, without prior approval of the FRB, from acquiring all or substantially all of the assets of a bank, acquiring control of a bank, merging or consolidating with another bank holding company, or acquiring direct or indirect ownership or control of any voting shares of another bank or bank holding company if, after such acquisition, the acquiring bank holding company would control more than 5% of the voting shares of anysuch other bank or bank holding company without prior
approval of the FRB.company. Further, as a Massachusetts bank holding company, the Company must obtain the prior approval of the Massachusetts Board of Bank Incorporation to acquire ownership or control of more than 5% of any voting stock in any other banking institution, acquire substantially all the assets of a bank, or merge with another bank holding company.
The BHCA prohibits a bank holding company from engaging directly or indirectly in activities other than those of banking, managing or controlling banks or furnishing services to its subsidiary banks. However, a bank holding company may engage in and may own shares of companies engaged in certain activities that the FRB determines to be so closely related to banking or managing and controlling banks as to be a proper incident thereto.
Limitations on Acquisitions of Company Common Stock
The Change in Bank Control Act prohibits a person or group of persons from acquiring “control” of a bank holding company unless the FRB has been notified and has not objected to the transaction. Under a rebuttable presumption established by the FRB, the acquisition of 10% or more of a class of voting securities of a bank holding company, such as the Company, with a class of securities registered under Section 12 of the Exchange Act, would, under the circumstances set forth in the presumption, constitute the acquisition of control of a bank holding company. In addition, the BHCA prohibits any company would be required to obtainfrom acquiring control of a bank or bank holding company without first having obtained the approval of the FRB underFRB. Pursuant to the BHCA, before acquiring 25% (5% in the casea company is deemed to have control of an acquirer that is a bank or bank holding company)company in a number of ways including: if the company owns, controls or holds with power to vote 25% or more of a class of voting securities of the bank or otherwise obtaining controlbank holding company; controls in any manner the election of a majority of directors or trustees of the bank or bank holding company; or the
FRB has determined, after notice and opportunity for hearing, that the company has the power to exercise a controlling influence over athe management or policies of the bank or bank holding company. In 2008, the FRB released guidance on minority investments in banks that relaxed the presumption of control for investments of greater than 10% of a class of outstanding voting securities of a bank holding company in certain instances discussed in the guidance.
Regulation of the Banks
Brookline Bank and First Ipswich are subject to regulation, supervision and examination by the FRB and the MDOB. BankRI is subject to regulation, supervision and examination by the FRB and the RIBD. The enforcement powers available to federal and state banking regulators include, among other things, the ability to issue cease and desist or removal orders to terminate insurance of deposits; to assess civil money penalties; to issue directives to increase capital; to place the bank into receivership; and to initiate injunctive actions against banking organizations and institution-affiliated parties.
Deposit Insurance
Substantially all of the depositsDeposit obligations of the Banks are insured up to applicable limits by the FDIC’s DepositorsDeposit Insurance Fund (“DIF”) and are subject to deposit insurance assessments to maintain the DIF.Deposit Insurance Fund. The Dodd-Frank Act permanently increased the FDIC deposit insurance limit to $250,000 per depositor for deposits maintained in the same right and capacity at a particular insured depository institution. The Federal Deposit Insurance Act (the “FDIA”), as amended by the Federal Deposit Insurance Reform Act and the Dodd-Frank Act, requires the FDIC to set atake steps as may be necessary to cause the ratio of deposit insurance reserves to estimated insured deposits-thedeposits - the designated reserve ratio-ofratio - to reach 1.35% by September 30, 2020, and it mandates that the reserve ratio designated by the FDIC for any year may not be less than 1.35%. The FDIC utilizes a risk-based assessment system that imposes insurance premiums based upon a risk matrix that takes into account a bank’s capital level and supervisory rating (“CAMELS rating”). CAMELS ratings reflect the applicable bank regulatory agencies’ evaluation of the financial institution’s capital, asset quality, management, earnings, liquidity and sensitivity to risk. Assessment rates may also vary for certain institutions based on long-term debt issuer ratings, secured orissuance of unsecured debt and levels of brokered deposits. Pursuant to the Dodd-Frank Act, deposit premiums are based on assets rather than insurable deposits. To determine their actual deposit insurance premiums, each of the Banks computes its base amount on its average consolidated assets less its average tangible equity (defined as the amount of Tier 1 capital) and its applicable assessment rate. The Company’s FDIC deposit insurance costs totaled $3.1$3.5 million in 2013.2015. The FDIC has the power to adjust the assessment rates at any time.
Pursuant to the Dodd-Frank Act, FDIC deposit insurance has been permanently increased from $100,000 to $250,000 per depositor. On December 31, 2012, unlimited FDIC insurance on noninterest-bearing transaction accounts under the Dodd-Frank Act expired.
Under the FDIA, the FDIC may terminate deposit insurance upon a finding that the institution has engaged in unsafe and unsound practices, is in an unsafe or unsound condition to continue operations, or has violated any applicable law, regulation, rule, order or condition imposed by the FDIC.
Cross-Guarantee
Similar to the source of strength doctrine discussed above in “-Regulation“Regulation of the Company-Source of Strength,” under the cross-guarantee provisions of the FDIA, the FDIC can hold any FDIC-insured depository institution liable for any loss suffered or anticipated by the FDIC in connection with (i) the “default” of a commonly controlled FDIC-insured depository institution; or (ii) any assistance provided by the FDIC to a commonly controlled FDIC-insured depository institution “in danger of default.”
Acquisitions and Branching
The Banks must seek prior regulatory approval from the FRB to acquire another bank or establish a new branch office. Brookline Bank and First Ipswich must also seek prior regulatory approval from the MDOB to acquire another bank or establish a new branch office and BankRI must also seek prior regulatory approval from the RIBD to acquire another bank or establish a new branch office. Well capitalized and well managed banks may acquire other banks in any state, subject to certain deposit concentration limits and other conditions, pursuant to the Riegle-Neal Interstate Banking and Branching Efficiency Act of 1994, andas amended by the Dodd-Frank Act. In addition, the Dodd-Frank Act authorizes a state-chartered bank to establish new branches on an interstate basis to the same extent a bank chartered by the host state may establish branches.
Activities and Investments of Insured State-Chartered Banks
Section 24 of the FDIA generally limits the investment activitiestypes of equity investments that FDIC-insured state-chartered banks, when actingsuch as the Banks, may make and the kinds of activities in which such banks may engage, as a principal, to those that are permissible for national banks. Further, the Gramm-Leach-Bliley Act of 1999 (the “GLBA”) permits state banks, to the extent permitted under state law, to engage through “financial subsidiaries” in certain activities which are permissible for subsidiaries of a financial holding company. In order to form a financial subsidiary, a state-chartered bank must be well capitalized, and such banks would be subject tomust comply with certain capital deduction, risk management and affiliate transaction rules, among other things.requirements.
Brokered Deposits
Section 29 of the FDIA and federal regulations generally limit the ability of an insured depository institution to accept, renew or roll over any brokered deposit unless the institution’s capital category is “well capitalized” or, with regulatory approval, “adequately capitalized.” Depository institutions, other than those in the lowest risk category, that have brokered deposits in excess of 10% of total deposits will be subject to increased FDIC deposit insurance premium assessments. Additionally, depository institutions considered “adequately capitalized” that need regulatory approval to accept, renew or roll over any brokered deposits are subject to additional restrictions on the interest rate they may pay on deposits. At As of December 31, 2013,2015, none of the Company did not have anyBanks had brokered deposits in excess of 10% of total deposits.
The Community Reinvestment Act
The Community Reinvestment Act (“CRA”) requires the FRB to evaluate each of the Banks’Banks with regard to their performance in helping to meet the credit needs of the entire communities it serves,each of the Banks serve, including low and moderate-income neighborhoods, consistent with its safe and sound banking operations, and to take this record into consideration when evaluating certain applications. The FRB’s CRA regulations are generally based upon objective criteria of the performance of institutions under three key assessment tests: (i) a lending test, to evaluate the institution’s record of making loans in its service areas; (ii) an investment test, to evaluate the institution’s record of investing in community development projects, affordable housing, and programs benefiting low or moderate income individuals and businesses; and (iii) a service test, to evaluate the institution’s delivery of services through its branches, ATMs, and other offices. Failure of an institution to receive at least a “Satisfactory” rating could inhibit the Banks or the Company from undertaking certain activities, including engaging in activities newly permitted as a financial holding company under GLBA and acquisitions of other financial institutions. Each Bank has achieved a rating of “Satisfactory” on its most recent CRA examination. Both Massachusetts and Rhode Island and Massachusetts have enactedadopted specific community reinvestment requirements which are substantially similar community reinvestment requirements.to those of the FRB.
Lending Restrictions
Federal law limits a bank’s authority to extend credit to its directors, executive officers and holders of more than 10% shareholders,of the Company's common stock, as well as to entities controlled by such persons. Among other things, extensions of credit to insiders are required to be made on terms that are substantially the same as, and follow credit underwriting procedures that are not less stringent than, those prevailing for comparable transactions with unaffiliated persons. Also, the terms of such extensions of credit may not involve more than the normal risk of repayment or present other unfavorable features and may not exceed certain limitations on the amount of credit extended to such persons, individually and in the aggregate, which limits are based, in part, on the amount of the bank’s capital. The Dodd-Frank Act explicitly provides that an extension of credit to an insider includes credit exposure arising from a derivatives transaction, repurchase agreement, reverse repurchase agreement, securities lending transaction or securities borrowing transaction. Additionally, the Dodd-Frank Act requires that asset sale transactions with insiders must be on market terms, and if the transaction represents more than 10% of the capital and surplus of the bank, be approved by a majority of the disinterested directors of the bank.
Capital Adequacy and Safety and Soundness
Regulatory Capital Requirements
The FRB has issued risk-based and leverage capital guidelinesrules applicable to U.S. banking organizations.organizations such as the Company and the Banks. These guidelines are intended to reflect the relationship between the banking organization’s capital and the degree of risk associated with its operations based on transactions recorded on-balance sheet as well as off-balance sheet items. The FRB and the FDIC may from time to time require that a banking organization maintain capital above the minimum levels discussed below, due to the banking organization’s financial condition or actual or anticipated growth.
Current FRBThe capital adequacy guidelinesrules define qualifying capital instruments and specify minimum amounts of capital as a three-tier capital framework.percentage of assets that banking organizations are required to maintain. Common equity Tier 1 capital generally includes common stock and related surplus, retained earnings and, in certain cases and subject to certain limitations, minority interest in consolidated subsidiaries, less goodwill, other non-qualifying intangible assets and certain other deductions. Tier 1 capital for banks and bank holding companies generally consists of the sum of common shareholders’ equity Tier 1 elements, non-cumulative perpetual preferred stock, and trust preferred securities (bothrelated surplus in certain cases and subject to certain limitations, and,minority interests in the case of the latter, to specific limitations on the kind and amount of such securitiesconsolidated subsidiaries that may be includeddo not qualify as common equity Tier 1 capital, andless certain additional restrictions described below), and minority interests in the equity accounts of consolidated subsidiaries, less goodwill and other non-qualifying intangible assets. Pursuant to the Dodd-Frank Act, trust preferred securities issued after May 19, 2010, will not count as Tier 1 capital. The Company’s currently outstanding trust preferred securities were grandfathered for Tier 1 eligibility, subject to a limit of 25% of Tier 1 capital, under the Final Capital Rule discussed below.deductions. Tier 2 capital generally consists of hybrid capital instruments, perpetual debt and mandatory convertible debt securities, cumulative perpetual preferred stock, and trust preferred securities ( to the extent not eligible to be included as Tier 1 capital), term subordinated debt and intermediate-term preferred stock, and, subject to limitations, general allowances for loan losses. The sum of Tier 1 and Tier 2 capital less certain required deductions such as investments in unconsolidated banking or finance subsidiaries, represents qualifying total risk-based capital. Risk-basedPrior to the effectiveness of certain provisions of the Dodd-Frank Act, bank holding companies were permitted to include trust preferred securities and cumulative perpetual
preferred stock in Tier 1 capital, subject to limitations. However, the FRB’s capital rule applicable to bank holding companies permanently grandfathers nonqualifying capital instruments, including trust preferred securities, issued before May 19, 2010 by depository institution holding companies with less than $15 billion in total assets as of December 31, 2009, subject to a limit of 25% of Tier 1 capital. In addition, under rules that became effective January 1, 2015, accumulated other comprehensive income (positive or negative) must be reflected in Tier 1 capital; however, the Company was permitted to make a one-time, permanent election to continue to exclude accumulated other comprehensive income from capital. The Company has made this election.
Under the capital rules, risk-based capital ratios are calculated by dividing common equity Tier 1, Tier 1, and total risk-based capital, respectively, by risk-weighted assets. Assets and off-balance sheet credit equivalents are assigned to one of fourseveral categories of risk-weights, based primarily on relative credit risk. TheUnder the FRB's rules, the Company and the Banks are each required to maintain a minimum common equity Tier 1 capital ratio requirement of 4.5%, a minimum Tier 1 capital ratio requirement of 6%, a minimum total capital requirement of 8% and a minimum leverage ratio requirement of 4%. Additionally subject to a transition schedule, these rules require an institution to establish a capital conservation buffer of common equity Tier 1 capital in an amount above the minimum risk-based capital requirements for "adequately capitalized" institutions equal to 2.5% of total risk weighted assets, or face restrictions on the ability to pay dividends, pay discretionary bonuses, and to engaged in share repurchases.
A bank holding company, such as the Company, is considered "well capitalized" if the bank holding company (i) has a total risk based capital ratio of at least 10%, (ii) has a Tier 1 risk-based capital ratio is 4% and the minimum total risk-based capital ratio is 8%. As of December 31, 2013, the Company’s Tier 1 risk-based capital ratio was 11.0% and its total risk-based capital ratio was 12.2%. The Company is currently considered “well capitalized” under all regulatory definitions.
In addition to the risk-based capital requirements, the FRB requires top-rated bank holding companies to maintain a minimum leverage capital ratio of Tier 1 capital (defined by reference to the risk-based capital guidelines) to its average total consolidated assets of at least 3.0%. For most other bank holding companies (including the Company)6%, the minimum leverageand (iii) is not subject to any written agreement order, capital ratio is 4.0%. Bank holding companies with supervisory, financial, operationaldirective or managerial weaknesses, as well as bank holding companies that are anticipating or experiencing significant growth, are expected to maintain capital ratios well above the minimum levels. The Company’s leverage capital ratio as of December 31, 2013 was 9.4%.
The FRB’s capital adequacy standards also apply to state-chartered banks which are members of the Federal Reserve System, such as the Banks. Moreover, the FRB has promulgated corresponding regulations to implement the system of prompt corrective action established by Section 38 ofdirective to meet and maintain a specific capital level for any capital measure. In addition, under the FDIA. Under these regulations,FRB's prompt corrective action rules, a state member bank is considered “well capitalized” if it has: (i) has a total risk-based capital ratio of 10.0% or greater; (ii) a Tier 1 risk-based capital ratio of 6.0%8.0% or greater; (iii) a common Tier 1 equity ratio of at least 6.5% or greater, (iv) a leverage capital ratio of 5.0% or greater; and (iv) is not subject to any written agreement, order, capital directive, or prompt corrective action directive to meet and maintain a specific capital level for any capital measure. A bank is “adequately capitalized” if it has: (1) a total risk-based capital ratio of 8.0% or greater; (2) a Tier 1 risk-based capital ratio of 4.0% or greater; and (3) a leverage capital ratio of 4.0% or greater (3.0% under certain circumstances) and does not meet the definition of a “well capitalized bank.”
The FRB also must take into consideration:considers: (i) concentrations of credit risk; (ii) interest rate risk; and (iii) risks from non-traditional activities, as well as an institution’s ability to manage those risks, whenrisks. When determining the adequacy of an institution’s capital. Thiscapital, this evaluation will be made asis a part of the institution’s regular safety and soundness examination. Each of the Banks is currently considered well-capitalized under all regulatory definitions.
Generally, a bank, upon receiving notice that it is not adequately capitalized (i.e., that it is “undercapitalized”), becomes subject to the prompt corrective action provisions of Section 38 of FDIA that, for example, (i) restrict payment of capital distributions and management fees, (ii) require that the FRB monitor the condition of the institution and its efforts to restore its capital, (iii) require submission of a capital restoration plan, (iv) restrict the growth of the institution’s assets and (v) require prior regulatory approval of certain expansion proposals. A bank that is required to submit a capital restoration plan must concurrently submit a performance guarantee by each company that controls the bank. A bank that is “critically undercapitalized” (i.e., has a ratio of tangible equity to total assets that is equal to or less than 2.0%) will be subject to further restrictions, and generally will be placed in conservatorship or receivership within 90 days.
The Basel Committee on Banking Supervision has released new capital requirements, known as Basel III, setting forth higher capital requirements, enhanced risk coverage, a global leverage ratio, provisions for counter-cyclical capital, and liquidity standards. On July 2, 2013, the FRB, along with the other federal banking agencies, issued a final rule (the “Final
Capital Rule”) implementing the Basel III capital standards and establishing the minimum capital requirements for banks and bank holding companies requiredBanks are considered “well capitalized” under the Dodd-Frank Act. The majority ofFRB's prompt corrective action rules and the provisions ofCompany is considered “well capitalized” under the Final Capital Rule applyFRB's rules applicable to bank holding companies and banks with consolidated assets of $500 million or more, such as the Company, Brookline Bank and BankRI. The Final Capital Rule establishes a new capital risk-based capital ratio, a minimum common equity Tier 1 capital ratio of 6.5% of risk-weighted assets to be a “well capitalized” institution, and increase the minimum total Tier 1 capital ratio to be a “well capitalized institution from 6.0% to 8.0%. The Final Capital Rule also requires that an institution establish a capital conservation buffer of common equity Tier 1 capital in an amount above the minimum risk-based capital requirements for “adequately capitalized” institutions equal to 2.5% of total risk weight assets, or face restrictions on capital distributions and executive bonuses. The Final Capital Rule increases the required capital for certain categories of assets, including higher-risk construction real estate loans and certain exposures related to securitizations. Under the Final Capital Rule, the Company may make a one-time, permanent election to continue to exclude accumulated other comprehensive income from capital. If the Company does not make this election, unrealized gains and losses would be included in the calculation of its regulatory capital.companies.
The Company must comply with the Final Capital Rule beginning on January 1, 2015.
Safety and Soundness Standards
The FDIA requires the federal bank regulatory agencies to prescribe standards, by regulations or guidelines, relating to internal controls, information systems and internal audit systems, risk management, loan documentation, credit underwriting, interest rate risk exposure, asset growth, asset quality, earnings, stock valuation and compensation, fees and benefits, and such other operational and managerial standards as the agencies deem appropriate. Guidelines adopted by the federal bank regulatory agencies establish general standards relating to internal controls and information systems, internal audit systems, loan documentation, credit underwriting, interest rate exposure, asset growth and compensation, fees and benefits. In general, these guidelines require, among other things, appropriate systems and practices to identify and manage the risk and exposures specified in the guidelines. The guidelines prohibit excessive compensation as an unsafe and unsound practice and describe compensation as excessive when the amounts paid are unreasonable or disproportionate to the services performed by an executive officer, employee, director or principal stockholder. In addition, the federal banking agencies adopted regulations that authorize, but do not require, an agency to order an institution that has been given notice by an agency that it is not satisfying any of such safety and soundness standards to submit a compliance plan. If, after being so notified, an institution fails to submit an acceptable compliance plan or fails in any material respect to implement an acceptable compliance plan, the agency must issue an order directing action to correct the deficiency and may issue an order directing other actions of the types to which an undercapitalized institution is subject under the “prompt corrective action” provisions of FDIA. See “-Regulatory“Regulatory Capital Requirements”Requirements” above. If an institution fails to comply with such an order, the agency may seek to enforce such order in judicial proceedings and to impose civil money penalties.
Dividend Restrictions
The Company is a legal entity separate and distinct from the Banks. The revenue of the Company (on a parent company only basis) is derived primarily from dividends paid to it by the Banks. The right of the Company, and consequently the right of shareholders of the Company, to participate in any distribution of the assets or earnings of the Banks through the payment of such dividends or otherwise is necessarily subject to the prior claims of creditors of the Banks (including depositors), except to the extent that certain claims of the Company in a creditor capacity may be recognized.
Restrictions on Bank Holding Company Dividends
The FRB has authority to prohibit bank holding companies from paying dividends if such payment is deemed to be an unsafe or unsound practice. The FRB has indicated generally that it may be an unsafe or unsound practice for bank holding companies to pay dividends unless the bank holding company’s net income overfor the precedingprior year is sufficient to fund the dividends and the expected rate of earnings retention is consistent with the organization’s capital needs, asset quality and overall financial condition. Further, when the Final Capital Rule comes into effect, ourCompany's ability to pay dividends will be restricted if we doit does not maintain athe required capital conservation buffer. See “-Capital“Capital Adequacy and Safety and Soundness-Regulatory Capital Requirements”Requirements” above.
Restrictions on Bank Dividends
The FRB has the authority to use its enforcement powers to prohibit a bank from paying dividends if, in its opinion, the payment of dividends would constitute an unsafe or unsound practice. Federal law also prohibits the payment of dividends by a bank that will result in the bank failing to meet its applicable capital requirements on a pro forma basis. Payment of dividends by a bank is also restricted pursuant to various state regulatory limitations.
Certain Transactions by Bank Holding Companies with their Affiliates
There are various statutory restrictions on the extent to which bank holding companies and their non-bank subsidiaries may borrow, obtain credit from or otherwise engage in “covered transactions” with their insured depository institution subsidiaries. The Dodd-Frank Act amended the definition of affiliate to include an investment fund for which the depository institution or one of its affiliates is an investment adviser. An insured depository institution (and its subsidiaries) may not lend money to, or engage in covered transactions with, its non-depository institution affiliates if the aggregate amount of covered transactions outstanding involving the bank, plus the proposed transaction, exceeds the following limits: (i) in the case of any one such affiliate, the aggregate amount of covered transactions of the insured depository institution and its subsidiaries cannot exceed 10% of the capital stock and surplus of the insured depository institution; and (ii) in the case of all affiliates, the aggregate amount of covered transactions of the insured depository institution and its subsidiaries cannot exceed 20% of the capital stock and surplus of the insured depository institution. For this purpose, “covered transactions” are defined by statute to include a loan or extension of credit to an affiliate, a purchase of or investment in securities issued by an affiliate, a purchase of assets from an affiliate unless exempted by the FRB, the acceptance of securities issued by an affiliate as collateral for a loan or extension of credit to any person or company, the issuance of a guarantee, acceptance or letter of credit on behalf of an affiliate, securities borrowing or lending transactions with an affiliate that creates a credit exposure to such affiliate, or a derivatives transaction with an affiliate that creates a credit exposure to such affiliate. Covered transactions are also subject to certain collateral security requirements. Covered transactions as well as other types of transactions between a bank and a bank holding company must be on market terms and not otherwise unduly favorable to the holding company or an affiliate of the holding company. As of December 31, 2015, there were no such transactions. Moreover, Section 106 of the BHCA provides that, to further competition, a bank holding company and its subsidiaries are prohibited from engaging in certain tying arrangements in connection with any extension of credit, lease or sale of property of any kind, or furnishing of any service. At As of December 31, 2013,2015, there were no such transactions.
Consumer Protection Regulation
The Company and the Banks are subject to a number of federal and state laws designed to protect consumers and prohibit unfair or deceptive business practices. These laws include the Equal Credit Opportunity Act, Fair Housing Act, Home Ownership Protection Act, Fair Credit Reporting Act, as amended by the Fair and Accurate Credit Transactions Act of 2003 (the “FACT Act”), GLBA, Truth in Lending Act, the CRA, the Home Mortgage Disclosure Act, Real Estate Settlement Procedures Act, National Flood Insurance Act and various state law counterparts. These laws and regulations mandate certain disclosure requirements and regulate the manner in which financial institutions must interact with customers when taking deposits, making loans, collecting loans and providing other services. Further, the Dodd-Frank Act established the CFPB,Consumer Financial Protection Bureau ("CFPB"), which has the responsibility for making rules and regulations under the federal consumer protection laws relating to financial products and services. The CFPB also has a broad mandate to prohibit unfair or deceptive acts and practices and is specifically empowered to require certain disclosures to consumers and draft model
disclosure forms. Failure to comply with consumer protection laws and regulations can subject financial institutions to enforcement actions, fines and other penalties. The FRB will examineexamines the Banks for compliance with CFPB rules and enforce CFPB rules with respect to the Banks.
Mortgage Reform
The Dodd-Frank Act prescribes certain standards that mortgage lenders must consider before making a residential mortgage loan, including verifying a borrower’s ability to repay such mortgage loan, and allows borrowers to assert violations of certain provisions of the Truth-in-Lending Act as a defense to foreclosure proceedings. Under the Dodd-Frank Act, prepayment penalties are prohibited for certain mortgage transactions and creditors are prohibited from financing insurance policies in connection with a residential mortgage loan or home equity line of credit. In addition, the Dodd-Frank Act prohibits mortgage originators from receiving compensation based on the terms of residential mortgage loans and generally limits the ability of a mortgage originator to be compensated by others if compensation is received from a consumer. The Dodd-Frank Act requires mortgage lenders to make additional disclosures prior to the extension of credit, in each billing statement and for negative amortization loans and hybrid adjustable rate mortgages. Additionally, the CFPB’s qualified mortgage rule, (the “QM Rule”), requires creditors, such as the Banks, to make a reasonable good faith determination of a consumer's ability to repay any consumer credit transaction secured by a dwelling prior to making the loan.
Privacy and Customer Information Security
The GLBA requires financial institutions to implement policies and procedures regarding the disclosure of nonpublic personal information about consumers to nonaffiliated third parties. In general, the Banks must provide their customers with an annual disclosure that explains their policies and procedures regarding the disclosure of such nonpublic personal information, and, except as otherwise required or permitted by law, the Banks are prohibited from disclosing such information except as provided in such policies and procedures. If the financial institution only discloses information under exceptions from the GLBA that do not require an opt out to be provided and if there has been no change in the financial institutions privacy policies and practices since its most recent disclosures provide to customers, an annual disclosure is not required to be provided by the financial institution. The GLBA also requires that the Banks develop, implement and maintain a comprehensive written information security program designed to ensure the security and confidentiality of customer information (as defined under GLBA), to protect against anticipated threats or hazards to the security or integrity of such information and to protect against unauthorized access to or use of such information that could result in substantial harm or inconvenience to any customer. The Banks are also required to send a notice to customers whose “sensitive information” has
been compromised if unauthorized use of this information is “reasonably possible.” Most of the states, including the states where the Banks operate, have enacted legislation concerning breaches of data security and the duties of the Banks in response to a data breach. Congress continues to consider federal legislation that would require consumer notice of data security breaches. Pursuant to the FACT Act, the Banks must also develop and implement a written identity theft prevention program to detect, prevent, and mitigate identity theft in connection with the opening of certain accounts or certain existing accounts. Additionally, the FACT Act amends the Fair Credit Reporting Act to generally prohibit a person from using information received from an affiliate to make a solicitation for marketing purposes to a consumer, unless the consumer is given notice and a reasonable opportunity and a reasonable and simple method to opt out of the making of such solicitations.
Anti-Money Laundering
The Bank Secrecy Act
Under the Bank Secrecy Act (“BSA”), a financial institution is required to have systems in place to detect certain transactions, based on the size and nature of the transaction. Financial institutions are generally required to report to the United States Treasury any cash transactions involving more than $10,000. In addition, financial institutions are required to file suspicious activity reports for any transaction or series of transactions that involve more than $5,000 and which the financial institution knows, suspects or has reason to suspect involves illegal funds, is designed to evade the requirements of the BSA or has no lawful purpose. The Uniting and Strengthening America by Providing Appropriate Tools Required to Intercept and Obstruct Terrorism Act of 2001 (the “USA PATRIOT Act”), which amended the BSA, is designed to deny terrorists and others the ability to obtain anonymous access to the U.S. financial system. The USA PATRIOT Act has significant implications for financial institutions and businesses of other types involved in the transfer of money. The USA PATRIOT Act, together with the implementing regulations of various federal regulatory agencies, has caused financial institutions, such as the Banks, to adopt and implement additional policies or amend existing policies and procedures with respect to, among other things, anti-money laundering compliance, suspicious activity, currency transaction reporting, customer identity verification and customer risk analysis. In evaluating an application under Section 3 of the BHCA to acquire a bank or an application under the Bank Merger Act to merge banks or effect a purchase of assets and assumption of deposits and other liabilities, the applicable federal banking
regulator must consider the anti-money laundering compliance record of both the applicant and the target. In addition, under the USA PATRIOT Act, financial institutions are required to take steps to monitor their correspondent banking and private banking relationships as well as, if applicable, their relationships with “shell banks.”
Office of Foreign Assets Control (“OFAC”)
The United StatesU.S. has imposed economic sanctions that affect transactions with designated foreign countries, nationals and others. These sanctions, which are administered by OFAC,the U.S. Treasury’s Office of Foreign Assets Control (“OFAC”), take many different forms. Generally, however, they contain one or more of the following elements: (i) restrictions on trade with or investment in a sanctioned country, including prohibitions against direct or indirect imports from and exports to a sanctioned country and prohibitions on “U.S. persons” engaging in financial or other transactions relating to making investments in, or providing investment-related advice or assistance to, a sanctioned country;country or with certain designated persons and entities; (ii) a blocking of assets in which the government or specially designated nationals of the sanctioned country have an interest, by prohibiting transfers of property subject to U.S. jurisdiction (including property in the possession or control of U.S. persons).; and (iii) restrictions on transactions with or involving certain persons or entities. Blocked assets (for example, property and bank deposits) cannot be paid out, withdrawn, set off or transferred in any manner without a license from OFAC. Failure to comply with these sanctions could have serious legal and reputational consequences for the Banks. At Company. As of December 31, 2013,2015, the Company did not have any transactions with sanctioned countries, nationals, and others.
Regulation of Other Activities
Volcker Rule Restrictions on Proprietary Trading and Sponsorship of Hedge Funds and Private Equity Funds
The Dodd-Frank Act barsprohibits banking organizations, such as the Company and the Banks, from engaging in proprietary trading and from sponsoring and investing in hedge funds and private equity funds, except as permitted under certain limited circumstances, in a provision commonly referred to as the “Volcker Rule.” Under the Dodd-Frank Act, proprietary trading generally means trading by a banking entity or its affiliate for its owntrading account. Hedge funds and private equity funds are described by the Dodd-Frank Act as funds that would be registered under the Investment Company Act but for certain enumerated exemptions. The Volcker Rule restrictions apply to the Company, the Banks and all of their subsidiaries and affiliates.
Item 1A. Risk Factors
Before deciding to invest in us or deciding to maintain or increase your investment, you should carefully consider the risks described below, in addition to the other information contained in this report and in our other filings with the SEC. The risks and uncertainties described below and in our other filings are not the only ones facing us. Additional risks and uncertainties not presently known to us or that we currently deem immaterial may also affect our business. If any of these
known or unknown risks or uncertainties actually occur, our business, financial condition and results of operations could be seriously harmed. In that event, the market price for our common stock could decline and you may lose your investment.
We operate in a highly regulated industry, and laws and regulations, or changes in them, could limit or restrict our activities and could have an adverse impact in our operations.
We and our banking subsidiaries are subject to regulation and supervision by the FRB. Our banking subsidiaries are also subject to regulation and supervision by state banking regulators and the FRB. Federal and state laws and regulations govern numerous matters affecting us, including changes in the ownership or control of banks and bank holding companies, maintenance of adequate capital and the financial condition of a financial institution, permissible types, amounts and terms of extensions of credit and investments, permissible non-banking activities, the level of reserves against deposits and restrictions on dividend payments. The FRB and the state banking regulators have the power to issue cease and desist orders to prevent or remedy unsafe or unsound practices or violations of law by banks subject to their regulation, and the FRB possesses similar powers with respect to bank holding companies. These and other restrictions limit the manner in which we and our banking subsidiaries may conduct business and obtain financing.
Our business is also affected by the monetary policies of the FRB. Changes in monetary or legislative policies may affect the interest rates that our banking subsidiaries must offer to attract deposits and the interest rates it must charge on loans, as well as the manner in which it offers deposits and makes loans. These monetary policies have had, and are expected to continue to have, significant effects on the operating results of depository institutions generally, including our banking subsidiaries.
Because our business isAs a highly regulated business, the laws, rules, regulations, and supervisory guidance and policies applicable to us are subject to regular modification and change. It is impossible to predict the competitive impact that any such changes would have on the banking and financial services industry in general, or on our business in particular. Such changes may, among other
things, increase the cost of doing business, limit permissible activities, or affect the competitive balance between banks and other financial institutions. The Dodd-Frank Act instituted major changes to the banking and financial institutions regulatory regimes in light of the recent performance of and government intervention in the financial services sector.sector following the 2008 financial crisis. Other changes to statutes, regulations, or regulatory policies, including changes in interpretation or implementation of statutes, regulations, or policies, or supervisory guidance could affect us in substantialenforcement and unpredictable ways. Such changes could subject us to additional costs, limitother legal actions by federal or state authorities, including criminal and civil penalties, the typesloss of financial services and products we may offer, and/or increase the abilityFDIC insurance, revocation of non-banks to offer competing financial services and products, amonga banking charter, other things. Failure to comply with laws, regulations, or policies could result in sanctions by regulatory agencies, civil money penalties, and/or reputationreputational damage, which could have a material adverse effect on our business, financial condition, and results of operations. See the "Supervision"Supervision and Regulation" section of Item 1, "Business."
Additional requirements imposed by the Dodd-Frank Act could adversely affect us.
The Dodd-Frank Act comprehensively reformed the regulation of financial institutions, products and services. Because many aspects of the Dodd-Frank Act are subject to rulemaking that will take effect over several years, it is difficult to forecast the full impact that such rulemaking will have on us, its customers or the financial industry. In addition, the Dodd-Frank Act established the CFPB. The CFPB has the authority to prescribe rules for all depository institutions governing the provision of consumer financial products and services, which may result in rules and regulations that reduce the profitability of such products and services or impose greater costs and restrictions on the Company and its subsidiaries. The Dodd-Frank Act also established new minimum mortgage underwriting standards for residential mortgages, and the regulatory agencies have focused on the examination and supervision of mortgage lending and servicing activities.
Effective December 10, 2013, pursuant to the Dodd-Frank Act, federal banking and securities regulators issued final rules to implement Section 619 of the Dodd-Frank Act, also known as the “Volcker Rule.” Generally, the Volcker Rule restricts banking organizations and their affiliated companies from engaging in proprietary trading and from sponsoring and investing in hedge funds and private equity funds, except as permitted under certain limited circumstances. After the transition period, the Volcker Rule restrictions will apply to the Company, the Bank and all of our subsidiaries and affiliates, unless an exception applies.
Current and future legal and regulatory requirements, restrictions, and regulations, including those imposed under the Dodd-Frank Act, may adversely impact our profitability and may have a material and adverse effect on our business, financial condition, and results of operations, may require us to invest significant management attention and resources to evaluate and make any changes required by the legislation and related regulations and may make it more difficult for us to attract and retain qualified executive officers and employees.
We willhave become subject to more stringent capital requirements.
The Dodd-Frank Act required the federal banking agencies to establish minimum leverage and risk-based capital requirements for insured banks and their holding companies. The federal banking agencies issued a joint final rule, or the “Final Capital Rule,” that implementsimplemented the Basel III capital standards and establishesestablished the minimum capital levels required under the Dodd-Frank Act. We mustAs of January 1, 2015 we are required to comply with the Final Capital Rule by January 1, 2015.Rule. The Final Capital Rule establishesrequires banks and bank holding companies to maintain a minimum common equity Tier I1 capital ratio of 4.5% of risk-weighted assets, a minimum Tier 1 capital ratio of 6% of risk-weighted assets, a total capital ratio of 8% of risk-weighted assets, and a leverage ratio of 4%. In addition, in connection with implementing the Final Capital Rule, the FDIC revised its prompt corrective action regulations for state nonmember banks to require a minimum common equity Tier 1 capital ratio of 6.5% of risk-weighted assets for a “well capitalized” institution and increasesincreased the minimum Tier I1 capital ratio for a “well capitalized” institution from 6.0%6% to 8.0%8%. Additionally, subject to a transition period, the Final Capital Rule requires an institutionbanks and bank holding companies to maintain a 2.5% common equity Tier I1 capital conservation buffer overabove the 6.5% minimum risk-based capital requirementrequirements for “adequately capitalized”adequately capitalized institutions or faceto avoid restrictions on the ability to pay dividends, discretionary bonuses, and to engage in share repurchases. The Company and the Banks met these requirements as of December 31, 2015. The Final Capital Rule permanently grandfathersgrandfathered trust preferred securities issued before May 19, 2010 for institutions with less than $15 billion in total assets as of December 31, 2009, subject to a limit of 25% of Tier I1 capital. The Final Capital Rule increasesincreased the required capital for certain categories of assets, including high-volatilityhigh volatility construction real estate loans and certain exposures related to securitizations; however, the Final Capital Rule retainsretained the currentprevious capital treatment of residential mortgages. Under the Final Capital Rule, we maythe Company was permitted to make a one-time, permanent election to continue to exclude accumulated other comprehensive income from capital. If we do not makeThe Company has made this election, unrealized gains and losses will be included in the calculation of our regulatory capital.election. Implementation of these standards, or any other new regulations, may adversely affect our ability to pay dividends, or require us to reduce business levels or raise capital, including in ways that may adversely affect our results of operations or financial condition.
We face significant legal risks, both from regulatory investigations and proceedings and from private actions brought against us.
From time to time we are named as a defendant or are otherwise involved in various legal proceedings, including class actions and other litigation or disputes with third parties. There is no assurance that litigation with private parties will not increase in the future. Actions against us may result in judgments, settlements, fines, penalties or other results adverse to us, which could materially adversely affect our business, financial condition or results of operations, or cause serious reputational harm to us. As a participant in the financial services industry, it is likely that we willcould continue to experience a high level of litigation related to our businesses and operations.
Our businesses and operations are also subject to increasing regulatory oversight and scrutiny, which may lead to additional regulatory investigations or enforcement actions. These and other initiatives from federal and state officials may subject us to further judgments, settlements, fines or penalties, or cause us to be required to restructure our operations and activities, all of which could lead to reputational issues, or higher operational costs, thereby reducing our revenue.
We may incur fines, penalties and other negative consequences from regulatory violations, possibly even inadvertent or unintentional violations.
We maintain systems and procedures designed to ensure that we comply with applicable laws and regulations. However, some legal/regulatory frameworks provide for the imposition of fines or penalties for noncompliance even though the noncompliance was inadvertent or unintentional and even though there was in place at the time systems and procedures designed to ensure compliance. For example, we are subject to regulations issued by the Office of Foreign Assets Control, or “OFAC,” that prohibit financial institutions from participating in the transfer of property belonging to the governments of certain foreign countries and designated nationals of those countries.countries and certain other persons or entities whose interest in property is blocked by OFAC-administered sanctions. OFAC may impose penalties for inadvertent or unintentional violations even if reasonable processes are in place to prevent the violations. There may be other negative consequences resulting from a finding of noncompliance, including restrictions on certain activities. Such a finding may also damage our reputation as described below and could restrict the ability of institutional investment managers to invest in our securities.
Our business may be adversely affected by conditions in the financial markets and by economic conditions generally.
Continued weaknessWeakness in the U.S. economy may adversely affect our business. AlthoughWhile in recent years there are indications thathas been a gradual improvement in the U.S. economy, is stabilizing, the outlook remains uncertain amid concerns about publicshort- and long-term interest rates, debt levelsand equity capital markets and financial market conditions.conditions generally. A deterioration of business and economic conditions could adversely affect the credit quality of our loans, results of operations and financial condition. Increases in loan delinquencies and default rates could adversely impact our loan charge-offs and provision for loan and lease losses. Deterioration or defaults made by issuers of the underlying collateral of our investment securities may cause additional credit-related other-than-temporary impairment charges to our income statement. Our ability to borrow from other financial institutions or to access the debt or equity capital markets on favorable terms or at all could be adversely affected by disruptions in the capital markets or other events, including actions by rating agencies and deteriorating investor expectations.
Deterioration in local economies or real estate market may adversely affect our business.
We primarily serve individuals and businesses located in the greater Boston metropolitan area, eastern Massachusetts, New York, New Jersey, and Rhode Island. Our success is largely dependent on the economic conditions, including employment levels, population growth, income levels, savings trends and government policies, in those market areas. Weaker economic conditions caused by recession, unemployment, inflation, a decline in real estate values or other factors beyond our control may adversely affect the ability of our borrowers to service their debt obligations, and could result in higher loan and lease losses and lower net income for us.
If our allowance for loan and lease losses is not sufficient to cover actual loan and lease losses, our earnings wouldmay decrease.
We are exposed to the risk that our borrowers may default on their obligations. A borrower's default on its obligations under one or more loans or leases may result in lost principal and interest income and increased operating expenses as a result of the allocation of management time and resources to the collection and work-out of the loan or lease. In certain situations, where collection efforts are unsuccessful or acceptable work-out arrangements cannot be reached, we may have to write off the loan or lease in whole or in part. In such situations, we may acquire real estate or other assets, if any, that secure the loan or lease through foreclosure or other similar available remedies, and often the amount owed under the defaulted loan or lease exceeds the value of the assets acquired.
We periodically make a determination of an allowance for loan and lease losses based on available information, including, but not limited to, the quality of the loan and lease portfolio certainas indicated by loan risk ratings, economic conditions, the value of the underlying collateral and the level of nonaccruing and criticized loans and leases. Management relies on its loan officers and credit quality reviews, its experience and its evaluation of economic conditions, among other factors, in determining the amount of provision required for the allowance for loan and lease losses. Provisions to this allowance result in an expense for the period. If, as a result of general economic conditions, previously incorrect assumptions, or an increase in defaulted loans or leases, we determine that additional increases in the allowance for loan and lease losses are necessary, additional expenses willmay be incurred.
Determining the allowance for loan and lease losses inherently involves a high degree of subjectivity and requires us to make significant estimates of current credit risks and trends, all of which may undergo material changes. At any time, there are likely to be loans and/or leases in our portfolio that will result in losses but that have not been identified as nonperforming or potential problem credits. We cannot be sure that we will be able to identify deteriorating credits before they become nonperforming assets or that we will be able to limit losses on those loans and leases that are identified. We have in the past been, and in the future may be, required to increase our allowance for loan and lease losses for any of several reasons. State and federal regulators, in reviewing our loan and lease portfolio as part of a regulatory examination, may request that we increase the allowance for loan and lease losses. Changes in economic conditions or individual business or personal circumstances affecting borrowers, new information regarding existing loans and leases, identification of additional problem loans and leases and other factors, both within and outside of our control, may require an increase in the allowance for loan and lease losses. In addition, if charge-offs in future periods exceed the allowance for loan and lease losses, we will need additional increases in its allowance for loan and lease losses. Any increases in the allowance for loan and lease losses willmay result in a decrease in our net income and, possibly, our capital, and could have an adverse effect on our financial condition and results of operations.
Our loan and lease portfolios include commercial real estate mortgage loans and commercial loans and leases, which are generally riskier than other types of loans.
Our commercial real estate and commercial loan and lease portfolios currently comprise 72.6%80.8% of total loans and leases. Commercial loans and leases generally carry larger balances and involve a higher risk of nonpayment or late payment than residential mortgage loans. Most of the commercial loans and leases are secured by borrower business assets such as accounts receivable, inventory, equipment and other fixed assets. Compared to real estate, these types of collateral are more difficult to monitor, harder to value, may depreciate more rapidly and may not be as readily saleable if repossessed. Repayment of
commercial loans and leases is largely dependent on the business and financial condition of borrowers. Business cash flows are dependent on the demand for the products and services offered by the borrower's business. Such demand may be reduced when economic conditions are weak or when the products and services offered are viewed as less valuable than those offered by competitors. Because of the risks associated with commercial loans and leases, we may experience higher rates of default than if the portfolio were more heavily weighted toward residential mortgage loans. Higher rates of default could have an adverse effect on our financial condition and results of operations.
Environmental liability associated with our lending activities could result in losses.
In the course of business, we may acquire, through foreclosure, properties securing loans originated or purchased that are in default. Particularly in commercial real estate lending, there is a risk that material environmental violations could be discovered on these properties. In this event, we might be required to remedy these violations at the affected properties at our
sole cost and expense. The cost of remedial action could substantially exceed the value of affected properties. We may not have adequate remedies against the prior owner or other responsible parties and could find it difficult or impossible to sell the affected properties. These events could have an adverse effect on our financial condition and results of operations.
Competition in the financial services industry could make it difficult for us to sustain adequate profitability.
We face significant competition for loans, leases and deposits from other banks and financial institutions both within and beyond our local marketplace. Many of our competitors have substantially greater resources and higher lending limits than we do and may offer products and services that we do not, or cannot, provide. There is also increased competition by out-of-market competitors through the internet. The ability of non-banking financial institutions to provide services previously limited to commercial banks has intensified competition. Because non-banking financial institutions are not subject to the same regulatory restrictions as banks and bank holding companies, they can often operate with greater flexibility and lower cost structures. Securities firms and insurance companies that elect to become financial holding companies may acquire banks and other financial institutions. This may significantly change the competitive environment in which we conduct our business. As a result of these various sources of competition, we could lose business to competitors or could be forced to price products and services on less advantageous terms to retain or attract clients, either of which would adversely affect our profitability.
Market changes may adversely affect demand for our services and impact results of operations.
Channels for servicing our customers are evolving rapidly, with less reliance on traditional branch facilities, more use of online and mobile banking, and increased demand for universal bankers and other relationship managers who can service multiples product lines. We compete with larger providers who are rapidly evolving their service channels and escalating the costs of evolving the service process. We have a process for evaluating the profitability of our branch system and other office and operational facilities. The identification of unprofitable operations and facilities can lead to restructuring charges and introduce the risk of disruptions to revenues and customer relationships.
Changes to interest rates could adversely affect our results of operations and financial condition.
Our consolidated results of operations depend, on a large part, on net interest income, which is the difference between (i) interest income on interest-earning assets, such as loans, leases and securities, and (ii) interest expense on interest-bearing liabilities, such as deposits and borrowed funds. As a result, our earnings and growth are significantly affected by interest rates, which are subject to the influence of economic conditions generally, both domestic and foreign, to events in the capital markets and also to the monetary and fiscal policies of the United States and its agencies, particularly the FRB. The nature and timing of any changes in such policies or general economic conditions and their effect on us cannot be controlled and are extremely difficult to predict. An increase in interest rates could also have a negative impact on our results of operations by reducing the ability of borrowers to repay their current loan obligations, which could not only result in increased loan defaults, foreclosures and charge-offs, but also necessitate further increases to our allowances for loan losses. A decrease in interest rates may trigger loan prepayments, which may serve to reduce net interest income if we are unable to lend those funds to other borrowers or invest the funds at the same or higher interest rates.
Our securities portfolio performance in difficult market conditions could have adverse effects on our results of operations.
Unrealized losses on investment securities result from changes in credit spreads and liquidity issues in the marketplace, along with changes in the credit profile of individual securities issuers. Under GAAP, we are required to review our investment portfolio periodically for the presence of other-than-temporary impairment of our securities, taking into consideration current market conditions, the extent and nature of changes in fair value, issuer rating changes and trends, volatility of earnings, current analysts' evaluations, our ability and intent to hold investments until a recovery of fair value, as well as other factors. Adverse developments with respect to one or more of the foregoing factors may require us to deem particular securities to be other-than-temporarily impaired, with the credit-related portion of the reduction in the value recognized as a charge to our earnings.
Subsequent valuations, in light of factors prevailing at that time, may result in significant changes in the values of these securities in future periods. Any of these factors could require us to recognize further impairments in the value of our securities portfolio, which may have an adverse effect on our results of operations in future periods.
Wholesale funding sources may prove insufficient to replace deposits at maturity and support our operations and future growth.
We and our banking subsidiaries must maintain sufficient funds to respond to the needs of depositors and borrowers. To manage liquidity, we draw upon a number of funding sources in addition to core deposit growth and repayments and maturities of loans and investments. These sources include Federal Home Loan Bank advances, proceeds from the sale of investments and loans, and liquidity resources at the holding company. Our ability to manage liquidity will be severely constrained if we are unable to maintain access to funding or if adequate financing is not available to accommodate future growth at acceptable costs. In addition, if we are required to rely more heavily on more expensive funding sources to support future growth, our revenues may not increase proportionately to cover our costs. In this case, operating margins and profitability would be adversely affected. Turbulence in the capital and credit markets may adversely affect our liquidity and financial condition and the willingness of certain counterparties and customers to do business with us.
The soundness of other financial institutions could adversely affect us.
Our ability to engage in routine funding transactions could be adversely affected by the actions and commercial soundness of other financial institutions. Financial services institutions are interrelated as a result of trading, clearing, counterparty and other relationships. We have exposure to many different counterparties, and we routinely execute transactions
with counterparties in the financial industry, including brokers and dealers, other commercial banks, investment banks, mutual and hedge funds, and other financial institutions. As a result, defaults by, or even rumors or questions about, one or more financial services institutions, or the financial services industry generally, could lead to market-wide liquidity problems and losses or defaults by us or by other institutions and organizations. Many of these transactions expose us to credit risk in the event of default of our counterparty or client. In addition, our credit risk may be exacerbated when the collateral held by us cannot be liquidated or is liquidated at prices not sufficient to recover the full amount of the financial instrument exposure due to us. There is no assurance that any such losses would not materially and adversely affect our results of operations.
Damage to our reputation could significantly harm our business, including our competitive position and business prospects.
We are dependent on our reputation within our market area, as a trusted and responsible financial company, for all aspects of our relationships with customers, employees, vendors, third-party service providers, and others, with whom we conduct business or potential future business. Our ability to attract and retain customers and employees could be adversely affected if our reputation is damaged. Our actual or perceived failure to address various issues could give rise to reputational risk that could cause harm to us and our business prospects. These issues also include, but are not limited to, legal and regulatory requirements; properly maintaining customer and employee personal information; record keeping; money-laundering; sales and trading practices; ethical issues; appropriately addressing potential conflicts of interest; and the proper identification of the legal, reputational, credit, liquidity and market risks inherent in our products. Failure to appropriately address any of these issues could also give rise to additional regulatory restrictions and legal risks, which could, among other consequences, increase the size and number of litigation claims and damages asserted or subject us to enforcement actions, fines and penalties and incur related costs and expenses.
Our ability to service our debt and pay dividends is dependent on capital distributions from our subsidiary banks, and these distributions are subject to regulatory limits and other restrictions.
We are a legal entity that is separate and distinct from the Banks. Our revenue (on a parent company only basis) is derived primarily from dividends paid to us by the Banks. Our right, and consequently the right of our shareholders, to participate in any distribution of the assets or earnings of the Banks through the payment of such dividends or otherwise is necessarily subject to the prior claims of creditors of the Banks (including depositors), except to the extent that certain claims of ours in a creditor capacity may be recognized. It is possible, depending upon the financial condition of our subsidiary banks and other factors, that applicable regulatory authorities could assert that payment of dividends or other payments is an unsafe or unsound practice. If one or more of our subsidiary banks is unable to pay dividends to us, we may not be able to service our debt or pay dividends on our common stock. Further, whenas a result of the capital conservation buffer requirement of the Final Capital Rule, comes into effect, our ability to pay dividends wouldon our common stock or service our debt could be restricted if we do not maintain a capital conservation buffer. A reduction or elimination of dividends could adversely affect the market price of our common stock and would adversely affect our business, financial condition, results of operations and prospects. See Item 1, “Business-Supervision“Business-Supervision and Regulation-DividendRegulation-Dividend Restrictions” and “Business-Supervision“Business-Supervision and Regulation-CapitalRegulation-Capital Adequacy and Safety and Soundness-RegulatorySoundness-Regulatory Capital Requirements.”
To the extent that we acquire other companies, our business may be negatively impacted by certain risks inherent with such acquisitions.
We have acquired and will continue to consider the acquisition of other financial services companies. To the extent that we acquire other companies in the future, our business may be negatively impacted by certain risks inherent with such acquisitions. Some of these risks include the following:
•The risk that the acquired business will not perform in accordance with management'sManagement's expectations;
•The risk that difficulties will arise in connection with the integration of the operations of the acquired business with the operations of our businesses;
•The risk that managementManagement will divert its attention from other aspects of our business;
•The risk that we may lose key employees of the combined business; and
•The risks associated with entering into geographic and product markets in which we have limited or no direct prior experience.
We may be required to write down goodwill and other acquisition-related identifiable intangible assets.
When we acquire a business, a portion of the purchase price of the acquisition may be allocated to goodwill and other identifiable intangible assets. The excess of the purchase price over the fair value of the net identifiable tangible and intangible assets acquired determines the amount of the purchase price that is allocated to goodwill acquired. At As of December 31, 2013,2015, goodwill and other identifiable intangible assets were $154.8 million.$148.5 million. Under current accounting guidance, if we determine that goodwill or intangible assets are impaired, we would be required to write down the value of these assets. We conduct an annual review to determine whether goodwill and other identifiable intangible assets are impaired. Company managementWe conduct a quarterly review for for indicators of impairment of goodwill and other identifiable intangible assets. The Company's Management recently completed such an impairment analysisthese reviews and concluded that no impairment charge was necessary for the year ended
December 31, 2013.2015. We cannot provide assurance whether we will be required to take an impairment charge in the future. Any impairment charge would have a negative effect on stockholders' equity and financial results and may cause a decline in our stock price.
Systems failures, interruptions or breaches of security and other cyber security risks could have an adverse effect on our financial condition and results of operations.
We are subject to certain operational risks, including, but not limited to, data processing system failures and errors, cyber security breaches, inadequate or failed internal processes, customer or employee fraud and catastrophic failures resulting from terrorist acts or natural disasters. We depend upon data processing, software, communication, and information exchange on a variety of computing platforms and networks and over the Internet, and we rely on the services of a variety of vendors to meet our data processing and communication needs. Despite instituted safeguards, we cannot be certain that all of our systems are entirely free from vulnerability to attack or other technological difficulties or failures. Information security risks have increased significantly due to the use of online, telephone and mobile banking channels by clients and the increased sophistication and activities of organized crime, hackers, terrorists and other external parties. Our technologies, systems, networks and our clients’ devices have been subject to, and are likely to continue to be the target of, cyber-attacks, computer viruses, malicious code, phishing attacks or information security breaches that could result in the unauthorized release, gathering, monitoring, misuse, loss or destruction of our or our clients’ confidential, proprietary and other information, the theft of client assets through fraudulent transactions or disruption of our or our clients’ or other third parties’ business operations. If information security is breached or other technology difficulties or failures occur, information may be lost or misappropriated, and services and operations may be interruptedinterrupted. A security breach could result in violations of applicable privacy and we could be exposedother laws, financial loss to claims from customers.us or to our customers, loss of confidence in our security measures, significant litigation exposure, and harm to our reputation. While we maintain a system of internal controls and procedures, any of these results could have a material adverse effect on our business, financial condition, results of operations or liquidity.
We rely on other companies to provide key components of our business infrastructure.
Third party vendors provide key components of our business infrastructure such as internet connections, network access and core application processing. While we have selected these third party vendors carefully, we do not control their actions. Any problems caused by these third parties, including as a result of their not providing us their services for any reason or their performing their services poorly, could adversely affect our ability to deliver products and services to our customers or otherwise conduct our business efficiently and effectively. Replacing these third party vendors could also entail significant delay and expense.
Our internal controls, procedures and policies may fail or be circumvented.
Management regularly reviews and updates our internal controls, disclosure controls and procedures, and corporate governance policies and procedures. Any system of controls, however well-designed and operated, is based in part on certain assumptions and can provide only reasonable, not absolute, assurances that the objectives of the system are met. Any failure or circumvention of the controls and procedures or failure to comply with regulations related to controls and procedures could have a material adverse effect on our business, results of operations and financial condition.
If our risk management framework does not effectively identify or mitigate our risks, we could suffer losses.
Our risk management framework seeks to mitigate risk and appropriately balance risk and return. We have established processes and procedures intended to identify, measure, monitor and report the types of risk to which we are subject, including credit risk, operations risk, compliance risk, reputation risk, strategic risk, market risk and liquidity risk. We seek to monitor and control our risk exposure through a framework of policies, procedures and reporting requirements. Management of our risks in some cases depends upon the use of analytical and/or forecasting models. If the models used to mitigate these risks are inadequate, we may incur losses. In addition, there may be risks that exist, or that develop in the future, that we have not appropriately anticipated, identified or mitigated. If our risk management framework does not effectively identify or mitigate our risks, we could suffer unexpected losses and could be materially adversely affected.
We may be unable to attract and retain qualified key employees, which could adversely affect our business prospects, including our competitive position and results of operations.
Our success is dependent upon our ability to attract and retain highly skilled individuals. There is significant competition for those individuals with the experience and skills required to conduct many of our business activities. We may not be able to hire or retain the key personnel that we depend upon for success. The unexpected loss of services of one or more of these or other key personnel could have a material adverse impact on our business because of their skills, knowledge of the markets in which we operate, years of industry experience and the difficulty of promptly finding qualified replacement personnel.
Our financial statements are based in part on assumptions and estimates, which, if wrong, could cause unexpected losses in the future.
Pursuant to accounting principles generally accepted in the U.S., we are required to use certain assumptions and estimates in preparing our financial statements, including in determining loan loss and litigation reserves, goodwill impairment and the fair value of certain assets and liabilities, among other items. If assumptions or estimates underlying our financial statements are incorrect, we may experience material losses. See the "Critical"Critical Accounting Policies" section in Item 7, "Management's Discussion and Analysis of Financial Condition and Results of Operations."
Changes in generally accepted accounting principles can be difficult to predict and can materially impact how we record and report our financial condition and results of operations.
Our accounting policies and methods are fundamental to how we record and report our financial condition and results of operations. From time to time, the Financial Accounting Standards Board changes the financial accounting and reporting principles that govern the preparation of our financial statements. These changes can be hard to anticipate and implement, and can materially impact how we record and report our financial condition and results of operations.
Future capital offerings may adversely affect the market price of our common stock.
In the future, we may attempt to increase our capital resources or, if our or our banking subsidiaries' capital ratios fall below required minimums, we could be forced to raise additional capital by making additional offerings of debt, common or preferred stock, trust preferred securities, and senior or subordinated notes. Upon liquidation, holders of our debt securities and shares of preferred stock and lenders with respect to other borrowings will receive distributions of our available assets prior to the holders of our common stock. Additional equity offerings may dilute the holdings of our existing stockholders or reduce the market price of our common stock, or both. Because our decision to issue securities in any future offering will depend on market conditions and other factors beyond our control, we cannot predict or estimate the amount, timing or nature of our future offerings. Moreover, we cannot assure you that such capital will be available to us on acceptable terms or at all. Our inability to raise sufficient additional capital on acceptable terms when needed could adversely affect our businesses, financial condition and results of operations.
The market price and trading volume of our common stock may be volatile.
The market price of our common stock may be volatile. In addition, the trading volume in our common stock may fluctuate and cause significant price variations to occur. We cannot assure you that the market price of our common stock will not fluctuate or decline significantly in the future. Some of the factors that could negatively affect our share price or result in fluctuations in the price or trading volume of our common stock include:
•quarterly variations in our operating results or the quality of our assets;
•operating results that vary from the expectations of management,Management, securities analysts and investors;
•changes in expectations as to our future financial performance;
•announcements of innovations, new products, strategic developments, significant contracts, acquisitions and other
material events by us or our competitors;
•the operating and securities price performance of other companies that investors believe are comparable to us;
•our past and future dividend practices;
•future sales of our equity or equity-related securities; and
•changes in global financial markets and global economies and general market conditions, such as interest rates, stock,
commodity or real estate valuations or volatility.
Anti-takeover provisions could negatively impact our stockholders.
Provisions of Delaware law and provisions of our certificate of incorporation and by-laws could make it more difficult for a third party to acquire control of us or have the effect of discouraging a third party from attempting to acquire control of us, even if an acquisition might be in the best interest of our stockholders.
Item 1B. Unresolved Staff Comments
None.
Item 2. Properties
At December 31, 2013, the Company conducted its business from its main office, which isThe Company’s executive administration offices are located inat 131 Clarendon Street, Boston, Massachusetts, andwhich is owned by Brookline Bank, as well as a leased operations center in Brookline, Massachusetts, and anits corporate operations center in Lincoln, Rhode Island, thatwhich is owned by BankRI. BankRI, with other administrative and operations functions performed at several different locations.
Brookline Bank conducts its business from 2325 banking
offices, 54 of which are owned and 1821 of which are leased. Brookline Bank's main banking office is leased and a leased officelocated in Newton, Massachusetts, that is used to conduct its indirect automobile lending business.Brookline, Massachusetts. Brookline Bank also has 2 remote ATM locations, both of which are leased. Eastern Funding conducts its business from leased premises in New York City, New York and in Melville, New York.
BankRI conducts its business from its main office, which is leased and located in Providence, Rhode Island, and from 1819 banking offices, 56 of which are owned and 13 of which are leased. BankRI's main banking office, is leased and located in Providence, Rhode Island. BankRI also has 23 remote ATM locations, bothall of which are leased. Macrolease conducts its business from leased premises in Plainview, New York.
First Ipswich conducts its business from 65 banking offices, 1 of which is owned and 54 of which are leased. First Ipswich's main banking office, is owned and located in Ipswich, Massachusetts. First Ipswich also has 1 remote ATM location which is leased.
Refer to Note 13, "Commitments and Contingencies," to the consolidated financial statements for information regarding the Company's lease commitments atas of December 31, 2013.2015.
Item 3. Legal Proceedings
During the fiscal year ended December 31, 2013,2015, the Company was not involved in any legal proceedings other than routine legal proceedings occurring in the ordinary course of business. Management believes that those routine legal proceedings involve, in the aggregate, amounts that are immaterial to the Company's financial condition and results of operations.
Item 4. Mine Safety Disclosures
Not applicable.
PART II
Item 5. Market for the Registrant's Common Equity, Related Stockholder Matters and Issuer Purchases of Equity Securities
| |
| (a) | The common stock of the Company is traded on NASDAQ under the symbol BRKL. The approximate number of registered holders of common stock as of February 28, 201429, 2016 was 2,099.2,021. Market prices for the Company's common stock and dividends paid per quarter during 20132015 and 20122014 follow. |
| | | | Market Prices | | Dividend Paid Per Share | Market Prices | | Dividend Paid Per Share |
| | High | | Low | | High | | Low | |
| 2013 | | | | | | |
| 2015 | | | | | | |
| First Quarter | $ | 9.39 |
| | $ | 8.66 |
| | $ | 0.085 |
| $ | 10.05 |
| | $ | 9.29 |
| | $ | 0.085 |
|
| Second Quarter | 9.14 |
| | 8.23 |
| | 0.085 |
| 11.54 |
| | 10.10 |
| | 0.090 |
|
| Third Quarter | 10.08 |
| | 8.81 |
| | 0.085 |
| 11.66 |
| | 10.09 |
| | 0.090 |
|
| Fourth Quarter | 9.58 |
| | 8.72 |
| | 0.085 |
| 11.89 |
| | 10.19 |
| | 0.090 |
|
| 2012 | | | | | | |
| 2014 | | | | | | |
| First Quarter | $ | 9.78 |
| | $ | 8.37 |
| | $ | 0.085 |
| $ | 9.70 |
| | $ | 8.66 |
| | $ | 0.085 |
|
| Second Quarter | 9.49 |
| | 8.46 |
| | 0.085 |
| 9.63 |
| | 8.83 |
| | 0.085 |
|
| Third Quarter | 9.25 |
| | 8.13 |
| | 0.085 |
| 9.51 |
| | 8.55 |
| | 0.085 |
|
| Fourth Quarter | 8.90 |
| | 7.54 |
| | 0.085 |
| 10.15 |
| | 8.56 |
| | 0.085 |
|
Five-Year Performance Comparison
The following graph compares total shareholder return on the Company's common stock over the last five years with the the S&P 500 Index, the Russell 2000 Index the SNL Index of Banks with assets between $1 billion and $5 billion and the SNL Index of Banks with assets between $5 billion and $10 billion. Index values are as of December 31 of each of the indicated years.
Total Return Performance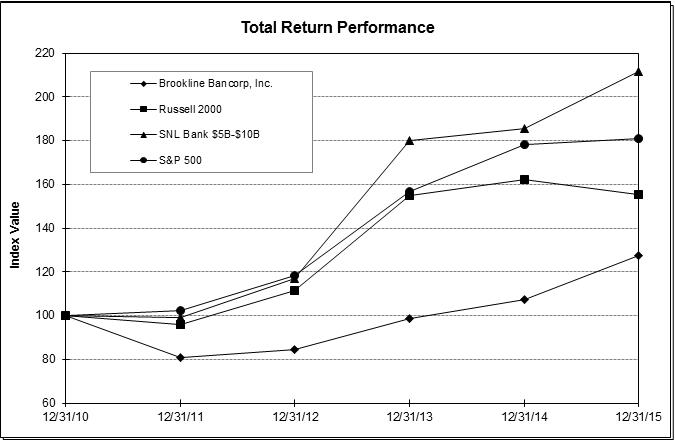
| | | | At December 31, | At December 31, |
| Index | 2008 | | 2009 | | 2010 | | 2011 | | 2012 | | 2013 | 2010 | | 2011 | | 2012 | | 2013 | | 2014 | | 2015 |
| Brookline Bancorp, Inc. | 100.00 |
| | 98.22 |
| | 111.21 |
| | 89.79 |
| | 93.99 |
| | 109.64 |
| 100.00 |
| | 113.22 |
| | 91.41 |
| | 95.69 |
| | 111.62 |
| | 121.67 |
|
| Russell 2000 | 100.00 |
| | 127.17 |
| | 161.32 |
| | 154.59 |
| | 179.86 |
| | 249.69 |
| 100.00 |
| | 126.86 |
| | 121.56 |
| | 141.43 |
| | 196.34 |
| | 205.95 |
|
| SNL Bank $5B-$10B | 100.00 |
| | 76.88 |
| | 83.40 |
| | 82.77 |
| | 97.36 |
| | 150.21 |
| 100.00 |
| | 108.48 |
| | 107.66 |
| | 126.64 |
| | 195.38 |
| | 201.25 |
|
| S&P 500 | 100.00 |
| | 126.46 |
| | 145.51 |
| | 148.59 |
| | 172.37 |
| | 228.19 |
| 100.00 |
| | 115.06 |
| | 117.49 |
| | 136.30 |
| | 180.44 |
| | 205.14 |
|
| SNL Bank $1B $5B | 100.00 |
| | 71.68 |
| | 81.25 |
| | 74.10 |
| | 91.37 |
| | 132.87 |
| |
The graph assumes $100 invested on December 31, 20082010 in each of the Company's common stock, the S&P 500 Index, the Russell 2000 Index the SNL Index of Banks with assets between $1 billion and $5 billion and the SNL Index of Banks with assets between $5 billion and $10 billion. The graph also assumes reinvestment of all dividends.
| |
| (c) | There were no purchases made during the year ended December 31, 20132015 by or on behalf of the Company of the Company's common stock. As of December 31, 2013,2015, the Company was not authorized to repurchase any additional$10.0 million of total outstanding shares of itsthe Company's common stock. |
Item 6. Selected Financial Data
The selected financial and other data of the Company set forth below are derived in part from, and should be read in conjunction with, the Consolidated Financial Statements of the Company and Notes thereto presented elsewhere herein.
|
| | | | | | | | | | | | | | | | | | | |
| | At or for the year ended December 31, |
| | 2013 | | 2012 | | 2011 | | 2010 | | 2009 |
| | (Dollars in Thousands, Except Per Share Data) |
| FINANCIAL CONDITION DATA | | | | | | | | | |
| Total assets | $ | 5,325,106 |
| | $ | 5,147,534 |
| | $ | 3,299,013 |
| | $ | 2,720,542 |
| | $ | 2,615,884 |
|
| Total loans and leases | 4,362,465 |
| | 4,175,712 |
| | 2,720,821 |
| | 2,253,538 |
| | 2,164,295 |
|
| Allowance for loan and lease losses | 48,473 |
| | 41,152 |
| | 31,703 |
| | 29,695 |
| | 31,083 |
|
| Net loans and leases | 4,313,992 |
| | 4,134,560 |
| | 2,689,118 |
| | 2,223,843 |
| | 2,133,212 |
|
| Investment securities available-for-sale | 492,428 |
| | 481,323 |
| | 217,431 |
| | 304,540 |
| | 291,414 |
|
| Goodwill and identified intangible assets | 154,777 |
| | 159,400 |
| | 51,013 |
| | 45,112 |
| | 46,336 |
|
| Total deposits | 3,835,006 |
| | 3,616,259 |
| | 2,252,331 |
| | 1,810,899 |
| | 1,633,687 |
|
| Core deposits(1) | 2,900,338 |
| | 2,605,318 |
| | 1,446,659 |
| | 1,019,293 |
| | 800,474 |
|
| Certificates of deposit | 934,668 |
| | 1,010,941 |
| | 805,672 |
| | 791,606 |
| | 833,213 |
|
| Total borrowed funds | 812,555 |
| | 853,969 |
| | 506,919 |
| | 388,569 |
| | 468,766 |
|
| Stockholders' equity | 613,867 |
| | 612,097 |
| | 503,602 |
| | 495,443 |
| | 487,317 |
|
| Tangible stockholders' equity (non-GAAP) (15) | 459,090 |
| | 452,697 |
| | 452,589 |
| | 450,331 |
| | 440,981 |
|
| Nonperforming loans and leases(2) | 16,501 |
| | 22,246 |
| | 7,530 |
| | 7,463 |
| | 6,233 |
|
| Nonperforming assets(3) | 18,079 |
| | 23,737 |
| | 8,796 |
| | 8,166 |
| | 7,663 |
|
| EARNINGS DATA | | | | | | | | | |
| Interest and dividend income | $ | 206,384 |
| | $ | 213,200 |
| | $ | 140,535 |
| | $ | 130,992 |
| | $ | 140,056 |
|
| Interest expense | 30,166 |
| | 35,832 |
| | 30,336 |
| | 34,567 |
| | 53,756 |
|
| Net interest income | 176,218 |
| | 177,368 |
| | 110,199 |
| | 96,425 |
| | 86,300 |
|
| Provision for credit losses | 10,929 |
| | 15,888 |
| | 3,631 |
| | 3,796 |
| | 9,780 |
|
| Provision for income taxes | 19,481 |
| | 21,341 |
| | 19,886 |
| | 19,156 |
| | 13,413 |
|
| Net income | 35,386 |
| | 37,142 |
| | 27,600 |
| | 26,872 |
| | 19,200 |
|
| Operating earnings | 35,981 |
| | 41,114 |
| | 28,902 |
| | 26,872 |
| | 19,200 |
|
| PER COMMON SHARE DATA | | | | | | | | | |
| Net income—Basic | $ | 0.51 |
| | $ | 0.53 |
| | $ | 0.47 |
| | $ | 0.46 |
| | $ | 0.33 |
|
| Net income—Diluted | 0.51 |
| | 0.53 |
| | 0.47 |
| | 0.46 |
| | 0.33 |
|
| Dividends paid per common share | 0.34 |
| | 0.34 |
| | 0.34 |
| | 0.34 |
| | 0.54 |
|
| Book value per share (end of period) | 8.79 |
| | 8.78 |
| | 8.59 |
| | 8.45 |
| | 8.32 |
|
| Tangible book value per share (end of period) (non-GAAP)(4) | 6.57 |
| | 6.49 |
| | 7.72 |
| | 7.68 |
| | 7.53 |
|
| Stock price (end of period) | 9.55 |
| | 8.50 |
| | 8.44 |
| | 10.85 |
| | 9.91 |
|
| PERFORMANCE RATIOS | | | | | | | | | |
| Net interest margin | 3.64 | % | | 3.85 | % | | 3.76 | % | | 3.74 | % | | 3.38 | % |
| Return on average assets | 0.68 | % | | 0.74 | % | | 0.90 | % | | 1.01 | % | | 0.73 | % |
| Operating return on average assets (non-GAAP)(5) | 0.70 | % | | 0.82 | % | | 0.94 | % | | 1.01 | % | | 0.73 | % |
| Efficiency ratio(6) | 64.44 | % | | 61.42 | % | | 54.59 | % | | 48.78 | % | | 51.25 | % |
| Operating efficiency ratio (non-GAAP)(7) | 63.96 | % | | 58.67 | % | | 52.68 | % | | 48.78 | % | | 51.25 | % |
| Return on average tangible assets (non-GAAP) | 0.71 | % | | 0.75 | % | | 0.92 | % | | 1.03 | % | | 0.74 | % |
| Return on average stockholders' equity | 5.74 | % | | 6.12 | % | | 5.51 | % | | 5.45 | % | | 3.94 | % |
| Operating return on average stockholders' equity (non-GAAP) (16) | 5.84 | % | | 6.78 | % | | 5.77 | % | | 5.45 | % | | 3.94 | % |
|
| | | | | | | | | | | | | | | | | | | |
| | At or for the year ended December 31, |
| | 2015 | | 2014 | | 2013 | | 2012 | | 2011 |
| | (Dollars in Thousands, Except Per Share Data) |
| FINANCIAL CONDITION DATA | | | | | | | | | |
| Total assets (*) | $ | 6,042,338 |
| | $ | 5,800,948 |
| | $ | 5,325,651 |
| | $ | 5,147,450 |
| | $ | 3,299,417 |
|
| Total loans and leases | 4,995,540 |
| | 4,822,607 |
| | 4,362,465 |
| | 4,175,712 |
| | 2,720,821 |
|
| Allowance for loan and lease losses | 56,739 |
| | 53,659 |
| | 48,473 |
| | 41,152 |
| | 31,703 |
|
| Investment securities available-for-sale | 513,201 |
| | 550,761 |
| | 492,428 |
| | 481,323 |
| | 217,431 |
|
| Goodwill and identified intangible assets | 148,523 |
| | 151,434 |
| | 154,777 |
| | 159,400 |
| | 51,013 |
|
| Total deposits | 4,306,018 |
| | 3,958,106 |
| | 3,835,006 |
| | 3,616,259 |
| | 2,252,331 |
|
| Core deposits (1) | 3,218,146 |
| | 3,011,398 |
| | 2,900,338 |
| | 2,605,318 |
| | 1,446,659 |
|
| Certificates of deposit | 1,087,872 |
| | 946,708 |
| | 934,668 |
| | 1,010,941 |
| | 805,672 |
|
| Total borrowed funds | 983,029 |
| | 1,126,404 |
| | 812,555 |
| | 853,969 |
| | 506,919 |
|
| Stockholders' equity (*) | 667,485 |
| | 641,818 |
| | 614,412 |
| | 612,013 |
| | 504,006 |
|
| Tangible stockholders' equity (*)(**) | 518,962 |
| | 490,384 |
| | 459,635 |
| | 452,613 |
| | 452,993 |
|
| Nonperforming loans and leases (2) | 19,333 |
| | 13,714 |
| | 16,501 |
| | 22,246 |
| | 7,530 |
|
| Nonperforming assets (3) | 20,676 |
| | 15,170 |
| | 18,079 |
| | 23,737 |
| | 8,796 |
|
| EARNINGS DATA | | | | | | | | | |
| Interest and dividend income | $ | 226,910 |
| | $ | 218,482 |
| | $ | 206,384 |
| | $ | 213,200 |
| | $ | 140,535 |
|
| Interest expense | 32,545 |
| | 29,414 |
| | 30,166 |
| | 35,832 |
| | 30,336 |
|
| Net interest income | 194,365 |
| | 189,068 |
| | 176,218 |
| | 177,368 |
| | 110,199 |
|
| Provision for credit losses | 7,451 |
| | 8,477 |
| | 10,929 |
| | 15,888 |
| | 3,631 |
|
| Non-interest income (*) | 20,184 |
| | 20,180 |
| | 15,619 |
| | 18,782 |
| | 5,715 |
|
| Non-interest expense (*) | 125,377 |
| | 129,160 |
| | 122,442 |
| | 119,858 |
| | 62,907 |
|
| Provision for income taxes (*) | 29,353 |
| | 26,286 |
| | 20,664 |
| | 22,523 |
| | 20,581 |
|
| Net income (*) | 49,782 |
| | 43,288 |
| | 36,015 |
| | 36,654 |
| | 27,800 |
|
| Operating earnings (**) | 49,782 |
| | 43,288 |
| | 36,610 |
| | 40,626 |
| | 29,102 |
|
| PER COMMON SHARE DATA | | | | | | | | | |
| Earnings per share - Basic (*) | $ | 0.71 |
| | $ | 0.62 |
| | $ | 0.52 |
| | $ | 0.53 |
| | $ | 0.47 |
|
| Earnings per share - Diluted (*) | 0.71 |
| | 0.62 |
| | 0.52 |
| | 0.53 |
| | 0.47 |
|
| Dividends paid per common share | 0.36 |
| | 0.34 |
| | 0.34 |
| | 0.34 |
| | 0.34 |
|
| Book value per share (end of period) (*) | 9.51 |
| | 9.16 |
| | 8.79 |
| | 8.77 |
| | 8.59 |
|
| Tangible book value per share (*)(**) | 7.39 |
| | 7.00 |
| | 6.58 |
| | 6.49 |
| | 7.72 |
|
| Stock price (end of period) | 11.50 |
| | 10.03 |
| | 9.55 |
| | 8.50 |
| | 8.44 |
|
| PERFORMANCE RATIOS | | | | | | | | | |
| Net interest margin | 3.54 | % | | 3.61 | % | | 3.64 | % | | 3.85 | % | | 3.76 | % |
| Return on average assets (*) | 0.85 | % | | 0.78 | % | | 0.70 | % | | 0.73 | % | | 0.91 | % |
| Operating return on average assets (*)(**) | 0.85 | % | | 0.78 | % | | 0.71 | % | | 0.81 | % | | 0.95 | % |
| Return on average tangible assets (*)(**) | 0.87 | % | | 0.80 | % | | 0.72 | % | | 0.76 | % | | 0.92 | % |
| Operating return on average tangible assets (*)(**) | 0.87 | % | | 0.80 | % | | 0.73 | % | | 0.84 | % | | 0.97 | % |
| Return on average stockholders' equity (*) | 7.57 | % | | 6.86 | % | | 5.84 | % | | 6.04 | % | | 5.55 | % |
| Operating return on average stockholders' equity (*)(**) | 7.57 | % | | 6.86 | % | | 5.94 | % | | 6.69 | % | | 5.81 | % |
|
| | | | | | | | | | | | | | | | | | | |
| | At or for the year ended December 31, |
| | 2013 | | 2012 | | 2011 | | 2010 | | 2009 |
| | (Dollars in Thousands, Except Per Share Data) |
| Return on average tangible stockholders' equity (non-GAAP) (17) | 7.71 | % | | 8.40 | % | | 6.13 | % | | 6.00 | % | | 4.36 | % |
| Operating return on average tangible stockholders' equity (non-GAAP)(8) | 7.84 | % | | 9.29 | % | | 6.42 | % | | 6.00 | % | | 4.36 | % |
| Dividend payout ratio(9) | 67.38 | % | | 64.13 | % | | 72.72 | % | | 74.69 | % | | 165.02 | % |
| GROWTH RATIOS | | | | | | | | | |
| Total loan and lease growth(10) | 4.47 | % | | 53.59 | % | | 20.74 | % | | 4.12 | % | | 2.79 | % |
| Organic loan and lease growth(11) | 4.47 | % | | 11.84 | % | | 11.72 | % | | 4.12 | % | | 2.79 | % |
| Total deposit growth(10) | 6.05 | % | | 60.56 | % | | 24.38 | % | | 10.85 | % | | 20.64 | % |
| Organic deposit growth(11) | 6.05 | % | | 10.24 | % | | 12.66 | % | | 10.85 | % | | 20.64 | % |
| ASSET QUALITY RATIOS | | | | | | | | | |
| Net loan and lease charge-offs as a percentage of average loans and leases | 0.08 | % | | 0.16 | % | | 0.08 | % | | 0.24 | % | | 0.33 | % |
| Nonperforming loans and leases as a percentage of total loans and leases(12) | 0.38 | % | | 0.53 | % | | 0.28 | % | | 0.33 | % | | 0.29 | % |
| Nonperforming assets as a percentage of total assets(12) | 0.34 | % | | 0.46 | % | | 0.27 | % | | 0.30 | % | | 0.29 | % |
| Total allowance for loan and lease losses as a percentage of total loans and leases(12) | 1.11 | % | | 0.99 | % | | 1.17 | % | | 1.32 | % | | 1.44 | % |
| Allowance for loan and lease losses related to originated loans and leases as a percentage of originated loans and leases(13) | 1.32 | % | | 1.33 | % | | 1.25 | % | | 1.32 | % | | 1.44 | % |
| CAPITAL RATIOS | | | | | | | | | |
| Stockholders' equity to total assets | 11.53 | % | | 11.89 | % | | 15.27 | % | | 18.21 | % | | 18.63 | % |
| Tangible equity ratio (non-GAAP)(14) | 8.88 | % | | 9.08 | % | | 13.93 | % | | 16.83 | % | | 17.16 | % |
| Tier 1 leverage capital ratio | 9.36 | % | | 9.44 | % | | 14.37 | % | | 15.42 | % | | 15.64 | % |
| Tier 1 risk-based capital ratio | 11.01 | % | | 10.85 | % | | 15.91 | % | | 18.83 | % | | 19.35 | % |
| Total risk-based capital ratio | 12.15 | % | | 11.83 | % | | 17.05 | % | | 17.58 | % | | 18.10 | % |
|
| | | | | | | | | | | | | | | | | | | |
| | At or for the year ended December 31, |
| | 2015 | | 2014 | | 2013 | | 2012 | | 2011 |
| | (Dollars in Thousands, Except Per Share Data) |
| Return on average tangible stockholders' equity (*)(**) | 9.80 | % | | 9.06 | % | | 7.84 | % | | 8.28 | % | | 6.17 | % |
| Operating return on average tangible stockholders' equity (*)(**) | 9.80 | % | | 9.06 | % | | 7.97 | % | | 9.18 | % | | 6.46 | % |
| Dividend payout ratio (*)(**) | 50.15 | % | | 55.16 | % | | 66.20 | % | | 64.87 | % | | 72.20 | % |
| Efficiency ratio (4)(*) | 58.44 | % | | 61.73 | % | | 63.83 | % | | 61.11 | % | | 54.27 | % |
| GROWTH RATIOS | | | | | | | | | |
| Total loan and lease growth (5) | 3.59 | % | | 10.55 | % | | 4.47 | % | | 53.47 | % | | 20.74 | % |
| Organic loan and lease growth (6) | 3.59 | % | | 10.55 | % | | 4.47 | % | | 11.73 | % | | 11.72 | % |
| Total deposit growth (5) | 8.79 | % | | 3.21 | % | | 6.05 | % | | 60.56 | % | | 24.38 | % |
| Organic deposit growth (6) | 8.79 | % | | 3.21 | % | | 6.05 | % | | 10.24 | % | | 12.66 | % |
| ASSET QUALITY RATIOS | | | | | | | | | |
| Net loan and lease charge-offs as a percentage of average loans and leases | 0.09 | % | | 0.07 | % | | 0.08 | % | | 0.16 | % | | 0.08 | % |
| Nonperforming loans and leases as a percentage of total loans and leases | 0.39 | % | | 0.28 | % | | 0.38 | % | | 0.53 | % | | 0.28 | % |
| Nonperforming assets as a percentage of total assets (*) | 0.34 | % | | 0.26 | % | | 0.34 | % | | 0.46 | % | | 0.27 | % |
| Total allowance for loan and lease losses as a percentage of total loans and leases | 1.14 | % | | 1.11 | % | | 1.11 | % | | 0.99 | % | | 1.17 | % |
| Allowance for loan and lease losses related to originated loans and leases as a percentage of originated loans and leases (**) | 1.20 | % | | 1.20 | % | | 1.32 | % | | 1.32 | % | | 1.26 | % |
| CAPITAL RATIOS | | | | | | | | | |
| Stockholders' equity to total assets (*) | 11.05 | % | | 11.06 | % | | 11.54 | % | | 11.89 | % | | 15.28 | % |
| Tangible equity ratio (*)(**) | 8.81 | % | | 8.68 | % | | 8.89 | % | | 9.07 | % | | 13.95 | % |
| Tier 1 leverage capital ratio | 9.37 | % | | 9.01 | % | | 9.36 | % | | 9.44 | % | | 14.37 | % |
| Tier 1 risk-based capital ratio | 10.91 | % | | 10.55 | % | | 11.01 | % | | 10.85 | % | | 15.91 | % |
| Total risk-based capital ratio | 13.54 | % | | 13.24 | % | | 12.15 | % | | 11.83 | % | | 17.05 | % |
| Common equity Tier 1 capital ratio (***) | 10.62 | % | | N/A |
| | N/A |
| | N/A |
| | N/A |
|
| |
| (1) | Core deposits consist of demand checking, NOW, money market and savings accounts. |
| |
| (2) | Nonperforming loans and leases consist of nonaccrual loans and leases. Amount includes deferred origination costs. |
| |
| (3) | Nonperforming assets consist of nonperforming loans and leases, other real estate owned and other repossessed assets. Amount includes deferred origination costs. |
| |
| (4) | Tangible book value per share is calculated by dividing tangible stockholders' equity by common shares (total common shares issued, less common shares classified as treasury shares and unallocated ESOP common shares). |
| |
(5) | Operating return on average assets is calculated by dividing operating earnings by average assets during the period. |
| |
(6) | The efficiency ratio is calculated by dividing non-interest expense by the sum of net interest income and non-interest income for the period. |
| |
(7) | The operating efficiency ratio is calculated by dividing non-interest expense less compensation-related, acquisition-related and other costs for the period by the sum of net interest income and non-interest income for the period. |
| |
(8) | Operating return on average tangible stockholders' equity is calculated by dividing operating earnings by average tangible stockholders' equity during the period. |
| |
(9) | The dividend payout ratio is calculated by dividing dividends paid during the period by net income during the period. |
| |
(10)(5) | Total growth is calculated by dividing the change in the balance during the period by the balance at the beginning of the period. |
| |
(11)(6) | Organic growth is calculated by dividing the change in the balance during the period less the fair value of acquired loan and deposit balances at the date of acquisition by the balance at the beginning of the period. |
(*) Previously reported amounts prior to January 1, 2015 have been restated to reflect a retrospective change in
accounting principle for investments in qualified affordable housing projects, in accordance with ASU 2014-01. Refer
to Note 10, "Other Assets".
(**) Refer to Non-GAAP Financial Measures and Reconciliation to GAAP.
| |
(12)(***) | Amount includes acquired and originated loans and leases and deferred loan origination costs. |
| |
(13) | Amount excludes acquired loans and leases and includes deferred loan origination costs associated with originated loans. |
| |
(14) | The tangibleCommon equity tier 1 capital ratio is calculated by dividing tangible stockholders'common equity (total stockholders' equity less goodwill and identified intangible assets, net) (the numerator)Tier 1 capital by tangible assets (total assets less goodwill and identified intangible assets, net) (the denominator).risk-weighted assets. The ratio was established as part of the implementation of Basel III, effective January 1, 2015. |
| |
(15) | Tangible stockholders’ equity is calculated by subtracting goodwill and identified intangible assets, net, from total stockholders' equity. |
| |
(16) | Operating return on average stockholders’ equity is calculated by dividing operating earnings by average stockholders’ equity during the period. |
| |
(17) | Return on average tangible stockholders' equity is calculated by dividing earnings by average tangible stockholders' equity during the period. |
Item 7. Management's Discussion and Analysis of Financial Condition and Results of Operations
Introduction
Brookline Bancorp, Inc. (the "Company"), a Delaware corporation, operates as a multi-bank holding company for Brookline Bank and its subsidiaries, BankRIsubsidiaries; Bank Rhode Island ("BankRI") and its subsidiaries,subsidiaries; First Ipswich Bank ("First Ipswich") and its subsidiaries,subsidiaries; and Brookline Securities Corp.
As a commercially-focused financial institution with 49 full-service banking offices throughout greater Boston, the north shore of Massachusetts and Rhode Island, the Company, through Brookline Bank, BankRI and First Ipswich (the “Banks”), offers a wide range of commercial, business and retail banking services, including a full complement of cash management products, on-line and mobile banking services, consumer and residential loans and investment services, designed to meet the financial needs of small- to mid-sized businesses and individuals throughout central New England. Specialty lending activities include equipment financing primarily in the New York and New Jersey metropolitan area.
The Company has no significant assets other than the common stock of the Banks. For this reason, substantially all of the discussion in this document relatesfocuses its business efforts on profitably growing its commercial lending businesses, both organically and
through acquisitions. The Company’s customer focus, multi-bank structure, and risk management are integral to the operations of the Banksits organic
growth strategy and their subsidiaries.
The Company's commercially-focused business strategy, its niche business lines and its customer responsiveness have played a key role in growing the business and differentiatingserve to differentiate the Company from its competitors. Through itsAs full-service banks,financial institutions, the Company works to createBanks
and their subsidiaries focus on the continued acquisition of well-qualified customers, the deepening of long-term banking
relationships with each customer, built uponthrough a full complement of products and excellent customer service. service, and strong risk management.
The Company manages the Banks under uniform strategic objectives, with one set of uniform policies consistently applied by one executive management team. Within this environment, the Company believes that the ability to make customer decisions locally enhances management'sManagement's motivation, service levels and, as a consequence, the Company's financial results. As such, while most back-office functions are consolidated at the holding company level, branding and decision-making, including credit decisions and pricing, remain largely local in order to better meet the needs of bank customers and further motivate the Banks’ commercial, business and retail bankers.
The competition for loans and leases and deposits remains intense. In addition to this competition, the national economic recovery remains weak and the rate of unemployment high. While the economy in Massachusetts and, in particular, the greater Boston metropolitan area has remained relatively stable, the unemployment rate in Massachusetts increased slightly during the year to 7.0% in December 2013 from 6.7% in December 2012. Meanwhile, the unemployment rate in Rhode Island fell 110 basis points to 9.1% in December 2013 from 10.2% in December 2012. Economic growth has benefited the Company's loan and lease customers and, as a result, the Company experienced loan and lease losses that were lower year over year. This is evidenced by the decrease in net loan and lease charge-offs as a percentage of average loan and leases to 0.08% for the year ended December 31, 2013 from 0.16% in 2012. While thesethere are signs that the economy has started to gradually improve,improved in 2015, the Company expects the operating environment in 20142016 to remain challenging. The volume of loan and lease originations and loan and lease losses will depend, to a large extent, on how the economy performs.
Loan and lease growth and deposit growth are also greatly influenced by the rate-setting actions of the FRB.Board of Governors of the Federal Reserve System (“FRB”). The FRB lowered the rate for overnight federal fund borrowings between banks from 5.25% in September 2007 to a target range between zero and 0.25% in December 2013, the rate currently in effect. These low interest rates haverate environment has had and may continue to have an ongoinga negative impact on the Company's yields and net interest margin. Conversely, rising rates in the future could cause changes in the mix and volume of the Company's deposits and make it more difficult for certain borrowers to be eligible for new loans or leases or to service their existing debt.
The future operating results of the Company will depend on its ability to maintain net interest margin, while minimizing exposure to credit risk, along with increasing sources of non-interest income, while controlling the growth of non-interest or operating expenses.
The Company and the Banks are supervised, examined and regulated by the FRB. As a Massachusetts-chartered savings bank and trust company, respectively, Brookline Bank and First Ipswich are also subject to regulation under the laws of the Commonwealth of Massachusetts and the jurisdiction of the Massachusetts Division of Banks. As a Rhode Island-chartered financial institution, BankRI is also subject to regulation under the laws of the State of Rhode Island and the jurisdiction of the Banking Division of the Rhode Island Department of Business Regulation. The Federal Deposit Insurance Corporation ("FDIC") continues to insure each of the Banks’ deposits up to $250,000 per depositor. Additionally, as a Massachusetts-chartered savings bank, Brookline Bank is also insured by the Depositors Insurance Fund (“DIF”), a private industry-sponsored company. The DIF insures savings bank deposits in excess of the FDIC insurance limits. As such, Brookline Bank offers 100% insurance on all deposits as a result of a combination of insurance from the FDIC and the DIF.
The Company’s common stock is traded on the Nasdaq Global Select MarketSM under the symbol “BRKL.”
Executive Overview
Growth
Total assets at December 31, 2013 grew to $5.3 billion, an increase of 3.4% from December 31, 2012. The loan and lease portfolio grew to $4.4$6.0 billion as of December 31, 2013, up 4.5%2015 increased $241.4 million, or 4.2%, from December 31, 2012. This growth resulted largely2014. The increase was primarily driven by increases in investment securities and loans and leases, partly offset by decreases in cash and cash equivalents.
Total loans and leases of $5.0 billion as of December 31, 2015 increased $172.9 million, or 3.6%, from the increase inDecember 31, 2014. The Company's commercial loan portfolios, which are comprised of commercial real estate loans and commercial loans and leases, continued to exhibit growth. The Company's commercial loan portfolios, which totaled $4.0 billion, or 80.8%, of
total loans and leases as of December 31, 2015, increased $403.8 million, or 11.1%, from $3.6 billion, or 75.4% of total loans and leases, as of December 31, 2014. The $403.8 million increase in the commercial loan portfolios was partially offset by the $303.3 million decrease in the indirect automobile portfolio in 2015 due to the sale during the first quarter of 2015 of over 90% of the indirect automobile portfolio.
Total deposits of to $4.3 billion as of December 31, 2015 increased $347.9 million, or 8.8%, from $4.0 billion as of December 31, 2014. Core deposits, which include demand checking, NOW, money market and savings accounts, increased to $3.2 billion or 11.1% for 2013.
Deposit growth also continued with total deposits up 6.0% fromto 6.9% as of December 31, 2012. The Company's core deposits increased as a percentage of total deposits to 75.6% at December 31, 2013 from 72.0% at December 31, 2012.2015.
Asset Quality
The ratio of the allowance for loan and lease losses to total loans and leases was 1.11% at1.14% as of December 31, 20132015, compared to 0.99% at1.11% as of December 31, 2012. This increase in the allowance to total loans and leases ratio was largely the result of the loan mix within the portfolio growth.2014. The allowance for loan and lease losses related to originated loans and leases as a percentage of the total originated loan and lease portfolio, including deferred loan origination costs, was 1.32% as compared with 1.33%1.20% as of December 31, 2012.2015 and December 31, 2014. The Company continued to employ its historical underwritingALLL methodology throughoutand in the year endedthird quarter 2014, incorporated a loss emergence period ("LEP") to its ALLL methodology. The LEP incorporates a study of the time period from the first indication of elevated risk of repayment (or other early event indicating a problem) to eventual charge-off to support the LEP considered in the ALLL calculation. During the third quarter of 2015, the Company enhanced and refined its general allowance methodology to provide further quantification of probable losses in the portfolio. Under this enhanced methodology, Management combined the historical loss histories of the Banks to generate a single set of ratios.
Nonperforming assets as of December 31, 2013 and continued2015 totaled $20.7 million, or 0.34% of total assets, compared to calculate its allowance for loan and lease losses on a historically consistent basis. This ratio may increase in connection with increased levels$15.2 million, or 0.26% of organic growth in future periods.
total assets, as of December 31, 2014. Net charge-offs for the year ended December 31, 20132015 were $3.4$4.3 million, or 0.08%0.09% of average loans and leases, compared to 0.16%$3.1 million, or 0.07%, for the year ended December 31, 2012. Nonperforming assets at2014.
Capital Strength
The Company is a "well-capitalized" bank holding company as defined in the Federal Reserve Board's Regulation Y. The Company's common equity tier 1 capital ratio was 10.62% as of December 31, 2013 totaled $18.1 million, or 0.34%2015. Common equity tier 1 capital ratio is calculated by dividing common equity Tier 1 capital by risk-weighted assets. The ratio was established as part of total assets, compared to $23.7 million, or 0.46%the implementation of total assets, at December 31, 2012.
The Company remains well-capitalized as defined by its regulatory requirements with capital ratios in excess of all minimum regulatory requirements.Basel III, effective January 1, 2015. The Company's Tier 1 leverage ratio was 9.4% at9.37% as of December 31, 2013. Brookline Bancorp, Inc.'s2015, up from 9.01% as of December 31, 2014. As of December 31, 2015, the Company's Tier 1 risk-based ratio was 10.91% as of December 31, 2015, compared to 10.55% as of December 31, 2014. The Company's Total risk-based ratio was 13.54% as of December 31, 2015, compared to 13.24% as of December 31, 2014. The ratio of stockholders' equity to total assets was 11.05% and 11.06% as of December 31, 2015 and December 31, 2014, respectively. The Company's tangible equity ratio was 8.81% and 8.68% as of 8.9%, down from 9.1% at December 31, 2012, reflects the growth in the Company's loan2015 and lease portfolio.December 31, 2014, respectively.
Net Income
For the year ended December 31, 2013,2015, the Company reported net income of $35.4$49.8 million, or $0.51$0.71 per basic and diluted share, down 4.7% from the year ended December 31, 2012. The return on average assets was 0.68% for the year ended December 31, 2013, and the return on average stockholders' equity was 5.74%.
Net earnings from operations, which exclude compensation-related, acquisition-related and other expenses netan increase of tax, were $36.0$6.5 million, or $0.5215.0%, from $43.3 million, or $0.62 per basic and diluted share for the year ended December 31, 2013, compared to $41.12014. The increase in net income is primarily the result of an increase in net interest income of $5.3 million, or $0.59 per diluted, sharea decrease in the provision for credit losses of $1.0 million, a decrease in non-interest expense of $3.8 million offset by an increase in provision for income taxes of $3.1 million.
The return on average assets was 0.85% for the year ended December 31, 2012. Operating returns on average assets and average stockholders' equity were 0.70% and 5.84%, respectively,2015, compared to 0.78% for the year ended December 31, 2013.
Net interest margin2014. The return on average stockholders' equity was 3.64%7.57% for the year ended December 31, 2013 down from 3.85%2015, compared to 6.86% for the year ended December 31, 2012. 2014.
The yield on interest-earning assets decreased 35 basis points to 4.27% in 2013net interest margin was 3.54% for the year ended December 31, 2015 down from 4.62% in 2012, largely due to continued rate pressures on3.61% for the commercial real estate and indirect automobile portfolios.year ended December 31, 2014. The relative consistencycompression in the net interest margin in a highly competitive and declining interest rate environment is in part, a result of a reductiondecrease in the yield on interest-earning assets by 7 basis points to 4.12% in 2015 from 4.19% in 2014, and an increase of 173 basis points in the Company's overall cost of funds to 0.78%0.63% in 20132015 from 0.95%0.60% in 2012, as well as the2014. The decrease in the Company's loan-to-deposit ratioyield on interest-earning assets was largely due to 113.8% at December 31, 2013 from 115.5% at December 31, 2012. Despitecontinued rate pressures on the strength of the Company's net interest margin,loan portfolio. The Company continued to experience competitive pricing pressure in all loan categories andin 2015 including the continuation of a low interest-rate environment along withand the Company's diminishing ability to reduce its costcosts, all of funds, continueswhich contributed to place significant pressure on the Company'sdecline in the net interest margin andmargin. Despite these challenges, the Company’s net interest income.income increased $5.3 million due to growth in interest earning assets and a shift in the mix of those assets from lower yielding indirect auto loans to higher yielding commercial loans.
Results for 20132015 included a $10.9$7.5 million provision for credit losses, discussed in the "Allowance for Credit Losses—Allowance for Loan and Lease Losses" section beginning on page 39.below.
Non-interest income decreased $4.8 million to $13.8 million during the year ended December 31, 2013 from $18.6 million during the year ended December 31, 2012. Several factors contributed to the year-to-year decrease, including a decrease of $1.2 million in loan-related gains on sale and other fee income, an increase of $1.1 million in losses from investments in affordable housing projects, a decrease of $0.5 million in gains related to the sale of securities, and the inclusion in 2012 of a net gain of $1.9 million on the sale of loans and leases.
Non-interest expense increased $2.1 million, or 1.7%, to $122.5remained consistent at $20.2 million for the year ended December 31, 2013 from $120.4 million during2015 and December 31, 2014. Several factors contributed to the year ended December 31, 2012. Theover year increase, was largely attributable to additional staffingincluding an increase of $2.5 million in loan level derivative income, an increase of $0.6 million in gain on sales of loans and branch expansionleases held-for-sale, offset by a decrease of $1.5 million in professional servicesgain on sale of premises and equipment, and a decrease of $1.7 million in other non-interest income.
Non-interest expense mostly duedecreased $3.8 million, to professional fees incurred related to the BankRI acquisition. Compensation and employee benefit expenses were $65.3$125.4 million for the year ended December 31, 2013 compared2015 from $129.2 million for the year ended December 31, 2014. The decrease was largely attributable to $58.8a decrease of $2.2 million in 2012equipment and data processing, a decrease of $1.2 million in professional services, expenses were $5.7and a decrease of $0.5 million in 2013 as compared to $12.5 million in 2012.compensation and employee benefit expense.
Critical Accounting Policies
The accounting policies described below are considered critical to understanding the Company's financial condition and operating results. Such accounting policies are considered to be especially important because they involve a higher degree of complexity and require managementManagement to make difficult and subjective judgments which often require assumptions or estimates about matters that are inherently uncertain. The use of different judgments, assumptions and estimates could result in material differences in the Company's operating results or financial condition.
Investment Securities
SecuritiesInvestment securities classified as available-for-sale are carried at estimated fair value, with any unrealized gains and losses, net of taxes, reported as accumulated other comprehensive income or loss in stockholders' equity. Debt securities that the Company has the positive intent and ability to hold to maturity are classified as "held to maturity""held-to-maturity" and are carried at amortized cost.
The market values of the Company's investment securities, particularly its fixed-rate securities, are affected by changes in market interest rates as determined by the term structure of risk-free rates and the credit spreads associated with different investment categories. In general, as interest rates rise, the fair value of fixed-rate securities will decrease; as interest rates fall, the fair value of fixed-rate securities will increase. On a quarterly basis, the Company reviews and evaluates fair value based on market data obtained from independent sources or, in the absence of active market data, from model-derived valuations based on market assumptions. If the Company deems any decline to be other-than-temporary, the amount of impairment loss recorded in
earnings for a debt security is the entire difference between the security's cost and its fair value if the Company intends to sell the debt security prior to recovery or it is more likely than not that the Company will have to sell the debt security prior to recovery. If, however, the Company does not intend to sell the debt security or it concludes that it is more likely than not that the Company will not have to sell the debt security prior to recovery, the credit loss component of an other-than-temporary impairment of a debt security is recognized as a charge to earnings and the remaining portion of the impairment loss is recognized as a reduction in comprehensive income. The credit loss component of an other-than-temporary loss is determined based on the Company's best estimate of cash flows expected to be collected. There were no impairment losses charged to earnings in 2013, 20122015, 2014 and 2011.2013.
See Note 21, "Fair Value of Financial Instruments" to the consolidated financial statements for additional information on how managementManagement determines the fair value of its financial instruments.
Acquired Loans
Loans that the Company acquired are initially recorded at fair value with no carryover of the related allowance for loan and lease losses. Determining the fair value of the acquired loans involves estimating the amount and timing of principal and interest cash flows initially expected to be collected on the loans and discounting those cash flows at an appropriate market rate of interest. The Company will continuecontinues to evaluate the reasonableness of expectations for the timing and the amount of cash to be collected. Subsequent decreases in expected cash flows may result in changes in the amortization or accretion of fair market value adjustments, and in some cases may result in a loan being considered impaired.
Allowance for Loan and Lease Losses
The allowance for loan and lease losses represents management'sManagement's estimate of probable losses inherent in the loan and lease portfolio. Additions to the allowance for loan and lease losses are made by charges to the provision for credit losses. Losses on loans and leases are deducted from the allowance when all or a portion of a loan or lease is considered uncollectable. The determination of the loans on which full collectability is not reasonably assured, the estimates of the fair value of the underlying collateral, and the assessment of economic and other conditions are subject to assumptions and judgments by management.Management. Valuation allowances could differ materially as a result of changes in, or different interpretations of, these assumptions and judgments.
Management evaluates the adequacy of the allowance on a quarterly basis and reviews its conclusion as to the amount to be established with the Audit Committee and the Board of Directors.
See Note 7, "Allowance for Loan and Lease Losses," to the consolidated financial statements for additional information on how managementManagement determines the balance of the allowance for loan and lease losses for each portfolio and class of loans.
Goodwill
Goodwill is presumed to have an indefinite useful life and is tested at least annually for impairment. Impairment exists when the carrying amount of goodwill exceeds its implied fair value. If fair value exceeds the carrying amount at the time of testing, goodwill is not considered impaired. Quoted market prices in active markets are the best evidence of fair value and are considered to be used as the basis for measurement, when available. Other acceptable valuation methods include present-value measurements based on multiples of earnings or revenues, or similar performance measures. Differences in valuation techniques could result in materially different evaluations of impairment. In September 2011, the FASB issued Accounting Standards Update ("ASU") 2011-08 addressing the topic ofwhich provides guidance for companies when testing goodwill for impairment. The objective of the ASU is to simplify how entities test goodwill for impairment. The amendments inPursuant to the ASU, permit an entity to firstentities may now assess qualitative factors to determine whether it is more likely than not that the fair value of a reporting unit is less than its carrying amount as a basis for determining whether it is necessary to perform the two-step goodwill impairment test. The more-likely-than-not threshold is defined as having a likelihood of more than 50%.
In reaching its conclusion aboutTo determine whether it is more likely than not that the fair value of a reporting unit is less than its carrying amount, an entity should consider the extent to which each of the adverse events or circumstances identified could affect the comparison of a reporting unit's fair value with its carrying amount. An
Pursuant to the ASU, an entity should place more weight on the events and circumstances that most affecthave the greatest impact on a reporting unit's fair value or the carrying amount of its net assets; and may affect its determination of whether it is more likely than not that the fair value of a reporting unit is less than its carrying amount.
The following qualitativeQualitative factors that have been assessed to determine whether it is more likely than not that the fair value of a reporting unit is less than its carrying amount including goodwill: general economic conditions, regulatory environment, share price, real estate values, lending concentrations, interest-rate environment, asset quality, capital, financial performance, integration of acquired companies and conversion to a new data processing system.
Based on an evaluation ofThe Company has evaluated the qualitative factors mentioneddiscussed above and assessingassessed the effect identified adverse events or circumstances could have, the Companyand based on this analysis has concluded there was no indication of goodwill impairment.impairment as of December 31, 2015. Further analysis of the Company’s goodwill can be found in Note 9 “Goodwill and Other Intangible Assets” within Notesnotes to Consolidated Financial Statements.the consolidated financial statements.
Identified Intangible Assets
Identified intangible assets are assets resulting from acquisitions that are being amortized over their estimated useful lives. The recoverability of identified intangible assets is evaluated for impairment at least annually. If impairment is deemed to have occurred, the amount of impairment is charged to expense when identified.
Income Taxes
Certain areas of accounting for income taxes require management'sManagement's judgment, including determining the expected realization of deferred tax assets and the adequacy of liabilities for uncertain tax positions. Judgments are made regarding various tax positions, which are often subjective and involve assumptions about items that are inherently uncertain. If actual factors and conditions differ materially from estimates made by management,Management, the actual realization of the net deferred tax assets or liabilities for uncertain tax positions could vary materially from the amounts previously recorded.
Deferred tax assets arise from items that may be usedclaimed as a tax deduction or credit in future income tax returns, for which a financial statement tax benefit has already been recognized. The Company’s realization of the net deferred tax asset generally depends upon future levels of its taxable income and the existence of prior years' taxable income tofor which refund claims couldfor refunds can be carried back. ValuationWhere necessary, valuation allowances are recorded against those deferred tax assets which a Company has determined will not likely to be realized. Deferred tax liabilities represent items that will require a future tax payment. TheyDeferred tax liabilities generally represent tax expense recognized in the Company's financial statements for which payment has been deferred, or a deduction takenclaimed on the Company's tax return but not yet recognized as an expense in the Company's financial statements. Deferred tax liabilities are also recognized for certain non-cash items such as goodwill.
Recent Accounting Developments
See Note 1, “Basis of Presentation” within Notesnotes to Consolidated Financial Statementsthe consolidated financial statements for information regarding recent accounting developments.
Non-GAAP Financial Measures and Reconciliation to GAAP
In addition to evaluating the Company's results of operations in accordance with GAAP, managementManagement periodically supplements this evaluation with an analysis of certain non-GAAP financial measures, such as operating earnings metrics, the return on tangible assets or equity, the tangible equity ratio, tangible book value per share, dividend payout ratio and the ratio of the allowance for loan and lease losses related to originated loans and leases operating earnings metrics, the efficiencyas a percentage of originated loans and tangible equity ratios, tangible book value per share and dividend payout ratio.leases. Management believes that these non-GAAP financial measures provide useful information useful to investors infor understanding the Company's underlying operating performance and trends, and facilitatestrends. These non-GAAP financial measures may also aid investors in facilitating comparisons with the performance assessment of the Company's financial performance, including non-interest expense control, while the tangible equity ratio and tangible book value per share are used to analyze the relative strength of the Company's capital position.
Operating Earnings
Operating earnings exclude compensation-related, acquisition-related and other expenses from net income; by excluding such items, the Company's results can be measured and assessed on a more consistent basis from period to period. Items excluded from operating earnings, which include, but are not limited to, acquisition-related expenses, and other charges related to executive-level management separation and severance-related costs, are also excluded when calculating the operating efficiency ratio.
In light of diversity in presentation among financial institutions, the methodologies used by the Company for determining the non-GAAP financial measures discussed above may differ from those used by other financial institutions.
Operating Earnings
Operating earnings exclude compensation-related and acquisition-related items from net income. By excluding such items, the Company's results can be measured and assessed on a more consistent basis from period to period. Items excluded from operating earnings are also excluded when calculating the operating return and operating efficiency ratios.
The following table summarizes the Company's operating earnings and operating earnings per share ("EPS") as of the dates indicated:
|
| | | | | | | | | | | | | | | | | | | |
| | Year Ended December 31, |
| | 2015 |
| 2014 |
| 2013 |
| 2012 |
| 2011 |
| | (Dollars in Thousands, Except Per Share Data) |
| Net income, as reported* | $ | 49,782 |
| | $ | 43,288 |
| | $ | 36,015 |
| | $ | 36,654 |
| | $ | 27,800 |
|
| Adjustments to arrive at operating earnings: | | | | | | | | | |
Compensation-related expenses (1) | — |
| | — |
| | 911 |
| | — |
| | — |
|
Acquisition-related expenses (2) | — |
| | — |
| | — |
| | 5,396 |
| | 2,201 |
|
| Total pre-tax adjustments | — |
| | — |
| | 911 |
| | 5,396 |
| | 2,201 |
|
| Tax effect: | | | | | | | | | |
Compensation-related expenses (1) | — |
| | — |
| | (316 | ) | | — |
| | — |
|
Acquisition-related expenses (2) | — |
| | — |
| | — |
| | (1,424 | ) | | (899 | ) |
| Total adjustments, net of tax | — |
| | — |
| | 595 |
| | 3,972 |
| | 1,302 |
|
| Operating earnings* | $ | 49,782 |
| | $ | 43,288 |
| | $ | 36,610 |
| | $ | 40,626 |
| | $ | 29,102 |
|
| | | | | | | | | | |
| Earnings per share, as reported* | $ | 0.71 |
| | $ | 0.62 |
| | $ | 0.52 |
| | $ | 0.53 |
| | $ | 0.47 |
|
| Adjustments to arrive at operating earnings per share: | | | | | | | | | |
Compensation-related expenses (1) | — |
| | — |
| | 0.01 |
| | — |
| | — |
|
Acquisition-related expenses (2) | — |
| | — |
| | — |
| | 0.06 |
| | 0.02 |
|
| Total adjustments per share | — |
| | — |
| | 0.01 |
| | 0.06 |
| | 0.02 |
|
| Operating earnings per share* | $ | 0.71 |
| | $ | 0.62 |
| | $ | 0.53 |
| | $ | 0.59 |
| | $ | 0.49 |
|
| (*) Previously reported amounts prior to January 1, 2015 have been restated to reflect a retrospective change in accounting principle for investments in qualified affordable housing projects, in accordance with ASU 2014-01. Refer to Note 10, "Other Assets". |
| (1) Compensation-related expenses include expense related to the departure of the Company's Chief Financial Officer in 2013. |
| (2) Acquisition-related expenses include expenses related to the acquisition of BankRI in January 2012 and First Ipswich in February 2011. |
The following table summarizes the Company's operating earnings, operating earnings per share ("EPS") and operating return on average assets as of the dates indicated:
|
| | | | | | | | | | | | | | | | | | | |
| | Year Ended December 31, |
| | 2013 | | 2012 | | 2011 | | 2010 | | 2009 |
| | (Dollars in Thousands, Except Per Share Data) |
| Net income, as reported | $ | 35,386 |
| | $ | 37,142 |
| | $ | 27,600 |
| | $ | 26,872 |
| | $ | 19,200 |
|
| Adjustments to arrive at operating earnings: | | | | | | | | | |
| Compensation-related expenses | 911 |
| | — |
| | — |
| | — |
| | — |
|
| Acquisition-related expenses | — |
| | 5,396 |
| | 2,201 |
| | — |
| | — |
|
| Total pre-tax adjustments | 911 |
| | 5,396 |
| | 2,201 |
| | — |
| | — |
|
| Tax effect: | | | | | | | | | |
| Compensation-related expenses | (316 | ) | | — |
| | — |
| | — |
| | — |
|
| Acquisition-related expenses | — |
| | (1,424 | ) | | (899 | ) | | — |
| | — |
|
| Total adjustments, net of tax | 595 |
| | 3,972 |
| | 1,302 |
| | — |
| | — |
|
| Operating earnings | $ | 35,981 |
| | $ | 41,114 |
| | $ | 28,902 |
| | $ | 26,872 |
| | $ | 19,200 |
|
| Earnings per share, as reported | $ | 0.51 |
| | $ | 0.53 |
| | $ | 0.47 |
| | $ | 0.46 |
| | $ | 0.33 |
|
| Adjustments to arrive at operating earnings per fully dilutive share: | | | | | | | | | |
| Compensation-related expenses | 0.01 |
| | — |
| | — |
| | — |
| | — |
|
| Acquisition-related expenses | — |
| | 0.06 |
| | 0.02 |
| | — |
| | — |
|
| Total adjustments per share | 0.01 |
| | 0.06 |
| | 0.02 |
| | — |
| | — |
|
| Operating earnings per fully dilutive share | $ | 0.52 |
| | $ | 0.59 |
| | $ | 0.49 |
| | $ | 0.46 |
| | $ | 0.33 |
|
| Average total assets | $ | 5,174,002 |
| | $ | 4,992,792 |
| | $ | 3,061,747 |
| | $ | 2,655,743 |
| | $ | 2,631,137 |
|
| Operating return on average assets | 0.70 | % | | 0.82 | % | | 0.94 | % | | 1.01 | % | | 0.73 | % |
The following table summarizes the Company's operating return on average assets, operating return on average tangible assets, operating return on average stockholders' equity and operating return on average tangible stockholders' equity:equity as of the dates indicated: |
| | | | | | | | | | | | | | | | | | | |
| | Year Ended December 31, |
| | 2015 |
| 2014 |
| 2013 |
| 2012 |
| 2011 |
| | (Dollars in Thousands) |
| Operating earnings (*) | $ | 49,782 |
| | $ | 43,288 |
| | $ | 36,610 |
| | $ | 40,626 |
| | $ | 29,102 |
|
| | | | | | | | | | |
| Average total assets (*) | $ | 5,840,749 |
| | $ | 5,556,224 |
| | $ | 5,174,232 |
| | $ | 4,992,952 |
| | $ | 3,062,151 |
|
| Less: Average goodwill and average identified intangible assets, net | 150,020 |
| | 153,170 |
| | 157,187 |
| | 164,301 |
| | 50,876 |
|
| Average tangible assets (*) | $ | 5,690,729 |
| | $ | 5,403,054 |
| | $ | 5,017,045 |
| | $ | 4,828,651 |
| | $ | 3,011,275 |
|
| |
|
| |
|
| |
|
| |
|
| |
|
|
| Operating return on average assets (*) | 0.85 | % | | 0.78 | % | | 0.71 | % | | 0.81 | % | | 0.95 | % |
| | | | | | | | | | |
| Operating return on average tangible assets (*) | 0.87 | % | | 0.80 | % | | 0.73 | % | | 0.84 | % | | 0.97 | % |
| | | | | | | | | | |
| Average total stockholders' equity (*) | $ | 657,841 |
| | $ | 630,966 |
| | $ | 616,473 |
| | $ | 606,821 |
| | $ | 501,259 |
|
| Less: Average goodwill and average identified intangible assets, net | 150,020 |
| | 153,170 |
| | 157,187 |
| | 164,301 |
| | 50,876 |
|
| Average tangible stockholders' equity (*) | $ | 507,821 |
| | $ | 477,796 |
| | $ | 459,286 |
| | $ | 442,520 |
| | $ | 450,383 |
|
| | | | | | | | | | |
| Operating return on average stockholders' equity (*) | 7.57 | % | | 6.86 | % | | 5.94 | % | | 6.69 | % | | 5.81 | % |
| | | | | | | | | | |
| Operating return on average tangible stockholders' equity (*) | 9.80 | % | | 9.06 | % | | 7.97 | % | | 9.18 | % | | 6.46 | % |
| (*) Previously reported amounts prior to January 1, 2015 have been restated to reflect a retrospective change in accounting principle for investments in qualified affordable housing projects, in accordance with ASU 2014-01. Refer to Note 10, "Other Assets". |
|
| | | | | | | | | | | | | | | | | | | |
| | Year Ended December 31, |
| | 2013 | | 2012 | | 2011 | | 2010 | | 2009 |
| | (Dollars in Thousands) |
| Operating earnings | $ | 35,981 |
| | $ | 41,114 |
| | $ | 28,902 |
| | $ | 26,872 |
| | $ | 19,200 |
|
| Average stockholders' equity | $ | 616,243 |
| | $ | 606,661 |
| | $ | 500,855 |
| | $ | 493,373 |
| | $ | 487,884 |
|
| Less: Average goodwill and average identified intangible assets, net | 157,187 |
| | 164,301 |
| | 50,876 |
| | 45,724 |
| | 47,080 |
|
| Average tangible stockholders' equity | $ | 459,056 |
| | $ | 442,360 |
| | $ | 449,979 |
| | $ | 447,649 |
| | $ | 440,804 |
|
| Operating return on average tangible stockholders' equity | 7.84 | % | | 9.29 | % | | 6.42 | % | | 6.00 | % | | 4.36 | % |
The following table summarizes the Company’s return on average tangible assets and return on average tangible
|
| | | | | | | | | | | | | | | | | | | |
| | Year Ended December 31, |
| | 2015 | | 2014 | | 2013 | | 2012 | | 2011 |
| | (Dollars in Thousands) |
| Net income, as reported (*) | $ | 49,782 |
| | $ | 43,288 |
| | $ | 36,015 |
| | $ | 36,654 |
| | $ | 27,800 |
|
| | | | | | | | | | |
| Average total assets (*) | $ | 5,840,749 |
| | $ | 5,556,224 |
| | $ | 5,174,232 |
| | $ | 4,992,952 |
| | $ | 3,062,151 |
|
| Less: Average goodwill and average identified intangible assets, net | 150,020 |
|
| 153,170 |
|
| 157,187 |
|
| 164,301 |
|
| 50,876 |
|
| Average tangible assets (*) | 5,690,729 |
| | 5,403,054 |
| | 5,017,045 |
| | 4,828,651 |
| | 3,011,275 |
|
| | | | | | | | | | |
| Return on average tangible assets (*) | 0.87 | % | | 0.80 | % | | 0.72 | % | | 0.76 | % | | 0.92 | % |
| | | | | | | | | | |
| Average total stockholders' equity (*) | 657,841 |
| | 630,966 |
| | 616,473 |
| | 606,821 |
| | 501,259 |
|
| Less: Average goodwill and average identified intangible assets,net | 150,020 |
| | 153,170 |
| | 157,187 |
| | 164,301 |
| | 50,876 |
|
| Average tangible stockholders' equity (*) | 507,821 |
| | 477,796 |
| | 459,286 |
| | 442,520 |
| | 450,383 |
|
| | | | | | | | | | |
| Return on average tangible stockholders' equity (*) | 9.80 | % | | 9.06 | % | | 7.84 | % | | 8.28 | % | | 6.17 | % |
| (*) Previously reported amounts prior to January 1, 2015 have been restated to reflect a retrospective change in accounting principle for investments in qualified affordable housing projects, in accordance with ASU 2014-01. Refer to Note 10, "Other Assets". |
The following tables summarize the Company's tangible equity ratio and tangible book value per share derived from amounts reported in the consolidated balance sheet as of the dates indicated. |
| | | | | | | | | | | | | | | | | | | |
| | At December 31, |
| | 2015 | | 2014 | | 2013 | | 2012 | | 2011 |
| | (Dollars in Thousands) |
| Total stockholders' equity (*) | $ | 667,485 |
| | $ | 641,818 |
| | $ | 614,412 |
| | $ | 612,013 |
| | $ | 504,006 |
|
| Less: Goodwill and identified intangible assets, net | 148,523 |
| | 151,434 |
| | 154,777 |
| | 159,400 |
| | 51,013 |
|
| Tangible stockholders' equity (*) | $ | 518,962 |
| | $ | 490,384 |
| | $ | 459,635 |
| | $ | 452,613 |
| | $ | 452,993 |
|
| | | | | | | | | | |
| Total assets (*) | $ | 6,042,338 |
| | $ | 5,800,948 |
| | $ | 5,325,651 |
| | $ | 5,147,450 |
| | $ | 3,299,417 |
|
| Less: Goodwill and identified intangible assets, net | 148,523 |
| | 151,434 |
| | 154,777 |
| | 159,400 |
| | 51,013 |
|
| Tangible assets (*) | $ | 5,893,815 |
| | $ | 5,649,514 |
| | $ | 5,170,874 |
| | $ | 4,988,050 |
| | $ | 3,248,404 |
|
| | | | | | | | | | |
| Tangible equity ratio (*) | 8.81 | % | | 8.68 | % | | 8.89 | % | | 9.07 | % | | 13.95 | % |
| (*) Previously reported amounts prior to January 1, 2015 have been restated to reflect a retrospective change in accounting principle for investments in qualified affordable housing projects, in accordance with ASU 2014-01. Refer to Note 10, "Other Assets". |
|
| | | | | | | | | | | | | | | | | | | |
| | At December 31, |
| | 2013 | | 2012 | | 2011 | | 2010 | | 2009 |
| | (Dollars in Thousands) |
| Total stockholders' equity | $ | 613,867 |
| | $ | 612,097 |
| | $ | 503,602 |
| | $ | 495,443 |
| | $ | 487,317 |
|
| Less: Goodwill and identified intangible assets, net | 154,777 |
| | 159,400 |
| | 51,013 |
| | 45,112 |
| | 46,336 |
|
| Tangible stockholders' equity | $ | 459,090 |
| | $ | 452,697 |
| | $ | 452,589 |
| | $ | 450,331 |
| | $ | 440,981 |
|
| Total assets | $ | 5,325,106 |
| | $ | 5,147,534 |
| | $ | 3,299,013 |
| | $ | 2,720,542 |
| | $ | 2,615,884 |
|
| Less: Goodwill and identified intangible assets, net | 154,777 |
| | 159,400 |
| | 51,013 |
| | 45,112 |
| | 46,336 |
|
| Tangible assets | $ | 5,170,329 |
| | $ | 4,988,134 |
| | $ | 3,248,000 |
| | $ | 2,675,430 |
| | $ | 2,569,548 |
|
| Tangible equity ratio | 8.88 | % | | 9.08 | % | | 13.93 | % | | 16.83 | % | | 17.16 | % |
|
| | | | | | | | | | | | | | | | | | | |
| | Year Ended December 31, |
| | 2015 | | 2014 | | 2013 | | 2012 | | 2011 |
| | (Dollars in Thousands) |
| Tangible stockholders' equity (*) | $ | 518,962 |
| | $ | 490,384 |
| | $ | 459,635 |
| | $ | 452,613 |
| | $ | 452,993 |
|
| | | | | | | | | | |
| Common shares issued | 75,744,445 |
| | 75,744,445 |
| | 75,744,445 |
| | 75,749,825 |
| | 64,597,180 |
|
| Less: | | | | | | | | | |
| Treasury shares | 4,861,554 |
| | 5,040,571 |
| | 5,171,985 |
| | 5,373,733 |
| | 5,373,733 |
|
| Unallocated ESOP | 213,066 |
| | 251,382 |
| | 291,666 |
| | 333,918 |
| | 378,215 |
|
| Unvested restricted stocks | 486,035 |
| | 419,702 |
| | 409,068 |
| | 295,055 |
| | 185,291 |
|
| Common shares outstanding | 70,183,790 |
| | 70,032,790 |
| | 69,871,726 |
| | 69,747,119 |
| | 58,659,941 |
|
| | | | | | | | | | |
| Tangible book value per share (*) | $ | 7.39 |
| | $ | 7.00 |
| | $ | 6.58 |
| | $ | 6.49 |
| | $ | 7.72 |
|
| (*) Previously reported amounts prior to January 1, 2015 have been restated to reflect a retrospective change in accounting principle for investments in qualified affordable housing projects, in accordance with ASU 2014-01. Refer to Note 10, "Other Assets". |
|
| | | | | | | | | | | | | | | | | | | |
| | Year Ended December 31, |
| | 2013 | | 2012 | | 2011 | | 2010 | | 2009 |
| | (Dollars in Thousands) |
| Tangible stockholders' equity | $ | 459,090 |
| | $ | 452,697 |
| | $ | 452,589 |
| | $ | 450,331 |
| | $ | 440,981 |
|
| Common shares issued | 75,744,445 |
| | 75,749,825 |
| | 64,597,180 |
| | 64,445,389 |
| | 64,404,419 |
|
| Less: Common shares classified as treasury shares | 5,171,985 |
| | 5,373,733 |
| | 5,373,733 |
| | 5,373,733 |
| | 5,373,733 |
|
| Unallocated ESOP | 291,666 |
| | 333,918 |
| | 378,215 |
| | 424,422 |
| | 472,604 |
|
| Unvested restricted stocks | 409,068 |
| | 295,055 |
| | 185,291 |
| | 40,970 |
| | 8,889 |
|
| Common shares outstanding | 69,871,726 |
| | 69,747,119 |
| | 58,659,941 |
| | 58,606,264 |
| | 58,549,193 |
|
| Tangible book value per share | $ | 6.57 |
| | $ | 6.49 |
| | $ | 7.72 |
| | $ | 7.68 |
| | $ | 7.53 |
|
The following table summarizes the Company's dividend payout ratio:
|
| | | | | | | | | | | | | | | | | | | |
| | Year Ended December 31, |
| | 2013 | | 2012 | | 2011 | | 2010 | | 2009 |
| | (Dollars in Thousands) |
| Dividends paid | $ | 23,843 |
| | $ | 23,821 |
| | $ | 20,072 |
| | $ | 20,070 |
| | $ | 31,684 |
|
| Net income, as reported | $ | 35,386 |
| | $ | 37,142 |
| | $ | 27,600 |
| | $ | 26,872 |
| | $ | 19,200 |
|
| Dividend payout ratio | 67.38 | % | | 64.13 | % | | 72.72 | % | | 74.69 | % | | 165.02 | % |
Financial Condition |
| | | | | | | | | | | | | | | | | | | |
| | Year Ended December 31, |
| | 2015 |
| 2014 |
| 2013 |
| 2012 |
| 2011 |
| | (Dollars in Thousands) |
| Dividends paid | $ | 24,967 |
| | $ | 23,876 |
| | $ | 23,841 |
| | $ | 23,777 |
| | $ | 20,072 |
|
| | | | | | | | | | |
| Net income, as reported (*) | $ | 49,782 |
| | $ | 43,288 |
| | $ | 36,015 |
| | $ | 36,654 |
| | $ | 27,800 |
|
| | | | | | | | | | |
| Dividend payout ratio (*) | 50.15 | % | | 55.16 | % | | 66.20 | % | | 64.87 | % | | 72.20 | % |
| (*) Previously reported amounts prior to January 1, 2015 have been restated to reflect a retrospective change in accounting principle for investments in qualified affordable housing projects, in accordance with ASU 2014-01. Refer to Note 10, "Other Assets". |
General
Total assets at December 31, 2013 grewThe following table summarizes the Company’s allowance for loan and lease losses related to $5.3 billion, an increase of $0.2 billion or 3.4% from December 31, 2012. Growth in totaloriginated loans and leases was $186.8 million, or 4.5%. since December 31, 2012, which was comprised primarilyas a percentage of growth in commercial real estate loans of $197.7 million, or 9.9%, and in commercialtotal originated loans and leases of $118.2 million, or 13.9%. Offsetting this loan and lease growth was a $141.8 million decline in indirect automobile loan balances from December 31, 2012 to 2013, due to management's unwillingness to originate loans at what it considers to be very low interest rates.leases: |
| | | | | | | | | | | | | | | | | | | |
| | Year Ended December 31, |
| | 2015 | | 2014 | | 2013 | | 2012 | | 2011 |
| | | | | | | | | | |
| Allowance for loan and lease losses | $ | 56,739 |
| | $ | 53,659 |
| | $ | 48,473 |
| | $ | 41,152 |
| | $ | 31,703 |
|
| Less: Allowance for acquired loan and lease losses | 1,752 |
| | 2,848 |
| | 1,629 |
| | — |
| | — |
|
| Allowance for originated loan and lease losses | $ | 54,987 |
|
| $ | 50,811 |
|
| $ | 46,844 |
|
| $ | 41,152 |
|
| $ | 31,703 |
|
| | | | | | | | | | |
| Total loans and leases | $ | 4,995,540 |
| | $ | 4,822,607 |
| | $ | 4,362,465 |
| | $ | 4,175,712 |
| | $ | 2,720,821 |
|
| Less: Total acquired loans and leases | 422,652 |
| | 590,654 |
| | 815,412 |
| | 1,059,611 |
| | 198,936 |
|
| Total originated loan and leases | $ | 4,572,888 |
|
| $ | 4,231,953 |
|
| $ | 3,547,053 |
|
| $ | 3,116,101 |
|
| $ | 2,521,885 |
|
| | | | | | | | | | |
| Allowance for loan and lease losses related to originated loans and leases as a percentage of originated loan and leases | 1.20 | % |
| 1.20 | % |
| 1.32 | % |
| 1.32 | % |
| 1.26 | % |
The Company's deposits increased by $0.2 billion, or 6.0%, since December 31, 2012 due to an increase in money market accounts. Core deposits as a percentage of total deposits increased to 75.6% at December 31, 2013 from 72.0% at December 31, 2012. Borrowed funds decreased by $41.4 million, or 4.8%, to $812.6 million at December 31, 2013 from $854.0 million at December 31, 2012 as the Company continues to fund its business with core deposits. Stockholders' equity as a percentage of total assets was 11.5% and 11.9%, respectively, at December 31, 2013 and 2012.Financial Condition
Loans and Leases
The following table sets forthsummarizes the Company's loanportfolio of loans and lease balances and the percentage breakdown by loan categoryleases receivables at the dates indicated:
| | | | At December 31, | At December 31, |
| | 2013 | | 2012 | | 2011 | | 2010 | | 2009 | 2015 | | 2014 | | 2013 | | 2012 | | 2011 |
| | Balance | | Percent of Total | | Balance | | Percent of Total | | Balance | | Percent of Total | | Balance | | Percent of Total | | Balance | | Percent of Total | Balance | | Percent of Total | | Balance | | Percent of Total | | Balance | | Percent of Total | | Balance | | Percent of Total | | Balance | | Percent of Total |
| | (Dollars in Thousands) | (Dollars in Thousands) |
| Commercial real estate loans: | | | | | | | | | | | | | | | | | | | | | | | | | | | | | | | | | | | | | | |
| Commercial real estate mortgage | $ | 1,461,985 |
| | 33.5 | % | | $ | 1,301,233 |
| | 31.1 | % | | $ | 748,736 |
| | 27.5 | % | | $ | 564,584 |
| | 25.0 | % | | $ | 525,107 |
| | 24.3 | % | |
| Commercial real estate | | $ | 1,875,592 |
| | 37.5 | % | | $ | 1,680,082 |
| | 34.8 | % | | $ | 1,461,985 |
| | 33.5 | % | | $ | 1,301,233 |
| | 31.1 | % | | $ | 748,736 |
| | 27.5 | % |
| Multi-family mortgage | 627,933 |
| | 14.4 | % | | 606,533 |
| | 14.5 | % | | 481,459 |
| | 17.7 | % | | 421,013 |
| | 18.7 | % | | 375,081 |
| | 17.3 | % | 658,480 |
| | 13.2 | % | | 639,706 |
| | 13.2 | % | | 627,933 |
| | 14.4 | % | | 606,533 |
| | 14.5 | % | | 481,459 |
| | 17.7 | % |
| Construction | 113,705 |
| | 2.6 | % | | 98,197 |
| | 2.3 | % | | 40,798 |
| | 1.5 | % | | 18,205 |
| | 0.8 | % | | 18,180 |
| | 0.8 | % | 130,322 |
| | 2.6 | % | | 148,013 |
| | 3.1 | % | | 113,705 |
| | 2.6 | % | | 98,197 |
| | 2.3 | % | | 40,798 |
| | 1.5 | % |
| Total commercial real estate loans | 2,203,623 |
| | 50.5 | % | | 2,005,963 |
| | 47.9 | % | | 1,270,993 |
| | 46.7 | % | | 1,003,802 |
| | 44.5 | % | | 918,368 |
| | 42.4 | % | 2,664,394 |
| | 53.3 | % | | 2,467,801 |
| | 51.1 | % | | 2,203,623 |
| | 50.5 | % | | 2,005,963 |
| | 47.9 | % | | 1,270,993 |
| | 46.7 | % |
| Commercial loans and leases: | | | | | | | | | | | | | | | | | | | | | | | | | | | | | | | | | | | | | | |
| Commercial | 407,792 |
| | 9.3 | % | | 382,277 |
| | 9.1 | % | | 150,895 |
| | 5.5 | % | | 96,788 |
| | 4.3 | % | | 93,769 |
| | 4.4 | % | 592,531 |
| | 11.9 | % | | 514,077 |
| | 10.7 | % | | 407,792 |
| | 9.3 | % | | 382,277 |
| | 9.1 | % | | 150,895 |
| | 5.5 | % |
| Equipment financing | 513,024 |
| | 11.8 | % | | 420,991 |
| | 10.1 | % | | 246,118 |
| | 9.1 | % | | 205,018 |
| | 9.1 | % | | 166,680 |
| | 7.7 | % | 721,890 |
| | 14.5 | % | | 601,424 |
| | 12.5 | % | | 513,024 |
| | 11.8 | % | | 420,991 |
| | 10.1 | % | | 246,118 |
| | 9.1 | % |
| Condominium association | 44,794 |
| | 1.0 | % | | 44,187 |
| | 1.1 | % | | 46,953 |
| | 1.7 | % | | 42,422 |
| | 1.9 | % | | 37,492 |
| | 1.7 | % | 59,875 |
| | 1.2 | % | | 51,593 |
| | 1.1 | % | | 44,794 |
| | 1.0 | % | | 44,187 |
| | 1.1 | % | | 46,953 |
| | 1.7 | % |
| Total commercial loans and leases | 965,610 |
| | 22.1 | % | | 847,455 |
| | 20.3 | % | | 443,966 |
| | 16.3 | % | | 344,228 |
| | 15.3 | % | | 297,941 |
| | 13.8 | % | 1,374,296 |
| | 27.6 | % | | 1,167,094 |
| | 24.3 | % | | 965,610 |
| | 22.1 | % | | 847,455 |
| | 20.3 | % | | 443,966 |
| | 16.3 | % |
| Indirect automobile | 400,531 |
| | 9.2 | % | | 542,344 |
| | 13.0 | % | | 573,350 |
| | 21.1 | % | | 553,689 |
| | 24.6 | % | | 553,963 |
| | 25.6 | % | 13,678 |
| | 0.3 | % | | 316,987 |
| | 6.6 | % | | 400,531 |
| | 9.2 | % | | 542,344 |
| | 13.0 | % | | 573,350 |
| | 21.1 | % |
| Consumer loans: | | | | | | | | | | | | | | | | | | | | | | | | | | | | | | | | | | | | | | |
| Residential mortgage | 528,185 |
| | 12.1 | % | | 511,109 |
| | 12.3 | % | | 350,213 |
| | 12.9 | % | | 288,108 |
| | 12.8 | % | | 336,665 |
| | 15.5 | % | 616,449 |
| | 12.3 | % | | 571,920 |
| | 11.9 | % | | 528,185 |
| | 12.1 | % | | 511,109 |
| | 12.3 | % | | 350,213 |
| | 12.9 | % |
| Home equity | 257,461 |
| | 5.9 | % | | 261,562 |
| | 6.3 | % | | 76,527 |
| | 2.8 | % | | 58,745 |
| | 2.6 | % | | 51,107 |
| | 2.4 | % | 314,553 |
| | 6.3 | % | | 287,058 |
| | 5.9 | % | | 257,461 |
| | 5.9 | % | | 261,562 |
| | 6.3 | % | | 76,527 |
| | 2.8 | % |
| Other consumer | 7,055 |
| | 0.2 | % | | 7,279 |
| | 0.2 | % | | 5,772 |
| | 0.2 | % | | 4,966 |
| | 0.2 | % | | 6,251 |
| | 0.3 | % | 12,170 |
| | 0.2 | % | | 11,747 |
| | 0.2 | % | | 7,055 |
| | 0.2 | % | | 7,279 |
| | 0.2 | % | | 5,772 |
| | 0.2 | % |
| Total consumer loans | 792,701 |
| | 18.2 | % | | 779,950 |
| | 18.8 | % | | 432,512 |
| | 15.9 | % | | 351,819 |
| | 15.6 | % | | 394,023 |
| | 18.2 | % | 943,172 |
| | 18.8 | % | | 870,725 |
| | 18.0 | % | | 792,701 |
| | 18.2 | % | | 779,950 |
| | 18.8 | % | | 432,512 |
| | 15.9 | % |
| Total loans and leases | 4,362,465 |
| | 100.0 | % | | 4,175,712 |
| | 100.0 | % | | 2,720,821 |
| | 100.0 | % | | 2,253,538 |
| | 100.0 | % | | 2,164,295 |
| | 100.0 | % | 4,995,540 |
| | 100.0 | % | | 4,822,607 |
| | 100.0 | % | | 4,362,465 |
| | 100.0 | % | | 4,175,712 |
| | 100.0 | % | | 2,720,821 |
| | 100.0 | % |
| Allowance for loan and lease losses | (48,473 | ) | | | | (41,152 | ) | | | | (31,703 | ) | | | | (29,695 | ) | | | | (31,083 | ) | | | (56,739 | ) | | | | (53,659 | ) | | | | (48,473 | ) | | | | (41,152 | ) | | | | (31,703 | ) | | |
| Net loans and leases | $ | 4,313,992 |
| | | | $ | 4,134,560 |
| | | | $ | 2,689,118 |
| | | | $ | 2,223,843 |
| | | | $ | 2,133,212 |
| | | $ | 4,938,801 |
| | | | $ | 4,768,948 |
| | | | $ | 4,313,992 |
| | | | $ | 4,134,560 |
| | | | $ | 2,689,118 |
| | |
The Company's loan portfolio consists primarily of first mortgage loans secured by commercial, multi-family and residential real estate properties located in the Company's primary lending area, indirect automobile loans, loans to business entities, including commercial lines of credit, loans to condominium associations and loans and leases used to finance equipment used by small businesses. The Company also provides financing for construction and development projects, home equity and other consumer loans.
The Company employs seasoned commercial lenders and retail bankers who rely on community and business contacts as well as referrals from customers, attorneys and other professionals to generate loans and deposits. Existing borrowers are also an important source of business since many of them have more than one loan outstanding with the Company. The Company's ability to originate loans depends on the strength of the economy, trends in interest rates, and levels of customer demandsdemand and market competition.
It is theThe Company's current policy is that the aggregate amount of loans outstanding to any one borrower or related entities may not exceed $35.0 million unless approved by the ExecutiveBoard Credit Committee, a committee of the Company's Board of Directors. At
As of December 31, 2013,2015, there were notwo borrowers with aggregated loans outstanding of $35.0 million or greater. There were 113 borrowers each with aggregate loans outstanding of $5.0 million or greater at December 31, 2013. The cumulative total of those loans was $1,162.7$95.1 million or 26.7%1.90% of total loans outstanding atas of December 31, 2013.2015.
The Company has written underwriting policies to control the inherent risks in loan origination. The policies address approval limits, loan-to-value ratios, appraisal requirements, debt service coverage ratios, loan concentration limits and other matters relevant to loan underwriting.
Commercial Real Estate Loans
The commercial real estate portfolio is comprised of commercial real estate mortgage loans, multi-family mortgage loans, and construction loans and is the largest component of the Company's overall loan portfolio, representing 50.5%53.3% of total loans and leases outstanding (including deferred loan origination costs) atas of December 31, 2013. For the commercial real estate portfolio, the Company focuses on making loans in the $3 million to $10 million range.2015.
Typically, commercial real estate loans are larger in size and involve a greater degree of risk than owner-occupied residential mortgage loans. Loan repayment is usually dependent on the successful operation and management of the properties and the value of the properties securing the loans. Economic conditions can greatly affect cash flows and property values.
A number of factors are considered in originating commercial real estate and multi-family mortgage loans. The qualifications and financial condition of the borrower (including credit history), as well as the potential income generation and the value and condition of the underlying property, are evaluated. When evaluating the qualifications of the borrower, the Company considers the financial resources of the borrower, the borrower's experience in owning or managing similar property and the borrower's payment history with the Company and other financial institutions. Factors considered in evaluating the underlying property include the net operating income of the mortgaged premises before debt service and depreciation, the debt service coverage ratio (the ratio of cash flow before debt service to debt service), the use of conservative capitalization rates, and the ratio of the loan amount to the appraised value. Generally, personal guarantees are obtained from commercial real estate loan borrowers.
Commercial real estate and multi-family mortgage loans are typically originated for terms of five years with amortization periods of 20 to 30 years. Many of the loans are priced at inception on a fixed-rate basis generally for periods ranging from two to five years with repricing periods for longer-term loans. When possible, prepayment penalties are included in loan covenants on these loans. For commercial customers who are interested in loans with terms longer than five years, the Company offers interest rate swaps to accommodate customer need.
Brookline Bank'sThe Company's urban and suburban market area is characterized by a large number of apartment buildings, condominiums and office buildings. As a result, multi-family and commercial real estate and multi-family mortgage lending has been a significant part of Brookline Bank'sthe Company's activities for many years. These types of loans typically generate higher yields, but also involve greater credit risk. Many of Brookline Bank'sthe Company's borrowers have more than one multi-family or commercial real estate loan outstanding with Brookline Bank.the Company.
Over 99% of the commercial real estate loans outstanding at December 31, 2013 were secured by properties located in New England. The commercial real estate portfolio at that date was composed primarily of loans secured by apartment buildings ($624.0679.4 million), office buildings ($479.6628.5 million), retail stores ($439.7511.4 million), industrial properties ($247.6299.2 million) and mixed-use properties ($169.4201.5 million). as of December 31, 2015. At that date, over 97% of the commercial real estate loans outstanding were secured by properties located in New England.
Construction and development financing is generally considered to involve a higher degree of risk than long-term financing on improved, occupied real estate and thus has higherlower concentration limits than do other commercial credit classes. Risk of loss on a construction loan is largely dependent upon the accuracy of the initial estimate of construction costs, the estimated time to sell or rent the completed property at an adequate price or rate of occupancy, and market conditions. If the estimates and projections prove to be inaccurate, the Company may be confronted with a project which, upon completion, has a value that is insufficient to assure full loan repayment.
Criteria applied in underwriting construction loans for which the primary source of repayment is the sale of the property are different from the criteria applied in underwriting construction loans for which the primary source of repayment is the stabilized cash flow from the completed project. For those loans where the primary source of repayment is from resale of the property, in addition to the normal credit analysis performed for other loans, the Company also analyzes project costs, the attractiveness of the property in relation to the market in which it is located and demand within the market area. For those construction loans where the source of repayment is the stabilized cash flow from the completed project, the Company analyzes
not only project costs but also how long it might take to achieve satisfactory occupancy and the reasonableness of projected rental rates in relation to market rental rates.
Historically, construction and development lending has comprised a modest part of the Company's loan originations. At December 31, 2013, total construction loans equaled $113.7 million or 2.6% of total loans outstanding (including deferred loan origination costs) at that date.
Commercial Loans
ThisThe commercial loan and lease portfolio is comprised of commercial loans, equipment financing loans and leases and condominium association loans and represented 22.1%27.6% of total loans outstanding (including deferred loan origination costs) atas of December 31, 2013. The Company focuses on making commercial loans in the $1.0 million to $3.5 million range.2015.
The Company provides commercial banking services to companies in its market area. Over 53%50% of the commercial loans outstanding atas of December 31, 20132015 were made to borrowers located in New England. Over 17% of the outstanding balances were made to borrowers in New York and New Jersey by the Company's equipment financing divisions. The remaining 50% of the commercial loans outstanding were made to borrowers in other areas in the United States of America. Product offerings include lines of credit, term loans, letters of credit, deposit services and cash management. These types of credit facilities have as their primary source of repayment cash flows from the operations of a business. Interest rates offered are available on a floating basis tied to the prime rate or a similar index or on a fixed-rate basis referenced on the FHLBBFederal Home Loan Bank of Boston ("FHLBB") index.
Credit extensions are made to established businesses on the basis of loan purpose and assessment of capacity to repay as determined by an analysis of their financial statements, the nature of collateral to secure the credit extension and, in most instances, the personal guarantee of the owner of the business.business as well as industry and general economic conditions. The Company also participates in U.S. Government programs such as the Small Business Administration (the "SBA") in both the 7A program and as an SBA preferred lender.
The Company’s equipment financing divisions focus on market niches in which its lenders have deep experience and industry contacts, and on making loans to customers with business experience. An important part of the Company’s equipment financing loan origination volume comes from equipment manufacturers and existing customers as they expand their operations. The equipment financing portfolio is composed primarily of loans to finance coin-operated laundry, tow trucks, fitness, dry cleaning fitness, and convenience store equipment and, most recently, tow trucks.equipment. The borrowers are located primarily in the greater New York/York and New Jersey metropolitan area, although the customer base extends to locations throughout the United States. Typically, the loans are priced at a fixed rate of interest and require monthly payments over their three- to seven-year life. The yields earned on equipment financing loans are higher than those earned on the commercial loans made by the Banks because they involve a higher degree of credit risk. Equipment financing customers are typically small-business owners who operate with limited financial resources and who face greater risks when the economy weakens or unforeseen adverse events arise. Because of these characteristics, personal guarantees of borrowers are usually obtained along with liens on available assets. The Company focuses on making equipment financing loans and leases in the $100 thousand to $500 thousand range.
The Company's equipment financing divisions focus on market niches in which its lenders have deep experience and industry contacts, and on making loans to customers with business experience. An important part of the Company's equipment financing loan origination volume comes from equipment manufacturers and existing customers as they expand their operations. The size of loan is determined by an analysis of cash flow and other characteristics pertaining to the business and the equipment to be financed, based on detailed revenue and profitability data of similar operations.
Loans to condominium associations are for the purpose of funding capital improvements, are made for five- to ten-year terms and are secured by a general assignment of condominium association revenues. Among the factors considered in the underwriting of such loans are the level of owner occupancy, the financial condition and history of the condominium association, the attractiveness of the property in relation to the market in which it is located and the reasonableness of estimates of the cost of capital improvements to be made. Depending on loan size, funds are advanced as capital improvements are made and, in more complex situations, after completion of engineering inspections.
Indirect Automobile Loans
This loan portfolio represented 9.2% of total loans outstanding (including deferred loan origination costs) at December 31, 2013. Loans outstanding in the portfolio totaled $400.5 million at December 31, 2013, down from $542.3 million at December 31, 2012. Although 2013 was the second straight year of robust automobile sales, competition for these loans increased significantly as credit unions and large national banks entered indirect automobile lending in a search for additional sources of income. That competition drove interest rates down and, in some cases, changed the manner in which interest rates are developed, i.e. from including a dealer-shared spread to requiring a dealer-based fee to originate the loan. Depending on the terms of the dealer's enrollment agreement with the Company, the dealer earns this fee 90 days after a loan is originated or once the borrower makes at least three payments on the loan.
Indirect automobile loans are for the purchase of automobiles (both new and used) and light-duty trucks primarily by individuals, but also by corporations and other organizations. The loans are originated through over 200 dealerships located primarily in Massachusetts, but also in Connecticut, Rhode Island and New Hampshire. Dealer relationships are reviewed periodically for application quality, the ratio of loans approved to applications submitted and loan performance.
Loan applications are generated by approved dealers and data is entered into an application processing system. A credit bureau scorecard model is used in the underwriting process. The model is based on data accumulated by nationally recognized
credit bureaus and is a risk assessment tool that analyzes an individual's credit history and assigns a numeric credit score. The model meets the requirements of the Equal Credit Opportunity Act. The application processing system sorts each application according to score ranges. Loans must meet criteria established in the Company's loan policy. Credit profile measurements such as debt-to-income ratios, payment-to-income ratios and loan-to-value ratios are utilized in the underwriting process and to monitor the performance of loans falling within specified ratio ranges. Regarding loan-to-value ratios, the Company considers indirect automobile loans to be essentially credits that are less than fully collateralized. When borrowers cease to make required payments, repossession and sale of the vehicle financed usually results in insufficient funds to fully pay the remaining loan balance.
While the Company's indirect automobile loan policy permits the aggregate amount of loans with credit scores of 660 or below to comprise as much as 15% of loans outstanding, at December 31, 2013, loans with credit scores of 660 or below were 3.2% of loans outstanding. The average-dollar original weighted credit score of loans in the portfolio at that date was 747. See the subsection "Provision for Credit Losses" appearing elsewhere herein for further information regarding loan underwriting and the average credit scores of the borrowers to whom indirect automobile loans were made. All loans require the purchase of single interest insurance by the borrower. The insurance is designed to protect the Company from loss when a loan is in default and the collateral value is impaired due to vehicle damage or the Company is unable to take possession of the vehicle.
Indirect automobile loans are assigned a particular tier based on the credit score determined by the credit bureau. The tier is used for pricing purposes so as to assure consistency in loan pricing. Tier rates can be modified if certain conditions exist as outlined in the Company's loan policy. The APR paid by a borrower may differ from the "buy rate" earned by the Company. The difference is commonly referred to as the "spread." An agreed-upon percentage (depending upon the agreement with the dealer) of the spread is paid after the end of the month in which the loan is made and is comprised of the amount differential between amortization schedules of the buy rate and the APR. If a loan is repaid in its entirety within 90 days or before three payments have been made (depending on the agreement with the dealer), the dealer must pay the remainder of unamortized spread to the Company. If a loan is repaid after 90 days or after three payments have been made (depending on the agreement with the dealer), the dealer is not obliged to repay any part of the spread amount previously received. Spread payments to dealers are amortized as a reduction of interest received from borrowers over the life of the related loans. When loans are prepaid, any remaining unamortized balance is charged to expense at that time. For loans originated with no rate differential the Company will pay a flat fee to the dealers to procure the loan. This fee is deferred and amortized over the life of the loan.
Various reports are generated to monitor receipt of required loan documents, adherence to loan policy parameters, dealer performance, loan delinquencies and loan charge-offs. Summary reports are submitted to the Company's Chief Credit Officer and the Board of Directors on a periodic basis.
Consumer Loans
ThisThe consumer loan portfolio is comprised of residential mortgage loans, home equity loans and lines andof credit, other consumer loans, and indirect automobile loans and represented 18.2%19.1% of total loans outstanding (including deferred loan origination costs) atas of December 31, 2013.2015. The Company focuses its mortgage loans on existing and new customers within its branch networks in its urban and suburban marketplaces in the greater Boston and Providence metropolitan areas.
The Loans outstanding in the indirect automobile portfolio totaled $13.7 million as of December 31, 2015, down from $317.0 million as of December 31, 2014. In December 2014, the Company ceased the origination of indirect automobile loans and in March 2015 sold $255.2 million of the indirect automobile loan portfolio. As of December 31, 2015, the Company continues to service the remaining portfolio.The Company originates adjustable- and fixed-rate residential mortgage loans secured by one- to four-family residences on a servicing-released basis. In general, the Company maintains three-, five- and seven-year adjustable-rate mortgage loans and ten-year fixed-rate fully amortizing mortgage loans in its portfolio. Fixed-rate mortgage loans with maturities beyond ten years, such as 15- and 30-year fixed-rate mortgages, are not generally maintained in the Company's portfolio but are rather sold into the secondary market. During 2013, the Banks acted as correspondent banks in these secondary-market transactions. Loan sales in the secondary market provide funds for additional lending and other banking activities.residences. Each residential mortgage loan granted is subject to a satisfactorily completed application, employment verification, credit history and a demonstrated ability to repay the debt. Generally, loans are not made when the loan-to-value ratio exceeds 80% unless private mortgage insurance is obtained and/or there is a financially strong guarantor. Appraisals are performed by outside independent fee appraisers.
In general, the Company maintains three-, five- and seven-year adjustable-rate mortgage loans and ten-year fixed-rate fully amortizing mortgage loans in its portfolio. Fixed-rate mortgage loans with maturities beyond ten years, such as 15- and 30-year fixed-rate mortgages, are generally sold into the secondary market on a servicing-released basis. The Banks act as
correspondent banks in these secondary-market transactions. Loan sales in the secondary market provide funds for additional lending and other banking activities.
Underwriting guidelines for home equity loans and lines of credit are similar to those for residential mortgage loans. Home equity loans and lines of credit are limited to no more than 80% of the appraised value of the property securing the loan lessincluding the amount of any existing first mortgage liens.
Other consumer loans have historically been a modest part of the Company's loan originations. AtAs of December 31, 2013,2015, other consumer loans equaled $7.1$12.2 million, or 0.2% of total loans outstanding (including deferred loan origination costs) at that date.
Loans to Insiders
Refer to Note 6, “Loans and Leases” within Notes to Consolidated Financial Statements for information regarding loans to insiders.
Loan Maturities and Repricing
The following table shows the contractual maturity and repricing dates of the Company's loans atas of December 31, 2013.2015. The table does not include projected prepayments or scheduled principal amortization.
| | | | Amount due at December 31, 2013 | Amount due at December 31, 2015 |
| | Within One Year | | More than One Year to Three Years | | More than Three Years to Five Years | | More than Five Years to Ten Years | | More than Ten Years | | Total after One Year | | Total | Within One Year | | More than One Year to Three Years | | More than Three Years to Five Years | | More than Five Years to Fifteen Years | | More than Fifteen Years | | Total after One Year | | Total |
| | (In Thousands) | (In Thousands) |
| Commercial real estate mortgage | $ | 252,448 |
| | $ | 311,778 |
| | $ | 611,132 |
| | $ | 269,740 |
| | $ | 16,887 |
| | $ | 1,209,537 |
| | $ | 1,461,985 |
| |
| Commercial real estate | | $ | 540,646 |
| | $ | 520,253 |
| | $ | 637,176 |
| | $ | 172,909 |
| | $ | 4,608 |
| | $ | 1,334,946 |
| | $ | 1,875,592 |
|
| Multi-family mortgage | 185,139 |
| | 123,404 |
| | 223,228 |
| | 87,068 |
| | 9,094 |
| | 442,794 |
| | 627,933 |
| 225,190 |
| | 198,207 |
| | 178,979 |
| | 54,528 |
| | 1,576 |
| | 433,290 |
| | 658,480 |
|
| Construction | 55,439 |
| | 20,119 |
| | 8,984 |
| | 27,734 |
| | 1,429 |
| | 58,266 |
| | 113,705 |
| 93,165 |
| | 28,281 |
| | 4,871 |
| | 4,005 |
| | — |
| | 37,157 |
| | 130,322 |
|
| Commercial | 182,259 |
| | 57,079 |
| | 91,535 |
| | 40,413 |
| | 36,506 |
| | 225,533 |
| | 407,792 |
| 209,289 |
| | 100,904 |
| | 124,785 |
| | 92,772 |
| | 64,781 |
| | 383,242 |
| | 592,531 |
|
| Equipment financing | 62,728 |
| | 109,817 |
| | 237,390 |
| | 103,089 |
| | — |
| | 450,296 |
| | 513,024 |
| 94,057 |
| | 160,157 |
| | 328,341 |
| | 139,335 |
| | — |
| | 627,833 |
| | 721,890 |
|
| Condominium association | 8,932 |
| | 6,369 |
| | 11,150 |
| | 16,102 |
| | 2,241 |
| | 35,862 |
| | 44,794 |
| 5,869 |
| | 8,517 |
| | 20,376 |
| | 25,113 |
| | — |
| | 54,006 |
| | 59,875 |
|
| Indirect automobile | 9,292 |
| | 107,845 |
| | 231,317 |
| | 52,077 |
| | — |
| | 391,239 |
| | 400,531 |
| 910 |
| | 6,843 |
| | 5,882 |
| | 43 |
| | — |
| | 12,768 |
| | 13,678 |
|
| Residential mortgage | 132,199 |
| | 78,560 |
| | 190,621 |
| | 86,522 |
| | 40,283 |
| | 395,986 |
| | 528,185 |
| 148,059 |
| | 138,814 |
| | 180,884 |
| | 99,930 |
| | 48,762 |
| | 468,390 |
| | 616,449 |
|
| Home equity | 92,935 |
| | 1,364 |
| | 4,404 |
| | 86,026 |
| | 72,732 |
| | 164,526 |
| | 257,461 |
| 185,043 |
| | 1,982 |
| | 3,778 |
| | 68,032 |
| | 55,718 |
| | 129,510 |
| | 314,553 |
|
| Other consumer | 3,929 |
| | 384 |
| | 108 |
| | — |
| | 2,634 |
| | 3,126 |
| | 7,055 |
| 5,935 |
| | 380 |
| | 40 |
| | — |
| | 5,815 |
| | 6,235 |
| | 12,170 |
|
| Total | $ | 985,300 |
| | $ | 816,719 |
| | $ | 1,609,869 |
| | $ | 768,771 |
| | $ | 181,806 |
| | $ | 3,377,165 |
| | $ | 4,362,465 |
| $ | 1,508,163 |
| | $ | 1,164,338 |
| | $ | 1,485,112 |
| | $ | 656,667 |
| | $ | 181,260 |
| | $ | 3,487,377 |
| | $ | 4,995,540 |
|
The following table sets forth atas of December 31, 20132015 the dollar amount of loans contractually due or scheduled to reprice after one year and whether such loans have fixed interest rates or adjustable interest rates.
| | | | Due after One Year | Due after One Year |
| | Fixed | | Adjustable | | Total | Fixed | | Adjustable | | Total |
| | (In Thousands) | (In Thousands) |
| Originated: | | | | | | | | | | |
| Commercial real estate mortgage | $ | 289,315 |
| | $ | 648,583 |
| | $ | 937,898 |
| |
| Commercial real estate | | $ | 319,238 |
| | $ | 889,551 |
| | $ | 1,208,789 |
|
| Multi-family mortgage | 60,748 |
| | 327,122 |
| | 387,870 |
| 78,352 |
| | 334,592 |
| | 412,944 |
|
| Construction | 17,192 |
| | 39,322 |
| | 56,514 |
| 9,548 |
| | 27,379 |
| | 36,927 |
|
| Commercial | 103,904 |
| | 66,829 |
| | 170,733 |
| 207,081 |
| | 163,907 |
| | 370,988 |
|
| Equipment financing | 15,835 |
| | 20,027 |
| | 35,862 |
| 535,185 |
| | 84,879 |
| | 620,064 |
|
| Condominium association | 380,441 |
| | 45,953 |
| | 426,394 |
| 22,533 |
| | 31,473 |
| | 54,006 |
|
| Indirect automobile | 391,239 |
| | — |
| | 391,239 |
| 12,768 |
| | — |
| | 12,768 |
|
| Residential mortgage | 35,312 |
| | 298,046 |
| | 333,358 |
| 48,197 |
| | 369,470 |
| | 417,667 |
|
| Home equity | 19,098 |
| | 16,257 |
| | 35,355 |
| 26,310 |
| | 21,232 |
| | 47,542 |
|
| Other consumer | 513 |
| | 2,561 |
| | 3,074 |
| 471 |
| | 5,761 |
| | 6,232 |
|
| Total | $ | 1,313,597 |
| | $ | 1,464,700 |
| | $ | 2,778,297 |
| |
| Total originated | | $ | 1,259,683 |
| | $ | 1,928,244 |
| | $ | 3,187,927 |
|
| Acquired: | | | | | | | | | | |
| Commercial real estate mortgage | $ | 95,362 |
| | $ | 176,277 |
| | $ | 271,639 |
| |
| Commercial real estate | | $ | 43,088 |
| | $ | 83,068 |
| | $ | 126,156 |
|
| Multi-family mortgage | 16,106 |
| | 38,818 |
| | 54,924 |
| 11,162 |
| | 9,184 |
| | 20,346 |
|
| Construction | 1,123 |
| | 629 |
| | 1,752 |
| — |
| | 230 |
| | 230 |
|
| Commercial | 20,378 |
| | 34,422 |
| | 54,800 |
| 6,197 |
| | 6,058 |
| | 12,255 |
|
| Equipment financing | 23,902 |
| | — |
| | 23,902 |
| 7,768 |
| | — |
| | 7,768 |
|
| Residential mortgage | 39,043 |
| | 23,585 |
| | 62,628 |
| 29,915 |
| | 20,808 |
| | 50,723 |
|
| Home equity | 58,219 |
| | 70,952 |
| | 129,171 |
| 37,465 |
| | 44,504 |
| | 81,969 |
|
| Other consumer | 52 |
| | — |
| | 52 |
| 3 |
| | — |
| | 3 |
|
| Total | $ | 254,185 |
| | $ | 344,683 |
| | $ | 598,868 |
| |
| Total acquired | | $ | 135,598 |
| | $ | 163,852 |
| | $ | 299,450 |
|
| | | | | | | |
| Total loans | | $ | 1,395,281 |
| | $ | 2,092,096 |
| | $ | 3,487,377 |
|
Asset Quality
Criticized and Classified Assets
The Company's managementManagement rates certain loans and leases as "other assets as "special mention,especially mentioned ("OAEM")", "substandard" or "doubtful" based on criteria established under banking regulations. (ReferRefer to Note 7, "Allowance for Loan and Lease Losses," to the consolidated financial statements for more information on the Company's risk rating system.) These loans and leases are collectively referred to as "criticized" assets. Loans and leases rated as special mentionOAEM have potential weaknesses that deserve management'sManagement's close attention. If left uncorrected, these potential weaknesses may result in deterioration of the repayment prospects of the loan or lease at some future date. Loans and leases rated as substandard are inadequately protected by the payment capacity of the obligor or of the collateral pledged, if any. Substandard loans and leases have a well-defined weakness or weaknesses that jeopardize the liquidation of debt and are characterized by the distinct possibility that the Company will sustain some loss if existing deficiencies are not corrected. AtLoans and leases rated as doubtful have well-defined weaknesses that jeopardize the orderly liquidation of debt and partial loss of principal is likely. As of December 31, 2013,2015, the Company had $57.5$49.0 million of total assets, including acquired assets, that were designated as criticized. This compares to $58.6 million and $47.7$71.4 million of assets that were designated as criticized atas of December 31, 2012 and 2011, respectively.2014.
Nonperforming Assets
"Nonperforming assets" consist of nonperforming loans and leases, other real estate owned ("OREO") and other repossessed assets. Under certain circumstances, the Company may restructure the terms of a loan or lease as a concession to a borrower, except for acquired loans and leases which are individually evaluated against expected performance on the date of acquisition. These restructured loans and leases are generally considered "nonperforming loans and leases" until a history of collection of at least six months on the restructured terms of the loan or lease has been established. OREO consists of real estate acquired through foreclosure proceedings and real estate acquired through acceptance of a deed in lieu of foreclosure. Other repossessed assets consist of assets that have been acquired through foreclosure that are not real estate.estate and are included in other assets on the Company's consolidated balance sheets.
Accrual of interest on loans generally is discontinued when contractual payment of principal or interest becomes past due 90 days or, if in management'sManagement's judgment, reasonable doubt exists as to the full timely collection of interest. Exceptions may be made if the loan has matured and is in the process of renewal or is well-secured and in the process of collection. When a loan is placed on nonaccrual status, interest accruals cease and uncollected accrued interest is reversed and charged against current interest income. Interest payments on nonaccrual loans are generally applied to principal. If collection of the principal is reasonably assured, interest payments are recognized as income on the cash basis. Loans are generally returned to accrual status when principal and interest payments are current, full collectability of principal and interest is reasonably assured and a consistent record of performance, of at least 6six months of performance has been achieved.
In cases where a borrower experiences financial difficulties and the Company makes certain concessionary modifications to contractual terms, the loan is classified as a troubled debt restructured loan. In determining whether a debtor is experiencing financial difficulties, the Company considers, among other factors, if the debtor is in payment default or is likely to be in payment default in the foreseeable future without the modification, the debtor declared or is in the process of declaring bankruptcy, there is substantial doubt that the debtor will continue as a going concern, the debtor's entity-specific projected cash flows will not be sufficient to service its debt, or the debtor cannot obtain funds from sources other than the existing creditors at market terms for debt with similar risk characteristics.
AtAs of December 31, 2013, the Company had loans and leases (including deferred origination costs) greater than 90 days past due and accruing of $10.9 million, or 0.25% of total loans and leases, compared to $16.6 million, or 0.40% of total loans and leases at December 31, 2012, representing a decrease of $5.7 million, or 0.15% of total loans and leases. The decrease was related primarily to the resolution of several delinquent loans during the year ended December 31, 2013.
At December 31, 2013,2015, the Company had nonperforming assets (including deferred origination costs) of $18.1$20.7 million, representing 0.34% of total assets, compared to nonperforming assets of $23.7$15.2 million, or 0.46%0.26% of total assets, atas of December 31, 2012, representing an decrease of $5.7 million, or 0.12% of total assets. This decrease is due to the resolution of several nonaccrual loans during the year ended December 31, 2013.2014.
The Company evaluates the underlying collateral of each nonperforming loan and lease and continues to pursue the collection of interest and principal. Management believes that the current level of nonperforming assets remains manageable relative to the size of the Company's loan and lease portfolio. If economic conditions were to worsen or if the marketplace were to experience prolonged economic stress, managementManagement believes it is likely that the level of nonperforming assets would increase, as would the level of charged-off loans.
Past Due and Accruing
Accrual of interest on loans generally is discontinued when contractual payment of principal or interest becomes past due 90 days or, if in Management's judgment, reasonable doubt exists as to the full timely collection of interest. Exceptions may be made if the loan has matured and is in the process of renewal or is well-secured and in the process of collection. When a loan is placed on nonaccrual status, interest accruals cease and uncollected accrued interest is reversed and charged against current interest income. Interest payments on nonaccrual loans are generally applied to principal. If collection of the principal is reasonably assured, interest payments are recognized as income on the cash basis. Loans are generally returned to accrual status
when principal and interest payments are current, full collectability of principal and interest is reasonably assured and a consistent record of at least six consecutive months of performance has been achieved.
As of December 31, 2015, the Company had loans and leases greater than 90 days past due and accruing of $8.7 million, or 0.17% of total loans and leases, compared to $6.0 million, or 0.12% of total loans and leases, as of December 31, 2014, representing an increase of $2.7 million. The increase was related primarily to one loan which was over 90 days past due and accruing with an outstanding balance of $2.8 million as of December 31, 2015.
The following table sets forth information regarding nonperforming assets as of the dates indicated:
| | | | At December 31, | At December 31, |
| | 2013 | | 2012 | | 2011 | | 2010 | | 2009 | 2015 | | 2014 | | 2013 | | 2012 | | 2011 |
| | (Dollars in Thousands) | (Dollars in Thousands) |
| Nonperforming loans and leases: | | | | | | | | | | | | | | | | | | |
| Nonaccrual loans and leases: | | | | | | | | | | | | | | | | | | |
| Commercial real estate mortgage | $ | 1,098 |
| | $ | 4,014 |
| | $ | 1,608 |
| | $ | — |
| | $ | 2,000 |
| |
| Commercial real estate | | $ | 5,482 |
| | $ | 1,009 |
| | $ | 1,098 |
| | $ | 4,014 |
| | $ | 1,608 |
|
| Multi-family mortgage | — |
| | 4,233 |
| | 1,380 |
| | 964 |
| | 935 |
| 291 |
| | — |
| | — |
| | 4,233 |
| | 1,380 |
|
| Construction | — |
| | — |
| | 352 |
| | 2,475 |
| | — |
| — |
| | — |
| | — |
| | — |
| | 352 |
|
| Total commercial real estate loans | | 5,773 |
| | 1,009 |
| | 1,098 |
| | 8,247 |
| | 3,340 |
|
| | | | | | | | | | | |
| Commercial | 6,148 |
| | 5,454 |
| | 5 |
| | — |
| | — |
| 6,264 |
| | 5,196 |
| | 6,148 |
| | 5,454 |
| | 5 |
|
| Equipment financing | 4,115 |
| | 3,873 |
| | 1,925 |
| | 2,478 |
| | 1,915 |
| 2,610 |
| | 3,223 |
| | 4,115 |
| | 3,873 |
| | 1,925 |
|
| Condominium association | 1 |
| | 8 |
| | 15 |
| | — |
| | — |
| — |
| | — |
| | 1 |
| | 8 |
| | 15 |
|
| Total commercial loans and leases | | 8,874 |
| | 8,419 |
| | 10,264 |
| | 9,335 |
| | 1,945 |
|
| | | | | | | | | | | |
| Indirect automobile | 259 |
| | 99 |
| | 111 |
| | 158 |
| | 187 |
| 675 |
| | 645 |
| | 259 |
| | 99 |
| | 111 |
|
| | | | | | | | | | | |
| Residential mortgage | 2,875 |
| | 3,804 |
| | 1,979 |
| | 1,363 |
| | 789 |
| 2,225 |
| | 1,682 |
| | 2,875 |
| | 3,804 |
| | 1,979 |
|
| Home equity | 1,987 |
| | 716 |
| | 145 |
| | 25 |
| | 407 |
| 1,757 |
| | 1,918 |
| | 1,987 |
| | 716 |
| | 145 |
|
| Other consumer | 18 |
| | 45 |
| | 10 |
| | — |
| | — |
| 29 |
| | 41 |
| | 18 |
| | 45 |
| | 10 |
|
| Total consumer loans | | 4,011 |
| | 3,641 |
| | 4,880 |
| | 4,565 |
| | 2,134 |
|
| | | | | | | | | | | |
| Total nonaccrual loans and leases | 16,501 |
| | 22,246 |
| | 7,530 |
| | 7,463 |
| | 6,233 |
| 19,333 |
| | 13,714 |
| | 16,501 |
| | 22,246 |
| | 7,530 |
|
| | | | | | | | | | | |
| Other real estate owned | 577 |
| | 903 |
| | 845 |
| | — |
| | — |
| 729 |
| | 953 |
| | 577 |
| | 903 |
| | 845 |
|
| Other repossessed assets | 1,001 |
| | 588 |
| | 421 |
| | 703 |
| | 1,430 |
| 614 |
| | 503 |
| | 1,001 |
| | 588 |
| | 421 |
|
| Total nonperforming assets | $ | 18,079 |
| | $ | 23,737 |
| | $ | 8,796 |
| | $ | 8,166 |
| | $ | 7,663 |
| $ | 20,676 |
| | $ | 15,170 |
| | $ | 18,079 |
| | $ | 23,737 |
| | $ | 8,796 |
|
| | | | | | | | | | | |
| Loans and leases past due greater than 90 days and accruing | $ | 10,913 |
| | $ | 16,637 |
| | $ | 4,769 |
| | $ | 5,902 |
| | $ | 8,673 |
| $ | 8,690 |
| | $ | 6,008 |
| | $ | 10,913 |
| | $ | 17,581 |
| | $ | 4,769 |
|
| Total delinquent loans and leases 61-90 days past due | 5,882 |
| | 4,536 |
| | 1,070 |
| | 1,535 |
| | 1,682 |
| |
| Restructured loans and leases not included in nonperforming assets | 12,759 |
| | 7,191 |
| | 5,205 |
| | 4,946 |
| | 3,898 |
| |
| | | | | | | | | | | |
| Total nonperforming loans and leases as a percentage of total loans and leases | 0.38 | % | | 0.53 | % | | 0.28 | % | | 0.33 | % | | 0.29 | % | 0.39 | % | | 0.28 | % | | 0.38 | % | | 0.53 | % | | 0.28 | % |
| Total nonperforming assets as a percentage of total assets | 0.34 | % | | 0.46 | % | | 0.27 | % | | 0.30 | % | | 0.29 | % | 0.34 | % | | 0.26 | % | | 0.34 | % | | 0.46 | % | | 0.27 | % |
| Total delinquent loans and leases 61-90 days past due as a percentage of total loans and leases | 0.13 | % | | 0.11 | % | | 0.04 | % | | 0.07 | % | | 0.08 | % | |
The $2.9 million decrease in commercial real estate mortgage loans on nonaccrual fromTroubled Debt Restructured Loans and Leases
As of December 31, 2012 to December 31, 2013 is the result of a large payoff during the year. The $4.2 million decrease in multi-family mortgage loans on nonaccrual from December 31, 2012 to December 31, 2013 was driven by the resolution of several nonaccrual loans during the year ended December 31, 2013.
The $0.7 million increase in commercial loans on nonaccrual from December 31, 2012 to December 31, 2013 is in large part the result of growth in commercial loans portfolio of $118.2 million. The $0.2 million increase in equipment financing nonaccrual loans and leases from December 31, 2012 to December 31, 2013 is largely a result of the 32.5% increase in originated balances in the equipment financing portfolio for the same period.
The decrease in non-accruing residential mortgages of $0.9 million from December 31, 2012 to December 31, 2013 was largely driven by the resolution of several residential mortgage loans throughout 2013. Nonaccrual home equity loans increased by $1.3 million at December 31, 2013 compared to 2012. This increase is in large part due to a large home equity loan going on nonaccrual in the fourth quarter of 2013.
At December 31, 2013,2015, restructured loans included $5.9$5.6 million of commercial real estate mortgage loans, $0.9 million of multi-family mortgage loans, $6.3$10.6 million of commercial loans, $2.5$2.3 million of equipment financing loans and leases, $2.5$2.0 million of residential mortgage loans and $0.3$1.5 million of home equity loans. AtAs of December 31, 2012,2014, restructured loans included $6.7$8.9 million of commercial real estate mortgage loans, $0.9 million of multi-family mortgage loans, $3.3$8.4 million of commercial loans, $3.8 million of equipment financing loans and $4.0 million of residential mortgage loans. A restructured
$2.7 million of equipment financing loans and leases, $2.7 million of residential mortgage loans and $0.9 million of home equity loans. A restructured loan is a loan for which where the maturity date was extended, the principal was reduced, and/or the interest rate was modified to drop the required monthly payment to a more manageable amount for the borrower.
Repossessed vehiclesThe following table sets forth information regarding troubled debt restructured loans and equipment totaled $1.0 millionleases at the dates indicated:
|
| | | | | | | |
| | At December 31, 2015 | | At December 31, 2014 |
| | (Dollars in Thousands) |
| Troubled debt restructurings: | |
| | |
|
| On accrual | $ | 17,953 |
| | $ | 14,815 |
|
| On nonaccrual | 4,965 |
| | 5,625 |
|
| Total troubled debt restructurings | $ | 22,918 |
| | $ | 20,440 |
|
Changes in troubled debt restructured loans and $0.6 million at December 31, 2013leases were as follows for the periods indicated:
|
| | | | | | | |
| | Year ended December 31, |
| | 2015 | | 2014 |
| | (Dollars in Thousands) |
| Balance at beginning of period | $ | 20,440 |
| | $ | 18,348 |
|
| Additions | 6,873 |
| | 8,657 |
|
| Net charge-offs (recoveries) | (135 | ) | | (391 | ) |
| Repayments | (4,260 | ) | | (195 | ) |
Other reductions (1) | — |
| | (5,979 | ) |
| Balance at end of period | $ | 22,918 |
| | $ | 20,440 |
|
(1) Other reductions include transfers to OREO and 2012, respectively.change in troubled debt restructuring status.
Allowances for Credit Losses
Allowance for Loan and Lease Losses
The allowance for loan and lease losses consists of general specific and unallocatedspecific allowances and reflects management'sManagement's estimate of probable loan and lease losses inherent in the loan portfolio at the balance sheet date. Management uses a consistent and systematic process and methodology to evaluate the adequacy of the allowance for loan and lease losses on a quarterly basis. The allowance is calculated by loan type: commercial real estate loans, commercial loans and leases, indirect automobile loans and consumer loans, each category of which is further segregated. A formula-based credit evaluation approach is applied to each group that is evaluated collectively, primarily by loss factors, which includes estimates of incurred losses over an estimated LEP, assigned to each risk rating by type, coupled with an analysis of certain loans individually evaluated for impairment. Management continuously evaluates and challenges inputs and assumptions in the allowance for loan and lease loss.
The process to determine the allowance for loan and lease losses requires managementManagement to exercise considerable judgment regarding the risk characteristics of the loan portfolios and the effect of relevant internal and external factors. While managementManagement evaluates currently available information in establishing the allowance for loan and lease losses, future adjustments to the allowance for loan and lease losses may be necessary if conditions differ substantially from the assumptions used in making the evaluations. Management performs a comprehensive review of the allowance for loan and lease losses on a quarterly basis. In addition, various regulatory agencies, as an integral part of their examination process, periodically review a financial institution's allowance for loan and lease losses and carrying amounts of other real estate owned. Such agencies may require the financial institution to recognize additions to the allowance based on their judgments about information available to them at the time of their examination. See Note 1, "Basis of Presentation," and Note 7, "Allowance for Loan and Lease Losses," to the consolidated financial statements for descriptions of how managementManagement determines the balance of the allowance for loan and lease losses for each portfolio and class of loans.
During the third quarter of 2015, the Company enhanced and refined its general allowance methodology to provide further quantification of probable losses in the portfolio. Under the enhanced methodology, Management combined the historical loss histories of the Banks to generate a single set of ratios. Management believes it is appropriate to aggregate the ratios as the Banks share common environmental factors, operate in similar geographic markets, and utilize common underwriting standards in accordance with the Company's Credit Policy. In prior periods, a historical loss history applicable to each Bank was used.
Management employed a similar analysis for the consolidation of the qualitative factors as it did for the quantitative factors. Again, Management believes the combination of the existing nine qualitative factors used at each of the Banks into a single group of nine factors used across the Company is appropriate based on the commonality of environmental factors, markets and underwriting standards among the Banks. In prior periods each of the Banks utilized a set of qualitative factors applicable to each Bank.
The Company’s December 31, 2015 allowance calculation included a further segmentation of the commercial loans and leases to reflect the increased risk in the Company’s taxi medallion portfolio. As of December 31, 2015, this portfolio is approximately $35.8 million. Based on industry conditions, Management established a specific loss factor for this portfolio that best represents the changing risks associated with it.
Based on the refinements to the Company’s allowance methodology discussed above, Management determined that the potential risks anticipated by the unallocated allowance are now incorporated into the qualitative and quantitative components, making the unallocated allowance unnecessary. In prior years, the unallocated allowance was used to recognize the estimated risk associated with the allocated general and specific allowances. It incorporated Management’s evaluation of existing conditions that were not included in the allocated allowance determinations and provided for losses that arise outside of the ordinary course of business.
The following tables present the changes in the allowance for loan and lease losses by portfolio category for the years ended December 31, 2015, 2014, 2013, 2012, 2011, 2010, and 2009,2011, respectively.
| | | | Year Ended December 31, 2013 | Year Ended December 31, 2015 |
| | Commercial Real Estate | | Commercial | | Indirect Automobile | | Consumer | | Unallocated | | Total | Commercial Real Estate | | Commercial | | Indirect Automobile | | Consumer | | Unallocated | | Total |
| | (In Thousands) | (In Thousands) |
| Balance at December 31, 2012 | $ | 20,018 |
| | $ | 10,655 |
| | $ | 5,304 |
| | $ | 2,545 |
| | $ | 2,630 |
| | $ | 41,152 |
| |
| Balance at December 31, 2014 | | $ | 29,594 |
| | $ | 15,957 |
| | $ | 2,331 |
| | $ | 3,359 |
| | $ | 2,418 |
| | $ | 53,659 |
|
| Charge-offs | (88 | ) | | (2,077 | ) | | (1,714 | ) | | (909 | ) | | — |
| | (4,788 | ) | (550 | ) | | (3,634 | ) | | (1,788 | ) | | (582 | ) | | — |
| | (6,554 | ) |
| Recoveries | 13 |
| | 657 |
| | 501 |
| | 263 |
| | — |
| | 1,434 |
| — |
| | 667 |
| | 1,442 |
| | 102 |
| | — |
| | 2,211 |
|
| Provision (credit) for loan and lease losses | 3,079 |
| | 5,985 |
| | (167 | ) | | 1,476 |
| | 302 |
| | 10,675 |
| 1,107 |
| | 9,028 |
| | (1,716 | ) | | 1,422 |
| | (2,418 | ) | | 7,423 |
|
| Balance at December 31, 2013 | $ | 23,022 |
| | $ | 15,220 |
| | $ | 3,924 |
| | $ | 3,375 |
| | $ | 2,932 |
| | $ | 48,473 |
| |
| Balance at December 31, 2015 | | $ | 30,151 |
| | $ | 22,018 |
| | $ | 269 |
| | $ | 4,301 |
| | $ | — |
| | $ | 56,739 |
|
| | | | | | | | | | | | | |
| Total loans and leases | $ | 2,203,623 |
| | $ | 965,610 |
| | $ | 400,531 |
| | $ | 792,701 |
| | N/A |
| | $ | 4,362,465 |
| $ | 2,664,394 |
| | $ | 1,374,296 |
| | $ | 13,678 |
| | $ | 943,172 |
| | N/A |
| | $ | 4,995,540 |
|
| Total allowance for loan and lease losses as a percentage of total loans and leases | 1.04 | % | | 1.58 | % | | 0.98 | % | | 0.43 | % | | N/A |
| | 1.11 | % | 1.13 | % | | 1.60 | % | | 1.97 | % | | 0.46 | % | | N/A |
| | 1.14 | % |
|
| | | | | | | | | | | | | | | | | | | | | | | |
| | Year Ended December 31, 2014 |
| | Commercial Real Estate | | Commercial | | Indirect Automobile | | Consumer | | Unallocated | | Total |
| | (In Thousands) |
| Balance at December 31, 2013 | $ | 23,022 |
| | $ | 15,220 |
| | $ | 3,924 |
| | $ | 3,375 |
| | $ | 2,932 |
| | $ | 48,473 |
|
| Charge-offs | (130 | ) | | (2,507 | ) | | (1,163 | ) | | (650 | ) | | — |
| | (4,450 | ) |
| Recoveries | 4 |
| | 801 |
| | 434 |
| | 158 |
| | — |
| | 1,397 |
|
| Provision (credit) for loan and lease losses | 6,698 |
| | 2,443 |
| | (864 | ) | | 476 |
| | (514 | ) | | 8,239 |
|
| Balance at December 31, 2014 | $ | 29,594 |
| | $ | 15,957 |
| | $ | 2,331 |
| | $ | 3,359 |
| | $ | 2,418 |
| | $ | 53,659 |
|
| | | | | | | | | | | | |
| Total loans and leases | $ | 2,467,801 |
| | $ | 1,167,094 |
| | $ | 316,987 |
| | $ | 870,725 |
| | N/A |
| | $ | 4,822,607 |
|
| Total allowance for loan and lease losses as a percentage of total loans and leases | 1.20 | % | | 1.37 | % | | 0.74 | % | | 0.39 | % | | N/A |
| | 1.11 | % |
| | | | Year Ended December 31, 2012 | Year Ended December 31, 2013 |
| | Commercial Real Estate | | Commercial | | Indirect Automobile | | Consumer | | Unallocated | | Total | Commercial Real Estate | | Commercial | | Indirect Automobile | | Consumer | | Unallocated | | Total |
| | (In Thousands) | (In Thousands) |
| Balance at December 31, 2011 | $ | 15,477 |
| | $ | 5,997 |
| | $ | 5,604 |
| | $ | 1,577 |
| | $ | 3,048 |
| | $ | 31,703 |
| |
| Balance at December 31, 2012 | | $ | 20,018 |
| | $ | 10,655 |
| | $ | 5,304 |
| | $ | 2,545 |
| | $ | 2,630 |
| | $ | 41,152 |
|
| Charge-offs | — |
| | (5,347 | ) | | (2,153 | ) | | (592 | ) | | — |
| | (8,092 | ) | (88 | ) | | (2,077 | ) | | (1,714 | ) | | (909 | ) | | — |
| | (4,788 | ) |
| Recoveries | 118 |
| | 417 |
| | 969 |
| | 26 |
| | — |
| | 1,530 |
| 13 |
| | 657 |
| | 501 |
| | 263 |
| | — |
| | 1,434 |
|
| Provision (credit) for loan and lease losses | 4,423 |
| | 9,588 |
| | 884 |
| | 1,534 |
| | (418 | ) | | 16,011 |
| 3,079 |
| | 5,985 |
| | (167 | ) | | 1,476 |
| | 302 |
| | 10,675 |
|
| Balance at December 31, 2012 | $ | 20,018 |
| | $ | 10,655 |
| | $ | 5,304 |
| | $ | 2,545 |
| | $ | 2,630 |
| | $ | 41,152 |
| |
| Balance at December 31, 2013 | | $ | 23,022 |
| | $ | 15,220 |
| | $ | 3,924 |
| | $ | 3,375 |
| | $ | 2,932 |
| | $ | 48,473 |
|
| | | | | | | | | | | | | |
| Total loans and leases | $ | 2,005,963 |
| | $ | 847,455 |
| | $ | 542,344 |
| | $ | 779,950 |
| | N/A |
| | $ | 4,175,712 |
| $ | 2,203,623 |
| | $ | 965,610 |
| | $ | 400,531 |
| | $ | 792,701 |
| | N/A |
| | $ | 4,362,465 |
|
| Total allowance for loan and lease losses as a percentage of total loans and leases | 1.00 | % | | 1.26 | % | | 0.98 | % | | 0.33 | % | | N/A |
| | 0.99 | % | |
| Allowance for loan and lease losses as a percentage of total loans and leases | | 1.04 | % | | 1.58 | % | | 0.98 | % | | 0.43 | % | | N/A |
| | 1.11 | % |
|
| | | | | | | | | | | | | | | | | | | | | | | |
| | Year Ended December 31, 2012 |
| | Commercial Real Estate | | Commercial | | Indirect Automobile | | Consumer | | Unallocated | | Total |
| | (In Thousands) |
| Balance at December 31, 2011 | $ | 15,477 |
| | $ | 5,997 |
| | $ | 5,604 |
| | $ | 1,577 |
| | $ | 3,048 |
| | $ | 31,703 |
|
| Charge-offs | — |
| | (5,347 | ) | | (2,153 | ) | | (592 | ) | | — |
| | (8,092 | ) |
| Recoveries | 118 |
| | 417 |
| | 969 |
| | 26 |
| | — |
| | 1,530 |
|
| Provision (credit) for loan and lease losses | 4,423 |
| | 9,588 |
| | 884 |
| | 1,534 |
| | (418 | ) | | 16,011 |
|
| Balance at December 31, 2012 | $ | 20,018 |
| | $ | 10,655 |
| | $ | 5,304 |
| | $ | 2,545 |
| | $ | 2,630 |
| | $ | 41,152 |
|
| | | | | | | | | | | | |
| Total loans and leases | $ | 2,005,963 |
| | $ | 847,455 |
| | $ | 542,344 |
| | $ | 779,950 |
| | N/A |
| | $ | 4,175,712 |
|
| Allowance for loan and lease losses as a percentage of total loans and leases | 1.00 | % | | 1.26 | % | | 0.98 | % | | 0.33 | % | | N/A |
| | 0.99 | % |
|
| | | | | | | | | | | | | | | | | | | | | | | |
| | Year Ended December 31, 2011 |
| | Commercial Real Estate | | Commercial | | Indirect Automobile | | Consumer | | Unallocated | | Total |
| | (In Thousands) |
| Balance at December 31, 2010 | $ | 12,398 |
| | $ | 5,293 |
| | $ | 6,952 |
| | $ | 1,638 |
| | $ | 3,414 |
| | $ | 29,695 |
|
| Charge-offs | (30 | ) | | (773 | ) | | (2,076 | ) | | (12 | ) | | — |
| | (2,891 | ) |
| Recoveries | — |
| | 330 |
| | 605 |
| | 8 |
| | — |
| | 943 |
|
| Provision (credit) for loan and lease losses | 3,109 |
| | 1,147 |
| | 123 |
| | (57 | ) | | (366 | ) | | 3,956 |
|
| Balance at December 31, 2011 | $ | 15,477 |
| | $ | 5,997 |
| | $ | 5,604 |
| | $ | 1,577 |
| | $ | 3,048 |
| | $ | 31,703 |
|
| | | | | | | | | | | | |
| Total loans and leases | $ | 1,270,993 |
| | $ | 443,966 |
| | $ | 573,350 |
| | $ | 432,512 |
| | N/A |
| | $ | 2,720,821 |
|
| Allowance for loan and lease losses as a percentage of total loans and leases | 1.22 | % | | 1.35 | % | | 0.98 | % | | 0.36 | % | | N/A |
| | 1.17 | % |
|
| | | | | | | | | | | | | | | | | | | | | | | |
| | Year Ended December 31, 2010 |
| | Commercial Real Estate | | Commercial | | Indirect Automobile | | Consumer | | Unallocated | | Total |
| | (In Thousands) |
| Balance at December 31, 2009 | $ | 12,447 |
| | $ | 4,853 |
| | $ | 8,479 |
| | $ | 1,675 |
| | $ | 3,629 |
| | $ | 31,083 |
|
| Charge-offs | (1,100 | ) | | (1,182 | ) | | (3,818 | ) | | (161 | ) | | — |
| | (6,261 | ) |
| Recoveries | 5 |
| | 202 |
| | 840 |
| | 30 |
| | — |
| | 1,077 |
|
| Provision (credit) for loan and lease losses | 1,046 |
| | 1,420 |
| | 1,451 |
| | 94 |
| | (215 | ) | | 3,796 |
|
| Balance at December 31, 2010 | $ | 12,398 |
| | $ | 5,293 |
| | $ | 6,952 |
| | $ | 1,638 |
| | $ | 3,414 |
| | $ | 29,695 |
|
| Total loans and leases | $ | 1,003,802 |
| | $ | 344,228 |
| | $ | 553,689 |
| | $ | 351,819 |
| | N/A |
| | $ | 2,253,538 |
|
| Allowance for loan and lease losses as a percentage of total loans and leases | 1.24 | % | | 1.54 | % | | 1.26 | % | | 0.47 | % | | N/A |
| | 1.32 | % |
|
| | | | | | | | | | | | | | | | | | | | | | | |
| | Year Ended December 31, 2009 |
| | Commercial Real Estate | | Commercial | | Indirect Automobile | | Consumer | | Unallocated | | Total |
| | (In Thousands) |
| Balance at December 31, 2008 | $ | 11,052 |
| | $ | 4,222 |
| | $ | 7,937 |
| | $ | 1,546 |
| | $ | 3,539 |
| | $ | 28,296 |
|
| Charge-offs | (318 | ) | | (1,177 | ) | | (6,529 | ) | | (15 | ) | | — |
| | (8,039 | ) |
| Recoveries | 4 |
| | 113 |
| | 821 |
| | 8 |
| | — |
| | 946 |
|
| Provision (credit) for loan and lease losses | 1,709 |
| | 1,695 |
| | 6,250 |
| | 136 |
| | 90 |
| | 9,880 |
|
| Balance at December 31, 2009 | $ | 12,447 |
| | $ | 4,853 |
| | $ | 8,479 |
| | $ | 1,675 |
| | $ | 3,629 |
| | $ | 31,083 |
|
| Total loans and leases | $ | 918,368 |
| | $ | 297,941 |
| | $ | 553,963 |
| | $ | 394,023 |
| | N/A |
| | $ | 2,164,295 |
|
| Allowance for loan and lease losses as a percentage of total loans and leases | 1.36 | % | | 1.63 | % | | 1.53 | % | | 0.43 | % | | N/A |
| | 1.44 | % |
The allowance for loan and lease losses for the entire portfolio was $48.5$56.7 million atas of December 31, 2013,2015, or 1.11%1.14% of total loans and leases outstanding. This compared to an allowance for loan and lease losses of $41.2$53.7 million, or 0.98%1.11% of total loans and leases outstanding, atas of December 31, 2012.2014. The increase in the allowance for loan and lease losses and in the allowance for loan and lease losses as a percentage of total loans and leases from December 31, 2014 to December 31, 2015 is largelydue to loan growth of $172.9 million during the year, a resultspecific reserve recorded for a commercial relationship which was downgraded in the first
quarter, and an increase in reserves for taxi medallion loans, which were partially offset by the release of reserves related to the sale of the additional allowance relating toindirect automobile portfolio during the first quarter and a reduction of the reserves for the acquired loan portfolio.portfolios.
Management believes that the allowance for loan and lease losses as of December 31, 20132015 is appropriate based on the facts and circumstances discussed further below.
Commercial Real Estate Loans
The allowance for commercial real estate loan losses was $23.0$30.2 million, or 1.04%1.13% of total commercial real estate loans outstanding, atas of December 31, 2013.2015. This compared to an allowance for commercial real estate loan losses of $20.0$29.6 million, or 1.00%1.20% of total commercial real estate loans outstanding, atas of December 31, 2012.
2014. Specific reserves on commercial real estate loans were $2.3 million and $0.1 million as of December 31, 2015 and December 31, 2014, respectively. The $3.0$0.6 million increase in the allowance for commercial real estate loansloan losses during 20132015 was primarily driven by originated loan growth of $310.8$287.2 million, or 21.3% over13.4% from December 31, 2014 and the same period. Management adjusteddeterioration of one relationship in the loss factorscommercial real estate loan portfolio during 2013, slightly reducing the loss factors based on stable assetfirst quarter of 2015, partially offset by the improved credit quality trends. of other commercial real estate loans.
The ratio of total criticized originatedand classified commercial real estate loans to total originated commercial real estate loans (including deferred origination costs) increaseddecreased to 0.74% at1.03% as of December 31, 20132015 from 0.60% at1.81% as of December 31, 2012.2014. The ratio of originated commercial real estate loans on nonaccrual to total originated commercial real estate loans (including deferred origination costs) decreasedincreased to 0.01% at0.13% as of December 31, 20132015 from 0.24% at0.05% as of December 31, 2012.2014.
The primary contributorNet charge-offs was $0.6 million, or 0.02% of the $3.0 million increase in the allowance foraverage commercial real estate loans, and leases in 2013 is loan growth of $310.8 million or 21.3% over the same period. Also contributing to the $3.0 million increase in the allowance is reserve on the acquired portfolio of $0.5 million due to deterioration in the acquired loan portfolio.
Net charge-offs/recoveries in 2013 increased slightly compared to prior periods. Net charge-offs totaled $0.1 million for the year ended December 31, 2013, compared with $0.1 million in2015. As a percentage of average commercial real estate loans, net recoveriescharge-offs for the year ended December 31, 2012.2014 was negligible. Provisions for commercial real estate loans recorded in these periods more than adequately covered charge-offs during those periods. See the "Results of Operations—Provision for Credit Losses" section below for additional information.
Commercial Loans and Leases
The allowance for commercial loan and lease losses was $15.2$22.0 million, or 1.58%1.60% of total commercial loans and leases outstanding, atas of December 31, 2013,2015, compared to $10.7$16.0 million, or 1.26%1.37% of total commercial loans and leases outstanding, atas of December 31, 2012.
2014. Specific reserves on commercial loans and leases increased from $1.0 million as of December 31, 2014 to $1.3 million as of December 31, 2015. The $4.6$6.1 million increase in the allowance for commercial loans and lease losses during 20132015 was primarily driven by originated loan growth of $186.4$247.6 million, or 29.1% over22.5%, and the same period. Loss factors were adjusted downwarddeterioration of one relationship in the commercial loans and were supported by improving asset quality trends. leases portfolio during the first quarter of 2015.
The ratio of total originated criticized and classified commercial loans and leases to total originated commercial loans and leases (including deferred origination costs) was 0.98% at1.57% as of December 31, 2013,2015, compared to 1.70% at2.28% as of December 31, 2012.2014. The ratio of originated commercial loans and leases on nonaccrual to total originated commercial loans and leases (including deferred origination costs) decreased to 0.68% at0.46% as of December 31, 20132015 from 0.91% at0.54% as of December 31, 2012. Included in the $4.6 million increase is a reserve on the acquired portfolio of $1.1 million due to deterioration in the acquired loan portfolio. The reserve on loans specifically evaluated for impairment remained constant at $0.8 million.2014.
Net charge-offs decreased $3.5increased $1.3 million to $1.4$3.0 million, or 0.16%0.23% of average commercial loans and leases, for the year ended December 31, 2013,2015, compared with net charge-offs of $4.9$1.7 million, or 0.64%0.16% of average commercial loans and leases, for the year ended December 31, 2012.2014. Provisions for commercial loans recorded in these periods more than adequately covered charge-offs during those periods. See the "Results of Operations—Provision for Credit Losses" section below for additional information.
Indirect Automobile Loans
The allowance for indirect automobile loan losses was $3.9$0.3 million, or 0.98%1.97% of total indirect automobile loans outstanding, atas of December 31, 2013,2015, compared to $5.3$2.3 million, or 0.98%0.74% of the indirect automobile portfolio outstanding, atas of December 31, 2012.
2014. The $2.0 million decrease in the allowance for indirect automobile loan losses was primarily a result of the sale of the majority of the indirect automobile portfolio in the first quarter of 2015. Loans outstanding decreased $141.8$303.3 million, or 26.1%95.7%, to $400.5$13.7 million atas of December 31, 20132015 from $542.3$317.0 million atas of December 31, 2012. 2014. Based on a review of the credit metrics of the remaining indirect automobile portfolio, and a change in the reserve factor, the allowance ratio increased for the remaining portfolio. There were no loans individually evaluated for impairment in the indirect automobile portfolio as of December 31, 2015 and December 31, 2014.
The ratio of indirect automobile loans with borrower credit scores below 660 to the total indirect automobile portfolio (including deferred origination costs) increased slightly to 3.19% at45.5% as of December 31, 20132015 from 3.12% at3.1% as of December 31, 2012. There were no loans individually evaluated for impairment in the2014. The ratio of indirect automobile portfolio atloans on nonaccrual to total indirect automobile loans increased to 4.93% as of December 31, 2013.2015 compared to 0.20% as of December 31, 2014.
Net charge-offs in the indirect automobile portfolio totaled $1.2$0.3 million, or 0.25%0.36% of average indirect automobile loans, for the year ended December 31, 20132015, compared with net charge-offs of 1.2$0.7 million, or 0.21%0.20% of average indirect automobile loans, for the year ended December 31, 2012. These charge-off metrics seem to further corroborate the stability in credit quality within this portfolio.2014. Provisions for indirect automobile loans recorded in these periods more than adequately covered charge-offs during those periods. See the "Results of Operations—Provision for Credit Losses" section below for additional information.
Consumer Loans
The allowance for consumer loan losses, including residential loans and home equity loans and lines of credit, was $3.4$4.3 million, or 0.43%0.46% of total consumer loans outstanding, atas of December 31, 2013,2015, compared to $2.5$3.4 million, or 0.33%0.39% of consumer loans outstanding, atas of December 31, 2012.
2014. There was nominal reserve for loans individually evaluated for impairment as of December 31, 2015 and 2014. The $0.8$0.9 million increase in the allowance for consumer loans during 20132015 was primarily driven by originated loan growth of 15.9%. The ratio of originated residential and home equity loans with loan-to-value ratios greater than 80% decreased to 4.78% of total originated residential and home equity loans (including deferred origination costs) at$109.4 million, or 16.4%, from December 31, 2013 from 7.25% at December 31, 2012. Furthermore the2014. The ratio of originated consumer loans on nonaccrual to total originated consumer loans (including deferred origination costs) trended downwardincreased to 0.40% at0.29% as of December 31, 20132015 from 0.44% at0.23% as of December 31, 2012. Management evaluates several factors in determining whether an impaired2014. The risk of loss on a home equity loan requires a specific reserve, includingis higher since the borrower's ability to serviceproperty securing the loan guarantor supporthas often been previously pledged as collateral for a first mortgage loan. The Company gathers and analyzes delinquency data, to the extent that data are available on these first liens, for purposes of assessing the collectability of the second liens held by the Company even if these home equity loans are not delinquent. This data are further analyzed for performance differences between amortizing and non-amortizing home equity loans, the percentage borrowed to total loan commitment and by the amount of payments made by the borrowers. The loss exposure is not considered to be high due to the combination of current property values, the historically low loan-to-value ratios, the low level of losses experienced in the past few years and the valuelow level of available collateral, and believes these reserve levels are adequate.
Included in the $0.8 million increase in the allowance is a $0.3 million decrease in reserves for loans specifically evaluated for impairment, to $0.3 million on loan balancesdelinquencies as of $4.3 million at December 31, 2013 from $0.6 million on2015. If the local economy weakens, however, a rise in losses in those loan balances of $5.2 million at December 31, 2012. The $0.3 million decreaseclasses could occur. Historically, losses in reserves for loans specifically evaluated for impairment is being offset by a reserve on the acquired consumer loan portfolio of $0.6 million that was recorded during the year ended December 31, 2013.these classes have been low.
Net charge-offs in the consumer loan portfolio totaled $0.6$0.5 million, or 0.08%0.05% of average consumer loans, and leases for the year ended December 31, 2013,2015, compared with net charge-offs of $0.6$0.5 million, or 0.07%0.06% of average consumer loans, and leases for the year ended December 31, 2012. Though credit quality metrics were mixed in the first half of the year, they have returned to more normal levels in recent months.2014.
Unallocated Allowance
The unallocated allowance recognizes the estimation risk associated with the allocated general and specific allowances, incorporates management's evaluation of existing conditions that are not included in the allocated allowance determinations and protects against potential losses outsideAs a result of the ordinary course of business. These conditions are reviewed quarterly by management and include general economic conditions, credit quality trends and internal loan review and regulatory examination findings. Causes of losses outsidechanges to the normal course of business include but are not limited to fraudulently obtained loans where there is no primary or secondary source of repayment; catastrophic and uninsured property loss where collateral is destroyed with no compensation; and legal documentation flaws that compromise security interests in collateral assets ormethodology described above, the availability of guarantors.
Thereserve for unallocated allowance for loan and lease losses was $2.9 million atas of December 31, 2013,2015 was reduced to zero, as compared to $2.6$2.4 million atas of December 31, 2012. The unallocated portion of the allowance for loan and lease losses increased by $0.3 million on a year-to-year basis at December 31, 2013, largely as a result of growth in the originated loan and leases portfolios.2014.
The following tables set forth the Company's percent of allowance for loan and lease losses to the total allowance for loan and lease losses and the percent of loans to total loans (including deferred loan origination costs) for each of the categories listed at the dates indicated.
| | | | At December 31, | At December 31, |
| | 2013 | | 2012 | | 2011 | 2015 | | 2014 | | 2013 |
| | Amount | | Percent of Allowance to Total Allowance | | Percent of Loans in Each Category to Total Loans | | Amount | | Percent of Allowance to Total Allowance | | Percent of Loans in Each Category to Total Loans | | Amount | | Percent of Allowance to Total Allowance | | Percent of Loans in Each Category to Total Loans | Amount | | Percent of Allowance to Total Allowance | | Percent of Loans in Each Category to Total Loans | | Amount | | Percent of Allowance to Total Allowance | | Percent of Loans in Each Category to Total Loans | | Amount | | Percent of Allowance to Total Allowance | | Percent of Loans in Each Category to Total Loans |
| | (Dollars in Thousands) | (Dollars in Thousands) |
| Commercial real estate mortgage | $ | 14,883 |
| | 30.7 | % | | 33.5 | % | | $ | 12,993 |
| | 31.6 | % | | 31.2 | % | | $ | 9,936 |
| | 31.3 | % | | 27.5 | % | |
| Commercial real estate | | $ | 21,100 |
| | 37.3 | % | | 37.5 | % | | $ | 20,858 |
| | 38.9 | % | | 34.8 | % | | $ | 14,883 |
| | 30.7 | % | | 33.5 | % |
| Multi-family mortgage | 4,890 |
| | 10.1 | % | | 14.4 | % | | 4,541 |
| | 11.0 | % | | 14.5 | % | | 4,459 |
| | 14.1 | % | | 17.7 | % | 6,376 |
| | 11.2 | % | | 13.2 | % | | 5,057 |
| | 9.4 | % | | 13.2 | % | | 4,890 |
| | 10.1 | % | | 14.4 | % |
| Construction | 3,249 |
| | 6.7 | % | | 2.6 | % | | 2,484 |
| | 6.0 | % | | 2.4 | % | | 1,082 |
| | 3.4 | % | | 1.5 | % | 2,675 |
| | 4.7 | % | | 2.6 | % | | 3,679 |
| | 6.9 | % | | 3.1 | % | | 3,249 |
| | 6.7 | % | | 2.6 | % |
| Total commercial real estate loans | | 30,151 |
| | 53.2 | % | | 53.3 | % | | 29,594 |
| | 55.2 | % | | 51.1 | % | | 23,022 |
| | 47.5 | % | | 50.5 | % |
| Commercial | 6,724 |
| | 13.9 | % | | 9.3 | % | | 3,870 |
| | 9.4 | % | | 9.2 | % | | 1,505 |
| | 4.8 | % | | 5.5 | % | 12,745 |
| | 22.5 | % | | 11.9 | % | | 7,463 |
| | 13.9 | % | | 10.7 | % | | 6,724 |
| | 13.9 | % | | 9.3 | % |
| Equipment financing | 8,161 |
| | 16.8 | % | | 11.8 | % | | 6,454 |
| | 15.7 | % | | 10.1 | % | | 4,128 |
| | 13.0 | % | | 9.1 | % | 8,809 |
| | 15.5 | % | | 14.5 | % | | 8,112 |
| | 15.1 | % | | 12.5 | % | | 8,161 |
| | 16.8 | % | | 11.8 | % |
| Condominium association | 335 |
| | 0.7 | % | | 1.0 | % | | 331 |
| | 0.8 | % | | 1.1 | % | | 364 |
| | 1.1 | % | | 1.7 | % | 464 |
| | 0.8 | % | | 1.2 | % | | 382 |
| | 0.7 | % | | 1.1 | % | | 335 |
| | 0.7 | % | | 1.0 | % |
| Total commercial loans and leases | | 22,018 |
| | 38.8 | % | | 27.6 | % | | 15,957 |
| | 29.7 | % | | 24.3 | % | | 15,220 |
| | 31.4 | % | | 22.1 | % |
| Indirect automobile | 3,924 |
| | 8.1 | % | | 9.2 | % | | 5,304 |
| | 12.9 | % | | 13.0 | % | | 5,604 |
| | 17.7 | % | | 21.1 | % | 269 |
| | 0.5 | % | | 0.3 | % | | 2,331 |
| | 4.3 | % | | 6.6 | % | | 3,924 |
| | 8.1 | % | | 9.2 | % |
| Residential mortgage | 1,431 |
| | 3.0 | % | | 12.1 | % | | 1,516 |
| | 3.7 | % | | 12.2 | % | | 828 |
| | 2.6 | % | | 12.9 | % | 2,069 |
| | 3.6 | % | | 12.3 | % | | 1,392 |
| | 2.6 | % | | 11.9 | % | | 1,431 |
| | 3.0 | % | | 12.1 | % |
| Home equity | 1,324 |
| | 2.7 | % | | 5.9 | % | | 970 |
| | 2.4 | % | | 6.3 | % | | 696 |
| | 2.2 | % | | 2.8 | % | 2,149 |
| | 3.8 | % | | 6.3 | % | | 1,846 |
| | 3.5 | % | | 5.9 | % | | 1,324 |
| | 2.7 | % | | 5.9 | % |
| Other consumer | 620 |
| | 1.3 | % | | 0.2 | % | | 59 |
| | 0.1 | % | | 0.2 | % | | 53 |
| | 0.2 | % | | 0.2 | % | 83 |
| | 0.1 | % | | 0.2 | % | | 121 |
| | 0.2 | % | | 0.2 | % | | 620 |
| | 1.3 | % | | 0.2 | % |
| Total consumer loans | | 4,301 |
| | 7.5 | % | | 18.8 | % | | 3,359 |
| | 6.3 | % | | 18.0 | % | | 3,375 |
| | 7.0 | % | | 18.2 | % |
| Unallocated | 2,932 |
| | 6.0 | % | | — |
| | 2,630 |
| | 6.4 | % | | — |
| | 3,048 |
| | 9.6 | % | | — |
| — |
| | — | % | | — |
| | 2,418 |
| | 4.5 | % | | — |
| | 2,932 |
| | 6.0 | % | | — |
|
| Total | $ | 48,473 |
| | 100.0 | % | | 100.0 | % | | $ | 41,152 |
| | 100.0 | % | | 100.0 | % | | $ | 31,703 |
| | 100.0 | % | | 100.0 | % | $ | 56,739 |
| | 100.0 | % | | 100.0 | % | | $ | 53,659 |
| | 100.0 | % | | 100.0 | % | | $ | 48,473 |
| | 100.0 | % | | 100.0 | % |
| | | | At December 31, | At December 31, |
| | 2010 | | 2009 | 2012 | | 2011 |
| | Amount | | Percent of Allowance to Total Allowance | | Percent of Loans in Each Category to Total Loans | | Amount | | Percent of Allowance to Total Allowance | | Percent of Loans in Each Category to Total Loans | Amount | | Percent of Allowance to Total Allowance | | Percent of Loans in Each Category to Total Loans | | Amount | | Percent of Allowance to Total Allowance | | Percent of Loans in Each Category to Total Loans |
| | (Dollars in Thousands) | (Dollars in Thousands) |
| Commercial real estate mortgage | $ | 8,235 |
| | 27.7 | % | | 25.0 | % | | $ | 8,335 |
| | 26.8 | % | | 24.3 | % | |
| Commercial real estate | | $ | 12,993 |
| | 31.6 | % | | 31.1 | % | | $ | 9,936 |
| | 31.3 | % | | 27.5 | % |
| Multi-family mortgage | 3,691 |
| | 12.4 | % | | 18.7 | % | | 3,378 |
| | 10.9 | % | | 17.3 | % | 4,541 |
| | 11.0 | % | | 14.5 | % | | 4,459 |
| | 14.1 | % | | 17.7 | % |
| Construction | 472 |
| | 1.6 | % | | 0.8 | % | | 734 |
| | 2.3 | % | | 0.8 | % | 2,484 |
| | 6.0 | % | | 2.4 | % | | 1,082 |
| | 3.4 | % | | 1.5 | % |
| Total commercial real estate loans | | 20,018 |
| | 48.6 | % | | 48.0 | % | | 15,477 |
| | 48.8 | % | | 46.7 | % |
| Commercial | 1,237 |
| | 4.2 | % | | 4.3 | % | | 1,796 |
| | 5.8 | % | | 6.1 | % | 3,870 |
| | 9.4 | % | | 9.2 | % | | 1,505 |
| | 4.8 | % | | 5.5 | % |
| Equipment financing | 3,744 |
| | 12.6 | % | | 9.1 | % | | 3,057 |
| | 9.8 | % | | 7.7 | % | 6,454 |
| | 15.7 | % | | 10.1 | % | | 4,128 |
| | 13.0 | % | | 9.1 | % |
| Condominium association(1) | 312 |
| | 1.0 | % | | 1.9 | % | | — |
| | — |
| | — |
| |
| Condominium association | | 331 |
| | 0.8 | % | | 1.1 | % | | 364 |
| | 1.1 | % | | 1.7 | % |
| Total commercial loans and leases | | 10,655 |
| | 25.9 | % | | 20.4 | % | | 5,997 |
| | 18.9 | % | | 16.3 | % |
| Indirect automobile | 6,952 |
| | 23.4 | % | | 24.6 | % | | 8,479 |
| | 27.3 | % | | 25.6 | % | 5,304 |
| | 12.9 | % | | 12.9 | % | | 5,604 |
| | 17.7 | % | | 21.1 | % |
| Residential mortgage | 977 |
| | 3.3 | % | | 12.8 | % | | 1,026 |
| | 3.3 | % | | 15.5 | % | 1,516 |
| | 3.7 | % | | 12.2 | % | | 828 |
| | 2.6 | % | | 12.9 | % |
| Home equity | 611 |
| | 2.1 | % | | 2.6 | % | | 587 |
| | 1.9 | % | | 2.3 | % | 970 |
| | 2.4 | % | | 6.3 | % | | 696 |
| | 2.2 | % | | 2.8 | % |
| Other consumer | 50 |
| | 0.2 | % | | 0.2 | % | | 62 |
| | 0.2 | % | | 0.3 | % | 59 |
| | 0.1 | % | | 0.2 | % | | 53 |
| | 0.2 | % | | 0.2 | % |
| Total consumer loans | | 2,545 |
| | 6.2 | % | | 18.7 | % | | 1,577 |
| | 5.0 | % | | 15.9 | % |
| Unallocated | 3,414 |
| | 11.5 | % | | — |
| | 3,629 |
| | 11.7 | % | | — |
| 2,630 |
| | 6.4 | % | | — |
| | 3,048 |
| | 9.6 | % | | — |
|
| Total | $ | 29,695 |
| | 100.0 | % | | 100.0 | % | | $ | 31,083 |
| | 100.0 | % | | 100.0 | % | $ | 41,152 |
| | 100.0 | % | | 100.0 | % | | $ | 31,703 |
| | 100.0 | % | | 100.0 | % |
| |
(1) | The allowance for condominium association loans was included in commercial loans in years prior to 2010. |
Liability for Unfunded Credit Commitments
The liability for unfunded credit commitments, which is included in other liabilities, was $1.3 million as of December 31, 2015, $1.3 million as of December 31, 2014 and $1.0 million atas of December 31, 2013, $0.7 million at December 31, 2012 and $0.8 million at December 31, 2011. During the year ended December 31, 2013,2013. The changes in the liability for unfunded credit commitments increased by $0.3 million to reflect changes in the estimate of loss exposure associated with certain credit unfunded credit commitments.
See the subsections "Comparison of Years Ended December 31, 20132015 and December 31, 2012—2014—Provision for Credit Losses" and "Comparison of Years Ended December 31, 20122014 and December 31, 2011—2013—Provision for Credit Losses" appearing elsewhere in this report for a discussion of the provision for loan and lease losses and loan and lease charge-offs recognized in the Company's consolidated financial statements during the past three years.
InvestmentsInvestment Securities and Restricted Equity Securities
Investment Securities
The investment portfolio exists primarily for liquidity purposes, and secondarily as sources of interest and dividend income, interest-rate risk management and tax planning as a counterbalance to loan and deposit flows. Securities available-for-saleInvestment securities are utilized as part of the Company's asset/liability management and may be sold in response to, or in anticipation of, factors such as changes in market conditions and interest rates, security prepayment rates, deposit outflows, liquidity concentrations and regulatory capital requirements.
The investment policy of the Company, which is reviewed and approved by the Board of Directors on an annual basis, specifies the types of investments that are acceptable, required investment ratings by at least one nationally recognized rating agency, concentration limits and duration guidelines. Compliance with the investment policy is monitored on a regular basis. In general, the Company seeks to maintain a high degree of liquidity and targets cash, cash equivalents and investment securities available-for-sale balances between 10% and 30% of total assets.
Cash, cash equivalents, and investment securities increased$68.5 million, or 11.2%, to $682.4 million as of December 31, 2015 from $614.0 million as of December 31, 2014. The increase was primarily driven by the sale of the indirect automobile portfolio, offset by growth in the loans and leases portfolio, security portfolio and the maturity of FHLBB advances. Cash, cash equivalents, and investment securities were 11.3% of total assets as of December 31, 2015, compared to 10.6% of total assets at December 31, 2014.
The following table sets forth certain information regarding the amortized cost and market value of the Company's investment securities at the dates indicated:
| | | | At December 31, | At December 31, |
| | 2013 | | 2012 | | 2011 | 2015 | | 2014 | | 2013 |
| | Amortized Cost | | Fair Value | | Amortized Cost | | Fair Value | | Amortized Cost | | Fair Value | Amortized Cost | | Fair Value | | Amortized Cost | | Fair Value | | Amortized Cost | | Fair Value |
| | (In Thousands) | (In Thousands) |
| Investment securities available-for-sale: | | | | | | | | | | | | | | | | | | | | | | |
| Debt securities: | | | | | | | | | | | | | | | | | | | | | | |
| GSEs | $ | 12,138 |
| | $ | 12,180 |
| | $ | 69,504 |
| | $ | 69,809 |
| | $ | 92,402 |
| | $ | 93,069 |
| $ | 40,658 |
| | $ | 40,627 |
| | $ | 22,929 |
| | $ | 22,988 |
| | $ | 12,138 |
| | $ | 12,180 |
|
| Municipal obligations | 1,068 |
| | 1,086 |
| | 1,058 |
| | 1,101 |
| | 1,250 |
| | 1,303 |
| |
| Auction-rate municipal obligations | 1,900 |
| | 1,775 |
| | 2,100 |
| | 1,976 |
| | 2,700 |
| | 2,490 |
| |
| Corporate debt obligations | 27,751 |
| | 28,224 |
| | 10,481 |
| | 10,685 |
| | 41,490 |
| | 41,354 |
| |
| Trust preferred securities and pools | 1,461 |
| | 1,210 |
| | 2,786 |
| | 2,519 |
| | 3,928 |
| | 3,003 |
| |
| GSE CMOs | 254,331 |
| | 243,644 |
| | 215,670 |
| | 217,001 |
| | 2,961 |
| | 3,025 |
| 198,000 |
| | 193,816 |
| | 238,910 |
| | 234,169 |
| | 254,331 |
| | 243,644 |
|
| GSE MBSs | 202,478 |
| | 199,401 |
| | 165,996 |
| | 169,648 |
| | 68,181 |
| | 71,504 |
| 230,213 |
| | 229,881 |
| | 249,329 |
| | 250,981 |
| | 202,478 |
| | 199,401 |
|
| Private-label CMOs | 3,258 |
| | 3,355 |
| | 6,719 |
| | 6,866 |
| | 366 |
| | 378 |
| — |
| | — |
| | — |
| | — |
| | 3,258 |
| | 3,355 |
|
| SBA commercial loan asset- backed securities | 245 |
| | 243 |
| | 383 |
| | 381 |
| | 443 |
| | 443 |
| 148 |
| | 147 |
| | 205 |
| | 203 |
| | 245 |
| | 243 |
|
| Auction-rate municipal obligations | | — |
| | — |
| | — |
| | — |
| | 1,900 |
| | 1,775 |
|
| Municipal obligations | | — |
| | — |
| | — |
| | — |
| | 1,068 |
| | 1,086 |
|
| Corporate debt obligations | | 46,160 |
| | 46,486 |
| | 39,805 |
| | 40,207 |
| | 27,751 |
| | 28,224 |
|
| Trust preferred securities and pools | | 1,466 |
| | 1,267 |
| | 1,463 |
| | 1,240 |
| | 1,461 |
| | 1,210 |
|
| Total debt securities | 504,630 |
| | 491,118 |
| | 474,697 |
| | 479,986 |
| | 213,721 |
| | 216,569 |
| 516,645 |
| | 512,224 |
| | 552,641 |
| | 549,788 |
| | 504,630 |
| | 491,118 |
|
| Marketable equity securities | 1,259 |
| | 1,310 |
| | 1,249 |
| | 1,337 |
| | 834 |
| | 862 |
| 956 |
| | 977 |
| | 947 |
| | 973 |
| | 1,259 |
| | 1,310 |
|
| Total investment securities available-for-sale | $ | 505,889 |
| | $ | 492,428 |
| | $ | 475,946 |
| | $ | 481,323 |
| | $ | 214,555 |
| | $ | 217,431 |
| $ | 517,601 |
| | $ | 513,201 |
| | $ | 553,588 |
| | $ | 550,761 |
| | $ | 505,889 |
| | $ | 492,428 |
|
| Investment securities held-to-maturity: | | | | | | | | | | | | |
| GSEs | | $ | 34,915 |
| | $ | 34,819 |
| | $ | — |
| | $ | — |
| | $ | — |
| | $ | — |
|
| GSE MBSs | | 19,291 |
| | 18,986 |
| | — |
| | — |
| | — |
| | — |
|
| Municipal Obligations | | 39,051 |
| | 39,390 |
| | — |
| | — |
| | — |
| | — |
|
| Foreign Government Obligations | | 500 |
| | 500 |
| | 500 |
| | 500 |
| | 500 |
| | 500 |
|
| Total investment securities held-to-maturity | | $ | 93,757 |
| | $ | 93,695 |
| | $ | 500 |
| | $ | 500 |
| | $ | 500 |
| | $ | 500 |
|
| Restricted equity securities: | | | | | | | | | | | | | | | | | | | | | | |
| FHLBB stock | $ | 50,081 |
| | |
| | $ | 52,188 |
| | |
| | $ | 37,914 |
| | |
| $ | 48,890 |
| | |
| | $ | 58,326 |
| | |
| | $ | 50,081 |
| | |
|
| FRB stock | 16,003 |
| | |
| | 15,998 |
| | |
| | 994 |
| | |
| 16,752 |
| | |
| | 16,003 |
| | |
| | 16,003 |
| | |
|
| Other | 475 |
| | |
| | 475 |
| | |
| | 375 |
| | |
| 475 |
| | |
| | 475 |
| | |
| | 475 |
| | |
|
| Total restricted equity securities | $ | 66,559 |
| | |
| | $ | 68,661 |
| | |
| | $ | 39,283 |
| | |
| $ | 66,117 |
| | |
| | $ | 74,804 |
| | |
| | $ | 66,559 |
| | |
|
| Investment securities held-to-maturity | $ | 500 |
| | |
| | $ | 500 |
| | |
| | $ | — |
| | |
| |
Total investment securities and restricted equity securities primarily consist of investment securities available-for-sale, investment securities held-to-maturity, stock in the FHLBB and stock in the FRB. TotalThe total securities portfolio increased $9.0$47.0 million, or 1.6%7.5% since December 31, 2012. At January 1, 2012, the Company acquired $328.9 million2014. As of securities in the BankRI acquisition. At December 31, 2013,2015, total investment securities were 10.5%portfolio was 11.1% of total assets, a decrease fromcompared to 10.8% of total assets as of December 31, 2012,2014.
The fair value of investment securities is based principally on market prices and dealer quotes received from third-party, nationally-recognized pricing services for identical investment securities such as U.S. Treasury and agency securities. The Company's marketable equity securities are priced this way and are included in Level 1. These prices are validated by comparing the primary pricing source with an alternative pricing source when totalavailable. When quoted market prices for identical securities are unavailable, the Company uses market prices provided by independent pricing services based on recent trading activity and other observable information, including but not limited to market interest-rate curves, referenced credit spreads and estimated prepayment speeds where applicable. These investments include certain U.S. and government agency debt securities, municipal and corporate debt securities, GSE residential MBSs and CMOs, and trust preferred securities, all of
which are included in Level 2. Certain fair values are estimated using pricing models (such as auction-rate municipal securities) and are included in Level 3.
Additionally, Management reviews changes in fair value from period to period and performs testing to ensure that prices received from the third parties are consistent with their expectation of the market. Changes in the prices obtained from the pricing service are analyzed from month to month, taking into consideration changes in market conditions including changes in mortgage spreads, changes in U.S. Treasury security yields and changes in generic pricing of 15-year and 30-year securities. Additional analysis may include a review of prices provided by other independent parties, a yield analysis, a review of average life changes using Bloomberg analytics and a review of historical pricing for the particular security.
During the second quarter of 2014, to better align the Company’s investment portfolio with Management’s strategic focus, the Company liquidated all private-label CMOs, auction-rate municipal obligations and municipal obligations, all of which are 100% risk weighted. Proceeds from the investment securities sales were 10.7% of total assets.used to reinvest in GSE securities, which are risk weighted at 20%.
Maturities, calls and principal repayments for investment securities available-for-sale and investment securities held-to-maturity totaled $137.3$107.4 million for the year ended December 31, 20132015 compared to $207.5$84.6 million for the same period in 2012. In 2013, the Company sold2014. There were no sales of investment securities of $1.2 million and realized gains of $0.4 millionavailable-for-sale in 2015, as compared to sales of $166.2$5.5 million in investment securities available-for-sale and gains of $0.9$0.1 million for 2012. In 2013,2014. For the year ended December 31, 2015, the Company purchased $171.2$63.6 million of investment securities available-for-sale and $102.8 million of investment securities held-to-maturity, compared to $326.1$139.9 million in 2012.
Investmentof investment securities available-for-sale are recorded at fair value, which is primarily obtained from a third-party pricing service. Atand $0.5 million of investment securities held-to-maturity in 2014.
As of December 31, 2013,2015, the fair value of all investment securities available-for-sale was $492.4$513.2 million and carried a total of $13.5$4.4 million of net unrealized losses, compared to $5.4a fair value of $550.8 million ofand net unrealized gains atlosses of $2.8 million as of December 31, 2012.2014. As of December 31, 2015, $368.6 million, or 71.8%, of the portfolio, had gross unrealized losses of $6.0 million. This compares to $335.7 million, or 60.9%, of the portfolio with gross unrealized losses of $6.0 million as of December 31, 2014. The Company's unrealized loss position increased in 2015 driven by a higher year over year interest rates and a change in the unrealized loss of the remaining securities available-for-sale is dueportfolio mix from shorter duration MBS to an increaselonger duration agency debentures and municipal securities.
Management believes that these negative differences between amortized cost and fair value do not include credit losses, but rather differences in interest rates. Management believesrates between the time of purchase and the time of measurement. It is more likely than not that the Company will not sell the investment securities before recovery, and, as a result, it will recover the amortized cost basis of the investment securities and that it is more likely than not that it will not sell the securities before recovery.securities. As such, managementManagement has determined that the securities are not other-than-temporarily impaired as of December 31, 2013.2015. If market conditions for securities worsen or the creditworthiness of the underlying issuers deteriorates, it is possible that the Company may recognize additional other-than-temporary impairments in future periods.
Debt Securities
The Company expects to recover its amortized cost basis For additional discussion on all debt securities in its available-for-sale and held-to-maturity portfolios. Furthermore,how the Company does not intend to sell nor does it anticipate that it will be required to sell any of its securities in an unrealized loss position as of December 31, 2013, prior to the recovery of their amortized cost basis. The Company's ability and intent to hold these securities until recovery is supportedvalidates fair values provided by the Company's strong capital and liquidity positions as well as its historically low portfolio turnover.third-party pricing service, see Note 21, “Fair Value of Financial Instruments.”
Investment Securities Available-for-Sale
U.S. Government-Sponsored Enterprises
The Company invests in securities issued by U.S. Government-sponsored enterprises ("GSEs"), including GSE debt securities, mortgage-backed securities ("MBSs"), and collateralized mortgage obligations ("CMOs"). GSE securities include obligations issued by the Federal National Mortgage Association ("FNMA"), the Federal Home Loan Mortgage Corporation ("FHLMC"), the Government National Mortgage Association ("GNMA"), the Federal Home Loan Banks ("FHLB") and the Federal Farm Credit Bank. At As of December 31, 2013,2015, only GNMA MBSs and CMOs, and Small Business Administration ("SBA") commercial loan asset-backed securities with an estimated fair value of $18.9$21.8 million were backed explicitly by the full faith and credit of the U.S. Government, compared to $10.0$26.2 million at as of December 31, 2012.2014.
GSE securities are considered attractive investments because they (1) generate positive yields with minimal administrative expense, (2) impose minimal credit risk as a result of the guarantees usually provided, (3) can be utilized as collateral for borrowings, (4) generate cash flows useful for liquidity management and (5) are ‘‘qualified investments’’ as designated for regulatory purposes that the Company is obligated to meet.
At As of December 31, 2013,2015, the Company owned GSE debentures with a total fair value of $40.6 million, which approximated amortized cost. As of December 31, 2014, the Company held GSE debentures with a total fair value of $12.2$23.0 million, and a net unrealized gainwhich approximated amortized cost. As of $42 thousand. At December 31, 2012, the Company held GSE debentures with a total fair value of $69.8 million and a net unrealized gain of $0.3 million. At December 31, 2013, none2015, seven of the fivethirteen securities in this portfolio were in unrealized loss positions. At As of December 31, 2012, none2014, four of the twenty-eighteight securities in this portfolio were in unrealized loss positions. All securities are performing and backed by the implicit(FHLB/implicit (FHLB/FNMA/FHLMC) or explicit(GNMA/explicit (GNMA/SBA) guarantee of the U.S Government.
During the year ended December 31, 2013,2015, the Company held SBApurchased a total of $24.9 million GSE debentures. This compares to $21.0 million purchased during the same period in 2014.
As of December 31, 2015, the Company owned GSE mortgage-related securities with a total fair value of $0.2$423.7 million and a net unrealized loss of $2.0 thousand. At December 31, 2012, the Company held SBA securities with$4.5 million. This compares to a total fair value of $0.4$485.2 million and a net unrealized loss of less than $2.0 thousand. At $3.1 million as of December 31, 2013, seven2014. As of December 31, 2015, 101 of the nine249 securities in this portfolio were in unrealized loss positions. At As of December 31, 2012, eight2014, 79 of the eleven250 securities in this portfolio were in unrealized loss positions. All securities are performing and backed by the explicit(SBA)implicit (FHLB/FNMA/FHLMC) or explicit (GNMA) guarantee of the U.S Government. During the years ended December 31, 2015 and 2014, the Company purchased a total of $29.5 million and $106.9 million, respectively, in GSE CMOs and GSE MBSs.
SBA Commercial Loan Asset-Backed
As of December 31, 2013,2015 and December 31, 2014, the Company held GSE mortgage-relatedowned SBA securities with a total fair value of $443.0$0.1 million, and a net unrealized losswhich approximated amortized cost. As of $13.8 million. This compares to a total fair value of $386.6 million and a net unrealized gain of $5.0 million at December 31, 2012. At December 31, 2013, 862015, six of the 232seven securities in this portfolio were in unrealized loss positions. At As of December 31, 2012, 322014, seven of the 224eight securities in this portfolio were in unrealized loss positions. All securities are performing and backed by the implicit(FHLB/FNMA/FHLMC) or explicit(GNMA)explicit (SBA) guarantee of the U.S Government. During the years ended December 31, 2013 and 2012, the Company purchased a total of $149.5 million and $326.1 million, respectively, in GSE CMOs and GSE MBSs to reinvest cash from matured securities.
Mortgage-related securities are created by the pooling of mortgages and the issuance of a security with an interest rate that is less than the average interest rate on the underlying mortgages. Mortgage related securities purchased by the Company generally are comprised of a pool of single-family mortgages. The issuers of such securities are generally GSEs such as FNMA, FHLMC and GNMA, which pool and resell participation interests in the form of securities to investors and guarantee the payment of principal and interest to the investors.
Investments in mortgage-related securities issued and guaranteed by GSEs generally do not entail significant credit risk. Such investments, however, are susceptible to significant interest rate and cash flow risks when actual cash flows from the investments differ from cash flows estimated at the time of purchase. Additionally, the market value of such securities can be affected adversely by market changes in interest rates. Prepayments that are faster than anticipated may shorten the life of a security and result in the accelerated expensing of any premiums paid, thereby reducing the net yield earned on the
security. Although prepayments of underlying mortgages depend on many factors, the difference between the interest rates on the underlying mortgages and prevailing mortgage interest rates generally is the most significant determinant of the rate of prepayments. During periods of declining interest rates, refinancing generally increases and accelerates the prepayment of underlying mortgages and the related security. Such an occurrence can also create reinvestment risk because of the unavailability of other investments with a comparable rate of return in relation to the nature and maturity of the alternative
investment. Conversely, in a rising interest-rate environment, prepayments may decline, thereby extending the estimated life of the security and depriving the Company of the ability to reinvest cash flows at the higher market rates of interest.
Private-Label CMOs
At As of December 31, 2013,2015 and 2014, the Company helddid not own any private-issuer CMO-related securities. All private-label CMOs were sold during the second quarter of 2014.
Auction-Rate Municipal Obligations and Municipal Obligations
As of December 31, 2015 and 2014, the Company did not own any auction-rate municipal obligations and municipal obligations. All auction-rate municipal obligations and municipal obligations were sold during the second quarter of 2014.
Corporate Obligations
From time to time, the Company will invest in high-quality corporate obligations to provide portfolio diversification and improve the overall yield on the portfolio. The Company owned fifteen corporate obligation securities with a total fair value of $3.4$46.5 million and a net unrealized gain of $0.1 million. At $0.3 million as of December 31, 2012, the Company held private-issuer CMO-related2015. This compares to thirteen corporate obligation securities with a total fair value of $6.9$40.2 million and a net unrealized gain of $0.1 million. At $0.4 million as of December 31, 2013,2014. As of December 31, 2015, two of the eleven securities in this portfolio were in unrealized loss positions. At December 31, 2012, one of the elevenfifteen securities in this portfolio was in an unrealized loss position. All securities are performing and whileAs of December 31, 2014, one security was downgraded in 2013, the security is in an unrealized gain position and the underlying credit metrics have not deteriorated in 2013.
Auction-Rate Municipal Obligations and Municipal Obligations
The auction-rate obligations owned by the Company were rated "AAA" at the time of acquisition due, in part, to the guarantee of third-party insurers who would have to pay the obligations if the issuers failed to pay the obligations when they become due. During the financial crisis, certain third-party insurers experienced financial difficulties and were not able to meet their contractual obligations. As a result, auctions failed to attract a sufficient number of investors and created a liquidity problem for those investors who were relying on the obligations to be redeemed at auction. Since then, there has not been an active market for auction-rate municipal obligations.
Based on an evaluation of market factors, the estimated fair value of the auction-rate municipal obligations owned by the Company at December 31, 2013 was $1.8 million, with a corresponding net unrealized loss of $0.1 million. This compares to $2.0 million with a corresponding net unrealized loss of $0.1 million at December 31, 2012. At December 31, 2013, both of thethirteen securities in this portfolio werewas in an unrealized loss positions. At December 31, 2012, all three of the securities in this portfolio were in unrealized loss positions.position. Full collection of the obligations is expected because the financial condition of the issuers is sound none of the issuersand has not defaulted on scheduled payments, the obligations are rated investment grade and the Company has the ability and intent to hold the obligations for a period of time to recover the unrealized losses.
The Company owns municipal obligations with an estimated fair value of $1.1 million which approximates amortized cost at December 31, 2013. This compares to a total fair value of $1.1 million which also approximates amortized cost at December 31, 2012. At both December 31, 2013 and 2012, none of the two securities in this portfolio was in unrealized loss positions. Full collection of the obligations is expected because the financial condition of the issuers is sound, none of the issuers has defaulted on scheduled payments, the obligations are rated investment grade and the Company has the ability and intent to hold the obligations for a period of time to recover the unrealized losses.
Corporate Obligations
From time to time, the Company will invest in high-quality corporate obligations to provide portfolio diversification and improve the overall yield on the portfolio. The Company owned eleven corporate obligation securities with a total fair value of $28.2 million and total net unrealized gains of $0.5 million as of December 31, 2013. This compares to eight corporate obligation securities with a total fair value of $10.7 million and total net unrealized gains of $0.2 million at December 31, 2012. At both December 31, 2013 and 2012, all but one of the securities are investment grade and this security is currently in an unrealized gain position. At December 31, 2013, two of the eleven securities in this portfolio are in unrealized loss positions. At December 31, 2012, none of the eight securities in this portfolio was in unrealized loss positions. Full collection of the obligations is expected because the financial condition of the issuers is sound, none of the issuers has defaulted on scheduled payments, the obligations are rated investment grade and the Company has the ability and intent to hold the obligations for a period of time to recover the unrealized losses.cost. During the year ended December 31, 2013,2015, the Company purchased $21.7$9.3 million in corporate obligations. The Company did not purchase any corporate obligations compared to $12.0 million in the same period in 2012.2014.
Trust Preferred Securities and PreTSLs
Trust preferred securities represent subordinated debt issued by financial institutions. These securities are sometimes pooled and sold to investors through structured vehicles known as trust preferred pools (“PreTSLs”). When issued, PreTSLs are divided into tranches or segments that establish priority rights to cash flows from the underlying trust preferred securities. AtAs of December 31, 2013,2015 and 2014, the Company owned two trust preferred securities and no PreTSL pools with a total fair value of $1.2 million and a total net unrealized loss of $0.3 million. This compares to three trust preferred securities and two PreTSL pools with a total fair value of $2.5 million and a total net unrealized loss of $0.3 million at December 31, 2012. During the year ended December 31, 2013, the Company sold all PreTSL securities for a net gain of $0.4 million. At December 31, 2013, all of the securities in this portfolio were in unrealized loss positions, which represents 17.2% of the amortized cost of the securities. At December 31, 2012, three of the five securities in this portfolio were in unrealized loss positions, which represents 14.5% of the amortized cost of the securities.
During the year ended December 31, 2013, the Company sold two PreTSL pooled securities for a net gain of $0.4 million. At the time of sale, the proposed "Volcker Rule" of the Dodd-Frank Wall Street Reform and Consumer Protection Act, restricted banks from owning PreTSL pooled securities. The Company had the ability and intent to hold both securities to maturity prior to the new proposed regulations based on the amortized cost of the securities held at that time versus market indications. The Company identified that these securities were subject to the "Volcker Rule” and decided to sell the securities while a market existed. After regulatory review in January 2014, the "Volcker Rule" was revised and banks of less than $10 billion in size were grandfathered to hold these securities in their portfolios.pools.
Marketable Equity Securities
At bothAs of December 31, 20132015 and 2012,2014, the Company owned marketable equity securities with a fair value of $1.3$1.0 million,, including net unrealized gains which approximated amortized cost. As of $0.1 million. At December 31, 2013, one2015, none of the fourtwo securities in this portfolio was in an unrealized loss position, which represents 0.8%position. As of December 31, 2014, none of the amortized cost of the securities. At December 31, 2012, none of the four securities in this portfolio waswere in an unrealized loss position.
Investment Securities Held-to-Maturity
U.S. Government-Sponsored Enterprises
The Company invests in securities issued by U.S. Government-sponsored enterprises ("GSEs") including GSE debt securities, mortgage-backed securities ("MBSs"), and collateralized mortgage obligations ("CMOs"). GSE securities include obligations issued by the Federal National Mortgage Association ("FNMA"), the Federal Home Loan Mortgage Corporation ("FHLMC"), the Government National Mortgage Association ("GNMA"), the Federal Home Loan Banks ("FHLB"), and the Federal Farm Credit Bank. As of December 31, 2015, the Company owned GSE debentures and GSE MBS with a total fair value of $34.8 million and $19.0 million, respectively.
As of December 31, 2015, the Company owned GSE mortgage-related securities with a total amortized cost of $19.3 million. As of December 31, 2014, the Company did not own any GSE mortgage-related securities. During the year ended December 31, 2015, the Company purchased a total of $42.4 million and $21.3 million, in GSEs and GSE MBSs, respectively. As of December 31, 2015, 16 of the 22 securities in this portfolio were in unrealized loss positions. All securities are performing and backed by the implicit (FHLB/FNMA/FHLMC) or explicit (GNMA) guarantee of the U.S Government.
Municipal Obligations
As of December 31, 2015, the Company owned 72 municipal obligation securities with a total fair value and total amortized cost of $39.4 million and 39.1 million, respectively. As of December 31, 2014, the Company did not own any municipal obligation securities. During the years ended December 31, 2015 and 2014, the Company purchased a total of $39.2 million of municipal obligations. As of December 31, 2015, 15 of the 72 securities in this portfolio were in unrealized loss positions.
Foreign Government Obligations
As of December 31, 2015 and December 31, 2014, the Company owned 1 foreign government obligation security with a fair value and amortized cost of $0.5 million. As of December 31, 2015 and December 31, 2014, this security was not in an unrealized loss position. During the year ended December 31, 2015, the Company did not purchase any foreign government obligation securities. During the year ended December 31, 2014, the Company purchased $0.5 million of State of Israel bonds in 2011 with a carrying value of $0.5 million and a fair value of $0.5 million. This security matures in March, 2014 and carries an interest rate payable of LIBOR plus 0.125%.foreign government obligation securities.
Restricted Equity Securities
FHLBB Stock—The Company invests in the stock of the FHLBB as one of the requirements to borrow. The Company maintains an excess balance of capital stock of $12.0$4.3 million which allows for additional borrowing capacity at each subsidiary institution.of the Banks.
AtAs of December 31, 2013,2015, the Company owned stock in the FHLBB with a carrying value of $50.1$48.9 million, a decrease of $2.1$9.4 million from $52.2$58.3 million atas of December 31, 2012, primarily due to a $2.1 million FHLBB stock redemption during 2013. At September 30, 2013,2014. As of December 31, 2015, the FHLBB had total assets of $39.7$58.1 billion and total capital of $2.7$3.0 billion, of which $705.7 million$1.1 billion was retained earnings. The FHLBB stated that it remained in compliance with all regulatory capital ratios as of September 30, 2013December 31, 2015 and based on the most recent information available, was classified as "adequately capitalized" by its regulator.regulator, based on the FHLBB's financial information as of September 30, 2015. See Note 5, "Restricted Equity Securities" to the consolidated financial statements for further information about the FHLBB.
Federal Reserve Bank Stock—The Company invests in the stock of the Federal Reserve Bank of Boston, as required by its subsidiary Banks'a condition of the membership for the Banks in the Federal Reserve System. In 2013,2015, the Company increasedmaintained its investment in the stock of the Federal Reserve Bank of Boston by $5 thousand to adjust for deposit growth. The FRB is now the primary federal regulator for the Company and its subsidiary banks.the Banks.
Carrying Value, Weighted Average Yields, and Contractual Maturities of Investment and Restricted Equity Securities
The table below sets forth certain information regarding the carrying value, weighted average yields and contractual maturities of the Company's investment and restricted equity securities portfolio at the date indicated.
| | | | Balance at December 31, 2013 | Balance at December 31, 2015 |
| | One Year or Less | | After One Year Through Five Years | | After Five Years Through Ten Years | | After Ten Years | | Total | One Year or Less | | After One Year Through Five Years | | After Five Years Through Ten Years | | After Ten Years | | Total |
| | Carrying Value | | Weighted Average Yield | | Carrying Value | | Weighted Average Yield | | Carrying Value | | Weighted Average Yield | | Carrying Value | | Weighted Average Yield | | Carrying Value | | Weighted Average Yield | Carrying Value | | Weighted Average Yield | | Carrying Value | | Weighted Average Yield | | Carrying Value | | Weighted Average Yield | | Carrying Value | | Weighted Average Yield | | Carrying Value | | Weighted Average Yield |
| | (Dollars in Thousands) | (Dollars in Thousands) |
| Investment securities available-for-sale: | | | | | | | | | | | | | | | | | | | | | | | | | | | | | | | | | | | | | | |
| Debt securities: | | | | | | | | | | | | | | | | | | | | | | | | | | | | | | | | | | | | | | |
| GSEs | $ | 12,180 |
| | 0.62 | % | | $ | — |
| | — |
| | $ | — |
| | — |
| | $ | — |
| | — |
| | $ | 12,180 |
| | 0.62 | % | $ | — |
| | — | % | | $ | 12,697 |
| | 1.72 | % | | $ | 27,930 |
| | 2.30 | % | | $ | — |
| | — | % | | $ | 40,627 |
| | 2.12 | % |
| Municipal obligations(1) | 752 |
| | 3.55 | % | | 334 |
| | 3.31 | % | | — |
| | — |
| | — |
| | — |
| | 1,086 |
| | 3.48 | % | |
| Auction-rate municipal obligations(1) | — |
| | — |
| | — |
| | — |
| | — |
| | — |
| | 1,775 |
| | 0.25 | % | | 1,775 |
| | 0.25 | % | |
| GSE CMOs | | — |
| | — |
| | 1,895 |
| | 1.51 | % | | 34 |
| | 5.19 | % | | 191,887 |
| | 1.83 | % | | 193,816 |
| | 1.82 | % |
| GSE MBSs | | 6 |
| | 0.02 | % | | 8,416 |
| | 3.98 | % | | 66,489 |
| | 1.87 | % | | 154,970 |
| | 2.16 | % | | 229,881 |
| | 2.15 | % |
| SBA commercial loan asset- backed securities | | — |
| | — |
| | — |
| | — | % | | 130 |
| | 0.88 | % | | 17 |
| | 0.60 | % | | 147 |
| | 0.85 | % |
| Corporate debt obligations | — |
| | — |
| | 28,010 |
| | 2.32 | % | | — |
| | — |
| | 214 |
| | — |
| | 28,224 |
| | 2.30 | % | 2,997 |
| | 2.09 | % | | 37,241 |
| | 2.18 | % | | 6,248 |
| | 2.85 | % | | — |
| | — |
| | 46,486 |
| | 2.27 | % |
| Trust preferred securities | — |
| | — |
| | — |
| | — |
| | — |
| | — |
| | 1,210 |
| | 1.05 | % | | 1,210 |
| | 1.05 | % | — |
| | — |
| | — |
| | — |
| | — |
| | — |
| | 1,267 |
| | 1.13 | % | | 1,267 |
| | 1.13 | % |
| GSE CMOs | — |
| | — |
| | 81 |
| | 3.55 | % | | 54 |
| | 3.69 | % | | 243,509 |
| | 1.80 | % | | 243,644 |
| | 1.80 | % | |
| GSE MBSs | 130 |
| | 3.81 | % | | 11,762 |
| | 4.16 | % | | 65,432 |
| | 2.18 | % | | 122,077 |
| | 2.09 | % | | 199,401 |
| | 2.24 | % | |
| Private-label CMOs | — |
| | — |
| | 987 |
| | — |
| | 1,419 |
| | 4.63 | % | | 949 |
| | 6.11 | % | | 3,355 |
| | 5.01 | % | |
| SBA commercial loan asset- backed securities | — |
| | — |
| | 13 |
| | 1.70 | % | | 170 |
| | 0.83 | % | | 60 |
| | 1.02 | % | | 243 |
| | 0.93 | % | |
| Total debt securities | $ | 13,062 |
| | 0.82 | % | | $ | 41,187 |
| | 2.90 | % | | $ | 67,075 |
| | 2.23 | % | | $ | 369,794 |
| | 1.90 | % | | 491,118 |
| | 2.00 | % | $ | 3,003 |
| | 2.09 | % | | $ | 60,249 |
| | 2.32 | % | | $ | 100,831 |
| | 2.05 | % | | $ | 348,141 |
| | 1.97 | % | | 512,224 |
| | 2.03 | % |
| Marketable equity securities | |
| | |
| | |
| | |
| | |
| | |
| | |
| | |
| | 1,310 |
| | 2.95 | % | |
| | |
| | |
| | |
| | |
| | |
| | |
| | |
| | 977 |
| | 1.77 | % |
| Total investment securities available-for-sale | |
| | |
| | |
| | |
| | |
| | |
| | |
| | |
| | 492,428 |
| | 2.00 | % | |
| | |
| | |
| | |
| | |
| | |
| | |
| | |
| | $ | 513,201 |
| | 2.03 | % |
| Investment securities held-to-maturity: | | |
| | |
| | |
| | |
| | |
| | |
| | |
| | |
| | |
| | |
|
| GSEs | | $ | — |
| | — |
| | $ | 9,500 |
| | 2.01 | % | | $ | 25,415 |
| | 2.28 | % | | $ | — |
| | — |
| | $ | 34,915 |
| | 2.21 | % |
| GSE MBSs | | 151 |
| | 1.82 | % | | — |
| | — |
| | — |
| | — |
| | 19,140 |
| | 1.82 | % | | 19,291 |
| | 1.82 | % |
| Municipal Obligations | | — |
| | — |
| | 14,389 |
| | 1.19 | % | | 24,662 |
| | 1.70 | % | | — |
| | — |
| | 39,051 |
| | 1.52 | % |
| Foreign Government Obligations | | 500 |
| | 1.30 | % | | — |
| | — |
| | — |
| | — |
| | — |
| | — |
| | 500 |
| | 1.30 | % |
| Total investment securities held-to-maturity | | $ | 651 |
| | 1.42 | % | | $ | 23,889 |
| | 1.52 | % | | $ | 50,077 |
| | 2.00 | % | | $ | 19,140 |
| | 1.82 | % | | $ | 93,757 |
| | 1.83 | % |
| Restricted equity securities: | | | | | | | | | | | | | | | | | | | | | | | | | | | | | | | | | | | | | | |
| FHLBB stock | |
| | |
| | |
| | |
| | |
| | |
| | |
| | |
| | 50,081 |
| | 0.50 | % | |
| | |
| | |
| | |
| | |
| | |
| | |
| | |
| | $ | 48,890 |
| | 2.54 | % |
| FRB stock | |
| | |
| | |
| | |
| | |
| | |
| | |
| | |
| | 16,003 |
| | 6.00 | % | |
| | |
| | |
| | |
| | |
| | |
| | |
| | |
| | 16,752 |
| | 6.00 | % |
| Other stock | |
| | |
| | |
| | |
| | |
| | |
| | |
| | |
| | 475 |
| | — |
| |
| | |
| | |
| | |
| | |
| | |
| | |
| | |
| | 475 |
| | — | % |
| Total restricted equity securities | |
| | |
| | |
| | |
| | |
| | |
| | |
| | |
| | 66,559 |
| | 1.83 | % | |
| | |
| | |
| | |
| | |
| | |
| | |
| | |
| | $ | 66,117 |
| | 3.42 | % |
| Investment securities held-to-maturity | |
| | |
| | |
| | |
| | |
| | |
| | |
| | |
| | 500 |
| | 1.99 | % | |
| Total securities | |
| | |
| | |
| | |
| | |
| | |
| | |
| | |
| | $ | 559,487 |
| | 1.98 | % | |
| |
| (1) | Yields have been calculated on a tax-equivalent basis. |
Premises and Equipment
Corporate Headquarters
On October 29, 2012, the Company moved its headquarters to 131 Clarendon Street in Boston, Massachusetts. The eight-story building, including the land, was acquired at a cost of approximately $14.0 million.
At December 31, 2013, $33.4 million in depreciable assets associated with the new headquarters have been recognized; of which $31.9 million will be depreciated over 40 years and the remaining $1.4 million will be depreciated between 3 and 15 years. See Note 8, "Premises and Equipment," to the consolidated financial statements for more information. In addition, the Company realized $0.2 million of tax credits during the year ended December 31, 2013 compared to $1.9 million in 2012 . See Note 17, "Income Taxes" to the consolidated financial statements.
A portion of the Company's new headquarters was rented to third-party tenants in 2013 with rental income of $0.3 million reported in non-interest income. The Company expects $0.4 million of rental income for the year ended 2014.
Core Operating Systems
The Company has also entered into contracts associated with the conversion of its core operating systems. Brookline Bank and First Ipswich were successfully converted to a new core operating system in 2012. BankRI converted to the Company's core operating system late in the second quarter 2013.
Deposits
The following table presents the Company's deposit mix at the dates indicated.
| | | | At December 31, | At December 31, |
| | 2013 | | 2012 | | 2011 | 2015 | | 2014 | | 2013 |
| | Amount | | Percent of Total | | Weighted Average Rate | | Amount | | Percent of Total | | Weighted Average Rate | | Amount | | Percent of Total | | Weighted Average Rate | Amount | | Percent of Total | | Weighted Average Rate | | Amount | | Percent of Total | | Weighted Average Rate | | Amount | | Percent of Total | | Weighted Average Rate |
| | (Dollars in Thousands) | (Dollars in Thousands) |
| Non-interest-bearing deposits: | | | | | | | | | | | | | | | | | | Non-interest-bearing deposits: | | | | | | | | | | | | | | | | |
| Demand checking accounts | $ | 707,023 |
| | 18.4 | % | | — | % | | $ | 623,274 |
| | 17.2 | % | | — | % | | $ | 225,284 |
| | 10.0 | % | | — | % | $ | 799,117 |
| | 18.6 | % | | — | % | | $ | 726,118 |
| | 18.3 | % | | — | % | | $ | 707,023 |
| | 18.4 | % | | — | % |
| Interest-bearing deposits: | | | | | | | | | | | | | | | | | | Interest-bearing deposits: | | | | | | | | | | | | | | | | |
| NOW accounts | 210,602 |
| | 5.5 | % | | 0.07 | % | | 212,858 |
| | 5.9 | % | | 0.09 | % | | 110,220 |
| | 4.9 | % | | 0.18 | % | 283,972 |
| | 6.6 | % | | 0.07 | % | | 235,063 |
| | 6.0 | % | | 0.07 | % | | 210,602 |
| | 5.5 | % | | 0.07 | % |
| Savings accounts | 494,734 |
| | 12.9 | % | | 0.25 | % | | 515,367 |
| | 14.2 | % | | 0.39 | % | | 164,744 |
| | 7.3 | % | | 0.40 | % | 540,788 |
| | 12.6 | % | | 0.25 | % | | 531,727 |
| | 13.4 | % | | 0.21 | % | | 494,734 |
| | 12.9 | % | | 0.25 | % |
| Money market accounts | 1,487,979 |
| | 38.8 | % | | 0.54 | % | | 1,253,819 |
| | 34.7 | % | | 0.63 | % | | 946,411 |
| | 42.0 | % | | 0.83 | % | 1,594,269 |
| | 37.0 | % | | 0.44 | % | | 1,518,490 |
| | 38.4 | % | | 0.52 | % | | 1,487,979 |
| | 38.8 | % | | 0.54 | % |
| Certificate of deposit accounts | 934,668 |
| | 24.4 | % | | 0.90 | % | | 1,010,941 |
| | 28.0 | % | | 1.06 | % | | 805,672 |
| | 35.8 | % | | 1.26 | % | 1,087,872 |
| | 25.3 | % | | 0.93 | % | | 946,708 |
| | 23.9 | % | | 0.88 | % | | 934,668 |
| | 24.4 | % | | 0.91 | % |
| Total interest-bearing deposits | 3,127,983 |
| | 81.6 | % | | 0.57 | % | | 2,992,985 |
| | 82.8 | % | | 0.70 | % | | 2,027,047 |
| | 90.0 | % | | 0.93 | % | 3,506,901 |
| | 81.4 | % | | 0.53 | % | | 3,231,988 |
| | 81.7 | % | | 0.54 | % | | 3,127,983 |
| | 81.6 | % | | 0.57 | % |
| Total deposits | $ | 3,835,006 |
| | 100.0 | % | | 0.47 | % | | $ | 3,616,259 |
| | 100.0 | % | | 0.58 | % | | $ | 2,252,331 |
| | 100.0 | % | | 0.84 | % | $ | 4,306,018 |
| | 100.0 | % | | 0.43 | % | | $ | 3,958,106 |
| | 100.0 | % | | 0.43 | % | | $ | 3,835,006 |
| | 100.0 | % | | 0.47 | % |
The Company seeks to increase its percentage of core (non-certificate of deposit) deposits and decrease its loan-to-deposit ratio over time, while continuing to increase deposits as a percentage of total funding sources. This strategic goal, however, is difficult given theThe Company's loan-to-deposit ratio decreased to 116.0% as of 113.8% at December 31, 2013 (down2015, from 115.5% at121.8% as of December 31, 2012) and the Company's rapid growth in loans and leases. Total deposits increased by $0.2 billion, or 6.0%, from $3.6 billion, or 70.3% of total assets at December 31, 2012, to $3.8 billion, or 72.0% of total assets at December 31, 2013.2014.
In 2013, coreTotal deposits increased $0.3 billion, or 11.3%8.8%, rising from 72.0%to $4.3 billion as of December 31, 2015, compared to $4.0 billion as of December 31, 2014. Deposits as a percentage of total deposits atassets increased from 68.2% as of December 31, 20122014 to 75.6%71.3% as of December 31, 2015. The increase in deposits as a percentage of total assets is primarily due to the growth in brokered deposits, atnon-interest-bearing accounts and the maturity of FHLBB advances using the excess liquidity generated by the sale of the indirect auto loans in the first quarter of 2015.
As of December 31, 2013.
Certificates2015, the Company had $252.3 million of brokered deposits compared to $62.0 million as of December 31, 2014. Brokered deposits allow the Company to seek additional funding by attracting deposits from outside the Company's core market. The Company's investment policy limits the amount of brokered deposits to 15% of total assets. Brokered deposits are included in the certificate of deposit decreased $76.3balance, which increased $141.2 million, or 7.5%14.9%, in 2013.during 2015. Certificates of deposit have also fallenincreased as a percentage of total deposits from 28.0% atto 25.3% as of December 31, 2012 to 24.4% at2015 from 23.9% as of December 31, 2013.2014.
In 2015, core deposits increased $206.7 million, or 6.9%. The Company does not rely onratio of core deposits to total deposits decreased from 76.1% as of December 31, 2014 to 74.7% as of December 31, 2015, primarily due to the shift in deposit mix and increase in brokered deposits.
The Company believes theCompany's growth in deposits and the shift in the mix of deposits in 20132015 and 20122014 were due in part to expansion of itsthe Company's cash management capabilities, more effortservices and increased efforts in seeking deposits from existing customer relationships and the desire of certain depositors to place their funds in a more strongly capitalized financial institution and in more liquid accounts.relationships. A rise in interest rates could cause a shift from core deposit accounts to certificate of deposit accounts with longer maturities. Generally, the rates paid on certificates of deposit are higher than those paid on core deposit accounts.
The following table sets forth the distribution of the average balances of the Company's deposit accounts for the years indicated and the weighted average interest rates on each category of deposits presented. Averages for the years presented are based on daily balances.
| | | | Year Ended December 31, | Year Ended December 31, |
| | 2013 | | 2012 | | 2011 | 2015 | | 2014 | | 2013 |
| | Average Balance | | Percent of Total Average Deposits | | Weighted Average Rate | | Average Balance | | Percent of Total Average Deposits | | Weighted Average Rate | | Average Balance | | Percent of Total Average Deposits | | Weighted Average Rate | Average Balance | | Percent of Total Average Deposits | | Weighted Average Rate | | Average Balance | | Percent of Total Average Deposits | | Weighted Average Rate | | Average Balance | | Percent of Total Average Deposits | | Weighted Average Rate |
| | (Dollars in Thousands) | (Dollars in Thousands) |
| Core deposits: | | | | | | | | | | | | | | | | | | | | | | | | | | | | | | | | | | |
| Non-interest-bearing demand checking accounts | $ | 656,724 |
| | 17.7 | % | | — | % | | $ | 562,238 |
| | 16.0 | % | | — | % | | $ | 181,078 |
| | 8.6 | % | | — | % | $ | 770,045 |
| | 18.5 | % | | — | % | | $ | 700,815 |
| | 18.1 | % | | — | % | | $ | 648,852 |
| | 17.5 | % | | — | % |
| NOW accounts | 198,050 |
| | 5.3 | % | | 0.09 | % | | 183,046 |
| | 5.2 | % | | 0.11 | % | | 126,950 |
| | 6.0 | % | | 0.17 | % | 249,204 |
| | 6.0 | % | | 0.07 | % | | 220,377 |
| | 5.7 | % | | 0.08 | % | | 205,922 |
| | 5.6 | % | | 0.09 | % |
| Savings accounts | 509,436 |
| | 13.7 | % | | 0.25 | % | | 517,485 |
| | 14.7 | % | | 0.33 | % | | 157,578 |
| | 7.4 | % | | 0.60 | % | 532,496 |
| | 12.8 | % | | 0.21 | % | | 518,741 |
| | 13.4 | % | | 0.23 | % | | 509,436 |
| | 13.7 | % | | 0.25 | % |
| Money market accounts | 1,370,195 |
| | 37.0 | % | | 0.60 | % | | 1,203,113 |
| | 34.1 | % | | 0.73 | % | | 830,780 |
| | 39.4 | % | | 0.92 | % | 1,560,437 |
| | 37.5 | % | | 0.44 | % | | 1,526,915 |
| | 39.3 | % | | 0.51 | % | | 1,370,195 |
| | 37.0 | % | | 0.60 | % |
| Total core deposits | 2,734,405 |
| | 73.8 | % | | 0.35 | % | | 2,465,882 |
| | 70.0 | % | | 0.43 | % | | 1,296,386 |
| | 61.4 | % | | 0.68 | % | 3,112,182 |
| | 74.9 | % | | 0.26 | % | | 2,966,848 |
| | 76.5 | % | | 0.31 | % | | 2,734,405 |
| | 73.8 | % | | 0.35 | % |
| Certificate of deposit accounts | 971,044 |
| | 26.2 | % | | 0.94 | % | | 1,055,510 |
| | 30.0 | % | | 1.02 | % | | 813,470 |
| | 38.6 | % | | 1.35 | % | 1,045,328 |
| | 25.1 | % | | 0.78 | % | | 911,072 |
| | 23.5 | % | | 0.86 | % | | 971,044 |
| | 26.2 | % | | 0.94 | % |
| Total deposits | $ | 3,705,449 |
| | 100.00 | % | | |
| | $ | 3,521,392 |
| | 100.00 | % | | |
| | $ | 2,109,856 |
| | 100.00 | % | | |
| $ | 4,157,510 |
| | 100.0 | % | | 0.44 | % | | $ | 3,877,920 |
| | 100.0 | % | | 0.51 | % | | $ | 3,705,449 |
| | 100.0 | % | | 0.61 | % |
AtAs of December 31, 20132015 and 2012,2014, the Company had outstanding certificatescertificate of deposit of $100,000$250,000 or more, maturing as follows:
| | | | At December 31, | At December 31, |
| | 2013 | | 2012 | 2015 | | 2014 |
| | Amount | | Weighted Average Rate | | Amount | | Weighted Average Rate | Amount | | Weighted Average Rate | | Amount | | Weighted Average Rate |
| | (Dollars in Thousands) | (Dollars in Thousands) |
| Maturity period: | | | | | | | | | | | | | | |
| Six months or less | $ | 181,598 |
| | 0.70 | % | | $ | 172,176 |
| | 0.90 | % | $ | 67,361 |
| | 0.67 | % | | $ | 81,937 |
| | 0.66 | % |
| Over six months through 12 months | 139,154 |
| | 0.86 | % | | 158,057 |
| | 1.01 | % | 54,135 |
| | 1.03 | % | | 33,602 |
| | 0.93 | % |
| Over 12 months | 103,937 |
| | 1.32 | % | | 114,572 |
| | 1.41 | % | 46,856 |
| | 1.52 | % | | 43,298 |
| | 1.30 | % |
| | $ | 424,689 |
| | 0.91 | % | | $ | 444,805 |
| | 1.07 | % | |
| Total certificate of deposit of $250,000 or more | | $ | 168,352 |
| | 1.02 | % | | $ | 158,837 |
| | 0.89 | % |
Borrowed Funds
The following table sets forth certain information regarding FHLBB advances, subordinated debentures and notes and other borrowed funds for the dates indicated:
|
| | | | | | | | | | | |
| | Year Ended December 31, |
| | 2015 | | 2014 | | 2013 |
| | (Dollars in Thousands) |
| Borrowed funds: | | | | | |
| Average balance outstanding | $ | 957,437 |
| | $ | 994,734 |
| | $ | 808,007 |
|
| Maximum amount outstanding at any month end during the year | 1,094,459 |
| | 1,132,957 |
| | 838,588 |
|
| Balance outstanding at end of year | 983,029 |
| | 1,126,404 |
| | 812,555 |
|
| Weighted average interest rate for the period | 1.55 | % | | 1.22 | % | | 1.39 | % |
| Weighted average interest rate at end of period | 1.55 | % | | 1.37 | % | | 1.36 | % |
Advances from the FHLBB
On a long-term basis, the Company intends to continue to increase its core deposits. The Company also uses FHLBB borrowings and other wholesale borrowing opportunistically as part of the Company's overall strategy to fund loan growth and manage interest-rate risk and liquidity. The advances are secured by a blanket security agreement which requires the Banks to maintain as collateral certain qualifying assets as collateral, principally mortgage loans and securities in an aggregate amount at least equal to outstanding advances. The maximum amount that the FHLBB will advance to member institutions, including the Company, fluctuates from time to time in accordance with the policies of the FHLBB. The Company may also borrow from the FRB's "discount window" as necessary.
FHLBB borrowings decreased by $22.1$142.2 million to $768.8 million at$0.9 billion as of December 31, 20132015 from the December 31, 20122014 balance of $790.9 million.
The following table sets forth certain information regarding FHLBB advances and other borrowed funds forfrom the dates indicated:
|
| | | | | | | | | | | |
| | Year Ended December 31, |
| | 2013 | | 2012 | | 2011 |
| | (Dollars in Thousands) |
| Borrowed funds: | | | | | |
| Average balance outstanding | $ | 808,007 |
| | $ | 792,954 |
| | $ | 422,128 |
|
| Maximum amount outstanding at any month end during the year | 838,588 |
| | 853,969 |
| | 506,919 |
|
| Balance outstanding at end of year | 812,555 |
| | 853,969 |
| | 506,919 |
|
| Weighted average interest rate for the year | 1.41 | % | | 1.82 | % | | 2.51 | % |
| Weighted average interest rate at end of year | 1.36 | % | | 2.06 | % | | 2.22 | % |
Repurchase Agreements
The Company periodically enters into repurchase agreements with its larger deposit and commercial customers as part of its cash management services which are typically overnight borrowings. Short-term borrowings and repurchase agreements with Company customers decreased $16.4$1.4 million to $34.6$38.2 million in 2013as of December 31, 2015 from $51.0$39.6 million in 2012.as of December 31, 2014.
Subordinated DebtDebentures and Other BorrowingsNotes
In connection with the acquisition of Bancorp Rhode Island, Inc., the Company assumed 3three subordinated debentures issued by a subsidiary of Bancorp Rhode Island, Inc. One of these subordinated debenture forin the amount of $3.0 million was called in the first quarter of 2013 due to its high fixed rate.
On September 15, 2014, the Company offered $75.0 million of 6.0% fixed-to-floating subordinated notes due September
15, 2029. The two remainingCompany is obligated to pay 6.0% interest semiannually between September 2014 and September 2024. Subsequently, the Company is obligated to pay 3-month LIBOR plus 3.315% quarterly until the notes mature in September 2029. As of December 31, 2015, the Company capitalized $1.4 million in relation to the issuance of these subordinated notes.
The following table summarizes the Company's subordinated debentures are summarized below:and notes at the dates indicated.
| | | At December 31, 2013: | | | | | | | | | |
| | | | | | | | | | Carrying Amount |
| Issue Date | | Rate | | Fair Market Rate at BankRI Acquisition | | Maturity Date | | Next Call Date | | Carrying Amount | | Rate | | Maturity Date | | Next Call Date | | December 31, 2015 | | December 31, 2014 |
| | | (Dollars in Thousands) | | (Dollars in Thousands) |
| June 26, 2003 | | Variable; 3-month LIBOR + 3.10% | | 6.45 | % | | June 26, 2033 | | March 26, 2014 | | $ | 4,666 |
| | Variable; 3-month LIBOR + 3.10% | | June 26, 2033 | | March 28, 2016 | | $ | 4,725 |
| | $ | 4,696 |
|
| March 17, 2004 | | Variable; 3-month LIBOR + 2.79% | | 6.45 | % | | March 17, 2034 | | March 17, 2014 | | $ | 4,497 |
| | Variable; 3-month LIBOR + 2.79% | | March 17, 2034 | | March 17, 2016 | | $ | 4,589 |
| | $ | 4,543 |
|
| September 15, 2014 | | | 6.0% Fixed-to-Variable; 3-month LIBOR + 3.315% | | September 15, 2029 | | September 15, 2024 | | $ | 73,624 |
| | $ | 73,524 |
|
|
| | | | | | | | | | | | | |
| At December 31, 2012: | | | | | | | | |
| Issue Date | | Rate | | Fair Market Rate at BankRI Acquisition | | Maturity Date | | Next Call Date | | Carrying Amount |
| | | (Dollars in Thousands) |
| February 22, 2001 | | Fixed; 10.2% | | 3.00 | % | | February 22, 2031 | | February 22, 2013 | | $ | 3,000 |
|
| June 26, 2003 | | Variable; 3-month LIBOR + 3.10% | | 6.45 | % | | June 26, 2033 | | March 26, 2013 | | $ | 4,641 |
|
| March 17, 2004 | | Variable; 3-month LIBOR + 2.79% | | 6.45 | % | | March 17, 2034 | | March 17, 2013 | | $ | 4,450 |
|
Derivative Financial Instruments
The Company has entered into interest-rate swaps with certain of its commercial customers and concurrently enters into offsetting swaps with third-party financial institutions. The Company did not have derivative fair value hedges or derivative cash flow hedges at December 31, 20132015 or 2012.2014. The following table summarizes certain information concerning the Company's interest-rate swaps at December 31, 2015 and 2014:
|
| | | | | | |
| | At December 31, 2015 | At December 31, 2014 |
| | (Dollars in Thousands) |
| Notional principal amounts | $ | 490,632 |
| $ | 109,362 |
|
| Fixed weighted average interest rate from the Company to counterparty | 4.30 | % | 4.72 | % |
| Floating weighted average interest rate from counterparty to the Company | 2.40 | % | 2.12 | % |
| Weighted average remaining term to maturity (in months) | 100 |
| 100 |
|
| Fair value: | | |
| Recognized as an asset | $ | 8,656 |
| $ | 2,676 |
|
| Recognized as a liability | $ | 8,781 |
| $ | 2,714 |
|
Stockholders' Equity and Dividends
The Company's total stockholders' equity was $667.5 million as of December 31, 2015, representing a $25.7 million increase compared to $641.8 million at December 31, 2014. The increase is due to net income of $49.8 million for the year ended December 31, 2015, which was partially offset by dividends paid by the Company of $25.0 million in 2015.
For the year ended December 31, 2015, the dividend payout ratio was 50.2%, compared to 55.2% for the year ended December 31, 2014. The dividends paid in the fourth quarter of 2015 represented the Company's 67th consecutive quarter of dividend payments. Additionally, the Company increased the quarterly dividend distribution from $0.085 per share to $0.09 per share in the second quarter of 2015.
In 2015, 2014 and 2013, no shares of the Company's common stock were repurchased by the Company. On October 29, 2014, the Company’s Board of Directors authorized a stock repurchase program to acquire up to $10.0 million of total outstanding shares of the Company's common stock over a period of fourteen months ending on December 31, 2015. As of December 31, 2015, no shares were repurchased under the stock repurchase program.
On February 4, 2016, the Company's Board of Directors authorized a stock repurchase program to acquire up to $10.0 million of total outstanding shares of the Company's common stock over a period of twelve months ending on January 31, 2017. Repurchases may be made from time to time depending on market conditions and 2012:other factors, and will be conducted through open market or private transactions, through block trades, and pursuant to any trading plan that may be adopted in accordance with the Securities and Exchange Commission Rule 10b5-1. There is no guarantee as to the exact number of shares, if any, to be repurchased by the Company.
Stockholders' equity represented 11.05% of total assets as of December 31, 2015 and 11.06% of total assets as of December 31, 2014. Tangible stockholders' equity (total stockholders' equity less goodwill and identified intangible assets, net) represented 8.81% of tangible assets (total assets less goodwill and identified intangible assets, net) as of December 31, 2015 and 8.68% as of December 31, 2014.
Results of Operations
The primary drivers of the Company's net income are net interest income, which is strongly affected by the net yield on and growth of interest-earning assets and liabilities ("net interest margin"), the quality of the Company's assets, its levels of non-interest income and non-interest expense, and its tax provision.
The Company's net interest income represents the difference between interest income earned on its investments, loans and leases, and its cost of funds. Interest income is dependent on the amount of interest-earning assets outstanding during the period and the yield earned thereon. Cost of funds is a function of the average amount of deposits and borrowed money outstanding during the year and the interest rates paid thereon. The net interest margin is calculated by dividing net interest income by average interest-earning assets. Net interest spread is the difference between the average rate earned on interest-earning assets and the average rate paid on interest-bearing liabilities. The increases or decreases, as applicably in the components of interest income and interest expense, expressed in terms of fluctuation in average volume and rate, are
summarized under "Rate/Volume Analysis" below. Information as to the components of interest income, interest expense and average rates is provided under "Average Balances, Net Interest Income, Interest-Rate Spread and Net Interest Margin" below.
Because the Company's assets and liabilities are not identical in duration and in repricing dates, the differential between the two is vulnerable to changes in market interest rates as well as the overall shape of the yield curve. These vulnerabilities are inherent to the business of banking and are commonly referred to as "interest-rate risk." How interest-rate risk is measured and, once measured, how much interest-rate risk is taken are based on numerous assumptions and other subjective judgments. See the discussion in the "Measuring Interest-Rate Risk" section of Item 7A, "Quantitative and Qualitative Disclosures about Market Risk" below.
The quality of the Company's assets also influences its earnings. Loans and leases that are not paid on a timely basis and exhibit other weaknesses can result in the loss of principal and/or interest income. Additionally, the Company must make timely provisions to the allowance for loan and lease losses based on estimates of probable losses inherent in the loan and lease portfolio. These additions, which are charged against earnings, are necessarily greater when greater probable losses are expected. Further, the Company incurs expenses as a result of resolving troubled assets. These variables reflect the "credit risk" that the Company takes on in the ordinary course of business and are further discussed under "Financial Condition—Asset Quality" above.
Average Balances, Net Interest Income, Interest-Rate Spread and Net Interest Margin
The following table sets forth information about the Company's average balances, interest income and interest rates earned on average interest-earning assets, interest expense and interest rates paid on average interest-bearing liabilities, interest-rate spread and net interest margin for the years ended December 31, 2015, 2014 and 2013. Average balances are derived from daily average balances and yields include fees, costs and purchase-accounting-related premiums and discounts which are considered adjustments to coupon yields in accordance with GAAP. Certain amounts previously reported have been reclassified to conform to the current presentation.
|
| | | | | | |
| | At December 31, 2013 | At December 31, 2012 |
| | (Dollars in Thousands) |
| Notional principal amounts | $ | 22,418 |
| $ | 33,221 |
|
| Fixed weighted average interest rate from customer to counterparty | 5.66 | % | 5.15 | % |
| Floating weighted average rate from counterparty | 3.45 | % | 2.63 | % |
| Weighted average remaining term to maturity (in months) | 47 |
| 41 |
|
| Fair value: | | |
| Recognized as an asset | $ | 825 |
| $ | 1,317 |
|
| Recognized as a liability | $ | 856 |
| $ | 1,380 |
|
|
| | | | | | | | | | | | | | | | | | | | | | | | | | | | | | | | |
| | Year Ended December 31, |
| | 2015 | | 2014 | | 2013 |
| | Average Balance | | Interest (1) | | Average Yield/ Cost | | Average Balance | | Interest (1) | | Average Yield/ Cost | | Average Balance | | Interest (1) | | Average Yield/ Cost |
| | (Dollars in Thousands) |
| Assets: | | | | | | | | | | | | | | | | | |
| Interest-earning assets: | | | | | | | | | | | | | | | | | |
| Debt securities | $ | 583,921 |
| | $ | 11,521 |
| | 1.97 | % | | $ | 518,920 |
| | $ | 9,531 |
| | 1.84 | % | | $ | 476,387 |
| | $ | 7,983 |
| | 1.68 | % |
| Marketable and restricted equity securities | 73,808 |
| | 2,793 |
| | 3.78 | % | | 72,151 |
| | 2,112 |
| | 2.93 | % | | 68,306 |
| | 1,223 |
| | 1.79 | % |
| Short-term investments | 56,520 |
| | 128 |
| | 0.23 | % | | 45,560 |
| | 102 |
| | 0.22 | % | | 62,258 |
| | 111 |
| | 0.18 | % |
| Total investments | 714,249 |
| | 14,442 |
| | 2.02 | % | | 636,631 |
| | 11,745 |
| | 1.84 | % | | 606,951 |
| | 9,317 |
| | 1.54 | % |
| Commercial real estate loans (2) | 2,529,566 |
| | 106,447 |
| | 4.21 | % | | 2,324,934 |
| | 103,324 |
| | 4.42 | % | | 2,091,860 |
| | 98,245 |
| | 4.67 | % |
| Commercial loans (2) | 636,084 |
| | 26,590 |
| | 4.13 | % | | 522,208 |
| | 21,341 |
| | 4.04 | % | | 435,184 |
| | 20,580 |
| | 4.68 | % |
| Equipment financing (2) | 650,376 |
| | 44,468 |
| | 6.84 | % | | 554,240 |
| | 39,807 |
| | 7.18 | % | | 452,601 |
| | 31,076 |
| | 6.87 | % |
| Indirect automobile loans (2) | 83,218 |
| | 2,686 |
| | 3.23 | % | | 366,217 |
| | 11,812 |
| | 3.23 | % | | 475,387 |
| | 17,355 |
| | 3.65 | % |
| Residential mortgage loans (2) | 600,072 |
| | 21,455 |
| | 3.58 | % | | 551,481 |
| | 19,957 |
| | 3.62 | % | | 511,348 |
| | 19,926 |
| | 3.90 | % |
| Other consumer loans (2) | 311,855 |
| | 11,792 |
| | 3.78 | % | | 280,663 |
| | 11,189 |
| | 3.98 | % | | 263,955 |
| | 10,624 |
| | 4.02 | % |
| Total loans and leases | 4,811,171 |
| | 213,438 |
| | 4.44 | % | | 4,599,743 |
| | 207,430 |
| | 4.51 | % | | 4,230,335 |
| | 197,806 |
| | 4.68 | % |
| Total interest-earning assets | 5,525,420 |
| | 227,880 |
| | 4.12 | % | | 5,236,374 |
| | 219,175 |
| | 4.19 | % | | 4,837,286 |
| | 207,123 |
| | 4.28 | % |
| Allowance for loan and lease losses | (55,950 | ) | | | | | | (51,480 | ) | | | | | | (44,008 | ) | | | | |
| Non-interest-earning assets | 371,279 |
| | | | | | 371,330 |
| | | | | | 380,954 |
| | | | |
| Total assets | $ | 5,840,749 |
| | | | | | $ | 5,556,224 |
| | | | | | $ | 5,174,232 |
| | | | |
| Liabilities and Stockholders' Equity: | | | | | | | | | | | | | | | | | |
| Interest-bearing liabilities: | | | | | | | | | | | | | | | | | |
| Interest-bearing deposits: | | | | | | | | | | | | | | | | | |
| NOW accounts | $ | 249,204 |
| | 179 |
| | 0.07 | % | | $ | 220,377 |
| | 171 |
| | 0.08 | % | | $ | 205,922 |
| | 173 |
| | 0.08 | % |
| Savings accounts | 532,496 |
| | 1,094 |
| | 0.21 | % | | 518,741 |
| | 1,197 |
| | 0.23 | % | | 509,436 |
| | 1,288 |
| | 0.25 | % |
| Money market accounts | 1,560,437 |
| | 6,935 |
| | 0.44 | % | | 1,526,915 |
| | 7,846 |
| | 0.51 | % | | 1,370,195 |
| | 8,220 |
| | 0.60 | % |
| Certificate of deposit | 1,045,328 |
| | 9,272 |
| | 0.78 | % | | 911,072 |
| | 7,846 |
| | 0.86 | % | | 971,044 |
| | 9,092 |
| | 0.94 | % |
| Total interest-bearing deposits (3) | 3,387,465 |
| | 17,480 |
| | 0.52 | % | | 3,177,105 |
| | 17,060 |
| | 0.54 | % | | 3,056,597 |
| | 18,773 |
| | 0.61 | % |
| Advances from the FHLBB | 840,123 |
| | 9,950 |
| | 1.17 | % | | 935,400 |
| | 10,535 |
| | 1.11 | % | | 759,640 |
| | 10,886 |
| | 1.43 | % |
| Subordinated debentures and notes | 82,846 |
| | 5,001 |
| | 6.04 | % | | 30,766 |
| | 1,740 |
| | 5.66 | % | | 9,548 |
| | 439 |
| | 4.60 | % |
| Other borrowed funds | 34,468 |
| | 114 |
| | 0.33 | % | | 28,568 |
| | 79 |
| | 0.28 | % | | 38,819 |
| | 68 |
| | 0.18 | % |
| Total borrowed funds | 957,437 |
| | 15,065 |
| | 1.55 | % | | 994,734 |
| | 12,354 |
| | 1.22 | % | | 808,007 |
| | 11,393 |
| | 1.39 | % |
| Total interest-bearing liabilities | 4,344,902 |
| | 32,545 |
| | 0.75 | % | | 4,171,839 |
| | 29,414 |
| | 0.71 | % | | 3,864,604 |
| | 30,166 |
| | 0.78 | % |
| Non-interest-bearing liabilities: | | | | | | | | | | | | | | | | | |
| Non-interest-bearing demand checking accounts (3) | 770,045 |
| | |
| | |
| | 700,815 |
| | |
| | |
| | 648,852 |
| | |
| | |
|
| Other non-interest-bearing liabilities | 62,914 |
| | |
| | |
| | 48,378 |
| | |
| | |
| | 40,574 |
| | |
| | |
|
| Total liabilities | 5,177,861 |
| | |
| | |
| | 4,921,032 |
| | |
| | |
| | 4,554,030 |
| | |
| | |
|
| Brookline Bancorp, Inc. stockholders' equity | 657,841 |
| | |
| | |
| | 630,966 |
| | |
| | |
| | 616,473 |
| | |
| | |
|
| Noncontrolling interest in subsidiary | 5,047 |
| | |
| | |
| | 4,226 |
| | |
| | |
| | 3,729 |
| | |
| | |
|
| Total liabilities and equity | $ | 5,840,749 |
| | |
| | |
| | $ | 5,556,224 |
| | |
| | |
| | $ | 5,174,232 |
| | |
| | |
|
| Net interest income (tax-equivalent basis) / Interest-rate spread (4) | |
| | 195,335 |
| | 3.37 | % | | |
| | 189,761 |
| | 3.48 | % | | |
| | 176,957 |
| | 3.50 | % |
| Less adjustment of tax-exempt income | |
| | 970 |
| | |
| | |
| | 693 |
| | |
| | |
| | 739 |
| | |
|
| Net interest income | |
| | $ | 194,365 |
| | |
| | |
| | $ | 189,068 |
| | |
| | |
| | $ | 176,218 |
| | |
|
| Net interest margin (5) | |
| | |
| | 3.54 | % | | |
| | |
| | 3.61 | % | | |
| | |
| | 3.64 | % |
| |
| (1) | Tax-exempt income on debt securities, equity securities and revenue bonds included in commercial real estate loans is included on a tax-equivalent basis. |
| |
| (2) | Loans on nonaccrual status are included in the average balances. |
| |
| (3) | Including non-interest-bearing checking accounts, the average interest rate on total deposits was 0.42%, 0.44% and 0.51% in the years ended December 31, 2015, 2014 and 2013, respectively. |
| |
| (4) | Interest-rate spread represents the difference between the yield on interest-earning assets and the cost of interest-bearing liabilities. |
| |
| (5) | Net interest margin represents net interest income (tax equivalent basis) divided by average interest-earning assets. |
See "Comparison of Years Ended December 31, 2015 and December 31, 2014" and "Comparison of Years Ended December 31, 2014 and December 31, 2013" below for a discussion of average assets and liabilities, net interest income, interest-rate spread and net interest margin.
Rate/Volume Analysis
The following table presents, on a tax-equivalent basis, the extent to which changes in interest rates and changes in volume of interest-earning assets and interest-bearing liabilities have affected the Company's interest income and interest expense during the periods indicated. Information is provided in each category with respect to: (i) changes attributable to changes in volume (changes in volume multiplied by prior rate), (ii) changes attributable to changes in rate (changes in rate multiplied by prior volume), and (iii) the net change. The changes attributable to the combined impact of volume and rate have been allocated proportionately to the changes due to volume and the changes due to rate.
|
| | | | | | | | | | | | | | | | | | | | | | | |
| | Year Ended
December 31, 2015
Compared to Year Ended
December 31, 2014 | | Year Ended
December 31, 2014
Compared to Year Ended
December 31, 2013 |
| | Increase (Decrease) Due To | | | | Increase (Decrease) Due To | | |
| | Volume | | Rate | | Net Change | | Volume | | Rate | | Net Change |
| | (In Thousands) |
| Interest and dividend income: | | | | | | | | | | | |
| Investments: | | | | | | | | | | | |
| Debt securities | $ | 1,196 |
| | $ | 794 |
| | 1,990 |
| | $ | 749 |
| | $ | 799 |
| | $ | 1,548 |
|
| Marketable and restricted equity securities | 49 |
| | 632 |
| | 681 |
| | 72 |
| | 817 |
| | 889 |
|
| Short-term investments | 24 |
| | 2 |
| | 26 |
| | (32 | ) | | 23 |
| | (9 | ) |
| Total investments | 1,269 |
| | 1,428 |
| | 2,697 |
| | 789 |
| | 1,639 |
| | 2,428 |
|
| Loans and leases: | | | | | | | | | | | |
| Commercial real estate loans | 9,045 |
| | (5,922 | ) | | 3,123 |
| | 10,458 |
| | (5,379 | ) | | 5,079 |
|
| Commercial loans and leases | 4,601 |
| | 648 |
| | 5,249 |
| | 3,752 |
| | (2,991 | ) | | 761 |
|
| Equipment financing | 6,903 |
| | (2,242 | ) | | 4,661 |
| | 7,255 |
| | 1,476 |
| | 8,731 |
|
| Indirect automobile loans | (9,141 | ) | | 15 |
| | (9,126 | ) | | (3,691 | ) | | (1,852 | ) | | (5,543 | ) |
| Residential mortgage loans | 1,759 |
| | (261 | ) | | 1,498 |
| | 1,502 |
| | (1,471 | ) | | 31 |
|
| Other consumer loans | 1,241 |
| | (638 | ) | | 603 |
| | 677 |
| | (112 | ) | | 565 |
|
| Total loans | 14,408 |
| | (8,400 | ) | | 6,008 |
| | 19,953 |
| | (10,329 | ) | | 9,624 |
|
| Total change in interest and dividend income | 15,677 |
| | (6,972 | ) | | 8,705 |
| | 20,742 |
| | (8,690 | ) | | 12,052 |
|
| Interest expense: | | | | | | | | | | | |
| Deposits: | | | | | | | | | | | |
| NOW accounts | 23 |
| | (15 | ) | | 8 |
| | 8 |
| | (10 | ) | | (2 | ) |
| Savings accounts | 32 |
| | (135 | ) | | (103 | ) | | 24 |
| | (115 | ) | | (91 | ) |
| Money market accounts | 171 |
| | (1,082 | ) | | (911 | ) | | 905 |
| | (1,279 | ) | | (374 | ) |
| Certificate of deposit | 724 |
| | 702 |
| | 1,426 |
| | (537 | ) | | (709 | ) | | (1,246 | ) |
| Total deposits | 950 |
| | (530 | ) | | 420 |
| | 400 |
| | (2,113 | ) | | (1,713 | ) |
| Borrowed funds: | | | | | | | | | | | |
| Advances from the FHLBB | (1,058 | ) | �� | 473 |
| | (585 | ) | | 2,293 |
| | (2,644 | ) | | (351 | ) |
| Subordinated debentures and notes | 2,948 |
| | 313 |
| | 3,261 |
| | 1,179 |
| | 122 |
| | 1,301 |
|
| Other borrowed funds | 17 |
| | 18 |
| | 35 |
| | (21 | ) | | 32 |
| | 11 |
|
| Total borrowed funds | 1,907 |
| | 804 |
| | 2,711 |
| | 3,451 |
| | (2,490 | ) | | 961 |
|
| Total change in interest expense | 2,857 |
| | 274 |
| | 3,131 |
| | 3,851 |
| | (4,603 | ) | | (752 | ) |
| Change in tax-exempt income | — |
| | (277 | ) | | (277 | ) | | — |
| | 46 |
| | 46 |
|
| Change in net interest income | $ | 12,820 |
| | $ | (7,523 | ) | | $ | 5,297 |
| | $ | 16,891 |
| | $ | (4,041 | ) | | $ | 12,850 |
|
See "Comparison of Years Ended December 31, 2015 and December 31, 2014" and "Comparison of Years Ended December 31, 2014 and December 31, 2013" below for a discussion of changes in interest income, interest-rate spread and net interest margin resulting from changes in rates and volumes.
Comparison of Years Ended December 31, 2015 and December 31, 2014
Net Interest Income
Net interest income increased $5.3 million to $194.4 million for the year ended December 31, 2015 from $189.1 million for the year ended December 31, 2014. The increase year over year reflects a $5.8 million increase in interest income on loans and leases, a $1.9 million increase in interest income on debt securities, offset by a $3.1 million increase in interest expense on deposit and borrowings, which is reflective of the various portfolios repricing and replacing balances into the current low interest rate environment.
Net interest margin decreased by 7 basis points, to 3.54% in 2015 from 3.61% in 2014. Competitive pressures on loan pricing resulted in decreases in the Company's weighted average interest rate on loans (prior to purchase accounting adjustments) to 4.44% for the year ended December 31, 2015 from 4.51% for the year ended December 31, 2014. Interest amortization and accretion on acquired loans totaled $4.5 million and contributed 9 basis points to 2015 loan yields, compared to $8.4 million and 16 basis points in 2014. The decrease in the net interest margin is the result of repricing interest-earning assets in a lower interest rate environment without a comparable offset in lower funding costs.
The yield on interest-earning assets decreased to 4.12% for the year ended December 31, 2015 from 4.19% for the year ended December 31, 2014. This decrease is the result of the continued pricing pressure due to the low interest rate environment and the intense competition in most loan categories, as well as a decrease in accretion on acquired loans and leases, offset by an increase in prepayment penalties and late charges. During the year ended December 31, 2015, the Company recorded $3.2 million in prepayment penalties and late charges, which contributed 6 basis points to yields on interest-earning assets, in the year ended December 31, 2015, compared to $2.2 million, or 4 basis points, for the year ended December 31, 2014.
The overall cost of funds (including non-interest-bearing demand checking accounts) increased 4 basis points to 0.75% for the year ended December 31, 2015 from 0.71% for the year ended December 31, 2014. The increase was primarily driven by the issuance of the $75.0 million subordinated notes in September 2014. Refer to "Financial Condition - Borrowed Funds" above for more details.
Future net interest income, net interest spread and net interest margin may continue to be negatively affected by a number of factors including: the low interest-rate environment, ongoing pricing pressures in both loan and deposit portfolios, the ability of the Company to increase its core deposit ratio, the ability of the Company to increase its non-interest-bearing deposits as a percentage of total deposits, decrease its loan-to-deposit ratio, or decrease its reliance on FHLBB advances. It may also be negatively affected by changes in the amount of purchase accounting accretion and amortization included in interest income and interest expense.
Interest Income—Loans and Leases
|
| | | | | | | | | | | | | | |
| | Year Ended December 31, | | Dollar Change | | Percent Change |
| | 2015 | | 2014 | | |
| | (Dollars in Thousands) |
| Interest income—loans and leases: | | | | | | | |
| Commercial real estate loans | $ | 106,447 |
| | $ | 102,852 |
| | $ | 3,595 |
| | 3.5 | % |
| Commercial loans | 25,756 |
| | 21,164 |
| | 4,592 |
| | 21.7 | % |
| Equipment financing | 44,468 |
| | 39,807 |
| | 4,661 |
| | 11.7 | % |
| Indirect automobile loans | 2,686 |
| | 11,812 |
| | (9,126 | ) | | (77.3 | )% |
| Residential mortgage loans | 21,455 |
| | 19,957 |
| | 1,498 |
| | 7.5 | % |
| Other consumer loans | 11,792 |
| | 11,189 |
| | 603 |
| | 5.4 | % |
| Total interest income—loans and leases | $ | 212,604 |
| | $ | 206,781 |
| | $ | 5,823 |
| | 2.8 | % |
Interest income from loans and leases was $212.6 million for 2015, and represented a yield on total loans of 4.44%. This compares to $206.8 million of interest on loans and a yield of 4.51% for 2014. This $5.8 million increase in interest income from loans and leases was attributable to an increase of $14.4 million of increased origination volume, which was offset by a decrease of $8.4 million due to the changes in interest rates. The $9.1 million decrease in interest income from the indirect automobile portfolio was the result of the sale of most of the portfolio in the first quarter of 2015 and Management's decision to cease origination indirect automobile loans in December 31, 2014.
Accretion on acquired loans and leases of $4.5 million contributed 9 basis points to the Company's net interest margin for the year ended December 31, 2015, compared to 8.4 million and 16 basis points for the year ended December 31, 2014. This decrease was due to a reforecast of certain acquired loans in the equipment financing portfolio, improved credit quality and expected cash flows on certain acquired commercial real estate loans and leases as well as higher amount of loan payoffs during 2014.
Interest Income—Investments
|
| | | | | | | | | | | | | | |
| | Year Ended December 31, | | Dollar Change | | Percent Change |
| | 2015 | | 2014 | | |
| | (Dollars in Thousands) |
| Interest income—investments: | | | | | | | |
| Debt securities | $ | 11,416 |
| | $ | 9,527 |
| | $ | 1,889 |
| | 19.8 | % |
| Marketable and restricted equity securities | 2,762 |
| | 2,072 |
| | 690 |
| | 33.3 | % |
| Short-term investments | 128 |
| | 102 |
| | 26 |
| | 25.5 | % |
| Total interest income—investments | $ | 14,306 |
| | $ | 11,701 |
| | $ | 2,605 |
| | 22.3 | % |
Total investment income was $14.3 million for the year ended December 31, 2015 compared to $11.7 million for the year ended December 31, 2014. As of December 31, 2015, the yield on total investments was 2.02% as compared to 1.84% as of December 31, 2014. This year over year increase in total investment income of $2.6 million, or 22.3%, was driven by a $1.3 million increase due to rates and a $1.4 million increase due to volume. In 2015, the yield on total investments was 2.02% as compared to 1.84% in 2014.
Interest Expense—Deposits and Borrowed Funds
|
| | | | | | | | | | | | | | |
| | Year Ended December 31, | | Dollar Change | | Percent Change |
| | 2015 | | 2014 | | |
| | (Dollars in Thousands) |
| Interest expense: | | | | | | | |
| Deposits: | | | | | | | |
| NOW accounts | $ | 179 |
| | $ | 171 |
| | $ | 8 |
| | 4.7 | % |
| Savings accounts | 1,094 |
| | 1,197 |
| | (103 | ) | | (8.6 | )% |
| Money market accounts | 6,935 |
| | 7,846 |
| | (911 | ) | | (11.6 | )% |
| Certificate of deposit | 9,272 |
| | 7,846 |
| | 1,426 |
| | 18.2 | % |
| Total interest expense—deposits | 17,480 |
| | 17,060 |
| | 420 |
| | 2.5 | % |
| Borrowed funds: | | | | | | | |
| Advances from the FHLBB | 9,950 |
| | 10,535 |
| | (585 | ) | | (5.6 | )% |
| Subordinated debentures and notes | 5,001 |
| | 1,740 |
| | 3,261 |
| | 187.4 | % |
| Other borrowed funds | 114 |
| | 79 |
| | 35 |
| | 44.3 | % |
| Total interest expense—borrowed funds | 15,065 |
| | 12,354 |
| | 2,711 |
| | 21.9 | % |
| Total interest expense | $ | 32,545 |
| | $ | 29,414 |
| | $ | 3,131 |
| | 10.6 | % |
Deposits
Except for certificate of deposits, ongoing declines in the interest rates paid on deposits contributed to reductions in the Company’s overall cost of deposits.
In 2015, interest paid on deposits increased $0.4 million, or 2.5%, as compared to 2014. Interest expense increased $1.0 million due to the growth in deposits, offset by a $0.5 million decrease in deposit-related interest expense driven by a decrease in interest rates. Purchase accounting accretion on acquired deposits was $0.2 million for the year ended December 31, 2015, compared to $0.2 million for the year ended December 31, 2014. Purchase accounting accretion did not impact the Company's net interest margin in either year.
Borrowed Funds
As of December 31, 2015 the Company's borrowed funds include: $0.9 billion in FHLBB advances, $82.9 million in subordinated debentures and notes, and $38.2 million in other borrowed funds. In 2015, the average balance of FHLBB advances decreased $95.3 million, or 10.2%, while the average balance of subordinated debentures and notes increased $52.1 million, or 169.3%. Other borrowed funds, which include repurchase agreements, increased $5.9 million, or 20.7% for the year ended December 31, 2015.
During the year ended December 31, 2015, interest paid on borrowed funds increased $2.7 million, or 21.9% year over year, primarily driven by liabilities on subordinated notes issued during the third quarter of 2014. The cost of borrowed funds was 1.55% for the year ended December 31, 2015 as compared to 1.22% for the year ended December 31, 2014. This change was driven by an increase of $0.8 million due to borrowing rates and an increase of $1.9 million in interest expense due to volume. For the years ended December 31, 2015 and 2014, the purchase accounting accretion on acquired borrowed funds was $2.8 million which contributed 5 basis points to the Company's net interest margin in both years.
Provision for Credit Losses
The provisions for credit losses are set forth below:
|
| | | | | | | | | | | | | | | | | | | | | | | |
| | Originated | | Acquired | | Total |
| | Year Ended December 31, | | Year Ended December 31, | | Year Ended December 31, |
| | 2015 | | 2014 | | 2015 | | 2014 | | 2015 | | 2014 |
| | (In Thousands) |
| Provision for loan and lease losses: | | | | | | | | | | | |
| Commercial real estate | $ | 1,459 |
| | $ | 5,009 |
| | $ | (352 | ) | | $ | 1,689 |
| | $ | 1,107 |
| | $ | 6,698 |
|
| Commercial | 9,077 |
| | 2,030 |
| | (49 | ) | | 413 |
| | 9,028 |
| | 2,443 |
|
| Indirect automobile | (1,716 | ) | | (864 | ) | | — |
| | — |
| | (1,716 | ) | | (864 | ) |
| Consumer | 953 |
| | 417 |
| | 469 |
| | 59 |
| | 1,422 |
| | 476 |
|
| Unallocated | (2,418 | ) | | (514 | ) | | — |
| | — |
| | (2,418 | ) | | (514 | ) |
| Total provision for loan and lease losses | 7,355 |
| | 6,078 |
| | 68 |
| | 2,161 |
| | 7,423 |
| | 8,239 |
|
| Unfunded credit commitments | 28 |
| | 238 |
| | — |
| | — |
| | 28 |
| | 238 |
|
| Total provision for credit losses | $ | 7,383 |
| | $ | 6,316 |
| | $ | 68 |
| | $ | 2,161 |
| | $ | 7,451 |
| | $ | 8,477 |
|
For the year ended December 31, 2015, the provision for credit losses decreased $1.0 million, or 12.1%, to $7.5 million from $8.5 million for the year ended December 31, 2014. The decrease in the provision for credit losses for the year ended December 31, 2015 was primarily driven by a decrease in the provision related to improved credit characteristics and the continued strong credit quality of the portfolio, as well as a decrease in the provision for the indirect automobile portfolio related to the sale of most of the indirect automobile portfolio in the first quarter of 2015, all of which were partially offset by an increase in the specific reserves for one commercial loan relationship and increases in the reserves for taxi medallion loans as well as net charge offs. See Management's discussion in "Allowances for Credit Losses-Allowance for Loan and Lease Losses" and Note 7, "Allowance for Loan and Lease Losses," to the consolidated financial statements for a description of how Management determined the allowance for loan and lease losses for each portfolio and class of loans.
The liability for unfunded credit commitments, which is included in other liabilities, was $1.3 million as of December 31, 2015 and December 31, 2014 respectively. For the year ended December 31, 2015, the provision for unfunded credit commitments decreased by $0.2 million related to changes in the estimate of loss exposure associated with certain unfunded credit commitments. No credit commitments were charged off against the Company's liability account for the years ended December 31, 2015 and 2014.
Non-Interest Income
The following table sets forth the components of non-interest income:
|
| | | | | | | | | | | | | | |
| | Year Ended December 31, | | Dollar Change | | Percent Change |
| | 2015 | | 2014 | | |
| | (Dollars in Thousands) |
| Deposit fees | $ | 8,730 |
| | $ | 8,692 |
| | $ | 38 |
| | 0.4 | % |
| Loan fees | 1,186 |
| | 1,010 |
| | 176 |
| | 17.4 | % |
| Loan level derivative income, net | 3,397 |
| | 946 |
| | 2,451 |
| | 259.1 | % |
| Gain on sales of loans and leases held-for-sale | 2,208 |
| | 1,651 |
| | 557 |
| | 33.7 | % |
| Gain on sales of investment securities, net | — |
| | 65 |
| | (65 | ) | | (100.0 | )% |
| Gain on sale/disposals of premises and equipment, net | — |
| | 1,502 |
| | (1,502 | ) | | (100.0 | )% |
| Other | 4,663 |
| | 6,314 |
| | (1,651 | ) | | (26.1 | )% |
| Total non-interest income | $ | 20,184 |
| | $ | 20,180 |
| | $ | 4 |
| | — | % |
Total non-interest income remained consistent at $20.2 million for the years ended December 31, 2015 and 2014.
Loan level derivative income, net increased $2.5 million for the year ended December 31, 2015 primarily driven by new loan level interest rate swap agreements completed in the year.
Gain on sale/disposals of premises and equipment decreased $1.5 million for the year ended December 31, 2015 primarily due to the sale of a building in 2014 which resulted in a gain of $1.6 million.
Other income decreased $1.7 million for the year ended December 31, 2015 primarily driven by a $1.4 million legal settlement the Company received from an insurance carrier in relation to litigation in 2014.
Non-Interest Expense
The following table sets forth the components of non-interest expense:
|
| | | | | | | | | | | | | | |
| | Year Ended December 31, | | Dollar Change | | Percent Change |
| | 2015 | | 2014 | | |
| | (Dollars in Thousands) |
| Compensation and employee benefits | $ | 71,272 |
| | $ | 71,801 |
| | $ | (529 | ) | | (0.7 | )% |
| Occupancy | 13,926 |
| | 14,294 |
| | (368 | ) | | (2.6 | )% |
| Equipment and data processing | 14,837 |
| | 17,020 |
| | (2,183 | ) | | (12.8 | )% |
| Professional services | 4,192 |
| | 5,357 |
| | (1,165 | ) | | (21.7 | )% |
| FDIC insurance | 3,510 |
| | 3,362 |
| | 148 |
| | 4.4 | % |
| Advertising and marketing | 3,352 |
| | 3,058 |
| | 294 |
| | 9.6 | % |
| Amortization of identified intangible assets | 2,911 |
| | 3,343 |
| | (432 | ) | | (12.9 | )% |
| Other | 11,377 |
| | 10,925 |
| | 452 |
| | 4.1 | % |
| Total non-interest expense | $ | 125,377 |
| | $ | 129,160 |
| | $ | (3,783 | ) | | (2.9 | )% |
For the year ended December 31, 2015, non-interest expense decreased $3.8 million, or 2.9%, to $125.4 million as compared to the same period in 2014. This decrease is primarily due to a $2.2 million decrease in equipment and data processing expense, a $1.2 million decrease in professional service expense, and a $0.5 million decrease in compensation and employee benefits expense.
The efficiency ratio decreased to 58.44% for the year ended December 31, 2015 from 61.73% for the year ended December 31, 2014. The efficiency ratio improved in 2015 due to a decrease in non-interest expense and an increase in net interest income as a result of continued efforts to drive revenue growth while controlling expenses.
Equipment and data processing expense for the year ended December 31, 2015 decreased $2.2 million compared to the same period in 2014. This decrease was primarily driven by the decrease of core processing system expenses resulting from the sale of the indirect automobile loan portfolio in the first quarter of 2015.
Expenses related to Professional Services for the year ended December 31, 2015 decreased $1.2 million compared to the same period in 2014. The decrease was largely due to lower audit, tax and legal fees incurred in 2015.
Compensation and employee benefits expense for the year ended December 31, 2015 decreased $0.5 million compared to the same period in 2014. The decrease was primarily driven by a decrease in the Company's liability related to a supplemental executive retirement plan and a decrease in employee headcount in 2015.
Provision for Income Taxes
|
| | | | | | | | | | | | | | |
| | Year Ended December 31, | | Dollar Change | | Percent Change |
| | 2015 | | 2014 | | |
| | (Dollars in Thousands) |
| Income before provision for income taxes | $ | 81,721 |
| | $ | 71,611 |
| | $ | 10,110 |
| | 14.1 | % |
| Provision for income taxes | 29,353 |
| | 26,286 |
| | 3,067 |
| | 11.7 | % |
| Net income, before non-controlling interest in subsidiary | $ | 52,368 |
| | $ | 45,325 |
| | $ | 7,043 |
| | 15.5 | % |
| Effective tax rate * | 35.9 | % | | 36.7 | % | | N/A |
| | (2.1 | )% |
(*) Previously reported amounts prior to January 1, 2015 have been restated to reflect a retrospective change in accounting principle for investments in qualified affordable housing projects, in accordance with ASU 2014-01.
The Company recorded income tax expense of $29.4 million for 2015, compared to $26.3 million for 2014. This represents a total effective tax rates of 35.9% and 36.7% for 2015 and 2014, respectively. The decrease in the Company's effective tax rate from 2014 was primarily driven by investments in municipal bonds and the formation of a new security corporation in Massachusetts.
Comparison of Years Ended December 31, 2014 and December 31, 2013
Net Interest Income
For the year ended December 31, 2014, net interest income increased $12.9 million to $189.1 million from $176.2 million for the year ended December 31, 2013. The year over year increase reflects a $9.7 million increase in interest income on loans and leases, a $1.6 million increase in interest income on debt securities, and lower interest expense on deposits and borrowings of $0.8 million which is reflective of the various portfolios repricing and replacing balances in the current low interest rate environment.
Net interest margin decreased by 3 basis points to 3.61% in 2014 from 3.64% in 2013. Competitive pressures on loan pricing resulted in a decrease in the Company's weighted average interest rate on loans (prior to purchase accounting adjustments) to 4.49% for the year ended December 31, 2014 from 4.66% for the year ended December 31, 2013. Interest amortization and accretion on acquired loans totaled $8.4 million and contributed 16 basis points to loan yields in 2014, compared to $4.7 million and 10 basis points in 2013, primarily due to changes in expected cash flows.
The decrease in asset yields in 2014 was offset by a decrease in the total cost of interest-bearing liabilities of 7 basis points, the Company's total cost of interest-bearing liabilities was 0.71% in 2014 compared to 0.78% in 2013. The decrease in the cost of interest-bearing liabilities was driven by a reduction in replacement rates on FHLB borrowings and the interest rates provided for certain deposit products. The cost of interest-bearing deposits decreased 8 basis points to 0.54% in 2014 from 0.62% in 2013 as customers continued to shift funds from certificates of deposits to non-maturity deposit products. For the year ended December 31, 2014, interest amortization and accretion on purchase accounting marks on borrowed funds and certificates of deposits totaled $3.1 million and contributed 5 basis points to the 2014 net interest margin compared to $3.8 million and 8 basis points in 2013.
Future net interest income, net interest spread and net interest margin may continue to be negatively affected by the low interest-rate environment, ongoing pricing pressures in both loan and deposit portfolios, and the ability of the Company to increase its core deposit ratio, increase its non-interest-bearing deposits as a percentage of total deposits, decrease its loan-to-deposit ratio, or decrease its reliance on FHLBB advances. It may also be negatively affected by changes in the amount of purchase accounting accretion and amortization included in interest income and interest expense.
Interest Income—Loans and Leases
|
| | | | | | | | | | | | | | |
| | Year Ended December 31, | | Dollar Change | | Percent Change |
| | 2014 | | 2013 | | |
| | (Dollars in Thousands) |
| Interest income—loans: | | | | | | | |
| Commercial real estate loans | $ | 102,852 |
| | $ | 97,550 |
| | $ | 5,302 |
| | 5.4 | % |
| Commercial loans | 21,164 |
| | 20,567 |
| | 597 |
| | 2.9 | % |
| Equipment financing | 39,807 |
| | 31,076 |
| | 8,731 |
| | 28.1 | % |
| Indirect automobile loans | 11,812 |
| | 17,355 |
| | (5,543 | ) | | (31.9 | )% |
| Residential mortgage loans | 19,957 |
| | 19,926 |
| | 31 |
| | 0.2 | % |
| Other consumer loans | 11,189 |
| | 10,624 |
| | 565 |
| | 5.3 | % |
| Total interest income—loans | $ | 206,781 |
| | $ | 197,098 |
| | $ | 9,683 |
| | 4.9 | % |
Except for equipment financing, declines in the yields on all portfolios reflect the high rate of loan refinancings in a low rate environment and the intense pricing competition which affected the Company’s lending markets.
For the year ended December 31, 2014, interest income from loans and leases was $206.8 million , and represented a yield on total loans of 4.49% as compared to $197.1 million or 4.66% for 2013. The $9.7 million increase in interest income from loans and leases in 2014 was attributable to an increase of $20.0 million in origination volume which was offset by a decrease of $10.4 million due to the lower rate environment. The $5.5 million decrease in interest income from the indirect automobile portfolio is related to a run off of the indirect automobile loans and the shift to a higher yielding portfolio mix.
Accretion on acquired loans and leases of $8.4 million contributed 16 basis points to net interest margin for the year ended December 31, 2014, compared to $4.7 million and 10 basis points for the year ended December 31, 2013. This increase was primarily due to a reforecast of certain acquired loans in the equipment financing portfolio, improved credit quality, and expected cash flows on certain acquired commercial real estate loans and leases.
Interest Income—Investments
|
| | | | | | | | | | | | | | |
| | Year Ended December 31, | | Dollar Change | | Percent Change |
| | 2014 | | 2013 | | |
| | (Dollars in Thousands) |
| Interest income—investments: | | | | | | | |
| Debt securities | $ | 9,527 |
| | $ | 7,963 |
| | $ | 1,564 |
| | 19.6 | % |
| Marketable and restricted equity securities | 2,072 |
| | 1,212 |
| | 860 |
| | 71.0 | % |
| Short-term investments | 102 |
| | 111 |
| | (9 | ) | | (8.1 | )% |
| Total interest income—investments | $ | 11,701 |
| | $ | 9,286 |
| | $ | 2,415 |
| | 26.0 | % |
In 2014, the total investment income was $11.7 million compared to $9.3 million in 2013. The increase in total investment income of $2.4 million, or 26.0%, was driven by a $1.6 million increase due to rates and a $0.8 million increase due to volume. The yield on total investments was 1.88% for 2014 as compared to 1.57% for 2013.
Interest Expense—Deposits and Borrowed Funds
|
| | | | | | | | | | | | | | |
| | Year Ended December 31, | | Dollar Change | | Percent Change |
| | 2014 | | 2013 | | |
| | (Dollars in Thousands) |
| Interest expense: | | | | | | | |
| Deposits: | | | | | | | |
| NOW accounts | $ | 171 |
| | $ | 173 |
| | $ | (2 | ) | | (1.2 | )% |
| Savings accounts | 1,197 |
| | 1,288 |
| | (91 | ) | | (7.1 | )% |
| Money market accounts | 7,846 |
| | 8,220 |
| | (374 | ) | | (4.5 | )% |
| Certificates of deposit | 7,846 |
| | 9,092 |
| | (1,246 | ) | | (13.7 | )% |
| Total interest expense—deposits | 17,060 |
| | 18,773 |
| | (1,713 | ) | | (9.1 | )% |
| Borrowed funds: | | | | | | | |
| Advances from the FHLBB | 10,535 |
| | 10,886 |
| | (351 | ) | | (3.2 | )% |
| Subordinated debentures and notes | 1,740 |
| | 439 |
| | 1,301 |
| | 296.4 | % |
| Other borrowed funds | 79 |
| | 68 |
| | 11 |
| | 16.2 | % |
| Total interest expense—borrowed funds | 12,354 |
| | 11,393 |
| | 961 |
| | 8.4 | % |
| Total interest expense | $ | 29,414 |
| | $ | 30,166 |
| | $ | (752 | ) | | (2.5 | )% |
Deposits
Ongoing declines in the interest rates paid on deposits and continued declines in certificate of deposit balances as a
percentage of total deposits contributed to reductions in the Company’s overall cost of deposits.
Interest paid on deposits decreased $1.7 million, or 9.1%, in 2014 as compared to 2013. In 2014, interest expense increased $0.4 million due to the growth in deposits, which was offset by a $2.1 million decrease in deposit-related interest expense resulting from decreases in interest rates. Accretion on acquired deposits was $0.2 million for the year ended December 31, 2014. Accretion did not impact the Company's net interest margin during the same period. While interest-bearing deposit balances increased during this period, the increases in interest expense on deposits due to volume were offset by decreases in interest expense due to deposit offering rates.
For the year ended December 31, 2014, interest-bearing deposit average balances grew $120.4 million, or 3.9%, which was attributable to increases in money market accounts, NOW accounts, and savings accounts of $156.7 million, or 11.4%; $14.4 million, or 7.2% and $9.3 million, or 1.8%, respectively, offset by a decline in certificate of deposit of $60.0 million, or 6.2%. The reduction in rates offered on certificate of deposit accounts contributed significantly to the reduction in the cost of interest-bearing deposits to 0.54% in 2014 from 0.62% in 2013.
Borrowed Funds
The Company's funds as of December 31, 2014 included $1.0 billion in FHLBB advances, $9.2 million in subordinated debt acquired in the BankRI acquisition, $73.5 million in newly issued subordinated debt, and $39.6 million in repurchase agreements. The average balance of FHLBB advances increased $175.8 million, or 23.1%, in 2014, average balance of subordinated debentures and notes increased $21.2 million, or 222.2%, while other borrowed funds, which include repurchase agreements, decreased $10.3 million, or 26.4% in 2014.
For the year ended December 31, 2014, interest paid on borrowed funds increased $1.0 million, or 8.4%,compared to the year ended December 31, 2013. The increase was primarily due to the new subordinated notes issued during the third quarter of 2014. Debt-related interest expenses decreased $2.4 million as a result of decreases in the Company's borrowing rates from 1.41% in 2013 to 1.24% in 2014, which was offset by an increase in interest expense due to an increase of $3.4 million in the debt levels in 2014 . The decrease in the cost of borrowed funds was driven by maturing borrowings which were replaced at lower costs due to the current low rate environment. Interest amortization and accretion on acquired borrowed funds totaled $2.8 million and contributed 5 basis points to the 2014 net interest margin as compared to $3.4 million and 7 basis points in 2013.
Provision for Credit Losses
The provisions for credit losses are set forth below:
|
| | | | | | | | | | | | | | | | | | | | | | | |
| | Originated | | Acquired | | Total |
| | Year Ended December 31, | | Year Ended December 31, | | Year Ended December 31, |
| | 2014 | | 2013 | | 2014 | | 2013 | | 2014 | | 2013 |
| | (In Thousands) |
| Provision for loan and lease losses: | | | | | | | | | | | |
| Commercial real estate | $ | 5,009 |
| | $ | 2,563 |
| | $ | 1,689 |
| | $ | 516 |
| | $ | 6,698 |
| | $ | 3,079 |
|
| Commercial | 2,030 |
| | 4,917 |
| | 413 |
| | 1,068 |
| | 2,443 |
| | 5,985 |
|
| Indirect automobile | (864 | ) | | (167 | ) | | — |
| | — |
| | (864 | ) | | (167 | ) |
| Consumer | 417 |
| | 286 |
| | 59 |
| | 1,190 |
| | 476 |
| | 1,476 |
|
| Unallocated | (514 | ) | | 302 |
| | — |
| | — |
| | (514 | ) | | 302 |
|
| Total provision for loan and lease losses | 6,078 |
| | 7,901 |
| | 2,161 |
| | 2,774 |
| | 8,239 |
| | 10,675 |
|
| Unfunded credit commitments | 238 |
| | 254 |
| | — |
|
| — |
| | 238 |
| | 254 |
|
| Total provision for credit losses | $ | 6,316 |
| | $ | 8,155 |
| | $ | 2,161 |
| | $ | 2,774 |
| | $ | 8,477 |
| | $ | 10,929 |
|
The provision for credit losses in 2014 and 2013 was $8.5 million and $10.9 million, respectively. The provision of loan and lease losses decreased approximately $2.5 million in 2014 compared to 2013 primarily due to the continued favorable trends in the credit characteristics of the commercial construction, equipment financing and indirect automobile portfolios. The decrease was partially offset by additional reserves required for loan growth in the originated portfolios and credit deterioration in the acquired portfolios in 2014. See Management's discussion in "Allowances for Credit Losses—Allowance for Loan and Lease Losses" and Note 7, "Allowance for Loan and Lease Losses," to the consolidated financial statements for a description of how Management determined the allowance for loan and lease losses for each portfolio and class of loans.
The liability for unfunded credit commitments, which is included in other liabilities, was $1.3 million as of December 31, 2014 and $1.0 million as of December 31, 2013. For the year ended December 31, 2014, the liability for unfunded credit commitments increased by $0.3 million to reflect changes in the estimate of loss exposure associated with certain unfunded credit commitments which increased the provision for credit losses by the same amount in 2014. No credit commitments were charged off against the Company's liability account for the years ended December 31, 2014 or 2013.
Non-Interest Income
The following table sets forth the components of non-interest income:
|
| | | | | | | | | | | | | | |
| | Year Ended December 31, | | Dollar Change | | Percent Change |
| | 2014 | | 2013 | | |
| | (Dollars in Thousands) |
| Deposit fees | $ | 8,692 |
| | $ | 8,172 |
| | $ | 520 |
| | 6.4 | % |
| Loan fees | 1,010 |
| | 1,415 |
| | (405 | ) | | (28.6 | )% |
| Loan level derivative income, net | 946 |
| | — |
| | 946 |
| | 100.0 | % |
| Gain on sales of loans and leases held-for-sale | 1,651 |
| | 794 |
| | 857 |
| | 107.9 | % |
| Gain on sales of investment securities, net | 65 |
| | 397 |
| | (332 | ) | | (83.6 | )% |
| Gain on sale/disposals of premises and equipment, net | 1,502 |
| | — |
| | 1,502 |
| | 100.0 | % |
| Other | 6,314 |
| | 4,841 |
| | 1,473 |
| | 30.4 | % |
| Total non-interest income | $ | 20,180 |
| | $ | 15,619 |
| | $ | 4,561 |
| | 29.2 | % |
For the year ended December 31, 2014, non-interest income increased $4.6 million, or 29.2%, to $20.2 million from $15.6 million for the year ended December 31, 2013.
Loan level derivative income, net increased $0.9 million for the year ended December 31, 2014 primarily driven by the execution of new loan level interest rate swap agreements completed in the year.
Gain on sales of loans and leases held for sale increased $0.9 million for the year ended December 31, 2014 primarily driven by the participation sale of certain pools of equipment financing to manage concentration risk.
Gain on sale/disposals of premises and equipment increased $1.5 million for the year ended December 31, 2014 primarily due to the sale of a building in 2014 which resulted in a gain of $1.6 million.
Other income increased $1.5 million to $6.3 million for the year ended December 31, 2014 primarily due to a $1.4 million legal settlement the company received from an insurance carrier in relation to litigation in 2014.
Non-Interest Expense
The following table sets forth the components of non-interest expense:
|
| | | | | | | | | | | | | | |
| | Year Ended December 31, | | Dollar Change | | Percent Change |
| | 2014 | | 2013 | | |
| | (Dollars in Thousands) |
| Compensation and employee benefits | $ | 71,801 |
| | $ | 65,261 |
| | $ | 6,540 |
| | 10.0 | % |
| Occupancy | 14,294 |
| | 12,616 |
| | 1,678 |
| | 13.3 | % |
| Equipment and data processing | 17,020 |
| | 16,899 |
| | 121 |
| | 0.7 | % |
| Professional services | 5,357 |
| | 5,673 |
| | (316 | ) | | (5.6 | )% |
| FDIC insurance | 3,362 |
| | 3,102 |
| | 260 |
| | 8.4 | % |
| Advertising and marketing | 3,058 |
| | 3,003 |
| | 55 |
| | 1.8 | % |
| Amortization of identified intangible assets | 3,343 |
| | 4,623 |
| | (1,280 | ) | | (27.7 | )% |
| Other | 10,925 |
| | 11,265 |
| | (340 | ) | | (3.0 | )% |
| Total non-interest expense | $ | 129,160 |
| | $ | 122,442 |
| | $ | 6,718 |
| | 5.5 | % |
For the year ended December 31, 2014, non-interest expense increased 5.5% to $129.2 million, primarily due to increases in compensation and employee benefits expenses. The efficiency ratio decreased to 61.73% for the year ended December 31, 2014 from 63.83% for the year ended December 31, 2013. Improvements in the efficiency ratio in 2014 were driven by increases in net interest income and non-interest income which were primarily offset by increases in non-interest expense.
In 2014, compensation and employee benefits expense increased $6.5 million, or 10.0%. Several factors contributed to the increase. The Company recorded an additional $3.6 million in incentive plan expenses in 2014. Supplemental Employee Retirement Plan expenses increased $1.3 million due to a decrease in the discount rate. Additionally, the Company suspended the indirect automobile lending line of business during the fourth quarter of 2014 and recognized a $0.2 million severance charge. There were also increases in overall compensation and employee benefits expense for additional staffing for the opening of the Wakefield, Rhode Island, branch of BankRI during the second quarter of 2014 and to support the growth in equipment financing.
Occupancy expense increased $1.7 million, or 13.3%, compared to 2013. The increase was primarily due to additional expenses associated with the newly opened branch in Wakefield, Rhode Island, as well as the recognition of future lease obligation associated with the consolidation of an operations center, offices for indirect automobile operations and two discontinued branch properties.
The increases in occupancy cost were offset by decreases in amortization of identified intangible assets due to the accelerated method of amortization for certain intangible assets and that several intangible assets that were fully amortized as of December 31, 2013.
Provision for income taxes |
| | | | | | | | | | | | | | |
| | Year Ended December 31, | | Dollar Change | | Percent Change |
| | 2014 | | 2013 | | |
| | (Dollars in Thousands) |
| Income before provision for income taxes | $ | 71,611 |
| | $ | 58,466 |
| | $ | 13,145 |
| | 22.5 | % |
| Provision for income taxes | 26,286 |
| | 20,664 |
| | 5,622 |
| | 27.2 | % |
| Net income | $ | 45,325 |
| | $ | 37,802 |
| | $ | 7,523 |
| | 19.9 | % |
| Effective tax rate | 36.7 | % | | 35.3 | % | | N/A |
| | 3.9 | % |
The Company recorded income tax expense of $26.3 million for 2014, compared to $20.7 million for 2013 which represents a total effective tax rates of 36.7% and 35.3%, respectively. The increase in the effective tax rate was primarily due to the tax credit received in 2013 for the rehabilitation of the Company's headquarters.
Liquidity and Capital Resources
Liquidity
Liquidity is defined as the ability to meet current and future financial obligations of a short-term nature. The Company further defines liquidity as the ability to respond to the needs of depositors and borrowers, as well as to earnings enhancement opportunities, in a changing marketplace. Liquidity management is monitored by an Asset/Liability Committee ("ALCO"), consisting of members of Management, which is responsible for establishing and monitoring liquidity targets as well as strategies and tactics to meet these targets.
The primary source of funds for the payment of dividends and expenses by the Company is dividends paid to it by the Banks and Brookline Securities Corp. The primary sources of liquidity for the Banks consist of deposit inflows, loan repayments, borrowed funds and maturing investment securities.
Deposits, which are considered the most stable source of liquidity, totaled $4.3 billion as of December 31, 2015 and represented 81.4% of total funding (the sum of total deposits and total borrowings), compared to deposits of $4.0 billion, or 77.8% of total funding, as of December 31, 2014. Core deposits, which consist of demand checking, NOW, savings and money market accounts, totaled $3.2 billion as of December 31, 2015 and represented 74.7% of total deposits, compared to core deposits of $3.0 billion, or 76.1% of total deposits, as of December 31, 2014. Additionally, the Company had $252.3 million of brokered deposits as of December 31, 2015, which represented 5.9% of total deposits, compared to $62.0 million or 1.6% of total deposits, as of December 31, 2014. The Company offers attractive interest rates based on market conditions to increase deposits balances, while managing cost of funds.
Borrowings are used to diversify the Company's funding mix and to support asset growth. When profitable lending and investment opportunities exist, access to borrowings provides a means to grow the balance sheet. Borrowings totaled $1.0 billion as of December 31, 2015, representing 18.6% of total funding, compared to $1.1 billion, or 22.2% of total funding, as of December 31, 2014. The decrease was due to decreased FHLBB borrowings of $142.2 million using the excess liquidity generated by the sale of the indirect automobile portfolio.
As members of the FHLBB, the Banks have access to both short- and long-term borrowings. As of December 31, 2015, the Company's total borrowing limit from the FHLBB for advances and repurchase agreements was $1.3 billion as compared to $1.5 billion as of December 31, 2014, based on the level of qualifying collateral available for these borrowings.
As of December 31, 2015, the Banks also have access to funding through certain uncommitted lines of credit of $119.0 million. The Company had a $12.0 million committed line of credit for contingent liquidity as of December 31, 2015.
The Company has access to the Federal Reserve Bank "discount window" to supplement its liquidity. The Company has $81.0 million of borrowing capacity at the Federal Reserve Bank as of December 31, 2015. As of December 31, 2015, the Company did not have any borrowings with the Federal Reserve Bank outstanding.
Additionally, the Banks have access to liquidity through repurchase agreements and brokered deposits.
In general, the Company seeks to maintain a high degree of liquidity and targets cash, cash equivalents and investment securities available-for-sale balances of between 10% and 30% of total assets. As of December 31, 2015, cash, cash equivalents and investment securities available-for-sale totaled $588.7 million, or 9.7% of total assets. This compares to $613.5 million, or 10.6% of total assets as of December 31, 2014.
While Management believes that the Company has adequate liquidity to meet its commitments, and to fund the Banks' lending and investment activities, the availabilities of these funding sources are subject to broad economic conditions and could be restricted in the future. Such restrictions would impact the Company's immediate liquidity and/or additional liquidity needs.
Capital Resources
As of December 31, 2015 and 2014, the Company and the Banks were under the primary regulation of and required to comply with the capital requirements of the FRB. At those dates, the Company, Brookline Bank, BankRI and First Ipswich exceeded all regulatory capital requirements and the banks were considered "well-capitalized." See details in "Supervision and Regulation" in Item 1.
The Company's and the Banks' actual and required capital amounts and ratios were as follows:
|
| | | | | | | | | | | | | | | | | | | | | |
| | | Actual | | Minimum Required for Capital Adequacy Purposes | | Minimum Required To Be Considered "Well- Capitalized" Under Prompt Corrective Action Rules |
| | | Amount | | Ratio | | Amount | | Ratio | | Amount | | Ratio |
| | | (Dollars in Thousands) |
| At December 31, 2015: | | | | | | | | | | | | |
| Brookline Bancorp, Inc. | | | | | | | | | | | | |
| Common equity Tier 1 capital ratio | (1) | $ | 530,505 |
| | 10.62 | % | | $ | 225,214 |
| | 4.50 | % | | N/A |
| | N/A |
|
| Tier 1 leverage capital ratio | (2) | 545,035 |
| | 9.37 | % | | 231,930 |
| | 4.00 | % | | N/A |
| | N/A |
|
| Tier 1 risk-based capital ratio | (3) | 545,035 |
| | 10.91 | % | | 300,019 |
| | 6.00 | % | | N/A |
| | N/A |
|
| Total risk-based capital ratio | (4) | 676,709 |
| | 13.54 | % | | 401,013 |
| | 8.00 | % | | N/A |
| | N/A |
|
| Brookline Bank | | | | | | | | | | | | |
| Common equity Tier 1 capital ratio | (1) | $ | 374,002 |
| | 11.89 | % | | $ | 141,548 |
| | 4.50 | % | | $ | 204,459 |
| | 6.50 | % |
| Tier 1 leverage capital ratio | (2) | 380,003 |
| | 10.78 | % | | 141,003 |
| | 4.00 | % | | 176,254 |
| | 5.00 | % |
| Tier 1 risk-based capital ratio | (3) | 380,003 |
| | 12.08 | % | | 188,743 |
| | 6.00 | % | | 251,658 |
| | 8.00 | % |
| Total risk-based capital ratio | (4) | 417,270 |
| | 13.27 | % | | 251,557 |
| | 8.00 | % | | 314,446 |
| | 10.00 | % |
| BankRI | | | | | | | | | | | | |
| Common equity Tier 1 capital ratio | (1) | $ | 171,967 |
| | 10.63 | % | | $ | 72,799 |
| | 4.50 | % | | $ | 105,154 |
| | 6.50 | % |
| Tier 1 leverage capital ratio | (2) | 171,967 |
| | 8.51 | % | | 80,831 |
| | 4.00 | % | | 101,038 |
| | 5.00 | % |
| Tier 1 risk-based capital ratio | (3) | 171,967 |
| | 10.63 | % | | 97,065 |
| | 6.00 | % | | 129,420 |
| | 8.00 | % |
| Total risk-based capital ratio | (4) | 189,953 |
| | 11.74 | % | | 129,440 |
| | 8.00 | % | | 161,800 |
| | 10.00 | % |
| First Ipswich | | | | | | | | | | | | |
| Common equity Tier 1 capital ratio | (1) | $ | 32,831 |
| | 13.87 | % | | $ | 10,652 |
| | 4.50 | % | | $ | 15,386 |
| | 6.50 | % |
| Tier 1 leverage capital ratio | (2) | 32,831 |
| | 9.26 | % | | 14,182 |
| | 4.00 | % | | 17,727 |
| | 5.00 | % |
| Tier 1 risk-based capital ratio | (3) | 32,831 |
| | 13.87 | % | | 14,202 |
| | 6.00 | % | | 18,936 |
| | 8.00 | % |
| Total risk-based capital ratio | (4) | 35,617 |
| | 15.05 | % | | 18,933 |
| | 8.00 | % | | 23,666 |
| | 10.00 | % |
| At December 31, 2014: | | | | | | | | | | | | |
| Brookline Bancorp, Inc. | | | | | | | | | | | | |
| Tier 1 leverage capital ratio | (1) | $ | 504,964 |
| | 9.01 | % | | $ | 224,179 |
| | 4.00 | % | | N/A |
| | N/A |
|
| Tier 1 risk-based capital ratio | (2) | 504,964 |
| | 10.55 | % | | 191,456 |
| | 4.00 | % | | N/A |
| | N/A |
|
| Total risk-based capital ratio | (3) | 633,421 |
| | 13.24 | % | | 382,732 |
| | 8.00 | % | | N/A |
| | N/A |
|
| Brookline Bank | | | | | | | | | | | | |
| Tier 1 leverage capital ratio | (1) | $ | 336,513 |
| | 9.60 | % | | $ | 140,214 |
| | 4.00 | % | | $ | 175,267 |
| | 5.00 | % |
| Tier 1 risk-based capital ratio | (2) | 336,513 |
| | 10.72 | % | | 125,565 |
| | 4.00 | % | | 188,347 |
| | 6.00 | % |
| Total risk-based capital ratio | (3) | 373,312 |
| | 11.90 | % | | 250,966 |
| | 8.00 | % | | 313,708 |
| | 10.00 | % |
| BankRI | | | | | | | | | | | | |
| Tier 1 leverage capital ratio | (1) | $ | 150,403 |
| | 8.43 | % | | $ | 71,366 |
| | 4.00 | % | | $ | 89,207 |
| | 5.00 | % |
| Tier 1 risk-based capital ratio | (2) | 150,403 |
| | 10.70 | % | | 56,225 |
| | 4.00 | % | | 84,338 |
| | 6.00 | % |
| Total risk-based capital ratio | (3) | 166,135 |
| | 11.82 | % | | 112,443 |
| | 8.00 | % | | 140,554 |
| | 10.00 | % |
| First Ipswich | | | | | | | | | | | | |
| Tier 1 leverage capital ratio | (1) | $ | 29,962 |
| | 9.27 | % | | $ | 12,929 |
| | 4.00 | % | | $ | 16,161 |
| | 5.00 | % |
| Tier 1 risk-based capital ratio | (2) | 29,962 |
| | 12.40 | % | | 9,665 |
| | 4.00 | % | | 14,498 |
| | 6.00 | % |
| Total risk-based capital ratio | (3) | 32,375 |
| | 13.40 | % | | 19,328 |
| | 8.00 | % | | 24,160 |
| | 10.00 | % |
| |
| (1) | Common equity tier 1 capital ratio is calculated by dividing common equity Tier 1 capital by risk-weighted assets. The ratio was established as part of the implementation of Basel III, effective January 1, 2015. |
| |
| (2) | Tier 1 leverage capital ratio is calculated by dividing Tier 1 capital by average assets. |
| |
| (3) | Tier 1 risk-based capital ratio is calculated by dividing Tier 1 capital by risk-weighted assets. |
| |
| (4) | Total risk-based capital ratio is calculated by dividing total capital by risk-weighted assets. |
Off-Balance-Sheet Arrangements
The Company is party to off-balance sheet financial instruments in the normal course of business to meet the financing needs of its customers and to reduce its own exposure to fluctuations in interest rates. These financial instruments include loan commitments, standby and commercial letters of credit.credit and interest rate swaps. According to GAAP, these financial instruments are not recorded in the financial statements until they are funded or related fees are incurred or received. The effect of such activity on the Company's financial condition and results of operations, such as recorded liability for unfunded credit commitment, is immaterial. See Note 13, "Commitments and Contingencies," to the consolidated financial statements for a description of off-balance-sheet financial instruments.
Contractual ObligationsStockholders' Equity and Dividends
A summaryThe Company's total stockholders' equity was $667.5 million as of contractual obligationsDecember 31, 2015, representing a $25.7 million increase compared to $641.8 million at December 31, 20132014. The increase is due to net income of $49.8 million for the year ended December 31, 2015, which was partially offset by dividends paid by the expected paymentCompany of $25.0 million in 2015.
For the year ended December 31, 2015, the dividend payout ratio was 50.2%, compared to 55.2% for the year ended December 31, 2014. The dividends paid in the fourth quarter of 2015 represented the Company's 67th consecutive quarter of dividend payments. Additionally, the Company increased the quarterly dividend distribution from $0.085 per share to $0.09 per share in the second quarter of 2015.
In 2015, 2014 and 2013, no shares of the Company's common stock were repurchased by the Company. On October 29, 2014, the Company’s Board of Directors authorized a stock repurchase program to acquire up to $10.0 million of total outstanding shares of the Company's common stock over a period follows.of fourteen months ending on December 31, 2015. As of December 31, 2015, no shares were repurchased under the stock repurchase program.
On February 4, 2016, the Company's Board of Directors authorized a stock repurchase program to acquire up to $10.0 million of total outstanding shares of the Company's common stock over a period of twelve months ending on January 31, 2017. Repurchases may be made from time to time depending on market conditions and other factors, and will be conducted through open market or private transactions, through block trades, and pursuant to any trading plan that may be adopted in accordance with the Securities and Exchange Commission Rule 10b5-1. There is no guarantee as to the exact number of shares, if any, to be repurchased by the Company.
Stockholders' equity represented 11.05% of total assets as of December 31, 2015 and 11.06% of total assets as of December 31, 2014. Tangible stockholders' equity (total stockholders' equity less goodwill and identified intangible assets, net) represented 8.81% of tangible assets (total assets less goodwill and identified intangible assets, net) as of December 31, 2015 and 8.68% as of December 31, 2014.
Results of Operations
The primary drivers of the Company's net income are net interest income, which is strongly affected by the net yield on and growth of interest-earning assets and liabilities ("net interest margin"), the quality of the Company's assets, its levels of non-interest income and non-interest expense, and its tax provision.
The Company's net interest income represents the difference between interest income earned on its investments, loans and leases, and its cost of funds. Interest income is dependent on the amount of interest-earning assets outstanding during the period and the yield earned thereon. Cost of funds is a function of the average amount of deposits and borrowed money outstanding during the year and the interest rates paid thereon. The net interest margin is calculated by dividing net interest income by average interest-earning assets. Net interest spread is the difference between the average rate earned on interest-earning assets and the average rate paid on interest-bearing liabilities. The increases or decreases, as applicably in the components of interest income and interest expense, expressed in terms of fluctuation in average volume and rate, are
summarized under "Rate/Volume Analysis" below. Information as to the components of interest income, interest expense and average rates is provided under "Average Balances, Net Interest Income, Interest-Rate Spread and Net Interest Margin" below.
Because the Company's assets and liabilities are not identical in duration and in repricing dates, the differential between the two is vulnerable to changes in market interest rates as well as the overall shape of the yield curve. These vulnerabilities are inherent to the business of banking and are commonly referred to as "interest-rate risk." How interest-rate risk is measured and, once measured, how much interest-rate risk is taken are based on numerous assumptions and other subjective judgments. See the discussion in the "Measuring Interest-Rate Risk" section of Item 7A, "Quantitative and Qualitative Disclosures about Market Risk" below.
The quality of the Company's assets also influences its earnings. Loans and leases that are not paid on a timely basis and exhibit other weaknesses can result in the loss of principal and/or interest income. Additionally, the Company must make timely provisions to the allowance for loan and lease losses based on estimates of probable losses inherent in the loan and lease portfolio. These additions, which are charged against earnings, are necessarily greater when greater probable losses are expected. Further, the Company incurs expenses as a result of resolving troubled assets. These variables reflect the "credit risk" that the Company takes on in the ordinary course of business and are further discussed under "Financial Condition—Asset Quality" above.
Average Balances, Net Interest Income, Interest-Rate Spread and Net Interest Margin
The following table sets forth information about the Company's average balances, interest income and interest rates earned on average interest-earning assets, interest expense and interest rates paid on average interest-bearing liabilities, interest-rate spread and net interest margin for the years ended December 31, 2015, 2014 and 2013. Average balances are derived from daily average balances and yields include fees, costs and purchase-accounting-related premiums and discounts which are considered adjustments to coupon yields in accordance with GAAP. Certain amounts previously reported have been reclassified to conform to the current presentation.
|
| | | | | | | | | | | | | | | | | | | |
| | Payment Due by Period |
| | Less Than One Year | | One to Three Years | | Three to Five Years | | Over Five Years | | Total |
| | (In Thousands) |
| At December 31, 2013: | | | | | | | | | |
| Advances from the FHLBB | $ | 186,035 |
| | $ | 375,971 |
| | $ | 183,823 |
| | $ | 22,944 |
| | $ | 768,773 |
|
| Loan commitments(1) | 1,023,573 |
| | — |
| | — |
| | — |
| | 1,023,573 |
|
| Occupancy lease commitments(2) | 4,936 |
| | 9,240 |
| | 7,422 |
| | 12,431 |
| | 34,029 |
|
| Service provider contracts(3) | 9,909 |
| | 32,132 |
| | 16,598 |
| | 4,828 |
| | 63,467 |
|
| Retirement benefit obligations | 28 |
| | 64 |
| | 68 |
| | 205 |
| | 365 |
|
| | $ | 1,224,481 |
| | $ | 417,407 |
| | $ | 207,911 |
| | $ | 40,408 |
| | $ | 1,890,207 |
|
|
| | | | | | | | | | | | | | | | | | | | | | | | | | | | | | | | |
| | Year Ended December 31, |
| | 2015 | | 2014 | | 2013 |
| | Average Balance | | Interest (1) | | Average Yield/ Cost | | Average Balance | | Interest (1) | | Average Yield/ Cost | | Average Balance | | Interest (1) | | Average Yield/ Cost |
| | (Dollars in Thousands) |
| Assets: | | | | | | | | | | | | | | | | | |
| Interest-earning assets: | | | | | | | | | | | | | | | | | |
| Debt securities | $ | 583,921 |
| | $ | 11,521 |
| | 1.97 | % | | $ | 518,920 |
| | $ | 9,531 |
| | 1.84 | % | | $ | 476,387 |
| | $ | 7,983 |
| | 1.68 | % |
| Marketable and restricted equity securities | 73,808 |
| | 2,793 |
| | 3.78 | % | | 72,151 |
| | 2,112 |
| | 2.93 | % | | 68,306 |
| | 1,223 |
| | 1.79 | % |
| Short-term investments | 56,520 |
| | 128 |
| | 0.23 | % | | 45,560 |
| | 102 |
| | 0.22 | % | | 62,258 |
| | 111 |
| | 0.18 | % |
| Total investments | 714,249 |
| | 14,442 |
| | 2.02 | % | | 636,631 |
| | 11,745 |
| | 1.84 | % | | 606,951 |
| | 9,317 |
| | 1.54 | % |
| Commercial real estate loans (2) | 2,529,566 |
| | 106,447 |
| | 4.21 | % | | 2,324,934 |
| | 103,324 |
| | 4.42 | % | | 2,091,860 |
| | 98,245 |
| | 4.67 | % |
| Commercial loans (2) | 636,084 |
| | 26,590 |
| | 4.13 | % | | 522,208 |
| | 21,341 |
| | 4.04 | % | | 435,184 |
| | 20,580 |
| | 4.68 | % |
| Equipment financing (2) | 650,376 |
| | 44,468 |
| | 6.84 | % | | 554,240 |
| | 39,807 |
| | 7.18 | % | | 452,601 |
| | 31,076 |
| | 6.87 | % |
| Indirect automobile loans (2) | 83,218 |
| | 2,686 |
| | 3.23 | % | | 366,217 |
| | 11,812 |
| | 3.23 | % | | 475,387 |
| | 17,355 |
| | 3.65 | % |
| Residential mortgage loans (2) | 600,072 |
| | 21,455 |
| | 3.58 | % | | 551,481 |
| | 19,957 |
| | 3.62 | % | | 511,348 |
| | 19,926 |
| | 3.90 | % |
| Other consumer loans (2) | 311,855 |
| | 11,792 |
| | 3.78 | % | | 280,663 |
| | 11,189 |
| | 3.98 | % | | 263,955 |
| | 10,624 |
| | 4.02 | % |
| Total loans and leases | 4,811,171 |
| | 213,438 |
| | 4.44 | % | | 4,599,743 |
| | 207,430 |
| | 4.51 | % | | 4,230,335 |
| | 197,806 |
| | 4.68 | % |
| Total interest-earning assets | 5,525,420 |
| | 227,880 |
| | 4.12 | % | | 5,236,374 |
| | 219,175 |
| | 4.19 | % | | 4,837,286 |
| | 207,123 |
| | 4.28 | % |
| Allowance for loan and lease losses | (55,950 | ) | | | | | | (51,480 | ) | | | | | | (44,008 | ) | | | | |
| Non-interest-earning assets | 371,279 |
| | | | | | 371,330 |
| | | | | | 380,954 |
| | | | |
| Total assets | $ | 5,840,749 |
| | | | | | $ | 5,556,224 |
| | | | | | $ | 5,174,232 |
| | | | |
| Liabilities and Stockholders' Equity: | | | | | | | | | | | | | | | | | |
| Interest-bearing liabilities: | | | | | | | | | | | | | | | | | |
| Interest-bearing deposits: | | | | | | | | | | | | | | | | | |
| NOW accounts | $ | 249,204 |
| | 179 |
| | 0.07 | % | | $ | 220,377 |
| | 171 |
| | 0.08 | % | | $ | 205,922 |
| | 173 |
| | 0.08 | % |
| Savings accounts | 532,496 |
| | 1,094 |
| | 0.21 | % | | 518,741 |
| | 1,197 |
| | 0.23 | % | | 509,436 |
| | 1,288 |
| | 0.25 | % |
| Money market accounts | 1,560,437 |
| | 6,935 |
| | 0.44 | % | | 1,526,915 |
| | 7,846 |
| | 0.51 | % | | 1,370,195 |
| | 8,220 |
| | 0.60 | % |
| Certificate of deposit | 1,045,328 |
| | 9,272 |
| | 0.78 | % | | 911,072 |
| | 7,846 |
| | 0.86 | % | | 971,044 |
| | 9,092 |
| | 0.94 | % |
| Total interest-bearing deposits (3) | 3,387,465 |
| | 17,480 |
| | 0.52 | % | | 3,177,105 |
| | 17,060 |
| | 0.54 | % | | 3,056,597 |
| | 18,773 |
| | 0.61 | % |
| Advances from the FHLBB | 840,123 |
| | 9,950 |
| | 1.17 | % | | 935,400 |
| | 10,535 |
| | 1.11 | % | | 759,640 |
| | 10,886 |
| | 1.43 | % |
| Subordinated debentures and notes | 82,846 |
| | 5,001 |
| | 6.04 | % | | 30,766 |
| | 1,740 |
| | 5.66 | % | | 9,548 |
| | 439 |
| | 4.60 | % |
| Other borrowed funds | 34,468 |
| | 114 |
| | 0.33 | % | | 28,568 |
| | 79 |
| | 0.28 | % | | 38,819 |
| | 68 |
| | 0.18 | % |
| Total borrowed funds | 957,437 |
| | 15,065 |
| | 1.55 | % | | 994,734 |
| | 12,354 |
| | 1.22 | % | | 808,007 |
| | 11,393 |
| | 1.39 | % |
| Total interest-bearing liabilities | 4,344,902 |
| | 32,545 |
| | 0.75 | % | | 4,171,839 |
| | 29,414 |
| | 0.71 | % | | 3,864,604 |
| | 30,166 |
| | 0.78 | % |
| Non-interest-bearing liabilities: | | | | | | | | | | | | | | | | | |
| Non-interest-bearing demand checking accounts (3) | 770,045 |
| | |
| | |
| | 700,815 |
| | |
| | |
| | 648,852 |
| | |
| | |
|
| Other non-interest-bearing liabilities | 62,914 |
| | |
| | |
| | 48,378 |
| | |
| | |
| | 40,574 |
| | |
| | |
|
| Total liabilities | 5,177,861 |
| | |
| | |
| | 4,921,032 |
| | |
| | |
| | 4,554,030 |
| | |
| | |
|
| Brookline Bancorp, Inc. stockholders' equity | 657,841 |
| | |
| | |
| | 630,966 |
| | |
| | |
| | 616,473 |
| | |
| | |
|
| Noncontrolling interest in subsidiary | 5,047 |
| | |
| | |
| | 4,226 |
| | |
| | |
| | 3,729 |
| | |
| | |
|
| Total liabilities and equity | $ | 5,840,749 |
| | |
| | |
| | $ | 5,556,224 |
| | |
| | |
| | $ | 5,174,232 |
| | |
| | |
|
| Net interest income (tax-equivalent basis) / Interest-rate spread (4) | |
| | 195,335 |
| | 3.37 | % | | |
| | 189,761 |
| | 3.48 | % | | |
| | 176,957 |
| | 3.50 | % |
| Less adjustment of tax-exempt income | |
| | 970 |
| | |
| | |
| | 693 |
| | |
| | |
| | 739 |
| | |
|
| Net interest income | |
| | $ | 194,365 |
| | |
| | |
| | $ | 189,068 |
| | |
| | |
| | $ | 176,218 |
| | |
|
| Net interest margin (5) | |
| | |
| | 3.54 | % | | |
| | |
| | 3.61 | % | | |
| | |
| | 3.64 | % |
|
| | | | | | | | | | | | | | | | | | | |
| | Payment Due by Period |
| | Less Than One Year | | One to Three Years | | Three to Five Years | | Over Five Years | | Total |
| | (In Thousands) |
| At December 31, 2012: | | | | | | | | | |
| Advances from the FHLBB | $ | 363,485 |
| | $ | 154,178 |
| | $ | 213,362 |
| | $ | 59,840 |
| | $ | 790,865 |
|
| Loan commitments(1) | 777,285 |
| | — |
| | — |
| | — |
| | 777,285 |
|
| Occupancy lease commitments(2) | 4,551 |
| | 7,591 |
| | 6,364 |
| | 8,153 |
| | 26,659 |
|
| Service provider contracts(3) | 10,447 |
| | 15,821 |
| | 10,008 |
| | 8,809 |
| | 45,085 |
|
| Retirement benefit obligations | 32 |
| | 72 |
| | 84 |
| | 250 |
| | 438 |
|
| | $ | 1,155,800 |
| | $ | 177,662 |
| | $ | 229,818 |
| | $ | 77,052 |
| | $ | 1,640,332 |
|
| |
| (1) | These amounts represent commitments made by the Company to extend credit to borrowers as long as thereTax-exempt income on debt securities, equity securities and revenue bonds included in commercial real estate loans is no violation of any condition establishedincluded on a tax-equivalent basis. |
| |
| (2) | Loans on nonaccrual status are included in the contract. Commitments generally have fixed expiration dates or other termination clauses. Since someaverage balances. |
| |
| (3) | Including non-interest-bearing checking accounts, the average interest rate on total deposits was 0.42%, 0.44% and 0.51% in the years ended December 31, 2015, 2014 and 2013, respectively. |
| |
| (4) | Interest-rate spread represents the difference between the yield on interest-earning assets and the cost of the commitments are expected to expire without being drawn upon, the total commitment amount does not necessarily represent future cash requirements.interest-bearing liabilities. |
| |
| (5) | Net interest margin represents net interest income (tax equivalent basis) divided by average interest-earning assets. |
See "Comparison of Years Ended December 31, 2015 and December 31, 2014" and "Comparison of Years Ended December 31, 2014 and December 31, 2013" below for a discussion of average assets and liabilities, net interest income, interest-rate spread and net interest margin.
Rate/Volume Analysis
The following table presents, on a tax-equivalent basis, the extent to which changes in interest rates and changes in volume of interest-earning assets and interest-bearing liabilities have affected the Company's interest income and interest expense during the periods indicated. Information is provided in each category with respect to: (i) changes attributable to changes in volume (changes in volume multiplied by prior rate), (ii) changes attributable to changes in rate (changes in rate multiplied by prior volume), and (iii) the net change. The changes attributable to the combined impact of volume and rate have been allocated proportionately to the changes due to volume and the changes due to rate.
|
| | | | | | | | | | | | | | | | | | | | | | | |
| | Year Ended
December 31, 2015
Compared to Year Ended
December 31, 2014 | | Year Ended
December 31, 2014
Compared to Year Ended
December 31, 2013 |
| | Increase (Decrease) Due To | | | | Increase (Decrease) Due To | | |
| | Volume | | Rate | | Net Change | | Volume | | Rate | | Net Change |
| | (In Thousands) |
| Interest and dividend income: | | | | | | | | | | | |
| Investments: | | | | | | | | | | | |
| Debt securities | $ | 1,196 |
| | $ | 794 |
| | 1,990 |
| | $ | 749 |
| | $ | 799 |
| | $ | 1,548 |
|
| Marketable and restricted equity securities | 49 |
| | 632 |
| | 681 |
| | 72 |
| | 817 |
| | 889 |
|
| Short-term investments | 24 |
| | 2 |
| | 26 |
| | (32 | ) | | 23 |
| | (9 | ) |
| Total investments | 1,269 |
| | 1,428 |
| | 2,697 |
| | 789 |
| | 1,639 |
| | 2,428 |
|
| Loans and leases: | | | | | | | | | | | |
| Commercial real estate loans | 9,045 |
| | (5,922 | ) | | 3,123 |
| | 10,458 |
| | (5,379 | ) | | 5,079 |
|
| Commercial loans and leases | 4,601 |
| | 648 |
| | 5,249 |
| | 3,752 |
| | (2,991 | ) | | 761 |
|
| Equipment financing | 6,903 |
| | (2,242 | ) | | 4,661 |
| | 7,255 |
| | 1,476 |
| | 8,731 |
|
| Indirect automobile loans | (9,141 | ) | | 15 |
| | (9,126 | ) | | (3,691 | ) | | (1,852 | ) | | (5,543 | ) |
| Residential mortgage loans | 1,759 |
| | (261 | ) | | 1,498 |
| | 1,502 |
| | (1,471 | ) | | 31 |
|
| Other consumer loans | 1,241 |
| | (638 | ) | | 603 |
| | 677 |
| | (112 | ) | | 565 |
|
| Total loans | 14,408 |
| | (8,400 | ) | | 6,008 |
| | 19,953 |
| | (10,329 | ) | | 9,624 |
|
| Total change in interest and dividend income | 15,677 |
| | (6,972 | ) | | 8,705 |
| | 20,742 |
| | (8,690 | ) | | 12,052 |
|
| Interest expense: | | | | | | | | | | | |
| Deposits: | | | | | | | | | | | |
| NOW accounts | 23 |
| | (15 | ) | | 8 |
| | 8 |
| | (10 | ) | | (2 | ) |
| Savings accounts | 32 |
| | (135 | ) | | (103 | ) | | 24 |
| | (115 | ) | | (91 | ) |
| Money market accounts | 171 |
| | (1,082 | ) | | (911 | ) | | 905 |
| | (1,279 | ) | | (374 | ) |
| Certificate of deposit | 724 |
| | 702 |
| | 1,426 |
| | (537 | ) | | (709 | ) | | (1,246 | ) |
| Total deposits | 950 |
| | (530 | ) | | 420 |
| | 400 |
| | (2,113 | ) | | (1,713 | ) |
| Borrowed funds: | | | | | | | | | | | |
| Advances from the FHLBB | (1,058 | ) | �� | 473 |
| | (585 | ) | | 2,293 |
| | (2,644 | ) | | (351 | ) |
| Subordinated debentures and notes | 2,948 |
| | 313 |
| | 3,261 |
| | 1,179 |
| | 122 |
| | 1,301 |
|
| Other borrowed funds | 17 |
| | 18 |
| | 35 |
| | (21 | ) | | 32 |
| | 11 |
|
| Total borrowed funds | 1,907 |
| | 804 |
| | 2,711 |
| | 3,451 |
| | (2,490 | ) | | 961 |
|
| Total change in interest expense | 2,857 |
| | 274 |
| | 3,131 |
| | 3,851 |
| | (4,603 | ) | | (752 | ) |
| Change in tax-exempt income | — |
| | (277 | ) | | (277 | ) | | — |
| | 46 |
| | 46 |
|
| Change in net interest income | $ | 12,820 |
| | $ | (7,523 | ) | | $ | 5,297 |
| | $ | 16,891 |
| | $ | (4,041 | ) | | $ | 12,850 |
|
See "Comparison of Years Ended December 31, 2015 and December 31, 2014" and "Comparison of Years Ended December 31, 2014 and December 31, 2013" below for a discussion of changes in interest income, interest-rate spread and net interest margin resulting from changes in rates and volumes.
Comparison of Years Ended December 31, 2015 and December 31, 2014
Net Interest Income
Net interest income increased $5.3 million to $194.4 million for the year ended December 31, 2015 from $189.1 million for the year ended December 31, 2014. The increase year over year reflects a $5.8 million increase in interest income on loans and leases, a $1.9 million increase in interest income on debt securities, offset by a $3.1 million increase in interest expense on deposit and borrowings, which is reflective of the various portfolios repricing and replacing balances into the current low interest rate environment.
Net interest margin decreased by 7 basis points, to 3.54% in 2015 from 3.61% in 2014. Competitive pressures on loan pricing resulted in decreases in the Company's weighted average interest rate on loans (prior to purchase accounting adjustments) to 4.44% for the year ended December 31, 2015 from 4.51% for the year ended December 31, 2014. Interest amortization and accretion on acquired loans totaled $4.5 million and contributed 9 basis points to 2015 loan yields, compared to $8.4 million and 16 basis points in 2014. The decrease in the net interest margin is the result of repricing interest-earning assets in a lower interest rate environment without a comparable offset in lower funding costs.
The yield on interest-earning assets decreased to 4.12% for the year ended December 31, 2015 from 4.19% for the year ended December 31, 2014. This decrease is the result of the continued pricing pressure due to the low interest rate environment and the intense competition in most loan categories, as well as a decrease in accretion on acquired loans and leases, offset by an increase in prepayment penalties and late charges. During the year ended December 31, 2015, the Company recorded $3.2 million in prepayment penalties and late charges, which contributed 6 basis points to yields on interest-earning assets, in the year ended December 31, 2015, compared to $2.2 million, or 4 basis points, for the year ended December 31, 2014.
The overall cost of funds (including non-interest-bearing demand checking accounts) increased 4 basis points to 0.75% for the year ended December 31, 2015 from 0.71% for the year ended December 31, 2014. The increase was primarily driven by the issuance of the $75.0 million subordinated notes in September 2014. Refer to "Financial Condition - Borrowed Funds" above for more details.
Future net interest income, net interest spread and net interest margin may continue to be negatively affected by a number of factors including: the low interest-rate environment, ongoing pricing pressures in both loan and deposit portfolios, the ability of the Company to increase its core deposit ratio, the ability of the Company to increase its non-interest-bearing deposits as a percentage of total deposits, decrease its loan-to-deposit ratio, or decrease its reliance on FHLBB advances. It may also be negatively affected by changes in the amount of purchase accounting accretion and amortization included in interest income and interest expense.
Interest Income—Loans and Leases
|
| | | | | | | | | | | | | | |
| | Year Ended December 31, | | Dollar Change | | Percent Change |
| | 2015 | | 2014 | | |
| | (Dollars in Thousands) |
| Interest income—loans and leases: | | | | | | | |
| Commercial real estate loans | $ | 106,447 |
| | $ | 102,852 |
| | $ | 3,595 |
| | 3.5 | % |
| Commercial loans | 25,756 |
| | 21,164 |
| | 4,592 |
| | 21.7 | % |
| Equipment financing | 44,468 |
| | 39,807 |
| | 4,661 |
| | 11.7 | % |
| Indirect automobile loans | 2,686 |
| | 11,812 |
| | (9,126 | ) | | (77.3 | )% |
| Residential mortgage loans | 21,455 |
| | 19,957 |
| | 1,498 |
| | 7.5 | % |
| Other consumer loans | 11,792 |
| | 11,189 |
| | 603 |
| | 5.4 | % |
| Total interest income—loans and leases | $ | 212,604 |
| | $ | 206,781 |
| | $ | 5,823 |
| | 2.8 | % |
Interest income from loans and leases was $212.6 million for 2015, and represented a yield on total loans of 4.44%. This compares to $206.8 million of interest on loans and a yield of 4.51% for 2014. This $5.8 million increase in interest income from loans and leases was attributable to an increase of $14.4 million of increased origination volume, which was offset by a decrease of $8.4 million due to the changes in interest rates. The $9.1 million decrease in interest income from the indirect automobile portfolio was the result of the sale of most of the portfolio in the first quarter of 2015 and Management's decision to cease origination indirect automobile loans in December 31, 2014.
Accretion on acquired loans and leases of $4.5 million contributed 9 basis points to the Company's net interest margin for the year ended December 31, 2015, compared to 8.4 million and 16 basis points for the year ended December 31, 2014. This decrease was due to a reforecast of certain acquired loans in the equipment financing portfolio, improved credit quality and expected cash flows on certain acquired commercial real estate loans and leases as well as higher amount of loan payoffs during 2014.
Interest Income—Investments
|
| | | | | | | | | | | | | | |
| | Year Ended December 31, | | Dollar Change | | Percent Change |
| | 2015 | | 2014 | | |
| | (Dollars in Thousands) |
| Interest income—investments: | | | | | | | |
| Debt securities | $ | 11,416 |
| | $ | 9,527 |
| | $ | 1,889 |
| | 19.8 | % |
| Marketable and restricted equity securities | 2,762 |
| | 2,072 |
| | 690 |
| | 33.3 | % |
| Short-term investments | 128 |
| | 102 |
| | 26 |
| | 25.5 | % |
| Total interest income—investments | $ | 14,306 |
| | $ | 11,701 |
| | $ | 2,605 |
| | 22.3 | % |
Total investment income was $14.3 million for the year ended December 31, 2015 compared to $11.7 million for the year ended December 31, 2014. As of December 31, 2015, the yield on total investments was 2.02% as compared to 1.84% as of December 31, 2014. This year over year increase in total investment income of $2.6 million, or 22.3%, was driven by a $1.3 million increase due to rates and a $1.4 million increase due to volume. In 2015, the yield on total investments was 2.02% as compared to 1.84% in 2014.
Interest Expense—Deposits and Borrowed Funds
|
| | | | | | | | | | | | | | |
| | Year Ended December 31, | | Dollar Change | | Percent Change |
| | 2015 | | 2014 | | |
| | (Dollars in Thousands) |
| Interest expense: | | | | | | | |
| Deposits: | | | | | | | |
| NOW accounts | $ | 179 |
| | $ | 171 |
| | $ | 8 |
| | 4.7 | % |
| Savings accounts | 1,094 |
| | 1,197 |
| | (103 | ) | | (8.6 | )% |
| Money market accounts | 6,935 |
| | 7,846 |
| | (911 | ) | | (11.6 | )% |
| Certificate of deposit | 9,272 |
| | 7,846 |
| | 1,426 |
| | 18.2 | % |
| Total interest expense—deposits | 17,480 |
| | 17,060 |
| | 420 |
| | 2.5 | % |
| Borrowed funds: | | | | | | | |
| Advances from the FHLBB | 9,950 |
| | 10,535 |
| | (585 | ) | | (5.6 | )% |
| Subordinated debentures and notes | 5,001 |
| | 1,740 |
| | 3,261 |
| | 187.4 | % |
| Other borrowed funds | 114 |
| | 79 |
| | 35 |
| | 44.3 | % |
| Total interest expense—borrowed funds | 15,065 |
| | 12,354 |
| | 2,711 |
| | 21.9 | % |
| Total interest expense | $ | 32,545 |
| | $ | 29,414 |
| | $ | 3,131 |
| | 10.6 | % |
Deposits
Except for certificate of deposits, ongoing declines in the interest rates paid on deposits contributed to reductions in the Company’s overall cost of deposits.
In 2015, interest paid on deposits increased $0.4 million, or 2.5%, as compared to 2014. Interest expense increased $1.0 million due to the growth in deposits, offset by a $0.5 million decrease in deposit-related interest expense driven by a decrease in interest rates. Purchase accounting accretion on acquired deposits was $0.2 million for the year ended December 31, 2015, compared to $0.2 million for the year ended December 31, 2014. Purchase accounting accretion did not impact the Company's net interest margin in either year.
Borrowed Funds
As of December 31, 2015 the Company's borrowed funds include: $0.9 billion in FHLBB advances, $82.9 million in subordinated debentures and notes, and $38.2 million in other borrowed funds. In 2015, the average balance of FHLBB advances decreased $95.3 million, or 10.2%, while the average balance of subordinated debentures and notes increased $52.1 million, or 169.3%. Other borrowed funds, which include repurchase agreements, increased $5.9 million, or 20.7% for the year ended December 31, 2015.
During the year ended December 31, 2015, interest paid on borrowed funds increased $2.7 million, or 21.9% year over year, primarily driven by liabilities on subordinated notes issued during the third quarter of 2014. The cost of borrowed funds was 1.55% for the year ended December 31, 2015 as compared to 1.22% for the year ended December 31, 2014. This change was driven by an increase of $0.8 million due to borrowing rates and an increase of $1.9 million in interest expense due to volume. For the years ended December 31, 2015 and 2014, the purchase accounting accretion on acquired borrowed funds was $2.8 million which contributed 5 basis points to the Company's net interest margin in both years.
Provision for Credit Losses
The provisions for credit losses are set forth below:
|
| | | | | | | | | | | | | | | | | | | | | | | |
| | Originated | | Acquired | | Total |
| | Year Ended December 31, | | Year Ended December 31, | | Year Ended December 31, |
| | 2015 | | 2014 | | 2015 | | 2014 | | 2015 | | 2014 |
| | (In Thousands) |
| Provision for loan and lease losses: | | | | | | | | | | | |
| Commercial real estate | $ | 1,459 |
| | $ | 5,009 |
| | $ | (352 | ) | | $ | 1,689 |
| | $ | 1,107 |
| | $ | 6,698 |
|
| Commercial | 9,077 |
| | 2,030 |
| | (49 | ) | | 413 |
| | 9,028 |
| | 2,443 |
|
| Indirect automobile | (1,716 | ) | | (864 | ) | | — |
| | — |
| | (1,716 | ) | | (864 | ) |
| Consumer | 953 |
| | 417 |
| | 469 |
| | 59 |
| | 1,422 |
| | 476 |
|
| Unallocated | (2,418 | ) | | (514 | ) | | — |
| | — |
| | (2,418 | ) | | (514 | ) |
| Total provision for loan and lease losses | 7,355 |
| | 6,078 |
| | 68 |
| | 2,161 |
| | 7,423 |
| | 8,239 |
|
| Unfunded credit commitments | 28 |
| | 238 |
| | — |
| | — |
| | 28 |
| | 238 |
|
| Total provision for credit losses | $ | 7,383 |
| | $ | 6,316 |
| | $ | 68 |
| | $ | 2,161 |
| | $ | 7,451 |
| | $ | 8,477 |
|
For the year ended December 31, 2015, the provision for credit losses decreased $1.0 million, or 12.1%, to $7.5 million from $8.5 million for the year ended December 31, 2014. The decrease in the provision for credit losses for the year ended December 31, 2015 was primarily driven by a decrease in the provision related to improved credit characteristics and the continued strong credit quality of the portfolio, as well as a decrease in the provision for the indirect automobile portfolio related to the sale of most of the indirect automobile portfolio in the first quarter of 2015, all of which were partially offset by an increase in the specific reserves for one commercial loan relationship and increases in the reserves for taxi medallion loans as well as net charge offs. See Management's discussion in "Allowances for Credit Losses-Allowance for Loan and Lease Losses" and Note 7, "Allowance for Loan and Lease Losses," to the consolidated financial statements for a description of how Management determined the allowance for loan and lease losses for each portfolio and class of loans.
The liability for unfunded credit commitments, which is included in other liabilities, was $1.3 million as of December 31, 2015 and December 31, 2014 respectively. For the year ended December 31, 2015, the provision for unfunded credit commitments decreased by $0.2 million related to changes in the estimate of loss exposure associated with certain unfunded credit commitments. No credit commitments were charged off against the Company's liability account for the years ended December 31, 2015 and 2014.
Non-Interest Income
The following table sets forth the components of non-interest income:
|
| | | | | | | | | | | | | | |
| | Year Ended December 31, | | Dollar Change | | Percent Change |
| | 2015 | | 2014 | | |
| | (Dollars in Thousands) |
| Deposit fees | $ | 8,730 |
| | $ | 8,692 |
| | $ | 38 |
| | 0.4 | % |
| Loan fees | 1,186 |
| | 1,010 |
| | 176 |
| | 17.4 | % |
| Loan level derivative income, net | 3,397 |
| | 946 |
| | 2,451 |
| | 259.1 | % |
| Gain on sales of loans and leases held-for-sale | 2,208 |
| | 1,651 |
| | 557 |
| | 33.7 | % |
| Gain on sales of investment securities, net | — |
| | 65 |
| | (65 | ) | | (100.0 | )% |
| Gain on sale/disposals of premises and equipment, net | — |
| | 1,502 |
| | (1,502 | ) | | (100.0 | )% |
| Other | 4,663 |
| | 6,314 |
| | (1,651 | ) | | (26.1 | )% |
| Total non-interest income | $ | 20,184 |
| | $ | 20,180 |
| | $ | 4 |
| | — | % |
Total non-interest income remained consistent at $20.2 million for the years ended December 31, 2015 and 2014.
Loan level derivative income, net increased $2.5 million for the year ended December 31, 2015 primarily driven by new loan level interest rate swap agreements completed in the year.
Gain on sale/disposals of premises and equipment decreased $1.5 million for the year ended December 31, 2015 primarily due to the sale of a building in 2014 which resulted in a gain of $1.6 million.
Other income decreased $1.7 million for the year ended December 31, 2015 primarily driven by a $1.4 million legal settlement the Company received from an insurance carrier in relation to litigation in 2014.
Non-Interest Expense
The following table sets forth the components of non-interest expense:
|
| | | | | | | | | | | | | | |
| | Year Ended December 31, | | Dollar Change | | Percent Change |
| | 2015 | | 2014 | | |
| | (Dollars in Thousands) |
| Compensation and employee benefits | $ | 71,272 |
| | $ | 71,801 |
| | $ | (529 | ) | | (0.7 | )% |
| Occupancy | 13,926 |
| | 14,294 |
| | (368 | ) | | (2.6 | )% |
| Equipment and data processing | 14,837 |
| | 17,020 |
| | (2,183 | ) | | (12.8 | )% |
| Professional services | 4,192 |
| | 5,357 |
| | (1,165 | ) | | (21.7 | )% |
| FDIC insurance | 3,510 |
| | 3,362 |
| | 148 |
| | 4.4 | % |
| Advertising and marketing | 3,352 |
| | 3,058 |
| | 294 |
| | 9.6 | % |
| Amortization of identified intangible assets | 2,911 |
| | 3,343 |
| | (432 | ) | | (12.9 | )% |
| Other | 11,377 |
| | 10,925 |
| | 452 |
| | 4.1 | % |
| Total non-interest expense | $ | 125,377 |
| | $ | 129,160 |
| | $ | (3,783 | ) | | (2.9 | )% |
For the year ended December 31, 2015, non-interest expense decreased $3.8 million, or 2.9%, to $125.4 million as compared to the same period in 2014. This decrease is primarily due to a $2.2 million decrease in equipment and data processing expense, a $1.2 million decrease in professional service expense, and a $0.5 million decrease in compensation and employee benefits expense.
The efficiency ratio decreased to 58.44% for the year ended December 31, 2015 from 61.73% for the year ended December 31, 2014. The efficiency ratio improved in 2015 due to a decrease in non-interest expense and an increase in net interest income as a result of continued efforts to drive revenue growth while controlling expenses.
Equipment and data processing expense for the year ended December 31, 2015 decreased $2.2 million compared to the same period in 2014. This decrease was primarily driven by the decrease of core processing system expenses resulting from the sale of the indirect automobile loan portfolio in the first quarter of 2015.
Expenses related to Professional Services for the year ended December 31, 2015 decreased $1.2 million compared to the same period in 2014. The decrease was largely due to lower audit, tax and legal fees incurred in 2015.
Compensation and employee benefits expense for the year ended December 31, 2015 decreased $0.5 million compared to the same period in 2014. The decrease was primarily driven by a decrease in the Company's liability related to a supplemental executive retirement plan and a decrease in employee headcount in 2015.
Provision for Income Taxes
|
| | | | | | | | | | | | | | |
| | Year Ended December 31, | | Dollar Change | | Percent Change |
| | 2015 | | 2014 | | |
| | (Dollars in Thousands) |
| Income before provision for income taxes | $ | 81,721 |
| | $ | 71,611 |
| | $ | 10,110 |
| | 14.1 | % |
| Provision for income taxes | 29,353 |
| | 26,286 |
| | 3,067 |
| | 11.7 | % |
| Net income, before non-controlling interest in subsidiary | $ | 52,368 |
| | $ | 45,325 |
| | $ | 7,043 |
| | 15.5 | % |
| Effective tax rate * | 35.9 | % | | 36.7 | % | | N/A |
| | (2.1 | )% |
(*) Previously reported amounts prior to January 1, 2015 have been restated to reflect a retrospective change in accounting principle for investments in qualified affordable housing projects, in accordance with ASU 2014-01.
The Company recorded income tax expense of $29.4 million for 2015, compared to $26.3 million for 2014. This represents a total effective tax rates of 35.9% and 36.7% for 2015 and 2014, respectively. The decrease in the Company's effective tax rate from 2014 was primarily driven by investments in municipal bonds and the formation of a new security corporation in Massachusetts.
Comparison of Years Ended December 31, 2014 and December 31, 2013
Net Interest Income
For the year ended December 31, 2014, net interest income increased $12.9 million to $189.1 million from $176.2 million for the year ended December 31, 2013. The year over year increase reflects a $9.7 million increase in interest income on loans and leases, a $1.6 million increase in interest income on debt securities, and lower interest expense on deposits and borrowings of $0.8 million which is reflective of the various portfolios repricing and replacing balances in the current low interest rate environment.
Net interest margin decreased by 3 basis points to 3.61% in 2014 from 3.64% in 2013. Competitive pressures on loan pricing resulted in a decrease in the Company's weighted average interest rate on loans (prior to purchase accounting adjustments) to 4.49% for the year ended December 31, 2014 from 4.66% for the year ended December 31, 2013. Interest amortization and accretion on acquired loans totaled $8.4 million and contributed 16 basis points to loan yields in 2014, compared to $4.7 million and 10 basis points in 2013, primarily due to changes in expected cash flows.
The decrease in asset yields in 2014 was offset by a decrease in the total cost of interest-bearing liabilities of 7 basis points, the Company's total cost of interest-bearing liabilities was 0.71% in 2014 compared to 0.78% in 2013. The decrease in the cost of interest-bearing liabilities was driven by a reduction in replacement rates on FHLB borrowings and the interest rates provided for certain deposit products. The cost of interest-bearing deposits decreased 8 basis points to 0.54% in 2014 from 0.62% in 2013 as customers continued to shift funds from certificates of deposits to non-maturity deposit products. For the year ended December 31, 2014, interest amortization and accretion on purchase accounting marks on borrowed funds and certificates of deposits totaled $3.1 million and contributed 5 basis points to the 2014 net interest margin compared to $3.8 million and 8 basis points in 2013.
Future net interest income, net interest spread and net interest margin may continue to be negatively affected by the low interest-rate environment, ongoing pricing pressures in both loan and deposit portfolios, and the ability of the Company to increase its core deposit ratio, increase its non-interest-bearing deposits as a percentage of total deposits, decrease its loan-to-deposit ratio, or decrease its reliance on FHLBB advances. It may also be negatively affected by changes in the amount of purchase accounting accretion and amortization included in interest income and interest expense.
Interest Income—Loans and Leases
|
| | | | | | | | | | | | | | |
| | Year Ended December 31, | | Dollar Change | | Percent Change |
| | 2014 | | 2013 | | |
| | (Dollars in Thousands) |
| Interest income—loans: | | | | | | | |
| Commercial real estate loans | $ | 102,852 |
| | $ | 97,550 |
| | $ | 5,302 |
| | 5.4 | % |
| Commercial loans | 21,164 |
| | 20,567 |
| | 597 |
| | 2.9 | % |
| Equipment financing | 39,807 |
| | 31,076 |
| | 8,731 |
| | 28.1 | % |
| Indirect automobile loans | 11,812 |
| | 17,355 |
| | (5,543 | ) | | (31.9 | )% |
| Residential mortgage loans | 19,957 |
| | 19,926 |
| | 31 |
| | 0.2 | % |
| Other consumer loans | 11,189 |
| | 10,624 |
| | 565 |
| | 5.3 | % |
| Total interest income—loans | $ | 206,781 |
| | $ | 197,098 |
| | $ | 9,683 |
| | 4.9 | % |
Except for equipment financing, declines in the yields on all portfolios reflect the high rate of loan refinancings in a low rate environment and the intense pricing competition which affected the Company’s lending markets.
For the year ended December 31, 2014, interest income from loans and leases was $206.8 million , and represented a yield on total loans of 4.49% as compared to $197.1 million or 4.66% for 2013. The $9.7 million increase in interest income from loans and leases in 2014 was attributable to an increase of $20.0 million in origination volume which was offset by a decrease of $10.4 million due to the lower rate environment. The $5.5 million decrease in interest income from the indirect automobile portfolio is related to a run off of the indirect automobile loans and the shift to a higher yielding portfolio mix.
Accretion on acquired loans and leases of $8.4 million contributed 16 basis points to net interest margin for the year ended December 31, 2014, compared to $4.7 million and 10 basis points for the year ended December 31, 2013. This increase was primarily due to a reforecast of certain acquired loans in the equipment financing portfolio, improved credit quality, and expected cash flows on certain acquired commercial real estate loans and leases.
Interest Income—Investments
|
| | | | | | | | | | | | | | |
| | Year Ended December 31, | | Dollar Change | | Percent Change |
| | 2014 | | 2013 | | |
| | (Dollars in Thousands) |
| Interest income—investments: | | | | | | | |
| Debt securities | $ | 9,527 |
| | $ | 7,963 |
| | $ | 1,564 |
| | 19.6 | % |
| Marketable and restricted equity securities | 2,072 |
| | 1,212 |
| | 860 |
| | 71.0 | % |
| Short-term investments | 102 |
| | 111 |
| | (9 | ) | | (8.1 | )% |
| Total interest income—investments | $ | 11,701 |
| | $ | 9,286 |
| | $ | 2,415 |
| | 26.0 | % |
In 2014, the total investment income was $11.7 million compared to $9.3 million in 2013. The increase in total investment income of $2.4 million, or 26.0%, was driven by a $1.6 million increase due to rates and a $0.8 million increase due to volume. The yield on total investments was 1.88% for 2014 as compared to 1.57% for 2013.
Interest Expense—Deposits and Borrowed Funds
|
| | | | | | | | | | | | | | |
| | Year Ended December 31, | | Dollar Change | | Percent Change |
| | 2014 | | 2013 | | |
| | (Dollars in Thousands) |
| Interest expense: | | | | | | | |
| Deposits: | | | | | | | |
| NOW accounts | $ | 171 |
| | $ | 173 |
| | $ | (2 | ) | | (1.2 | )% |
| Savings accounts | 1,197 |
| | 1,288 |
| | (91 | ) | | (7.1 | )% |
| Money market accounts | 7,846 |
| | 8,220 |
| | (374 | ) | | (4.5 | )% |
| Certificates of deposit | 7,846 |
| | 9,092 |
| | (1,246 | ) | | (13.7 | )% |
| Total interest expense—deposits | 17,060 |
| | 18,773 |
| | (1,713 | ) | | (9.1 | )% |
| Borrowed funds: | | | | | | | |
| Advances from the FHLBB | 10,535 |
| | 10,886 |
| | (351 | ) | | (3.2 | )% |
| Subordinated debentures and notes | 1,740 |
| | 439 |
| | 1,301 |
| | 296.4 | % |
| Other borrowed funds | 79 |
| | 68 |
| | 11 |
| | 16.2 | % |
| Total interest expense—borrowed funds | 12,354 |
| | 11,393 |
| | 961 |
| | 8.4 | % |
| Total interest expense | $ | 29,414 |
| | $ | 30,166 |
| | $ | (752 | ) | | (2.5 | )% |
Deposits
Ongoing declines in the interest rates paid on deposits and continued declines in certificate of deposit balances as a
percentage of total deposits contributed to reductions in the Company’s overall cost of deposits.
Interest paid on deposits decreased $1.7 million, or 9.1%, in 2014 as compared to 2013. In 2014, interest expense increased $0.4 million due to the growth in deposits, which was offset by a $2.1 million decrease in deposit-related interest expense resulting from decreases in interest rates. Accretion on acquired deposits was $0.2 million for the year ended December 31, 2014. Accretion did not impact the Company's net interest margin during the same period. While interest-bearing deposit balances increased during this period, the increases in interest expense on deposits due to volume were offset by decreases in interest expense due to deposit offering rates.
For the year ended December 31, 2014, interest-bearing deposit average balances grew $120.4 million, or 3.9%, which was attributable to increases in money market accounts, NOW accounts, and savings accounts of $156.7 million, or 11.4%; $14.4 million, or 7.2% and $9.3 million, or 1.8%, respectively, offset by a decline in certificate of deposit of $60.0 million, or 6.2%. The reduction in rates offered on certificate of deposit accounts contributed significantly to the reduction in the cost of interest-bearing deposits to 0.54% in 2014 from 0.62% in 2013.
Borrowed Funds
The Company's funds as of December 31, 2014 included $1.0 billion in FHLBB advances, $9.2 million in subordinated debt acquired in the BankRI acquisition, $73.5 million in newly issued subordinated debt, and $39.6 million in repurchase agreements. The average balance of FHLBB advances increased $175.8 million, or 23.1%, in 2014, average balance of subordinated debentures and notes increased $21.2 million, or 222.2%, while other borrowed funds, which include repurchase agreements, decreased $10.3 million, or 26.4% in 2014.
For the year ended December 31, 2014, interest paid on borrowed funds increased $1.0 million, or 8.4%,compared to the year ended December 31, 2013. The increase was primarily due to the new subordinated notes issued during the third quarter of 2014. Debt-related interest expenses decreased $2.4 million as a result of decreases in the Company's borrowing rates from 1.41% in 2013 to 1.24% in 2014, which was offset by an increase in interest expense due to an increase of $3.4 million in the debt levels in 2014 . The decrease in the cost of borrowed funds was driven by maturing borrowings which were replaced at lower costs due to the current low rate environment. Interest amortization and accretion on acquired borrowed funds totaled $2.8 million and contributed 5 basis points to the 2014 net interest margin as compared to $3.4 million and 7 basis points in 2013.
Provision for Credit Losses
The provisions for credit losses are set forth below:
|
| | | | | | | | | | | | | | | | | | | | | | | |
| | Originated | | Acquired | | Total |
| | Year Ended December 31, | | Year Ended December 31, | | Year Ended December 31, |
| | 2014 | | 2013 | | 2014 | | 2013 | | 2014 | | 2013 |
| | (In Thousands) |
| Provision for loan and lease losses: | | | | | | | | | | | |
| Commercial real estate | $ | 5,009 |
| | $ | 2,563 |
| | $ | 1,689 |
| | $ | 516 |
| | $ | 6,698 |
| | $ | 3,079 |
|
| Commercial | 2,030 |
| | 4,917 |
| | 413 |
| | 1,068 |
| | 2,443 |
| | 5,985 |
|
| Indirect automobile | (864 | ) | | (167 | ) | | — |
| | — |
| | (864 | ) | | (167 | ) |
| Consumer | 417 |
| | 286 |
| | 59 |
| | 1,190 |
| | 476 |
| | 1,476 |
|
| Unallocated | (514 | ) | | 302 |
| | — |
| | — |
| | (514 | ) | | 302 |
|
| Total provision for loan and lease losses | 6,078 |
| | 7,901 |
| | 2,161 |
| | 2,774 |
| | 8,239 |
| | 10,675 |
|
| Unfunded credit commitments | 238 |
| | 254 |
| | — |
|
| — |
| | 238 |
| | 254 |
|
| Total provision for credit losses | $ | 6,316 |
| | $ | 8,155 |
| | $ | 2,161 |
| | $ | 2,774 |
| | $ | 8,477 |
| | $ | 10,929 |
|
The provision for credit losses in 2014 and 2013 was $8.5 million and $10.9 million, respectively. The provision of loan and lease losses decreased approximately $2.5 million in 2014 compared to 2013 primarily due to the continued favorable trends in the credit characteristics of the commercial construction, equipment financing and indirect automobile portfolios. The decrease was partially offset by additional reserves required for loan growth in the originated portfolios and credit deterioration in the acquired portfolios in 2014. See Management's discussion in "Allowances for Credit Losses—Allowance for Loan and Lease Losses" and Note 7, "Allowance for Loan and Lease Losses," to the consolidated financial statements for a description of how Management determined the allowance for loan and lease losses for each portfolio and class of loans.
The liability for unfunded credit commitments, which is included in other liabilities, was $1.3 million as of December 31, 2014 and $1.0 million as of December 31, 2013. For the year ended December 31, 2014, the liability for unfunded credit commitments increased by $0.3 million to reflect changes in the estimate of loss exposure associated with certain unfunded credit commitments which increased the provision for credit losses by the same amount in 2014. No credit commitments were charged off against the Company's liability account for the years ended December 31, 2014 or 2013.
Non-Interest Income
The following table sets forth the components of non-interest income:
|
| | | | | | | | | | | | | | |
| | Year Ended December 31, | | Dollar Change | | Percent Change |
| | 2014 | | 2013 | | |
| | (Dollars in Thousands) |
| Deposit fees | $ | 8,692 |
| | $ | 8,172 |
| | $ | 520 |
| | 6.4 | % |
| Loan fees | 1,010 |
| | 1,415 |
| | (405 | ) | | (28.6 | )% |
| Loan level derivative income, net | 946 |
| | — |
| | 946 |
| | 100.0 | % |
| Gain on sales of loans and leases held-for-sale | 1,651 |
| | 794 |
| | 857 |
| | 107.9 | % |
| Gain on sales of investment securities, net | 65 |
| | 397 |
| | (332 | ) | | (83.6 | )% |
| Gain on sale/disposals of premises and equipment, net | 1,502 |
| | — |
| | 1,502 |
| | 100.0 | % |
| Other | 6,314 |
| | 4,841 |
| | 1,473 |
| | 30.4 | % |
| Total non-interest income | $ | 20,180 |
| | $ | 15,619 |
| | $ | 4,561 |
| | 29.2 | % |
For the year ended December 31, 2014, non-interest income increased $4.6 million, or 29.2%, to $20.2 million from $15.6 million for the year ended December 31, 2013.
Loan level derivative income, net increased $0.9 million for the year ended December 31, 2014 primarily driven by the execution of new loan level interest rate swap agreements completed in the year.
Gain on sales of loans and leases held for sale increased $0.9 million for the year ended December 31, 2014 primarily driven by the participation sale of certain pools of equipment financing to manage concentration risk.
Gain on sale/disposals of premises and equipment increased $1.5 million for the year ended December 31, 2014 primarily due to the sale of a building in 2014 which resulted in a gain of $1.6 million.
Other income increased $1.5 million to $6.3 million for the year ended December 31, 2014 primarily due to a $1.4 million legal settlement the company received from an insurance carrier in relation to litigation in 2014.
Non-Interest Expense
The following table sets forth the components of non-interest expense:
|
| | | | | | | | | | | | | | |
| | Year Ended December 31, | | Dollar Change | | Percent Change |
| | 2014 | | 2013 | | |
| | (Dollars in Thousands) |
| Compensation and employee benefits | $ | 71,801 |
| | $ | 65,261 |
| | $ | 6,540 |
| | 10.0 | % |
| Occupancy | 14,294 |
| | 12,616 |
| | 1,678 |
| | 13.3 | % |
| Equipment and data processing | 17,020 |
| | 16,899 |
| | 121 |
| | 0.7 | % |
| Professional services | 5,357 |
| | 5,673 |
| | (316 | ) | | (5.6 | )% |
| FDIC insurance | 3,362 |
| | 3,102 |
| | 260 |
| | 8.4 | % |
| Advertising and marketing | 3,058 |
| | 3,003 |
| | 55 |
| | 1.8 | % |
| Amortization of identified intangible assets | 3,343 |
| | 4,623 |
| | (1,280 | ) | | (27.7 | )% |
| Other | 10,925 |
| | 11,265 |
| | (340 | ) | | (3.0 | )% |
| Total non-interest expense | $ | 129,160 |
| | $ | 122,442 |
| | $ | 6,718 |
| | 5.5 | % |
For the year ended December 31, 2014, non-interest expense increased 5.5% to $129.2 million, primarily due to increases in compensation and employee benefits expenses. The efficiency ratio decreased to 61.73% for the year ended December 31, 2014 from 63.83% for the year ended December 31, 2013. Improvements in the efficiency ratio in 2014 were driven by increases in net interest income and non-interest income which were primarily offset by increases in non-interest expense.
In 2014, compensation and employee benefits expense increased $6.5 million, or 10.0%. Several factors contributed to the increase. The Company recorded an additional $3.6 million in incentive plan expenses in 2014. Supplemental Employee Retirement Plan expenses increased $1.3 million due to a decrease in the discount rate. Additionally, the Company suspended the indirect automobile lending line of business during the fourth quarter of 2014 and recognized a $0.2 million severance charge. There were also increases in overall compensation and employee benefits expense for additional staffing for the opening of the Wakefield, Rhode Island, branch of BankRI during the second quarter of 2014 and to support the growth in equipment financing.
Occupancy expense increased $1.7 million, or 13.3%, compared to 2013. The increase was primarily due to additional expenses associated with the newly opened branch in Wakefield, Rhode Island, as well as the recognition of future lease obligation associated with the consolidation of an operations center, offices for indirect automobile operations and two discontinued branch properties.
The increases in occupancy cost were offset by decreases in amortization of identified intangible assets due to the accelerated method of amortization for certain intangible assets and that several intangible assets that were fully amortized as of December 31, 2013.
Provision for income taxes |
| | | | | | | | | | | | | | |
| | Year Ended December 31, | | Dollar Change | | Percent Change |
| | 2014 | | 2013 | | |
| | (Dollars in Thousands) |
| Income before provision for income taxes | $ | 71,611 |
| | $ | 58,466 |
| | $ | 13,145 |
| | 22.5 | % |
| Provision for income taxes | 26,286 |
| | 20,664 |
| | 5,622 |
| | 27.2 | % |
| Net income | $ | 45,325 |
| | $ | 37,802 |
| | $ | 7,523 |
| | 19.9 | % |
| Effective tax rate | 36.7 | % | | 35.3 | % | | N/A |
| | 3.9 | % |
The Company recorded income tax expense of $26.3 million for 2014, compared to $20.7 million for 2013 which represents a total effective tax rates of 36.7% and 35.3%, respectively. The increase in the effective tax rate was primarily due to the tax credit received in 2013 for the rehabilitation of the Company's headquarters.
Liquidity and Capital Resources
Liquidity
Liquidity is defined as the ability to meet current and future financial obligations of a short-term nature. The Company further defines liquidity as the ability to respond to the needs of depositors and borrowers, as well as to earnings enhancement opportunities, in a changing marketplace. Liquidity management is monitored by an Asset/Liability Committee ("ALCO"), consisting of members of Management, which is responsible for establishing and monitoring liquidity targets as well as strategies and tactics to meet these targets.
The primary source of funds for the payment of dividends and expenses by the Company is dividends paid to it by the Banks and Brookline Securities Corp. The primary sources of liquidity for the Banks consist of deposit inflows, loan repayments, borrowed funds and maturing investment securities.
Deposits, which are considered the most stable source of liquidity, totaled $4.3 billion as of December 31, 2015 and represented 81.4% of total funding (the sum of total deposits and total borrowings), compared to deposits of $4.0 billion, or 77.8% of total funding, as of December 31, 2014. Core deposits, which consist of demand checking, NOW, savings and money market accounts, totaled $3.2 billion as of December 31, 2015 and represented 74.7% of total deposits, compared to core deposits of $3.0 billion, or 76.1% of total deposits, as of December 31, 2014. Additionally, the Company had $252.3 million of brokered deposits as of December 31, 2015, which represented 5.9% of total deposits, compared to $62.0 million or 1.6% of total deposits, as of December 31, 2014. The Company offers attractive interest rates based on market conditions to increase deposits balances, while managing cost of funds.
Borrowings are used to diversify the Company's funding mix and to support asset growth. When profitable lending and investment opportunities exist, access to borrowings provides a means to grow the balance sheet. Borrowings totaled $1.0 billion as of December 31, 2015, representing 18.6% of total funding, compared to $1.1 billion, or 22.2% of total funding, as of December 31, 2014. The decrease was due to decreased FHLBB borrowings of $142.2 million using the excess liquidity generated by the sale of the indirect automobile portfolio.
As members of the FHLBB, the Banks have access to both short- and long-term borrowings. As of December 31, 2015, the Company's total borrowing limit from the FHLBB for advances and repurchase agreements was $1.3 billion as compared to $1.5 billion as of December 31, 2014, based on the level of qualifying collateral available for these borrowings.
As of December 31, 2015, the Banks also have access to funding through certain uncommitted lines of credit of $119.0 million. The Company had a $12.0 million committed line of credit for contingent liquidity as of December 31, 2015.
The Company has access to the Federal Reserve Bank "discount window" to supplement its liquidity. The Company has $81.0 million of borrowing capacity at the Federal Reserve Bank as of December 31, 2015. As of December 31, 2015, the Company did not have any borrowings with the Federal Reserve Bank outstanding.
Additionally, the Banks have access to liquidity through repurchase agreements and brokered deposits.
In general, the Company seeks to maintain a high degree of liquidity and targets cash, cash equivalents and investment securities available-for-sale balances of between 10% and 30% of total assets. As of December 31, 2015, cash, cash equivalents and investment securities available-for-sale totaled $588.7 million, or 9.7% of total assets. This compares to $613.5 million, or 10.6% of total assets as of December 31, 2014.
While Management believes that the Company has adequate liquidity to meet its commitments, and to fund the Banks' lending and investment activities, the availabilities of these funding sources are subject to broad economic conditions and could be restricted in the future. Such restrictions would impact the Company's immediate liquidity and/or additional liquidity needs.
Capital Resources
As of December 31, 2015 and 2014, the Company and the Banks were under the primary regulation of and required to comply with the capital requirements of the FRB. At those dates, the Company, Brookline Bank, BankRI and First Ipswich exceeded all regulatory capital requirements and the banks were considered "well-capitalized." See details in "Supervision and Regulation" in Item 1.
The Company's and the Banks' actual and required capital amounts and ratios were as follows:
|
| | | | | | | | | | | | | | | | | | | | | |
| | | Actual | | Minimum Required for Capital Adequacy Purposes | | Minimum Required To Be Considered "Well- Capitalized" Under Prompt Corrective Action Rules |
| | | Amount | | Ratio | | Amount | | Ratio | | Amount | | Ratio |
| | | (Dollars in Thousands) |
| At December 31, 2015: | | | | | | | | | | | | |
| Brookline Bancorp, Inc. | | | | | | | | | | | | |
| Common equity Tier 1 capital ratio | (1) | $ | 530,505 |
| | 10.62 | % | | $ | 225,214 |
| | 4.50 | % | | N/A |
| | N/A |
|
| Tier 1 leverage capital ratio | (2) | 545,035 |
| | 9.37 | % | | 231,930 |
| | 4.00 | % | | N/A |
| | N/A |
|
| Tier 1 risk-based capital ratio | (3) | 545,035 |
| | 10.91 | % | | 300,019 |
| | 6.00 | % | | N/A |
| | N/A |
|
| Total risk-based capital ratio | (4) | 676,709 |
| | 13.54 | % | | 401,013 |
| | 8.00 | % | | N/A |
| | N/A |
|
| Brookline Bank | | | | | | | | | | | | |
| Common equity Tier 1 capital ratio | (1) | $ | 374,002 |
| | 11.89 | % | | $ | 141,548 |
| | 4.50 | % | | $ | 204,459 |
| | 6.50 | % |
| Tier 1 leverage capital ratio | (2) | 380,003 |
| | 10.78 | % | | 141,003 |
| | 4.00 | % | | 176,254 |
| | 5.00 | % |
| Tier 1 risk-based capital ratio | (3) | 380,003 |
| | 12.08 | % | | 188,743 |
| | 6.00 | % | | 251,658 |
| | 8.00 | % |
| Total risk-based capital ratio | (4) | 417,270 |
| | 13.27 | % | | 251,557 |
| | 8.00 | % | | 314,446 |
| | 10.00 | % |
| BankRI | | | | | | | | | | | | |
| Common equity Tier 1 capital ratio | (1) | $ | 171,967 |
| | 10.63 | % | | $ | 72,799 |
| | 4.50 | % | | $ | 105,154 |
| | 6.50 | % |
| Tier 1 leverage capital ratio | (2) | 171,967 |
| | 8.51 | % | | 80,831 |
| | 4.00 | % | | 101,038 |
| | 5.00 | % |
| Tier 1 risk-based capital ratio | (3) | 171,967 |
| | 10.63 | % | | 97,065 |
| | 6.00 | % | | 129,420 |
| | 8.00 | % |
| Total risk-based capital ratio | (4) | 189,953 |
| | 11.74 | % | | 129,440 |
| | 8.00 | % | | 161,800 |
| | 10.00 | % |
| First Ipswich | | | | | | | | | | | | |
| Common equity Tier 1 capital ratio | (1) | $ | 32,831 |
| | 13.87 | % | | $ | 10,652 |
| | 4.50 | % | | $ | 15,386 |
| | 6.50 | % |
| Tier 1 leverage capital ratio | (2) | 32,831 |
| | 9.26 | % | | 14,182 |
| | 4.00 | % | | 17,727 |
| | 5.00 | % |
| Tier 1 risk-based capital ratio | (3) | 32,831 |
| | 13.87 | % | | 14,202 |
| | 6.00 | % | | 18,936 |
| | 8.00 | % |
| Total risk-based capital ratio | (4) | 35,617 |
| | 15.05 | % | | 18,933 |
| | 8.00 | % | | 23,666 |
| | 10.00 | % |
| At December 31, 2014: | | | | | | | | | | | | |
| Brookline Bancorp, Inc. | | | | | | | | | | | | |
| Tier 1 leverage capital ratio | (1) | $ | 504,964 |
| | 9.01 | % | | $ | 224,179 |
| | 4.00 | % | | N/A |
| | N/A |
|
| Tier 1 risk-based capital ratio | (2) | 504,964 |
| | 10.55 | % | | 191,456 |
| | 4.00 | % | | N/A |
| | N/A |
|
| Total risk-based capital ratio | (3) | 633,421 |
| | 13.24 | % | | 382,732 |
| | 8.00 | % | | N/A |
| | N/A |
|
| Brookline Bank | | | | | | | | | | | | |
| Tier 1 leverage capital ratio | (1) | $ | 336,513 |
| | 9.60 | % | | $ | 140,214 |
| | 4.00 | % | | $ | 175,267 |
| | 5.00 | % |
| Tier 1 risk-based capital ratio | (2) | 336,513 |
| | 10.72 | % | | 125,565 |
| | 4.00 | % | | 188,347 |
| | 6.00 | % |
| Total risk-based capital ratio | (3) | 373,312 |
| | 11.90 | % | | 250,966 |
| | 8.00 | % | | 313,708 |
| | 10.00 | % |
| BankRI | | | | | | | | | | | | |
| Tier 1 leverage capital ratio | (1) | $ | 150,403 |
| | 8.43 | % | | $ | 71,366 |
| | 4.00 | % | | $ | 89,207 |
| | 5.00 | % |
| Tier 1 risk-based capital ratio | (2) | 150,403 |
| | 10.70 | % | | 56,225 |
| | 4.00 | % | | 84,338 |
| | 6.00 | % |
| Total risk-based capital ratio | (3) | 166,135 |
| | 11.82 | % | | 112,443 |
| | 8.00 | % | | 140,554 |
| | 10.00 | % |
| First Ipswich | | | | | | | | | | | | |
| Tier 1 leverage capital ratio | (1) | $ | 29,962 |
| | 9.27 | % | | $ | 12,929 |
| | 4.00 | % | | $ | 16,161 |
| | 5.00 | % |
| Tier 1 risk-based capital ratio | (2) | 29,962 |
| | 12.40 | % | | 9,665 |
| | 4.00 | % | | 14,498 |
| | 6.00 | % |
| Total risk-based capital ratio | (3) | 32,375 |
| | 13.40 | % | | 19,328 |
| | 8.00 | % | | 24,160 |
| | 10.00 | % |
| |
| (1) | Common equity tier 1 capital ratio is calculated by dividing common equity Tier 1 capital by risk-weighted assets. The ratio was established as part of the implementation of Basel III, effective January 1, 2015. |
| |
| (2) | The leases contain escalation clauses for real estate taxes and other expenditures, which are not included above.Tier 1 leverage capital ratio is calculated by dividing Tier 1 capital by average assets. |
| |
| (3) | Payments to service providers under most of the existing contracts are based on the volume of accounts served or transactions processed. Some contracts also call for higher required payments when there are increases in the Consumer Price Index. The expected payments shown in this table are based on an estimate of the number of accounts to be served or transactions to be processed, but do not include any projection of the effect of changes in the Consumer Price Index.Tier 1 risk-based capital ratio is calculated by dividing Tier 1 capital by risk-weighted assets. |
| |
| (4) | Total risk-based capital ratio is calculated by dividing total capital by risk-weighted assets. |
Off-Balance-Sheet Arrangements
The Company is party to off-balance sheet financial instruments in the normal course of business to meet the financing needs of its customers and to reduce its own exposure to fluctuations in interest rates. These financial instruments include loan commitments, standby and commercial letters of credit and interest rate swaps. According to GAAP, these financial instruments are not recorded in the financial statements until they are funded or related fees are incurred or received. The effect of such activity on the Company's financial condition and results of operations, such as recorded liability for unfunded credit commitment, is immaterial. See Note 13, "Commitments and Contingencies," to the consolidated financial statements for a description of off-balance-sheet financial instruments.
Stockholders' Equity and Dividends
Brookline Bancorp, Inc.'sThe Company's total stockholders' equity was $613.9$667.5 million as of December 31, 2015, representing a $25.7 million increase compared to $641.8 million at December 31, 2013, a $1.8 million increase compared to $612.1 million at December 31, 2012.2014. The increase primarily reflectsis due to net income of $35.4$49.8 million for the year ended December 31, 2013,2015, which was partially offset by dividends paid by the Company of $23.8 million and a decrease in other comprehensive income (OCI) of $11.4$25.0 million in that same period. The decrease in OCI2015.
For the year ended December 31, 2015, the dividend payout ratio was caused by changes in interest rates from 201250.2%, compared to 2013.55.2% for the year ended December 31, 2014. The dividends paid in the fourth quarter of 20132015 represented the Company's 59th67th consecutive quarter of dividend payments, and the 47th consecutive quarter in whichpayments. Additionally, the Company paidincreased the quarterly dividend distribution from $0.085 per share to $0.09 per share in the second quarter of 2015.
In 2015, 2014 and 2013, no shares of the Company's common stock were repurchased by the Company. On October 29, 2014, the Company’s Board of Directors authorized a regular dividendstock repurchase program to acquire up to $10.0 million of $0.085. Fortotal outstanding shares of the year endedCompany's common stock over a period of fourteen months ending on December 31, 2013, the dividend payout ratio was 67.4%, compared to 64.1% for the year ended2015. As of December 31, 2012.2015, no shares were repurchased under the stock repurchase program.
On February 4, 2016, the Company's Board of Directors authorized a stock repurchase program to acquire up to $10.0 million of total outstanding shares of the Company's common stock over a period of twelve months ending on January 31, 2017. Repurchases may be made from time to time depending on market conditions and other factors, and will be conducted through open market or private transactions, through block trades, and pursuant to any trading plan that may be adopted in accordance with the Securities and Exchange Commission Rule 10b5-1. There is no guarantee as to the exact number of shares, if any, to be repurchased by the Company.
Stockholders' equity represented 11.5%11.05% of total assets atas of December 31, 20132015 and 11.9%11.06% of total assets atas of December 31, 2012.2014. Tangible stockholders' equity (total stockholders' equity less goodwill and identified intangible assets, net) represented 8.9%8.81% of tangible assets (total assets less goodwill and identified intangible assets, net) atas of December 31, 20132015 and 9.1% at8.68% as of December 31, 2012.2014.
Liquidity and Capital Resources
Liquidity
Liquidity is defined as the ability to meet current and future financial obligations of a short-term nature. The Company further defines liquidity as the ability to respond to the needs of depositors and borrowers, as well as to earnings enhancement opportunities, in a changing marketplace. Liquidity management is monitored by an Asset/Liability Committee ("ALCO"), consisting of members of management, which is responsible for establishing and monitoring liquidity targets as well as strategies and tactics to meet these targets.
The primary source of funds for the payment of dividends and expenses by the Company is dividends paid to it by its Banks and Brookline Securities Corp. The primary sources of liquidity for the Banks consist of deposit inflows, loan repayments, borrowed funds and maturing investment securities and sales of securities from the available-for-sale portfolio.
Deposits, which are considered the most stable source of liquidity, totaled $3.8 billion at December 31, 2013 and represented 72.9% of total funding (the sum of total deposits, total borrowings, and stockholders' equity), compared to deposits of $3.6 billion, or 71.2% of total funding, at December 31, 2012. Core deposits, which consist of demand checking, NOW, savings and money market accounts, totaled $2.9 billion at December 31, 2013 and represented 75.6% of total deposits, compared to core deposits of $2.6 billion, or 72.0% of total deposits, at December 31, 2012. While deposits are considered the most reliable source of liquidity, the Company is careful to increase deposits without adversely impacting the weighted average cost of those funds.
Borrowings are used to diversify the Company's funding mix and to support asset growth. When profitable lending and investment opportunities exist, access to borrowings provides a means to grow the balance sheet. Borrowings totaled $812.6 million at December 31, 2013, representing 15.4% of total funding, compared to $854.0 million, or 16.8% of total funding, at December 31, 2012. As members of the FHLBB, the Banks have access to both short- and long-term borrowings. The Banks also have access to funding through retail repurchase agreements, brokered deposits and $119 million of uncommitted lines of credit, and may utilize additional sources of funding in the future, including borrowings at the Federal Reserve "discount window," to supplement its liquidity. At December 31, 2013, the Company's total borrowing limit from the FHLBB for advances and repurchase agreements was $957.0 million, based on the level of qualifying collateral available for these borrowings.
In general, the Company seeks to maintain a high degree of liquidity and targets cash and equivalents and available-for-sale security balances of between 10% and 30% of total assets. At December 31, 2013, cash and equivalents and available-for-sale securities totaled $584.9 million, or 11.0% of total assets. This compares to $598.4 million, or 11.6% of total assets at December 31, 2012.
While management believes that the Company has adequate liquidity to meet its commitments, and to fund the Banks' lending and investment activities, the availabilities of these funding sources are subject to broad economic conditions and could be restricted in the future. Such restrictions would impact the Company's immediate liquidity and/or additional liquidity needs.
Capital Resources
At December 31, 2013 and 2012, the Company and the Banks are all under the primary regulation of the FRB, and, as such, must comply with the capital requirements of the FRB. See details in "Supervision and Regulation" in Item 1.
At December 31, 2013, the Company, Brookline Bank, BankRI and First Ipswich exceeded all regulatory capital requirements and were considered "well-capitalized."
The Company's and the Banks' actual and required capital amounts and ratios are as follows
|
| | | | | | | | | | | | | | | | | | | | | |
| | | Actual | | Minimum Required for Capital Adequacy Purposes | | Minimum Required To Be Considered "Well- Capitalized" |
| | | Amount | | Ratio | | Amount | | Ratio | | Amount | | Ratio |
| | | (Dollars in Thousands) |
| At December 31, 2013: | | | | | | | | | | | | |
| Brookline Bancorp, Inc. | | | | | | | | | | | | |
| Tier 1 leverage capital ratio | (1) | $ | 480,472 |
| | 9.4 | % | | $ | 205,946 |
| | 4.0 | % | | N/A |
| | N/A |
|
| Tier 1 risk-based capital ratio | (2) | 480,472 |
| | 11.0 | % | | 174,512 |
| | 4.0 | % | | N/A |
| | N/A |
|
| Total risk-based capital ratio | (3) | 529,982 |
| | 12.2 | % | | 349,159 |
| | 8.0 | % | | N/A |
| | N/A |
|
| Brookline Bank | | | | | | | | | | | | |
| Tier 1 leverage capital ratio | (1) | $ | 299,822 |
| | 9.4 | % | | $ | 127,992 |
| | 4.0 | % | | $ | 159,990 |
| | 5.0 | % |
| Tier 1 risk-based capital ratio | (2) | 299,822 |
| | 10.4 | % | | 114,874 |
| | 4.0 | % | | 172,311 |
| | 6.0 | % |
| Total risk-based capital ratio | (3) | 335,727 |
| | 11.7 | % | | 229,753 |
| | 8.0 | % | | 287,192 |
| | 10.0 | % |
| BankRI | | | | | | | | | | | | |
| Tier 1 leverage capital ratio | (1) | $ | 134,904 |
| | 8.1 | % | | $ | 66,784 |
| | 4.0 | % | | $ | 83,480 |
| | 5.0 | % |
| Tier 1 risk-based capital ratio | (2) | 134,904 |
| | 10.6 | % | | 52,904 |
| | 4.0 | % | | 79,355 |
| | 6.0 | % |
| Total risk-based capital ratio | (3) | 145,847 |
| | 11.4 | % | | 105,782 |
| | 8.0 | % | | 132,228 |
| | 10.0 | % |
| First Ipswich | | | | | | | | | | | | |
| Tier 1 leverage capital ratio | (1) | $ | 30,435 |
| | 9.8 | % | | $ | 12,461 |
| | 4.0 | % | | $ | 15,576 |
| | 5.0 | % |
| Tier 1 risk-based capital ratio | (2) | 30,435 |
| | 13.6 | % | | 8,971 |
| | 4.0 | % | | 13,457 |
| | 6.0 | % |
| Total risk-based capital ratio | (3) | 32,289 |
| | 14.4 | % | | 17,938 |
| | 8.0 | % | | 22,423 |
| | 10.0 | % |
| At December 31, 2012: | | | | | | | | | | | | |
| Brookline Bancorp, Inc. | | | | | | | | | | | | |
| Tier 1 leverage capital ratio | (1) | $ | 465,142 |
| | 9.4 | % | | $ | 197,094 |
| | 4.0 | % | | N/A |
| | N/A |
|
| Tier 1 risk-based capital ratio | (2) | 465,142 |
| | 10.9 | % | | 171,481 |
| | 4.0 | % | | N/A |
| | N/A |
|
| Total risk-based capital ratio | (3) | 507,077 |
| | 11.8 | % | | 342,909 |
| | 8.0 | % | | N/A |
| | N/A |
|
| Brookline Bank | | | | | | | | | | | | |
| Tier 1 leverage capital ratio | (1) | $ | 282,706 |
| | 9.3 | % | | $ | 121,725 |
| | 4.0 | % | | $ | 152,156 |
| | 5.0 | % |
| Tier 1 risk-based capital ratio | (2) | 282,706 |
| | 9.8 | % | | 115,626 |
| | 4.0 | % | | 173,439 |
| | 6.0 | % |
| Total risk-based capital ratio | (3) | 318,629 |
| | 11.0 | % | | 231,310 |
| | 8.0 | % | | 289,137 |
| | 10.0 | % |
| First Ipswich | | | | | | | | | | | | |
| Tier 1 leverage capital ratio | (1) | $ | 29,209 |
| | 9.7 | % | | $ | 12,020 |
| | 4.0 | % | | $ | 15,025 |
| | 5.0 | % |
| Tier 1 risk-based capital ratio | (2) | 29,209 |
| | 13.2 | % | | 8,824 |
| | 4.0 | % | | 13,237 |
| | 6.0 | % |
| Total risk-based capital ratio | (3) | 30,168 |
| | 13.7 | % | | 17,642 |
| | 8.0 | % | | 22,053 |
| | 10.0 | % |
| |
(1) | Tier 1 leverage capital ratio is calculated by dividing Tier 1 capital by average assets. |
| |
(2) | Tier 1 risk-based capital ratio is calculated by dividing Tier 1 capital by risk-weighted assets. |
| |
(3) | Total risk-based capital ratio is calculated by dividing total capital by risk-weighted assets. |
Results of Operations
The primary drivers of the Company's net income are net interest income, which is strongly affected by the net yield on and growth of interest-earning assets and liabilities ("net interest margin"), the quality of the Company's assets, its levels of non-interest income and non-interest expense, and its tax provision.
The Company's net interest income represents the difference between interest income earned on its investments, loans and leases, and its cost of funds. Interest income dependsis dependent on the amount of interest-earning assets outstanding during the period and the yield earned thereon. Cost of funds is a function of the average amount of deposits and borrowed money outstanding during the year and the interest rates paid thereon. The net interest margin is calculated by dividing net interest income by average interest-earning assets. Net interest spread is the difference between the average rate earned on interest-earning assets and the average rate paid on interest-bearing liabilities. The increases (decreases)or decreases, as applicably in the components of interest income and interest expense, expressed in terms of fluctuation in average volume and rate, are
summarized under "Rate/Volume Analysis" on page 58.below. Information as to the components of interest income, interest expense and average rates is provided under "Average Balances, Net Interest Income, Interest-Rate Spread and Net Interest Margin" on page 56.below.
Because the Company's assets and liabilities are not identical in duration and in repricing dates, the differential between the two is vulnerable to changes in market interest rates as well as the overall shape of the yield curve. These vulnerabilities are inherent to the business of banking and are commonly referred to as "interest-rate risk." How interest-rate risk is measured and, once measured, how much interest-rate risk is taken are based on numerous assumptions and other subjective judgments. See the discussion in the "Measuring Interest-Rate Risk" section of Item 7A, "Quantitative and Qualitative Disclosures about Market Risk," on page 71.Risk" below.
The quality of the Company's assets also influences its earnings. Loans and leases that are not paid on a timely basis and exhibit other weaknesses can result in the loss of principal and/or interest income. Additionally, the Company must make timely provisions to the allowance for loan and lease losses based on estimates of probable losses inherent in the loan and lease portfolio. These additions, which are charged against earnings, are necessarily greater when greater probable losses are expected. Further, the Company incurs expenses as a result of resolving troubled assets. These variables reflect the "credit risk" that the Company takes on in the ordinary course of business and are further discussed under "Financial Condition—Asset Quality" on pages 37.above.
General
The Company's net income of $35.4 million for the year ended December 31, 2013 decreased by $1.8 million, or 4.7%, compared to the year ended December 31, 2012. Operating income decreased $5.1 million, or 12.5%, after adjustment for the $0.6 million of after-tax compensation-related expenses incurred during 2013 associated with the departure of the Chief Financial Officer. Basic and diluted operating EPS decreased 11.9% compared to 2012, from $0.59 to $0.52.
Earnings in 2013 represented a return on average assets of 0.68% and a return on average stockholders' equity of 5.74%, as compared to a return on average assets of 0.74% and a return on average stockholders' equity of 6.12% for 2012. Operating earnings in 2013 represented an operating return on average assets of 0.70% and an operating return on average stockholders' equity of 5.84%, as compared to an operating return on average assets of 0.82% and an operating return on average stockholders' equity of 6.78% for 2012.
Selected income statement, per share data and operating ratios are presented in the table below for the years indicated:
|
| | | | | | | | | | | | | | |
| | Year Ended December 31, | | Dollar Change | | Percent Change |
| | 2013 | | 2012 | | |
| | (Dollars in Thousands, Except Per Share Data) |
| Income statement data: | | | | | | | |
| Net interest income | $ | 176,218 |
| | $ | 177,368 |
| | $ | (1,150 | ) | | (0.6 | )% |
| Non-interest income | 13,825 |
| | 18,605 |
| | (4,780 | ) | | (25.7 | )% |
| Provision for credit losses | 10,929 |
| | 15,888 |
| | (4,959 | ) | | (31.2 | )% |
| Non-interest expense | 122,460 |
| | 120,375 |
| | 2,085 |
| | 1.7 | % |
| Provision for income taxes | 19,481 |
| | 21,341 |
| | (1,860 | ) | | (8.7 | )% |
| Net income | 37,173 |
| | 38,369 |
| | (1,196 | ) | | (3.1 | )% |
| Net income attributable to Brookline Bancorp, Inc. | 35,386 |
| | 37,142 |
| | (1,756 | ) | | (4.7 | )% |
| Operating earnings(4) | 35,981 |
| | 41,114 |
| | (5,133 | ) | | (12.5 | )% |
| Per share data: | | | | | | | |
| Earnings per basic and diluted share | $ | 0.51 |
| | $ | 0.53 |
| | $ | (0.02 | ) | | (3.8 | )% |
| Operating earnings per basic and diluted share(4) | 0.52 |
| | 0.59 |
| | (0.07 | ) | | (11.9 | )% |
| Dividends per common share | 0.34 |
| | 0.34 |
| | — |
| | — |
|
| Operating ratios: | | | | | | | |
| Interest rate spread | 3.49 | % | | 3.67 | % | | | | |
| Net interest margin(1)(4) | 3.64 | % | | 3.85 | % | | | | |
| Return on average assets(2)(4) | 0.68 | % | | 0.74 | % | | | | |
| Operating return on average assets(4) | 0.70 | % | | 0.82 | % | | | | |
| Efficiency ratio | 64.44 | % | | 61.42 | % | | | | |
| Operating efficiency ratio(4) | 63.96 | % | | 58.67 | % | | | | |
| Return on average stockholders' equity(3)(4) | 5.74 | % | | 6.12 | % | | | | |
| |
(1) | Calculated as a fully taxable equivalent by dividing net interest income by average interest-earning assets. |
| |
(2) | Calculated by dividing net income by average total assets. |
| |
(3) | Calculated by dividing net income applicable to common shares by average common stockholders' equity. |
| |
(4) | Non-GAAP performance measure. |
Average Balances, Net Interest Income, Interest-Rate Spread and Net Interest Margin
The net interest margin for 2013 was 3.64% compared to a net interest margin of 3.85% for the prior year. The yield on the Company's interest-earning assets decreased by 35 basis points compared to 2012 and net interest income decreased$1.2 million, or 0.6%, and this was offset by a decline in the cost of funds on interest-bearing liabilities by 17 basis points. Interest-earning assets increased by $181.2 million from 2012, mostly as a resulted of growth in the Company’s commercial real estate, commercial loan and leases and consumer loan portfolios. Interest-bearing liabilities increased by $104.6 million mainly in the Company’s money market accounts.
The following table sets forth information about the Company's average balances, interest income and interest rates earned on average interest-earning assets, interest expense and interest rates paid on average interest-bearing liabilities, interest-rate spread and net interest margin for the years ended December 31, 2013, 20122015, 2014 and 2011.2013. Average balances are derived from daily average balances and yields include fees, costs and purchase-accounting-related premiums and discounts which are considered adjustments to coupon yields in accordance with GAAP. Certain amounts previously reported have been reclassified to conform to the current presentation.
| | | | Year Ended December 31, | Year Ended December 31, |
| | 2013 | | 2012 | | 2011 | 2015 | | 2014 | | 2013 |
| | Average Balance | | Interest(1) | | Average Yield/ Cost | | Average Balance | | Interest(1) | | Average Yield/ Cost | | Average Balance | | Interest(1) | | Average Yield/ Cost | Average Balance | | Interest (1) | | Average Yield/ Cost | | Average Balance | | Interest (1) | | Average Yield/ Cost | | Average Balance | | Interest (1) | | Average Yield/ Cost |
| | (Dollars in Thousands) | (Dollars in Thousands) |
| Assets: | | | | | | | | | | | | | | | | | | | | | | | | | | | | | | | | | | |
| Interest-earning assets: | | | | | | | | | | | | | | | | | | | | | | | | | | | | | | | | | | |
| Debt securities | | $ | 583,921 |
| | $ | 11,521 |
| | 1.97 | % | | $ | 518,920 |
| | $ | 9,531 |
| | 1.84 | % | | $ | 476,387 |
| | $ | 7,983 |
| | 1.68 | % |
| Marketable and restricted equity securities | | 73,808 |
| | 2,793 |
| | 3.78 | % | | 72,151 |
| | 2,112 |
| | 2.93 | % | | 68,306 |
| | 1,223 |
| | 1.79 | % |
| Short-term investments | $ | 62,258 |
| | $ | 111 |
| | 0.18 | % | | $ | 95,173 |
| | $ | 209 |
| | 0.22 | % | | $ | 73,628 |
| | $ | 105 |
| | 0.14 | % | 56,520 |
| | 128 |
| | 0.23 | % | | 45,560 |
| | 102 |
| | 0.22 | % | | 62,258 |
| | 111 |
| | 0.18 | % |
| Investment securities available-for-sale(2) | 477,318 |
| | 7,983 |
| | 1.67 | % | | 449,694 |
| | 8,606 |
| | 1.91 | % | | 278,300 |
| | 6,327 |
| | 2.27 | % | |
| Marketable and restricted equity securities(2) | 67,375 |
| | 1,405 |
| | 2.09 | % | | 58,354 |
| | 824 |
| | 1.41 | % | | 39,557 |
| | 224 |
| | 0.57 | % | |
| Loans and leases: | | | | | | | | | | | | | | | | | | |
| Total investments | | 714,249 |
| | 14,442 |
| | 2.02 | % | | 636,631 |
| | 11,745 |
| | 1.84 | % | | 606,951 |
| | 9,317 |
| | 1.54 | % |
Commercial real estate loans(3)(2) | 2,091,860 |
| | 98,245 |
| | 4.67 | % | | 1,910,320 |
| | 94,521 |
| | 4.97 | % | | 1,162,769 |
| | 61,211 |
| | 5.26 | % | 2,529,566 |
| | 106,447 |
| | 4.21 | % | | 2,324,934 |
| | 103,324 |
| | 4.42 | % | | 2,091,860 |
| | 98,245 |
| | 4.67 | % |
Commercial loans(3)(2) | 435,184 |
| | 20,580 |
| | 4.68 | % | | 370,366 |
| | 19,471 |
| | 5.26 | % | | 180,713 |
| | 8,698 |
| | 4.81 | % | 636,084 |
| | 26,590 |
| | 4.13 | % | | 522,208 |
| | 21,341 |
| | 4.04 | % | | 435,184 |
| | 20,580 |
| | 4.68 | % |
Equipment financing(3)(2) | 452,601 |
| | 31,076 |
| | 6.87 | % | | 394,845 |
| | 32,027 |
| | 8.11 | % | | 221,458 |
| | 18,018 |
| | 8.14 | % | 650,376 |
| | 44,468 |
| | 6.84 | % | | 554,240 |
| | 39,807 |
| | 7.18 | % | | 452,601 |
| | 31,076 |
| | 6.87 | % |
Indirect automobile loans(3)(2) | 475,387 |
| | 17,355 |
| | 3.65 | % | | 573,398 |
| | 23,641 |
| | 4.12 | % | | 575,635 |
| | 28,313 |
| | 4.92 | % | 83,218 |
| | 2,686 |
| | 3.23 | % | | 366,217 |
| | 11,812 |
| | 3.23 | % | | 475,387 |
| | 17,355 |
| | 3.65 | % |
Residential mortgage loans(3)(2) | 511,348 |
| | 19,926 |
| | 3.90 | % | | 501,660 |
| | 21,998 |
| | 4.39 | % | | 335,940 |
| | 14,901 |
| | 4.44 | % | 600,072 |
| | 21,455 |
| | 3.58 | % | | 551,481 |
| | 19,957 |
| | 3.62 | % | | 511,348 |
| | 19,926 |
| | 3.90 | % |
Other consumer loans(3)(2) | 263,955 |
| | 10,624 |
| | 4.02 | % | | 269,725 |
| | 12,299 |
| | 4.56 | % | | 76,156 |
| | 3,022 |
| | 3.97 | % | 311,855 |
| | 11,792 |
| | 3.78 | % | | 280,663 |
| | 11,189 |
| | 3.98 | % | | 263,955 |
| | 10,624 |
| | 4.02 | % |
| Total loans and leases | | 4,811,171 |
| | 213,438 |
| | 4.44 | % | | 4,599,743 |
| | 207,430 |
| | 4.51 | % | | 4,230,335 |
| | 197,806 |
| | 4.68 | % |
| Total interest-earning assets | 4,837,286 |
| | 207,305 |
| | 4.27 | % | | 4,623,535 |
| | 213,596 |
| | 4.62 | % | | 2,944,156 |
| | 140,819 |
| | 4.79 | % | 5,525,420 |
| | 227,880 |
| | 4.12 | % | | 5,236,374 |
| | 219,175 |
| | 4.19 | % | | 4,837,286 |
| | 207,123 |
| | 4.28 | % |
| Allowance for loan and lease losses | (44,008 | ) | | | | | | (38,073 | ) | | | | | | (30,564 | ) | | | | | (55,950 | ) | | | | | | (51,480 | ) | | | | | | (44,008 | ) | | | | |
| Non-interest-earning assets | 380,724 |
| | | | | | 407,330 |
| | | | | | 148,155 |
| | | | | 371,279 |
| | | | | | 371,330 |
| | | | | | 380,954 |
| | | | |
| Total assets | $ | 5,174,002 |
| | | | | | $ | 4,992,792 |
| | | | | | $ | 3,061,747 |
| | | | | $ | 5,840,749 |
| | | | | | $ | 5,556,224 |
| | | | | | $ | 5,174,232 |
| | | | |
| Liabilities and Stockholders' Equity: | | | | | | | | | | | | | | | | | | | | | | | | | | | | | | | | | | |
| Interest-bearing liabilities: | | | | | | | | | | | | | | | | | | | | | | | | | | | | | | | | | | |
| Interest-bearing deposits: | | | | | | | | | | | | | | | | | | | | | | | | | | | | | | | | | | |
| NOW accounts | $ | 198,050 |
| | 173 |
| | 0.09 | % | | $ | 183,046 |
| | 209 |
| | 0.11 | % | | $ | 126,950 |
| | 216 |
| | 0.17 | % | $ | 249,204 |
| | 179 |
| | 0.07 | % | | $ | 220,377 |
| | 171 |
| | 0.08 | % | | $ | 205,922 |
| | 173 |
| | 0.08 | % |
| Savings accounts | 509,436 |
| | 1,288 |
| | 0.25 | % | | 517,485 |
| | 1,726 |
| | 0.33 | % | | 157,578 |
| | 942 |
| | 0.60 | % | 532,496 |
| | 1,094 |
| | 0.21 | % | | 518,741 |
| | 1,197 |
| | 0.23 | % | | 509,436 |
| | 1,288 |
| | 0.25 | % |
| Money market accounts | 1,370,195 |
| | 8,220 |
| | 0.60 | % | | 1,203,113 |
| | 8,773 |
| | 0.73 | % | | 830,780 |
| | 7,626 |
| | 0.92 | % | 1,560,437 |
| | 6,935 |
| | 0.44 | % | | 1,526,915 |
| | 7,846 |
| | 0.51 | % | | 1,370,195 |
| | 8,220 |
| | 0.60 | % |
| Certificates of deposit | 971,044 |
| | 9,092 |
| | 0.94 | % | | 1,055,510 |
| | 10,724 |
| | 1.02 | % | | 813,470 |
| | 10,973 |
| | 1.35 | % | |
| Total interest-bearing deposits(4) | 3,048,725 |
| | 18,773 |
| | 0.62 | % | | 2,959,154 |
| | 21,432 |
| | 0.72 | % | | 1,928,778 |
| | 19,757 |
| | 1.02 | % | |
| Certificate of deposit | | 1,045,328 |
| | 9,272 |
| | 0.78 | % | | 911,072 |
| | 7,846 |
| | 0.86 | % | | 971,044 |
| | 9,092 |
| | 0.94 | % |
| Total interest-bearing deposits (3) | | 3,387,465 |
| | 17,480 |
| | 0.52 | % | | 3,177,105 |
| | 17,060 |
| | 0.54 | % | | 3,056,597 |
| | 18,773 |
| | 0.61 | % |
| Advances from the FHLBB | 759,640 |
| | 10,886 |
| | 1.43 | % | | 732,457 |
| | 13,710 |
| | 1.87 | % | | 414,432 |
| | 10,454 |
| | 2.52 | % | 840,123 |
| | 9,950 |
| | 1.17 | % | | 935,400 |
| | 10,535 |
| | 1.11 | % | | 759,640 |
| | 10,886 |
| | 1.43 | % |
| Subordinated debentures and notes | | 82,846 |
| | 5,001 |
| | 6.04 | % | | 30,766 |
| | 1,740 |
| | 5.66 | % | | 9,548 |
| | 439 |
| | 4.60 | % |
| Other borrowed funds | 48,367 |
| | 507 |
| | 1.05 | % | | 60,497 |
| | 690 |
| | 1.14 | % | | 7,696 |
| | 125 |
| | 1.60 | % | 34,468 |
| | 114 |
| | 0.33 | % | | 28,568 |
| | 79 |
| | 0.28 | % | | 38,819 |
| | 68 |
| | 0.18 | % |
| Total borrowed funds | | 957,437 |
| | 15,065 |
| | 1.55 | % | | 994,734 |
| | 12,354 |
| | 1.22 | % | | 808,007 |
| | 11,393 |
| | 1.39 | % |
| Total interest-bearing liabilities | 3,856,732 |
| | 30,166 |
| | 0.78 | % | | 3,752,108 |
| | 35,832 |
| | 0.95 | % | | 2,350,906 |
| | 30,336 |
| | 1.29 | % | 4,344,902 |
| | 32,545 |
| | 0.75 | % | | 4,171,839 |
| | 29,414 |
| | 0.71 | % | | 3,864,604 |
| | 30,166 |
| | 0.78 | % |
| Non-interest-bearing liabilities: | | | | | | | | | | | | | | | | | | | | | | | | | | | | | | | | | | |
| Non-interest-bearing deposits: | | | | | | | | | | | | | | | | | | |
| Non-interest-bearing demand checking accounts(4) | 656,724 |
| | |
| | |
| | 562,238 |
| | |
| | |
| | 181,078 |
| | |
| | |
| |
| Non-interest-bearing demand checking accounts (3) | | 770,045 |
| | |
| | |
| | 700,815 |
| | |
| | |
| | 648,852 |
| | |
| | |
|
| Other non-interest-bearing liabilities | 40,574 |
| | |
| | |
| | 68,055 |
| | |
| | |
| | 26,091 |
| | |
| | |
| 62,914 |
| | |
| | |
| | 48,378 |
| | |
| | |
| | 40,574 |
| | |
| | |
|
| Total liabilities | 4,554,030 |
| | |
| | |
| | 4,382,401 |
| | |
| | |
| | 2,558,075 |
| | |
| | |
| 5,177,861 |
| | |
| | |
| | 4,921,032 |
| | |
| | |
| | 4,554,030 |
| | |
| | |
|
| Brookline Bancorp, Inc. stockholders' equity | 616,243 |
| | |
| | |
| | 606,661 |
| | |
| | |
| | 500,855 |
| | |
| | |
| 657,841 |
| | |
| | |
| | 630,966 |
| | |
| | |
| | 616,473 |
| | |
| | |
|
| Noncontrolling interest in subsidiary | 3,729 |
| | |
| | |
| | 3,730 |
| | |
| | |
| | 2,817 |
| | |
| | |
| 5,047 |
| | |
| | |
| | 4,226 |
| | |
| | |
| | 3,729 |
| | |
| | |
|
| Total liabilities and equity | $ | 5,174,002 |
| | |
| | |
| | $ | 4,992,792 |
| | |
| | |
| | $ | 3,061,747 |
| | |
| | |
| $ | 5,840,749 |
| | |
| | |
| | $ | 5,556,224 |
| | |
| | |
| | $ | 5,174,232 |
| | |
| | |
|
| Net interest income (tax-equivalent basis) / Interest-rate spread(5) | |
| | 177,139 |
| | 3.49 | % | | |
| | 177,764 |
| | 3.67 | % | | |
| | 110,483 |
| | 3.50 | % | |
| Net interest income (tax-equivalent basis) / Interest-rate spread (4) | | |
| | 195,335 |
| | 3.37 | % | | |
| | 189,761 |
| | 3.48 | % | | |
| | 176,957 |
| | 3.50 | % |
| Less adjustment of tax-exempt income | |
| | 921 |
| | |
| | |
| | 396 |
| | |
| | |
| | 284 |
| | |
| |
| | 970 |
| | |
| | |
| | 693 |
| | |
| | |
| | 739 |
| | |
|
| Net interest income | |
| | $ | 176,218 |
| | |
| | |
| | $ | 177,368 |
| | |
| | |
| | $ | 110,199 |
| | |
| |
| | $ | 194,365 |
| | |
| | |
| | $ | 189,068 |
| | |
| | |
| | $ | 176,218 |
| | |
|
| Net interest margin(6) | |
| | |
| | 3.64 | % | | |
| | |
| | 3.85 | % | | |
| | |
| | 3.76 | % | |
| Net interest margin (5) | | |
| | |
| | 3.54 | % | | |
| | |
| | 3.61 | % | | |
| | |
| | 3.64 | % |
| |
| (1) | Tax-exempt income on debt securities, equity securities and revenue bonds included in commercial real estate loans is included on a tax-equivalent basis. |
| |
| (2) | Average balances include unrealized gains (losses) on securities available-for-sale. Equity securities include marketable equity securities and restricted equity securities. Dividend payments may not be consistent and average yield on equity securities may vary from month to month. |
| |
(3) | Loans on nonaccrual status are included in the average balances. |
| |
(4)(3) | Including non-interest-bearing checking accounts, the average interest rate on total deposits was 0.51%0.42%, 0.61%0.44% and 0.94%0.51% in the years ended December 31, 2013, 20122015, 2014 and 2011,2013, respectively. |
| |
(5)(4) | Interest-rate spread represents the difference between the yield on interest-earning assets and the cost of interest-bearing liabilities. |
| |
(6)(5) | Net interest margin represents net interest income (tax equivalent basis) divided by average interest-earning assets. |
See "Comparison of Years Ended December 31, 20132015 and December 31, 2012"2014" and "Comparison of Years Ended December 31, 20122014 and December 31, 2011"2013" on pages 59 and 65, respectivelybelow for a discussion of average assets and liabilities, net interest income, interest-rate spread and net interest margin.
Rate/Volume Analysis
The following table presents, on a tax-equivalent basis, the extent to which changes in interest rates and changes in volume of interest-earning assets and interest-bearing liabilities have affected the Company's interest income and interest expense during the periods indicated. Information is provided in each category with respect to: (i) changes attributable to changes in volume (changes in volume multiplied by prior rate), (ii) changes attributable to changes in rate (changes in rate multiplied by prior volume), and (iii) the net change. The changes attributable to the combined impact of volume and rate have been allocated proportionately to the changes due to volume and the changes due to rate.
| | | | Year Ended
December 31, 2013
Compared to Year Ended
December 31, 2012 | | Year Ended
December 31, 2012
Compared to Year Ended
December 31, 2011 | Year Ended
December 31, 2015
Compared to Year Ended
December 31, 2014 | | Year Ended
December 31, 2014
Compared to Year Ended
December 31, 2013 |
| | Increase (Decrease) Due To | | | | Increase (Decrease) Due To | | | Increase (Decrease) Due To | | | | Increase (Decrease) Due To | | |
| | Volume | | Rate | | Net Change | | Volume | | Rate | | Net Change | Volume | | Rate | | Net Change | | Volume | | Rate | | Net Change |
| | (In Thousands) | (In Thousands) |
| Interest and dividend income: | | | | | | | | | | | | | | | | | | | | | | |
| Investments: | | | | | | | | | | | | |
| Debt securities | | $ | 1,196 |
| | $ | 794 |
| | 1,990 |
| | $ | 749 |
| | $ | 799 |
| | $ | 1,548 |
|
| Marketable and restricted equity securities | | 49 |
| | 632 |
| | 681 |
| | 72 |
| | 817 |
| | 889 |
|
| Short-term investments | $ | (64 | ) | | $ | (34 | ) | | $ | (98 | ) | | $ | 35 |
| | $ | 69 |
| | $ | 104 |
| 24 |
| | 2 |
| | 26 |
| | (32 | ) | | 23 |
| | (9 | ) |
| Investment securities available-for-sale | 508 |
| | (1,131 | ) | | (623 | ) | | 3,394 |
| | (1,115 | ) | | 2,279 |
| |
| Marketable and restricted equity securities | 143 |
| | 438 |
| | 581 |
| | 146 |
| | 454 |
| | 600 |
| |
| Loans: | | | | | | | | | | | | |
| Total investments | | 1,269 |
| | 1,428 |
| | 2,697 |
| | 789 |
| | 1,639 |
| | 2,428 |
|
| Loans and leases: | | | | | | | | | | | | |
| Commercial real estate loans | 9,306 |
| | (5,582 | ) | | 3,724 |
| | 36,899 |
| | (3,589 | ) | | 33,310 |
| 9,045 |
| | (5,922 | ) | | 3,123 |
| | 10,458 |
| | (5,379 | ) | | 5,079 |
|
| Commercial loans | 3,318 |
| | (2,209 | ) | | 1,109 |
| | 9,900 |
| | 873 |
| | 10,773 |
| |
| Commercial loans and leases | | 4,601 |
| | 648 |
| | 5,249 |
| | 3,752 |
| | (2,991 | ) | | 761 |
|
| Equipment financing | 4,340 |
| | (5,291 | ) | | (951 | ) | | 14,064 |
| | (55 | ) | | 14,009 |
| 6,903 |
| | (2,242 | ) | | 4,661 |
| | 7,255 |
| | 1,476 |
| | 8,731 |
|
| Indirect automobile loans | (3,767 | ) | | (2,519 | ) | | (6,286 | ) | | (109 | ) | | (4,563 | ) | | (4,672 | ) | (9,141 | ) | | 15 |
| | (9,126 | ) | | (3,691 | ) | | (1,852 | ) | | (5,543 | ) |
| Residential mortgage loans | 419 |
| | (2,491 | ) | | (2,072 | ) | | 7,268 |
| | (171 | ) | | 7,097 |
| 1,759 |
| | (261 | ) | | 1,498 |
| | 1,502 |
| | (1,471 | ) | | 31 |
|
| Other consumer loans | (258 | ) | | (1,417 | ) | | (1,675 | ) | | 8,761 |
| | 516 |
| | 9,277 |
| 1,241 |
| | (638 | ) | | 603 |
| | 677 |
| | (112 | ) | | 565 |
|
| Total loans | 13,358 |
| | (19,509 | ) | | (6,151 | ) | | 76,783 |
| | (6,989 | ) | | 69,794 |
| 14,408 |
| | (8,400 | ) | | 6,008 |
| | 19,953 |
| | (10,329 | ) | | 9,624 |
|
| Total change in interest and dividend income | 13,945 |
| | (20,236 | ) | | (6,291 | ) | | 80,358 |
| | (7,581 | ) | | 72,777 |
| 15,677 |
| | (6,972 | ) | | 8,705 |
| | 20,742 |
| | (8,690 | ) | | 12,052 |
|
| Interest expense: | | | | | | | | | | | | | | | | | | | | | | |
| Deposits: | | | | | | | | | | | | | | | | | | | | | | |
| NOW accounts | 16 |
| | (52 | ) | | (36 | ) | | 77 |
| | (84 | ) | | (7 | ) | 23 |
| | (15 | ) | | 8 |
| | 8 |
| | (10 | ) | | (2 | ) |
| Savings accounts | (27 | ) | | (411 | ) | | (438 | ) | | 1,355 |
| | (571 | ) | | 784 |
| 32 |
| | (135 | ) | | (103 | ) | | 24 |
| | (115 | ) | | (91 | ) |
| Money market accounts | 1,125 |
| | (1,678 | ) | | (553 | ) | | 2,934 |
| | (1,787 | ) | | 1,147 |
| 171 |
| | (1,082 | ) | | (911 | ) | | 905 |
| | (1,279 | ) | | (374 | ) |
| Certificates of deposit | (827 | ) | | (805 | ) | | (1,632 | ) | | 2,822 |
| | (3,071 | ) | | (249 | ) | |
| Certificate of deposit | | 724 |
| | 702 |
| | 1,426 |
| | (537 | ) | | (709 | ) | | (1,246 | ) |
| Total deposits | 287 |
| | (2,946 | ) | | (2,659 | ) | | 7,188 |
| | (5,513 | ) | | 1,675 |
| 950 |
| | (530 | ) | | 420 |
| | 400 |
| | (2,113 | ) | | (1,713 | ) |
| Borrowed funds: | | | | | | | | | | | | |
| Advances from the FHLBB | 494 |
| | (3,318 | ) | | (2,824 | ) | | 6,471 |
| | (3,215 | ) | | 3,256 |
| (1,058 | ) | �� | 473 |
| | (585 | ) | | 2,293 |
| | (2,644 | ) | | (351 | ) |
| Subordinated debentures and notes | | 2,948 |
| | 313 |
| | 3,261 |
| | 1,179 |
| | 122 |
| | 1,301 |
|
| Other borrowed funds | (130 | ) | | (53 | ) | | (183 | ) | | 612 |
| | (47 | ) | | 565 |
| 17 |
| | 18 |
| | 35 |
| | (21 | ) | | 32 |
| | 11 |
|
| Total borrowed funds | | 1,907 |
| | 804 |
| | 2,711 |
| | 3,451 |
| | (2,490 | ) | | 961 |
|
| Total change in interest expense | 651 |
| | (6,317 | ) | | (5,666 | ) | | 14,271 |
| | (8,775 | ) | | 5,496 |
| 2,857 |
| | 274 |
| | 3,131 |
| | 3,851 |
| | (4,603 | ) | | (752 | ) |
| Change in tax-exempt income | — |
| | (525 | ) | | (525 | ) | | — |
| | (112 | ) | | (112 | ) | — |
| | (277 | ) | | (277 | ) | | — |
| | 46 |
| | 46 |
|
| Change in net interest income | $ | 13,294 |
| | $ | (14,444 | ) | | $ | (1,150 | ) | | $ | 66,087 |
| | $ | 1,082 |
| | $ | 67,169 |
| $ | 12,820 |
| | $ | (7,523 | ) | | $ | 5,297 |
| | $ | 16,891 |
| | $ | (4,041 | ) | | $ | 12,850 |
|
See "Comparison of Years Ended December 31, 20132015 and December 31, 2012"2014" and "Comparison of Years Ended December 31, 20122014 and December 31, 2011"2013" below for a discussion of changes in interest income, interest-rate spread and net interest margin resulting from changes in rates and volumes.
Comparison of Years Ended December 31, 2013 and December 31, 2012
General
|
| | | | | | | | | | | | | | |
| | Year Ended December 31, | | Dollar Change | | Percent Change |
| | 2013 | | 2012 | | |
| | (Dollars in Thousands) |
| Interest and dividend income | $ | 206,384 |
| | $ | 213,200 |
| | $ | (6,816 | ) | | (3.2 | )% |
| Interest expense | 30,166 |
| | 35,832 |
| | (5,666 | ) | | (15.8 | )% |
| Net interest income | 176,218 |
| | 177,368 |
| | (1,150 | ) | | (0.6 | )% |
| Provision for credit losses | 10,929 |
| | 15,888 |
| | (4,959 | ) | | (31.2 | )% |
| Net interest income after provision for credit losses | 165,289 |
| | 161,480 |
| | 3,809 |
| | 2.4 | % |
| Non-interest income | 13,825 |
| | 18,605 |
| | (4,780 | ) | | (25.7 | )% |
| Non-interest expense | 122,460 |
| | 120,375 |
| | 2,085 |
| | 1.7 | % |
| Provision for income taxes | 19,481 |
| | 21,341 |
| | (1,860 | ) | | (8.7 | )% |
| Net income | 37,173 |
| | 38,369 |
| | (1,196 | ) | | (3.1 | )% |
| Less net income attributable to noncontrolling interest in subsidiary | 1,787 |
| | 1,227 |
| | 560 |
| | 45.6 | % |
| Net income attributable to Brookline Bancorp, Inc. | $ | 35,386 |
| | $ | 37,142 |
| | $ | (1,756 | ) | | (4.7 | )% |
Net income for 2013 decreased $1.8 million, or 4.7%, to $35.4 million from $37.1 million for 2012. BasicComparison of Years Ended December 31, 2015 and fully diluted EPS decreased to $0.51 for 2013 from $0.53 for 2012. Net income for 2013 includes $0.6 million (after-tax) of compensation-related expenses incurred during 2013 associated with the departure of the Chief Financial Officer. The 2013 earnings represent a return on average assets of 0.68% and a return on average stockholders' equity of 5.74%, as compared to a return on average assets of 0.74% and a return on average stockholders' equity of 6.12% for 2012.December 31, 2014
Net Interest Income
Net interest income decreased $1.2increased $5.3 million in 2013 compared to 2012.$194.4 million for the year ended December 31, 2015 from $189.1 million for the year ended December 31, 2014. The decreaseincrease year over year reflects $6.6a $5.8 million lessincrease in interest income on loans and leases, mitigateda $1.9 million increase in interest income on debt securities, offset by lowera $3.1 million increase in interest expense on deposit and borrowings, of $5.7 million which is reflective of the various portfolios repricing and replacing balances into the current low interest rate environment.
Net interest margin decreased by 217 basis points, to 3.64%3.54% in 20132015 from 3.85%3.61% in 2012.2014. Competitive pressures on loan pricing resulted in decreases in the Company's weighted average interest rate on loans (prior to purchase accounting adjustments) to 4.66%4.44% for the year ended December 31, 20132015 from 5.08%4.51% for the year ended December 31, 2012.2014. Interest amortization and accretion on acquired loans totaled $4.7$4.5 million and contributed 109 basis points to 20132015 loan yields, compared to $6.7$8.4 million and 1716 basis points in 2012,2014. The decrease in the net interest margin is the result of repricing interest-earning assets in a lower interest rate environment without a comparable offset in lower funding costs.
The yield on interest-earning assets decreased to 4.12% for the year ended December 31, 2015 from 4.19% for the year ended December 31, 2014. This decrease is the result of the continued pricing pressure due to the low interest rate environment and the intense competition in most loan categories, as well as a decrease in accretion on acquired loans and leases, offset by an increase in prepayment penalties and late charges. During the year ended December 31, 2015, the Company recorded $3.2 million in prepayment penalties and late charges, which contributed 6 basis points to yields on interest-earning assets, in the year ended December 31, 2015, compared to $2.2 million, or 4 basis points, for the year ended December 31, 2014.
The overall cost of funds (including non-interest-bearing demand checking accounts) increased 4 basis points to 0.75% for the year ended December 31, 2015 from 0.71% for the year ended December 31, 2014. The increase was primarily driven by the issuance of the $75.0 million subordinated notes in September 2014. Refer to "Financial Condition - Borrowed Funds" above for more details.
Future net interest income, net interest spread and net interest margin may continue to be negatively affected by a number of factors including: the low interest-rate environment, ongoing pricing pressures in both loan and deposit portfolios, the ability of the Company to increase its core deposit ratio, the ability of the Company to increase its non-interest-bearing deposits as a percentage of total deposits, decrease its loan-to-deposit ratio, or decrease its reliance on FHLBB advances. It may also be negatively affected by changes in the amount of purchase accounting accretion and amortization included in interest income and interest expense.
Interest Income—Loans and Leases
|
| | | | | | | | | | | | | | |
| | Year Ended December 31, | | Dollar Change | | Percent Change |
| | 2015 | | 2014 | | |
| | (Dollars in Thousands) |
| Interest income—loans and leases: | | | | | | | |
| Commercial real estate loans | $ | 106,447 |
| | $ | 102,852 |
| | $ | 3,595 |
| | 3.5 | % |
| Commercial loans | 25,756 |
| | 21,164 |
| | 4,592 |
| | 21.7 | % |
| Equipment financing | 44,468 |
| | 39,807 |
| | 4,661 |
| | 11.7 | % |
| Indirect automobile loans | 2,686 |
| | 11,812 |
| | (9,126 | ) | | (77.3 | )% |
| Residential mortgage loans | 21,455 |
| | 19,957 |
| | 1,498 |
| | 7.5 | % |
| Other consumer loans | 11,792 |
| | 11,189 |
| | 603 |
| | 5.4 | % |
| Total interest income—loans and leases | $ | 212,604 |
| | $ | 206,781 |
| | $ | 5,823 |
| | 2.8 | % |
Interest income from loans and leases was $212.6 million for 2015, and represented a yield on total loans of 4.44%. This compares to $206.8 million of interest on loans and a yield of 4.51% for 2014. This $5.8 million increase in interest income from loans and leases was attributable to an increase of $14.4 million of increased origination volume, which was offset by a decrease of $8.4 million due to the changes in interest rates. The $9.1 million decrease in interest income from the indirect automobile portfolio was the result of the sale of most of the portfolio in the first quarter of 2015 and Management's decision to cease origination indirect automobile loans in December 31, 2014.
Accretion on acquired loans and leases of $4.5 million contributed 9 basis points to the Company's net interest margin for the year ended December 31, 2015, compared to 8.4 million and 16 basis points for the year ended December 31, 2014. This decrease was due to a reforecast of certain acquired loans in the equipment financing portfolio, improved credit quality and expected cash flows on certain acquired commercial real estate loans and leases as well as higher amount of loan payoffs during 2014.
Interest Income—Investments
|
| | | | | | | | | | | | | | |
| | Year Ended December 31, | | Dollar Change | | Percent Change |
| | 2015 | | 2014 | | |
| | (Dollars in Thousands) |
| Interest income—investments: | | | | | | | |
| Debt securities | $ | 11,416 |
| | $ | 9,527 |
| | $ | 1,889 |
| | 19.8 | % |
| Marketable and restricted equity securities | 2,762 |
| | 2,072 |
| | 690 |
| | 33.3 | % |
| Short-term investments | 128 |
| | 102 |
| | 26 |
| | 25.5 | % |
| Total interest income—investments | $ | 14,306 |
| | $ | 11,701 |
| | $ | 2,605 |
| | 22.3 | % |
Total investment income was $14.3 million for the year ended December 31, 2015 compared to $11.7 million for the year ended December 31, 2014. As of December 31, 2015, the yield on total investments was 2.02% as compared to 1.84% as of December 31, 2014. This year over year increase in total investment income of $2.6 million, or 22.3%, was driven by a $1.3 million increase due to rates and a $1.4 million increase due to volume. In 2015, the yield on total investments was 2.02% as compared to 1.84% in 2014.
Interest Expense—Deposits and Borrowed Funds
|
| | | | | | | | | | | | | | |
| | Year Ended December 31, | | Dollar Change | | Percent Change |
| | 2015 | | 2014 | | |
| | (Dollars in Thousands) |
| Interest expense: | | | | | | | |
| Deposits: | | | | | | | |
| NOW accounts | $ | 179 |
| | $ | 171 |
| | $ | 8 |
| | 4.7 | % |
| Savings accounts | 1,094 |
| | 1,197 |
| | (103 | ) | | (8.6 | )% |
| Money market accounts | 6,935 |
| | 7,846 |
| | (911 | ) | | (11.6 | )% |
| Certificate of deposit | 9,272 |
| | 7,846 |
| | 1,426 |
| | 18.2 | % |
| Total interest expense—deposits | 17,480 |
| | 17,060 |
| | 420 |
| | 2.5 | % |
| Borrowed funds: | | | | | | | |
| Advances from the FHLBB | 9,950 |
| | 10,535 |
| | (585 | ) | | (5.6 | )% |
| Subordinated debentures and notes | 5,001 |
| | 1,740 |
| | 3,261 |
| | 187.4 | % |
| Other borrowed funds | 114 |
| | 79 |
| | 35 |
| | 44.3 | % |
| Total interest expense—borrowed funds | 15,065 |
| | 12,354 |
| | 2,711 |
| | 21.9 | % |
| Total interest expense | $ | 32,545 |
| | $ | 29,414 |
| | $ | 3,131 |
| | 10.6 | % |
Deposits
Except for certificate of deposits, ongoing declines in the interest rates paid on deposits contributed to reductions in the Company’s overall cost of deposits.
In 2015, interest paid on deposits increased $0.4 million, or 2.5%, as compared to 2014. Interest expense increased $1.0 million due to the growth in deposits, offset by a $0.5 million decrease in deposit-related interest expense driven by a decrease in interest rates. Purchase accounting accretion on acquired deposits was $0.2 million for the year ended December 31, 2015, compared to $0.2 million for the year ended December 31, 2014. Purchase accounting accretion did not impact the Company's net interest margin in either year.
Borrowed Funds
As of December 31, 2015 the Company's borrowed funds include: $0.9 billion in FHLBB advances, $82.9 million in subordinated debentures and notes, and $38.2 million in other borrowed funds. In 2015, the average balance of FHLBB advances decreased $95.3 million, or 10.2%, while the average balance of subordinated debentures and notes increased $52.1 million, or 169.3%. Other borrowed funds, which include repurchase agreements, increased $5.9 million, or 20.7% for the year ended December 31, 2015.
During the year ended December 31, 2015, interest paid on borrowed funds increased $2.7 million, or 21.9% year over year, primarily driven by liabilities on subordinated notes issued during the third quarter of 2014. The cost of borrowed funds was 1.55% for the year ended December 31, 2015 as compared to 1.22% for the year ended December 31, 2014. This change was driven by an increase of $0.8 million due to borrowing rates and an increase of $1.9 million in interest expense due to volume. For the years ended December 31, 2015 and 2014, the purchase accounting accretion on acquired borrowed funds was $2.8 million which contributed 5 basis points to the Company's net interest margin in both years.
Provision for Credit Losses
The provisions for credit losses are set forth below:
|
| | | | | | | | | | | | | | | | | | | | | | | |
| | Originated | | Acquired | | Total |
| | Year Ended December 31, | | Year Ended December 31, | | Year Ended December 31, |
| | 2015 | | 2014 | | 2015 | | 2014 | | 2015 | | 2014 |
| | (In Thousands) |
| Provision for loan and lease losses: | | | | | | | | | | | |
| Commercial real estate | $ | 1,459 |
| | $ | 5,009 |
| | $ | (352 | ) | | $ | 1,689 |
| | $ | 1,107 |
| | $ | 6,698 |
|
| Commercial | 9,077 |
| | 2,030 |
| | (49 | ) | | 413 |
| | 9,028 |
| | 2,443 |
|
| Indirect automobile | (1,716 | ) | | (864 | ) | | — |
| | — |
| | (1,716 | ) | | (864 | ) |
| Consumer | 953 |
| | 417 |
| | 469 |
| | 59 |
| | 1,422 |
| | 476 |
|
| Unallocated | (2,418 | ) | | (514 | ) | | — |
| | — |
| | (2,418 | ) | | (514 | ) |
| Total provision for loan and lease losses | 7,355 |
| | 6,078 |
| | 68 |
| | 2,161 |
| | 7,423 |
| | 8,239 |
|
| Unfunded credit commitments | 28 |
| | 238 |
| | — |
| | — |
| | 28 |
| | 238 |
|
| Total provision for credit losses | $ | 7,383 |
| | $ | 6,316 |
| | $ | 68 |
| | $ | 2,161 |
| | $ | 7,451 |
| | $ | 8,477 |
|
For the year ended December 31, 2015, the provision for credit losses decreased $1.0 million, or 12.1%, to $7.5 million from $8.5 million for the year ended December 31, 2014. The decrease in the provision for credit losses for the year ended December 31, 2015 was primarily driven by a decrease in the provision related to improved credit characteristics and the continued strong credit quality of the portfolio, as well as a decrease in the provision for the indirect automobile portfolio related to the sale of most of the indirect automobile portfolio in the first quarter of 2015, all of which were partially offset by an increase in the specific reserves for one commercial loan relationship and increases in the reserves for taxi medallion loans as well as net charge offs. See Management's discussion in "Allowances for Credit Losses-Allowance for Loan and Lease Losses" and Note 7, "Allowance for Loan and Lease Losses," to the consolidated financial statements for a description of how Management determined the allowance for loan and lease losses for each portfolio and class of loans.
The liability for unfunded credit commitments, which is included in other liabilities, was $1.3 million as of December 31, 2015 and December 31, 2014 respectively. For the year ended December 31, 2015, the provision for unfunded credit commitments decreased by $0.2 million related to changes in the estimate of loss exposure associated with certain unfunded credit commitments. No credit commitments were charged off against the Company's liability account for the years ended December 31, 2015 and 2014.
Non-Interest Income
The following table sets forth the components of non-interest income:
|
| | | | | | | | | | | | | | |
| | Year Ended December 31, | | Dollar Change | | Percent Change |
| | 2015 | | 2014 | | |
| | (Dollars in Thousands) |
| Deposit fees | $ | 8,730 |
| | $ | 8,692 |
| | $ | 38 |
| | 0.4 | % |
| Loan fees | 1,186 |
| | 1,010 |
| | 176 |
| | 17.4 | % |
| Loan level derivative income, net | 3,397 |
| | 946 |
| | 2,451 |
| | 259.1 | % |
| Gain on sales of loans and leases held-for-sale | 2,208 |
| | 1,651 |
| | 557 |
| | 33.7 | % |
| Gain on sales of investment securities, net | — |
| | 65 |
| | (65 | ) | | (100.0 | )% |
| Gain on sale/disposals of premises and equipment, net | — |
| | 1,502 |
| | (1,502 | ) | | (100.0 | )% |
| Other | 4,663 |
| | 6,314 |
| | (1,651 | ) | | (26.1 | )% |
| Total non-interest income | $ | 20,184 |
| | $ | 20,180 |
| | $ | 4 |
| | — | % |
Total non-interest income remained consistent at $20.2 million for the years ended December 31, 2015 and 2014.
Loan level derivative income, net increased $2.5 million for the year ended December 31, 2015 primarily driven by new loan level interest rate swap agreements completed in the year.
Gain on sale/disposals of premises and equipment decreased $1.5 million for the year ended December 31, 2015 primarily due to the sale of a building in 2014 which resulted in a gain of $1.6 million.
Other income decreased $1.7 million for the year ended December 31, 2015 primarily driven by a $1.4 million legal settlement the Company received from an insurance carrier in relation to litigation in 2014.
Non-Interest Expense
The following table sets forth the components of non-interest expense:
|
| | | | | | | | | | | | | | |
| | Year Ended December 31, | | Dollar Change | | Percent Change |
| | 2015 | | 2014 | | |
| | (Dollars in Thousands) |
| Compensation and employee benefits | $ | 71,272 |
| | $ | 71,801 |
| | $ | (529 | ) | | (0.7 | )% |
| Occupancy | 13,926 |
| | 14,294 |
| | (368 | ) | | (2.6 | )% |
| Equipment and data processing | 14,837 |
| | 17,020 |
| | (2,183 | ) | | (12.8 | )% |
| Professional services | 4,192 |
| | 5,357 |
| | (1,165 | ) | | (21.7 | )% |
| FDIC insurance | 3,510 |
| | 3,362 |
| | 148 |
| | 4.4 | % |
| Advertising and marketing | 3,352 |
| | 3,058 |
| | 294 |
| | 9.6 | % |
| Amortization of identified intangible assets | 2,911 |
| | 3,343 |
| | (432 | ) | | (12.9 | )% |
| Other | 11,377 |
| | 10,925 |
| | 452 |
| | 4.1 | % |
| Total non-interest expense | $ | 125,377 |
| | $ | 129,160 |
| | $ | (3,783 | ) | | (2.9 | )% |
For the year ended December 31, 2015, non-interest expense decreased $3.8 million, or 2.9%, to $125.4 million as compared to the same period in 2014. This decrease is primarily due to a $2.2 million decrease in equipment and data processing expense, a $1.2 million decrease in professional service expense, and a $0.5 million decrease in compensation and employee benefits expense.
The efficiency ratio decreased to 58.44% for the year ended December 31, 2015 from 61.73% for the year ended December 31, 2014. The efficiency ratio improved in 2015 due to a decrease in non-interest expense and an increase in net interest income as a result of continued efforts to drive revenue growth while controlling expenses.
Equipment and data processing expense for the year ended December 31, 2015 decreased $2.2 million compared to the same period in 2014. This decrease was primarily driven by the decrease of core processing system expenses resulting from the sale of the indirect automobile loan portfolio in the first quarter of 2015.
Expenses related to Professional Services for the year ended December 31, 2015 decreased $1.2 million compared to the same period in 2014. The decrease was largely due to lower audit, tax and legal fees incurred in 2015.
Compensation and employee benefits expense for the year ended December 31, 2015 decreased $0.5 million compared to the same period in 2014. The decrease was primarily driven by a decrease in the Company's liability related to a supplemental executive retirement plan and a decrease in employee headcount in 2015.
Provision for Income Taxes
|
| | | | | | | | | | | | | | |
| | Year Ended December 31, | | Dollar Change | | Percent Change |
| | 2015 | | 2014 | | |
| | (Dollars in Thousands) |
| Income before provision for income taxes | $ | 81,721 |
| | $ | 71,611 |
| | $ | 10,110 |
| | 14.1 | % |
| Provision for income taxes | 29,353 |
| | 26,286 |
| | 3,067 |
| | 11.7 | % |
| Net income, before non-controlling interest in subsidiary | $ | 52,368 |
| | $ | 45,325 |
| | $ | 7,043 |
| | 15.5 | % |
| Effective tax rate * | 35.9 | % | | 36.7 | % | | N/A |
| | (2.1 | )% |
(*) Previously reported amounts prior to January 1, 2015 have been restated to reflect a retrospective change in accounting principle for investments in qualified affordable housing projects, in accordance with ASU 2014-01.
The Company recorded income tax expense of $29.4 million for 2015, compared to $26.3 million for 2014. This represents a total effective tax rates of 35.9% and 36.7% for 2015 and 2014, respectively. The decrease in the Company's effective tax rate from 2014 was primarily driven by investments in municipal bonds and the formation of a new security corporation in Massachusetts.
Comparison of Years Ended December 31, 2014 and December 31, 2013
Net Interest Income
For the year ended December 31, 2014, net interest income increased $12.9 million to $189.1 million from $176.2 million for the year ended December 31, 2013. The year over year increase reflects a $9.7 million increase in interest income on loans and leases, a $1.6 million increase in interest income on debt securities, and lower interest expense on deposits and borrowings of $0.8 million which is reflective of the various portfolios repricing and replacing balances in the current low interest rate environment.
Net interest margin decreased by 3 basis points to 3.61% in 2014 from 3.64% in 2013. Competitive pressures on loan pricing resulted in a decrease in the Company's weighted average interest rate on loans (prior to purchase accounting adjustments) to 4.49% for the year ended December 31, 2014 from 4.66% for the year ended December 31, 2013. Interest amortization and accretion on acquired loans totaled $8.4 million and contributed 16 basis points to loan yields in 2014, compared to $4.7 million and 10 basis points in 2013, primarily due to changes in expected cash flows.
The decrease in asset yields in 2014 was mitigatedoffset by thea decrease in the total cost of interest-bearing liabilities of 7 basis points, the Company's total cost of interest-bearing liabilities was 0.71% in 2014 compared to 0.78% in 2013 from 0.95%2013. The decrease in 2012. The Company'sthe cost of interest-bearing liabilities was driven by a reduction in replacement rates on FHLB borrowings and the offeredinterest rates on a variety ofprovided for certain deposit products contributed significantly to the reduction in the cost of interest-bearing liabilities.products. The cost of interest-bearing deposits decreased 8 basis points to 0.54% in 2014 from 0.62% in 2013 from 0.72% in 2012 as customers continued to shift funds from certificates of deposits intoto non-maturity deposit products. InterestFor the year ended December 31, 2014, interest amortization and accretion on purchase accounting marks on borrowed funds and certificates of deposits totaled $5.0$3.1 million and contributed 85 basis points to the 20132014 net interest margin.margin compared to $3.8 million and 8 basis points in 2013.
Future net interest income, net interest spread and net interest margin may continue to be negatively affected by the low interest-rate environment, ongoing pricing pressures in both loan and deposit portfolios, and the ability of the Company to increase its core deposit ratio, increase its non-interest-bearing deposits as a percentage of total deposits, decrease its loan-to-deposit ratio, or decrease its reliance on FHLBB advances. It may also be negatively affected by changes in the amount of purchase accounting accretion and amortization included in interest income and interest expense.
Interest Income—Loans and Leases
| | | | Year Ended December 31, | | Dollar Change | | Percent Change | Year Ended December 31, | | Dollar Change | | Percent Change |
| | 2013 | | 2012 | | 2014 | | 2013 | |
| | (Dollars in Thousands) | (Dollars in Thousands) |
| Interest income—loans and leases: | | | | | | | | |
| Interest income—loans: | | | | | | | | |
| Commercial real estate loans | $ | 97,550 |
| | $ | 94,427 |
| | $ | 3,123 |
| | 3.3 | % | $ | 102,852 |
| | $ | 97,550 |
| | $ | 5,302 |
| | 5.4 | % |
| Commercial loans | 20,567 |
| | 19,318 |
| | 1,249 |
| | 6.5 | % | 21,164 |
| | 20,567 |
| | 597 |
| | 2.9 | % |
| Equipment financing | 31,076 |
| | 32,027 |
| | (951 | ) | | (3.0 | )% | 39,807 |
| | 31,076 |
| | 8,731 |
| | 28.1 | % |
| Indirect automobile loans | 17,355 |
| | 23,641 |
| | (6,286 | ) | | (26.6 | )% | 11,812 |
| | 17,355 |
| | (5,543 | ) | | (31.9 | )% |
| Residential mortgage loans | 19,926 |
| | 21,998 |
| | (2,072 | ) | | (9.4 | )% | 19,957 |
| | 19,926 |
| | 31 |
| | 0.2 | % |
| Other consumer loans | 10,624 |
| | 12,300 |
| | (1,676 | ) | | (13.6 | )% | 11,189 |
| | 10,624 |
| | 565 |
| | 5.3 | % |
| Total interest income—loans | $ | 197,098 |
| | $ | 203,711 |
| | $ | (6,613 | ) | | (3.2 | )% | $ | 206,781 |
| | $ | 197,098 |
| | $ | 9,683 |
| | 4.9 | % |
Interest
Except for equipment financing, declines in the yields on all portfolios reflect the high rate of loan refinancings in a low rate environment and the intense pricing competition which affected the Company’s lending markets.
For the year ended December 31, 2014, interest income from loans and leases was $197.1$206.8 million for 2013,, and represented a yield on total loans of 4.66%. This compares4.49% as compared to $203.7$197.1 million ofor 4.66% for 2013. The $9.7 million increase in interest onincome from loans and leases in 2014 was attributable to an increase of $20.0 million in origination volume which was offset by a yielddecrease of 5.08% for 2012. This$10.4 million due to the lower rate environment. The $5.5 million decrease in interest income in loans and leases was most notable infrom the indirect automobile portfolio where the interest income decreasedis related to $17.4 million in 2013 from $23.6 million in 2012, reflecting a run off of the indirect automobile loans and the shift to a higher yielding portfolio mix.
DeclinesAccretion on acquired loans and leases of $8.4 million contributed 16 basis points to net interest margin for the year ended December 31, 2014, compared to $4.7 million and 10 basis points for the year ended December 31, 2013. This increase was primarily due to a reforecast of certain acquired loans in the yieldsequipment financing portfolio, improved credit quality, and expected cash flows on allcertain acquired commercial real estate loans categories reflect the high rate of 2013 loan refinancings and the intense pricing competition which affected the Company's lending markets.
On an overall basis, the decline in interest income on loans was primarily driven by a decrease of $19.5 million due to the lower rate environment in 2013, offset by increases of $13.4 million in interest income on loans due to increases in average loans outstanding. Interest income increased as a result of the growth in the average balance of loans of $210.0 million or 5.2%, a result of growth in all of the lending portfolios except for the indirect automobile and other consumer loan portfolios.leases.
Interest Income—Investments
| | | | Year Ended December 31, | | Dollar Change | | Percent Change | Year Ended December 31, | | Dollar Change | | Percent Change |
| | 2013 | | 2012 | | 2014 | | 2013 | |
| | (Dollars in Thousands) | (Dollars in Thousands) |
| Interest income—investments: | | | | | | | | | | | | | | |
| Debt securities | | $ | 9,527 |
| | $ | 7,963 |
| | $ | 1,564 |
| | 19.6 | % |
| Marketable and restricted equity securities | | 2,072 |
| | 1,212 |
| | 860 |
| | 71.0 | % |
| Short-term investments | $ | 111 |
| | $ | 208 |
| | $ | (97 | ) | | (46.6 | )% | 102 |
| | 111 |
| | (9 | ) | | (8.1 | )% |
| Investment securities available-for-sale | 7,963 |
| | 8,551 |
| | (588 | ) | | (6.9 | )% | |
| Restricted equity securities | 1,212 |
| | 730 |
| | 482 |
| | 66.0 | % | |
| Total interest income—investments | $ | 9,286 |
| | $ | 9,489 |
| | $ | (203 | ) | | (2.1 | )% | $ | 11,701 |
| | $ | 9,286 |
| | $ | 2,415 |
| | 26.0 | % |
TotalIn 2014, the total investment income (consisting of interest on short-term investments, investment securities available-for-sale and restricted equity securities) was $11.7 million compared to $9.3 million for 2013 compared to $9.5 million for 2012. This decreasein 2013. The increase in total investment income of $0.2$2.4 million, or 2.1%26.0%, was attributabledriven by a $1.6 million increase due to replacement of maturing cashflow into the current low rate environment.rates and a $0.8 million increase due to volume. The yield on total investments was 1.57%1.88% for 20132014 as compared to 1.60%1.57% for 2012. The decrease in yield on investments from 2012 to 2013 reflects the paydown of higher-coupon MBSs and CMOs which were replaced by similar but lower-yielding investment securities.2013.
Interest Expense—Deposits and Borrowed Funds
| | | | Year Ended December 31, | | Dollar Change | | Percent Change | Year Ended December 31, | | Dollar Change | | Percent Change |
| | 2013 | | 2012 | | 2014 | | 2013 | |
| | (Dollars in Thousands) | (Dollars in Thousands) |
| Interest expense: | | | | | | | | | | | | | | |
| Deposits: | | | | | | | | | | | | | | |
| NOW accounts | $ | 173 |
| | $ | 209 |
| | $ | (36 | ) | | (17.2 | )% | $ | 171 |
| | $ | 173 |
| | $ | (2 | ) | | (1.2 | )% |
| Savings accounts | 1,288 |
| | 1,726 |
| | (438 | ) | | (25.4 | )% | 1,197 |
| | 1,288 |
| | (91 | ) | | (7.1 | )% |
| Money market accounts | 8,220 |
| | 8,773 |
| | (553 | ) | | (6.3 | )% | 7,846 |
| | 8,220 |
| | (374 | ) | | (4.5 | )% |
| Certificates of deposit | 9,092 |
| | 10,724 |
| | (1,632 | ) | | (15.2 | )% | 7,846 |
| | 9,092 |
| | (1,246 | ) | | (13.7 | )% |
| Total interest expense—deposits | 18,773 |
| | 21,432 |
| | (2,659 | ) | | (12.4 | )% | 17,060 |
| | 18,773 |
| | (1,713 | ) | | (9.1 | )% |
| Borrowed funds: | | | | | | | | | | | | | | |
| Advances from the FHLBB | 10,886 |
| | 13,710 |
| | (2,824 | ) | | (20.6 | )% | 10,535 |
| | 10,886 |
| | (351 | ) | | (3.2 | )% |
| Subordinated debentures and notes | | 1,740 |
| | 439 |
| | 1,301 |
| | 296.4 | % |
| Other borrowed funds | 507 |
| | 690 |
| | (183 | ) | | (26.5 | )% | 79 |
| | 68 |
| | 11 |
| | 16.2 | % |
| Total interest expense—borrowed funds | 11,393 |
| | 14,400 |
| | (3,007 | ) | | (20.9 | )% | 12,354 |
| | 11,393 |
| | 961 |
| | 8.4 | % |
| Total interest expense | $ | 30,166 |
| | $ | 35,832 |
| | $ | (5,666 | ) | | (15.8 | )% | $ | 29,414 |
| | $ | 30,166 |
| | $ | (752 | ) | | (2.5 | )% |
Deposits
Ongoing declines in the interest rates paid on deposits and continued declines in certificate of deposit balances as a
percentage of total deposits contributed to reductions in the Company’s overall cost of deposits.
Interest paid on deposits decreased by $2.7$1.7 million, or 12.4%9.1%, in 20132014 as compared to 2012. Interest2013. In 2014, interest expense increased $0.2$0.4 million due to the growth in deposits, which was offset by a $2.9$2.1 million decrease in deposit-related interest expense resulting from decreases in interest rates. ToAccretion on acquired deposits was $0.2 million for the year ended December 31, 2014. Accretion did not impact the Company's net interest margin during the same period. While interest-bearing deposit balances increased during this end,period, the growthincreases in interest expense on deposits due to volume were offset by decreases in interest expense due to deposit offering rates.
For the year ended December 31, 2014, interest-bearing deposit average balances of $89.6grew $120.4 million, or 3.0%3.9%, during 2013which was attributable to increases in money market accounts, (average balance up $167.1NOW accounts, and savings accounts of $156.7 million, or 13.9%), and NOW accounts (average balance up $15.011.4%; $14.4 million, or 8.2%)7.2% and $9.3 million, or 1.8%, respectively, offset by a decline in certificatescertificate of deposit (average balance down $84.5of $60.0 million, or 8.0%) and savings accounts (average balance down $8.0 million, or 1.6%)6.2%. The Company's reduction in rates offered on certificatescertificate of deposit accounts contributed significantly to the reduction in the cost of interest-bearing deposits to 0.54% in 2014 from 0.62% in 2013 from 0.72% in 2012.2013.
Borrowed Funds
InterestThe Company's funds as of December 31, 2014 included $1.0 billion in FHLBB advances, $9.2 million in subordinated debt acquired in the BankRI acquisition, $73.5 million in newly issued subordinated debt, and $39.6 million in repurchase agreements. The average balance of FHLBB advances increased $175.8 million, or 23.1%, in 2014, average balance of subordinated debentures and notes increased $21.2 million, or 222.2%, while other borrowed funds, which include repurchase agreements, decreased $10.3 million, or 26.4% in 2014.
For the year ended December 31, 2014, interest paid on borrowed funds decreased by $3.0increased $1.0 million, or 20.9%8.4%,compared to the year ended December 31, 2013. The increase was primarily due to the new subordinated notes issued during the third quarter of 2014. Debt-related interest expenses decreased $2.4 million as a result of decreases in the Company's borrowing rates from 1.41% in 2013 compared to 2012. Decreases1.24% in borrowing rates in 2013 resulted in a reduction in debt-related interest expenses of $3.4 million,2014, which was offset by an increase in interest expense due to increasesan increase of $3.4 million in 2013the debt levels of $0.4 million.
Included in the Company's borrowed funds at December 31, 2013 were $34.6 million2014 . The decrease in repurchase agreements and $9.2 million in subordinated debt acquired in the BankRI acquisition. The average balance of FHLBB advances increased $27.2 million, or 3.7% in 2013, while other borrowed funds, which include repurchase agreements and subordinated debt, decreased $12.1 million, or 20.1% in 2013. Overall, the cost of borrowed funds decreased 41 basis points in 2013 to 1.41%, compared to 1.82% in 2012was driven by maturing borrowings beingwhich were replaced at lower costs indue to the current low rate environment. Interest amortization and accretion on acquired borrowed funds totaled $2.8 million and contributed 5 basis points to the 2014 net interest margin as compared to $3.4 million and 7 basis points in 2013.
Provision for Credit Losses
The provisions for credit losses are set forth below:
| | | | Originated | | Acquired | | Total | Originated | | Acquired | | Total |
| | Year Ended December 31, | | Year Ended December 31, | | Year Ended December 31, | Year Ended December 31, | | Year Ended December 31, | | Year Ended December 31, |
| | 2013 | | 2012 | | 2013 | | 2012 | | 2013 | | 2012 | 2014 | | 2013 | | 2014 | | 2013 | | 2014 | | 2013 |
| | (In Thousands) | (In Thousands) |
| Provision for loan and lease losses: | | | | | | | | | | | | | | | | | | | | | | |
| Commercial real estate | $ | 2,563 |
| | $ | 4,348 |
| | $ | 516 |
| | $ | 75 |
| | $ | 3,079 |
| | $ | 4,423 |
| $ | 5,009 |
| | $ | 2,563 |
| | $ | 1,689 |
| | $ | 516 |
| | $ | 6,698 |
| | $ | 3,079 |
|
| Commercial | 4,917 |
| | 9,513 |
| | 1,068 |
| | 75 |
| | 5,985 |
| | 9,588 |
| 2,030 |
| | 4,917 |
| | 413 |
| | 1,068 |
| | 2,443 |
| | 5,985 |
|
| Indirect automobile | (167 | ) | | 884 |
| | — |
| | — |
| | (167 | ) | | 884 |
| (864 | ) | | (167 | ) | | — |
| | — |
| | (864 | ) | | (167 | ) |
| Consumer | 286 |
| | 1,534 |
| | 1,190 |
| | — |
| | 1,476 |
| | 1,534 |
| 417 |
| | 286 |
| | 59 |
| | 1,190 |
| | 476 |
| | 1,476 |
|
| Unallocated | 302 |
| | (418 | ) | | — |
| | — |
| | 302 |
| | (418 | ) | (514 | ) | | 302 |
| | — |
| | — |
| | (514 | ) | | 302 |
|
| Total provision for loan and lease losses | 7,901 |
| | 15,861 |
| | 2,774 |
| | 150 |
| | 10,675 |
| | 16,011 |
| 6,078 |
| | 7,901 |
| | 2,161 |
| | 2,774 |
| | 8,239 |
| | 10,675 |
|
| Unfunded credit commitments | 254 |
| | (123 | ) | | — |
| | — |
| | 254 |
| | (123 | ) | 238 |
| | 254 |
| | — |
|
| — |
| | 238 |
| | 254 |
|
| Total provision for credit losses | $ | 8,155 |
| | $ | 15,738 |
| | $ | 2,774 |
| | $ | 150 |
| | $ | 10,929 |
| | $ | 15,888 |
| $ | 6,316 |
| | $ | 8,155 |
| | $ | 2,161 |
| | $ | 2,774 |
| | $ | 8,477 |
| | $ | 10,929 |
|
The provision for credit losses in 2014 and 2013 was $8.5 million and 2012 was $10.9 million, and $15.9 million, respectively. Of the $5.0 million decrease in theThe provision forof loan and lease losses decreased approximately $2.5 million in 20132014 compared to 2012, $3.2 million was attributable to lower net charge offs of $3.4 million in 2013 compared to $6.6 million in 2012. Offsetting lower charge offs is an additional provision on acquired loans of $2.8 million in 2013primarily due to the continued favorable trends in the credit characteristics of the commercial construction, equipment financing and indirect automobile portfolios. The decrease was partially offset by additional reserves required for loan growth in the originated portfolios and credit deterioration in projected cash flows from the date of acquisition.acquired portfolios in 2014. See management'sManagement's discussion in "Allowances for Credit Losses—Allowance for Loan and Lease Losses" beginning on page 39 and Note 7, "Allowance for Loan and Lease Losses," to the consolidated financial statements for a description of how managementManagement determined the allowance for loan and lease losses for each portfolio and class of loans.
The liability for unfunded credit commitments, which is included in other liabilities, was $1.3 million as of December 31, 2014 and $1.0 million atas of December 31, 2013 and $0.7 million at December 31, 2012. During2013. For the year ended December 31, 2013,2014, the liability for unfunded credit commitments increased by $0.3 million to reflect changes in the estimate of loss exposure associated with certain unfunded credit commitments increasingwhich increased the provision for credit losses by the same amount in 2013.2014. No credit commitments were charged off against the Company's liability account infor the years ended December 31, 20132014 or 2012.2013.
Non-Interest Income
The following table sets forth the components of non-interest income:
|
| | | | | | | | | | | | | | |
| | Year Ended December 31, | | Dollar Change | | Percent Change |
| | 2013 | | 2012 | | |
| | (Dollars in Thousands) |
| Fees, charges and other income | $ | 15,240 |
| | $ | 16,475 |
| | $ | (1,235 | ) | | (7.5 | )% |
| Loss from investments in affordable housing | (1,812 | ) | | (694 | ) | | (1,118 | ) | | 161.1 | % |
| Gain on sales of loans and leases | — |
| | 1,898 |
| | (1,898 | ) | | (100.0 | )% |
| Net gain on sales of securities | 397 |
| | 926 |
| | (529 | ) | | (57.1 | )% |
| Total non-interest income | $ | 13,825 |
| | $ | 18,605 |
| | $ | (4,780 | ) | | (25.7 | )% |
|
| | | | | | | | | | | | | | |
| | Year Ended December 31, | | Dollar Change | | Percent Change |
| | 2014 | | 2013 | | |
| | (Dollars in Thousands) |
| Deposit fees | $ | 8,692 |
| | $ | 8,172 |
| | $ | 520 |
| | 6.4 | % |
| Loan fees | 1,010 |
| | 1,415 |
| | (405 | ) | | (28.6 | )% |
| Loan level derivative income, net | 946 |
| | — |
| | 946 |
| | 100.0 | % |
| Gain on sales of loans and leases held-for-sale | 1,651 |
| | 794 |
| | 857 |
| | 107.9 | % |
| Gain on sales of investment securities, net | 65 |
| | 397 |
| | (332 | ) | | (83.6 | )% |
| Gain on sale/disposals of premises and equipment, net | 1,502 |
| | — |
| | 1,502 |
| | 100.0 | % |
| Other | 6,314 |
| | 4,841 |
| | 1,473 |
| | 30.4 | % |
| Total non-interest income | $ | 20,180 |
| | $ | 15,619 |
| | $ | 4,561 |
| | 29.2 | % |
TotalFor the year ended December 31, 2014, non-interest income decreased by $4.8increased $4.6 million, or 25.7%29.2%, to $13.8$20.2 million for 2013 from $18.6 million for 2012. The decrease is mainly do to a decrease in gain on sales of loans and leases, a decrease in fees, charges and other income and an increase in losses from investments in affordable housing. Losses from investments in affordable housing increased to $1.8$15.6 million for the year ended December 31, 2013 from $0.7 million for the year ended December 31, 2012. These tax-induced losses were offset by an increase in related tax benefits of $0.3 million in 2013. Investment securities were sold during 2013 at a net gain of $0.4 million, compared to a net gain of $0.9 million on sales of investment securities in 2012.
The following table sets forth the Company's feeLoan level derivative income, in more detail for the periods indicated:
|
| | | | | | | | | | | | | | |
| | Year Ended December 31, | | Dollar Change | | Percent Change |
| | 2013 | | 2012 | | |
| | (Dollars in Thousands) |
| Deposit fees | $ | 7,471 |
| | $ | 7,595 |
| | $ | (124 | ) | | (1.6 | )% |
| Investment and insurance fees | 3,199 |
| | 3,385 |
| | (186 | ) | | (5.5 | )% |
| Loan and lease fees | 1,334 |
| | 2,090 |
| | (756 | ) | | (36.2 | )% |
| Other fees and other income | 3,236 |
| | 3,405 |
| | (169 | ) | | (5.0 | )% |
| Total fees, charges and other income | $ | 15,240 |
| | $ | 16,475 |
| | $ | (1,235 | ) | | (7.5 | )% |
Fees, charges and other income are the major sources of non-interest income for the Company and include deposit-related fees, indirect automobile and consumer loan fees, and other service fees. Total fees, charges and other income decreased by $1.2 million, or 7.5%, to $15.2 million for 2013 from $16.5 million for 2012. Deposit fees decreased to $7.5net increased $0.9 million for the year ended December 31, 2013 from $7.62014 primarily driven by the execution of new loan level interest rate swap agreements completed in the year.
Gain on sales of loans and leases held for sale increased $0.9 million for the year ended December 31, 2012. Loan2014 primarily driven by the participation sale of certain pools of equipment financing to manage concentration risk.
Gain on sale/disposals of premises and lease fees decreased to $1.3equipment increased $1.5 million for the year ended December 31, 2013 from $2.12014 primarily due to the sale of a building in 2014 which resulted in a gain of $1.6 million.
Other income increased $1.5 million to $6.3 million for the year ended December 31, 2012. Other fees and other income decreased2014 primarily due to $3.2a $1.4 million forlegal settlement the year ended December 31, 2013company received from $3.4 million for the year ended December 31, 2012.an insurance carrier in relation to litigation in 2014.
Non-Interest Expense
The following table sets forth the components of non-interest expense:
| | | | Year Ended December 31, | | Dollar Change | | Percent Change | Year Ended December 31, | | Dollar Change | | Percent Change |
| | 2013 | | 2012 | | 2014 | | 2013 | |
| | (Dollars in Thousands) | (Dollars in Thousands) |
| Compensation and employee benefits | $ | 65,261 |
| | $ | 58,830 |
| | $ | 6,431 |
| | 10.9 | % | $ | 71,801 |
| | $ | 65,261 |
| | $ | 6,540 |
| | 10.0 | % |
| Occupancy | 12,616 |
| | 10,611 |
| | 2,005 |
| | 18.9 | % | 14,294 |
| | 12,616 |
| | 1,678 |
| | 13.3 | % |
| Equipment and data processing | 16,899 |
| | 14,540 |
| | 2,359 |
| | 16.2 | % | 17,020 |
| | 16,899 |
| | 121 |
| | 0.7 | % |
| Professional services | 5,695 |
| | 12,475 |
| | (6,780 | ) | | (54.3 | )% | 5,357 |
| | 5,673 |
| | (316 | ) | | (5.6 | )% |
| FDIC insurance | 3,102 |
| | 4,212 |
| | (1,110 | ) | | (26.4 | )% | 3,362 |
| | 3,102 |
| | 260 |
| | 8.4 | % |
| Advertising and marketing | 3,003 |
| | 2,984 |
| | 19 |
| | 0.6 | % | 3,058 |
| | 3,003 |
| | 55 |
| | 1.8 | % |
| Amortization of identified intangible assets | 4,623 |
| | 5,622 |
| | (999 | ) | | (17.8 | )% | 3,343 |
| | 4,623 |
| | (1,280 | ) | | (27.7 | )% |
| Other | 11,261 |
| | 11,101 |
| | 160 |
| | 1.4 | % | 10,925 |
| | 11,265 |
| | (340 | ) | | (3.0 | )% |
| Total non-interest expense | $ | 122,460 |
| | $ | 120,375 |
| | $ | 2,085 |
| | 1.7 | % | $ | 129,160 |
| | $ | 122,442 |
| | $ | 6,718 |
| | 5.5 | % |
Non-interestFor the year ended December 31, 2014, non-interest expense increased 5.5% to $129.2 million, primarily due to increases in compensation and employee benefits expenses. The efficiency ratio decreased to 61.73% for the year ended December 31, 2014 from 63.83% for the year ended December 31, 2013. Improvements in the efficiency ratio in 2014 were driven by increases in net interest income and non-interest income which were primarily offset by increases in non-interest expense.
In 2014, compensation and employee benefits expense increased $6.5 million, or 10.0%. Several factors contributed to the increase. The Company recorded an additional $3.6 million in incentive plan expenses in 2014. Supplemental Employee Retirement Plan expenses increased $1.3 million due to a decrease in the discount rate. Additionally, the Company suspended the indirect automobile lending line of business during the fourth quarter of 2014 and recognized a $0.2 million severance charge. There were also increases in overall compensation and employee benefits expense for 2013additional staffing for the opening of the Wakefield, Rhode Island, branch of BankRI during the second quarter of 2014 and to support the growth in equipment financing.
Occupancy expense increased 1.7%$1.7 million, or 13.3%, compared to $122.5 million, largely2013. The increase was primarily due to additional staffing,expenses associated with the newly opened branch expansions and system conversion related expenses.
Compensation and employee benefits increased $6.4 million, or 10.9%, largely due to an expansion of the workforce. Professional service fees decreased $6.8 million, or 54.3%in Wakefield, Rhode Island, as well as the Company incurred less consulting related expenses. Equipmentrecognition of future lease obligation associated with the consolidation of an operations center, offices for indirect automobile operations and data processing costs increased $2.4 million, or 16.2%, due to BankRI completing its conversiontwo discontinued branch properties.
The increases in early 2013 and occupancy costs increased $2.0 million, or 18.9%, compared to 2012 related to increased real estate expenses. Additionally, FDIC insurance costs decreased $1.1 million, or 26.4%, andcost were offset by decreases in amortization of identified intangible assets decreased $1.0 million or 17.8%.
due to the accelerated method of amortization for certain intangible assets and that several intangible assets that were fully amortized as of December 31, 2013.
Provision for income taxes |
| | | | | | | | | | | | | | |
| | Year Ended December 31, | | Dollar Change | | Percent Change |
| | 2014 | | 2013 | | |
| | (Dollars in Thousands) |
| Income before provision for income taxes | $ | 71,611 |
| | $ | 58,466 |
| | $ | 13,145 |
| | 22.5 | % |
| Provision for income taxes | 26,286 |
| | 20,664 |
| | 5,622 |
| | 27.2 | % |
| Net income | $ | 45,325 |
| | $ | 37,802 |
| | $ | 7,523 |
| | 19.9 | % |
| Effective tax rate | 36.7 | % | | 35.3 | % | | N/A |
| | 3.9 | % |
|
| | | | | | | | | | | | | | |
| | Year Ended December 31, | | Dollar Change | | Percent Change |
| | 2013 | | 2012 | | |
| | (Dollars in Thousands) |
| Income before provision for income taxes | $ | 56,654 |
| | $ | 59,710 |
| | $ | (3,056 | ) | | (5.1 | )% |
| Provision for income taxes | 19,481 |
| | 21,341 |
| | (1,860 | ) | | (8.7 | )% |
| Net income | $ | 37,173 |
| | $ | 38,369 |
| | $ | (1,196 | ) | | (3.1 | )% |
| Effective tax rate | 34.4 | % | | 35.7 | % | | N/A |
| | (3.8 | )% |
The Company recorded income tax expense of $19.5$26.3 million for 2014, compared to $20.7 million for 2013 compared to $21.3 million for 2012. This representedwhich represents a total effective tax rates of 34.4%36.7% and 35.7%35.3%, respectively. The decreaseincrease in the effective tax rate was primarily attributable to non deductible professional fees of $1.4 million related to the BankRI acquisition in 2012 and a reduction in state income tax expense. Additional state income tax expense were recognized in 2012 as the projected state tax savings from the acquisition of BankRI reduced the value of the deferred tax asset by $0.5 million. These reductions were partially offset by a $1.1 million reduction in the tax savings from the rehabilitation tax credits received for the refurbishment of the corporate headquarters at 131 Clarendon Street in Boston, Massachusetts as renovations were completed early in 2013.
Comparison of Years Ended December 31, 2012 and December 31, 2011
General
|
| | | | | | | | | | | | | | |
| | Year Ended December 31, | | Dollar Change | | Percent Change |
| | 2012 | | 2011 | | |
| | (Dollars in Thousands) |
| Interest and dividend income | $ | 213,200 |
| | $ | 140,535 |
| | $ | 72,665 |
| | 51.7 | % |
| Interest expense | 35,832 |
| | 30,336 |
| | 5,496 |
| | 18.1 | % |
| Net interest income | 177,368 |
| | 110,199 |
| | 67,169 |
| | 61.0 | % |
| Provision for credit losses | 15,888 |
| | 3,631 |
| | 12,257 |
| | 337.6 | % |
| Net interest income after provision for credit losses | 161,480 |
| | 106,568 |
| | 54,912 |
| | 51.5 | % |
| Non-interest income | 18,605 |
| | 5,062 |
| | 13,543 |
| | 267.5 | % |
| Non-interest expense | 120,375 |
| | 62,925 |
| | 57,450 |
| | 91.3 | % |
| Provision for income taxes | 21,341 |
| | 19,886 |
| | 1,455 |
| | 7.3 | % |
| Net income | 38,369 |
| | 28,819 |
| | 9,550 |
| | 33.1 | % |
| Less net income attributable to noncontrolling interest in subsidiary | 1,227 |
| | 1,219 |
| | 8 |
| | 0.7 | % |
| Net income attributable to Brookline Bancorp, Inc. | $ | 37,142 |
| | $ | 27,600 |
| | $ | 9,542 |
| | 34.6 | % |
The acquisition of BankRI on January 1, 2012, coupled with 11.8% and 10.2% organic growth in loans and deposits, respectively, drove the increase in the Company's 2012 income over 2011. Overall asset quality remained strong in 2012. The net interest margin for 2012 increased 9 basis points as compared to 2011 and benefited from the impact of purchase accounting accretion and amortization. Increases in other income were offset, to a degree, by increase in expenses associated with the Company's acquisition of BankRI and the Company's ongoing infrastructure build.
Net Interest Income
For 2012, net interest income was $177.4 million, compared to $110.2 million for 2011. The increase in interest income reflects an increase of $1.7 billion in interest-earning assets during 2012 primarily due to the acquisition of BankRI. The net interest margin for 2012 was 3.85% compared to a net interest margin of 3.76%tax credit received in 2013 for the prior year. Net interest marginrehabilitation of the Company's headquarters.
increasedLiquidity and Capital Resources
Liquidity
Liquidity is defined as the costability to meet current and future financial obligations of funds on interest-bearing liabilities declining by 30 basis points offset by a decreaseshort-term nature. The Company further defines liquidity as the ability to respond to the needs of 9 basis points on interest earning assets. Purchase accounting reflected $6.7 million increase in interest incomedepositors and contributed 17 basis points to 2012 loan yields and a $5.0 million reduction in interest expense and contributed 11 basis points to 2012 net interest margin.
Compared to 2011, net interest income increased $67.2 million million in 2012. The increase reflects an increase of $$69.8 million in interest income on loans and leases, due largely to a $1.1 billion increase in acquired loan and lease balances in connection with the acquisition of BankRI on January 1, 2012borrowers, as well as organic growthto earnings enhancement opportunities, in total loansa changing marketplace. Liquidity management is monitored by an Asset/Liability Committee ("ALCO"), consisting of members of Management, which is responsible for establishing and leasesmonitoring liquidity targets as well as strategies and tactics to meet these targets.
The primary source of $322.3 million, or 11.8%,funds for the year endedpayment of dividends and expenses by the Company is dividends paid to it by the Banks and Brookline Securities Corp. The primary sources of liquidity for the Banks consist of deposit inflows, loan repayments, borrowed funds and maturing investment securities.
Deposits, which are considered the most stable source of liquidity, totaled $4.3 billion as of December 31, 2012. In particular, growth in the commercial loan2015 and lease, commercial real estate and equipment financing portfolios fueled the increase in loan and lease interest income, along with a shift from lower interest earning portfolios, such as indirect automobile loans into higher interest earning portfolios such as equipment financing.
Net interest margin increased by 9 basis points, from 3.76% in 2011 to 3.85% in 2012. Competitive pressures on loan pricing resulted in decreases in the Company’s weighted average interest rate on loans (prior to purchase accounting adjustments) from 5.26% at December 31, 2011 to 5.08% at December 31, 2012. Interest amortization and accretion on acquired loans totaled $6.7 million and contributed 17 basis points to 2012 loan yields, offsetting the decrease in pre-acquisition loan yields from December 31, 2011 to December 31, 2012.
The remaining increase in net interest margin from 2011 to 2012 is related to a decrease in the overall costrepresented 81.4% of deposits and borrowing. The addition of $1.1 billion in deposits from BankRI on January 1, 2012 and the Company’s reduction in rates offered on certificates of deposit contributed significantly to the reduction in the cost of interest-bearing deposits, from 1.02% in 2011 to 0.72% in 2012. Fair-market valuation adjustments and the continued maturing of higher-rate FHLBB advances contributed to the decline in the cost of borrowing. The total cost of interest-bearing liabilities decreased from 1.29% in 2011 to 0.95% in 2012.
Future net interest income, net interest spread and net interest margin may continue to be negatively affected by the low interest-rate environment; ongoing pricing pressures in both loan and deposit portfolios; and the ability of the Company to increase its core deposit ratio, increase its non-interest-bearing deposits as a percentagefunding (the sum of total deposits decrease its loan-to-deposit ratio,and total borrowings), compared to deposits of $4.0 billion, or decrease its reliance on FHLBB advances. It may also be negatively affected by changes in the amount77.8% of purchase accounting accretiontotal funding, as of December 31, 2014. Core deposits, which consist of demand checking, NOW, savings and amortization included in interest income and interest expense.
Interest Income—Loans and Leases
|
| | | | | | | | | | | | | | |
| | Year Ended December 31, | | Dollar Change | | Percent Change |
| | 2012 | | 2011 | | |
| | (Dollars in Thousands) |
| Interest income—loans: | | | | | | | |
| Commercial real estate loans | $ | 94,427 |
| | $ | 60,986 |
| | $ | 33,441 |
| | 54.8 | % |
| Commercial loans | 19,318 |
| | 8,697 |
| | 10,621 |
| | 122.1 | % |
| Equipment financing | 32,027 |
| | 18,019 |
| | 14,008 |
| | 77.7 | % |
| Indirect automobile loans | 23,641 |
| | 28,313 |
| | (4,672 | ) | | (16.5 | )% |
| Residential mortgage loans | 21,998 |
| | 14,901 |
| | 7,097 |
| | 47.6 | % |
| Other consumer loans | 12,300 |
| | 3,022 |
| | 9,278 |
| | 307.0 | % |
| Total interest income—loans | $ | 203,711 |
| | $ | 133,938 |
| | $ | 69,773 |
| | 52.1 | % |
Interest income from loans was $203.7 million for 2012,money market accounts, totaled $3.2 billion as of December 31, 2015 and represented 74.7% of total deposits, compared to core deposits of $3.0 billion, or 76.1% of total deposits, as of December 31, 2014. Additionally, the Company had $252.3 million of brokered deposits as of December 31, 2015, which represented 5.9% of total deposits, compared to $62.0 million or 1.6% of total deposits, as of December 31, 2014. The Company offers attractive interest rates based on market conditions to increase deposits balances, while managing cost of funds.
Borrowings are used to diversify the Company's funding mix and to support asset growth. When profitable lending and investment opportunities exist, access to borrowings provides a yieldmeans to grow the balance sheet. Borrowings totaled $1.0 billion as of December 31, 2015, representing 18.6% of total funding, compared to $1.1 billion, or 22.2% of total funding, as of December 31, 2014. The decrease was due to decreased FHLBB borrowings of $142.2 million using the excess liquidity generated by the sale of the indirect automobile portfolio.
As members of the FHLBB, the Banks have access to both short- and long-term borrowings. As of December 31, 2015, the Company's total borrowing limit from the FHLBB for advances and repurchase agreements was $1.3 billion as compared to $1.5 billion as of December 31, 2014, based on the level of qualifying collateral available for these borrowings.
As of December 31, 2015, the Banks also have access to funding through certain uncommitted lines of credit of $119.0 million. The Company had a $12.0 million committed line of credit for contingent liquidity as of December 31, 2015.
The Company has access to the Federal Reserve Bank "discount window" to supplement its liquidity. The Company has $81.0 million of borrowing capacity at the Federal Reserve Bank as of December 31, 2015. As of December 31, 2015, the Company did not have any borrowings with the Federal Reserve Bank outstanding.
Additionally, the Banks have access to liquidity through repurchase agreements and brokered deposits.
In general, the Company seeks to maintain a high degree of liquidity and targets cash, cash equivalents and investment securities available-for-sale balances of between 10% and 30% of total loansassets. As of 5.08%.December 31, 2015, cash, cash equivalents and investment securities available-for-sale totaled $588.7 million, or 9.7% of total assets. This compares to $133.9$613.5 million, or 10.6% of interest on loanstotal assets as of December 31, 2014.
While Management believes that the Company has adequate liquidity to meet its commitments, and a yieldto fund the Banks' lending and investment activities, the availabilities of 5.26% for 2011. This increase in interest income in loansthese funding sources are subject to broad economic conditions and leases was most notable in commercial loans, the yield for which increased from 4.81% to 5.26% in 2012, and increase that reflects the fact that commercial loans represented 24.9% of BankRI's total loans and leases at acquisition.
Declinescould be restricted in the yields on commercial real estate loans, indirect automobile loansfuture. Such restrictions would impact the Company's immediate liquidity and/or additional liquidity needs.
Capital Resources
As of December 31, 2015 and to a lesser extent, residential mortgage loans reflect2014, the high rate of 2012 loan refinancingCompany and the intense pricing competition which characterizedBanks were under the Company's lending markets.
On an overall basis, 2012 declines in interest income on loansprimary regulation of $7.0 million dueand required to comply with the lower rate environment were offset by increases of $76.8 million in interest income on loans due to increases in average loan outstanding. Interest income increased as a resultcapital requirements of the growthFRB. At those dates, the Company, Brookline Bank, BankRI and First Ipswich exceeded all regulatory capital requirements and the banks were considered "well-capitalized." See details in the average balance of loans of $1.5 million, or 57.5%, which is related to both the"Supervision and Regulation" in Item 1.
acquisition of Bank Rhode Island on January 1st, 2012The Company's and the Banks' actual and required capital amounts and ratios were as well as organic growth in all of the lending portfolios except for the indirect automobile loan portfolio.
Interest Income—Investmentsfollows:
|
| | | | | | | | | | | | | | |
| | Year Ended December 31, | | Dollar Change | | Percent Change |
| | 2012 | | 2011 | | |
| | (Dollars in Thousands) |
| Interest income—investments: | | | | | | | |
| Short-term investments | $ | 208 |
| | $ | 105 |
| | $ | 103 |
| | 98.1 | % |
| Investment securities available-for-sale | 8,551 |
| | 6,297 |
| | 2,254 |
| | 35.8 | % |
| Restricted equity securities | 730 |
| | 195 |
| | 535 |
| | 274.4 | % |
| Total interest income—investments | $ | 9,489 |
| | $ | 6,597 |
| | $ | 2,892 |
| | 43.8 | % |
|
| | | | | | | | | | | | | | | | | | | | | |
| | | Actual | | Minimum Required for Capital Adequacy Purposes | | Minimum Required To Be Considered "Well- Capitalized" Under Prompt Corrective Action Rules |
| | | Amount | | Ratio | | Amount | | Ratio | | Amount | | Ratio |
| | | (Dollars in Thousands) |
| At December 31, 2015: | | | | | | | | | | | | |
| Brookline Bancorp, Inc. | | | | | | | | | | | | |
| Common equity Tier 1 capital ratio | (1) | $ | 530,505 |
| | 10.62 | % | | $ | 225,214 |
| | 4.50 | % | | N/A |
| | N/A |
|
| Tier 1 leverage capital ratio | (2) | 545,035 |
| | 9.37 | % | | 231,930 |
| | 4.00 | % | | N/A |
| | N/A |
|
| Tier 1 risk-based capital ratio | (3) | 545,035 |
| | 10.91 | % | | 300,019 |
| | 6.00 | % | | N/A |
| | N/A |
|
| Total risk-based capital ratio | (4) | 676,709 |
| | 13.54 | % | | 401,013 |
| | 8.00 | % | | N/A |
| | N/A |
|
| Brookline Bank | | | | | | | | | | | | |
| Common equity Tier 1 capital ratio | (1) | $ | 374,002 |
| | 11.89 | % | | $ | 141,548 |
| | 4.50 | % | | $ | 204,459 |
| | 6.50 | % |
| Tier 1 leverage capital ratio | (2) | 380,003 |
| | 10.78 | % | | 141,003 |
| | 4.00 | % | | 176,254 |
| | 5.00 | % |
| Tier 1 risk-based capital ratio | (3) | 380,003 |
| | 12.08 | % | | 188,743 |
| | 6.00 | % | | 251,658 |
| | 8.00 | % |
| Total risk-based capital ratio | (4) | 417,270 |
| | 13.27 | % | | 251,557 |
| | 8.00 | % | | 314,446 |
| | 10.00 | % |
| BankRI | | | | | | | | | | | | |
| Common equity Tier 1 capital ratio | (1) | $ | 171,967 |
| | 10.63 | % | | $ | 72,799 |
| | 4.50 | % | | $ | 105,154 |
| | 6.50 | % |
| Tier 1 leverage capital ratio | (2) | 171,967 |
| | 8.51 | % | | 80,831 |
| | 4.00 | % | | 101,038 |
| | 5.00 | % |
| Tier 1 risk-based capital ratio | (3) | 171,967 |
| | 10.63 | % | | 97,065 |
| | 6.00 | % | | 129,420 |
| | 8.00 | % |
| Total risk-based capital ratio | (4) | 189,953 |
| | 11.74 | % | | 129,440 |
| | 8.00 | % | | 161,800 |
| | 10.00 | % |
| First Ipswich | | | | | | | | | | | | |
| Common equity Tier 1 capital ratio | (1) | $ | 32,831 |
| | 13.87 | % | | $ | 10,652 |
| | 4.50 | % | | $ | 15,386 |
| | 6.50 | % |
| Tier 1 leverage capital ratio | (2) | 32,831 |
| | 9.26 | % | | 14,182 |
| | 4.00 | % | | 17,727 |
| | 5.00 | % |
| Tier 1 risk-based capital ratio | (3) | 32,831 |
| | 13.87 | % | | 14,202 |
| | 6.00 | % | | 18,936 |
| | 8.00 | % |
| Total risk-based capital ratio | (4) | 35,617 |
| | 15.05 | % | | 18,933 |
| | 8.00 | % | | 23,666 |
| | 10.00 | % |
| At December 31, 2014: | | | | | | | | | | | | |
| Brookline Bancorp, Inc. | | | | | | | | | | | | |
| Tier 1 leverage capital ratio | (1) | $ | 504,964 |
| | 9.01 | % | | $ | 224,179 |
| | 4.00 | % | | N/A |
| | N/A |
|
| Tier 1 risk-based capital ratio | (2) | 504,964 |
| | 10.55 | % | | 191,456 |
| | 4.00 | % | | N/A |
| | N/A |
|
| Total risk-based capital ratio | (3) | 633,421 |
| | 13.24 | % | | 382,732 |
| | 8.00 | % | | N/A |
| | N/A |
|
| Brookline Bank | | | | | | | | | | | | |
| Tier 1 leverage capital ratio | (1) | $ | 336,513 |
| | 9.60 | % | | $ | 140,214 |
| | 4.00 | % | | $ | 175,267 |
| | 5.00 | % |
| Tier 1 risk-based capital ratio | (2) | 336,513 |
| | 10.72 | % | | 125,565 |
| | 4.00 | % | | 188,347 |
| | 6.00 | % |
| Total risk-based capital ratio | (3) | 373,312 |
| | 11.90 | % | | 250,966 |
| | 8.00 | % | | 313,708 |
| | 10.00 | % |
| BankRI | | | | | | | | | | | | |
| Tier 1 leverage capital ratio | (1) | $ | 150,403 |
| | 8.43 | % | | $ | 71,366 |
| | 4.00 | % | | $ | 89,207 |
| | 5.00 | % |
| Tier 1 risk-based capital ratio | (2) | 150,403 |
| | 10.70 | % | | 56,225 |
| | 4.00 | % | | 84,338 |
| | 6.00 | % |
| Total risk-based capital ratio | (3) | 166,135 |
| | 11.82 | % | | 112,443 |
| | 8.00 | % | | 140,554 |
| | 10.00 | % |
| First Ipswich | | | | | | | | | | | | |
| Tier 1 leverage capital ratio | (1) | $ | 29,962 |
| | 9.27 | % | | $ | 12,929 |
| | 4.00 | % | | $ | 16,161 |
| | 5.00 | % |
| Tier 1 risk-based capital ratio | (2) | 29,962 |
| | 12.40 | % | | 9,665 |
| | 4.00 | % | | 14,498 |
| | 6.00 | % |
| Total risk-based capital ratio | (3) | 32,375 |
| | 13.40 | % | | 19,328 |
| | 8.00 | % | | 24,160 |
| | 10.00 | % |
Total investment income (consisting of interest on short-term investments, investment securities available-for-sale and restricted equity securities) was $9.5 million for 2012 compared to $6.6 million for 2011. This increase in total investment income of $2.9 million, or 43.8%, was attributable to a increase in the average balance of investments of $211.7 million. The average balance of investments in 2012 was $603.2 million, of which $289.3 million million represented investments from BankRI. The yield on total investments was 1.60% for 2012 as compared to 1.70% for 2011. The decrease in yield on investments from 2011 to 2012 reflects the rapid paydown of higher coupon MBSs and CMOs, which were replaced by lower yielding securities.
Interest Expense—Deposits and Borrowed Funds
|
| | | | | | | | | | | | | | |
| | Year Ended December 31, | | Dollar Change | | Percent Change |
| | 2012 | | 2011 | | |
| | (Dollars in Thousands) |
| Interest expense: | | | | | | | |
| Deposits: | | | | | | | |
| NOW accounts | $ | 209 |
| | $ | 216 |
| | $ | (7 | ) | | (3.2 | )% |
| Savings accounts | 1,726 |
| | 942 |
| | 784 |
| | 83.2 | % |
| Money market accounts | 8,773 |
| | 7,626 |
| | 1,147 |
| | 15.0 | % |
| Certificates of deposit | 10,724 |
| | 10,973 |
| | (249 | ) | | (2.3 | )% |
| Total interest expense—deposits | 21,432 |
| | 19,757 |
| | 1,675 |
| | 8.5 | % |
| Borrowed funds: | | | | | | | |
| Advances from the FHLBB | 13,710 |
| | 10,454 |
| | 3,256 |
| | 31.1 | % |
| Other borrowed funds | 690 |
| | 125 |
| | 565 |
| | 452.0 | % |
| Total interest expense—borrowed funds | 14,400 |
| | 10,579 |
| | 3,821 |
| | 36.1 | % |
| Total interest expense | $ | 35,832 |
| | $ | 30,336 |
| | $ | 5,496 |
| | 18.1 | % |
Deposits
The addition of $1.1 billion of deposits from Bank Rhode Island on January 1st, 2012 and the Company's reduction in rates offered on certificates of deposits contributed significantly to the Company's decline in the cost of interest-bearing deposits from 1.02% in 2011 to 0.72% in 2012.
Included in the 2012 cost of interest-bearing deposits was $1.2 million, or 4 basis point, of purchase accounting amortization. Increases in total deposits increased interest expense by $7.2 million, which was offset by the $5.5 million decrease in deposit-related interest expense resulting from the decrease in interest rates. To this end, the growth in interest-bearing deposit average balances of $1.0 billion, or 53.4%, during 2012 was attributable to money market accounts (average balance up $372.3 million, or 44.8%), savings accounts (average balance up $359.9 million, or 228.4%) certificates of deposit (average balance up $242.0 million, or 29.8%) and NOW accounts (average balance up $56.1 million, or 44.2%).
Borrowed Funds
Interest paid on borrowed funds increased by $3.8 million, or 36.1% in 2012 as compared to 2011. Decreases in borrowing rates in 2012 resulted in a reduction in debt-related interest expense of $3.3 million, which was offset by an increase in interest expense due to increases in 2012 debt levels of $7.1 million.
Included in the Company's borrowed funds at December 31, 2012 were $39.3 million in repurchase agreements and $12.1 million in subordinated debt acquired in the BankRI acquisition. The average balance of FHLBB advances increased $318.0 million, or 76.7% in 2012, while other borrowed funds, which include repurcahse agreenment and subordinated debt, increased $52.8 million, or 686.1% in 2012. Overall, the cost of non-deposit borrowings decreased 69 basis points in 2012 to 1.82%, compared to 2.51% in 2011.
Provision for Credit Losses
|
| | | | | | | | | | | | | | |
| | Year Ended December 31, | | Dollar Change | | Percent Change |
| | 2012 | | 2011 | | |
| | (Dollars in Thousands) |
| Provision for loan and lease losses: | | | | | | | |
| Commercial real estate | $ | 4,423 |
| | $ | 3,109 |
| | $ | 1,314 |
| | 42.3 | % |
| Commercial | 9,588 |
| | 1,147 |
| | 8,441 |
| | 735.9 | % |
| Indirect automobile | 884 |
| | 123 |
| | 761 |
| | 618.7 | % |
| Consumer | 1,534 |
| | (57 | ) | | 1,591 |
| | (2,791.2 | )% |
| Unallocated | (418 | ) | | (366 | ) | | (52 | ) | | 14.2 | % |
| Total provision for loan and lease losses | $ | 16,011 |
| | $ | 3,956 |
| | 12,055 |
| | 304.7 | % |
| Unfunded credit commitments | (123 | ) | | (325 | ) | | 202 |
| | * |
|
| Total provision for credit losses | $ | 15,888 |
| | $ | 3,631 |
| | $ | 12,257 |
| | 337.6 | % |
| |
*(1) | Not meaningful.Common equity tier 1 capital ratio is calculated by dividing common equity Tier 1 capital by risk-weighted assets. The ratio was established as part of the implementation of Basel III, effective January 1, 2015. |
| |
| (2) | Tier 1 leverage capital ratio is calculated by dividing Tier 1 capital by average assets. |
| |
| (3) | Tier 1 risk-based capital ratio is calculated by dividing Tier 1 capital by risk-weighted assets. |
| |
| (4) | Total risk-based capital ratio is calculated by dividing total capital by risk-weighted assets. |
Off-Balance-Sheet Arrangements
The provision for credit losses in 2012 and 2011 were $15.9 million and $3.6 million, respectively. Of the $12.1 million increaseCompany is party to off-balance sheet financial instruments in the provision fornormal course of business to meet the financing needs of its customers and to reduce its own exposure to fluctuations in interest rates. These financial instruments include loan commitments, standby and lease losses on originated loans in 2012 compared with 2011, $7.7 million was attributablecommercial letters of credit and interest rate swaps. According to originated loan and lease growth of 22.5% and $4.2 million was attributable to a provisionGAAP, these financial instruments are not recorded in the second quarterfinancial statements until they are funded or related fees are incurred or received. The effect of 2012such activity on two commercial loans originated shortly after the acquisitionCompany's financial condition and results of BankRI. Additional provision of $0.2 million on acquired loans in 2012 was due to deterioration in projected cash flows on acquired loans from the date of acquisitionoperations, such as recorded liability for BankRIunfunded credit commitment, is immaterial. See Note 13, "Commitments and from December 31, 2011 for First Ipswich. See management’s discussion in ‘‘Allowances for Credit Losses-Allowance for Loan and Lease Losses’’ beginning on page 39 and Note 7, ‘‘Allowance for Loan and Lease Losses,’’Contingencies," to the consolidated financial statements for a description of how management determined the allowance for loan and lease losses for each portfolio and classoff-balance-sheet financial instruments.
Contractual Obligations
A summary of loans.
The liability for unfunded credit commitments, which is included in other liabilities, was $0.7 million at December 31, 2012 and $0.8 million at December 31, 2011. During the year ended December 31, 2012, the liability for unfunded credit commitments decreased by $0.1 million to reflect changes in the estimate of loss exposure associated with credit commitments. This decrease reduced the provision for credit lossescontractual obligations by the same amount in 2012. No credit commitments were charged off againstexpected payment period for the liability account in the twelve-month periods ended December 31, 2012 or 2011, respectively.date indicated follows.
Non-Interest Income
Total non-interest income increased by $13.5 million, or 267.5%, from $5.1 million in 2011 to $18.6 million in 2012, largely as a result of the acquisition of BankRI and the related increase in mortgage and deposit related fees, charges and other income.
|
| | | | | | | | | | | | | | |
| | Year Ended December 31, | | Dollar Change | | Percent Change |
| | 2012 | | 2011 | | |
| | (Dollars in Thousands) |
| Fees, charges and other income | $ | 16,475 |
| | $ | 5,653 |
| | $ | 10,822 |
| | 191.4 | % |
| Loss from investments in affordable housing | (694 | ) | | (671 | ) | | (23 | ) | | 3.4 | % |
| Gain on sales of loans and leases | 1,898 |
| | — |
| | 1,898 |
| | * |
|
| Net gain on sales of securities | 926 |
| | 80 |
| | 846 |
| | 1,057.5 | % |
| Total non-interest income | $ | 18,605 |
| | $ | 5,062 |
| | $ | 13,543 |
| | 267.5 | % |
|
| | | | | | | | | | | | | | | | | | | |
| | Payment Due by Period |
| | Less Than One Year | | One to Three Years | | More than Three Years to Five Years | | Over Five Years | | Total |
| | (In Thousands) |
| At December 31, 2015: | | | | | | | | | |
| Advances from the FHLBB | $ | 575,749 |
| | $ | 264,898 |
| | $ | 5,433 |
| | $ | 15,786 |
| | $ | 861,866 |
|
| Subordinated debentures and notes | — |
| | — |
| | — |
| | 82,936 |
| | 82,936 |
|
| Other borrowed funds | 38,227 |
| | — |
| | — |
| | — |
| | 38,227 |
|
| Loan commitments(1) | 1,089,038 |
| | — |
| | — |
| | — |
| | 1,089,038 |
|
| Occupancy lease commitments(2) | 4,933 |
| | 8,543 |
| | 5,884 |
| | 13,521 |
| | 32,881 |
|
| Service provider contracts(3) | 7,516 |
| | 22,904 |
| | 2,212 |
| | 1,069 |
| | 33,701 |
|
| Postretirement benefit obligations(4) | 451 |
| | 1,329 |
| | 959 |
| | 18,157 |
| | 20,896 |
|
| | $ | 1,715,914 |
| | $ | 297,674 |
| | $ | 14,488 |
| | $ | 131,469 |
| | $ | 2,159,545 |
|
| |
*(1) | Not meaningful.These amounts represent commitments made by the Company to extend credit to borrowers as long as there is no violation of any condition established in the contract. Commitments generally have fixed expiration dates or other termination clauses. Since some of the commitments are expected to expire without being drawn upon, the total commitment amount does not necessarily represent future cash requirements. |
Fees, charges and other income are the major sources of non-interest income for the Company and include deposit-related fees, indirect automobile and consumer loan fees, and other service fees. Total non-interest income increased by $13.5 million, or 267.5%, from $5.1 million for 2011 to $18.6 million for 2012. The increase is primarily due to the acquisition of BankRI and the related increase in mortgage- and deposit related fees, charges and other income
The following table sets forth the Company's fee income in more detail for the periods indicated:
|
| | | | | | | | | | | | | | |
| | Year Ended December 31, | | Dollar Change | | Percent Change |
| | 2012 | | 2011 | | |
| | (Dollars in Thousands) |
| Deposit fees | $ | 7,595 |
| | $ | 2,715 |
| | $ | 4,880 |
| | 179.7 | % |
| Investment and insurance fees | 3,385 |
| | 174 |
| | 3,211 |
| | 1,845.4 | % |
| Loan and lease fees | 2,090 |
| | 1,725 |
| | 365 |
| | 21.2 | % |
| Other fees and other income | 3,405 |
| | 1,039 |
| | 2,366 |
| | 227.7 | % |
| Total fees, charges and other income | $ | 16,475 |
| | $ | 5,653 |
| | $ | 10,822 |
| | 191.4 | % |
The 2012 results also included a $1.9 million gain on a sale of $19.6 million of equipment leases undertaken to manage concentration risk. Losses from investments in affordable housing remained constant from 2012 to 2013 at $0.7 million. These tax-induced losses were offset by an increase in related tax benefits of $0.3 million. Investment securities (primarily equity securities) were sold during 2012 at a net gain of $0.9 million, compared to a net gain of $0.1 million on sales of investment securities in 2011.
Non-Interest Expense
|
| | | | | | | | | | | | | | |
| | Year Ended December 31, | | Dollar Change | | Percent Change |
| | 2012 | | 2011 | | |
| | (Dollars in Thousands) |
| Compensation and employee benefits | $ | 58,830 |
| | $ | 30,789 |
| | $ | 28,041 |
| | 91.1 | % |
| Occupancy | 10,611 |
| | 6,138 |
| | 4,473 |
| | 72.9 | % |
| Equipment and data processing | 14,540 |
| | 9,144 |
| | 5,396 |
| | 59.0 | % |
| Professional services | 12,475 |
| | 5,375 |
| | 7,100 |
| | 132.1 | % |
| FDIC insurance | 4,212 |
| | 1,746 |
| | 2,466 |
| | 141.2 | % |
| Advertising and marketing | 2,984 |
| | 1,376 |
| | 1,608 |
| | 116.9 | % |
| Amortization of identified intangible assets | 5,622 |
| | 1,570 |
| | 4,052 |
| | 258.1 | % |
| Other | 11,101 |
| | 6,787 |
| | 4,314 |
| | 63.6 | % |
| Total non-interest expense | $ | 120,375 |
| | $ | 62,925 |
| | $ | 57,450 |
| | 91.3 | % |
Non-interest expense in 2012 increased $57.5 million compared to 2011. The increase year-to-year was largely attributable to the addition of BankRI non-interest expenses, acquisition-related expenses of $5.4 million in the first quarter of 2012, and various costs incurred in conjunction with the Company's core systems conversions, consolidation of shared services, and other infrastructure-related expenditures.
Compensation and employee benefit expenses were $58.8 million in 2012 compared to $30.8 million in 2011. In addition to the impact of the BankRI acquisition, which accounted for $19.1 million of additional compensation and employee benefit expense as compared to 2011, the increase in non-interest expense related to the addition of loan officers and other individuals in key support areas of the Company to support future growth. This included the addition or expansion of the Loan Review, Credit Administration, Compliance, Human Resources, Legal and Finance functions. Any future compensation and employee benefit expense synergies in connection with the acquisition of BankRI will not be realized until after BankRI's core system conversion, expected to occur in the latter part of the second quarter of 2013.
Professional service fees increased $7.1 million to $12.5 million in 2012, mainly driven by $5.4 million in merger-related expenses, a $1.1 million increase in outsourced internal audit expenses associated with a change in internal auditors, increases in external auditor fees related to the 2012 systems conversions, and increased legal expenses to settle several legal issues associated with the BankRI acquisition (all of which had been settled or resolved by December 31, 2012). In addition, the infrastructure build has resulted in an additional $1.0 million in consulting-related expenses in connection with certain support functions of the Company.
Equipment and data processing costs increased $5.4 million, or 59.0%, in 2012 due in part to the acquisition of BankRI, which accounted for $3.7 million of the increase. In addition, 2012 equipment and data processing costs include $0.8 million in one-time expenses related to the core-system conversions at Brookline Bank and First Ipswich. The increases from 2011 to 2012 in occupancy costs, FDIC insurance, advertising and marketing, amortization of identified intangible assets, and other expenses are largely related to the addition of expenses incurred by BankRI during the year.
As a result, the Company's efficiency ratio increased from 54.6% in 2011 to 61.4% in 2012. On an operating basis, the Company's efficiency ratio increased from 52.7% in 2011 to 58.7% in 2012.
Provision for income taxes
|
| | | | | | | | | | | | | | |
| | Year Ended December 31, | | Dollar Change | | Percent Change |
| | 2012 | | 2011 | | |
| | (Dollars in Thousands) |
| Income before provision for income taxes | $ | 59,710 |
| | $ | 48,705 |
| | $ | 11,005 |
| | 22.6 | % |
| Provision for income taxes | 21,341 |
| | 19,886 |
| | 1,455 |
| | 7.3 | % |
| Net income | $ | 38,369 |
| | $ | 28,819 |
| | $ | 9,550 |
| | 33.1 | % |
| Effective tax rate | 35.7 | % | | 40.8 | % | | N/A |
| | (12.5 | )% |
The Company recorded income tax expense of $21.3 million for 2012, compared to $19.9 million for 2011. This represented total effective tax rates of 35.7% and 40.8%, respectively. The decrease in tax rate was primarily due to tax credits and benefits recognized for investment in affordable housing projects ($0.8 million) and the Company’s new headquarters ($1.2 million) offset by an increase in state taxes of $0.6 million and the non-deductibility of $1.4 million of the $5.4 million in professional fees incurred related to the BankRI acquisition.
| |
| (2) | The Company leases certain office space under various noncancellable operating leases. These leases have original terms ranging from 5 years to over 25 years. Certain leases contain renewal options and escalation clauses for real estate taxes and other expenditures which can increase rental expenses based principally on the consumer price index and fair market rental value provisions. |
| |
| (3) | Payments to service providers under most of the existing contracts are based on the volume of accounts served or transactions processed. Some contracts also call for higher required payments when there are increases in the Consumer Price Index. The expected payments shown in this table are based on an estimate of the number of accounts to be served or transactions to be processed, but do not include any projection of the effect of changes in the Consumer Price Index. |
| |
| (4) | These amounts represent commitments made by the Company for a Supplemental Executive Retirement Plan as part of the acquisition of BankRI and a Postretirement Benefits Plan, at Brookline Bank, that provides part of the annual expense of health insurance premiums for retired employees and their dependents. |
Item 7A. Quantitative and Qualitative Disclosures about Market Risk
Market Risk
Market risk is the risk that the market value or estimated fair value of the Company's assets, liabilities, and derivative financial instruments will decline as a result of changes in interest rates or financial market volatility, or that the Company's net income will be significantly reduced by interest-rate changes.
Interest-Rate Risk
The principal market risk facing the Company is interest-rate risk, which can comeoccur in a variety of forms, including repricing risk, yield-curve risk, basis risk and prepayment risk. Repricing risk existsoccurs when the change in the average yield of either interest-earning assets or interest-bearing liabilities is more sensitive than the other to changes in market interest rates. Such a change in sensitivity could reflect a number of possible mismatches in the repricing opportunities of the Company's assets and liabilities. Yield-curve risk reflects the possibility that the changes in the shape of the yield curve could have different effects on the Company's assets and liabilities. Basis risk existsoccurs when different parts of the balance sheet are subject to varying base rates reflecting the possibility that the spread from those base rates will deviate. Prepayment risk is associated with financial instruments with an option to prepay before the stated maturity, often at a time of disadvantage to person selling the option; this risk is most often associated with the prepayment of loans, callable investments, and callable borrowings.
Asset/Liability Management
Market risk and interest-rate risk management is governed by the Company's Asset/Liability Committee ("ALCO"). The ALCO establishes exposure limits that define the Company's tolerance for interest-rate risk. The Asset/Liability CommitteeALCO and the Company's Treasury Group measure and manage the composition of the balance sheet over a range of possible changes in interest rates while remaining responsive to market demand for loan and deposit products. The ALCO monitors current exposures versus limits and reports those results to the Board of Directors. The policy limits and guidelines serve as benchmarks for measuring interest-rate risk and for providing a framework for evaluation and interest-rate risk-management decision-making. The Company measures its interest-rate risk by using an asset/liability simulation model. The model considers several factors to determine the Company's potential exposure to interest-rate risk, including measurement of repricing gaps, duration, convexity, value-at-risk, and the market value of portfolio equity under assumed changes in the level of interest rates, the shape of yield curves, and general market volatility.
Management controls the Company's interest-rate exposure using several strategies, which include adjusting the maturities of securities in the Company's investment portfolio, limiting or expanding the terms of loans originated, limiting fixed-rate deposits with terms of more than five years, and adjusting maturities of FHLBB advances. The Company limits this risk by restricting the types of MBSs it invests in to those with limited average life changes under certain interest-rate-shock scenarios, or securities with embedded prepayment penalties. The Company also places limits on holdings of fixed-rate mortgage loans with maturities greater than five years. The Company may also may use derivative instruments, principally interest-rate swaps, to manage its interest-rate risk; however, the Company had no derivative fair value hedges or derivative cash flows athedges as of December 31, 20132015 or 2012.2014. See Note 16, "Derivatives and Hedging Activities," to the consolidated financial statements.
Measuring Interest-Rate Risk
As noted above, interest-rate risk can be measured by analyzing the extent to which the repricing of assets and liabilities are mismatched to create an interest-rate sensitivity gap. An asset or liability is said to be interest-rate sensitive within a specific period if it will mature or reprice within that period. The interest-rate sensitivity gap is defined as the difference between the amount of interest-earning assets maturing or repricing within a specific time period and the amount of interest-bearing liabilities maturing or repricing within that same time period. A gap is considered positive when the amount of interest-rate-sensitive assets exceeds the amount of interest-rate-sensitive liabilities. A gap is considered negative when the amount of interest-rate-sensitive liabilities exceeds the amount of interest-rate-sensitive assets. During a period of falling interest rates, therefore, a positive gap would tend to adversely affect net interest income. Conversely, during a period of rising interest rates, a positive gap position would tend to result in an increase in net interest income.
The Company's interest-rate risk position is measured using both income simulation and interest-rate sensitivity "gap" analysis. Income simulation is the primary tool for measuring the interest-rate risk inherent in the Company's balance sheet at a given point in time by showing the effect on net interest income, over a twelve-month period, of a variety of interest-rate shocks. These simulations take into account repricing, maturity, and prepayment characteristics of individual products. The ALCO reviews simulation results to determine whether the exposure resulting from changes in market interest rates remains within established tolerance levels over a twelve-month horizon, and develops appropriate strategies to manage this exposure. The Company's interest-rate risk analysis remains modestly asset-sensitive atas of December 31, 2013.2015.
The assumptions used in the Company’s interest-rate sensitivity simulation discussed above are inherently uncertain and, as a result, the simulations cannot precisely measure net interest income or precisely predict the impact of changes in interest rates.
As of December 31, 2013,2015, net interest income simulation indicated that the Company's exposure to changing interest rates was within tolerance. The ALCO reviews the methodology utilized for calculating interest-rate risk exposure and may periodically adopt modifications to this methodology. The following table presents the estimated impact of interest-rate changes on the Company's estimated net interest income over the twelve-month periods indicated:
| | | | Estimated Exposure to Net Interest Income over Twelve-Month Horizon Beginning | Estimated Exposure to Net Interest Income over Twelve-Month Horizon Beginning |
| | December 31, 2013 | December 31, 2015 | | December 31, 2014 |
| Gradual Change in Interest Rate Levels | Dollar Change | | Percent Change | Dollar Change | | Percent Change | | Dollar
Change | | Percent
Change |
| | (Dollars in Thousands) | (Dollars in Thousands) |
| Up 300 basis points | $ | 590 |
| | 0.33 | % | $ | 11,616 |
| | 5.9 | % | | $ | 1,882 |
| | 1.0 | % |
| Up 200 basis points | 414 |
| | 0.23 | % | 8,144 |
| | 4.2 | % | | 1,327 |
| | 0.7 | % |
| Up 100 basis points | 220 |
| | 0.12 | % | 4,246 |
| | 2.2 | % | | 693 |
| | 0.4 | % |
| Down 100 basis points | (3,648 | ) | | (2.02 | )% | (8,852 | ) | | (4.5 | )% | | (2,828 | ) | | (1.5 | )% |
The estimated impact of a 300 basis points increase in market interest rates on the Company's estimated net interest income over a twelve-month horizon was a positive 5.9% as of December 31, 2015, compared to a positive 1.0% as of December 31, 2014, the increase in asset sensitivity was due to a change in the funding mix, as deposits replaced wholesale funding.
Economic Value of Equity ("EVE") at Risk Simulation is conducted in tandem with net interest income simulations to ascertain a longer term view of the Company’s interest-rate risk position by capturing longer-term repricing risk and options risk embedded in the balance sheet. It measures the sensitivity of the economic value of equity to changes in interest rates. The EVE at Risk Simulation values only the current balance sheet and does not incorporate growth assumptions. As with the net interest income simulation, this simulation captures product characteristics such as loan resets, repricing terms, maturity dates, and rate caps and floors. Key assumptions include loan prepayment speeds, deposit pricing elasticity, and non-maturity deposit attrition rates. These assumptions can have significant impacts on valuation results as the assumptions remain in effect for the entire life of each asset and liability. The Company conducts non-maturity deposit behavior studies on a periodic basis to support deposit assumptions used in the valuation process. All key assumptions are subject to a periodic review.
EVE at Risk is calculated by estimating the net present value of all future cash flows from existing assets and liabilities using current interest rates as well as parallel shocks to the current interest-rate environment. The following table sets forth the estimated percentage change in the Company’s EVE at Risk, assuming various shifts in interest rates. Given the interest rate environment atas of December 31, 2013,2015, simulations for interest rate declines of more than 100 basis points were not deemed to be meaningful.
|
| | | | |
| | Estimated Percent Change in Economic Value of Equity | |
Parallel Shock in Interest Rate Levels | | December 31, 2013 | |
Up 300 basis points | | (3.05 | )% | |
Up 200 basis points | | (3.87 | )% | |
Up 100 basis points | | (2.06 | )% | |
Down 100 basis points | | 1.11 | % | |
|
| | | | | | |
| | | Estimated Percent Change in Economic Value of Equity |
| Parallel Shock in Interest Rate Levels | | At December 31, 2015 | | At December 31, 2014 |
| Up 300 basis points | | 7.1 | % | | (2.6 | )% |
| Up 200 basis points | | 4.2 | % | | (2.5 | )% |
| Up 100 basis points | | 2.0 | % | | (1.0 | )% |
| Down 100 basis points | | (7.7 | )% | | (5.4 | )% |
The Company also uses interest-rate sensitivity "gap" analysis to provide a more general overview of its interest-rate risk profile. The interest-rate sensitivity gap is defined as the difference between interest-earning assets and interest-bearing liabilities maturing or repricing within a given time period. The table below shows the Company's interest-rate sensitivity gap position as of December 31, 2013.2015.
| | | | One Year or Less | | More than One Year to Two Years | | More than Two Years to Three Years | | More than Three Years to Five Years | | More than Five Years | | Total | One Year or Less | | More than One Year to Two Years | | More than Two Years to Three Years | | More than Three Years to Five Years | | More than Five Years | | Total |
| | (Dollars in Thousands) | (Dollars in Thousands) |
| Interest-earning assets(1): | | | | | | | | | | | | | | | | | | | | | | |
| Short-term investments | $ | 55,357 |
| | $ | — |
| | $ | — |
| | $ | — |
| | $ | — |
| | $ | 55,357 |
| $ | 46,736 |
| | $ | — |
| | $ | — |
| | $ | — |
| | $ | — |
| | $ | 46,736 |
|
| Weighted average rate | 0.58 | % | | — |
| | — |
| | — |
| | — |
| | 0.30 | % | — |
| | — |
| | — |
| | — |
| | — |
| | — |
|
| Investment securities(1) | 79,650 |
| | 55,101 |
| | 47,580 |
| | 91,914 |
| | 218,683 |
| | 492,928 |
| |
| Investment securities(1) (3) | | 97,566 |
| | 65,373 |
| | 77,667 |
| | 123,358 |
| | 242,994 |
| | 606,958 |
|
| Weighted average rate | 3.96 | % | | 4.35 | % | | 4.17 | % | | 4.23 | % | | 5.25 | % | | 4.65 | % | 1.97 | % | | 1.96 | % | | 2.02 | % | | 1.85 | % | | 2.08 | % | | 2.00 | % |
| Commercial real estate loans(1) | 876,578 |
| | 382,182 |
| | 329,080 |
| | 489,503 |
| | 126,280 |
| | 2,203,623 |
| 1,261,145 |
| | 488,896 |
| | 384,988 |
| | 465,273 |
| | 64,092 |
| | 2,664,394 |
|
| Weighted average rate | 6.36 | % | | 8.97 | % | | 8.88 | % | | 8.67 | % | | 17.02 | % | | 8.31 | % | 3.57 | % | | 4.25 | % | | 4.26 | % | | 4.38 | % | | 4.61 | % | | 3.96 | % |
| Commercial loans(1) | 445,963 |
| | 226,124 |
| | 147,016 |
| | 109,630 |
| | 36,877 |
| | 965,610 |
| |
| Commercial loans and leases(1) | | 794,541 |
| | 263,850 |
| | 172,593 |
| | 138,325 |
| | 4,987 |
| | 1,374,296 |
|
| Weighted average rate | 11.30 | % | | 12.72 | % | | 12.68 | % | | 11.50 | % | | 8.02 | % | | 11.04 | % | 5.35 | % | | 6.20 | % | | 5.92 | % | | 5.61 | % | | (16.55 | )% | | 5.53 | % |
| Auto loans(1) | 181,600 |
| | 111,157 |
| | 61,163 |
| | 36,888 |
| | 9,723 |
| | 400,531 |
| |
| Indirect automobile loans(1) | | 8,604 |
| | 3,420 |
| | 1,148 |
| | 298 |
| | 208 |
| | 13,678 |
|
| Weighted average rate | 5.05 | % | | 4.90 | % | | 4.87 | % | | 4.96 | % | | 0.79 | % | | 4.87 | % | 5.09 | % | | 5.35 | % | | 4.91 | % | | 4.28 | % | | — | % | | 5.04 | % |
| Consumer loans(1) | 503,314 |
| | 107,011 |
| | 77,126 |
| | 87,846 |
| | 17,404 |
| | 792,701 |
| 524,446 |
| | 128,595 |
| | 100,041 |
| | 119,059 |
| | 71,031 |
| | 943,172 |
|
| Weighted average rate | 5.49 | % | | 10.21 | % | | 9.69 | % | | 9.41 | % | | 24.78 | % | | 7.39 | % | 3.46 | % | | 3.82 | % | | 3.78 | % | | 3.87 | % | | 3.26 | % | | 3.58 | % |
| Total interest-earning assets | 2,142,462 |
| | 881,575 |
| | 661,965 |
| | 815,781 |
| | 408,967 |
| | 4,910,750 |
| 2,733,038 |
| | 950,134 |
| | 736,437 |
| | 846,313 |
| | 383,312 |
| | 5,649,234 |
|
| Weighted average rate | 6.83 | % | | 9.28 | % | | 9.11 | % | | 8.46 | % | | 9.86 | % | | 8.10 | % | 3.95 | % | | 4.58 | % | | 4.35 | % | | 4.14 | % | | 2.48 | % | | 4.04 | % |
| Interest-bearing liabilities(1): | | | | | | | | | | | | | | | | | | | | | | |
| NOW accounts | — |
| | — |
| | — |
| | — |
| | 210,602 |
| | 210,602 |
| — |
| | — |
| | — |
| | — |
| | 283,972 |
| | 283,972 |
|
| Weighted average rate | — |
| | — |
| | — |
| | — |
| | 0.15 | % | | 0.15 | % | — |
| | — |
| | — |
| | — |
| | 0.06 | % | | 0.06 | % |
| Savings accounts | — |
| | — |
| | — |
| | — |
| | 494,734 |
| | 494,734 |
| — |
| | — |
| | — |
| | — |
| | 540,788 |
| | 540,788 |
|
| Weighted average rate | — |
| | — |
| | — |
| | — |
| | 0.50 | % | | 0.50 | % | — |
| | — |
| | — |
| | — |
| | 0.25 | % | | 0.25 | % |
| Money market savings accounts | 1,487,979 |
| | — |
| | — |
| | — |
| | — |
| | 1,487,979 |
| 1,589,076 |
| | — |
| | — |
| | — |
| | 5,193 |
| | 1,594,269 |
|
| Weighted average rate | 0.64 | % | | — |
| | — |
| | — |
| | — |
| | 0.64 | % | 0.44 | % | | — |
| | — |
| | — |
| | — |
| | 0.44 | % |
| Certificates of deposit(1) | 695,038 |
| | 139,924 |
| | 46,047 |
| | 53,010 |
| | 649 |
| | 934,668 |
| 718,317 |
| | 227,297 |
| | 61,279 |
| | 77,981 |
| | 2,998 |
| | 1,087,872 |
|
| Weighted average rate | 0.93 | % | | 1.09 | % | | 1.91 | % | | 1.49 | % | | 0.17 | % | | 0.90 | % | 0.75 | % | | 1.02 | % | | 1.40 | % | | 1.99 | % | | — | % | | 0.93 | % |
| Borrowed funds(1) | 231,088 |
| | 283,486 |
| | 91,081 |
| | 183,114 |
| | 23,786 |
| | 812,555 |
| 639,696 |
| | 211,916 |
| | 42,730 |
| | 2,909 |
| | 85,778 |
| | 983,029 |
|
| Weighted average rate | 1.32 | % | | 1.58 | % | | 4.90 | % | | 7.08 | % | | 7.13 | % | | 3.28 | % | 0.92 | % | | 2.91 | % | | 2.50 | % | | 4.17 | % | | 5.70 | % | | 1.85 | % |
| Total interest-bearing liabilities | 2,414,105 |
| | 423,410 |
| | 137,128 |
| | 236,124 |
| | 729,771 |
| | 3,940,538 |
| 2,947,089 |
| | 439,213 |
| | 104,009 |
| | 80,890 |
| | 918,729 |
| | 4,489,930 |
|
| Weighted average rate | 0.74 | % | | 1.42 | % | | 3.90 | % | | 5.82 | % | | 0.61 | % | | 1.20 | % | 0.62 | % | | 1.93 | % | | 1.85 | % | | 2.06 | % | | 0.70 | % | | 0.82 | % |
| Interest sensitivity gap(2) | $ | (271,643 | ) | | $ | 458,165 |
| | $ | 524,837 |
| | $ | 579,657 |
| | $ | (320,804 | ) | | $ | 970,212 |
| $ | (214,051 | ) | | $ | 510,921 |
| | $ | 632,428 |
| | $ | 765,423 |
| | $ | (535,417 | ) | | $ | 1,159,304 |
|
| Cumulative interest sensitivity gap | $ | (271,643 | ) | | $ | 186,522 |
| | $ | 711,359 |
| | $ | 1,291,016 |
| | $ | 970,212 |
| | |
| $ | (214,051 | ) | | $ | 296,870 |
| | $ | 929,298 |
| | $ | 1,694,721 |
| | $ | 1,159,304 |
| | |
|
| Cumulative interest sensitivity gap as a percentage of total assets | (5.10 | )% | | 3.50 | % | | 13.36 | % | | 24.24 | % | | 18.22 | % | | |
| (3.54 | )% | | 4.91 | % | | 15.38 | % | | 28.05 | % | | 19.19 | % | | |
|
| Cumulative interest sensitivity gap as a percentage of total interest-earning assets | (5.53 | )% | | 3.80 | % | | 14.49 | % | | 26.29 | % | | 19.76 | % | | |
| (3.79 | )% | | 5.26 | % | | 16.45 | % | | 30.00 | % | | 20.52 | % | | |
|
| |
| (1) | Interest-earning assets and interest-bearing liabilities are included in the period in which the balances are expected to be redeployed and/or repriced as a result of anticipated prepayments, scheduled rate adjustments and contractual maturities. |
| |
| (2) | Interest sensitivity gap represents the difference between interest-earning assets and interest-bearing liabilities. |
| |
| (3) | Investment securities include all debt, equity and restricted equity securities and unrealized gains and losses on investment securities. |
AtAs of December 31, 2013,2015, interest-earning assets maturing or repricing within one year amounted to $2.1$2.7 billion and interest-bearing liabilities maturing or repricing within one year amounted to $2.4$2.9 billion, resulting in a cumulative one-year negative gap position of $271.6$214.1 million or 5.53%3.79% of total interest-earning assets. AtAs of December 31, 2012,2014, the Company had a cumulative one-year negative gap position of $502.3$371.2 million, or 9.76%6.88% of total interest-earning assets. The change in the cumulative one-year gap position from the end of 2012December 31, 2014 was due to the extension ofincreased FHLB borrowings from the short to medium term to mitigate a rise in funding costs as rates rose.borrowings.
Interest rates paid on NOW accounts, savings accounts and money market accounts are subject to change at any time and such deposits are available for immediate withdrawal. A review of rates paid on these deposit categories over the last several years indicated that the amount and timing of rate changes did not coincide with the amount and timing of rate changes on other deposits when the FRB adjusted its benchmark federal funds rate.
Management views NOW and savings accounts to be less sensitive to interest rates than money market accounts and these accounts are therefore characterized as stable long-term funding sensitive beyond five years. Management views money
market accounts to be more volatile deposits and these accounts are therefore characterized as sensitive to changes in interest rates within the first year.
Other Market Risks
Included in the Company's investment portfolio at December 31, 2013 were marketable equity securities with a market value of $1.3 million. That amount includes net unrealized gains of $0.1 million. Movements in the market price of securities may affect the amount of gains or losses ultimately realized by the Company from the sale of its equity securities.
The assumptions used in the Company's interest-rate sensitivity simulation discussed above are inherently uncertain and, as a result, the simulations cannot precisely measure net interest income or precisely predict the impact of changes in interest rates.
Item 8. Financial Statements and Supplementary Data
The following financial statements and supplementary data required by this item are presented on the following pages which appear elsewhere herein:
Item 9. Changes in and Disagreements with Accountants on Accounting and Financial Disclosure
None.
Item 9A. Controls and Procedures
Under the supervision and with the participation of the Company's management,Management, including the Company's Chief Executive Officer (Principal Executive Officer) and Chief AccountingFinancial Officer (Principal Financial and Accounting Officer), the Company has evaluated the effectiveness of its disclosure controls and procedures (as defined in Rule 13a-15(e) and 15d-15(e) under the Exchange Act) as of the end of the period covered by this report. Based upon that evaluation, the Chief Executive Officer and Chief AccountingFinancial Officer consideredconcluded that, as of the end of the period covered by this report, the Company's disclosure controls and procedures were effective to ensure that information required to be disclosed in the reports that the Company files or submits under the Exchange Act is (i) recorded, processed, summarized and reported, within the time periods specified in the SEC's rules and forms and (ii) accumulated and communicated to the Company's management,Management, including its Chief AccountingFinancial Officer, as appropriate to allow timely decisions regarding required disclosure.
There has been no change in the Company's internal control over financial reporting identified in connection with the quarterly evaluation that occurred during the Company's last fiscal quarter that has materially and detrimentally affected, or is reasonably likely to materially and detrimentally affect, the Company's internal control over financial reporting.
The Company's managementManagement is responsible for establishing and maintaining adequate internal control over financial reporting as such term is defined in Exchange Act Rule 13a-15(f). The Company's internal control system was designed to provide reasonable assurance to its managementManagement and the Board of Directors regarding the preparation and fair presentation of published financial statements. All internal control systems, no matter how well designed have inherent limitations. Therefore, even those systems determined to be effective can provide only reasonable assurance with respect to financial statement preparation and presentation. The Company's managementManagement assessed the effectiveness of its internal control over financial reporting as of the end of the period covered by this report. In addition, the effectiveness of the Company's internal control over financial reporting as of the end of the period covered by this report has been audited by KPMG LLP, an independent registered public accounting firm.firm as stated in its report which is included in Item 8 of this Annual Report on Form 10-K.
On May 14, 2013, the Committee of Sponsoring Organizations of the Treadway Commission (“COSO”) issued an updated version of its Internal Control - Integrated Framework, referred to as the 2013 COSO Framework. Management assessed the Company’s system of internal control over financial reporting as of December 31, 2014, in relation to criteria for effective internal control over financial reporting as described in “Internal Control - Integrated Framework (1992),” issued by COSO. Management has adopted the 2013 COSO Framework and deemed the change from the 1992 COSO Framework to the 2013 COSO Framework not significant to the Company’s system of internal control over financial reporting.
Management's Report on Internal Control Over Financial Reporting as of December 31, 20132015 appears on page F-1 herein and the related Report of Independent Registered Public Accounting Firm thereon appears on page F-2 herein.
Item 9B. Other Information
None.
PART III
Item 10. Directors, Executive Officers and Corporate Governance
The information required by this item is incorporated herein by reference to the Company's Proxy Statement to be filed in connection with the Annual Meeting of Stockholders ("2014 Proxy Statement").
Item 11. Executive Compensation
The information required by this item is incorporated herein by reference to 2014 Proxy Statement.
Item 12. Security Ownership of Certain Beneficial Owners and Management and Related Stockholder Matters
The information required by this item is incorporated herein by reference to 2014 Proxy Statement.
Item 13. Certain Relationships and Related Transactions, and Director Independence
The information required by this item is incorporated herein by reference to 2014 Proxy Statement.
Item 14. Principal Accounting Fees and Services
The information required by this item is incorporated herein by reference to 2014 Proxy Statement.
PART IV
Item 15. Exhibits, Financial Statement Schedules
All financial statements are included in Item 8 of Part II of this Annual Report on Form 10-K.
| |
| (2) | Financial Statement Schedules |
All financial statement schedules have been omitted because they are not required, not applicable or are included in the consolidated financial statements or related notes.
The exhibits listed in paragraph (b) below are filed herewith or incorporated herein by reference to other filings.
EXHIBIT INDEX
|
| | | |
| Exhibit | | Description |
| 1.1 |
| | Underwriting Agreement, dated September 11, 2014, by and among Brookline Bancorp, Inc., Sterne, Agee & Leach, Inc. and Sandler O’Neil + Partners, L.P., as representatives of the several underwriters named therein (incorporated by reference to Exhibit 1.1 of the Company’s Current Report on Form 8-K filed on September 12, 2014) |
| 2.1 |
| | Agreement and Plan of Merger, dated as of April 19, 2011, by and between Brookline Bancorp, Inc. and Bancorp Rhode Island, Inc. (incorporated by reference to Exhibit 2.1 of the Company's Current Report on Form 8-K filed on April 22, 2011) |
| 3.1 |
| | Certificate of Incorporation of Brookline Bancorp, Inc. (incorporated by reference to Exhibit 3.1 (included in Exhibit 2) of the Registration Statement on Form S-1 filed by the Company on April 10, 2002 (Registration No. 333-85980)) |
| 3.2 |
| | Amended and Restated Bylaws of Brookline Bancorp, Inc. (incorporated by reference to Exhibit 3.02 of the Company's Current Report on Form 8-K filed on January 10, 2013) |
| 4 |
| | Form of Common Stock Certificate of the Company (incorporated by reference to Exhibit 4 of the Registration Statement on Form S-1 filed by the Company on April 10, 2002 (Registration No. 333-85980)) |
10.1+4.1 |
| | FormSubordinated Indenture, dated as of Employment AgreementSeptember 16, 2014, between Brookline Bancorp, Inc. and U.S. Bank National Association, as Trustee (incorporated by reference to Exhibit 10.14.1 of the Registration Statement on Form S-1 filed by the Company on November 18, 1997 (Registration No. 333-40471)) |
10.2+ |
| | Form of Change in Control Agreement (incorporated by reference to Exhibit 10.2 of the Company'sCompany’s Current Report on Form 8-K filed on March 11, 2008)September 17, 2014) |
10.3+4.2 |
| | First Supplemental Retirement Income Agreement with Charles H. PeckIndenture, dated as of September 16, 2014, between Brookline Bancorp, Inc. and U.S. Bank National Association, as Trustee (incorporated by reference to Exhibit 10.54.2 of the Registration Statement on Form S-1 filed by the Company on November 18, 1997 (Registration No. 333-40471)) |
10.3.1+ |
| | Amendment No. 2 to the Supplemental Retirement Income Agreement by and between Brookline Bank and Charles H. Peck (incorporated by reference to Exhibit 10.4.1 of the Company's Annual Report on Form 10-K filed on February 28, 2007) |
10.3.2+ |
| | Amendment No. 3 to the Supplemental Retirement Income Agreement by and between Brookline Bank and Charles H. Peck (incorporated by reference to Exhibit 10.4.2 of the Company'sCompany’s Current Report on Form 8-K filed on December 18, 2008)September 17, 2014) |
10.3.3+4.3 |
| | 2005 Supplemental Retirement Income Agreement by and between Brookline Bank and Charles H. PeckForm of Global Note to represent the 6.000% Fixed-to-Floating Rate Subordinated Notes due September 15, 2029 (incorporated by reference to Exhibit 10.4.34.3 of the Company'sCompany’s Current Report on Form 8-K filed on December 18, 2008)September 17, 2014) |
10.4+10.1+ |
| | Brookline Bancorp, Inc. Deferred Compensation Plan effective January 1, 2011 (incorporated by reference to Exhibit 99.1 of the Company's Current Report on Form 8-K filed on September 16, 2010) |
10.5+10.2+ |
| | Brookline Bancorp, Inc. 2003 Stock Option Plan (incorporated by reference to Exhibit A of the Company's Proxy Statement filed on July 23, 2003) |
10.6+10.3+ |
| | Brookline Bancorp, Inc. 2003 Recognition and Retention Plan (incorporated by reference to Exhibit B of the Company's Proxy Statement filed on July 23, 2003) |
10.7+10.4+ |
| | Brookline Bancorp, Inc. 2011 Restricted Stock Plan (incorporated by reference to Appendix A of the Company's Proxy Statement filed on March 17, 2011) |
10.8+10.5+ |
| | Amendment to Employment Agreement, dated as of December 15, 2005, by and among Brookline Bank, Brookline Bancorp, Inc. and Charles H. Peck2014 Equity Incentive Plan (incorporated by reference to Exhibit 10.810.1 of the Company's QuarterlyCompany’s Current Report on Form 10-Q8-K filed on May 3, 2006) |
| 9, 2014) |
| | | |
Exhibit | | Description |
10.9+10.6+ |
| | Employment Agreement, dated as of April 11, 2011, by and among Brookline Bancorp, Inc., Brookline Bank and Paul A. Perrault (incorporated by reference to Exhibit 10.10 of the Company's Current Report on Form 8-K filed on April 15, 2011) |
10.10+ |
| | | |
| Exhibit | | Description |
| 10.7+ |
| | Retirement Agreement, dated as of December 23, 2010, by and between Brookline Bancorp, Inc., Brookline Bank and Charles H. Peck (incorporated by reference to Exhibit 10.11 of the Company's Current Report on Form 8-K filed on December 27, 2010) |
10.11+10.8+ |
| | Employment Letter Agreement, dated as of April 19, 2011, by and between Brookline Bancorp, Inc. and Mark J. Meiklejohn (incorporated by reference to Exhibit 10.3 of Pre-effective Amendment No. 2 of the Registration Statement on Form S-4 filed by the Company on July 25, 2011 (Registration Number 333-174731)) |
10.12+10.9+ |
| | Form of Amended Change in Control Agreement dated as of January 1, 2010, by and between M. Robert Rose and Brookline Bank (incorporated by reference to Exhibit 10.12 of Amendment No. 1 to the Company's Annual Report on Form 10-K filed on June 2, 2011) |
10.13+ |
| | Change in Control Agreement, dated as of September 26, 2011, by and among Brookline Bancorp, Inc., Brookline Bank and Julie A. Gerschick (incorporated by reference to Exhibit 10.1 of the Company's CurrentQuarterly Report on Form 8-K10-Q filed on September 27, 2011)May 9, 2014) |
10.14+14.1 |
| | Release, Consulting and Non-Competition Agreement, dated asCode of April 19, 2011, by and among Brookline Bancorp, Inc., Bancorp Rhode Island, Inc., Bank Rhode Island and Merrill W. ShermanEthics for Financial Professionals (incorporated by reference to Exhibit 10.1 of Bancorp Rhode Island, Inc.'s Current Report on14 to Form 8-K dated April 22, 2011) |
10.15+ |
| | Amendment to Release, Consulting and Non-Competition Agreement, dated as of January 1, 2012, by and among Brookline Bancorp, Inc., Bancorp Rhode Island, Inc., Bank Rhode Island and Merrill W. Sherman (incorporated by reference to Exhibit 10.2 of the Company's Current Report on Form 8-K10-K filed on January 3, 2012) |
10.16+ |
| | Resignation Agreement dated December 6, 2013 by and among Julie A. Gerschick, Brookline Bancorp, Inc., Brookline Bank, Fist Ipswich Bank, and Bank Rhode Island (incorporated by reference to Exhibit 10.1 of the Company's Current report on Form 8-K filed on December 6, 2013)March 10, 2006) |
| 21 |
| | Subsidiaries of the Registrant (incorporated by reference in Part I, Item 1. "Business—General" of this Annual Report on Form 10-K) |
| 23* |
| | Consent of Independent Registered Public Accounting Firm |
| 31.1* |
| | Rule 13a-14(a)/15d-14(a) Certification of the Chief Executive Officer pursuant to Section 302 of the Sarbanes-Oxley Act of 2002 |
| 31.2* |
| | Rule 13a-14(a)/15d-14(a) Certification of the Chief Financial Officer pursuant to Section 302 of the Sarbanes-Oxley Act of 2002 |
| 32.1** |
| | Rule 13a-14(b) Certifications of the Chief Executive Officer Pursuant to Section 906 of the Sarbanes-Oxley Act of 2002 |
| 32.2** |
| | Rule 13a-14(b) Certifications of the Chief Financial Officer Pursuant to Section 906 of the Sarbanes-Oxley Act of 2002 |
101***101 |
| | The following materials from Brookline Bancorp, Inc.'s Annual Report on Form 10-K for the year ended December 31, 20132014 were formatted in xBRL (eXtensible Business Reporting Language): (i) Consolidated Balance Sheets as of December 31, 20132014 and 2012,2013, (ii) Consolidated Statements of Income for the years ended December 31, 2014, 2013 2012 and 2011,2012, (iii) Consolidated Statements of Comprehensive Income for the years ended December 31, 2014, 2013 2012 and 2011,2012, (iv) Consolidated Statements of Changes in Equity for the years ended December 31, 2014, 2013 2012 and 2011,2012, (v) Consolidated Statements of Cash Flows for the years ended December 31, 2014, 2013 2012 and 20112012 and (vi) Notes to Consolidated Financial Statements. |
| |
*** | Pursuant to Rule 406T of Regulation S-T, the xBRL related information in Exhibit 101 of this Annual Report on Form 10-K is furnished and not filed for purposes of Sections 11 and 12 of the Securities Act of 1933 and Section 18 of the Securities Exchange Act of 1934. |
| |
| + | Management contract or compensatory plan or agreement |
| |
| (c) | Other Required Financial Statements and Schedules |
Not applicable.
SIGNATURES
Pursuant to the requirements of Section 13 or 15(d) of the Securities Exchange Act of 1934, the Registrant has duly caused this report to be signed on its behalf by the undersigned, thereunto duly authorized.
|
| | |
Date: March 3, 2014February 29, 2016 | BROOKLINE BANCORP, INC. |
| | By: | /s/ PAUL A. PERRAULT |
| | | Paul A. Perrault President and Chief Executive Officer |
Pursuant to the requirements of the Securities Exchange Act of 1934, this report has been signed below by the following persons on behalf of the Registrant and in the capacities and on the dates indicated.
|
| | | | | | |
| By: | | /s/ PAUL A. PERRAULT | | By: | | /s/ THOMAS J. MESHAKOCARL M. CARLSON |
| | | Paul A. Perrault, President and Chief Executive Officer (Principal Executive Officer) | | | | Thomas J. Meshako,Carl M. Carlson,
Chief AccountingFinancial Officer (Principal Financial Officer) |
| | | Date: March 3, 2014February 29, 2016 | | | | Date: March 3, 2014February 29, 2016 |
| | | | | | | |
| By: | | /s/ MARGARET BOLES FITZGERALD | | By: | | /s/ BOGDAN NOWAKCHARLES H. PECK |
| | | Margaret Boles Fitzgerald, Director | | | | Bogdan Nowak,
Charles H. Peck,
Director |
| | | Date: March 3, 2014February 29, 2016 | | | | Date: March 3, 2014February 26, 2016 |
| | | | | | | |
| By: | | /s/ DAVID C. CHAPIN | | By: | | /s/ CHARLES H. PECKJOHN M. PEREIRA |
| | | David C. Chapin, Director | | | | Charles H. Peck,John M. Pereira,
Director |
| | | Date: March 3, 2014February 29, 2016 | | | | Date: March 3, 2014February 29, 2016 |
| | | | | | | |
| By: | | /s/ JOHN J. DOYLE, JR. | | By: | | /s/ MERRILL W. SHERMAN |
| | | John J. Doyle, Jr., Director | | | | Merrill W. Sherman, Director |
| | | Date: March 3, 2014February 29, 2016 | | | | Date: March 3, 2014February 29, 2016 |
| | | | | | | |
| By: | | /s/ JOHN A. HACKETT | | By: | | /s/ JOSEPH J. SLOTNIK |
| | | John A. Hackett, Director | | | | Joseph J. Slotnik, Chairman and Director |
| | | Date: March 3, 2014February 29, 2016 | | | | Date: March 3, 2014February 29, 2016 |
| | | | | | | |
| By: | | /s/ JOHN L. HALL, II | | By: | | /s/ ROSAMOND B. VAULE |
| | | John L. Hall, II, Director | | | | Rosamond B. Vaule, Director |
| | | Date: March 3, 2014February 29, 2016 | | | | Date: March 3, 2014February 29, 2016 |
| | | | | | | |
| By: | | /s/ THOMAS J. HOLLISTER | | By: | | /s/ PETER O. WILDE |
| | | Thomas J. Hollister, Director | | | | Peter O. Wilde, Director |
| | | Date: March 3, 2014February 29, 2016 | | | | Date: March 3, 2014February 29, 2016 |
| | | | | | |
| By: | | /s/ BOGDAN NOWAK | | | | |
| | Bogdan Nowak,
Director | | | | |
| | Date: February 29, 2016 | | | | |
| | | | | | |
MANAGEMENT'S REPORT ON INTERNAL CONTROL
OVER FINANCIAL REPORTING
The managementManagement of Brookline Bancorp, Inc. is responsible for establishing and maintaining adequate internal control over financial reporting. Brookline Bancorp Inc.'s internal control system was designed to provide reasonable assurance to the Company's managementManagement and boardBoard of directorsDirectors regarding the preparation and fair presentation of published financial statements.
All internal control systems, no matter how well-designed, have inherent limitations. Therefore, even those systems determined to be effective can provide only reasonable assurance with respect to financial statement preparation and presentation.
Brookline Bancorp, Inc.'s managementManagement assessed the effectiveness of the Company's internal control over financial reporting as of December 31, 2013.2015. In making this assessment, it used the criteria set forth by the Committee of Sponsoring Organizations of the Treadway Commission (COSO) in Internal Control—Integrated Framework.Framework (2013). Based on our assessment, we believe that, as of December 31, 2013,2015, the Company's internal control over financial reporting is effective based on those criteria.
Brookline Bancorp, Inc.'s independent registered public accounting firm has issued an audit report on the effectiveness of the Company's internal control over financial reporting. This report appears on page F-2.
|
| | |
| /s/ PAUL A. PERRAULT | | /s/ THOMAS J. MESHAKOCARL M. CARLSON |
| Paul A. Perrault | | Thomas J. MeshakoCarl M. Carlson |
Chief Executive Officer (Principal Executive Officer) | | Chief AccountingFinancial Officer (Principal Financial Officer) |
REPORT OF INDEPENDENT REGISTERED PUBLIC ACCOUNTING FIRM
The Board of Directors and Stockholders
Brookline Bancorp, Inc.:
We have audited Brookline Bancorp, Inc.’s (the Company) internal control over financial reporting as of December 31, 2013,2015, based on criteria established in Internal Control - Integrated Framework (1992)(2013) issued by the Committee of Sponsoring Organizations of the Treadway Commission (COSO). The Company’s managementManagement is responsible for maintaining effective internal control over financial reporting and for its assessment of the effectiveness of internal control over financial reporting, included in the accompanying Management’s Report on Internal Control Over Financial Reporting. Our responsibility is to express an opinion on the Company’s internal control over financial reporting based on our audit.
We conducted our audit in accordance with the standards of the Public Company Accounting Oversight Board (United States). Those standards require that we plan and perform the audit to obtain reasonable assurance about whether effective internal control over financial reporting was maintained in all material respects. Our audit included obtaining an understanding of internal control over financial reporting, assessing the risk that a material weakness exists, and testing and evaluating the design and operating effectiveness of internal control based on the assessed risk. Our audit also included performing such other procedures as we considered necessary in the circumstances. We believe that our audit provides a reasonable basis for our opinion.opinion.
A company’s internal control over financial reporting is a process designed to provide reasonable assurance regarding the reliability of financial reporting and the preparation of financial statements for external purposes in accordance with generally accepted accounting principles. A company’s internal control over financial reporting includes those policies and procedures that (1) pertain to the maintenance of records that, in reasonable detail, accurately and fairly reflect the transactions and dispositions of the assets of the company; (2) provide reasonable assurance that transactions are recorded as necessary to permit preparation of financial statements in accordance with generally accepted accounting principles, and that receipts and expenditures of the company are being made only in accordance with authorizations of management and directors of the company; and (3) provide reasonable assurance regarding prevention or timely detection of unauthorized acquisition, use, or disposition of the company’s assets that could have a material effect on the financial statements.
Because of its inherent limitations, internal control over financial reporting may not prevent or detect misstatements. Also, projections of any evaluation of effectiveness to future periods are subject to the risk that controls may become inadequate because of changes in conditions, or that the degree of compliance with the policies or procedures may deteriorate.
In our opinion, the Company maintained, in all material respects, effective internal control over financial reporting as of December 31, 2013,2015, based on criteria established in Internal Control - Integrated Framework (1992)(2013) issued by the Committee of Sponsoring Organizations of the Treadway Commission (COSO).
We also have audited, in accordance with the standards of the Public Company Accounting Oversight Board (United States), the consolidated balance sheets of Brookline Bancorp, Inc. and subsidiaries as of December 31, 20132015 and 2012,2014, and the related consolidated statements of income, comprehensive income, changes in stockholders’ equity, and cash flows for each of the years in the three-year period ended December 31, 2013,2015, and our report dated March 3, 2014February 29, 2016 expressed an unqualified opinion on those consolidated financial statements.
/s/ KPMG LLP
Boston, Massachusetts
March 3, 2014February 29, 2016
REPORT OF INDEPENDENT REGISTERED PUBLIC ACCOUNTING FIRM
The Board of Directors and Stockholders
Brookline Bancorp, Inc.:
We have audited the accompanying consolidated balance sheets of Brookline Bancorp, Inc. and subsidiaries (the Company) as of December 31, 20132015 and 2012,2014, and the related consolidated statements of income, comprehensive income, changes in stockholders’ equity, and cash flows for each of the years in the three‑year period ended December 31, 2013.2015. These consolidated financial statements are the responsibility of the Company’s management.Management. Our responsibility is to express an opinion on these consolidated financial statements based on our audits.
We conducted our audits in accordance with the standards of the Public Company Accounting Oversight Board (United States). Those standards require that we plan and perform the audit to obtain reasonable assurance about whether the financial statements are free of material misstatement. An audit includes examining, on a test basis, evidence supporting the amounts and disclosures in the financial statements. An audit also includes assessing the accounting principles used and significant estimates made by management,Management, as well as evaluating the overall financial statement presentation. We believe that our audits provide a reasonable basis for our opinion.
In our opinion, the consolidated financial statements referred to above present fairly, in all material respects, the financial position of Brookline Bancorp, Inc. and subsidiaries as of December 31, 20132015 and 2012,2014, and the results of their operations and their cash flows for each of the years in the three‑year period ended December 31, 2013,2015, in conformity with U.S. generally accepted accounting principles.
We also have audited, in accordance with the standards of the Public Company Accounting Oversight Board (United States), the Company’s internal control over financial reporting as of December 31, 2013,2015, based on criteria established in Internal Control - Integrated Framework (1992)(2013) issued by the Committee of Sponsoring Organizations of the Treadway Commission (COSO), and our report dated March 3, 2014February 29, 2016 expressed an unqualified opinion on the effectiveness of the Company’s internal control over financial reporting.
/s/ KPMG LLP
Boston, Massachusetts
March 3, 2014
February 29, 2016
BROOKLINE BANCORP, INC. AND SUBSIDIARIES
Consolidated Balance Sheets | | | | At December 31, | At December 31, |
| | 2013 | | 2012 | 2015 | | 2014 |
| | (In Thousands Except Share Data) | (In Thousands Except Share Data) |
| ASSETS | | | | | | |
| Cash and due from banks | $ | 37,148 |
| | $ | 78,441 |
| $ | 28,753 |
| | $ | 36,893 |
|
| Short-term investments | 55,357 |
| | 38,656 |
| 46,736 |
| | 25,830 |
|
| Total cash and cash equivalents | 92,505 |
| | 117,097 |
| 75,489 |
| | 62,723 |
|
| Investment securities available-for-sale | 492,428 |
| | 481,323 |
| 513,201 |
| | 550,761 |
|
| Investment securities held-to-maturity (fair value of $500 and $502, respectively) | 500 |
| | 500 |
| |
| Investment securities held-to-maturity (fair value of $93,695 and $500, respectively) | | 93,757 |
| | 500 |
|
| Total investment securities | 492,928 |
| | 481,823 |
| 606,958 |
| | 551,261 |
|
| Loans held-for-sale | 13,372 |
| | 3,233 |
| 13,383 |
| | 1,537 |
|
| Loans and leases: | | | | | | |
| Commercial real estate loans | 2,203,623 |
| | 2,005,963 |
| 2,664,394 |
| | 2,467,801 |
|
| Commercial loans and leases | 965,610 |
| | 847,455 |
| 1,374,296 |
| | 1,167,094 |
|
| Indirect automobile loans | 400,531 |
| | 542,344 |
| 13,678 |
| | 316,987 |
|
| Consumer loans | 792,701 |
| | 779,950 |
| 943,172 |
| | 870,725 |
|
| Total loans and leases | 4,362,465 |
| | 4,175,712 |
| 4,995,540 |
| | 4,822,607 |
|
| Allowance for loan and lease losses | (48,473 | ) | | (41,152 | ) | (56,739 | ) | | (53,659 | ) |
| Net loans and leases | 4,313,992 |
| | 4,134,560 |
| 4,938,801 |
| | 4,768,948 |
|
| Restricted equity securities | 66,559 |
| | 68,661 |
| 66,117 |
| | 74,804 |
|
| Premises and equipment, net of accumulated depreciation and amortization of $44,420 and $38,985, respectively | 80,505 |
| | 70,791 |
| |
| Premises and equipment, net of accumulated depreciation of $51,722 and $44,668, respectively | | 78,156 |
| | 80,619 |
|
| Deferred tax asset | 31,710 |
| | 27,197 |
| 26,817 |
| | 27,687 |
|
| Goodwill | 137,890 |
| | 137,890 |
| 137,890 |
| | 137,890 |
|
| Identified intangible assets, net of accumulated amortization of $22,895 and $18,272, respectively | 16,887 |
| | 21,510 |
| |
| Other real estate owned and repossessed assets, net | 1,578 |
| | 1,491 |
| |
| Other assets | 77,180 |
| | 83,281 |
| |
| Identified intangible assets, net of accumulated amortization of $29,149 and $26,238, respectively | | 10,633 |
| | 13,544 |
|
| Other real estate owned ("OREO") and repossessed assets, net | | 1,343 |
| | 1,456 |
|
| Other assets* | | 86,751 |
| | 80,479 |
|
| Total assets | $ | 5,325,106 |
| | $ | 5,147,534 |
| $ | 6,042,338 |
| | $ | 5,800,948 |
|
| LIABILITIES AND STOCKHOLDERS' EQUITY | | | | | | |
| Deposits: | | | | | | |
| Non-interest-bearing deposits: | | | | | | |
| Demand checking accounts | $ | 707,023 |
| | $ | 623,274 |
| $ | 799,117 |
| | $ | 726,118 |
|
| Interest-bearing deposits: | | | | | | |
| NOW accounts | 210,602 |
| | 212,858 |
| 283,972 |
| | 235,063 |
|
| Savings accounts | 494,734 |
| | 515,367 |
| 540,788 |
| | 531,727 |
|
| Money market accounts | 1,487,979 |
| | 1,253,819 |
| 1,594,269 |
| | 1,518,490 |
|
| Certificate of deposit accounts | 934,668 |
| | 1,010,941 |
| 1,087,872 |
| | 946,708 |
|
| Total interest-bearing deposits | 3,127,983 |
| | 2,992,985 |
| 3,506,901 |
| | 3,231,988 |
|
| Total deposits | 3,835,006 |
| | 3,616,259 |
| 4,306,018 |
| | 3,958,106 |
|
| Borrowed funds: | | | | | | |
| Advances from the FHLBB | 768,773 |
| | 790,865 |
| |
| Advances from the Federal Home Loan Bank of Boston ("FHLBB") | | 861,866 |
| | 1,004,026 |
|
Subordinated debentures and notes
| | 82,936 |
| | 82,763 |
|
| Other borrowed funds | 43,782 |
| | 63,104 |
| 38,227 |
| | 39,615 |
|
| Total borrowed funds | 812,555 |
| | 853,969 |
| 983,029 |
| | 1,126,404 |
|
| Mortgagors' escrow accounts | 7,889 |
| | 6,946 |
| 7,516 |
| | 8,501 |
|
| Accrued expenses and other liabilities | 51,485 |
| | 54,551 |
| 72,289 |
| | 61,332 |
|
| Total liabilities | 4,706,935 |
| | 4,531,725 |
| 5,368,852 |
| | 5,154,343 |
|
| | | | | | | |
| Commitments and contingencies (Note 13) |
| |
|
| |
|
| Stockholders' Equity: | | | | | | |
| Brookline Bancorp, Inc. stockholders' equity: | | | | | | |
| Common stock, $0.01 par value; 200,000,000 shares authorized; 75,744,445 shares and 75,749,825 shares issued, respectively | 757 |
| | 757 |
| |
| Common stock, $0.01 par value; 200,000,000 shares authorized; 75,744,445 shares issued | | 757 |
| | 757 |
|
| Additional paid-in capital | 617,538 |
| | 618,426 |
| 616,899 |
| | 617,475 |
|
| Retained earnings, partially restricted | 64,903 |
| | 53,358 |
| |
| Accumulated other comprehensive (loss) income | (7,915 | ) | | 3,483 |
| |
| Treasury stock, at cost; 5,171,985 shares and 5,373,733 shares, respectively | (59,826 | ) | | (62,107 | ) | |
| Unallocated common stock held by ESOP; 291,666 shares and 333,918 shares, respectively | (1,590 | ) | | (1,820 | ) | |
| Total Brookline Bancorp, Inc. stockholders' equity | 613,867 |
| | 612,097 |
| |
| Retained earnings, partially restricted* | | 109,675 |
| | 84,860 |
|
| Accumulated other comprehensive loss | | (2,476 | ) | | (1,622 | ) |
| Treasury stock, at cost; 4,861,554 shares and 5,040,571 shares, respectively | | (56,208 | ) | | (58,282 | ) |
| Unallocated common stock held by Employee Stock Ownership Plan ("ESOP"); 213,066 shares and 251,382 shares, respectively | | (1,162 | ) | | (1,370 | ) |
| Total Brookline Bancorp, Inc. stockholders' equity* | | 667,485 |
| | 641,818 |
|
| Noncontrolling interest in subsidiary | 4,304 |
| | 3,712 |
| 6,001 |
| | 4,787 |
|
| Total stockholders' equity | 618,171 |
| | 615,809 |
| |
| Total liabilities and stockholders' equity | $ | 5,325,106 |
| | $ | 5,147,534 |
| |
| Total stockholders' equity* | | 673,486 |
| | 646,605 |
|
| Total liabilities and stockholders' equity* | | $ | 6,042,338 |
| | $ | 5,800,948 |
|
| | | | | |
| (*) Previously reported amounts prior to January 1, 2015 have been restated to reflect a retrospective change in accounting principle for investments in qualified affordable housing projects, in accordance with ASU 2014-01. Refer to Note 10, "Other Assets". | | (*) Previously reported amounts prior to January 1, 2015 have been restated to reflect a retrospective change in accounting principle for investments in qualified affordable housing projects, in accordance with ASU 2014-01. Refer to Note 10, "Other Assets". |
See accompanying notes to consolidated financial statements.
F-4
BROOKLINE BANCORP, INC. AND SUBSIDIARIES
Consolidated Statements of Income
| | | | Year Ended December 31, | Year Ended December 31, |
| | 2013 | | 2012 | | 2011 | 2015 | | 2014 | | 2013 |
| | (In Thousands Except Share Data) | (In Thousands Except Share Data) |
| Interest and dividend income: | | | | | | | | | | |
| Loans and leases | $ | 197,098 |
| | $ | 203,711 |
| | $ | 133,938 |
| $ | 212,604 |
| | $ | 206,781 |
| | $ | 197,098 |
|
| Debt securities | 7,963 |
| | 8,551 |
| | 6,297 |
| 11,416 |
| | 9,527 |
| | 7,963 |
|
| Marketable and restricted equity securities | 1,212 |
| | 730 |
| | 195 |
| 2,762 |
| | 2,072 |
| | 1,212 |
|
| Short-term investments | 111 |
| | 208 |
| | 105 |
| 128 |
| | 102 |
| | 111 |
|
| Total interest and dividend income | 206,384 |
| | 213,200 |
| | 140,535 |
| 226,910 |
| | 218,482 |
| | 206,384 |
|
| Interest expense: | | | | | | | | | | |
| Deposits | 18,773 |
| | 21,432 |
| | 19,757 |
| 17,480 |
| | 17,060 |
| | 18,773 |
|
| Borrowed funds | 11,393 |
| | 14,400 |
| | 10,579 |
| 15,065 |
| | 12,354 |
| | 11,393 |
|
| Total interest expense | 30,166 |
| | 35,832 |
| | 30,336 |
| 32,545 |
| | 29,414 |
| | 30,166 |
|
| Net interest income | 176,218 |
| | 177,368 |
| | 110,199 |
| 194,365 |
| | 189,068 |
| | 176,218 |
|
| Provision for credit losses | 10,929 |
| | 15,888 |
| | 3,631 |
| 7,451 |
| | 8,477 |
| | 10,929 |
|
| Net interest income after provision for credit losses | 165,289 |
| | 161,480 |
| | 106,568 |
| 186,914 |
| | 180,591 |
| | 165,289 |
|
| Non-interest income: | | | | | | | | | | |
| Fees, charges and other income | 15,240 |
| | 16,475 |
| | 5,653 |
| |
| Loss from investments in affordable housing projects | (1,812 | ) | | (694 | ) | | (671 | ) | |
| Gain on sales of securities | 397 |
| | 926 |
| | 80 |
| |
| Gain on sales of loans and leases | — |
| | 1,898 |
| | — |
| |
| Total non-interest income | 13,825 |
| | 18,605 |
| | 5,062 |
| |
| Deposit fees | | 8,730 |
| | 8,692 |
| | 8,172 |
|
| Loan fees | | 1,186 |
| | 1,010 |
| | 1,415 |
|
| Loan level derivative income, net | | 3,397 |
| | 946 |
| | — |
|
| Gain on sales of investment securities, net | | — |
| | 65 |
| | 397 |
|
| Gain on sales of loans and leases held-for-sale | | 2,208 |
| | 1,651 |
| | 794 |
|
| Gain on sale/disposals of premises and equipment, net | | — |
| | 1,502 |
| | — |
|
| Other | | 4,663 |
| | 6,314 |
| | 4,841 |
|
| Total non-interest income* | | 20,184 |
| | 20,180 |
| | 15,619 |
|
| Non-interest expense: | | | | | | | | | | |
| Compensation and employee benefits | 65,261 |
| | 58,830 |
| | 30,789 |
| 71,272 |
| | 71,801 |
| | 65,261 |
|
| Occupancy | 12,616 |
| | 10,611 |
| | 6,138 |
| 13,926 |
| | 14,294 |
| | 12,616 |
|
| Equipment and data processing | 16,899 |
| | 14,540 |
| | 9,144 |
| 14,837 |
| | 17,020 |
| | 16,899 |
|
| Professional services | 5,695 |
| | 12,475 |
| | 5,375 |
| 4,192 |
| | 5,357 |
| | 5,673 |
|
| FDIC insurance | 3,102 |
| | 4,212 |
| | 1,746 |
| 3,510 |
| | 3,362 |
| | 3,102 |
|
| Advertising and marketing | 3,003 |
| | 2,984 |
| | 1,376 |
| 3,352 |
| | 3,058 |
| | 3,003 |
|
| Amortization of identified intangible assets | 4,623 |
| | 5,622 |
| | 1,570 |
| 2,911 |
| | 3,343 |
| | 4,623 |
|
| Other | 11,261 |
| | 11,101 |
| | 6,787 |
| 11,377 |
| | 10,925 |
| | 11,265 |
|
| Total non-interest expense | 122,460 |
| | 120,375 |
| | 62,925 |
| 125,377 |
| | 129,160 |
| | 122,442 |
|
| Income before provision for income taxes | 56,654 |
| | 59,710 |
| | 48,705 |
| |
| Provision for income taxes | 19,481 |
| | 21,341 |
| | 19,886 |
| |
| Net income before noncontrolling interest in subsidiary | 37,173 |
| | 38,369 |
| | 28,819 |
| |
| Income before provision for income taxes* | | 81,721 |
| | 71,611 |
| | 58,466 |
|
| Provision for income taxes* | | 29,353 |
| | 26,286 |
| | 20,664 |
|
| Net income before noncontrolling interest in subsidiary* | | 52,368 |
| | 45,325 |
| | 37,802 |
|
| Less net income attributable to noncontrolling interest in subsidiary | 1,787 |
| | 1,227 |
| | 1,219 |
| 2,586 |
| | 2,037 |
| | 1,787 |
|
| Net income attributable to Brookline Bancorp, Inc. | $ | 35,386 |
| | $ | 37,142 |
| | $ | 27,600 |
| |
| Net income attributable to Brookline Bancorp, Inc.* | | $ | 49,782 |
| | $ | 43,288 |
| | $ | 36,015 |
|
| Earnings per common share: | | | | | | | | | | |
| Basic | $ | 0.51 |
| | $ | 0.53 |
| | $ | 0.47 |
| $ | 0.71 |
| | $ | 0.62 |
| | $ | 0.52 |
|
| Diluted | 0.51 |
| | 0.53 |
| | 0.47 |
| 0.71 |
| | 0.62 |
| | 0.52 |
|
| Weighted average common shares outstanding during the year: | | | | | | | | | | |
| Basic | 69,808,164 |
| | 69,702,417 |
| | 58,633,627 |
| 70,098,561 |
| | 69,945,028 |
| | 69,808,164 |
|
| Diluted | 69,883,924 |
| | 69,746,256 |
| | 58,636,431 |
| 70,235,868 |
| | 70,054,815 |
| | 69,883,924 |
|
| Dividends declared per common share | $ | 0.34 |
| | $ | 0.34 |
| | $ | 0.34 |
| $ | 0.355 |
| | $ | 0.340 |
| | $ | 0.340 |
|
| | | | | | | |
| (*) Previously reported amounts prior to January 1, 2015 have been restated to reflect a retrospective change in accounting principle for investments in qualified affordable housing projects, in accordance with ASU 2014-01. Refer to Note 10, "Other Assets". | | (*) Previously reported amounts prior to January 1, 2015 have been restated to reflect a retrospective change in accounting principle for investments in qualified affordable housing projects, in accordance with ASU 2014-01. Refer to Note 10, "Other Assets". |
See accompanying notes to consolidated financial statements.
F-5
BROOKLINE BANCORP, INC. AND SUBSIDIARIES
Consolidated Statements of Comprehensive Income
| | | | Year Ended December 31, | Year Ended December 31, |
| | 2013 | | 2012 | | 2011 | 2015 | | 2014 | | 2013 |
| | (In Thousands) | (In Thousands) |
| Net income before noncontrolling interest in subsidiary | $ | 37,173 |
| | $ | 38,369 |
| | $ | 28,819 |
| |
| Net income before noncontrolling interest in subsidiary* | | $ | 52,368 |
| | $ | 45,325 |
| | $ | 37,802 |
|
| | | | | | | | | | | |
| Other comprehensive income (loss), net of taxes: | | | | | | | | | | |
| | | | | | | | | | | |
| Investment securities available-for-sale: | | | | | | | | | | |
| Unrealized securities holding (losses) gains excluding non-credit gain on impairment of securities | (18,710 | ) | | 3,396 |
| | (488 | ) | |
| Non-credit gain on impairment of securities | — |
| | 34 |
| | 11 |
| |
| Unrealized securities holding (losses) gains | | (1,573 | ) | | 10,699 |
| | (18,710 | ) |
| Income tax benefit (expense) | 7,275 |
| | (1,308 | ) | | 177 |
| 479 |
| | (4,058 | ) | | 7,275 |
|
| Net unrealized securities holding (losses) gains before reclassification adjustments | (11,435 | ) | | 2,122 |
| | (300 | ) | (1,094 | ) | | 6,641 |
| | (11,435 | ) |
| Less reclassification adjustments for securities gains included in net income: | | | | | | | | | | |
| Gain on sales of securities, net | 397 |
| | 926 |
| | 80 |
| — |
| | 65 |
| | 397 |
|
| Income tax expense | (142 | ) | | (328 | ) | | (29 | ) | — |
| | (23 | ) | | (142 | ) |
| Net reclassification adjustments for securities gains included in net income | 255 |
| | 598 |
| | 51 |
| — |
| | 42 |
| | 255 |
|
| Net unrealized securities holding (losses) gains | (11,690 | ) | | 1,524 |
| | (351 | ) | (1,094 | ) | | 6,599 |
| | (11,690 | ) |
| | | | | | | | | | | |
| Postretirement benefits: | | | | | | | | | | |
| Adjustment of accumulated obligation for postretirement benefits | 468 |
| | (10 | ) | | (57 | ) | 353 |
| | (498 | ) | | 468 |
|
| Income tax (expense) benefit | (176 | ) | | 6 |
| | 23 |
| (113 | ) | | 192 |
| | (176 | ) |
| Net adjustment of accumulated obligation for postretirement benefits | 292 |
| | (4 | ) | | (34 | ) | 240 |
| | (306 | ) | | 292 |
|
| | | | | | | | | | | |
| Net other comprehensive (loss) income | (11,398 | ) | | 1,520 |
| | (385 | ) | |
| Other comprehensive (loss) income, net of taxes | | (854 | ) | | 6,293 |
| | (11,398 | ) |
| | | | | | | | | | | |
| Comprehensive income | 25,775 |
| | 39,889 |
| | 28,434 |
| |
| Comprehensive income* | | 51,514 |
| | 51,618 |
| | 26,404 |
|
| Net income attributable to noncontrolling interest in subsidiary | 1,787 |
| | 1,227 |
| | 1,219 |
| 2,586 |
| | 2,037 |
| | 1,787 |
|
| Comprehensive income attributable to Brookline Bancorp, Inc. | $ | 23,988 |
| | $ | 38,662 |
| | $ | 27,215 |
| |
| Comprehensive income attributable to Brookline Bancorp, Inc.* | | $ | 48,928 |
| | $ | 49,581 |
| | $ | 24,617 |
|
| | | |
| (*) Previously reported amounts prior to January 1, 2015 have been restated to reflect a retrospective change in accounting principle for investments in qualified affordable housing projects, in accordance with ASU 2014-01. Refer to Note 10, "Other Assets". | | (*) Previously reported amounts prior to January 1, 2015 have been restated to reflect a retrospective change in accounting principle for investments in qualified affordable housing projects, in accordance with ASU 2014-01. Refer to Note 10, "Other Assets". |
See accompanying notes to consolidated financial statements.
F-6
BROOKLINE BANCORP, INC. AND SUBSIDIARIES
Consolidated Statements of Changes in Stockholders' Equity
Year Ended December 31, 2013, 20122015, 2014 and 20112013
|
| | | | | | | | | | | | | | | | | | | | | | | | | | | | | | | | | | | |
| | Common Stock | | Additional Paid-in Capital | | Retained Earnings | | Accumulated Other Comprehensive Income (loss) | | Treasury Stock | | Unallocated Common Stock Held by ESOP | | Total Brookline Bancorp, Inc. Stockholders' Equity | | Noncontrolling Interest in Subsidiary | | Total Stockholders' Equity |
| | (In Thousands) |
| Balance at December 31, 2012 | $ | 757 |
| | $ | 618,426 |
| | $ | 53,358 |
| | $ | 3,483 |
| | $ | (62,107 | ) | | $ | (1,820 | ) | | $ | 612,097 |
| | $ | 3,712 |
| | $ | 615,809 |
|
| Net income attributable to Brookline Bancorp, Inc. | — |
| | — |
| | 35,386 |
| | — |
| | — |
| | — |
| | 35,386 |
| | — |
| | 35,386 |
|
| Net income attributable to noncontrolling interest in subsidiary | — |
| | — |
| | — |
| | — |
| | — |
| | — |
| | — |
| | 1,787 |
| | 1,787 |
|
| Other comprehensive loss | — |
| | — |
| | — |
| | (11,398 | ) | | — |
| | — |
| | (11,398 | ) | | — |
| | (11,398 | ) |
| Common stock dividends of $0.34 per share | — |
| | — |
| | (23,841 | ) | | — |
| | — |
| | — |
| | (23,841 | ) | | — |
| | (23,841 | ) |
| Dividend distribution to owners of noncontrolling interest in subsidiary | — |
| | — |
| | — |
| | — |
| | — |
| | — |
| | — |
| | (1,195 | ) | | (1,195 | ) |
| Compensation under recognition and retention plan | — |
| | 1,393 |
| | — |
| | — |
| | — |
| | — |
| | 1,393 |
| | — |
| | 1,393 |
|
| Common stock held by ESOP committed to be released (42,252 shares) | — |
| | (2,281 | ) | | — |
| | — |
| | 2,281 |
| | 230 |
| | 230 |
| | — |
| | 230 |
|
| Balance at December 31, 2013 | $ | 757 |
| | $ | 617,538 |
| | $ | 64,903 |
| | $ | (7,915 | ) | | $ | (59,826 | ) | | $ | (1,590 | ) | | $ | 613,867 |
| | $ | 4,304 |
| | $ | 618,171 |
|
|
| | | | | | | | | | | | | | | | | | | | | | | | | | | | | | | | | | | |
| | Common Stock | | Additional Paid-in Capital | | Retained Earnings* | | Accumulated Other Comprehensive (Loss) Income | | Treasury Stock | | Unallocated Common Stock Held by ESOP | | Total Brookline Bancorp, Inc. Stockholders' Equity* | | Noncontrolling Interest in Subsidiary | | Total Stockholders' Equity* |
| | (In Thousands) |
| Balance at December 31, 2014 | $ | 757 |
| | $ | 617,475 |
| | $ | 84,860 |
| | $ | (1,622 | ) | | $ | (58,282 | ) | | $ | (1,370 | ) | | $ | 641,818 |
| | $ | 4,787 |
| | $ | 646,605 |
|
| Net income attributable to Brookline Bancorp, Inc. | — |
| | — |
| | 49,782 |
| | — |
| | — |
| | — |
| | 49,782 |
| | — |
| | 49,782 |
|
| Net income attributable to noncontrolling interest in subsidiary | — |
| | — |
| | — |
| | — |
| | — |
| | — |
| | — |
| | 2,586 |
| | 2,586 |
|
| Issuance of noncontrolling units | — |
| | — |
| | — |
| | — |
| | — |
| | — |
| | — |
| | 65 |
| | 65 |
|
| Other comprehensive income | — |
| | — |
| |
|
| | (854 | ) | | — |
| | — |
| | (854 | ) | | — |
| | (854 | ) |
| Common stock dividends of $0.355 per share | — |
| | — |
| | (24,967 | ) | | — |
| | — |
| | — |
| | (24,967 | ) | | — |
| | (24,967 | ) |
| Dividend distribution to owners of noncontrolling interest in subsidiary | — |
| | — |
| | — |
| | — |
| | — |
| | — |
| | — |
| | (1,437 | ) | | (1,437 | ) |
| Compensation under recognition and retention plan | — |
| | (763 | ) | | — |
| | — |
| | 2,074 |
| | — |
| | 1,311 |
| | — |
| | 1,311 |
|
| Common stock held by ESOP committed to be released (38,316 shares) | — |
| | 187 |
| | — |
| | — |
| | — |
| | 208 |
| | 395 |
| | — |
| | 395 |
|
| Balance at December 31, 2015 | $ | 757 |
| | $ | 616,899 |
| | $ | 109,675 |
| | $ | (2,476 | ) | | $ | (56,208 | ) | | $ | (1,162 | ) | | $ | 667,485 |
| | $ | 6,001 |
| | $ | 673,486 |
|
| | | | | | | | | | | | | | | | | | |
| (*) Previously reported amounts prior to January 1, 2015 have been restated to reflect a retrospective change in accounting principle for investments in qualified affordable housing projects, in accordance with ASU 2014-01. Refer to Note 10, "Other Assets". |
See accompanying notes to consolidated financial statements.
F-7
BROOKLINE BANCORP, INC. AND SUBSIDIARIES
Consolidated Statements of Changes in Stockholders' Equity (Continued)
Year Ended December 31, 2013, 20122015, 2014 and 20112013
| | | | Common Stock | | Additional Paid-in Capital | | Retained Earnings | | Accumulated Other Comprehensive Income | | Treasury Stock | | Unallocated Common Stock Held by ESOP | | Total Brookline Bancorp, Inc. Stockholders' Equity | | Noncontrolling Interest in Subsidiary | | Total Stockholders' Equity | Common Stock | | Additional Paid-in Capital | | Retained Earnings* | | Accumulated Other Comprehensive Income (loss) | | Treasury Stock | | Unallocated Common Stock Held by ESOP | | Total Brookline Bancorp, Inc. Stockholders' Equity* | | Noncontrolling Interest in Subsidiary | | Total Stockholders' Equity* |
| | (In Thousands) | (In Thousands) |
| Balance at December 31, 2011 | $ | 644 |
| | $ | 525,171 |
| | $ | 39,993 |
| | $ | 1,963 |
| | $ | (62,107 | ) | | $ | (2,062 | ) | | $ | 503,602 |
| | $ | 3,400 |
| | $ | 507,002 |
| |
| Balance at December 31, 2013 | | $ | 757 |
| | $ | 617,538 |
| | $ | 65,448 |
| | $ | (7,915 | ) | | $ | (59,826 | ) | | $ | (1,590 | ) | | $ | 614,412 |
| | $ | 4,304 |
| | $ | 618,716 |
|
| Net income attributable to Brookline Bancorp, Inc. | — |
| | — |
| | 37,142 |
| | — |
| | — |
| | — |
| | 37,142 |
| | — |
| | 37,142 |
| — |
| | — |
| | 43,288 |
| | — |
| | — |
| | — |
| | 43,288 |
| | — |
| | 43,288 |
|
| Net income attributable to noncontrolling interest in subsidiary | — |
| | — |
| | — |
| | — |
| | — |
| | — |
| | — |
| | 1,227 |
| | 1,227 |
| — |
| | — |
| | — |
| | — |
| | — |
| | — |
| | — |
| | 2,037 |
| | 2,037 |
|
| Issuance of non-controlling interest | | — |
| | — |
| | — |
| | — |
| | — |
| | — |
| | — |
| | 60 |
| | 60 |
|
| Other comprehensive loss | | — |
| | — |
| | — |
| | 6,293 |
| | — |
| | — |
| | 6,293 |
| | — |
| | 6,293 |
|
| Common stock dividends of $0.34 per share | | — |
| | — |
| | (23,876 | ) | | — |
| | — |
| | — |
| | (23,876 | ) | | — |
| | (23,876 | ) |
| Dividend distribution to owners of noncontrolling interest in subsidiary | — |
| | — |
| | — |
| | — |
| | — |
| | — |
| | — |
| | (915 | ) | | (915 | ) | — |
| | — |
| | — |
| | — |
| | — |
| | — |
| | — |
| | — |
| | (1,195 | ) |
| Issuance of shares of common stock (10,997,840 shares) | 113 |
| | 92,709 |
| | — |
| | — |
| | — |
| | — |
| | 92,822 |
| | — |
| | 92,822 |
| |
| Other comprehensive income | — |
| | — |
| | — |
| | 1,520 |
| | — |
| | — |
| | 1,520 |
| | — |
| | 1,520 |
| |
| Common stock dividends of $0.34 per share | — |
| | — |
| | (23,777 | ) | | — |
| | — |
| | — |
| | (23,777 | ) | | — |
| | (23,777 | ) | |
| Compensation under recognition and retention plans | — |
| | 546 |
| | — |
| | — |
| | — |
| | — |
| | 546 |
| | — |
| | 546 |
| — |
| | (339 | ) | | — |
| | — |
| | 1,544 |
| | — |
| | 1,205 |
| | (1,614 | ) | | (409 | ) |
| Common stock held by ESOP committed to be released (44,292 shares) | — |
| | — |
| | — |
| | — |
| | — |
| | 242 |
| | 242 |
| | — |
| | 242 |
| |
| Balance at December 31, 2012 | $ | 757 |
| | $ | 618,426 |
| | $ | 53,358 |
| | $ | 3,483 |
| | $ | (62,107 | ) | | $ | (1,820 | ) | | $ | 612,097 |
| | $ | 3,712 |
| | $ | 615,809 |
| |
| Common stock held by ESOP committed to be released (40,284 shares) | | — |
| | 276 |
| | — |
| | — |
| | — |
| | 220 |
| | 496 |
| | — |
| | 496 |
|
| Balance at December 31, 2014 | | $ | 757 |
| | $ | 617,475 |
| | $ | 84,860 |
| | $ | (1,622 | ) | | $ | (58,282 | ) | | $ | (1,370 | ) | | $ | 641,818 |
| | $ | 4,787 |
| | $ | 646,605 |
|
| | | | | | | | | | | | | | | | | | | |
| (*) Previously reported amounts prior to January 1, 2015 have been restated to reflect a retrospective change in accounting principle for investments in qualified affordable housing projects, in accordance with ASU 2014-01. Refer to Note 10, "Other Assets". | | (*) Previously reported amounts prior to January 1, 2015 have been restated to reflect a retrospective change in accounting principle for investments in qualified affordable housing projects, in accordance with ASU 2014-01. Refer to Note 10, "Other Assets". |
See accompanying notes to consolidated financial statements.
F-8
BROOKLINE BANCORP, INC. AND SUBSIDIARIES
Consolidated Statements of Changes in Stockholders' Equity (Continued)
Year Ended December 31, 2013, 20122015, 2014 and 20112013
|
| | | | | | | | | | | | | | | | | | | | | | | | | | | | | | | | | | | |
| | Common Stock | | Additional Paid-in Capital | | Retained Earnings | | Accumulated Other Comprehensive Income | | Treasury Stock | | Unallocated Common Stock Held by ESOP | | Total Brookline Bancorp, Inc. Stockholders' Equity | | Noncontrolling Interest in Subsidiary | | Total Stockholders' Equity |
| | (In Thousands) |
| Balance at December 31, 2010 | $ | 644 |
| | $ | 524,515 |
| | $ | 32,357 |
| | $ | 2,348 |
| | $ | (62,107 | ) | | $ | (2,314 | ) | | $ | 495,443 |
| | $ | 2,505 |
| | $ | 497,948 |
|
| Net income attributable to Brookline Bancorp, Inc. | — |
| | — |
| | 27,600 |
| | — |
| | — |
| | — |
| | 27,600 |
| | — |
| | 27,600 |
|
| Net income attributable to noncontrolling interest in subsidiary | — |
| | — |
| | — |
| | — |
| | — |
| | — |
| | — |
| | 1,219 |
| | 1,219 |
|
| Dividend distribution to owners of noncontrolling interest in subsidiary | — |
| | — |
| | — |
| | — |
| | — |
| | — |
| | — |
| | (585 | ) | | (585 | ) |
| Issuance of units of ownership to minority owners of subsidiary | — |
| | — |
| | — |
| | — |
| | — |
| | — |
| | — |
| | 102 |
| | 102 |
|
| Minority owners' interest in deferred tax asset related to subsidiary | — |
| | — |
| | — |
| | — |
| | — |
| | — |
| | — |
| | 159 |
| | 159 |
|
| Other comprehensive loss | — |
| | — |
| | — |
| | (385 | ) | | — |
| | — |
| | (385 | ) | | — |
| | (385 | ) |
| Common stock dividends of $0.34 per share | — |
| | — |
| | (19,964 | ) | | — |
| | — |
| | — |
| | (19,964 | ) | | — |
| | (19,964 | ) |
| Expense of stock options granted | — |
| | 47 |
| | — |
| | — |
| | — |
| | — |
| | 47 |
| | — |
| | 47 |
|
| Income tax benefit from vesting of recognition and retention plan shares and dividend distributions on allocated ESOP shares | — |
| | 79 |
| | — |
| | — |
| | — |
| | — |
| | 79 |
| | — |
| | 79 |
|
| Compensation under recognition and retention plans | — |
| | 364 |
| | — |
| | — |
| | — |
| | — |
| | 364 |
| | — |
| | 364 |
|
| Common stock held by ESOP committed to be released (46,207 shares) | — |
| | 166 |
| | — |
| | — |
| | — |
| | 252 |
| | 418 |
| | — |
| | 418 |
|
| Balance at December 31, 2011 | $ | 644 |
| | $ | 525,171 |
| | $ | 39,993 |
| | $ | 1,963 |
| | $ | (62,107 | ) | | $ | (2,062 | ) | | $ | 503,602 |
| | $ | 3,400 |
| | $ | 507,002 |
|
|
| | | | | | | | | | | | | | | | | | | | | | | | | | | | | | | | | | | |
| | Common Stock | | Additional Paid-in Capital | | Retained Earnings* | | Accumulated Other Comprehensive Income | | Treasury Stock | | Unallocated Common Stock Held by ESOP | | Total Brookline Bancorp, Inc. Stockholders' Equity* | | Noncontrolling Interest in Subsidiary | | Total Stockholders' Equity* |
| | (In Thousands) |
| Balance at December 31, 2012 | $ | 757 |
| | $ | 618,426 |
| | $ | 53,274 |
| | $ | 3,483 |
| | $ | (62,107 | ) | | $ | (1,820 | ) | | $ | 612,013 |
| | $ | 3,712 |
| | $ | 615,725 |
|
| Net income attributable to Brookline Bancorp, Inc. | — |
| | — |
| | 36,015 |
| | — |
| | — |
| | — |
| | 36,015 |
| | — |
| | 36,015 |
|
| Net income attributable to noncontrolling interest in subsidiary | — |
| | — |
| | — |
| | — |
| | — |
| | — |
| | — |
| | 1,787 |
| | 1,787 |
|
| Issuance of shares of common stock (10,997,840 shares) | — |
| | — |
| | — |
| | — |
| | — |
| | — |
| | — |
| | — |
| | — |
|
| Other comprehensive income | — |
| | — |
| | — |
| | (11,398 | ) | | — |
| | — |
| | (11,398 | ) | | — |
| | (11,398 | ) |
| Common stock dividends of $0.34 per share | — |
| | — |
| | (23,841 | ) | | — |
| | — |
| | — |
| | (23,841 | ) | | — |
| | (23,841 | ) |
| Dividend distribution to owners of noncontrolling interest in subsidiary | — |
| | — |
| | — |
| | — |
| | — |
| | — |
| | — |
| | (1,195 | ) | | (1,195 | ) |
| Compensation under recognition and retention plans | — |
| | 1,393 |
| | — |
| | — |
| | — |
| | — |
| | 1,393 |
| | — |
| | 1,393 |
|
| Restricted stock awards issued, net of awards surrendered | — |
| | (2,281 | ) | | — |
| | — |
| | 2,281 |
| | — |
| | — |
| | | | — |
|
| Common stock held by ESOP committed to be released (38,306 shares) | — |
| | — |
| | — |
| | — |
| | — |
| | 230 |
| | 230 |
| | — |
| | 230 |
|
| Balance at December 31, 2013 | $ | 757 |
| | $ | 617,538 |
| | $ | 65,448 |
| | $ | (7,915 | ) | | $ | (59,826 | ) | | $ | (1,590 | ) | | $ | 614,412 |
| | $ | 4,304 |
| | $ | 618,716 |
|
| | | | | | | | | | | | | | | | | | |
| (*) Previously reported amounts prior to January 1, 2015 have been restated to reflect a retrospective change in accounting principle for investments in qualified affordable housing projects, in accordance with ASU 2014-01. Refer to Note 10, "Other Assets". |
See accompanying notes to consolidated financial statements.
F-9
BROOKLINE BANCORP, INC. AND SUBSIDIARIES Consolidated Statements of Cash Flows |
| | | | | | | | | | | |
| | Year Ended December 31, |
| | 2013 | | 2012 | | 2011 |
| | (In Thousands) |
| Cash flows from operating activities: | | | | | |
| Net income attributable to Brookline Bancorp, Inc. | $ | 35,386 |
| | $ | 37,142 |
| | $ | 27,600 |
|
| Adjustments to reconcile net income to net cash provided from operating activities: |
| |
| |
|
Net income attributable to noncontrolling interest in subsidiary | 1,787 |
| | 1,227 |
| | 1,219 |
|
| Provision for credit losses | 10,929 |
| | 15,888 |
| | 3,631 |
|
| Origination of loans and leases to be sold | (52,485 | ) | | (101,286 | ) | | (46,555 | ) |
| Proceeds from loans and leases sold | 56,389 |
| | 104,029 |
| | 41,687 |
|
| Proceeds from sales of other real estate owned and other repossessed assets | 11,857 |
| | 1,572 |
| | 1,711 |
|
| Deferred income tax expense | 2,444 |
| | 663 |
| | 784 |
|
| Depreciation of premises and equipment | 6,291 |
| | 3,733 |
| | 2,061 |
|
| Amortization of securities premiums and discounts, net | 3,200 |
| | 4,486 |
| | 2,344 |
|
| Amortization of deferred loan and lease origination costs, net | 7,749 |
| | 10,121 |
| | 9,775 |
|
| Amortization of identified intangible assets | 4,623 |
| | 5,622 |
| | 1,570 |
|
| (Accretion) amortization of acquisition fair value adjustments, net | (6,193 | ) | | (12,121 | ) | | 658 |
|
| Gain on sale of loans and leases held-for-sale | (671 | ) | | (718 | ) | | (392 | ) |
| Gain on sale of loans and leases | — |
| | (1,898 | ) | | — |
|
| Gain on sale of securities | (397 | ) | | (926 | ) | | (80 | ) |
| Gain on sale of other real estate owned and repossessed assets | (2 | ) | | (194 | ) | | — |
|
| Write-down of other real estate owned and repossessed assets | 263 |
| | 73 |
| | 869 |
|
| Compensation under recognition and retention plans | 1,393 |
| | 546 |
| | 364 |
|
| Expense of restricted stock plans, net of income tax | 584 |
| | 625 |
| | 126 |
|
| Loss from investments in affordable housing projects | 1,812 |
| | 694 |
| | 671 |
|
| ESOP shares committed to be released | 230 |
| | 242 |
| | 418 |
|
| Net change in: |
| |
| |
|
| Cash surrender value of bank-owned life insurance | (1,093 | ) | | (1,165 | ) | | — |
|
| Other assets | 5,398 |
| | (11,621 | ) | | (4,097 | ) |
| Accrued expenses and other liabilities | (3,434 | ) | | 2,577 |
| | 1,869 |
|
| Net cash provided from operating activities | 86,060 |
| | 59,311 |
| | 46,233 |
|
| Cash flows from investing activities: |
| |
| |
|
| Proceeds from sales of securities available-for-sale | 1,210 |
| | 166,201 |
| | 124 |
|
| Proceeds from maturities, calls, and principal repayments of securities available-for-sale | 137,275 |
| | 207,512 |
| | 145,374 |
|
| Purchases of securities available-for-sale | (171,231 | ) | | (326,104 | ) | | (45,361 | ) |
| Proceeds from principal repayments of securities held-to-maturity | 2,107 |
| | — |
| | — |
|
| Purchase of restricted-equity and other securities | (5 | ) | | (15,505 | ) | | — |
|
| Proceeds from sales of loans and leases | — |
| | 21,904 |
| | — |
|
| Net increase in loans and leases | (220,021 | ) | | (352,893 | ) | | (273,394 | ) |
| Acquisitions, net of cash and cash equivalents acquired | — |
| | (89,258 | ) | | 5,792 |
|
| Monies in escrow—Bancorp Rhode Island, Inc. acquisition | — |
| | 112,983 |
| | (112,983 | ) |
| Purchase of premises and equipment | (16,443 | ) | | (23,664 | ) | | (19,910 | ) |
BROOKLINE BANCORP, INC. AND SUBSIDIARIES Consolidated Statements of Cash Flows |
| | | | | | | | | | | |
| | Year Ended December 31, |
| | 2015 | | 2014 | | 2013 |
| | (In Thousands) |
| Cash flows from operating activities: | | | | | |
Net income attributable to Brookline Bancorp, Inc. (1) | $ | 49,782 |
| | $ | 43,288 |
| | $ | 36,015 |
|
| Adjustments to reconcile net income to net cash provided from operating activities: |
| |
| |
|
Net income attributable to noncontrolling interest in subsidiary | 2,586 |
| | 2,037 |
| | 1,787 |
|
| Provision for credit losses | 7,451 |
| | 8,477 |
| | 10,929 |
|
| Origination of loans and leases held-for-sale | (74,841 | ) | | (21,365 | ) | | (52,485 | ) |
| Proceeds from sales of loans and leases held-for-sale, net | 64,398 |
| | 34,717 |
| | 56,326 |
|
| Deferred income tax expense | 1,239 |
| | 125 |
| | 2,398 |
|
| Depreciation of premises and equipment | 7,074 |
| | 7,020 |
| | 6,291 |
|
| Amortization of investment securities premiums and discounts, net | 1,841 |
| | 2,656 |
| | 3,200 |
|
| Amortization of deferred loan and lease origination costs, net | 4,775 |
| | 9,890 |
| | 7,749 |
|
| Amortization of identified intangible assets | 2,911 |
| | 3,343 |
| | 4,623 |
|
| Amortization of debt issuance costs | 100 |
| | 29 |
| | — |
|
| Accretion of acquisition fair value adjustments, net | (7,242 | ) | | (11,217 | ) | | (6,193 | ) |
| Gain on sales of investment securities, net | — |
| | (65 | ) | | (397 | ) |
| Gain on sales of loans and leases held-for-sale | (2,208 | ) | | (1,651 | ) | | (794 | ) |
| Gain on sales/disposals of premises and equipment, net | — |
| | (1,502 | ) | | — |
|
| Loss (gain) on sales of OREO and other repossessed assets, net | 102 |
| | 11 |
| | (2 | ) |
| Write-down of OREO and other repossessed assets | 229 |
| | 381 |
| | 263 |
|
| Compensation under recognition and retention plans | 1,276 |
| | 1,205 |
| | 1,393 |
|
| ESOP shares committed to be released | 395 |
| | 496 |
| | 230 |
|
| Net change in: |
| |
| |
|
| Cash surrender value of bank-owned life insurance | (1,049 | ) | | (1,054 | ) | | (1,093 | ) |
Other assets (1) | (5,135 | ) | | (1,700 | ) | | 6,581 |
|
| Accrued expenses and other liabilities | 10,920 |
| | 9,166 |
| | (2,804 | ) |
Net cash provided from operating activities (1) (2) | 64,604 |
| | 84,287 |
| | 74,017 |
|
| | | | | | |
| Cash flows from investing activities: |
| |
| |
|
| Proceeds from sales of investment securities available-for-sale | — |
| | 5,485 |
| | 1,210 |
|
| Proceeds from maturities, calls, and principal repayments of investment securities available-for-sale | 97,771 |
| | 84,091 |
| | 137,275 |
|
| Purchases of investment securities available-for-sale | (63,615 | ) | | (139,866 | ) | | (171,231 | ) |
| Proceeds from maturities, calls, and principal repayments of investment securities held to maturity | 9,579 |
| | 500 |
| | — |
|
| Purchases of investment securities held-to-maturity | (102,847 | ) | | (500 | ) | | — |
|
| Proceeds from redemption of restricted equity securities (FHLBB stock) | 9,924 |
| | — |
| | 2,107 |
|
| Purchase of restricted equity securities | (1,237 | ) | | (8,245 | ) | | (5 | ) |
| Proceeds from sales of loans and leases held-for-investment, net | 273,688 |
| | — |
| | — |
|
| Net increase in loans and leases | (457,460 | ) | | (477,128 | ) | | (219,835 | ) |
| Proceeds from sales of premises and equipment | — |
| | 1,972 |
| | 260 |
|
| Purchase of premises and equipment, net | (4,775 | ) | | (7,782 | ) | | (16,443 | ) |
See accompanying notes to consolidated financial statements.
F-10
BROOKLINE BANCORP, INC. AND SUBSIDIARIES Consolidated Statements of Cash Flows (Continued) |
| | | | | | | | | | | |
| | Year Ended December 31, |
| | 2013 | | 2012 | | 2011 |
| | (In Thousands) |
| Sale of premises and equipment | 260 |
| | — |
| | — |
|
| Proceeds from redemption of restricted securities (FHLBB stock) | — |
| | 2,003 |
| | — |
|
| Net cash used in investing activities | (266,848 | ) | | (296,821 | ) | | (300,358 | ) |
| Cash flows from financing activities: |
| |
| |
|
| Increase in demand checking, NOW, savings and money market accounts | $ | 295,020 |
| | $ | 312,644 |
| | $ | 273,693 |
|
| Decrease in certificates of deposit | (76,620 | ) | | (80,879 | ) | | (44,734 | ) |
| Proceeds from FHLBB advances | 2,363,200 |
| | 3,007,883 |
| | 3,973,549 |
|
| Repayment of FHLBB advances | (2,381,917 | ) | | (2,992,101 | ) | | (3,865,689 | ) |
| Proceeds from payment of federal funds purchased | — |
| | — |
| | (13,000 | ) |
| Repayment of subordinated debt | (3,000 | ) | | — |
| | (13,000 | ) |
| (Decrease) increase in other borrowed funds | (16,394 | ) | | 25,023 |
| | 4,018 |
|
| Increase in mortgagors' escrow accounts | 943 |
| | 433 |
| | 123 |
|
| Payment of dividends on common stock | (23,841 | ) | | (23,777 | ) | | (19,964 | ) |
| Payment of dividends to owners of noncontrolling interest in subsidiary | (1,195 | ) | | (915 | ) | | (585 | ) |
| Proceeds from issuance of additional ownership interest in subsidiary | — |
| | — |
| | 102 |
|
| Net cash provided from financing activities | 156,196 |
| | 248,311 |
| | 294,513 |
|
| Net (decrease) increase in cash and cash equivalents | (24,592 | ) | | 10,801 |
| | 40,388 |
|
| Cash and cash equivalents at beginning of year | 117,097 |
| | 106,296 |
| | 65,908 |
|
| Cash and cash equivalents at end of year | $ | 92,505 |
| | $ | 117,097 |
| | $ | 106,296 |
|
| |
| |
| |
|
| Supplemental disclosure of cash flow information: |
| |
| |
|
| Cash paid during the year for: |
| |
| |
|
| Interest on deposits, borrowed funds and subordinated debt | $ | 34,303 |
| | $ | 40,682 |
| | $ | 32,029 |
|
| Income taxes | 19,137 |
| | 20,570 |
| | 20,607 |
|
| Non-cash investing activities: |
| |
| |
|
| Transfer from loans to loan held-for-sale | $ | 13,372 |
| | $ | — |
| | $ | — |
|
| Transfer from loans to other real estate owned | 12,205 |
| | 386 |
| | 2,536 |
|
| Acquisition of Bancorp Rhode Island: |
| |
| |
|
| Fair value of assets acquired, net of cash and cash equivalents acquired | $ | — |
| | $ | 1,571,817 |
| | $ | — |
|
| Fair value of liabilities assumed | — |
| | 1,481,535 |
| | — |
|
| Acquisition of First Ipswich Bancorp: |
| |
| |
|
| Fair value of assets acquired, net of cash and cash equivalents acquired | $ | — |
| | $ | — |
| | $ | 246,186 |
|
| Fair value of liabilities assumed | — |
| | — |
| | 251,978 |
|
BROOKLINE BANCORP, INC. AND SUBSIDIARIES Consolidated Statements of Cash Flows (Continued) |
| | | | | | | | | | | |
| | Year Ended December 31, |
| | 2015 | | 2014 | | 2013 |
| | (In Thousands) |
Proceeds from sales of OREO and other repossessed assets (2) | 7,152 |
| | 12,317 |
| | 11,857 |
|
Net cash used for investing activities (2) | (231,820 | ) | | (529,156 | ) | | (254,805 | ) |
| | | | | | |
| Cash flows from financing activities: |
| |
| |
|
| Increase in demand checking, NOW, savings and money market accounts | 206,748 |
| | 111,060 |
| | 295,020 |
|
| Increase (decrease) in certificates of deposit | 141,338 |
| | 12,271 |
| | (76,620 | ) |
| Proceeds from FHLBB advances | 4,018,000 |
| | 2,214,931 |
| | 2,363,200 |
|
| Repayment of FHLBB advances | (4,157,392 | ) | | (1,976,848 | ) | | (2,381,917 | ) |
| Proceeds from issuance of subordinated notes | — |
| | 73,495 |
| | — |
|
| Repayment of subordinated debentures | — |
| | — |
| | (3,000 | ) |
| (Decrease) increase in other borrowed funds, net | (1,388 | ) | | 4,996 |
| | (16,394 | ) |
| (Decrease) increase in mortgagors' escrow accounts, net | (985 | ) | | 612 |
| | 943 |
|
| Payment of dividends on common stock | (24,967 | ) | | (23,876 | ) | | (23,841 | ) |
| Proceeds from issuance of noncontrolling units | 65 |
| | 60 |
| | — |
|
| Payment of dividends to owners of noncontrolling interest in subsidiary | (1,437 | ) | | (1,614 | ) | | (1,195 | ) |
| Net cash provided from financing activities | 179,982 |
| | 415,087 |
| | 156,196 |
|
| Net increase (decrease) in cash and cash equivalents | 12,766 |
| | (29,782 | ) | | (24,592 | ) |
| Cash and cash equivalents at beginning of year | 62,723 |
| | 92,505 |
| | 117,097 |
|
| Cash and cash equivalents at end of year | $ | 75,489 |
| | $ | 62,723 |
| | $ | 92,505 |
|
| |
| |
| |
|
| Supplemental disclosure of cash flow information: |
| |
| |
|
| Cash paid during the year for: |
| |
| |
|
| Interest on deposits, borrowed funds and subordinated debt | $ | 35,522 |
| | $ | 31,303 |
| | $ | 34,303 |
|
| Income taxes | 26,694 |
| | 21,207 |
| | 19,137 |
|
| Non-cash investing activities: |
| |
| |
|
| Transfer from loans and leases to loan and leases held-for-sale | $ | — |
| | $ | — |
| | $ | 13,372 |
|
| Transfer from loans to other real estate owned | 7,370 |
| | 12,587 |
| | 12,205 |
|
| | | | | | |
| (1) Previously reported amounts prior to January 1, 2015 have been restated to reflect a retrospective change in accounting principle for investments in qualified affordable housing projects, in accordance with ASU 2014-01. Refer to Note 10, "Other Assets". |
| (2) Cash flows resulting from the sales of OREO and other repossessed assets which had been recorded as cash flows from operating activities in prior filings have been revised to cash flows from investing activities in 2015 to properly reflect the cash flow activity. There is no impact to the Company's net income or related per share amounts for the year ended December 31, 2015, 2014, and 2013. |
See accompanying notes to consolidated financial statements.
F-11
BROOKLINE BANCORP, INC. AND SUBSIDIARIES
Notes to Consolidated Financial Statements
December 31, 2013, 20122015, 2014 and 20112013
(1) Basis of Presentation
Overview
Brookline Bancorp, Inc. (the "Company") is a bank holding company (within the meaning of the Bank Holding Company Act of 1956, as amended) and the parent of Brookline Bank, a Massachusetts-chartered savings bank; Bank Rhode Island ("BankRI"), a Rhode Island-chartered bank;financial institution; and First Ipswich Bank ("First Ipswich" and formerly known as the First National Bank of Ipswich)), a Massachusetts-chartered trust company (collectively referred to as the "Banks"). The Banks are all members of the Federal Reserve System. The Company is also the parent of Brookline Securities Corp. ("BSC"). The Company's primary business is to provide commercial, business and retail banking services to its corporate, municipal and individual customers through its banks and non-bank subsidiaries.
Brookline Bank, which includes its wholly-owned subsidiaries BBS Investment Corp. and, Longwood Securities Corp., and its 84.8%84.5%-owned subsidiary, Eastern Funding LLC ("Eastern Funding"), operates 2325 full-service banking offices in Brookline, Massachusetts, and the greater Boston metropolitan area. BankRI, which includes its wholly-owned subsidiaries, Acorn Insurance Agency, BRI InvestmentRealty Corp., Macrolease Corporation ("Macrolease"), Acorn Insurance AgencyBRI Investment Corp. and its wholly-owned subsidiary, BRI RealtyMSC Corp., operates 1819 full-service banking offices in the greater Providence County, Kent County and Washington County, Rhode Island.area. First Ipswich, which includes its wholly-owned subsidiaries, First Ipswich Securities II Corp., First Ipswich Insurance Agency and FNBI Realty,First Ipswich Securities II Corp. , operates 65 full-service banking offices on the north shore of eastern Massachusetts and in the Boston metropolitan area.Massachusetts.
The Company's activities include acceptance of commercial, business, municipal and retail deposits, origination of mortgage loans on commercial and residential real estate located principally in Massachusetts and Rhode Island, origination of commercial loans and leases to small- and mid-sized businesses, origination of indirect automobile loans, investment in debt and equity securities, and the offering of cash management and investment advisory services. The Company also provides specialty equipment financing through its subsidiaries Eastern Funding, which is based in New York City, New York, and Macrolease, which is based in Plainview, New York. The Company ceased the origination of indirect automobile loans in December 2014.
The Company and the Banks are subject to competition from other financial and non-financial institutions and are supervised, examined and regulated by the Board of Governors of the Federal Reserve System ("FRB"). As Massachusetts-chartered member banks,savings bank and trust company, Brookline Bank and First Ipswich, respectively, are also subject to regulation under the laws of the Commonwealth of Massachusetts and the jurisdiction of the Massachusetts Division of Banks. As a Rhode Island-chartered financial institution, BankRI is subject to regulation under the laws of the State of Rhode Island and the jurisdiction of the Banking Division of the Rhode Island Department of Business Regulation.
The Federal Deposit Insurance Corporation ("FDIC") offers insurance coverage on all deposits up to $250,000 per depositor for all threeat each of the Banks. As FDIC-insured depository institutions, all threethe Banks are also secondarily subject to supervision, examination and regulation by the FDIC. Additionally, as a Massachusetts-chartered savings bank, Brookline Bank is also insured by the Depositors Insurance Fund ("DIF"), a private industry-sponsored insurance company. The DIF insures savings bank deposits in excess of the FDIC insurance limits. As such, Brookline Bank offers 100% insurance on all deposits as a result of a combination of insurance from the FDIC and the DIF. Brookline Bank is required to file reports with the DIF.
Basis of Financial Statement Presentation
The Company's consolidated financial statements have been prepared in conformity with U.S. generally accepted accounting principles ("GAAP") as set forth by the Financial Accounting Standards Board ("FASB") in its Accounting Standards Codification and through the rules and interpretive releases of the Securities and Exchange Commission ("SEC") under the authority of federal securities laws.
The consolidated financial statements include the accounts of the Company and its wholly-owned subsidiaries. All significant intercompany transactions and balances are eliminated in consolidation.
In preparing these consolidated financial statements, managementManagement is required to make significant estimates and assumptions that affect the reported amounts of assets, liabilities, income, expenses and disclosure of contingent assets and liabilities. Actual results could differ from those estimates based upon changing conditions, including economic conditions and future events. Material estimates that are particularly susceptible to significant change in the near-term include the determination of the allowance for loan and lease losses, the determination of fair market values of assets and liabilities, including acquired loans, the review of goodwill and intangibles for impairment and the review of deferred tax assets for valuation allowance.
BROOKLINE BANCORP, INC. AND SUBSIDIARIES
Notes to Consolidated Financial Statements (Continued)
December 31, 2015, 2014, 2013 2012 and 2011
The judgments used by managementManagement in applying these critical accounting policies may be affected by a further and prolonged deterioration in the economic environment, which may result in changes to future financial results. For example, subsequent evaluations of the loan and lease portfolio, in light of the factors then prevailing, may result in significant changes in the allowance for loan and lease losses in future periods, and the inability to collect outstanding principal may result in increased loan and lease losses.
Reclassification
Certain previously reported amounts have been reclassified to conform to the current year's presentation. These reclassifications did not changeExcept for the adoption of Accounting Standards Update ("ASU") 2014-01, there were no changes to stockholders' equity orand net income reported. Refer to Note 10, "Other Assets" for the impact the adoption had on the Company's financial statements.
Cash and Cash Equivalents
For purposes of reporting asset balances and cash flows, cash and cash equivalents includes cash on hand and due from banks (including cash items in process of clearing), interest-bearing deposits with banks, federal funds sold, money market mutual funds and other short-term investments with original maturities of three months or less.
Investment Securities
Investment securities, other than those reported as short-term investments, are classified at the time of purchase as "available for sale," "held to maturity,"available-for-sale," or "trading."held-to-maturity." Classification is periodically re-evaluated for consistency with the Company's goals and objectives. Equity investments in the Federal Home Loan Bank of Boston ("FHLBB") and the Federal Reserve Bank of Boston are discussed in more detail in Note 5, "Restricted Equity Securities."
Investment Securities Available-for-Sale and Held-to-Maturity
SecuritiesInvestment securities for which the Company has the positive intent and ability to hold to maturity are classified as held-to-maturity and carried at amortized cost. Those investment securities held for indefinite periods of time but not necessarily to maturity are classified as available-for-sale. SecuritiesInvestment securities held for indefinite periods of time include investment securities that managementManagement intends to use as part of its asset/liability, liquidity, and/or capital management strategies and may be sold in response to changes in interest rates, maturities, asset/liability mix, liquidity needs, regulatory capital needs or other business factors. SecuritiesInvestment securities available-for-sale are carried at estimated fair value, primarily obtained from a third-party pricing service, with unrealized gains and losses reported on an after-tax basis in stockholders' equity as accumulated other comprehensive income or loss. As of December 31, 20132015 and 2012,2014, the Company did not make any adjustments to the prices provided by the third-party pricing service.
Security transactions are recorded on the trade date. Realized gains and losses are determined using the specific identification method and are recorded in non-interest income. Interest and dividends on securities are recorded using the accrual method. Premiums and discounts on securities are amortized or accreted into interest income using the level-yield method over the remaining period to contractual maturity, adjusted for the effect of actual prepayments in the case of mortgage-backed securities ("MBSs") and collateralized mortgage obligations ("CMOs"). These estimates of prepayment assumptions are made based upon the actual performance of the underlying security, current interest rates, the general market consensus regarding changes in mortgage interest rates, the contractual repayment terms of the underlying loans, the priority rights of the investors to the cash flows from the mortgage securities and other economic conditions. When differences arise between anticipated prepayments and actual prepayments, the effective yield is recalculated to reflect actual payments to date and anticipated future payments. Unamortized premium or discount is adjusted to the amount that would have existed had the new effective yield been applied since purchase, with a corresponding charge or credit to interest income.
Management evaluates securities for other-than-temporary impairment ("OTTI") on a periodic basis. Factors considered in determining whether an impairment is other-than-temporaryOTTI include: (1) the length of time and the extent to which the fair value has been less than amortized cost, (2) projected future cash flows, (3) the financial condition and near-term prospects of the issuerissuers, and (3)(4) the intent and ability of the Company to hold the investment for a period of time sufficient to allow for any anticipated recovery in fair value. The Company records an other-than-temporaryOTTI loss in an amount equal to the entire difference between the fair value and amortized cost ifif: (1) the Company intends to sell an impaired investment security, (2) it is more likely than not that the Company will be required to sell the investment security before its amortized costs, or (3) for debt securities, the present value of expected future cash flows is not sufficient to recover the entire amortized cost basis. If aan investment security is determined to be other-than-temporarily impaired but the Company does not intend to sell the security, only the credit portion of the estimated loss is recognized in earnings, with the other portion of the loss recognized in other comprehensive income.
BROOKLINE BANCORP, INC. AND SUBSIDIARIES
Notes to Consolidated Financial Statements (Continued)
December 31, 2015, 2014, 2013 2012 and 2011
to be OTTI but the Company does not intend to sell the investment security, only the credit portion of the estimated loss is recognized in earnings, with the non credit portion of the loss recognized in other comprehensive income.
Restricted Equity Securities
The Company owns investmentsinvests in the stock of the FHLBB, the Federal Reserve Bank of Boston and a small amount of other restricted securities. No ready market exists for these stocks, and they have no quoted market values. The Banks, as members of the FHLBB, are required to maintain investments in the capital stock of the FHLBB equal to their membership base investments plus an activity-based investment determined according to the Banks' level of outstanding FHLBB advances. Federal Reserve Bank of Boston stock was purchased at par and is redeemable at par. The Company reviews for impairment of these securities based on the ultimate recoverability of the cost basis in the stock. AtAs of December 31, 2013,2015 and 2014, no impairment has been recognized.
Loans
Originated Loans
Loans the Company originates for the portfolio, and for which it has the intent and ability to hold to maturity, are reported at amortized cost, inclusive of deferred loan origination fees and expenses, less unadvanced funds due borrowers on loans and the allowance for loan and lease losses.
Interest income on loans and leases originated for the portfolio is accrued on unpaid principal balances as earned. Loan origination fees and direct loan origination costs are deferred, and the net fee or cost is recognized in interest income using the interest method. Deferred loan origination costs include payments to dealers originating indirect automobile loans. The difference between the rate charged by a dealer to originate an indirect automobile loan and the "buy rate," or the rate earned by the Company, is referred to as the "spread." The computed dollar value of the spread paid to a dealer is amortized as a charge to income over the life of the loan on a level-yield basis. Deferred amounts are recognized for fixed-rate loans over the contractual life of the loans and for adjustable-rate loans over the period of time required to adjust the contractual interest rate to a yield approximating a market rate at the origination date. If a loan is prepaid, the unamortized portion of the loan origination costs, including those indirect-automobile-relatedthird party referral related costs not subject to rebate from the dealer, is charged to income.
Loans and Leases Held-for-Sale
Management identifies and designates certain newly originated loans and leases for sale to specific financial institutions, subject to the underwriting criteria of those financial institutions. These loans and leases are held for sale and are carried at the lower of cost or market as determined in the aggregate. Deferred loan fees and costs are included in the determination of the gain or loss on sale.
Acquired Loans
Acquired loans that have evidence of deterioration of credit quality since origination and for which it is probable, at acquisition, that the CorporationCompany will be unable to collect all contractually required payments receivable are initially recorded at fair value (as determined by the present value of expected future cash flows) with no valuation allowance. The difference between the undiscounted cash flows expected at acquisition and the recorded fair value of the loan, or the “accretable yield,” is recognized as interest income on a level-yield method over the life of the loan. Contractually required payments for interest and principal that exceed the undiscounted cash flows expected at acquisition, or the “nonaccretable difference,” are not recognized as a yield adjustment or as a loss accrual or a valuation allowance. Increases in expected cash flows subsequent to the initial investment are recognized prospectively through adjustment of the yield on the loan over its remaining life. Decreases in expected cash flows are recognized as impairment. Valuation allowances on these impaired loans reflect only losses incurred after the acquisition (meaning the present value of all cash flows expected at acquisition that ultimately are not to be received).
Nonperforming Loans
Nonaccrual Loans
Accrual of interest on loans generally is discontinued when contractual payment of principal or interest becomes past due 90 days or, if in management'sManagement's judgment, reasonable doubt exists as to the full timely collection of interest. Exceptions may be made if the loan has matured and is in the process of renewal or is well-secured and in the process of collection. When a loan is placed on nonaccrual status, interest accruals cease and uncollected accrued interest is reversed and charged against current interest income. Interest payments on nonaccrual loans are generally applied to principal. If collection of the principal is reasonably assured, interest payments are recognized as income on the cash basis. Loans are generally returned to accrual status
BROOKLINE BANCORP, INC. AND SUBSIDIARIES
Notes to Consolidated Financial Statements (Continued)
December 31, 2015, 2014, 2013
when principal and interest payments are current, full collectability of principal and interest is reasonably assured and a consistent record of at least six consecutive months of performance has been achieved.
BROOKLINE BANCORP, INC. AND SUBSIDIARIES
Notes to Consolidated Financial Statements (Continued)
December 31, 2013, 2012 and 2011
Impaired Loans
A loan is considered to be impaired when, based on current information and events, it is probable that the Company will be unable to collect all amounts due (both interest and principal) according to the contractual terms of the loan agreement. Smaller-balance, homogeneous loans that are evaluated collectively for impairment, such as indirect automobile, residential, home equity and other consumer loans are specifically excluded from the impaired loan portfolio except where the loan is classified as a troubled debt restructuring. The Company has defined the population of impaired loans to include nonaccrual loans and troubled debt restructured ("TDR") loans.
When the ultimate collectability of the total principal of an impaired loan or lease is in doubt and the loan is on nonaccrual status, all payments are applied to principal, under the cost recovery method. When the ultimate collectability of the total principal of an impaired loan or lease is not in doubt and the loan or lease is on nonaccrual status, contractual interest is credited to interest income when received, under the cash basis method.
The value of an impaired loan is measured based upon the present value of expected future cash flows discounted at the loan's effective interest rate, or the fair value of the collateral if the loan is collateral-dependent and its payment is expected solely based on the underlying collateral. For impaired loans deemed collateral dependent, where impairment is measured using the fair value of the collateral, the Company will either obtain a new appraisal or use another available source of collateral assessment to determine a reasonable estimate of the fair value of the collateral.
Interest collected on impaired loans is either applied against principal or reported as income according to management'sManagement's judgment as to the collectability of principal. If managementManagement does not consider a loan ultimately collectible within an acceptable time frame, payments are applied as principal to reduce the loan balance. If full collection of the remaining recorded investment should subsequently occur, interest receipts are recorded as interest income on a cash basis.
Troubled Debt Restructured Loans
In cases where a borrower experiences financial difficulties and the Company makes certain concessionary modifications to contractual terms, the loan is classified as a troubled debt restructuredTDR loan. In determining whether a debtor is experiencing financial difficulties, the Company considers, among other factors, ifwhether the debtor is in payment default or is likely to be in payment default in the foreseeable future without the modification, if the debtor declared or is in the process of declaring bankruptcy, there is substantial doubt that the debtor will continue as a going concern, the debtor's entity-specific projected cash flows will not be sufficient to service its debt, or the debtor cannot obtain funds from sources other than the existing creditors at market terms for debt with similar risk characteristics.
Large groups of small-balance homogeneous loans such as residential real estate, residential construction, home equity and other consumer portfolios are collectively evaluated for impairment. As such, the Company does not typically identify individual loans within these groupings as impaired loans or for impairment evaluation and disclosure. However, the Company evaluates all TDRs for impairment on an individual loan basis regardless of loan type.
Modifications may include interest-rate reductions, short-term (defined as one year or less) changes in payment structure to interest-only payments, short-term extensions of the loan's original contractual term, or less frequently, principal forgiveness, interest capitalization, forbearance and other actions intended to minimize the economic loss and to avoid foreclosure or repossession of collateral. Typically, troubled debt restructuringsTDRs are placed on nonaccrual status and reported as nonperforming loans. Generally, a nonaccrual loan that is restructured remains on nonaccrual for a period of six months to demonstrate that the borrower can meet the restructured terms; however, performance prior to the restructuring, or significant events that coincide with the restructuring, are considered in assessing whether the borrower can meet the new terms and may result in the loan being returned to accrual status at the time of restructuring or after a shorter performance period. If the borrower's ability to meet the revised payment schedule is not reasonably assured, the loan remains classified as a nonaccrual loan.
Loans restructured at an interest rate equal to or greater than that of a new loan with comparable risk at the time of the loan agreement is modified may be excluded from restructured loan disclosures in years subsequent to the restructuring if they are in compliance with the modified terms.
Allowance for Loan and Lease Losses
BROOKLINE BANCORP, INC. AND SUBSIDIARIES
Notes to Consolidated Financial Statements (Continued)
December 31, 2015, 2014, 2013
Management has established a methodology to determine the adequacy of the allowance for loan and lease losses that assesses the risks and losses inherent in the loan and lease portfolio. Additions to the allowance for loan and lease losses are made by charges to the provision for credit losses. Losses on loans and leases are charged off against the allowance when all or a portion of a loan or lease is considered uncollectible. Subsequent recoveries on loans previously charged off, if any, are credited to the allowance when realizedrealized.
The allowance for loan and lease losses consists of general, specific and unallocated reserves and reflects management's estimate of probable loan and lease losses inherent in the loan portfolio at the balance sheet date. Management uses a consistent and systematic process and methodology to evaluate the adequacy of the allowance for loan and lease losses on a quarterly basis. TheFor purposes of determining the allowance is calculatedfor loan and lease losses, the Company has segmented certain loans and leases in the portfolio by loan category, includingproduct type into the following segments: (1) commercial real estate loans, (2) commercial loans and leases, (3) and consumer loans. Portfolio segments are further disaggregated into classes based on the associated risks within the segments. Commercial real estate loans are divided into three classes: commercial real estate mortgage loans, multi-family mortgage loans, and construction loans. Commercial loans and leases are divided into three classes: commercial loans which includes taxi medallion loans, equipment financing, and loans to condominium associations. Consumer loans are divided into four classes: residential mortgage loans, home equity loans, indirect automobile loans, and other consumer loans; with each of these categories further segregated into classes.loans. A formula-based credit evaluation approach is applied to each group, coupled with an analysis of certain loans for impairment.
The process to determine the allowance for loan and lease losses requires management to exercise considerable judgment regarding the risk characteristics of the loan portfolio categories and the effect of relevant internal and external factors. The
BROOKLINE BANCORP, INC. AND SUBSIDIARIES
Notes to Consolidated Financial Statements (Continued)
December 31, 2013, 2012 and 2011
reasonableness of prior judgments is evaluated on a quarterly basis by comparison of estimated loan and lease losses to loan and lease losses actually incurred. In addition, various regulatory agencies, as an integral part of their examination process, periodically review the Company's allowance for loan and lease losses. Such agencies may require the Company to change the allowance based on their judgments of information available to them at the time of their examination.
General Allowance
The general allowance related to loans collectively evaluated for impairment is determined using a formula-based approach utilizing the risk ratings of individual credits and loss factors derived from historic portfolio loss rates. Otherrates, which include estimates of incurred losses over an estimated loss emergence period (“LEP”). The LEP was generated utilizing a charge-off look-back analysis which studied the time from the first indication of elevated risk of repayment (or other early event indicating a problem) to eventual charge-off to support the LEP considered in the allowance calculation. This reserving methodology established the approximate number of months of LEP that represents incurred losses for each portfolio. In addition to quantitative measures, relevant qualitative factors include, but are not limited to, historicto: (1) levels and trends in loan charge-offs and recoveries; past-due loans; risk-rated loans; classified loanspast due and impaired loans; the paceloans, (2) levels and trends in charge-offs, (3) changes in underwriting standards, policy exceptions, and credit policy, (4) experience of loan growth; underwriting policieslending management and adherence to such policies;staff, (5) economic trends, (6) industry conditions, (7) effects of changes in credit concentration; the experience of lending personnelconcentrations, (8) interest rate environment, and management; trends in the economy(9) regulatory and employment; business conditions; industry conditions; and political, legislative and regulatoryother changes. The general allowance related to the acquired loans collectively evaluated for impairment areis determined based upon the degree, if any, of deterioration in the pooled loans subsequent to acquisition. The qualitative factors used in the determination are the same as those used for originated loans.
Specific AllowanceDuring 2015, the Company enhanced and refined its general allowance methodology. Under the enhanced methodology, Management combined the historical loss histories of the Banks to generate a single set of historical loss ratios. Management believes it is appropriate to aggregate the ratios as the Banks share common environmental factors, operate in similar geographic markets, and utilize common underwriting standards in accordance with the Company's Credit Policy. In prior periods, a historical loss history applicable to each Bank was used.
Management employed a similar analysis for the consolidation of the qualitative factors as it did for the quantitative factors. Again, Management believes the realignment of the existing nine qualitative factors used at each of the Banks into a single group of factors used for the Company is appropriate based on the commonality of environmental factors, markets and underwriting standards among the Banks. In prior periods each of the Banks utilized a set of qualitative factors applicable to each Bank.
The Company’s December 31, 2015 allowance calculation included a further segmentation of the commercial loans and leases to reflect the increased risk in the Company’s taxi medallion portfolio. As of December 31, 2015, this portfolio is approximately $35.8 million. Based on industry conditions, Management established a specific loss factor for this portfolio that best represents the changing risks associated with it.
Based on the refinements to the Company’s allowance methodology discussed above, Management determined that the potential risks anticipated by the unallocated allowance are now incorporated into the allowance methodology, making the unallocated allowance unnecessary. In prior periods, the unallocated allowance was used to recognize the estimated risk associated with the allocated general and specific allowances. It incorporated Management’s evaluation of existing conditions that were not included in the allocated allowance determinations and provided for losses that arise outside of the ordinary course of business.
Specific valuation allowances are established for impaired originated loans with book values greater than the discounted present value of expected future cash flows or, in the case of collateral-dependent impaired loans, for any excess of a loan's
BROOKLINE BANCORP, INC. AND SUBSIDIARIES
Notes to Consolidated Financial Statements (Continued)
December 31, 2015, 2014, 2013
book balance and the fair value of its underlying collateral. Specific valuation allowances are established for acquired loans with deterioration in the discounted present value of expected furtherfuture cash flows since acquisitions or, in the case of collateral dependent impaired loans, for any increase in the excess of a loan's book balance greater than the fair value of its underlying collateral. A specific valuation allowance for losses on troubled debt restructuredTDR loans is determined by comparing the net carrying amount of the troubled debt restructured loan with the restructured loan's cash flows discounted at the original effective rate. Impaired loans are reviewed quarterly with adjustments made to the calculated reserve as deemed necessary.
Unallocated Allowance
DeterminationAs of December 31, 2015, Management believes that the unallocated portion ofmethodology for calculating the allowance is sound and that the allowance provides a subjective process. Management believes the unallocated allowance is an important component of the total allowance because it addresses thereasonable basis for determining and reporting on probable inherent risk of loss that exists in that part of the Company's loan portfolio with repayment terms that extend over many years. It also helps to minimize the risk related to the margin of imprecision inherentlosses in the estimation of the allocated components of the allowance. The Company has not allocated the unallocated portion of the allowance to the variousCompany’s loan categories and classes because such an allocation would imply a degree of precision that does not exist.portfolios.
Liability for Unfunded Commitments
In the ordinary course of business, the Company enters into commitments to extend credit, commercial letters of credit, and standby letters of credit. Such financial instruments are recorded in the financial statements when they become payable. The credit risk associated with these commitments is evaluated in a manner similar to the allowance for loan losses.
Premises and Equipment
Premises and equipment are carried at cost less accumulated depreciation and amortization, except for land which is carried at cost. Premises and equipment are depreciated using the straight-line method over the estimated useful life of the assets. Leasehold improvements are amortized using the straight-line method over the shorter of the lease term or the estimated useful life of the improvements.
Costs related to internal-use software development projects that provide significant new functionality are capitalized. Internal-use software is software acquired or modified solely to meet the Company's needs and for which there is no plan to market the software externally. Direct and indirect costs associated with the application development stage of internal use software are capitalized until such time that the software is substantially complete and ready for its intended use. Capitalized costs are amortized on a straight-line basis over the remaining estimated life of the software. Computer software and development costs incurred in the preliminary project stage, as well as training and maintenance costs, are expensed as incurred.
Leases
BROOKLINE BANCORP, INC. AND SUBSIDIARIES
NotesMassachusetts, Rhode Island and New York. Lease terms range from five years to Consolidated Financial Statements (Continued)
over 25 years with options to renew. Management performs an analysis to determine proper lease accounting at lease inception and for each renewal. If a lease meets any of the following four criteria, the lease is classified as capital lease. The four criteria are: transfer of ownership by the end of lease term; contains bargain purchase option; lease term is at least 75% of the property’s estimated remaining economic life; or present value of the minimum lease payment is at least 90% of the fair value of the leased property. The Company did not have any capital leases as of December 31, 2013, 20122015 or 2014. All leases are classified as operating leases and 2011rental payments are expensed as incurred. Certain leases contain rent escalation clauses which are amortized over the life of the lease under the straight-line method.
Bank-Owned Life Insurance
The Company acquired bank-owned life insurance ("BOLI") plans as part of its acquisitions of First Ipswich and BankRI. BOLI represents life insurance on the lives of certain current and former employees who have provided positive consent allowing their employer to be the beneficiary of such policies. BankRI and First Ipswich are the beneficiaries of their respective policies. BankRI and First Ipswich utilize BOLI as tax-efficient financing for their benefit obligations to their employees, including their retirement obligations and Supplemental Executive Retirement Plans ("SERPs").
Since BankRI and First Ipswich are the primary beneficiaries of their respective insurance policies, increases in the cash value of the policies, as well as insurance proceeds received, are recorded in non-interest income and are not subject to income taxes. BOLI is recorded at the cash value of the policies, less any applicable cash surrender charges, and is reflected as an asset in the accompanying consolidated balance sheets. Cash proceeds, if any, are classified as cash flows from investing activities.
The Company reviews the financial strength of the insurance carriers prior to the purchase of BOLI to ensure minimum credit ratings of at least investment grade. The financial strength of the carriers is reviewed at least annually, and BOLI with any individual carrier is limited to 10% of capital.the Company's capital and 25% of the Company's capital in the aggregate.
BROOKLINE BANCORP, INC. AND SUBSIDIARIES
Notes to Consolidated Financial Statements (Continued)
December 31, 2015, 2014, 2013
Goodwill and Other Identified Intangible Assets
Goodwill represents the excess of the cost of an acquisition over the fair value of the net assets acquired. Goodwill isand indefinite-lived identified intangible assets are not subject to amortization. IdentifiedDefinite-lived identified intangible assets are assets resulting from acquisitions that are being amortized over their estimated useful lives. The recoverability of goodwill and identified intangible assets is evaluated for impairment at least annually. As part of this evaluation, the Company makes a qualitative assessment of whether it is more likely than not that the fair value of an acquired asset is greater than its carrying amount. Pursuant to FASB Accounting Standards Update ("ASU") 2011-8, adopted in January 2012, ifIf the Company qualitatively concludes that it is more likely than not that the fair value of an acquired asset is greater than its carrying amount, no further testing is necessary. If, however, the Company qualitatively concludes that it is more likely than not that the fair value of an acquired asset is less than its carrying value, the Company performs a two-step quantitative impairment test to determine whether the asset is impaired. If impairment is deemed to have occurred, the amount of impairment is charged to expense when identified. The Company did not have any impairment as of December 31, 2015 and 2014.
OREO and Other Real Estate Owned and Repossessed Assets
OREO and other repossessed assets consists of propertyproperties acquired through foreclosure, real estate acquired through acceptance of a deed in lieu of foreclosure and loans determined to be substantively repossessed. Real estate loans that are substantively repossessed include only those loans for which the Company has taken possession of the collateral. OREO and other repossessed assets which consist of vehicles and equipment, if any, are recorded initially at estimated fair value less costs to sell, resulting in a new cost basis. The amount by which the recorded investment in the loan exceeds the fair value (net of estimated cost to sell) of the foreclosed or repossessed asset is charged to the allowance for loan and lease losses. Such evaluations are based on an analysis of individual properties/assets as well as a general assessment of current real estate market conditions. Subsequent declines in the fair value of the foreclosed or repossessed asset below the new cost basis are recorded through the use of a valuation allowance. Subsequent increases in the fair value are recorded as reductions in the allowance, but not below zero. Rental revenue received on foreclosed or repossessed assets is included in other non-interest income, whereas operating expenses and changes in the valuation allowance relating to foreclosed and repossessed assets are included in other non-interest expense. Certain costs used to improve such properties are capitalized. Gains and losses from the sale of OREO and other repossessed vehicles and equipmentassets are reflected in non-interest expense when realized. Together with nonperforming loans, OREO and repossessed assets comprise nonperforming assets.
Derivatives
The Company enters into interest rate swap agreements as part of the Company's interest-rate risk management strategy for certain assets and liabilities and not for speculative purposes. Based on the Company's intended use for the interest rate swap at inception, the Company designates the derivative as either an economic hedge of an asset or liability, or a hedging instrument subject to the hedge accounting provisions of FASB ASC Topic 815, "Derivatives and Hedging."
Interest rate swaps designated as economic hedges are recorded at fair value within other assets or liabilities. Changes in the fair value of these derivatives are recorded directly through earnings at each reporting period.
Transfer of Financial Assets
BROOKLINE BANCORP, INC. AND SUBSIDIARIES
Notes to Consolidated Financial Statements (Continued)
December 31, 2013, 2012 and 2011
Transfers of financial assets are accounted for as sales when control over the assets has been surrendered. Control over transferred assets is deemed to be surrendered when (1)the assets have been isolated from the Company, (2)the transferee obtains the right (free of conditions that constrain it from taking advantage of that right) to pledge or exchange the transferred assets, and (3)the Company does not maintain effective control over the transferred assets through an agreement to repurchase them before their maturity.
Securities Sold under Agreements to Repurchase
The Company enters into sales of securities under agreements to repurchase with the Banks' commercial customers. These agreements are treated as financings, and the obligations to repurchase securities sold are reflected as a liability in the consolidated balance sheets. Securities pledged as collateral under agreements to repurchase are reflected as assets in the accompanying consolidated balance sheets.
Employee Benefits
BROOKLINE BANCORP, INC. AND SUBSIDIARIES
Notes to Consolidated Financial Statements (Continued)
December 31, 2015, 2014, 2013
Costs related to the Company's 401(k) plansplan are recognized over the vesting period or charged againstin current operations in the year made depending on the plan.operations. Costs related to the Company's nonqualified deferred compensation plan, SERPs and postretirement benefits are recognized over the vesting period or the related service periods of the participating employees. Changes in the funded status of postretirement benefits are recognized through comprehensive income in the year in which changes occur.
Compensation expense for the Company's Employee Stock Ownership PlanProgram ("ESOP") is recorded at an amount equal to the shares allocated by the ESOP multiplied by the average fair market value of the shares during the year. The Company recognizes compensation expense ratably over the year based upon the Company's estimate of the number of shares expected to be allocated by the ESOP. The difference between the average fair market value and the cost of the shares allocated by the ESOP is recorded as an adjustment to additional paid-in capital.
The fair value of restricted common stock awards and stock option grants isare determined as of the grant date and isare recorded as compensation expense over the period in which the shares of commonrestricted stock awards and stock options vest. Forfeitures are estimated in determining compensation expense.
Fair Value Measurements
ASC 820-10, "Fair Value Measurements and Disclosures," defines fair value as the price that would be received to sell an asset or paid to transfer a liability in an orderly transaction between market participants. A fair value measurement assumes that the transaction to sell the asset or transfer the liability occurs in the principal market for the asset or liability or, in the absence of a principal market, the most advantageous market for the asset or liability. The price in the principal (or most advantageous) market used to measure the fair value of the asset or liability is not adjusted for transaction costs. An orderly transaction is a transaction that assumes exposure to the market for a period prior to the measurement date to allow for marketing activities that are usual and customary for transactions involving such assets and liabilities. It is not a forced transaction. Market participants are buyers and sellers in the principal market that are independent, knowledgeable, able to transact, and willing to transact.
A fair-value hierarchy for valuation inputs that gives the highest priority to quoted prices in active markets for identical assets or liabilities and the lowest priority to unobservable inputs are included in ASC 820. The fair value hierarchy is as follows:
Level 1: Inputs are unadjusted quoted prices in active markets for assets and liabilities identical to those reported at fair value.
Level 2: Inputs other than quoted prices included within Level 1. Level 2 inputs are observable either directly or indirectly. These inputs might include quoted prices for similar assets or liabilities in active markets, quoted prices for identical or similar assets in markets that are not active, inputs other than quoted prices that are observable for the asset or liability (such as interest rates, volatilities, prepayment speeds, credit risks, etc.) or inputs that are derived principally from or corroborated by market data by correlation or other means.
Level 3: Inputs are unobservable inputs for an asset or liability that reflect an entity's own assumptions about the assumptions that market participants would use in pricing the assets or liabilities. These inputs are used to determine fair value only when observable inputs are not available.
BROOKLINE BANCORP, INC. AND SUBSIDIARIES
Notes to Consolidated Financial Statements (Continued)
December 31, 2013, 2012 and 2011
Earnings per Common Share
Basic earnings per share ("EPS") is computed by dividing net income by the weighted average number of shares of common stock outstanding for the applicable period, exclusive of Treasury shares, unearned ESOP shares and unvested shares of restricted stock. Diluted EPS is calculated after adjusting the denominator of the basic EPS calculation for the effect of all potential dilutive common shares outstanding during the period. The dilutive effects of options and unvested restricted stock awards are computed using the "treasury stock" method. Management evaluated the "two class" method and concluded that the results of which aremethod did not materially different from those calculated usingapply to the “two-class” method.Company's EPS calculation.
Income Taxes
Income taxes are accounted for under the asset and liability method. Under this method, deferred tax assets and liabilities are recognized for the future tax consequences attributable to differences between the financial statement carrying amounts of existing assets and liabilities and their respective tax bases.
BROOKLINE BANCORP, INC. AND SUBSIDIARIES
Notes to Consolidated Financial Statements (Continued)
December 31, 2015, 2014, 2013
Deferred tax assets and liabilities are measured using enacted tax rates expected to apply to taxable income in the years in which those temporary differences are expected to be recovered or settled. The effect on deferred tax assets and liabilities of a change in tax rates is recognized in income in the period that includes the enactment date.
Tax positions that are more likely than not to be sustained upon a tax examination are recognized in the Company's financial statements to the extent that the benefit is greater than 50% likely of being recognized. Interest resulting from underpayment of income taxes is classified as income tax expense in the first period the interest would begin accruing according to the provision of the relevant tax law. Penalties resulting from underpayment of income taxes are classified as income tax expense in the period for which the Company claims or expects to claim an uncertain tax position or in the period in which the Company's judgment changes regarding an uncertain tax position.
Tax credits generated from the refurbishment of the corporate headquarters and investments in affordable housing projects are reflected in earnings when realized for federal income tax purposes.
Treasury Stock
SharesAny shares repurchased under the Company's share repurchase programs were purchased in open-market transactions and are held as treasury stock. Treasury stock also consists of common stock withheld to satisfy federal, state and local income tax withholding requirements for vested employee restricted stock awards.awards upon vesting. All treasury stock is held at cost.
Segment Reporting
An operating segment is defined as a component of a business for which separate financial information is available that is evaluated regularly by the chief operating decision-maker in deciding how to allocate resources and evaluate performance. The Company is a bank holding company with subsidiaries engaged in the business of banking and activities closely related to banking. The Company's banking business provided substantially all of its total revenues and pre-tax income in 2013, 20122015, 2014 and 2011.2013. Therefore, the Company has determined there to be a single segment.
Recent Accounting Pronouncements
In February 2013, FASB2016, the Financial Accounting Standards Board (“FASB”) issued Accounting Standards Update (“ASU”("ASU") No. 2013-01,2016-02, Clarifying the Scope of Disclosures about Offsetting Assets and Liabilities. This ASU clarifies the scope of offsetting disclosure requirements in ASU 2011-11, Balance Sheet (Topic 210): Disclosures about Offsetting Assets and Liabilities. Under ASU 2013-01, the disclosure requirements would apply to derivative instruments accounted for in accordance with ASC 815, including bifurcated embedded derivatives, repurchase agreements and reverse repurchase agreements, and securities borrowing and securities lending arrangements that are either offset on the balance sheet or subject to an enforceable master netting arrangement or similar agreement. Entities with other types of financial assets and financial liabilities subject to a master netting arrangement or similar agreement also are affected because these amendments make them no longer subject to the disclosure requirements in ASU No. 2011-11. Effective January 1, 2013, companies are required to disclose (a) gross amounts of recognized assets and liabilities; (b) gross amounts offset in the statement of financial position; (c) net amounts of assets and liabilities presented in the statement of financial position; (d) gross amount subject to enforceable master netting agreement not offset in the statements of financial position; and (e) net amounts after deducting (d) from (c). The disclosure should be presented in tabular format (unless another format is more appropriate) separately for assets and liabilities. The intent of the new disclosure is to enable users of financial statements to understand the effect of those arrangements on its financial position and to allow investors to
BROOKLINE BANCORP, INC. AND SUBSIDIARIES
Notes to Consolidated Financial Statements (Continued)
December 31, 2013, 2012 and 2011
better compare financial statements prepared under GAAP with financial statements prepared under International Financial Reporting Standards. As required, the Company added relevant disclosure in Note 16, “Derivatives and Hedging Activities.”
In February 2013, FASB issued ASU No. 2013-02, Comprehensive Income (Topic 220): Reporting of Amounts Reclassified out of Accumulated Other Comprehensive Income. This ASU states that the amendments do not change the current requirements for reporting net income or other comprehensive income in financial statements. The amendments do, however, require an entity to provide information about the amounts reclassified out of accumulated other comprehensive income by component. In addition, an entity is required to present, either on the face of the statement where net income is presented or in the notes, significant amounts reclassified out of accumulated other comprehensive income by the respective line items of net income, but only if the amount reclassified is required under U.S. GAAP to be reclassified to net income in its entirety in the same reporting period. For other amounts that are not required to be reclassified in their entirety to net income under U.S. GAAP, an entity is required to cross-reference to other disclosures required under U.S. GAAP that provide additional detail about those amounts. The amendments are effective prospectively for reporting periods beginning after December 15, 2012. In response to this ASU, the Company added a new footnote to disclose the amounts reclassified out of accumulated other comprehensive income and the effects on the line items of net income. See Note 15, “Comprehensive Income.”
In July 2013, FASB issued ASU 2013-10, Inclusion of the Fed Funds Effective Swap Rate (or Overnight Index Swap Rate) as a Benchmark Interest Rate for Hedge Accounting Purposes.Leases. This ASU amends ASC 815requires lessees to allow entitiesput most leases on their balance sheet but recognize expenses on their income statements in a manner similar to use the Fed Funds Effective Swap Rate, in addition to U.S. Treasury rates and LIBOR, as a benchmark interest rate in accounting for fair value and cash flow hedges in the United States.today's accounting. This ASU also eliminates the provision from ASC 815-20-25-6 that prohibits the use of different benchmark ratestoday's real estate-specific provisions for similar hedges except in rare and justifiable circumstances. This ASU is effective prospectively for qualifying new hedging relationship entered into on or after July 17, 2013, and for hedging relationship redesignated on or after that day. As of December 31, 2013, the Company did not have any fair value and cash flow hedges. The adoption of ASU No. 2013-10 did not have a material impact on the Company’s financial statements.
In July 2013, FASB issued ASU No. 2013-11, Presentation of an Unrecognized Tax Benefit When a Net Operating Loss Carryforward, a Similar Tax Loss, or a Tax Credit Carryforward Exists. This ASU provides guidance on financial statement presentation of unrecognized tax benefits (“UTBs”) when a net operating loss (“NOL”) carryforward, a similar tax loss, or a tax credit carryforward exists. The FASB’s objective in issuingall companies. For lessors, this ASU is to eliminate diversity in practice resulting from a lack of guidance on this topic in current U.S. GAAP. Under this ASU, an entity must present a UTB, or a portion of a UTB, inmodifies the financial statements as a reduction to a deferred tax asset (“DTA”)classification criteria and the accounting for an NOL carryforward, a similar tax loss, or a tax credit carryforward except when: (a) an NOL carryforward, a similar tax loss, or a tax credit carryforward is not available as of the reporting date under the governing tax law to settle taxes that would result from the disallowance of the tax position; or (b) the entity does not intend to use the DTA for this purpose (provided that the tax law permits a choice). If either of these conditions exists, an entity should present a UTB in the financial statements as a liabilitysales-type and should not net the UTB with a DTA. New recurring disclosures are not required because the ASU does not affect the recognition or measurement of uncertain tax positions under ASC 740. This amendment does not affect the amounts public entities disclose in the tabular reconciliation of the total amounts of UTBs because the tabular reconciliation presents the gross amount of UTBs.direct financing leases. This ASU is effective for fiscal years beginning after December 15, 2013, and2018, including interim periods within those years. The amendments should be applied to all UTBs that exist as of the effective date. Entities may choose to apply the amendments retrospectively to each prior reporting period presented. As of December 31, 2013, the Company did not have a UTB.therein. Early adoption is permitted. The Company will assessis currently assessing the applicability of this ASU after it become effective and as such has not determined the impact, if any, as of this ASU.December 31, 2015.
In January 2014,2016, the FASB issued ASU 2014-01,2016-01, Accounting for Investments in Qualified Low-Income Housing Tax Credit (“LIHTC”) program.Financial Instruments. This ASU provides guidance onsignificantly revises an entity’s accounting for investments by a reporting entity in flow-through limited liability entities. Currently,related to (1) the classification and measurement of investments in low-income housing are accountedequity securities and (2) the presentation of certain fair value changes for either byfinancial liabilities measured at fair value. It also amends certain disclosure requirements associated with the effective yield, equity or cost method. This ASU allows for reporting entities to make a policy election on how to account for their investments.fair value of financial instruments. This ASU is applied retrospectively effective prospectively for all annual periods presentedfiscal years beginning after December 15, 2014; early adoption is permitted.2017, including interim periods therein. The Company has not chosen to early adopt ASU No. 2014-01 and will assessis currently assessing the applicability of this ASU after it become effective and as such has not determined the impact, if any, as of this ASU.December 31, 2015.
In January 2014,August 2015, the FASB issued ASU 2014-04,2015-15, Receivables—TroubledInterest - Imputation of Interest (Subtopic 835-30): Presentation and Subsequent Measurement of Debt Restructurings by CreditorsIssuance Costs Associated with Line-of-Credit Arrangements. This ASU provides clarification on when an in substance repossession or foreclosure occurs resultingwas issued to clarify the presentation and subsequent measurement of debt issuance costs related to line-of-credit arrangements, since this was not addressed in the creditor derecognizingguidance in ASU 2015-03, which requires entities to present debt issuance costs related to a recognized debt liability as a direct deduction from the loancarrying amount of that debt liability. Given the absence of authoritative guidance with ASU 2015-03, ASU 2015-15 states that the SEC staff will not object to an entity deferring and recognizingpresenting debt issuance costs related to line-of-credit arrangements as an asset and subsequently amortizing the collateral. Currently, there isdeferred debt issuance costs ratably over the terms of the line-of-credit arrangement. As of December 31, 2015, the Company has accounted for the debt issuance costs related to the line-of-credit arrangement as a reduction of the debt liability, consistent with ASU 2015-03 and with the Company’s accounting treatment for other debt issuance costs. Management has determined that this ASU had no definitionimpact to the Company.
In August 2015, the FASB issued ASU 2015-14, Revenue from Contracts with Customers (Topic 606): Deferral of the Effective Datein substance a repossession or foreclosure and physical possession in the accounting literature.. This ASU is applied retrospectively orwas issued to defer the effective prospectivelydate of ASU 2014-09 for all annual periods presented beginning after December 15, 2014; early adoption is permitted. The Company has not chosen to early adoptentities by one year. In effect, public business entities, certain not-for-profit entities, and certain employee benefit plans should apply the guidance in ASU 2014-09
BROOKLINE BANCORP, INC. AND SUBSIDIARIES
Notes to Consolidated Financial Statements (Continued)
December 31, 2015, 2014, 2013 2012 and 2011
No. 2014-04 and will assessto annual reporting periods (including interim reporting periods within those period) beginning after December 15, 2017. The Company is currently assessing the applicability of this ASU after it become effective and as such has not determined the impact, if any, as of December 31, 2015.
In June 2015, the FASB issued ASU 2015-10, Technical Corrections and Improvements. This ASU represent changes to clarify the Codification, correct unintended application of guidance, or make minor improvements to the Codification that are not expected to have a significant effect on current accounting practice or create a significant administrative cost to most entities. This ASU is effective for all entities for fiscal years, and interim periods within those fiscal years, beginning after December 15, 2015. Early adoption is permitted, including adoption in an interim period. All other amendments will be effective upon issuance. Management has determined that this ASU.ASU had no impact to the Company as of December 31, 2015.
In April 2015, the FASB issued ASU 2015-03, Interest-Imputation of Interest (Subtopic 835-30): Simplifying the Presentation of Debt Issuance Costs. This ASU requires that all debt issuance costs be presented in the balance sheet as direct deductions from the carrying amount of the related debt liability. Amortization of the costs is reported as interest expense. This ASU is applied retrospectively for the first interim or annual period presented beginning after December 15, 2015, early adoption is permitted. As of December 31, 2015, the Company has accounted for its debt issuance cost as a reduction of the debt liability.
In January 2015, the FASB issued ASU 2015-01, Income Statement - Extraordinary and Unusual Items (Subtopic 225-20): Simplifying Income Statement Presentation by Eliminating the Concept of Extraordinary Items. This ASU eliminates from U.S. GAAP the concept of extraordinary items. This ASU is effective for fiscal years, and interim periods within those fiscal years, beginning after December 15, 2015. A reporting entity may apply the amendments prospectively. Management has determined that this ASU had no impact to the Company as of December 31, 2015.
(2) Acquisitions
Bancorp Rhode Island, Inc.
On January 1, 2012 (the "BankRI Acquisition Date"), the Company acquired all the assets and liabilities of Bancorp Rhode Island, Inc., the bank holding company for BankRI. As part of the acquisition, Bancorp Rhode Island, Inc. was merged into the Company and no longer exists as a separate entity. BankRI, a commercial bank with 1819 branches serving businesses and individuals in Rhode Island and nearby Massachusetts, continues to operate as a separate bank subsidiary of the Company.
Total consideration paid in the acquisition was $205.8 million, which consisted of approximately 11 million shares of stock with a total par value of approximately $0.1 million and a fair value of $92.8 million and $113.0 million in cash. Stock consideration was paid at the rate of 4.686 shares of Brookline Bancorp common stock per share of Bancorp Rhode Island, Inc. common stock. The assets acquired and the liabilities assumed in the acquisition were recorded by the Company at their estimated fair values as of the BankRI Acquisition Date.
First Ipswich Bancorp
On February 28, 2011 (the "First Ipswich Acquisition Date"), the Company acquired First Ipswich Bancorp, the bank holding company for First Ipswich. As part of the acquisition, First Ipswich Bancorp was effectively merged into the Company and no longer exists as a separate entity. First Ipswich, a commercial bank with six branches serving individuals and businesses on the north shore of eastern Massachusetts and in the Boston metropolitan area, continues to operate as a separate bank subsidiary of the Company.
Total consideration paid in the First Ipswich acquisition consisted of $19.7 million in cash. The assets acquired and the liabilities assumed in the acquisition were recorded by the Company at their estimated fair values as of the First Ipswich Acquisition Date and the fair value of the assets acquired and liabilities assumed in the First Ipswich acquisition totaled $271.6 million and $252.0 million, respectively. No expenses related to the acquisition of First Ipswich were recorded in the years ended December 31, 2013 and December 31, 2012. Expenses relating to the acquisition of First Ipswich totaling $0.2 million were recorded in professional services expense in the year ended December 31, 2011.
(3) Cash, Cash Equivalents and Short-Term Investments
The Banks are required to maintain average reserve balances in a non-interest-bearing account with the Federal Reserve Bank based upon a percentage of certain of the Banks' deposits. As of December 31, 20132015 and 2012,2014, the average amount required to be held was $5.3$6.2 million and $3.7$7.4 million, respectively. Aggregate reserve balances included in cash and cash equivalents were $54.2$45.5 million and $41.7$33.6 million, respectively, atas of December 31, 20132015 and 2012.
Short-term investments are summarized as follows:
|
| | | | | | | |
| | At December 31, |
| | 2013 | | 2012 |
| | (In Thousands) |
| Money market funds | $ | 10 |
| | $ | 20 |
|
| Federal funds sold | 55,347 |
| | 38,636 |
|
| | $ | 55,357 |
| | $ | 38,656 |
|
Short-term investments are stated at cost which approximates market value. Money market funds are invested in mutual funds whose assets are comprised primarily of U.S. Treasury obligations, commercial paper and certificates of deposit with maturities of 90 days or less.2014.
BROOKLINE BANCORP, INC. AND SUBSIDIARIES
Notes to Consolidated Financial Statements (Continued)
December 31, 2015, 2014, 2013 2012 and 2011
Short-term investments are summarized as follows:
|
| | | | | | | |
| | At December 31, |
| | 2015 | | 2014 |
| | (In Thousands) |
| FRB interest bearing reserve | $ | 34,575 |
| | $ | 19,789 |
|
| FHLB overnight deposits | 9,573 |
| | 5,708 |
|
| Federal funds sold | 2,588 |
| | 322 |
|
| Other interest bearing deposits | — |
| | 11 |
|
| Total short-term investments | $ | 46,736 |
| | $ | 25,830 |
|
Short-term investments are stated at cost which approximates market value.
(4) Investment Securities
The following tables set forth investment securities available-for-sale and held-to-maturity at the dates indicated:
| | | | At December 31, 2013 | At December 31, 2015 |
| | Amortized Cost | | Gross Unrealized Gains | | Gross Unrealized Losses | | Estimated Fair Value | Amortized Cost | | Gross Unrealized Gains | | Gross Unrealized Losses | | Estimated Fair Value |
| | (In Thousands) | (In Thousands) |
| Investment securities available-for-sale: | | | | | | | | |
| Debt securities: | | | | | | | | | | | | | | |
| GSEs | $ | 12,138 |
| | $ | 42 |
| | $ | — |
| | $ | 12,180 |
| $ | 40,658 |
| | $ | 141 |
| | $ | 172 |
| | $ | 40,627 |
|
| GSE CMOs | 254,331 |
| | 86 |
| | 10,773 |
| | 243,644 |
| 198,000 |
| | 45 |
| | 4,229 |
| | 193,816 |
|
| GSE MBSs | 202,478 |
| | 1,852 |
| | 4,929 |
| | 199,401 |
| 230,213 |
| | 1,098 |
| | 1,430 |
| | 229,881 |
|
| Private-label CMOs | 3,258 |
| | 115 |
| | 18 |
| | 3,355 |
| |
| SBA commercial loan asset-backed securities | 245 |
| | — |
| | 2 |
| | 243 |
| 148 |
| | — |
| | 1 |
| | 147 |
|
| Auction-rate municipal obligations | 1,900 |
| | — |
| | 125 |
| | 1,775 |
| |
| Municipal obligations | 1,068 |
| | 18 |
| | — |
| | 1,086 |
| |
| Corporate debt obligations | 27,751 |
| | 506 |
| | 33 |
| | 28,224 |
| 46,160 |
| | 344 |
| | 18 |
| | 46,486 |
|
| Trust preferred securities | 1,461 |
| | — |
| | 251 |
| | 1,210 |
| 1,466 |
| | — |
| | 199 |
| | 1,267 |
|
| Total debt securities | 504,630 |
| | 2,619 |
| | 16,131 |
| | 491,118 |
| 516,645 |
| | 1,628 |
| | 6,049 |
| | 512,224 |
|
| Marketable equity securities | 1,259 |
| | 61 |
| | 10 |
| | 1,310 |
| 956 |
| | 21 |
| | — |
| | 977 |
|
| Total investment securities available-for-sale | $ | 505,889 |
| | $ | 2,680 |
| | $ | 16,141 |
| | $ | 492,428 |
| $ | 517,601 |
| | $ | 1,649 |
| | $ | 6,049 |
| | $ | 513,201 |
|
| | | | | | | | | |
| Investment securities held-to-maturity | $ | 500 |
| | $ | — |
| | $ | — |
| | $ | 500 |
| |
| Investment securities held-to-maturity: | | | | | | | | |
| GSEs | | $ | 34,915 |
| | $ | 9 |
| | $ | 105 |
| | $ | 34,819 |
|
| GSEs MBSs | | 19,291 |
| | — |
| | 305 |
| | 18,986 |
|
| Municipal obligations | | 39,051 |
| | 364 |
| | 25 |
| | 39,390 |
|
| Foreign government securities | | 500 |
| | — |
| | — |
| | 500 |
|
| Total investment securities held-to-maturity | | $ | 93,757 |
|
| $ | 373 |
|
| $ | 435 |
|
| $ | 93,695 |
|
|
| | | | | | | | | | | | | | | |
| | At December 31, 2012 |
| | Amortized Cost | | Gross Unrealized Gains | | Gross Unrealized Losses | | Estimated Fair Value |
| | (In Thousands) |
| Debt securities: | | | | | | | |
| GSEs | $ | 69,504 |
| | $ | 305 |
| | $ | — |
| | $ | 69,809 |
|
| GSE CMOs | 215,670 |
| | 1,386 |
| | 55 |
| | 217,001 |
|
| GSE MBSs | 165,996 |
| | 3,704 |
| | 52 |
| | 169,648 |
|
| Private-label CMOs | 6,719 |
| | 147 |
| | — |
| | 6,866 |
|
| SBA commercial loan asset-backed securities | 383 |
| | — |
| | 2 |
| | 381 |
|
| Auction-rate municipal obligations | 2,100 |
| | — |
| | 124 |
| | 1,976 |
|
| Municipal obligations | 1,058 |
| | 43 |
| | — |
| | 1,101 |
|
| Corporate debt obligations | 10,481 |
| | 204 |
| | — |
| | 10,685 |
|
| Trust preferred securities and pools | 2,786 |
| | 136 |
| | 403 |
| | 2,519 |
|
| Total debt securities | 474,697 |
| | 5,925 |
| | 636 |
| | 479,986 |
|
| Marketable equity securities | 1,249 |
| | 88 |
| | — |
| | 1,337 |
|
| Total investment securities available-for-sale | $ | 475,946 |
| | $ | 6,013 |
| | $ | 636 |
| | $ | 481,323 |
|
| | | | | | | | |
| Investment securities held-to-maturity | $ | 500 |
| | $ | 2 |
| | $ | — |
| | $ | 502 |
|
At December 31, 2013, the fair value of all securities available-for-sale was $492.4 million and carried a total of $13.5 million of net unrealized losses, compared to a fair value of $481.3 million and a net unrealized gain of $5.4 million at December 31, 2012. Of the $492.4 million in securities available-for-sale at December 31, 2013, $383.3 million, or 77.8%, of the portfolio, had gross unrealized losses of $16.1 million. This compares to $47.6 million, or 9.9%, of the portfolio with gross
BROOKLINE BANCORP, INC. AND SUBSIDIARIES
Notes to Consolidated Financial Statements (Continued)
December 31, 2015, 2014, 2013 2012 and 2011
|
| | | | | | | | | | | | | | | |
| | At December 31, 2014 |
| | Amortized Cost | | Gross Unrealized Gains | | Gross Unrealized Losses | | Estimated Fair Value |
| | (In Thousands) |
| Investment securities available-for-sale: | | | | | | | |
| Debt securities: | | | | | | | |
| GSEs | $ | 22,929 |
| | $ | 88 |
| | $ | 29 |
| | $ | 22,988 |
|
| GSE CMOs | 238,910 |
| | 80 |
| | 4,821 |
| | 234,169 |
|
| GSE MBSs | 249,329 |
| | 2,531 |
| | 879 |
| | 250,981 |
|
| SBA commercial loan asset-backed securities | 205 |
| | — |
| | 2 |
| | 203 |
|
| Corporate debt obligations | 39,805 |
| | 403 |
| | 1 |
| | 40,207 |
|
| Trust preferred securities | 1,463 |
| | — |
| | 223 |
| | 1,240 |
|
| Total debt securities | 552,641 |
| | 3,102 |
| | 5,955 |
| | 549,788 |
|
| Marketable equity securities | 947 |
| | 26 |
| | — |
| | 973 |
|
| Total investment securities available-for-sale | $ | 553,588 |
| | $ | 3,128 |
| | $ | 5,955 |
| | $ | 550,761 |
|
| Investment securities held-to-maturity: | | | | | | | |
| Foreign government securities | $ | 500 |
| | $ | — |
| | $ | — |
| | $ | 500 |
|
| Total investment securities held-to-maturity | $ | 500 |
| | $ | — |
| | $ | — |
| | $ | 500 |
|
As of December 31, 2015, the fair value of all investment securities available-for-sale was $513.2 million, with net unrealized losses of $0.6$4.4 million, atcompared to a fair value of $550.8 million and net unrealized losses of $2.8 million as of December 31, 2012. The shift from an2014. As of December 31, 2015, $368.6 million, or 71.8% of the portfolio, had gross unrealized gain positionlosses of $6.0 million, compared to an$335.7 million, or 60.9% of the portfolio, with gross unrealized loss position in 2013losses of $6.0 million as of December 31, 2014.
As of December 31, 2015, the fair value of all investment securities held-to-maturity was primarily driven by rising interest rates.$93.7 million, with net unrealized losses of $62.0 thousand, compared to a fair value of $0.5 million with no unrealized gains as of December 31, 2014. As of December 31, 2015, $52.3 million, or 55.8% of the portfolio, had gross unrealized losses of $0.4 million. There were no investment securities held-to-maturity with net unrealized losses as of December 31, 2014.
Investment Securities as Collateral
At As of December 31, 20132015 and 2012,2014, respectively, $402.5$486.4 million and $309.7$473.1 million of investment securities available-for-sale were pledged as collateral for repurchase agreements; municipal deposits; treasury, tax and loan deposits; swap agreements; and FHLBB and FRB discount window borrowings. The Banks did not have any outstanding FRB borrowings at as of December 31, 20132015 and 2012.2014.
Other-Than-Temporary Impairment ("OTTI")
BROOKLINE BANCORP, INC. AND SUBSIDIARIES
Notes to Consolidated Financial Statements (Continued)
December 31, 2015, 2014, 2013
Investment securities at as of December 31, 20132015 and 20122014 that have been in a continuous unrealized loss position for less than twelve months or twelve months or longer are as follows: |
| | | | | | | | | | | | | | | | | | | | | | | |
| | At December 31, 2013 |
| | Less than Twelve Months | | Twelve Months or Longer | | Total |
| | Estimated Fair Value | | Unrealized Losses | | Estimated Fair Value | | Unrealized Losses | | Estimated Fair Value | | Unrealized Losses |
| | (In Thousands) |
| Debt securities: | | | | | | | | | | | |
| GSE CMOs | $ | 221,317 |
| | $ | 9,861 |
| | $ | 16,257 |
| | $ | 912 |
| | $ | 237,574 |
| | $ | 10,773 |
|
| GSE MBSs | 121,836 |
| | 3,746 |
| | 13,516 |
| | 1,183 |
| | 135,352 |
| | 4,929 |
|
| Private-label CMOs | 639 |
| | 18 |
| | — |
| | — |
| | 639 |
| | 18 |
|
| SBA commercial loan asset- backed securities | 32 |
| | — |
| | 192 |
| | 2 |
| | 224 |
| | 2 |
|
| Auction-rate municipal obligations | — |
| | — |
| | 1,775 |
| | 125 |
| | 1,775 |
| | 125 |
|
| Corporate debt obligations | 5,988 |
| | 33 |
| | — |
| | — |
| | 5,988 |
| | 33 |
|
| Trust preferred securities | — |
| | — |
| | 1,210 |
| | 251 |
| | 1,210 |
| | 251 |
|
| Temporarily impaired debt securities | 349,812 |
| | 13,658 |
| | 32,950 |
| | 2,473 |
| | 382,762 |
| | 16,131 |
|
| Marketable equity securities | 501 |
| | 10 |
| | — |
| | — |
| | 501 |
| | 10 |
|
| Total temporarily impaired securities | $ | 350,313 |
| | $ | 13,668 |
| | $ | 32,950 |
| | $ | 2,473 |
| | $ | 383,263 |
| | $ | 16,141 |
|
|
| | | | | | | | | | | | | | | | | | | | | | | |
| | At December 31, 2015 |
| | Less than Twelve Months | | Twelve Months or Longer | | Total |
| | Estimated Fair Value | | Unrealized Losses | | Estimated Fair Value | | Unrealized Losses | | Estimated Fair Value | | Unrealized Losses |
| | (In Thousands) |
| Investment securities available-for-sale: | | | | | | | | | | | |
| GSEs | $ | 19,633 |
| | $ | 172 |
| | $ | — |
| | $ | — |
| | $ | 19,633 |
| | $ | 172 |
|
| GSE CMOs | 89,680 |
| | 1,294 |
| | 100,473 |
| | 2,935 |
| | 190,153 |
| | 4,229 |
|
| GSE MBSs | 133,779 |
| | 845 |
| | 16,968 |
| | 585 |
| | 150,747 |
| | 1,430 |
|
| SBA commercial loan asset-backed securities | — |
| | — |
| | 139 |
| | 1 |
| | 139 |
| | 1 |
|
| Corporate debt obligations | 6,181 |
| | 18 |
| | — |
| | — |
| | 6,181 |
| | 18 |
|
| Trust preferred securities | — |
| | — |
| | 1,267 |
| | 199 |
| | 1,267 |
| | 199 |
|
| Temporarily impaired debt securities available-for-sale | 249,273 |
| | 2,329 |
| | 118,847 |
| | 3,720 |
| | 368,120 |
| | 6,049 |
|
| Investment securities held-to-maturity: | | | | | | | | | | | |
| GSEs | 25,837 |
| | 105 |
| | — |
| | — |
| | 25,837 |
|
| 105 |
|
| GSEs MBSs | 18,834 |
| | 305 |
| | — |
| | — |
| | 18,834 |
| | 305 |
|
| Municipal obligations | 7,629 |
| | 25 |
| | — |
| | — |
| | 7,629 |
| | 25 |
|
| Temporarily impaired debt securities held-to-maturity | 52,300 |
|
| 435 |
|
| — |
|
| — |
|
| 52,300 |
|
| 435 |
|
| Total temporarily impaired securities | $ | 301,573 |
|
| $ | 2,764 |
|
| $ | 118,847 |
|
| $ | 3,720 |
|
| $ | 420,420 |
|
| $ | 6,484 |
|
BROOKLINE BANCORP, INC. AND SUBSIDIARIES
Notes to Consolidated Financial Statements (Continued)
December 31, 2013, 2012 and 2011
|
| | | | | | | | | | | | | | | | | | | | | | | |
| | At December 31, 2012 |
| | Less than Twelve Months | | Twelve Months or Longer | | Total |
| | Estimated Fair Value | | Unrealized Losses | | Estimated Fair Value | | Unrealized Losses | | Estimated Fair Value | | Unrealized Losses |
| | (In Thousands) |
| Debt securities: | | | | | | | | | | | |
| GSE CMOs | $ | 23,910 |
| | $ | 55 |
| | $ | — |
| | $ | — |
| | $ | 23,910 |
| | $ | 55 |
|
| GSE MBSs | 19,186 |
| | 47 |
| | 235 |
| | 5 |
| | 19,421 |
| | 52 |
|
| Private-label CMOs | 25 |
| | — |
| | — |
| | — |
| | 25 |
| | — |
|
| SBA commercial loan asset- backed securities | 310 |
| | 2 |
| | — |
| | — |
| | 310 |
| | 2 |
|
| Auction-rate municipal obligations | — |
| | — |
| | 1,976 |
| | 124 |
| | 1,976 |
| | 124 |
|
| Trust preferred securities and pools | — |
| | — |
| | 1,931 |
| | 403 |
| | 1,931 |
| | 403 |
|
| Temporarily impaired debt securities | 43,431 |
| | 104 |
| | 4,142 |
| | 532 |
| | 47,573 |
| | 636 |
|
| Marketable equity securities | — |
| | — |
| | — |
| | — |
| | — |
| | — |
|
| Total temporarily impaired securities | $ | 43,431 |
| | $ | 104 |
| | $ | 4,142 |
| | $ | 532 |
| | $ | 47,573 |
| | $ | 636 |
|
|
| | | | | | | | | | | | | | | | | | | | | | | |
| | At December 31, 2014 |
| | Less than Twelve Months | | Twelve Months or Longer | | Total |
| | Estimated Fair Value | | Unrealized Losses | | Estimated Fair Value | | Unrealized Losses | | Estimated Fair Value | | Unrealized Losses |
| | (In Thousands) |
| Investment securities available-for-sale: | | | | | | | | | | | |
| GSEs | $ | 11,086 |
| | $ | 29 |
| | $ | — |
| | $ | — |
| | $ | 11,086 |
| | $ | 29 |
|
| GSE CMOs | 39,095 |
| | 179 |
| | 190,345 |
| | 4,642 |
| | 229,440 |
| | 4,821 |
|
| GSE MBSs | 50,099 |
| | 84 |
| | 39,555 |
| | 795 |
| | 89,654 |
| | 879 |
|
| SBA commercial loan asset-backed securities | 8 |
| | — |
| | 186 |
| | 2 |
| | 194 |
| | 2 |
|
| Corporate debt obligations | 4,069 |
| | 1 |
| | — |
| | — |
| | 4,069 |
| | 1 |
|
| Trust preferred securities and pools | — |
| | — |
| | 1,240 |
| | 223 |
| | 1,240 |
| | 223 |
|
| Total temporarily impaired investment securities available-for-sale | $ | 104,357 |
| | $ | 293 |
| | $ | 231,326 |
| | $ | 5,662 |
| | $ | 335,683 |
| | $ | 5,955 |
|
The Company performs regular analysis on the investment securities available-for-sale securities portfolio to determine whether a decline in fair value indicates that an investment security is OTTI. In making these OTTI determinations, managementManagement considers, among other factors, the length of time and extent to which the fair value has been less than amortized cost; projected future cash flows; credit subordination and the creditworthiness; capital adequacy and near-term prospects of the issuers.
BROOKLINE BANCORP, INC. AND SUBSIDIARIES
Notes to Consolidated Financial Statements (Continued)
December 31, 2015, 2014, 2013
Management also considers the Company's capital adequacy, interest-rate risk, liquidity and business plans in assessing whether it is more likely than not that the Company will sell or be required to sell the investment securities before recovery. If the Company determines that a decline in fair value is OTTI and that it is more likely than not that the Company will not sell or be required to sell the investment security before recovery of its amortized cost, the credit portion of the impairment loss is recognized in earningsthe Company's consolidated statement of income and the noncredit portion is recognized in accumulated other comprehensive income. The credit portion of the OTTI impairment represents the difference between the amortized cost and the present value of the expected future cash flows of the investment security. If the Company determines that a decline in fair value is OTTI and it is more likely than not that it will sell or be required to sell the investment security before recovery of its amortized cost, the entire difference between the amortized cost and the fair value of the security will be recognized in earnings.the Company's consolidated statement of income.
DebtInvestment Securities Available-For-Sale Impairment Analysis
The Company expects to recover its amortized costfollowing discussion summarizes, by investment security type, the basis for evaluating if the applicable investment securities within the Company’s available-for-sale portfolio were OTTI as of December 31, 2015. Based on all debt securities in its available-for-salethe analysis below and held-to-maturity portfolios. Furthermore,the determination that, it is more likely than not that the Company doeswill not intend to sell nor does it anticipate that it willor be required to sell anythe investment securities before recovery of its securities in an unrealized loss position as of December 31, 2013, prior to the recovery of their amortized cost basis.cost. The Company's ability and intent to hold these investment securities until recovery is supported by the Company's strong capital and liquidity positions as well as its historically low portfolio turnover. As such, Management has determined that the investment securities are not OTTI as of December 31, 2015. If market conditions for investment securities worsen or the creditworthiness of the underlying issuers deteriorates, it is possible that the Company may recognize additional OTTI in future periods.
U.S. Government-Sponsored Enterprises
The Company invests in securities issued by U.S. Government-sponsored enterprises ("GSEs"), including GSE debt securities, mortgage-backed securities ("MBSs"), and collateralized mortgage obligations ("CMOs"). GSE securities include obligations issued by the Federal National Mortgage Association ("FNMA"), the Federal Home Loan Mortgage Corporation ("FHLMC"), the Government National Mortgage Association ("GNMA"), the Federal Home Loan Banks ("FHLB") and the Federal Farm Credit Bank. At As of December 31, 2013,2015, only GNMA MBSs and CMOs, and Small Business Administration ("SBA") commercial loan asset-backed securities with an estimated fair value of $18.9$21.8 million were backed explicitly by the full faith and credit of the U.S. Government, compared to $10.0$26.2 million at as of December 31, 2012.2014.
At As of December 31, 2013,2015, the Company owned GSE debentures with a total fair value of $40.6 million, which approximated amortized cost. As of December 31, 2014, the Company held GSE debentures with a total fair value of $12.2$23.0 million, and a net unrealized gainwhich approximated amortized cost. As of $42.0 thousand. At December 31, 2012, the Company held GSE debentures with a total fair value of $69.8 million and a net unrealized gain of $0.3 million. At December 31, 2013, none2015, seven of the fivethirteen securities in this portfolio were in unrealized loss positions. At As of December 31, 2012, none2014, four of the twenty-eighteight securities in this portfolio were in unrealized loss positions. All
BROOKLINE BANCORP, INC. AND SUBSIDIARIES
Notes to Consolidated Financial Statements (Continued)
December 31, 2013, 2012 and 2011
securities are performing and backed by the implicit(FHLB/implicit (FHLB/FNMA/FHLMC) or explicit(GNMA/explicit (GNMA/SBA) guarantee of the U.S Government.
At For the year ended December 31, 2013,2015, the Company held SBApurchased a total of $24.9 million GSE debentures. This compares to $21.0 million purchased during the same period in 2014.
As of December 31, 2015, the Company owned GSE mortgage-related securities with a total fair value of $0.2$423.7 million and a net unrealized loss of $2.0 thousand. At December 31, 2012, the Company held SBA securities with$4.5 million. This compares to a total fair value of $0.4$485.2 million and a net unrealized loss of less than $2.0 thousand. At $3.1 million as of December 31, 2013, seven2014. As of December 31, 2015, 101 of the nine249 securities in this portfolio were in unrealized loss positions. At As of December 31, 2012, eight2014, 79 of the eleven250 securities in this portfolio were in unrealized loss positions. All securities are performing and backed by the implicit (FHLB/FNMA/FHLMC) or explicit (GNMA) guarantee of the U.S Government. During the years ended December 31, 2015 and 2014, the Company purchased a total of $29.5 million and $106.9 million, respectively, in GSE CMOs and GSE MBSs.
SBA Commercial Loan Asset-Backed
As of December 31, 2015 and December 31, 2014, the Company owned SBA securities with a total fair value of $0.1 million and $0.2 million, respectively, which approximated amortized cost. As of December 31, 2015, six of the seven securities in this portfolio were in unrealized loss positions. As of December 31, 2014, seven of the eight securities in this portfolio were in unrealized loss positions. All securities are performing and backed by the explicit (SBA) guarantee of the U.S Government.
AsCorporate Obligations
BROOKLINE BANCORP, INC. AND SUBSIDIARIES
Notes to Consolidated Financial Statements (Continued)
December 31, 2015, 2014, 2013,
From time to time, the Company held GSE mortgage-relatedmay invest in high-quality corporate obligations to provide portfolio diversification and improve the overall yield on the portfolio. The Company owned fifteen corporate obligation securities with a total fair value of $443.0 million and a net unrealized loss of $13.8 million. This compares to a total fair value of $386.6$46.5 million and a net unrealized gain of $5.0$0.3 million atas of December 31, 2012. At December 31, 2013, 86 of the 232 securities in this portfolio were in unrealized loss positions. At December 31, 2012, 32 of the 224 securities in this portfolio were in unrealized loss positions. All securities are performing and backed by the implicit(FHLB/FNMA/FHLMC) or explicit(GNMA) guarantee of the U.S Government. During the years ended December 31, 2013 and 2012, the Company purchased a total of $149.5 million and $326.1 million, respectively, in GSE CMOs and GSE MBSs2015. This compares to reinvest cash from matured securities.
Private-Label CMOs
At December 31, 2013, the Company held private-issuer CMO-relatedthirteen corporate obligation securities with a total fair value of $3.4$40.2 million and a net unrealized gain of $0.1 million. At $0.4 million as of December 31, 2012, the Company held private-issuer CMO-related securities with a total fair value2014. As of $6.9 million and a net unrealized gain of $0.1 million. At December 31, 2013,2015, two of the elevenfifteen securities in this portfolio were in an unrealized loss positions. At position. As of December 31, 2012,2014, one of the eleventhirteen securities in this portfolio were in unrealized loss positions. All securities are performing and while one security was downgraded in 2013, the security is in an unrealized gain position and the underlying credit metrics have not deteriorated in 2013.
Auction-Rate Municipal Obligations and Municipal Obligations
The auction-rate obligations owned by the Company were rated "AAA" at the time of acquisition due, in part, to the guarantee of third-party insurers who would have to pay the obligations if the issuers failed to pay the obligations when they become due. During the financial crisis, certain third-party insurers experienced financial difficulties and were not able to meet their contractual obligations. As a result, auctions failed to attract a sufficient number of investors and created a liquidity problem for those investors who were relying on the obligations to be redeemed at auction. Since then, there has not been an active market for auction-rate municipal obligations.
Based on an evaluation of market factors, the estimated fair value of the auction-rate municipal obligations owned by the Company at December 31, 2013 was $1.8 million, with a corresponding net unrealized loss of $0.1 million. This compares to $2.0 million with a corresponding net unrealized loss of $0.1 million at December 31, 2012. At December 31, 2013, all of the remaining securities in this portfolio were in unrealized loss positions. At December 31, 2012, all three of the securities in this portfolio were in unrealized loss positions.position. Full collection of the obligations is expected because the financial condition of the issuers is sound, none of the issuers hasthey have not defaulted on scheduled payments, the obligations are rated investment grade, and the Company has the ability and intent to hold the obligations for a period of time to recover the amortized cost.
The Company owns municipal obligations with an estimated fair value of $1.1 million which approximates amortized cost at For the year ended December 31, 2013. This compares2015, the Company purchased $9.3 million in corporate obligations compared to $12.0 million in the same period in 2014.
Trust Preferred Securities
Trust preferred securities represent subordinated debt issued by financial institutions. As of December 31, 2015, the Company owned two trust preferred securities with a total fair value of $1.1$1.3 million which also approximates amortized cost at and a net unrealized loss of $0.2 million. This compares to two trust preferred securities with a total fair value of $1.2 million and a net unrealized loss of $0.2 million as of December 31, 2012. At both 2014. As of December 31, 20132015 and 2012, none2014, both of the two securities in this portfolio were in unrealized loss positions. Full collection of the obligations is expected because the financial condition of the issuers is sound, noneneither of the
issuers has defaulted on scheduled payments, the obligations are rated investment grade, and the Company has the ability and
intent to hold the obligations for a period of time to recover the amortized cost.
CorporateMarketable Equity Securities
As of December 31, 2015, the Company owned marketable equity securities with a fair value of $1.0 million, which approximated amortized cost, compared to a fair value of $1.0 million, which approximated cost as of December 31, 2014. As of December 31, 2015, none of the two securities in this portfolio were in unrealized loss positions. As of December 31, 2014, none of the four securities in this portfolio were in unrealized loss positions.
Investment Securities Held-to-Maturity Impairment Analysis
U.S. Government-Sponsored Enterprises
The Company invests in securities issued by U.S. Government-sponsored enterprises ("GSEs") including GSE debt securities, mortgage-backed securities ("MBSs"), and collateralized mortgage obligations ("CMOs"). GSE securities include obligations issued by the Federal National Mortgage Association ("FNMA"), the Federal Home Loan Mortgage Corporation ("FHLMC"), the Government National Mortgage Association ("GNMA"), the Federal Home Loan Banks ("FHLB"), and the Federal Farm Credit Bank. As of December 31, 2015, the Company owned GSE debentures and GSE MBS with a total fair value of $34.8 million and $19.0 million, respectively.
As of December 31, 2015, the Company owned GSE mortgage-related securities with a total amortized cost of $19.3 million. As of December 31, 2014, the Company did not own any GSE mortgage-related securities. During the year ended December 31, 2015, the Company purchased a total of $42.4 million and $21.3 million, in GSEs and GSE MBSs, respectively. As of December 31, 2015, 16 of the 22 securities in this portfolio were in unrealized loss positions. All securities are performing and backed by the implicit (FHLB/FNMA/FHLMC) or explicit (GNMA) guarantee of the U.S Government.
Municipal Obligations
From time to time,As of December 31, 2015, the Company will invest in high-quality corporate obligations to provide portfolio diversification and improve the overall yield on the portfolio. The Company owned eleven corporate72 municipal obligation securities with a total fair value and total amortized cost of $28.2$39.4 million and total net unrealized gains39.1 million, respectively. As of $0.5 million as of December 31, 2013. This compares to eight corporate2014, the Company did not own any municipal obligation securities withsecurities. During the year ended December 31, 2015, the Company purchased a total fair value of $10.7$39.2 million and total net unrealized gains of $0.2 million at municipal obligations. During the year ended December 31, 2012. At both 2014, the Company did not purchase any municipal obligations. As of December 31, 2013 and 2012, all but one of2015, 15 the securities are investment grade and this security is currently in an unrealized gain position. At December 31, 2013, two of the eleven72 securities in this portfolio arewere in unrealized loss positions. At
BROOKLINE BANCORP, INC. AND SUBSIDIARIES
Notes to Consolidated Financial Statements (Continued)
December 31, 2015, 2014, 2013 2012 and 2011
Foreign Government Obligations
As of December 31, 2012, none of the eight securities in this portfolio were in unrealized loss positions. Full collection of the obligations is expected because the financial condition of the issuers is sound, none of the issuers has defaulted on scheduled payments, the obligations are rated investment grade2015 and the Company has the ability and intent to hold the obligations for a period of time to recover the unrealized losses. During the year ended December 31, 2013, the Company purchased $21.7 million in corporate obligations. The Company did not purchase any corporate obligations in the same period in 2012.
Trust Preferred Securities and PreTSLs
Trust preferred securities represent subordinated debt issued by financial institutions. These securities are sometimes pooled and sold to investors through structured vehicles known as trust preferred pools (“PreTSLs”). When issued, PreTSLs are divided into tranches or segments that establish priority rights to cash flows from the underlying trust preferred securities. At December 31, 2013,2014, the Company owned two trust preferred securities and no PreTSL poolsone foreign government obligation security with a total fair value of $1.2 million and a total net unrealized loss of $0.3 million. This compares to three trust preferred securities and two PreTSL pools with a total fair value of $2.5 million and a total net unrealized loss of $0.3 million at December 31, 2012. At December 31, 2013, all of the securities in this portfolio were in unrealized loss positions, which represents 17.2% of the amortized cost of the securities. At $0.5 million. As of December 31, 2012, three of2015 and December 31, 2014, the five securitiessecurity was not in the Company’s portfolio were inan unrealized loss positions, which represents 14.5% of the amortized cost of the securities.
position. During the year ended December 31, 2013,2015, the Company sold two PreTSL pooled securities for a net gain of $0.4 million. Atdid not purchase any foreign government obligation securities. During the time of sale, the proposed "Volcker Rule" of the Dodd-Frank Wall Street Reform and Consumer Protection Act, restricted banks from owning PreTSL pooled securities. The Company had the ability and intent to hold both securities to maturity prior to the new proposed regulations based on the amortized cost of the securities held at that time versus market indications. The Company identified that these securities were subject to the "Volcker Rule” and decided to sell the securities while a market existed. After regulatory review in January 2014, the "Volcker Rule" was revised and banks of less than $10 billion in size were grandfathered to hold these securities in their portfolios.
Marketable Equity Securities
At bothyear ended December 31, 2013 and 2012,2014, the Company owned marketable equity securities with a fair value of $1.3 million, including net unrealized gains of $0.1 million. At December 31, 2013, one of the four securities in this portfolio was in an unrealized loss position, which represents 0.8% of the amortized cost of the securities. At December 31, 2012, none of the four securities in this portfolio were in an unrealized loss position.
Securities Held-to-Maturity
The Company purchased $0.5 million of State of Israel bonds in 2011 with a carrying value of $0.5 million and a fair value of $0.5 million. This security matures in March, 2014 and carries an interest rate payable of LIBOR plus 0.125%.
BROOKLINE BANCORP, INC. AND SUBSIDIARIES
Notes to Consolidated Financial Statements (Continued)
December 31, 2013, 2012 and 2011
Portfolio Maturities
The final stated maturities of the investments in debt securities available-for-saleare as follows at the dates indicated are as follows:indicated:
| | | | At December 31, | At December 31, |
| | 2013 | | 2012 | 2015 | | 2014 |
| | Amortized Cost | | Estimated Fair Value | | Weighted Average Rate | | Amortized Cost | | Estimated Fair Value | | Weighted Average Rate | Amortized Cost | | Estimated Fair Value | | Weighted Average Rate | | Amortized Cost | | Estimated Fair Value | | Weighted Average Rate |
| | (Dollars in Thousands) | (Dollars in Thousands) |
| Investment securities available-for-sale: | | | | | | | | | | | | | | | | | | | | | | |
| Within 1 year | $ | 13,012 |
| | $ | 13,062 |
| | 0.82 | % | | $ | 59,396 |
| | $ | 59,736 |
| | 1.20 | % | $ | 2,999 |
| | $ | 3,003 |
| | 2.09 | % | | $ | 3,057 |
| | $ | 3,081 |
| | 3.00 | % |
| After 1 year through 5 years | 40,204 |
| | 41,187 |
| | 2.90 | % | | 25,249 |
| | 25,579 |
| | 1.61 | % | 59,729 |
| | 60,249 |
| | 2.32 | % | | 55,631 |
| | 56,586 |
| | 2.48 | % |
| After 5 years through 10 years | 66,447 |
| | 67,075 |
| | 2.23 | % | | 50,283 |
| | 52,557 |
| | 3.29 | % | 100,658 |
| | 100,833 |
| | 2.05 | % | | 103,268 |
| | 104,208 |
| | 2.00 | % |
| Over 10 years | 384,967 |
| | 369,794 |
| | 1.90 | % | | 339,769 |
| | 342,114 |
| | 1.93 | % | 353,259 |
| | 348,139 |
| | 1.97 | % | | 390,685 |
| | 385,913 |
| | 1.91 | % |
| | $ | 504,630 |
| | $ | 491,118 |
| | 2.00 | % | | $ | 474,697 |
| | $ | 479,986 |
| | 1.97 | % | $ | 516,645 |
| | $ | 512,224 |
| | 2.03 | % | | $ | 552,641 |
| | $ | 549,788 |
| | 1.99 | % |
| Investment securities held-to-maturity: | | | | | | | | | | | | |
| Within 1 year | | $ | 651 |
| | $ | 651 |
| | 1.00 | % | | $ | — |
| | $ | — |
| | — | % |
| After 1 year through 5 years | | 23,888 |
| | 23,866 |
| | 1.52 | % | | 500 |
| | 500 |
| | 1.30 | % |
| After 5 years through 10 years | | 50,078 |
| | 50,344 |
| | 2.00 | % | | $ | — |
| | $ | — |
| | — | % |
| Over 10 years | | 19,140 |
| | 18,834 |
| | 1.82 | % | | $ | — |
| | $ | — |
| | — | % |
| | | $ | 93,757 |
| | $ | 93,695 |
| | 1.83 | % | | $ | 500 |
| | $ | 500 |
| | — | % |
Actual maturities of GSE debt securities maywill differ from those presented above since certain obligations amortize and may also provide the issuer the right to call or prepay the obligation prior to scheduled maturity without penalty. AtMBSs and CMOs are included above based on their final stated maturities; the actual maturities, however, may occur earlier due to anticipated prepayments and stated amortization of cash flows.
As of December 31, 2013, there were no remaining callable GSE2015, issuers of debt securities with an estimated fair value of $48.5 million had the right to call or prepay the obligations. Of the $48.5 million, approximately $15.5 million matures in the investment portfolio. At1 - 5 years, $31.8 million matures in 6 - 10 years, and $1.3 million matures after ten years. As of December 31, 2013,2014, issuers of other debt securities with an estimated fair value of approximately $3.7$16.1 million had the right to call or prepay the obligations,obligations. Of the scheduled maturities of which were $0.7$16.1 million, less than one year,$5.0 million matures in 1-5 years, $9.9 million matures in 6-10 years, and $3.0$1.2 million matures after ten years. At December 31, 2012, issuers of all debt securities with an estimated fair value of approximately $8.9 million had the right to call or prepay the obligations, the scheduled maturities of which were $4.8 million after one year through five years, $0.2 million after five years through ten years, and $3.9 million after ten years. MBSs and CMOs are included above based on their contractual maturities; the remaining lives, however, are expected to be shorter due to anticipated payments.
Security Sales
Sales of investment securities are summarized as follows:
|
| | | | | | | | | | | |
| | Year Ended December 31, |
| | 2013 | | 2012 | | 2011 |
| | (In Thousands) |
| Sales of debt securities | $ | 1,210 |
| | $ | 166,201 |
| | $ | — |
|
| Sales of marketable equity securities | — |
| | — |
| | 124 |
|
| Gross gains from sales | 626 |
| | 1,093 |
| | 80 |
|
| Gross losses from sales | 229 |
| | 167 |
| | — |
|
Security transactions are recorded on the trade date. When securities are sold, the adjusted cost of the specific security sold is used to compute the gain or loss on the sale.
(5) Restricted Equity Securities
Investments in the restricted equity Sales of investment securities of various entities are summarized as follows:
BROOKLINE BANCORP, INC. AND SUBSIDIARIES
Notes to Consolidated Financial Statements (Continued)
December 31, 2015, 2014, 2013 2012 and 2011
|
| | | | | | | |
| | At December 31, |
| | 2013 | | 2012 |
| | (In Thousands) |
| FHLBB stock | $ | 50,081 |
| | $ | 52,188 |
|
| Federal Reserve Bank of Boston stock | 16,003 |
| | 15,998 |
|
| Other restricted equity securities | 475 |
| | 475 |
|
| | $ | 66,559 |
| | $ | 68,661 |
|
|
| | | | | | | | | | | |
| | Year Ended December 31, |
| | 2015 | | 2014 | | 2013 |
| | (In Thousands) |
| Sales of debt securities | $ | — |
| | $ | 5,084 |
| | $ | 1,210 |
|
| Sales of marketable equity securities | — |
| | 401 |
| | — |
|
| | | | | | |
| Gross gains from sales | — |
| | 380 |
| | 626 |
|
| Gross losses from sales | — |
| | 315 |
| | 229 |
|
| Gain on sales of securities, net | $ | — |
| | $ | 65 |
| | $ | 397 |
|
At
(5) Restricted Equity Securities
Investments in the restricted equity securities of various entities are as follows:
|
| | | | | | | |
| | At December 31, |
| | 2015 | | 2014 |
| | (In Thousands) |
| FHLBB stock | $ | 48,890 |
| | $ | 58,326 |
|
| Federal Reserve Bank of Boston stock | 16,752 |
| | 16,003 |
|
| Other restricted equity securities | 475 |
| | 475 |
|
| | $ | 66,117 |
| | $ | 74,804 |
|
The Company invests in the stock of FHLBB as one of the requirements to borrow. As of December 31, 20132015 and 2012,2014, FHLBB stock is recorded at its carrying value, which is equal to cost and which managementManagement believes approximates its fair value. The FHLBB stated that it remained in compliance with all regulatory capital ratios as of December 31, 2015 and was classified as "adequately capitalized" by its regulator, based on the FHLBB's financial information as of September 30, 2015. The FHLBB paid a dividend to member banks at an annualized rate of 254 basis points in 2015. The FHLBB increased its dividend from 174 basis points in the first quarter of 2015 to 332 basis points in the fourth quarter of 2015. As of December 31, 2013, effected the repurchase of $300 million of capital stock during 2013 and paid a stable modest dividend of 38bps during 2013. At December 31, 2013,2015, the Company's investment in FHLBB stock exceeded its required investment which provides for additional borrowing capacity.
The FHLBB has announced its intent to declare modest dividends throughout 2014, but cautioned that should adverse events occur, such as a negative trend in credit losses on the FHLBB's private-label MBSs or its mortgage portfolio, a meaningful decline in income or regulatory disapproval, dividends could again be suspended.
The Company increased its investmentinvests in the stock of the Federal Reserve Bank of Boston in 2012, consistent withas required by its the conversion of Brookline Bank and BankRI to state-chartered banks supervised byBanks' membership in the Federal Reserve Banksystem. As of Boston. At December 31, 20132015 and 2012,2014, Federal Reserve Bank of Boston stock is recorded at its carrying value, which is equal to cost and which managementManagement believes approximates its fair value.
BROOKLINE BANCORP, INC. AND SUBSIDIARIES
Notes to Consolidated Financial Statements (Continued)
December 31, 2015, 2014, 2013
(6) Loans and Leases
The following tables present loan and lease balances and weighted average coupon rates for the originated and acquired loan and lease portfolios at the dates indicated:
|
| | | | | | | | | | | | | | | | | | | | |
| | At December 31, 2015 |
| | Originated | | Acquired | | Total |
| | Balance | | Weighted Average Coupon | | Balance | | Weighted Average Coupon | | Balance | | Weighted Average Coupon |
| | (Dollars In Thousands) |
| Commercial real estate loans: | | | | | | | | | | | |
| Commercial real estate | $ | 1,684,548 |
| | 4.00 | % | | $ | 191,044 |
| | 4.15 | % | | $ | 1,875,592 |
| | 4.02 | % |
| Multi-family mortgage | 620,865 |
| | 3.92 | % | | 37,615 |
| | 4.35 | % | | 658,480 |
| | 3.94 | % |
| Construction | 129,742 |
| | 3.60 | % | | 580 |
| | 5.08 | % | | 130,322 |
| | 3.61 | % |
| Total commercial real estate loans | 2,435,155 |
| | 3.96 | % | | 229,239 |
| | 4.19 | % | | 2,664,394 |
| | 3.98 | % |
| Commercial loans and leases: | | | | | | | | | | | |
| Commercial | 576,599 |
| | 3.90 | % | | 15,932 |
| | 5.65 | % | | 592,531 |
| | 3.95 | % |
| Equipment financing | 712,988 |
| | 7.05 | % | | 8,902 |
| | 6.14 | % | | 721,890 |
| | 7.04 | % |
| Condominium association | 59,875 |
| | 4.50 | % | | — |
| | — | % | | 59,875 |
| | 4.50 | % |
| Total commercial loans and leases | 1,349,462 |
| | 5.59 | % | | 24,834 |
| | 5.83 | % | | 1,374,296 |
| | 5.59 | % |
| Indirect automobile loans | 13,678 |
| | 5.53 | % | | — |
| | — | % | | 13,678 |
| | 5.53 | % |
| Consumer loans: | | | | | | | | | | | |
| Residential mortgage | 527,846 |
| | 3.64 | % | | 88,603 |
| | 3.85 | % | | 616,449 |
| | 3.67 | % |
| Home equity | 234,708 |
| | 3.35 | % | | 79,845 |
| | 3.99 | % | | 314,553 |
| | 3.51 | % |
| Other consumer | 12,039 |
| | 4.77 | % | | 131 |
| | 17.40 | % | | 12,170 |
| | 4.91 | % |
| Total consumer loans | 774,593 |
| | 3.57 | % | | 168,579 |
| | 3.93 | % | | 943,172 |
| | 3.63 | % |
| Total loans and leases | $ | 4,572,888 |
| | 4.38 | % | | $ | 422,652 |
| | 4.18 | % | | $ | 4,995,540 |
| | 4.36 | % |
BROOKLINE BANCORP, INC. AND SUBSIDIARIES
Notes to Consolidated Financial Statements (Continued)
December 31, 2015, 2014, 2013 2012 and 2011
| | | | At December 31, 2013 | At December 31, 2014 |
| | Originated | | Acquired | | Total | Originated | | Acquired | | Total |
| | Balance | | Weighted Average Coupon | | Balance | | Weighted Average Coupon | | Balance | | Weighted Average Coupon | Balance | | Weighted Average Coupon | | Balance | | Weighted Average Coupon | | Balance | | Weighted Average Coupon |
| | (Dollars In Thousands) | (Dollars In Thousands) |
| Commercial real estate loans: | | | | | | | | | | | | | | | | | | | | | | |
| Commercial real estate | $ | 1,111,750 |
| | 4.34 | % | | $ | 350,235 |
| | 4.42 | % | | $ | 1,461,985 |
| | 4.36 | % | $ | 1,425,621 |
| | 4.18 | % | | $ | 254,461 |
| | 4.29 | % | | $ | 1,680,082 |
| | 4.20 | % |
| Multi-family mortgage | 554,555 |
| | 4.19 | % | | 73,378 |
| | 4.63 | % | | 627,933 |
| | 4.24 | % | 576,214 |
| | 4.11 | % | | 63,492 |
| | 4.50 | % | | 639,706 |
| | 4.15 | % |
| Construction | 102,927 |
| | 3.81 | % | | 10,778 |
| | 4.37 | % | | 113,705 |
| | 3.87 | % | 146,074 |
| | 3.79 | % | | 1,939 |
| | 5.50 | % | | 148,013 |
| | 3.81 | % |
| Total commercial real estate loans | 1,769,232 |
| | 4.26 | % | | 434,391 |
| | 4.46 | % | | 2,203,623 |
| | 4.30 | % | 2,147,909 |
| | 4.13 | % | | 319,892 |
| | 4.34 | % | | 2,467,801 |
| | 4.16 | % |
| Commercial loans and leases: | | | | | | | | | | | | | | | | | | | | | | |
| Commercial | 297,684 |
| | 3.68 | % | | 110,108 |
| | 4.54 | % | | 407,792 |
| | 3.91 | % | 462,730 |
| | 3.88 | % | | 51,347 |
| | 4.14 | % | | 514,077 |
| | 3.91 | % |
| Equipment financing | 485,330 |
| | 7.14 | % | | 27,694 |
| | 6.60 | % | | 513,024 |
| | 7.11 | % | 587,496 |
| | 6.92 | % | | 13,928 |
| | 6.22 | % | | 601,424 |
| | 6.90 | % |
| Condominium association | 44,794 |
| | 4.74 | % | | — |
| | — |
| | 44,794 |
| | 4.74 | % | 51,593 |
| | 4.60 | % | | — |
| | — | % | | 51,593 |
| | 4.60 | % |
| Total commercial loans and leases | 827,808 |
| | 5.77 | % | | 137,802 |
| | 4.95 | % | | 965,610 |
| | 5.65 | % | 1,101,819 |
| | 5.53 | % | | 65,275 |
| | 4.58 | % | | 1,167,094 |
| | 5.48 | % |
| Indirect automobile loans | 400,531 |
| | 4.98 | % | | — |
| | — |
| | 400,531 |
| | 4.98 | % | 316,987 |
| | 4.47 | % | | — |
| | — | % | | 316,987 |
| | 4.47 | % |
| Consumer loans: | | | | | | | | | | | | | | | | | | | | | | |
| Residential mortgage | 411,554 |
| | 3.65 | % | | 116,631 |
| | 3.93 | % | | 528,185 |
| | 3.71 | % | 472,078 |
| | 3.60 | % | | 99,842 |
| | 3.77 | % | | 571,920 |
| | 3.63 | % |
| Home equity | 132,396 |
| | 3.39 | % | | 125,065 |
| | 3.88 | % | | 257,461 |
| | 3.63 | % | 181,580 |
| | 3.35 | % | | 105,478 |
| | 3.85 | % | | 287,058 |
| | 3.53 | % |
| Other consumer | 5,532 |
| | 5.98 | % | | 1,523 |
| | 14.89 | % | | 7,055 |
| | 7.90 | % | 11,580 |
| | 5.13 | % | | 167 |
| | 16.35 | % | | 11,747 |
| | 5.29 | % |
| Total consumer loans | 549,482 |
| | 3.61 | % | | 243,219 |
| | 3.98 | % | | 792,701 |
| | 3.72 | % | 665,238 |
| | 3.56 | % | | 205,487 |
| | 3.82 | % | | 870,725 |
| | 3.62 | % |
| Total loans and leases | $ | 3,547,053 |
| | 4.59 | % | | $ | 815,412 |
| | 4.38 | % | | $ | 4,362,465 |
| | 4.55 | % | $ | 4,231,953 |
| | 4.43 | % | | $ | 590,654 |
| | 4.19 | % | | $ | 4,822,607 |
| | 4.40 | % |
The net unamortized deferred loan origination fees and costs included in total loans and leases were $12.8 million and $15.0 million as of December 31, 2015 and 2014, respectively. |
| | | | | | | | | | | | | | | | | | | | |
| | At December 31, 2012 |
| | Originated | | Acquired | | Total |
| | Balance | | Weighted Average Coupon | | Balance | | Weighted Average Coupon | | Balance | | Weighted Average Coupon |
| | (Dollars In Thousands) |
| Commercial real estate loans: | | | | | | | | | | | |
| Commercial real estate | $ | 871,552 |
| | 4.62 | % | | $ | 429,681 |
| | 4.69 | % | | $ | 1,301,233 |
| | 4.64 | % |
| Multi-family mortgage | 506,017 |
| | 4.50 | % | | 100,516 |
| | 4.99 | % | | 606,533 |
| | 4.58 | % |
| Construction | 80,913 |
| | 4.20 | % | | 17,284 |
| | 4.73 | % | | 98,197 |
| | 4.29 | % |
| Total commercial real estate loans | 1,458,482 |
| | 4.56 | % | | 547,481 |
| | 4.75 | % | | 2,005,963 |
| | 4.61 | % |
| Commercial loans and leases: | | | | | | | | | | | |
| Commercial | 230,892 |
| | 3.89 | % | | 151,385 |
| | 4.72 | % | | 382,277 |
| | 4.22 | % |
| Equipment financing | 366,297 |
| | 7.69 | % | | 54,694 |
| | 6.91 | % | | 420,991 |
| | 7.59 | % |
| Condominium association | 44,187 |
| | 5.02 | % | | — |
| | — |
| | 44,187 |
| | 5.02 | % |
| Total commercial loans and leases | 641,376 |
| | 6.14 | % | | 206,079 |
| | 5.30 | % | | 847,455 |
| | 5.93 | % |
| Indirect automobile loans | 542,344 |
| | 5.31 | % | | — |
| | — |
| | 542,344 |
| | 5.31 | % |
| Consumer loans: | | | | | | | | | | | |
| Residential mortgage | 368,095 |
| | 3.87 | % | | 143,014 |
| | 4.18 | % | | 511,109 |
| | 3.93 | % |
| Home equity | 99,683 |
| | 3.45 | % | | 161,879 |
| | 4.07 | % | | 261,562 |
| | 3.83 | % |
| Other consumer | 6,122 |
| | 5.35 | % | | 1,157 |
| | 12.97 | % | | 7,279 |
| | 6.56 | % |
| Total consumer loans | 473,900 |
| | 3.78 | % | | 306,050 |
| | 4.15 | % | | 779,950 |
| | 3.92 | % |
| Total loans and leases | $ | 3,116,102 |
| | 4.89 | % | | $ | 1,059,610 |
| | 4.67 | % | | $ | 4,175,712 |
| | 4.83 | % |
Competition for indirect automobile loans increased significantly in recent years as credit unions and large national banks entered indirect automobile lending. That competition drove interest rates down and, in some cases, changed the manner in which interest rates are developed, from including a dealer-shared spread to imposing a dealer-based fee to originate the loan. Given this market condition, Management ceased the Company's origination of indirect automobile loans in December 2014. For the quarter ended March 31, 2015, the Company sold over 90% of the portfolio for $255.2 million, which resulted in a loss of $11.8 thousand excluding the impact on the allowance for loan and lease losses. Refer to Note 7, "Allowance for Loan and Lease Losses" for the impact of the sale on the Company's allowance for loan and lease losses.
BROOKLINE BANCORP, INC. AND SUBSIDIARIES
Notes to Consolidated Financial Statements (Continued)
December 31, 2015, 2014, 2013 2012 and 2011
The Company's lending is primarily in eastern Massachusetts, southern New Hampshire and Rhode Island, with the exception of equipment financing, 38.2% of which is in the greater New York/New Jersey metropolitan area and 61.8% of which is in other areas in the United States of America.
For the year ended December 31, 2012, the Company sold $19.6 million of loans and leases, which resulted in a $1.9 million gain on sale recorded in non-interest income.
Accretable Yield for the Acquired Loan Portfolio
The following table summarizes activity in the accretable yield for the acquired loan portfolio for the periods indicated:
| | | | Year Ended December 31, | Year Ended December 31, |
| | 2013 | | 2012 | | 2011 | 2015 | | 2014 | | 2013 |
| | (In Thousands) | (In Thousands) |
| Balance at beginning of year | $ | 57,812 |
| | $ | (1,369 | ) | | $ | — |
| $ | 32,044 |
| | $ | 45,789 |
| | $ | 57,812 |
|
| Acquisitions | — |
| | 81,503 |
| | (2,504 | ) | |
| Accretion | | (10,467 | ) | | (15,805 | ) | | (20,500 | ) |
| Reclassification from nonaccretable difference for loans with improved cash flows | 8,477 |
| | 1,550 |
| | — |
| 4,483 |
| | 2,060 |
| | 8,477 |
|
| Accretion | (20,500 | ) | | (23,872 | ) | | 1,135 |
| |
Changes in expected cash flows that do not affect nonaccretable difference (1) | | (5,264 | ) | | — |
| | — |
|
| Balance at end of year | $ | 45,789 |
| | $ | 57,812 |
| | $ | (1,369 | ) | $ | 20,796 |
| | $ | 32,044 |
| | $ | 45,789 |
|
Subsequent(1) Represents changes in interest cash flows due to acquisition,changes in interest rates on variable rate loans.
On a quarterly basis, subsequent to acquisition, Management reforecasts the expected cash flows for acquired ASC 310-30 loans, taking into account prepayment speeds, probability of default and loss given defaults. Management then compares thiscash flow projections per the reforecast to the original estimatescash flow projections and determines whether any reduction in cash flow expectations are due to deterioration, or if the change in cash flow expectation is related to noncredit events. This cash flow analysis is used to evaluate the need for a provision for loan loss provisionand lease losses and/or prospective yield adjustments. During the years ended December 31, 20132015, 2014 and 2012,2013, accretable yield adjustments totaling $8.5$4.5 million, $2.1 million, and $1.6$8.5 million, respectively, were made for certain loan pools. These accretable yield adjustments, which are subject to continued re-assessment, will be recognized over the remaining lives of those pools. No provision for loans losses were recorded in 2012; however, a provision of $0.9 million was recorded during the year ended December 31, 2013 as a result of our reforecasts primarily due to decreases in expected cash flows.
The aggregate remaining nonaccretable difference (representing both principal and interest) applicable to acquired loans and leases totaled $4.5$2.9 million and $13.0$3.6 million atas of December 31, 20132015 and 2012,2014, respectively.
Related Party Loans
The Banks' authority to extend credit to their respective directors and executive officers, as well as to entities controlled by such persons, is currently governed by the requirements of the Sarbanes-Oxley Act and Regulation O of the FRB. Among other things, these provisions require that extensions of credit to insiders (1) be made on terms that are substantially the same as, and follow credit underwriting procedures that are not less stringent than, those prevailing for comparable transactions with unaffiliated persons and that do not involve more than the normal risk of repayment or present other unfavorable features; and (2) not exceed certain limitations on the amount of credit extended to such persons, individually and in the aggregate, which limits are based, in part, on the amount of the Banks' capital. In addition, the extensions of credit to insiders must be approved by eachthe applicable Bank's Board of Directors.
The following table summarizes the change in the total amounts of loans and advances, to directors, executive officers and their affiliates for the periods indicated. All loans were performing atas of December 31, 2013.2015.
|
| | | | | | | |
| | Year Ended December 31, |
| | 2015 | | 2014 |
| | (In Thousands) |
| Balance at beginning of year | $ | 8,574 |
| | $ | 4,783 |
|
| New loans granted during the year | 9,931 |
| | 2,375 |
|
| Loans reclassified as insider loans | 21,481 |
| | — |
|
| Advances on lines of credit | 840 |
| | 1,787 |
|
| Repayments | (1,344 | ) | | (182 | ) |
| Loan no longer classified as an insider loan | (2,107 | ) | | (189 | ) |
| Balance at end of year | $ | 37,375 |
| | $ | 8,574 |
|
BROOKLINE BANCORP, INC. AND SUBSIDIARIES
Notes to Consolidated Financial Statements (Continued)
December 31, 2015, 2014, 2013 2012 and 2011
|
| | | | | | | | | | | |
| | Year Ended December 31, |
| | 2013 | | 2012 | | 2011 |
| | (In Thousands) |
| Balance at beginning of year | $ | 4,083 |
| | $ | 16,428 |
| | $ | 16,399 |
|
| Acquired loans | — |
| | 2,848 |
| | 222 |
|
| New loans granted during the year | 365 |
| | 314 |
| | 288 |
|
| Advances on lines of credit | 1,370 |
| | 109 |
| | — |
|
| Repayments | (1,035 | ) | | (15,281 | ) | | (481 | ) |
| Loan no longer classified as an insider loan | — |
| | (335 | ) | | — |
|
| Loans reclassified as insider loans | 11,327 |
| | — |
| | — |
|
| Balance at end of year | $ | 16,110 |
| | $ | 4,083 |
| | $ | 16,428 |
|
Unfunded commitments on extensions of credit to insiders totaled $14.8 million and $11.7 million and $6.9 million atas of December 31, 20132015 and 2012,2014, respectively.
Loans and Leases Pledged as Collateral
AtAs of December 31, 20132015 and 2012,2014, there were $1.2$1.8 billion and $1.5$1.6 billion, respectively, of loans and leases pledged as collateral for repurchase agreements; municipal deposits; treasury, tax and loan deposits; swap agreements; and FHLBB borrowings. The Banks did not have any outstanding FRB borrowings as of December 31, 2015 and FRB discount window borrowings.2014.
(7) Allowance for Loan and Lease Losses
The following tables present the changes in the allowance for loan and lease losses and the recorded investment in loans and leases by portfolio segment for the periods indicated:
| | | | Year Ended December 31, 2013 | Year Ended December 31, 2015 |
| | Commercial Real Estate | | Commercial | | Indirect Automobile | | Consumer | | Unallocated | | Total | Commercial Real Estate | | Commercial | | Indirect Automobile | | Consumer | | Unallocated | | Total |
| | (In Thousands) | (In Thousands) |
| Balance at December 31, 2012 | $ | 20,018 |
| | $ | 10,655 |
| | $ | 5,304 |
| | $ | 2,545 |
| | $ | 2,630 |
| | $ | 41,152 |
| |
| Balance at December 31, 2014 | | $ | 29,594 |
| | $ | 15,957 |
| | $ | 2,331 |
| | $ | 3,359 |
| | $ | 2,418 |
| | $ | 53,659 |
|
| Charge-offs | (88 | ) | | (2,077 | ) | | (1,714 | ) | | (909 | ) | | — |
| | (4,788 | ) | (550 | ) | | (3,634 | ) | | (1,788 | ) | | (582 | ) | | — |
| | (6,554 | ) |
| Recoveries | 13 |
| | 657 |
| | 501 |
| | 263 |
| | — |
| | 1,434 |
| — |
| | 667 |
| | 1,442 |
| | 102 |
| | — |
| | 2,211 |
|
| Provision (credit) for loan and lease losses | 3,079 |
| | 5,985 |
| | (167 | ) | | 1,476 |
| | 302 |
| | 10,675 |
| 1,107 |
| | 9,028 |
| | (1,716 | ) | | 1,422 |
| | (2,418 | ) | | 7,423 |
|
| Balance at December 31, 2013 | $ | 23,022 |
| | $ | 15,220 |
| | $ | 3,924 |
| | $ | 3,375 |
| | $ | 2,932 |
| | $ | 48,473 |
| |
| Balance at December 31, 2015 | | $ | 30,151 |
| | $ | 22,018 |
| | $ | 269 |
| | $ | 4,301 |
| | $ | — |
| | $ | 56,739 |
|
| | | | Year Ended December 31, 2012 | Year Ended December 31, 2014 |
| | Commercial Real Estate | | Commercial | | Indirect Automobile | | Consumer | | Unallocated | | Total | Commercial Real Estate | | Commercial | | Indirect Automobile | | Consumer | | Unallocated | | Total |
| | (In Thousands) | (In Thousands) |
| Balance at December 31, 2011 | $ | 15,477 |
| | $ | 5,997 |
| | $ | 5,604 |
| | $ | 1,577 |
| | $ | 3,048 |
| | $ | 31,703 |
| |
| Balance at December 31, 2013 | | $ | 23,022 |
| | $ | 15,220 |
| | $ | 3,924 |
| | $ | 3,375 |
| | $ | 2,932 |
| | $ | 48,473 |
|
| Charge-offs | — |
| | (5,347 | ) | | (2,153 | ) | | (592 | ) | | — |
| | (8,092 | ) | (130 | ) | | (2,507 | ) | | (1,163 | ) | | (650 | ) | | — |
| | (4,450 | ) |
| Recoveries | 118 |
| | 417 |
| | 969 |
| | 26 |
| | — |
| | 1,530 |
| 4 |
| | 801 |
| | 434 |
| | 158 |
| | — |
| | 1,397 |
|
| Provision (credit) for loan and lease losses | 4,423 |
| | 9,588 |
| | 884 |
| | 1,534 |
| | (418 | ) | | 16,011 |
| 6,698 |
| | 2,443 |
| | (864 | ) | | 476 |
| | (514 | ) | | 8,239 |
|
| Balance at December 31, 2012 | $ | 20,018 |
| | $ | 10,655 |
| | $ | 5,304 |
| | $ | 2,545 |
| | $ | 2,630 |
| | $ | 41,152 |
| |
| Balance at December 31, 2014 | | $ | 29,594 |
| | $ | 15,957 |
| | $ | 2,331 |
| | $ | 3,359 |
| | $ | 2,418 |
| | $ | 53,659 |
|
BROOKLINE BANCORP, INC. AND SUBSIDIARIES
Notes to Consolidated Financial Statements (Continued)
December 31, 2013, 2012 and 2011
| | | | Year Ended December 31, 2011 | Year Ended December 31, 2013 |
| | Commercial Real Estate | | Commercial | | Indirect Automobile | | Consumer | | Unallocated | | Total | Commercial Real Estate | | Commercial | | Indirect Automobile | | Consumer | | Unallocated | | Total |
| | (In Thousands) | (In Thousands) |
| Balance at December 31, 2010 | $ | 12,398 |
| | $ | 5,293 |
| | $ | 6,952 |
| | $ | 1,638 |
| | $ | 3,414 |
| | $ | 29,695 |
| |
| Balance at December 31, 2012 | | $ | 20,018 |
| | $ | 10,655 |
| | $ | 5,304 |
| | $ | 2,545 |
| | $ | 2,630 |
| | $ | 41,152 |
|
| Charge-offs | (30 | ) | | (773 | ) | | (2,076 | ) | | (12 | ) | | — |
| | (2,891 | ) | (88 | ) | | (2,077 | ) | | (1,714 | ) | | (909 | ) | | — |
| | (4,788 | ) |
| Recoveries | — |
| | 330 |
| | 605 |
| | 8 |
| | — |
| | 943 |
| 13 |
| | 657 |
| | 501 |
| | 263 |
| | — |
| | 1,434 |
|
| Provision (credit) for loan and lease losses | 3,109 |
| | 1,147 |
| | 123 |
| | (57 | ) | | (366 | ) | | 3,956 |
| 3,079 |
| | 5,985 |
| | (167 | ) | | 1,476 |
| | 302 |
| | 10,675 |
|
| Balance at December 31, 2011 | $ | 15,477 |
| | $ | 5,997 |
| | $ | 5,604 |
| | $ | 1,577 |
| | $ | 3,048 |
| | $ | 31,703 |
| |
| Balance at December 31, 2013 | | $ | 23,022 |
| | $ | 15,220 |
| | $ | 3,924 |
| | $ | 3,375 |
| | $ | 2,932 |
| | $ | 48,473 |
|
The liability for unfunded credit commitments, which is included in other liabilities, was $1.0$1.3 million, $0.7$1.3 million and$0.8and $1.0 million at December 31, 2013, 20122015, 2014 and 2011,2013, respectively. The changes in the liability for unfunded credit commitments reflect changes in the estimate of loss exposure associated with certain unfunded credit commitments. No credit commitments were charged off against the liability account in the years ended December 31, 2013, 20122015, 2014 and 2011.2013.
BROOKLINE BANCORP, INC. AND SUBSIDIARIES
Notes to Consolidated Financial Statements (Continued)
December 31, 2015, 2014, 2013
Provision for Credit Losses
The provisions for credit losses are set forth below for the periods indicated:
| | | | Originated | | Acquired | | Total | Originated | | Acquired | | Total |
| | Year Ended December 31, | | Year Ended December 31, | | Year Ended December 31, | Year Ended December 31, | | Year Ended December 31, | | Year Ended December 31, |
| | 2013 | | 2012 | | 2011 | | 2013 | | 2012 | | 2011 | | 2013 | | 2012 | | 2011 | 2015 | | 2014 | | 2013 | | 2015 | | 2014 | | 2013 | | 2015 | | 2014 | | 2013 |
| | (In Thousands) | (In Thousands) |
| Provision for loan and lease losses: | | | | | | | | | | | | | | | | | | |
| Provision (credit) for loan and lease losses: | | | | | | | | | | | | | | | | | | |
| Commercial real estate | $ | 2,563 |
| | $ | 4,348 |
| | $ | 3,109 |
| | $ | 516 |
| | $ | 75 |
| | $ | — |
| | $ | 3,079 |
| | $ | 4,423 |
| | $ | 3,109 |
| $ | 1,459 |
| | $ | 5,009 |
| | $ | 2,563 |
| | $ | (352 | ) | | $ | 1,689 |
| | $ | 516 |
| | $ | 1,107 |
| | $ | 6,698 |
| | $ | 3,079 |
|
| Commercial | 4,917 |
| | 9,513 |
| | 1,147 |
| | 1,068 |
| | 75 |
| | — |
| | 5,985 |
| | 9,588 |
| | 1,147 |
| 9,077 |
| | 2,030 |
| | 4,917 |
| | (49 | ) | | 413 |
| | 1,068 |
| | 9,028 |
| | 2,443 |
| | 5,985 |
|
| Indirect automobile | (167 | ) | | 884 |
| | 123 |
| | — |
| | — |
| | — |
| | (167 | ) | | 884 |
| | 123 |
| (1,716 | ) | | (864 | ) | | (167 | ) | | — |
| | — |
| | — |
| | (1,716 | ) | | (864 | ) | | (167 | ) |
| Consumer | 286 |
| | 1,534 |
| | (57 | ) | | 1,190 |
| | — |
| | — |
| | 1,476 |
| | 1,534 |
| | (57 | ) | 953 |
| | 417 |
| | 286 |
| | 469 |
| | 59 |
| | 1,190 |
| | 1,422 |
| | 476 |
| | 1,476 |
|
| Unallocated | 302 |
| | (418 | ) | | (366 | ) | | — |
| | — |
| | — |
| | 302 |
| | (418 | ) | | (366 | ) | (2,418 | ) | | (514 | ) | | 302 |
| | — |
| | — |
| | — |
| | (2,418 | ) | | (514 | ) | | 302 |
|
| Total provision for loan and lease losses | 7,901 |
| | 15,861 |
| | 3,956 |
| | 2,774 |
| | 150 |
| | — |
| | 10,675 |
| | 16,011 |
| | 3,956 |
| 7,355 |
| | 6,078 |
| | 7,901 |
| | 68 |
| | 2,161 |
| | 2,774 |
| | 7,423 |
| | 8,239 |
| | 10,675 |
|
| Unfunded credit commitments | 254 |
| | (123 | ) | | (325 | ) | | — |
| | — |
| | — |
| | 254 |
| | (123 | ) | | (325 | ) | 28 |
| | 238 |
| | 254 |
| | — |
| | — |
| | — |
| | 28 |
| | 238 |
| | 254 |
|
| Total provision for credit losses | $ | 8,155 |
| | $ | 15,738 |
| | $ | 3,631 |
| | $ | 2,774 |
| | $ | 150 |
| | $ | — |
| | $ | 10,929 |
| | $ | 15,888 |
| | $ | 3,631 |
| $ | 7,383 |
| | $ | 6,316 |
| | $ | 8,155 |
| | $ | 68 |
| | $ | 2,161 |
| | $ | 2,774 |
| | $ | 7,451 |
| | $ | 8,477 |
| | $ | 10,929 |
|
Allowance for Loan and Lease Losses Methodology
Management has established a methodology to determine the adequacy of the allowance for loan and lease losses that assesses the risks and losses inherent in the loan and lease portfolio. Additions to the allowance for loan and lease losses are made by charges to the provision for credit losses. Losses on loans and leases are charged off against the allowance when all or a portion of a loan or lease is considered uncollectible. Subsequent recoveries on loans previously charged off, if any, are credited to the allowance when realized.
Management uses a consistent and systematic process and methodology to evaluate the adequacy of the allowance for loan and lease losses on a quarterly basis. For purposes of determining the allowance for loan and lease losses, the Company has segmented certain loans and leases in the portfolio by product type into the following pools:segments: (1) commercial real estate loans, (2) commercial loans and leases, (3) indirect automobile loans and (4) consumer loans. Portfolio segments are further disaggregated into classes based on the associated risks within the segments. Commercial real estate loans are divided into three classes: commercial real estate mortgage loans, multi-family mortgage loans, and construction loans. Commercial loans and leases are divided into three classes: commercial loans which includes taxi medallion loans, equipment financing, and loans to condominium associations. The indirect automobile loan segment is not divided into classes. Consumer loans are divided into threefour classes: residential mortgage loans, home equity loans, indirect automobile loans, and other consumer loans. A formula-based credit evaluation approach is applied to each group, coupled with an analysis of certain loans for impairment. For each class of loan, managementManagement makes significant judgments in selecting the estimation method that fits the credit characteristics of its class and portfolio segment as set forth below. (ReferAlso refer to Note 1, "Basis of Presentation," in the consolidated financial statements for more information on the Company's allowance of loan and lease losses methodology.)
General Allowance
The general allowance related to loans collectively evaluated for loanimpairment is determined using a formula-based approach utilizing the risk ratings of individual credits and leaseloss factors derived from historic portfolio loss rates, which include estimates of incurred losses over an estimated loss emergence period (“LEP”). The LEP was $44.1 million at December 31, 2013, comparedgenerated utilizing a charge-off look-back analysis which studied the time from the first indication of elevated risk of repayment (or other early event indicating a problem) to $36.8 million at December 31, 2012.eventual charge-off to support the LEP considered in the allowance calculation. This reserving methodology established the approximate number of months of LEP that represents incurred losses for each portfolio. In addition to quantitative measures, relevant qualitative factors include, but are not limited to: (1) levels and trends in past due and impaired loans, (2) levels and trends in charge-offs, (3) changes in underwriting standards, policy exceptions, and credit policy, (4) experience of lending management and staff, (5) economic trends, (6) industry conditions, (7) effects of changes in credit concentrations, (8) interest rate environment, and (9) regulatory and other changes. The general portionallowance related to the acquired loans collectively evaluated for impairment is determined based upon the degree, if any, of deterioration in the allowance for loan and lease losses increased by $7.3 million during the yearpooled
BROOKLINE BANCORP, INC. AND SUBSIDIARIES
Notes to Consolidated Financial Statements (Continued)
December 31, 2015, 2014, 2013 2012 and 2011
loans subsequent to acquisition. The qualitative factors used in the determination are the same as those used for originated loans.
During the third quarter of 2015, the Company enhanced and refined its general allowance methodology to provide further quantification of probable losses in the portfolio. Under the enhanced methodology, Management combined the historical loss histories of the Banks to generate a single set of ratios. Management believes it is appropriate to aggregate the ratios as the Banks share common environmental factors, operate in similar geographic markets, and utilize common underwriting standards in accordance with the Company's Credit Policy. In prior periods, a historical loss history applicable to each Bank was used.
Management employed a similar analysis for the consolidation of the qualitative factors as it did for the quantitative factors. Again, Management believes the realignment of the existing nine qualitative factors used at each of the Banks into a single group of factors for use across the Company is appropriate based on the commonality of environmental factors, markets and underwriting standards among the Banks. In prior periods each of the Banks utilized a set of qualitative factors applicable to each Bank.
The Company’s December 31, 2015 allowance calculation included a further segmentation of the commercial loans and leases to reflect the increased risk in the Company’s taxi medallion portfolio. As of December 31, 2015, this portfolio is approximately $35.8 million. Based on industry conditions, Management established a specific loss factor for this portfolio that best represents the changing risks associated with it.
Based on the refinements to the Company’s allowance methodology discussed above, Management determined that the potential risks anticipated by the unallocated allowance are now incorporated into the allowance methodology, making the unallocated allowance unnecessary. In prior periods, the unallocated allowance was used to recognize the estimated risk associated with the allocated general and specific allowances. It incorporated Management’s evaluation of existing conditions that were not included in the allocated allowance determinations and provided for losses that arise outside of the ordinary course of business.
Specific valuation allowances are established for impaired originated loans with book values greater than the discounted present value of expected future cash flows or, in the case of collateral-dependent impaired loans, for any excess of a loan's book balance and the fair value of its underlying collateral. Specific valuation allowances are established for acquired loans with deterioration in the discounted present value of expected future cash flows since acquisitions or, in the case of collateral dependent impaired loans, for any increase in the excess of a loan's book balance greater than the fair value of its underlying collateral. A specific valuation allowance for losses on TDR loans is determined by comparing the net carrying amount of the troubled debt restructured loan with the restructured loan's cash flows discounted at the original effective rate. Impaired loans are reviewed quarterly with adjustments made to the calculated reserve as necessary.
As of December 31, 2015, Management believes that the methodology for calculating the allowance is sound and that the allowance provides a reasonable basis for determining and reporting on probable losses in the Company’s loan portfolios.
The general allowance for loan and lease losses was $53.1 million as of December 31, 2015, compared to $50.1 million as of December 31, 2014. The general portion of the allowance for loan and lease losses increased by $3.0 million during the year ended December 31, 2013,2015, as a result of growth in the commercial real estate and equipment financingcommercial and industrial portfolios partially offset by the decrease in the indirect auto portfolios.portfolios, which resulted in a release of $1.9 million in the general allowance for loan and lease losses in the first quarter of 2015.
Specific Allowance
The specific allowance for loan and lease losses was $1.5$3.6 million atas of December 31, 2013,2015, compared to $1.7$1.2 million atas of December 31, 2012.2014. The specific allowance decreasedincreased by $0.2$2.5 million during the year ended December 31, 2013, largely as2015, primarily due to one commercial relationship which was downgraded during the year ended December 31, 2015.
The changes to the methodology described above resulted in a resultreallocation of a large commercial real estatereserve from unallocated to specific loan payoff, offset by an increase in specific reserves onsegments. As such, the equipment financing portfolio.
Unallocated Allowance
Thereserve for unallocated allowance for loan and lease losses was $2.9 million atas of December 31, 2013,2015 was reduced to zero, compared to $2.6$2.4 million atas of December 31, 2012. The unallocated portion of the allowance for loan and lease losses increased by $0.3 million during the year ended December 31, 2013, largely as a result of a change in the mix of the loan portfolio and loan growth.2014.
Credit Quality Assessment
BROOKLINE BANCORP, INC. AND SUBSIDIARIES
Notes to Consolidated Financial Statements (Continued)
December 31, 2015, 2014, 2013
At the time of loan origination, a rating is assigned based on the capacity to pay and general financial strength of the borrower, and the value of assets pledged as collateral.collateral, and the evaluation of third party support such as a guarantor. The Company continually monitors the asset quality of the loan portfolio using all available information. The officer responsible for handling each loan is required to initiate changes to risk ratings when changes in facts and circumstances occur that warrant an upgrade or downgrade in a loan rating. Based on this information, loans demonstrating certain payment issues or other weaknesses may be categorized as delinquent, impaired, nonperforming and/or put on nonaccrual status. Additionally, in the course of resolving such loans, the Company may choose to restructure the contractual terms of certain loans to match the borrower's ability to repay the loan based on their current financial condition. If a restructured loan meets certain criteria, it may be categorized as a troubled debt restructuring.
The Company reviews numerous credit quality indicators when assessing the risk in its loan portfolio. For the commercial real estate mortgage, multi-family mortgage, construction, commercial, equipment financing, condominium association and other consumer loan and lease classes,all loans, the Company utilizes an eight-grade loan rating system, which assigns a risk rating to each borrower based on a number of quantitative and qualitative factors associated with a loan transaction. Factors considered include industry and market conditions; position within the industry; earnings trends; operating cash flow; asset/liability values; debt capacity; guarantor strength; management and controls; financial reporting; collateral; and other considerations. In addition, the Company's independent loan review group evaluates the credit quality and related risk ratings of the commercial real estate and commercialin all loan portfolios. The results of these reviews are reported to the AuditRisk Committee of the Board of Directors on a periodic basis and annually to the Board of Directors. For the indirect automobile portfolio,consumer loans, the Company primarilyheavily relies on payment status for monitoringcalibrating credit risk while for residential mortgage and home equity portfolios loan-to-value ratios are used as the primary credit quality indicator.risk.
The ratings categories used for assessing credit risk in the commercial real estate, mortgage, multi-family mortgage, construction, commercial, equipment financing, condominium association and other consumer loan and lease classes are defined as follows:
1 -4 Rating—Pass
Loan rating grades "1" through "4" are classified as "Pass," which indicates borrowers are performing in accordance with the terms of the loan and are less likely to result in loss due to the capacity of the borrower to pay and the adequacy of the value of assets pledged as collateral.
5 Rating—Other AssetAssets Especially Mentioned ("OAEM")
Borrowers exhibit potential credit weaknesses or downward trends deserving management'sManagement's attention. If not checked or corrected, these trends will weaken the Company's asset and position. While potentially weak, currently these borrowers are marginally acceptable; no loss of principal or interest is envisioned.
6 Rating—Substandard
Borrowers exhibit well defined weaknesses that jeopardize the orderly liquidation of debt. Substandard loans may be inadequately protected by the current net worth and paying capacity of the obligors or by the collateral pledged, if any. Normal repayment from the borrower is in jeopardy. Although no loss of principal is envisioned, there is a distinct possibility that a
BROOKLINE BANCORP, INC. AND SUBSIDIARIES
Notes to Consolidated Financial Statements (Continued)
December 31, 2013, 2012 and 2011
partial loss of interest and/or principal will occur if the deficiencies are not corrected. Collateral coverage may be inadequate to cover the principal obligation.
7 Rating—Doubtful
Borrowers exhibit well-defined weaknesses that jeopardize the orderly liquidation of debt with the added provision that the weaknesses make collection of the debt in full, on the basis of currently existing facts, conditions, and values, highly questionable and improbable. Serious problems exist to the point where partial loss of principal is likely.
8 Rating—Definite Loss
Borrowers deemed incapable of repayment. Loans to such borrowers are considered uncollectible and of such little value that continuation as active assets of the Company is not warranted.
Assets rated as "OAEM," "substandard" or "doubtful" based on criteria established under banking regulations are collectively referred to as "criticized" assets.
Credit Quality Information
The following tables present the recorded investment in total loans in each class (unpaid balance of loans and leases outstanding excluding deferred loan origination costs) at December 31, 2013 by credit quality indicator.
|
| | | | | | | | | | | | | | | | | | | | | | | | | | | |
| | At December 31, 2013 |
| | Commercial Real Estate Mortgage | | Multi- Family Mortgage | | Construction | | Commercial | | Equipment Financing | | Condominium Association | | Other Consumer |
| | (In Thousands) |
| Originated: | | | | | | | | | | | | | |
| Loan rating: | | | | | | | | | | | | | |
| Pass | $ | 1,099,108 |
| | $ | 554,183 |
| | $ | 102,927 |
| | $ | 295,057 |
| | $ | 479,811 |
| | $ | 44,793 |
| | $ | 5,528 |
|
| OAEM | 11,555 |
| | 372 |
| | — |
| | 49 |
| | 625 |
| | — |
| | — |
|
| Substandard | 1,087 |
| | — |
| | — |
| | 1,078 |
| | 4,817 |
| | 1 |
| | 4 |
|
| Doubtful | — |
| | — |
| | — |
| | 1,500 |
| | 77 |
| | — |
| | — |
|
| Total originated | 1,111,750 |
| | 554,555 |
| | 102,927 |
| | 297,684 |
| | 485,330 |
| | 44,794 |
| | 5,532 |
|
| | | | | | | | | | | | | | |
| Acquired: | | | | | | | | | | | | | |
| Loan rating: | | | | | | | | | | | | | |
| Pass | 332,145 |
| | 69,310 |
| | 10,090 |
| | 96,779 |
| | 27,535 |
| | — |
| | 1,509 |
|
| OAEM | 7,556 |
| | 463 |
| | 688 |
| | 4,617 |
| | 61 |
| | — |
| | — |
|
| Substandard | 8,645 |
| | 3,605 |
| | — |
| | 8,518 |
| | 98 |
| | — |
| | 14 |
|
| Doubtful | 1,889 |
| | — |
| | — |
| | 194 |
| | — |
| | — |
| | — |
|
| Total acquired | 350,235 |
| | 73,378 |
| | 10,778 |
| | 110,108 |
| | 27,694 |
| | — |
| | 1,523 |
|
| | | | | | | | | | | | | | |
| Total loans by class | $ | 1,461,985 |
| | $ | 627,933 |
| | $ | 113,705 |
| | $ | 407,792 |
| | $ | 513,024 |
| | $ | 44,794 |
| | $ | 7,055 |
|
BROOKLINE BANCORP, INC. AND SUBSIDIARIES
Notes to Consolidated Financial Statements (Continued)
December 31, 2013, 2012 and 2011
|
| | | | | | |
| | At December 31, 2013 |
| | Indirect Automobile |
| | Dollars In Thousands | | Percent |
| Originated: | | | |
| Credit score: | | | |
| Over 700 | $ | 332,140 |
| | 82.9 | % |
| 661-700 | 54,038 |
| | 13.5 | % |
| 660 and below | 12,793 |
| | 3.2 | % |
| Data not available | 1,560 |
| | 0.4 | % |
| | $ | 400,531 |
| | 100.0 | % |
|
| | | | | | | | | | | | | | |
| | | At December 31, 2013 |
| | | Residential Mortgage | | Home Equity |
| | | Dollars In Thousands | | Percent | | Dollars In Thousands | | Percent |
| Originated: | | | | | | | | |
| Loan-to-value ratio: | | |
| | | | |
| | |
| Less than 50% | | $ | 94,500 |
| | 17.9 | % | | $ | 75,372 |
| | 29.3 | % |
| 50% - 69% | | 149,969 |
| | 28.4 | % | | 31,504 |
| | 12.2 | % |
| 70% - 79% | | 139,960 |
| | 26.5 | % | | 21,161 |
| | 8.2 | % |
| 80% and over | | 22,772 |
| | 4.3 | % | | 3,240 |
| | 1.3 | % |
| Data not available | | 4,353 |
| | 0.8 | % | | 1,119 |
| | 0.4 | % |
| Total originated | | 411,554 |
| | 77.9 | % | | 132,396 |
| | 51.4 | % |
| | | | | | | | | |
| Acquired: | | |
| | | | |
| | |
| Loan-to-value ratio: | | |
| | | | |
| | |
| Less than 50% | | $ | 23,101 |
| | 4.4 | % | | $ | 84,272 |
| | 32.7 | % |
| 50%—69% | | 39,298 |
| | 7.4 | % | | 25,964 |
| | 10.1 | % |
| 70%—79% | | 31,932 |
| | 6.0 | % | | 13,390 |
| | 5.2 | % |
| 80% and over | | 19,870 |
| | 3.8 | % | | 1,208 |
| | 0.5 | % |
| Data not available | | 2,430 |
| | 0.5 | % | | 231 |
| | 0.1 | % |
| Total acquired | | 116,631 |
| | 22.1 | % | | 125,065 |
| | 48.6 | % |
| | | | | | | | | |
| Total loans | | $ | 528,185 |
| | 100.0 | % | | $ | 257,461 |
| | 100.0 | % |
The following tables present the recorded investment in loans in each class (unpaid balance of loans and leases outstanding excluding deferred loan origination costs) at December 31, 2012 by credit quality indicator.
BROOKLINE BANCORP, INC. AND SUBSIDIARIES
Notes to Consolidated Financial Statements (Continued)
December 31, 2015, 2014, 2013 2012 and 2011
Credit Quality Information
The following tables present the recorded investment in loans in each class as of December 31, 2015 by credit quality indicator.
| | | | At December 31, 2012 | At December 31, 2015 |
| | Commercial Real Estate Mortgage | | Multi- Family Mortgage | | Construction | | Commercial | | Equipment Financing | | Condominium Association | | Other Consumer | Commercial Real Estate | | Multi- Family Mortgage | | Construction | | Commercial | | Equipment Financing | | Condominium Association | | Other Consumer |
| | (In Thousands) | (In Thousands) |
| Originated: | | | | | | | | | | | | | | | | | | | | | | | | | | |
| Loan rating: | | | | | | | | | | | | | | | | | | | | | | | | | | |
| Pass | $ | 863,901 |
| | $ | 504,883 |
| | $ | 80,913 |
| | $ | 227,201 |
| | $ | 359,064 |
| | $ | 44,179 |
| | $ | 6,093 |
| $ | 1,668,891 |
| | $ | 619,786 |
| | $ | 129,534 |
| | $ | 562,615 |
| | $ | 709,381 |
| | $ | 59,875 |
| | $ | 12,017 |
|
| OAEM | 5,686 |
| | 146 |
| | — |
| | 1,196 |
| | 2,979 |
| | — |
| | — |
| 12,781 |
| | 788 |
| | 208 |
| | 9,976 |
| | 804 |
| | — |
| | — |
|
| Substandard | 1,965 |
| | 988 |
| | — |
| | 502 |
| | 4,213 |
| | 8 |
| | 29 |
| 780 |
| | 291 |
| | — |
| | 1,714 |
| | 1,414 |
| | — |
| | 22 |
|
| Doubtful | — |
| | — |
| | — |
| | 1,993 |
| | 41 |
| | — |
| | — |
| 2,096 |
| | — |
| | — |
| | 2,294 |
| | 1,389 |
| | — |
| | — |
|
| Total originated | 871,552 |
| | 506,017 |
| | 80,913 |
| | 230,892 |
| | 366,297 |
| | 44,187 |
| | 6,122 |
| 1,684,548 |
| | 620,865 |
| | 129,742 |
| | 576,599 |
| | 712,988 |
| | 59,875 |
| | 12,039 |
|
| | | | | | | | | | | | | | | | | | | | | | | | | | | |
| Acquired: | | | | | | | | | | | | | | | | | | | | | | | | | | |
| Loan rating: | | | | | | | | | | | | | | | | | | | | | | | | | | |
| Pass | 409,725 |
| | 93,058 |
| | 17,186 |
| | 140,589 |
| | 54,175 |
| | — |
| | 1,157 |
| 182,377 |
| | 35,785 |
| | 580 |
| | 11,959 |
| | 8,902 |
| | — |
| | 131 |
|
| OAEM | 2,740 |
| | 2,439 |
| | — |
| | 1,344 |
| | 286 |
| | — |
| | — |
| 1,202 |
| | 612 |
| | — |
| | 902 |
| | — |
| | — |
| | — |
|
| Substandard | 17,216 |
| | 5,019 |
| | 98 |
| | 8,635 |
| | 233 |
| | — |
| | — |
| 7,066 |
| | 1,218 |
| | — |
| | 3,071 |
| | — |
| | — |
| | — |
|
| Doubtful | — |
| | — |
| | — |
| | 817 |
| | — |
| | — |
| | — |
| 399 |
| | — |
| | — |
| | — |
| | — |
| | — |
| | — |
|
| Total acquired | 429,681 |
| | 100,516 |
| | 17,284 |
| | 151,385 |
| | 54,694 |
| | — |
| | 1,157 |
| 191,044 |
| | 37,615 |
| | 580 |
| | 15,932 |
| | 8,902 |
| | — |
| | 131 |
|
| | | | | | | | | | | | | | | | | | | | | | | | | | | |
| Total loans by class | $ | 1,301,233 |
| | $ | 606,533 |
| | $ | 98,197 |
| | $ | 382,277 |
| | $ | 420,991 |
| | $ | 44,187 |
| | $ | 7,279 |
| |
| Total loans | | $ | 1,875,592 |
| | $ | 658,480 |
| | $ | 130,322 |
| | $ | 592,531 |
| | $ | 721,890 |
| | $ | 59,875 |
| | $ | 12,170 |
|
As of December 31, 2015, there were no loans categorized as definite loss.
| | | | At December 31, 2012 | At December 31, 2015 |
| | Indirect Automobile | Indirect Automobile |
| | Dollars In Thousands | | Percent | ($ In Thousands) |
| Originated: | | | | | | |
| Credit score: | | | | | | |
| Over 700 | $ | 454,056 |
| | 83.7 | % | $ | 5,435 |
| | 39.7 | % |
| 661-700 | 69,319 |
| | 12.8 | % | 1,965 |
| | 14.4 | % |
| 660 and below | 16,934 |
| | 3.1 | % | 6,217 |
| | 45.5 | % |
| Data not available | 2,035 |
| | 0.4 | % | 61 |
| | 0.4 | % |
| | $ | 542,344 |
| | 100.0 | % | |
| Total loans | | $ | 13,678 |
| | 100.0 | % |
BROOKLINE BANCORP, INC. AND SUBSIDIARIES
Notes to Consolidated Financial Statements (Continued)
December 31, 2015, 2014, 2013 2012 and 2011
|
| | | | | | | | | | | | | | |
| | | At December 31, 2012 |
| | | Residential Mortgage | | Home Equity |
| | | Dollars In Thousands | | Percent | | Dollars In Thousands | | Percent |
| Originated: | | | | | | | | |
| Loan-to-value ratio: | | |
| | | | |
| | |
| Less than 50% | | $ | 86,659 |
| | 17.0 | % | | $ | 50,398 |
| | 19.3 | % |
| 50%—69% | | 142,172 |
| | 27.8 | % | | 25,284 |
| | 9.7 | % |
| 70%—79% | | 111,234 |
| | 21.8 | % | | 16,523 |
| | 6.3 | % |
| 80% and over | | 27,858 |
| | 5.4 | % | | 6,042 |
| | 2.3 | % |
| Data not available | | 172 |
| | — | % | | 1,436 |
| | 0.5 | % |
| | | 368,095 |
| | 72.0 | % | | 99,683 |
| | 38.1 | % |
| Acquired: | | |
| | | | |
| | |
| Loan-to-value ratio: | | |
| | | | |
| | |
| Less than 50% | | 23,398 |
| | 4.6 | % | | 28,401 |
| | 10.9 | % |
| 50%—69% | | 42,214 |
| | 8.2 | % | | 39,385 |
| | 15.1 | % |
| 70%—79% | | 42,748 |
| | 8.4 | % | | 33,044 |
| | 12.6 | % |
| 80% and over | | 31,614 |
| | 6.2 | % | | 34,267 |
| | 13.1 | % |
| Data not available | | 3,040 |
| | 0.6 | % | | 26,782 |
| | 10.2 | % |
| | | 143,014 |
| | 28.0 | % | | 161,879 |
| | 61.9 | % |
| | | | | | | | | |
| Total loans | | $ | 511,109 |
| | 100.0 | % | | $ | 261,562 |
| | 100.0 | % |
|
| | | | | | | | | | | | | | |
| | | At December 31, 2015 |
| | | Residential Mortgage | | Home Equity |
| | | ($ In Thousands) | | ($ In Thousands) |
| Originated: | | | | | | | | |
| Loan-to-value ratio: | | |
| | | | |
| | |
| Less than 50% | | $ | 118,628 |
| | 19.2 | % | | $ | 131,584 |
| | 41.8 | % |
| 50% - 69% | | 214,390 |
| | 34.8 | % | | 51,492 |
| | 16.4 | % |
| 70% - 79% | | 173,774 |
| | 28.2 | % | | 32,916 |
| | 10.5 | % |
| 80% and over | | 17,808 |
| | 2.9 | % | | 18,082 |
| | 5.7 | % |
| Data not available | | 3,246 |
| | 0.5 | % | | 634 |
| | 0.2 | % |
| Total originated | | 527,846 |
| | 85.6 | % | | 234,708 |
| | 74.6 | % |
| | | | | | | | | |
| Acquired: | | |
| | | | |
| | |
| Loan-to-value ratio: | | |
| | | | |
| | |
| Less than 50% | | 18,857 |
| | 3.1 | % | | 48,563 |
| | 15.4 | % |
| 50%—69% | | 32,986 |
| | 5.3 | % | | 20,623 |
| | 6.6 | % |
| 70%—79% | | 17,883 |
| | 2.9 | % | | 7,144 |
| | 2.3 | % |
| 80% and over | | 14,011 |
| | 2.3 | % | | 2,650 |
| | 0.8 | % |
| Data not available | | 4,866 |
| | 0.8 | % | | 865 |
| | 0.3 | % |
| Total acquired | | 88,603 |
| | 14.4 | % | | 79,845 |
| | 25.4 | % |
| | | | | | | | | |
| Total loans | | $ | 616,449 |
| | 100.0 | % | | $ | 314,553 |
| | 100.0 | % |
BROOKLINE BANCORP, INC. AND SUBSIDIARIES
Notes to Consolidated Financial Statements (Continued)
December 31, 2015, 2014, 2013 2012 and 2011
The following tables present the recorded investment in loans in each class as of December 31, 2014 by credit quality indicator.
|
| | | | | | | | | | | | | | | | | | | | | | | | | | | |
| | At December 31, 2014 |
| | Commercial Real Estate | | Multi- Family Mortgage | | Construction | | Commercial | | Equipment Financing | | Condominium Association | | Other Consumer |
| | (In Thousands) |
| Originated: | | | | | | | | | | | | | |
| Loan rating: | | | | | | | | | | | | | |
| Pass | $ | 1,402,121 |
| | $ | 574,972 |
| | $ | 146,074 |
| | $ | 447,778 |
| | $ | 583,340 |
| | $ | 51,593 |
| | $ | 11,540 |
|
| OAEM | 22,491 |
| | 1,242 |
| | — |
| | 12,193 |
| | 932 |
| | — |
| | — |
|
| Substandard | 1,009 |
| | — |
| | — |
| | 1,671 |
| | 2,338 |
| | — |
| | 40 |
|
| Doubtful | — |
| | — |
| | — |
| | 1,088 |
| | 886 |
| | — |
| | — |
|
| Total originated | 1,425,621 |
| | 576,214 |
| | 146,074 |
| | 462,730 |
| | 587,496 |
| | 51,593 |
| | 11,580 |
|
| | | | | | | | | | | | | | |
| Acquired: | | | | | | | | | | | | | |
| Loan rating: | | | | | | | | | | | | | |
| Pass | 237,439 |
| | 60,837 |
| | 1,709 |
| | 43,925 |
| | 13,795 |
| | — |
| | 167 |
|
| OAEM | 8,351 |
| | 713 |
| | 230 |
| | 1,852 |
| | — |
| | — |
| | — |
|
| Substandard | 8,250 |
| | 1,942 |
| | — |
| | 5,424 |
| | 133 |
| | — |
| | — |
|
| Doubtful | 421 |
| | — |
| | — |
| | 146 |
| | — |
| | — |
| | — |
|
| Total acquired | 254,461 |
| | 63,492 |
| | 1,939 |
| | 51,347 |
| | 13,928 |
| | — |
| | 167 |
|
| | | | | | | | | | | | | | |
| Total loans | $ | 1,680,082 |
| | $ | 639,706 |
| | $ | 148,013 |
| | $ | 514,077 |
| | $ | 601,424 |
| | $ | 51,593 |
| | $ | 11,747 |
|
As of December 31, 2014, there were no loans categorized as definite loss.
|
| | | | | | |
| | At December 31, 2014 |
| | Indirect Automobile |
| | ($ In Thousands) |
| Originated: | | | |
| Credit score: | | | |
| Over 700 | $ | 262,160 |
| | 82.7 | % |
| 661-700 | 43,422 |
| | 13.7 | % |
| 660 and below | 9,927 |
| | 3.1 | % |
| Data not available | 1,478 |
| | 0.5 | % |
| Total loans | $ | 316,987 |
| | 100.0 | % |
BROOKLINE BANCORP, INC. AND SUBSIDIARIES
Notes to Consolidated Financial Statements (Continued)
December 31, 2015, 2014, 2013
|
| | | | | | | | | | | | | | |
| | | At December 31, 2014 |
| | | Residential Mortgage | | Home Equity |
| | | ($ In Thousands) | | ($ In Thousands) |
| Originated: | | | | | | | | |
| Loan-to-value ratio: | | |
| | | | |
| | |
| Less than 50% | | $ | 105,342 |
| | 18.4 | % | | $ | 113,541 |
| | 39.5 | % |
| 50%—69% | | 179,319 |
| | 31.4 | % | | 35,660 |
| | 12.4 | % |
| 70%—79% | | 166,467 |
| | 29.1 | % | | 27,123 |
| | 9.4 | % |
| 80% and over | | 19,335 |
| | 3.4 | % | | 4,195 |
| | 1.5 | % |
| Data not available | | 1,615 |
| | 0.3 | % | | 1,061 |
| | 0.4 | % |
| Total originated | | 472,078 |
| | 82.6 | % | | 181,580 |
| | 63.2 | % |
| | | | | | | | | |
| Acquired: | | |
| | | | |
| | |
| Loan-to-value ratio: | | |
| | | | |
| | |
| Less than 50% | | 19,574 |
| | 3.4 | % | | 70,293 |
| | 24.5 | % |
| 50%—69% | | 35,131 |
| | 6.2 | % | | 22,581 |
| | 7.9 | % |
| 70%—79% | | 22,972 |
| | 4.0 | % | | 10,569 |
| | 3.7 | % |
| 80% and over | | 16,268 |
| | 2.8 | % | | 1,178 |
| | 0.4 | % |
| Data not available | | 5,897 |
| | 1.0 | % | | 857 |
| | 0.3 | % |
| Total acquired | | 99,842 |
| | 17.4 | % | | 105,478 |
| | 36.8 | % |
| | | | | | | | | |
| Total loans | | $ | 571,920 |
| | 100.0 | % | | $ | 287,058 |
| | 100.0 | % |
The following table presents information regarding foreclosed residential real estate property at the dates indicated:
|
| | | | | | | |
| | At December 31, 2015 | | At December 31, 2014 |
| | (In Thousands) |
| Foreclosed residential real estate property held by the creditor | $ | 362 |
| | $ | 410 |
|
| Recorded investment in mortgage loans collateralized by residential real estate property that are in the process of foreclosure | 298 |
| | — |
|
BROOKLINE BANCORP, INC. AND SUBSIDIARIES
Notes to Consolidated Financial Statements (Continued)
December 31, 2015, 2014, 2013
Age Analysis of Past Due Loans and Leases
The following tables present an age analysis of the recorded investment in total loans and leases (unpaid balanceas of loans and leases outstanding excluding deferred loan origination costs) at December 31, 20132015 and 2012.2014.
|
| | | | | | | | | | | | | | | | | | | | | | | | | | | | | | | |
| | At December 31, 2013 |
| | Past Due | | | | | | Loans and Leases Past Due Greater Than 90 Days and Accruing | | |
| | 31-60 Days | | 61-90 Days | | Greater Than 90 Days | | Total | | Current | | Total Loans and Leases | | | Nonaccrual Loans and Leases |
| | (In Thousands) |
| Originated: | | | | | | | | | | | | | | | |
| Commercial real estate loans: | | | | | | | | | | | | | | | |
| Commercial real estate mortgage | $ | 4,896 |
| | $ | 1,393 |
| | $ | 169 |
| | $ | 6,458 |
| | $ | 1,105,292 |
| | $ | 1,111,750 |
| | $ | — |
| | $ | 169 |
|
| Multi-family mortgage | 14,400 |
| | — |
| | — |
| | 14,400 |
| | 540,155 |
| | 554,555 |
| | — |
| | — |
|
| Construction | — |
| | — |
| | — |
| | — |
| | 102,927 |
| | 102,927 |
| | — |
| | — |
|
| Total commercial real estate loans | 19,296 |
| | 1,393 |
| | 169 |
| | 20,858 |
| | 1,748,374 |
| | 1,769,232 |
| | — |
| | 169 |
|
| Commercial loans and leases: | | | | | | | | | | | | | | | |
| Commercial | 2,288 |
| | 75 |
| | 842 |
| | 3,205 |
| | 294,479 |
| | 297,684 |
| | — |
| | 1,551 |
|
| Equipment financing | 867 |
| | 1,558 |
| | 2,031 |
| | 4,456 |
| | 480,874 |
| | 485,330 |
| | — |
| | 4,086 |
|
| Condominium association | — |
| | — |
| | — |
| | — |
| | 44,794 |
| | 44,794 |
| | — |
| | 1 |
|
| Total commercial loans and leases | 3,155 |
| | 1,633 |
| | 2,873 |
| | 7,661 |
| | 820,147 |
| | 827,808 |
| | — |
| | 5,638 |
|
| Indirect automobile | 5,407 |
| | 857 |
| | 229 |
| | 6,493 |
| | 394,038 |
| | 400,531 |
| | 10 |
| | 259 |
|
| Consumer loans: | | | | | | | | | | | | | | | |
| Residential mortgage | 201 |
| | — |
| | 415 |
| | 616 |
| | 410,938 |
| | 411,554 |
| | — |
| | 1,713 |
|
| Home equity | 218 |
| | — |
| | — |
| | 218 |
| | 132,178 |
| | 132,396 |
| | — |
| | 462 |
|
| Other consumer | 11 |
| | 1 |
| | 4 |
| | 16 |
| | 5,516 |
| | 5,532 |
| | — |
| | 4 |
|
| Total consumer loans | 430 |
| | 1 |
| | 419 |
| | 850 |
| | 548,632 |
| | 549,482 |
| | — |
|
| 2,179 |
|
| Total originated loans and leases | $ | 28,288 |
| | $ | 3,884 |
| | $ | 3,690 |
| | $ | 35,862 |
| | $ | 3,511,191 |
| | $ | 3,547,053 |
| | $ | 10 |
| | $ | 8,245 |
|
BROOKLINE BANCORP, INC. AND SUBSIDIARIES
Notes to Consolidated Financial Statements (Continued)
December 31, 2013, 2012 and 2011
|
| | | | | | | | | | | | | | | | | | | | | | | | | | | | | | | |
| | At December 31, 2013 |
| | Past Due | | | | | | Loans and Leases Past Due Greater Than 90 Days and Accruing | | |
| | 31-60 Days | | 61-90 Days | | Greater Than 90 Days | | Total | | Current | | Total Loans and Leases | | | Nonaccrual Loans and Leases |
| | (In Thousands) |
| Acquired: | | | | | | | | | | | | | | | |
| Commercial real estate loans: | | | | | | | | | | | | | | | |
| Commercial real estate mortgage | $ | 1,221 |
| | $ | 87 |
| | $ | 4,887 |
| | $ | 6,195 |
| | $ | 344,040 |
| | $ | 350,235 |
| | $ | 3,958 |
| | $ | 929 |
|
| Multi-family mortgage | 327 |
| | — |
| | 1,052 |
| | 1,379 |
| | 71,999 |
| | 73,378 |
| | 1,052 |
| | — |
|
| Construction | — |
| | 409 |
| | — |
| | 409 |
| | 10,369 |
| | 10,778 |
| | — |
| | — |
|
| Total commercial real estate loans | 1,548 |
| | 496 |
| | 5,939 |
| | 7,983 |
| | 426,408 |
| | 434,391 |
| | 5,010 |
| | 929 |
|
| Commercial loans and leases: | | | | | | | | | | | | | | | |
| Commercial | 2,707 |
| | 121 |
| | 1,931 |
| | 4,759 |
| | 105,349 |
| | 110,108 |
| | 1,235 |
| | 4,597 |
|
| Equipment financing | 46 |
| | 41 |
| | 73 |
| | 160 |
| | 27,534 |
| | 27,694 |
| | 73 |
| | 29 |
|
| Total commercial loans and leases | 2,753 |
| | 162 |
| | 2,004 |
| | 4,919 |
| | 132,883 |
| | 137,802 |
| | 1,308 |
| | 4,626 |
|
| Consumer loans: | | | | | | | | | | | | | | | |
| Residential mortgage | 271 |
| | 777 |
| | 5,329 |
| | 6,377 |
| | 110,254 |
| | 116,631 |
| | 4,468 |
| | 1,162 |
|
| Home equity | 1,259 |
| | 552 |
| | 895 |
| | 2,706 |
| | 122,359 |
| | 125,065 |
| | 117 |
| | 1,525 |
|
| Other consumer | 6 |
| | 11 |
| | 4 |
| | 21 |
| | 1,502 |
| | 1,523 |
| | — |
| | 14 |
|
| Total consumer loans | 1,536 |
| | 1,340 |
| | 6,228 |
| | 9,104 |
| | 234,115 |
| | 243,219 |
| | 4,585 |
| | 2,701 |
|
| Total acquired loans and leases | $ | 5,837 |
| | $ | 1,998 |
| | $ | 14,171 |
| | $ | 22,006 |
| | $ | 793,406 |
| | $ | 815,412 |
| | $ | 10,903 |
| | $ | 8,256 |
|
BROOKLINE BANCORP, INC. AND SUBSIDIARIES
Notes to Consolidated Financial Statements (Continued)
December 31, 2013, 2012 and 2011
| | | | At December 31, 2012 | At December 31, 2015 |
| | Past Due | | | | | | Loans and Leases Past Due Greater Than 90 Days and Accruing | | | Past Due | | | | | | Loans and Leases Past Due Greater Than 90 Days and Accruing | | |
| | 31-60 Days | | 61-90 Days | | Greater Than 90 Days | | Total | | Current | | Total Loans and Leases | | Nonaccrual Loans and Leases | 31-60 Days | | 61-90 Days | | Greater Than 90 Days | | Total | | Current | | Total Loans and Leases | | Nonaccrual Loans and Leases |
| | (In Thousands) | (In Thousands) |
| Originated: | | | | | | | | | | | | | | | | | | | | | | | | | | | | | | |
| Commercial real estate loans: | | | | | | | | | | | | | | | | | | | | | | | | | | | | | | |
| Commercial real estate mortgage | $ | 1,530 |
| | $ | — |
| | $ | 435 |
| | $ | 1,965 |
| | $ | 869,587 |
| | $ | 871,552 |
| | $ | 434 |
| | $ | 1,539 |
| |
| Commercial real estate | | $ | 1,782 |
| | $ | — |
| | $ | 2,097 |
| | $ | 3,879 |
| | $ | 1,680,669 |
| | $ | 1,684,548 |
| | $ | — |
| | $ | 2,876 |
|
| Multi-family mortgage | 2,410 |
| | 60 |
| | 988 |
| | 3,458 |
| | 502,559 |
| | 506,017 |
| | — |
| | 1,932 |
| — |
| | — |
| | 16 |
| | 16 |
| | 620,849 |
| | 620,865 |
| | 16 |
| | 291 |
|
| Construction | 2,354 |
| | 816 |
| | — |
| | 3,170 |
| | 77,743 |
| | 80,913 |
| | — |
| | — |
| 652 |
| | — |
| | — |
| | 652 |
| | 129,090 |
| | 129,742 |
| | — |
| | — |
|
| Total commercial real estate loans | 6,294 |
| | 876 |
| | 1,423 |
| | 8,593 |
| | 1,449,889 |
| | 1,458,482 |
| | 434 |
| | 3,471 |
| 2,434 |
| | — |
| | 2,113 |
| | 4,547 |
| | 2,430,608 |
| | 2,435,155 |
| | 16 |
| | 3,167 |
|
| Commercial loans and leases: | | | | | | | | | | | | | | | | | | | | | | | | | | | | | | |
| Commercial | 26 |
| | 75 |
| | 26 |
| | 127 |
| | 230,765 |
| | 230,892 |
| | 26 |
| | 1,993 |
| 4,578 |
| | 1,007 |
| | 2,368 |
| | 7,953 |
| | 568,646 |
| | 576,599 |
| | 24 |
| | 3,586 |
|
| Equipment financing | 2,595 |
| | 1,439 |
| | 1,618 |
| | 5,652 |
| | 360,645 |
| | 366,297 |
| | — |
| | 3,817 |
| 1,681 |
| | 595 |
| | 2,143 |
| | 4,419 |
| | 708,569 |
| | 712,988 |
| | 77 |
| | 2,610 |
|
| Condominium association | — |
| | — |
| | — |
| | — |
| | 44,187 |
| | 44,187 |
| | — |
| | 8 |
| 205 |
| | 124 |
| | — |
| | 329 |
| | 59,546 |
| | 59,875 |
| | — |
| | — |
|
| Total commercial loans and leases | 2,621 |
| | 1,514 |
| | 1,644 |
| | 5,779 |
| | 635,597 |
| | 641,376 |
| | 26 |
| | 5,818 |
| 6,464 |
| | 1,726 |
| | 4,511 |
| | 12,701 |
| | 1,336,761 |
| | 1,349,462 |
| | 101 |
| | 6,196 |
|
| Indirect automobile | 5,592 |
| | 923 |
| | 99 |
| | 6,614 |
| | 535,730 |
| | 542,344 |
| | 1 |
| | 99 |
| 1,058 |
| | 335 |
| | 106 |
| | 1,499 |
| | 12,179 |
| | 13,678 |
| | — |
| | 675 |
|
| Consumer loans: | | | | | | | | | | | | | | | | | | | | | | | | | | | | | | |
| Residential mortgage | — |
| | — |
| | 1,059 |
| | 1,059 |
| | 367,036 |
| | 368,095 |
| | 27 |
| | 2,008 |
| 1,384 |
| | — |
| | 229 |
| | 1,613 |
| | 526,233 |
| | 527,846 |
| | — |
| | 1,873 |
|
| Home equity | — |
| | — |
| | 33 |
| | 33 |
| | 99,650 |
| | 99,683 |
| | — |
| | 58 |
| 390 |
| | 237 |
| | 9 |
| | 636 |
| | 234,072 |
| | 234,708 |
| | — |
| | 319 |
|
| Other consumer | — |
| | 2 |
| | 5 |
| | 7 |
| | 6,115 |
| | 6,122 |
| | 5 |
| | 29 |
| 19 |
| | 2 |
| | 25 |
| | 46 |
| | 11,993 |
| | 12,039 |
| | — |
| | 29 |
|
| Total consumer loans | — |
| | 2 |
| | 1,097 |
| | 1,099 |
| | 472,801 |
| | 473,900 |
| | 32 |
| | 2,095 |
| 1,793 |
| | 239 |
| | 263 |
| | 2,295 |
| | 772,298 |
| | 774,593 |
| | — |
|
| 2,221 |
|
| Total originated loans and leases | $ | 14,507 |
| | $ | 3,315 |
| | $ | 4,263 |
| | $ | 22,085 |
| | $ | 3,094,017 |
| | $ | 3,116,102 |
| | $ | 493 |
| | $ | 11,483 |
| $ | 11,749 |
| | $ | 2,300 |
| | $ | 6,993 |
| | $ | 21,042 |
| | $ | 4,551,846 |
| | $ | 4,572,888 |
| | $ | 117 |
| | $ | 12,259 |
|
BROOKLINE BANCORP, INC. AND SUBSIDIARIES
Notes to Consolidated Financial Statements (Continued)
December 31, 2015, 2014, 2013 2012 and 2011
| | | | At December 31, 2012 | At December 31, 2015 |
| | Past Due | | | | | | Loans and Leases Past Due Greater Than 90 Days and Accruing | | | Past Due | | | | | | Loans and Leases Past Due Greater Than 90 Days and Accruing | | |
| | 31-60 Days | | 61-90 Days | | Greater Than 90 Days | | Total | | Current | | Total Loans and Leases | | Nonaccrual Loans and Leases | 31-60 Days | | 61-90 Days | | Greater Than 90 Days | | Total | | Current | | Total Loans and Leases | | Nonaccrual Loans and Leases |
| | (In Thousands) | (In Thousands) |
| Acquired: | | | | | | | | | | | | | | | | | | | | | | | | | | | | | | |
| Commercial real estate loans: | | | | | | | | | | | | | | | | | | | | | | | | | | | | | | |
| Commercial real estate mortgage | $ | 2,911 |
| | $ | — |
| | $ | 7,289 |
| | $ | 10,200 |
| | $ | 419,481 |
| | $ | 429,681 |
| | $ | 6,616 |
| | $ | 2,475 |
| |
| Commercial real estate | | $ | 1,336 |
| | $ | 369 |
| | $ | 7,588 |
| | $ | 9,293 |
| | $ | 181,751 |
| | $ | 191,044 |
| | $ | 4,982 |
| | $ | 2,606 |
|
| Multi-family mortgage | 2,738 |
| | 395 |
| | 2,178 |
| | 5,311 |
| | 95,205 |
| | 100,516 |
| | 1,857 |
| | 2,301 |
| — |
| | — |
| | 1,077 |
| | 1,077 |
| | 36,538 |
| | 37,615 |
| | 1,077 |
| | — |
|
| Construction | — |
| | — |
| | — |
| | — |
| | 17,284 |
| | 17,284 |
| | — |
| | — |
| — |
| | — |
| | — |
| | — |
| | 580 |
| | 580 |
| | — |
| | — |
|
| Total commercial real estate loans | 5,649 |
| | 395 |
| | 9,467 |
| | 15,511 |
| | 531,970 |
| | 547,481 |
| | 8,473 |
| | 4,776 |
| 1,336 |
| | 369 |
| | 8,665 |
| | 10,370 |
| | 218,869 |
| | 229,239 |
| | 6,059 |
| | 2,606 |
|
| Commercial loans and leases: | | | | | | | | | | | | | | | | | | | | | | | | | | | | | | |
| Commercial | 866 |
| | 177 |
| | 4,353 |
| | 5,396 |
| | 145,989 |
| | 151,385 |
| | 3,503 |
| | 3,461 |
| 351 |
| | 23 |
| | 2,967 |
| | 3,341 |
| | 12,591 |
| | 15,932 |
| | 325 |
| | 2,678 |
|
| Equipment financing | 133 |
| | 21 |
| | 194 |
| | 348 |
| | 54,346 |
| | 54,694 |
| | 197 |
| | 56 |
| — |
| | — |
| | — |
| | — |
| | 8,902 |
| | 8,902 |
| | — |
| | — |
|
| Total commercial loans and leases | 999 |
| | 198 |
| | 4,547 |
| | 5,744 |
| | 200,335 |
| | 206,079 |
| | 3,700 |
| | 3,517 |
| 351 |
| | 23 |
| | 2,967 |
| | 3,341 |
| | 21,493 |
| | 24,834 |
| | 325 |
| | 2,678 |
|
| Consumer loans: | | | | | | | | | | | | | | | | | | | | | | | | | | | | | | |
| Residential mortgage | 247 |
| | 121 |
| | 5,266 |
| | 5,634 |
| | 137,380 |
| | 143,014 |
| | 3,650 |
| | 1,796 |
| 326 |
| | 216 |
| | 2,399 |
| | 2,941 |
| | 85,662 |
| | 88,603 |
| | 2,047 |
| | 352 |
|
| Home equity | 1,582 |
| | 507 |
| | 607 |
| | 2,696 |
| | 159,183 |
| | 161,879 |
| | 321 |
| | 658 |
| 1,012 |
| | 386 |
| | 460 |
| | 1,858 |
| | 77,987 |
| | 79,845 |
| | 142 |
| | 1,438 |
|
| Other consumer | 7 |
| | — |
| | — |
| | 7 |
| | 1,150 |
| | 1,157 |
| | — |
| | 16 |
| — |
| | — |
| | — |
| | — |
| | 131 |
| | 131 |
| | — |
| | — |
|
| Total consumer loans | 1,836 |
| | 628 |
| | 5,873 |
| | 8,337 |
| | 297,713 |
| | 306,050 |
| | 3,971 |
| | 2,470 |
| 1,338 |
| | 602 |
| | 2,859 |
| | 4,799 |
| | 163,780 |
| | 168,579 |
| | 2,189 |
| | 1,790 |
|
| Total acquired loans and leases | $ | 8,484 |
| | $ | 1,221 |
| | $ | 19,887 |
| | $ | 29,592 |
| | $ | 1,030,018 |
| | $ | 1,059,610 |
| | $ | 16,144 |
| | $ | 10,763 |
| $ | 3,025 |
| | $ | 994 |
| | $ | 14,491 |
| | $ | 18,510 |
| | $ | 404,142 |
| | $ | 422,652 |
| | $ | 8,573 |
| | $ | 7,074 |
|
| | | | | | | | | | | | | | | | | |
| Total loans and leases | | $ | 14,774 |
| | $ | 3,294 |
| | $ | 21,484 |
| | $ | 39,552 |
| | $ | 4,955,988 |
| | $ | 4,995,540 |
| | $ | 8,690 |
| | $ | 19,333 |
|
BROOKLINE BANCORP, INC. AND SUBSIDIARIES
Notes to Consolidated Financial Statements (Continued)
December 31, 2015, 2014, 2013
|
| | | | | | | | | | | | | | | | | | | | | | | | | | | | | | | |
| | At December 31, 2014 |
| | Past Due | | | | | | Loans and Leases Past Due Greater Than 90 Days and Accruing | | |
| | 31-60 Days | | 61-90 Days | | Greater Than 90 Days | | Total | | Current | | Total Loans and Leases | | | Nonaccrual Loans and Leases |
| | (In Thousands) |
| Originated: | | | | | | | | | | | | | | | |
| Commercial real estate loans: | | | | | | | | | | | | | | | |
| Commercial real estate | $ | 1,631 |
| | $ | 416 |
| | $ | 160 |
| | $ | 2,207 |
| | $ | 1,423,414 |
| | $ | 1,425,621 |
| | $ | — |
| | $ | 1,009 |
|
| Multi-family mortgage | 385 |
| | — |
| | — |
| | 385 |
| | 575,829 |
| | 576,214 |
| | — |
| | — |
|
| Construction | — |
| | — |
| | — |
| | — |
| | 146,074 |
| | 146,074 |
| | — |
| | — |
|
| Total commercial real estate loans | 2,016 |
| | 416 |
| | 160 |
| | 2,592 |
| | 2,145,317 |
| | 2,147,909 |
| | — |
| | 1,009 |
|
| Commercial loans and leases: | | | | | | | | | | | | | | | |
| Commercial | 758 |
| | 876 |
| | 1,499 |
| | 3,133 |
| | 459,597 |
| | 462,730 |
| | 2 |
| | 2,722 |
|
| Equipment financing | 1,534 |
| | 138 |
| | 2,392 |
| | 4,064 |
| | 583,432 |
| | 587,496 |
| | — |
| | 3,214 |
|
| Condominium association | 501 |
| | — |
| | — |
| | 501 |
| | 51,092 |
| | 51,593 |
| | — |
| | — |
|
| Total commercial loans and leases | 2,793 |
| | 1,014 |
| | 3,891 |
| | 7,698 |
| | 1,094,121 |
| | 1,101,819 |
| | 2 |
| | 5,936 |
|
| Indirect automobile | 4,635 |
| | 923 |
| | 166 |
| | 5,724 |
| | 311,263 |
| | 316,987 |
| | — |
| | 645 |
|
| Consumer loans: | | | | | | | | | | | | | | | |
| Residential mortgage | — |
| | — |
| | 501 |
| | 501 |
| | 471,577 |
| | 472,078 |
| | — |
| | 1,340 |
|
| Home equity | 75 |
| | 52 |
| | 129 |
| | 256 |
| | 181,324 |
| | 181,580 |
| | — |
| | 161 |
|
| Other consumer | 17 |
| | 5 |
| | 30 |
| | 52 |
| | 11,528 |
| | 11,580 |
| | — |
| | 41 |
|
| Total consumer loans | 92 |
| | 57 |
| | 660 |
| | 809 |
| | 664,429 |
| | 665,238 |
| | — |
| | 1,542 |
|
| Total originated loans and leases | $ | 9,536 |
| | $ | 2,410 |
| | $ | 4,877 |
| | $ | 16,823 |
| | $ | 4,215,130 |
| | $ | 4,231,953 |
| | $ | 2 |
| | $ | 9,132 |
|
BROOKLINE BANCORP, INC. AND SUBSIDIARIES
Notes to Consolidated Financial Statements (Continued)
December 31, 2015, 2014, 2013
|
| | | | | | | | | | | | | | | | | | | | | | | | | | | | | | | |
| | At December 31, 2014 |
| | Past Due | | | | | | Loans and Leases Past Due Greater Than 90 Days and Accruing | | |
| | 31-60 Days | | 61-90 Days | | Greater Than 90 Days | | Total | | Current | | Total Loans and Leases | | | Nonaccrual Loans and Leases |
| | (In Thousands) |
| Acquired: | | | | | | | | | | | | | | | |
| Commercial real estate loans: | | | | | | | | | | | | | | | |
| Commercial real estate | $ | 989 |
| | $ | 3,705 |
| | $ | 2,387 |
| | $ | 7,081 |
| | $ | 247,380 |
| | $ | 254,461 |
| | $ | 2,387 |
| | $ | — |
|
| Multi-family mortgage | 195 |
| | 729 |
| | 363 |
| | 1,287 |
| | 62,205 |
| | 63,492 |
| | 363 |
| | — |
|
| Construction | — |
| | — |
| | — |
| | — |
| | 1,939 |
| | 1,939 |
| | — |
| | — |
|
| Total commercial real estate loans | 1,184 |
| | 4,434 |
| | 2,750 |
| | 8,368 |
| | 311,524 |
| | 319,892 |
| | 2,750 |
| | — |
|
| Commercial loans and leases: | | | | | | | | | | | | | | | |
| Commercial | 712 |
| | 488 |
| | 3,033 |
| | 4,233 |
| | 47,114 |
| | 51,347 |
| | 624 |
| | 2,474 |
|
| Equipment financing | 2 |
| | 52 |
| | 66 |
| | 120 |
| | 13,808 |
| | 13,928 |
| | 73 |
| | 9 |
|
| Total commercial loans and leases | 714 |
| | 540 |
| | 3,099 |
| | 4,353 |
| | 60,922 |
| | 65,275 |
| | 697 |
| | 2,483 |
|
| Consumer loans: | | | | | | | | | | | | | | | |
| Residential mortgage | — |
| | — |
| | 2,715 |
| | 2,715 |
| | 97,127 |
| | 99,842 |
| | 2,372 |
| | 342 |
|
| Home equity | 1,005 |
| | 733 |
| | 923 |
| | 2,661 |
| | 102,817 |
| | 105,478 |
| | 187 |
| | 1,757 |
|
| Other consumer | — |
| | — |
| | — |
| | — |
| | 167 |
| | 167 |
| | — |
| | — |
|
| Total consumer loans | 1,005 |
| | 733 |
| | 3,638 |
| | 5,376 |
| | 200,111 |
| | 205,487 |
| | 2,559 |
| | 2,099 |
|
| Total acquired loans and leases | $ | 2,903 |
| | $ | 5,707 |
| | $ | 9,487 |
| | $ | 18,097 |
| | $ | 572,557 |
| | $ | 590,654 |
| | $ | 6,006 |
| | $ | 4,582 |
|
| | | | | | | | | | | | | | | | |
| Total loans and leases | $ | 12,439 |
| | $ | 8,117 |
| | $ | 14,364 |
| | $ | 34,920 |
| | $ | 4,787,687 |
| | $ | 4,822,607 |
| | $ | 6,008 |
| | $ | 13,714 |
|
Commercial Real Estate Loans—AtAs of December 31, 2013,2015, loans outstanding in the three classes within this categorysegment expressed as a percentage of total loans and leases outstanding were as follows: commercial real estate mortgage loans 33.5%-- 37.5%; multi-family mortgage loans 14.4%-- 13.2%; and construction loans -- 2.6%.
Loans in this portfolio that are on nonaccrual status and/or risk-rated "substandard" or worse are evaluated on an individual loan basis for impairment. For non-impaired commercial real estate loans, loss factors are applied to outstanding loans by risk rating for each of the three classes in the portfolio. The factors applied are based primarily on historic loan loss experience and an assessment of internal and external factors and other relevant information.
Commercial Loans and Leases—AtAs of December 31, 2013,2015, loans and leases outstanding in the three classes within this portfoliosegment expressed as a percent of total loans and leases outstanding were as follows: commercial loans and leases 9.3%-- 11.9%; equipment financing loans 11.8%-- 14.5%; and loans to condominium associations 1.0%-- 1.2%.
Loans and leases in this portfolio that are on nonaccrual status and/or risk-rated "substandard" or worse are evaluated on an individual basis for impairment. For non-impaired commercial loans and leases, loss factors are applied to outstanding loans by risk rating for each of the three classes in the portfolio.
Indirect Automobile Loans—At December 31, 2013, indirect automobile loans represented 9.2% of the Company's total loan and lease portfolio. Determination of the allowance for loan and lease losses for this portfolio is based primarily on borrowers' credit scores (generally considered to be a good indicator of capacity to pay a loan, with the risk of loan loss increasing as credit scores decrease), and on an assessment of trends in loan underwriting, loan loss experience, and the economy and industry conditions. Data are gathered on loan originations by year broken down into the following ranges of borrower credit scores: over 700, between 661 and 700, and 660 and below. The Company's loan policy specifies underwriting guidelines based in part on the score of the borrower and includes ceilings on the percent of loans originated that can be to
BROOKLINE BANCORP, INC. AND SUBSIDIARIES
Notes to Consolidated Financial Statements (Continued)
December 31, 2013, 2012 and 2011
borrowers with credit scores of 660 and below. The breakdown of the amounts shown in "Credit Quality Information" above is based on borrower credit scores at the time of loan origination. It is possible that the credit scores of certain borrowers may have deteriorated since the time the loan was originated. Additionally, migrations of loan charge-offs and recoveries are analyzed by year of origination. Based on that data and taking into consideration other factors such as loan delinquencies and economic conditions, projections are made as to the amount of expected losses inherent in the portfolio. The percentage of loans made to borrowers with credit scores of 660 and below was 3.2% and 3.1% at December 31, 2013 and 2012, respectively.
Consumer Loans—AtAs of December 31, 2013,2015, loans outstanding within the threefour classes within this portfoliosegment expressed as a percent of total loans and leases outstanding (including deferred loan origination costs) were as follows: residential mortgage loans 12.1%-- 12.3%, home equity loans 5.9%-- 6.3%, indirect automobile loans -- 0.3%, and other consumer loans -- 0.2%.
Significant risk characteristics related to the residential mortgage and home equity loan portfolios are the geographic concentration of the properties financed within selected communities in the greater Boston and Providence metropolitan areasareas.
BROOKLINE BANCORP, INC. AND SUBSIDIARIES
Notes to Consolidated Financial Statements (Continued)
December 31, 2015, 2014, 2013
The payment status and the economic conditions in those areas. The loan-to-value ratio isare the primary credit quality indicator used for residential mortgage loans and home equity loans. Generally, loans are not made when the loan-to-value ratio exceeds 80% unless private mortgage insurance is obtained and/or there is a financially strong guarantor. Consumer loans that become 90 days or more past due, or are placed on nonaccrual regardless of past due status, are reviewed on an individual basis for impairment by assessing the net realizable value of underlying collateral and the economic condition of the borrower. Determination of the allowance for loan and lease losses for indirect automobile loans is based primarily on payment status and historical loss rates.
Impaired Loans and Leases
A loan is considered to be impaired when, based on current information and events, it is probable that the Company will be unable to collect all amounts due (both interest and principal) according to the contractual terms of the loan agreement. The Company has defined the population of impaired loans to include nonaccrual loans and troubled debt restructured loans.
When the ultimate collectability of the total principal of an impaired loan or lease is in doubt and the loan is on nonaccrual status, all payments are applied to principal, under the cost recovery method. When the ultimate collectability of the total principal of an impaired loan or lease is not in doubt and the loan or lease is on nonaccrual status, contractual interest is credited to interest income when received, under the cash basis method.
The following tables include the recorded investment and unpaid principal balances of impaired loans and leases with the related allowance amount, if applicable, for the originated and acquired loan and lease portfolios at the dates and for the periods indicated. Also presented are the average recorded investments in the impaired loans and leases and the related amount of interest recognized during the period that the impaired loans were impaired.
|
| | | | | | | | | | | | | | | | | | | |
| | At December 31, 2013 | | Year Ended December 31, 2013 |
| | Recorded Investment (1) | | Unpaid Principal Balance | | Related Allowance | | Average Recorded Investment | | Interest Income Recognized |
| | (In Thousands) |
| Originated: | | | | | | | | | |
| With no related allowance recorded: | | | | | | | | | |
| Commercial real estate | $ | 2,009 |
| | $ | 2,009 |
| | $ | — |
| | $ | 2,184 |
| | $ | 92 |
|
| Commercial | 4,410 |
| | 4,399 |
| | — |
| | 4,257 |
| | 144 |
|
| Consumer | 989 |
| | 987 |
| | — |
| | 1,077 |
| | 30 |
|
| | 7,408 |
| | 7,395 |
| | — |
| | 7,518 |
| | 266 |
|
| With an allowance recorded: | | | | | | | | | |
| Commercial real estate | 1,466 |
| | 1,466 |
| | 184 |
| | 1,464 |
| | 43 |
|
| Commercial | 2,393 |
| | 2,383 |
| | 675 |
| | 1,781 |
| | 29 |
|
| Consumer | 2,448 |
| | 2,440 |
| | 323 |
| | 3,210 |
| | 97 |
|
| | 6,307 |
| | 6,289 |
| | 1,182 |
| | 6,455 |
| | 169 |
|
| Total | $ | 13,715 |
| | $ | 13,684 |
| | $ | 1,182 |
| | $ | 13,973 |
| | $ | 435 |
|
(1) Includes nonaccrual loans of $5.8 million
BROOKLINE BANCORP, INC. AND SUBSIDIARIES
Notes to Consolidated Financial Statements (Continued)
December 31, 2013, 2012 and 2011
|
| | | | | | | | | | | | | | | | | | | |
| | At December 31, 2013 | | Year Ended December 31, 2013 |
| | Recorded Investment (1) | | Unpaid Principal Balance | | Related Allowance | | Average Recorded Investment | | Interest Income Recognized |
| | (In Thousands) |
| Acquired: | | | | | | | | | |
| With no related allowance recorded: | | | | | | | | | |
| Commercial real estate | $ | 9,176 |
| | $ | 10,082 |
| | $ | — |
| | $ | 9,639 |
| | $ | 251 |
|
| Commercial | 6,988 |
| | 7,248 |
| | — |
| | 5,205 |
| | 129 |
|
| Consumer | 1,033 |
| | 1,037 |
| | — |
| | 1,333 |
| | 20 |
|
| | 17,197 |
| | 18,367 |
| | — |
| | 16,177 |
| | 400 |
|
| With an allowance recorded: | | | | | | | | | |
| Commercial real estate | 1,274 |
| | 1,291 |
| | 122 |
| | 2,765 |
| | 42 |
|
| Commercial | 1,020 |
| | 1,067 |
| | 169 |
| | 577 |
| | 5 |
|
| Consumer | — |
| | — |
| | — |
| | — |
| | — |
|
| | 2,294 |
| | 2,358 |
| | 291 |
| | 3,342 |
| | 47 |
|
| Total | $ | 19,491 |
| | $ | 20,725 |
| | $ | 291 |
| | $ | 19,519 |
| | $ | 447 |
|
(1) Includes nonaccrual loans of $10.9 million
|
| | | | | | | | | | | | | | | | | | | |
| | At December 31, 2012 | | Year Ended December 31, 2012 |
| | Recorded Investment (1) | | Unpaid Principal Balance | | Related Allowance | | Average Recorded Investment | | Interest Income Recognized |
| | (In Thousands) |
| Originated: | | | | | | | | | |
| With no related allowance recorded: | | | | | | | | | |
| Commercial real estate | $ | 2,051 |
| | $ | 2,051 |
| | $ | — |
| | $ | 2,547 |
| | $ | 243 |
|
| Commercial | 3,032 |
| | 3,059 |
| | — |
| | 3,159 |
| | 181 |
|
| Consumer | 1,191 |
| | 1,187 |
| | — |
| | 2,123 |
| | 130 |
|
| | 6,274 |
| | 6,297 |
| | — |
| | 7,829 |
| | 554 |
|
| With an allowance recorded: | | | | | | | | | |
| Commercial real estate | 2,517 |
| | 2,516 |
| | 241 |
| | 1,142 |
| | 79 |
|
| Commercial | 3,422 |
| | 3,559 |
| | 703 |
| | 3,393 |
| | 305 |
|
| Consumer | 3,648 |
| | 3,636 |
| | 596 |
| | 2,918 |
| | 100 |
|
| | 9,587 |
| | 9,711 |
| | 1,540 |
| | 7,453 |
| | 484 |
|
| Total | $ | 15,861 |
| | $ | 16,008 |
| | $ | 1,540 |
| | $ | 15,282 |
| | $ | 1,038 |
|
(1) Includes nonaccrual loans of $8.8 million
BROOKLINE BANCORP, INC. AND SUBSIDIARIES
Notes to Consolidated Financial Statements (Continued)
December 31, 2013, 2012 and 2011
|
| | | | | | | | | | | | | | | | | | | |
| | At December 31, 2012 | | Year Ended December 31, 2012 |
| | Recorded Investment (1) | | Unpaid Principal Balance | | Related Allowance | | Average Recorded Investment | | Interest Income Recognized |
| | (In Thousands) |
| Acquired: | | | | | | | | | |
| With no related allowance recorded: | | | | | | | | | |
| Commercial real estate | 17,918 |
| | 19,129 |
| | — |
| | 9,071 |
| | — |
|
| Commercial | 7,329 |
| | 7,782 |
| | — |
| | 3,801 |
| | — |
|
| Consumer | 3,266 |
| | 3,379 |
| | — |
| | 2,319 |
| | — |
|
| | 28,513 |
| | 30,290 |
| | — |
| | 15,191 |
| | — |
|
| With an allowance recorded: | | | | | | | | | |
| Commercial real estate | 673 |
| | 684 |
| | 75 |
| | 366 |
| | — |
|
| Commercial | 113 |
| | 121 |
| | 75 |
| | 109 |
| | — |
|
| Consumer | — |
| | — |
| | — |
| | — |
| | — |
|
| | 786 |
| | 805 |
| | 150 |
| | 475 |
| | — |
|
| Total | $ | 29,299 |
| | $ | 31,095 |
| | $ | 150 |
| | $ | 15,666 |
| | $ | — |
|
(1) Includes nonaccrual loans of $21.5 million
|
| | | | | | | | | | | | | | | | | | | |
| | At December 31, 2011 | | Year Ended December 31, 2011 |
| | Recorded Investment | | Unpaid Principal Balance | | Related Allowance | | Average Recorded Investment | | Interest Income Recognized |
| | (In Thousands) |
| Originated: | | | | | | | | | |
| With no related allowance recorded: | | | | | | | | | |
| Commercial real estate | $ | 2,902 |
| | $ | 3,140 |
| | $ | — |
| | $ | 2,834 |
| | $ | 119 |
|
| Commercial | 3,341 |
| | 4,063 |
| | — |
| | 2,938 |
| | 94 |
|
| Indirect automobile | 111 |
| | 111 |
| | — |
| | 100 |
| | — |
|
| Consumer | 3,126 |
| | 3,126 |
| | — |
| | 3,753 |
| | 159 |
|
| | 9,480 |
| | 10,440 |
| | — |
| | 9,625 |
| | 372 |
|
| With an allowance recorded: | | | | | | | | | |
| Commercial | 604 |
| | 619 |
| | 190 |
| | 774 |
| | 58 |
|
| Consumer | 339 |
| | 339 |
| | 35 |
| | 343 |
| | 7 |
|
| | 943 |
| | 958 |
| | 225 |
| | 1,117 |
| | 65 |
|
| Total | $ | 10,423 |
| | $ | 11,398 |
| | $ | 225 |
| | $ | 10,742 |
| | $ | 437 |
|
There were no changes in the allowance for loan and lease losses associated with acquired loans in 2011.
The following tables present information regarding impaired and non-impaired loans and leases at the dates indicated:
BROOKLINE BANCORP, INC. AND SUBSIDIARIES
Notes to Consolidated Financial Statements (Continued)
December 31, 2015, 2014, 2013 2012 and 2011
| | | | At December 31, 2013 | At December 31, 2015 | | At December 31, 2014 |
| | Loans and Leases Individually Evaluated for Impairment | | Loans and Leases Collectively Evaluated for Impairment | | Acquired Loans (ASC 310-30) | | Total | Recorded
Investment (1) | | Unpaid
Principal
Balance | | Related
Allowance | | Recorded Investment (2) | | Unpaid
Principal
Balance | | Related
Allowance |
| | Portfolio | | Allowance | | Portfolio | | Allowance | | Portfolio | | Allowance | | Portfolio | | Allowance | (In Thousands) |
| | (In Thousands) | |
| Originated: | | | | | | | | | | | | |
| With no related allowance recorded: | | | | | | | | | | | | |
| Commercial real estate | $ | 6,269 |
| | $ | 184 |
| | $ | 1,910,645 |
| | $ | 22,282 |
| | $ | 286,709 |
| | $ | 556 |
| | $ | 2,203,623 |
| | $ | 23,022 |
| $ | 2,758 |
| | $ | 2,756 |
| | $ | — |
| | $ | 2,751 |
| | $ | 2,748 |
| | $ | — |
|
| Commercial | 11,512 |
| | 675 |
| | 914,739 |
| | 14,293 |
| | 39,359 |
| | 252 |
| | 965,610 |
| | 15,220 |
| 14,097 |
| | 14,074 |
| | — |
| | 13,440 |
| | 13,421 |
| | — |
|
| Indirect automobile | — |
| | — |
| | 400,531 |
| | 3,924 |
| | — |
| | — |
| | 400,531 |
| | 3,924 |
| |
| Consumer | 4,309 |
| | 323 |
| | 708,640 |
| | 2,618 |
| | 79,752 |
| | 434 |
| | 792,701 |
| | 3,375 |
| 4,582 |
| | 4,575 |
| | — |
| | 3,055 |
| | 3,048 |
| | — |
|
| Unallocated | — |
| | — |
| | — |
| | 2,932 |
| | — |
| | — |
| | — |
| | 2,932 |
| |
| Total | $ | 22,090 |
| | $ | 1,182 |
| | $ | 3,934,555 |
| | $ | 46,049 |
| | $ | 405,820 |
| | $ | 1,242 |
| | $ | 4,362,465 |
| | $ | 48,473 |
| |
| Total originated with no related allowance recorded | | 21,437 |
| | 21,405 |
| | — |
| | 19,246 |
| | 19,217 |
| | — |
|
| With an allowance recorded: | | | | | | | | | | | | |
| Commercial real estate | | 6,150 |
| | 6,150 |
| | 2,167 |
| | 4,119 |
| | 4,119 |
| | 108 |
|
| Commercial | | 2,215 |
| | 2,213 |
| | 1,202 |
| | 2,019 |
| | 2,011 |
| | 768 |
|
| Consumer | | — |
| | — |
| | — |
| | 176 |
| | 176 |
| | 10 |
|
| Total originated with an allowance recorded | | 8,365 |
| | 8,363 |
| | 3,369 |
| | 6,314 |
| | 6,306 |
| | 886 |
|
| Total originated impaired loans and leases | | 29,802 |
| | 29,768 |
| | 3,369 |
| | 25,560 |
| | 25,523 |
| | 886 |
|
| | | | | | | | | | | | | |
| Acquired: | | | | | | | | | | | | |
| With no related allowance recorded: | | | | | | | | | | | | |
| Commercial real estate | | 7,035 |
| | 7,035 |
| | — |
| | 9,413 |
| | 9,428 |
| | — |
|
| Commercial | | 4,053 |
| | 4,052 |
| | — |
| | 6,049 |
| | 6,047 |
| | — |
|
| Consumer | | 7,549 |
| | 7,565 |
| | — |
| | 6,688 |
| | 6,688 |
| | — |
|
| Total acquired with no related allowance recorded | | 18,637 |
| | 18,652 |
| | — |
| | 22,150 |
| | 22,163 |
| | — |
|
| With an allowance recorded: | | | | | | | | | | | | |
| Commercial real estate | | 2,606 |
| | 2,606 |
| | 148 |
| | 244 |
| | 244 |
| | 22 |
|
| Commercial | | 486 |
| | 486 |
| | 112 |
| | 478 |
| | 478 |
| | 214 |
|
| Consumer | | 174 |
| | 174 |
| | 9 |
| | 225 |
| | 225 |
| | 41 |
|
| Total acquired with an allowance recorded | | 3,266 |
| | 3,266 |
| | 269 |
| | 947 |
| | 947 |
| | 277 |
|
| Total acquired impaired loans and leases | | 21,903 |
| | 21,918 |
| | 269 |
| | 23,097 |
| | 23,110 |
| | 277 |
|
| | | | | | | | | | | | | |
| Total impaired loans and leases | | $ | 51,705 |
| | $ | 51,686 |
| | $ | 3,638 |
| | $ | 48,657 |
| | $ | 48,633 |
| | $ | 1,163 |
|
(1) Includes originated and acquired nonaccrual loans of $9.3 million and $7.1 million, respectively as of December 31, 2015.
(2) Includes originated and acquired nonaccrual loans of $7.1 million and $4.6 million, respectively as of December 31, 2014.
BROOKLINE BANCORP, INC. AND SUBSIDIARIES
Notes to Consolidated Financial Statements (Continued)
December 31, 2015, 2014, 2013
|
| | | | | | | | | | | | | | | | | | | | | | | |
| | Year Ended |
| | December 31, 2015 | | December 31, 2014 | | December 31, 2013 |
| | Average
Recorded
Investment | | Interest
Income
Recognized | | Average
Recorded
Investment | | Interest
Income
Recognized | | Average
Recorded
Investment | | Interest
Income
Recognized |
| | (In Thousands) |
| Originated: | | | | | | | | | | | |
| With no related allowance recorded: | | | | | | | | | | | |
| Commercial real estate | $ | 3,999 |
| | $ | 86 |
| | $ | 2,786 |
| | $ | 102 |
| | $ | 2,184 |
| | $ | 92 |
|
| Commercial | 15,143 |
| | 641 |
| | 11,840 |
| | 343 |
| | 4,257 |
| | 144 |
|
| Consumer | 4,267 |
| | 65 |
| | 3,166 |
| | 42 |
| | 1,077 |
| | 30 |
|
| Total originated with no related allowance recorded | 23,409 |
| | 792 |
| | 17,792 |
| | 487 |
| | 7,518 |
| | 266 |
|
| With an allowance recorded: | | | | | | | | | | | |
| Commercial real estate | 5,132 |
| | 197 |
| | 3,223 |
| | 69 |
| | 1,464 |
| | 43 |
|
| Commercial | 5,650 |
| | 10 |
| | 2,285 |
| | 51 |
| | 1,781 |
| | 29 |
|
| Consumer | 84 |
| | — |
| | 458 |
| | 15 |
| | 3,210 |
| | 97 |
|
| Total originated with an allowance recorded | 10,866 |
| | 207 |
| | 5,966 |
| | 135 |
| | 6,455 |
| | 169 |
|
| Total originated impaired loans and leases | 34,275 |
| | 999 |
| | 23,758 |
| | 622 |
| | 13,973 |
| | 435 |
|
| | | | | | | | | | | | |
| Acquired: | | | | | | | | | | | |
| With no related allowance recorded: | | | | | | | | | | | |
| Commercial real estate | 9,200 |
| | 125 |
| | 10,884 |
| | 350 |
| | 9,639 |
| | 251 |
|
| Commercial | 4,428 |
| | 65 |
| | 6,875 |
| | 122 |
| | 5,205 |
| | 129 |
|
| Consumer | 7,837 |
| | 62 |
| | 6,701 |
| | 28 |
| | 1,333 |
| | 20 |
|
| Total acquired with no related allowance recorded | 21,465 |
| | 252 |
| | 24,460 |
| | 500 |
| | 16,177 |
| | 400 |
|
| With an allowance recorded: | | | | | | | | | | | |
| Commercial real estate | 713 |
| | — |
| | 942 |
| | 76 |
| | 2,765 |
| | 42 |
|
| Commercial | 638 |
| | — |
| | 631 |
| | 15 |
| | 577 |
| | 5 |
|
| Consumer | 249 |
| | 8 |
| | 281 |
| | 3 |
| | — |
| | — |
|
| Total acquired with an allowance recorded | 1,600 |
| | 8 |
| | 1,854 |
| | 94 |
| | 3,342 |
| | 47 |
|
| Total acquired impaired loans and leases | 23,065 |
| | 260 |
| | 26,314 |
| | 594 |
| | 19,519 |
| | 447 |
|
| | | | | | | | | | | | |
| Total impaired loans and leases | $ | 57,340 |
| | $ | 1,259 |
| | $ | 50,072 |
| | $ | 1,216 |
| | $ | 33,492 |
| | $ | 882 |
|
BROOKLINE BANCORP, INC. AND SUBSIDIARIES
Notes to Consolidated Financial Statements (Continued)
December 31, 2015, 2014, 2013
The following tables present information regarding impaired and non-impaired loans and leases at the dates indicated:
|
| | | | | | | | | | | | | | | | | | | | | | | | | | | | | | | |
| | At December 31, 2012 |
| | Loans and Leases Individually Evaluated for Impairment | | Loans and Leases Collectively Evaluated for Impairment | | Acquired Loans (ASC 310-30) | | Total |
| | Portfolio | | Allowance | | Portfolio | | Allowance | | Portfolio | | Allowance | | Portfolio | | Allowance |
| | (In Thousands) |
| Commercial real estate | $ | 5,576 |
| | $ | 316 |
| | $ | 1,652,231 |
| | $ | 19,702 |
| | $ | 348,156 |
| | $ | — |
| | $ | 2,005,963 |
| | $ | 20,018 |
|
| Commercial | 8,046 |
| | 778 |
| | 774,366 |
| | 9,877 |
| | 65,043 |
| | — |
| | 847,455 |
| | 10,655 |
|
| Indirect automobile | — |
| | — |
| | 542,344 |
| | 5,304 |
| | — |
| | — |
| | 542,344 |
| | 5,304 |
|
| Consumer | 5,237 |
| | 596 |
| | 672,051 |
| | 1,949 |
| | 102,662 |
| | — |
| | 779,950 |
| | 2,545 |
|
| Unallocated | — |
| | — |
| | — |
| | 2,630 |
| | — |
| | — |
| | — |
| | 2,630 |
|
| Total | $ | 18,859 |
| | $ | 1,690 |
| | $ | 3,640,992 |
| | $ | 39,462 |
| | $ | 515,861 |
| | $ | — |
| | $ | 4,175,712 |
| | $ | 41,152 |
|
|
| | | | | | | | | | | | | | | | | | | | | | | |
| | At December 31, 2015 |
| | Commercial Real Estate | | Commercial | | Indirect Automobile | | Consumer | | Unallocated | | Total |
| | (In Thousands) |
| Allowance for Loan and Lease Losses: | | | | | | | | | | | |
| Originated: | | | | | | | | | | | |
| Individually evaluated for impairment | $ | 2,167 |
| | $ | 1,202 |
| | $ | — |
| | $ | — |
| | $ | — |
| | $ | 3,369 |
|
| Collectively evaluated for impairment | 26,857 |
| | 20,545 |
| | 269 |
| | 3,947 |
| | — |
| | 51,618 |
|
| Total originated loans and leases | 29,024 |
| | 21,747 |
| | 269 |
| | 3,947 |
| | — |
| | 54,987 |
|
| | | | | | | | | | | | |
| Acquired: | | | | | | | | | | | |
| Individually evaluated for impairment | 148 |
| | 112 |
| | — |
| | 9 |
| | — |
| | 269 |
|
| Collectively evaluated for impairment | 333 |
| | 71 |
| | — |
| | 45 |
| | — |
| | 449 |
|
| Acquired with deteriorated credit quality | 646 |
| | 88 |
| | — |
| | 300 |
| | — |
| | 1,034 |
|
| Total acquired loans and leases | 1,127 |
| | 271 |
| | — |
| | 354 |
| | — |
| | 1,752 |
|
| | | | | | | | | | | | |
| Total allowance for loan and lease losses | $ | 30,151 |
| | $ | 22,018 |
| | $ | 269 |
| | $ | 4,301 |
| | $ | — |
| | $ | 56,739 |
|
| | | | | | | | | | | | |
| Loans and Leases: | | | | | | | | | | | |
| Originated: | | | | | | | | | | | |
| Individually evaluated for impairment | $ | 8,907 |
| | $ | 15,806 |
| | $ | — |
| | $ | 4,471 |
| | $ | — |
| | $ | 29,184 |
|
| Collectively evaluated for impairment | 2,426,248 |
| | 1,333,656 |
| | 13,678 |
| | 770,122 |
| | — |
| | 4,543,704 |
|
| Total originated loans and leases | 2,435,155 |
| | 1,349,462 |
| | 13,678 |
| | 774,593 |
| | — |
| | 4,572,888 |
|
| | | | | | | | | | | | |
| Acquired: | | | | | | | | | | | |
| Individually evaluated for impairment | 3,188 |
| | 4,090 |
| | — |
| | 2,606 |
| | — |
| | 9,884 |
|
| Collectively evaluated for impairment | 63,857 |
| | 12,081 |
| | — |
| | 105,146 |
| | — |
| | 181,084 |
|
| Acquired with deteriorated credit quality | 162,194 |
| | 8,663 |
| | — |
| | 60,827 |
| | — |
| | 231,684 |
|
| Total acquired loans and leases | 229,239 |
| | 24,834 |
| | — |
| | 168,579 |
| | — |
| | 422,652 |
|
| | | | | | | | | | | | |
| Total loans and leases | $ | 2,664,394 |
| | $ | 1,374,296 |
| | $ | 13,678 |
| | $ | 943,172 |
| | $ | — |
| | $ | 4,995,540 |
|
BROOKLINE BANCORP, INC. AND SUBSIDIARIES
Notes to Consolidated Financial Statements (Continued)
December 31, 2015, 2014, 2013
|
| | | | | | | | | | | | | | | | | | | | | | | |
| | At December 31, 2014 |
| | Commercial Real Estate | | Commercial | | Indirect Automobile | | Consumer | | Unallocated | | Total |
| | (In Thousands) |
| Allowance for Loan and Lease Losses: | | | | | | | | | | | |
| Originated: | | | | | | | | | | | |
| Individually evaluated for impairment | $ | 108 |
| | $ | 768 |
| | $ | — |
| | $ | 10 |
| | $ | — |
| | $ | 886 |
|
| Collectively evaluated for impairment | 27,457 |
| | 14,631 |
| | 2,331 |
| | 3,088 |
| | 2,418 |
| | 49,925 |
|
| Total originated loans and leases | 27,565 |
| | 15,399 |
| | 2,331 |
| | 3,098 |
| | 2,418 |
| | 50,811 |
|
| | | | | | | | | | | | |
| Acquired: | | | | | | | | | | | |
| Individually evaluated for impairment | — |
| | 144 |
| | — |
| | 41 |
| | — |
| | 185 |
|
| Collectively evaluated for impairment | 648 |
| | 222 |
| | — |
| | 2 |
| | — |
| | 872 |
|
| Acquired with deteriorated credit quality | 1,381 |
| | 192 |
| | — |
| | 218 |
| | — |
| | 1,791 |
|
| Total acquired loans and leases | 2,029 |
| | 558 |
| | — |
| | 261 |
| | — |
| | 2,848 |
|
| | | | | | | | | | | | |
| Total allowance for loan and lease losses | $ | 29,594 |
| | $ | 15,957 |
| | $ | 2,331 |
| | $ | 3,359 |
| | $ | 2,418 |
| | $ | 53,659 |
|
| | | | | | | | | | | | |
| Loans and Leases: | | | | | | | | | | | |
| Originated: | | | | | | | | | | | |
| Individually evaluated for impairment | $ | 6,870 |
| | $ | 15,459 |
| | $ | — |
| | $ | 3,231 |
| | $ | — |
| | $ | 25,560 |
|
| Collectively evaluated for impairment | 2,141,039 |
| | 1,086,360 |
| | 316,987 |
| | 662,007 |
| | — |
| | 4,206,393 |
|
| Total originated loans and leases | 2,147,909 |
| | 1,101,819 |
| | 316,987 |
| | 665,238 |
| | — |
| | 4,231,953 |
|
| | | | | | | | | | | | |
| Acquired: | | | | | | | | | | | |
| Individually evaluated for impairment | 626 |
| | 4,458 |
| | — |
| | 2,562 |
| | — |
| | 7,646 |
|
| Collectively evaluated for impairment | 97,141 |
| | 38,504 |
| | — |
| | 134,973 |
| | — |
| | 270,618 |
|
| Acquired with deteriorated credit quality | 222,125 |
| | 22,313 |
| | — |
| | 67,952 |
| | — |
| | 312,390 |
|
| Total acquired loans and leases | 319,892 |
| | 65,275 |
| | — |
| | 205,487 |
| | — |
| | 590,654 |
|
| | | | | | | | | | | | |
| Total loans and leases | $ | 2,467,801 |
| | $ | 1,167,094 |
| | $ | 316,987 |
| | $ | 870,725 |
| | $ | — |
| | $ | 4,822,607 |
|
Troubled Debt Restructured Loans and Leases
A specific valuation allowance for losses on troubled debt restructured loans is determined by comparing the net carrying amount of the troubled debt restructured loan with the restructured loan's cash flows discounted at the original effective rate.
BROOKLINE BANCORP, INC. AND SUBSIDIARIES
Notes to Consolidated Financial Statements (Continued)
December 31, 2015, 2014, 2013
The following table sets forth information regarding troubled debt restructured loans and leases at the dates indicated:
|
| | | | | | | |
| | At December 31, 2015 | | At December 31, 2014 |
| | (In Thousands) |
| Troubled debt restructurings: | | | |
| On accrual | $ | 17,953 |
| | $ | 14,815 |
|
| On nonaccrual | 4,965 |
| | 5,625 |
|
| Total troubled debt restructurings | $ | 22,918 |
| | $ | 20,440 |
|
The recorded investment in troubled debt restructurings and the associated specific allowances for loan and lease losses, in the originated and acquired loan and lease portfolios, that were modified during the periods indicated, are as follows for the periods indicated:follows.
| | | | Year Ended December 31, 2013 | At and for the Year Ended December 31, 2015 |
| | | | Recorded Investment | | Specific Allowance for Loan and Lease Losses | | | | | | Defaulted | | | Recorded Investment | | Specific Allowance for Loan and Lease Losses | | | | | | Defaulted (1) |
| | Number of Loans/ Leases | | At Modification | | At End of Period | | Nonaccrual Loans and Leases | | Additional Commitment | | Number of Loans/ Leases | | Recorded Investment | Number of Loans/ Leases | | At Modification | | At End of Period | | Nonaccrual Loans and Leases | | Additional Commitment | | Number of Loans/ Leases | | Recorded Investment |
| | (Dollars in Thousands) | (Dollars in Thousands) |
| Originated: | | | | | | | | | | | | | | | | | | | | | | | | | | | | | | |
| Commercial real estate mortgage | 1 |
| | $ | 1,039 |
| | $ | — |
| | $ | — |
| | $ | — |
| | $ | — |
| | — |
| | $ | — |
| |
| Commercial real estate | | — |
| | $ | — |
| | $ | — |
| | $ | — |
| | $ | — |
| | $ | — |
| | — |
| | $ | — |
|
| Commercial | 2 |
| | 926 |
| | 918 |
| | — |
| | — |
| | — |
| | — |
| | — |
| 9 |
| | 5,757 |
| | 5,497 |
| | 119 |
| | 258 |
| | — |
| | 1 |
| | 237 |
|
| Equipment financing | 5 |
| | 1,557 |
| | 1,415 |
| | 77 |
| | 861 |
| | — |
| | 2 |
| | 371 |
| 1 |
| | 112 |
| | 100 |
| | — |
| | — |
| | — |
| | — |
| | — |
|
| Residential mortgage | 1 |
| | 415 |
| | 353 |
| | — |
| | 353 |
| | — |
| | — |
| | — |
| 1 |
| | 100 |
| | 150 |
| | — |
| | 151 |
| | — |
| | — |
| | — |
|
| Total | 9 |
| | $ | 3,937 |
| | $ | 2,686 |
| | $ | 77 |
| | $ | 1,214 |
| | $ | — |
| | 2 |
| | $ | 371 |
| |
| Home equity | | 3 |
| | 353 |
| | 298 |
| | — |
| | 99 |
| | — |
| | 1 |
| | 28 |
|
| Total originated | | 14 |
| | 6,322 |
| | 6,045 |
| | 119 |
| | 508 |
| | — |
| | 2 |
| | 265 |
|
| | | | | | | | | | | | | | | | | |
| Acquired: | | | | | | | | | | | | | | | | |
| Commercial | | 4 |
| | 642 |
| | 632 |
| | — |
| | — |
| | — |
| | 1 |
| | 11 |
|
| Home equity | | 2 |
| | 200 |
| | 196 |
| | — |
| | — |
| | — |
| | 1 |
| | 24 |
|
| Total acquired | | 6 |
| | 842 |
| | 828 |
| | — |
| | — |
| | — |
| | 2 |
| | 35 |
|
| | | | | | | | | | | | | | | | | |
| Total loans and leases | | 20 |
| | $ | 7,164 |
| | $ | 6,873 |
| | $ | 119 |
| | $ | 508 |
| | $ | — |
| | 4 |
| | $ | 300 |
|
| | | | | | | | | | | | | | | | | |
(1) Includes loans and leases that have been modified within the past twelve months and subsequently had payment defaults during the period indicated.
BROOKLINE BANCORP, INC. AND SUBSIDIARIES
Notes to Consolidated Financial Statements (Continued)
December 31, 2015, 2014, 2013 2012 and 2011
| | | | Year Ended December 31, 2013 | At and for the Year Ended December 31, 2014 |
| | | | Recorded Investment | | Specific Allowance for Loan and Lease Losses | | | | | | Defaulted | | | Recorded Investment | | Specific Allowance for Loan and Lease Losses | | | | | | Defaulted (1) |
| | Number of Loans/ Leases | | At Modification | | At End of Period | | Nonaccrual Loans and Leases | | Additional Commitment | | Number of Loans/ Leases | | Recorded Investment | Number of Loans/ Leases | | At Modification | | At End of Period | | Nonaccrual Loans and Leases | | Additional Commitment | | Number of Loans/ Leases | | Recorded Investment |
| | (Dollars in Thousands) | (Dollars in Thousands) |
| Acquired: | | | | | | | | | | | | | | | | |
| Commercial real estate mortgage | 1 |
| | $ | 737 |
| | $ | 727 |
| | $ | — |
| | $ | — |
| | $ | — |
| | — |
| | $ | — |
| |
| Originated: | | | | | | | | | | | | | | | | |
| Commercial real estate | | 1 |
| | $ | 953 |
| | $ | 932 |
| | $ | — |
| | $ | — |
| | $ | — |
| | — |
| | $ | — |
|
| Commercial | 6 |
| | 3,209 |
| | 3,135 |
| | — |
| | 1,335 |
| | — |
| | 1 |
| | 1,335 |
| 6 |
| | 2,884 |
| | 2,948 |
| | — |
| | 628 |
| | — |
| | 3 |
| | 615 |
|
| Equipment financing | — |
| | — |
| | — |
| | — |
| | — |
| | — |
| | — |
| | — |
| 6 |
| | 984 |
| | 936 |
| | 15 |
| | 169 |
| | — |
| | 4 |
| | 636 |
|
| Residential mortgage | — |
| | — |
| | — |
| | — |
| | — |
| | — |
| | — |
| | — |
| 1 |
| | 496 |
| | — |
| | — |
| | — |
| | — |
| | — |
| | — |
|
| Total | 7 |
| | $ | 3,946 |
| | $ | 3,862 |
| | $ | — |
| | $ | 1,335 |
| | $ | — |
| | 1 |
| | $ | 1,335 |
| |
| Home Equity | | 2 |
| | 400 |
| | 402 |
| | — |
| | — |
| | — |
| | — |
| | — |
|
| Total originated | | 16 |
| | 5,717 |
| | 5,218 |
| | 15 |
| | 797 |
| | — |
| | 7 |
| | 1,251 |
|
| | | | | | | | | | | | | | | | | |
| Acquired: | | | | | | | | | | | | | | | | |
| Commercial | | 6 |
| | 1,369 |
| | 1,406 |
| | — |
| | 66 |
| | — |
| | 1 |
| | 419 |
|
| Home Equity | | 1 |
| | 190 |
| | 189 |
| | — |
| | — |
| | — |
| | — |
| | — |
|
| Total acquired | | 7 |
| | 1,559 |
| | 1,595 |
| | — |
| | 66 |
| | — |
| | 1 |
| | 419 |
|
| | | | | | | | | | | | | | | | | |
| Total loans and leases | | 23 |
| | $ | 7,276 |
| | $ | 6,813 |
| | $ | 15 |
| | $ | 863 |
| | $ | — |
| | 8 |
| | $ | 1,670 |
|
(1) Includes loans and leases that have been modified within the past twelve months and subsequently had payment defaults during the period indicated.
| | | | Year Ended December 31, 2012 | At and for the Year Ended December 31, 2013 |
| | | | Recorded Investment | | Specific Allowance for Loan and Lease Losses | | | | | | Defaulted | | | Recorded Investment | | Specific Allowance for Loan and Lease Losses | | | | Defaulted (1) |
| | Number of Loans/ Leases | | At Modification | | At End of Period | | Nonaccrual Loans and Leases | | Additional Commitment | | Number of Loans/ Leases | | Recorded Investment | Number of Loans/ Leases | | At Modification | | At End of Period | | Nonaccrual Loans and Leases | | Number of Loans/ Leases | | Recorded Investment |
| | (Dollars in Thousands) | (Dollars in Thousands) |
| Originated: | | | | | | | | | | | | | | | | | | | | | | | | | | | | |
| Commercial real estate mortgage | 2 |
| | $ | 867 |
| | $ | 854 |
| | $ | 33 |
| | $ | 513 |
| | $ | — |
| | 2 |
| | $ | 1,288 |
| |
| Commercial real estate | | 1 |
| | $ | 1,039 |
| | $ | — |
| | $ | — |
| | $ | — |
| | — |
| | $ | — |
|
| Commercial | 3 |
| | 3,942 |
| | 2,086 |
| | 316 |
| | 1,993 |
| | — |
| | 1 |
| | 44 |
| 2 |
| | 926 |
| | 918 |
| | — |
| | — |
| | — |
| | — |
|
| Equipment financing | 8 |
| | 2,138 |
| | 2,038 |
| | 110 |
| | 793 |
| | — |
| | 6 |
| | 1,240 |
| 5 |
| | 1,557 |
| | 1,415 |
| | 77 |
| | 861 |
| | 2 |
| | 371 |
|
| Residential mortgage | 6 |
| | 2,422 |
| | 1,724 |
| | 315 |
| | 294 |
| | — |
| | 3 |
| | 763 |
| 1 |
| | 415 |
| | 353 |
| | — |
| | 353 |
| | — |
| | — |
|
| Total | 19 |
| | $ | 9,369 |
| | $ | 6,702 |
| | $ | 774 |
| | $ | 3,593 |
| | $ | — |
| | 12 |
| | $ | 3,335 |
| |
| Total originated | | 9 |
| | 3,937 |
| | 2,686 |
| | 77 |
| | 1,214 |
| | 2 |
| | 371 |
|
| | | | | | | | | | | | | | | |
| Acquired: | | | | | | | | | | | | | | |
| Commercial real estate | | 1 |
| | 737 |
| | 727 |
| | — |
| | — |
| | — |
| | — |
|
| Commercial | | 6 |
| | 3,209 |
| | 3,135 |
| | — |
| | 1,335 |
| | 1 |
| | 1,335 |
|
| Total acquired | | 7 |
| | 3,946 |
| | 3,862 |
| | — |
| | 1,335 |
| | 1 |
| | 1,335 |
|
| | | | | | | | | | | | | | | |
| Total loans and leases | | 16 |
| | $ | 7,883 |
| | $ | 6,548 |
| | $ | 77 |
| | $ | 2,549 |
| | 3 |
| | $ | 1,706 |
|
|
| | | | | | | | | | | | | | | | | | | | | | | | | | | | | |
| | Year Ended December 31, 2012 |
| | | | Recorded Investment | | Specific Allowance for Loan and Lease Losses | | | | | | Defaulted |
| | Number of Loans/ Leases | | At Modification | | At End of Period | | | Nonaccrual Loans and Leases | | Additional Commitment | | Number of Loans/ Leases | | Recorded Investment |
| | (Dollars in Thousands) |
| Acquired: | | | | | | | | | | | | | | | |
| Commercial real estate mortgage | 1 |
| | $ | 3,145 |
| | $ | 3,208 |
| | $ | — |
| | $ | — |
| | $ | — |
| | — |
| | $ | — |
|
| Commercial | 2 |
| | 1,229 |
| | 1,163 |
| | — |
| | 478 |
| | — |
| | — |
| | — |
|
| Equipment financing | — |
| | — |
| | — |
| | — |
| | — |
| | — |
| | — |
| | — |
|
| Residential mortgage | — |
| | — |
| | — |
| | — |
| | — |
| | — |
| | — |
| | — |
|
| Total | 3 |
| | $ | 4,374 |
| | $ | 4,371 |
| | $ | — |
| | $ | 478 |
| | $ | — |
| | — |
| | $ | — |
|
|
| | | | | | | | | | | | | | | | | | | | | | | | | | | | | |
| | Year Ended December 31, 2011 |
| | | | Recorded Investment | | Specific Allowance for Loan and Lease Losses | | | | | | Defaulted |
| | Number of Loans/ Leases | | At Modification | | At End of Period | | | Nonaccrual Loans and Leases | | Additional Commitment | | Number of Loans/ Leases | | Recorded Investment |
| | (Dollars in Thousands) |
| Originated: | | | | | | | | | | | | | | | |
| Commercial real estate mortgage | 2 |
| | $ | 1,171 |
| | $ | 1,170 |
| | $ | 28 |
| | $ | — |
| | $ | — |
| | — |
| | $ | — |
|
| Multi-family mortgage | 1 |
| | 29 |
| | 29 |
| | — |
| | 29 |
| | — |
| | 1 |
| | 29 |
|
| Commercial | 1 |
| | 66 |
| | 66 |
| | — |
| | — |
| | — |
| | — |
| | — |
|
| Equipment financing | 16 |
| | 1,819 |
| | 1,710 |
| | 173 |
| | 524 |
| | — |
| | 3 |
| | 365 |
|
| Residential mortgage | 10 |
| | 1,942 |
| | 1,937 |
| | 190 |
| | 243 |
| | — |
| | 2 |
| | 491 |
|
| Total | 30 |
| | $ | 5,027 |
| | $ | 4,912 |
| | $ | 391 |
| | $ | 796 |
| | $ | — |
| | 6 |
| | $ | 885 |
|
BROOKLINE BANCORP, INC. AND SUBSIDIARIES
Notes to Consolidated Financial Statements (Continued)
December 31, 2013, 2012 and 2011
|
| | | | | | | | | | | | | | | | | | | | | | | | | | | | | |
| | Year Ended December 31, 2011 |
| | | | Recorded Investment | | Specific Allowance for Loan and Lease Losses | | | | | | Defaulted |
| | Number of Loans/ Leases | | At Modification | | At End of Period | | | Nonaccrual Loans and Leases | | Additional Commitment | | Number of Loans/ Leases | | Recorded Investment |
| | (Dollars in Thousands) |
| Acquired: | | | | | | | | | | | | | | | |
| Commercial real estate mortgage | 1 |
| | $ | 1,725 |
| | $ | 1,609 |
| | $ | — |
| | $ | 1,608 |
| | $ | — |
| | — |
| | $ | — |
|
| Multi-family mortgage | — |
| | — |
| | — |
| | — |
| | — |
| | — |
| | — |
| | — |
|
| Commercial | — |
| | — |
| | — |
| | — |
| | — |
| | — |
| | — |
| | — |
|
| Equipment financing | — |
| | — |
| | — |
| | — |
| | — |
| | — |
| | — |
| | — |
|
| Residential mortgage | 1 |
| | 677 |
| | 652 |
| | — |
| | — |
| | — |
| | — |
| | — |
|
| Total | 2 |
| | $ | 2,402 |
| | $ | 2,261 |
| | $ | — |
| | $ | 1,608 |
| | $ | — |
| | — |
| | $ | — |
|
The financial impact of the modification of performing and nonperforming(1) Includes loans and leases forthat have been modified within the year ending December 31, 2013 was $0.8 million. There was no financial impact ofpast twelve months and subsequently had payment defaults during the modification of performing and nonperforming loans and leases for the year ending December 31, 2012 or 2011.period indicated.
The following table sets forth the Company's end-of-period balances for troubled debt restructurings that were modified during the periods indicated, by type of modification.
|
| | | | | | | | | | | |
| | Year Ended December 31, |
| | 2013 | | 2012 | | 2011 |
| | (In Thousands) | | |
| Loans modified once: | | | | | |
| Extended maturity | $ | 3,841 |
| | $ | 1,478 |
| | $ | 1,136 |
|
| Adjusted principal | 908 |
| | 2,185 |
| | 1,456 |
|
| Adjusted interest rate | 755 |
| | 1,715 |
| | — |
|
| Combination maturity, principal, interest rate | 554 |
| | 1,838 |
| | 1,928 |
|
| Total loans modified once | $ | 6,058 |
| | $ | 7,216 |
| | $ | 4,520 |
|
| | | | | | |
| Loans modified more than once: | | | | | |
| Extended maturity | $ | 490 |
| | $ | — |
| | $ | 78 |
|
| Adjusted principal | — |
| | 3,857 |
| | 1,471 |
|
| Adjusted interest rate | — |
| | — |
| | 353 |
|
| Combination maturity, principal, interest rate | — |
| | — |
| | 751 |
|
| Total loans modified more than once | $ | 490 |
| | $ | 3,857 |
| | $ | 2,653 |
|
BROOKLINE BANCORP, INC. AND SUBSIDIARIES
Notes to Consolidated Financial Statements (Continued)
December 31, 2015, 2014, 2013 2012 and 2011
|
| | | | | | | | | | | |
| | Year Ended December 31, |
| | 2015 | | 2014 | | 2013 |
| | (In Thousands) |
| Loans with one modification: | | | | | |
| Extended maturity | $ | 2,215 |
| | $ | 3,241 |
| | $ | 3,841 |
|
| Adjusted principal | — |
| | — |
| | 908 |
|
| Adjusted interest rate | — |
| | — |
| | 755 |
|
| Interest only | 1,335 |
| | 16 |
| | — |
|
| Combination maturity, principal, interest rate | 692 |
| | 479 |
| | 554 |
|
| Total loans modified once | $ | 4,242 |
| | $ | 3,736 |
| | $ | 6,058 |
|
| | | | | | |
| Loans with more than one modification: | | | | | |
| Extended maturity | $ | 2,598 |
| | $ | 1,951 |
| | $ | 490 |
|
| Interest only | — |
| | 292 |
| | — |
|
| Combination maturity, principal, interest rate | 33 |
| | 834 |
| | — |
|
| Total loans modified more than once | $ | 2,631 |
| | $ | 3,077 |
| | $ | 490 |
|
The net charge-offs of the performing and nonperforming troubled debt restructuring loans and leases for the years ending December 31, 2015 and December 31, 2014 were $0.2 million and $0.3 million, respectively. There was no charge-offs or recoveries for troubled debt restructurings for the year ending December 31, 2013.
As of December 31, 2015, there were no commitments to lend funds to debtors owing receivables whose terms had been modified in troubled debt restructurings.
(8) Premises and Equipment
Premises and equipment consist of the following:
| | | | At December 31, | | Estimated Useful Life | At December 31, | | Estimated Useful Life |
| | 2013 | | 2012 | | 2015 | | 2014 | |
| | (In Thousands) | | (In Years) | (In Thousands) | | (In Years) |
| Land | $ | 7,481 |
| | $ | 7,553 |
| | NA | $ | 7,562 |
| | $ | 7,562 |
| | NA |
| Office building and improvements | 75,271 |
| | 67,672 |
| | 10 to 40 | 81,466 |
| | 78,461 |
| | 10 to 40 |
| Furniture, fixtures and equipment | 25,633 |
| | 22,537 |
| | 3 to 10 | 13,019 |
| | 12,224 |
| | 5 to 25 |
| Software | 5,018 |
| | 5,063 |
| | 3 to 7 | |
| Core processing system | 11,522 |
| | 6,951 |
| | 7.5 | |
| Vehicles | | 221 |
| | 144 |
| | 3 to 5 |
| Computer Equipment | | 8,677 |
| | 8,400 |
| | 3 |
| Core processing system and software | | 18,933 |
| | 18,496 |
| | 3 to 7.5 |
| Total | 124,925 |
| | 109,776 |
| | | 129,878 |
| | 125,287 |
| | |
| Accumulated depreciation and amortization | 44,420 |
| | 38,985 |
| | | 51,722 |
| | 44,668 |
| | |
| Total premises and equipment | $ | 80,505 |
| | $ | 70,791 |
| | | $ | 78,156 |
| | $ | 80,619 |
| | |
Depreciation and amortization expense is calculated using the straight-line method and is included in occupancy and equipment and data processing expense in the Consolidated Statements of Income. For the years ended December 31, 2013, 20122015, 2014 and 2011,2013, depreciation and amortization expense related to premises and equipment totaled $6.5$7.2 million, $4.0$7.0 million, and $2.1$6.3 million, respectively.
In January 2014, the Company completed a transaction to sell a facility located in Brookline, MA, for $2.2 million. The carrying value of the property, including land, building, and furniture, fixtures, and equipment, was $0.4 million. After costs to sell of $0.2 million, the Company recorded a gain on sale in the amount of $1.6 million during the year ended December 31,
BROOKLINE BANCORP, INC. AND SUBSIDIARIES
Notes to Consolidated Financial Statements (Continued)
December 31, 2015, 2014, 2013
2014, which is included in gain on sale/disposals of premises and equipment, net in the Company’s consolidated statements of income. There were no sales of premises and equipment during the years ended December 31, 2015 and 2013.
(9) Goodwill and Other Intangible Assets
The changes in the carrying value of goodwill for the periods indicated were as follows: | | | | Year Ended December 31, | Year Ended December 31, |
| | 2013 | | 2012 | | 2011 | 2015 | | 2014 | | 2013 |
| | (In Thousands) | (In Thousands) |
| Balance at beginning of year | $ | 137,890 |
| | $ | 45,799 |
| | $ | 43,241 |
| $ | 137,890 |
| | $ | 137,890 |
| | $ | 137,890 |
|
| Additions | — |
| | 93,145 |
| | 2,558 |
| — |
| | — |
| | — |
|
| Adjustments to original goodwill | — |
| | (1,054 | ) | | — |
| — |
| | — |
| | — |
|
| Balance at end of year | $ | 137,890 |
| | $ | 137,890 |
| | $ | 45,799 |
| $ | 137,890 |
| | $ | 137,890 |
| | $ | 137,890 |
|
BROOKLINE BANCORP, INC. AND SUBSIDIARIES
Notes to Consolidated Financial Statements (Continued)
December 31, 2013, 2012 and 2011
The following is a summary of the Company's other intangible assets:
| | | | At December 31, 2013 | | At December 31, 2012 | At December 31, 2015 | | At December 31, 2014 |
| | Gross
Amount | | Accumulated
Amortization | | Carrying
Amount | | Gross
Amount | | Accumulated
Amortization | | Carrying
Amount | Gross
Amount | | Accumulated
Amortization | | Carrying
Amount | | Gross
Amount | | Accumulated
Amortization | | Carrying
Amount |
| | (In Thousands) | (In Thousands) |
| Other intangible assets: | | | | | | | | | | | | | | | | | | | | | | |
| Core deposits | $ | 36,172 |
| | $ | 20,395 |
| | $ | 15,777 |
| | $ | 36,172 |
| | $ | 16,399 |
| | $ | 19,773 |
| $ | 36,172 |
| | $ | 26,628 |
| | $ | 9,544 |
| | $ | 36,172 |
| | $ | 23,717 |
| | $ | 12,455 |
|
| Trade name | 1,600 |
| | 511 |
| | 1,089 |
| | 1,600 |
| | 267 |
| | 1,333 |
| 1,600 |
| | 511 |
| | 1,089 |
| | 1,600 |
| | 511 |
| | 1,089 |
|
| Trust relationship | 1,568 |
| | 1,547 |
| | 21 |
| | 1,568 |
| | 1,164 |
| | 404 |
| 1,568 |
| | 1,568 |
| | — |
| | 1,568 |
| | 1,568 |
| | — |
|
| Other intangible | 442 |
| | 442 |
| | — |
| | 442 |
| | 442 |
| | — |
| 442 |
| | 442 |
| | — |
| | 442 |
| | 442 |
| | — |
|
| Total other intangible assets | $ | 39,782 |
| | $ | 22,895 |
| | $ | 16,887 |
| | $ | 39,782 |
| | $ | 18,272 |
| | $ | 21,510 |
| $ | 39,782 |
| | $ | 29,149 |
| | $ | 10,633 |
| | $ | 39,782 |
| | $ | 26,238 |
| | $ | 13,544 |
|
As ofAt December 31, 2013, the Company has concluded that the BankRI name willwould continue to be utilized in its marketing strategies; therefore, the trade name with carrying value of $1.1 million, has an indefinite life and ceased to amortize.
The weighted-average amortization period for core deposit intangible and trust relationships is 11.0 and 1.0 years, respectively. There were no impairment losses relating to other acquisition-related intangible assets recorded during the years ended December 31, 2013, 20122015, 2014 and 2011.2013.
The estimated aggregate future amortization expense for other intangible assets for each of the next five years and thereafter is as follows:
| | | Year ended December 31: | Amount | Amount |
| | (In Thousands) |
| (In Thousands) |
|
| 2014 | $ | 3,124 |
| |
| 2015 | 2,868 |
| |
| 2016 | 2,457 |
| $ | 2,500 |
|
| 2017 | 1,858 |
| 2,089 |
|
| 2018 | 1,836 |
| 1,669 |
|
| 2019 | | 1,295 |
|
| 2020 | | 944 |
|
| Thereafter | 3,655 |
| 1,047 |
|
| Total | $ | 15,798 |
| $ | 9,544 |
|
BROOKLINE BANCORP, INC. AND SUBSIDIARIES
Notes to Consolidated Financial Statements (Continued)
December 31, 2015, 2014, 2013
(10) Other Assets
BOLI
BOLI is recorded at the cash surrender value of the policies, less any applicable cash surrender charges, and is recorded in other assets. AtAs of December 31, 20132015 and 2012,2014, BankRI owned nineseven policies with a net cash surrender value of $34.7$36.8 million and $33.7$35.8 million, respectively. At bothAs of December 31, 20132015 and 2012,2014, First Ipswich owned two policies with a net cash surrender value of $0.8 million and $0.7 million.million, respectively.
The Company recorded a total of $1.0 million, $1.1 million, and $1.1 million of tax exempt income from these nine policies in 2015, 2014, and 2013, respectively. They are included in the Company’s other non-interest income in the consolidated statements of income.
Affordable Housing Investments
The Company began investing in affordable housing projects that benefit low- and moderate-income individuals in 2011 and currently has2009. As of December 31, 2015, the Company had investments in seventen of these projects. During 2013,The project sponsor or general partner controls the Company invested in two new affordable housing projects for a total of $3.3 million. Theproject's management. In each case, the Company is a limited partner in these projects given that its investments do not exceedwith less than 50% of the outstanding equity interest in any single projectproject.
On January 1, 2015, the Company adopted ASU 2014-01, Accounting for Investments in Qualified Affordable Housing Projects, which required retrospective application. Prior to the adoption of ASU 2014-01, the Company’s investments in qualified affordable housing projects were accounted for using the equity method. Under the equity method, operating losses or gains from these investments were included as a component of non-interest income in the Company's consolidated statements of income. ASU 2014-01 calls for the use of the proportional amortization method calculation and project managementthe operating losses or gains for these investments are included as a component of the provision for income taxes in the Company’s consolidated statements of income. Under the proportional amortization method, the initial costs of the investment in qualified affordable housing projects is controlled byamortized based on the general partner or project sponsor. tax credits and other benefits received.
Further information regarding the Company's investments in affordable housing projects follows:
|
| | | | | | | | | | | |
| | At December 31, |
| | 2015 | | 2014 | | 2013 |
| | (In Thousands) |
| Investments in affordable housing projects included in other assets | $ | 11,604 |
| | $ | 10,131 |
| | $ | 10,301 |
|
| Unfunded commitments related to affordable housing projects included in other liabilities | 3,163 |
| | 2,608 |
| | 2,904 |
|
| Investment in affordable housing tax credits included in other liabilities | 1,588 |
| | 1,432 |
| | 1,105 |
|
| Investment in affordable housing tax benefits included in other liabilities | 656 |
| | 669 |
| | 553 |
|
|
| | | |
| | For the year ended December 31, 2015 |
| | (In Thousands) |
| Investment amortization included in provision for income taxes | $ | 1,654 |
|
| Amount recognized as income tax benefit | 656 |
|
ASU 2014-01 was applied retrospectively to all periods presented. The cumulative effect on retained earnings was $1.1 million at January 1, 2015.
BROOKLINE BANCORP, INC. AND SUBSIDIARIES
Notes to Consolidated Financial Statements (Continued)
December 31, 2015, 2014, 2013 2012 and 2011
The following table illustrates the prior period adjustments related to the adoption of ASU 2014-01. |
| | | | | | | | | | | |
| | As of and for the Year Ended December 31, |
| | 2013 | | 2012 | | 2011 |
| | (In Thousands) |
| Investments in affordable housing projects included in other assets | $ | 10,301 |
| | $ | 9,167 |
| | $ | 6,712 |
|
| Unfunded commitments related to affordable housing projects included in other liabilities | 2,904 |
| | 4,291 |
| | 2,864 |
|
| Loss from investments in affordable housing projects | 1,812 |
| | 694 |
| | 671 |
|
| Reduction in tax expense due to affordable housing tax credits | 1,058 |
| | 806 |
| | 464 |
|
(11) Deposits
A summary of deposits follows: |
| | | |
| | At December 31, 2014 |
| | (In Thousands) |
| Other assets, as reported | $ | 79,411 |
|
| Prior period adjustment | 1,068 |
|
| Other assets, as adjusted | $ | 80,479 |
|
| | |
| Retained earnings, as reported | $ | 83,792 |
|
| Prior period adjustment | 1,068 |
|
| Retained earnings, as adjusted | $ | 84,860 |
|
|
| | | | | | | | | | | | | |
| | December 31, 2013 | | December 31, 2012 |
| | Amount | | Weighted Average Rate | | Amount | | Weighted Average Rate |
| | (Dollars in Thousands) |
| Demand checking accounts | $ | 707,023 |
| | — |
| | $ | 623,274 |
| | — |
|
| NOW accounts | 210,602 |
| | 0.07 | % | | 212,858 |
| | 0.09 | % |
| Savings accounts | 494,734 |
| | 0.25 | % | | 515,367 |
| | 0.39 | % |
| Money market accounts | 1,487,979 |
| | 0.54 | % | | 1,253,819 |
| | 0.63 | % |
| Total core deposit accounts | 2,900,338 |
| | 0.32 | % | | 2,605,318 |
| | 0.39 | % |
| Certificate of deposit accounts maturing: | | | | | | | |
| Within six months | 381,986 |
| | 0.72 | % | | 392,138 |
| | 0.91 | % |
| After six months but within 1 year | 312,005 |
| | 0.82 | % | | 359,510 |
| | 0.95 | % |
| After 1 year but within 2 years | 141,518 |
| | 1.09 | % | | 159,747 |
| | 1.09 | % |
| After 2 years but within 3 years | 45,965 |
| | 1.91 | % | | 34,392 |
| | 2.05 | % |
| After 3 years but within 4 years | 26,046 |
| | 1.65 | % | | 37,813 |
| | 2.08 | % |
| After 4 years but within 5 years | 26,810 |
| | 1.33 | % | | 27,341 |
| | 1.65 | % |
| 5+ Years | 338 |
| | 1.15 | % | | — |
| | — | % |
| Total certificate of deposit accounts | 934,668 |
| | 0.91 | % | | 1,010,941 |
| | 1.06 | % |
| Total deposits | $ | 3,835,006 |
| | 0.47 | % | | $ | 3,616,259 |
| | 0.58 | % |
Certificate of deposit accounts issued in amounts of $100,000 or more totaled $424.7 million and $437.9 million at December 31, 2013 and 2012, respectively.
Interest expense on deposit balances is summarized as follows: |
| | | | | | | |
| | For the year ended December 31, |
| | 2014 | | 2013 |
| | (In Thousands) |
| Loss from investments in affordable housing projects, as reported | $ | (2,060 | ) | | $ | (1,812 | ) |
| Prior period adjustment | 2,060 |
| | 1,812 |
|
| Loss from investments in affordable housing projects, as adjusted | $ | — |
| | $ | — |
|
| | | | |
| Provision for income taxes, as reported | $ | 24,749 |
| | $ | 19,481 |
|
| Prior period adjustment | 1,537 |
| | 1,183 |
|
| Provision for income taxes, as adjusted | $ | 26,286 |
| | $ | 20,664 |
|
| | | | |
| Net income, as reported | $ | 42,765 |
| | $ | 35,386 |
|
| Prior period adjustment | 523 |
| | 629 |
|
| Net income, as adjusted | $ | 43,288 |
| | $ | 36,015 |
|
| | | | |
| Basic earnings per share, as reported | $ | 0.61 |
| | $ | 0.51 |
|
| Prior period adjustment | 0.01 |
| | 0.01 |
|
| Basic earnings per share, as adjusted | $ | 0.62 |
| | $ | 0.52 |
|
| | | | |
| Effective tax rate, as reported | 35.5 | % | | 34.4 | % |
| Prior period adjustment | 1.2 | % | | 0.9 | % |
| Effective tax rate, as adjusted | 36.7 | % | | 35.3 | % |
BROOKLINE BANCORP, INC. AND SUBSIDIARIES
Notes to Consolidated Financial Statements (Continued)
December 31, 2015, 2014, 2013 2012 and 2011
(11) Deposits
A summary of deposits follows:
| | | | Year Ended December 31, | December 31, 2015 | | December 31, 2014 |
| | 2013 | | 2012 | | 2011 | Amount | | Weighted Average Rate | | Amount | | Weighted Average Rate |
| | (In Thousands) | (Dollars in Thousands) |
| Interest-bearing deposits: | | | | | | |
| Demand checking accounts | | $ | 799,117 |
| | — |
| | $ | 726,118 |
| | — |
|
| NOW accounts | $ | 173 |
| | $ | 209 |
| | $ | 216 |
| 283,972 |
| | 0.07 | % | | 235,063 |
| | 0.07 | % |
| Savings accounts | 1,288 |
| | 1,726 |
| | 942 |
| 540,788 |
| | 0.25 | % | | 531,727 |
| | 0.21 | % |
| Money market accounts | 8,220 |
| | 8,773 |
| | 7,626 |
| 1,594,269 |
| | 0.44 | % | | 1,518,490 |
| | 0.52 | % |
| Certificate of deposit accounts | 9,092 |
| | 10,724 |
| | 10,973 |
| |
| Total interest-bearing deposits | $ | 18,773 |
| | $ | 21,432 |
| | $ | 19,757 |
| |
| Total core deposit accounts | | 3,218,146 |
| | 0.26 | % | | 3,011,398 |
| | 0.31 | % |
| Certificate of deposit accounts maturing: | | | | | | | | |
| Within six months | | 320,975 |
| | 0.65 | % | | 363,258 |
| | 0.70 | % |
| After six months but within 1 year | | 395,516 |
| | 0.83 | % | | 258,379 |
| | 0.72 | % |
| After 1 year but within 2 years | | 226,513 |
| | 1.02 | % | | 232,658 |
| | 1.08 | % |
| After 2 years but within 3 years | | 60,730 |
| | 1.42 | % | | 36,685 |
| | 1.49 | % |
| After 3 years but within 4 years | | 30,002 |
| | 1.78 | % | | 24,059 |
| | 1.32 | % |
| After 4 years but within 5 years | | 53,717 |
| | 1.88 | % | | 31,630 |
| | 1.75 | % |
| 5+ Years | | 419 |
| | 1.82 | % | | 39 |
| | 1.34 | % |
| Total certificate of deposit accounts | | 1,087,872 |
| | 0.93 | % | | 946,708 |
| | 0.88 | % |
| Total deposits | | $ | 4,306,018 |
| | 0.43 | % | | $ | 3,958,106 |
| | 0.44 | % |
Certificate of deposit accounts issued in amounts of $250,000 or more totaled $168.4 million and $222.2 million as of December 31, 2015 and 2014, respectively.
Interest expense on deposit balances is summarized as follows:
|
| | | | | | | | | | | |
| | Year Ended December 31, |
| | 2015 | | 2014 | | 2013 |
| | (In Thousands) |
| Interest-bearing deposits: | | | | | |
| NOW accounts | $ | 179 |
| | $ | 171 |
| | $ | 173 |
|
| Savings accounts | 1,094 |
| | 1,197 |
| | 1,288 |
|
| Money market accounts | 6,935 |
| | 7,846 |
| | 8,220 |
|
| Certificate of deposit accounts | 9,272 |
| | 7,846 |
| | 9,092 |
|
| Total interest-bearing deposits | $ | 17,480 |
| | $ | 17,060 |
| | $ | 18,773 |
|
Related Party Deposits
Deposit accounts of directors, executive officers and their affiliates totaled $40.5 million and $16.1 million as of December 31, 2015 and 2014, respectively.
Collateral Pledged to Deposits
AtAs of December 31, 20132015 and 2012, $62.42014, $170.4 million and $86.5$93.0 million, respectively, of collateral was pledged for municipal deposits; treasury; taxdeposits and loan deposits.
(12) Borrowed Funds
Borrowed funds are comprised of the following:
|
| | | | | | | |
| | At December 31, |
| | 2013 | | 2012 |
| | (In Thousands) |
| Advances from the FHLBB | $ | 768,773 |
| | $ | 790,865 |
|
| Repurchase agreements | 34,619 |
| | 51,013 |
|
| Subordinated debentures | 9,163 |
| | 12,091 |
|
| Total borrowed funds | $ | 812,555 |
| | $ | 853,969 |
|
Interest expense on borrowed funds for the periods indicated is as follows:
|
| | | | | | | | | | | |
| | Year Ended December 31, |
| | 2013 | | 2012 | | 2011 |
| | (In Thousands) |
| Advances from the FHLBB | $ | 10,886 |
| | $ | 13,685 |
| | $ | 10,454 |
|
| Repurchase agreements | 68 |
| | 137 |
| | 125 |
|
| Subordinated debentures | 439 |
| | 578 |
| | — |
|
| Total interest expense on borrowed funds | $ | 11,393 |
| | $ | 14,400 |
| | $ | 10,579 |
|
Investment SecuritiesTT&L (Treasury Tax and Loans Pledged as Collateral
At December 31, 2013 and 2012, $1.6 billion and $1.8 billion, respectively, of investment securities available-for-sale and loans and leases, were pledged as collateral for repurchase agreements; municipal deposits; treasury; tax and loan deposits; swap agreements; current and future FHLBB borrowings; and future Federal Reserve "discount window" borrowings.
FHLBB Advances and Federal Reserve Borrowings
FHLBB advances mature as follows:Loan Deposits).
BROOKLINE BANCORP, INC. AND SUBSIDIARIES
Notes to Consolidated Financial Statements (Continued)
December 31, 2015, 2014, 2013 2012 and 2011
(12) Borrowed Funds
Borrowed funds are comprised of the following:
|
| | | | | | | | | | | | | | | | | | | | | |
| | At December 31, |
| | 2013 | | 2012 |
| | Amount | | Callable Amount | | Weighted Average Rate | | Amount | | Callable Amount | | Weighted Average Rate |
| | (Dollars in Thousands) |
| Within 1 year | $ | 186,035 |
| | $ | — |
| | 0.71 | % | | $ | 363,485 |
| | $ | 17,000 |
| | 1.32 | % |
| Over 1 year to 2 years | 283,000 |
| | — |
| | 0.79 | % | | 46,178 |
| | — |
| | 2.14 | % |
| Over 2 years to 3 years | 92,971 |
| | 32,094 |
| | 2.45 | % | | 108,000 |
| | — |
| | 1.00 | % |
| Over 3 years to 4 years | 147,198 |
| | 118,698 |
| | 3.86 | % | | 64,330 |
| | 30,000 |
| | 3.24 | % |
| Over 4 years to 5 years | 36,625 |
| | 10,071 |
| | 2.51 | % | | 149,032 |
| | 112,000 |
| | 3.86 | % |
| Over 5 years | 22,944 |
| | — |
| | 3.70 | % | | 59,840 |
| | 10,000 |
| | 3.00 | % |
| | $ | 768,773 |
| | $ | 160,863 |
| | 1.71 | % | | $ | 790,865 |
| | $ | 169,000 |
| | 2.06 | % |
|
| | | | | | | |
| | At December 31, |
| | 2015 | | 2014 |
| | (In Thousands) |
| Advances from the FHLBB | $ | 861,866 |
| | $ | 1,004,026 |
|
| Subordinated debentures and notes | 82,936 |
| | 82,763 |
|
| Other borrowed funds | 38,227 |
| | 39,615 |
|
| Total borrowed funds | $ | 983,029 |
| | $ | 1,126,404 |
|
Interest expense on borrowed funds for the periods indicated is as follows:
|
| | | | | | | | | | | |
| | Year Ended December 31, |
| | 2015 | | 2014 | | 2013 |
| | (In Thousands) |
| Advances from the FHLBB | $ | 9,950 |
| | $ | 10,535 |
| | $ | 10,886 |
|
| Subordinated debentures and notes | 5,001 |
| | 1,740 |
| | 439 |
|
| Other borrowed funds | 114 |
| | 79 |
| | 68 |
|
| Total interest expense on borrowed funds | $ | 15,065 |
| | $ | 12,354 |
| | $ | 11,393 |
|
Investment Securities and Loans Pledged as Collateral
As of December 31, 2015 and 2014, $2.3 billion and $2.1 billion, respectively, of investment securities and loans and leases, were pledged as collateral for repurchase agreements, swap agreements, FHLBB borrowings, and municipal deposits and TT&L (Treasury Tax and Loan Deposits). The Banks did not have any outstanding FRB borrowings as of December 31, 2015 and 2014.
FHLBB Advances
FHLBB advances mature as follows:
|
| | | | | | | | | | | | | | | | | | | | | |
| | At December 31, |
| | 2015 | | 2014 |
| | Amount | | Callable Amount | | Weighted Average Rate | | Amount | | Callable Amount | | Weighted Average Rate |
| | (Dollars in Thousands) |
| Within 1 year | $ | 575,749 |
| | $ | 30,599 |
| | 0.70 | % | | $ | 583,000 |
| | $ | — |
| | 0.52 | % |
| Over 1 year to 2 years | 228,422 |
| | 114,922 |
| | 1.89 | % | | 217,054 |
| | 31,353 |
| | 0.89 | % |
| Over 2 years to 3 years | 36,476 |
| | 10,038 |
| | 2.46 | % | | 145,326 |
| | 116,828 |
| | 2.43 | % |
| Over 3 years to 4 years | 5,342 |
| | — |
| | 2.17 | % | | 36,550 |
| | 10,054 |
| | 2.46 | % |
| Over 4 years to 5 years | 91 |
| | — |
| | 2.04 | % | | 5,416 |
| | — |
| | 2.21 | % |
| Over 5 years | 15,786 |
| | — |
| | 4.21 | % | | 16,680 |
| | — |
| | 4.18 | % |
| | $ | 861,866 |
| | $ | 155,559 |
| | 1.16 | % | | $ | 1,004,026 |
| | $ | 158,235 |
| | 1.02 | % |
Actual maturities of the advances may differ from those presented above since the FHLBB has the right to call certain advances prior to the scheduled maturity.
The FHLBB advances are secured by blanket pledge agreements which require the Banks to maintain as collateral certain qualifying assets principally the Banks' FHLBB stock, mortgage loans and securities in an aggregate amount equal to outstanding advances. Based on the $1.6 billion in qualifying collateral available for theseas collateral. The Banks did not have any FRB borrowings at as of December 31, 2013 the total2015. Total available borrowing capacity
BROOKLINE BANCORP, INC. AND SUBSIDIARIES
Notes to Consolidated Financial Statements (Continued)
December 31, 2015, 2014, 2013
for advances from the FHLBB and FRB was $1.4 billion as of December 31, 2015 for the Banks. The total amount of qualifying collateral for FHLBB and FRB borrowings was $1.02.1 billion as of December 31, 2015.
Repurchase Agreements
Information concerning repurchase agreements is as follows for the periods indicated below:
| | | | Year Ended December 31, | Year Ended December 31, |
| | 2013 | | 2012 | 2015 | | 2014 |
| | (Dollars In Thousands) | (Dollars In Thousands) |
| Outstanding at end of year | $ | 34,619 |
| | $ | 51,013 |
| $ | 38,227 |
| | $ | 39,633 |
|
| Average outstanding for the year | 38,784 |
| | 46,623 |
| 34,468 |
| | 28,724 |
|
| Maximum outstanding at any month-end | 48,544 |
| | 51,013 |
| 38,231 |
| | 39,633 |
|
| Weighted average rate at end of year | 0.17 | % | | 0.15 | % | 0.19 | % | | 0.16 | % |
| Weighted average rate paid for the year | 0.17 | % | | 0.13 | % | 0.33 | % | | 0.28 | % |
Securities sold under agreements to repurchase are funds borrowed from customers on an overnight basis that are secured by GSEs in the same amount. The obligations to repurchase the identical securities that were sold are reflected as liabilities and the securities remain in the asset accounts.
Subordinated Debentures and Notes
In the acquisition of Bancorp Rhode Island, Inc.,On September 15, 2014, the Company assumed threeissued $75.0 million of 6.0% fixed-to-floating subordinated notes due September
15, 2029. The Company is obligated to pay 6.0% interest semiannually between September 2014 and September 2024. Subsequently, the Company is obligated to pay 3-month LIBOR plus 3.315% quarterly until the notes mature in September 2029.
The following table summarizes the Company's subordinated debentures issued by a subsidiary of Bancorp Rhode Island, Inc. One subordinated debenture inand notes at the amount of $3.0 million was called in the first quarter of 2013 million due to its high fixed rate. The two remaining subordinated debentures are summarized below:
BROOKLINE BANCORP, INC. AND SUBSIDIARIES
Notes to Consolidated Financial Statements (Continued)
December 31, 2013, 2012 and 2011
|
| | | | | | | | | | | | | |
| At December 31, 2013: | | | | | | | | |
| Issue Date | | Rate | | Fair Market Rate at BankRI Acquisition | | Maturity Date | | Next Call Date | | Carrying Amount |
| | | (Dollars in Thousands) |
| June 26, 2003 | | Variable; 3-month LIBOR + 3.10% | | 6.45 | % | | June 26, 2033 | | March 26, 2014 | | $ | 4,666 |
|
| March 17, 2004 | | Variable; 3-month LIBOR + 2.79% | | 6.45 | % | | March 17, 2034 | | March 17, 2014 | | $ | 4,497 |
|
dates indicated.
| | | At December 31, 2012: | | | | | | | | | |
| | | | | | | | | Carrying Amount |
| Issue Date | | Rate | | Fair Market Rate at BankRI Acquisition | | Maturity Date | | Next Call Date | | Carrying Amount | | Rate | | Maturity Date | | Next Call Date | | December 31, 2015 | | December 31, 2014 |
| | | (Dollars in Thousands) | | (Dollars in Thousands) |
| February 22, 2001 | | Fixed; 10.2% | | 3.00 | % | | February 22, 2031 | | February 22, 2013 | | $ | 3,000 |
| |
| June 26, 2003 | | Variable; 3-month LIBOR + 3.10% | | 6.45 | % | | June 26, 2033 | | March 26, 2013 | | $ | 4,641 |
| | Variable; 3-month LIBOR + 3.10% | | June 26, 2033 | | March 28, 2016 | | $ | 4,725 |
| | $ | 4,696 |
|
| March 17, 2004 | | Variable; 3-month LIBOR + 2.79% | | 6.45 | % | | March 17, 2034 | | March 17, 2013 | | $ | 4,450 |
| | Variable; 3-month LIBOR + 2.79% | | March 17, 2034 | | March 17, 2016 | | $ | 4,589 |
| | $ | 4,543 |
|
| September 15, 2014 | | | 6.0% Fixed-to-Variable; 3-month LIBOR + 3.315% | | September 15, 2029 | | September 15, 2024 | | $ | 73,624 |
| | $ | 73,524 |
|
The above carrying amounts of the acquired subordinated debentures included $0.7 million of accretion adjustments and $1.4 million of capitalized debt issuance costs as of December 31, 2015. This compares to $0.8 million of accretion adjustments and $1.5 million of capitalized debt issuance costs as of December 31, 2014.
(13) Commitments and Contingencies
Off-Balance Sheet Financial Instruments
The Company is party to off-balance sheet financial instruments in the normal course of business to meet the financing needs of its customers and to reduce its own exposure to fluctuations in interest rates. These financial instruments include loan commitments, standby and commercial letters of credits, and interest rate swaps. According to GAAP, these financial instruments are not recorded in the financial statements until they are funded or related fees are incurred or received.
The contract amounts reflect the extent of the involvement the Company has in particular classes of these instruments. Such commitments involve, to varying degrees, elements of credit risk and interest-rate risk in excess of the amount recognized in the consolidated balance sheets. The Company's exposure to credit loss in the event of non-performance by the counterparty
BROOKLINE BANCORP, INC. AND SUBSIDIARIES
Notes to Consolidated Financial Statements (Continued)
December 31, 2015, 2014, 2013
is represented by the contractual amountfair value of the instruments. The Company uses the same policies in making commitments and conditional obligations as it does for on-balance sheet instruments.
Financial instruments with off-balance-sheet risk at the dates indicated follow:
BROOKLINE BANCORP, INC. AND SUBSIDIARIES
Notes to Consolidated Financial Statements (Continued)
December 31, 2013, 2012 and 2011
| | | | At December 31, | At December 31, |
| | 2013 | | 2012 | 2015 | | 2014 |
| | (In Thousands) | (In Thousands) |
| Financial instruments whose contract amounts represent credit risk: | | | | | | |
| Commitments to originate loans and leases: | | | | | | |
| Commercial real estate | $ | 48,973 |
| | $ | 158,768 |
| $ | 36,000 |
| | $ | 107,179 |
|
| Commercial | 143,252 |
| | 116,235 |
| 78,017 |
| | 102,353 |
|
| Residential mortgage | 8,027 |
| | 8,926 |
| 19,430 |
| | 20,520 |
|
| Unadvanced portion of loans and leases | 592,782 |
| | 299,523 |
| 648,291 |
| | 629,351 |
|
| Unused lines of credit: | | | | | | |
| Home equity | 205,665 |
| | 165,936 |
| 280,786 |
| | 244,603 |
|
| Other consumer | 1,035 |
| | 4,017 |
| 12,383 |
| | 10,876 |
|
| Other commercial | — |
| | 965 |
| 529 |
| | 728 |
|
| Unused letters of credit: | | | | | | |
| Financial standby letters of credit | 20,410 |
| | 19,887 |
| 12,389 |
| | 16,762 |
|
| Performance standby letters of credit | 2,989 |
| | 2,916 |
| 392 |
| | 3,126 |
|
| Commercial and similar letters of credit | 440 |
| | 112 |
| 821 |
| | 50 |
|
| Back-to-back interest rate swaps | 22,418 |
| | 33,221 |
| 490,632 |
| | 109,362 |
|
Commitments to extend credit are agreements to lend to a customer as long as there is no violation of any condition established in the contract. Commitments generally have fixed expiration dates or other termination clauses and may require the payment of a fee by the customer. Since some of the commitments are expected to expire without being drawn upon, the total commitment amounts do not necessarily represent future cash requirements. The Company evaluates each customer's creditworthiness on a case-by-case basis. The amount of collateral obtained, if any, is based on management'sManagement's credit evaluation of the borrower.
Standby and commercial letters of credits are conditional commitments issued by the Company to guarantee performance of a customer to a third party. These standby and commercial letters of credit are primarily issued to support the financing needs of the Company's commercial customers. The credit risk involved in issuing letters of credit is essentially the same as that involved in extending loans to customers.
The liability for unfunded credit commitments, which is included in other liabilities, was $1.0$1.3 million atas of December 31, 20132015 and $0.7 million at December 31, 2012.2014, respectively.
From time to time the Company enters into back-to-back interest rate swaps with commercial customers and third-party financial institutions. These swaps allow the Company to offer long-term fixed-rate commercial loans while mitigating the interest-rate risk of holding those loans. In a back-to-back interest rate swap transaction, the Company lends to a commercial customer on a floating-rate basis and then enters into an interest rate swap with that customer. Concurrently, the Company enters into offsetting swaps with a third-party financial institution, effectively minimizing its net interest-rate risk exposure resulting from such transactions.
The fair value of interest rate swap assets and liabilities is $0.8was $8.7 million and $0.9$8.8 million, respectively, atas of December 31, 2013.2015. The fair value of interest rate swap assets and liabilities is $1.3was $2.7 million and $1.4$2.7 million, respectively, atas of December 31, 2012.2014.
Lease Commitments
The Company leases certain office space under various noncancellable operating leases. A summary of future minimum rental payments under such leases at the dates indicated follows:
BROOKLINE BANCORP, INC. AND SUBSIDIARIES
Notes to Consolidated Financial Statements (Continued)
December 31, 2015, 2014, 2013 2012
The Company leases certain office space under various noncancellable operating leases. These leases have original terms ranging from 5 years to over 25 years. Certain leases contain renewal options and 2011escalation clauses which can increase rental expenses based principally on the consumer price index and fair market rental value provisions.
A summary of future minimum rental payments under such leases at the dates indicated follows:
| | | Year ended December 31, | Minimum Rental Payments | Minimum Rental Payments |
| | (In Thousands) | (In Thousands) |
| 2014 | $ | 4,936 |
| |
| 2015 | 4,740 |
| |
| 2016 | 4,500 |
| $ | 4,933 |
|
| 2017 | 4,030 |
| 4,472 |
|
| 2018 | 3,392 |
| 4,071 |
|
| 2019 | | 3,220 |
|
| 2020 | | 2,664 |
|
| Thereafter | 12,431 |
| 13,521 |
|
| Total | $ | 34,029 |
| $ | 32,881 |
|
TheCertain leases contain escalation clauses for real estate taxes and other expenditures, which are not included above. Total rental expense was $5.2$5.5 million in 2013, $4.52015, which included $0.2 million in 2012 and$2.7lease acceleration related to the sale of $255.2 million of the indirect automobile loan portfolio in March 2015. This compares to total rent expense of $6.5 million in 2011.2014, which included $0.8 million in lease acceleration related to a relocation of an operations center and the closure of a branch property. In 2013, total rent expense was $5.2 million.
A portion of the Company's new headquarters was rented to third-party tenants in 2013 withwhich generated rental income of $0.3$0.4 million in 2015 and 2014, respectively. Rental income was reported in non-interest income in the Company's consolidated statements of income.
Legal Proceedings
In the normal course of business, there are various outstanding legal proceedings. In the opinion of management,Management, after consulting with legal counsel, the consolidated financial position and results of operations of the Company are not expected to be affected materially by the outcome of such proceedings.
(14) Earnings per Share ("EPS")
The following table is a reconciliation of basic EPS and diluted EPS:
| | | | 2013 | | 2012 | | 2011 | For the year ended December 31, |
| | Basic | | Fully Diluted | | Basic | | Fully Diluted | | Basic | | Fully Diluted | 2015 | | 2014 | | 2013 |
| | (Dollars in Thousands, Except Per Share Amounts) | Basic | | Fully Diluted | | Basic | | Fully Diluted | | Basic | | Fully Diluted |
| Net income | $ | 35,386 |
| | $ | 35,386 |
| | $ | 37,142 |
| | $ | 37,142 |
| | $ | 27,600 |
| | $ | 27,600 |
| |
| | | (Dollars in Thousands, Except Per Share Amounts) |
| Numerator: | | | | | | | | | | | | |
| Net income* | | $ | 49,782 |
| | $ | 49,782 |
| | $ | 43,288 |
| | $ | 43,288 |
| | $ | 36,015 |
| | $ | 36,015 |
|
| | | | | | | | | | | | | |
| Denominator: | | | | | | | | | | | | |
| Weighted average shares outstanding | 69,808,164 |
| | 69,808,164 |
| | 69,702,417 |
| | 69,702,417 |
| | 58,633,627 |
| | 58,633,627 |
| 70,098,561 |
| | 70,098,561 |
| | 69,945,028 |
| | 69,945,028 |
| | 69,808,164 |
| | 69,808,164 |
|
| Effect of dilutive securities | — |
| | 75,760 |
| | — |
| | 43,839 |
| | — |
| | 2,804 |
| — |
| | 137,307 |
| | — |
| | 109,787 |
| | — |
| | 75,760 |
|
| Adjusted weighted average shares outstanding | 69,808,164 |
| | 69,883,924 |
| | 69,702,417 |
| | 69,746,256 |
| | 58,633,627 |
| | 58,636,431 |
| 70,098,561 |
| | 70,235,868 |
| | 69,945,028 |
| | 70,054,815 |
| | 69,808,164 |
| | 69,883,924 |
|
| Earnings per share | $ | 0.51 |
| | $ | 0.51 |
| | $ | 0.53 |
| | $ | 0.53 |
| | $ | 0.47 |
| | $ | 0.47 |
| |
| | | | | | | | | | | | | |
| EPS * | | $ | 0.71 |
| | $ | 0.71 |
| | $ | 0.62 |
| | $ | 0.62 |
| | $ | 0.52 |
| | $ | 0.52 |
|
OnBROOKLINE BANCORP, INC. AND SUBSIDIARIES
Notes to Consolidated Financial Statements (Continued)
December 31, 2015, 2014, 2013
(*) Previously reported amounts prior to January 3, 2012, the Company issued approximately 11 million shares of common stock as partial consideration1, 2015 have been restated to acquire Bancorp Rhode Island, Inc. (Referreflect a retrospective change in accounting principle for investments in qualified affordable housing projects, in accordance with ASU 2014-01. Refer to Note 2, "Acquisitions,")10, "Other Assets".
(15) Comprehensive IncomeIncome/(Loss)
Comprehensive income (loss) represents the sum of net income (loss) and other comprehensive income (loss). For the years ended December 31, 20132015, 20122014 and 20112013, the Company’s other comprehensive income (loss) include the following two components: (i) unrealized holding gains (losses) on investment securities available-for-sale; and (ii) adjustment of accumulated obligation for postretirement benefits.
BROOKLINE BANCORP, INC. AND SUBSIDIARIES
Notes to Consolidated Financial Statements (Continued)
December 31, 2013, 2012 and 2011
Changes in accumulated other comprehensive (loss) income by component, net of tax, were as follows for the periods indicated:
|
| | | | | | | | | | | |
| | Year Ended December 31, 2013 |
| | Investment Securities Available-for-Sale | | Postretirement Benefits | | Accumulated Other Comprehensive Income |
| | (In Thousands) |
| Balance at December 31, 2012 | $ | 3,358 |
| | $ | 125 |
| | $ | 3,483 |
|
| Other comprehensive (loss) income | (11,690 | ) | | 292 |
| | (11,398 | ) |
| Balance at December 31, 2013 | $ | (8,332 | ) | | $ | 417 |
| | $ | (7,915 | ) |
|
| | | | | | | | | | | |
| | Year Ended December 31, 2015 |
| | Investment Securities Available-for-Sale | | Postretirement Benefits | | Accumulated Other Comprehensive (Loss)/Income |
| | (In Thousands) |
| Balance at December 31, 2014 | $ | (1,733 | ) | | $ | 111 |
| | $ | (1,622 | ) |
| Other comprehensive (loss) income | (1,094 | ) | | 240 |
| | (854 | ) |
| Balance at December 31, 2015 | $ | (2,827 | ) | | $ | 351 |
| | $ | (2,476 | ) |
|
| | | | | | | | | | | |
| | Year Ended December 31, 2012 |
| | Investment Securities Available-for-Sale | | Postretirement Benefits | | Accumulated Other Comprehensive Income |
| | (In Thousands) |
| Balance at December 31, 2011 | $ | 1,834 |
| | $ | 129 |
| | $ | 1,963 |
|
| Other comprehensive income (loss) | 1,524 |
| | (4 | ) | | 1,520 |
|
| Balance at December 31, 2012 | $ | 3,358 |
| | $ | 125 |
| | $ | 3,483 |
|
|
| | | | | | | | | | | |
| | Year Ended December 31, 2014 |
| | Investment Securities Available-for-Sale | | Postretirement Benefits | | Accumulated Other Comprehensive Income/(Loss) |
| | (In Thousands) |
| Balance at December 31, 2013 | $ | (8,332 | ) | | $ | 417 |
| | $ | (7,915 | ) |
Other comprehensive income (loss)
| 6,599 |
| | (306 | ) | | 6,293 |
|
| Balance at December 31, 2014 | $ | (1,733 | ) | | $ | 111 |
| | $ | (1,622 | ) |
|
| | | | | | | | | | | |
| | Year Ended December 31, 2011 |
| | Investment Securities Available-for-Sale | | Postretirement Benefits | | Accumulated Other Comprehensive Income |
| | (In Thousands) |
| Balance at December 31, 2010 | $ | 2,185 |
| | $ | 163 |
| | $ | 2,348 |
|
| Other comprehensive loss | (351 | ) | | (34 | ) | | (385 | ) |
| Balance at December 31, 2011 | $ | 1,834 |
| | $ | 129 |
| | $ | 1,963 |
|
|
| | | | | | | | | | | |
| | Year Ended December 31, 2013 |
| | Investment Securities Available-for-Sale | | Postretirement Benefits | | Accumulated Other Comprehensive Income |
| | (In Thousands) |
| Balance at December 31, 2012 | $ | 3,358 |
| | $ | 125 |
| | $ | 3,483 |
|
| Other comprehensive (loss) income | (11,690 | ) | | 292 |
| | (11,398 | ) |
| Balance at December 31, 2013 | $ | (8,332 | ) | | $ | 417 |
| | $ | (7,915 | ) |
BROOKLINE BANCORP, INC. AND SUBSIDIARIES
Notes to Consolidated Financial Statements (Continued)
December 31, 2015, 2014, 2013
The following is a summary of the amounts reclassified from accumulated other comprehensive income (loss) for the years ended December 31, 20132015, 20122014, and 20112013.
| | | | Year Ended December 31, | | Income Statement Line Affected by Reclassification | Year Ended December 31, | | Income Statement Line Affected by Reclassification |
| | 2013 | | 2012 | | 2011 | | 2015 | | 2014 | | 2013 | |
| | (In Thousands) | | | (In Thousands) | | |
| Other Comprehensive Income (Loss) Component | | | | | | | | | | | | |
| | | | | | | | | | | | | |
| Unrealized gains on investment securities available-for-sale: | | | | | | | Unrealized gains on investment securities available-for-sale: | | | | | |
| | $ | 397 |
| | $ | 926 |
| | $ | 80 |
| | Gain on sales of securities,net | $ | — |
| | $ | 65 |
| | $ | 397 |
| | Gain on sales of securities,net |
| | (142 | ) | | (328 | ) | | (29 | ) | | Provision for income taxes | — |
| | (23 | ) | | (142 | ) | | Provision for income taxes |
| Total reclassifications for the period | $ | 255 |
| | $ | 598 |
| | $ | 51 |
| | Net income | $ | — |
| | $ | 42 |
| | $ | 255 |
| | Net income |
(16) Derivatives and Hedging Activities
The Company may use interest-rate contracts (swaps, caps and floors) as part of interest-rate risk management strategy. Interest-rate swap, cap and floor agreements are entered into as hedges against future interest-rate fluctuations on specifically identified assets or liabilities. The Company did not have derivative fair value hedges or derivative cash flow hedges atas of December 31, 20132015 and 2012.2014.
BROOKLINE BANCORP, INC. AND SUBSIDIARIES
Notes to Consolidated Financial Statements (Continued)
December 31, 2013, 2012 and 2011
Derivatives not designated as hedges are not speculative but rather, result from a service the Company provides to certain customers for a fee. The Company executes interest-rate swaps with commercial banking customers to aid them in managing their interest-rate risk. The interest-rate swap contracts allow the commercial banking customers to convert floating-rate loan payments to fixed-rate loan payments. The Company concurrently enters into offsetting swaps with a third-party financial institution, effectively minimizing its net risk exposure resulting from such transactions. The third-party financial institution exchanges the customer's fixed-rate loan payments for floating-rate loan payments. As the interest-rate swaps associated with this program do not meet hedge accounting requirements, changes in the fair value of both the customer swaps and the offsetting swaps are recognized directly in earnings. The Company had 864 interest-rate swaps with an aggregate notional amount of $22.4$490.6 million and 1022 interest-rate swaps with an aggregate notional amount of $33.2$109.4 million related to this program atas of December 31, 20132015 and 2012,2014, respectively.
Asset derivatives and liability derivatives are included in other assets and accrued expenses and other liabilities on the
consolidated balance sheets, respectively. The table below presents the fair value and classification of the Company'sCompany’s derivative
financial instruments on the consolidated balance sheets as of December 31, 20132015 and 2012, and2014.
|
| | | | | | | | | | | | | | | |
| | At December 31, 2015 | | At December 31, 2014 |
| | Asset Derivatives | | Liability Derivatives | | Asset Derivatives | | Liability Derivatives |
| | (In Thousands) |
| Total derivatives (interest-rate products) not designated as hedging instruments | $ | 8,656 |
| | $ | 8,781 |
| | $ | 2,676 |
| | $ | 2,714 |
|
Changes in the effect offair value are recognized directly in the Company's derivative financial instruments onunaudited consolidated statements of income and are included in other non-interest income in the consolidated statements of income. The table below presents the gain (loss) recognized in income statementsdue to changes in the fair value for the year ended December 31, 20132015 and 2012:2014.
|
| | | | | | | | | | | |
| | At December 31, 2013 | | Year Ended
December 31, 2013 |
| | Asset Derivatives | | Liability Derivatives | | Loss Recognized in Income on Derivatives(1) |
| | (In Thousands) |
| Total derivatives (interest-rate products) not designated as hedging instruments | $ | 825 |
| | $ | 856 |
| | $ | 32 |
|
| | | | | | |
| | At December 31, 2012 | | Year Ended
December 31, 2012 |
| | Asset Derivatives | | Liability Derivatives | | Loss Recognized in Income on Derivatives(1) |
| | (In Thousands) |
| Total derivatives (interest-rate products) not designated as hedging instruments | $ | 1,317 |
| | $ | 1,380 |
| | $ | 24 |
|
|
| | | | | | | |
| | Year Ended December 31, |
| | 2015 | | 2014 |
| | (In Thousands) |
| Gain (loss) recognized in income on derivatives | $ | 86 |
| | $ | (8 | ) |
| |
(1) | The amount of loss recognized in income represents changes related to the fair value of the interest rate products. |
By using derivative financial instruments, the Company exposes itself to credit risk. Credit risk which is the risk of failure by the counterparty to perform under the terms of the derivative contract. When the fair value of a derivative contract is positive, the
BROOKLINE BANCORP, INC. AND SUBSIDIARIES
Notes to Consolidated Financial Statements (Continued)
December 31, 2015, 2014, 2013
counterparty owes the Company, which creates credit risk for the Company. When the fair value of a derivative is negative, the Company owes the counterparty and, therefore, it does not possess credit risk. The credit risk in derivative instruments is mitigated by entering into transactions with highly-rated counterparties that managementManagement believes to be creditworthy and by limiting the amount of exposure to each counterparty. Thecounterparty by either cross collateralizing the underlying hedged loan or through bilateral posting of collateral to cover exposure. As the swaps are subject to master netting agreements, the Company had limited exposure relating to interest rate swaps with institutional counterparties atas of December 31, 2012 or 2011, as all such swaps were in a net liability position2015 and subject to master netting agreements.
2014. The estimated net credit risk exposure for derivative financial instruments was $31.2$125.0 thousand and $0.1 million at$38.0 thousand as of December 31, 2013,2015, and 2012,2014, respectively.
Certain of the derivative agreements contain provisions that require the Company to post collateral if the derivative exposure exceeds a threshold amount. The Company posted collateral of $14.7 million and $5.4 million in the normal course of business totaling $2.8 million and $0.5 million as of December 31, 20132015 and 2012,2014, respectively.
BROOKLINE BANCORP, INC. AND SUBSIDIARIES
Notes to Consolidated Financial Statements (Continued)
December 31, 2013, 2012 and 2011
The tables below present the offsetting of derivatives and amounts subject to master netting agreements not offset in the consolidated balance sheet at the dates indicated.
| | | | At December 31, 2013 | At December 31, 2015 |
| | Gross
Amounts of
Recognized Assets /Liabilities | | Gross Amounts
Offset in the Statement of Financial Position | | Net Amounts of
Assets Presented in the Statement of Financial Position | | Gross Amounts Not Offset in the Statement of Financial Position | | Net Amount | Gross
Amounts Recognized | | Gross Amounts
Offset in the Statement of Financial Position | | Net Amounts Presented in the Statement of Financial Position | | Gross Amounts Not Offset in the Statement of Financial Position | | Net Amount |
| | | Financial Instruments | | Cash Collateral (Received)/ Posted | | | Financial Instruments Pledged | | Cash Collateral Pledged | |
| | (In Thousands) | (In Thousands) |
| Asset Derivatives | $ | 825 |
| | $ | — |
| | $ | 825 |
| | $ | — |
| | $ | — |
| | $ | 825 |
| $ | 8,656 |
| | $ | — |
| | $ | 8,656 |
| | $ | — |
| | $ | — |
| | $ | 8,656 |
|
| | | | | | | | | | | | | | | | | | | | | | | |
| Liability Derivatives | $ | 856 |
| | $ | — |
| | $ | 856 |
| | $ | — |
| | $ | 2,811 |
| | $ | 3,667 |
| $ | 8,781 |
| | $ | — |
| | $ | 8,781 |
| | $ | 9,873 |
| | $ | 4,790 |
| | $ | — |
|
| | | | At December 31, 2012 | At December 31, 2014 |
| | Gross
Amounts of
Recognized Assets /Liabilities | | Gross Amounts
Offset in the Statement of Financial Position | | Net Amounts of
Assets Presented in the Statement of Financial Position | | Gross Amounts Not Offset in the Statement of Financial Position | | Net Amount | Gross
Amounts Recognized | | Gross Amounts
Offset in the Statement of Financial Position | | Net Amounts Presented in the Statement of Financial Position | | Gross Amounts Not Offset in the Statement of Financial Position | | Net Amount |
| | | Financial Instruments | | Cash Collateral (Received) / Posted | | | Financial Instruments Pledged | | Cash Collateral Pledged | |
| | (In Thousands) | (In Thousands) |
| Asset Derivatives | $ | 1,317 |
| | $ | — |
| | $ | 1,317 |
| | $ | — |
| | $ | — |
| | $ | 1,317 |
| $ | 2,676 |
| | $ | — |
| | $ | 2,676 |
| | $ | — |
| | $ | — |
| | $ | 2,676 |
|
| | | | | | | | | | | | | | | | | | | | | | | |
| Liability Derivatives | $ | 1,380 |
| | $ | — |
| | $ | 1,380 |
| | $ | — |
| | $ | 548 |
| | $ | 1,928 |
| $ | 2,714 |
| | $ | — |
| | $ | 2,714 |
| | $ | 4,173 |
| | $ | 1,180 |
| | $ | — |
|
The Company has agreements with certain of its derivative counterparties that contain credit-risk-related contingent provisions. These provisions provide the counterparty with the right to terminate its derivative positions and require the Company to settle its obligations under the agreements if the Company defaults on certain of its indebtedness or if the Company fails to maintain its status as a well-capitalized institution.
BROOKLINE BANCORP, INC. AND SUBSIDIARIES
Notes to Consolidated Financial Statements (Continued)
December 31, 2015, 2014, 2013
(17) Income Taxes
Income tax expense is comprised of the following amounts:
| | | | Year Ended December 31, | Year Ended December 31, |
| | 2013 | | 2012 | | 2011 | 2015 | | 2014 | | 2013 |
| | (In Thousands) | (In Thousands) |
| Current provision: | | | | | | | | | | |
| Federal | $ | 12,799 |
| | $ | 15,558 |
| | $ | 14,115 |
| |
| State | 4,238 |
| | 5,120 |
| | 4,987 |
| |
| Federal * | | $ | 23,340 |
| | $ | 20,862 |
| | $ | 13,968 |
|
| State * | | 4,774 |
| | 5,299 |
| | 4,298 |
|
| Total current provision | 17,037 |
| | 20,678 |
| | 19,102 |
| 28,114 |
| | 26,161 |
| | 18,266 |
|
| Deferred provision (benefit): | | | | | | | | | | |
| Federal | 2,572 |
| | 389 |
| | 811 |
| |
| State | (128 | ) | | 274 |
| | (27 | ) | |
| Federal * | | 679 |
| | 244 |
| | 2,537 |
|
| State * | | 560 |
| | (119 | ) | | (139 | ) |
| Total deferred provision | 2,444 |
| | 663 |
| | 784 |
| 1,239 |
| | 125 |
| | 2,398 |
|
| Total provision for income taxes | $ | 19,481 |
| | $ | 21,341 |
| | $ | 19,886 |
| $ | 29,353 |
| | $ | 26,286 |
| | $ | 20,664 |
|
Total provision for income taxes differed from the amounts computed by applying the statutory U.S. federal income tax rate (35.0%)35.0% to income before tax expense as a result of the following:
|
| | | | | | | | | | | |
| | Year Ended December 31, |
| | 2015 | | 2014 | | 2013 |
| | (In Thousands) |
| Expected income tax expense at statutory federal tax rate * | $ | 28,603 |
| | $ | 25,049 |
| | $ | 20,492 |
|
| State taxes, net of federal income tax benefit * | 3,467 |
| | 3,377 |
| | 2,713 |
|
| Bank-owned life insurance | (367 | ) | | (369 | ) | | (383 | ) |
| Tax-exempt interest income | (622 | ) | | (341 | ) | | (310 | ) |
| Income attributable to noncontrolling interest in subsidiary | (994 | ) | | (831 | ) | | (768 | ) |
| Tax credit—premises and equipment | — |
| | — |
| | (453 | ) |
| Tax credits from investments in affordable housing projects * | (526 | ) | | (667 | ) | | (537 | ) |
| Other, net * | (208 | ) | | 68 |
| | (90 | ) |
| Total provision for income taxes * | $ | 29,353 |
| | $ | 26,286 |
| | $ | 20,664 |
|
| Effective income tax rate * | 35.9 | % | | 36.7 | % | | 35.3 | % |
(*) Previously reported amounts prior to January 1, 2015 have been restated to reflect a retrospective change in accounting principle for investments in qualified affordable housing projects, in accordance with ASU 2014-01.
The Company's effective tax rate was 35.9% as of December 31, 2015 compared to 36.7% as of December 31, 2014. The decrease in the Company's effective tax rate from 2014 was primarily driven by investments in municipal bonds and the formation of a new security corporation in Massachusetts.
BROOKLINE BANCORP, INC. AND SUBSIDIARIES
Notes to Consolidated Financial Statements (Continued)
December 31, 2015, 2014, 2013 2012 and 2011
|
| | | | | | | | | | | |
| | Year Ended December 31, |
| | 2013 | | 2012 | | 2011 |
| | (In Thousands) |
| Expected income tax expense at statutory federal tax rate | $ | 19,830 |
| | $ | 20,899 |
| | $ | 17,047 |
|
| State taxes, net of federal income tax benefit | 2,673 |
| | 3,506 |
| | 3,224 |
|
| Bank-owned life insurance | (383 | ) | | (409 | ) | | — |
|
| Tax-exempt interest income | (310 | ) | | (216 | ) | | (157 | ) |
| Non-deductible acquisition and other expenses | — |
| | 617 |
| | 613 |
|
| Income attributable to noncontrolling interest in subsidiary | (768 | ) | | (560 | ) | | (427 | ) |
| Tax credit—premises and equipment | (453 | ) | | (1,593 | ) | | — |
|
| Tax credits from investments in affordable housing projects | (1,058 | ) | | (806 | ) | | (464 | ) |
| Other, net | (50 | ) | | (97 | ) | | 50 |
|
| Total provision for income taxes | $ | 19,481 |
| | $ | 21,341 |
| | $ | 19,886 |
|
| Effective income tax rate | 34.4 | % | | 35.7 | % | | 40.8 | % |
The Company's effective tax rate was 34.4% at December 31, 2013 compared to 35.7% at December 31, 2012. The decrease in the Company's effective tax rate in 2013 was primarily attributable to non deductible professional fees in 2012 related to the BankRI acquisition and lower state income tax expense. Additional state income tax expense was recognized in 2012 as the projected state tax savings from the acquisition of BankRI reduced the value of the deferred tax asset by $0.5 million, increasing the income tax expense in 2012. These reductions were partially offset by a $1.1 million reduction in the rehabilitation tax credits received for the refurbishment of the corporate headquarters at 131 Clarendon Street in Boston, Massachusetts as renovations were completed early in 2013.
The tax effects of temporary differences that give rise to significant portions of the deferred tax assets and liabilities at the dates indicated are as follows:
|
| | | | | | | |
| | At December 31, |
| | 2015 | | 2014 |
| | (In Thousands) |
| Deferred tax assets: | | | |
| Allowance for credit losses | $ | 22,741 |
| | $ | 21,770 |
|
| Acquisition fair value adjustments | 606 |
| | 3,066 |
|
| Unrealized loss on investment securities available-for-sale | 1,577 |
| | 1,086 |
|
| Retirement and postretirement benefits | 4,677 |
| | 4,794 |
|
| Deferred compensation | 4,966 |
| | 3,686 |
|
| Net operating loss and contribution carryovers | 1,335 |
| | 1,614 |
|
| Nonaccrual interest | 352 |
| | 814 |
|
| Restricted stock and stock option plans | 812 |
| | 708 |
|
| Accrued expenses | 387 |
| | 407 |
|
| Alternative minimum tax credits | 31 |
| | 31 |
|
| Other | 103 |
| | 63 |
|
| Total gross deferred tax assets | 37,587 |
| | 38,039 |
|
| Deferred tax liabilities: | | | |
| Identified intangible assets and goodwill | 5,392 |
| | 6,311 |
|
| Depreciation | 2,957 |
| | 2,740 |
|
| Deferred loan origination costs, net | 2,218 |
| | 930 |
|
| Unrecognized gain relating to postretirement obligation | 203 |
| | 70 |
|
| Other * | — |
| | 301 |
|
| Total gross deferred tax liabilities | 10,770 |
| | 10,352 |
|
| Net deferred tax asset | $ | 26,817 |
| | $ | 27,687 |
|
As of Contents
BROOKLINE BANCORP, INC. AND SUBSIDIARIES
Notes to Consolidated Financial Statements (Continued)
December 31, 2013, 2012 and 2011
|
| | | | | | | |
| | At December 31, |
| | 2013 | | 2012 |
| | (In Thousands) |
| Deferred tax assets: | | | |
| Allowance for credit losses | $ | 19,754 |
| | $ | 16,667 |
|
| Acquisition fair value adjustments | 7,430 |
| | 10,013 |
|
| Unrealized loss on securities available for sale | 5,119 |
| | — |
|
| Retirement and postretirement benefits | 4,159 |
| | 4,822 |
|
| Deferred compensation | 1,989 |
| | 2,254 |
|
| Net operating loss and contribution carryovers | 1,922 |
| | 2,229 |
|
| Non-accrual interest | 878 |
| | 948 |
|
| Restricted stock and stock option plans | 726 |
| | 803 |
|
| Write-downs of investment securities | 442 |
| | 795 |
|
| Depreciation | — |
| | 235 |
|
| Accrued expenses | 375 |
| | 200 |
|
| Alternative minimum tax credits | 31 |
| | 31 |
|
| Other | 33 |
| | 198 |
|
| Total gross deferred tax assets | 42,858 |
| | 39,195 |
|
| Deferred tax liabilities: | | | |
| Identified intangible assets and goodwill | 7,322 |
| | 8,893 |
|
| Depreciation | 2,619 |
| | — |
|
| Unrealized gain on securities available for sale | — |
| | 2,015 |
|
| Deferred loan origination costs, net | 734 |
| | 736 |
|
| Investments in affordable housing projects | 205 |
| | 246 |
|
| Unrecognized gain relating to postretirement obligation | 268 |
| | 92 |
|
| Other | — |
| | 16 |
|
| Total gross deferred tax liabilities | 11,148 |
| | 11,998 |
|
| Net deferred tax asset | $ | 31,710 |
| | $ | 27,197 |
|
At December 31, 2013,2015, the Company had net operating loss carryforwards for federal income tax purposes of $5.5$3.7 million which are available to offset future federal taxable income, if any, through 2020. In addition, the Company has alternative minimum tax credit carryforwards of $31,000,$31.0 thousand, which are available to reduce future federal income taxes, if any, over an indefinite period. According to Section 382 of the Internal Revenue Code, the net operating loss carryforwards and credit are subject to an annual limitation of $881,000.$0.9 million.
The Company has determined that a valuation allowance is not required for any of its deferred tax assets because it believes that it is more likely than not that these assets will reverse against future taxable income.
For federal income tax purposes, the Company has a $1.8 million reserve for credit losses which remains subject to recapture. If any portion of the reserve is used for purposes other than to absorb the losses for which it was established, approximately 150% of the amount actually used (limited to the amount of the reserve) would be subject to taxation in the year in which used. As the Company intends to use the reserve only to absorb credit losses, no provision has been made for the $750,000$1.0 million liability that would result if 100% of the reserve were recaptured.
The Company did not have any unrecognized tax benefits accrued as income tax receivables or as deferred tax items atas of December 31, 2013.2015 and 2014.
The Company files U.S. federal and state income tax returns. As of December 31, 2015, the Company is subject to federalexamination by the Internal Revenue Service and state examinationsMassachusetts and Rhode Island tax authorities for tax years after December 31, 2009.
BROOKLINE BANCORP, INC. AND SUBSIDIARIES
Notes to Consolidated Financial Statements (Continued)
December 31, 2015, 2014, 2013 2012 and 2011
December 31, 2011. As of December 31, 2015, the Company is also subject to examination for several other state tax authorities for tax years after December 31, 2009.
BROOKLINE BANCORP, INC. AND SUBSIDIARIES
Notes to Consolidated Financial Statements (Continued)
December 31, 2015, 2014, 2013
(18) Stockholders' Equity
Preferred Stock
The Company is authorized to issue 50,000,000 shares of serial preferred stock, par value $0.01 per share, from time to time in one or more series subject to limitations of law. The Board of Directors is authorized to fix the designations, powers, preferences, limitations and rights of the shares of each such series. As of December 31, 2013,2015, there were no shares of preferred stock issued.
Capital Distributions and Restrictions Thereon
The Company is a legal entity separate and distinct from each of the Banks and Brookline Securities Corp. The Company's primary source of revenue is dividends paid to it by the Banks and Brookline Securities Corp.
The FRB has authority to prohibit the Company from paying dividends to the Company's shareholders if such payment is deemed to be an unsafe or unsound practice. The FRB has indicated generally that it may be an unsafe or unsound practice for bank holding companies to pay dividends unless the bank holding company's net income over the preceding year is sufficient to fund the dividends and the expected rate of earnings retention is consistent with the organization's capital needs, asset quality and overall financial condition.
The FRB also has the authority to use its enforcement powers to prohibit the Banks from paying dividends to their parentthe Company if, in its opinion, the payment of dividends would constitute an unsafe or unsound practice. Federal law also prohibits the payment of dividends by a bank that will result in the bank failing to meet its applicable capital requirements on a pro forma basis. Payment of dividends by a bank is also restricted pursuant to various state regulatory limitations, including the Massachusetts Division of Banks in the case of Brookline Bank and First Ipswich, and the Banking Division of the Rhode Island Department of Business Regulation in the case of BankRI.
Common Stock Repurchases
In 2013, 20122015, 2014 and 2011,2013, no shares of the Company's common stock were repurchased by the Company. On October 29, 2014, the Company’s Board of Directors authorized a stock repurchase program to acquire up to $10.0 million of total outstanding shares of the Company's common stock over a period of fourteen months ending on December 31, 2015. As of December 31, 2013,2015, no shares were repurchased under the Company was notstock repurchase program.
On February 4, 2016, the Company's Board of Directors authorized a stock repurchase program to repurchase any additionalacquire up to $10.0 million of total outstanding shares of itsthe Company's common stock.stock over a period of twelve months ending on January 31, 2017. Repurchases may be made from time to time depending on market conditions and other factors, and will be conducted through open market or private transactions, through block trades, and pursuant to any trading plan that may be adopted in accordance with the Securities and Exchange Commission Rule 10b5-1. There is no guarantee as to the exact number of shares, if any, to be repurchased by the Company.
Restricted Retained Earnings
As part of the stock offering in 2002 and as required by regulation, Brookline Bank established a liquidation account for the benefit of eligible account holders and supplemental eligible account holders who maintain their deposit accounts at Brookline Bank after the stock offering. In the unlikely event of a complete liquidation of Brookline Bank (and only in that event), eligible depositors who continue to maintain deposit accounts at Brookline Bank shall be entitled to receive a distribution from the liquidation account.
Accordingly, retained earnings of the Company are deemed to be restricted up to the balance of the liquidation account. The liquidation account balance is reduced annually to the extent that eligible depositors have reduced their qualifying deposits as of each anniversary date. Subsequent increases in deposit account balances do not restore an account holder's interest in the liquidation account.account
The liquidation account totaled $16.6 million (unaudited), $18.4 million (unaudited), and $20.6 million (unaudited), $22.3 million (unaudited) and $24.4 million (unaudited) at
December 31, 2013, 20122015, 2014 and 2011,2013, respectively.
(19) Regulatory Capital Requirements
BROOKLINE BANCORP, INC. AND SUBSIDIARIES
Notes to Consolidated Financial Statements (Continued)
December 31, 2015, 2014, 2013
The Company's primary source of cash is dividends from the Banks and Brookline Securities Corp. The Banks are subject to certain restrictions on the amount of dividends that they may declare without prior regulatory approval. In addition, the dividends declared cannot be in excess of the amount which would cause the Banks to fall below the minimum required for capital adequacy purposes.
The Company is a bank holding company within the meaning of the Bank Holding Company Act of 1956, as amended (the "BHCA") and as such, must comply with the capital requirements of the Federal Reserve Bank (the "FRB") at the consolidated level. As member banks of the FRB, Brookline Bank, BankRI and First Ipswich are also required to comply with the regulatory capital requirement of the FRB.
BROOKLINE BANCORP, INC. AND SUBSIDIARIES
Notes to Consolidated Financial Statements (Continued)
December 31, 2013, 2012 and 2011
While the FRB is the primary regulator, the Banks are also subject to FDIC regulations and capital adequacy requirements since they are also FDIC-insured banks. The FDICFRB has promulgated corresponding regulations toimposing minimum capital requirements for bank holding companies and state member banks as well as prompt corrective action regulations for state member banks that implement the system of prompt corrective action established by Section 38 of the Federal Deposit Insurance Act, as amended (the "FDIA"). Under the prompt corrective action regulations in effect as of December 31, 2015, a bank is "well-capitalized" if it has: (1) a total risk-based capital ratio of 10.0% or greater; (2) a Tier 1 risk-based capital ratio of 6.0%8.0% or greater; (3) a common equity Tier 1 capital ratio of 6.5% or greater; (4) a Tier 1 leverage ratio of 5.0% or greater; and (4)(5) is not subject to any written agreement, order, capital directive or prompt corrective action directive to meet and maintain a specific capital level for any capital measure.
Failure to meet minimum capital requirements can initiate certain mandatory and possibly additional discretionary actions by regulators that, if undertaken, could have a direct material effect on the Company's financial statements. Under capital adequacy guidelines, and the regulatory framework for prompt corrective action, the Company and each of the Banks must meet specific capital guidelines that involve quantitative measures of the Company's and the Banks' assets, liabilities and certain off-balance sheet items as calculated under regulatory accounting practices. In addition, the prompt corrective action rules applicable to state member banks establish a framework of supervisory actions for state member banks that are not at least adequately capitalized. The Company's and the Banks' capital amounts and classification are also subject to qualitative judgments by the regulators about components, risk weightings, and other factors. Prompt corrective action provisions are not applicable to bank holding companies.
The following table reconciles stockholders' equity Bank holding companies are not subject to prompt corrective action requirements. However, a bank holding company is considered "well capitalized" for purpose of the FRB's Regulation Y (which can affect eligibility for expedited application processes to make acquisitions and engage in new activities) if the bank holding company maintains on a consolidated basis a total risk-based capital ratio of 10.0% or greater and a Tier 1 risk-based capital ratio of 6.0% or greater and is not subject to any written agreement under GAAP with regulatory capital directive or prompt correction action directive issued by the FRB to meet and maintain a specific capital level for the Company and its subsidiaries at the dates indicated.
|
| | | | | | | | | | | | | | | | | | | | | | | | | | | | | | | |
| | The Company Dec. 31, | | Brookline Bank Dec. 31, | | BankRI Dec. 31, | | First Ipswich Dec. 31, |
| | 2013 | | 2012 | | 2013 | | 2012 | | 2013 | | 2012 | | 2013 | | 2012 |
| | (In Thousands) |
| Stockholders' equity | $ | 613,867 |
| | $ | 612,097 |
| | $ | 301,291 |
| | $ | 288,859 |
| | $ | 236,579 |
| | $ | 247,606 |
| | $ | 34,641 |
| | $ | 35,515 |
|
| Add: Minority interest | 4,304 |
| | 3,712 |
| | 4,304 |
| | 3,712 |
| | — |
| | — |
| | — |
| | — |
|
| Add: Subordinated debenture | 9,163 |
| | 12,091 |
| | — |
| | — |
| | — |
| | — |
| | — |
| | — |
|
| Less: Disallowed goodwill and intangible assets | 154,777 |
| | 159,400 |
| | 7,647 |
| | 7,991 |
| | 106,593 |
| | 110,203 |
| | 5,271 |
| | 5,940 |
|
| Less: Unrealized loss on available-for-sale equity securities | — |
| | — |
| | — |
| | — |
| | — |
| | — |
| | 10 |
| | — |
|
| Less: Net unrealized (losses) gains on available-for-sale securities | (7,915 | ) | | 3,358 |
| | (1,874 | ) | | 1,874 |
| | (4,918 | ) | | 1,303 |
| | (1,075 | ) | | 366 |
|
| Tier 1 capital | 480,472 |
| | 465,142 |
| | 299,822 |
| | 282,706 |
| | 134,904 |
| | 136,100 |
| | 30,435 |
| | 29,209 |
|
| Allowance for credit losses not to exceed 1.25% of risk-weighted assets | 49,510 |
| | 41,935 |
| | 35,905 |
| | 35,923 |
| | 10,936 |
| | 5,053 |
| | 1,854 |
| | 959 |
|
| Unrealized gains on available-for-sale equity securities | — |
| | — |
| | — |
| | — |
| | 7 |
| | 18 |
| | — |
| | — |
|
| Total risk-based capital | $ | 529,982 |
| | $ | 507,077 |
| | $ | 335,727 |
| | $ | 318,629 |
| | $ | 145,847 |
| | $ | 141,171 |
| | $ | 32,289 |
| | $ | 30,168 |
|
As of December 31, 2013,2015, the Company, Brookline Bank, BankRI and First Ipswich met all applicable minimum capital requirements and the banks were considered "well-capitalized" by their respective regulators. The Company's and the Banks' actual and required capital amounts and ratios are as follows:
BROOKLINE BANCORP, INC. AND SUBSIDIARIES
Notes to Consolidated Financial Statements (Continued)
December 31, 2015, 2014, 2013 2012 and 2011
| | | | | Actual | | Minimum Required for Capital Adequacy Purposes | | Minimum Required To Be Considered "Well-Capitalized" | | Actual | | Minimum Required for Capital Adequacy Purposes | | Minimum Required To Be Considered "Well-Capitalized" Under Prompt Corrective Action Rules |
| | | Amount | | Ratio | | Amount | | Ratio | | Amount | | Ratio | | Amount | | Ratio | | Amount | | Ratio | | Amount | | Ratio |
| | | (Dollars in Thousands) | | (Dollars in Thousands) |
| At December 31, 2013: | | | | | | | | | | | | | |
| At December 31, 2015: | | | | | | | | | | | | | |
| Brookline Bancorp, Inc. | | | | | | | | | | | | | |
| Common equity Tier 1 capital ratio | | (1 | ) | $ | 530,505 |
| | 10.62 | % | | $ | 225,214 |
| | 4.50 | % | | N/A |
| | N/A |
|
| Tier 1 leverage capital ratio | | (2 | ) | 545,035 |
| | 9.37 | % | | 231,930 |
| | 4.00 | % | | N/A |
| | N/A |
|
| Tier 1 risk-based capital ratio | | (3 | ) | 545,035 |
| | 10.91 | % | | 300,019 |
| | 6.00 | % | | N/A |
| | N/A |
|
| Total risk-based capital ratio | | (4 | ) | 676,709 |
| | 13.54 | % | | 401,013 |
| | 8.00 | % | | N/A |
| | N/A |
|
| Brookline Bank | | | | | | | | | | | | | |
| Common equity Tier 1 capital ratio | | (1 | ) | $ | 374,002 |
| | 11.89 | % | | $ | 141,548 |
| | 4.50 | % | | $ | 204,459 |
| | 6.50 | % |
| Tier 1 leverage capital ratio | | (2 | ) | 380,003 |
| | 10.78 | % | | 141,003 |
| | 4.00 | % | | 176,254 |
| | 5.00 | % |
| Tier 1 risk-based capital ratio | | (3 | ) | 380,003 |
| | 12.08 | % | | 188,743 |
| | 6.00 | % | | 251,658 |
| | 8.00 | % |
| Total risk-based capital ratio | | (4 | ) | 417,270 |
| | 13.27 | % | | 251,557 |
| | 8.00 | % | | 314,446 |
| | 10.00 | % |
| BankRI | | | | | | | | | | | | | |
| Common equity Tier 1 capital ratio | | (1 | ) | $ | 171,967 |
| | 10.63 | % | | $ | 72,799 |
| | 4.50 | % | | $ | 105,154 |
| | 6.50 | % |
| Tier 1 leverage capital ratio | | (2 | ) | 171,967 |
| | 8.51 | % | | 80,831 |
| | 4.00 | % | | 101,038 |
| | 5.00 | % |
| Tier 1 risk-based capital ratio | | (3 | ) | 171,967 |
| | 10.63 | % | | 97,065 |
| | 6.00 | % | | 129,420 |
| | 8.00 | % |
| Total risk-based capital ratio | | (4 | ) | 189,953 |
| | 11.74 | % | | 129,440 |
| | 8.00 | % | | 161,800 |
| | 10.00 | % |
| First Ipswich | | | | | | | | | | | | | |
| Common equity Tier 1 capital ratio | | (1 | ) | $ | 32,831 |
| | 13.87 | % | | $ | 10,652 |
| | 4.50 | % | | $ | 15,386 |
| | 6.50 | % |
| Tier 1 leverage capital ratio | | (2 | ) | 32,831 |
| | 9.26 | % | | 14,182 |
| | 4.00 | % | | 17,727 |
| | 5.00 | % |
| Tier 1 risk-based capital ratio | | (3 | ) | 32,831 |
| | 13.87 | % | | 14,202 |
| | 6.00 | % | | 18,936 |
| | 8.00 | % |
| Total risk-based capital ratio | | (4 | ) | 35,617 |
| | 15.05 | % | | 18,933 |
| | 8.00 | % | | 23,666 |
| | 10.00 | % |
| | | | | | | | | | | | | | |
| At December 31, 2014: | | | | | | | | | | | | | |
| Brookline Bancorp, Inc. | | | | | | | | | | | | | | | | | | | | | | | | |
| Tier 1 leverage capital ratio | (1 | ) | $ | 480,472 |
| | 9.4 | % | | $ | 205,946 |
| | 4.0 | % | | N/A |
| | N/A |
| (2 | ) | $ | 504,964 |
| | 9.01 | % | | $ | 224,179 |
| | 4.00 | % | | N/A |
| | N/A |
|
| Tier 1 risk-based capital ratio | (2 | ) | 480,472 |
| | 11.0 | % | | 174,512 |
| | 4.0 | % | | N/A |
| | N/A |
| (3 | ) | 504,964 |
| | 10.55 | % | | 191,456 |
| | 4.00 | % | | N/A |
| | N/A |
|
| Total risk-based capital ratio | (3 | ) | 529,982 |
| | 12.2 | % | | 349,159 |
| | 8.0 | % | | N/A |
| | N/A |
| (4 | ) | 633,421 |
| | 13.24 | % | | 382,732 |
| | 8.00 | % | | N/A |
| | N/A |
|
| Brookline Bank | | | | | | | | | | | | | | | | | | | | | | | | |
| Tier 1 leverage capital ratio | (1 | ) | $ | 299,822 |
| | 9.4 | % | | $ | 127,992 |
| | 4.0 | % | | $ | 159,990 |
| | 5.0 | % | (2 | ) | $ | 336,513 |
| | 9.60 | % | | $ | 140,214 |
| | 4.00 | % | | $ | 175,267 |
| | 5.00 | % |
| Tier 1 risk-based capital ratio | (2 | ) | 299,822 |
| | 10.4 | % | | 114,874 |
| | 4.0 | % | | 172,311 |
| | 6.0 | % | (3 | ) | 336,513 |
| | 10.72 | % | | 125,565 |
| | 4.00 | % | | 188,347 |
| | 6.00 | % |
| Total risk-based capital ratio | (3 | ) | 335,727 |
| | 11.7 | % | | 229,753 |
| | 8.0 | % | | 287,192 |
| | 10.0 | % | (4 | ) | 373,312 |
| | 11.90 | % | | 250,966 |
| | 8.00 | % | | 313,708 |
| | 10.00 | % |
| BankRI | | | | | | | | | | | | | | | | | | | | | | | | |
| Tier 1 leverage capital ratio | (1 | ) | $ | 134,904 |
| | 8.1 | % | | $ | 66,784 |
| | 4.0 | % | | $ | 83,480 |
| | 5.0 | % | (2 | ) | $ | 150,403 |
| | 8.43 | % | | $ | 71,366 |
| | 4.00 | % | | $ | 89,207 |
| | 5.00 | % |
| Tier 1 risk-based capital ratio | (2 | ) | 134,904 |
| | 10.6 | % | | 52,904 |
| | 4.0 | % | | 79,355 |
| | 6.0 | % | (3 | ) | 150,403 |
| | 10.70 | % | | 56,225 |
| | 4.00 | % | | 84,338 |
| | 6.00 | % |
| Total risk-based capital ratio | (3 | ) | 145,847 |
| | 11.4 | % | | 105,782 |
| | 8.0 | % | | 132,228 |
| | 10.0 | % | (4 | ) | 166,135 |
| | 11.82 | % | | 112,443 |
| | 8.00 | % | | 140,554 |
| | 10.00 | % |
| First Ipswich | | | | | | | | | | | | | | | | | | | | | | | | |
| Tier 1 leverage capital ratio | (1 | ) | $ | 30,435 |
| | 9.8 | % | | $ | 12,461 |
| | 4.0 | % | | $ | 15,576 |
| | 5.0 | % | (2 | ) | $ | 29,962 |
| | 9.27 | % | | $ | 12,929 |
| | 4.00 | % | | $ | 16,161 |
| | 5.00 | % |
| Tier 1 risk-based capital ratio | (2 | ) | 30,435 |
| | 13.6 | % | | 8,971 |
| | 4.0 | % | | 13,457 |
| | 6.0 | % | (3 | ) | 29,962 |
| | 12.40 | % | | 9,665 |
| | 4.00 | % | | 14,498 |
| | 6.00 | % |
| Total risk-based capital ratio | (3 | ) | 32,289 |
| | 14.4 | % | | 17,938 |
| | 8.0 | % | | 22,423 |
| | 10.0 | % | (4 | ) | 32,375 |
| | 13.40 | % | | 19,328 |
| | 8.00 | % | | 24,160 |
| | 10.00 | % |
| At December 31, 2012: | | | | | | | | | | | | | |
| Brookline Bancorp, Inc. | | | | | | | | | | | | | |
| Tier 1 leverage capital ratio | (1 | ) | $ | 465,142 |
| | 9.4 | % | | $ | 197,094 |
| | 4.0 | % | | N/A |
| | N/A |
| |
| Tier 1 risk-based capital ratio | (2 | ) | 465,142 |
| | 10.9 | % | | 171,481 |
| | 4.0 | % | | N/A |
| | N/A |
| |
| Total risk-based capital ratio | (3 | ) | 507,077 |
| | 11.8 | % | | 342,909 |
| | 8.0 | % | | N/A |
| | N/A |
| |
| Brookline Bank | | | | | | | | | | | | | |
| Tier 1 leverage capital ratio | (1 | ) | $ | 282,706 |
| | 9.3 | % | | $ | 121,725 |
| | 4.0 | % | | $ | 152,156 |
| | 5.0 | % | |
| Tier 1 risk-based capital ratio | (2 | ) | 282,706 |
| | 9.8 | % | | 115,626 |
| | 4.0 | % | | 173,439 |
| | 6.0 | % | |
| Total risk-based capital ratio | (3 | ) | 318,629 |
| | 11.0 | % | | 231,310 |
| | 8.0 | % | | 289,137 |
| | 10.0 | % | |
| BankRI | | | | | | | | | | | | | |
| Tier 1 leverage capital ratio | (1 | ) | $ | 136,100 |
| | 8.5 | % | | $ | 64,047 |
| | 4.0 | % | | $ | 80,059 |
| | 5.0 | % | |
| Tier 1 risk-based capital ratio | (2 | ) | 136,100 |
| | 11.5 | % | | 47,175 |
| | 4.0 | % | | 70,763 |
| | 6.0 | % | |
| Total risk-based capital ratio | (3 | ) | 141,171 |
| | 12.0 | % | | 94,350 |
| | 8.0 | % | | 117,937 |
| | 10.0 | % | |
| First Ipswich | | | | | | | | | | | | | |
| Tier 1 leverage capital ratio | (1 | ) | $ | 29,209 |
| | 9.7 | % | | $ | 12,020 |
| | 4.0 | % | | $ | 15,025 |
| | 5.0 | % | |
| Tier 1 risk-based capital ratio | (2 | ) | 29,209 |
| | 13.2 | % | | 8,824 |
| | 4.0 | % | | 13,237 |
| | 6.0 | % | |
| Total risk-based capital ratio | (3 | ) | 30,168 |
| | 13.7 | % | | 17,642 |
| | 8.0 | % | | 22,053 |
| | 10.0 | % | |
BROOKLINE BANCORP, INC. AND SUBSIDIARIES
Notes to Consolidated Financial Statements (Continued)
December 31, 2015, 2014, 2013
| |
| (1) | Common equity tier 1 capital ratio is calculated by dividing common equity Tier 1 capital by risk-weighted assets. The ratio was established as part of the implementation of Basel III, effective January 1, 2015. |
| |
| (2) | Tier 1 leverage capital ratio is calculated by dividing Tier 1 capital by average assets. |
| |
(2)(3) | Tier 1 risk-based capital ratio is calculated by dividing Tier 1 capital by risk-weighted assets. |
| |
(3)(4) | Total risk-based capital ratio is calculated by dividing total capital by risk-weighted assets. |
BROOKLINE BANCORP, INC. AND SUBSIDIARIES
Notes to Consolidated Financial Statements (Continued)
December 31, 2015, 2014, 2013 2012 and 2011
(20) Employee Benefit Plans
Postretirement Benefits
Postretirement benefits are provided for part of the annual expense of health insurance premiums for certain retired employees and their dependents. No contributions are made by the Company to invest in assets allocated for the purpose of funding this benefit obligation.
The following table presents the components of net periodic postretirement benefit cost and other amounts recognized in other comprehensive income:
| | | | Year Ended December 31, | Year Ended December 31, |
| | 2013 | | 2012 | | 2011 | 2015 | | 2014 | | 2013 |
| | (In Thousands) | (In Thousands) |
| Net periodic benefit expense: | | | | | | | | | | |
| Service cost | $ | 61 |
| | $ | 74 |
| | $ | 74 |
| $ | 55 |
| | $ | 45 |
| | $ | 61 |
|
| Interest cost | 47 |
| | 55 |
| | 61 |
| 49 |
| | 47 |
| | 47 |
|
| Prior service credit | (21 | ) | | (21 | ) | | (21 | ) | (21 | ) | | (21 | ) | | (21 | ) |
| Actuarial gain | (16 | ) | | (3 | ) | | (4 | ) | (20 | ) | | (40 | ) | | (16 | ) |
| Net periodic benefit expense | $ | 71 |
| | $ | 105 |
| | $ | 110 |
| $ | 63 |
| | $ | 31 |
| | $ | 71 |
|
| Changes in postretirement benefit obligation recognized in other comprehensive income: | | | | | | | | | | |
| Net actuarial loss (gain) | $ | 489 |
| | $ | 11 |
| | $ | (36 | ) | $ | 374 |
| | $ | (477 | ) | | $ | 489 |
|
| Prior service credit | (21 | ) | | (21 | ) | | (21 | ) | (21 | ) | | (21 | ) | | (21 | ) |
| Total pre-tax changes in postretirement benefit obligation recognized in other comprehensive income | $ | 468 |
| | $ | (10 | ) | | $ | (57 | ) | $ | 353 |
| | $ | (498 | ) | | $ | 468 |
|
The discount rate used to determine the actuarial present value of projected postretirement benefit obligations was 4.90%4.35% in 2015, 4.00% in 2014 and 4.9% in 2013, 3.95% in 2012 and 5.25% in 2011. The estimated prior service credit that will be amortized from accumulated other comprehensive income into net periodic benefit cost in 20142016 is $21,000$54.0 thousand. The liability for the postretirement benefits included in accrued expenses and other liabilities was $1.11.2 million atas of December 31, 20132015 and $1.51.6 million atas of December 31, 20122014.
The actual health care trend used to measure the accumulated postretirement benefit obligation in 20132015 for plan participants below age 65 and for plan participants over age 65 was 2.7%7.4% and -14.5%5.0%, respectively. In 20122014, the rate for plan participants below age 65 and for plan participants over age 65 was 3.0%6.6% and -14.7%,less than zero percent, respectively. In 2015, there was a lower than expected increase in per capita medical expenses as compared to 2014, which created a smaller gap in the health care trend range. The rates to be used in 20142016 through 20182020 are expected to be in the range of 7.3%6.9% to 6.5%5.9% and to decline gradually thereafter to 5.3%5.1%. Assumed health care trend rates may have a significant effect on the amounts reported for the postretirement benefit plan. A 1% change in assumed health care cost trend rates would have the following effects:
| | | | 1% Increase | | 1% Decrease | 1% Increase | | 1% Decrease |
| | (In Thousands) | (In Thousands) |
| Effect on total service and interest cost components of net periodic postretirement benefit costs | $ | 26 |
| | $ | (20 | ) | $ | 26 |
| | $ | (24 | ) |
| Effect on the accumulated postretirement benefit obligation | 215 |
| | (171 | ) | 268 |
| | (208 | ) |
401(k) Plans
The Company administers twoone 401(k) plans, both ofplan (the "Plan"), which areis a qualified, tax-exempt profit-sharing plansplan with a salary deferral feature under Section 401(k) of the Internal Revenue Code. Each employee, reachingexcluding temporary employees, who has attained the age of 21 and having completed 1,000 hours of service in a plan year is eligible to participate in athe plan by making voluntary contributions, subject to certain limits based on federal tax laws. In one plan,the Plan, the Company contributes an amount equal to 5%makes a matching contribution of the compensation ofamount contributed by eligible employees, but does not match employee contributions to the plan. Participants are vested in employer contributions after three years of service.up
BROOKLINE BANCORP, INC. AND SUBSIDIARIES
Notes to Consolidated Financial Statements (Continued)
December 31, 2015, 2014, 2013 2012 and 2011
In the other plan, the Company makes a matching contribution of the amount contributed by eligible employees, up to 4%5% of the employee's yearly compensation. Contributions to both plansthe Plan are subject to certain limits based on federal tax laws. Expenses associated with the plans were $2.3 million in 2015, $2.4 million in 2014, and $2.0 million in 2013, $1.8 million in 2012 and $1.0 million in 2011.
Nonqualified Deferred Compensation Plan
The Company also maintains a Nonqualified Deferred Compensation Plan (the "Nonqualified Plan") under which certain participants may contribute the amounts they are precluded from contributing to the Company's 401(k) plansplan because of the qualified plan limitations, and additional compensation deferrals that may be advantageous for personal income tax or other planning reasons. Expenses associated with the Nonqualified Plan were nominal in 20132015, 20122014 and 20112013 were $0.5 million, $0.5 million and $0 million, respectively.. Accrued liabilities associated with the Nonqualified Plan in 20132015, 20122014, and 20112013 were $0.40.2 million, $0.50.3 million, and $00.4 million, respectively.
Supplemental Executive Retirement Agreements
The Company acquired two Supplemental Executive Retirement Plans ("the SERPs"(the "SERPs") as part of its acquisitionsacquisition of BankRI and First Ipswich.BankRI. The Company maintains the SERPs for certain senior executives under which participants are entitled to an annual retirement benefit. As of December 31, 20132015, there are 13 participants in the SERPs. The Company funded a Rabbi Trust to provide a partial funding source for the Company's liabilities under the SERPs. The Company records annual amounts related to the SERPs based on an actuarial calculation. Actuarial gains and losses are reflected immediately in the statement of imcome.income.
Total expenses for benefits payable under the SERPs for the years ended December 31, 20132015, and 20122014 were $0.60.1 million, and $0.41.9 million, respectively. Aggregate benefits payable included in accrued expenses and other liabilities atas of December 31, 20132015 and 20122014 were $10.111.2 million and $10.711.6 million, respectively.
The nominal discount rate used to determine the actuarial present value of projected benefits under the agreements was 5%4.3% and 4.25%4.0% in the year 20132015 and 2012,2014, respectively.
Employee Stock Ownership Plan
Brookline Bank established an Employee Stock Ownership Plan ("ESOP") on November 1, 1997. The Company's ESOP loan to Brookline Bank to purchase 546,986 shares of Company common stock is payable in quarterly installments over 30 years, bears interest at 8.50% per annum, matures December 31, 2021, and can be prepaid without penalty. Loans areThe loan is repaid to the Company in the form of cash contributions from Brookline Bank, subject to federal tax law limits. The outstanding balance of the loan atas of December 31, 20132015 and 20122014, which was $2.31.8 million and $2.62.0 million, respectively, and is eliminated in consolidation.
Shares of common stock used as collateral to secure the loan are released and available for allocation to eligible employees as the principal and interest on the loan is paid. Employees vestThe ESOP was amended in their ESOP account at a rate of 20% annually commencing2015 to permit all eligible participants in the yearESOP as of completionJuly 1, 2015 or any eligible participants after July 1, 2015 to be fully vested in the ESOP upon the date of three years of credited service or immediately if service is terminated due to death, retirement, disability or change in control.eligibility.
Dividends on released shares are credited to the participants' ESOP accounts. Dividends on unallocated shares of common stock are generally applied towards payment of the loan. ESOP shares committed to be released are considered outstanding in determining earnings per share.
AtAs of December 31, 20132015 and 2012,2014, the ESOP held 291,666213,066 and 333,918251,382 unallocated shares, respectively at an aggregate cost of $1.51.1 million and $1.7$1.3 million, respectively. The market value of such shares at as of December 31, 20132015 and 20122014 was $2.82.5 million and $2.8$2.5 million, respectively. Compensation and employee benefits expense related to the ESOP was $0.4 million in 20132015, $0.4 million2014 in 2012, and $0.4 million2013 in 2011, respectively, based on the commitment to release to eligible employees 38,316 shares in 2015, 40,284 shares in 2014 and 42,252 shares in 2013, 44,292 shares in 2012 and 46,207 shares in 2011.
Recognition and Retention Plans
On April 20, 2011, the stockholdersAs of December 31, 2015, the Company approvedhad three active recognition and retention plans: the 2003 Recognition and Retention Plan (the "2003 RRP") with 1,250,000 authorized shares, the 2011 Restricted Stock Award Plan (the "2011("2011 RSA") with 500,000 authorized shares and the 2014 Equity Incentive Plan ("2014 Plan") with 1,750,000 authorized shares. The 2003 RRP, the 2011 RSA and the 2014 Plan are collectively referred to as the "Plans". The purpose of the 2011 RSAPlans is to promote the long-term financial success of the Company and its subsidiaries by providing a means to attract, retain and reward individuals who contribute to such success and to further align their interests with those of the Company's stockholders.
BROOKLINE BANCORP, INC. AND SUBSIDIARIES
Notes to Consolidated Financial Statements (Continued)
December 31, 2015, 2014, 2013 2012 and 2011
the Company's stockholders. The maximum number of shares of the Company's common stock that may be awarded is 500,000.
The Company awarded 138,500 and 166,941 shares of common stock under the 2011 RSA in 2013 and 2012, respectively. Of the awarded shares, generally 50% vest ratably over three years with one-third of such shares vesting at each of the first, second and third anniversary dates of the awards. These are referred to as "time-based shares". The remaining 50% of each award has a cliff vesting schedule and will vest three years after the award date based on the level of the Company's achievement of identified performance targets in comparison to the level of achievement of such identified performance targets by a defined peer group comprised of 22 financial institutions. These are referred to as "performance-based shares". The specific performance measure targets relate to return on assets, return on tangible equity, asset quality and total stockholder return to stockholders (share price appreciation from date of award plus dividends paid as a percent of the Company's common stock share price on the date of award). If a participant leaves the Company prior to the third anniversary date of an award, any unvested shares will beare forfeited. Dividends declared with respect to shares awarded will be held by the Company and paid to the participant only when the shares vest.
The Company also has an active recognition and retention plan, titledUnder all the 2003 Recognition and Retention Plan (the "2003 RRP"), with 1,250,000 authorized shares. A prior plan, the 1999 Recognition and Retention Plan (the "1999 RRP" and collectively with the 2003 RRP, the "RRPs"), with 546,986 authorized shares, was terminated on April 19, 2009. Under both of the RRPs,Plans, shares of the Company's common stock were reserved for issuance as restricted stock awards to officers, employees, consultants and non-employee directors of the Company. Shares issued upon vesting may be either authorized but unissued shares or reacquired shares held by the Company as treasury shares. Any shares not issued because vesting requirements are not met will again be retired back to treasury and be made available again for issuance under the plans. All shares awarded under the 1999 RRP vested on or before April 19, 2009. As of that date, no shares remained available for award under that plan. As of December 31, 2013, 11,599 shares were available for award under the 2003 RRP.Plans.
Total expense for the RSA and RRP plansPlans was $1.4 million in 2015, $1.2 million in 2014 and 2013, $0.8respectively. Total income tax benefits on vested awards was $0.3 million in 2012 and2015, $0.4 million in 2011. The expense to be recognized for unvested shares at December 31, 2013 will be $1.52014, and $0.2 million in 2014.2013. Dividends paid on unvested RRP shares, which are recognized as compensation expense, were $30,000$0.1 million in 2013, $11,0002015, $0.2 million in 20122014, and $12,000$30.0 thousand in 2011.2013.
No dividend equivalent rights were paid to holders of unexercised vested options in 2013, 2012, or 2011.Activity under the recognition and retention plans was as follows:
|
| | | | | | | | | | |
| | Restricted Stock Awards Outstanding | | Weighted Average Price per Share | | |
| | (Dollars in Thousands, Except Per Share Amounts) | | |
| Recognition and Retention Plans: | | | | | |
| Outstanding at December 31, 2014 | 419,702 |
| | $ | 9.17 |
| | |
|
| Granted | 247,790 |
| | 11.36 |
| | |
|
| Vested | (126,193 | ) | | 9.02 |
| | |
|
| Forfeited / Canceled | (55,264 | ) | | 8.66 |
| | |
|
| Outstanding at December 31, 2015 | 486,035 |
| | $ | 10.37 |
| | |
| Unrecognized compensation cost | | | | | $ | 3,045 |
|
| Weighted average remaining recognition period (months) | | | | | 28 |
|
Stock Option Plans
The Company has an active stock optionequity incentive plan, the 2014 Plan. The prior plans, the "2003 Option Plan." A prior plan,Plan" and the "1999 Option Plan," wasPlan" were terminated on October 16, 2013 and April 19, 2009.2009, respectively. The 2014 plan is an omnibus plan from which the Company may award shares of restricted stock or stock options among other types of awards. Under bothall the stock option plans, shares of the Company's common stock were reserved for issuance to directors, employees, consultants and non-employee directors of the Company. Shares issued upon the exercise of a stock option may be either authorized but unissued shares or reacquired shares held by the Company as treasury shares. Any shares subject to an award which expire or are terminated unexercised will again be available for issuance under the plans.
The exercise price of options awarded is the fair market value of the common stock of the Company on the date the award is made. Certain of the options include a reload feature whereby an optionee exercising an option by delivery of shares of common stock would automatically be granted an additional option at the fair market value of stock when such additional option is granted equal to the number of shares so delivered. If an individual to whom a stock option was granted ceases to maintain continuous service by reason of normal retirement, death or disability, or following a change in control, all options and rights granted and not fully exercisable become exercisable in full upon the happening of such an event and shall remain exercisable for a period ranging from three3 months to five5 years.
In 2011, 5,000 options were awarded under the 2003 Option Plan, all of which vested throughout 2012.
No options were granted in 2013 or 2012. At December 31, 2013, 2,265,155 options were available for award under the Company's 2003 Option Plan.
Total expense for the stock option plans amounted to $10,000 in 2012 and $47,000 in 2011. In accordance with the terms of the Plans, no dividend equivalent rights were paid to holders of unexercised vested options in 2013, 2012 or 2011.
BROOKLINE BANCORP, INC. AND SUBSIDIARIES
Notes to Consolidated Financial Statements (Continued)
December 31, 2015, 2014, 2013 2012 and 2011
No options were granted in 2015, 2014, or 2013. There was no expense for the stock option plans in 2015, 2014, and 2013. In accordance with the terms of the Plans, no dividend equivalent rights were paid to holders of unexercised vested options in 2015, 2014 or 2013.
Activity under the option plans was as follows:
|
| | | | | | | | | | | | |
| | Options Outstanding | | Weighted Average Exercise Price Per Share | | Aggregate Intrinsic Value | | Weighted Average Contractual Term (In Years) |
| | (Dollars in Thousands, Except Per Share Amounts) |
| Employee Stock Options: | | | | | | | |
| Outstanding at December 31, 2010 | 1,128,345 |
| | $ | 14.08 |
| | |
| | |
| Granted | 5,000 |
| | 8.29 |
| | |
| | |
| Exercised | — |
| | — |
| | |
| | |
| Forfeited / Canceled | (42,500 | ) | | 14.67 |
| | |
| | |
| Outstanding at December 31, 2011 | 1,090,845 |
| | 14.08 |
| | |
| | |
| Granted | — |
| | — |
| | |
| | |
| Exercised | — |
| | — |
| | |
| | |
| Forfeited / Canceled | (15,000 | ) | | 14.95 |
| | |
| | |
| Outstanding at December 31, 2012 | 1,075,845 |
| | 14.95 |
| | |
| | |
| Granted | — |
| | — |
| | |
| | |
| Exercised | — |
| | — |
| | |
| | |
| Forfeited / Canceled | (841,000 | ) | | 14.95 |
| | |
| | |
| Outstanding at December 31, 2013 | 234,845 |
| | $ | 10.43 |
| | $ | — |
| | 5.7 |
| Exercisable at December 31, 2013 | 234,845 |
| | $ | 10.43 |
| | $ | — |
| | 5.7 |
To calculate the weighted average data presented in this note and the compensation expense presented in the accompanying financial statements, the fair value of each stock option award was estimated on the date of grant using the Black-Scholes option pricing model with the following valuation assumptions: |
| | | | | | | | | | | | |
| | Options Outstanding | | Weighted Average Exercise Price Per Share | | Aggregate Intrinsic Value | | Weighted Average Contractual Term (In Years) |
| | (Dollars in Thousands, Except Per Share Amounts) |
| Employee Stock Options: | | | | | | | |
| Outstanding at December 31, 2014 | 227,345 |
| | $ | 10.43 |
| | |
| | |
| Granted | — |
| | — |
| | |
| | |
| Exercised | — |
| | — |
| | |
| | |
| Forfeited / Canceled | — |
| | — |
| | |
| | |
| Outstanding at December 31, 2015 | 227,345 |
| | $ | 10.43 |
| | $ | — |
| | 3.7 |
| Exercisable at December 31, 2015 | 227,345 |
| | $ | 10.43 |
| | $ | — |
| | 3.7 |
|
| | |
| | Year Ended December 31, |
| 2011 |
Dividend yield | 4.30 | % |
Expected volatility | 34.38 | % |
Risk-free interest rate | 1.85 | % |
Expected life of options | 7.0 |
|
(21) Fair Value of Financial Instruments
A description of the valuation methodologies used for assets and liabilities measured at fair value on a recurring and non-recurring basis, as well as the general classification of such instruments pursuant to the valuation hierarchy, is set forth below. There were no changes in the valuation techniques used during 2013.2015 and 2014.
Assets and Liabilities Recorded at Fair Value on a Recurring Basis
AssetsThe following table set forth the carrying value of assets and liabilities measured at fair value on a recurring basis at December 31, 20132015 and 2012 are as follows:2014:
|
| | | | | | | | | | | | | | | |
| | Carrying Value as of December 31, 2015 |
| | Level 1 | | Level 2 | | Level 3 | | Total |
| | (In Thousands) |
| Assets: | |
| | |
| | |
| | |
|
| Investment securities available-for-sale: | | | | | | | |
| Debt securities: | | | | | | | |
| GSEs | $ | — |
| | $ | 40,627 |
| | $ | — |
| | $ | 40,627 |
|
| GSE CMOs | — |
| | 193,816 |
| | — |
| | 193,816 |
|
| GSE MBSs | — |
| | 229,881 |
| | — |
| | 229,881 |
|
| SBA commercial loan asset-backed securities | — |
| | 147 |
| | — |
| | 147 |
|
| Corporate debt obligations | — |
| | 46,486 |
| | — |
| | 46,486 |
|
| Trust preferred securities | — |
| | 1,267 |
| | — |
| | 1,267 |
|
| Total debt securities | — |
| | 512,224 |
| | — |
| | 512,224 |
|
| Marketable equity securities | 977 |
| | — |
| | — |
| | 977 |
|
| Total investment securities available-for-sale | $ | 977 |
| | $ | 512,224 |
| | $ | — |
| | $ | 513,201 |
|
| Interest-rate swaps | $ | — |
| | $ | 8,656 |
| | $ | — |
| | $ | 8,656 |
|
| Liabilities: | | | | | | | |
| Interest-rate swaps | $ | — |
| | $ | 8,781 |
| | $ | — |
| | $ | 8,781 |
|
BROOKLINE BANCORP, INC. AND SUBSIDIARIES
Notes to Consolidated Financial Statements (Continued)
December 31, 2015, 2014, 2013 2012 and 2011
|
| | | | | | | | | | | | | | | |
| | Carrying Value as of December 31, 2013 |
| | Level 1 | | Level 2 | | Level 3 | | Total |
| | (In Thousands) |
| Assets: | |
| | |
| | |
| | |
|
| Securities available-for-sale: | | | | | | | |
| GSEs | $ | — |
| | $ | 12,180 |
| | $ | — |
| | $ | 12,180 |
|
| Municipal obligations | — |
| | 1,086 |
| | — |
| | 1,086 |
|
| Auction-rate municipal obligations | — |
| | — |
| | 1,775 |
| | 1,775 |
|
| Corporate debt obligations | — |
| | 28,224 |
| | — |
| | 28,224 |
|
| Trust preferred securities and pools | — |
| | 1,210 |
| | — |
| | 1,210 |
|
| GSE CMOs | — |
| | 243,644 |
| | — |
| | 243,644 |
|
| GSE MBSs | — |
| | 199,401 |
| | — |
| | 199,401 |
|
| Private-label CMOs | — |
| | 3,355 |
| | — |
| | 3,355 |
|
| SBA commercial loan asset-backed securities | — |
| | 243 |
| | — |
| | 243 |
|
| Marketable equity securities | 1,310 |
| | — |
| | — |
| | 1,310 |
|
| Total securities available-for-sale | $ | 1,310 |
| | $ | 489,343 |
| | $ | 1,775 |
| | $ | 492,428 |
|
| Interest-rate swaps | $ | — |
| | $ | 825 |
| | $ | — |
| | $ | 825 |
|
| Liabilities: | | | | | | | |
| Interest-rate swaps | $ | — |
| | $ | 856 |
| | $ | — |
| | $ | 856 |
|
|
| | | | | | | | | | | | | | | |
| | Carrying Value as of December 31, 2012 |
| | Level 1 | | Level 2 | | Level 3 | | Total |
| | (In Thousands) |
| Assets: | | | | | | | |
| Investment securities available-for-sale: | | | | | | | |
| GSEs | $ | — |
| | $ | 69,809 |
| | $ | — |
| | $ | 69,809 |
|
| Municipal obligations | — |
| | 1,101 |
| | — |
| | 1,101 |
|
| Auction-rate municipal obligations | — |
| | — |
| | 1,976 |
| | 1,976 |
|
| Corporate debt obligations | — |
| | 10,685 |
| | — |
| | 10,685 |
|
| Trust preferred securities and pools | — |
| | 1,578 |
| | 941 |
| | 2,519 |
|
| GSE CMOs | — |
| | 217,001 |
| | — |
| | 217,001 |
|
| GSE MBSs | — |
| | 169,648 |
| | — |
| | 169,648 |
|
| Private-label CMOs | — |
| | 6,866 |
| | — |
| | 6,866 |
|
| SBA commercial loan asset-backed securities | — |
| | 381 |
| | — |
| | 381 |
|
| Marketable equity securities | 1,337 |
| | — |
| | — |
| | 1,337 |
|
| Total investment securities available-for-sale | $ | 1,337 |
| | $ | 477,069 |
| | $ | 2,917 |
| | $ | 481,323 |
|
| Interest-rate swaps | $ | — |
| | $ | 1,317 |
| | $ | — |
| | $ | 1,317 |
|
| Liabilities: | | | | | | | |
| Interest-rate swaps | $ | — |
| | $ | 1,380 |
| | $ | — |
| | $ | 1,380 |
|
BROOKLINE BANCORP, INC. AND SUBSIDIARIES
Notes to Consolidated Financial Statements (Continued)
December 31, 2013, 2012 and 2011
Assets and Liabilities Recorded at Fair Value on a Non-Recurring Basis
Assets and liabilities measured at fair value on a non-recurring basis at December 31, 2013 and 2012 are summarized below:
|
| | | | | | | | | | | | | | | |
| | Carrying Value as of December 31, 2013 |
| | Level 1 | | Level 2 | | Level 3 | | Total |
| | (In Thousands) |
| Assets measured at fair value on a non-recurring basis: | | | | | | | |
| Collateral-dependent impaired loans and leases | $ | — |
| | $ | — |
| | $ | 12,099 |
| | $ | 12,099 |
|
| Other real estate owned | — |
| | — |
| | 577 |
| | 577 |
|
| Repossessed assets | — |
| | 1,001 |
| | — |
| | 1,001 |
|
| | $ | — |
| | $ | 1,001 |
| | $ | 12,676 |
| | $ | 13,677 |
|
|
| | | | | | | | | | | | | | | |
| | Carrying Value as of December 31, 2012 |
| | Level 1 | | Level 2 | | Level 3 | | Total |
| | (In Thousands) |
| Assets measured at fair value on a non-recurring basis: | | | | | | | |
| Collateral-dependent impaired loans and leases | $ | — |
| | $ | 36,749 |
| | $ | — |
| | $ | 36,749 |
|
| Other real estate owned | — |
| | 903 |
| | — |
| | 903 |
|
| Repossessed assets | — |
| | 588 |
| | — |
| | 588 |
|
| | $ | — |
| | $ | 38,240 |
| | $ | — |
| | $ | 38,240 |
|
|
| | | | | | | | | | | | | | | |
| | Carrying Value as of December 31, 2014 |
| | Level 1 | | Level 2 | | Level 3 | | Total |
| | (In Thousands) |
| Assets: | | | | | | | |
| Investment securities available-for-sale: | | | | | | | |
| Debt securities: | | | | | | | |
| GSEs | $ | — |
| | $ | 22,988 |
| | $ | — |
| | $ | 22,988 |
|
| GSE CMOs | — |
| | 234,169 |
| | — |
| | 234,169 |
|
| GSE MBSs | — |
| | 250,981 |
| | — |
| | 250,981 |
|
| SBA commercial loan asset-backed securities | — |
| | 203 |
| | — |
| | 203 |
|
| Corporate debt obligations | — |
| | 40,207 |
| | — |
| | 40,207 |
|
| Trust preferred securities | — |
| | 1,240 |
| | — |
| | 1,240 |
|
| Total debt securities | — |
| | 549,788 |
| | — |
|
| 549,788 |
|
| Marketable equity securities | 973 |
| | — |
| | — |
| | 973 |
|
| Total investment securities available-for-sale | $ | 973 |
| | $ | 549,788 |
| | $ | — |
|
| $ | 550,761 |
|
| Interest-rate swaps | $ | — |
| | $ | 2,676 |
| | $ | — |
| | $ | 2,676 |
|
| Liabilities: | | | | | | | |
| Interest-rate swaps | $ | — |
| | $ | 2,714 |
| | $ | — |
| | $ | 2,714 |
|
Investment Securities Available-for-Sale
The fair value of investment securities is based principally on market prices and dealer quotes received from third-party and nationally-recognized pricing services for identical investment securities such as U.S. Treasury and agency securities. The Company's marketable equity securities thatare priced this way and are included in Level 1. These prices are validated by comparing the primary pricing source with an alternative pricing source when available. When quoted market prices for identical securities are unavailable, the Company uses market prices provided by independent pricing services based on recent trading activity and other observable information, including but not limited to market interest-rate curves, referenced credit spreads and estimated prepayment speeds where applicable. These investments include certain U.S. and government agency debtGSE debentures, GSE mortgage-related securities, municipal andSBA commercial loan asset backed securities, corporate debt securities, and GSE residential MBSs and CMOs,trust preferred securities, all of which are included in Level 2. Certain fair values are estimatedAs of December 31, 2015 and December 31, 2014, no investment securities were valued using pricing models (such as trust preferred securities and auction-rate municipal securities) and are included in Level 3.
Additionally, Management reviews changes in fair value from period to period and performs testing to ensure that prices received from the third parties are consistent with Management's expectation of the market. Changes in the prices obtained from the pricing service are analyzed from month to month, taking into consideration changes in market conditions including changes in mortgage spreads, changes in U.S. Treasury security yields and changes in generic pricing of 15-year and 30-year securities. Additional analysis may include a review of prices provided by other independent parties, a yield analysis, a review of average life changes using Bloomberg analytics and a review of historical pricing for a particular security.
Interest-Rate Swaps
The fair values for the interest-rate swap assets and liabilities represent a Level 2 valuation and are based on settlement values adjusted for credit risks associated with the counterparties and the Company.Company and observable market interest rate curves. Credit risk adjustments consider factors such as the likelihood of default by the Company and its counterparties, its net exposures and remaining contractual life. To date, the Company has not realized any losses due to a counterparty's inability to pay any net uncollateralized position. The change in value of interest-rate swap assets and liabilities attributable to credit risk was not significant during the reported periods. Refer also to Note 16, "Derivatives and Hedging Activities."
The reconciliation of all assets measured at fair value on a recurring basis using significant unobservable inputs (Level 3) is as follows for the year ended December 31, 2014:
BROOKLINE BANCORP, INC. AND SUBSIDIARIES
Notes to Consolidated Financial Statements (Continued)
December 31, 2015, 2014, 2013
|
| | | | | | | | | |
| | Year Ended December 31, |
| | 2015 | 2014 | 2013 |
| | (In Thousands) |
| Investment securities available-for-sale, beginning of year | $ | — |
| $ | 1,775 |
| $ | 2,917 |
|
| Investment security sales | — |
| (1,658 | ) | — |
|
| Principal paydowns and other | — |
| — |
| (1,150 | ) |
| Total realized losses included in other income | — |
| (242 | ) | — |
|
| Total unrealized gains included in other comprehensive income | — |
| 125 |
| 8 |
|
| Investment securities available-for-sale, end of year | $ | — |
| $ | — |
| $ | 1,775 |
|
There were no transfers between levels for assets and liabilities recorded at fair value on a recurring basis during 2015 or 2014.
Assets and Liabilities Recorded at Fair Value on a Non-Recurring Basis
Assets and liabilities measured at fair value on a non-recurring basis as of December 31, 2015 and 2014 are summarized below:
|
| | | | | | | | | | | | | | | |
| | Carrying Value as of December 31, 2015 |
| | Level 1 | | Level 2 | | Level 3 | | Total |
| | (In Thousands) |
| Assets measured at fair value on a non-recurring basis: | | | | | | | |
| Collateral-dependent impaired loans and leases | $ | — |
| | $ | — |
| | $ | 12,137 |
| | $ | 12,137 |
|
| OREO | — |
| | — |
| | 729 |
| | 729 |
|
| Repossessed assets | — |
| | 614 |
| | — |
| | 614 |
|
| Total assets measured at fair value on a non-recurring basis | $ | — |
| | $ | 614 |
| | $ | 12,866 |
| | $ | 13,480 |
|
|
| | | | | | | | | | | | | | | |
| | Carrying Value as of December 31, 2014 |
| | Level 1 | | Level 2 | | Level 3 | | Total |
| | (In Thousands) |
| Assets measured at fair value on a non-recurring basis: | | | | | | | |
| Collateral-dependent impaired loans and leases | $ | — |
| | $ | — |
| | $ | 6,376 |
| | $ | 6,376 |
|
| OREO | — |
| | — |
| | 953 |
| | 953 |
|
| Repossessed assets | — |
| | 503 |
| | — |
| | 503 |
|
| Total assets measured at fair value on a non-recurring basis | $ | — |
| | $ | 503 |
| | $ | 7,329 |
| | $ | 7,832 |
|
Collateral-Dependent Impaired Loans and Leases
For nonperforming loans and leases where the credit quality of the borrower has deteriorated significantly, fair values of the underlying collateral were estimated using purchase and sales agreements (Level 2), or comparable sales or recent appraisals (Level 3), adjusted for selling costs and other expenses.
BROOKLINE BANCORP, INC. AND SUBSIDIARIES
Notes to Consolidated Financial Statements (Continued)
December 31, 2015, 2014, 2013 2012 and 2011
Other Real Estate Owned
The Company records other real estate ownedOREO at the lower of cost or fair value. In estimating fair value, the Company utilizes purchase and sales agreements (Level 2) or comparable sales, recent appraisals or cash flows discounted at an interest rate commensurate with the risk associated with these cash flows (Level 3), adjusted for selling costs and other expenses.
Repossessed Assets
Repossessed vehicles and equipmentassets are carried at estimated fair value less costs to sell based on auction pricing (Level 2).
The table below presents quantitative information about significant unobservable inputs (Level 3) for assets measured at fair value on a recurring basis at December 31, 2013.
| | | | Fair Value | | Valuation Technique | | Unobservable Input | | Range | | Weighted Average Yields | Fair Value | | Valuation Technique |
| | (Dollars in Thousands) | At December 31, 2015 | | At December 31, 2014 | |
| Auction-rate municipal obligations | $ | 1,775 |
| | Discounted cash flow | | Discount rate | | 0-5% | | 4.0 | % | |
| | | (Dollars in Thousands) | |
| Collateral-dependent impaired loans and leases | $ | 12,099 |
| | Appraisal of collateral (1) | | | $ | 12,137 |
| | $ | 6,376 |
| | Appraisal of collateral (1) |
| Other real estate owned | $ | 577 |
| | Appraisal of collateral (1) | | | $ | 729 |
| | $ | 953 |
| | Appraisal of collateral (1) |
(1)(1) For impaired loans deemed collateral dependent, where impairmentFair value is measured using the fair valuegenerally determined through independent appraisals of the collateral, the Bank will either obtain a new appraisal orunderlying collateral. The Company may also use another available source of collateral assessment to determine a reasonable estimate of the fair value of the collateral.
Appraisals may be adjusted by Management for qualitative factors such as economic factors and estimated liquidation expenses. The reconciliationrange of all assets measured at fair value on a recurring basis using significant unobservable inputs (Level 3) is as follows for the periods indicated:
|
| | | | | | | |
| | Year Ended December 31, |
| | 2013 | | 2012 |
| | (In Thousands) |
| Investment securities available-for-sale, beginning of year | $ | 2,917 |
| | $ | 3,208 |
|
| Acquired, BankRI | — |
| | 184 |
|
| Principal paydowns and other | (1,150 | ) | | (836 | ) |
| Total unrealized gains included in other comprehensive income | 8 |
| | 361 |
|
| Investment securities available-for-sale, end of year | $ | 1,775 |
| | $ | 2,917 |
|
There were no transfers between levels for assets and liabilities recorded at fair value on a recurring basis during 2013 or 2012.these possible adjustments may vary.
Summary of Estimated Fair Values of Financial Instruments
The following table presents the carrying amount, estimated fair value, and placement in the fair value hierarchy of the Company's financial instruments as of December 31, 2013 and 2012.at the dates indicated. This table excludes financial instruments for which the carrying amount approximates fair value. Financial assets for which the fair value approximates carrying value include cash and cash equivalents, FHLBB and FRB stock and accrued interest receivable. Financial liabilities for which the fair value approximates carrying value include non-maturity deposits, short-term borrowings and accrued interest payable.
BROOKLINE BANCORP, INC. AND SUBSIDIARIES
Notes to Consolidated Financial Statements (Continued)
December 31, 2015, 2014, 2013 2012 and 2011
| | | | | | | | Fair Value Measurements | | | | | Fair Value Measurements |
| | Carrying Value | | Estimated Fair Value | | Level 1 Inputs | | Level 2 Inputs | | Level 3 Inputs | Carrying Value | | Estimated Fair Value | | Level 1 Inputs | | Level 2 Inputs | | Level 3 Inputs |
| | (In Thousands) | (In Thousands) |
| December 31, 2013 | | | | | | | | | | |
| At December 31, 2015 | | | | | | | | | | |
| Financial assets: | | | | | | | | | | | | | | | | | | |
| Investment securities held-to-maturity | $ | 500 |
| | $ | 500 |
| | $ | — |
| | $ | — |
| | $ | 500 |
| |
| Loans held for sale | 13,372 |
| | 13,372 |
| | — |
| | 13,372 |
| | — |
| |
| Investment securities held-to-maturity: | | | |
|
| | | | | | |
| GSE | | $ | 34,915 |
| | $ | 34,819 |
| | $ | — |
| | $ | 34,819 |
| | $ | — |
|
| GSE MBSs | | 19,291 |
| | 18,986 |
| | — |
| | 18,986 |
| | — |
|
| Municipal Obligations | | 39,051 |
| | 39,390 |
| | — |
| | 39,390 |
| | — |
|
| Foreign Government Obligations | | 500 |
| | 500 |
| | — |
| | — |
| | 500 |
|
| Loans held-for-sale | | 13,383 |
| | 13,383 |
| | — |
| | 13,383 |
| | — |
|
| Loans and leases, net | 4,313,992 |
| | 4,552,556 |
| | — |
| | — |
| | 4,552,556 |
| 4,938,801 |
| | 4,857,060 |
| | — |
| | — |
| | 4,857,060 |
|
| Financial liabilities: | | | | | | | | | | | | | | | | | | |
| Certificates of deposit | 934,668 |
| | 938,703 |
| | — |
| | 938,703 |
| | — |
| 1,087,872 |
| | 1,091,906 |
| | — |
| | 1,091,906 |
| | — |
|
| Borrowed funds | 812,555 |
| | 815,910 |
| | — |
| | 815,910 |
| | — |
| 983,029 |
| | 981,349 |
| | — |
| | 981,349 |
| | — |
|
| December 31, 2012 | | | | | | | | | | |
| At December 31, 2014 | | | | | | | | | | |
| Financial assets: | | | | | | | | | | | | | | | | | | |
| Investment securities held-to-maturity | $ | 500 |
| | $ | 502 |
| | $ | — |
|
| $ | — |
|
| $ | 502 |
| $ | 500 |
| | $ | 500 |
| | $ | — |
|
| $ | — |
|
| $ | 500 |
|
| Loans held for sale | 3,233 |
| | 3,233 |
| | — |
| | 3,233 |
| | — |
| |
| Loans held-for-sale | | 1,537 |
| | 1,537 |
| | — |
| | 1,537 |
| | — |
|
| Loans and leases, net | 4,134,560 |
| | 4,193,678 |
| | — |
| | — |
| | 4,193,678 |
| 4,768,948 |
| | 4,753,605 |
| | — |
| | — |
| | 4,753,605 |
|
| Financial liabilities: | | | | | | | | | | | | | | | | | | |
| Certificates of deposit | 1,010,941 |
| | 1,019,916 |
| | — |
| | 1,019,916 |
| | — |
| 946,708 |
| | 949,320 |
| | — |
| | 949,320 |
| | — |
|
| Borrowed funds | 853,969 |
| | 872,046 |
| | — |
| | 872,046 |
| | — |
| 1,126,404 |
| | 1,132,940 |
| | — |
| | 1,132,940 |
| | — |
|
Investment Securities Held-to-Maturity
The fair valuevalues of certain investment securities held-to-maturity are estimated using market prices provided by independent pricing models orservices based on recent trading activity and other observable information, including but not limited to market interest-rate curves, referenced credit spreads and estimated prepayment speeds where applicable. These investments include GSE debentures, GSE MBSs, and municipal obligations, all of which are included in Level 2. Additionally, fair values of foreign government obligations are based on comparisons to market prices of similar securities and are considered to be Level 3.
Loans Held for SaleHeld-for-Sale
Fair value is measured using quoted marketsmarket prices when available. These assets are typically categorized as Level 1. If quoted market prices are not available, comparable market values or discounted cash flow analysis may be utilized. These assets are typically categorized as Level 2.
Loans and Leases
The fair valuevalues of performing loans and leases was estimated by segregating the portfolio into its primary loan and lease categories—commercial real estate mortgage, multi-family mortgage, construction, commercial, equipment financing, condominium association, indirect automobile, residential mortgage, home equity and other consumer. These categories were further disaggregated based upon significant financial characteristics such as type of interest rate (fixed / variable) and payment status (current / past-due). The Company then discounteddiscounts the contractual cash flows for each loan category using interest rates currently being offered for loans with similar terms to borrowers of similar quality and incorporates estimates of future loan prepayments. This method of estimating fair value does not incorporate the exit price concept of fair value.
Deposits
BROOKLINE BANCORP, INC. AND SUBSIDIARIES
Notes to Consolidated Financial Statements (Continued)
December 31, 2015, 2014, 2013
The fair values of deposit liabilities with no stated maturity (demand, NOW, savings and money market savings accounts) are equal to the carrying amounts payable on demand. The fair value of certificates of deposit represents contractual cash flows discounted using interest rates currently offered on deposits with similar characteristics and remaining maturities. The fair value estimates for deposits do not include the benefit that results from the low-cost funding provided by the Company's core deposit relationships (deposit-based intangibles).
Borrowed Funds
The fair value of federal funds purchased is equal to the amount borrowed. The fair value of FHLBB advances and repurchase agreements represents contractual repayments discounted using interest rates currently available for borrowings with
BROOKLINE BANCORP, INC. AND SUBSIDIARIES
Notes to Consolidated Financial Statements (Continued)
December 31, 2013, 2012 and 2011
similar characteristics and remaining maturities. The fair values reported for retail repurchase agreements are based on the discounted value of contractual cash flows. The discount rates used are representative of approximate rates currently offered on borrowings with similar characteristics and maturities. The fair values reported for subordinated deferrable interest debentures are based on the discounted value of contractual cash flows. The discount rates used are representative of approximate rates currently offered on instruments with similar terms and maturities.
(22) Condensed Parent Company Financial Statements
Condensed Parent Company Balance Sheets as of December 31, 20132015 and 20122014 and Statements of Income for the years ended December 31, 2015, 2014 and 2013 2012 and 2011 follow.are as follows. The Statement of Stockholders' Equity is not presented below as the parent company's stockholders' equity is that of the consolidated company.
Balance Sheets
|
| | | | | | | |
| | At December 31, |
| | 2013 | | 2012 |
| | (In Thousands) |
| ASSETS | | | |
| Cash and due from banks | $ | 12,438 |
| | $ | 4,547 |
|
| Short-term investments | 33 |
| | 33 |
|
| Total cash and cash equivalents | 12,471 |
| | 4,580 |
|
| Restricted equity securities | 100 |
| | 100 |
|
| Loan to Brookline Bank ESOP | 2,252 |
| | 2,502 |
|
| Premises and equipment, net | 11,850 |
| | 8,202 |
|
| Deferred tax asset | — |
| | 1,879 |
|
| Investment in subsidiaries, at equity | 575,375 |
| | 592,961 |
|
| Goodwill | 35,267 |
| | 35,267 |
|
| Other assets | 6,185 |
| | 1,893 |
|
| Total assets | $ | 643,500 |
| | $ | 647,384 |
|
| LIABILITIES AND STOCKHOLDERS' EQUITY | | | |
| Demand checking accounts | $ | — |
| | $ | 41 |
|
| Borrowed funds | 9,163 |
| | 12,091 |
|
| Deferred tax liability | 1,195 |
| | — |
|
| Accrued expenses and other liabilities | 19,275 |
| | 23,155 |
|
| Total liabilities | 29,633 |
| | 35,287 |
|
| | | | |
| Stockholders' equity: | | | |
| Common stock | 757 |
| | 757 |
|
| Additional paid-in capital | 617,538 |
| | 618,426 |
|
| Retained earnings, partially restricted | 64,903 |
| | 53,358 |
|
| Accumulated other comprehensive (loss) income | (7,915 | ) | | 3,483 |
|
| Treasury stock, at cost; 5,171,985 shares and 5,373,733 shares, respectively | (59,826 | ) | | (62,107 | ) |
| Unallocated common stock held by ESOP; 291,666 shares and 333,918 shares, respectively | (1,590 | ) | | (1,820 | ) |
| Total Brookline Bancorp, Inc. stockholders' equity | 613,867 |
| | 612,097 |
|
| Total liabilities and stockholders' equity | $ | 643,500 |
| | $ | 647,384 |
|
BROOKLINE BANCORP, INC. AND SUBSIDIARIES
Notes to Consolidated Financial Statements (Continued)
December 31, 2015, 2014, 2013 2012 and 2011
Statements of Income
|
| | | | | | | | | | | |
| | Year Ended December 31, |
| | 2013 | | 2012 | | 2011 |
| | (In Thousands) |
| Interest and dividend income: | | | | | |
| Dividend income from subsidiaries | $ | 30,000 |
| | $ | 30,000 |
| | $ | 167,003 |
|
| Short-term investments | — |
| | — |
| | 1 |
|
| Loan to Brookline Bank ESOP | 205 |
| | 227 |
| | 249 |
|
| Total interest and dividend income | 30,205 |
| | 30,227 |
| | 167,253 |
|
| Interest expense: | | | | | |
| Borrowed funds and subordinated debt | 442 |
| | 589 |
| | 91 |
|
| Net interest income | 29,763 |
| | 29,638 |
| | 167,162 |
|
| Non-interest expense: | | | | | |
| Compensation and employee benefits | 2,305 |
| | 11,302 |
| | — |
|
| Occupancy | 16 |
| | — |
| | — |
|
| Equipment and data processing | 4,263 |
| | 1,395 |
| | — |
|
| Directors' fees | 590 |
| | 580 |
| | 225 |
|
| Franchise taxes | 223 |
| | 175 |
| | 180 |
|
| Professional services | 583 |
| | 2,773 |
| | 1,758 |
|
| Advertising and marketing | 6 |
| | 11 |
| | — |
|
| Other | 2,386 |
| | 2,477 |
| | 229 |
|
| Total non-interest expense | 10,372 |
| | 18,713 |
| | 2,392 |
|
| Income before income taxes | 19,391 |
| | 10,925 |
| | 164,770 |
|
| (Credit) provision for income taxes | (4,035 | ) | | (7,050 | ) | | 285 |
|
| Income before distributions in excess of net income of subsidiaries | 23,426 |
| | 17,975 |
| | 164,485 |
|
| Distributions less than (in excess of) net income of subsidiaries | 11,960 |
| | 19,167 |
| | (136,885 | ) |
| Net income | $ | 35,386 |
| | $ | 37,142 |
| | $ | 27,600 |
|
|
| | | | | | | |
| | At December 31, |
| | 2015 | | 2014 |
| | (In Thousands) |
| ASSETS | | | |
| Cash and due from banks | $ | 590 |
| | $ | 3,293 |
|
| Short-term investments | 27,513 |
| | 49,008 |
|
| Total cash and cash equivalents | 28,103 |
| | 52,301 |
|
| ESOP loan to Brookline Bank | 1,752 |
| | 2,002 |
|
| Restricted equity securities | 100 |
| | 100 |
|
| Premises and equipment, net | 9,040 |
| | 11,026 |
|
| Investment in subsidiaries, at equity | 681,504 |
| | 628,531 |
|
| Goodwill | 35,267 |
| | 35,267 |
|
| Other assets * | 2,631 |
| | 4,366 |
|
| Total assets * | $ | 758,397 |
| | $ | 733,593 |
|
| LIABILITIES AND STOCKHOLDERS' EQUITY | | | |
| Borrowed funds | $ | 82,936 |
| | $ | 82,745 |
|
| Deferred tax liability | 435 |
| | 721 |
|
| Accrued expenses and other liabilities | 7,541 |
| | 8,309 |
|
| Total liabilities | 90,912 |
| | 91,775 |
|
| | | | |
| Stockholders' equity: | | | |
| Common stock, $0.01 par value; 200,000,000 shares authorized; 75,744,445 shares issued | 757 |
| | 757 |
|
| Additional paid-in capital | 616,899 |
| | 617,475 |
|
| Retained earnings, partially restricted * | 109,675 |
| | 84,860 |
|
| Accumulated other comprehensive loss | (2,476 | ) | | (1,622 | ) |
| Treasury stock, at cost; 4,861,554 shares and 5,040,571 shares, respectively | (56,208 | ) | | (58,282 | ) |
| Unallocated common stock held by Employee Stock Ownership Plan ("ESOP"); 213,066 shares and 251,382 shares, respectively | (1,162 | ) | | (1,370 | ) |
| Total Brookline Bancorp, Inc. stockholders' equity * | 667,485 |
| | 641,818 |
|
| Total liabilities and stockholders' equity * | $ | 758,397 |
| | $ | 733,593 |
|
| | | | |
| (*) Previously reported amounts prior to January 1, 2015 have been restated to reflect a retrospective change in accounting principle for investments in qualified affordable housing projects, in accordance with ASU 2014-01. Refer to Note 10, "Other Assets". |
BROOKLINE BANCORP, INC. AND SUBSIDIARIES
Notes to Consolidated Financial Statements (Continued)
December 31, 2015, 2014, 2013 2012 and 2011
Statements of Income
|
| | | | | | | | | | | |
| | Year Ended December 31, |
| | 2015 | | 2014 | | 2013 |
| | (In Thousands) |
| Interest and dividend income: | | | | | |
| Dividend income from subsidiaries | $ | — |
| | $ | 24,700 |
| | $ | 30,000 |
|
| Marketable and restricted equity securities | 97 |
| | — |
| | — |
|
| ESOP loan to Brookline Bank | 162 |
| | 183 |
| | 205 |
|
| Total interest and dividend income | 259 |
| | 24,883 |
| | 30,205 |
|
| Interest expense: | | | | | |
| Borrowed funds | 5,063 |
| | 1,746 |
| | 442 |
|
| Net interest income | (4,804 | ) | | 23,137 |
| | 29,763 |
|
| Non-interest income: | | | | | |
| Other | 5 |
| | — |
| | — |
|
| Total non-interest income | 5 |
| | — |
| | — |
|
| Non-interest expense: | | | | | |
| Compensation and employee benefits | 205 |
| | 2,357 |
| | 2,305 |
|
| Occupancy | 22 |
| | 38 |
| | 16 |
|
| Equipment and data processing | 687 |
| | 1,499 |
| | 4,263 |
|
| Directors' fees | 688 |
| | 656 |
| | 590 |
|
| Franchise taxes | 113 |
| | 252 |
| | 223 |
|
| Insurance | 490 |
| | 472 |
| | 352 |
|
Professional services(1) | 185 |
| | (113 | ) | | 583 |
|
Other(2) | (1,289 | ) | | 751 |
| | 2,040 |
|
| Total non-interest expense | 1,101 |
| | 5,912 |
| | 10,372 |
|
| Income before income taxes | (5,900 | ) | | 17,225 |
| | 19,391 |
|
| Credit for income taxes | (1,854 | ) | | (2,705 | ) | | (4,035 | ) |
| Income before equity in undistributed income of subsidiaries | (4,046 | ) | | 19,930 |
| | 23,426 |
|
| Equity in undistributed income of subsidiaries | 53,828 |
| | 23,358 |
| | 12,589 |
|
| Net income | $ | 49,782 |
| | $ | 43,288 |
| | $ | 36,015 |
|
(1) The Parent Company received a net benefit in 2014 from the intercompany allocation of expense that is eliminated in consolidation.
(2) The Parent Company received a net benefit in 2015 from the intercompany allocation of expense that is eliminated in consolidation.
BROOKLINE BANCORP, INC. AND SUBSIDIARIES
Notes to Consolidated Financial Statements (Continued)
December 31, 2015, 2014, 2013
Statements of Cash Flows
|
| | | | | | | | | | | |
| | Year Ended December 31, |
| | 2013 | | 2012 | | 2011 |
| | (In Thousands) |
| Cash flows from operating activities: | | | | | |
| Net income attributable to parent company | $ | 35,386 |
| | $ | 37,142 |
| | $ | 27,600 |
|
| Adjustments to reconcile net income to net cash provided from operating activities: | | | | | |
| Distributions in excess (less than) of net income of subsidiaries | (11,960 | ) | | (19,167 | ) | | 137,227 |
|
| Other operating activities, net | 16,555 |
| | (5,617 | ) | | 1,202 |
|
| Net cash provided from operating activities | 39,981 |
| | 12,358 |
| | 166,029 |
|
| Cash flows from investing activities: | | | | | |
| Acquisitions, net of cash and cash equivalents acquired | — |
| | (89,258 | ) | | (19,729 | ) |
| Monies in escrow—Bancorp Rhode Island, Inc. acquisition | — |
| | 112,983 |
| | (112,983 | ) |
| Repayment of ESOP loan by Brookline Bank | 250 |
| | 250 |
| | 250 |
|
| Purchase of restricted equity securities | — |
| | (100 | ) | | — |
|
| Purchase of premises and equipment | (5,458 | ) | | (8,557 | ) | | — |
|
| Net cash provided from (used in) investing activities | (5,208 | ) | | 15,318 |
| | (132,462 | ) |
| Cash flows from financing activities: | | | | | |
| (Decrease) increase in demand deposit, NOW, savings and money market accounts | (41 | ) | | 41 |
| | — |
|
| Payment of dividends on common stock | (23,841 | ) | | (23,777 | ) | | (19,964 | ) |
| Repayment of subordinated and other debt | (3,000 | ) | | — |
| | (13,985 | ) |
| Income tax benefit from vesting of recognition and retention plan shares, exercise of non-incentive stock options, payment of dividend equivalent rights and dividend distribution on allocated ESOP shares | — |
| | — |
| | 79 |
|
| Net cash used in financing activities | (26,882 | ) | | (23,736 | ) | | (33,870 | ) |
| Net increase (decrease) in cash and cash equivalents | 7,891 |
| | 3,940 |
| | (303 | ) |
| Cash and cash equivalents at beginning of year | 4,580 |
| | 640 |
| | 943 |
|
| Cash and cash equivalents at end of year | $ | 12,471 |
| | $ | 4,580 |
| | $ | 640 |
|
| Supplemental disclosures of cash flow information: | | | | | |
| Cash paid during the year for: | | | | | |
| Interest on subordinated debt | $ | 480 |
| | $ | 795 |
| | $ | — |
|
| Income taxes | 19,137 |
| | 16,981 |
| | — |
|
| Acquisition of Bancorp Rhode Island: | | | | | |
| Fair value of assets acquired, net of cash and cash equivalents acquired | $ | — |
| | $ | 1,571,817 |
| | $ | — |
|
| Fair value of liabilities assumed | — |
| | 1,481,535 |
| | — |
|
| Acquisition of First Ipswich Bancorp: | | | | | |
| Fair value of assets acquired, net of cash and cash equivalents acquired | $ | — |
| | $ | — |
| | $ | 246,186 |
|
| Fair value of liabilities assumed | — |
| | — |
| | 251,978 |
|
|
| | | | | | | | | | | |
| | Year Ended December 31, |
| | 2015 | | 2014 | | 2013 |
| | (In Thousands) |
| Cash flows from operating activities: | | | | | |
| Net income attributable to parent company | $ | 49,782 |
| | $ | 43,288 |
| | $ | 36,015 |
|
| Adjustments to reconcile net income to net cash provided from operating activities: | | | | | |
| Equity in undistributed income of subsidiaries | (53,828 | ) | | (23,358 | ) | | (12,589 | ) |
| Depreciation of premises and equipment | 2,728 |
| | 2,563 |
| | 1,810 |
|
| Amortization of debt issuance costs | 100 |
| | 29 |
| | — |
|
| Other operating activities, net | 2,479 |
| | (30,822 | ) | | 14,745 |
|
| Net cash provided from (used for) operating activities | 1,261 |
| | (8,300 | ) | | 39,981 |
|
| Cash flows from investing activities: | | | | | |
| Repayment of ESOP loan by Brookline Bank | 250 |
| | 250 |
| | 250 |
|
| Purchase of premises and equipment | (742 | ) | | (1,739 | ) | | (5,458 | ) |
| Net cash used for investing activities | (492 | ) | | (1,489 | ) | | (5,208 | ) |
| Cash flows from financing activities: | | | | | |
| Decrease in demand deposit, NOW, savings and money market accounts | — |
| | — |
| | (41 | ) |
| Proceeds from issuance of subordinated notes | — |
| | 73,495 |
| | — |
|
| Repayment of subordinated debentures | — |
| | — |
| | (3,000 | ) |
| Payment of dividends on common stock | (24,967 | ) | | (23,876 | ) | | (23,841 | ) |
| Net cash (used for) provided from used for financing activities | (24,967 | ) | | 49,619 |
| | (26,882 | ) |
| Net (decrease) increase in cash and cash equivalents | (24,198 | ) | | 39,830 |
| | 7,891 |
|
| Cash and cash equivalents at beginning of year | 52,301 |
| | 12,471 |
| | 4,580 |
|
| Cash and cash equivalents at end of year | $ | 28,103 |
| | $ | 52,301 |
| | $ | 12,471 |
|
BROOKLINE BANCORP, INC. AND SUBSIDIARIES
Notes to Consolidated Financial Statements (Continued)
December 31, 2015, 2014, 2013 2012 and 2011
(23) Quarterly Results of Operations (Unaudited)
| | | | 2013 Quarters | 2015 Quarters |
| | Fourth | | Third | | Second | | First | Fourth | | Third | | Second | | First |
| | (Dollars in Thousands Except Per Share Data) | (Dollars in Thousands Except Per Share Data) |
| Interest and dividend income | $ | 51,049 |
| | $ | 50,823 |
| | $ | 52,900 |
| | $ | 51,612 |
| $ | 58,448 |
| | $ | 56,687 |
| | $ | 55,166 |
| | $ | 56,609 |
|
| Interest expense | 7,275 |
| | 7,411 |
| | 7,537 |
| | 7,943 |
| 8,370 |
| | 8,100 |
| | 7,994 |
| | 8,081 |
|
| Net interest income | 43,774 |
| | 43,412 |
| | 45,363 |
| | 43,669 |
| 50,078 |
| | 48,587 |
| | 47,172 |
| | 48,528 |
|
| Provision for credit losses | 3,887 |
| | 2,748 |
| | 2,439 |
| | 1,855 |
| 1,520 |
| | 1,755 |
| | 1,913 |
| | 2,263 |
|
| Net interest income after provision for credit losses | 39,887 |
| | 40,664 |
| | 42,924 |
| | 41,814 |
| 48,558 |
| | 46,832 |
| | 45,259 |
| | 46,265 |
|
| Loss on investment in affordable housing projects | (318 | ) | | (558 | ) | | (624 | ) | | (312 | ) | |
| Gain on sales of securities, net | 397 |
| | — |
| | — |
| | — |
| |
| Loan level derivative income | | 1,556 |
| | 900 |
| | 941 |
| | — |
|
| Gain on sale of loans and leases held-for-sale | | 614 |
| | 446 |
| | 279 |
| | 869 |
|
| Other non-interest income | 3,828 |
| | 4,011 |
| | 3,762 |
| | 3,639 |
| 3,893 |
| | 3,438 |
| | 3,647 |
| | 3,601 |
|
| Amortization of identified intangible assets | (1,127 | ) | | (1,154 | ) | | (1,177 | ) | | (1,165 | ) | (724 | ) | | (725 | ) | | (724 | ) | | (738 | ) |
| Other non-interest expense | (30,193 | ) | | (28,399 | ) | | (29,638 | ) | | (29,607 | ) | (31,605 | ) | | (30,545 | ) | | (29,728 | ) | | (30,588 | ) |
| Income before income taxes | 12,474 |
| | 14,564 |
| | 15,247 |
| | 14,369 |
| |
| Income before provision for income taxes | | 22,292 |
| | 20,346 |
| | 19,674 |
| | 19,409 |
|
| Provision for income taxes | 4,325 |
| | 4,645 |
| | 5,382 |
| | 5,129 |
| 8,237 |
| | 6,897 |
| | 7,115 |
| | 7,104 |
|
| Net income | 8,149 |
| | 9,919 |
| | 9,865 |
| | 9,240 |
| 14,055 |
| | 13,449 |
| | 12,559 |
| | 12,305 |
|
| Less net income attributable to noncontrolling interest in subsidiary | 495 |
| | 490 |
| | 375 |
| | 427 |
| 728 |
| | 561 |
| | 694 |
| | 602 |
|
| Net income attributable to Brookline Bancorp, Inc. | $ | 7,654 |
| | $ | 9,429 |
| | $ | 9,490 |
| | $ | 8,813 |
| $ | 13,327 |
| | $ | 12,888 |
| | $ | 11,865 |
| | $ | 11,703 |
|
| Earnings per share: | | | | | | | | | | | | | | |
| Basic | $ | 0.11 |
| | $ | 0.14 |
| | $ | 0.14 |
| | $ | 0.13 |
| $ | 0.19 |
| | $ | 0.18 |
| | $ | 0.17 |
| | $ | 0.17 |
|
| Diluted | 0.11 |
| | 0.13 |
| | 0.14 |
| | 0.13 |
| 0.19 |
| | 0.18 |
| | 0.17 |
| | 0.17 |
|
| Average common shares outstanding: | | | | | | | | | | | | | | |
| Basic | 69,862,175 |
| | 69,830,953 |
| | 69,774,703 |
| | 69,762,784 |
| 70,177,382 |
| | 70,129,056 |
| | 70,049,829 |
| | 70,036,090 |
|
| Diluted | 69,951,683 |
| | 69,913,765 |
| | 69,833,541 |
| | 69,830,630 |
| 70,318,657 |
| | 70,240,020 |
| | 70,215,850 |
| | 70,164,105 |
|
| Common stock price: | | | | | | | | | | | | | | |
| High | $ | 9.58 |
| | $ | 10.08 |
| | $ | 9.14 |
| | $ | 9.39 |
| $ | 11.89 |
| | $ | 11.66 |
| | $ | 11.54 |
| | $ | 10.05 |
|
| Low | 8.72 |
| | 8.81 |
| | 8.23 |
| | 8.66 |
| 10.19 |
| | 10.09 |
| | 10.10 |
| | 9.29 |
|
| Dividends per share | $ | 0.085 |
| | $ | 0.085 |
| | $ | 0.085 |
| | $ | 0.085 |
| $ | 0.090 |
| | $ | 0.090 |
| | $ | 0.090 |
| | $ | 0.085 |
|
BROOKLINE BANCORP, INC. AND SUBSIDIARIES
Notes to Consolidated Financial Statements (Continued)
December 31, 2015, 2014, 2013 2012 and 2011
| | | | 2012 Quarters | 2014 Quarters |
| | Fourth | | Third | | Second | | First | Fourth | | Third | | Second | | First |
| | (Dollars in Thousands Except Per Share Data) | (Dollars in Thousands Except Per Share Data) |
| Interest income | $ | 52,976 |
| | $ | 55,394 |
| | $ | 51,839 |
| | $ | 52,991 |
| |
| Interest and dividend income | | $ | 55,826 |
| | $ | 54,616 |
| | $ | 53,346 |
| | $ | 54,694 |
|
| Interest expense | 8,412 |
| | 8,983 |
| | 9,080 |
| | 9,357 |
| 8,250 |
| | 7,292 |
| | 6,912 |
| | 6,960 |
|
| Net interest income | 44,564 |
| | 46,411 |
| | 42,759 |
| | 43,634 |
| 47,576 |
| | 47,324 |
| | 46,434 |
| | 47,734 |
|
| Provision for credit losses | 3,101 |
| | 2,862 |
| | 6,678 |
| | 3,247 |
| 1,724 |
| | 2,034 |
| | 2,276 |
| | 2,443 |
|
| Net interest income after provision for credit losses | 41,463 |
| | 43,549 |
| | 36,081 |
| | 40,387 |
| 45,852 |
| | 45,290 |
| | 44,158 |
| | 45,291 |
|
| Gain on sales of securities, net | 129 |
| | — |
| | 797 |
| | — |
| |
| Gain on sales of loans and leases | 1,898 |
| | — |
| | — |
| | — |
| |
| Loss from investments in affordable housing projects | (239 | ) | | (73 | ) | | (244 | ) | | (138 | ) | |
| Loan level derivative income | | 562 |
| | 322 |
| | 62 |
| | — |
|
| Gain on sales of investment securities, net | | 78 |
| | — |
| | (13 | ) | | — |
|
| Gain on sales of loans and leases held-for-sale | | 368 |
| | 564 |
| | 92 |
| | 627 |
|
| Other non-interest income | 4,716 |
| | 3,858 |
| | 4,168 |
| | 3,733 |
| 3,533 |
| | 5,303 |
| | 3,681 |
| | 5,001 |
|
| Amortization of identified intangible assets | (1,797 | ) | | (1,271 | ) | | (1,271 | ) | | (1,283 | ) | (827 | ) | | (828 | ) | | (827 | ) | | (861 | ) |
| Other non-interest expense | (27,072 | ) | | (29,165 | ) | | (27,350 | ) | | (31,166 | ) | (31,628 | ) | | (31,086 | ) | | (30,388 | ) | | (32,715 | ) |
| Income before income taxes | 19,098 |
| | 16,898 |
| | 12,181 |
| | 11,533 |
| |
| Income before provision for income taxes | | 17,938 |
| | 19,565 |
| | 16,765 |
| | 17,343 |
|
| Provision for income taxes | 6,868 |
| | 5,176 |
| | 4,398 |
| | 4,899 |
| 6,586 |
| | 7,163 |
| | 6,158 |
| | 6,379 |
|
| Net income | 12,230 |
| | 11,722 |
| | 7,783 |
| | 6,634 |
| 11,352 |
| | 12,402 |
| | 10,607 |
| | 10,964 |
|
| Less net income attributable to noncontrolling interest in subsidiary | 367 |
| | 321 |
| | 254 |
| | 285 |
| 477 |
| | 662 |
| | 476 |
| | 422 |
|
| Net income attributable to Brookline Bancorp, Inc. | $ | 11,863 |
| | $ | 11,401 |
| | $ | 7,529 |
| | $ | 6,349 |
| $ | 10,875 |
| | $ | 11,740 |
| | $ | 10,131 |
| | $ | 10,542 |
|
| Earnings per share: | | | | | | | | | | | | | | |
| Basic | $ | 0.17 |
| | $ | 0.16 |
| | $ | 0.11 |
| | $ | 0.09 |
| $ | 0.16 |
| | $ | 0.17 |
| | $ | 0.15 |
| | $ | 0.15 |
|
| Diluted | 0.17 |
| | 0.16 |
| | 0.11 |
| | 0.09 |
| 0.16 |
| | 0.17 |
| | 0.14 |
| | 0.15 |
|
| Average common shares outstanding: | | | | | | | | | | | | | | |
| Basic | 69,742,225 |
| | 69,716,283 |
| | 69,677,656 |
| | 69,664,619 |
| 70,024,495 |
| | 69,989,909 |
| | 69,886,576 |
| | 69,875,473 |
|
| Diluted | 69,799,324 |
| | 69,754,473 |
| | 69,715,890 |
| | 69,665,873 |
| 70,130,243 |
| | 70,088,987 |
| | 70,012,377 |
| | 69,983,999 |
|
| Common stock price: | | | | | | | | | | | | | | |
| High | $ | 8.90 |
| | $ | 9.25 |
| | $ | 9.49 |
| | $ | 9.78 |
| $ | 10.15 |
| | $ | 9.51 |
| | $ | 9.63 |
| | $ | 9.70 |
|
| Low | 7.54 |
| | 8.13 |
| | 8.46 |
| | 8.37 |
| 8.56 |
| | 8.55 |
| | 8.83 |
| | 8.66 |
|
| Dividends per share | $ | 0.085 |
| | $ | 0.085 |
| | $ | 0.085 |
| | $ | 0.085 |
| $ | 0.085 |
| | $ | 0.085 |
| | $ | 0.085 |
| | $ | 0.085 |
|