It
UNITED STATES
SECURITIES AND EXCHANGE COMMISSION
Washington, D.C. 20549
FORM 10-K
(Mark One)
| | | | | |
| ☒ | ANNUAL REPORT PURSUANT TO SECTION 13 OR 15(d) OF THE SECURITIES EXCHANGE ACT OF 1934 |
For the fiscal year ended December 31, 20212023
OR
| | | | | |
| ☐ | TRANSITION REPORT PURSUANT TO SECTION 13 OR 15(d) OF THE SECURITIES EXCHANGE ACT OF 1934 |
For the transition period from ____ to _______
Commission file number 001-40643
OUTBRAIN INC.
(Exact name of registrant as specified in its charter)
| | | | | |
| Delaware | 20-5391629 |
| (State or other jurisdiction of incorporation or organization) | (I.R.S. Employer Identification No.) |
| | | | | | | | | | | |
| 111 West 19th Street |
| New York, | NY | 10011 | |
| (646) | 859-8594867-0149 | |
| (Address, including zip code, and telephone number, including area code, of registrant’s principal executive offices) |
Securities registered pursuant to Section 12(b) of the Act:
| | | | | | | | | | | | | | |
| Title of each class | | Trading Symbol(s) | | Name of each exchange on which registered |
| Common stock, par value $0.001 per share | | OB | | The Nasdaq Stock Market LLC |
Securities registered pursuant to section 12(g) of the Act: None
Indicate by check mark if the registrant is a well-known seasoned issuer, as defined in Rule 405 of the Securities Act. Yes ☐ No ☒
Indicate by check mark if the registrant is not required to file reports pursuant to Section 13 or Section 15(d) of the Act.YesAct. Yes ☐ No ☒
Indicate by check mark whether the registrant (1) has filed all reports required to be filed by Section 13 or 15(d) of the Securities Exchange Act of 1934 during the preceding 12 months (or for such shorter period that the registrant was required to file such reports), and (2) has been subject to such filing requirements for the past 90 days. Yes ☒ No ☐
Indicate by check mark whether the registrant has submitted electronically every Interactive Data File required to be submitted pursuant to Rule 405 of Regulation S-T (§232.405 of this chapter) during the preceding 12 months (or for such shorter period that the registrant was required to submit such files). Yes ☒ No ☐
Indicate by check mark whether the registrant is a large accelerated filer, an accelerated filer, a non-accelerated filer, a smaller reporting company, or an emerging growth company. See the definitions of “large accelerated filer,” “accelerated filer,” “smaller reporting company,” and “emerging growth company” in Rule 12b-2 of the Exchange Act. (Check one):
| | | | | | | | | | | |
| Large accelerated filer | ☐ | Accelerated filer | ☐☒ |
| Non-accelerated filer | ☒☐ | Smaller reporting company | ☐☒ |
| | Emerging growth company | ☒ |
If an emerging growth company, indicate by check mark if the registrant has elected not to use the extended transition period for complying with any new or revised financial accounting standards provided pursuant to Section 13(a) of the Exchange Act.Act ☐
Indicate by check mark whether the registrant has filed a report on and attestation to its management’s assessment of the effectiveness of its internal control over financial reporting under Section 404(b) of the Sarbanes-Oxley Act (15 U.S.C. 7262(b)) by the registered public accounting firm that prepared or issued its audit report. ☐
If securities are registered pursuant to Section 12(b) of the Act, indicate by check mark whether the financial statements of the registrant included in the filing reflect the correction of an error to previously issued financial statements. ☐
Indicate by check mark whether any of those error corrections are restatements that required a recovery analysis of incentive-based compensation received by any of the registrant’s executive officers during the relevant recovery period pursuant to §240.10D-1(b). ☐
Indicate by check mark whether the registrant is a shell company (as defined in Rule 12b-2 of the Act). Yes ☐ No ☒
AsThe aggregate market value of the voting and non-voting common equity held by non-affiliates computed by reference to the closing price of the shares of the registrant’s common stock on the Nasdaq Global Select Market on June 30, 2021,2023, the last business day of the registrant’s most recently completed second fiscal quarter, there was no established public market for the registrant’s common stock, par value $0.001 per share. The registrant’s common stock began trading on The Nasdaq Stock Market LLC on July 23, 2021.approximately $201.3 million.
As of February 28, 2022,29, 2023, Outbrain Inc. had 57,223,650had 49,054,785 shares of common stock outstanding.outstanding, $0.001 par value per share.
DOCUMENTS INCORPORATED BY REFERENCE
Portions of the registrant’s proxy statement for its 20222024 annual meeting of stockholders are incorporated herein by reference in Part III of this Annual Report on Form 10-K to the extent stated herein. Such proxy statement will be filed with the Securities and Exchange Commission within 120 days of the registrant’s fiscal year ended December 31, 2021.2023.
TABLE OF CONTENTS
Note About Forward-Looking Statements
This Annual Report on Form 10-K (this “Report”) contains forward-looking statements within the meaning of the federal securities laws, which statements involve substantial risks and uncertainties. Forward-looking statements may include, without limitation, statements generally relating to possible or assumed future results of our business, financial condition, results of operations, liquidity, plans and objectives. You can generally identify forward-looking statements because they contain words such as “may,” “will,” “should,” “expects,” “plans,” “anticipates,” “could,” “intends,” “target,” “projects,” “contemplates,” “believes,” “estimates,” “predicts,” “foresee,” “potential” or “continue” or the negative of these terms or other similar expressions that concern our expectations, strategy, plans or intentions or are not statements of historical facts.fact. We have based these forward-looking statements largely on our expectations and projections regarding future events and trends that we believe may affect our business, financial condition and results of operations. The outcome of the events described in these forward-looking statements is subject to risks, uncertainties and other factors including, but not limited to:
•overall advertising demand and traffic generated by our media partners;
•factors that affect advertising demand and spending, such as the continuation or worsening of unfavorable economic or business conditions or downturns, instability or volatility in financial markets, and unexpected events;other events or factors outside of our control, such as U.S. and global recession concerns, geopolitical concerns, including the ongoing wars between Ukraine-Russia and Israel-Hamas, supply chain issues, inflationary pressures, labor market volatility, bank closures or disruptions, the pace of recovery or any resurgences of the COVID-19 pandemic, and the impact of challenging economic conditions and other factors that have and may further impact advertisers’ ability to pay;
•our ability to continue to innovate, and adoption by our advertisers and media partners of our expanding solutions;
•the success of our sales and marketing investments, which may require significant investments and may involve long sales cycles;
•our ability to grow our business and manage growth effectively;
•our ability to compete effectively against current and future competitors;
•the loss of one or more of our large media partners, and our ability to expand our advertiser and media partner relationships;
•conditions in Israel, including the ongoing war between Israel and Hamas and other terrorist organizations, may limit our ability to market, support and innovate on our products due to the impact on our employees as well as our advertisers and their advertising markets;
•our ability to maintain our revenues or profitability despite quarterly fluctuations in our results, whether due to seasonality, large cyclical events, or other causes;
•the risk that our research and development efforts may not meet the demands of a rapidly evolving technology market;
•any failure of our recommendation engine to accurately predict userattention or engagement, any deterioration in the quality of our recommendations or failure to present interesting content to users or other factors which may cause us to experience a decline in user engagement or loss of media partners;
•limits on our ability to collect, use and disclose data to deliver advertisements;
•our ability to continue to innovate, and adoption by our advertisers and media partners of our expanding solutions;
•our ability to meet demands on our infrastructure and resources due to future growth or otherwise;
•our ability to extend our reach into evolving digital media platforms;
•our ability to maintain and scale our technology platform;
•our ability to growmeet demands on our businessinfrastructure and manageresources due to future growth effectively;
•the success of our sales and marketing investments, which may require significant investments and may involve long sales cycles;
•the risk that our research and development efforts may not meet the demands of a rapidly evolving technology market;
•the loss of one or more of our large media partners, and our ability to expand our advertiser and media partner relationships;otherwise;
•our abilityfailure or the failure of third parties to compete effectivelyprotect our sites, networks and systems against current and future competitors;security breaches, or otherwise to protect the confidential information of us or our partners;
•outages or disruptions that impact us or our service providers, resulting from cyber incidents, or failures or loss of the hardware, software and infrastructure on which we rely, or security breaches;our infrastructure;
•our ability to maintain our revenues or profitability despite quarterlysignificant fluctuations in our results, whether due to seasonality, large cyclical events, or other causes;currency exchange rates;
•political and regulatory risks in the various markets in which we operate;
•the challenges of compliance with differing and changing regulatory requirements;
•the effectstiming and execution of cost-saving measures and the ongoing and evolving COVID-19 pandemic, including the resulting global economic uncertainty, and measures taken in response to the pandemic;impact on our business or strategy; and
•the risks described in the section entitled “Risk Factors” and elsewhere in this Report.
Accordingly, you should not rely upon forward-looking statements as an indication of future performance. We cannot assure you that the results, events and circumstances reflected in the forward-looking statements will be achieved or will occur, and actual results, events or circumstances could differ materially from those projected in the forward-looking statements. The forward-looking statements made in this Report relate only to events as of the date on which the statements are made. We may not actually achieve the plans, intentions or expectations disclosed in our forward-looking statements and you should not place undue reliance on our forward-looking statements. We undertake no obligation and do not assume any obligation to update any forward-looking statements, whether as a result of new information, future events or circumstances after the date on which the statements are made or to reflect the occurrence of unanticipated events or otherwise, except as required by law.
PART I
Item 1. Business
Outbrain Inc., together (together with our subsidiaries, (“Outbrain”,“Outbrain,” the “Company”, “we”,“Company,” “we,” “our” or “us”) was incorporated in August 2006 in Delaware. The Company is headquartered in New York, New York and has wholly ownedwith various wholly-owned subsidiaries, including in Israel, Europe Asia, Brazil and Australia.Asia.
On July 22, 2021, the Company’sour registration statement on Form S-1 (File(File No. 333- 257525)333-257525), filed on June 29, 2021, as amended, was declared effective by the U.S. Securities and Exchange Commission (the “SEC”) in connection with the Company’sour initial public offering (“IPO”) of the Company’sour common stock, and itsour common stock began trading on The Nasdaq Stock Market LLC (“Nasdaq”) on July 23, 2021. On July 27, 2021, the Companywe closed itsour IPO and issued 8,000,000 shares of itsour common stock at an initial offering price of $20.00 per share, receiving aggregate net proceeds of $145.1 million, after deducting underwriting discounts, commissions and other offering costs.
Our mission is to help digital media owners thrive by recommending content, products and services that users love.connect businesses with engaged audiences.
Outbrain is a leading recommendationtechnology platform poweringthat drives business results by connecting media owners and advertisers with engaged audiences to drive business outcomes, reaching over a billion unique consumers around the open web.world. Outbrain’s technology provides personalization, engagementartificial intelligence (“AI”) prediction engine powers a two-sided platform for advertisers and monetization solutions tomedia owners that delivers concrete business outcomes. Our platform enables thousands of digital media properties, including many of the world’s most prestigious publishers. Through powering discovery feeds on the open web, Outbrain helps over a billion unique users on a monthly basis discover content, offers, servicesowners to provide tailored experiences to their audiences, delivering audience engagement and products they might be interested in.monetization. For tens of thousands of advertisers, around the world, Outbrain helps attract new customersfrom enterprise brands to performance marketers, our platform optimizes audience attention and grow their businesses, driving measurable results andengagement to deliver greater return on investment.investment at each step of the marketing funnel.
Over the past decade, consumers have become increasingly accustomed to seeing highly curated digital content and ads that alignaligns with their unique interests. Similar to the way in which socialSocial media and search have simplified discovery by synthesizingleveraging billions of consumer data points to offer personalized feeds, weexperiences. In a similar fashion, our prediction engine ingests billions of data points each minute to provide digital media partnersowners with a platform that encompasses data at scale as well as predictionto deliver curated editorial and recommendation capabilities, helping media partners deliver a discovery feed personalizedadvertiser experiences to their users, based on contextaudiences. We have been leveraging AI to enhance our ingestion of data and each user’s intereststhe performance of our prediction engine since our inception. This type of AI, known as traditional or predictive AI, uses machine learning to filter and better understand data to forecast consumer preferences. By contrast, generative AI turns machine learning inputs into actual content. Throughout this Report, when referring to “AI” we are referring to traditional or predictive AI, unless the term “generative AI” is specified.
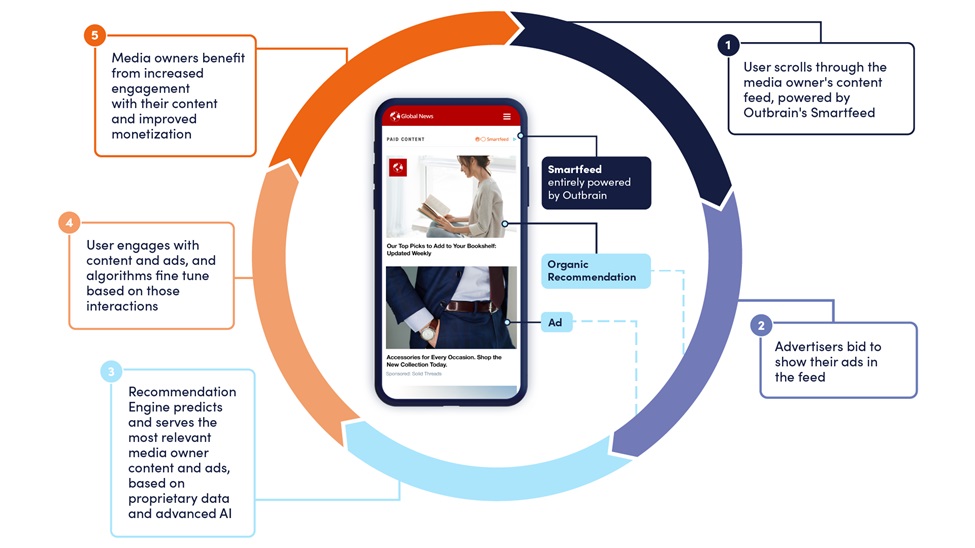
ConsumptionAccording to Statista, consumption of content continues to shift online, with over four5 billion consumers accessing the Internet, primarily through mobile devices, where scrollingthe ability to scroll through a feed experience is habituallyhas come to be expected by consumers on every page. According to eMarketer,This means the average personmethod in the United States is expected to spend more than eight hours a day consuming digitalwhich audiences discover and engage with editorial content must evolve. Our media in 2022. In addition, the estimated averagepartners are media owners that use of U.S. consumer’s mobile device grew from 87 minutes per day in 2012 to 264 minutes per day in 2021, a 203% increase. According to the Reuters Institute for the Study of Journalism at Oxford University, 73% of people access news through side-doors, not through the homepages of publications. We believe this means discovery feeds on article pages are more important than everOutbrain’s technology to help userstheir audiences navigate what to read, watch, orconsider, and buy next.
Our platform is built for user engagement and, as a mobile-first company, is designed to be highly effective on mobile devices. Outbrain’s technology is deployed on the mobile apps and websites of most of our media partners, generating 68%73% of our revenue in 2021.2023.
Outbrain operates a two-sided marketplace, which means we usually have full exclusive control over all aspects of the user experiences,consumer experience, allowing us to quickly test and deploy new formats for our constituents.advertisers and media owners. Since inception, we have been guided by the same core principles pertaining to our three constituents: consumers, media partners, users, and advertisers.
•Consumers. Our platform is centered on predicting consumer attention and engagement. We believe that by focusing our algorithm on optimizing toward these consumer-centric factors, we are able to cultivate user behavior patterns that compound over time, delivering greater effectiveness and efficiency for our advertisers, superior long-term monetization for our media partners, as well as increased value for Outbrain.
•Media Partners. We are committed to supporting the long-term success of our media partners. Consistent with this philosophy, we focus on establishing a true win-win partnership. We strive to develop trusted, transparent, multi-year contracts with media partners, which are typically exclusive with us.the objective of delivering long-term revenue and deeper audience engagement. Our media partners include both traditional publishers and companies in new and rapidly evolving categories, such as mobile device manufacturers and web browsers.manufacturers.
Users.•Advertisers. We believe that by focusing on improvingoffer unique advertising solutions across the user experience we are ablemarketing funnel and provide a single access point to cultivate user behavior patterns that compound engagement over time, delivering superior long-term monetization for ourselves and for our media partners.
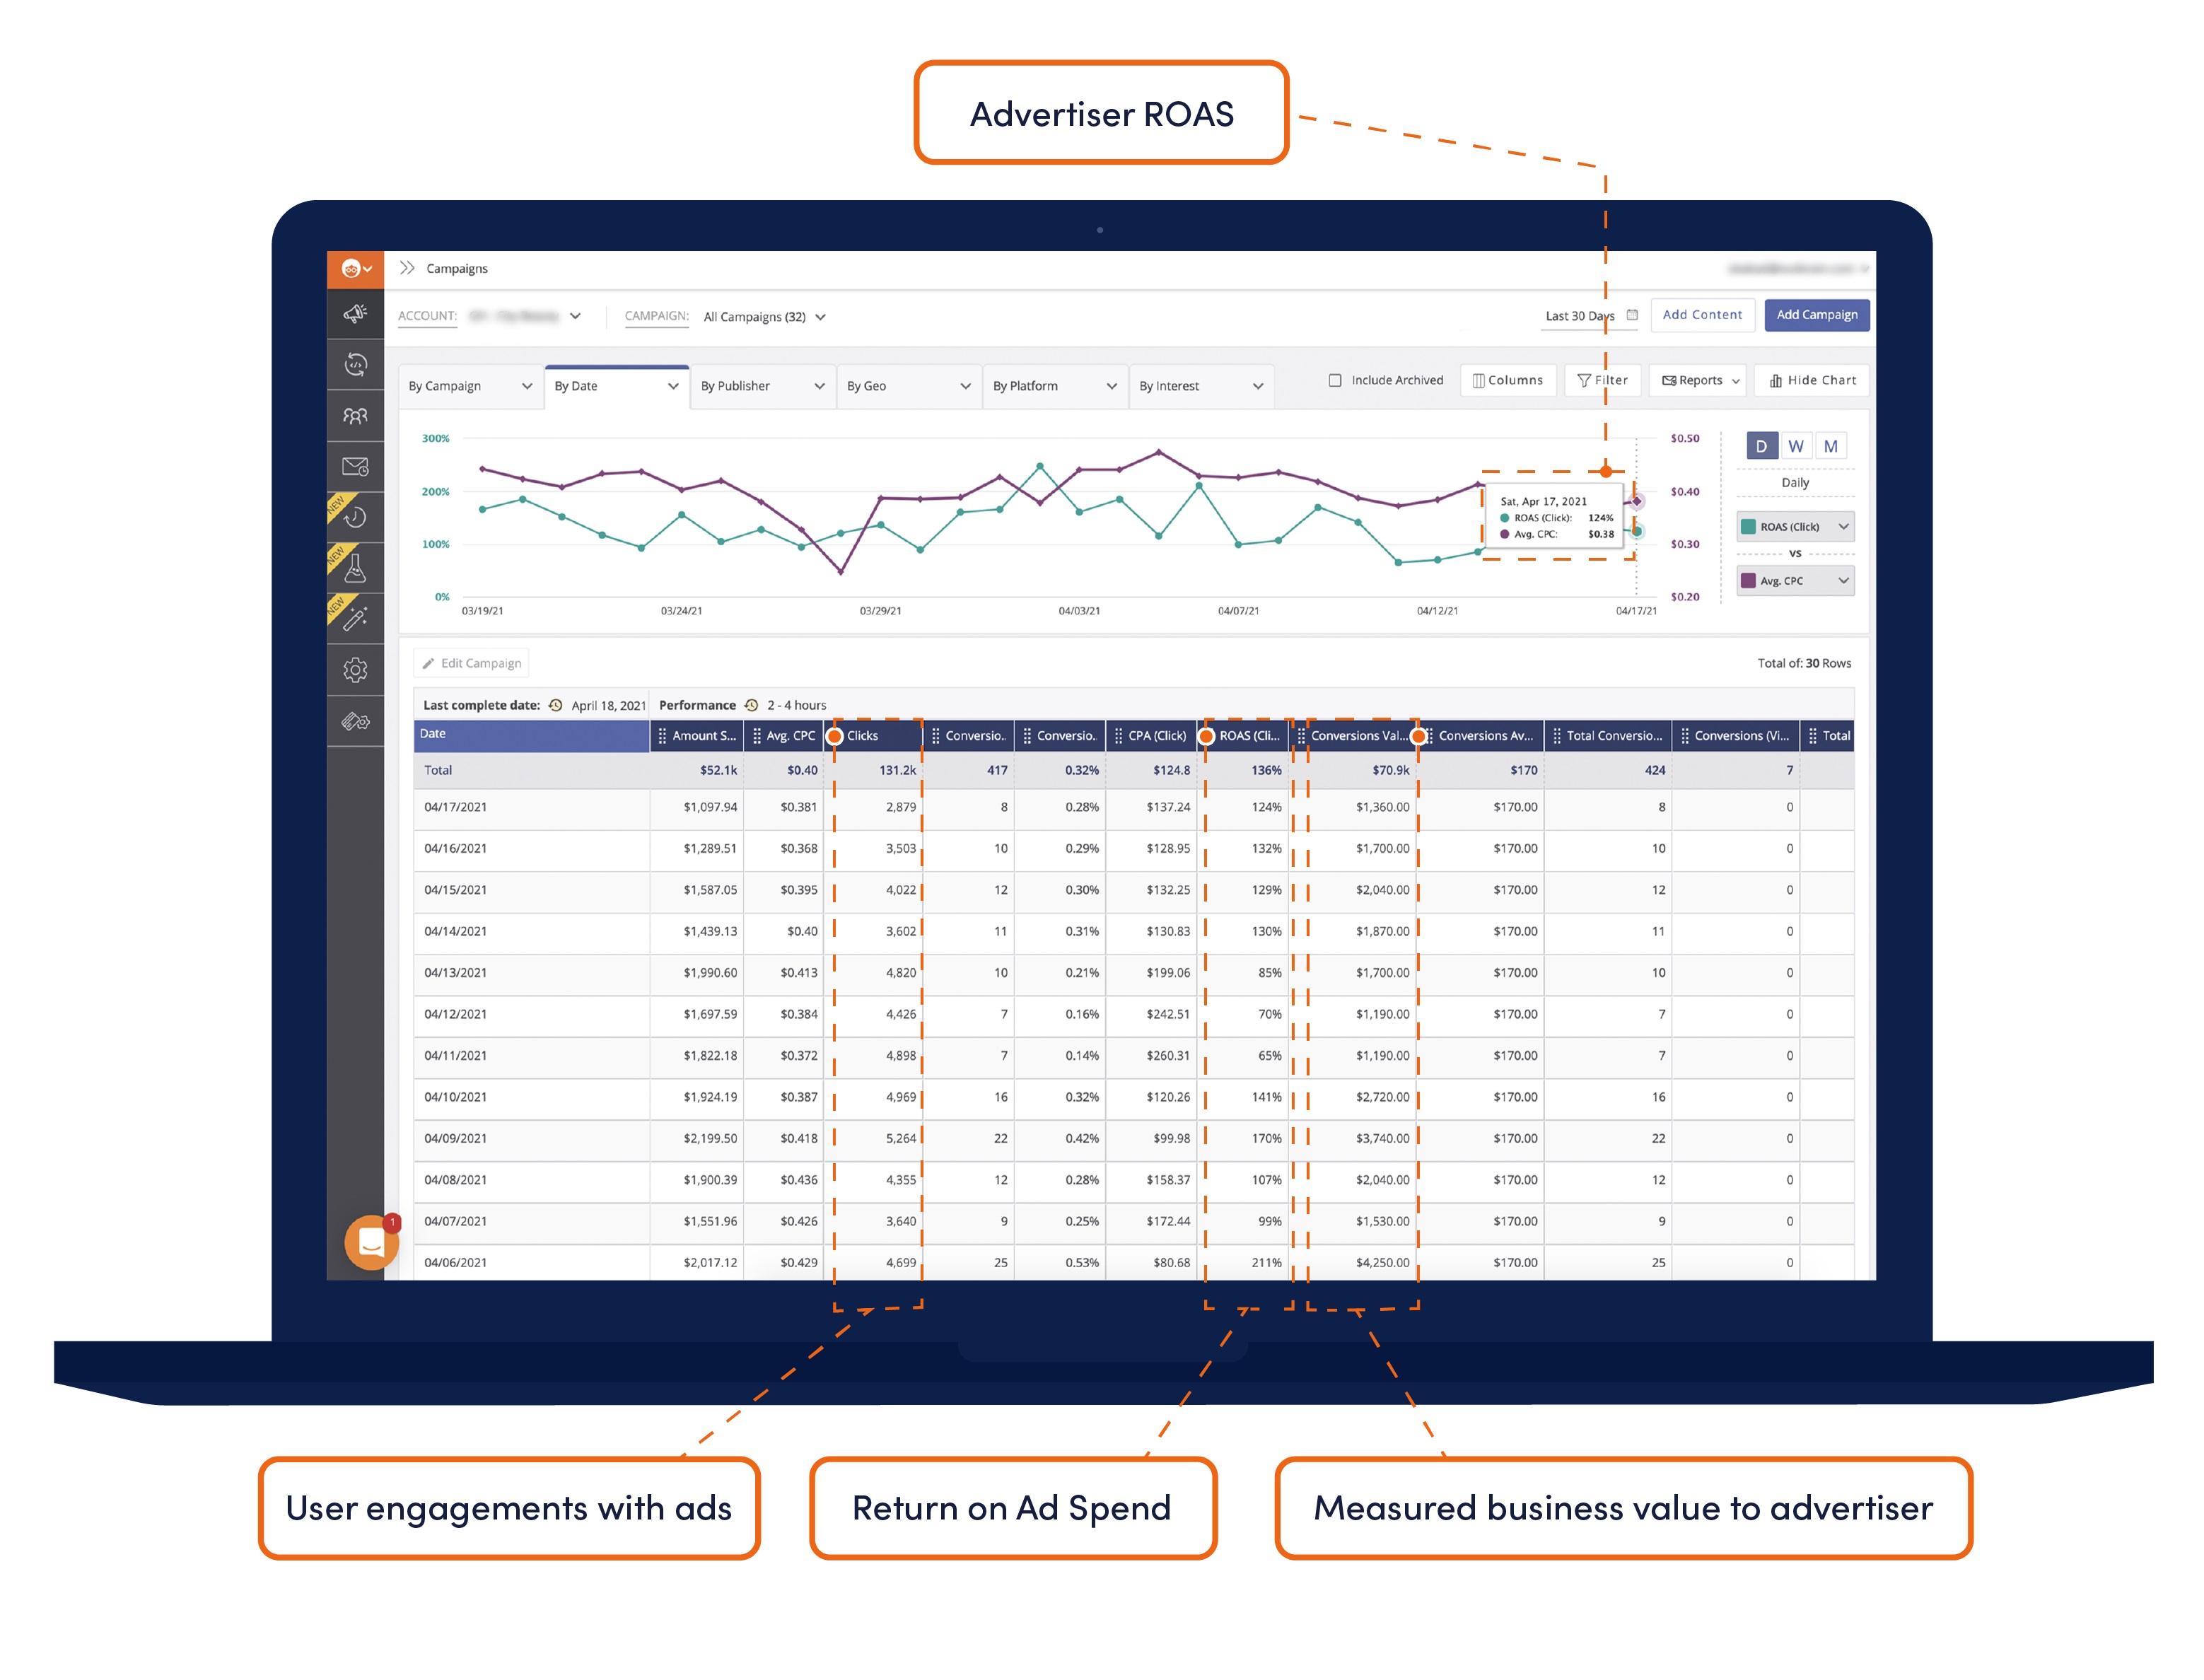
Advertisers.not only reach, but drive real business outcomes from consumers across the Open Internet. We strive to grow our advertising business by increasing overall user engagement, rather than price per engagement. Our emphasis on user engagement helps us improve advertisers’ return on ad spend (“ROAS”) thus unlocking more advertising spend and attracting more advertisers. In turn this enables us to better match ads to users and further grow user engagement and overall monetization.
We have delivered nearly $4 billion in direct revenuefrom enterprise brands to our media partners, since inception. performance marketers with solutions to optimize consumer attention and engagement, to deliver accountable business results and greater return on investment.
We partner with thousands of the world’s most trusted digital media owners for which weowners. We believe we are an important technology partner.and monetization partner to these media owners, delivering approximately $5.2 billion in direct revenue to our partners since our inception. Some key media partners with which we have longstandinglong-standing relationships across our various regions include Asahi Shimbun, CNN, Der Spiegel, Le Monde, MSN, New York Post, Sky News and Sky Sports, and The Washington Post. The average tenure of our top 20 media partners based(based on our 2021 revenue,2023 revenue), which also includes our more recent partnerships, such as Axel Springer and Fox News, is overapproximately seven years.
Through our direct, usually exclusive code-on-page integrations with media partners,owners, we have become one of the largest online advertising platforms on the open web.Open Internet. In 2021,2023, we provided personalized feeds and ads to over 1a billion monthly unique users,consumers, delivering on average over 1012 billion recommendations toexperiences promoting content, services, and products per day, with over 24,000tens of thousands of advertisers directly using our platform.
Our platform is user engagement focused. A significant proportionWe are one of the engagement created by our platform isfew technology companies who provide a single point of access to consumers as they engage with the content of the media partner for which we are providing the platform, which we refer to as ‘organic recommendations.’ Outbrain is trusted to power organic recommendations across all publisher media types, including written editorial, video and audio content. This provides the user with a personalized content experience, while increasing time spent and engagement on the media partner’s digital properties. We believe this is crucial to increasing long-term loyalty and retention of users for media partners, while increasing the depth and value of user visits in the short term. Powering a feed of both organic recommendations and targeted ads creates significant proprietary, first-party data that enables us to continuously refine our prediction algorithms, supporting our efforts to further increase engagement.
Advertisers use our platform to reach consumers efficiently through various ad formats across thousands of premium digital media properties aroundacross the world. Open Internet. As a result, we provide a platform that delivers a consistent experience to these consumers, giving advertisers confidence in how they reach their audiences at valuable moments of engagement and consideration.
Our platform provides accessAI prediction engine is fundamental to a significant volume of exclusive ad inventory within the content feeds of these premium digital media properties. Advertisers primarily use our platform for performance driven campaigns, with measurable outcomes. Our ability to drive value and ROAS for advertisers, at scale, is highlighted in the growth of ad spend through our platform. In 2021,how we invested significant R&D resources to automate and optimize the ROAS for our advertisers, which expanded the variety of content experiences and ad experiences we serve our audience. We now support native recommendations (image + text) formats, standard display formatsoutcomes for consumers, media owners, and a wide variety of video formats, providing full funnel opportunities for our advertising clients, from driving awareness through direct response and driving conversions.
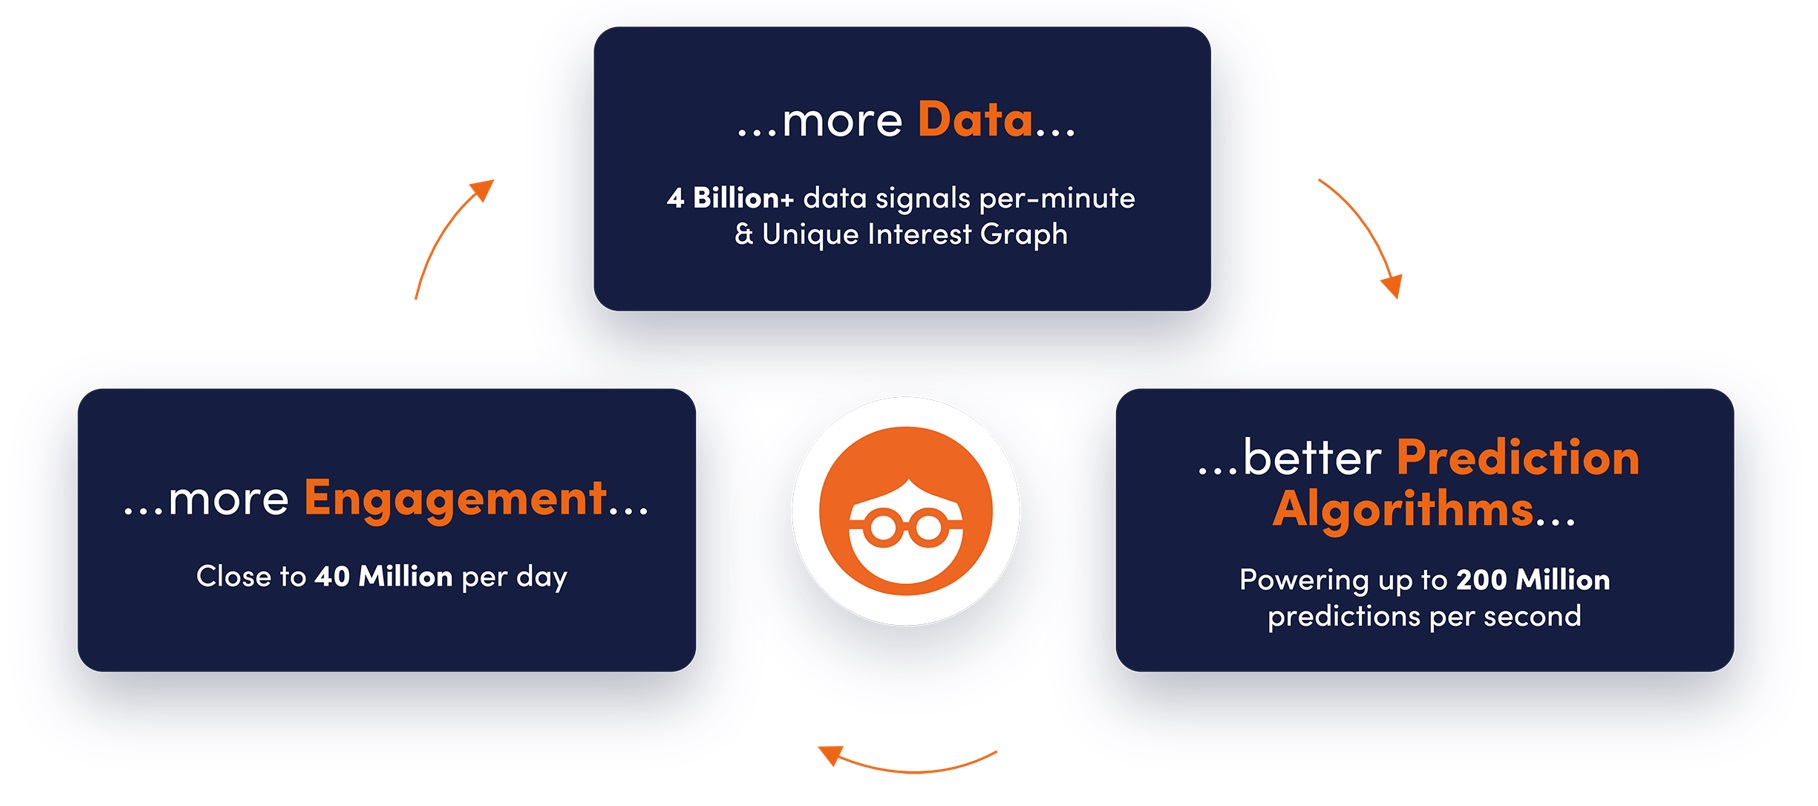
Data and algorithms are fundamental to everything we do.advertisers. We process billions of data signals per minute, powering up to 200 million Click Through Rate (“CTR”)more than one billion predictions and over 100,000 recommendationsexperiences per second. This drivesThe growth of our abilityplatform, access to deliver closeaudiences, and analysis of marketer results provides us with greater data, which enables us to 40 million engagements per day.continually improve the efficacy of our AI prediction engine. Our ability to collect and synthesize large data sets into our real-time decisioning engine powers our recommendations, our feedusing AI is a key differentiator, and enables us to deliver advertiser outcomes, consumer experiences, and our ad targeting, helping us optimize user engagement and monetization. As our platform grows, we are able to leverage our data scale in order to enhance our algorithms, enabling us to improve the efficacy of our platform. This, in turn, drives additional user engagement and thus more monetization for our partners and ourselves, which helps us further grow our business and scale our data. We refer to this phenomenon as our data flywheel. Engagements with our recommendations include user clicks on one of our recommendation links and views of a video that we recommended. We believe engagements are an indicator of the value users find in our recommendations and the value we create for our media partners through increased monetization.owner value.
We are targeting a large, fragmented and growing market. eMarketer states that approximately $492 billion was spent on global digital advertising in 2021, and by 2024, this figure is expected to increase to $717 billion. Approximately 40% of the world’s population has yet to gain access to the Internet. We believe a second factor will complement the increased activity of more people arriving online: the significant majority of consumption and economic activity, such as retail, still takes place offline. As the migration to online takes place, there remains significant future growth potential in eCommerce, given that just 13% of total retail sales in the United States in 2021 occurred online, according to the U.S. Department of Commerce. Online retail sales are both growing and fragmenting. We believe this represents an opportunity as the broader ecosystem of retailers seek advertising and technology partners to support their continued online growth. Advertisers increasingly expect measurable impact from their digital advertising investment, often preferring to pay for outcomes rather than pay for media, according to a 2020 Jounce market outlook report. Within digital advertising, more engaging and user-friendly formats, such as native and video, represent the fastest growing segments for ad spend, outgrowing search and traditional forms of display, according to eMarketer. Given our ability to deliver high impact and measurable performance to our advertisers, significant reach and unique inventory, we believe that we are well positioned to capture a significant share of this growing market.
We have a track record of consistently growing our business, and have achieved significant scale with over $1 billion of revenue in 2021. Our business is profitable and we are benefiting from strong operating leverage as we grow. Our net income was $11.0 million, or 4.6% of gross profit in 2021, compared to $4.4 million, or 2.6% of gross profit in 2020. Our gross profit was $240.3 million in 2021, up from $165.1 million in 2020, representing year over year growth of 45.6%. Our Ex-TAC Gross Profit was $272.1 million in 2021, up from $194.3 million in 2020, representing year over year growth of 40.0%. Our Adjusted EBITDA more than doubled to $88.9 million in 2021, from $41.1 million in 2020. Adjusted EBITDA was 32.7% and 21.2% of Ex-TAC Gross Profit in 2021 and 2020, respectively. See Item 7. Management’s Discussion and Analysis of Financial Condition and Results of Operations under “Non-GAAP Reconciliations” for definitions and reconciliations of our non-GAAP financial measures, such as Ex-TAC Gross Profit, Adjusted EBITDA, and Adjusted EBITDA as a percentage of Ex-TAC Gross Profit, to the corresponding measures calculated in accordance with U.S. GAAP.
Our Industry
Advertising is the primary business model for digital media on the open web. In addition, advertising is also increasingly usedOpen Internet, including traditional media environments, as a key revenue driver for other Internet based businesses, suchwell as mobile gaming and eCommerce.retail media environments. As a result, digital advertising not only subsidizes media consumption for billions of consumers globally, but also finances the creation of journalism, news, and innovative mediums of entertainment while lowering the costs to consumersacross thousands of various products and services.independent properties — creating a more diverse consumer ecosystem beyond walled gardens.
We believe that the following industry trends are relevant to our business:
Proliferation of digital media and digital advertising particularly across mobile environments.environments, with changing consumer expectations. As mentioned above, the consumption of content continues to shift to digital and primarily to mobile devices. In order to address this change, most media providers have shifted their focus from traditional means of content delivery to digital ones, with new ‘digital-native’ providers increasingly gaining attention. Advertising spend follows time spent and engagement, and mobile ad spend is expected to increase at a faster pace than digital ad spend in total. According to eMarketer, in 2021 global digital ad spend grew to $492 billion, a 29.1% year over year increase, exceeding growth expectations, and mobile ad spend grew to $369 billion, a 32.4% year over year increase. Of that, 40.2% was expected to go to search, with 55.2% expected to go to forms of display advertising, including native and video. The percentage of total media ad spending in digital was 63.0% in 2021 and is projected to be 65.9% in 2022, 68.5% in 2023, 70.3% in 2024 and 72.0% in 2025. Advertisers increasingly expect measurable impact from their digital advertising investment, often preferring to pay for outcomes rather than pay for media, according to a 2020 Jounce market outlook report. Within Digital Advertising, more engaging and user-friendly formats such as native and video represent the fastest growing segments for ad spend, outgrowing Search and traditional forms of Display, according to eMarketer.
Consumer habits and expectations are changing. Consumers have grown accustomed to consuming engaging content that is personalized and curated across multiple digital formats, including social, entertainment, gaming and audio. In mobile environments, consumers habitually scroll through apps, mobile browsers and news feeds, such as those found on social media, providing continuous opportunities to deliver personalized advertising experiences. As a result, we believe that personalized and engaging digital content experiences, supported by non-intrusive ads, have become the expectation of media owners, rather than a consumer luxury. As an example, digital video remains a fast-growth category of content consumptionAdvertising spend follows time spent and advertisingengagement, and as such mobile ad spend and video is expected to accountincrease at a faster pace than digital ad spend in total. There is a significant opportunity for more than halftechnology platforms to develop similar browsing experiences for consumers across the increasing amount of all US programmatic displayavailable content on the Open Internet. According to Insider Intelligence, in 2023 global digital ad spending in 2022.spend grew to $610 billion, a 10.7% year over year increase, and mobile ad spend grew to approximately $450 billion, an 11.9% year over year increase.
Trusted editorial content is becoming increasingly important.The massive scale of content creation and distribution across social media has made it difficult to curb the creation and proliferation of factually inaccurate news and misinformation, leading to a growing distrustmisinformation. Social media has become the preferred method of user-generated social media content. In a Kantar Dimensions study published in May 2020, social media was ranked asnews consumption for Americans, despite it being the least trusted medium, with only 17%category of consumers citing Facebookmedia, according to a 2023 Statista report. This indicates the desire of audiences to consume media through tailored experiences similar to social, and Twitter as reputable sources of information.in contrast spotlights the need for trusted, journalistic content. We believe that this is a trend that will continue: a 2021 study from The Trusted Web Foundation found that visiting news outlets directly remains the most common way of consuming news online, with more than twice as many respondents citing this method as compared with engaging with links on social media. At the same time, advertisers are growing increasingly concerned about having their messages shown alongside unsavory user-generated content. According to the CMO Council, 72% of advertisers are concerned about brand integrity on social media.continue. As a result, advertisers have become increasingly cognizant of wherebegun to express that they spend ad dollars,are seeking media environments that prioritize quality, transparency, and brand safety.fact-based reporting.
6Advertisers and media owners are focused on enabling a more sustainable digital media ecosystem. As delivery of content and advertising over digital channels increases in scale, the advertising industry is focused on increasing efficiency and transparency for both advertisers and publishers. Advertisers are requesting greater transparency into the publisher environments they are buying and appearing on, and technology platforms play a critical role in enabling this transparency. This has created larger industry focus on supply optimization. By understanding and prioritizing the most direct access points to publisher inventory, advertisers can reduce media waste and inefficiency. This enables a more sustainable advertising ecosystem at large, ensuring media dollars are spent on quality environments that drive value and reward publishers with sustainable revenue. Platforms with direct media and advertiser relationships, ability to control bidding, and to increase the effectiveness and efficiency of impressions served by optimizing to true consumer attention and engagement, will be best positioned to reduce carbon emissions while providing greater transparency to media owners and advertisers as a result.
All major browsers have now announced an intention to deprecate the use of third-party cookies, with Google Chrome officially restricting third-party cookies for 1% of consumers on January 4, 2024. Third-party cookies have historically been the primary vehicle to target and measure advertising campaigns across web environments. The advertising industry at large is focused on creating methods to deliver tailored experiences to consumers without infringing on user privacy or creating data leakage. As a result, platforms which focus on delivering relevant experiences to consumers based on context and interest, rather than user-based factors, will ostensibly be best positioned to meet advertiser needs in a post-cookie environment. Performance and ROASreturn-on-ad-spend (“ROAS”) are becoming increasingly important to advertisers. As digital advertising continuesspend becomes more accountable to consume a larger share of advertiser budgets, the ability to target advertising basedkey business metrics, technology platforms that deliver on specific user interestsconcrete engagement and context, in real-time, has become increasingly important to advertisers, as it contributes toperformance are more efficient campaigns and improved ROAS.relevant than ever. This creates demand for solutions that can adjust in real-time while measuring and optimizing for specific price and performance thresholds. As tools for targeting and tracking become more sophisticated and effective, advertisers are increasingly relying on performance centric pricing models to drive more measurable ROAS, for example, paying for a click (cost-per-click), lead, acquisition, download, install, or sale, insteadsale. Similarly, advertisers are now defining and tracking more accountable metrics for branding and awareness campaigns, rather than measuring views and impressions alone. While viewability remains crucial, advertisers are looking for metrics that provide greater insight into the moment in which they reach consumers. For example, ad placements with high viewability may be quickly passed over by consumers and receive low attention. As a result, advertisers are exploring the use cases for attention metrics, which we believe will enable advertisers to better measure the impact of paying to simply display an ad which may or may not create value. Accordingupper-funnel advertising. Attention adoption is high, with almost 96% of surveyed advertisers worldwide using attention metrics in at least some of their buys this year, according to a 2021 report by the Interactive Advertising BureauFebruary 2023 survey from DoubleVerify. Combining prediction models, accountable metrics such as attention and PwC Advisory Services LLC, the most significant and growing proportionengagement, with a wide range of all internet advertising revenues have been priced on a performance basis, 67.1% in 2020 versus 62.9% in 2019. Manyformats (from video, to display, to native) will enable advertisers including the largest brands, leverage third-party software and predictive data-driven models to meet their performance goals. In parallel, increasingly user friendly and engagement-focused formats of digital advertising have evolved to better serve advertisers seeking performance and ROAS.
Data-driven decisioning delivers better experiences and outcomes. Advances in software and hardware along with the growing usedeliver greater ROAS at each step of the Internetmarketing funnel.
Rapid rise of AI provides significant opportunities in advertising. AI models have become increasingly user-friendly and directly applicable to a wide range of industries and use cases. AI has made it possible to collect and rapidly process massive amounts of real-time data signals related to content, context and performance. Leveraging data at scale, advertising technology providers can dynamically serve content or ads that integrate seamlesslyperformance, and incorporate those signals into user environmentsprediction algorithms like ours. The most recent developments in AI and generative AI will enable platforms like ours to provide solutions directly to self-serve and managed advertisers to tailor creative experiences, automate campaign parameters to improve performance, and inform traditional buying methods with new metrics, such as attention, to optimize ad efficacy. Both advertisers and media owners will increasingly rely on AI-powered automation to deliver tailored impactful experiences. The decisioning intelligence developed by leading technology providers and large Internet platforms has made advertising more engaging for users and more effective for advertisers. As a result, advertisers are increasingly focused on data-driven decisioning, making these capabilities critical for media partners, as they seek to deliver quality experiences to their usersconsumers while maintaining their relevance with advertisers.maximizing performance and monetization opportunities.
The ChallengeNavigating the Transforming Media Landscape for Digital Media Owners and Advertisers
AsWe are targeting a large, fragmented and growing market. According to Insider Intelligence, global digital advertising is expected to grow by 26% over the pacenext two years, accounting for $767 million in spend in 2025. The addressable market for advertising on the Open Internet is tremendous: Insider Intelligence data (January 2024) shows that the programmatic advertising sector is still growing significantly, especially on the Open Internet, where spending in the U.S. alone is rising at a faster rate than in walled gardens and could surpass $50 billion by 2025.
The media landscape is undergoing a substantial transformation, primarily due to the increased consumption of onlinevideo on social platforms. This shift is shaping how consumers engage with digital media and influencing advertisers in budget allocation.
Global digital advertising revenues have historically been concentrated by the walled gardens, particularly within Google, Meta and their platforms. According to Insider Intelligence (eMarketer, October, 2023) the relative shares of Google and Meta are expected to decline year over year through 2025, despite their revenue growth. Other channels are capturing share of digital advertising spend, including TikTok, Amazon, and Roku, supporting our belief that advertiser dollars will shift and overall spend will increase to platforms delivering incremental reach, engaged consumers and return on investment for advertisers.
Additionally, while consumers are spending a large proportion of their time on social media, Insider Intelligence’s data shows that growth of time spent is plateauing, as consumers seek longer-form content creationto engage with (rather than short-form social content alone). We believe this represents an opportunity as the broader ecosystem of advertisers seek partners to support continued growth of editorial and consumption continuesjournalistic content.
Accordingly, we are executing on strategies to accelerate,draw both consumers and competitionadvertisers to the Open Internet. Our long-standing approach to navigating this changing landscape includes our efforts to become the leading prediction platform on the Open Internet, continually optimizing for user attention intensifies, digital media owners must focus on their core strength: creating relevant, interesting, quality content. However, their success also depends on sustainably attracting, engaging, retaining and monetizing audiences while competing with the major social and aggregation platforms, known as the ‘walled gardens.’ These platforms, driven by the nature of their services and their scale, have significant resources to invest in technology and have amassed large volumes of coveted user data, enabling them to deliver highly targeted and thus effective ads alongside user generated or third-party content, helping them achieve an outsized share of the advertising market.
As a result, we believe that digital media owners, whose properties are often referred to as the ‘open web,’ face challenges in the following key areas:
User experience. In today’s dynamic, mobile-first environment, providing a high-quality user experience that addresses consumer habits and expectations is critical to attracting, engaging and retaining audiences. For example, over the past few years, consumers have grown accustomed to receiving personalized content recommendations, which are now common within the walled gardens. In addition, infinite scrolling feeds of content have also become popular, especially on mobile devices. Keeping pace with these changes, as well as other emerging products and features, represents a significant challenge to many digital media owners who lack the scale and resources required to compete.
Monetization. The fragmented ecosystem of digital advertising technology intermediaries, constantly evolving landscape of ad formats and the growing sophistication of advertisers seeking measurable ROAS makes it difficult for digital media owners to develop and maintain the technology required to optimize their monetization. In addition, digital media owners often lack access to a large and diverse advertiser base. As a result, they may not benefit from the variety of ads that are necessary in order to optimize consumer engagement and thus overall monetization.
Our Solution
We enable digital media owners to provide their users with an experience that is personalized and relevant to their interests while generating incremental revenue through highly engaging content recommendations and relevant advertisements. Our platform is informed by large, proprietary data sets. Our recommendation engine relies on advanced artificial intelligence technology and machine learning algorithms. We leverage our scale, gained through a large number of partners and advertisers, in order to grow and enhance our data and our technology continuously.
By delivering relevant content recommendations that personalize the user experience, alongside targeted ads, our platform increases and monetizes user engagement. Our technology platform forms the underlying “operating system” of our media partners’ content feeds, helping them manage and grow their business.
We focus on the long-term
•Our goal is to delight the user. We believe in the compounding value that is generated by increasing user engagement. As a result, we aim to delight users by recommending relevant content in order to deliver superior long-term monetization for our media partners and ourselves.
•Quality is fundamental. We partner with prestigious and trusted digital media owners around the world. Through our commitment to working with the most credible sources of digital media and content creators, we have created an ecosystem trusted by publishers, advertisers and users alike.
•Deep integrations are key. Our technology is deeply integrated with our partners’ systems, enabling us to roll out new products and features with speed. As a result, our partners gain the flexibility to capitalize on new forms of content distribution and advertising, as well as shifting consumer preferences, empowering them to achieve their growth and monetization objectives.
•Transparency builds trust and alignment. By maintaining transparency on pricing, data collection and efficacy, we align our incentives with those of our partners and work to ensure their objectives are achieved, driving the long-term success of our business.
Our Offering for Media Partners
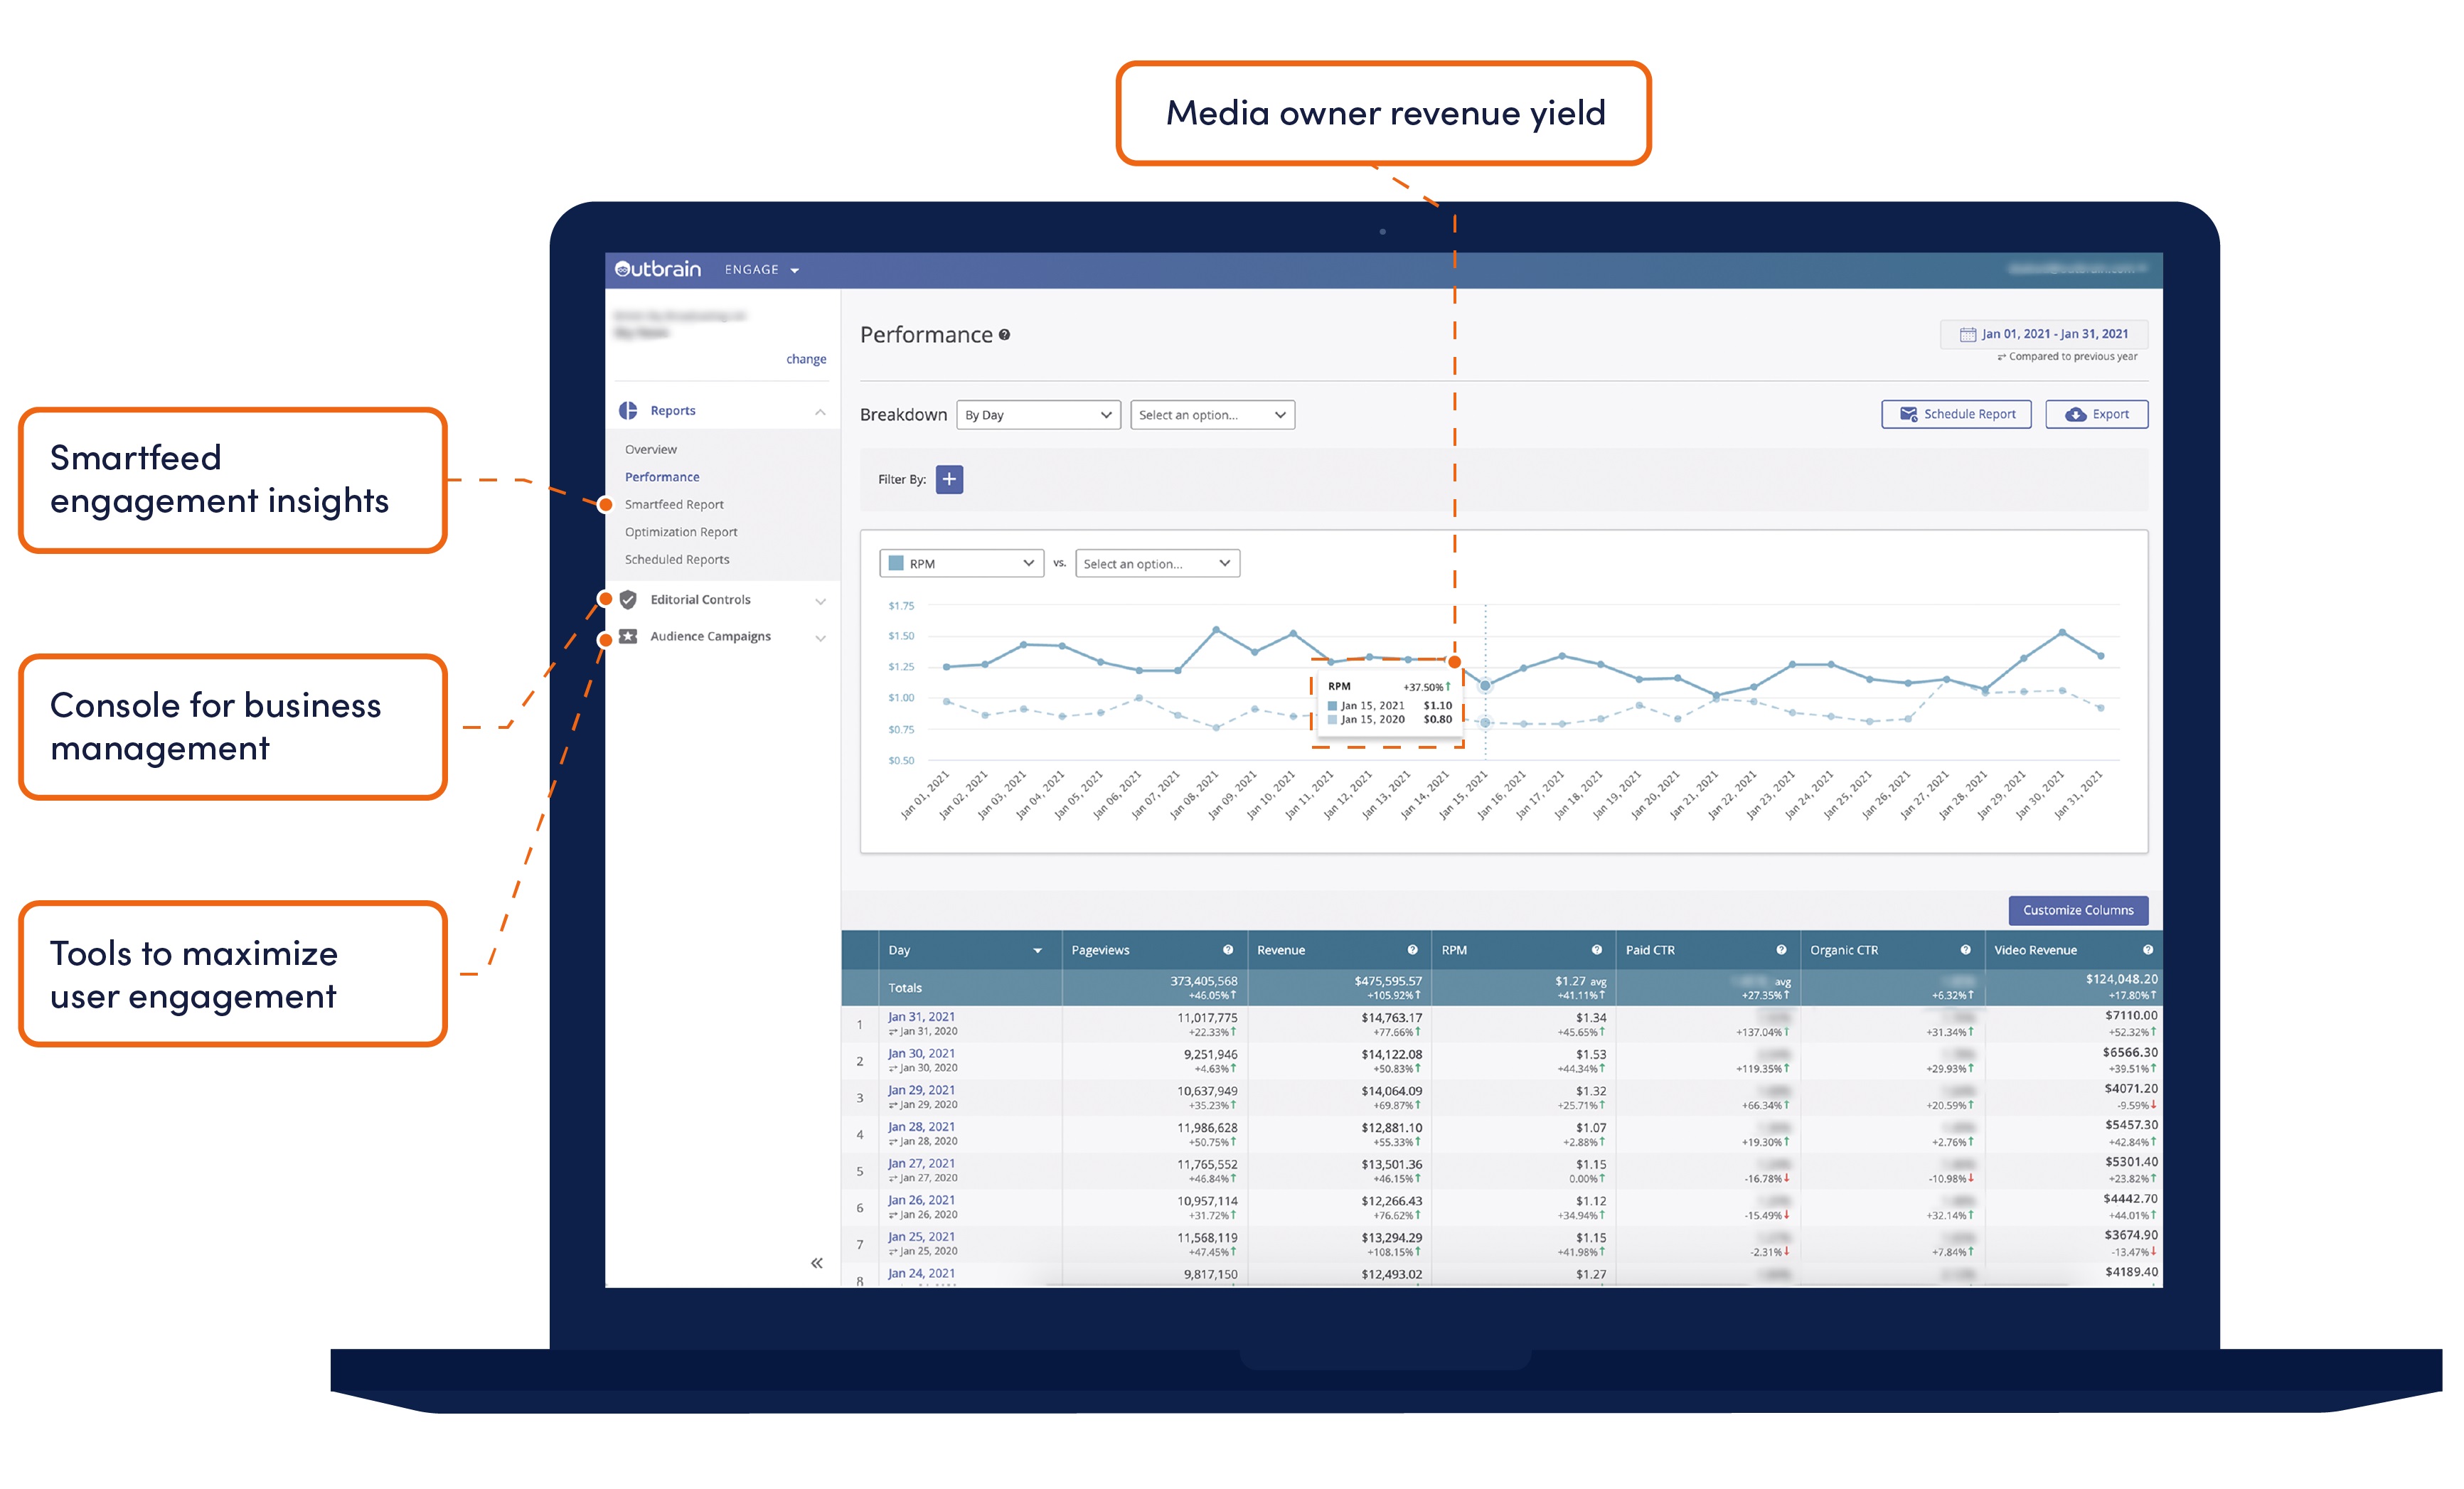
We provideOutbrain’s extensive platform provides a suite of solutions tailored specifically to meet the needs of media owners. Our comprehensive media owner suite brings advanced AI-backed prediction technology to the Open Internet, enabling our media partners with an ‘operating system’ that helps them manageto enhance their businesses through sustainable monetization, robust audience development, and grow their businesses. Our platform and products provide the data, scale, and technology capabilities to personalize the content experience, grow audiences, maximize user engagement and monetize content. We empowerefficient revenue diversification. This data-driven decision making allows our media partners enabling them to innovate their user experience by continuously introducing new features, capabilitiesposition themselves for success in 2024 and technologies that help optimize content delivery through personalized recommendations. We aggregate advertiser demand on behalf of media partners, providing them with critical monetization. Media partners benefit from the combined scale of technology, data and users, which we derive from the large volume of partners and advertisers that use our platform.
Our product suite for media partners, Outbrain Engage, encompasses multiple key technologies, enabling media partners to:beyond.
•Delight users through personalized feedsMonetization that Balances Content and data-driven recommendations.Ads: Outbrain facilitates content discovery and seamless monetization for our media partners on their own sites. Our sophisticated algorithms optimize the editorial recirculation of content, resurfacing high-quality material for consumers and driving longer sessions on the site. This approach also enhances the value of audience interactions, as consumers engaged with editorial content are more likely to interact with paid advertisements.
•Fueling Publisher Business with our Demand Strategy: Outbrain's branding platform, synthesizes billions ofOnyx by Outbrain™, is designed to maximize brand impact on the Open Internet. Collaborating with premium brands, we optimize for user attention to captivate audiences, boost engagement, and unlock increased monetization opportunities for media owners. This reinforces our value proposition to media owners and drives sustainable success for the industry.
•Customized Layouts: Outbrain’s AI-first platform delivers customized experiences. By leveraging machine learning to analyze audience behavior, contextual insights, and campaign performance data, points, including context,Outbrain dynamically optimizes our media partners’ digital properties for user experience. Outbrain’s AI-powered prediction engine surfaces the most relevant editorial content and our ad delivery is optimized for campaign performance to increase engagement and drive higher ROAS. Our Smartlogic technology dynamically selects the right experience and layouts according to the audience’s interests and behaviors to provide customized recommendations to users. Our Smartfeed product is a powerful solution forthe media partners to personalize content recommendation for users. The modular format of the feed enables media partners to customize the order, layout, and composition of content based on consumers’ context, interests and preferences. Our Smartlogic product dynamically adjusts both the arrangement and the formats of content delivered to a user within Smartfeed depending on the user’s preferences and our media partnerowner’s own key performance indicators (“KPIs”), ensuringfrom engagement to monetization.
•Engaging Experiences: We offer a more personalizedrange of formats for strong monetization, including premium pre-roll video ads contextually matched with relevant editorial video content, high-impact display creatives, standard IAB banners, and classic native formats. Combined with our prediction engine, these experiences provide reliable and stable monetization across the entirety of media owner digital properties. We are particularly focused on creating engaging feed experience.video experiences for both publisher audience development and advertiser purposes, to directly address the desire of consumers to “watch” rather than read: According to Insider Intelligence, “in 2023, it’s estimated that digital video comprised 52.3% of total time spent on screen, with entertainment and news as the preferred categories for that consumption.”
•MonetizeEfficient Audience Development: A significant proportion of the engagement created by our platform is with the content through customized, data-driven advertising. We deliver critical revenue thatof the media partners depend onpartner, which we refer to operate their business. Our platform and partner integrations support a wide range of ad formats that leverage unique data insights in order to maximize revenue. Our algorithms balance revenue yields with overall user experience and can be harnessed to support additional revenue initiatives.as an “organic experience.” Outbrain typically providesequips our media partners with closeessential tools and services to promote relevant organic editorial experiences to their audiences, improving audience engagement, recirculation, and monetization opportunities as a 100% fill rate ofresult. This offering is crucial to support continued audience acquisition and retention across the Open Internet.
•Powerful Revenue Diversification: Keystone by Outbrain™ technology extends ad inventory managed by Outbrain; we believe thatserver optimization capabilities beyond direct campaigns to various campaign types, allowing media owners to effectively diversify their revenue streams. With our total revenue optimization tool, media owners can execute subscription campaigns or optimize their own eCommerce and affiliate campaigns with Outbrain’s roledistinctive capability for driving engagement.
Outbrain serves as an end-to-end solution, working directly with botha technology partner for media owners, and advertisers, provides an economic advantage fortheir success is integral to ours. With journalism embedded in our partners. It is estimated thatDNA and a strong prioritization of supporting publishing since our inception, we possess a unique understanding of the industry. Our long-lasting partnerships, averaging seven years, currently extend to over 8,000 media owners typically keep 40-50% of ad spend after it has passed through the variety of ad tech and programmatic point solutions, compared to around 70% of spend from Outbrain’s advertisers being passed on toworldwide, with over $5 billion invested back into our media partners.
•Maximize user engagement. Our solution enables media partners to engage and retain their audience, helping them achieve multiple business outcomes such as time spent with their content, growth of digital subscriptions, app downloads, podcast engagement and more. In addition, our proprietary optimization engine is an always-on testing and optimization solution that continuously enhances page layouts for maximum engagement and value.
•Manage their business. Outbrain Engage provides media partners with a web-based dashboard enabling them to manage and control certain aspects of our platform including the content, formats, sources, frequency and categories of ads delivered on their properties. In addition, we provide precise advertiser and creative classification and filtering tools while strictly enforcing rigorous ad and content quality requirements. We operate at great scale, with hundreds of thousands of new ads uploaded to our platform daily. We have processes and technology to review ads before they go live on Amplify, our product suite for advertisers, either through our automated processes or manually, in a process designedbusiness model to ensure compliance with our strict content guidelines (which are available publicly on our website). We reject, on average, over 20%date, contributing to the sustainability of new ads submitted. Our extensive ad review processes and automated monitoring tools provide a further layer of quality control for media partners.the publishing industry.
We have thousands of media partner arrangements. We document most of our media partner arrangements using standard contract terms, which are comprised of a partner enrollment form, completed by media partners seeking our services, that hyperlinks to our publicly available standard partner distribution terms. The partner enrollment form contains the commercial terms of our arrangements: term length (initial, auto-renewal and notice period), the specified percentage of the revenue earned from implementing our technology on the media partner pages, the payment terms, as well as any additional terms agreed upon by the parties. The hyperlinked standard partner distribution terms include terms related to the license and use of the platform and technology, limitations on use of similar technologies, and customary terms and conditions. Other
In addition, certain media partner arrangements may also include additional commercial terms such as variable revenue percentages based on page view volume or revenue, or a guaranteed minimum rate of payment if the media partner meets certain additional criteria, including the implementation of advertisementsadvertisement spaces in defined placements.
In addition, certainplacements across the media partner arrangements may have additional commercial terms such as variable revenue percentages based on page view volume or revenue, access to customized reporting, further detail around use or limitations of similar services, and additional termination rights.sites. We also have arrangements with media partners on a programmatic basis such that the contract defines the mechanics to participate in the media partner’s real-time auction for access to the media partner’s inventory, with neither party committing to provide or bid on inventory. The commercial terms of these arrangements, such as revenue percentages, tiering of such percentages, guaranteed minimum rates of payment or programmatic are all factors, among others such as geography and size of the media partners, that contribute to our revenue mix.
Our Offering for Advertisers
Our platformWe provide a full-stack, cross-funnel advertising solution for advertisers of all sizes — from enterprise brands and the agencies who serve them, to direct-to-consumer brands, performance marketers, and beyond. We drive ROAS for advertisers by connecting them with audiences when they are most likely to pay attention, engage, and convert. This enables advertisers to not only reach, but drive real business outcomes from consumers across the Open Internet.
We have one-on-one interactions with consumers, at scale. We provide advertisers a powerful open web platform with significant reach and exclusive inventory, helping them connect with audiences on premium digital properties. Using Outbrainseveral proprietary buying platforms that enable our advertiser partners to deliver measurable results across each step of the purchase funnel. Amplify, our product suite for advertisers, we enable them to focus their campaigns on the users most likely to engage with their ads. Advertisers log into ourperformance advertising platform, directly to create campaigns, load or automatically generate creative assets, and manage their advertising activity on the open web, all while optimizing spend towarddrives engagement and conversion with native ad experiences. Zemanta, our demand-side platform (“DSP”), enables advertisers to optimize their media spend for engagement and outcomes with programmatic buying methods. In 2023, Outbrain launched our new branding platform, Onyx by Outbrain™, applying our AI prediction engine to a viewable, brand-safe environment that delivers greater consumer attention. We believe this presents a significant opportunity to both provide brands with more accountable methods of measurement for their upper and mid-funnel marketing objectives, while also providing the tailored, relevant experience consumers have come to expect.
Regardless of the buying channel advertisers choose to use, our product offerings provide differentiated value by delivering accountable results beyond views, such as attention, engagement, and conversions.
Our unique inventory is also programmatically accessible via leading third-party demand side platforms, which enables advertisers to access the value of Outbrain and Onyx environments on their platform of choice. Our proprietary buying platforms, described above, provide unique value through AI-powered campaign tools, unique formats, and targeting capabilities, all of which are designed to deliver better ROAS.
Outbrain Amplify providesOur offerings provide advertisers with:
•Seamless and non-intrusive ads.engaging ad experiences. We provide advertisers access toOutbrain features ad inventory and formats that benefits from high user attention by delivering ads thatblend seamlessly with the page experience, and are nativerelevant and engaging to the user experiencebased on their interests. Outbrain formats are available in a range of variations tailored to achieving specific engagement and performance goals. Onyx formats are designed for attention and are personalized based on our unique understandinglarge-format and high-impact in nature. Our suite of each user’s contextad experiences includes standard native, carousel and interests. We call our ads Smartads™ because they are component-based and dynamically match the look and feel of the content where they are placed. Our Smartads support a variety of formats, including text and image, video, interactive carousel, app install ads, outstream video, contextual pre-roll video, and other forms of direct response.high-impact display.
•Ads optimized for engagement.AI-powered prediction engine. Our deep and direct integration across the digital properties ofintegrations with thousands of media partners providesproperties provide us with a wealth of consumer interest and engagement data points. Our proprietary prediction engine ingests billions of data pertainingpoints each minute, utilizing AI and machine learning to user engagement and content consumption patterns. This enables us to deliver adsmake real-time ad serving decisions based on which opportunities are most likely to yield optimal results for the advertiser. This unique engine differentiates our useroffering beyond typical programmatic platforms, and consistently delivers ROAS for our advertisers.
•Performance tools driven by automation and AI. Use of AI to power better performance is part of our DNA. Our Conversion Bid Strategy (CBS) tool harnesses our wealth of engagement data and machine learning to optimize bid strategies to hit the advertiser’s desired campaign goals. CBS has proven so effective that approximately 75% of advertiser campaigns in 2023 utilized CBS to optimize campaign performance. We are also leveraging generative AI in dynamic new features like AI-powered headline generation, which simplifies ad creation and produces tailored, engaging content, elevating click through rates and overall performance.
•Unique interest graph,and contextual data. Our relationships with our media partners also provide us with a wealth of consumer interest and contextual data, which we use to build unique targeting products. Our data offering includes targeting offerings based on consumer interest segments, as well as other unique data-driven toolscomplex offerings that predict audience characteristics based on contextual and technologies. We believe thatinterest data. This supports our direct integrationsadvertisers reaching relevant audiences without reliance on third-party cookies, and exclusive partnerships are a differentiator when compared to most other online advertising solutions. Unlike other solutions, which often connect an advertiser to an available ad opportunity in a non-exclusive manner, typically mediated by other third-party platforms and technologies, our platform benefits from direct visibility into users’ overall engagement.powers greater performance.
•ResultsConcrete business outcomes. —optimize and pay for performance. OurThe Outbrain platform enables advertisers to optimize to specific campaign goals, and buy on a Cost-per-Click basis, guaranteeing engagement and delivering other measurable business outcomes. We maintain transparent performance metrics,outcomes beyond traditional ad views. This includes sales, conversions, traffic, sign-ups, leads, attention, and advertisersmore. Advertisers are able to view progress, manage ongoing campaigns and maximize ROAS. Our autopilot featureOnyx platform similarly optimizes towards an accountable outcome: attention. Onyx enables advertisers to setdeliver concrete ROAS with their goalsbranding campaigns, by providing high audience attention and KPIscorresponding incremental outcomes as a result, rather than ad views alone.
•Full-stack buying solutions. As referenced above, we provide a full suite of buying capabilities for advertisers. We own and allowsoperate our own proprietary performance platform, Amplify, to automatically optimize bid prices and budget allocations to hit these goals. Our Conversion Bid Strategy (CBS) product automates and improves the optimization process, allowing advertisers to select varied ROAS or conversion goals while our product automatically optimizes their campaigns to maximize performance towards the desired outcomes. Advertisers and their agencies wishing to transact through programmatic channels can use Zemanta, our programmatic platform, as well as otherour own DSP, Zemanta. We also connect with leading third-party DSPs via our own programmatic platforms.platform (SSP), providing agency holding companies and brands with programmatic access to our platform on their buying platform (DSP) of choice. We are one of the few Open Internet advertising companies with an end-to-end buying stack, including our own SSP, DSP, and performance buying platform. This enables advertisers to benefit from greater supply-path optimization, efficiency, and transparency — and enables a more sustainable advertising ecosystem.
•Quality. We work with established media partners, employing rigorous selection criteria, onboarding standards, controls, processes, and ongoing monitoring. As a result, our platform provides predominantly exclusive access to engaged usersconsumers in high quality content environments across many of the world’s most trusted media properties.
Advertiser Results Driven by Tailored Consumer Experience Our Personalized Feed Experience for Users—Smartfeed™
Smartfeed is our personalized feed solution that drives deeper discovery of content, products and services, longer sessions and better user engagement. Smartfeed powers the content feeds of thousands of digitalrelationships with media owners combining highly engaging multimedia formats, such as text and image, or video, with a diverse range of experiences and dynamic optimizations, continuously improving a personalized user experience.
Within Smartfeed,notably differentiate our offering for advertisers. Our Smartlogic product dynamically adjusts bothoptimizes the arrangement and the formatsformat of contentexperiences delivered to a user, depending on the user’s preferenceseach consumer, predicting which experiences they are most likely to be interested in and engage with. This ensures optimal performance for our media partner’s KPIs, ensuring a more personalizedadvertising partners, and engaging feed experience. It leverages machine learningallows them to personalize not just the content, but the entire feed composition from content experiences to the numberreach consumers at incremental, exclusive moments of high attention and format of ads, ordering and more.engagement.
Our Smartfeed technology supports a wide variety of ad creative formats, including:
Our Strengths
•Mission-critical partner for digital media owners.Exclusive, owned and operated inventory at scale across the Open Internet. We provide digital media partnersare one of very few platforms with mission-critical technology, an “operating system,”access to exclusive inventory on over 8,000 properties across the Open Internet. Our goal is to ensure that is designed to increase user engagement and content monetization. Thethe capabilities and revenue we provide to our media partners will enable many of our partnersthem to sustain their businesses and deliver quality journalism, in some cases as they continue a long-term transition away from historic reliance on offline ad revenue. We are a trusted partner for some of the world’s most prestigious digital media owners such as Asahi Shimbun, CNN, Der Spiegel, Le Monde, MSN, Sky Newsjournalism. The unique services and Sky Sports, and The Washington Post. The average tenure ofmission-critical partnership we provide to our top 20 media partners based onenable us to continually grow and protect our 2021 revenue,exclusive inventory. This provides advertisers with the ability to reach incremental audiences at new moments of attention and engagement — adding value to their media mix in an advertising ecosystem that is over seven years.congested with commoditized offerings.
•Unique, at-scale platformEnd-to-end tech stack for advertisers. Through our vastWe own and predominantly exclusive relationships with media partners, we provideoperate several buying platforms, allowing advertisers withto access to over a billion monthly unique users. The breadththe value of our audience reach enables advertisersunique inventory, data, and performance offerings in the ways they currently buy. Our proprietary performance platform allows us to deliver at-scale campaignssupport a high volume of diverse advertiser profiles, meeting a wide range of objectives through automation tools. In contrast, our SSP and DSP enable us to optimizeseamlessly work with enterprise brands and agencies as well as performance marketers. This provides us with growth opportunities across the performancefull catalog of their advertising spend.demand.
•Unique proprietary data and algorithms driving a virtuous cycle.Our direct integrations across our media partners’ properties provide us with a large volume of proprietary first-party engagement data, including context, userconsumer interest and behavioral signals. Leveraging our data and AI capabilities, we continuously optimize our algorithmsprediction engine to improve CTRconsumer engagement and advertiser ROAS. By delivering better results to advertisers, we are able to grow our business andcontinually enhance our platform which, in turn, helps us collect more dataperformance and further enhance our algorithms, driving better resultsvalue for our partners, helping us further grow our platform and our business.media owners.
•Well positioned for a privacy-centric world. By integrating directly with our media partners’ properties, we generate proprietary first-party data and are able to collect and infer valuable user related data and insights.insights, while respecting privacy regulations. With the upcoming discontinuation of third-party cookies and confusion about the efficacy of any new
approaches, marketers are looking for more enduring ways to reinstateunderstand their consumer vision. More than three quarters of advertisers claimed ‘robust first-party data’ is important when selecting video partners. In addition, ourcustomers. Our ability to use uniqueextract and leverage contextual signals enables us to deliver strong user engagement and advertiser ROAStailored advertising without the need to rely solelyrelying on user-based targeting, typically enabled through user tracking technologies that may not be available in the future.cookie-based targeting.
•History of successful innovation. We pioneered the category of engagement-driven consumer recommendations. Since then, we have developed our categorycore prediction capabilities into a scaled advertiser business that serves objectives at each stage of the marketing funnel. Additionally, we have evolved our AI prediction technology to optimize all media partner revenue goals and have been focused on innovation since our founding.maximize full-page monetization with video and other new experiences. To ensure seamlesscontinued product innovation, we operate as a continuous deployment engineering organization, releasing an averagehundreds ofover 300 code deployments daily. We plan to continue investing in our platform and its features.
•Scaled, profitable and diversified business. We have grown our business rapidly while achieving profitability, demonstratingprofitability. This demonstrates the powerscalability of our technology to new use cases, and the strength of our partner and advertiser relationships and the inherent operating leverage oflong-standing client relationships. In 2023 our model. In 2021, we achieved over $1 billion in revenue, $240.3 million in gross profit, and $272.1 million in Ex-TAC Gross Profit, reflecting year over year growth of 32.4%, 45.6% and 40.0%, respectively. In 2021, net income was $11.0 million, or 4.6% of gross profit, compared to a net income of $4.4 million, or 2.6% of gross profit, in 2020. Adjusted EBITDA more than doubled to $88.9 million, or 32.7% of Ex-TAC Gross Profit, in 2021 from $41.1 million, or 21.2% of Ex-TAC Gross Profit, in 2020. Our business is well diversified. In 2021 our top
twenty digital media partners accounted for approximately 49%50% of our revenue, with the largest accounting for 11%10% of our revenue. During the same year, our top twenty advertisers accounted for approximately 23%24% of our revenue, with the largest accounting for approximately 3%2% of our revenue.See Item 7. Management’s Discussion and Analysis of Financial Condition and Results of Operations under “Non-GAAP Reconciliations” for definitions and reconciliations of our non-GAAP financial measures, such as Ex-TAC Gross Profit, Adjusted EBITDA, and Adjusted EBITDA as a percentage of Ex-TAC Gross Profit, to the corresponding measures calculated in accordance with U.S. GAAP.
•Team and culture. Companies cannot effect the change they aspire to achieve without passionate, innovative employees. We rely on a global and diverse team of highly capablehigh-performing and results orientated employees to collaborate, innovate, and execute our vision—vision. In our ongoing commitment to empower high quality journalismfostering a robust company culture and content creation. Outbrain routinely conducts anonymousreinforcing the social fabric within our organization, we recognize the profound impact that these elements have on our overall success and sustainability. This commitment is manifested through strategic investments in initiatives that prioritize employee well-being, diversity, equity, and inclusion. We understand that a strong company culture not only enhances organizational cohesion but also contributes significantly to attracting and retaining top talent. Our continued investment in professional development programs, mentorship initiatives, and employee engagement surveys; accordingactivities underscores our dedication to the survey in mid-2021, which had an 86% employee participation rate, 90% ofnurturing a positive and inclusive work environment. By prioritizing these aspects, we aim to build a resilient culture that strengthens our employees responded that they would recommend Outbrain as a great place to work.
Our Growth Strategies
We believe that we are well positioned to capitalize on the continued growth of digital content consumption and digital advertising. We intendhave demonstrated the applications of our core AI prediction technology to continue investing innew arenas as consumer habits and advertiser needs change. We believe there is a significant opportunity to leverage our technology and innovationalgorithms to improvebring more relevant consumer experiences to the Open Internet, similar to those which have grown the popularity of social platforms. We believe that this will enable us to partner with traditional media properties in new ways, to apply our recommendationprediction engine and product offering, support our effortsoptimization technology to new media environments, and to grow relationships with existing and new media partners, and expand our advertiser footprint andthe share of wallet. We plan to pursue the following growth strategies:wallet across our scaled advertiser client base.
•Continuously improveGrow user engagement.engagement across the Open Internet. Improving the qualityabilities of our recommendationprediction engine has been an important driver of past growth and we expect it to remain a key driver of future growth. We believe that a great user experience drives engagement that compounds over time. Continued investment in our technology, artificial intelligence and machine learning capabilities drives a better user experience, resultingenable us to power consumer engagement for media owners in better CTR predictions and, in turn, higher monetization yield and revenue.new ways, as consumer habits change. We believe that we canimprovements to our existing prediction capabilities, as well as applications of our engine to new formats and media environments, will enable us to significantly grow our business solely by improving user engagement.revenue.
•Grow ourmedia owner partnerships and access to ad inventory.We have an extensive history of growing ad inventory by expanding our media partnerships and forming new ones.ones with an emphasis on premium media owners in the markets where we operate.
Existing partners. We have a strong track record of growth through the continuous expansion of existing media partnerships, as we launched products, features and formats that improved user engagement and retention, grew audiences, and improved monetization.partnerships. We plan to continue innovating as we seek to groware actively growing our adavailable inventory by implementing optimizations, creatingproviding solutions: (i) for new ad formats, seeking additional adplacements on our media partner properties, such as video and mid-article, and (ii) to create new experiences across our existing placements and pursuing opportunitiesfeeds. We strive to manage a larger proportion of our media partners’ digital properties, through both direct integrationsto ultimately become the preferred total revenue and programmatic relationships. In addition, we plan to expand our partnerships with software and hardware providers, enabling us to offer personalized content feedsfull-page optimization partner for browsers and mobile operating systems.media owners.
New partners. We also plan to pursue new partnerships with media owners to power new media environments that are attuned to grow next-gen audiences — as well as integrations with programmatic platforms that will provide access to new consumer segments, across apps and other environments. We plan to expand our reachpartnerships with original equipment manufacturers (OEMs), news aggregators, browsers, operating systems and other platforms enabling us to additional user segments, helping us grow our business.offer dynamic content feeds and advertising solutions for different platforms.
•Grow budgets from new and existing advertisers. We have developed an advertiser spend.offering that drives business outcomes across multiple steps of the marketing funnel. We plan to grow spendcontinue development of our offerings to drive growth from existing, as well as new advertisers by pursuing the following initiatives:a diverse set of advertiser types.
◦Further invest in our advertiser product suite.suite, developing cross-funnel solutions. In the past, improvements to our advertiser solutions have been a meaningful driver of growth for our business. With the release of Onyx by Outbrain, we increased our ability to access branding and video budgets. We plan to continue investinginvest in Amplifythe continuous improvement of our buying platforms and Zemantatechnology, including enhancements to our AI prediction engine, our DSP (Zemanta), and our performance platform (Amplify), in orderan effort to deliver better tools and technologies for advertisers onensure we can grow the share of budget from our platform.advertiser base from branding to performance objectives.
◦Continuously improve ROAS.ROAS through AI and automation. We aim to deliver better results for advertisers through improved CTR, as well asconsumer attention and click-through-rate (“CTR”) and outcome prediction. Our investments in AI and automation in pricingtools are designed to deliver better results for our advertisers, with less hands-on intervention. This will enable us to deliver better advertiser results and conversion optimization through our Conversion Bid Strategy product, helping us grow existingnew and newexisting advertisers’ share of wallet.
◦Grow brand spend.spend through development of Onyx creative experiences. We planThe rollout of Onyx by Outbrain enabled us to expand our existing suite of solutions aimed atserve brand advertisers. We believe thatawareness objectives and capitalize on growth in the video and high-impact advertising sectors. Our Brand Studio and the video experiences we will beare now able to captureprovide as a result of our acquisition of video intelligence AG (“vi”) in 2022 enable us to provide innovative creative solutions that deliver high attention. The addition of video experiences (including pre-roll, and outstream) to our platform presents a significant spend from new and existing advertisers by providing new capabilities, such as additional exclusive ad placements, new optimization solutions, and unique ad formats, amongst others.growth opportunity in video, which has not exceeded 10% of our revenue mix, with significant remaining headroom for growth into a higher yielding business.
◦Grow the numberAttract new types of advertisers. In addition to investments in our advertiser product and technology, we plan to investcontinue investing in sales and marketing initiatives aimed at attracting new types of advertisers, to our platform. We believe Zemanta’s programmatic offerings will continue to gain adoption amongst leading agenciessuch as enterprise brand advertisers. Our focus on premium media partnerships and brands,high-impact and that new programmatic demand partners willvideo formats enable us to continue to expand our advertiser footprint.form new business relationships with advertisers who traditionally have not spent with Outbrain.
◦Drive adoptionDeepen strategic value to media partners. The expansion of high impact ad formats. High impact ad formats such as video, content highlight reels, and interactive carousel represent a significantour demand business to service new objectives greatly increases the opportunity for our media partners. Onyx enables our media partners to improve monetization of existing inventory. We plan to expand our offerings and capabilities in order to drive continued adoption by advertisers of these formats, helping them reach more of their target audience and achieve their campaign goals, enabling us to grow our business. The additionbenefit from an entirely new catalog of video ad formatsand high-impact display demand, which is complementary and incremental to the dependable, year-round performance advertising demand we provide. By evolving our business to service advertiser objectives across the funnel, we are in tandem evolving our relationship with media owners to provide full-page, cross-demand monetization solutions. This is critical at a time when media owners are seeking dependable, diverse revenue. In addition, Keystone by Outbrain further broadens the revenue opportunity we can provide to our platformmedia owners — providing solutions to optimize total revenue across their site by optimizing affiliate revenue, e-commerce, events, subscriptions, and advertiser offering is evidence of the significant opportunity for growth and has already delivered strong returns. From 2018 to 2021, we grew video revenues from approximately 2% to approximately 8% of our annual revenue.
On January 5, 2022, we completed the acquisition of video intelligence AG (“vi”), a Swiss-based contextual video technology company for digital media owners. Through our acquisition of vi in the first quarter of 2022, we expanded our video offering to new formats and environments, including In-Stream video ads and connected TV (CTV) environments.more.
◦Acquisitions and strategic partnerships.We have a track record of successfully executing a number of acquisitions and partnerships, helping us efficiently expand our offerings, grow our business and grow our talent. In 2017, we acquired Zemanta, providing us with advanceda DSP and bidder that has enabled us to grow in a multitude of strategic areas (including the development of Onyx by Outbrain’s managed programmatic capabilities.offering). In 2018, we acquired AdNgin, an advanced user interface optimization platform.platform, which has been instrumental in developing our AI-backed media owner engine, Smartlogic. In 2019, we acquired Ligatus, a German-based native advertising and programmatic company. In January 2022, we acquired vi, providing us with an expanded video offering for advertisers and media owners.owners, enabling the creation of Onyx by Outbrain’s video suite. We intend to continue pursuingto opportunistically pursue partnership and acquisition opportunities that will enhance our technology or market presence and deliver more value to our partners and advertisers.
Our Competition
The digital advertising industry is highly competitive and fragmented. Many of our competitors provide only one element of the full demand offering we have now created. We believe we are in a differentiated position due to our ability to service advertiser objectives from branding to performance and provide media owners with full-page monetization as a result. We compete for advertising dollars and media owner partnerships with advertising technology platforms who have traditionally been performance focused, such as Criteo, Taboola, and RevContent. With the creation of our branding platform, Onyx and our programmatic tech stack, we also compete with companies such as Magnite, PubMatic, Taboola,Teads, and TripleLift. The Trade Desk, ViantOpen Internet category, which we and Xandr (Microsoft), as well asthe competitors listed above are placed within, also competes with large consumer-facing digital platforms with advertising technology capabilities,for ad dollars. These include companies such as Amazon, Facebook,Meta, TikTok, Google, and Twitter. X (formerly known as Twitter).
The key factors that enabledifferentiate us to compete effectively for inventory from digitalcompetitors and secure long-term media ownersowner partnerships as a result include:
•the (i) our unique media owner suite which includes audience engagement and revenue diversification offerings that provide valuable tools that extend far beyond monetization alone, and increasingly (ii) our ability to deliver competitiveoffer full-page monetization and engagement on media partner properties;
•trust, transparency and long-term alignment; and
•solutions, with an array of advertiser demand types from branding dollars to performance dollars, which are optimized by differentiated feedAI-backed Smartlogic technology.
The key factors that enable us to compete effectively for advertising dollars include:
•delivering high ROAS through (i) deep understanding of consumer interest and intent across editorial environments, as a result of our abilityunique media owner offering, (ii) utilization of our core AI prediction technology to identifyleverage this data to deliver better branding, consideration and engage relevant users;
•performance outcomes, (iii) access to massive audience reach;
•quality of inventory;scale on premium media owner properties across the globe; and
•comprehensive range of (iv) supply-path optimization by design, offering advertisers efficient, direct access to media owner inventory types, advertising formats and campaign tools.at scale.
Our Technology
We have designed our platform to process real-time content and advertising transactions quickly and efficiently at a massive scale. Our platform delivers on average over 1012 billion recommendations daily, in 20 languages. We designed our platform using a microservices-based architecture, which enables the rapid deployment of new features with high availability, reliability, and redundancy.
Our platform consists of the following key technology components:
•Infrastructure. To support our business needs, we operate our own proprietary cloud infrastructure.infrastructure, and also utilize other public clouds. Our globalproprietary infrastructure includes over 7,000 servers, with storage capacity exceeding several petabytes. Our servers are primarily located in three third-party data centers, on a co-location basis, in Secaucus, NJ, Sacramento, CA, and Chicago, IL. Each of our data centers is operated by a different vendor, in order to minimize the impact of any outage on our platform. While all three data centers actively serve recommendations to users,consumers, we are able to serve all of our traffic from two of the three data centers if needed. We utilize a global content delivery network (CDN), and dynamic acceleration, for additional performance optimization and redundancy. In 2022, we also started serving recommendations from a public cloud based in the Netherlands to several countries in Europe. We use architecture similar to our primary third-party data centers and deploy over two availability zones for high availability.
Our infrastructure is designed such that we do not have any known single point of failure at any level. Within each data center, we have load-balanced servers on each layer of the system, so that a failure in one server or component will not impact performance or availability. Some of these clusters are dedicated to handling incoming traffic and delivering content, including web servers, caches and real-time database applications. Other clusters are devoted to the data analytics and algorithm modeling involved in creating content recommendations. The design also includes load balancers, firewalls and routers that connect the components and provide connections to the Internet. In particular, we use software specifically designed for processing large data sets to provide real-time data analysis, the results of which are then fed back to refresh and improve our recommendation algorithms.
We monitor our system using several tools, both internal and external, to gauge our uptime and performance. We also use multiple layered security controls to protect our recommendation engine and our data assets, including software-based access controls for our source code and production systems segregated networks for different components of our production systems and centralized production systems management. We believe that the failure of any individual component will not affect the overall availability of our platform, having maintained an uptime of 99.9% from 2018 to 2021.2023.
•Data. One of the key benefits of our platform is the management, analysis, and structuring of valuable user engagement and advertising data.
◦Our data scale: We gather billions of data events per minute delivering over 1012 billion recommendations per day. On average,During 2023, we collect in excess of 80improved our data efficiency by reducing the overall terabytes of data collected per day, consisting ofwhile increasing overall click-through-rates by focusing on the most impactful data such as contextual signals, advertiser data, and user engagement data (typically clicks on recommendations). We leverage our data to improve our algorithms and prediction capabilities.
◦Our automated content index:To operate our platform, we have created our automated content index, comprising over 25 billion content elements. Our technology automatically classifies and analyzes content at a rate of over 1,500,0001 million pages a day in 20 different languages. We index content through RSS feeds and JavaScript triggers to continuously identify new content and changes to existing content. Our automated index deconstructs content into base elements including titles, images and topics in order to recombine the elements into targeting data and formatted recommendations and ads.
•Artificial Intelligence and Machine Learning. Our proprietary artificial intelligence and machine learning capabilities enable us to harness the vast volume of data we collect in order to effectively match usersconsumers to relevant content and ads based on our content index. AI is at the heart of our key prediction engine, which backs all of our advertiser and media owner offerings. Leveraging AI to ingest and analyze the billions of data points we access daily, and effectively utilizing them to make predictions that deliver better business outcomes, is a key tenet of our business. Our algorithms make over 1,000 click and conversion rate predictions per second, on average, before selecting which recommendations to present on each page view.
Our Data Flywheel
Sales and Marketing
We focus our sales and marketing efforts on supporting, advising, and training our media partners and advertisers, helping them optimize their useadvertisers. We strive to add value for our partners through education of the best uses of new metrics such as attention, as well as providing key insights around consumer engagement and interest which are accessible to us through our platform. We employ in-market sales teams across our markets, helping us attract premium digital media owners and advertisers to our platform.platforms, as well as global support hubs to manage small and medium clients. In addition, we have developed and currently utilize online acquisition channels to attract new advertisers, who we are able to onboard and serve in an automated manner, using self-serve tools and technologies.
Our sales teams educate prospective media owners, partners, and advertisers on the use, technical capabilities, and benefits of our platform. Our dedicated teams work with potential customers through the entire sale cycle, from initial contact to contract execution and implementation. Throughout the process, our teams provide guidance as to how our platform can optimize the value of a media partner’sowner’s audience or how an advertiser can reach relevant users.consumers. Additionally, following contract execution and implementation, our account management teams guide our media partners on how additional platform deployment and optimizations can deliver incremental monetization. We engage advertisers and their agencies in order to educate them on how to increase reach and ROAS using our solutions.
Our marketing team is focused on delivering strategies that drive efficient new media partner and advertiser acquisition, enhancingincreasing awareness of our brand and our evolving solutions, and educating the market in order to enhance our position as key industry thought leaders, supporting our sales teams, and increasing awareness of our brand.leaders.
Human Capital Resources
Much of our success can be directly attributed to our global team of technology, business, and data science experts who work outout of our 1715 locations worldwide. Outbrain comprisesis comprised of a diverse, intelligent and driven group of individuals who are passionate and excited to be leading the waycontinued innovation in which users discover things online.Open Internet technology and advertising.
Our culture and team are the most importanta critical asset in building and expanding our business. Our team identifies new problems to solve, builds solutions, optimizes and extends our infrastructure, and acquires and serves customers. We believe that our strong and diverse teams deepen customer relationships, promote innovation, and increase productivity. Our Culture Manifesto, available publicly on the Outbrain website, is one of many important expressions of the values and principles that reflect how we behave, collectively and individually.
Our people strategy revolves around creating employee experiences. We strive to foster deep employee engagement built upon personal development and achievement that is supported by continuous feedback, learning, and team building. As we continue growing our team, and become more diverse culturally and geographically, we want to make sure we retain a shared mission among the people that become part of our company.Company. In particular, there are certain characteristics that we seek out in our employees:
•Intelligent and productive. There are many great attributes companies can seek in the candidates they hire—academichire —academic degrees, deep industry expertise, hands-on work experience, etc. While these attributes are an important part of our screening process, we seek, above all else, a combination of smarts and a “get stuff done” attitude.
•Collaborative. We love hiring and nurturing professionals who are great at their craft. At the same time, we are cognizant that we are ultimately playing a team sport and we therefore look for people who strive to be amazing team players. A self-described “Superstar” or “Ninja” focused on personal status is not likely to fit our team, even if they might beare very good at their profession.
•Passionate. People who have a passion for something typically have that spark in their eyes when they engage in the work they love. They bring their best self to work, possess the desire to improve and learn, and focus on opportunities rather than obstacles. Through their passion, they set the tone for the rest of the team and become excellent examples for everyone to follow.
We also strive to make Outbrain diverse at all levels of the company,Company, and in all types of jobs. Our priority is to always hire and promote people based on qualifications and merit, and we believe that this approach does not conflict with the objectives of inclusion and empowerment. Our team consists of people from many different nationalities and cultures with different perspectives, opinions and ideas which we believe is undeniably powerful and ultimately drives shareholder value. We support employee-led employee resource groups ("ERGs"(“ERGs”), which foster a diverse and inclusive workplace. We currently have four ERGs: OB Good, OB Green, OB WE and OB4Equality,OB-4-Equality, focusing on social responsibility, environmental sustainability, women'swomen’s empowerment, and diversity equity and inclusion, respectively, all of which are open to people of all backgrounds.
As of December 31, 2021,2023, we had 1,016942 employees and contractors, 53% of whomcontractors. Based on where data is available, 49% were male, 47% were female and 47% of whom were female. 43.3%4% undisclosed. Approximately 40% of our workforce is located in Israel, 15.5%13% is located in the United States, 13% is located in Slovenia, and the remaining 41.2%34% is located inacross our other global offices. In March 2020, we transitioned to remote work, with selective offices returning on a hybrid basis where conditions related to Covid-19COVID-19 permitted. Based on feedback from the organization,In 2022, we planreturned to continue working based onour offices using a hybrid model, with employees working from both our office locations and their homes. As of September 2023, we formalized a hybrid schedule of three-days a week in office.
Intellectual Property
The protection of our technology and intellectual property is an important component of our success. We protect our intellectual property rights by relying on federal and state statutory and common law rights, foreign laws where applicable, and contractual restrictions. We seek to control access to our proprietary technology by entering into non-disclosure agreements with third parties and disclosure and invention assignment agreements with our employees and contractors.
We consider our trademarks, patents, copyrights, trade secrets, and other intellectual property rights to be, in the aggregate, material to our business. In addition to our intellectual property rights, we also consider the skills and ingenuity of our employees and the functionality and frequent enhancements to our solutions to be contributors to our success. We believe our platform would be difficult, time consuming, and costly to replicate. We protect our competitive technology position through innovation and by continually developing new intellectual property.
Outbrain has built an extensive intellectual property portfolio to date. This portfolio includes 18 granted U.S. utility patents, 35 granted U.S. design patents, and 1415 European registered community designs and 14 UK registered designs.
Regulatory Environment
We are subject to privacya variety of laws and regulations governingin the United States and abroad that involve matters central to our business, many of which are still evolving and being tested in courts, and could be interpreted or enforced in ways that could harm our business. These laws and regulations involve matters including privacy, use of artificial intelligence, data use, data protection and personal information, content, intellectual property, advertising, marketing, distribution, data security, data retention and deletion, data localization and storage, data disclosure, competition, protection of minors, consumer protection, accessibility, taxation, environmental reporting and economic or other trade controls including sanctions, and securities law compliance. Foreign laws and regulations can impose different obligations, or penalties or fines for non-compliance, or be more restrictive than those in the United States. More generally, the application, interpretation, and enforcement of applicable laws and regulations are often uncertain, particularly in the new and rapidly evolving industry in which we operate, and may be interpreted and applied inconsistently from jurisdiction to jurisdiction, industry or size of company. For example, the Digital Services Act (DSA) in the European Union, which became enforceable in February 2024, is aimed at protecting users and the digital space from harmful and illegal content. Although we have not been named a “Very Large Online Platform” under the DSA, we are required to meet certain content transparency requirements which require technical and compliance changes. The DSA includes significant penalties for non-compliance. In addition, the rising global adoption of artificial intelligence technologies has resulted in the European Union reaching a provisional political agreement on the Artificial Intelligence Act, 2023 (“EU AI Act”).The EU AI Act imposes multiple new requirements on the utilization of generative artificial intelligence technologies which may adversely impact our business practices and affect our ability to adopt new technologies.
Orders issued by, or inquiries or enforcement actions initiated by, government or regulatory authorities have caused us, and in the future will likely continue to cause us, to incur substantial costs and expose us to civil and criminal liability (including liability for our personnel) or penalties (including substantial monetary remedies). Such orders, inquiries or enforcement actions could be materially adverse to our business, result in negative publicity and reputational harm, divert resources and the time and attention of management from our business, or subject us to other structural or behavioral remedies that adversely affect our business.
We have been subject to significant legislative and regulatory developments in the past, and proposed or new legislation and regulations could significantly affect our business in the future. For example, we implemented a number of changes and controls as a result of requirements under the General Data Protection Regulation ((EU) 2016/679) (GDPR), and may implement additional changes in the future. The GDPR also requires submission of personal data breach notifications to our lead European Union privacy regulator, and includes significant penalties for non-compliance with the notification obligation as well as other requirements of the regulation. The interpretation of the GDPR is still evolving and draft decisions of regulators are subject to review by other European privacy regulators as part of the GDPR’s consistency mechanism, which may lead to significant changes in the final outcome of such investigations. As a result, the interpretation and enforcement of the GDPR, as well as the imposition and amount of penalties for non-compliance, are subject to significant uncertainty. In addition, the United Kingdom, Brazil, Japan, Singapore and other countries have enacted similar data protection regulations imposing data privacy-related requirements on products and services offered to users in their respective jurisdictions that could increase the cost and complexity of delivering our services, cause us to cease the offering of our products and services in certain countries, or result in fines or other penalties. The California Consumer Privacy Act, as amended by the California Privacy Rights Act, and similar laws recently enacted by other states also establish certain transparency rules and create certain data privacy rights for users. In addition, the European Union’s ePrivacy Directive and national implementation laws impose additional limitations. Changes to our products or business practices as a result of these or similar developments have in the past adversely affected, and may in the future adversely affect, our business and adds complexity to our and our partner’s compliance programs.
We are also subject to evolving laws and regulations that dictate whether, how, and under what circumstances we can transfer, process and/or receive certain data that is critical to our operations, including the collection use,of data and sharingthe data shared between countries or regions in which we operate. If we are unable to collect data and/or transfer data between and among countries and regions in which we operate, it could affect our ability to provide our services or our ability to target ads, which could adversely affect our financial results. For example, in July 2023 the E.U.-U.S. Data Privacy Framework (“DPF”), a voluntary certification program for the transfers of consumer data. personal data from the EU to the U.S., became effective. The DPF replaced the prior transfer framework that was invalidated in July 2020 by the Court of Justice of the European Union. Though we have been certified under the DPF, these mechanisms, including the Standard Contractual Clauses, for transfers of data continue to face legal challenges and invalidation of such schemes or restrictions on data transfers could materially and adversely affect our business, financial condition, and results of operations.
Interest-based advertising specifically, or the use of data to draw inferences about a consumer’s interests and deliver relevant advertising to that consumer, has comeis under increasing scrutiny by legislative bodies, regulatory bodies, self-regulatory bodies, privacy advocates, academics, and academicsthe press in the United States and abroad. In particular, much of this scrutiny has focused on the use of cookies and other tracking technologies that collect or aggregate information regarding consumers’ online browsing and mobile app activity. Our Company, our media partners and advertisers rely upon large volumes of such data collected primarily through cookies and other tracking technologies. It is essential that we monitor legal requirements and other developments in this area, both domestically and globally, maintain a robust privacy and security compliance program, anticipate the evolution of regulations applicable to us and engage in responsible privacy practices, including providing consumers with notice of the types of data we collect, how we collect it, with whom we share it, how we use that data to provide our solutions and how consumers can exercise their rights and personalization choices. We typically collect IP addresses and device identifiers that are considered to be personal data or personal information under the privacy laws of some jurisdictions or otherwise may be the subject of current or future data privacy legislation or regulation. The definition of personally identifiable information, personal information, or personal data varies by jurisdiction and continues to evolve in ways that may require us to adapt our practices to comply with laws and regulations related to the collection, storage, use, and sharing of consumer data. As a result, our technology platform and business practices must be assessed regularly against a continuously evolving legal, regulatory, and technology landscape.
A growing set of privacy regulations have introduced complexity regarding the collection, use, and transmission of consumer data to the digital advertising ecosystem. We have implemented a number of technology innovations, process enhancements, and industry solutions in response to increased obligations, including adopting the advertising industry’s technical and policy solutions that form compliance standards.
Additionally, compliance with our privacy policy, privacy notices and our general consumer data privacy and security practices are subject to review by the Federal Trade Commission, which may bring enforcement actions to challenge allegedly unfair and deceptive trade practices, including the violation of privacy policies and misrepresentations or material omissions therein.
Certain State Attorneys General in the United States may also bring enforcement actions based on applicable state laws or federal laws that permit state-level enforcement. California enacted legislation, the California Consumer Privacy Act, along with related regulations (together, the “CCPA”), which became effective in 2020. The CCPA creates individual privacy rights for California residents and increases the privacy and security obligations of businesses handling personal data. The CCPA is enforceable by the California Attorney General and there is also a private right of action relating to certain data security incidents. The CCPA generally requires covered businesses to, among other things, provide disclosures to California consumers and afford California consumers the ability to opt-out of the sharing of personal data between parties, a concept that is defined
broadly, and behavioral advertising triggers such requirements under the CCPA. The CCPA or subsequent guidance on our business or operations may require us to further modify our data processing practices and policies and to incur substantial costs and expenses in an effort to comply. Decreased availability and increased costs of information could adversely affect our ability to meet our advertisers’ requirements and could have an adverse effect on our business, results of operations, and financial condition. Additionally, starting in January 2023, the California Privacy Rights Act (“CPRA”), which was voted into law in November 2020 and amends the CCPA, imposes additional data protection obligations on certain businesses doing business in California, including abiding by additional consumer rights and limiting the use and processing of personal data including sensitive data. In addition, the CPRA explicitly requires businesses to provide consumers with the right to opt-out of sharing of personal data with third parties for behavioral advertising. Accordingly, the CPRA could have an adverse effect on our business, results of operations, and financial condition.
The CCPA has led to “copycat” laws in other states across the country, such as in Virginia and Colorado, and likely in Connecticut, Florida, New York, Oklahoma, and Washington. This legislation may add additional complexity, variation in requirements, restrictions, and potential legal risk, require additional investment in resources to compliance programs, and could impact strategies and availability of previously useful data and could result in increased compliance costs and/or changes in business practices and policies. Such new privacy laws add additional complexity, requirements, restrictions, and potential legal risk, require additional investment in resources such as compliance programs, and could impact trading strategies and availability of previously useful data.
Outside of the United States, our privacy and data practices are subject to regulation by data protection authorities and other regulators in the countries in which we do business. The use and transfer of personal data in member states of the European Union is currently governed under the GDPR, which grants additional data protection rights to consumers, such as deletion and portability, and generally prohibits the transfer of personal data of EU subjects outside of the EU, unless the party exporting the data from the EU implements a compliance mechanism designed to ensure that the receiving party will adequately protect such data. The GDPR establishes significant potential liabilities for certain data protection violations, which may result in fines up to the greater of €20 million or 4% of an enterprise’s global annual revenue. Despite GDPR purportedly harmonizing data protection laws across the European Union, continuously evolving interpretation and enforcement by member states requires regular review of the legal and regulatory landscape. The United Kingdom, previously part of the European Union and subject to the GDPR, may also amend its data protection regime, which could add more complexity to the regulatory landscape and our operations in Europe.
We previously relied upon the EU-U.S. Privacy Shield framework (the “Privacy Shield framework”) to transfer personal data of EU subjects to the United States. The Privacy Shield framework was declared invalid by the CJEU on July 16, 2020. In the same judgment, the CJEU upheld the adequacy of the standard contractual clauses, a standard form of contract approved by the European Commission as an adequate personal data transfer mechanism, and a potential alternative to the Privacy Shield framework, both of which were used by Outbrain, but it made clear that reliance on the standard contractual clauses alone may not necessarily be sufficient in all circumstances and cast doubt on their future use. The use of standard contractual clauses for the transfer of personal data specifically to the United States remains under review by a number of European data protection supervisory authorities.
Furthermore, the EU is currently in discussions to replace the ePrivacy Directive (commonly called the “Cookie Directive”) with the ePrivacy Regulation that governs the use of technologies that collect, access, and store consumer information and may create additional compliance burdens for us in Europe.
Further, other jurisdictions have proposed or enacted legislation that closely track the concepts, obligations, and consumer rights described in the GDPR, including Brazil’s General Data Protection Law, the Japanese APPI and Singapore’s Personal Data Protection Act 2020. The laws that have passed are being enforced by local authorities. The enactment of new proposed laws is gaining momentum and adds additional complexity to our and our partners’ compliance programs.
Beyond laws and regulations, we are also members of self-regulatory bodies that impose additional requirements related to the collection, use, and disclosure of consumer data. We are members in good standing of the Network Advertising Initiative (“NAI”)(NAI), an association dedicated to responsible data collection and its use for digital advertising. We adhere to the NAI Code of Conduct, for Web and Mobile, along with the IAB Self-Regulatory Principles for Online Behavioral Advertising, and the IAB Europe OBA Framework. We are also Trustworthy Accountability Group (“TAG”) Brand Safety Certified. We are participants of, and adhere to, the Self-Regulatory Principles set forth byin the Digital Advertising Alliance and the European Interactive Digital Advertising Alliance.
UnderAlliance and adhere to the requirements ofSelf-Regulatory Principles set forth by these self-regulatory bodies, in addition to other compliance obligations, we provide consumers with notice via our privacy policies about our use of cookies and other tracking technologies to collect consumer data, our use of consumer data to deliver interest-based ads, and consumers’ opt-out choices. We also allow consumers to opt-out from the use of data we collect for purposes of interest-based advertising through mechanisms described in our privacy policies available on our website.organizations. Some of these self-regulatory bodies have the ability to review or sanction members or participants, which could result in penalties and cause reputational harm. Additionally, some of these bodies might refer violations of their requirements to the Federal Trade Commission or other regulators.
For additional information regarding the current regulatory environment and how it may impact us, see Item 1A. “Risk Factors” under “Risks Relating to Legal or Regulatory Matters” included in this Report.
Security
Being a trusted partner is a key value for us and, as such, cyber security is an ongoing commitment. Our dedicated cyber security team has implemented industry best practices and standards including, but not limited to, ISO 27001, ISO 27017, ISO 27032, Cloud Security Alliance Star level 1, and PCI-DSS SAQ A-EP, SOC 2 data centers.
Our products are designed with security, and privacy, at the forefront. We maintain tight controls over the personal data we collect, encrypting it where necessary, and retaining it in firewalled and securedour databases with strictly limited and controlled access rights, to ensure it is secure while utilizing advanced monitoring over our environment. All traffic to and between our data centers is encrypted, along with all sensitive configurations, while our users and customers have their passwords hashed.
Secure advertising is a building block of user trust. In order to provide secure ads, we integrated an advanced industry leading third-party technology to scan live ads looking for potential security violations either in the ads themselves or on the pages to which they directly link. Combined with internally developed capabilities and our content review process we are tackling both malicious ads and the bad actors behind them.
We constantly strive to understand what we have yet to discover by running an exhaustive security testing framework, including scanning all internal and external assets for vulnerabilities, utilizing multiple third-party security testing teams every year, and running a bug bounty program with more than 300 security researchers.
Providing a clean, non-fraudulent premium network for publishers,media owners, advertisers and consumers is a top priority at Outbrain. Our dedicated anti-fraud team monitors our platform to identify and investigate unusual web traffic patterns. We detect, block and prevent fraudulent web traffic by using both internal and external third-party TAGthird-party TAG Anti-Fraud certified solutions. We have been a TAG-verifiedTrustworthy Accountability Group (TAG) Brand Safety Certified member since 2018. We are also adopting the implement certain Media Rating Council Invalid Traffic Detection and Filtration Standards in our internal fraud detection technological ecosystem.
Item 1A. Risk Factors
An investment in our shares of common stock involves a high degree of risk. You should consider carefully the risks described below and all other information contained in this Report, including in the “Note About Forward-Looking Statements,” the section titled “Management’s Discussion and Analysis of Financial Condition and Results of Operations,”Operations” (“MD&A”), and our audited consolidated financial statements and the accompanying notes included elsewhere in this Report. If any of the following risks actually occurs,occur, our business, financial condition and results of operations could be materially and adversely affected. In that event, the trading price of our shares of common stock would likely decline and you might lose all or part of your investment.
Risk Factor Summary
The following is a summary of some of the principal risks we face:
•Our revenue and results of operations are highly dependent on overall advertising demand and spending and traffic generated by our media partners;
•The impact on advertising demand and spend of factors such as the continuation or worsening of unfavorable economic or business conditions or downturns and instability in the financial markets;
•A failure to grow or to manage growth effectively may cause the quality of our platform and solutions to suffer, and may adversely affect our business, results of operations, and financial condition;
•Continued growth in our business may place demands on our infrastructure and resources;
•Our research and development efforts may not meet the demands of a rapidly evolving technology market;
•Loss of media partners could have a significant impact on our revenue and results of operations;suffer;
•Our sales and marketing efforts may require significant investments and, in certain cases, involve long sales cycles;
•Our research and development efforts may not meet the demands of a rapidly evolving technology market;
•The digital advertising industry is intensely competitive and we must effectively compete against current and future competitors;
•Loss of media partners could have a significant impact on our revenue and results of operations;
•Growth in our business may place demands on our infrastructure and resources;
•The failure of our recommendation engine to accurately predict user engagement may adversely affect our business, results of operations, and financial condition;engagement;
•If the quality of our recommendations deteriorates, or if we fail to present interesting content to our users, we may experience a decline in user engagement, which could result in the loss of media partners;
•The digital advertising industry is intensely competitive, and if we do not effectively compete against current and future competitors, our business, results of operations, and financial condition could be adversely affected;
•Limitations on our ability to collect, use, and disclose data to deliver advertisements;
•FailuresOur failure or the failure of third parties to protect our sites, networks and systems against security breaches, or otherwise to protect the confidential information of us or our partners;
•Outages or disruptions that impact us or our service providers, resulting from cyber incidents, or failures or loss of the hardware, software and infrastructure on which we rely, or security breaches, could adversely affect our business;infrastructure; and
•Political and regulatory risks in the various markets in which we operate;operate and the challenges of compliance with differing and changing regulatory requirements.
Risks Related to Outbrain and Outbrain’s Industry
Our revenue and results of operations are highly dependent on overall advertising demand and spending in the markets in which we operate. Factors that affect the amount of advertising spending, such as economic downturns, and unexpected events or events outside of our control, can make it difficult to predict our revenue and could adversely affect our business, results of operations, and financial condition.
Our business depends on the overall advertising demand for advertisingand spending in the markets in which we operate and on the business trends of our current and prospective media partners and advertisers. Macroeconomic factors in the U.S. and foreign markets, could cause advertisers to reduce their advertising budgets, including instability in political or market conditions, as well as adverse economic conditions and general uncertainty about economic recovery or growth, particularly in North America, EMEA (Europe, Middle East and Africa), and Asia, where we conduct most of our business, as well as instabilitycould result in, political or market conditions generally. Given global supply chain issues, and inflationary pressures, certain advertisers may not have readily accessible inventory to merit marketing expenditures. Our business may also be negatively impacted by the Ukraine-Russia conflict, as geopolitical concerns may resultresulted in, conservative approaches by advertisers and media owners when allocating budgets and ad inventory, respectively. Additionally,respectively, and reductions in advertising demand and spend.
The continued volatile macroeconomic environment, with variables such as the Russia-Ukraine and Israel-Hamas wars, general unrest in Europe and the Middle East, bank failures, inflation, and U.S. interest rates, has impacted certain categories of our service providersadvertisers. These conditions have been and may be further affected by the conflict which may in turn adversely impacted us and could, if they continue or worsen, adversely impact us. Reductionsus in overallthe future, including if our advertisers were to reduce or further reduce their advertising spending as a result of any of these factors.
We continue to monitor our operations, and the operations of those in our ecosystem (including media partners, advertisers and agencies). However, these conditions, whether resulting from the factors described above or due to the occurrence of other unanticipated events, could make it difficult for us, our media partners, advertisers and agencies to predict ouraccurately forecast and plan future performance.business activities and could cause a reduction or delay, or further reduction or delay, in overall advertising demand and spending. The occurrence of unforeseen events, like the COVID-19 pandemic, conflicts and wars, and other macroeconomic factors that affect advertising demand may have a disproportionate impact on our revenues and profitability in certain periods and could adversely affect our business, results of operations, and financial condition.
In order to meet our growth objectives, we will need to continue to innovate, seek to have advertisers and media partners adopt our expanding solutions, and extend our reach into evolving digital media platforms. If we fail to grow, or fail to manage our growth effectively, the quality of our platform and solutions may suffer, and our business, results of operations, and financial condition may be adversely affected.
Our growth plans depend upon our ability to innovate, attract advertisers and digital media owners to our solutions to buy and sell new inventory, and expand the use of our solutions by advertisers and media partners utilizing other digital media platforms and video. Our business model may not translate well into emerging forms of advertising due to market resistance or other factors, such as evolving regulatory restrictions, and we may not be able to innovate successfully enough to compete effectively.
The advertising technology market is dynamic, and our success depends upon our ability to develop innovative new technologies and solutions for the evolving needs of sellers of digital advertising, including websites, applications and other media partners, and buyers of digital advertising. We also need to grow significantly to develop the market reach and scale necessary to compete effectively with large competitors. This growth depends to a significant degree upon the quality of our strategic vision and planning. The advertising market is evolving rapidly, and if we make strategic errors, there is a significant risk that we will lose our competitive position and be unable to achieve our objectives. The growth we are pursuing may itself strain the organization, harming our ability to continue that growth, and to maintain the quality of our operations. If we are not able to innovate and grow successfully, our business, results of operations, financial condition and the value of our company may be adversely affected.
The continued growthGrowth in our business may place demands on our infrastructure and our operational, managerial, administrative, and financial resources.
Our success will depend on our ability to manage growth effectively. Among other things, this will require us at various times to:
•strategically invest in the development and enhancement of our platform and data center infrastructure;
•manage multiple relationships with various media partners, advertisers, and other third parties;
•extend our operating, administrative, legal, financial, and accounting systems and controls;
•increase coordination among our engineering, product, operations, go-to-market and other support organizations; and
•recruit, hire, train, and retain experienced personnel.
If we do not manage our growth well, the efficacy and performance of our platform may suffer, which may harm our reputation and reduce demand for our platform and solutions. Failure to manage our growth effectively may have an adverse effect on our business, results of operations, and financial condition.
Our sales and marketing efforts may require significant investments and, in certain cases, involve long sales cycles, and may not yield the results we seek. Even if our sales and marketing efforts are successful, there can be no assurance that our media partners will be able to generate sufficient traffic.
Our sales and marketing teams educate prospective media partners and advertisers about the use, technical capabilities, and benefits of our platform. Our sales cycle (with both media partners as well as with certain advertisers and agencies) can take
significant time from initial contact to contract execution and implementation. We may not succeed in attracting new media partners despite our significant investment in business development and sales and marketing, and it is complex to predict the extent of the revenue that will be generated with a media partner. We may not succeed in expanding relationships with existing media partners and advertisers, despite our significant investment in sales, account management, marketing, and research and development and it is difficult to predict when additional products will generate revenue through our platform, and the extent of that revenue. Programmatic partners tend to have a long sales cycle with distinct technical and integration requirements, as well as a separate ongoing partner management process. If we are unsuccessful in our sales and marketing efforts, our results of operations and prospects will be adversely affected.
Even if our sales and marketing efforts are successful, there can be no assurance that the properties of our media partners will be able to generate sufficient user interest, traffic or engagement. The ability of our media partners to maintain or grow their digital properties is often outside of our control, may be significantly impacted by broader media consumption trends, and may result in stagnant or declining ad inventory availability, which could negatively impact our results of operations and prospects.
Our research and development efforts may not meet the demands of a rapidly evolving technology market resulting in a loss of customers, revenue, and/or market share.
We expect to continue to dedicate significantconsiderable financial and other resources to our research and development efforts in order to maintain or improve our competitive position. However, investing in research and development personnel, developing new solutions and enhancing existing solutions is expensive and time consuming. Our research and development activities may be directed at maintaining or increasing the performance of our recommendations, developing tools that improve productivity or efficiency, or introducing new solutions. However, there is no assurance that such activities will result in significant new marketable solutions, enhancements to our current solutions, design improvements, additional revenue or other expected benefits. Furthermore, there is no assurance that our efforts to promote new or enhanced solutions, like video solutions or new advertiser tools, will be successful. If we are unable to generate an adequate return on our investment with respect to our research and development efforts, our business, results of operations, and financial condition may be adversely affected.
Loss of large media partners could have a significant impact on our revenue and results of operations.
A significant portion of our recommendations are placed on web pages and mobile applications of a small number of our media partners. Certain partners may reduce or terminate their business with us at any time for any reason, including as a result of changes in their financial condition or other business circumstances, such as a change in strategy or model by which they monetize their properties. In 2021, our largest media partner accounted for approximately 11% of our revenues, whereas in 2020 and 2019, each of our two largest media partners accounted for approximately 10% of our revenues. If a large media partner reduces or terminates its relationship with us, or if several small or medium-sized media partners terminate their
relationships with us, we may not have access to sufficient media partners to satisfy demand from advertisers resulting in lower revenues. In addition, losing key media partners may lead advertisers to seek alternate advertising solutions, which could slow our growth. A media partner may terminate its relationship with us and enter into a relationship with a competitor, and to the extent that becomes a long-term relationship, reestablishing our relationship with that media partner may prove difficult. As discussed below, establishing relationships with media partners may involve long sales cycles. As a result, the loss of a significant media partner relationship or of several small or medium-sized media partner relationships could have a material adverse impact on our business, results of operations and financial condition.
Our sales and marketing efforts may require significant investments and, in certain cases, involve long sales cycles, and may not yield the results we seek. Even if our sales and marketing efforts are successful, there can be no assurance that our media partners will be able to generate sufficient traffic.
Our sales and marketing teams educate prospective media partners and advertisers about the use, technical capabilities, and benefits of our platform. Our sales cycle (with both media partners as well as with certain advertisers and agencies) can take significant time from initial contact to contract execution and implementation. We may not succeed in attracting new media partners despite our significant investment in business development, sales and marketing and it is complex to predict the extent of the revenue that will be generated with a media partner. We may not succeed in expanding relationships with existing media partners and advertisers, despite our significant investment in sales, account management, marketing, and research and development and it is difficult to predict when additional products will generate revenue through our platform, and the extent of that revenue. Programmatic partners tend to have a longer sales cycle with distinct technical and integration requirements, as well as a separate ongoing partner management process. If we are unsuccessful in our sales and marketing efforts, our results of operations and prospects will be adversely affected.
Even if our sales and marketing efforts are successful, there can be no assurance that the properties of our media partners will be able to generate sufficient user interest, traffic or engagement. The ability of our media partners to maintain or grow their digital properties is often outside of our control and may result in stagnant or declining ad inventory availability, which could negatively impact our results of operations and prospects.
Our revenue growth and future prospects will be adversely affected if we fail to expand our advertiser relationships.
Our revenue growth depends on our success in expanding and deepening our relationships with existing advertisers. Our growth strategy is premised in part on increasing spend from existing advertisers. In order to do so, we must be able to demonstrate better results for our advertisers with increased user engagement and ROAS, among other things. We do not have long-term commitments from our advertisers. We seek to increase the number of advertisers and to reach new advertisers. Attracting new advertisers and expanding existing relationships with our advertisers requires substantial effort and expense. In particular, large advertisers with well-established brands may require us to spend significant time educating them about our platform and solutions. It may be difficult and time consuming to identify, sell and market to potential advertisers who already allocate their budgets to large competitors and who expect to see a similar return on investment before diversifying or allocating a portion of their advertising budgets to us.
As new advertisers spend in our network or as advertisers allocate greater budgets to our platform, our credit loss exposure may increase over time and may exceed reserves for such contingencies. As we expand the application of our solutions, we increasingly depend on media agencies to assist advertisers in planning and purchasing advertising for brand marketing objectives, such as preference shift and brand awareness. We typically experience slow payment cycles by advertising agencies, as is common in our industry, and in some instances, if the advertiser does not pay the agency, the agency is not liable to us, and we must seek payment solely from the advertiser. If we are unsuccessful in developing new advertiser and agency relationships and maintaining and expanding our existing relationships, our results of operations and prospects will be adversely affected.
The failure of our recommendation engine to accurately predict user engagement may adversely affect our business, results of operations, and financial condition.
The success of our recommendation engine depends on the ability of our proprietary algorithms to predict the likelihood users will engage with our recommendations and on the quality of our data assets. We need to continuously deliver satisfactory results for users, media partners and advertisers in order to maintain revenue, which, in turn, depends in part on the optimal functioning of our platform and solutions. Therefore, a failure of our recommendation engine to accurately predict user engagement could negatively affect our results of operations and revenue.
If the quality of our recommendations deteriorates, or if we fail to present interesting content to our users, we may experience a decline in user engagement, which could result in the loss of media partners.
Our technology selects the recommendations that are displayed to users on the online properties of our media partners. Our success depends on our ability to make valuable recommendations, which, in turn, depends on the quality of recommendations in our index and our ability to predict engagement by an individual user within a specific context. We believe that one of our key competitive advantages is our recommendation technology. Subject to our advertiser guidelines, we offer our media partners a degree of flexibility with respect to the type of recommendation that they believe will appeal to their audience based on the editorial tone of their properties. If the quality of our recommendations suffers, whether due to our actions or decisions made by our media partners, or we are otherwise unable to provide users with valuable and relevant recommendations, user engagement may decline or perceptions of our recommendations may be adversely impacted. If we experience a decline in users or user engagement, for example, because users begin to ignore our platform or direct their attention to other elements on the online properties of our media partners, our media partners and advertisers may in turn not view our solutions as attractive, which could harm our business, results of operations, and financial condition.
The content of advertisements could damage our reputation and brand, or harm our ability to expand our base of users, advertisers and media partners, and negatively impact our business, results of operations, and financial condition.
Our reputation and brand may be negatively affected by ads that are deemed to be hostile, infringing, offensive or inappropriate by users and media partners. From time to time, we make changes in our advertiser guidelines that can result in the inclusion or exclusion of certain types of ads. We cannot predict with certainty the impact that such changes might have on user engagement or perceptions of our recommendations. We have adopted policies regarding unacceptable advertisements and retain authority to remove ads that violate these policies; however, advertisers could nonetheless provide such content and occasionally circumvent our policies. If any of those ads lead to hostile, infringing, offensive or inappropriate content, our reputation could suffer by association. The safeguards we have in place may not be sufficient to avoid harm to our reputation and brand. This could adversely affect existing relationships with media partners and advertisers, as well as our ability to expand our user and media partner base, and harm our business, results of operations, and financial condition.
Conditions in Israel could materially and adversely affect our business.
Many of our employees, including certain members of our management team, operate from our offices in Israel. In addition, a number of our officers and directors are residents of Israel. Accordingly, political, economic and military conditions in Israel and the surrounding region may directly affect our business and operations. In recent years, Israel has been engaged in sporadic armed conflicts with Hamas, an Islamist terrorist group that controls the Gaza Strip, with Hezbollah, an Islamist terrorist group that controls large portions of southern Lebanon, and with Iranian-backed military forces in Syria. In addition, Iran has threatened to attack Israel and may be developing nuclear weapons. Some of these hostilities were accompanied by missiles being fired from the Gaza Strip, Lebanon and Syria against civilian targets in various parts of Israel, including areas in which our employees are located, which negatively affected business conditions in Israel. Any hostilities involving Israel or the interruption or curtailment of trade between Israel and its trading partners could adversely affect our operations, results of operations and financial condition.
Our commercial insurance does not cover losses that may occur as a result of events associated with war and terrorism. Although the Israeli government currently covers the reinstatement value of property damage and certain direct and indirect damages that are caused by terrorist attacks or acts of war, such coverage would likely be limited, may not be applicable to our business (either due to the geographic location of our offices or the type of business that we operate) and may not reinstate our loss of revenue or economic losses more generally. Furthermore, we cannot assure you that this government coverage will be maintained or that it will sufficiently cover our potential damages. Any losses or damages incurred by us could have a material adverse effect on our business. Any armed conflicts or political instability in the region would likely negatively affect business conditions and could harm our results of operations.
Further, in the past, the State of Israel and Israeli companies have been subjected to economic boycotts. Several countries still restrict business with the State of Israel and with Israeli companies. These restrictive laws and policies may have an adverse impact on the expansion of our business, financial condition and/or our results of operations. In addition, a campaign of boycotts, divestment and sanctions has been undertaken against Israel, which could also adversely impact our business.
Also, many Israeli citizens are obligated to perform several days, and in some cases more, of annual military reserve duty each year until they reach the age of 40 (or older, for reservists who are military officers or who have certain occupations) and, in the event of a military conflict, may be called to active duty. In response to increases in terrorist activity, there have been periods of significant call-ups of military reservists. It is possible that there will be military reserve duty call-ups in the future. Our operations could be disrupted by such call-ups, particularly if such call-ups include the call-up of members of our management. Such disruption could materially adversely affect our business, financial condition and results of operations.
The digital advertising industry is intensely competitive, and if we do not effectively compete against current and future competitors, our business, results of operations, and financial condition could be adversely affected.
The digital advertising ecosystem is competitive and complex. Some of our competitors have longer operating histories, greater name recognition, and greater financial, technical, sales, and marketing resources than we have. In addition, some competitors may have greater flexibility than we do to compete aggressively on the basis of their scale, price and other contract terms, or to compete with us by including in their product offerings services that we may not provide. The market is fragmented and we also face competition from many smaller companies, many of which may be willing to offer their services on prices or terms that are not profitable for us. Some competitors are able or willing to agree to contract terms that expose them to risks and in order to compete effectively we might need to accommodate similar risks that could be difficult to manage or insure against.
Media partnersowners are investing in capabilities that enable them to connect more effectively and directly with advertisers.advertisers, or to partner with fewer vendors. Our business may suffer to the extent that our media partners and advertisers sell and purchase advertising inventory directly from one another or through intermediaries other than us, reducing the amount of advertising spend on our platform. If we are unable to compete effectively for media partners’owners’ inventory and/or advertisers’ advertising spend, we may experience less demand, which could adversely affect our business, results of operations, and financial condition.
There has also been rapid evolution and consolidation in digital advertising, and we expect these trends to continue, thereby increasing the capabilities and competitive positioning of larger companies, particularly those that are already dominant. There is a finite number of large digital media owners and advertisers in our target markets, and any consolidation of media partners or advertisers may give the resulting enterprises greater bargaining power or result in the loss of media partners and advertisers that use our platform, reducing our potential base of media partners and advertisers, each of which would potentially erode our revenue.
With the introduction of new technologies and the influx of new entrants to the market, we expect competition to persist and intensify in the future, which could harm our ability to increase sales and maintain our profitability. In addition, we and our media partners compete indirectly for user engagement with larger search and social media companies, such as Facebook, Inc.Meta (formerly Facebook), Google, Inc., LinkedIn, Corp.X (formerly Twitter Inc) and Twitter Inc.TikTok. We also broadly compete for advertiser budgets with other forms of traditional and online marketing, including keyword advertising, social media marketing and display advertising.
In addition, large and established internet and technology companies may have the power to significantly change the very nature of digital advertising marketplaces in ways that could materially disadvantage us. Some of these companies could leverage their positions to make changes to their web browsers, mobile operating systems, platforms, exchanges, networks or other solutions or services that could be significantly harmful to our business and results of operations. Some of these companies also have significantly larger resources than we do, and in many cases have advantageous competitive positions in popular products and services such as Amazon Advertising, Google Search, YouTube, Chrome, Meta Platforms, and Apple Search Ads, which they can use to their advantage. Furthermore, our competitors have invested substantial resources in innovation, which could lead to technological advancements that change the competitive dynamics of our business in ways that we may not be able to predict.
Loss of existing or future market share to new competitors and advertisers allocating finite budgets to competitors could substantially harm our business, results of operations, and financial condition.
Loss of large media partners could have a significant impact on our revenue and results of operations.
A significant portion of our recommendations are placed on web pages and mobile applications of a small number of our media partners. Certain partners may reduce or terminate their business with us at any time for any reason, including as a result of changes in their financial condition or other business circumstances, such as a change in strategy or model by which they monetize their properties. Our largest media partner accounted for approximately 10% of our revenues in 2023 and 2022 and 11% of our revenues in 2021. If a large media partner, or if several small or medium-sized media partners, terminate their relationships with us or reduce the amount of inventory we receive from them, whether based on their decisions or changes in the ecosystem, we may not have access to sufficient media partners to satisfy demand from advertisers resulting in lower revenues. In addition, losing key media partners may lead advertisers to seek alternate advertising solutions, which could slow our growth. A media partner may terminate its relationship with us and enter into a relationship with a competitor, and to the extent that becomes a long-term relationship, reestablishing our relationship with that media partner may prove difficult. As discussed above, establishing relationships with media partners may involve long sales cycles. As a result, the loss of a significant media partner relationship or of several small or medium-sized media partner relationships could have a material adverse impact on our business, results of operations and financial condition.
Our revenue growth and future prospects will be adversely affected if we fail to expand our advertiser and agency relationships.
Our revenue growth depends on our success in expanding and deepening our relationships with existing advertisers. Our growth strategy is premised in part on increasing spend from existing advertisers. In order to do so, we must be able to demonstrate better results for our advertisers with increased user engagement and ROAS, among other things. We do not have long-term commitments from our advertisers. We also seek to increase the number of advertisers and to reach new advertisers, both directly and through their media agencies. Attracting new advertisers and expanding existing relationships with our advertisers requires substantial effort and expense. In particular, large advertisers with well-established brands may require us to spend significant time educating them about our platform and solutions. It may be difficult and time consuming to identify, sell and market to potential advertisers who already allocate their budgets to large competitors and who expect to see a similar return on investment before diversifying or allocating a portion of their advertising budgets to us.
As we expand the application of our solutions, we increasingly depend on media agencies who assist advertisers in planning and purchasing advertising for brand marketing objectives, such as preference shift and brand awareness. Media agencies may require platforms like ours to be added to preferred partners programs, connect to designated intermediaries or make various commitments. It may be difficult, costly or time-consuming to meet media agency requirements and may not result in revenue growth. If we are unsuccessful in developing new advertiser and agency relationships and maintaining and expanding our existing relationships, our results of operations and prospects will be adversely affected.
We are subject to payment-related risks that may adversely affect our business, working capital, financial condition and results of operations.
Our business has been and may be further impacted by the ability or willingness of our advertisers to pay for their use of our platform. New advertisers spending on our platform, or existing advertisers allocating greater budgets to our platform, has resulted in an increase in our credit loss exposure. We may be involved in disputes with our advertisers, and in the case of agencies, their advertisers, over the operation of our platform, the terms of our agreements or our billings for purchases made by them through our platform. If we are unable to resolve disputes with our clients or our advertisers are experiencing financial hardship, it is less likely that we will be able to collect payment, and we may lose clients or clients may decrease their use of our platform and our financial performance and growth may be adversely affected. Even if we are not paid by advertisers ontime or at all, we may still be obligated to pay our media partners, and as a consequence, our business, financial condition and results of operations could be adversely impacted.
We have had clients who have declared bankruptcy or gone out of business without remitting full payment to us, and we have incurred write-offs for credit losses as a result of the failure of our advertisers to make payments to us in a timely manner or at all. If we are unable to collect payment from advertisers or media agencies due to their inability to pay, refusal to pay or bankruptcy, we will incur further write-offs for credit losses, which could harm our results of operations. In the future, credit loss may exceed reserves for such contingencies and our creditlossexposure may increase over time. Any increase in write-offs for credit loss could harm our business, financial condition and results of operations.
We also regularly experience slow payment cycles by media agencies as is common in our industry. In terms of our payment obligations, typically, we are contractually required to pay our media partners within a negotiated period of time, regardless of whether our advertisers or agency clients pay us on time, or at all. While we attempt to negotiate long payment periods with our media partners and shorter periods from our advertisers and seek to enforce the payment terms currently in place with our clients, we are not always successful. As a result, we must manage timing issues between our accounts payable and our accounts receivables. Our collections and payments cycle may increasingly consume working capital if we continue to be successful in growing our business. If we are unable to generate sufficient funds from operations or borrow on commercially acceptable terms or at all, our working capital availability could be reduced, and as a consequence, our financial condition and results of operations would be adversely impacted.
Many of our contracts with media agencies provide that if the advertiser does not pay the agency, the agency is not liable to us, and we must seek payment solely from the advertiser, a type of arrangement called sequential liability. Contracting with these agencies, which in some cases have or may develop higher-risk credit profiles, may subject us to greater credit risk than if we were to contract directly with advertisers. This credit risk may vary depending on the nature of an advertising agency’s aggregated advertiser base.
The failure of our recommendation engine to accurately predict consumer engagement may adversely affect our business, results of operations, and financial condition.
The success of our recommendation engine depends on the ability of our proprietary algorithms to predict the likelihood users will engage with our recommendations and on the quality of our data assets. We need to continuously deliver satisfactory results for users, media partners and advertisers in order to maintain revenue, which, in turn, depends in part on the optimal functioning of our platform and solutions. Therefore, a failure of our recommendation engine to accurately predict user engagement could negatively affect our results of operations and revenue.
If the quality of our advertisements deteriorates, or if we fail to present interesting content to consumers, we may experience a decline in user engagement, which could result in the loss of media partners.
Our technology selects what is displayed to consumers on the online properties of our media partners. Our success depends on our ability to make valuable recommendations to organic experiences and ads, which, in turn, depends on the quality of our index and our ability to predict engagement by an individual consumer within a specific context. We believe that one of our key competitive advantages is our AI prediction engine. Subject to our advertiser guidelines, we offer our media partners a degree of flexibility with respect to the type of recommendation that they believe will appeal to their audience based on the editorial tone of their properties. If the quality of our recommendations suffers, whether due to our actions or decisions made by our media partners, the types of advertisers interested in utilizing our platform, or we are otherwise unable to provide users with valuable and relevant recommendations, user engagement may decline or perceptions of our recommendations may be adversely impacted. If we experience a decline in consumers or their engagement, for example, because consumers begin to ignore our platform or direct their attention to other elements on the online properties of our media partners, our media partners and advertisers may in turn not view our solutions as attractive, which could harm our business, results of operations, and financial condition.
The content of advertisements could damage our reputation and brand, or harm our ability to expand our base of consumers, advertisers and media partners, and negatively impact our business, results of operations, and financial condition.
Our reputation and brand may be negatively affected by ads that are deemed to be hostile, infringing, offensive or inappropriate by consumers and media partners. From time to time, we make changes in our advertiser guidelines that can result in the inclusion or exclusion of certain types of ads. We cannot predict with certainty the impact that such changes might have on user engagement or perceptions of our recommendations. We have adopted policies regarding unacceptable advertisements and retain authority to remove ads that violate these policies; however, advertisers could nonetheless provide such content and occasionally circumvent our policies. If any of those ads lead to hostile, infringing, offensive or inappropriate content, our reputation could suffer by association. The safeguards we have in place may not be sufficient to avoid harm to our reputation and brand. This could adversely affect existing relationships with media partners and advertisers, as well as our ability to expand our user and media partner base, and harm our business, results of operations, and financial condition.
Conditions in Israel, including the ongoing conflict between Israel and Hamas and other terrorist organizations, may adversely affect our operations and limit our ability to market, support and innovate on our products, which would lead to a decrease in revenues.
Because a material part of our operations are conducted in Israel and certain members of our board of directors and management as well as many of our employees and consultants, including employees of our service providers, are located in Israel, our business and operations are directly affected by economic, political, geopolitical and military conditions in Israel. Since the establishment of the State of Israel in 1948, a number of armed conflicts have occurred between Israel and its neighboring countries and terrorist organizations active in the region. These conflicts have involved missile strikes, hostile infiltrations and terrorism against civilian targets in various parts of Israel, which have negatively affected business conditions in Israel.
In October 2023, Hamas terrorists infiltrated Israel’s southern border from the Gaza Strip and conducted a series of attacks on civilian and military targets. Hamas also launched extensive rocket attacks on the Israeli population, industrial centers located along Israel’s border with the Gaza Strip and in other areas within the State of Israel. These attacks resulted in extensive deaths, injuries and kidnapping of civilians and soldiers. Following the attack, Israel’s security cabinet declared war against Hamas and a military campaign against these terrorist organizations commenced in parallel to their continued rocket and terror attacks.
In connection with the Israeli security cabinet’s declaration of war against Hamas and possible hostilities with other organizations, several hundred thousand Israeli military reservists were drafted to perform immediate military service. Certain of our employees in Israel, in addition to employees of our service providers located in Israel, have been called, and additional employees may be called, for service in the current or future wars or other armed conflicts, and such persons may be absent for an extended period of time. As a result, our operations may be disrupted by such absences, which may materially and adversely affect our business and results of operations.
The intensity and duration of Israel’s current war against Hamas and other terror organizations, as well as additional potential crises involving hostile countries, such as Iran, are difficult to predict, as are the economic implications on the Company’s business and operations and on Israel’s economy in general. These events may be intertwined with wider macroeconomic indications of a deterioration of Israel’s economic standing, including the downgrading of Israel's credit rating by rating agencies, which may have a material adverse effect on the Company and its ability to effectively conduct its operations.
Furthermore, following the Hamas and Hezbollah attacks on Israel, the Houthi movement, which controls parts of Yemen, launched several attacks on marine vessels traversing the Red Sea, which were thought either to be in route toward Israel or to be owned by Israeli persons. The Red Sea is a vital maritime route for international trade traveling to or from Israel, and in response to the Houthi movement’s attacks, coalition forces led by the United States and United Kingdom have targeted sites in Yemen.
The hostilities with Hamas, Hezbollah and other organizations and countries have included and may include terror, missile and drone attacks. In the event that Israel’s communications infrastructure or other public utilities are damaged as a result of hostile actions, or hostilities otherwise disrupt our ongoing operations, our ability to deliver and/or service our products in a timely manner to meet our customer expectations could be materially and adversely affected.
We also do business with advertisers and media partners located in Israel. The conditions described above may impact advertising demand and the extent of monetization on media partners in Israel. A portion of our business (less than 5% of our revenues) is from advertisers in Israel displaying ads on media partner inventory in Israel which has been impacted by the above events.
Our commercial insurance does not cover losses that may occur as a result of events associated with war and terrorism. Although the Israeli government currently covers the reinstatement value of property damage and certain direct and indirect damages that are caused by terrorist attacks or acts of war, we cannot assure you that such government coverage will be maintained or that it will sufficiently cover our potential damages. Any losses or damages incurred by us could have a material adverse effect on our business.
Further, in the past, the State of Israel and Israeli companies have been subjected to economic boycotts. Campaigns of boycotts, divestment and sanctions undertaken against Israel, could adversely impact our business. In addition, some countries around the world restrict doing business with Israel and Israeli companies, and additional countries may impose restrictions on doing business with Israel and Israeli companies if hostilities in Israel or political instability in the region continue or increase. There have also been increased efforts by countries, activists and organizations to cause companies and consumers to boycott Israeli goods and services. In January 2024, the International Court of Justice (“ICJ”), issued an interim ruling in a case filed by South Africa against Israel in December 2023, making allegations of genocide amid the war in Gaza, and ordered Israel, among other
things, to take measures to prevent genocidal acts, prevent and punish incitement to genocide, and take steps to provide basic services and humanitarian aid to civilians in Gaza. There are concerns that companies and businesses will terminate, and may have already terminated, certain commercial relationships with Israeli companies following the ICJ decision. The foregoing efforts by countries, activists and organizations, particularly if they become more widespread, as well as the ICJ rulings and future rulings and orders of other tribunals against Israel (if handed), may materially and adversely impact our ability to sell and provide our products and services outside of Israel.
Finally, political conditions within Israel may affect our operations. Israel has held five general elections between 2019 and 2022, and prior to October 2023, the Israeli government pursued extensive changes to Israel’s judicial system, which sparked extensive political debate and unrest. In response to such initiative, many individuals, organizations and institutions, both within and outside of Israel, have voiced concerns that the proposed changes may negatively impact the business environment in Israel including due to reluctance of foreign investors to invest or transact business in Israel, as well as to increased currency fluctuations, downgrades in credit ratings, increased interest rates, increased volatility in security markets, and other changes in macroeconomic conditions. To date, these initiatives have been substantially put on hold. If such changes to Israel’s judicial system are again pursued by the government and approved by the parliament, this may have an adverse effect on our business, our results of operations, and our ability to raise additional funds, if deemed necessary by our management and board of directors.
Our current business model depends on media partnersowners maintaining open access digital properties, monetizing through advertising and attracting users to their digital properties, and could be impacted by continued pressure on the publishing industry.
Our platform depends on users being ablecontinuing to consume content freely on media partners’owners’ digital properties. SomeMedia owners face challenges growing and maintaining their audiences a result of the proliferation of new and innovative content distribution methods such as social media platforms. The overall decline in media owner audiences limits available advertising inventory creating financial pressure on media owners who rely on advertising to operate their business. As a result of these evolving trends, we have seen and may continue to see media owners consolidating or ceasing to operate.
In addition, some media partners, typically those that participate in both print and digital publishing, charge their users a subscription fee for online access by implementing a paywall. Our business may be negatively impacted by media partners shifting from open access to paywalls or generating less user interest because it may decrease our access to usersconsumers and advertising inventory.
If media partners consolidate, cease to operate, or shift their revenue models to a subscription-based service, they may decrease their reliance on other forms of revenue generation, including our recommendations and ads, whichfrom advertising, this could negatively affect our business, results of operations, and financial condition.
To the extent we have long-term commitments with our media partners, and they are adversely impacted by the evolving media owner landscape, we may not be able to recoup our investment in our media partners. Our results of operations may fluctuate significantly from period to period and may not meet our expectations or those of securities analysts and investors.
Our results of operations have fluctuated in the past, and future results of operations are likely to fluctuate as well. In addition, because our business continues to evolve, you should not place undue reliance on our historical results of operations in assessing our future prospects. Factors that can cause our results of operations to fluctuate include:
•changes in demand and competition for ad inventory sold on our platform;
•changes in our access to valuable ad inventory of media partners;
•the addition or loss of media partners on our platform, and/or loss of ad inventory from a media partner;
•costs associated with adding or attempting to retain them;media partners;
•the continuation or worsening of unfavorable economic or business conditions or downturns or instability in financial markets;
•seasonality of our business;
•changes in consumer usage of devices and channels to access media and digital content;
•changes in the structure of the buying and selling of digital ad inventory;
•changes in the pricing policies of media partners and competitors;
•changes in third-party service costs;
•changes and uncertainty in our legislative, regulatory, and industry environment, particularly in the areas of data protection and consumer privacy;
•introduction of new technologies or solutions;
•unilateral actions taken by demand side platforms, agencies, advertisers, media partners, and supply side platforms;
•changes in our capital expenditures as we acquire hardware, technologies, and other assets for our business; and
•changes to the cost of retaining and adding highly specialized personnel.
Any one or more of the factors above may result in significant fluctuations in our results of operations.
Our profitability has been and may continue to be adversely impacted, or may fluctuate on a quarterly basis, due to guarantees that we have provided to some of our media partners.
In order to secure favorable terms, such as exclusivity and longer-term agreements, we may offer media partners contracts with guaranteed minimum rates of payments. These guarantees require us to pay theour media ownerpartner for the ad impressions we receive, regardless of whether the consumer engages with the ad or we are paid by the advertiser. If the level of userconsumer engagement on a media partner property or overall advertiser demand falls, the payments to our media partners with guaranteed minimum rates of payment may adversely impact our Ex-TAC Gross Profit and our margins. This includes the possibility of paying a media partner an amount in excess of the revenue that we generated from ads served on that media partner property. The revenue from ads served on a media partner property or overall advertiser demand could drop for reasons outside of our control. It is also possible that we will agree to a rate of payment that is more difficult to profitably recoup than we originally believed. In addition, many of our contracts that contain guarantee arrangements set a single rate of payment and do not account for seasonal revenue fluctuations. As a result, our gross profit margins may fluctuate with the seasonality of the business. Although we have secured limited exemptions in contracts with guarantees, due to these factors,Additionally, these guarantees may adversely impact our traffic acquisition costs in absolute dollar terms and as a percentage of revenue, as well as overall profitability. The provision of guaranteed minimum rates to additional media partners or to existing media partners upon contract renewal, or the provision of such guarantees in contracts that contemplate a large number of page views, such as some of the contracts we have entered into with large media partners, may increase the risk that our gross profit and/or margins may be adversely impacted for the reasons we describe above.
Seasonal fluctuations in advertising activity and large cyclical events could have a material impact on our revenue, cash flow and operating results.
Our revenue, cash flow, operating results and other key operating and performance metrics may vary from quarter to quarter due to the seasonal nature of our advertisers’ spending. For example, advertisers tend to devote more of their advertising budgets to the fourth calendar quarter to coincide with user holiday spending. Moreover, advertising inventory in the fourth quarter may be more expensive due to increased demand. Other large cyclical events that attract advertisers, such as elections, the Olympics and other sporting events, the Oscars, or other large entertainment events, also could cause our revenue to increase during certain periods and decrease in other periods.
If currency exchange rates fluctuate substantially in the future, our results of operations, which are reported in U.S. dollars, could be adversely affected.
We are exposed to the effects of fluctuations in currency exchange rates. A significant percentage of our international revenue is from advertisers who pay us in currencies other than the U.S. dollar. We also incur operating expenses in local currencies, including with respect to employee compensation, at our offices outside of the United States and, most significantly, in Israel, the United Kingdom and Euro-based countries where we operate. Fluctuations in the exchange rates between the U.S. dollar and those other currencies could result in the U.S. dollar equivalent of such foreign-denominated revenue being lower than would be the case if exchange rates were stable and the U.S. dollar equivalent of such expenses being higher. This could have a negative impact on our reported operating results. We evaluate periodically the various currencies to which we are exposed and take hedging measures to reduce the potential adverse impact from the appreciation or the depreciation of our non-U.S.-dollar-denominated operations, as appropriate. Any such strategies, such as forward contracts, options and foreign exchange swaps related to transaction exposures that we may implement to mitigate this risk may not fully eliminate our exposure to foreign exchange fluctuations.
Our business depends on our ability to collect, use and disclose data to deliver advertisements. Any limitation imposed on our collection, use or disclosure of this data could significantly diminish the value of our solution.
We use “cookies,” or small text files placed on consumer devices when an Internet browser is used, as well as mobile device identifiers, to gather data that enables our platform to be more effective. We collect this data through various means, including code that media partners and advertisers implement on their pages, software development kits installed in mobile applications, our own cookies, and other tracking technologies. Our advertisers, directly or through third-party data providers, may choose to further target their campaigns within our platform.
The data we collect improves our algorithms and helps us deliver relevant recommendations with greater userconsumer engagement. Our ability to collect and use data is critical to the value of our platform. Without cookies, mobile device IDs, and other tracking technology data, our recommendations would be informed by less information about user interests and advertisers may have less visibility into their return on ad spend. If our ability to use cookies, mobile device IDs or other tracking technologies is limited, we may be required to develop or obtain additional applications and technologies to compensate for the lack of cookies, mobile device IDs and other tracking technology data, which could be time consuming or costly to develop, less effective, and subject to additional regulation. As described in more detail below in this Item 1A under “User growth and engagement depends upon effective interoperation with devices, platforms and standards set by third parties that we do not control,” prominent technology companies also have discontinued, or announced intentions to discontinue, the use of certain cookies, and to develop alternative methods and mechanisms for tracking users.
Additionally, we are subject to laws and regulations related to data privacy, data protection, information security, and consumer protection across different markets where we conduct our business, which could potentially impact our ability to collect, use, and disclose data as described in this Item 1A under “We are subject to laws and regulations related to dataonline privacy, data protection, and information security, and consumer protection across different markets where we conduct our business, including in the United States and Europe. Such laws, regulations, and industry requirements are constantly evolving and changing and could potentially impact data collection and data usage for advertising and recommendations. Our actual or perceived failure to comply with such obligations could have an adverse effect on our business, results of operations, and financial conditioncondition..”
There are many technical challenges relating to our ability to collect, aggregate and associate the data, and we cannot assure you that we will be able to do so effectively, which would adversely affect our business, results of operations, and financial condition.
User growth and engagement depends upon effective interoperation with devices, platforms and standards set by third parties that we do not control.
Our recommendationsadvertisements are currently accessed through desktops, laptops and mobile devices, and are adaptable across many digital environments, including web pages, mobile applications, email and video players. In the future, our recommendationsadvertisements may be accessed through other new devices and media platforms. As a result, we depend on the interoperability of our solutions with popular devices, platforms and standards that we do not control. For example, because many users access our platform through mobile devices, we depend on the interoperability of our solutions with mobile devices and operating systems such as Android and iOS. Any changes in, or restrictions imposed by, such devices, platforms or standards that impair the functionality of our current or proposed solutions, limit what our media partners may or may not display, how they acquire audiences, or give preferential treatment to competitive products or services could adversely affect usage of our platform.
Some users also download free or paid “ad blocking” software on their computers or mobile devices, not only for privacy reasons, but also to counteract the adverse effect advertisements can have on the user experience, including increased load times, data consumption, and screen overcrowding. If more users adopt these measures, our business, results of operations, and financial condition could be adversely affected. Many applications and other devices allow users to avoid receiving advertisements by paying for subscriptions or other downloads. Prominent media technology companies, including Google, are also limiting what advertisements may be rendered through their browsers in the name of user experience and load times. Ad-blocking technologies could have an adverse effect onnegatively impact our business results of operations, and financial condition if they reduceby reducing the volume or effectiveness and value of advertising.
Prominent technology companies also have discontinued, or announced intentions to discontinue, the use of certain cookies, and to develop alternative methods and mechanisms for tracking users. The most commonly used Internet browsers allow users to modify their browser settings to block first-party cookies (placed directly by the media partner or website owner that the user intends to interact with) or third-party cookies, and some browsers block third-party cookies by default. For example, Apple already prohibits the use of third-party cookies and moved to “opt-in” privacy models with iOS requiring users to voluntarily choose (opt-in) to permit app developers to track them across applications and websites and therefore receive targeted ads. In January 2020, Google has announced its intention to limitit will deprecate the use of third-party cookies in its Chrome web browser by the end of 2023. In February 2022, Google announced that its next version of the Android operating system will include privacy restrictions, similar to Apple’s, that will prevent tracking across applications.2024. As a consequence of these changes, fewer of our cookies or media partners’ cookies may be set in browsers or be accessible in mobile devices, which adversely affects our business.
As companies replace cookies, it is possible that such companies may rely on proprietary algorithms or statistical methods to track users without cookies, or may utilize log-in credentials entered by users into other web properties owned by these companies, such as their email services, to track web usage, including usage across multiple devices. Alternatively, such companies may build different and potentially proprietary user tracking methods into their widely-used web browsers. Although we believe we are well positioned to adapt and continue to provide key data insights to our media partners without cookies, thisAny transition could be more disruptive, slower, or more expensive than we currently anticipate, and could materially affect the accuracy of our recommendations and ads and thus our ability to serve our advertisers, adversely affecting our business, results of operations, and financial condition.
If we fail to detect and prevent click fraud or other invalid engagements with the advertisements we serve, we could lose the confidence of our advertisers, which would cause our business to suffer and negatively impact our financial results.
Our success relies on delivering measurable business value to our advertisers. We are exposed to the risk of fraudulent and otherwise invalid engagements that advertisers may perceive as undesirable. A major source of invalid engagements is click fraud in which a user, automated script or computer program intentionally engages with ads for reasons other than accessing the underlying content. If we are unable to detect and prevent such fraudulent or malicious activity, or other invalid engagements or if we choose to manage traffic quality in a way that advertisers find unsatisfactory, the affected advertisers may experience or perceive a reduced return on their investment in our platform, which could lead to dissatisfaction with our solutions, refusals to pay, refund demands or withdrawal of future business. This could damage our brand and lead to a financial loss or to a loss of advertisers which would adversely affect our business, results of operations, and financial condition.
Our failure or the failure of third parties to protect our sites, networks and systems against security breaches, or otherwise to protect our confidential information or the confidential information of our partners, could damage our reputation and brand and substantially harm our business and operating results.
We collect, maintain, transmit and store data about consumers, clients, employees, business partners and others, including personally identifiable information, as well as other confidential information. We also engage third parties that store, process and transmit these types of information on our behalf. We have experienced and expect to continue to experience actual and attempted cyberattacks. Our security measures, and those of our third-party service providers, might not detect or prevent all attempts to breach our systems including, denial-of-service attacks, viruses, malicious software, break-ins, phishing attacks, social engineering, security breaches, ransomware, credential stuffing attacks or other attacks and similar disruptions that may jeopardize the security of information stored in or transmitted by our websites, networks and systems or that we or such third parties otherwise maintain. We and such third parties might not anticipate or prevent all types of attacks, and because techniques used to obtain unauthorized access to or sabotage systems change frequently, attacks might not be known to us or our third-party service providers until after they are launched. In addition, security breaches can occur as a result of non-technical issues, including intentional or inadvertent breaches by our employees or by third parties. These risks may increase over time as the complexity and number of technical systems and applications we use also increases.
Breaches of our security measures or those of our third-party service providers or cyber security incidents could result in: unauthorized access to our applications, sites, networks and systems; unauthorized access to and misappropriation of data and customer information, including customers’ personally identifiable information, or other confidential or proprietary information of ourselves or third parties; phishing scams and malware, ransomware and other malicious Internet-based activity; deletion or modification of content or the display of unauthorized content on our sites; interruption, disruption or malfunction of operations; costs relating to breach remediation, deployment of additional personnel and protection technologies, response to governmental investigations and media inquiries and coverage; engagement of third-party experts and consultants; litigation; regulatory action; and other potential liabilities. Any security breach or cyber incident, whether actual or perceived, which impacts us or one of our third-party service providers could significantly damage our reputation and brand, cause our business to suffer through, among other things, loss of, or failure to attract, media partners or advertisers and we could be required to expend significant capital and other resources to alleviate problems caused by such breaches.
In addition, some jurisdictions have enacted laws requiring companies to notify individuals of data security breaches involving certain types of personal data, and our agreements with certain partners may require us to notify them in the event of a security incident. These mandatory disclosures may lead to negative publicity and may cause our users, media partners or advertisers to lose confidence in the effectiveness of our data security measures. In the European Union and United Kingdom a data breach involving personal data will generally require notification of the relevant Supervisory Authority(ies) and, where the risk to individuals is high, notification of the affected individuals themselves. In the European Union and United Kingdom there is a possibility of significant fines being imposed in the event of a security breach.
Any security breach or cyber incident, which impacts us or one of our third-party service providers, or any failure on our part or on the part of such third parties to protect our sites, networks and systems or to protect our confidential information or the confidential information of others could damage our reputation and brand and substantially harm our business and operating results.
Our business depends on our ability to maintain and scale our technology platform. Real or perceived errors, disruptions or disruptionsoutages in our platform, including due to the possible cyberattacks discussed above or our failure to maintain adequate security and supporting infrastructure, could adversely affect our operating results and growth prospects.
We depend upon the sustained and uninterrupted operation of our platform to generate recommendations, serve ads, manage our content index, continually improve and analyze our data assets and optimize performance in real time. If our platform cannot scale to meet demand, or if there are errors, bugs, or other performance failures, including any related to our third-party service providers, in our execution of any of these functions on our platform, then our business may be harmed. Undetected bugs, defects, errors and other performance failures may occur, especially when we are implementing new solutions or features. Despite testing by us, errorssuch performance failures in our platform may occur, which could result in negative publicity, damage to our brand and reputation, loss of or delay in market acceptance of our solutions, increased costs or loss of revenue, loss of competitive position or claims by advertisers or media partners for losses sustained by them.
We also face risks of disruptions of service from third-party interference with our platformplatform. As discussed above, cyberattack techniques are constantly evolving and cyber-attacks. For such occurrences, ourbecoming increasingly diverse and sophisticated. Our platform is designed with degradation features that enable us to turn off our recommendationsorganic experiences and ads without producing white space on the media partner’s properties for the vast majority of our media partners. While we have robust systems in place to counter breaches and attacks such as DoS (a technique used by hackers to take an Internet service offline by overloading its servers),breaches, attacks have occurred and we cannot guarantee that future attacks may not have dire consequences, including impacting what may be displayed on the properties of our media partners and advertisers. Disruptions to our platform and our servers could interrupt our ability to provide our solutions and materially affect our reputation, relationships with media partners and advertisers, business and results of operations. There can be no assurance that any limitation of liability provisions in our contracts would be enforceable or adequate or would otherwise protect us from any such liabilities or damages with respect to any particular claim arising from a cyber incident. We also cannot be sure that our existing insurance coverage will continue to be available on acceptable terms, will be available in sufficient amounts to cover one or more large claims, or that insurers will not deny coverage as to any future claim. Moreover, anticipating cyberattacks or alleviating problems resulting from errors or disruptions in our platform could require significant resources, which would adversely impact our financial position, and results of operations.
Our business relies on the incorporation of machine learning and predictive AI solutions into our platform, offerings, services and features. Our competitors or other third parties may incorporate AI into their products more quickly or more successfully than us, which could impair our ability to compete effectively and adversely affect our results of operations. Additionally, if the content, analyses, or recommendations that AI applications assist in producing are or are alleged to be infringing, deficient, inaccurate, or biased, our business, financial condition, and results of operations may be adversely affected and we may be subject to the risk of litigation. We have also announced that we are experimenting with various generative AI capabilities with the goal of automating and significantly enhancing platform functionality, ad variety and overall engagement. Generative AI, however, also presents emerging ethical issues and if our use of AI becomes controversial, we may experience brand or reputational harm, competitive harm, or legal liability. The rapid evolution of AI, including government regulation of AI, may impede our ability to do business and will require significant resources to ensure compliance.
Failures or loss of theour infrastructure, including hardware and software, with respect to us and infrastructureother service providers on which we rely, or security breaches, could adversely affect our business.
We rely on owned and leased servers and other third-party hardware and infrastructure to support our operations. Our third-partyTo support our business needs, we operate our own proprietary cloud infrastructure using third party data centers are co-located in three geographically separate locations managed by three different vendors in the United States. In addition, we also serve recommendations from a public cloud based in Europe. We do not have control over the operationoperations of these facilities or technology of our cloud and such facilities couldservice providers, including any third-party vendors that collect, process and store personal data on our behalf. Our systems, servers and platforms and those of our service providers may be subjectvulnerable to break-ins, computer viruses, physical or electronic break-ins, sabotage, intentional acts of vandalism and other misconduct. misconduct that our security measures or the security measures of these service providers may not detect. Individuals able to circumvent such security measures may disrupt our operations, damage our hardware and infrastructure, misappropriate confidential or proprietary information or otherwise impair our reputation and business. Additionally, to the extent that our cloud and other service providers experience security breaches that result in the unauthorized or improper use of confidential data, employee data or personal data, we may not be indemnified for losses resulting from such breaches. There can be no assurance that we or our third-party providers will be successful in preventing security breaches, including as a result of cyber attacks, or successfully mitigating their effects.
Further, our servers and data centers are vulnerable to damage or interruption from fires, natural disasters, terrorist attacks, power loss, telecommunications failures or similar catastrophic events. If a data center goes offline, an alternate data center would take over our serving and data storage needs, but our service may be slowed or degraded as a result until full data center operations are restored. We cannot assure you that future outages may not have material adverse consequences to our business. Moreover, if for any reason our arrangement with one or more of the providers of the servers that we use is terminated, we could incur additional expenses in establishing new facilities and support.
We cannot predict the extent to which the ongoing and evolving COVID-19 pandemic, including the resulting global economic uncertainty, and measures taken in response to the pandemic, could adversely affect our business, results of operations, and financial condition.
In March 2020, the World Health Organization characterized the rapid spread of the COVID-19 disease as a pandemic. Since then, the COVID-19 disease (including its variant strains) has disrupted the global economy and put unprecedented strains on governments, health care systems, educational institutions, businesses, and individuals around the world, resulting in regional quarantines, labor shortages or stoppages, changes in consumer purchasing patterns, disruptions to the ability of service providers to deliver data on a timely basis, or at all, and overall economic instability. The impact on the global population and the duration of the COVID-19 pandemic is difficult to assess or predict. It is also difficult to predict the impact on the global economic market, which depends upon the actions of governments, businesses, and other enterprises in response to the pandemic and the effectiveness of those actions. The pandemic has already caused, and could result in further, significant disruption of global financial markets and economic uncertainty. Although the advertising market and our business have generally recovered from the economic effects of the COVID-19 pandemic, it did initially impact our sales and operations adversely. Despite recovery, variables such as global supply chain disruptions, labor shortages and stoppages, and cost inflation impacted certain categories of advertisers, such as the automotive advertisers, and could adversely impact us in the future, including if our advertisers were to reduce or cut their advertising spend as a result of any of these factors. We continue to monitor our operations, and the operations of those in our ecosystem (including media partners, advertisers and agencies), as well as government recommendations.
In response to the COVID-19 pandemic, we required most employees to work remotely, suspended all non-essential travel worldwide for our employees, canceled or postponed company-sponsored events, and discouraged employee attendance at industry events and in-person work-related meetings. While we have rolled back or modified certain of these restrictions, we will continue to monitor the situation and adjust our current policies accordingly. The continuation of these restrictions or the implementation of any additional restrictions due to any resurgences or otherwise could negatively impact our marketing efforts, lengthen sales cycles, slow down our recruiting efforts, and/or create operational or other challenges, any of which could adversely affect our business, results of operations, and financial condition.
By contrast, as the economy recovers, pandemic concerns ease and employees return to the office, certain media partners have experienced a decline in traffic from the height of traffic during the work-from-home peak digital usage periods, and may experience further declines. As a result, by comparison to our 2020 results of operations, our results of operations in future periods may be unpredictable.
We depend on highly skilled personnel to grow and operateoperate our business, and if we are unable to hire, retain and motivate our personnel, we may not be able to grow effectively.
Our future success depends upon contributions from our employees, in particular our senior management team. We do not maintain key person life insurance for any employee. From time to time, there may be changes in our senior management team, and such changes may be disruptive to our business.
Our growth strategy also depends on our ability to expand and retain our organization with highly skilled personnel. Identifying, recruiting, training and integrating qualified individuals will require significant time, expense and attention. In addition to hiring new employees, we must continue to focus on retaining our best employees. Competition for highly skilled personnel in our industry has intensified over the last year and is expected to continue to be challenging in the future across all
our locations, particularly in New York City, where our headquarters isare located, and in Israel and Slovenia, where we conduct the majority of our research and development activities. We may need to invest significant amounts of cash and equityand, therefore, may be impacted by our share performance, to attract and retain employees and we may not realize returns on these investments. If we are not able to effectively add and retain employees, our ability to achieve our strategic objectives willcould be adversely impacted, and our business willcould be harmed.
Our corporate culture has contributed to our success, and if we cannot maintain it as we grow,a result of our hybrid work model or otherwise, we could lose the innovation, creativity, and teamwork fostered by our culture, and our business may be harmed.
We believe our corporate culture has been a critical component of our success as we believe it fosters innovation, creativity, and teamwork across our business, helping to drive our success. We cannot ensure we can effectively maintain our corporate culture as we continue to grow.grow and maintain the hybrid work model we established as a result of COVID-19. As we expand and change, in particular across multiple geographies, following acquisitions, in more remote environments or in a more remote environment,global talent centers, it may be difficult to preserve our corporate culture, which could reduce our ability to innovate, create, and operate effectively. In turn,Over time, factors such as expansion, dispersal and remote operations may also decrease the cohesiveness of our teams, which is critical to our corporate culture. The failure to preserve our culture could adversely affect our business, results of operations, and financial condition by negatively affecting our ability to attract, recruit, integrate and retain employees, continue to perform at current levels, and effectively execute our business strategy.
If currency exchange rates fluctuate substantiallyUtilizing labor in foreign countries may subject us to additional risks, which could have an adverse effect on our business, operating results and financial condition.
We have attempted to control our operating expenses by utilizing lower cost labor in foreign countries, such as India, and we may in the future expand our results of operations, which are reported in U.S. dollars, could be adversely affected.
We are exposed to the effects of fluctuations in currency exchange rates. A significant percentage of our international revenue is from advertisers who pay us in currencies other than the U.S. dollar. We also incur operating expenses in local currencies, including with respect to employee compensation, at our officesreliance on off-shore labor. Countries outside of the United States may be subject to relatively higher degrees of political and most significantly, in Israel as well associal instability and may lack the United Kingdom. Fluctuations in the exchange rates between the U.S. dollar and thoseinfrastructure to withstand political unrest, natural disasters, pandemics or other currenciesinstability, which could interfere with work performed by these labor sources or could result in the U.S. dollar equivalent of such foreign-denominated revenue being lower than would be the case if exchange rates were stable and the U.S. dollar equivalent of such expenses being higher.This could have a negative impact on our reported operating results. We evaluate periodically the various currencies to which we are exposed and take hedging measures to reduce the potential adverse impact from the appreciation or the depreciation of our non-U.S.-dollar-denominated operations, as appropriate. Any such strategies, such as forward contracts, options and foreign exchange swaps related to transaction exposures that we may implement to mitigate this risk may not fully eliminate our exposure to foreign exchange fluctuations.
Our credit facility subjects us to operating restrictions and financial covenants that impose risk of default and may restrict our business and financing activities.
On November 2, 2021, we entered into the Second Amended and Restated Loan and Security Agreement with SVB that provides a senior secured revolving credit facility in the aggregate principal amount of up to $75 million. Borrowings under this agreement are secured by substantially all of our assets of our parent entity and certain domestic subsidiary co-borrowers, including all accounts receivable and proceeds from sales of our intellectual property, and are subject to a negative pledge on our intellectual property in favor of SVB. The credit facility contains representations and warranties, including, without limitation, with respect to collateral; accounts receivable; financials; litigation, indictment and compliance with laws; disclosure and no material adverse effect, each of which is a condition to funding. This credit facility includes events of default and is also subject to certain financial and other covenants, including, without limitation, restrictions on liens, indebtedness, investments, fundamental changes, dispositions, restricted payments and prepayment of the 2.95% Convertible Senior Notes due 2026 and of junior indebtedness. The credit facility contains a financial covenant that requires, in the event that credit extensions under the facility equal or exceed 85% of the available commitments under the Facility or upon the occurrence of an event of default, the Company and its subsidiaries to maintain a minimum consolidated monthly fixed charge coverage ratio of 1.00.
An inability to make the required representations and warranties, including with respect to collateral, accounts receivable, financials, litigation, indictment and compliance with laws, disclosures and no material adverse effect, may limit our ability borrow and/or the covenants may restrict our ability to finance our operations and to pursue our business activities and strategies. Our ability to makes these representations and warranties, and/or comply with these covenants may be affected by events beyond our control. Our abilityhaving to replace or supplement the existing facilityreduce these labor sources. Moreover, we may be limited due to various factors, including the statushave difficulty in successfully staffing, transitioning knowledge of systems and controls, and managing our foreign operations, which could impact our business, global credit market conditions,financial condition or results of operations. Doing business outside of the U.S. also increases our risk exposure to anti-corruption laws and perceptionsregulations such as the Foreign Corrupt Practices Act, any violation of our businesswhich could expose us to significant financial penalties or industry by sources of financing. In addition, if credit is available, lenders may seek more restrictive covenants and higher interest ratesconsent orders that may reducecurtail our borrowing capacity, increase our costs, and reduce our operating flexibility. If we do not have or are unable to generate sufficient cash available to repay our debt obligations when they become due and payable, either upon maturity or in the event of a default, we may not be able to obtain additional debt or equity financing on favorable terms, if at all.
We may engage in strategic transactions, which may not yield a positive financial outcome. Further, such activity may result in the company operating in businesses beyond its current core business with risk factors beyond those which are identified here.
From time to time, we may evaluate potential mergers and acquisitions or investment opportunities. We have made a number of acquisitions in the past. Any transactions that we enter into could be material to our financial condition and results of operations. The process of integrating an acquired company, business or technology could create unforeseen operating difficulties and expenditures. Acquisitions and investments carry with them a number of risks, including the following:
•diversion of management time and focus from operating our business;
•implementation or remediation of controls, procedures and policies of the acquired company;
•integration of financial systems;
•coordination of product, engineering and selling and marketing functions;
•retention of employees from the acquired company;
•unforeseen liabilities;
•litigation or other claims arising in connection with the acquired company; and
•in the case of foreign acquisitions, the need to integrate operations across different cultures and languages and to address the particular economic, currency, political and regulatory risks associated with specific countries.
Our failure to address these or other risks encountered in connection with acquisitions could cause us to fail to realize the anticipated benefits of such acquisitions, resulting in unanticipated liabilities and harming our business, results of operations and financial condition.
Risks Relating to Legal or Regulatory Matters
Our business is subject to political and regulatory risks in the various markets in which we operate; compliance with differing and changing regulatory requirements poses compliance challenges.
Our business is subject to regulation, which is rapidly evolving, and the business and regulatory environment in each of the international markets in which we operate may differ. For example, regulations relating to our business, including our employees, our arrangements with media partners and advertisers, stricter rules relating to content running through our network, and privacy related regulations affect how we conduct our business. The following are some of the political and regulatory risks and challenges we face across jurisdictions:
•greater difficulty in enforcing contracts;
•higher costs of doing business internationally, including costs incurred in establishing and maintaining office space and equipment for our international operations;
•risks associated with trade restrictions and foreign legal requirements, including any certification and localization of our platform that may be required in foreign countries;
•organizing or similar activity by workers, local unions, work councils, or other labor organizations;
•our ability to respond to competitive developments and other market and technological dynamics, such as the emergence of generative AI;
•greater risk of unexpected changes in regulatory practices, tariffs, and tax laws and treaties;
•compliance with anti-bribery laws, including, without limitation, compliance with the U.S. Foreign Corrupt Practices Act and the UK Bribery Act;
•compliance with data collectionprotection and privacy law regimes of various countries;countries, especially as our business relates to consumer online privacy and interested-based advertising;
•heightened risk of unfair or corrupt business practices in certain geographies and of improper or fraudulent sales arrangements that may impact financial results and result in restatements of, or irregularities in, financial statements;
•the uncertainty of protection for intellectual property rights in some countries;
•general economic and political conditions in these foreign markets, including political and economic instability in some countries;
•the potential for heightened regulation relating to content curation or discovery as a result of concerns relating to the spread of disinformation through technology platforms; and
•double taxation of our international earnings and potentially adverse tax consequences due to changes in the tax laws of the United States or the foreign jurisdictions in which we operate.
We are subject to laws and regulations related to dataonline privacy, data protection, and information security, content and consumer protection across different markets where we conduct our business, including in the United States and Europe. Such laws, regulations, and industry requirements are constantly evolving and changing and could potentially impact data collection and data usage for advertising and recommendations. Our actual or perceived failure to comply with such obligations could have an adverse effect on our business, results of operations, and financial condition.
We receive, store, and process data about or related to users in addition to our media partners, advertisers, services providers and employees. Our handling of this data is subject to a variety of federal, state, and foreign laws and regulations and is subject to regulation by various government authorities. Our data handling is also is subject to contractual obligations and may be deemed to be subject to industry standards.
The U.S. federal and various state and foreign governments have adopted or proposed limitations on the collection, distribution, use, and storage of data relating to individuals, including the use of contact information and other data for marketing,online identifiers, advertising and other communications with individuals and businesses. In the United States, various laws and regulations apply to the collection, processing, disclosure, and security of certain types of data. Additionally, the Federal Trade Commission and many state attorneys general are interpreting federal and state consumer protection laws as imposing standards for the online collection, use, dissemination, and security of data and issuing separate guidance in this area. If we fail to comply with any such laws or regulations, we may be subject to enforcement actions that may not only expose us to litigation, fines, and civil and/or criminal penalties, but also require us to change our business practices as well as have an adverse effect on our business, results of operations, and financial condition.
The regulatory framework for dataonline privacy issues worldwide is continuously evolving and is likely to remain uncertainreceive global scrutiny for the foreseeable future. The occurrence of unanticipated events often rapidly drives the adoption of legislation or regulation affecting the use, collection, or other processing of data and manners in which we conduct our business. Restrictions could be placed upon the collection, management, aggregation, and use of information, which could result in a material increase in the cost of collecting or otherwise obtaining certain kinds of data and could limit the ways in which we may use or disclose information. In particular interest-based advertising, or the use of data to draw inferences about a user’s interests and deliver relevant advertising to that user, and similar or related practices (sometimes referred to as interest-based advertising, behavioral advertising or personalized advertising), such as cross-device data collection and aggregation, steps taken to de-identify personal data, and to use and distribute the resulting data, including for purposes of personalization and the targeting of advertisements, havehas come under increasing scrutiny by legislative, regulatory, and self-regulatory bodies in the United States and abroad that focus on consumer protection or data privacy (and also by app platforms, as discussed above).online privacy. Much of this scrutiny has focused on the use of cookies and other technologies to collect information about Internet users’ online browsing activity on web browsers, mobile devices, and other devices, to associate such data with user or device identifiers or de-identified identities across devices and channels. BecauseAs we rely upon large volumes of such data collected primarily through cookies and similar technologies, it is possible that these effortslegislative and technical changes may have a substantial impact on our ability to collect and use the data fromof Internet users, and itusers. It is essential that we monitor global privacy developments in this area domestically and globally, and engage in responsible privacy practices, including providing users with notice of the types of data we collect and how we use that data to provide our services.
In the United States, the U.S. Congress and state legislatures, along with federal regulatory authorities have recently increased their attention on matters concerning the collection and use of consumer data. In the United States, non-sensitive consumer data generally may be used under current rules and regulations, subject to certain restrictions, so long as the person does not affirmatively “opt-out” of the collection or use of such data. If an “opt-in” model or other more restrictive regulations were to be widely adopted in the United States, less data would be available, and could adversely affect our business.
For example, California enacted legislation, the California Consumer Privacy Act, along with related regulations (together, the “CCPA”), which became effective in 2020.was subsequently updated by the California Privacy Rights Act (“CPRA”). The CCPA creates individual privacy rights for California residents and increases the privacy and security obligations of businesses handling personal data and the CPRA imposes additional data protection obligations including limitation on the use and processing of sensitive personal data. The CCPA isand CPRA are enforceable by the California Attorney General and there is also a private right of action relating to certain data security incidents. The CCPA generally requires covered businesses to, among other things, provide disclosures to California consumers and afford California consumers abilities to opt-out of the sharing of personal data between parties, a concept that is defined broadly, andwith behavioral advertising triggerstriggering such requirements under the CCPA. The CCPA and CPRA or subsequent guidance may require us to further modify our data processing practices and policies and to incur substantial costs and expenses in an effort to comply. Decreased availability and increased costs of information could adversely affect our ability to meet our advertisers’ requirements and could have an adverse effect on our business, results of operations, and financial condition.
Additionally, starting in January 2023, the California Privacy Rights Act (“CPRA”), which was voted into law in November 2020 and amends the CCPA, imposes additional data protection obligations on certain businesses doing business in California, including honoring additional consumer rights and limiting the use and processing of personal data including sensitive data. In addition, the CPRA explicitly requires businesses to provide consumers with the right to opt-out of sharing of personal data with third parties for behavioral advertising. Accordingly, the CPRA could have an adverse effect on our business, results of operations, and financial condition.
The CCPA has led to “copycat” laws in otherOther states across the country have been implementing similar privacy laws, such as in Virginia, Colorado, Connecticut and Colorado,Utah. Any disparity between federal and likely in Connecticut, Florida, New York, Oklahoma, and Washington. This legislationstate laws may add additional complexity, including a variation in requirements, restrictions, and potential legal risk, and may require additional investment in resources to compliance programs, and could impact strategies and availability of previously useful data and could result in increased compliance costs and/disjointed internal approaches to the collection and use of data as a result of state-based differences or changes in business practices and policies. Such new privacy laws add additional complexity, requirements, restrictions, and potential legal risk, require additional investment in resources to compliance programs, and could impact trading strategies and availability of previously useful data.
In Europe, the General Data Protection Regulation (EU) 2016/679 (“GDPR”) took effect on May 25, 2018 and applies to products and services that we provide in Europe, as well as the processing of personal data of European Economic Area (“EEA”) citizens,residents, wherever that processing occurs. The GDPR includes operational requirements for companies that receive or process personal data of residents of the EEA that are different from those that were in place in the EEA prior to the GDPR. Failure to comply with GDPR, or its implementation in the United Kingdom through the Data Protection Act 2018 (“UK GDPR”), may result in significant penalties for non-compliance, ranging from €10 million to €20 million or 2% to 4% of an enterprise’s global annual revenue, whichever is greater in the case of the GDPR orUnited Kingdom, the greater of £17.5 million or 4% of the total worldwide turnover in the preceding financial year or, in the case of the United Kingdom.GDPR, whichever is greater €20 million or 4% of an enterprise’s global annual revenue. In addition to the foregoing, a breach of the GDPR or the UK GDPR could result in regulatory investigations, reputational damage, orders to cease/change our processing of our data, enforcement notices, and/or assessment notices (for a compulsory audit). We may also face civil claims including representative actions and other class
action type litigation (where individuals have suffered harm), potentially amounting to significant compensation or damages liabilities, as well as associated costs, diversion of internal resources, and reputational harm.
ThereIn addition, there is an increasingincreased focus on the self-regulatory mechanisms created to further compliance requirements with respect to the digital advertising ecosystem, including criticism thatthese regulations. For example, the Internet Advertising Bureau (“IAB”) Transparency & Consent Framework (“TCF”) ishas been criticized for being inherently incompatible with GDPR given the high velocity personal data trading. The Belgian Autorité de Protection des Données fined the IAB €250,000 in February 2022 becauseGDPR. As a result, loss of alleged breaches of GDPR. The IAB has indicated that it will appeal the decision. In the interim, our publishers may need to implement changes to the TCF in order for Outbrain to continue personalizing recommendations. Further, in light of this decision, the industry may lose confidence in the TCFsuch mechanisms and further challenges to the TCFslow adoption rates create may undermine the viability of the TCF such that there is no industry standard for requesting and obtaining consent, all of which could negatively affect our business, results of operations, and finalfinancial condition. In addition, the UK Information Commissioner’s Office (“ICO”), the Irish Data Protection Commission and the French Commission Nationale de l”Informatiquel’Informatique et de Libertés (“CNIL”) are investigating continue to investigate the ad tech industry and the use of cookies.
Further, in the European Union, current national laws that implement the ePrivacy Directive (2002/58/EC) will be replaced by an EU Regulation, known as the ePrivacy Regulation, which will significantly increase fines for non-compliance and impose burdensome requirements around placing cookies. While the text of the ePrivacy Regulation is still under development, a European court decision and regulators’ recent guidance in the Court of Justice of the European Union (“CJEU”)CJEU Fashion ID, casePlanet 49, Wirtschaftsakademie cases are driving increased attention to cookies and tracking technologies. On April 7, 2021,technologies and impacting compliance requirements across the Austrian online privacy campaign group NYOB announced that it filed a complaint with the CNIL, against the use of the Google Android Advertising Identifier on the ground that users do not have the opportunity to meaningfully give consent to digital advertising and that this amounts to a violation of ePrivacy laws.ecosystem. As regulators start to enforce a strict approach (which has already begun to occur in Germany, where data protection authorities have initiated a probe into third-party cookies), this has led to systemsregarding the use of cookies, we expect further system changes, limitslimitations on the effectiveness of our marketingadvertising activities, and diverts the attention of our technology personnel, and in the futurecompliance requirements, which may adversely affect our margins, increase costs, and subject us to additional liabilities.
Though GDPR intended to harmonize the privacy and data protection laws across the EEA, member state interpretations of the law continue to vary making an already detailed regulatory frameworkcompliance increasingly complex to comply with.complex. For example, some countries in the EU, such as France and Germany, have adopted a strict approach to the dropping of any cookies without consent, even if cookies are used strictly for technical delivery and not for personalization. Countries in the EU or the UK may adopt similar interpretations regarding strictly technical cookies. ThoughAlthough we developed technical solutions to comply with such cookie limitations, evolving interpretations of required limitations may result in unintended consequences with respect to our operations, such as fraud identification or user experience.
Any failure to achieve required data protection standards may result in lawsuits, regulatory fines, or other actions or liability, all of which may harm our results of operations. It is possible that CCPA (and other U.S. privacy laws), GDPR, UK GDPR and the ePrivacy Regulation in Europe and related standards may be interpreted and applied in manners that are, or are asserted to be, inconsistent with our data management practices or the technological features of our solutions. The risk is further exacerbated because of the evolving interpretationsolutions, and application of privacy andany failure to achieve required data protection laws.standards may result in lawsuits, regulatory fines, or other actions or liability, all of which may harm our results of operations.
In addition to government regulation, privacy advocacy and industry groups may propose new and different self-regulatory standards that either legally or contractually apply to us, our media partners or our advertisers.advertisers, such as the IAB U.S. Global Privacy Platform and Multi-State Privacy Agreement. We are members of self-regulatory bodies that impose additional requirements related to the collection, use, and disclosure of consumer data. Underdata, such as the requirementsright to opt out of these self-regulatory bodies, in addition to other compliance obligations, we are obligated to provide consumers with notice about our usethe sharing or the sale of cookies and other technologies to collect consumer data and of our collection and use of consumer datatheir personal information for certain purposes, and to provide consumers with certain choices relating to the use of consumer data.interest-based advertising purposes. Some of these self-regulatory bodies have the ability to discipline members or participants, which could result in fines, penalties, and/or public censure (which could in turn cause reputational harm). Additionally, some of these self-regulatory bodies might refer violations of their requirements to the Federal Trade Commission or other regulatory bodies. If we were to be found responsible for such a violation, it could adversely affect our reputation, as well as our business, our compliance with self-regulatory frameworks, results of operations, and financial condition.
In Europe, the Digital Services Act (EU) 2022/2065 (“DSA”) will be enforceable from February 2024 and applies to digital services that connect consumers to goods, services, or content in the EEA. Although we have not been classified as a “very large online platform” under the DSA, we may still be required to comply with the provisions of the DSA or support our partners’ compliance with the provisions of the DSA. The DSA imposes stricter obligations on curbing harmful or unlawful content, such as implementing tools to automatically monitor, detect and take down illegal online content; implementing a mechanism for users to easily flag content and to cooperate with “trusted flaggers” (such as NGOs); reinforcing traceability of our customers; implementing a mechanism for the public and businesses to challenge content moderation decisions and seek redress; providing access to vetted researchers to the key data and provision of access to NGOs to public data; increased transparency on the algorithms used for recommending content to users; implementing risk-based controls to prevent the misuse of our tools and independent audits of our risk management systems; implementing mechanisms to adapt swiftly and efficiently in reaction to crises affecting public security or public health; preventing the use of targeted advertising with respect to children targeting and sensitive personal data. Sanctions under the DSA include fines of up to 6% of global turnover in the event of non-compliance and can lead to a ban on operating in the EU in cases of repeated serious breaches. A similar piece of legislation, the Online Safety Bill, is currently being discussed in the UK. In addition to the foregoing, a breach of the DSA could result in regulatory investigations, reputational damage, orders to cease/change our services, enforcement notices, and/or assessment notices (for a compulsory audit). We may also face civil claims including representative actions and other class action type litigation (where individuals have suffered harm), potentially amounting to significant compensation or damages liabilities, as well as associated costs, diversion of internal resources, and reputational harm. In addition, we may be required to indemnify media partners against claims with respect to our advertising content. Our advertisers may not have the ability to satisfy their indemnification obligations to us, in whole or in part, and pursuing any claims for indemnification may be costly or unsuccessful. As a result, we may be required to satisfy indemnification obligations to media partners, or claims against us, with our own assets.
If media partners, advertisers, and data providers do not obtain necessary and requisite consents from consumers for us to process their personal data, we could be subject to fines and liability.
Pursuant to GDPR, the UK GDPR and related ePrivacy laws, media partners and any downstream partners are required to obtain unambiguous consent from EEA data subjects to process their personal data, which the industry has addressed through the release and widespread adoption of the IAB TCF in April 2018 and subsequent 2.0 update in August 2020.TCF. Because we do not have direct relationships with users, we rely on media partners, advertisers, and data providers, as applicable, to implement notice or choice mechanisms required under applicable laws, and transmit notification of the consent (or no consent) of the user to us. Where applicable, we may only use user data to deliver interest-based advertisements where we have consent. If media partners, advertisers, or data providers do not follow the process (and in any event as the legal requirements in this area continue to evolve and develop), we could be subject to fines and liability. We may not have adequate insurance or contractual indemnity arrangements to protect us against any such claims andor losses.
Rulings fromEvolving legislation and mechanisms governing the Courttransfer of Justice of the European Union invalidated the EU-U.S. Privacy Shield as a lawful means for transferring personal data from the EEA or the UK to the United States; this introducesintroduce increased uncertainty and may require us to change our EEA/UK data practices and/or rely on an alternative legally sufficient compliance measure.
The GDPR and the UK GDPR, generally prohibit the transfer of personal data of EEA/UK subjects outside of the EEA/UK, unless a lawful data transfer solution has been implemented or a data transfer derogation applies. On July 16,In 2023, the EU-U.S. Data Privacy Framework (DPF) was adopted as the replacement mechanism for transfer of EU data to the US after the 2020 in a case known as Schrems II, the CJEU ruled on the validity of twoinvalidation of the primary data transfer solutions. The first method, EU-U.S.prior E.U.-U.S. Privacy Shield operatedmechanism. The DPF is a voluntary certification program administered by the U.S.US Department of Commerce (the “Privacy Shield”), was declared invalid as awhich requires companies to self-certify compliance with the DPF principles. Although we are certified under the DPF, this mechanism is already facing legal mechanism to transfer data from EEA/UK to the United States. As a result, despite the fact that we had certified our compliancescrutiny and challenges, similar to the Privacy Shield, we can no longer rely on this mechanism as a lawful meansand its invalidation may impact our ability to transfer EEA/UK data to us in the United States. While the United States and the European Union are in discussions regarding a replacement to the Privacy Shield, we cannot predict if it will happen or if it does, what impact it will have on our business and industry.
The second mechanism, the UK and EEA Standard Contractual Clauses (“SCCs”), were upheld as a valid legal mechanismsmechanism for transnational data transfer. However, the ruling requires that European organizations seeking to rely on the EU SCCs to export data out of the EEA ensure the data is protected to a standard that is “essentially equivalent” to that in the EEA including, where necessary, by taking “supplementary measures” to protect the data. Since the July 28, 2021 UK Adequacy Decision, we rely on such decision for the transfer of data from the EEA to the UK, and the UK SCCs transfers from the UK to the US, with supplementary measures as per the June 2021 European Data Protection Guidelines. Despite such decision, more recent rulings in 2022 from the Austrian Datenschutzbehörde and the French Commission de l’Informatique et des Libertés (CNIL) stated that publishers using Google Analytics are breaching GDPR because the data is sent to the U.S. and Google does not have sufficient protective measures in place for such transfer. It remains unclearbring into question whether supplemental measures for the transfer of data outside of the UK and EEA will be deemed sufficient by media partners, regulatory bodies and courts and, ifcourts. If such supplementary measures are found to be inadequate, this may adversely affect our business, results of operations and financial condition.
In the event that use of the DFP, the SCCs or relying on the UK adequacy decision is subsequentlyare invalidated as a solutionsolutions for data transfers to the United States,U.S., or there are additional changes to the data protection regime in the EEA/UK resulting in any inability to transfer personal data from the EEA/UK to the United StatesU.S. in compliance with data protection laws, European media partners and advertisers may be more inclined to work with businesses that do not rely on such compliance mechanisms to ensure legal and regulatory compliance, such as EEA/UK-based companies or other competitors that do not need to transfer personal data to the United StatesU.S. in order to avoid the above-identified risks and legal issues. Such changes could cause us to incur penalties under GDPR or UK GDPR, could increase the cost and complexity of operating our business, or adversely impact adverse our business, results of operations, and financial condition.
If the security of the confidential information or personal data of our media partners and the users of our media partner properties stored in our systems is breached or otherwise subjected to unauthorized access, our reputation may be harmed and we may be exposed to liability.
We believe that we take reasonable steps to protect the security, integrity and confidentiality of the information we collect and store, but there is no guarantee that inadvertent (e.g., software bugs or other technical malfunctions, employee error or malfeasance, or other factors) or unauthorized disclosure will not occur or that third parties will not gain unauthorized access to this information despite our efforts. To reduce our vulnerability, we have a dedicated information security team responsible for improving and coordinating security across the company. We (i) conduct routine employee training sessions and onboarding security training, including phishing simulation, to increase awareness of phishing and other cyber threats; (ii) require multi-factor authentication access methods for all employees into our network; (iii) operate general monitoring and service protections that are subject to continuous enhancements to detect and mitigate various threats, including performing ongoing manual and automatic vulnerability assessment tests; (iv) manage an ongoing cyber risk-management framework to assess internal technological changes, as well as external systems and services as part of supply chain risk; and (v) maintain ISO 27001 security certification. However, since techniques used to obtain unauthorized access frequently evolve, we may be unable to anticipate these techniques or to implement adequate preventative measures. If our security measures are breached because of third-party action, employee error, malfeasance or otherwise, or if design flaws in our software are exposed and exploited, and, as a result, a third party obtains unauthorized access to any of our users’ data, our relationships with our users may be damaged, and we could incur significant liability and reputational harm. In addition, some jurisdictions have enacted laws requiring companies to notify individuals of data security breaches involving certain types of personal data, and our agreements with certain partners require us to notify them in the event of a security incident. These mandatory disclosures regarding a security breach sometimes lead to negative publicity and may cause our users, media partners or advertisers to lose confidence in the effectiveness of our data security measures. In the European Union/United Kingdom a data breach involving personal data will generally require notification of the national Information Commissioner’s Office and, where the risk to individuals is high, notification of the affected individuals themselves. In the European Union/United Kingdom there is a possibility of significant fines being imposed in the event of a security breach. Any security breach, whether actual or perceived, may harm our reputation, and we could lose users or fail to acquire new users, media partners or advertisers, all of whom may, in addition, have claims against us as a result of a security breach. Users also may be able to bring a class action against us. In addition, security breaches of our media partners, advertisers, vendors or other third parties working with us could also have a negative impact on our reputation and operations.
Any governmental investigations, legal proceedings, or claims against us could result in liability, harm our reputation and could be costly and time-consuming to defend.
From time to time, we may behave been subject to litigation claims, whether arising in connection with employment, competition, or commercial matters, including certain terms in our commercial agreements.matters. We also may be exposed to potential claims brought by third parties against us, our media partners or our advertisers. Such claims may allege, for example, that our advertisers’ recommendations (including the destination page reached) infringe the intellectual property or other rights of third parties, isare false, deceptive, misleading or offensive, or that our advertisers’ products are defective or harmful.
In addition, we may be involved in regulatory issues and government investigations, including, but not limited to, actions relating to competition law. For example, on April 29, 2021, we were notified that the Antitrust Division of the U.S. Department of Justice is conducting a criminal investigation into the hiring activities in our industry that includes us. We continue to cooperate with the Antitrust Division. While there can be no assurance regarding the ultimate resolution of this matter, we do not believe that our conduct violated applicable law.
Our reputation as a business with high standards of regulatory compliance depends in part on our media partners’ and advertisers’ adherence to laws and regulations of multiple jurisdictions concerning copyright, trademark and other intellectual property rights, unfair competition, privacy and data protection, and truth in-advertising, and their use of our platform in ways
consistent with users’ expectations. In general, we require our media partners and advertisers to comply with all applicable laws, including all applicable intellectual property, content, privacy and data protection regulations. We rely on contractual representations from media partners and advertisers that they will comply with all such applicable laws. We make reasonable efforts to enforce contractual notice requirements, but, due to the nature of our business, we are unable to audit fully our media partners’ and advertisers’ compliance with our recommended disclosures or with applicable laws and regulations. If our media partners or advertisers were to breach their contractual or other requirements in this regard, or a court or governmental agency
were to determine that we, our media partners and/or our advertisers failed to comply with any applicable law, then we may be subject to potentially adverse publicity, damages and related possible investigation, litigation or other regulatory activity. In addition, any perception that we, our media partners and/or our advertisers fail to comply with current or future regulations and industry practices may expose us to public criticism, collective redress actions, reputational harm or claims by regulators, which could disrupt our industry and/or operations and expose us to increased liability.
In some instances, we may be required to indemnify media partners against such claims with respect to our advertisers’ campaigns. Therefore, we may require our advertisers to indemnify us for any damages from any such claim, although in certain cases we may not be so indemnified. We cannot assure prospective investors that our advertisers will have the ability to satisfy their indemnification obligations to us, in whole, in part or at all, and pursuing any claims for indemnification may be costly or unsuccessful. As a result, we may be required to satisfy indemnification obligations to media partners, or claims against us, with our own assets.
As a result of any of the above, we could becomehave been involved in litigation or governmental investigations, whether on our own, or involving or concerning our media partners or advertisers, including class action claims, and,or as third-parties required to comply with requests for information or subpoenas. As a result of such actions, we may become subject to significant liability, including claims for damages, financial penalties, and financial penalties.costs of compliance. Claims may be expensive to defend, divert management’s attention from our business operations, and affect the cost and availability of insurance, even if we ultimately prevail. If any of this occurs, it may have a material adverse effect on our reputation, business operations, financial position, competitive position and prospects.
We may be unable to obtain, maintain and protect our intellectual property rights and proprietary information or prevent third parties from making unauthorized use of our intellectual property.
Our intellectual property rights are important to our business. We rely on a combination of confidentiality clauses, trade secrets, copyrights, patents and trademarks to protect our intellectual property and know-how. However, the steps we take to protect our intellectual property may be inadequate. We will not be able to protect our intellectual property if we are unable to enforce our rights or if we do not detect unauthorized use of our intellectual property. Despite our precautions, it may be possible for unauthorized third parties, including our employees, consultants, service providers, media partners or advertisers, to copy our products and/or obtain and use information that we regard as proprietary to create solutions and services that compete with ours. We cannot assure you that the steps taken by us will prevent misappropriation of our trade secrets or technology or infringement of our intellectual property. In addition, the laws of some foreign countries where we operate do not protect our proprietary rights to as great an extent as the laws of the United States, and many foreign countries do not enforce these laws as diligently as government agencies and private parties in the United States.
Our policy is to enter into confidentiality and invention assignment agreements with our employees and consultants and enter into confidentiality agreements with the parties with whom we have strategic relationships and business alliances. No assurance can be given that these agreements will be effective in controlling access to our proprietary information and other intellectual property. Further, these agreements do not prevent our competitors from independently developing technologies that are substantially equivalent or superior to our solutions.
We may from time to time be subject to claims of prior use, opposition or similar proceedings with respect to applications for registrations of our intellectual property, including but not limited to our trademarks and patent applications. The process of seeking patent protection can be lengthy and expensive, and any of our pending or future patent or trademark applications, whether or not challenged, may not be issued with the scope of the claims we seek, if at all. We are unable to guarantee that patents or trademarks will issue from pending or future applications or that, if patents or trademarks issue, they will not be challenged, invalidated or circumvented, or that the rights granted under the patents will provide us with meaningful protection or any commercial advantage. We rely on our brand and trademarks to identify our solutions to our media partners and advertisers and to differentiate our solutions from those of our competitors. If we are unable to adequately protect our trademarks, third parties may use our brand names or trademarks similar to ours in a manner that may cause confusion to our users or confusion in the market, or dilute our brand names or trademarks, which could decrease the value of our brand.
From time to time, we may discover that third parties are infringing, misappropriating or otherwise violating our intellectual property rights. However, policing unauthorized use of our intellectual property and misappropriation of our technology is difficult and we may therefore not always be aware of such unauthorized use or misappropriation. Despite our efforts to protect our intellectual property rights, unauthorized third parties may attempt to use, copy or otherwise obtain and market or distribute our intellectual property rights or technology or otherwise develop solutions with the same or similar functionality as our solutions. If competitors infringe, misappropriate or otherwise misuse our intellectual property rights and we are not adequately protected, or if such competitors are able to develop solutions with the same or similar functionality as ours without infringing our intellectual property, our competitive position and results of operations could be harmed and our legal costs could increase.
We may be subject to intellectual property rights claims by third parties, which are costly to defend and could require us to pay significant damages and could limit our ability to use technology or intellectual property.
We operate in an industry with extensive intellectual property litigation. There is a risk that our business, platform, and services may infringe or be alleged to infringe the trademarks, copyrights, patents, and other intellectual property rights of third parties, including patents held by our competitors or by non-practicing entities. We may also face allegations that our employees have misappropriated or divulged the intellectual property of their former employers or other third parties. Regardless of whether claims that we are infringing patents or other intellectual property rights have any merit, the claims are time consuming, divert management attention and financial resources and are costly to evaluate and defend. Some of our competitors have substantially greater resources than we do and are able to sustain the cost of complex intellectual property litigation to a greater extent and for longer periods of time than we could. Results of these litigation matters are difficult to predict and may require us to stop offering some features, purchase licenses, which may not be available on favorable terms or at all, or modify our technology or our platform while we develop non-infringing substitutes, or incur significant settlement costs. Any of these events could adversely affect our business, results of operations, and financial condition.
Our platform relies on third-party open source software components. Failure to comply with the terms of the underlying open source software licenses could expose us to liabilities, and the combination of open source software with code that we develop could compromise the proprietary nature of our platform.
Our platform utilizes software licensed to us by third-party authors under “open source” licenses and we expect to continue to utilize open source software in the future. The use of open source software may entail greater risks than the use of third-party commercial software, as open source licensors generally do not provide warranties or other contractual protections regarding infringement claims or the quality of the code. To the extent that our platform depends upon the successful operation of the open source software we use, any undetected errors or defects in this open source software could prevent the deployment or impair the functionality of our platform, delay new solutions introductions, result in a failure of our platform, and injure our reputation. For example, undetected errors or defects in open source software could render it vulnerable to breaches or security attacks, and, in conjunction, make our systems more vulnerable to data breaches. Furthermore, some open source licenses contain requirements that we make available source code for modifications or derivative works we create based upon the type of open source software we use. If we combine our proprietary software with open source software in a specific manner, we could, under some open source licenses, be required to release the source code of our proprietary software to the public. This would allow our competitors to create similar solutions with lower development effort and time and ultimately put us at a competitive disadvantage.
Although we monitor our use of open source software to avoid subjecting our platform to conditions we do not intend, we cannot assure you that our processes for controlling our use of open source software in our platform will be effective. If we are held to have breached the terms of an open source software license, we could be required to seek licenses from third parties to continue operating using our solution on terms that are not economically feasible, to re-engineer our solution or the supporting computational infrastructure to discontinue use of code, or to make generally available, in source code form, portions of our proprietary code.
We are required to comply with international advertising regulations in connection with the distribution of advertising, including potential regulation or oversight of native advertising disclosure standards. Failure to comply could negatively impact us, our media partners and/or our advertisers, which could have an adverse effect on our business, results of operations, and financial condition.
We are subject to complex and changing advertising regulations in many jurisdictions in which we operate, including regulatory and self-regulatory requirements to comply with native advertising regulations in connection with the advertising we distribute for our advertisers. For example, in the United States, the Federal Trade Commission requires that all online advertising meet certain principles, including the clear and conspicuous disclosure of advertisements. If we, or our advertisers, make mistakes in implementing this varied and evolving guidance, or our commitments with respect to these principles, we could be subject to negative publicity, government investigation, government or private litigation, or investigation by self-regulatory bodies or other accountability groups. Any such action against us could be costly and time consumingtime-consuming and may require us to change our business practices, cause us to divert management’s attention and our resources and be damaging to our reputation and our business. Moreover, additional or different disclosures may lead to a reduction in user engagement, which could have an adverse effect on our business, results of operations, and financial condition.
Environmental, social and governance (“ESG”) risks could adversely affect the Company's reputation, business and performance and the trading price of its common stock.
Companies are facing increasing scrutiny from investors, customers, regulators and other stakeholders related to their ESG practices and disclosure. The nature, scope and complexity of matters that we must assess and report are expanding due to growing mandatory and voluntary reporting relating to the environment, climate change, diversity and inclusion, workplace conduct and human capital management. Significant expenditures and commitment of time by management, employees and consultants are involved in developing, implementing and overseeing policies, practices, additional disclosures and internal controls related to ESG risk and performance. An inability to implement such policies, practices, and internal controls and maintain compliance with laws and regulations, or a perception among stakeholders that our ESG disclosures and sustainability goals are insufficient, our goals are unattainable or are not an appropriate area of focus could harm our reputation and have an adverse impact on our business, financial condition or results of operations. Investors, investor advocacy groups and investment funds may focus on these practices, especially as they relate to the environment, climate change, diversity and inclusion, workplace conduct and human capital management. Failure to adapt to or comply with regulatory requirements, at the U.S. federal or state level and internationally, or investor or stakeholder expectations and standards could negatively impact our reputation, our ability to do business with certain customers, vendors, suppliers or other third parties, and our stock price. Increased ESG-related compliance costs could result in increases to our overall operational costs which could impact our profitability. Any of the foregoing could have an adverse impact on our business, financial condition or results of operations.
Risks Related to Taxation
Our tax liabilities may be greater than anticipated.
The U.S. and non-U.S. tax laws applicable to our business activities are subject to interpretation and are changing. We are subject to audit by the U.S. Internal Revenue Service and by taxing authorities of the state, local and foreign jurisdictions in which we operate. Our tax obligations are based in part on our corporate operating structure, including the manner in which we develop, value, use and hold our intellectual property, the jurisdictions in which we operate, how tax authorities assess revenue-based taxes such as sales and use taxes, the scope of our international operations, and the value we ascribe to our intercompany transactions. Taxing authorities may challenge, and have challenged, our tax positions and methodologies for valuing developed technology or intercompany arrangements, positions regarding the collection of sales and use taxes, and the jurisdictions in which we are subject to taxes, which could expose us to additional taxes. Any adverse outcomes of such challenges to our tax positions could result in additional taxes for prior periods, interest and penalties, as well as higher future taxes.
In addition, our future tax expense could increase as a result of changes in tax laws, regulations or accounting principles, or as a result of earning income in jurisdictions that have higher tax rates. For example, the European Commission has proposed, and various jurisdictions have enacted or are considering enacting laws that impose separate taxes on specified digital services, which may increase our tax obligations in such jurisdictions. Digital services or other similar taxes could, among other things, increase our tax expense, create significant administrative burdens for us, discourage potential customers from subscribing to our platform due to the incremental cost of any such sales or other related taxes, or otherwise have a negative effect on our financial condition and results of operations. In addition, the Organization for Economic Cooperation and Development is progressing on a Base Erosion and Profit Shifting Project that, if implemented, would change various aspects of the existing framework under which our tax obligations are determined in many of the countries in which we do business. More than 140 countries tentatively signed on to a framework that imposes a minimum tax rate of 15%, among other provisions, and the European Union has adopted a Council Directive which requires these provisions to be transposed into member states’ national laws.As this framework is subject to further negotiation and implementation by each member country, the timing and ultimate impact of any such changes on our tax obligations are uncertain.
Moreover, the determination of our provision for income taxes and other tax liabilities requires significant estimates and judgment by management, and the tax treatment of certain transactions is uncertain. Given uncertainty with respect to the impact of the COVID-19 pandemic on our operations, theThe income tax benefit/expense we record may vary significantly in future periods.periods based on factors outside of our control, such as the uncertainty with respect to the current macroeconomic environment on our operations and our stock price. For example, in periods in which our stock price varies from the grant price of the share-based compensation vesting in that period, we will recognize excess tax benefits or shortfalls that will impact our effective tax rate.
Any changes, ambiguity, or uncertainty in taxing jurisdictions’ administrative interpretations, decisions, policies and positions, including the position of taxing authorities with respect to revenue generated by reference to certain digital services, could also materially impact our income tax liabilities. Although we believe that our estimates and judgments are reasonable, the ultimate outcome of any particular issue may differ from the amounts previously recorded in our financial statements and any such occurrence could adversely affect our business, results of operations, and financial condition.
Future events may impact our deferred tax asset position including deferred tax assets related to our utilization of net operating losses (“NOLs,” each a “NOL”) and U.S. deferred federal income taxes on undistributed earnings of international affiliates that are considered to be reinvested indefinitely.
We evaluate our ability to utilize deferred tax assets and our need for valuation allowances based on available evidence. This process involves significant management judgment regarding assumptions that are subject to change from period to period based on changes in tax laws or variances between future projected operating performance and actual results. We are required to establish a valuation allowance for deferred tax assets if we determine, based on available evidence at the time the determination is made, that it is more likely than not that some portion or all of the deferred tax assets will not be utilized. In making this determination, we evaluate all positive and negative evidence as of the end of each reporting period. Future adjustments (either increases or decreases), to a deferred tax asset valuation allowance are determined based upon changes in the expected realization of the net deferred tax assets. The utilization of our deferred tax assets ultimately depends on the existence of sufficient taxable income in carry-forward periods under the applicable tax law. Due to significant estimates used to establish a valuation allowance and the potential for changes in facts and circumstances, it is possible that we will be required to record adjustments to a valuation allowance in future reporting periods. Changes to a valuation allowance or the amount of deferred taxes could have a materially adverse effect on our business, financial condition and results of operations. Further, while we have no current intention to do so in the foreseeable future, should we change our assertion regarding the permanent reinvestment of the undistributed earnings of certain of our foreign subsidiaries, a deferred tax liability may need to be established.
The ability to fully utilize our NOL and tax credit carryforwards to offset future taxable income may be limited. Under Section 382 of the Internal Revenue Code of 1986, as amended, if a corporation undergoes an “ownership change,” the corporation’s ability to use its pre-change NOL carryforwards to offset its post-change income may be limited. In general, an “ownership change” will occur if there is a cumulative change in our ownership by 5% or greater stockholders that exceeds 50% over a rolling three-year period. Similar rules may apply under state tax laws. We may experience ownership changes in the future as a result of future transactions in our stock. As a result, if we earn net taxable income, our ability to use our pre-change NOL carryforwards or other pre-change tax attributes to offset United States federal and state taxable income may be subject to limitations. Any such limitations on the ability to use our NOL carryforwards and other tax assets could adversely impact our business, financial condition, and operating results.
Risks Related to the Securities Markets and Ownership of Our Common Stock
The trading price of the shares of our common stock is likely to be volatile, and purchasers of our common stock could incur substantial losses.
Technology stocks historically have experienced high levels of volatility. The trading price of our common stock has fluctuated and may continue to do so. These fluctuations could cause you to incur substantial losses, including all of your investment in our common stock. Factors that could cause fluctuations in the trading price of our common stock include the following:
•significant volatility in the market price and trading volume of technology companies in general and of companies in the digital advertising industry in particular;
•announcements of new solutions or technologies, commercial relationships, acquisitions, or other events by us or our competitors;
•price and volume fluctuations in the overall stock market from time to time;
•changes in how advertisers perceive the benefits of our platform and future offerings;
•the public’s reaction to our press releases, other public announcements, and filings with the SEC;
•the trading of or conversion of our Convertible Notes;
•fluctuations in the trading volume of our shares or the size of our public float;
•sales of large blocks of our common stock;
•actual or anticipated changes or fluctuations in our results of operations;
•changes in actual or future expectations of investors or securities analysts;
•litigation involving us, our industry, or both;.
•governmental or regulatory actions or audits;
•regulatory developments applicable to our business, including those related to privacy in the United States or globally;
•general economic conditions and trends;
•major catastrophic events in our domestic and foreign markets; and
•departures of key employees.
In addition, if the market for technology stocks, the stock of digital advertising companies or the stock market, in general, experiences a loss of investor confidence, the trading price of our common stock could decline for reasons unrelated to our business, results of operations, or financial condition. The trading price of our common stock might also decline in reaction to events that affect other companies in the digital advertising industry even if these events do not directly affect us. In the past, following periods of volatility in the market price of a company’s securities, securities class action litigation has often been brought against that company. If litigation is instituted against us, we could incur substantial costs and divert management’s attention and resources. In addition, repurchases pursuant to our share repurchase program could affect our stock price and increase its volatility. The existence of a share repurchase program could also cause our stock price to be higher than it would be in the absence of such a program and could potentially reduce the market liquidity for our stock. There can be no assurance that any share repurchases will enhance stockholder value because the market price of our common stock may decline below the levels at which we repurchased shares of common stock. Although our share repurchase program is intended to enhance long-term stockholder value, short-term stock price fluctuations could reduce the program’s effectiveness. Furthermore, the program does not obligate the Company to repurchase any dollar amount or number of shares of common stock, and may be commenced, suspended or discontinued at any time and any suspension or discontinuation could cause the market price of our stock to decline.
If securities or industry analysts do not publish research or publish unfavorable research about our business, our stock price and trading volume could decline.
The trading market for our common stock depends, to some extent, on the research and reports that securities or industry analysts publish about us or our business. We do not have any control over these analysts. If one or more of the analysts who cover us should downgrade our shares, change their opinion of our business prospects or publish inaccurate or unfavorable research about our business, our share price may decline. If one or more of these analysts who cover us ceases coverage of our company or fails to regularly publish reports on us, we could lose visibility in the financial markets, which could cause our share price or trading volume to decline.
We have broad discretion in the use of proceeds from our IPO and may invest or spend the proceeds in ways with which investors do not agree and in ways that may not yield a return.
We are using the net proceeds from our IPO for working capital and general corporate purposes, including research and development expenditures focused on product development and sales and marketing expenditures aimed at growing our business. We may also use the net proceeds to make acquisitions or investments in complementary companies or technologies. Consequently, our management has broad discretion over the specific use of these net proceeds and may use such proceeds in a way with which our investors disagree. The failure by our management to apply and invest these funds effectively may not yield a favorable return to our investors and may adversely affect our business, results of operations, and financial condition. Pending their use, we may invest the net proceeds from our IPO in a manner that does not produce income or that loses value. If we do not use the net IPO proceeds effectively, our business, results of operations, and financial condition could be adversely affected.
Sales of substantial amounts of our common stock in the public markets, or the perception that they may occur, could cause the market price of our common stock to decline.
The market price of our common stock could decline and may make it more difficult for you to sell your stock at a time and price that you deem appropriate, as a result of substantial sales of our common stock, particularly sales by our directors, executive officers and significant stockholders, a large number of shares of our common stock becoming available for sale or the perception in the market that holders of a large number of shares intend to sell their shares.
Our directors, executive officers and employees hold options and restricted stock units under our equity incentive plans, and the shares issuable upon the exercise of such options or vesting of such restricted stock units have been registered for public resale under the Securities Act. Accordingly, these shares will be able to be freely sold in the public market upon issuance subject to certain legal and contractual requirements.
A small number of significant beneficial owners of our common stock acting together have a significant influence over matters requiring stockholder approval, which could delay or prevent a change of control.
The largest beneficial owners of our common stock, an entity affiliated with Lightspeed Venture Partners, Viola Ventures III, L.P., entities affiliated with Gemini Israel Ventures, entities affiliated with Index Ventures, Gruner + Jahr GmbH, and Yaron Galai together beneficially owned an aggregate 41.7% of our outstanding common stock as of December 31, 2021. As a result, these stockholders, if they act together, could exercise significant influence over our operations and business strategy since they have sufficient voting power to control the outcome of matters requiring stockholder approval. These matters may include:
•the composition of our board of directors which has the authority to direct our business and to appoint and remove our officers;
•approving or rejecting a merger, consolidation or other business combination;
•raising future capital; and
•amending our certificate of incorporation which governs the rights attached to our common stock.
This concentration of ownership of our shares could delay or prevent proxy contests, mergers, tender offers, open-market purchase programs or other purchases of our common stock that might otherwise give you the opportunity to realize a premium over the then-prevailing market price of our common stock. This concentration of ownership may also adversely affect our share price.
Failure to design, implement and maintain effective internal controls may adversely affect investor confidence in our company and, as a result, the value of our common stock.
The Sarbanes-Oxley Act requires, among other things, that we maintain proper and effective internal control over financial reporting. We are required to disclose, on a quarterly basis, material changes made in our internal control over financial reporting. We willare now also be required, pursuant to Section 404 of the Sarbanes-Oxley Act, to furnish a report by management on, among other things, the effectiveness of our internal control over financial reporting as of the end of the first complete fiscal year after our IPO. This assessment will needis required to include disclosure of any material weaknesses identified by our management in our internal control over financial reporting. However, our independent registered public accounting firm will not be required to attest to the effectiveness of our internal control over financial reporting pursuant to Section 404 until the later of the year following our first annual report required to be filed with the SEC, or the date we are no longer an “emerging growth company” as defined in the JOBS Act. At such time, our independent registered public accounting firm may issue a report that is adverse if it is not satisfied with the level at which our controls are documented, designed or operating.
As a newly public company, we have undertaken and
We continue to undertake a range of actions to augment our internal control over financial reporting. These include implementing newreporting and internal controls and procedures and hiring additional accounting and financial reporting staff. We intend to continue to enhance our internal control over financial reporting following our IPO.controls. Any failure of our internal controls could result in a material misstatement in our financial statements. Furthermore, if we are unable to conclude that our internal control over financial reporting is effective at the time that we are required to make such assessment, we could lose investor confidence in the accuracy and completeness of our financial reports, which would cause the price of our common stock to decline, and we may be subject to investigation or sanctions by the SEC.
We are an emerging growth company subject to reduced disclosure requirements, and there is a risk that availing ourselves of such reduced disclosure requirements will make our common stock less attractive to investors.
We are an emerging growth company, and for as long as we continue to be an emerging growth company, we intend to take advantage of exemptions from various reporting requirements such as, but not limited to, not being required to obtain auditor attestation of our reporting on internal control over financial reporting, having reduced disclosure obligations about our executive compensation in our periodic reports and proxy statements, and not being required to hold advisory stockholder votes on executive compensation and stockholder approval of any golden parachute payments not previously approved. If some investors find our common stock less attractive as a result, there may be a less active trading market for our common stock, and our stock price may be more volatile.
In addition, Section 107 of the JOBS Act provides that an emerging growth company can take advantage of an extended transition period for complying with new or revised accounting standards. This provision allows an emerging growth company to delay the adoption of some accounting standards until those standards would otherwise apply to private companies. We have elected to use the extended transition period under the JOBS Act. Accordingly, our consolidated financial statements may not be comparable to the financial statements of public companies that comply with such new or revised accounting standards.
We will remain an emerging growth company until the earliest of: the end of the fiscal year in which the market value of the shares of our outstanding capital stock held by non-affiliates is $700 million or more as of the end of the second quarter of that year, the end of the fiscal year in which we have total annual gross revenue of $1.07$1.235 billion, the date on which we issue more than $1.0 billion in nonconvertible debt in a three-year period, or five years from the date of our IPO.
Our management team has limited experience managing a public company and we will incur significantly increased costs and devote substantial management time as a result of operating as a public company.
Most members of our management team have limited experience managing a publicly traded company, interacting with public company investors, and complying with the increasingly complex laws, rules, and regulations that govern public companies. As a newly public company, we are subject to significant obligations relating to reporting, procedures and internal controls, and our management team may not successfully or efficiently manage such obligations. These obligations and scrutiny will require significant attention from our management and could divert their attention away from the day-to-day management of our business, which could adversely affect our business, results of operations, and financial condition. We expect that these requirements will increase our compliance costs. We have hired, and will need to hire, additional accounting, financial, and legal staff with appropriate public company experience and technical accounting knowledge and may need to establish an internal audit function. We cannot predict or estimate the amount of additional costs we may incur as a result of becoming a public company or the timing of these costs.
As a public company, it is more expensive for us to maintain director and officer liability insurance, and we may be required to accept reduced coverage or incur substantially higher costs to maintain coverage. These factors could also make it more difficult for us to attract and retain qualified members of our board of directors, particularly to serve on our audit committee and qualified executive officers.
The requirements of being a public company may strain our resources, divert management’s attention and affect our ability to attract and retain executive management and qualified board members.
As a newly public company, we are subject to the reporting requirements of the Securities Exchange Act of 1934, as amended or the Exchange Act,(the “Exchange Act”), the Sarbanes-Oxley Act, the Dodd-Frank Wall Street Reform and Consumer Protection Act of 2010, the listing requirements of the Nasdaq and other applicable securities rules and regulations. Compliance with these rules and regulations will increasehas increased our legal and financial compliance costs, makehas made some activities more difficult, time-consuming or costly and increasehas increased demand on our systems and resources, and this will continue particularly after we are no longer an “emerging growth company.”
The Exchange Act requires, among other things, that we file annual, quarterly and current reports with respect to our business and results of operations. The Sarbanes-Oxley Act requires, among other things, that we maintain effective disclosure controls and procedures and internal control over financial reporting. In order to maintain and improve our disclosure controls and procedures and internal control over financial reporting to meet this standard, significant resources and management oversight may be required. As a result, management’s attention may be diverted from other business concerns, which could adversely affect our business, results of operations, and financial condition. We may need to hire more employees in the future or engage outside consultants to comply with these requirements, which will increase our costs and expenses. In addition, changing laws, regulations and standards relating to corporate governance and public disclosure are creating uncertainty for public companies, increasing legal and financial compliance costs and making some activities more time consuming. These laws, regulations and standards are subject to varying interpretations, in many cases due to their lack of specificity, and, as a result, their application in practice may evolve over time as new guidance is provided by regulatory and governing bodies. This could result in continuing uncertainty regarding compliance matters and higher costs necessitated by ongoing revisions to disclosure and governance practices.
We intendhave invested, and may need to further invest in, resources to comply with evolving laws, regulations and standards, and this investment may result in increased general and administrative expenses and a diversion of management’s time and attention from revenue-generating activities to compliance activities. If our efforts to comply with new laws, regulations and standards differ from the activities intended by regulatory or governing bodies due to ambiguities related to their application and practice, regulatory authorities may initiate legal proceedings against us and our business may be adversely affected. However,
As a public company, it is also more expensive for as long as we remain an “emerging growth company” as defined in the JOBS Act,us to maintain director and officer liability insurance, and we may take advantagebe required to accept reduced coverage or incur substantially higher costs to maintain coverage. These factors could also make it more difficult for us to attract and retain qualified members of certain exemptions from various reporting requirements that are applicableour board of directors, particularly to emerging growth companies as described above. We may take advantage of these reporting exemptions until we are no longer an emerging growth company.serve on our audit committee, and qualified executive officers.
We do not intend to pay dividends on our common stock, so any returns will be limited to the value of our common stock.
We have never declared or paid cash dividends on our common stock and do not expect to pay any dividends in the foreseeable future. Any determination to pay dividends in the future will be at the discretion of our board of directors and will depend on a number of factors, including our financial condition, results of operations, capital requirements, general business conditions and other factors that our board of directors may deem relevant. Our current credit facility imposes certain limitations on our ability to pay dividends and any new credit facility may contain certain similar restrictions. Until such time that we pay a dividend, investors must rely on sales of their common stock after price appreciation, which may never occur, as the only way to realize any future gains on their investments.
We may need to raise additional funds to pursue our strategy, and we may be unable to raise capital when needed or on acceptable terms.
From time to time, we may seek additional equity or debt financing to fund our growth, develop new solutions or make acquisitions or other investments. Our business plans may change, general economic, financial or political conditions in our markets may change, or other circumstances may arise that have a material adverse effect on our cash flow and the anticipated cash needs of our business. Any of these events or circumstances could result in significant additional funding needs, requiring us to raise additional capital. We cannot predict the timing or amount of any such capital requirements at this time. If financing is not available on satisfactory terms, or at all, we may be unable to expand our business or to develop new business at the rate desired and our results of operations may suffer.
Anti-takeover provisions in our charter documents and under Delaware law could make an acquisition of our company, which may be beneficial to our stockholders, more difficult and may prevent attempts by our stockholders to replace or remove our current management.
Provisions in our amended and restated certificate of incorporation and amended and restated bylaws may delay or prevent an acquisition of us or a change in our management. These provisions include:
•authorizing “blank check” preferred stock, which could be issued by the board without stockholder approval and may contain voting, liquidation, dividend and other rights superior to our common stock, which would increase the number of outstanding shares and could thwart a takeover attempt;
•a classified board of directors whose members can only be dismissed for cause;
•the prohibition on actions by written consent of our stockholders;
•the limitation on who may call a special meeting of stockholders;
•the establishment of advance notice requirements for nominations for election to our board of directors or for proposing matters that can be acted upon at stockholder meetings; and
•the requirement of at least 75% of the outstanding capital stock to amend any of the foregoing second through fifth provisions.
In addition, because we are incorporated in Delaware, we are governed by the provisions of Section 203 of the Delaware General Corporation Law, which limits the ability of stockholders owning in excess of 15% of our outstanding voting stock to merge or combine with us. Although we believe these provisions collectively provide for an opportunity to obtain greater value for stockholders by requiring potential acquirers to negotiate with our board of directors, they would apply even if an offer rejected by our board were considered beneficial by some stockholders. In addition, these provisions may frustrate or prevent any attempts by our stockholders to replace or remove our current management by making it more difficult for stockholders to replace members of our board of directors, which is responsible for appointing the members of our management.
Item 1B. Unresolved Staff Comments
None.
Item 1C. Cybersecurity Risk Management and Strategy
We have developed and implemented a cybersecurity risk management program intended to protect the confidentiality, integrity, and availability of our critical systems and information. We utilize various risk management guides, as well as the protocols of certain certifications as described below to identify, assess, and manage cybersecurity risks relevant to our business through our risk management program. Our cybersecurity risk management program includes a cybersecurity incident response plan.
We use COBIT, or Control Objectives for Information Technologies, as a framework for risk management and manage various controls as required by ISO 27001, 27017 and 27032 standards. We maintain the following certifications: ISO 27001, ISO 27017 and ISO 27032, Cloud Security Alliance Star level 1 and PCI-DSS SAQ A-EP. Our on-premises data centers are SOC 2 certified.
In addition to our certifications, we (i) conduct routine employee training sessions and onboarding security training, including phishing simulations, to increase awareness of phishing and other cyber threats; (ii) require multi-factor authentication access methods for all employees into our network; (iii) operate general monitoring and service protections that are subject to continuous enhancements to detect and mitigate various threats, including performing ongoing manual and automatic vulnerability assessment tests; and (iv) manage an ongoing cyber risk-management framework to assess internal technological changes, as well as external systems and services as part of supply chain risk.
In an effort to detect vulnerabilities or cyber breaches that we have not yet discovered, we regularly run an exhaustive security testing framework, including scanning all internal and external assets for vulnerabilities, utilizing multiple third-party security testing teams every year, and maintaining a bug bounty program.
Our cybersecurity risk management program is integrated into our overall enterprise risk management program, and shares common methodologies, reporting channels and governance processes that apply across the enterprise risk management program to other legal, compliance, strategic, operational, and financial risk areas.
Our cybersecurity risk management program includes:
•Ongoing risk assessments designed to help identify material cybersecurity risks to our critical systems, information, products, services, and our broader enterprise IT environment;
•a security team principally responsible for managing (1) our cybersecurity risk assessment processes, (2) our security controls, and (3) our response to cybersecurity incidents;
•the use of external service providers, where appropriate, to assess, test or otherwise assist with aspects of our security controls;
•cybersecurity awareness training of our employees, incident response personnel, and senior management;
•a cybersecurity incident response plan that includes procedures for responding to cybersecurity incidents;
•a third-party risk management process for service providers, suppliers, and vendors.
We have not identified risks from known cybersecurity threats, including as a result of any prior cybersecurity incidents, that have materially affected or are reasonably likely to materially affect us, including our business strategy, results of operations, or financial condition.
Cybersecurity Governance
Our Board considers cybersecurity risk as part of its risk oversight function and has delegated to the Audit Committee oversight of cybersecurity and other information technology risks. The Audit Committee oversees management’s implementation of our cybersecurity risk management program.
The Audit Committee receives quarterly reports from management regarding our cybersecurity risks. In addition, management updates the Committee, as necessary, regarding any material cybersecurity incidents, as well as certain other incidents that have lesser impact potential.
The Audit Committee reports to the full Board regarding its activities, including those related to cybersecurity. The full Board also receives briefings from management on our cyber risk management program, including education sessions regarding cybersecurity topics from our Chief Information Officer (CIO) and Chief Information Security Officer (CISO), internal security staff or external experts.
Our Risk Committee, which includes our CEO and other members of management, meets quarterly as part of the Company’s enterprise risk management program, with cybersecurity being the most significant area of review and reporting.
Our security team, including our Governance Risk and Compliance lead (GRC), CISO & CIO, is responsible for assessing and managing our risks from cybersecurity threats. The team has primary responsibility for our overall cybersecurity risk management program and supervises both our internal cybersecurity personnel and our retained external cybersecurity consultants. Our CISO has 25 years experience as a technology leader, with extensive experience within the cybersecurity ecosystem and risk management. He has been certified as a CISO by the Israeli Technion Institute. Our CIO has 15 years experience as a technology leader with extensive cybersecurity experience. He is also CRISC (Certified in Risk and Information Systems Control) certified. Our security team supervises efforts to prevent, detect, mitigate, and remediate cybersecurity risks and incidents through various means, which may include briefings from internal security personnel; threat intelligence and other information obtained from governmental, public or private sources, including external consultants engaged by us; and alerts and reports produced by security tools deployed in the IT environment.
Item 2. Properties
Our corporate headquarters are located in New York, NY, U.S., where we occupy office space consisting of approximately 22,30023,000 square feet pursuant to a lease agreement executed in July 2021 and expiring in October 2027. As of March 2022, we are finalizing construction of our new office space in New York, NY.
Since 2007, we have maintained a presence in Netanya, Israel, which is overseen by one of our founders, where we occupy space consisting of approximately 44,00047,000 square feet under a lease that expires in 2023.2026. In January 2023, we also entered into a new lease in Ljubljana, Slovenia, which is approximately 16,000 square feet and expires in 2032. We use this facilitythese facilities primarily for technology and development, and, to a lesser extent, for general administration and sales and marketing. We maintain a regional office in London, England for general administration and sales and marketing. We also have sales and operations offices in a number of locations around the world, including Amsterdam, Brussels, Chicago,including Cologne, Ljubljana,Germany; Gurugram, India; Madrid, Spain; Milan, Mumbai,Italy; Munich, Germany; Paris, France; São Paolo, Brazil; Singapore; Sydney, Australia; Timişoara, Romania; and Tokyo, and Zurich.Japan.
We believe that our current facilities are adequate to meet our needs forfor the immediate future, and that, should it be needed, suitable additional space will be available to accommodate any expansion of our operations.
Item 3. Legal Proceedings
Information with respect to this item may be found in Note 711 in the accompanying notes to the audited consolidated financial statements included in Part II, Item 8 “Financial Statements and Supplementary Data” of this Report, under “Legal Proceedings and other Matters,” which is incorporated herein by reference.
Item 4. Mine Safety Disclosures
Not applicable.
PART II
Item 5. Market for Registrant's Common Equity, Related Stockholder Matters and Issuer Purchases of Equity Securities
Our common stock began trading on The NASDAQ Stock Market LLC (“Nasdaq”) on July 23, 2021 under the symbol “OB.” Prior to July 23, 2021, there was no established public trading market for our common stock.
Holders of Record
As of February 28, 2022,29, 2024, there were approximatealpproximately 142 holders y 238 holders of record of our common stock. The actual number of the Company’s stockholders is greater than this number of record holders, which does not include stockholders who are the beneficial owners of shares that are held of record by brokers and other nominees.nominee holders.
Dividend Policy
We have never declared or paid cash dividends on our common stock. We currently intend to invest our available funds and any future earnings in the operation of our business, as well as share repurchases, and do not anticipate paying any dividends on our common stock in the foreseeable future. Any future determination to declare dividends will be made at the discretion of our boardBoard of directorsDirectors (“Board”) and will depend on our financial condition, operating results, capital requirements, general business conditions, and other factors that our board may deem relevant.
Unregistered Sales of Equity Securities
(a) Recent Sales of Unregistered Equity Securities
None.
(b) Use of Proceeds
On July 27, 2021, we sold 8,000,000 shares of our common stock in connection with our IPO, at a public offering price of $20.00 per share for an aggregate offering price of $160.0 million. The proceeds from the sale were $145.1 million, after deducting underwriting discounts and commissions and offering expenses payable by us. The offer and sale of all of the shares in our IPO were registered under the Securities Act pursuant to a registration statement on Form S-1 (File No. 333-257525), which was declared effective by the SEC on July 22, 2021.
As of March 1, 2022, a portion of the net proceeds from our IPO have been used for working capital and general corporate purposes, and in January 2022, $37.3 million was used to fund the first installment of the purchase price to acquire video intelligence AG.
There has been no material change in the planned use of proceeds from our IPO as described in our Prospectus filed with the SEC pursuant to Rule 424(b) under the Securities Act.
Purchases of Equity Securities by the Issuer
On February 28,December 14, 2022, our Board of Directors approved a stockshare repurchase program under which we are authorizedauthorizing us to purchaserepurchase up to $30 million of our common stock, par value $0.001 per share, with no requirement to purchase any minimum number of shares. The manner, timing, and actual number of shares repurchased under the program will depend on a variety of factors, including price, general business and market conditions, and other investment opportunities. Shares may be repurchased through privately negotiated transactions or open market purchases, including through the use of trading plans intended to qualify under Rule 10b5-1 under the Securities Exchange Act.Act of 1934, as amended (the “Exchange Act”). The repurchase program may be commenced, suspended, or terminated at any time at our discretion without prior notice.
In addition, we may from time to time withhold shares in connection with tax obligations related to vesting of restricted stock units in accordance with the terms of our equity incentive plans and the underlying award agreements.
The below table sets forth the repurchases of our common stock for the three months ended December 31, 2021:2023:
| | | | | | | | | | | | | | | | | | | | | | | | | | |
| Period | | (a) Total number of shares (or units) purchased (1) | | (b) Average price paid per share (or unit) | | (c) Total number of shares (or units) purchased as part of publicly announced plans or programs | | (d) Maximum number (or approximate dollar value) of shares (or units) that may yet be purchased under the plans or programs |
| October 2021 | | — | | $— | | — | | — |
| November 2021 | | — | | $— | | — | | — |
| December 2021 | | 976,733 | | $13.82 | | — | | — |
| TOTAL | | 976,733 | | $13.82 | | — | | — |
| | | | | | | | | | | | | | | | | | | | | | | | | | |
| Period | | (a) Total number of shares (or units) purchased (1) | | (b) Average price paid per share (or unit) (2) | | (c) Total number of shares purchased as part of publicly announced plans or programs | | (d) Approximate dollar value of shares that may yet be purchased under the plans or programs (in thousands)(2) |
| October 2023 | | 458,348 | | $4.71 | | 440,000 | | $15,421 |
| November 2023 | | 338,377 | | $3.86 | | 336,600 | | $14,128 |
| December 2023 | | 423,786 | | $4.14 | | 408,689 | | $12,436 |
| TOTAL | | 1,220,511 | | $4.28 | | 1,185,289 | | |
_________________
(1) Total number of shares purchased representsincludes shares repurchased under our $30 million share repurchase program, as well as shares withheld to coversatisfy employee tax withholding obligations arising in connection with the vesting and settlement of restricted stock units under the Company’sour 2007 Omnibus Securities and Incentive Plan and our 2021 Long-Term Incentive Plan.
Stock Performance Graph
The following graph compares the cumulative total stockholder return on an initial investment of $100 in our common stock between July 23, 2021 (our initial trading day) and December 31, 2021,2023, with the comparative cumulative total return of an investment of such amount onin (i) the NASDAQ Composite Index (IXIC), (ii) the NASDAQ Internet Index, and (iii) the Russell 2000 Index (RUT) over the same period. We have not paid any cash dividends. Therefore, the total return calculation for us is solely based on the change in the price of our common stock, whereas the data for the comparative indices assumes reinvestment of dividends. The graph assumes the closing market price on July 23, 2021 of $20.00 per sharesshare as the initial value of our common stock. The returns shown below are based on historical results and are not necessarily indicative of, nor intended to forecast, potential future stock price performance. The graph is not deemed “filed” with the SEC and shall not be deemed incorporated by reference into any of our prior or future filings made with the SEC.
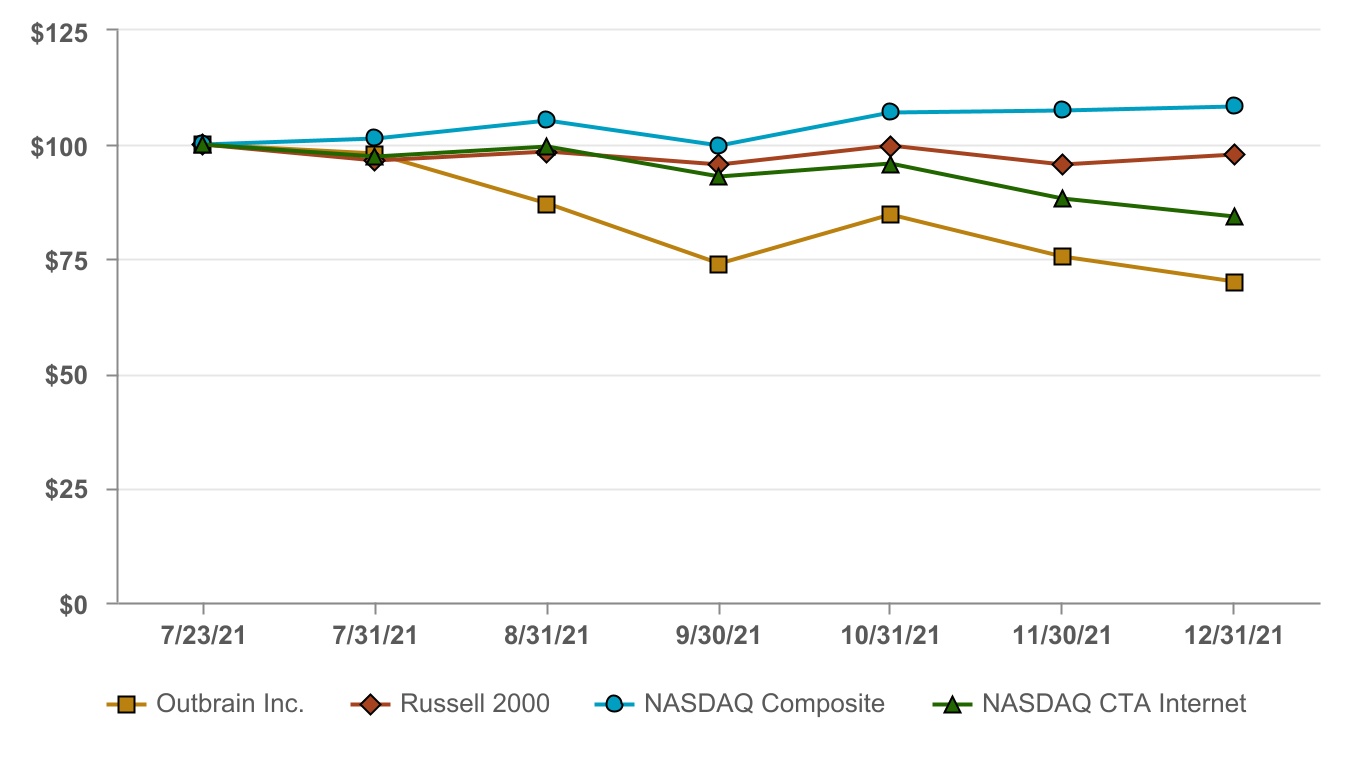

Item 6. [Reserved]
Item 7. Management's Discussion and Analysis of Financial Condition and Results of Operations
You should read the following discussion and analysis of our financial condition and results of operations together with our audited annual consolidated financial statements and the related notes and other financial information included elsewhere in this Annual Report on Form 10-K (this “Report”). In addition to historical financial information, the following discussion contains forward-looking statements that reflect our plans, estimates, beliefs, and expectations, and involve risks and uncertainties.uncertainties that could cause actual results, events, or circumstances to differ materially from those projected in the forward-looking statements. Factors that could cause or contribute to these differences include those discussed below and elsewhere in this Report, particularly under Item 1A, “Risk Factors” and “Note About Forward-Looking Statements.”
The purpose of this Management's Discussion and Analysis of Financial Condition and Results of Operations (“MD&A”) is to provide the readers of our financial statements with narrative information from our management, which is necessary to understand our business, financial condition, and results of operations. The MD&A should be read in conjunction with our audited consolidated financial statements and notes thereto, as well as our Annual Report on Form 10-K for the year ended December 31, 2022, which includes a discussion and analysis of our financial condition and results of operations for the year ended December 31, 2021 in Item 7 of Part II, “Management’s Discussion and Analysis of Financial Condition and Results of Operations.” In addition to the audited consolidated financial statements prepared in accordance with the generally accepted accounting principles in the United States (“GAAP”), we use certain non-GAAP financial measures throughout this discussion to provide investors with supplemental metrics used by our management for financial and operational decision making. These measures are supplemental and are not an alternative to our financial statements prepared in accordance with U.S. GAAP. See “Non-GAAP Reconciliations” in this Report for the definitions and limitations of these measures, and reconciliations to the most comparable U.S. GAAP financial measures.
Business Overview
Outbrain Inc., together (together with our subsidiaries, (“Outbrain”,“Outbrain,” the “Company”, “we”,“Company,” “we,” “our” or “us”) was incorporated in August 2006 in Delaware. The Company is headquartered in New York, New York and has wholly ownedwith various wholly-owned subsidiaries, including in Israel, Europe Asia, Brazil and Australia.Asia.
Outbrain is a leading recommendationtechnology platform poweringthat drives business results by connecting media owners and advertisers with engaged audiences to drive business outcomes, reaching over a billion unique consumers around the open web.world. Outbrain’s artificial intelligence (“AI”) prediction engine powers a two-sided platform for advertisers and media owners that delivers concrete business outcomes. Our technology provides personalization, engagement and monetization solutions toplatform enables thousands of digital media properties, including many of the world’s most prestigious publishers. Through powering discovery feeds on the open web, Outbrain helps over a billion unique users on a monthly basis discover content, offers, servicesowners to provide tailored experiences to their audiences, delivering audience engagement and products they might be interested in.monetization. For tens of thousands of advertisers, around the world, Outbrain helps attract new customersfrom enterprise brands to performance marketers, our platform optimizes audience attention and grow their businesses, driving measurable results andengagement to deliver greater return on investment.investment at each step of the marketing funnel. See Item 1 “Business” in this Report for more information regarding our business, industry, product offerings and growth strategies.
OverOutbrain operates a two-sided marketplace, which means we usually have exclusive control over all aspects of the past decade, consumers have become increasingly accustomedconsumer experience, allowing us to seeing highly curated digital contentquickly test and ads that align with their unique interests. Similar to the way in which socialdeploy new formats for our advertisers and media and search have simplified discovery by synthesizing billions of consumer data points to offer personalized feeds, we provide media partners with a platform that encompasses data at scale as well as prediction and recommendation capabilities, helping media partners deliver a discovery feedpersonalized to their users, based on context and each user’s interests and preferences.
Over the past decade, consumers have become increasingly accustomed to seeing highly curated digital content and ads that align with their unique interests. Similar to the way in which social media and search have simplified discovery by synthesizing billions of consumer data points to offer personalized feeds, we provide media partners with a platform that encompasses data at scale as well as prediction and recommendation capabilities, helping them deliver a discovery feed personalized to their users, based on context and each user’s unique interests and preferences. Our platform is built for user engagement and, as a mobile-first company, is designed to be highly effective on mobile devices. our technology is deployed on the mobile apps and websites of most of our media partners, generating 68% of our revenue in 2021.
owners. Since inception, we have been guided by the same core principles pertaining to our three constituents: consumers, media partners, users, and advertisers.
•Consumers. Our platform is centered on predicting consumer attention and engagement. We believe that by focusing our algorithm on optimizing toward these consumer-centric factors, we are able to cultivate user behavior patterns that compound over time, delivering greater effectiveness and efficiency for our advertisers, superior long-term monetization for our media partners, as well as increased value for Outbrain.
•Media Partners. We are committed to supporting the long-term success of our media partners. Consistent with this philosophy, we focus on establishing a true win-win partnership. We strive to develop trusted, transparent, multi-year contracts with media partners, which are typically exclusive with us.the objective of delivering long-term revenue and deeper audience engagement. Our media partners include both traditional publishers and companies in new and rapidly evolving categories, such as mobile device manufacturers and web browsers.manufacturers.
Users.• We believe that by focusing on improving the user experience we are able to cultivate user behavior patterns that compound engagement over time, delivering superior long-term monetization for ourselves and for our media partners.
Advertisers. We striveoffer unique advertising solutions across the marketing funnel and provide a single access point to grow our advertisingnot only reach, but drive real business by increasing overall useroutcomes from consumers across the Open Internet. We provide advertisers from enterprise brands to performance marketers with solutions to optimize consumer attention and engagement, rather than price per engagement. Our emphasis on user engagement helps us improve advertisers’to deliver accountable business results and greater return on ad spend (“ROAS”) thus unlocking more advertising spend and attracting more advertisers. In turn this enables us to better match ads to users and further grow user engagement and overall monetization.investment.
Through our direct, usually exclusive code-on-page integrations with media partners,owners, we have become one of the largest online advertising platforms on the open web.Open Internet. In 2021,2023, we provided personalized feeds and ads to over 1a billion monthly unique users,consumers, delivering on average over 1012 billion recommendations toexperiences promoting content, services, and products per day, with over 24,000tens of thousands of advertisers directly using our platform.
The following is a summary of our performance for the periods presented:years ended December 31, 2023 and 2022:
•Our revenue grew to $1,015.6was $935.8 million in 2021, from $767.12023, compared to $992.1 million in 2020,2022. Revenue for 2023 included net favorable foreign currency effects of approximately $5.0 million, and $687.3decreased $61.3 million, in 2019.or 6.2% on a constant currency basis.
•Our gross profit was $240.3$184.8 million and our gross margin was 23.7%19.7% in 2021,2023, compared to gross profit of $165.1$192.7 million and gross margin of 21.5%19.4% in 2020, and gross profit of $141.8 million and gross margin of 20.6% in 2019.2022.
•Our Ex-TAC Gross Profit(1) increased to $272.1Profit(1) was $227.4 million in 2021, from $194.32023, compared to $234.8 million in 2020 and $170.3 million in 2019.2022.
•Our net income increased to $11.0was $10.2 million, or 4.6%5.5% of gross profit in 2021,2023, compared to $4.4 million, or 2.6% of gross profit in 2020, and a net loss of $20.5$24.6 million, or (14.5)(12.8)% of gross profit in 2019.2022. Net income for the 20212023 included a one-time tax benefitpre-tax gain of $31.8approximately $22.6 million due to a releaserecorded in 2023 in connection with the repurchase of the valuation allowance on certain U.S. deferred tax assets. Net income for 2021 also included chargeshalf of $42.0 million (pre-tax) to recognize the unamortized discount and deferred financing costs on our senior subordinated secured notes that were exchanged for2.95% convertible notes upon our IPO, as well as $16.5 million of one-time incremental cumulative stock-based compensation expense (pre-tax) for awards with an IPO performance condition.due in 2026.
•Our Adjusted EBITDA(1) increased to $88.9was $28.5 million in 2021, from $41.12023, compared to $26.3 million in 2020 and $19.3 million in 2019.2022. Adjusted EBITDA(1) was 32.7%, 21.2%12.5% and 11.3%11.2% of Ex-TAC Gross Profit(1) in 2021, 20202023 and 2019,2022, respectively.
______________________
(1)Ex-TAC Gross Profit, and Adjusted EBITDA and constant currency measures are non-GAAP financial measures. See “Non-GAAP Reconciliations” in this Report for the definitions and limitations of these measures, and reconciliations to the most comparable U.S. GAAP financial measures.
Recent Developments
Initial Public OfferingIsrael-Hamas War – October 2023
Many of our employees, including certain members of our management team and board of directors, operate from Israel. Accordingly, political, economic and military conditions in Israel and the surrounding region may directly affect our business and operations.
In October 2023, Hamas terrorists infiltrated Israel’s southern border from the Gaza strip and conducted a series of attacks on civilian and military targets. Hamas also launched extensive rocket attacks on the Israeli population and industrial centers located along Israel’s border with the Gaza strip and in other areas within the State of Israel. These attacks resulted in extensive deaths, injuries and the kidnapping of civilians and soldiers. In response, Israel’s security cabinet declared war against Hamas and a military campaign against this terrorist organization commenced in parallel to their continued rocket and terror attacks. In addition, since the commencement of these events, there have been continued hostilities along Israel’s northern border with Lebanon (with the Hezbollah terror organization). Furthermore, the Houthi movement, which controls parts of Yemen, launched several attacks on marine vessels traversing the Red Sea, which were thought either to be in route toward Israel or to be owned by Israeli persons. The Red Sea is a vital maritime route for international trade traveling to or from Israel, and in response to the Houthi movement’s attacks, coalition forces led by the United States and Great Britain have targeted sites in Yemen. It is possible that hostilities with Hezbollah in Lebanon will escalate, and that other terrorist organizations, including Palestinian military organizations in the West Bank as well as other hostile countries, such as Iran, will join the hostilities and these clashes may escalate in the future into a greater regional conflict.
The draft of Israeli military reservists, as well as the evacuation of Israeli citizens from areas near conflict zones have adversely affected our employees impacted by such actions. In addition, future government-imposed restrictions and precautions in response to such conflicts may negatively impact our employees, management and directors by interrupting their ability to effectively perform their roles and responsibilities. In addition, further hostilities involving Israel, the interruption or curtailment of trade between Israel and its trading partners, and/or the willingness to do business with companies with operations in Israel, could adversely affect our business, financial condition and results of operations and could make it more difficult for us to raise capital. The intensity and duration of Israel’s current war against Hamas and the other terror organizations is difficult to predict and we are continuing to monitor the situation and assessing its potential impact on our business.
We cannot attribute the impact of the current trends in advertising demand to any particular factor, including the Israel-Hamas War, and cannot predict the impact if the war continues or escalates further. See Item 1A “Risk Factors” included in this Report for more information regarding certain risks associated with the Israel-Hamas conflict.
The Launch of our New Branding Platform
On July 22, 2021,June 14, 2023, we announced the launch of Onyx by Outbrain™ (Onyx), a new branding platform designed to maximize consumer attention to deliver more effective branding and consideration campaigns. The Onyx product offering consists of an exclusive environment of in-article placements across a number of Outbrain’s premium media owner partners, featuring rich pre-roll video and high-impact formats designed to drive high attention.
Onyx is designed to meet enterprise brand requirements of viewability and brand safety, while delivering value beyond traditional ad views. With Onyx, we have applied Outbrain’s AI prediction engine to an entirely new business offering that will enable brands to reach their target audiences at viewable, premium, high-attention moments across the Open Internet. Onyx diversifies Outbrain’s business model by showcasing the ability to apply our Form S-1 was declared effectiveunique prediction technology beyond performance advertising.
The Onyx environment is designed for brand needs, including third-party brand safety verification and consistently high viewability. Launched in partnership with industry leaders in brand safety and attention-based media measurement, Onyx aims to increase campaign effectiveness by predicting moments of attention and optimizing media spend toward them. Onyx is now available in the U.S. Securities, UK, Japan, Germany, France, and Exchange Commission (the “SEC”)Italy, with additional markets rolling out in the future. With the addition of Onyx, we greatly expanded our total addressable market with our ability to deliver on upper-funnel objectives.
Restructuring
On May 31, 2023, we announced a reduction in our global workforce of approximately 10% to adjust to the continued macroeconomic uncertainty, create additional operating efficiencies, and support our strategic growth and profitability objectives. During the second quarter of 2023, we recorded pre-tax charges of approximately $2.3 million in connection with our IPOthe workforce reduction, primarily related to employee severance and related benefit costs. These costs were in addition to $1.2 million of our common stockseverance and our common stock began trading on Nasdaq on July 23, 2021. On July 27, 2021, we closed our IPO and issued 8,000,000 sharesrelated costs related to other reorganization activities undertaken during 2023.
Partial Repurchase of our common stock at an initial offering price of $20.00 per share, receiving aggregate net proceeds of $145.1 million, after deducting underwriting discounts, commissions and other offering costs.
In connection with the IPO, all of the shares of our convertible preferred stock outstanding automatically converted into an aggregate of 28,091,267 shares of the Company’s common stock, with all series converted on a one-to-one basis, with the exception of Series F, which was converted at 1.14-to-1, based on the terms of the Series F agreement and the IPO price. The total carrying value of convertible preferred stock of $162.4 million was reclassified to stockholders’ equity (deficit).
Reverse Stock Split
In connection with our IPO, our Board of Directors (the “Board”) and our stockholders approved a 1-for-1.70 reverse stock split of our common stock, which became effective on July 13, 2021. All share and per-share amounts for all periods presented in our audited consolidated financial statements and notes thereto have been adjusted retroactively to reflect the reverse stock split and adjustment of the conversion ratio of the convertible preferred stock.
Convertible Senior Notes
On July 1, 2021,April 14, 2023, we completed the sale of $200.0repurchased $118.0 million aggregate principal amount of senior subordinated securedour 2.95% convertible notes due July 1, 2026 (the “Notes”(“Convertible Notes”), in out of the initially issued principal balance of $236.0 millionvia a private placement to institutional investors affiliatedprivately negotiated repurchase agreement with and funds managed by The Baupost Group Securities, L.L.C., pursuantthe sole holder of the Convertible Notes, for approximately $96.2 million in cash, including accrued interest, representing a discount of approximately 19% to the principal amount of the repurchased Convertible Notes. As a Senior Subordinated Secured Note Purchase Agreement dated July 1, 2021 (the “Note Purchase Agreement”). On July 27, 2021,result, we recorded a pre-tax gain of approximately $22.6 million in our audited consolidated statement of operations for the year ended December 31, 2023. In connection with our partial repurchase of Convertible Notes, we redeemed some of our available-for-sale marketable securities prior to their maturities for net proceeds of $78.9 million. Following the closing of our IPOthe repurchase, the repurchased Convertible Notes were cancelled by the Trustee, and pursuant$118.0 million principal amount of the Convertible Notes out of the initially issued principal balance of $236.0 million remains outstanding as of December 31, 2023, and continues to be subject to the terms of the Note Purchase Agreement, we exchanged $200.0 million aggregate principal amountindenture dated as of the Notes due July 1, 2026 for $236.0 million aggregate principal amount of 2.95% Convertible Senior Notes due 2026 (the “Convertible Notes”27, 2021 (“Indenture”), pursuant to an indenture, dated July 27, 2021, between the Company and The Bank of New York Mellon, as trustee. The Convertible Notes will mature on July 27, 2026, unless earlier converted, redeemed or repurchased. See “Liquidity and Capital Resources” for additional information.which they were issued.
AcquisitionsAcquisition
On November 19, 2021,January 5, 2022, we entered into a definitive agreement, by and among Outbrain andcompleted the shareholders acquisition of all of the outstanding shares of video intelligence AG (“vi”), a Swiss-based contextual video technology company for digital media owners, for the acquisition of all of the outstanding shares of vi for aowners. The purchase price of approximately $55 million. The acquisition$54.2 million was completed on January 5, 2022. The purchase price was paid in the formcomprised of cash and Outbrain common stock, with the first installment of $37.3 million in cash and the equity portion paid at closing, and the substantial majority of the remaining cash balance payable in the third quarter of 2022. The equity portion of the purchase price is subject to a post-closing adjustment based on market price355,786 shares of our stock to be determined one year from closing, at which time any required adjustment is to be paid in cash. Aggregate consideration for thecommon stock. This acquisition of vi will not exceed approximately $55 million in total. The purpose of the acquisition was to expandexpanded our video product offerings to include in-stream high-quality video content, delivering a better user experience and more value to itsour advertisers. This acquisition will bewas accounted for as a business combination and the results of the acquired entity will be included in our results of operations beginning as of the acquisition date in 2022.
On April 1, 2019, we completed the acquisition of all the outstanding shares of Ligatus, a German-based native advertising company, pursuant to a share purchase agreement with Gruner + Jahr GmbH. The acquisition date fair value of the consideration transferred was approximately $40.1 million, which consisted of 3,603,179 shares of our common stock. The acquisition was accounted for as a business combination and the results of operations of the acquired entity have been included in our results of operations as of the acquisition date.beginning on January 5, 2022.
As part of our growth strategy, we plan to continue to evaluate strategic acquisition or investment opportunities to add incremental growth with compounding benefitsthat would enhance our technology or market presence and deliver more value to our business, to further expand our offerings, add key technology and/or reach new markets.partners and advertisers.
COVID-19
In March 2020, the World Health Organization declared the spread of the COVID-19 diseaseMacroeconomic Environment
General worldwide economic conditions have recently experienced significant instability, as a global pandemic. The COVID-19 pandemic resulted in a global slowdown of economic activity causing a decrease in demand for a broad variety of goodswell as volatility and services, including those provided by certain advertisers using our platform. Many of our advertisers reduced their advertising spending, which had a negative impact on our revenue during the first half of 2020. As the world quickly shifted to online activities and advertisers gradually shifted their spending toward digital advertising, our revenue trends improved meaningfully and returned to growth beginningdisruption in the second half of 2020. Althoughfinancial markets, resulting from factors including the advertising market and our business have generally recovered from the economic effects of the wars between Russia-Ukraine and Israel-Hamas, the COVID-19 pandemic, bank closures, and general economic uncertainty. The current macroeconomic environment, with variables such as inflation, increased interest rates, bank disruptions, recessionary concerns, bankruptcies, currency exchange rate fluctuations, global supply chain disruptions, and labor shortages and stoppages, and cost inflationmarket volatility, has negatively impacted certain categories of advertisers, such as the automotive advertisers,our advertisers. Accordingly, these conditions have adversely impacted our business and could, if they continue or worsen, adversely impact us in the future, including if our advertisers were to reduce or cutfurther reduce their advertising spending as a result of any of these factors. We continue to monitor our operations, and the operations of those in our ecosystem (including media partners, advertisers, and agencies), as well as government recommendations.. These conditions make it difficult for us, our media partners, advertisers, and agencies to accurately forecast and plan future business activities and could cause a further reduction or delay in overall advertising demand and spending or impact our advertisers’ ability to pay, which would negatively impact our business, financial condition, and results of operations.
Factors Affecting Our Business
Retention and Growth of Relationships with Media Partners
We rely on relationships with our media partners for a significant portion of our advertising inventory and for our corresponding ability to increase revenue through expanding their use of our platform.drive advertising revenue. To further strengthen these relationships, we continuously invest in our technology and product functionality to drive user engagement and monetization by (i) improving our algorithms;algorithms, referred to as our AI prediction engine; (ii) effectively managing our supply and demand; and (iii) expanding the adoption of our enhanced products by media partners.partners; and (iv) expanding our demand capabilities to new formats and business lines such as Onyx.
Our relationships with media partners are typically long-term, exclusive, and strategic in nature. Our top 20 media partners, based on our 20212023 revenue, have been using our platform for an average of over seven years, despite their typical contract length being two to threefour years. Net revenue retention is an important indicator of media partner satisfaction, the value of our platform, as well as our ability to grow revenue from existing relationships.
We calculate media partner net revenue retention at the end of each quarter by starting with revenue generated on media partners’ properties during the same period in the prior year, “Prior Period Retention Revenue.” We then calculate the revenue generated on these same media partners’ properties in the current period, “Current Period Retention Revenue.” Current Period Retention Revenue reflects any expansions within the media partner relationships, such as any additional placements or properties on which we extend our recommendations, as well as contraction or attrition. Our media partner net revenue retention in a quarter equals the Current Period Retention Revenue divided by the Prior Period Retention Revenue. To calculate media partner net revenue retention for year-to-date and annual periods, we sum the quarterly Current Period Retention
Revenue and divide it by the sum of the quarterly Prior Period Retention Revenue. These amounts exclude certain revenue adjustments and revenue recognized on a net basis. Our media partner net revenue retention was 126%86% for the yearyears ended December 31, 2021, 104% for the year ended December 31, 20202023 and 95% for the year ended December 31, 2019 (104% excluding one media partner that we chose not2022, reflecting lower yields mainly due to renew in 2019).
Our growth also dependsweaker demand on our abilityplatform, primarily as a result of the unfavorable macroeconomic conditions and the related impact on advertising spend.
Exploring new media partnerships, especially those that provide us with access to secure new partnerships with media partners.audiences and data sets, also contributes to our growth. New media partners are defined as those relationships in which revenue was not generated in the prior period, except for limited instances where residual revenue was generated on a media partner’s properties. In such instances, the residual revenue would be excluded from net revenue retention above. Revenue generated on new media partners’ properties contributed approximately 7%8% to revenue growth for the year ended December 31, 2021, 7%2023 and 12% for the year ended December 31, 2020 and 10% for the year ended December 31, 2019.2022.
User Engagement with Relevant Media and Advertising Content
We believe thatDriving attention and engagement is athe key pillar of the overall value that our platform provides to users,that drives value for consumers, media partners, and advertisers. Our algorithms enable effectiveAI prediction algorithm manages this dynamic, matching consumers with editorial and advertiser experiences that will deliver attention and engagement of users by facilitatingacross the discovery of content, products and services that they find most interesting, as well as connecting them to personalized ads that are relevant to them.Open Internet. We believe that the user experience has a profound impact on long-termlong term user behavior patterns and thus “compounds” over time, improving our long-termlong term monetization prospects. This principle guides our behavior, and as a result, we do not focus on the price of ads, nor on maximizing such prices, as may be the case with some of our competitors. Given this view, we do not focus on cost-per-click or cost-per-impression as key performance indicators for the business. Consequently, we have a differentiated approachWe strive to monetization as we optimize our algorithmscompound consumer attention and engagement, continually enhancing value for the overall user experience rather than just for the price of each individual user engagement.both advertisers and media owners.
Growth in userattention and engagement is driven by several factors, including enhancements to our recommendation engine,AI prediction technology, growth in the breadth and depth of our data assets, the increase in size and quality of our content and advertising index, user engagement, new media partners, and expansion on existing media partner properties where our recommendations can be served and the adoption of our platform by new media partners. As we grow userattention and engagement, we are able to collect more data enabling us to further enhanceand continually improve our algorithms,prediction engine — which in turn helps us make smarter recommendationsdrives better results for our advertiser and further grow user engagement, providing our platform and our business with a powerfulmedia owner partners. This growth flywheel. We measure the impact of this growth flywheel on our business“flywheel” can be measured by reviewing the growth of Click Through Ratethe consumer data points we drive, such as click-through-rate (“CTR”) for ads on our platform.. CTR improvements increase the number of clicks on our platform. We believe that we have a significant opportunity to further grow userconsumer engagement, and thus our business, as today CTR for ads on our platform is less than 1% of recommendationsads served. With the launch of Onyx, we have expanded the measurable consumer data points that fuel our prediction engine, expanding our ability to drive concrete business outcomes at each step of the marketing funnel.
Advertiser Retention and Growth
We focus on serving adsOur engine serves the ad experiences that are more engagingpredicted to deliver high attention or engagement, rather than on the price of the ads. We believe this approach leads to better return-on-ad-spend (“ROAS”) for advertisers, whether they are focused on driving a performance outcome, or a branding outcome. Our growth is partially driven by retaining and expanding the amount of spend by advertisers on our platform, as well as by acquiring new advertisers. Improving our platform’s functionality and features increasesOur recent launch of Onyx by Outbrain™ expands Outbrain’s total addressable market to now include top of the attractiveness offunnel marketing dollars while also attracting more diverse, premium demand.
We continually invest in enhancements to our platform that allow advertisers to existingdrive concrete business outcomes and new advertisers while also growingROAS. In particular, we are expanding our shareusage of their advertising budgets. We continuously investAI to automate manual tasks in enhancing our technological capabilitiescampaign set up and optimization, and to deliver better ROASenhance advertiser creative and transparency on ad spend, and market these attributes to grow our advertiser base and share of wallet.landing page performance.
Prices paid by advertisers on our platform fluctuate period to period for a variety of reasons, including supply and demand competitionbalance, macroeconomic conditions, and seasonality. While in 2019 and 2020 average prices on an annual basis were down relative to prior year, weWe have noted an upwardexperienced a downward trend resulting in a higherlower average priceprices in 2021,2023 and 2022, compared to 2019 and 2020 levels.normal levels, reflecting unfavorable macroeconomic conditions impacting our industry. Movements in average prices do not necessarily correlate to our revenue or Ex-TAC Gross Profit trends. In order to grow our revenue and Ex-TAC Gross Profit and maximize value for our advertisers and media partners, our focus as a business is on driving user engagementbusiness outcomes and ROAS for advertisers, not on optimizing for price.
For the year ended December 31, 2021, over 24,0002023, tens of thousands of unique advertisers were active on our platform. Inowned and operated platform, in addition we continue to growthe thousands of advertisers who access Outbrain and Onyx environments through our programmatic partnerships, enabling us to grow our advertiser base efficiently.partnerships.
Expansion Into New Environments, New Content Experiences and New Ad Formats
The accelerating pace of technological innovation has rapidly changed consumer habits. The available mediums and adoption, combinedformats for consumers to engage with continuously evolving usermedia has greatly expanded over the last several years. As this evolution in media consumption and consumer behavior and content consumption habits, presents multiple opportunities for growth. The emergence ofcontinues, we are focused on utilizing our AI prediction technology to bring curated, relevant consumer experiences to these new devices, platformsexperiences and environments in which users spend time consuming content is one area of expansion for us. Similarly, the formats in which content can or will be consumed continue to evolve, as well as user-friendly and impactful ad formats that can be delivered in or alongside that content. formats.
Fundamentally, we plan to continue makingto make our platform available for media partners on all types of devices and platforms and all formatsevolve our business to apply our technology to the most popular methods of media that carry their content.
consumption, which now include unique video, high-impact display, and other new media experiences. Examples of new environments in which content consumption is expected to grow include connected TVs, screens for autonomous vehicles and public transport, pre-installed applications on new smartphones, smartphone nativeSmartphones, Smartphone content feeds, gaming applications, and push notificationsnotifications. Additionally, we believe there is a strong opportunity to develop better personalization solutions for the visual and email newsletters.video consumption of news media across the Open Internet.
Through our acquisition of vi in the first quarter of 2022, we expanded our video product offerings to new formats and environments, including pre-roll video formats. With the introduction of Onyx by Outbrain™, we have expanded our investment in applying our AI prediction to these new video and high-impact formats, delivering a curated consumer experience that drives attention for enterprise brands. We are developing solutions that allow media partners, service providers and manufacturersplan to provide better curated, personalized and more engaging content feeds and recommendationscontinue to evaluate strategic acquisition or investment opportunities as part of our growth strategy in these environments.the future.
The development and deployment of new ad formats allow us to better serve users,consumers, media partners and, ultimately, advertisers who seek to target and engage usersconsumers at scale; we believe this continues to open and grow new types of advertiser demand, while ensuring relevance as the environments in which we operate diversify.
Investment in Our Technology and Infrastructure
Innovation is a core tenet of our Company and our industry. We plan to continue our investments in our people and our technology in order to retain and enhance our leadershipcompetitive position. For example, improvements to our algorithmsAI prediction engine help us deliver more relevant ads, driving higher user engagement, thereby improving ROAS for advertisers and increasing monetization for ourour media partners. In addition,
We strongly believe in the transformative power of AI in shaping the future of sustainable media, and have been utilizing AI technology for years to empower both media owners and advertisers in their businesses. We leverage AI in a manner designed to enable media owners to increase their revenues and connect with audiences on their own platforms within the Open Internet. We use machine learning to predict consumer interest and propensity to convert. We make around 1 billion such predictions every second. Our technology has developed into a robust AI machine learning system and is largely homegrown by our Research and Development team. One of the strongest long-term levers in our business is the continuous improvement of our algorithms and the data sets our algorithms learn from. Our direct integrations across our media partners’ properties provide us with a large volume of proprietary first-party data, including context, user interest and behavioral signals. The more data points we have, the better our CTR predictions and yield potential can be.
Our Smartlogic product dynamically adjusts both the arrangement and the formats of content delivered to a user, depending on the user’s preferences and our media partner’s key performance indicators (“KPIs”), designed to provide a tailored and engaging feed experience. We continue to invest in media partner and advertiser focused tools, technology, and products as well as privacy-centric solutions. For example, Keystone by Outbrain™ enables a more holistic management of overall revenue for media owners increasingly focused on revenue diversification.
We believe that our proprietary micro-services, API-based cloud infrastructure provides us with a strategic competitive advantage, as we are able to deploy code an averagehundreds of 300 times per day and grow in a scalable and highly cost-effective manner. As we develop and deploy solutions for enhanced integration of our technologies in new environments, with new content and ad formats, we anticipate activity through our platform to grow. We anticipate that the investment in our technology, infrastructure and solutions will contribute to our long-term growth.
Industry Dynamics
Our business depends on the overall demand for digital advertising, and on the continuous success of our current and prospective media partners.partners, and on general market conditions. Digital advertising is a rapidly evolving and growing industry, with growth that has outpaced the growth of the broaderbroad advertising industry, and it has been more resilient to economic downturns compared to the advertising industry in general.industry. Content consumption is increasingly shiftingcontinues to shift online, requiring media owners to adapt in order to successfully attract, engage and monetize their users. Given the large and growingconsumers. The soaring volume of online content, being generated online,amplified by the latest generative AI innovations, has made content curation tools are increasingly becoming a necessityeven more essential for usersconsumers and media owners alike. Advertisers
AI is revolutionizing content creation, distribution, and personalization; automating tasks like video editing, image recognition, and language translation. AI-powered systems are also improving content delivery, helping media platforms suggest relevant movies, shows, articles, and advertisements to consumers. This is especially important at a time when advertisers increasingly rely onanticipate measurable results from their digital advertising platforms that deliver highly targeted adsinvestments. Our experience in this space enables us to more nimbly capitalize on the opportunities for media owners and measurable performance. advertisers to leverage AI and automation to engage consumers and optimize their business goals.
Regulators across most developed markets are increasingly focused on enacting and enforcing user privacy rules as well as exerting tighter oversight ofon the major ‘walled garden’“walled garden” platforms. Industry participants have recently been, and likely will continue to be, impacted by changes implemented by platform leaders, such as Apple’s change to its Identifier for Advertisers policy and Google’s evolving roadmap pertaining to the use of third-party cookies within its Chrome web browser. See Item 1A, “Risk Factors”Factors'' in this Report for additional information regarding changing industry dynamics with respect to industry participants and the regulatory environment. Given our focus on innovation,context and engagement, the depth and length of our media partner relationships, and our scale, we believe that we are well positioned in the long-term to address and potentially benefit from many of these industry dynamics. Additionally, we are confident that our strength in delivering engagement and clear outcomes for advertisers, built on our proprietary AI prediction engine, aligns well with the ongoing market shift towards increased accountability and expectations of ROAS from digital advertising spend.
Seasonality
The global advertising industry experiences seasonal trends that affect most participants in the digital advertising ecosystem. Our revenue generally fluctuates from quarter to quarter as a result of a variety of factors, including seasonality, as many advertisers allocate the largest portion of their budgets to the fourth quarter of the calendar year to coincide with increased holiday purchasing, as well as the timing of advertising budget cycles. Historically, the fourth quarter of the year has reflected the highest levels of advertiser spending, and the first quarter generally has reflected the lowest level of advertiser spending.
In addition, expenditures by advertisers tend to be cyclical and discretionary in nature, reflecting changes in brand advertising strategy, budgeting constraints, and buying patterns, and a variety of other factors, many of which are outside of our control. The quarterly rate of increase in our traffic acquisition costs is generally commensurate with the quarterly rate of increase in our revenue. However, traffic acquisition costs have, at times, grown at a faster or slower rate than revenue, primarily due to the mix of the revenue generated or contracted terms with media partners. We generally expect these seasonal trends to continue, though historical seasonality may not be predictive of future results given the potential for changes in advertising buying patterns.patterns and macroeconomic conditions. These trends will affect our operating results and we expect our revenue to continue to fluctuate based on seasonal factors that affect the advertising industry as a whole.
Definitions of Financial and Performance Measures
Revenue
We generate revenue from advertisers through ads that we deliver across a variety of media partner properties. We charge advertisers for clicks on and, to a lesser extent, impressions of their ads, depending on how they choose to contract with us. We recognize revenue in the period in which the click or impression occurs.
The amount of revenue that we generate depends on the level of demand from advertisers to promote their content to users across our media partners’ properties. We generate higher revenue at times of high demand, which is also impacted by seasonal factors. For any given marketing campaign, the advertiser has the ability to adjust its price in real time and set a maximum daily spend. This allows advertisers to adjust the estimated ad spend attributable to the particular campaign. Due to the measurable performance that our advertisers achieve with us, a significant portion of our advertisers increase their level of spend with us on an unlimited basis,over time as long as their ROAS objectives are met.
Our agreements with advertisers provide them with considerable flexibility to modify their overall budget, price (cost-per-click or cost-per-impression), and the ads they wish to deliver on our platform.
Traffic Acquisition Costs
We define traffic acquisition costs (“TAC”) as amounts owed to media partners for their share of the revenue we generated on their properties. We incur traffic acquisition costs in the period in which the revenue is recognized. Traffic acquisition costs are based on the media partners’ revenue share or, in some circumstances, based on a guaranteed minimum rate of payment from us in exchange for guaranteed placement of our ads on specified portions of the media partner’s digital properties. These guaranteed rates are typically provided per thousand qualified page views, whereas our minimum monthly payment to the media partner may fluctuate based on how many qualified page views the media partner generates, subject to a maximum guarantee. As such, traffic acquisition costs may not correlate with fluctuations in revenue, and our rates may remain fixed even with a decrease in revenue. Traffic acquisition costs also include amounts payable to programmatic supply partners.
Other Cost of Revenue
Other cost of revenue consists of costs related to the management of our data centers, hosting fees, data connectivity costs and depreciation and amortization. Other cost of revenue also includes the amortization of capitalized software that is developed or obtained for internal use associated with our revenue-generating technologies.
Operating Expenses
Our operating expenses consist of research and development, sales and marketing and general and administrative expenses. The largest component of our operating expenses is personnel costs. Personnel costs consist of wages, benefits, bonuses, stock-based compensation and, with respect to sales and marketing expenses, sales commissions.
Research and Development. Research and development expenses are related to the development and enhancement of our platform and consist primarily of personnel and the related overhead costs, amortization of capitalized software for non-revenue generating infrastructure and facilities costs.
Sales and Marketing. Sales and marketing expenses consist primarily of personnel and the related overhead costs for personnel engaged in marketing, advertising, client services, and promotional activities. These expenses also include advertising and promotional spend on media, conferences, and other events to market our services, and facilities costs.
General and Administrative. General and administrative expenses consist primarily of personnel and the related overhead costs, professional fees, facilities costs, insurance, and certain taxes other than income taxes. General and administrative personnel costs include, among others, our executive, finance, human resources, information technology and legal functions. Our professional service fees consist primarily of accounting, audit, tax, legal, information technology and other consulting costs, including our implementation of theand compliance with Sarbanes-Oxley Act requirements.
Other Income (Expense), Net
Other income (expense), net is comprised of charges related to exchange of senior notes upon IPO,gain (loss) on convertible debt, interest expense and interest income and other income (expense), net..
Charges related to exchangeGain on convertible debt. In 2023, we repurchased $118.0 million of senior notes upon IPO.Charges for the year ended December 31, 2021 includeour outstanding Convertible Notes at a one-time chargediscount of $42.0 million related to accelerated amortizationapproximately 19% of the unamortized discount and deferred issuance costs on the $200.0 million aggregate principal amount and recorded a pre-tax gain of senior subordinated secured notes issued on July 1, 2021 and exchanged to Convertible Notes upon our IPO.$22.6 million.
Interest Expense. Interest expense consists of interest expense on our 2.95%the Convertible Senior Notes, due 2026 (the “Convertible Notes”), our revolving credit facility and capital leases. Interest expense may increase if we incur any borrowings periodically under our revolving credit facility or if we enter into new debt facilities or capital leasing arrangements.
Interest Income and Other Income (Expense), Net.net. Interest income and other income (expense), net primarily consists of interest earned on our cash, and cash equivalents and money market funds, as well asinvestments in marketable securities, discount amortization on our investments in marketable securities, and foreign currency exchange gains and losses. Foreign currency exchange gains and losses, both realized and unrealized, relate to transactions and monetary asset and liability balances denominated in currencies other than the functional currencies.currencies, including mark-to-market adjustments on undesignated foreign exchange forward contracts. Foreign currency gains and losses may continue to fluctuate in the future due to changes in foreign currency exchange rates.
(Benefit) Provision for Income Taxes
(Benefit) provisionProvision for income taxes consists of federal and state income taxes in the United States (U.S.) and income taxes in certain foreign jurisdictions, as well as deferred income taxes and changes in valuation allowance, reflecting the net tax effects of temporary differences between the carrying amounts of assets and liabilities for financial reporting purposes and the amounts used for income tax purposes.
Realization of our deferred tax assets depends on the generation of future taxable income. In considering the need for a valuation allowance, we consider our historical and future projected taxable income, as well as other objectively verifiable evidence, including our realization of tax attributes, assessment of tax credits and utilization of net operating loss carryforwards.
Results of Operations
We have one operating segment, which is also our reportable segment. The following tables set forth our results of operations for the periods presented:
| | Year Ended December 31, |
| 2021 | | 2020 | | 2019 |
| (in thousands) |
| | Year Ended December 31, | | | | Year Ended December 31, |
| | 2023 | | | | 2023 | | 2022 |
| (In thousands) | | | (In thousands) |
| Consolidated Statements of Operations: | Consolidated Statements of Operations: | |
| Revenue | Revenue | | $ | 1,015,630 | | | $ | 767,142 | | | $ | 687,333 | |
| Revenue | |
| Revenue | | | $ | 935,818 | | $ | 992,082 |
| Cost of revenue: | Cost of revenue: | |
| Traffic acquisition costs | |
| Traffic acquisition costs | |
| Traffic acquisition costs | Traffic acquisition costs | | 743,579 | | | 572,802 | | | 517,000 | | | 708,449 | | 757,321 |
| Other cost of revenue | Other cost of revenue | | 31,791 | | | 29,278 | | | 28,548 | | Other cost of revenue | | 42,571 | | 42,108 |
| Total cost of revenue | Total cost of revenue | | 775,370 | | | 602,080 | | | 545,548 | | Total cost of revenue | | 751,020 | | 799,429 |
| Gross profit | Gross profit | | 240,260 | | | 165,062 | | | 141,785 | | Gross profit | | 184,798 | | 192,653 |
| Operating expenses: | Operating expenses: | |
| Research and development | Research and development | | 39,169 | | | 28,961 | | | 26,391 | |
| Research and development | |
| Research and development | | | 36,402 | | 40,320 |
| Sales and marketing | Sales and marketing | | 95,786 | | | 77,570 | | | 78,941 | | Sales and marketing | | 98,370 | | 108,816 |
| General and administrative | General and administrative | | 70,749 | | | 48,354 | | | 51,038 | | General and administrative | | 58,665 | | 57,065 |
| Total operating expenses | Total operating expenses | | 205,704 | | | 154,885 | | | 156,370 | | Total operating expenses | | 193,437 | | 206,201 |
| Income (loss) from operations | | 34,556 | | | 10,177 | | | (14,585) | |
| Loss from operations | | Loss from operations | | (8,639) | | (13,548) |
| Other income (expense), net: | Other income (expense), net: | |
| Charges related to exchange of senior notes upon IPO | | (42,049) | | | — | | | — | |
| Gain on convertible debt | |
| Gain on convertible debt | |
| Gain on convertible debt | | | 22,594 | | — |
| Interest expense | Interest expense | | (3,964) | | | (832) | | | (601) | | Interest expense | | (5,393) | | (7,625) |
| Interest income and other income (expense), net | Interest income and other income (expense), net | | (3,078) | | | (1,695) | | | 152 | | Interest income and other income (expense), net | | 7,793 | | 2,600 |
| Total other expense, net | | (49,091) | | | (2,527) | | | (449) | |
| (Loss) income before provision for income taxes | | (14,535) | | | 7,650 | | | (15,034) | |
| (Benefit) provision for income taxes | | (25,530) | | | 3,293 | | | 5,480 | |
| Total other income (expense), net | | Total other income (expense), net | | 24,994 | | (5,025) |
| Income (loss) before provision (benefit) for income taxes | | Income (loss) before provision (benefit) for income taxes | | 16,355 | | (18,573) |
| Provision for income taxes | | Provision for income taxes | | 6,113 | | 6,008 |
| Net income (loss) | Net income (loss) | | $ | 10,995 | | | $ | 4,357 | | | $ | (20,514) | | Net income (loss) | | $ | 10,242 | | $ | (24,581) |
| Other Financial Data: | Other Financial Data: | | | | | | |
| Research and development as % of revenue | Research and development as % of revenue | | 3.9 | % | | 3.8 | % | | 3.8 | % |
| Research and development as % of revenue | |
| Research and development as % of revenue | | | 3.9 | % | | 4.1 | % |
| Sales and marketing as % of revenue | Sales and marketing as % of revenue | | 9.4 | % | | 10.1 | % | | 11.5 | % | Sales and marketing as % of revenue | | 10.5 | % | | 11.0 | % |
| General and administrative as % of revenue | General and administrative as % of revenue | | 7.0 | % | | 6.3 | % | | 7.4 | % | General and administrative as % of revenue | | 6.3 | % | | 5.8 | % |
Non-GAAP Financial Data: (1) | |
| Ex-TAC Gross Profit | | $ | 272,051 | | | $ | 194,340 | | | $ | 170,333 | |
| Adjusted EBITDA | | $ | 88,884 | | | $ | 41,145 | | | $ | 19,275 | |
| Ex-TAC Gross Profit (1) | |
Ex-TAC Gross Profit (1) | |
Ex-TAC Gross Profit (1) | | | $ | 227,369 | | $ | 234,761 |
Adjusted EBITDA (1) | | Adjusted EBITDA (1) | | $ | 28,455 | | $ | 26,274 |
______________________
(1)Ex-TAC Gross Profit and Adjusted EBITDA are non-GAAP financial measures. See “Non-GAAP Reconciliations” in this Report for the definitions and limitations of these measures, and reconciliations to the most comparable U.S. GAAP financial measures.
Year Ended December 31, 20212023 Compared to Year Ended December 31, 20202022
Revenue
Revenue increaseddecreased by $248.5$56.3 million, or 32.4%5.7%, to $1,015.6$935.8 million in 20212023 from $767.1$992.1 million in 2020.2022. Revenue grew approximately 25.8%, or $198.5 million, from net revenue retention on existing media partners primarily due to increased monetization from higher demand on our platform and our growth in the click-through-rate, and approximately 7.0%, or $53.8 million, from new media partners. Revenue in 2021 also benefited fromfor 2023 included net favorable foreign currency effects of approximately $6.7 million.$5.0 million, and decreased $61.3 million, or 6.2%, on a constant currency basis, compared to the prior year period. Our reported revenue decreased approximately $140.1 million due to net revenue retention of 86% on existing media partners, as we have experienced lower yields mainly due to weaker demand on our platform, reflecting the current macroeconomic conditions and the related impact on advertising spend. This decrease was partially offset by growth of approximately 8%, or $80.1 million, from new media partners.
See “Non-GAAP Reconciliations” for information regarding the constant currency measures provided in this discussion and below to supplement our reported results.
Cost of Revenue and Gross Profit
Traffic acquisition costs increased $170.8decreased $48.9 million, or 29.8%6.5%, to $743.6$708.4 million in 2021,2023, compared to $572.8$757.3 million in the prior year period, includingperiod. Traffic acquisition costs included net unfavorable foreign currency effects of approximately $7.3 million. Traffic$3.9 million, and decreased $52.8 million, or 7.0%, on a constant currency basis, compared to the prior year period. The decrease in traffic acquisition costs grew less than revenuewas primarily due to favorablelower revenue mix from higher margin media partners and improved performance on media owners with guarantee arrangements.from certain deals, partially offset by a net unfavorable change in revenue mix. As a percentage of revenue, traffic acquisition costs decreased to 73.2%75.7% in 2021,2023, from 74.7%76.3% in 2020.2022.
Other cost of revenue increased $2.5$0.5 million, or 8.6%1.1%, to $31.8$42.6 million in 2021,2023, compared to $29.3$42.1 million in the prior year period, primarily due to higher hosting fees due to continued platform improvements, including increased revenue and increaseddata processing capacity, partially offset by lower depreciation expense on server equipment. As a percentage of revenue, other cost of revenue decreased 70increased 30 basis points to 3.1%4.5% in 20212023 from 3.8%4.2% in 2020.2022.
Gross profit increased $75.2decreased $7.9 million, or 45.6%4.1%, to $240.3$184.8 million in 2021,2023, compared to $165.1$192.7 million in 2020,2022, which was primarily attributable to the increasedecrease in revenue partially offset byexceeding the corresponding increasedecrease in the cost of revenue, as previously described. Gross profit for 2023 included net favorable foreign currency effects of approximately $1.0 million, and decreased $8.9 million, or 4.6%, on a constant currency basis, compared to the prior year period.
Ex-TAC Gross Profit
Our Ex-TAC Gross Profit increased $77.8decreased $7.4 million, or 40.0%3.1%, to $272.1$227.4 million in 2021,2023, from $194.3$234.8 million in 2020, including2022. Ex-TAC Gross Profit for 2023 included net unfavorablefavorable foreign currency effects of approximately $0.6 million.$1.1 million, and decreased $8.5 million, or 3.6%, on a constant currency basis, compared to the prior year period. The increasedecrease in Ex-TAC Gross Profit was primarily driven by ourlower revenue growth as well as favorableand a net unfavorable change in revenue mix, from higher margin media partners andpartially offset by improved performance on media owners with guarantee arrangements.from certain deals. See “Non-GAAP Reconciliations” for the related definition and reconciliations to our gross profit.
Operating Expenses
Operating expenses increaseddecreased by $50.8$12.8 million, or 32.8%6.2%, to $205.7$193.4 million in 2021,2023, from $154.9$206.2 million in 2020.2022. Operating expenses for 20212023 included net favorable foreign currency effects of approximately $16.5$4.9 million, of one-time incremental cumulative stock-based compensation expense for awards withand decreased $7.9 million, or 3.8%, on a performance condition that was met uponconstant currency basis, compared to the Company’s IPO, and regulatory matter costs of $6.4 million. Operating expenses for 2020 included terminated merger expenses of $11.2 million, offset in part by a $2.3 million reversal of a tax-contingency recorded in 2019.prior year period. The remaining $36.8 million increasereported decrease in operating expenses was primarily attributable to higherlower personnel-related costs of $25.0$14.1 million primarily reflecting higher(net of $2.9 million of increased severance and related costs), largely due to lower headcount from cost reduction initiatives and incentive-based compensation, as well as increasedfavorable foreign currency effects, lower professional fees of $4.3$2.9 million largely attributable to Sarbanes-Oxley Act implementation costs in the prior year period, and marketing costslower expense of $3.8 million. Operating expenses included net unfavorable foreign currency effects of approximately $4.6 million.$2.2 million related to fully amortized intangible assets from a prior acquisition. These declines were partially offset by a $4.7 million increase in the provision for credit losses and a $2.6 million increase in regulatory fees largely due to a partial insurance recovery in the prior year period.
The components of operating expenses are discussed below:
•Research and development expenses — increased $10.2decreased $3.9 million, primarily attributabledue to increasedlower personnel-related costs to invest in the growth of our platform, including $1.2 million of one-time incremental cumulative stock-based compensation expense related to awards with a performance condition that was satisfied upon our IPO.costs.
•Sales and marketing expenses — increased $18.2decreased $10.5 million, primarily due to highera $7.0 million decrease in personnel-related costs (net of $14.3 million, including $4.2 million of one-time incremental cumulative stock-based compensation expense for awards with a performance condition that was satisfied upon our IPO, as well as higher marketingincreased severance and related costs of $3.6 million.$1.9 million), lower expense of $2.2 million related to fully amortized intangible assets, and lower marketing costs.
•General and administrative expenses — increased $22.4$1.6 million, primarily due to a $4.7 million increase in the provision for credit losses and a $2.6 million increase in regulatory fees, largely due to higher personnel-relateda partial insurance recovery in the prior year period. These increases were partially offset by lower personnel related costs of $18.3$3.2 million including $11.1 million of one-time incremental cumulative stock-based compensation expense for awards with a performance condition that was satisfied upon our IPO, and higherlower professional fees of $10.5$2.9 million, which included regulatory matterlargely attributable to the Sarbanes-Oxley implementation costs of $6.4 million in 2021. Operating expenses for 2020 included terminated merger expenses of $11.2 million, partially offset by a $2.3 million reversal of a tax-contingency recorded in 2019 with a corresponding charge to income tax expense in 2020.the prior year period.
Operating expenses as a percentage of revenue increaseddecreased slightly to 20.3%20.7% in 20212023 from 20.2%20.8% in 2020. 2022, primarily due to the favorable impact of our cost-saving measures, including our global workforce reduction executed in the first half of 2023 to adjust to the continued macroeconomic uncertainty, offset in part by higher severance and benefit costs and provision for credit losses recorded in 2023. We expect our operating expenses on an absolute basis, excluding one-time costs, to increase over the next twelve months due to higher personnel-related costs (including stock-based compensation)modestly in 2024 from 2023, as we invest in key strategic initiatives to support the growth ofinnovation in our business and the current and expected continued competitive labor market conditions, as well as due to an increase in other sales and marketing costs and increased expenses assuming a transition from a fully remote to a hybrid environment over the course of the year. In addition, our overall general and administrative expenses are expected to increase indrive future periods due to incremental costs associated with being a public company.growth.
Total Other Expense,Income (Expense), Net
Total other expense,income (expense), net, increased $30.0 million to $49.1income of $25.0 million in 2021,2023, compared to $2.5net expense of $5.0 million in 2020,2022, primarily due to $42.0driven by the pre-tax gain of approximately $22.6 million of one-time charges recorded in 2021 to recognize2023 in connection with the unamortized discount and deferred issuance costs on senior subordinated secured notes issued on July 1, 2021, uponpartial repurchase of our IPO and convertible senior notes issuance (see Note 6 to the accompanying audited consolidated financial statements for additional information).Convertible Notes. The increase in total other expense,income (expense), net was also attributable to $3.1incremental investment income of $4.4 million recorded in connection with our investment program initiated in July 2022, a favorable change of $3.0 million in mark-to-market adjustments on undesignated foreign exchange forward contracts used to manage our foreign currency exchange risk on net cash flows from our non-U.S. dollar denominated operations, and reduced interest expense onof $2.2 million largely due to our convertible senior notes in 2021, as well as the absencerepurchase of half of the $1.1 million gain on saleoutstanding Convertible Notes in April 2023. These increases were partially offset by higher losses resulting from remeasurement of an asset recordedtransactions denominated in 2020.currencies other than the functional currencies.
(Benefit) Provision for Income Taxes
Benefit fromProvision for income taxes was $25.5$6.1 million in 2021,2023, compared to provision for income taxes of $3.3$6.0 million in 2020, primarily attributable to the release of the valuation allowance on certain deferred tax assets in the U.S.2022. Our effective tax rate was 175.6%37.4% in 2021,2023, compared to 43.0%(32.3)% in 2020. Our 20212022, primarily due to a higher pre-tax income in 2023 (which included a pre-tax gain of approximately $22.6 million on the partial repurchase of our Convertible Notes), as compared to a pre-tax loss in the prior period, and incremental tax expense related to the profitability of non-U.S. jurisdictions, partially offset by a deduction related to foreign-derived intangible income in 2023.
A provision enacted as part of the 2017 Tax Cuts & Jobs Act requires companies to capitalize certain research and experimental expenditures for tax purposes in tax years beginning after December 31, 2021. As a result, as of December 31, 2023, the Company’s U.S. federal net operating losses have been fully utilized, with the exception of those subject to the annual limitation provided for in Section 382 of the Internal Revenue Code of 1986, as amended (the “Code”), which resulted in higher cash taxes and lower effective tax rate was unfavorably impacted by the $31.8 million release of valuation allowance in the U.S. (See Note 11 to the accompanying audited consolidated financial statements for additional information.) Our 2020 effective tax rate was unfavorably impacted by approximately 16.5 percentage points due to certain non-recurring prior year taxes in a foreign tax jurisdiction.deduction related to foreign-derived intangible income.
Our future effective tax rate may be affected by the geographic mix of earnings in countries with different statutory rates. Additionally, our future effective tax rate may be affected by our ongoing assessment of the need for a valuation allowance on our deferred tax assets or liabilities, or changes in tax laws, regulations, or accounting principles, tax planning initiatives, as well as certain discrete items.
Net Income (Loss)
As a result of the foregoing, we recorded net income increased $6.6 million, to $11.0of $10.2 million in 2021, from $4.42023, as compared to net loss of $24.6 million in 2020.2022. As previously discussed, net income for 20212023 included a one-time tax benefit$22.6 million pre-tax gain in connection with our partial repurchase of $31.8 million due to a release of the valuation allowance on certain deferred tax assets. Net income for 2021 also included charges of $42.0 million (pre-tax) to recognize the unamortized discount and deferred financing costs on our senior subordinated secured notes that were exchanged for convertible notes upon our IPO, as well as $16.5 million of one-time incremental cumulative stock-based compensation expense (pre-tax) for awards with an IPO performance condition.Convertible Notes.
Adjusted EBITDA
Our Adjusted EBITDA increased $47.7$2.2 million to $88.9$28.5 million in 20212023 from $41.1$26.3 million in 2020, which was2022, primarily attributabledue to the increase inlower operating expenses, partially offset by lower Ex-TAC Gross Profit, partially offset by the corresponding increase in operating expenses as we continue to invest in our business.previously described. Our Adjusted EBITDA for 2023 included net favorable foreign currency effects of approximately $5.9 million. See “Non-GAAP Reconciliations” for the related definitions of Adjusted EBITDA and reconciliations to our net income.
Year Ended December 31, 2020 Compared to Year Ended December 31, 2019
Revenue
Revenue increased by $79.8 million, or 11.6%, to $767.1 million in 2020 from $687.3 million in 2019. Approximately 7%, or $52 million, of the increase in revenue was from new media partners and approximately 4%, or $27 million, was from net revenue retention on existing media partners as we continue to expand business with them. The COVID-19 pandemic negatively impacted our revenue trends in the first half of 2020. Revenue for the year ended December 31, 2020 benefited from net favorable foreign currency effects of $6.3 million.
Cost of Revenue and Gross Profit
Traffic acquisition costs increased $55.8 million, or 10.8%, in 2020 compared to 2019 including net unfavorable foreign currency effects of $5.3 million, and were generally commensurate with the increase in revenue. As a percentage of revenue, traffic acquisition costs decreased approximately 50 basis points to 74.7% in 2020, compared to 75.2% in 2019.
Other cost of revenue increased $0.7 million, or 2.6%, in 2020 compared to 2019, which was primarily attributable to an increase in services that fluctuate with the growth of ad traffic, largely offset by the favorable impact of cost savings initiatives and efficiency projects. As a percentage of revenue, other cost of revenue decreased 40 basis points to 3.8% in 2020, compared to 4.2% in 2019.
Gross profit increased $23.3 million, or 16.4%, to $165.1 million in 2020 compared to $141.8 million in 2019, which was primarily attributable to the increase in revenue, partially offset by the corresponding increase in cost of revenue, as previously described.
Ex-TAC Gross Profit
Our Ex-TAC Gross Profit increased 14.1% to $194.3 million in 2020, from $170.3 million in 2019, primarily due to revenue growth. See “Non-GAAP Reconciliations” for the related definition and reconciliations to our gross profit.
Operating Expenses
Operating expenses decreased by $1.5 million, or 0.9%, to $154.9 million in 2020 from $156.4 million in 2019. The decrease in operating expenses was mainly attributable to $6.5 million of reduced expenses in connection with the COVID-19 pandemic, including travel and entertainment, facilities, and marketing event expenses, as well as a favorable change of $4.2 million relating to a reversal of a tax-contingency recorded in 2019, as further discussed below. These declines were largely offset by an increase of approximately $9.0 million in personnel-related costs in 2020.
The components of operating expenses are discussed below:
•Research and development expenses—increased $2.6 million, primarily due to higher personnel costs, to invest in the growth of our platform.
•Sales and marketing expenses—decreased $1.4 million, primarily reflecting a decrease of $5.0 million due to reduced expenses in connection with the COVID-19 pandemic, partially offset by an increase of $3.4 million in personnel costs primarily related to higher incentive-based compensation.
•General and administrative expenses—decreased $2.7 million, which included a favorable change of $4.2 million relating to a reversal of a tax-contingency recorded in 2019 and a corresponding charge to income tax expense in 2020, as well as a $3.0 million reduction in expenses in connection with the COVID-19 pandemic and other travel and entertainment expenses. These decreases were partially offset by increased personnel costs of $3.6 million primarily attributable to increased incentive-based compensation costs and $0.6 million of increased acquisition-related costs.
Operating expenses as a percentage of revenue declined by 2.6%, from 22.8% in 2019 to 20.2% in 2020.
Total Other Expense, Net
Total other expense, net, increased $2.1 million, to $2.5 million in 2020 from $0.4 million in 2019, primarily due to higher foreign currency losses of $3.5 million resulting from transactions denominated in currencies other than the functional currencies, partially offset by a $1.1 million gain on sale of an asset.
Provision for Income Taxes
Provision for income taxes decreased by $2.2 million to $3.3 million in 2020 from $5.5 million in 2019. This decrease was primarily attributable to the valuation allowance against one of our foreign subsidiaries’ net operating losses, which was recorded in 2019 and released in 2020 due to the increase in taxable income, as well as higher uncertain tax positions in 2019. Our effective tax rate was 43.0% in 2020, compared to (36.5)% in 2019 due to a loss from operations for that year. Our 2020 effective tax rate was unfavorably impacted by approximately 16.5 percentage points due to certain non-recurring prior year taxes in a foreign tax jurisdiction.
Net Income (Loss)
As a result of the foregoing, net income (loss) increased $24.9 million, to net income of $4.4 million in 2020, from a net loss of $20.5 million in 2019.
Adjusted EBITDA
Our Adjusted EBITDA increased $21.8 million, or 113%, to $41.1 million in 2020 from $19.3 million in 2019, which was primarily attributable to the increase in revenue, partially offset by the corresponding increase in cost of revenue, as previously described. See “Non-GAAP Reconciliations” for the related definitions and reconciliations to our net income.
Non-GAAP Reconciliations
Because we are a global company, the comparability of our operating results is affected by foreign exchange fluctuations. We calculate certain constant currency measures and foreign currency impacts by translating the current year’s reported amounts into comparable amounts using the prior year’s exchange rates. All constant currency financial information being presented is non-GAAP and should be used as a supplement to our reported operating results. We believe that this information is helpful to our management and investors to assess our operating performance on a comparable basis. However, these measures are not intended to replace amounts presented in accordance with U.S. GAAP and may be different from similar measures calculated by other companies.
We present Ex-TAC Gross Profit, Adjusted EBITDA,EBITDA, Adjusted EBITDA as a percentage of Ex-TAC Gross Profit, and Free Cash Flow because they are key profitability measures used by our management and the Board to understand and evaluate our operating performance and trends, develop short-term and long-term operational plans, and make strategic decisions regarding the allocation of capital. Accordingly, we believe that these measures provide information to investors and the market in understanding and evaluating our operating results in the same manner as our management and the Board.
These non-GAAP financial measures are defined and reconciled to the corresponding U.S. GAAP measures below. These non-GAAP financial measures are subject to significant limitations, including those identified below. In addition, other companies in our industry may define these measures differently, which may reduce their usefulness as comparative measures. As a result, this information should be considered as supplemental in nature and is not meant as a substitute for revenue, gross profit, net income (loss) or net cash provided by (used in) operating activities presented in accordance with U.S. GAAP.
Ex-TAC Gross Profit
Ex-TAC Gross Profit is a non-GAAP financial measure. Gross profit is the most comparable U.S. GAAP measure. In calculating Ex-TAC Gross Profit, we add back other cost of revenue to gross profit. Ex-TAC Gross Profit may fluctuate in the future due to various factors, including, but not limited to, seasonality and changes in the number of media partners and advertisers, advertiser demand or user engagements.
There are limitations on the use of Ex-TAC Gross Profit in that traffic acquisition cost is a significant component of our total cost of revenue but not the only component and, by definition, Ex-TAC Gross Profit presented for any period will be higher than gross profit for that period. A potential limitation of this non-GAAP financial measure is that other companies, including companies in our industry which have a similar business, may define Ex-TAC Gross Profit differently, which may make comparisons difficult. As a result, this information should be considered as supplemental in nature and is not meant as a substitute for revenue or gross profit presented in accordance with U.S. GAAP.
The following table presents the reconciliation of Ex-TAC Gross Profit to gross profit, the most directly comparable U.S. GAAP measure, for the periods presented: | | | | | | | | | | | | | | | | | | | | |
| | Year Ended December 31, |
| | 2021 | | 2020 | | 2019 |
| (in thousands) |
| Revenue | | $ | 1,015,630 | | | $ | 767,142 | | | $ | 687,333 | |
| Traffic acquisition costs | | (743,579) | | | (572,802) | | | (517,000) | |
| Other cost of revenue | | (31,791) | | | (29,278) | | | (28,548) | |
| Gross profit | | 240,260 | | | 165,062 | | | 141,785 | |
| Other cost of revenue | | 31,791 | | | 29,278 | | | 28,548 | |
| Ex-TAC Gross Profit | | $ | 272,051 | | | $ | 194,340 | | | $ | 170,333 | |
| | | | | | | | | | | | | | |
| | Year Ended December 31, |
| | 2023 | | 2022 |
| (In thousands) |
| Revenue | | $ | 935,818 | | | $ | 992,082 | |
| Traffic acquisition costs | | (708,449) | | | (757,321) | |
| Other cost of revenue | | (42,571) | | | (42,108) | |
| Gross profit | | 184,798 | | | 192,653 | |
| Other cost of revenue | | 42,571 | | | 42,108 | |
| Ex-TAC Gross Profit | | $ | 227,369 | | | $ | 234,761 | |
Adjusted EBITDA
We define Adjusted EBITDA as net income (loss) before chargesgain related to the exchange of senior notes upon IPO;convertible debt; interest expense; interest income and other (expense) income, (expense), net; (benefit) provision for income taxes; depreciation and amortization; stock-based compensation, and other income or expenses that we do not consider indicative of our core operating performance, including, but not limited to merger and acquisition costs, certain public company implementation related costs, regulatory matter costs, and a tax contingency.severance costs related to our cost saving initiatives. We present Adjusted EBITDA as a supplemental performance measure because we believe it facilitates operating performance comparisons from period to period.
We believe that Adjusted EBITDA provides useful information to investors and others in understanding and evaluating our operating results in the same manner as our management and the Board. However, Adjusted EBITDA is a non-GAAP financial measure and how we calculateour calculation of Adjusted EBITDA is not necessarily comparable to non-GAAP information of other companies. Adjusted EBITDA should be considered as a supplemental measure and should not be considered in isolation or as a substitute orfor any measures of our financial performance that are calculated and reported in accordance with U.S. GAAP.
The following table presents the reconciliation of Adjusted EBITDA to net income (loss), the most directly comparable U.S. GAAP measure, for the periods presented:
| | | | | | | | | | | | | | | | | | | | |
| | Year Ended December 31, |
| | 2021 | | 2020 | | 2019 |
| (in thousands) |
| Net income (loss) | | $ | 10,995 | | | $ | 4,357 | | | $ | (20,514) | |
| Interest expense and other income (expense), net | | 7,042 | | | 2,527 | | | 449 | |
| Charges related to exchange of senior notes upon IPO | | 42,049 | | | — | | | — | |
| (Benefit) provision for income taxes | | (25,530) | | | 3,293 | | | 5,480 | |
| Depreciation and amortization | | 19,470 | | | 18,509 | | | 16,744 | |
| Stock-based compensation | | 26,307 | | | 3,588 | | | 3,876 | |
| Regulatory matter costs | | 6,361 | | | — | | | — | |
Merger and acquisition costs(1) | | 2,190 | | | 11,168 | | | 10,527 | |
Tax contingency(2) | | — | | | (2,297) | | | 2,713 | |
| Adjusted EBITDA | | $ | 88,884 | | | $ | 41,145 | | | $ | 19,275 | |
| Adjusted EBITDA as % of Ex-TAC Gross Profit | | 32.7 | % | | 21.2 | % | | 11.3 | % |
| | | | | | | | | | | | | | |
| | Year Ended December 31, |
| | 2023 | | 2022 |
| (In thousands) |
| Net income (loss) | | $ | 10,242 | | | $ | (24,581) | |
| Interest expense | | 5,393 | | | 7,625 | |
| Interest income and other income (expense), net | | (7,793) | | | (2,600) | |
| Gain related to convertible debt | | (22,594) | | | — | |
| Provision for income taxes | | 6,113 | | | 6,008 | |
| Depreciation and amortization | | 20,702 | | | 26,919 | |
| Stock-based compensation | | 12,141 | | | 11,660 | |
| Regulatory matter costs, net of insurance proceeds | | 742 | | | (1,875) | |
Merger and acquisition costs, public company implementation costs(1) | | — | | | 2,515 | |
| Severance costs | | 3,509 | | | 603 | |
| Adjusted EBITDA | | $ | 28,455 | | | $ | 26,274 | |
| | | | |
| Net income (loss) as % of gross profit | | 5.5 | % | | (12.8) | % |
| Adjusted EBITDA as % of Ex-TAC Gross Profit | | 12.5 | % | | 11.2 | % |
_________________________
(1)Primarily includes costs related to our terminated merger with Taboola.com Ltd., costs related to our acquisition of vi in January 2022, and Ligatus in April 2019, and costs related to our initial public offering and SOX implementation.
(2)Reflects a reversal of a tax contingency recorded within operating expenses in 2019 and a corresponding charge to income tax expense in 2020, net of foreign exchange impact.public company implementation costs.
Free Cash Flow
Free cash flow is defined as cash flow provided by operating activities, less capital expenditures and capitalized software development costs. Free cash flow is a supplementary measure used by our management and the Board to evaluate our ability to generate cash and we believe it allows for a more complete analysis of our available cash flows. Free cash flow should be considered as a supplemental measure and should not be considered in isolation or as a substitute for any measures of our financial performance that are calculated and reported in accordance with U.S. GAAP.
The following table presents the reconciliation of free cash flow to net cash provided by operating activities.
| | Year Ended December 31, |
| 2021 | | 2020 | | 2019 |
| (in thousands) |
| Year Ended December 31, | | | Year Ended December 31, |
| 2023 | | | 2023 | | 2022 |
| (In thousands) | | | (In thousands) |
| Net cash provided by operating activities | Net cash provided by operating activities | $ | 56,762 | | $ | 52,986 | | $ | 16,740 | |
| Purchases of property and equipment | Purchases of property and equipment | (9,743) | | (1,511) | | (2,452) | |
| Capitalized software development costs | Capitalized software development costs | (10,311) | | (8,990) | | (7,935) | |
| Free cash flow | Free cash flow | $ | 36,708 | | $ | 42,485 | | $ | 6,353 | |
LiquidityLIQUIDITY AND CAPITAL RESOURCES
We regularly evaluate the cash requirements for our operations, commitments, development activities and Capital Resourcescapital expenditures and manage our liquidity risk in a manner consistent with our corporate priorities. Our current investment program is focused on achieving maximum returns within our investment policy parameters, while preserving capital and maintaining sufficient liquidity.
We believe that our operating cash flow, cash and cash equivalents and investments will be sufficient to fund our anticipated operating expenses, capital expenditures, interest payments on our long-term debt, and planned share repurchases for at least the next 12 months and the foreseeable future. However, there are multiple factors that could impact our future liquidity, including our business performance, our ability to collect payments from our advertisers, having to pay our media partners even if our advertisers default on their payments, or other factors described under Item 1A “Risk Factors” included in this Report.
Sources of Liquidity
Our primary sources of liquidity are cash receipts from our advertisers, our cash and cash equivalents, cash from our operations, cash generated from our IPOinvestments in marketable securities, and from the offering of our Convertible Notes, as well as available capacity under our revolving credit facility.facility discussed below.
While our collections during the three months ended March 31, 2023 were negatively impacted by the closure of Silicon Valley Bank (“SVB”), we have historically experienced higher cash collections during our first quarter due to seasonally strong fourth quarter sales, and, as a result, our working capital needs typically decrease during the first quarter. We generally expect these trends to continue in future periods.
As of December 31, 2021, we had $455.42023, in addition to cash flow from our operations, our available liquidity was follows:
| | | | | | | | |
| | December 31, 2023 |
| | (In thousands) |
Cash and cash equivalents (1) | | $ | 70,889 | |
| Short-term investments | | 94,313 | |
| Long-term investments | | 65,767 | |
Revolving Credit Facility (2) | | 75,000 | |
| Total | | $ | 305,969 | |
__________________________
(1) As ofDecember 31, 2023, approximately $32.1 million of our cash and cash equivalents of which $45.0 million was held outside of the United States by our non-U.S. subsidiaries. We currently do not have any plans to repatriate our earnings from our foreign subsidiaries. We intend to continue to reinvest our earnings from foreign operations for the foreseeable future, and do not anticipate that we will need funds generated from foreign operations to fund our domestic operations.
Our primary source of operating cash flows is cash receipts from advertisers. We primarily use our operating cash for payments due to media partners and vendors, as well as for personnel costs and other employee-related expenditures. We have historically experienced higher cash collections during our first quarter due to seasonally strong fourth quarter sales, and, as a result, our working capital needs typically decrease during this quarter. We expect these trends to continue as we continue to grow our business.
Our cash flow used in investing activities primarily consists of capital expenditures and capitalized software development costs. We spent $9.7 million in capital expenditures in 2021 and anticipate that our capital expenditures will be between $21 million and $24 million in 2022, including incremental leasehold improvements of approximately $5 million relating to headcount growth and adapting to post-Covid hybrid work environment. Capital expenditures for 2022 will also include expenditures for servers and related equipment and office equipment. However, actual amounts may vary from these estimates.
We believe that the net proceeds from the IPO and the offering of the Notes, together with our cash and cash equivalents and borrowings available to us, will be sufficient to fund our anticipated operating expenses, capital expenditures, and interest payments on our long-term debt for at least the next 12 months and the foreseeable future.In addition, we may use our available cash to make acquisitions or investments in complementary companies or technologies, such as our acquisition of vi in January 2022. We also expect to use cash from our operations to fund share repurchases under our $30 million share repurchase authorization announced in February 2022. However, there are multiple factors that could impact our future liquidity, including our ability to collect payments from our advertisers, having to pay our media partners even if our advertisers decrease their payments due to economic conditions, the continued impacts of the COVID-19 pandemic or other factors described under Item 1A “Risk Factors” included in this Report.
Convertible Notes
On July 1, 2021, we completed the sale of $200.0 million aggregate principal amount of senior subordinated secured notes due July 1, 2026 (the “Notes”), in a private placement to institutional investors affiliated with the funds managed by The Baupost Group, L.L.C. (the “Baupost Investors”), pursuant to a Senior Subordinated Secured Note Purchase Agreement dated July 1, 2021 (the “Note Purchase Agreement”). Upon issuance of the Notes, we recorded a $36.0 million discount in connection with embedded conversion feature, as well as deferred financing costs of $6.0 million in our consolidated balance sheet. The Notes, which were exchanged and cancelled upon the IPO, bore interest that accrued at the rate of (i) prior to July 1, 2024, 10.0% per annum and (ii) on and after July 1, 2024, 14.5% per annum, payable quarterly and were guaranteed by certain of our wholly-owned subsidiaries and secured by a second priority lien on all of our and our subsidiaries’ tangible and intangible assets, subject to certain excluded assets, permitted liens and customary exceptions.
On July 27, 2021, in connection with the closing of our IPO and pursuant to the terms of the Note Purchase Agreement, we exchanged $200 million aggregate principal amount of the Notes due July 1, 2026 for $236.0 million aggregate principal amount of 2.95% Convertible Senior Notes due 2026 (the “Convertible Notes”), pursuant to an indenture, dated as of July 27, 2021 (the “Indenture”), between the Company and The Bank of New York Mellon, as trustee. Upon the issuance of such Convertible Notes, the Notes and our obligations and the guarantee thereunder have been canceled and extinguished. The Convertible Notes will mature on July 27, 2026, unless earlier converted, redeemed or repurchased. In connection with the exchange of Notes to Convertible Notes, we recognized accelerated amortization of the unamortized discount and deferred issuance costs relating to the Notes totaling $42.0 million, which was recorded within charges related to exchange of senior notes upon IPO in our consolidated statement of operations for the year ended December 31, 2021. Deferred financing costs related to Convertible Notes were not material.
Interest on the Convertible Notes accrues from July 27, 2021, and is payable semi-annually in arrears on January 27 and July 27 of each year, beginning on January 27, 2022, at a rate of 2.95% per year. The initial conversion rate for the Convertible Notes is 40 shares of our common stock per $1,000 principal amount of Convertible Notes (equivalent to an initial conversion price of $25 per share of the Company’s common stock), subject to adjustment.
We may not redeem the Convertible Notes prior to July 27, 2024. On or after July 27, 2024, we may redeem for cash all or any portion of the Convertible Notes, at our option, if the last reported sale price of the common stock has been at least 130% of the conversion price then in effect for at least 20 trading days (whether or not consecutive) during any 30 consecutive trading day period (including the last trading day of such period) ending on, and including, the trading day immediately preceding the date on which we provide notice of redemption at a redemption price equal to 100% of the principal amount of the Convertible Notes to be redeemed plus accrued and unpaid interest to, but excluding, the redemption date. In addition, calling any Convertible Note for redemption will constitute a “make-whole fundamental change” (as defined in the Indenture) with respect to that Convertible Note, in which case the conversion rate applicable to the conversion of that Convertible Note will be increased if it is converted by holders after it is called for redemption.
Holders(2) may convert all or any portion of their Convertible Notes, in multiples of $1,000 principal amount, into shares of our common stock at any time until the second scheduled trading day immediately preceding the maturity date, at the conversion rate then in effect. We will settle conversions of the Convertible Notes by paying or delivering, as the case may be, cash, shares of common stock, or a combination thereof, at our election.
Upon the occurrence of a fundamental change (as defined in the Indenture), subject to certain conditions, holders of the Convertible Notes may require us to repurchase for cash all or any portion of their Convertible Notes in principal amounts of $1,000 or an integral multiple thereof, at a repurchase price of the principal amount of the Convertible Notes to be repurchased, plus accrued and unpaid interest to, but excluding, the repurchase date. In addition, following certain corporate events that occur prior to the maturity date or if we deliver a notice of redemption, we will, in certain circumstances, increase the conversion rate for a holder who elects to convert its Convertible Notes in connection with such a corporate event or convert its Convertible Notes called for redemption during the related redemption period, as the case may be.
The Indenture contains customary covenants and events of default.
Revolving Credit Facility
On November 2, 2021, wethe Company entered into the Second Amended and Restated Loan and SecuritySecurity Agreement with SVB, (the “2021 Revolving Credit Facility”), which replaced our prior $35.0 million revolving credit facility that had matured. The 2021 Revolving Credit Facility provides, subject to borrowing availability and certain other conditions, for revolving loans in an aggregate principal amount of up to $75.0 million (the “Facility”), with a $15.0 million sub-facility for letters of credit. Our borrowing availability under the Facility is calculated by reference to a borrowing base which is determined by specified percentages of eligible accounts receivable.receivable, based on the defined borrowing formula. On July 18, 2023, the Company entered into a first amendment to the Facility to convert the borrowing rate from LIBOR to SOFR and reduce the required level of domestic cash deposits that the Company is required to maintain at SVB. On March 27, 2023, First Citizens Bank entered into an agreement with FDIC to acquire Silicon Valley Bridge Bank, N.A., assuming all customer deposits and certain other liabilities of Silicon Valley Bridge Bank, N.A. As a result, the Facility remained in effect with First Citizens Bank. The Facility will terminate on the earlier of (i) November 2, 2026 or (ii) 120 days prior to the maturity date of the Company’s 2.95% Convertible Senior Notes, due 2026, unless the Convertible Notes have been converted to our common equity securities of the Company.securities.
Outstanding loans under the Facility accrue interest, at our option, at a rate equal to either (a) a base rate minus an applicable margin ranging from 1.5% to 1.0% per annum or (b) LIBOR plus an applicable margin of 1.5% to 2.0% per annum, in each case based upon borrowing availability under the Facility. The undrawn portions of the commitments under the Facility are subject to a commitment fee at a rate ranging from 0.20% per annum to 0.30% per annum, based upon borrowing availability under the Facility.
The 2021 Revolving Credit Facility contains representations and warranties, including, without limitation, with respect to collateral; accounts receivable; financials; litigation, indictment and compliance with laws; disclosure and no material adverse effect, each of which is a condition to funding. Additionally, the 2021 Revolving Credit Facility includes events of default and customary affirmative and negative covenants applicable to us and our subsidiaries, including, without limitation, restrictions on liens, indebtedness, investments, fundamental changes, dispositions, restricted payments, and prepayment of the Convertible Notes and of junior indebtedness. The 2021 Revolving Credit Facility contains a financial covenant that requires, in the event that credit extensions under the Facility equal or exceed 85% of the lesser of the available commitments under the Facility or upon the occurrence of an event of defaults, our Company to maintain a minimum consolidated monthly fixed charge coverage ratio of 1.00.
Our obligations and the obligations of the other subsidiary co-borrowers under the 2021 Revolving Credit Facility are secured by a first-priority lien on substantially all our assets and the assets such other subsidiary co-borrowers.
We were in compliance with all of the financial covenants under the 2021 Revolving Credit Facility as of December 31, 2021. As of December 31, 20212023 and December 31, 2020, we had no borrowings outstanding2022. See Note 9 to the accompanying audited financial statements for additional information relating to the Facility.
Material Cash Requirements
Our primary uses of liquidity are payments to our media partners, our operating expenses, capital expenditures, our long-term debt and the related interest payments, and repurchases under our revolving credit facilities. The$30 million share repurchase program. We may also use our available borrowing capacity under our 2021 Revolving Credit Facility as of December 31, 2021 was $75.0 million based on the defined borrowing formula. Deferred financing costs of $0.5 million were recorded within other assets on the Company’s consolidated balance sheet as of December 31, 2021.cash to make acquisitions or investments in complementary companies or technologies.
We primarily use our operating cash for payments due to media partners and vendors, as well as for personnel costs, and other employee-related expenditures. Our contracts with media partners are generally variable based on volume or guarantee a minimum rate of payment if the media partner reaches certain performance targets. See “Definitions of Financial and Performance Measures —Traffic Acquisition Costs.”
Contractual Cash FlowsObligations
The following table summarizes the major components of net cash flows for the periods presented:
| | | | | | | | | | | | | | | | | |
| Year Ended December 31, |
| 2021 | | 2020 | | 2019 |
| (in thousands) |
| Net cash provided by operating activities | $ | 56,762 | | | $ | 52,986 | | | $ | 16,740 | |
| Net cash used in investing activities | (20,101) | | | (9,423) | | | (7,589) | |
| Net cash provided by (used in) financing activities | 325,894 | | | (4,228) | | | (3,659) | |
| Effect of exchange rate changes | (1,030) | | | 4,750 | | | 64 | |
| Net increase in cash, cash equivalents and restricted cash | $ | 361,525 | | | $ | 44,085 | | | $ | 5,556 | |
Operating Activities
Net cash provided by operating activities increased $3.8 million, to $56.8 million in 2021,presents our material contractual obligations as compared to $53.0 million in 2020, primarily driven by a $48.7 million increase in our net income after non-cash adjustments, largely offset by net use of cash related to working capital of $33.1 million, primarily due to the timing of payments, and increase in other assets of $9.2 million, due to higher prepayments to certain media owners in connection with long-term contracts.
Net cash provided by operating activities increased $36.3 million, to $53.0 million in 2020 from $16.7 million in 2019, primarily due to a $21.2 million increase in net income after non-cash adjustments. Net cash provided by operating activities also reflected a $14.9 million net increase related to favorable changes in working capital, primarily attributable to the growth in our business, particularly in the fourth quarter of 2020, and improved cash collections.
Investing Activities
Cash used in investing activities increased $10.7 million, to $20.1 million in 2021 from $9.4 million in 2020, primarily due to higher capital expenditures of $8.2 million.
Cash used in investing activities increased $1.8 million, to $9.4 million in 2020 from $7.6 million in 2019, primarily due to lower cash flows related to our acquisition and disposal activities.
Financing Activities
Cash from financing activities increased $330.1 million to $325.9 million in 2021, largely due to net proceeds from common stock issuance upon our IPO of $145.1 million and net proceeds related to issuances of long-term debt of $193.3 million. These increases in cash from financing activities were partially offset by a $13.9 million increase in payments in connection with shares withheld to cover employee tax withholding obligations on vested stock-based compensation awards, primarily in connection with our IPO.
Cash used in financing activities increased by $0.5 million, to $4.2 million in 2020 from $3.7 million in 2019 reflecting lower proceeds from exercises of stock options and warrants and increased principal payments on capital lease obligations.
Contractual Obligations
As of December 31, 2021, our contractual obligations are as follows:2023:
| | | | | | | | | | | | | | | | | | | | | | | | | | | | | |
| Payments Due by Period |
| Total | | 2022 | | 2023-2024 | | 2025-2026 | | 2027 |
| (in thousands) |
| Long-term debt | $ | 236,000 | | | $ | — | | | $ | — | | | $ | 236,000 | | | $ | — | |
| Interest | 34,810 | | | 6,962 | | | 13,924 | | | 13,924 | | | — | |
Operating lease obligations(1) | 15,068 | | | 4,214 | | | 5,896 | | | 4,029 | | | 929 | |
Capital lease obligations(2) | 5,327 | | | 3,329 | | | 1,998 | | | — | | | — | |
Other commitments(3) | 41,371 | | | 24,810 | | | 11,545 | | | 5,016 | | | — | |
Total(4) | $ | 332,576 | | | $ | 39,315 | | | $ | 33,363 | | | $ | 258,969 | | | $ | 929 | |
| | | | | | | | | | | | | | | | | | | | | | | | | | | | | |
| Payments Due by Period |
| Total | | 2024 | | 2025-2026 | | 2027-2028 | | Thereafter |
| (In thousands) |
Long-term debt (1) | $ | 118,000 | | | $ | — | | | $ | 118,000 | | | $ | — | | | $ | — | |
Interest (1) | 10,443 | | | 3,481 | | | 6,962 | | | — | | | — | |
Operating lease obligations (2) | 15,126 | | | 4,481 | | | 6,722 | | | 2,859 | | | 1,064 | |
Finance lease obligations (3) | 256 | | | 256 | | | — | | | — | | | — | |
Other commitments(4) | 50,239 | | | 31,396 | | | 18,627 | | | 216 | | | — | |
Total (5) | $ | 194,064 | | | $ | 39,614 | | | $ | 150,311 | | | $ | 3,075 | | | $ | 1,064 | |
___________________
(1)Our Convertible Notes are due July 27, 2026, with interest payable semi-annually in arrears on January 27 and July 27 of each year. As a result of the partial repurchase of half of our Convertible Notes in April 2023, our remaining commitment relating to long-term debt has been reduced to $118 million. See Note 9 to the accompanying audited financial statements for additional information, including conditions for early redemption.
(2)Operating lease agreements primarily relate to leases for certain office facilities.facilities and managed data center facilities, including one new operating lease agreement that has not yet commenced with future lease payments of approximately $0.6 million. See Note 8 to the accompanying financial statements for additional information relating to our leases.
(2)(3)Capital lease and other obligations relate to prior leases for certain servers and related equipment. For the year ended December 31, 2021,2023, we made regular payments totaling $4.9$1.8 million on our capitalfinance lease obligations. See Note 8 to the accompanying audited consolidated financial statements for additional information relating to our leases.
(3)(4)Other commitments include data service contracts and other hosting agreements, network services, and other costs to maintain our platform.
(4)(5)We are unable to reliably estimate the timing of future payments related to uncertain tax positions; therefore, we have excluded $3.3$8.4 million from the preceding table related to uncertain tax positions, including accrued interest and penalties as of December 31, 2021.2023.
ObligationsTreasury Share Repurchases
On December 14, 2022, our Board approved a new stock repurchase program, authorizing us to repurchase up to $30 million of our common stock, par value $0.001 per share, with no requirement to purchase any minimum number of shares. The manner, timing, and actual number of shares repurchased under contractsthe program will depend on a variety of factors, including price, general business and market conditions, and other investment opportunities. Shares may be repurchased through privately negotiated transactions or open market purchases, including through the use of trading plans intended to qualify under Rule 10b5-1 under the Exchange Act. The repurchase program may be commenced, suspended, or terminated at any time at our discretion without prior notice. As of December 31, 2023, the remaining repurchase availability under our $30 million share repurchase program was $12.4 million, reflecting repurchases of 3,729,462 shares for $17.8 million in 2023. Commission costs associated with share repurchases and excise taxes accrued as a result of the Inflation Reduction Act of 2022 do not reduce the remaining authorized amount under the repurchase programs.
During 2022, we repurchased 6,389,129 shares with a fair value of $30.2 million, including commissions, under our prior $30 million share repurchase program authorized in February 2022.
In addition to our publicly announced programs, we periodically withhold shares to satisfy employee tax withholding obligations arising in connection with the vesting of restricted stock units and exercise of options and warrants in accordance with the terms of our equity incentive plans and the underlying award agreements. During 2023 and 2022, we withheld 163,265 shares and 245,465 shares, respectively, with a fair value of $0.8 million and $2.5 million, respectively, to satisfy the minimum employee tax withholding obligations.
Capital Expenditures
Our cash flow used in investing activities primarily consists of capital expenditures and capitalized software development costs. We spent $10.1 million in capital expenditures in 2023, primarily relating to expenditures for servers and related equipment, leasehold improvements, and office equipment. We currently anticipate that we can cancel withoutour capital expenditures will be between $9 million and $11 million in 2024, primarily relating to expenditures for servers and related equipment and other equipment. However, actual amounts may vary from these estimates.
Cash Flows
The following table summarizes the major components of our net cash flows for the periods presented:
| | | | | | | | | | | |
| Year Ended December 31, |
| 2023 | | 2022 |
| (In thousands) |
| Net cash provided by operating activities | $ | 13,746 | | | $ | 3,813 | |
| Net cash provided by (used in) investing activities | 69,640 | | | (317,898) | |
| Net cash used in financing activities | (117,068) | | | (31,699) | |
| Effect of exchange rate changes | (1,004) | | | (4,043) | |
| Net decrease in cash, cash equivalents and restricted cash | $ | (34,686) | | | $ | (349,827) | |
Operating Activities
Net cash from operating activities increased $9.9 million, to net cash provided by operating activities of $13.7 million in 2023, as compared to net cash provided by operating activities of $3.8 million in 2022, which was primarily driven by a significant penalty$9.2 million increase in our net income after non-cash adjustments and contracts that are variable based upon volume, such as contracts witha $0.7 million net favorable change in operating assets and liabilities, primarily attributable to lower prepayments made to media partners that guaranteeunder long-term contracts, partially offset by a minimum ratenet unfavorable change due to the timing of payment ifworking capital.
Our free cash flow for 2023 improved to a use of cash of $6.5 million, as compared to a use of cash of $22.1 million in 2022, primarily reflecting higher net cash provided by operating activities and lower capital expenditures in 2023. Free cash flow is a supplemental non-GAAP financial measure. See “Non-GAAP Reconciliations” for the media partner reaches certain performance targets, are not includedrelated definition and a reconciliation to net cash provided by operating activities.
Investing Activities
Cash from investing activities increased $387.5 million, to net cash provided by investing activities of $69.6 million in 2023, from net cash used in investing activities of $317.9 million in 2022. This increase was primarily attributable to higher net proceeds of $337.0 million related to our investments in marketable securities, comprised of proceeds from sales (net of repurchases) of $90.3 million in 2023, compared to net purchases of 246.7 million in 2022, reflecting the initial purchases made upon initiating our investment program in the table above. See “Definitionsprior year period. The increase in cash from investing activities was also attributable to the higher use of Financialcash of $44.8 million in the prior year period for consideration paid, net of cash acquired for our acquisition of vi, lower capital expenditures of $3.2 million in 2023, primarily due to higher purchases of servers and Performance Measures —Traffic Acquisition Costs.”related equipment in 2022, and lower capitalized software development costs of $2.5 million.
Financing Activities
Cash from financing activities decreased $85.4 million to cash used in financing activities of $117.1 million in 2023, from cash used in financing activities of $31.7 million in 2022. This decrease was primarily attributable to $96.2 million of cash used to repurchase half of the Company’s Convertible Notes in April 2023, and a $4.2 million decline in proceeds from exercises of stock options and warrants, partially offset by lower treasury share repurchases of $14.1 million in 2023, compared to 2022.
Critical Accounting Policies and Estimates
Our audited consolidated financial statements are prepared in accordance with U.S. GAAP. The preparation of these audited consolidated financial statements requires management to make estimates and assumptions that affect the reported amounts of assets, liabilities, revenue, expenses and related disclosures. We evaluate our estimates and assumptions on an ongoing basis. Our estimates are based on historical experience and various other assumptions that we believe to be reasonable under the circumstances. Our actual results could differ from these estimates.
We believe that the following policies may involve a higher degree of judgment and complexity in their application than most of our accounting policies and represent the critical accounting policies used in the preparation of our audited consolidated financial statements. Readers are encouraged to consider this summary together with our audited consolidated financial statements and the related notes, including Note 1, for a more complete understanding of the critical accounting policies discussed below.
Revenue Recognition
We recognize revenue when we transfer control of promised services directly to our customers, in an amount that reflects the consideration to which we expect to be entitled to in exchange for those services.
We recognize revenue pursuant to the five-step framework contained in ASC 606: (i) identify the contract with a client; (ii) identify the performance obligations in the contract, including whether they are distinct in the context of the contract; (iii) determine the transaction price, including the constraint on variable consideration; (iv) allocate the transaction price to the performance obligations in the contract; and (v) recognize revenue as we satisfy the performance obligations.
We generate revenue primarily from advertisers through user engagement with the ads that we place on media partners’ web pages and mobile applications. Our platform delivers ads to end-users that appear as links to articles, products and videos on media partners’ sites.
Our customers include brands, performance advertisers and other advertisers, which we collectively refer to as our advertisers, each of which contracts for use of our services primarily through insertion orders or through our self-service tools, allowing advertisers to establish budgets for their advertising campaigns. Advertising campaigns are primarily billed on a monthly basis. Our payment terms generally range from 30 to 60 days. Because the amount billed is representative of the value of the service delivered to advertisers, we recognize revenue as we satisfy our performance obligations based on the users’ clicks or ads displayed because the advertiser can direct the use of, and obtain substantially all of the remaining benefits from, the services simultaneously.
For advertising campaigns priced on a cost-per-click basis, we bill our advertisers and recognize revenue when a user clicks on an advertisement we deliver.
For campaigns priced on a cost-per-impression basis, we bill our advertisers and recognize revenue based on the number of times an advertisement is displayed to a user.
Variable consideration, including allowances, discounts, refunds, credits, incentives, or other price concessions, is estimated and recorded at the time that related revenue is recognized. Advance payments from advertisers for future services represent contract liabilities and are recorded as deferred revenue in our consolidated balance sheets.
The determination of whether our revenue should be reported on a gross or net basis involves significant judgment. In general, we act as a principal on behalf of our advertisers and revenue is recognized gross of any costs that we remit to the media partners. In these cases, we determined that we control the advertising inventory before it is transferred to our advertisers. Our control is evidenced by our ability to monetize the advertising inventory before it is transferred to our advertisers. For those revenue arrangements where we do not control the advertising inventory before it is transferred to our advertisers, we are the agent and recognize revenue on a net basis. We recognize revenue net of applicable sales taxes.
Stock-based Compensation
We recognize stock-based compensation for stock-based awards, including stock options, warrants, restricted stock awards (“RSAs”), restricted stock units (“RSUs”) and stock appreciation rights (“SARs”) based on the grant date fair value of the awards. Determining the appropriate fair value of stock-based awards requires numerous assumptions, some of which are highly complex and subjective.
Stock option awards, RSAs, RSUs and SARs generally vest subject to the satisfaction of service requirements, or the satisfaction of both service requirements and achievement of certain performance conditions. For stock awards that vest subject to the satisfaction of service requirements, stock-based compensation is measured based on the fair value of the award on the date of grant and is recognized as stock-based compensation on a straight-line basis over the requisite service period. For stock awards that have a performance component, stock-based compensation is measured based on the fair value on the grant date and is recognized over the requisite service period as achievement of the performance objective becomes probable.
We estimate the fair value of our stock option awards on the grant date using the Black-Scholes option-pricing model. The Black-Scholes option-pricing model requires the use of judgments and assumptions, including fair value of our common stock for periods prior to the completion of our IPO, the option’s expected term, the expected volatility of our common stock, risk free interest rates and the expected dividend yield. The fair value of our RSAs and RSUs is the fair value of our common stock on the date of grant. We account for forfeitures as they occur.
There were no stock options granted in 2019. The following table summarizes the weighted-average assumptions used for the Black-Scholes option pricing model to determine the fair value of our stock options for the years ended December 31, 2021 and 2020:
| | | | | | | | | | | |
| Year Ended December 31, 2021 | | Year Ended December31, 2020 |
| Expected term (in years) | 6.03 | | 6.02 |
| Risk-free interest rate | 1.29 | % | | 0.52 | % |
| Expected volatility | 43 | % | | 44 | % |
| Dividend rate | 0 | % | | 0 | % |
| Fair value of common stock | $ | 5.95 | | $ | 4.61 |
The Black-Scholes model assumptions are further described below:
•Expected term. The expected term represents the period that our stock-based awards are expected to be outstanding. For option grants that are considered to be “plain vanilla,” we determine the expected term using the simplified method. The simplified method deems the term to be the average of the time-to-vesting and the contractual life of the stock-based awards.
•Risk-free interest rate. The risk-free interest rate is based on the U.S. Treasury yield curve in effect at the date of grant for zero-coupon U.S. Treasury notes with maturities approximating the stock-based awards’ expected term.
•Expected Volatility. Because we have a short trading history for our common stock, the expected volatility was derived from the average historical stock volatilities of several actively traded public companies within our industry that we consider to be comparable to our business over a period equivalent to the expected term of the stock-based awards.
•Dividend rate. The expected dividend rate was assumed to be zero as we have not paid and do not anticipate paying any dividends in the foreseeable future.
•Fair value of our common stock. For stock options granted subsequent to our IPO, the fair value of common stock is based on the closing price of our common stock reported on NASDAQ Global Market stock exchange on the date of grant. Prior to our IPO, because there is was no public market for our common stock, our Board determined the fair value of the common stock by considering a number of objective and subjective factors, including having valuations of our common stock performed by an unrelated valuation specialist, valuations of comparable peer companies, sales of our convertible preferred stock to unrelated third parties, operating and financial performance, the lack of liquidity of our capital stock, and general and industry-specific economic outlook.
If any of the assumptions used in the Black-Scholes option-pricing model change significantly, stock-based compensation for future awards may differ materially compared with the previously granted awards.
Income Taxes
We are subject to income taxes in the United States and numerous foreign jurisdictions. Significant judgment is required in determining our provision for income taxes and income tax assets and liabilities, including evaluating uncertainties in the application of accounting principles and complex tax laws.
We record a provision for income taxes for the anticipated tax consequences of the reported results of operations using an asset and liability approach, which requires recognition of deferred income tax assets and liabilities for the expected future tax consequences of temporary differences between the financial reporting and tax bases of assets and liabilities, as well as for operating loss and tax credit carryforwards. Deferred income tax assets and liabilities are measured using the currently enacted tax rates that apply to taxable income in effect for the years in which those tax assets and liabilities are expected to be realized or settled.
We record a valuation allowance to reduce our deferred tax assets to the net amount that we believe is more likely than not to be realized. In evaluating our ability to recover our deferred tax assets within the jurisdictions in which they arise, we consider all available positive and negative evidence, including our history of pre-tax income, projected future taxable income, the scheduled reversals of deferred tax liabilities, taxable income available to carryback to prior years and our tax planning strategies. As a result of our analysis, during 2023 and 2022, after weighing all of the evidence, we determined that the positive evidence, particularly the evidence that was objectively verifiable, continued to outweigh the negative evidence. However, upon evaluating our forecasted state taxable income, we increased our valuation allowance against state net operating loss carryforwards by $0.5 million and $2.8 million in 2023 and 2022, respectively.
We recognize tax benefits from uncertain tax positions only if we believe that it is more likely than not that the tax position will be sustained on examination by the taxing authoritiesauthorities based on the technical merits of the position. Although we believe that we have adequately reserved for our uncertain tax positions, we can provide no assurance that the final tax outcome of these matters will not be materially different. We make adjustments to these reserves when facts and circumstances change, such as the closing of a tax audit or the refinement of an estimate. To the extent that the final tax outcome of these matters is different than the amounts recorded, such differences will affect the provision for income taxes in the period in which such determination is made and could have a material impact on our financial condition and operating results. The provision for income taxes includes the effects of any reserves that we believe are appropriate, as well as the related interest and penalties.
Accounting for Convertible Instruments
On January 1, 2021, we early adopted Accounting Standards Update (“ASU”) 2020-06, “Accounting for Convertible Instruments and ContractsWe have not made any material changes in an Entity’s Own Equity,” which simplified the accounting for convertible debt instruments by reducing the number of accounting modelsmethodology used to allocate proceeds from five toaccount for income taxes during the past three removing certain conditions for equity classificationfiscal years. Changes in tax laws and amending earnings per share calculations to assume share settlementrates could affect recorded deferred tax assets and to requireliabilities in the if-converted method tofuture. Other than those potential impacts, we do not believe there is a reasonable likelihood that there will be applied to all for convertible debt instruments. The adoption of this standard did not have an impact on our consolidated financial statements as of the date of adoption. We applied this guidance to its Convertible Notes issueda material change in July 2021 and utilized the if-converted method to calculate the dilutive impact of Convertible Notes and our previously outstanding convertible preferred stock on our earnings per share.tax related balances.
Recently Issued Accounting Pronouncements
See Note 1 to the accompanying audited consolidated financial statements for recently issued accounting standards, which may have an impact on our financial statements upon adoption.
Off-Balance Sheet Arrangements
We do not currently engage in off-balance sheet financing arrangements. In addition, we do not have any interest in entities referred to as variable interest entities, which includes special purpose entities and other structured finance entities.
JOBS Act Transition Period
We are an emerging growth company as defined in the JOBS Act. The JOBS Act provides that an emerging growth company may take advantage of an extended transition period for complying with new or revised accounting standards, delaying the adoption of some accounting standards until they would otherwise apply to private companies. We have elected to use the extended transition period under the JOBS Act for the adoption of certain accounting standards until the earlier of the date we (i) are no longer an emerging growth company or (ii) affirmatively and irrevocably opt out of the extended transition period provided in the JOBS Act. As a result, our audited consolidated financial statements may not be comparable to companies that have adopted new or revised accounting pronouncements as of public company effective dates.
Item 7A. Quantitative and Qualitative Disclosures About Market Risk
We have operations both in the United States and internationally, and we are exposed to market risks in the ordinary course of our business. These risks primarily include foreign exchange, interest rate, inflation and foreign exchangecredit risks.
We do not believe that inflation has had a material effect on our business, financial condition, or results of operations. We continue to monitor the impact of inflation to minimize its effects. If our costs were to become subject to significant inflationary pressures, we may not be able to fully offset such higher costs, which could negatively impact our business, financial condition, and results of operations.
Foreign Currency Risk
Our consolidated results of operations and cash flows are subject to fluctuations due to changes in foreign currency exchange rates. A substantialrates. The majority of our revenue and cost of revenue are denominated in U.S. Dollars, with the remainder in other currencies. Our operating expenses are generally denominated in the currencies in which our operations are located. A majority of our operating expenses are denominated in U.S. Dollars, with the remainder denominated primarily in New Israeli Shekels and to a lesser extent British pound sterling and Euros. We evaluate periodically the various currencies to which we are exposed and, from time to time, may enter into foreign currency forward exchange contracts to manage our foreign currency risk and reduce the potential adverse impact from the appreciation or the depreciation of our non-U.S. dollar-denominated operations, as appropriate.
Changes in the U.S. Dollar against the currencies of the countries in which we operate impact our operating results, as further described in Item 7, “Results of Operations.” The effect of a hypothetical 10% increase or decrease in our weighted-average exchange rates on our revenue, cost of revenue and operating expenses denominated in foreign currencies would result in a $4.7$7.2 million favorableunfavorable or unfavorablefavorable change to our operating loss for the year ended December 31, 2021.2023.
Interest Rate Risk
Our exposure to market risk for changes in interest rates relates primarily to our cash and cash equivalents and our outstanding debt obligations. Our primary exposure to market risk is interest rate sensitivity, which is affected by changes in the general level of the interest rates in the United States.
Our total indebtedness, including capital lease obligations was $241.1 millionexposure to market risk for changes in interest rates relates primarily to our cash and $7.4 million atcash equivalents, investments and any future borrowings under the Facility. There have been no amounts outstanding under the Facility since we amended and restated our loan agreement in November 2021. Long-term debt recorded on our audited consolidated balance sheets as of December 31, 20212023 and December 31, 2020, respectively. Our convertible notes issued in July 2021 have2022 was $118.0 million and $236.0 million, respectively, and bears a fixed rate of interest. Our
As of December 31, 2023, our exposure to interest rates primarily relates tomarket risk for changes in interest payable on any future borrowingsrates relates primarily to our cash and cash equivalents of $70.9 million and our investments in marketable securities of $160.1 million under our revolvinginvestments program initiated during the third quarter of 2022, which consist of U.S. Treasuries, U.S. government bonds, commercial paper, U.S. corporate bonds and municipal bonds, with maturities from three months to two years from the date of purchase. The primary objectives of our investment program are focused on achieving maximum returns within our investment policy parameters, while preserving capital and maintaining sufficient liquidity. We plan to actively monitor our exposure to the fair value of our investment portfolio in accordance with our policies and procedures, which include monitoring market conditions, to minimize investment risk.
A 100 basis point change in interest rates as of December 31, 2023 would change the fair value of investment portfolio by approximately $1.3 million. Since our debt investments are classified as available-for-sale, the unrealized gains and losses related to fluctuations in market volatility and interest rates are reflected within accumulated other comprehensive income (loss) within stockholders’ equity in our audited consolidated balance sheets.
Inflation Risk
Our business is subject to risk associated with inflation. We continue to monitor the impact of inflation to minimize its effects. If our costs, including wages, were to become subject to significant inflationary pressures, we may not be able to fully offset such higher costs which could negatively impact our business, financial condition, and results of operations. Inflation throughout the broader economy has and could lead to reduced ad spend and indirectly harm our business, financial condition and results of operations. See Item 1A, “Risk Factors.”
Credit Risk
Financial instruments that subject us to concentration of credit facility.risk are cash and cash equivalents, investments and receivables. As part of our ongoing procedures, we monitor the credit levels and the financial condition of our customers in order to minimize our credit risk and require certain customers with higher potential credit risk to prepay for their campaigns.See Item 1A, “Risk Factors” under “We are subject to payment-related risks that may adversely affect our business, working capital, financial condition and results of operations.”We do not factor our accounts receivables, nor do we maintain credit insurance to manage the risk of credit loss. We are also exposed to a risk that the counterparty to our foreign currency forward exchange contracts will fail to meet its contractual obligations. In order to mitigate this risk, we perform an evaluation of our counterparty credit risk and our forward contracts have a term of no more than 12 months.
Item 8. Financial Statements and Supplementary Data
INDEX TO FINANCIAL STATEMENTS
Report of Independent Registered Public Accounting Firm
To the Stockholders and Board of Directors
of Outbrain Inc.:
Opinion on the Consolidated Financial Statements
We have audited the accompanying consolidated balance sheets of Outbrain Inc. and subsidiaries (the Company) as of December 31, 20212023 and 2020,2022, the related consolidated statements of operations, comprehensive income (loss), convertible preferred stock and stockholders’ equity (deficit), and cash flows for each of the years in the three-year period ended December 31, 2021,2023, and the related notes (collectively, the consolidated financial statements). In our opinion, the consolidated financial statements present fairly, in all material respects, the financial position of the Company as of December 31, 20212023 and 2020,2022, and the results of its operations and its cash flows for each of the years in the three-year period ended December 31, 2021,2023, in conformity with U.S. generally accepted accounting principles.
Basis for Opinion
These consolidated financial statements are the responsibility of the Company’s management. Our responsibility is to express an opinion on these consolidated financial statements based on our audits. We are a public accounting firm registered with the Public Company Accounting Oversight Board (United States) (PCAOB) and are required to be independent with respect to the Company in accordance with the U.S. federal securities laws and the applicable rules and regulations of the Securities and Exchange Commission and the PCAOB.
We conducted our audits in accordance with the standards of the PCAOB. Those standards require that we plan and perform the audit to obtain reasonable assurance about whether the consolidated financial statements are free of material misstatement, whether due to error or fraud. Our audits included performing procedures to assess the risks of material misstatement of the consolidated financial statements, whether due to error or fraud, and performing procedures that respond to those risks. Such procedures included examining, on a test basis, evidence regarding the amounts and disclosures in the consolidated financial statements. Our audits also included evaluating the accounting principles used and significant estimates made by management, as well as evaluating the overall presentation of the consolidated financial statements. We believe that our audits provide a reasonable basis for our opinion.
/s/ KPMG LLP
We have served as the Company’s auditor since 2013.
New York, New York
March 18, 20228, 2024
KPMG LLP, a Delaware limited liability partnership and a member firm of
the KPMG global organization of independent member firms affiliated with
KPMG International Limited, a private English company limited by guarantee.
OUTBRAIN INC.
Consolidated Balance Sheets
(In thousands, except for number of shares and par value)
| | December 31, 2021 | | December 31, 2020 |
| ASSETS | | | |
| CURRENT ASSETS: | |
| December 31, 2023 | | | December 31, 2023 | | December 31, 2022 |
| ASSETS: | |
| Current assets: | |
| Current assets: | |
| Current assets: | |
| Cash and cash equivalents | Cash and cash equivalents | $ | 455,397 | | | $ | 93,641 | |
| Cash and cash equivalents | |
| Cash and cash equivalents | |
| Short-term investments in marketable securities | |
| Accounts receivable, net of allowances | Accounts receivable, net of allowances | 192,814 | | | 165,449 | |
| Prepaid expenses and other current assets | Prepaid expenses and other current assets | 27,873 | | | 18,326 | |
| Total current assets | Total current assets | 676,084 | | | 277,416 | |
| Non-current assets: | |
| Long-term investments in marketable securities | |
| Long-term investments in marketable securities | |
| Long-term investments in marketable securities | |
| Property, equipment and capitalized software, net | Property, equipment and capitalized software, net | 28,008 | | | 24,756 | |
| Operating lease right-of-use assets, net | |
| Intangible assets, net | Intangible assets, net | 5,719 | | | 9,812 | |
| Goodwill | Goodwill | 32,881 | | | 32,881 | |
| Deferred tax assets | Deferred tax assets | 32,867 | | | 2,802 | |
| Other assets | Other assets | 20,331 | | | 8,819 | |
| TOTAL ASSETS | TOTAL ASSETS | $ | 795,890 | | | $ | 356,486 | |
| | LIABILITIES, CONVERTIBLE PREFERRED STOCK AND STOCKHOLDERS’ EQUITY (DEFICIT) | |
| CURRENT LIABILITIES: | |
| LIABILITIES AND STOCKHOLDERS’ EQUITY: | |
| LIABILITIES AND STOCKHOLDERS’ EQUITY: | |
| LIABILITIES AND STOCKHOLDERS’ EQUITY: | |
| Current liabilities: | |
| Current liabilities: | |
| Current liabilities: | |
| Accounts payable | |
| Accounts payable | |
| Accounts payable | Accounts payable | $ | 160,790 | | | $ | 118,491 | |
| Accrued compensation and benefits | Accrued compensation and benefits | 23,331 | | | 23,000 | |
| Accrued and other current liabilities | Accrued and other current liabilities | 99,590 | | | 109,747 | |
| Deferred revenue | Deferred revenue | 4,784 | | | 5,512 | |
| Total current liabilities | Total current liabilities | 288,495 | | | 256,750 | |
| Non-current liabilities: | |
| Long-term debt | Long-term debt | 236,000 | | | — | |
| Long-term debt | |
| Long-term debt | |
| Operating lease liabilities, non-current | |
| Other liabilities | Other liabilities | 14,620 | | | 17,105 | |
| TOTAL LIABILITIES | TOTAL LIABILITIES | $ | 539,115 | | | $ | 273,855 | |
| | Commitments and Contingencies (Note 7) | 0 | | 0 |
| Convertible preferred stock, par value of $0.001 per share, 100,000,000 shares authorized and no shares issued and outstanding as of December 31, 2021, and 27,766,563 shares authorized and 27,652,449 shares of Series A, B, C, D, E, F, G and H issued and outstanding as of December 31, 2020. | — | | | 162,444 | |
| STOCKHOLDERS’ DEFICIT: | |
| Common stock, par value of $0.001 per share−1,000,000,000 shares authorized, 58,015,075 shares issued and 56,701,394 shares outstanding as of December 31, 2021; 65,183,785 shares authorized, 17,439,488 share issued and 17,158,802 shares outstanding as of December 31, 2020. | 58 | | | 17 | |
| Commitments and Contingencies (Note 11) | | Commitments and Contingencies (Note 11) | | | |
| STOCKHOLDERS’ EQUITY: | |
| Common stock, par value of $0.001 per share − one billion shares authorized, 61,567,520 shares issued and 49,726,518 shares outstanding as of December 31, 2023; one billion shares authorized, 60,175,020 share issued and 52,226,745 shares outstanding as of December 31, 2022. | |
| Common stock, par value of $0.001 per share − one billion shares authorized, 61,567,520 shares issued and 49,726,518 shares outstanding as of December 31, 2023; one billion shares authorized, 60,175,020 share issued and 52,226,745 shares outstanding as of December 31, 2022. | |
| Common stock, par value of $0.001 per share − one billion shares authorized, 61,567,520 shares issued and 49,726,518 shares outstanding as of December 31, 2023; one billion shares authorized, 60,175,020 share issued and 52,226,745 shares outstanding as of December 31, 2022. | |
| Preferred stock, par value of $0.001 per share − 100,000,000 shares authorized, none issued and outstanding as of December 31, 2023 and December 31, 2022 | |
| Additional paid-in capital | Additional paid-in capital | 434,945 | | | 95,055 | |
| Treasury stock, at cost, 1,313,681 shares as of December 31, 2021 and 280,686 shares as of December 31, 2020 | (16,504) | | | (2,350) | |
| Treasury stock, at cost − 11,841,002 shares as of December 31, 2023 and 7,948,275 shares as of December 31, 2022 | |
| Accumulated other comprehensive loss | Accumulated other comprehensive loss | (4,474) | | | (4,290) | |
| Accumulated deficit | Accumulated deficit | (157,250) | | | (168,245) | |
| TOTAL STOCKHOLDERS’ EQUITY (DEFICIT) | 256,775 | | | (79,813) | |
| TOTAL LIABILITIES, CONVERTIBLE PREFERRED STOCK AND STOCKHOLDERS’ EQUITY (DEFICIT) | $ | 795,890 | | | $ | 356,486 | |
| TOTAL STOCKHOLDERS’ EQUITY | |
| TOTAL LIABILITIES AND STOCKHOLDERS’ EQUITY | |
|
See Accompanying Notes to Consolidated Financial Statements.
OUTBRAIN INC.
Consolidated Statements of Operations
(In thousands, except for share and per share data)
| | | | | | | | | | | | | | | | | |
| Year Ended December 31, |
| 2023 | | 2022 | | 2021 |
| Revenue | $ | 935,818 | | | $ | 992,082 | | | $ | 1,015,630 | |
| Cost of revenue: | | | | | |
| Traffic acquisition costs | 708,449 | | | 757,321 | | | 743,579 | |
| Other cost of revenue | 42,571 | | | 42,108 | | | 31,791 | |
| Total cost of revenue | 751,020 | | | 799,429 | | | 775,370 | |
| Gross profit | 184,798 | | | 192,653 | | | 240,260 | |
| Operating expenses: | | | | | |
| Research and development | 36,402 | | | 40,320 | | | 39,169 | |
| Sales and marketing | 98,370 | | | 108,816 | | | 95,786 | |
| General and administrative | 58,665 | | | 57,065 | | | 70,749 | |
| Total operating expenses | 193,437 | | | 206,201 | | | 205,704 | |
| (Loss) income from operations | (8,639) | | | (13,548) | | | 34,556 | |
| Other income (expense), net: | | | | | |
| Gain (loss) on convertible debt | 22,594 | | | — | | | (42,049) | |
| Interest expense | (5,393) | | | (7,625) | | | (3,964) | |
| Interest income and other income (expense), net | 7,793 | | | 2,600 | | | (3,078) | |
| Total other income (expense), net | 24,994 | | | (5,025) | | | (49,091) | |
| Income (loss) before provision (benefit) for income taxes | 16,355 | | | (18,573) | | | (14,535) | |
| Provision (benefit) for income taxes | 6,113 | | | 6,008 | | | (25,530) | |
| Net income (loss) | $ | 10,242 | | | $ | (24,581) | | | $ | 10,995 | |
| | | | | |
| Weighted average shares outstanding: | | | | | |
| Basic | 50,900,422 | | | 55,615,385 | | | 35,159,757 | |
| Diluted | 56,965,299 | | | 55,615,385 | | | 53,894,347 | |
| | | | | |
| Net income (loss) per common share: | | | | | |
| Basic | $ | 0.20 | | | $ | (0.44) | | | $ | 0.31 | |
| Diluted | $ | (0.06) | | | $ | (0.44) | | | $ | 0.20 | |
See Accompanying Notes to Consolidated Financial Statements.
OUTBRAIN INC.
Consolidated Statements of Operations
(In thousands)
| | | | | | | | | | | | | | | | | |
| Year Ended December 31, |
| 2021 | | 2020 | | 2019 |
| Revenue | $ | 1,015,630 | | | $ | 767,142 | | | $ | 687,333 | |
| Cost of revenue: | | | | | |
| Traffic acquisition costs | 743,579 | | | 572,802 | | | 517,000 | |
| Other cost of revenue | 31,791 | | | 29,278 | | | 28,548 | |
| Total cost of revenue | 775,370 | | | 602,080 | | | 545,548 | |
| Gross profit | 240,260 | | | 165,062 | | | 141,785 | |
| Operating expenses: | | | | | |
| Research and development | 39,169 | | | 28,961 | | | 26,391 | |
| Sales and marketing | 95,786 | | | 77,570 | | | 78,941 | |
| General and administrative | 70,749 | | | 48,354 | | | 51,038 | |
| Total operating expenses | 205,704 | | | 154,885 | | | 156,370 | |
| Income (loss) from operations | 34,556 | | | 10,177 | | | (14,585) | |
| Other expense, net: | | | | | |
| Charges related to exchange of senior notes upon IPO | (42,049) | | | — | | | — | |
| Interest expense | (3,964) | | | (832) | | | (601) | |
| Interest income and other (expense) income, net | (3,078) | | | (1,695) | | | 152 | |
| Total other expense, net | (49,091) | | | (2,527) | | | (449) | |
| (Loss) income before provision for income taxes | (14,535) | | | 7,650 | | | (15,034) | |
| (Benefit) provision for income taxes | (25,530) | | | 3,293 | | | 5,480 | |
| Net income (loss) | $ | 10,995 | | | $ | 4,357 | | | $ | (20,514) | |
| | | | | |
| Weighted average shares outstanding: | | | | | |
| Basic | 35,159,757 | | | 16,816,178 | | | 15,275,129 | |
| Diluted | 53,894,347 | | | 20,186,802 | | | 15,275,129 | |
| | | | | |
| Net income (loss) per common share: | | | | | |
| Basic | $ | 0.31 | | | $ | 0.10 | | | $ | (1.34) | |
| Diluted | $ | 0.20 | | | $ | 0.08 | | | $ | (1.34) | |
See Accompanying Notes to Consolidated Financial Statements.
OUTBRAIN INC.
Consolidated Statements of Comprehensive Income (Loss)
(In thousands)
| | Year Ended December 31, |
| 2021 | | 2020 | | 2019 |
| Year Ended December 31, | | | Year Ended December 31, |
| 2023 | | | 2023 | | 2022 | | 2021 |
| Net income (loss) | Net income (loss) | $ | 10,995 | | | $ | 4,357 | | | $ | (20,514) | |
| Other comprehensive (loss) income: | |
| Other comprehensive income (loss): | |
| Foreign currency translation adjustments | Foreign currency translation adjustments | (184) | | | 1,233 | | | (16) | |
| Foreign currency translation adjustments | |
| Foreign currency translation adjustments | |
| Unrealized gains (losses) on available-for-sale investments in debt securities (net of taxes of $(467) and $470 in 2023 and 2022, respectively) | |
| Total other comprehensive income (loss) | |
| Comprehensive income (loss) | Comprehensive income (loss) | $ | 10,811 | | | $ | 5,590 | | | $ | (20,530) | |
See Accompanying Notes to Consolidated Financial Statements.
OUTBRAIN INC.
Consolidated Statements of Stockholders’ Equity (Deficit)
(In thousands, except for number of shares) | | | | | | | | | | | | | | | | | | | | | | | | | | | | | | | | | | | | | | | | | | | | | | | | | | | | | | | | | | | | | | |
| Convertible Preferred Stock | | | Common Stock | | Additional Paid-In Capital | | Treasury Stock | | Accumulated Other Comprehensive (Loss) Income | | Accumulated Deficit | | Total Stockholders’ Equity (Deficit) |
| Shares | | Amount | | | Shares | | Amount | | | Shares | | Amount | | | |
| Balance – January 1, 2021 | 27,652,449 | | | $ | 162,444 | | | | 17,439,488 | | | $ | 17 | | | $ | 95,055 | | | (280,686) | | | $ | (2,350) | | | $ | (4,290) | | | $ | (168,245) | | | $ | (79,813) | |
| Conversion of convertible preferred stock to common stock | (27,652,449) | | | (162,444) | | | | 28,091,267 | | | 28 | | | 162,416 | | | — | | | — | | | — | | | — | | | 162,444 | |
| Issuance of common stock from initial public offering | — | | | — | | | | 8,000,000 | | | 8 | | | 145,097 | | | — | | | — | | | — | | | — | | | 145,105 | |
| Exercise of employee stock options, net of shares withheld for taxes | — | | | — | | | | 1,970,110 | | | 2 | | | 5,937 | | | (56,262) | | | (666) | | | — | | | — | | | 5,273 | |
| Vesting of restricted stock units, net of shares withheld for taxes | — | | | — | | | | 2,514,210 | | | 3 | | | (3) | | | (976,733) | | | (13,488) | | | — | | | — | | | (13,488) | |
| Stock-based compensation | — | | | — | | | | — | | | — | | | 26,443 | | | — | | | — | | | — | | | — | | | 26,443 | |
| Other comprehensive loss | — | | | — | | | | — | | | — | | | — | | | — | | | — | | | (184) | | | — | | | (184) | |
| Net income | — | | | — | | | | — | | | — | | | — | | | — | | | — | | | — | | | 10,995 | | | 10,995 | |
| Balance – December 31, 2021 | — | | | $ | — | | | | 58,015,075 | | | $ | 58 | | | $ | 434,945 | | | (1,313,681) | | | $ | (16,504) | | | $ | (4,474) | | | $ | (157,250) | | | $ | 256,775 | |
| Exercise of employee stock options, warrants and restricted stock awards, net of shares withheld for taxes | — | | | — | | | | 827,319 | | | 1 | | | 4,154 | | | (95,138) | | | (1,425) | | | — | | | — | | | 2,730 | |
| Vesting of restricted stock units, net of shares withheld for taxes | — | | | — | | | | 976,840 | | | 1 | | | (1) | | | (150,327) | | | (1,047) | | | — | | | — | | | (1,047) | |
| Acquisition consideration | — | | | — | | | | 355,786 | | | — | | | 4,190 | | | — | | | — | | | — | | | — | | | 4,190 | |
| Shares repurchased under the share repurchase program | — | | | — | | | | — | | | — | | | — | | | (6,389,129) | | | (30,192) | | | — | | | — | | | (30,192) | |
| Stock-based compensation | — | | | — | | | | — | | | — | | | 12,543 | | | — | | | — | | | — | | | — | | | 12,543 | |
| Other comprehensive loss | — | | | — | | | | — | | | — | | | — | | | — | | | — | | | (5,439) | | | — | | | (5,439) | |
| Net loss | — | | | — | | | | — | | | — | | | — | | | — | | | — | | | — | | | (24,581) | | | (24,581) | |
| Other | — | | | — | | | | — | | | — | | | — | | | — | | | — | | | — | | | 2,807 | | | 2,807 | |
| Balance – December 31, 2022 | — | | | $ | — | | | | 60,175,020 | | | $ | 60 | | | $ | 455,831 | | | (7,948,275) | | | $ | (49,168) | | | $ | (9,913) | | | $ | (179,024) | | | $ | 217,786 | |
| Vesting of restricted stock units, net of shares withheld for taxes | — | | | — | | | | 1,392,500 | | | 2 | | | (2) | | | (163,265) | | | (752) | | | — | | | — | | | (752) | |
| Shares repurchased under the share repurchase program | — | | | — | | | | — | | | — | | | — | | | (3,729,462) | | | (17,769) | | | — | | | — | | | (17,769) | |
| Stock-based compensation | — | | | — | | | | — | | | — | | | 12,696 | | | — | | | — | | | — | | | — | | | 12,696 | |
| Other comprehensive income | — | | | — | | | | — | | | — | | | — | | | — | | | — | | | 861 | | | — | | | 861 | |
| Net income | — | | | — | | | | — | | | — | | | — | | | — | | | — | | | — | | | 10,242 | | | 10,242 | |
| Balance – December 31, 2023 | — | | | $ | — | | | | 61,567,520 | | | $ | 62 | | | $ | 468,525 | | | (11,841,002) | | | $ | (67,689) | | | $ | (9,052) | | | $ | (168,782) | | | $ | 223,064 | |
| | | | | | | | | | | | | | | | | | | | |
See Accompanying Notes to Consolidated Financial Statements.
OUTBRAIN INC.
Consolidated Statements of Convertible Preferred Stock and Stockholders’ Equity (Deficit)
(In thousands, except for number of shares)
| | | | | | | | | | | | | | | | | | | | | | | | | | | | | | | | | | | | | | | | | | | | | | | | | | | | | | | | | | | | | | |
| Convertible Preferred Stock | | | Common Stock | | Additional Paid In Capital | | Treasury Stock | | Accumulated Other Comprehensive (Loss) Income | | Accumulated (Deficit) Income | | Total Stockholders’ (Deficit) Income |
| Shares | | Amount | | | Shares | | Amount | | | Shares | | Amount | | | |
| Balance–January 1,2019 | 27,627,166 | | | $ | 162,164 | | | | 12,703,334 | | | $ | 12 | | | $ | 47,075 | | | (247,863) | | | $ | (2,019) | | | $ | (5,507) | | | $ | (152,088) | | | $ | (112,527) | |
| Issuance of Series H convertible preferred stock for a business combination | 20,617 | | | 228 | | | | — | | | — | | | — | | | — | | | — | | | — | | | — | | | — | |
| Issuance of Series H convertible preferred stock for an asset acquisition | 4,666 | | | 52 | | | | — | | | — | | | — | | | — | | | — | | | — | | | — | | | — | |
| Exercise of employee stock options, net of shares withheld for taxes | — | | | — | | | | 258,000 | | | — | | | 994 | | | (5,054) | | | (51) | | | — | | | — | | | 943 | |
| Vesting of restricted stock units | — | | | — | | | | 272,719 | | | 1 | | | — | | | — | | | — | | | — | | | — | | | 1 | |
| Issuance of common stock upon acquisition | — | | | — | | | | 3,603,179 | | | 4 | | | 38,329 | | | — | | | — | | | — | | | — | | | 38,333 | |
| Stock-based compensation | — | | | — | | | | — | | | — | | | 4,118 | | | — | | | — | | | — | | | — | | | 4,118 | |
| Other comprehensive loss | — | | | — | | | | — | | | — | | | — | | | — | | | — | | | (16) | | | — | | | (16) | |
| Net loss | — | | | — | | | | — | | | — | | | — | | | — | | | — | | | — | | | (20,514) | | | (20,514) | |
| Balance–December 31, 2019 | 27,652,449 | | | $ | 162,444 | | | | 16,837,232 | | | $ | 17 | | | $ | 90,516 | | | (252,917) | | | $ | (2,070) | | | $ | (5,523) | | | $ | (172,602) | | | $ | (89,662) | |
| Exercise of employee stock options, net of shares withheld for taxes | — | | | — | | | | 305,934 | | | — | | | 674 | | | (27,769) | | | (280) | | | — | | | — | | | 394 | |
| Vesting of restricted stock units | — | | | — | | | | 296,322 | | | — | | | — | | | — | | | — | | | — | | | — | | | — | |
| Stock-based compensation | — | | | — | | | | — | | | — | | | 3,865 | | | — | | | — | | | — | | | — | | | 3,865 | |
| Other comprehensive income | — | | | — | | | | — | | | — | | | — | | | — | | | — | | | 1,233 | | | — | | | 1,233 | |
| Net income | — | | | — | | | | — | | | — | | | — | | | — | | | — | | | — | | | 4,357 | | | 4,357 | |
| Balance–December 31, 2020 | 27,652,449 | | | $ | 162,444 | | | | 17,439,488 | | | $ | 17 | | | $ | 95,055 | | | (280,686) | | | $ | (2,350) | | | $ | (4,290) | | | $ | (168,245) | | | $ | (79,813) | |
| Conversion of convertible preferred stock to common stock | (27,652,449) | | | (162,444) | | | | 28,091,267 | | | 28 | | | 162,416 | | | — | | | — | | | | | | | 162,444 | |
| Issuance of common stock from initial public offering | — | | | — | | | | 8,000,000 | | | 8 | | | 145,097 | | | — | | | — | | | — | | | — | | | 145,105 | |
| Exercise of employee stock options, net of shares withheld for taxes | — | | | — | | | | 1,970,110 | | | 2 | | | 5,937 | | | (56,262) | | | (666) | | | — | | | — | | | 5,273 | |
| Vesting of restricted stock units, net of shares withheld for taxes | — | | | — | | | | 2,514,210 | | | 3 | | | (3) | | | (976,733) | | | (13,488) | | | — | | | — | | | (13,488) | |
| Stock-based compensation | — | | | — | | | | — | | | — | | | 26,443 | | | — | | | — | | | — | | | — | | | 26,443 | |
| Other comprehensive loss | — | | | — | | | | — | | | — | | | — | | | — | | | — | | | (184) | | | — | | | (184) | |
| Net income | — | | | — | | | | — | | | — | | | — | | | — | | | — | | | — | | | 10,995 | | | 10,995 | |
| Balance–December 31, 2021 | — | | | $ | — | | | | 58,015,075 | | | $ | 58 | | | $ | 434,945 | | | (1,313,681) | | | $ | (16,504) | | | $ | (4,474) | | | $ | (157,250) | | | $ | 256,775 | |
| | | | | | | | | | | | | | | | | | | | |
See Accompanying Notes to Consolidated Financial Statements.
OUTBRAIN INC.
Consolidated Statements of Cash FlowFlowss
(In thousands)
| | Year Ended December 31, |
| 2021 | | 2020 | | 2019 |
| Year Ended December 31, | | | Year Ended December 31, |
| 2023 | | | 2023 | | 2022 | | 2021 |
| CASH FLOWS FROM OPERATING ACTIVITIES: | CASH FLOWS FROM OPERATING ACTIVITIES: | | | | | |
| Net income (loss) | Net income (loss) | $ | 10,995 | | | $ | 4,357 | | | $ | (20,514) | |
| Net income (loss) | |
| Net income (loss) | |
| Adjustments to reconcile net income (loss) to net cash provided by operating activities: | Adjustments to reconcile net income (loss) to net cash provided by operating activities: | |
| Charges related to exchange of senior notes upon IPO | 42,049 | | | — | | | — | |
| (Gain) loss on convertible debt | |
| (Gain) loss on convertible debt | |
| (Gain) loss on convertible debt | |
| Stock-based compensation | |
| Depreciation and amortization of property and equipment | Depreciation and amortization of property and equipment | 7,499 | | | 6,638 | | | 6,248 | |
| Amortization of capitalized software development costs | Amortization of capitalized software development costs | 8,441 | | | 7,545 | | | 6,461 | |
| Amortization of intangible assets | Amortization of intangible assets | 3,530 | | | 4,326 | | | 4,035 | |
| Loss (gain) on sale of assets | 5 | | | (1,095) | | | (25) | |
| Stock-based compensation | 26,307 | | | 3,588 | | | 3,876 | |
| Provision for doubtful accounts | 2,647 | | | 2,621 | | | 3,189 | |
| Provision for credit losses | |
| Non-cash operating lease expense | |
| Deferred income taxes | Deferred income taxes | (31,810) | | | (2,256) | | | (141) | |
| Amortization of discount on marketable securities | |
| Other | Other | 3,428 | | | (1,371) | | | 67 | |
| Changes in operating assets and liabilities: | Changes in operating assets and liabilities: | |
| Accounts receivable | Accounts receivable | (31,496) | | | (24,124) | | | 4,797 | |
| Accounts receivable | |
| Accounts receivable | |
| Prepaid expenses and other current assets | Prepaid expenses and other current assets | (9,975) | | | (3,729) | | | 1,038 | |
| Other assets | (11,025) | | | (1,821) | | | (146) | |
| Accounts payable | 42,977 | | | 31,429 | | | (25,366) | |
| Accrued and other current liabilities | (6,871) | | | 24,109 | | | 32,291 | |
| Accounts payable and other current liabilities | |
| Operating lease liabilities | |
| Deferred revenue | Deferred revenue | (667) | | | 2,159 | | | 1,045 | |
| Other | 728 | | | 610 | | | (115) | |
| Other non-current assets and liabilities | |
| Net cash provided by operating activities | Net cash provided by operating activities | 56,762 | | | 52,986 | | | 16,740 | |
| | CASH FLOWS FROM INVESTING ACTIVITIES: | CASH FLOWS FROM INVESTING ACTIVITIES: | |
| CASH FLOWS FROM INVESTING ACTIVITIES: | |
| CASH FLOWS FROM INVESTING ACTIVITIES: | |
| Acquisition of business, net of cash acquired | |
| Acquisition of business, net of cash acquired | |
| Acquisition of business, net of cash acquired | |
| Purchases of property and equipment | Purchases of property and equipment | (9,743) | | | (1,511) | | | (2,452) | |
| Capitalized software development costs | Capitalized software development costs | (10,311) | | | (8,990) | | | (7,935) | |
| Proceeds from sale of assets | — | | | 1,117 | | | — | |
| Acquisition of business | — | | | — | | | 2,920 | |
| Purchases of marketable securities | |
| Proceeds from maturities of marketable securities | |
| Other | Other | (47) | | | (39) | | | (122) | |
| Net cash used in investing activities | (20,101) | | | (9,423) | | | (7,589) | |
| Net cash provided by (used in) investing activities | |
| | CASH FLOWS FROM FINANCING ACTIVITIES: | CASH FLOWS FROM FINANCING ACTIVITIES: | |
| CASH FLOWS FROM FINANCING ACTIVITIES: | |
| CASH FLOWS FROM FINANCING ACTIVITIES: | |
| Repayment of long-term debt obligations | |
| Repayment of long-term debt obligations | |
| Repayment of long-term debt obligations | |
| Treasury stock repurchases and share withholdings on vested awards | |
| Principal payments on finance lease obligations | |
| Proceeds from exercise of common stock options and warrants | |
| Proceeds from IPO issuance of common stock, net of underwriting costs | Proceeds from IPO issuance of common stock, net of underwriting costs | 148,800 | | | — | | | — | |
| Payment of initial public offering transaction costs | Payment of initial public offering transaction costs | (3,695) | | | — | | | — | |
| Proceeds from issuance of debt | Proceeds from issuance of debt | 200,000 | | | — | | | — | |
| Payment of deferred financing costs | Payment of deferred financing costs | (6,656) | | | — | | | — | |
| Proceeds from borrowings on revolving credit facility | — | | | 10,000 | | | — | |
| Principal repayments on revolving credit facility | — | | | (10,000) | | | — | |
| Proceeds from exercise of common stock options and warrants | 5,939 | | | 825 | | | 933 | |
Tax withholdings on vested restricted stock awards | (14,154) | | | (280) | | | (51) | |
| Principal payments on capital lease obligations | (4,340) | | | (4,773) | | | (4,541) | |
| Net cash provided by (used in) financing activities | 325,894 | | | (4,228) | | | (3,659) | |
| Payment of contingent consideration liability up to acquisition-date fair value | |
| Net cash (used in) provided by financing activities | |
| Effect of exchange rate changes | Effect of exchange rate changes | (1,030) | | | 4,750 | | | 64 | |
| | Net increase in cash, cash equivalents and restricted cash | 361,525 | | | 44,085 | | | 5,556 | |
| Net (decrease) increase in cash, cash equivalents and restricted cash | |
| Net (decrease) increase in cash, cash equivalents and restricted cash | |
| Net (decrease) increase in cash, cash equivalents and restricted cash | |
| Cash, cash equivalents and restricted cash — Beginning | Cash, cash equivalents and restricted cash — Beginning | 94,067 | | | 49,982 | | | 44,426 | |
| Cash, cash equivalents and restricted cash — Ending | Cash, cash equivalents and restricted cash — Ending | $ | 455,592 | | | $ | 94,067 | | | $ | 49,982 | |
| | RECONCILIATION OF CASH, CASH EQUIVALENTS, AND RESTRICTED CASH TO THE CONSOLIDATED BALANCE SHEETS | RECONCILIATION OF CASH, CASH EQUIVALENTS, AND RESTRICTED CASH TO THE CONSOLIDATED BALANCE SHEETS | | | | | |
| RECONCILIATION OF CASH, CASH EQUIVALENTS, AND RESTRICTED CASH TO THE CONSOLIDATED BALANCE SHEETS | |
| RECONCILIATION OF CASH, CASH EQUIVALENTS, AND RESTRICTED CASH TO THE CONSOLIDATED BALANCE SHEETS | |
| Cash and cash equivalents | |
| Cash and cash equivalents | |
| Cash and cash equivalents | Cash and cash equivalents | $ | 455,397 | | | $ | 93,641 | | | $ | 49,593 | |
| Restricted cash, included in other assets | Restricted cash, included in other assets | $ | 195 | | | $ | 426 | | | $ | 389 | |
| Total cash, cash equivalents, and restricted cash | Total cash, cash equivalents, and restricted cash | $ | 455,592 | | | $ | 94,067 | | | $ | 49,982 | |
OUTBRAIN INC.
Consolidated Statements of Cash Flows (Continued)
(In thousands)
| | Year Ended December 31, |
| 2021 | | 2020 | | 2019 |
| Year Ended December 31, | | | Year Ended December 31, |
| 2023 | | | 2023 | | 2022 | | 2021 |
| SUPPLEMENTAL DISCLOSURES OF CASH FLOW INFORMATION: | SUPPLEMENTAL DISCLOSURES OF CASH FLOW INFORMATION: | | | | | |
| Cash paid for income taxes, net of refunds | |
| Cash paid for income taxes, net of refunds | |
| Cash paid for income taxes, net of refunds | Cash paid for income taxes, net of refunds | $ | 6,742 | | | $ | 2,639 | | | $ | 5,489 | |
| Cash paid for interest | Cash paid for interest | $ | 587 | | | $ | 760 | | | $ | 548 | |
| | Non-cash investing activities: | |
| SUPPLEMENTAL SCHEDULE OF NONCASH INVESTING AND FINANCING ACTIVITIES: | |
| SUPPLEMENTAL SCHEDULE OF NONCASH INVESTING AND FINANCING ACTIVITIES: | |
| SUPPLEMENTAL SCHEDULE OF NONCASH INVESTING AND FINANCING ACTIVITIES: | |
| Acquisition consideration payable | |
| Acquisition consideration payable | |
| Acquisition consideration payable | |
| Operating lease right-of-use assets obtained in exchange for lease obligations | |
| Purchases of property and equipment included in accounts payable | |
| Stock-based compensation capitalized for software development costs | Stock-based compensation capitalized for software development costs | $ | 195 | | | $ | 212 | | | $ | 242 | |
| Purchases of property and equipment included in accounts payable | $ | 15 | | | $ | 135 | | | $ | 142 | |
| Stock consideration issued for acquisition of a business | |
| Conversion of preferred stock to common stock | |
| Property and equipment financed under capital obligation arrangements | Property and equipment financed under capital obligation arrangements | $ | 1,837 | | | $ | 4,834 | | | $ | 6,769 | |
| | Non-cash financing activities: | |
| Conversion of preferred stock to common stock | $ | 162,444 | | | $ | — | | | $ | — | |
| Unpaid deferred financing costs in accounts payable and accrued expenses | Unpaid deferred financing costs in accounts payable and accrued expenses | $ | 28 | | | $ | — | | | $ | — | |
| Series H convertible preferred stock issued for acquisition of a business | $ | — | | | $ | — | | | $ | 228 | |
| Series H convertible preferred stock issued for asset acquisition | $ | — | | | $ | — | | | $ | 52 | |
| Common stock issued for acquisition of a business | $ | — | | | $ | — | | | $ | 40,060 | |
See Accompanying Notes to Consolidated Financial Statements.
OUTBRAIN INC.
Notes to Consolidated Financial Statements
As of and For Years Ending December 31, 20212023 and 20202022
1. Organization, Description of Business and Summary of Significant Accounting Policies
Organization and Description of Business
Outbrain Inc., together (together with its subsidiaries, (“Outbrain”,“Outbrain,” the “Company”, “we”,“Company,” “we,” “our” or “us”), was incorporated in August 2006 in Delaware. The Company is headquartered in New York, New York and has wholly owned subsidiaries in Israel, Europe, Asia, Brazil and Australia. In connection with the Company’s initial public offering (“IPO”), its common stock began trading on The Nasdaq Stock Market LLC (“Nasdaq”) on July 23, 2021 under the “OB” ticker symbol.
Outbrain is a leading recommendationtechnology platform poweringthat drives business results by connecting media owners and advertisers with engaged audiences to drive business outcomes across the open web.Open Internet. The Company’s platform provides personalized recommendations that appear as links to content, advertisements and videos on media owners’ online properties. The Company generates revenue from marketersadvertisers through userconsumer engagements with promoted recommendationsadvertisements that it delivers across a variety of third-party media owners’ online properties. The Company pays traffic acquisition costs to its media owner partners on whose digital properties the recommendationsadvertisements are shown. The Company’s advertiser solutions are mainly priced using a performance-based model based on the actual number of engagements generated by users,consumers, which is highly dependent on its ability to generate trustworthy and interesting recommendationsadvertisements to individual usersconsumers based on its proprietary algorithms. A small portion of the Company’s revenue is generated through advertisers participating in programmatic auctions wherein the pricing is determined by the auction results and not dependent on user engagement.
Reverse Stock Split
In July 2021, the Company’s Board and stockholders approved a 1-for-1.7 reverse stock split of its common and convertible preferred stock. The reverse stock split became effective on July 13, 2021. The par value of the common stock was not adjusted as a result of the reverse stock split. In addition, adjustments corresponding to the reverse stock split were made to the ratio at which the convertible preferred stock converted into common stock immediately prior to the closing of the IPO, in accordance with existing terms of the convertible preferred stock. All share and per-share amounts for all periods presented in these financial statements and notes thereto have been adjusted retroactively to reflect the effect of the reverse stock split.
Initial Public Offering
On July 22, 2021, the Company’s Form S-1, filed on June 29, 2021, as amended, was declared effective by the U.S. Securities and Exchange Commission (the “SEC”) in connection with the Company’s initial public offering (“IPO”) of the Company’s common stock and its common stock began trading on The Nasdaq Stock Market LLC (“Nasdaq”) on July 23, 2021. On July 27, 2021, the Company closed its IPO and issued 8,000,000 shares of its common stock at an initial offering price of $20.00 per share, receiving aggregate net proceeds of $145.1 million, after deducting underwriting discounts, commissions and other offering costs.
Deferred offering costs of $3.7 million primarily consisted of accounting, legal and other transaction costs directly related to the IPO. Prior to the IPO, deferred offering costs were recorded within prepaid expenses and other current assets on the Company’s consolidated balance sheet. Upon the Company’s IPO, such costs were reclassified to additional paid-in capital within stockholders’ equity (deficit) and recorded against the proceeds of the offering.
In connection with the IPO, all of the shares of the Company’s convertible preferred stock outstanding automatically converted into an aggregate of 28,091,267 shares of the Company’s common stock, with all series converted on a 1-to-one basis, with the exception of Series F, which was converted at 1.14-to-1, based on the terms of the Series F agreement and the IPO price. The total carrying value of convertible preferred stock of $162.4 million was reclassified to stockholders’ equity (deficit).
Basis of Presentation
The accompanying audited consolidated financial statements have been prepared in accordance with generally accepted accounting principles in the United States of America (“USU.S. GAAP”). The accompanying audited consolidated financial statements include the accounts of Outbrain Inc. and its wholly owned subsidiaries. All intercompany accounts and transactions have been eliminated uponin consolidation.
OUTBRAIN INC.
Notes to Consolidated Financial Statements
Asthe 1-for-1.7 reverse stock split of the Company’s common and For Years Ending December 31,convertible preferred stock, which became effective on July 13, 2021, and 2020
with the exception of the par value, which was not adjusted.
Use of Estimates
The preparation of audited consolidated financial statements in conformity with U.S. GAAP requires management to make estimates and assumptions that affect the reported amounts of assets and liabilities and related disclosures as of the date of the audited consolidated financial statements and the reported amounts of revenue and expenses during the reporting period. Estimates and judgments are based on historical information and on various other assumptions that the Company believes are reasonable under the circumstances. Estimates and assumptions made in the accompanying condensedaudited consolidated financial statements include, but are not limited to, the allowance for doubtful accounts,credit losses, sales allowance, software development costs eligible for capitalization, valuation of deferred tax assets, the useful lives of property and equipment, the useful lives and fair value of intangible assets, andvaluation of goodwill, the fair value of stock-based awards, and the recognition and measurement of income tax uncertainties and other contingencies. Actual results could differ materially from these estimates.
Reclassifications
Certain reclassifications have been made to the prior periods’ financial information in order to conform to the current period’s presentation.
Cash and Cash Equivalents and Investments
The Company considers all highly liquid investments with maturities of three months or less when purchased to be cash equivalents. Cash and cash equivalents consist of cash on hand and highly liquid investments in money market funds.funds, U.S. government bonds, U.S. treasuries and commercial paper. Most of the Company’s cash deposits are above the $250,000 Federal Deposit Insurance Corporation (“FDIC”) limit and, therefore, not insured.
OUTBRAIN INC.
Notes to Consolidated Financial Statements
As of and For Years Ending December 31, 2023 and 2022
The Company’s investments in debt securities are classified as available-for-sale and are recorded at fair value. The Company classifies its investments in debt securities as short-term or long-term, based on each security’s maturity date. Unrealized gains and losses on available-for-sale securities are recognized in other comprehensive (loss) income (“OCI”), net of taxes. Although the Company does not have intent to sell its debt investments, the Company may sell them prior to their maturities for a variety of reasons, including portfolio diversification, credit quality, yields, and liquidity requirements. Any realized gains and losses on the sale of investments are determined based on a specific identification method and recorded within interest income and other (expense) income, net in the Company’s consolidated statements of operations.
Restricted Cash
Restricted cash represents security deposits for facility leases and is included in other assets in the accompanying consolidated balance sheets.
Accounts Receivable and Allowance for Doubtful AccountsCredit Losses
Accounts receivable are recorded at invoiced amounts, net of allowances for doubtful accounts,credit losses, if applicable, and are unsecured and do not bear interest. Accounts receivable also includeincludes earned and billable amounts not yet invoiced as of the end of the reporting period.
The allowance for doubtful accountscredit losses is based on the best estimate of the amount of probable credit losses in existing accounts receivable. The Company evaluates the collectability of its accounts receivableallowance for credit losses is determined based on knownhistorical collection risksexperience, reasonable and historical experience. In circumstances wheresupportable forecasted information, and any applicable market conditions. The allowance for credit losses also takes into consideration the Company’s current customer information, collection history, and other relevant data. The Company reviews the allowance for credit losses on a quarterly basis. Account balances are written off against the allowance when it is aware of a customer’s inability to meet its financial obligations (e.g., bankruptcy filings or substantial downgrading of credit ratings), it records a specific reserve for bad debts against amounts due to reducedeemed probable that the net recognized receivable to the amount it reasonably believes will not be collected. For all other customers, the Company records reserves for bad debts based on the length of time the receivables are past due and its historical experience of collections and write-offs.recovered. If circumstances change, such as higher-than-expected defaults or an unexpected material adverse change in a major customer’s ability to meet its financial obligations, the Company’s estimate of amounts collectible could be reduced by a material amount.
Certain Risks and Concentrations
Financial instruments that potentially subject the Company to concentrations of credit risk consist of cash and cash equivalents, restricted cash and accounts receivable. The Company’s cash and cash equivalents and restricted cash are generally invested in high-credit quality financial instruments with both banks and financial institutions to reduce the amount of exposure to any single financial institution.
The Company generally does not require collateral to secure accounts receivable. No single marketer accounted for 10% or more of the Company’s total revenue for the years ended 2021, 20202023, 2022 and 2019,2021, or 10% or more of its gross accounts receivable balance as of December 31, 2023 and 2022.
For the years ended December 31, 2023 and December 31, 2022, none of the Company’s media owners accounted for 10% of its total traffic acquisition costs. For the year ended December 31, 2021, one media owner accounted for 10% of the Company’s total traffic acquisition costs.
Property, equipment and 2020.capitalized software, net
Property and equipment, including leasehold improvements, is stated at cost, less accumulated depreciation and amortization. Depreciation is computed using the straight-line method over the estimated useful lives of the related assets. The estimated useful lives relating to software and computer and equipment (excluding servers) is generally three years, and the estimated useful lives for furniture and fixtures is generally five years. Leasehold improvements are depreciated on a straight-line basis over the shorter of the estimated useful lives of the assets or the remaining lease term. In January 2023 the Company completed an assessment of the useful lives of servers and adjusted the estimated useful life of servers from three to six years, effective in 2023.
OUTBRAIN INC.
Notes to Consolidated Financial Statements
As of and For Years Ending December 31, 20212023 and 20202022
For the year ended December 31, 2021, one media owner accounted for 10% of the Company’s total traffic acquisition costs. For the year ended December 31, 2020, two media owners individually accounted for 12% and 11% of the Company’s total traffic acquisition costs. For the year ended December 31, 2019, two media owners individually accounted for 14% and 11% of the Company’s total traffic acquisition costs.
Property, equipment and capitalized software, net
Property and equipment, including leasehold improvements, are stated at cost, less accumulated depreciation and amortization. Depreciation is computed using the straight-line method over the estimated useful lives of the related assets. Depreciation on property and equipment, excluding leasehold improvements, is three years. Leasehold improvements are amortized on a straight-line basis over the shorter of the estimated useful lives of the assets or the remaining lease term. Amortization on leasehold improvements ranges from one to nine years.
The Company capitalizes qualifying development costs associated with software that is developed or obtained for internal use, provided that management with the relevant authority authorizes and commits to the funding of the project, it is probable the project will be completed and the software will be used to perform the function intended. Capitalized costs, including costs incurred for enhancements that are expected to result in additional significant functionality are capitalized and amortized on a straight-line basis over the estimated useful life, which approximates three years. Costs related to preliminary project activities and post-implementation operation activities, including training and maintenance, are expensed as incurred.
Intangible assets, net
Intangible assets primarily consist of developed technology, media owner and customer relationships and media owner relationshipstrade names, resulting from the Company’s acquisitions. Intangible assets are carried at cost, less accumulated amortization, unless a determination has been made that their value has been impaired. Intangible assets are amortized on a straight-line basis over their estimated useful lives. Amortization expense in the accompanying consolidated statements of operations is included as a component of other cost of revenue for developed technology assets and sales and marketing expense for customer and media owner relationships and tradenames.
Impairment of Long-Lived Assets
Long-lived assets consist of the Company’s property, equipment, capitalized software development costs and other assets, including identifiable intangible assets with finite lives. The Company’s long-lived assets are reviewed for impairment whenever events or changes in circumstances indicate that the carrying value of these assets may not be recoverable or that the useful life is shorter than originally estimated. Recoverability of these assets is first assessed by comparison of the carrying amount of each asset to the future undiscounted cash flows the asset is expected to generate over their remaining lives. If the asset is considered to be impaired, the amount of any impairment is measured as the difference between the carrying value and the fair value of the impaired asset. If the useful life is shorter than originally estimated, the Company amortizes the remaining carrying value over the new shorter useful life.
Goodwill
Goodwill represents the excess of the purchase price of an acquired entity over the fair value of intangible assets acquired and liabilities assumed in a business combination. Goodwill is not amortized but instead evaluated for impairment. The Company performs its annual impairment test of goodwill during the fourth quarter of each fiscal year or whenever events or circumstances change that would indicate that goodwill may not be recoverable. In conducting the impairment test, the Company can opt to perform a qualitative assessment to test goodwill for impairment or can directly perform the two-step impairment test described below. Based onIf the Company’sCompany performs a qualitative assessment ifand it is determined that the fair value of a reporting unit is more likely than not to be less than its carrying amount, a quantitative impairment test is performed. If the fair value of the reporting unit exceeds the carrying value of the net assets assigned to that unit, goodwill is not considered impaired. If the carrying value of the reporting unit exceeds its fair value, an impairment charge is recorded for the difference. Based on the Company’s qualitative assessment performed during the fourth quarter of fiscal years 2021, 20202023, 2022 and 2019,2021, the Company concluded that it was more-likely-than-not that the estimated fair value of the Company’s single reporting unit exceeded its carrying value. Accordingly, no goodwill impairment charges were recognized for the years ended December 31, 2021, 20202023, 2022 and 2019.2021.
OUTBRAIN INC.
Notes to Consolidated Financial Statements
As of and For Years Ending December 31, 2021 and 2020
Revenue Recognition
The Company recognizes revenues when it transfers control of promised services directly to its customers, in an amount that reflects the consideration to which the Company expects to be entitled to in exchange for those services. The Company recognizes revenue pursuant to the five-step framework contained in ASC 606: (i) identify the contract with a client; (ii) identify the performance obligations in the contract, including whether they are distinct in the context of the contract; (iii) determine the transaction price, including the constraint on variable consideration; (iv) allocate the transaction price to the performance obligations in the contract; and (v) recognize revenue as the Company satisfies the performance obligations.
The Company generates revenue primarily from advertisers through user engagement with the ads that it places on media partners’ web pages and mobile applications. The Company’s platform delivers ads to end-users that appear as links to articles and videos on media owners’ sites.
OUTBRAIN INC.
Notes to Consolidated Financial Statements
As of and For Years Ending December 31, 2023 and 2022
The Company’s customers include brands, performance marketers and other advertisers, which are collectively referred to as its advertisers, each of which contract for use of its services primarily through insertion orders or through self-service tools, allowing advertisers to establish budgets for their advertising campaigns. Advertising campaigns are primarily billed on a monthly basis. The Company’s payment terms generally range from 30 to 60 days.
For advertising campaigns priced on a cost-per-click basis, the Company bills its advertisers and recognizes revenue when a user clicks on an advertisement it delivers.
For campaigns priced on a cost-per-impression basis, the Company bills its advertisers and recognizes revenue based on the number of times an advertisement is displayed to a user.user in the period.
Variable consideration, including allowances, discounts, refunds, credits, incentives, or other price concessions, is estimated and recorded at the time that related revenue is recognized. Advance payments from advertisers for future services represent contract liabilities and are recorded as deferred revenue in the Company’s consolidated balance sheets.
The determination of whether revenue should be reported on a gross or a net basis involves significant judgement. In general, the Company acts as a principal on behalf of its advertisers and revenue is recognized gross of any costs that it remits to the media partners. In these cases, the Company determined that it controls the advertising inventory before it is transferred to its advertisers. The Company’s control is evidenced by its ability to monetize the advertising inventory before it is transferred to its advertisers. For those revenue arrangements where the Company does not control the advertising inventory before it is transferred to its advertisers, the Company is the agent and recognizes revenue on a net basis. The Company recognizes revenue net of applicable sales taxes.
Contract Balances
Balances. There were no contract assets as of December 31, 20212023 or December 31, 2020.2022. Contract liabilities primarily relate to advance payments and consideration received from customers. As of December 31, 20212023 and December 31, 2020,2022, the Company’s contract liabilities were recorded as deferred revenue in its consolidated balance sheets. See Note 1215 for disaggregation of the Company’s revenue based on geography of where the Company’s marketers are physically located.
Cost of Revenue
Traffic Acquisition Costs. Traffic acquisition costs consist of amounts the Company owes to media owners when users engage with promoted recommendations on media owners’ properties. The Company incurs costs with media owners in the period in which the click-throughs occur or in some circumstances based on a guaranteed minimum rate of payment from the Company in exchange for guaranteed placement of the Company’s promoted recommendations on specified portions of the media ownersowners’ online properties. These guaranteed rates are typically provided per thousand qualified page views, whereby the Company’s minimum monthly payment to the media owner may fluctuate based on how many qualified page views the media owner generates, generally subject to a maximum guarantee. Traffic acquisition costs also include amounts payable to programmatic supply partners.
OUTBRAIN INC.
Notes to Consolidated Financial Statements
As of and For Years Ending December 31, 2021 and 2020
In some instances, the Company may make upfront payments to media owners in connection with long-term contracts. The Company capitalizes these advance payments under these agreements if selectspecific capitalization criteria have been met. The capitalization criteria includeincludes the existence of future economic benefits to us,the Company, the existence of legally enforceable recoverability language (e.g., early termination clauses), management’s ability and intent to enforce the recoverability language and the ability to generate future earnings from the agreement in excess of amounts deferred. Capitalized amounts are amortized as traffic acquisition costs over the shorter of the period of contractual recoverability or the corresponding period of economic benefit. Amounts not yet paid are accrued systematically based on the Company’s estimate of user engagement.
Other Cost of Revenue. Cost of revenue also includes costs related to the management of the Company’s data centers, hosting fees, data connectivity costs and depreciation and amortization. Cost of revenue also includes the amortization of capitalized software that is developed or obtained for internal use associated with the Company’s revenue-generating technologies. Additionally, other cost of revenue includes amortization of intangible assets related to developed technology acquired by the Company and used in its revenue-generating efforts.
OUTBRAIN INC.
Notes to Consolidated Financial Statements
As of and For Years Ending December 31, 2023 and 2022
Research and Development
The Company incurs research and development expenses primarily relating to the development and enhancement of its content discovery platform. These expenses consist primarily of personnel and the related overhead costs and amortization of capitalized software for non-revenue generating infrastructure. Research and development expenses are expensed as incurred, except for internal-use software development costs that qualify for capitalization.
Advertising and Promotional Costs
Advertising and promotional costs are included in sales and marketing expenses as incurred in the accompanying consolidated statements of operations. Advertising and promotional costscosts were $13.1$12.7 million, $9.3$15.6 million and $11.0$13.1 million for the years ended December 31, 2023, 2022 and 2021, 2020 and 2019, respectively.
Segment Information
The Company has 1one operating and reporting segment. The Company’s chief operating decision maker is its Co-Chief Executive Officer who makes resource allocation decisions and assesses performance based on financial information presented on a consolidated basis.
Stock-based Compensation
The Company recognizes stock-based compensation for stock-based awards, including stock options, restricted stock awards (“RSAs”), restricted stock units (“RSUs”) and stock appreciation rights (“SARs”) based on the estimated fair value of the awards. The fair value of the Company’s RSUs is the fair value of the Company’s common stock on the date of grant. The Company estimates the fair value of its stock option awards on the grant date using the Black-Scholes option-pricing model. The Black-Scholes option-pricing model requires the use of judgments and assumptions, including the option’s expected term and the price volatility of the underlying stock. The fair value of the Company’s RSAs and RSUs is the fair value of the Company’s common stock on the date of grant. The Company accounts for forfeitures as they occur.
StockCertain of the Company’s stock option awards, RSAs, RSUs and SARs generally vest subjecthad a service condition and a performance condition, satisfied upon the Company’s IPO, which was a qualifying liquidity event. Accordingly, the Company recognized stock-based compensation expense upon its IPO to the satisfaction ofextent the related service requirements, or the satisfaction of both service requirementscondition was met. Stock-based compensation expense for unvested stock option and achievement of certain performance conditions. For stockRSU awards, and other awards that vest subject to the satisfaction of service requirements, stock-based compensationconditions is measured based on the fair value of the award on the date of grant and isbeing recognized as stock-based compensation on a straight-line basis over the requisite service period. For stock awards that have a performance component, stock-based compensation is measured based on the fair value on the grant date and is recognized over the requisite service period as achievement of the performance objective becomes probable.
For common stock options or warrants issued to non-employees, including consultants, the Company records stock-based compensation based on the fair value of the options or warrants calculated using the Black-Scholes option pricing model. The Company calculates the fair value of each stock-based award to non-employees on each measurement date based on the fair value of its common stock. The fair value of each stock-based award granted to non-employees is remeasured as the options or warrants vest, and the resulting change in fair value is recognized in the consolidated statements of operations during the period the related services are rendered.
OUTBRAIN INC.
Notes to Consolidated Financial Statements
As of and For Years Ending December 31, 2021 and 2020
Foreign Currency
The Company transacts business in various foreign currencies. In general, the functional currency of its foreign subsidiaries is the currency of the local country. Consequently,Accordingly, revenues and expenses of operations outside the United States (“U.S.”) are generally translated into U.S. dollars using weighted-average exchange rates, while assets and liabilities are translated into U.S. dollars using exchange rates in effect at the balance sheet date with the resulting translation adjustments recorded as a component of accumulated other comprehensive income (loss) within the statements of convertible preferred stock and stockholders’ equity (deficit). Foreign currency transaction gains and losses resulting from remeasurement of transactions denominated in a currency other than the functional currency are recognized in the consolidated statements of operations. The net foreign exchange transaction gains (losses)losses included in interest income and other (expense) income, (expense), net in the accompanying consolidated statements of operations were $(3.3)$1.0 million, $(3.1)$2.1 million and $0.3$3.1 million for the years ended December 31, 2021, 20202023, 2022 and 2019,2021, respectively.
Derivative Financial Instruments
The Company is exposed to certain risks relating to its ongoing business operations, including but not limited to, fluctuations in foreign currency exchange rates. The Company enters into foreign currency forward exchange contracts to manage its foreign currency exchange risk by reducing the effects of fluctuations in foreign currency exchange rates on its net cash flows. These derivative contracts are not designated as accounting hedges. Accordingly, the Company recognizes gains and losses resulting from a change in fair value for these derivatives in the period in which the change occurs. For the years ended December 31, 2021, 2020 and 2019, the Company recognized unrealized net gains of $0.2 million, $0.4 million and $0.5 million within interest income and other income (expense), net in its consolidated statements of operations. The Company classifies cash flows from these contracts as operating activities in its consolidated statements of cash flows. The notional amount of the Company’s outstanding derivative instruments was $33.5$36.3 million and $8.8$44.9 million as of December 31, 20212023 and 2020,2022, respectively. See Note 7 for additional information.
OUTBRAIN INC.
Notes to Consolidated Financial Statements
As of and For Years Ending December 31, 2023 and 2022
Severance Pay Asset and Liability
The Company records a severance pay asset and liability on its consolidated balance sheets related to certain of its employees located in Israel. The liability for severance pay is calculated pursuant to Israeli severance pay law based on the most recent salary for the employees multiplied by the number of years of employment, as of the respective balance sheet date. EmployeesEligible employees are entitled to one-monthone month salary for each year of employment or a portion thereof. The Company’s liability at each respective balance sheet date for all of its eligible Israeli employees is fully accrued in other liabilities in the accompanying consolidated balance sheets. The Company funds this obligation through monthly deposits to the employee’semployees’ pension and management insurance policies. The carrying value of these policies is recorded as a severance fund asset in other assets in the accompanying consolidated balance sheets.
The deposited funds may be withdrawn only upon the fulfillment of itsthe Company’s obligation pursuant to Israeli severance pay law. The carrying value of its deposited funds is based on the cash surrender value of these policies and includes profits accumulated through the respective balance sheet date.
Defined Contribution Plans
The Company contributes to defined contribution savings plans covering eligible employees of the Company. Participants of the plans may defer annual pre-tax compensation, subject to statutory and plan limitations. In addition, a certain percentage of an employee’s contributions are matched by the Company and vest over a specified period of time, subject to certain statutory and plan limitations. The Company’s contributions were approximately $8.5 million, $9.6 million, and $8.4 million for 2023, 2022, and 2021, respectively, which were expensed as incurred.
Income Taxes
The Company accounts for income taxes using an asset and liability method. Deferred tax assets and liabilities are recognized for the future tax consequences attributable to differences between the financial statement carrying amounts of existing assets and liabilities and their respective tax bases and operating loss and tax credit carryforwards. Deferred income tax assets and liabilities are measured using the currently enacted tax rates that apply to taxable income in effect for the years in which those tax assets and liabilities are expected to be realized or settled. The Company regularly assesses the likelihood that its deferred income tax assets will be realized. To the extent that the Company believes any amounts are not more likely than not to be realized, a valuation allowance is recorded to reduce the deferred income tax assets. The Company’s deferred tax assets were $32.9$38.4 million and $2.8$35.7 million as of December 31, 20212023 and 2020,2022, respectively. The Company’s deferred tax liabilities were $1.7$4.0 million and $3.4$5.3 million as of December 31, 20212023 and 2020,2022, respectively, and are included within other liabilities in the consolidated balance sheets. The Company regularly assesses the need for the valuation allowance on its deferred tax assets, and to the extent that it determines that an adjustment is needed, such adjustment will be recorded in the period that the determination is made.
OUTBRAIN INC.
Notes to Consolidated Financial Statements
As of and For Years Ending December 31, 2021 and 2020
The Company recognizes the effect of income tax positions only if those positions are more likely than not of being sustained. Recognized income tax positions are measured at the largest amount that is greater than 50% likely of being realized. Changes in recognition or measurement are reflected in the period in which the change in judgment occurs. The Company recognizes interest and penalties related to income tax matters as income tax expense.
COVID-19 ImpactsThe Company's policy with respect to releasing the income tax effects related to its available-for-sale investments in debt securities from accumulated other comprehensive income is to apply a security by security approach whereby the tax effects are measured based on the change to unrealized gains or losses reflected in other comprehensive income.
In March 2020,New Accounting Pronouncements
Under the World Health Organization declaredJOBS Act, the spreadCompany meets the definition of an emerging growth company and can delay adopting new or revised accounting standards issued subsequent to the enactment of the COVID-19 diseaseJOBS Act until such time as a global pandemic.those standards would otherwise apply to private companies. The COVID-19 pandemic resulted in a global slowdown of economic activity causing a decrease in demandCompany has elected to use this extended transition period for a broad variety of goodscomplying with new or revised accounting standards that have different effective dates for public and services, including those provided by certain advertisers usingprivate companies until the Company’s platform. ManyCompany is no longer an emerging growth company or until the Company affirmatively and irrevocably opts out of the Company’s advertisers reduced their advertising spending, which had a negative impact on its revenue during the first halfextended transition period.
Table of 2020. As the world quickly shifted to online activities and advertisers gradually shifted their spending toward digital advertising, the Company’s revenue trends improved meaningfully and returned to growth beginning in the second half of 2020. Although the advertising market and the Company’s business have generally recovered from the economic effects of the COVID-19 pandemic, variables such as global supply chain disruptions, labor shortages and stoppages, and cost inflation impacted certain categories of advertisers, such as the automotive advertisers, and could adversely impact the Company in the future, including if its advertisers were to reduce or cut their advertising spending as a result of any of these factors. The Company continues to monitor its operations, and the operations of those in its ecosystem (including media partners, advertisers and agencies), as well as government recommendations.Contents OUTBRAIN INC.
Notes to Consolidated Financial Statements
As of and For Years Ending December 31, 2023 and 2022
Recently Issued Accounting Pronouncements
Recently adopted accounting pronouncements
On January 1, 2021, the Company early adopted Accounting Standards Update (“ASU”) 2020-06, “Accounting for Convertible Instruments and Contracts in an Entity’s Own Equity,” which simplified the accounting for convertible debt instruments by reducing the number of accounting models used to allocate proceeds from five to three, removing certain conditions for equity classification and amending earnings per share calculations to assume share settlement and to require the if-converted method to be applied to all convertible debt instruments. The adoption of this standard did not have an impact on the Company’s consolidated financial statements as of the date of adoption. The Company applied this guidance to its Convertible Notes issued in July 2021 and utilized the if-converted method to calculate the dilutive impact of Convertible Notes and its previously outstanding convertible preferred stock on its earnings per share.
Recently issued accounting pronouncements not yet adopted
In February 2016, the Financial Accounting Standards Board (the “FASB”) issued ASU 2016-02, “Leases (Topic 842)”, which sets out the principles for the recognition, measurement, presentation and disclosure of leases for both parties to a contract (i.e., lessees and lessors). The new standard requires lessees to apply a dual approach, classifying leases as either finance or operating leases based on the principle of whether the lease is effectively a financed purchase by the lessee. This classification will determine whether lease expense is recognized based on an effective interest method or on a straight-line basis over the term of the lease. A lessee is also required to record a right-of-use asset and a lease liability for all leases with a term of greater than twelve months, regardless of their classification. Leases with a term of twelve months or less will be accounted for similar to existing guidance for operating leases today. The new standard requires lessors to account for leases using an approach that is substantially equivalent to existing guidance for sales-type leases, direct financing leases and operating leases. ASU 2016-02 supersedes the previous leases standard, Leases (Topic 840). In June 2020,November 2023, the FASB issued ASU 2020-05 Revenue from Contracts with Customers2023-07, “Segment Reporting (Topic 606)280): Improvements to Reportable Segment Disclosures” (“ASU 2023-07”). ASU 2023-07 requires enhanced disclosures about significant segment expenses and Leases (Topic 842): Effective Datesprofitability measures for Certain Entities.all public entities, including those that have one reportable segment. The amendments in this update defer theASU is required to be applied retrospectively and is effective date of ASU 2016-02 for private companies to fiscal years beginning after December 15, 2021,2023, and interim periods within fiscal years beginning after December 15, 2022. Early application2024. The Company is in the process of evaluating the impact of ASU 2023-07 on its segment disclosures.
In December 2023, the FASB issued ASU 2023-09, “Income Taxes (Topic 740): Improvements to Income Tax Disclosures” (“ASU 2023-09”). ASU 2023-09 is focused on increased visibility into specific income tax components, requiring disclosures of specific categories and a greater disaggregation of information by jurisdiction within the effective tax rate reconciliation and income taxes paid disclosures. ASU 2023-09 is effective for our annual periods beginning January 1, 2025, with early adoption permitted. The Company will adopt this standardis in the process of evaluating the impact of ASU 2023-09 on its tax-related disclosures.
2. Acquisition
On January 5, 2022, the Company acquired all of the outstanding shares of video intelligence AG (“vi”), a Swiss-based contextual video technology company for digital media owners, for an aggregate purchase price of approximately $54.2 million, which was paid in the form of cash and Outbrain common stock. The equity portion of the purchase price was comprised of 355,786 shares of the Company’s common stock with a fair value of $4.2 million. The first installment of $37.3 million in cash and the equity portion were paid at closing, an additional $10.6 million paid in the third quarter of 2022, and $1.3 million was paid in 2023. The consideration paid during the first quarter of 2023 included $0.9 million of contingent consideration, $0.5 millionof which was recognized on the acquisition date, and$0.4 million recorded as a fair value adjustment in the Company’s consolidated statement of operations for the year ended December 31, 2022, based on the market price of the Company’s stock determined one year from closing. This acquisition expanded the Company’s video product offerings to include in-stream high-quality video content, delivering a better user experience and more value to its advertisers.
This acquisition was accounted for as a business combination under the acquisition method of accounting and the results of operations of vi have been included in the Company’s results of operations since January 5, 2022. The Company incurred transaction costs relating to the vi acquisition of $0.2 million, which were included in general and administrative expenses in the Company’s consolidated statement of operations for the year ended December 31, 2022. The results of operations for vi have been included in the Company’s audited consolidated financial statements beginning on January 1,5, 2022.
3. Restructuring
On May 31, 2023, the Company announced a reduction in its global workforce of approximately 10%, to adjust to the continued macroeconomic uncertainty, create additional operating efficiencies, and support the Company’s strategic growth and profitability objectives. As a result, the Company recorded pre-tax charges of approximately $2.3 million for employee severance and related benefit costs in its consolidated statement of operations for 2023, $1.5 million of which was recorded within sales and marketing expenses, $0.4 million within research and development expenses, and $0.4 million within general and administrative expenses. During the twelve months ended December 31, 2023, all of the associated costs have been fully paid.
In addition, the Company incurred $1.2 million of other severance and related costs related to reorganization activities undertaken in 2023, approximately $0.9 million of which have been paid during the twelve months ended December 31, 2023.
OUTBRAIN INC.
Notes to Consolidated Financial Statements
As of and For Years Ending December 31, 2023 and 2022
4. Investments in Marketable Securities
All of the Company’s debt securities are classified as requiravailable-for-sale. The Company’s cash equivalents and investments as of December 31, 2023 and December 31, 2022 consisted of the following:
| | | | | | | | | | | | | | | | | | | | | | | | | | | | | | | | | | | | | | | | | | | | | | | | | | | | | |
| | | | December 31, 2023 |
| (In thousands) | | Fair Value Level | | Amortized cost (1) | | Gross Unrealized Gains | | Gross Unrealized Losses | | Estimated Fair Value | | | Cash Equivalents | | Short-term investments | | Long-term investments |
| Money market funds | | 1 | | $ | 15,355 | | | $ | — | | | $ | — | | | $ | 15,355 | | | | $ | 15,355 | | | $ | — | | | $ | — | |
| U.S. Treasuries | | 2 | | 14,977 | | | 1 | | | (29) | | | 14,949 | | | | 3,497 | | | 11,452 | | | — | |
| U.S. government bonds | | 2 | | 39,048 | | | 40 | | | (114) | | | 38,974 | | | | — | | | 20,762 | | | 18,212 | |
| Commercial paper | | 2 | | 9,422 | | | 11 | | | (3) | | | 9,430 | | | | — | | | 9,430 | | | — | |
| U.S. Corporate bonds | | 2 | | 100,146 | | | 275 | | | (197) | | | 100,224 | | | | — | | | 52,669 | | | 47,555 | |
| Total cash equivalents and investments | | | | $ | 178,948 | | | $ | 327 | | | $ | (343) | | | $ | 178,932 | | | | $ | 18,852 | | | $ | 94,313 | | | $ | 65,767 | |
| | | | | | | | | | | | | | | | | | | | | | | | | | | | | | | | | | | | | | | | | | | | | | | | | | | | | |
| | | | December 31, 2022 |
| (In thousands) | | Fair Value Level | | Amortized cost (1) | | Gross Unrealized Gains | | Gross Unrealized Losses | | Estimated Fair Value | | | Cash Equivalents | | Short-term investments | | Long-term investments |
| Money market funds | | 1 | | $ | 39,198 | | | $ | — | | | $ | — | | | $ | 39,198 | | | | $ | 39,198 | | | $ | — | | | $ | — | |
| U.S. Treasuries | | 2 | | 31,721 | | | — | | | (317) | | | 31,404 | | | | — | | | 23,701 | | | 7,703 | |
| U.S. government bonds | | 2 | | 77,259 | | | — | | | (899) | | | 76,360 | | | | — | | | 52,254 | | | 24,106 | |
| Commercial paper | | 2 | | 43,126 | | | 3 | | | (161) | | | 42,968 | | | | — | | | 42,968 | | | — | |
| U.S. Corporate bonds | | 2 | | 95,599 | | | 29 | | | (694) | | | 94,934 | | | | — | | | 47,982 | | | 46,952 | |
| Total cash equivalents and investments | | | | $ | 286,903 | | | $ | 32 | | | $ | (2,071) | | | $ | 284,864 | | | | $ | 39,198 | | | $ | 166,905 | | | $ | 78,761 | |
___________________________
(1)ed. The Company expects its assetsamortized cost of debt securities excludes accrued interest of $1.4 million and liabilities t$1.0 million, respectively, as of December 31, 2023 and December 31, 2022o increase .by $14 million to $16 million
On April 14, 2023, in connection with the recordingCompany’s partial repurchase of right-of-use assetsits 2.95% Convertible Senior Notes due 2026 (“Convertible Notes”), the Company redeemed half of its available-for-sale marketable securities prior to their maturities to finance the debt repurchase. Proceeds from the sales of securities for the twelve months ended December 31, 2023 were $81.7 million and lease liabilities upon adoptiona gross realized loss of this standard. This standard is not expected to have a material impact on$0.5 million was released from other comprehensive loss and recorded within interest income and other income (expense), net in the Company’s resultsaudited consolidated statement of operations.operations for the twelve months ended December 31, 2023. The gross realized loss was determined using the specific identification method. See Note 12 for the effect of the reclassification adjustments on other comprehensive income.
The following table shows the fair value of the Company’s available-for-sale securities by contractual maturity:
| | | | | |
| December 31, 2023 |
| (In thousands) |
| Within 1 year | $ | 113,165 | |
| After 1 year through 2 years | 65,767 | |
| Total fair value | $ | 178,932 | |
OUTBRAIN INC.
Notes to Consolidated Financial Statements
As of and For Years Ending December 31, 20212023 and 2020
In June 2016,The following table presents the FASB issued ASU 2016-13, “Financial Instruments - Credit Losses (Topic 326),” which requiresfair value in investments and gross unrealized losses recorded in other comprehensive loss, by investment category and the measurement and recognitionlength of expected credit losses for financial assets held at amortized cost. ASU 2016-13 replacestime the existing incurredsecurities have been in a continuous loss impairment model with an expected loss model which requires considerationposition:
| | | | | | | | | | | | | | | | | | | | | | | | | | | | | | | | | | | | | | |
| | December 31, 2023 |
| | Less than 12 Months | | 12 Months or More | | Total |
| (In thousands) | | Fair Value | | Unrealized Loss | | Fair Value | | Unrealized Loss | | Fair Value | | Unrealized Loss |
| U.S. Treasuries | | $ | 1,279 | | | $ | — | | | $ | 4,711 | | | $ | (29) | | | $ | 5,990 | | | $ | (29) | |
| U.S. government bonds | | 6,798 | | | (9) | | | 16,964 | | | (105) | | | 23,762 | | | (114) | |
| Commercial paper | | 3,649 | | | (3) | | | — | | | — | | | 3,649 | | | (3) | |
| U.S. Corporate bonds | | 40,031 | | | (119) | | | 18,840 | | | (78) | | | 58,871 | | | (197) | |
| Total | | $ | 51,757 | | | $ | (131) | | | $ | 40,515 | | | $ | (212) | | | $ | 92,272 | | | $ | (343) | |
As of forward-looking information to calculate credit loss estimates. These changes will resultDecember 31, 2022, all of the Company’s marketable securities had been in an earlier recognition of credit losses. The Company's financial assets held at amortized cost include accounts receivable. The amendments in ASU 2020-05 deferredunrealized loss position for less than twelve months.
For marketable securities with unrealized loss positions, the effective date for Topic 326 to fiscal years beginning after December 15, 2022. The Company plans to adopt this standard on the earlier of January 1, 2023 or on losing its emerging growth company status. The Company does not expectintend to sell these securities and it is more likely than not that the adoptionCompany will hold these securities until maturity or a recovery of this standard will have a material impact on the consolidated financial statements or related disclosures.cost basis. No allowance for credit losses was recorded for these securities as of December 31, 2023 and December 31, 2022.
5. Goodwill and Intangible Assets
The Company’s goodwill balance as of December 31, 2023 and December 31, 2022 was $63.1 million. The Company has not recorded any accumulated impairments of goodwill.
The gross carrying amount and accumulated amortization of the Company’s intangible assets are as follows:
| | | | | | | | | | | | | | | | | | | | | | | |
| December 31, 2023 |
| Weighted Average Amortization
Period | | Gross Value | | Accumulated Amortization | | Net Carrying Value |
| (In thousands) |
| Developed technology | 8.0 years | | $ | 18,410 | | | $ | (10,900) | | | $ | 7,510 | |
| Customer relationships | 5.0 years | | 5,972 | | | (5,530) | | | 442 | |
| Publisher relationships | 8.0 years | | 18,973 | | | (10,863) | | | 8,110 | |
| Trade names | 8.8 years | | 5,326 | | | (1,779) | | | 3,547 | |
| Content Provider Relationships | 5.0 years | | 284 | | | (113) | | | 171 | |
| Other | 15.8 years | | 898 | | | (282) | | | 616 | |
| Total intangible assets, net | | | $ | 49,863 | | | $ | (29,467) | | | $ | 20,396 | |
| | | | | | | | | | | | | | | | | | | | | | | |
| December 31, 2022 |
| Weighted Average Amortization
Period | | Gross Value | | Accumulated Amortization | | Net Carrying Value |
| (In thousands) |
| Developed technology | 5.8 years | | $ | 18,411 | | | $ | (9,652) | | | $ | 8,759 | |
| Customer relationships | 4.1 years | | 5,856 | | | (5,022) | | | 834 | |
| Publisher relationships | 6.3 years | | 18,738 | | | (8,782) | | | 9,956 | |
| Trade names | 8.7 years | | 5,279 | | | (1,143) | | | 4,136 | |
| Content Provider Relationships | 5.0 years | | 284 | | | (56) | | | 228 | |
| Other | 15.8 years | | 888 | | | (227) | | | 661 | |
| Total intangible assets, net | | | $ | 49,456 | | | $ | (24,882) | | | $ | 24,574 | |
OUTBRAIN INC.
Notes to Consolidated Financial Statements
As of and For Years Ending December 31, 2023 and 2022
No impairment charges were recorded for the Company’s intangible assets subject to amortization during the years ended December 31, 2023, 2022, and 2021.
As of December 31, 2023, estimated amortization related to the Company’s identifiable acquisition-related intangible assets in future periods was as follows:
| | | | | | | | |
| Year Ending December 31, | | Amount |
| | (In thousands) |
| 2024 | | $ | 3,469 | |
| 2025 | | 3,469 | |
| 2026 | | 3,469 | |
| 2027 | | 3,117 | |
| 2028 | | 3,062 | |
| Thereafter | | 3,810 | |
| Total | | $ | 20,396 | |
6. Balance Sheet Components
Accounts Receivable and Allowance for Credit Losses
Accounts receivable, net of allowance for credit losses consists of the following:
| | | | | | | | | | | |
| December 31, |
| 2023 | | 2022 |
| (In thousands) |
| Accounts receivable | $ | 199,714 | | | $ | 186,770 | |
| Allowance for credit losses | (10,380) | | | (5,512) | |
| Accounts receivable, net of allowance for credit losses | $ | 189,334 | | | $ | 181,258 | |
The allowance for credit losses consists of the following activity:
| | | | | | | | | | | | | | | | | |
| Year Ended December 31, |
| 2023 | | 2022 | | 2021 |
| (In thousands) |
| Allowance for credit losses, beginning balance | $ | 5,512 | | | $ | 4,402 | | | $ | 4,174 | |
| Provision for credit losses, net of recoveries | 8,220 | | | 3,227 | | | 2,601 | |
| Write-offs | (3,352) | | | (2,117) | | | (2,373) | |
| Allowance for credit losses, ending balance | $ | 10,380 | | | $ | 5,512 | | | $ | 4,402 | |
Prepaid Expenses and Other Current Assets
Prepaid expenses and other current assets consists of the following:
| | | | | | | | | | | |
| December 31, |
| 2023 | | 2022 |
| (In thousands) |
| Prepaid traffic acquisition costs | $ | 26,398 | | | $ | 23,149 | |
| Prepaid taxes | 11,371 | | | 15,280 | |
| Prepaid software licenses | 2,224 | | | 2,465 | |
| Other prepaid expenses and other current assets | 7,247 | | | 5,867 | |
| Total prepaid expenses and other current assets | $ | 47,240 | | | $ | 46,761 | |
OUTBRAIN INC.
Notes to Consolidated Financial Statements
As of and For Years Ending December 31, 2023 and 2022
Property, Equipment and Capitalized Software, Net
Property, equipment and capitalized software, net consists of the following:
| | | | | | | | | | | |
| December 31, |
| 2023 | | 2022 |
| (In thousands) |
| Capitalized software development costs | $ | 78,389 | | | $ | 67,685 | |
| Computer and equipment | 61,529 | | | 59,536 | |
| Leasehold improvements | 3,300 | | | 2,859 | |
| Software | 3,221 | | | 3,113 | |
| Furniture and fixtures | 1,098 | | | 1,177 | |
| Property, equipment and capitalized software, gross | 147,537 | | | 134,370 | |
| Less: accumulated depreciation and amortization | (105,076) | | | (94,480) | |
| Total property, equipment and capitalized software, net | $ | 42,461 | | | $ | 39,890 | |
The Company capitalized software development costs, including stock-based compensation, of $10.7 million and $13.5 million for the years ended December 31, 2023 and 2022, respectively. Accumulated amortization for capitalized software development costs was $57.4 million and $47.8 million as of December 31, 2023 and 2022, respectively.
As of December 31, 2023 and 2022, total computer equipment financed and software licensed under finance leases was $0.2 million and $1.9 million, net of accumulated amortization of $25.8 million and $23.9 million. Amortization expense related to total computer equipment financed and software licensed under finance leases was $1.6 million, $2.9 million and $3.8 million, respectively, for the years ended December 31, 2023, 2022 and 2021.
Accrued and Other Current Liabilities
Accrued and other current liabilities consist of the following:
| | | | | | | | | | | |
| December 31, |
| 2023 | | 2022 |
| (In thousands) |
| Accrued traffic acquisition costs | $ | 75,870 | | | $ | 73,396 | |
| Accrued tax liabilities | 15,596 | | | 15,013 | |
| Accrued agency commissions | 12,376 | | | 13,451 | |
| Operating lease obligations, current | 3,684 | | | 3,236 | |
| Accrued professional fees | 3,261 | | | 4,915 | |
| Interest payable | 1,566 | | | 3,074 | |
| Other | 7,350 | | | 13,007 | |
| Total accrued and other current liabilities | $ | 119,703 | | | $ | 126,092 | |
In addition to accrued traffic acquisition costs, accounts payable includes $137.6 million and $136.8 million of traffic acquisition costs as of December 31, 2023 and 2022, respectively.
OUTBRAIN INC.
Notes to Consolidated Financial Statements
As of and For Years Ending December 31, 2023 and 2022
7. Fair Value Measurements
The Company utilizes valuation techniques that maximize the use of observable inputs and minimize the use of unobservable inputs to the extent possible. The Company’s financial instruments include restricted time deposits, severance pay fund deposits and foreign currency forward contract assets.contracts. The Company determines the fair value of its financial instruments based on assumptions that market participants would use in pricing an asset or liability in the principal or most advantageous market. When considering market participant assumptions in fair value measurements, the Company uses the fair value hierarchy described below to distinguish between observable and unobservable inputs::
Level I — Valuations based on quoted prices in active markets for identical assets and liabilities at the measurement date;
Level II — Valuations based on quoted prices in active markets for similar assets or liabilities, quoted prices for identical or similar assets or liabilities in inactive markets, or other inputs that are observable or can be principally corroborated by observable market data for substantially the full term of the related assets or liabilities; and
Level III — Valuations based on unobservable inputs that are significant to the measurement of the fair value of the assets or liabilities that are supported by little or no market data.
The following table sets forth the fair value of the Company’s financial assets and liabilities measured on a recurring basis by level within the fair value hierarchy:
| | December 31, 2021 |
| Level I | | Level II | | Level III | | Total |
| (In thousands) |
| December 31, 2023 | | | December 31, 2023 |
| Level I | | | Level I | | Level II | | Level III | | Total |
| (In thousands) | | | (In thousands) |
| Financial Assets: | Financial Assets: | |
Cash equivalents and investments (1) | |
Cash equivalents and investments (1) | |
Cash equivalents and investments (1) | |
Restricted time deposit (1)(2) | Restricted time deposit (1)(2) | $ | — | | | $ | 195 | | | $ | — | | | $ | 195 | |
Severance pay fund deposits (1)(2) | Severance pay fund deposits (1)(2) | — | | | 6,086 | | | — | | | 6,086 | |
Foreign currency forward contract (2)(3) | Foreign currency forward contract (2)(3) | — | | | 741 | | | — | | | 741 | |
| Total financial assets | Total financial assets | $ | — | | | $ | 7,022 | | | $ | — | | | $ | 7,022 | |
| Financial Liabilities: | |
Foreign currency forward contract (4) | |
Foreign currency forward contract (4) | |
Foreign currency forward contract (4) | |
| Total financial liabilities | |
| | December 31, 2020 |
| Level I | | Level II | | Level III | | Total |
| (In thousands) |
| December 31, 2022 | | | December 31, 2022 |
| Level I | | | Level I | | Level II | | Level III | | Total |
| (In thousands) | | | (In thousands) |
| Financial Assets: | Financial Assets: | |
Cash equivalents and investments (1) | |
Cash equivalents and investments (1) | |
Cash equivalents and investments (1) | |
Restricted time deposit (1)(2) | Restricted time deposit (1)(2) | $ | — | | | $ | 426 | | | $ | — | | | $ | 426 | |
Severance pay fund deposits (1)(2) | Severance pay fund deposits (1)(2) | — | | | 5,379 | | | — | | | 5,379 | |
Foreign currency forward contract (2)(3) | Foreign currency forward contract (2)(3) | — | | | 553 | | | — | | | 553 | |
| Total financial assets | Total financial assets | $ | — | | | $ | 6,358 | | | $ | — | | | $ | 6,358 | |
| Financial Liabilities: | |
Foreign currency forward contract (4) | |
Foreign currency forward contract (4) | |
Foreign currency forward contract (4) | |
| Total financial liabilities | |
_____________________
(1)Recorded within other assetsMoney market securities are valued using Level I of the fair value hierarchy, while the fair values of U.S. Treasuries, government bonds, commercial paper, corporate bonds and municipal bonds are considered Level II and are obtained from independent pricing services, which may use various methods, including quoted prices for identical or similar securities in active and inactive markets. See Note 4 for additional detail of the Company’s fixed income securities by balance sheet location.
(2)Recorded within prepaid expenses and other current assetsassets.
OUTBRAIN INC.
Notes to Consolidated Financial Statements
As of and For Years Ending December 31, 20212023 and 20202022
(4)Recorded within accrued and other current liabilities.
The Company records the fair values of the assets and liabilities relating to its undesignated foreign currency forward contracts on a gross basis in its consolidated balance sheets, as they are not subject to master netting arrangements. There is no cash collateral required to be pledged by the Company or its counterparties. The Company enters into foreign currency forward exchange contracts to manage the effects of fluctuations in foreign currency exchange rates on its net cash flows from non-U.S. dollar denominated operations.
By entering into foreign currency forward contracts, the Company is exposed to a potential credit risk that the counterparty to its contracts will fail to meet its contractual obligations. If a counterparty fails to perform, the Company’s 2.95%maximum credit risk exposure would be the positive fair value of the foreign currency forward contracts, or any asset balance, which represents the amount the counterparty owes to the Company. In order to mitigate the counterparty risk, the Company performs an evaluation of its counterparty credit worthiness, and its forward contracts have a term of no more than 12 months. The Company had foreign currency forward contracts with Silicon Valley Bank (“SVB”), which was closed by the California regulators on March 10, 2023. On March 12, 2023, the Department of the Treasury, Federal Reserve and the FDIC approved actions enabling the FDIC to complete its resolution of SVB in a manner that fully protected all depositors and converted SVB to Silicon Valley Bridge Bank, N.A. On March 27, 2023, First-Citizens Bank & Trust Company (“First Citizens Bank”) entered into an agreement with the FDIC to acquire Silicon Valley Bridge Bank, N.A and the Company’s existing foreign currency forward contracts were assumed by First Citizens Bank. For the years ended December 31, 2023, 2022 and 2021, the Company recorded net unrealized gains of $1.6 million, net unrealized losses of $1.5 million, and net unrealized gains of $0.2 million, respectively, within interest income and other income (expense), net in its consolidated statements of operations, related to mark-to-market adjustments on its undesignated foreign currency forward contacts.
The Convertible Senior Notes due 2026 (“Convertible Notes”) are recorded within long-term debt in itson the Company’s consolidated balance sheetsheets at their carrying value, which may differ from their fair value. The fair value of Convertible Notes is estimated using external pricing data, including any available market data for other debt instruments with similar characteristics. The following table summarizes the carrying value and the estimated fair value of the Company’s Convertible Notes, based on Level II measurements of the fair value hierarchy:
| | | | | | | | | | | | | | | | | | | | | | | |
| December 31, 2021 | | December 31, 2020 |
| Carrying Value | | Estimated Fair Value | | Carrying Value | | Estimated Fair Value |
| | | (In thousands) | | |
| Convertible Notes | $ | 236,000 | | $ | 234,348 | | $ | — | | $ | — |
| | | | | | | | | | | | | | | | | | | | | | | |
| December 31, 2023 | | December 31, 2022 |
| Carrying Value | | Estimated Fair Value | | Carrying Value | | Estimated Fair Value |
| | | (In thousands) | | |
| Convertible Notes | $ | 118,000 | | $ | 95,958 | | $ | 236,000 | | $ | 180,752 |
See Note 9 for additional information relating to the Convertible Notes, half of which were repurchased in April 2023.
3. Balance Sheet Components
Accounts Receivable, Net
Accounts receivable, net consists of the following:
| | | | | | | | | | | |
| December 31, |
| 2021 | | 2020 |
| (In thousands) |
| Accounts receivable | $ | 197,216 | | | $ | 169,623 | |
| Allowance for doubtful accounts | (4,402) | | | (4,174) | |
| Accounts receivable, net | $ | 192,814 | | | $ | 165,449 | |
Allowance for Doubtful Accounts8. Leases
The allowanceCompany leases certain equipment and computers under finance lease arrangements, as well as office facilities and managed data center facilities under non-cancelable operating lease arrangements for doubtful accounts consists ofits U.S. and international locations that expire on various dates through 2032. These arrangements require the following activity:Company to pay certain operating expenses, such as taxes, repairs and insurance and contain renewal and escalation clauses. The Company’s options to extend or terminate a lease are not included in the lease terms, unless the Company is reasonably certain it will exercise that option. The Company’s leases generally do not contain any material restrictive covenants.
| | | | | | | | | | | | | | | | | |
| Year Ended December 31, |
| 2021 | | 2020 | | 2019 |
| (In thousands) |
| Allowance for doubtful accounts, beginning balance | $ | 4,174 | | | $ | 3,281 | | | $ | 2,049 | |
| Provision for doubtful accounts, net of recoveries | 2,601 | | | 2,668 | | | 3,376 | |
| Write-offs | (2,373) | | | (1,775) | | | (2,144) | |
| Allowance for doubtful accounts, ending balance | $ | 4,402 | | | $ | 4,174 | | | $ | 3,281 | |
OUTBRAIN INC.
Notes to Consolidated Financial Statements
As of and For Years Ending December 31, 20212023 and 20202022
Property, EquipmentThe following table summarizes assets and Capitalized Software, Netliabilities related to the Company’s operating and finance leases:
Property, equipment and capitalized software, net consists | | | | | | | | | | | | | | | | | |
| Consolidated Balance Sheet Location | | December 31, 2023 | | December 31, 2022 |
| | | (In thousands) |
| Lease assets | | | | | |
| Operating leases | Operating lease right-of-use assets, net | | $ | 12,145 | | $ | 11,065 |
| Finance leases | Property, equipment and capitalized software, net | | 226 | | 1,858 |
| Total lease assets | | | $ | 12,371 | | $ | 12,923 |
| | | | | |
| Lease liabilities | | | | | |
| Current liabilities: | | | | | |
| Operating leases | Accrued and other current liabilities | | $ | 3,684 | | | $ | 3,236 | |
| Finance leases | Accrued and other current liabilities | | 254 | | | 1,758 | |
| | | | | |
| Non-current liabilities: | | | | | |
| Operating leases | Operating lease liabilities, non-current | | 9,217 | | | 8,445 | |
| Finance leases | Other liabilities | | — | | | 254 | |
| Total lease liabilities | | | $ | 13,155 | | | $ | 13,693 | |
The following table presents the components of the following:Company’s total lease expense:
| | | | | | | | | | | |
| December 31, |
| 2021 | | 2020 |
| (In thousands) |
| Computer and equipment | $ | 43,316 | | | $ | 41,735 | |
| Capitalized software development costs | 54,233 | | | 43,728 | |
| Software | 2,817 | | | 3,444 | |
| Leasehold improvements | 1,547 | | | 2,805 | |
| Furniture and fixtures | 83 | | | 908 | |
| Property, equipment and capitalized software, gross | 101,996 | | | 92,620 | |
| Less: accumulated depreciation and amortization | (73,988) | | | (67,864) | |
| Total property, equipment and capitalized software, net | $ | 28,008 | | | $ | 24,756 | |
| | | | | | | | | | | | | | | | | |
| | | Twelve Months Ended December 31, |
| Consolidated Statements of
Operations Location | | 2023 | | 2022 |
| | | (In thousands) |
| Operating lease cost | | | | | |
| Fixed lease costs | Cost of revenue and operating expenses | | $ | 4,453 | | | $ | 4,309 | |
| Variable lease costs | Operating Expenses | | 207 | | | 136 | |
| Short-term lease costs | Cost of revenue and operating expenses | | 578 | | | 564 | |
| Finance lease cost: | | | | | |
| Depreciation | Cost of revenue | | 1,632 | | | 2,962 | |
| Interest | Interest expense | | 83 | | | 259 | |
| Total lease cost | | | $ | 6,953 | | | $ | 8,230 | |
The Company capitalized software development costs, including stock-based compensation, of $10.5 million and $9.2 million for the years ended December 31, 2021 and 2020, respectively. Accumulated amortization for capitalized software development costs was $38.2 million and $29.8 million as of December 31, 2021 and 2020, respectively.
As of December 31, 2021 and 2020, total computer equipment financed and software licensed under capital leases was $4.9 million and $7.4 million, net of accumulated amortization of $21.0 million and $17.2 million. Amortization expense related to total computer equipment financed and software licensed under capital leases was $3.8 million, $3.7 million and $4.5 million for2023, the years ended December 31, 2021, 2020 and 2019.
Accrued and Other Current Liabilities
Accrued and other current liabilities consistmaturities of the following:Company's lease liabilities under operating and finance leases were as follows:
| | | | | | | | | | | |
| December 31, |
| 2021 | | 2020 |
| (In thousands) |
| Accrued traffic acquisition costs | $ | 60,274 | | | $ | 77,195 | |
| Accrued agency commissions | 10,639 | | | 8,755 | |
| Accrued tax liabilities | 9,240 | | | 9,622 | |
| Accrued professional fees | 6,569 | | | 2,749 | |
| Interest payable | 3,094 | | | — | |
| Capital lease obligations, current | 3,069 | | | 3,853 | |
| Other accrued expenses | 6,705 | | | 7,573 | |
| Total accrued and other current liabilities | $ | 99,590 | | | $ | 109,747 | |
| | | | | | | | | | | | | | |
| Year | | Operating Leases | | Finance Leases |
| | (In thousands) |
| 2024 | | $ | 4,481 | | | $ | 256 | |
| 2025 | | 4,012 | | | — | |
| 2026 | | 2,710 | | | — | |
| 2027 | | 2,104 | | | — | |
| 2028 | | 755 | | | — | |
| Thereafter | | 1,064 | | | — | |
| Total minimum payments required | | $ | 15,126 | | | $ | 256 | |
| Less: imputed interest | | (2,225) | | (2) |
| Total present value of lease liabilities | | $ | 12,901 | | | $ | 254 | |
In addition to accrued traffic acquisition cost, accounts payable includes $147.4 million and $111.7 million of traffic acquisition costs asAs of December 31, 20212023, the Company entered into one new operating lease agreement that has not yet commenced with future lease payments of approximately $0.6 million. The lease will commence in the first quarter of 2024 and 2020, respectively.has a lease term of two years.
OUTBRAIN INC.
Notes to Consolidated Financial Statements
As of and For Years Ending December 31, 2021 and 2020
4. Acquisition
Ligatus
On April 1, 2019, the Company acquired of all of the outstanding shares of Ligatus GmbH (“Ligatus”), a German-based native advertising company, pursuant to a share purchase agreement between the Company and the sellers, Gruner + Jahr GmbH. The acquisition date fair value of the consideration transferred was approximately $40.1 million, which consisted of 3,603,179 shares of Outbrain common stock valued at $11.12 per share. The acquisition was accounted for as a business combination and the results of operations of the acquired entity have been included in the Company’s results of operations as of the acquisition date. The purpose of the acquisition was to expand the Company’s native offering to advertisers and strengthen its relationships with its media owners. The Company expensed all transaction costs in the period in which they were incurred.
Identifiable intangible assets acquired are amortized on a straight-line basis over their estimated useful lives. The Company estimated the useful lives of the acquired customer and publisher relationships to be four years, and trade names to be eight years. Amortization expense in the accompanying consolidated statements of operations is included as a component of sales and marketing expense for the acquired intangible assets.
See Note 13, Subsequent Events, for the Company’s acquisition of video intelligence AG in January 2022.
5. Goodwill and Intangible Assets
The Company’s goodwill balance was $32.9 million as of December 31, 2021 and December 31, 2020, and the Company has not recorded any accumulated impairments of goodwill.
The gross carrying amount and accumulated amortization of the Company’s intangible assets are as follows:
| | | | | | | | | | | | | | | | | | | | | | | |
| December 31, 2021 |
| Amortization Period | | Gross Value | | Accumulated Amortization | | Net Carrying Value |
| (In thousands) |
| Developed technology | 36-48 months | | $ | 8,425 | | | $ | (8,425) | | | $ | — | |
| Customer relationships | 48 months | | 5,345 | | | (4,050) | | | 1,295 | |
| Publisher relationships | 48 months | | 8,403 | | | (5,777) | | | 2,626 | |
| Trade names | 8 years | | 1,665 | | | (572) | | | 1,093 | |
| Other | 14 years | | 876 | | | (171) | | | 705 | |
| Total intangible assets, net | | | $ | 24,714 | | | $ | (18,995) | | | $ | 5,719 | |
| | | | | | | | | | | | | | | | | | | | | | | |
| December 31, 2020 |
| Amortization Period | | Gross Value | | Accumulated Amortization | | Net Carrying Value |
| (In thousands) |
| Developed technology | 36-48 months | | $ | 8,425 | | | $ | (8,388) | | | $ | 37 | |
| Customer relationships | 48 months | | 5,694 | | | (3,166) | | | 2,528 | |
| Publisher relationships | 48 months | | 9,111 | | | (3,986) | | | 5,125 | |
| Trade names | 8 years | | 1,805 | | | (395) | | | 1,410 | |
| Other | 14 years | | 830 | | | (118) | | | 712 | |
| Total intangible assets, net | | | $ | 25,865 | | | $ | (16,053) | | | $ | 9,812 | |
No impairment charges were recorded for the Company’s intangible assets subject to amortization during the years ended December 31, 2021, 2020, and 2019.
OUTBRAIN INC.
Notes to Consolidated Financial Statements
As of and For Years Ending December 31, 20212023 and 2020
As of December 31, 2021, estimated amortizationThe following table summarizes weighted-average lease terms and discount rates for the Company’s leases:
| | | | | | | | | | | | | | |
| | December 31, 2023 | | December 31, 2022 |
| Weighted-average remaining lease term (in years) | | | | |
| Operating leases | | 4.07 years | | 3.87 years |
| Finance leases | | 0.21 years | | 1.05 years |
| Weighted-average discount rate | | | | |
| Operating leases | | 7.30% | | 5.82% |
| Finance leases | | 7.30% | | 7.34% |
Supplemental cash flow information related to the Company’s identifiable acquisition-related intangible assets in future periods wasleases is as follows:
| | | | | | | | |
| Year Ending December 31, | | Amount |
| | (In thousands) |
| 2022 | | $ | 3,400 | |
| 2023 | | 1,047 | |
| 2024 | | 263 | |
| 2025 | | 263 | |
| 2026 | | 263 | |
| Thereafter | | 483 | |
| Total | | $ | 5,719 | |
| | | | | | | | | | | |
| Year Ended December 31, 2023 | | Year Ended December 31, 2022 |
| (In thousands) |
| Cash paid for amounts included in measurement of lease liabilities: | | | |
| Operating cash outflows from operating leases | $ | 4,297 | | | $ | 4,246 | |
| Cash flows from finance leases | $ | 1,830 | | | $ | 3,190 | |
| New operating lease assets obtained in exchange for new lease obligations | $ | 5,061 | | | $ | 1,247 | |
6.9. Long-Term Debt
Convertible Notes
On July 1, 2021, the Company completed the sale of $200 million aggregate principal amount of senior subordinated secured notes due July 1, 2026 (the “Notes”), in a private placement to institutional investors affiliated with the funds managed by The Baupost Group, L.L.C. (the “Baupost Investors”), pursuant to a Senior Subordinated Secured Note Purchase Agreement dated July 1, 2021 (the “Note Purchase Agreement”). Upon issuance of the Notes, the Company recorded a $36.0 million discount in connection with the embedded conversion feature, as well as deferred financing costs of $6.0 million in its consolidated balance sheet. The Notes, which were exchanged and cancelled upon the IPO, bore interest that accrued at the rate of (i) prior to July 1, 2024, 10.0% per annum and (ii) on and after July 1, 2024, 14.5% per annum, payable quarterly and were guaranteed by certain of the Company’s wholly-owned subsidiaries and secured by a second priority lien on all of the Company’s and its subsidiaries’ tangible and intangible assets, subject to certain excluded assets, permitted liens and customary exceptions.
On July 27, 2021, in connection with the closing of the Company’s IPO and pursuant to the terms of the Note Purchase Agreement, the Company exchanged $200 million aggregate principal amount of the Notes due July 1, 2026 for $236.0 million aggregate principal amount of the Company’s 2.95% Convertible Senior Notes, due 2026 (the “Convertible Notes”), pursuant to an indenture, dated as of July 27, 2021 (the “Indenture”), between the Company and The Bank of New York Mellon, as trustee. Upon the issuance of such Convertible Notes, the Notes and the obligations of the Company and the guarantee thereunder have been canceled and extinguished. The Convertible Notes will mature on July 27, 2026, unless earlier converted, redeemed or repurchased. In connection with the exchange of Notes to Convertible Notes, the Company recognized accelerated amortization of the unamortized discount and deferred issuance costs relating to the Notes totaling $42.0 million, which was recorded within charges related to exchange of senior notes upon IPOgain (loss) on convertible debt in the Company’s consolidated statement of operations for the year ended December 31, 2021. Deferred financing costs related to Convertible Notes were not material.
Interest onOn April 14, 2023, the Company repurchased $118.0 million aggregate principal amount of the Convertible Notes accrues from July 27, 2021out of the initially issued principal balance of $236.0 millionvia a privately negotiated repurchase agreement with Baupost Group Securities, L.L.C., the sole holder of the Convertible Notes, for approximately $96.2 million in cash, including accrued interest, representing a discount of approximately 19% to the principal amount of the repurchased notes. As a result, the Company recorded a pre-tax gain of approximately $22.6 million within gain (loss) on convertible debt in the Company’s consolidated statement of operations for the year ended December 31, 2023. Following the closing of the repurchase, the repurchased notes were cancelled by the Trustee, and $118.0 million principal amount of the Convertible Notes out of the initially issued principal balance of $236.0 million, remains outstanding as of December 31, 2023 and continues to be subject to the terms of the Indenture pursuant to which they were issued.
OUTBRAIN INC.
Notes to Consolidated Financial Statements
As of and For Years Ending December 31, 2023 and 2022
Interest is payable semi-annually in arrears on January 27 and July 27 of each year, beginning on January 27, 2022, at a rate of 2.95% per year. The initial conversion rate for the Convertible Notes is 40 shares of the Company’s common stock per $1,000 principal amount of Convertible Notes (equivalent to an initial conversion price of $25 per share of the Company’s common stock), subject to adjustment.
The Company may not redeem theits outstanding Convertible Notes prior to July 27, 2024. On or after July 27, 2024, the Company may redeem for cash all or any portion of the Convertible Notes, at its option, if the last reported sale price of the common stock has been at least 130% of the conversion price then in effect for at least 20 trading days (whether or not consecutive) during any 30 consecutive trading day period (including the last trading day of such period) ending on, and including, the trading day immediately preceding the date on which the Company provides notice of redemption at a redemption price equal to 100% of the principal amount of the Convertible Notes to be redeemed plus accrued and unpaid interest to, but excluding, the redemption date. In addition, calling any Convertible Note for redemption will constitute a “make-whole fundamental change” (as defined in the Indenture) with respect to that Convertible Note, in which case the conversion rate applicable to the conversion of that Convertible Note will be increased if it is converted by holders after it is called for redemption.
Holders may convert all or any portion of their Convertible Notes, in multiples of $1,000 principal amount, into shares of the Company’s common stock at any time until the second scheduled trading day immediately precedingpreceding the maturity date, at the conversion rate then in effect. The Company will settle conversions of the Convertible Notes by paying or delivering, as the case may be, cash, shares of common stock, or a combination thereof, at its election.
Upon the occurrence of a fundamental change (as defined in the Indenture), subject to certain conditions, holders of the Convertible Notes may require the Company to repurchase for cash all or any portion of their Convertible Notes in principal amounts of $1,000 or an integral multiple thereof, at a repurchase price of the principal amount of the Convertible Notes to be repurchased, plus accrued and unpaid interest to, but excluding, the repurchase date. In addition, following certain corporate events that occur prior to the maturity date or if the Company delivers a notice of redemption, the Company will, in certain circumstances, increase the conversion rate for a holder who elects to convert its Convertible Notes in connection with such a corporate event or convert its Convertible Notes called for redemption during the related redemption period, as the case may be. The Indenture contains customary covenants and events of default.
As described in Note 1, the Company early adopted ASU 2020-06 on January 1, 2021. The Company was not required to bifurcate the embedded conversion feature and the Convertible Notes were not issued with a substantial premium. As such, the Company accounted for the Convertible Notes as a liability under the no proceeds allocated model. The Company calculates earnings per share using the if-converted method.
Revolving Credit Facility
On November 2, 2021, the Company entered into the Second Amended and Restated Loan and Security Agreement with SVB, (the “2021 Revolving Credit Facility”), which replaced its prior $35.0 million revolving credit facility that had matured. The 2021 Revolving Credit Facility provides, subject to borrowing availability and certain other conditions, for revolving loans in an aggregate principal amount of up to $75.0 million (the “Facility”), with a $15.0 million sub-facility for letters of credit. On July 18, 2023, the Company entered into a first amendment to the Facility to convert the borrowing rate from LIBOR to SOFR and reduce the required level of domestic cash deposits that the Company is required to maintain at SVB. The Company’s borrowing availability under the Facility is calculated by reference to a borrowing base which is determined by specified percentages of eligible accounts receivable. The Facility will terminate on the earlier of (i) November 2, 2026 or (ii) 120 days prior to the maturity date of the Company’s 2.95% Convertible Senior Notes, due 2026, unless the Convertible Notes have been converted to common equity securities of the Company.
Outstanding loans under the Facility, as recently amended, accrue interest, at the Company’s option based upon borrowing availability under the Facility, at a rate equal to either (a) a base rate minus an applicable margin ranging from 1.5% to 1.0% per annum or (b) LIBORSOFR plus an applicable margin of 1.5% to 2.0% per annum, in each case based upon borrowing availability undersubject to a SOFR adjustment ranging from 0.10% to 0.15%, depending on the Facility.length of the borrowing. The undrawn portions of the commitments under the Facility are subject to a commitment fee at a rate ranging from 0.20% per annum to 0.30% per annum, based upon borrowing availability under the Facility.
OUTBRAIN INC.
Notes to Consolidated Financial Statements
As of and For Years Ending December 31, 2023 and 2022
The 2021 Revolving Credit Facility contains representations and warranties, including, without limitation, with respect to collateral; accounts receivable; financials; litigation, indictment and compliance with laws; disclosure and no material adverse effect, each of which is a condition to funding. Additionally, the 2021 Revolving Credit Facility includes events of default and customary affirmative and negative covenants applicable to the Company and its subsidiaries, including, without limitation, restrictions on liens, indebtedness, investments, fundamental changes, dispositions, restricted payments and prepayment of the Convertible Notes and of junior indebtedness. The 2021 Revolving Credit Facility contains a financial covenant that requires, in the event that credit extensions under the Facility equal or exceed 85% of the available commitments under the Facility or upon the occurrence of an event of default, the Company to maintain a minimum consolidated monthly fixed charge coverage ratio of 1.00.
The obligations of the Company and the other subsidiary co-borrowers under the 2021 Revolving Credit Facility are secured by a first-priority lien on substantially all the assets of the Company and such other subsidiary co-borrowers.
As previously discussed in Note 7, on March 27, 2023, First Citizens Bank entered into an agreement with FDIC to acquire the Silicon Valley Bridge Bank, N.A, assuming all customer deposits and certain other liabilities of Silicon Valley Bridge Bank, N.A. As a result, the Facility remains in effect with First Citizens Bank. The Company was in compliance with all of the financial covenants under its 2021 Revolving Creditthe Facility as of December 31, 2021.2023 and December 31, 2022. As of December 31, 20212023 and December 31, 2020,2022, the Company had no borrowings outstanding under its revolving credit facilitiesthe Facility and its available borrowing capacity was $75.0 million and $70.7 million, respectively, based on the defined borrowing formula. Deferred financing costs of $0.5 million were recorded within otherOther assets onin the company’sCompany’s consolidated balance sheetsheets as of December 31, 2021.2023 and December 31, 2022 included deferred financing costs of $0.3 million and $0.4 million, respectively, which are being amortized over the term of the Facility.
10. Income Taxes
The components of income (loss) before income taxes and the income tax provision (benefit) are as follows:
| | | | | | | | | | | | | | | | | |
| Year Ended December 31, |
| 2023 | | 2022 | | 2021 |
| (In thousands) |
| United States | $ | 16,837 | | | $ | (11,707) | | | $ | (38,175) | |
| Foreign | (482) | | | (6,866) | | | 23,640 | |
| Income (loss) before provision for income taxes | $ | 16,355 | | | $ | (18,573) | | | $ | (14,535) | |
| | | | | | | | | | | | | | | | | |
| Year Ended December 31, |
| 2023 | | 2022 | | 2021 |
| (In thousands) |
| Current provisions for income taxes: | | | | | |
| Federal | $ | 5,177 | | | $ | — | | | $ | — | |
| State | 57 | | | 744 | | | 541 | |
| Foreign | 5,191 | | | 9,117 | | | 5,739 | |
| Total current provision for income taxes | 10,425 | | | 9,861 | | | 6,280 | |
| Deferred tax benefit: | | | | | |
| Federal | (2,427) | | | (792) | | | (25,787) | |
| State | 446 | | | (1,153) | | | (5,558) | |
| Foreign | (2,331) | | | (1,908) | | | (465) | |
| Total deferred tax benefit | (4,312) | | | (3,853) | | | (31,810) | |
| Provision (benefit) for income taxes | $ | 6,113 | | | $ | 6,008 | | | $ | (25,530) | |
OUTBRAIN INC.
Notes to Consolidated Financial Statements
As of and For Years Ending December 31, 20212023 and 20202022
The reconciliation of the statutory federal income tax and the Company’s effective income tax is as follows:
| | | | | | | | | | | | | | | | | |
| Year Ended December 31, |
| 2023 | | 2022 | | 2021 |
| Tax at statutory federal rate | 21.0 | % | | 21.0 | % | | 21.0 | % |
| State tax—net of federal benefit | 2.4 | % | | 1.7 | % | | 1.9 | % |
| Foreign withholding taxes | 1.8 | % | | (2.0) | % | | (2.9) | % |
Foreign rate differential (1) | 12.5 | % | | (11.8) | % | | 3.2 | % |
| Stock compensation and other permanent items | 7.0 | % | | (5.1) | % | | (24.9) | % |
| Tax rate change | 1.6 | % | | (0.1) | % | | (4.4) | % |
| Uncertain tax positions | 6.5 | % | | (22.0) | % | | (18.9) | % |
| Change in valuation allowance | 4.2 | % | | (13.6) | % | | 209.4 | % |
| Global intangible low-taxed income inclusion | 4.4 | % | | — | % | | (19.3) | % |
| Foreign-derived intangible income deduction | (12.6) | % | | — | % | | — | % |
| Foreign tax credits | (6.1) | % | | — | % | | 4.9 | % |
| Return to provision adjustments | (5.1) | % | | (0.4) | % | | 5.4 | % |
| Other | (0.2) | % | | — | % | | 0.2 | % |
| Effective tax rate | 37.4 | % | | (32.3) | % | | 175.6 | % |
7.(1) Primarily relates to higher tax rates relating to certain of the Company’s European operations.
Deferred taxes are the result of temporary differences between the bases of assets and liabilities for financial reporting and income tax purposes. Deferred tax assets and liabilities as of December 31, 2023 and 2022 were comprised of the following:
| | | | | | | | | | | |
| December 31, |
| 2023 | | 2022 |
| (In thousands) |
| Deferred tax assets: | | | |
| Net operating loss carryforwards | $ | 12,500 | | | $ | 15,005 | |
| Foreign tax credit carryforwards | 1,492 | | | 1,048 | |
| Capital loss carryforwards | 3,390 | | | 3,398 | |
| Stock-based compensation | 1,578 | | | 1,110 | |
| Accruals, reserves, and other | 5,433 | | | 6,276 | |
| Senior notes interest & deferred financing fees | 4,872 | | | 10,033 | |
| Capitalization of research and development costs | 24,257 | | | 13,946 | |
| Allowance for credit losses | 2,565 | | | 1,409 | |
| Gross deferred tax assets | 56,087 | | | 52,225 | |
| Valuation allowance | (16,309) | | | (15,629) | |
| Total deferred tax assets | 39,778 | | | 36,596 | |
| Deferred tax liabilities: | | | |
| Intangible assets and capitalized software | (5,399) | | | (6,181) | |
| Total deferred tax liabilities | (5,399) | | | (6,181) | |
| Net deferred tax assets | $ | 34,379 | | | $ | 30,415 | |
The Company regularly assesses the need for the valuation allowance on its deferred tax assets, and to the extent that it determines that an adjustment is needed, such adjustment will be recorded in the period that the determination is made.
OUTBRAIN INC.
Notes to Consolidated Financial Statements
As of and For Years Ending December 31, 2023 and 2022
During the fourth quarter of 2021, the Company reassessed the need for a valuation allowance, considering, among other things, its cumulative pre-tax book income, excluding one-time expenses, in the three-year period ended December 31, 2021, its projected future taxable income, and the scheduled reversals of its deferred tax liabilities. After weighing all of the evidence, the Company determined that the positive evidence in favor of releasing a portion of the valuation allowance outweighed the negative evidence against releasing the allowance on certain U.S. deferred tax assets, and concluded that it is more likely than not that the majority of the U.S. deferred tax assets will be realized. As a result, during the fourth quarter of 2021, the Company released $38.1 million of its U.S. valuation allowance.
During 2023 and 2022, after weighing all of the evidence, the Company determined that the positive evidence, particularly the evidence that was objectively verifiable, continued to outweigh the negative evidence. However, upon evaluating its forecasted state taxable income, the Company increased its valuation allowance against state net operating loss carryforwards by $0.5 million and $2.8 million as of December 31, 2023 and 2022, respectively. As of each reporting date, the Company will continue to consider existing evidence, both positive and negative, that could impact its view with regard to future realization of deferred tax assets.It is possible that the valuation allowance could change in the next 12 months.
Recognition of deferred tax assets is appropriate when realization of these assets is more likely than not. Based upon the weight of available evidence, which includes the Company’s historical operating performance and the recorded cumulative net losses in prior fiscal periods, the Company recorded a valuation allowance of $16.3 million and $15.6 million against certain deferred tax assets as of December 31, 2023 and December 31, 2022, respectively. The net valuation allowance increased by $0.7 million and $4.9 million for the years ended December 31, 2023 and 2022, respectively.
As of December 31, 2023 and 2022, the Company had U.S. federal net operating loss carryforwards of $2.7 million and $13.2 million, respectively. The federal net operating loss carryforwards will expire at various amounts beginning in the year ending December 31, 2032, if not utilized. Utilization of the net operating losses remaining as of December 31, 2023 is subject to an annual limitation provided for in Section 382 of the Internal Revenue Code of 1986, as amended (the “Code”) and any annual limitation could result in the expiration of net operating loss carryforwards before utilization.
As of December 31, 2023 and 2022, the Company had state net operating loss carryforwards of $116.0 million and $117.5 million, respectively. State net operating losses will expire at various amounts beginning in the year ending December 31, 2025, if not utilized. As of December 31, 2023, the Company had Swiss net operating loss carryforwards of $13.2 million, which will expire in various amounts beginning in tax year 2027, if not utilized. As of December 31, 2023 and 2022, the Company had U.K. foreign tax credits of $1.1 million and $1.0 million, respectively, which can be carried forward indefinitely. As of December 31, 2023, the Company also had U.S. foreign tax credits of $0.4 million, which can be carried forward for 10 years.
While the Company has recognized the U.S. federal tax impact on a portion of the undistributed earnings of its foreign subsidiaries under the Tax Cuts and Jobs Act, enacted in 2017 (“Tax Act”), its policy with respect to foreign earnings remains unchanged and the Company considers them to be indefinitely reinvested. Upon distribution of those earnings in the form of a dividend or otherwise, the Company could be subject to taxes, including withholding taxes payable to various foreign countries, for which a deferred tax liability is not currently recognized.
On August 16, 2022, the U.S. enacted the Inflation Reduction Act of 2022, which among other things implements a 15% minimum tax on adjusted financial statement income of certain large corporations and a 1% excise tax on net stock repurchases. Accordingly, during the year ended December 31, 2023, the Company recorded a liability of $0.1 million for federal excise tax with a corresponding increase in Treasury stock in connection with its share repurchase program.
In addition, a provision enacted as part of the 2017 Tax Cuts & Jobs Act requires companies to capitalize certain research and experimental expenditures for tax purposes in tax years beginning after December 31, 2021. As a result, as of December 31, 2023, the Company’s U.S. federal net operating losses have been fully utilized, with the exception of the $2.7 million subject to the annual limitation provided under Section 382 of the Code, which resulted in higher cash taxes and lower effective tax rate due to a deduction related to foreign-derived intangible income.
OUTBRAIN INC.
Notes to Consolidated Financial Statements
As of and For Years Ending December 31, 2023 and 2022
Unrecognized Tax Benefits
The activity related to the gross amount of unrecognized tax benefits is as follows:
| | | | | | | | | | | | | | | | | |
| Year Ended December 31, |
| 2023 | | 2022 | | 2021 |
| (In thousands) |
| Beginning balance | $ | 7,352 | | | $ | 3,272 | | | $ | 1,232 | |
| Decreases due to tax settlements | — | | | (464) | | | (616) | |
| Decreases due to expirations of statutes of limitations | (699) | | | (93) | | | (112) | |
| Additions based on tax positions related to prior year | 1,612 | | | 1,617 | | | 2,323 | |
| Additions based on tax positions related to current year | 158 | | | 3,020 | | | 445 | |
| Ending balance | $ | 8,423 | | | $ | 7,352 | | | $ | 3,272 | |
If recognized, the Company’s gross unrecognized tax benefits would not have a material impact on its effective tax rate for the year ended December 31, 2023. While it is often difficult to predict the outcome of any particular uncertain tax position, the Company believes it is reasonably possible that its unrecognized tax benefits will decrease by approximately $5.6 million during the next 12 months, primarily due to the expected completion of ongoing tax audits. The Company further expects that the amount of unrecognized tax benefits will continue to change in the future as a result of ongoing operations, the outcomes of audits, and the expiration of the statute of limitations. This change is not expected to have a significant impact on the Company’s results of operations or financial condition.
The Company recognizes accrued interest and penalties related to unrecognized tax benefits in its income tax provision (benefit). Accrued interest and penalties recognized for the year ended December 31, 2023 were de minimis. As of December 31, 2022 and 2021, the Company recognized $0.9 million, and $(0.1) million of accrued interest and penalties, respectively, which are reflected in the table above.
The Company is subject to taxation in the United States, various states, and several foreign jurisdictions. The Company establishes reserves for open tax years for uncertain tax positions that may be subject to challenge by various taxing authorities. The consolidated tax provision and related accruals include the impact of such reasonably estimable losses and related interest and penalties as deemed appropriate. United States and foreign jurisdictions have statutes of limitations generally ranging from 3 to 5 years. However, the statute of limitations does not begin for years that a net operating loss carryforward was generated until the loss is applied against taxable income. In that scenario, the taxing authority can only make adjustments in the original loss year to the extent of the net operating loss. Open audit years in the United States are 2013 through 2023, in the U.K. are 2017 through 2023 and in Israel are 2020 through 2023. The Company is currently under audit in the U.K. for tax years 2018-2022, Germany for the tax years 2018-2021 and in Japan for tax years 2020-2022.
11. Commitments and Contingencies
Legal Proceedings and Other Matters
From time to time, the Company may become subject to legal proceedings, claims and litigation arising in the ordinary course of business. In addition, the Company may receive letters alleging infringement of patent or other intellectual property rights. The Company is not currently a party to any material legal proceedings, nor is it aware of any pending or threatened litigation that, in its opinion, would have a material adverse effect on its business, operating results, cash flows or financial condition should such litigation be resolved unfavorably.
On April 29,Since 2021, the Company was notified thathad been cooperating with the previously disclosed criminal investigation being conducted by the Antitrust Division of the U.S. Department of Justice is conducting a criminal investigation into the hiring practices in itsthe Company’s industry that includesincluded the Company. The Company is continuing to cooperate withOn July 11, 2023, the Antitrust Division. While there can be no assurance regarding the ultimate resolutionU.S. Department of this matter,Justice informed the Company does not believe that its conduct violated applicable law.it is no longer pursuing this investigation.
Lease and Other CommitmentsThe Company leases certain office facilities under non-cancelable operating lease arrangements for its U.S. and international locations that expire on various dates through 2027. These arrangements require the Company
OUTBRAIN INC.
Notes to pay certain operating expenses, such as taxes, repairs and insurance and contain renewal and escalation clauses. The Company recognizes rent expense under these arrangements on a straight-line basis over the term of the lease.
In addition, the Company leases certain equipment and computers under capital lease arrangements that expire at various dates through 2024.Consolidated Financial Statements
As of and For Years Ending December 31, 2021, the aggregate future non-cancelable minimum lease payments consist of the following:2023 and 2022
| | | | | | | | | | | | | | |
| Year Ending December 31: | | Operating Leases | | Capital Leases |
| | (In thousands) |
| 2022 | | $ | 4,214 | | | $ | 3,329 | |
| 2023 | | 3,128 | | | 1,741 | |
| 2024 | | 2,768 | | | 257 | |
| 2025 | | 2,630 | | | — | |
| 2026 | | 1,399 | | | — | |
| Thereafter | | 929 | | | — | |
| Total minimum payments required | | $ | 15,068 | | | $ | 5,327 | |
Rent expense for all operating leases amounted to $4.0 million, $4.7 million and $5.1 million for the years ended December 31, 2021, 2020 and 2019, respectively.
8. Capitalization12. Stockholders’ Equity
In July 2021, theThe Company’s certificate of incorporation, wasas amended and restated to providein July 2021, provides the Company with the authority to issue up to 1.1 billion shares, comprised of 1.0 billion shares of $0.001 par value common stock and 0.1 billion shares of $0.001 par value preferred stock. Each holder of common stock is entitled to 1one vote with respect to each share of common stock and is entitled to dividends, if and when declared by the Company’s Board of Directors (the “Board”), subject to preferential rights of preferred stockholders.
OUTBRAIN INC.
Notes to Consolidated Financial Statements
As of and For Years Ending December 31, 2021 and 2020
Initial Public Offering
On July 22, 2021, the Company’s Form S-1, filed on June 29, 2021, as amended, was declared effective by the SECU.S. Securities and Exchange Commission (the “SEC”) in connection with the Company’s IPO of the Company’s common stock and its common stock began trading on Nasdaq on July 23, 2021. On July 27, 2021, the Company closed its IPO and issued 8,000,000 shares of its common stock at an initial offering price of $20.00 per share, receiving aggregate net proceeds of $145.1 million, after deducting underwriting discounts, commissions and other offering costs.
Deferred offering costs of $3.7 million, primarily consistedcomprised of accounting, legal and other transaction costs directly related to the IPO. Prior to the IPO, deferred offering costs were recorded within prepaid expenses and other current assets onagainst the Company’s consolidated balance sheet. Uponproceeds of the Company’s IPO, such costs were reclassified tooffering in additional paid-in capital within stockholders’ equity (deficit) and recorded against the proceeds of the offering.
Reverse Stock Split
In July 2021, the Company’s Board and stockholders approved a 1-for-1.7 reverse stock split of its common and convertible preferred stock. The reverse stock split became effective on July 13, 2021. The par value of the common stock was not adjusted as a result of the reverse stock split. In addition, adjustments corresponding to the reverse stock split were made to the ratio at which the convertible preferred stock converted into common stock immediately prior to the closing of the IPO, in accordance with existing terms of the convertible preferred stock. All share and per-share amounts for all periods presented in these financial statements and notes thereto have been adjusted retroactively to reflect the effect of the reverse stock split.
Share Repurchases
The Company may from time to time withhold shares in connection with tax obligations related to vesting of restricted stock units in accordance with the terms of its equity incentive plans and the underlying award agreements. During 2021, 2020 and 2019, the Company withheld 1,032,995 shares, 27,769 shares and 5,054 shares, respectively, with a fair value of $14.2 million, $0.3 million and $0.1 million, respectively, to satisfy the minimum employee tax withholding obligations..
See Note 13 for the new stock repurchase program approved by the Company’s Board in February 2022.
Convertible Preferred Stock
Prior to the IPO, the Company issued Series A-H convertible preferred stock. In connection with the IPO, all of the shares of the Company’s Series A-H convertible preferred stock previously outstanding automatically converted into an aggregate of 28,091,267 shares of the Company’s common stock, with all series converted on a 1-to-oneone-to-one basis, with the exception of Series F, which was converted at 1.14-to-1, based on the terms of the Series F agreement and the IPO price. TheDuring 2021, total carrying value of convertible preferred stock of $162.4 million was reclassified to stockholders’ equity (deficit). As of December 31, 2021, and there werewas no shares ofremaining convertible preferred stock issued and outstanding.
The following table summarizes the Company’s convertible preferred stock at December 31, 2020:
OUTBRAIN INC.
Notes to Consolidated Financial Statements
As of and For Years Ending December 31, 2021 and 2020
| | | | | | | | | | | | | | | | | | | | | | | | | | | | | | | | |
| | December 31, 2020 |
| Convertible Preferred Stock: | | Shares Authorized | | Shares Issued and Outstanding | | Net Carrying Value | | Liquidation Price Per Share | | Aggregate Liquidation Preference |
| | (In thousands, except share data) |
| Series A | | 4,156,416 | | | 4,156,417 | | | $ | 5,053 | | | $ | 1.22842 | | | $ | 5,106 | |
| Series B | | 8,568,094 | | | 8,568,095 | | | 11,717 | | | 1.40055 | | | 12,000 | |
| Series C | | 3,810,263 | | | 3,810,264 | | | 12,330 | | | 2.88694 | | | 11,000 | |
| Series D | | 3,373,545 | | | 3,373,545 | | | 35,035 | | | 10.43919 | | | 35,217 | |
| Series E | | 635,410 | | | 635,409 | | | 6,054 | | | 9.44265 | | | 6,000 | |
| Series F | | 3,143,191 | | | 3,128,258 | | | 35,606 | | | 22.8055 | | | 71,342 | |
| Series G | | 3,333,042 | | | 3,254,243 | | | 48,612 | | | 15.00131 | | | 48,818 | |
| Series H | | 746,602 | | | 726,218 | | | 8,037 | | | 15.00131 | | | 10,894 | |
| Total convertible preferred stock | | 27,766,563 | | | 27,652,449 | | | $ | 162,444 | | | | | $ | 200,377 | |
The Company recorded its convertible preferred stock at fair value on the dates of issuance, net of issuance costs, outside of stockholders’ deficit because, in the event of certain “liquidation events” that are not solely within the Company’s control (including merger, acquisition, or sale of all or substantially all of its assets), the shares became redeemable at the option of the holders. The Company did not adjust the carrying values of the convertible preferred stock to the deemed liquidation values of such shares since a liquidation event was not probable prior to the Company’s IPO.
Prior to the conversion of the preferred stock into common stock in July 2021, the holders of the convertible preferred stock had the following rights, preferences, and privileges:
Conversion Rights
Each share of Series A, B, C, D, E, F, G and H convertible preferred stock was convertible at the option of the holder into the number of shares of common stock determined by dividing the original issue price by the applicable conversion price. The original issue price per share and initial conversion price per share is $1.22842 for Series A, $1.40055 for Series B, $2.88694 for Series C, $10.43919 for Series D, $9.44265 for Series E, $11.4028 for Series F and $15.00131 for Series G and Series H. At each reporting date, each share of Series A, B, C, D, E, F, G and H convertible preferred stock was convertible on a 1-for-one basis into common stock at the respective conversion ratios. The conversion price for each share of convertible preferred stock was subject to adjustment for certain recapitalizations, splits, combinations, common stock dividends, or similar events. The conversion prices per share above reflect the adjustment for the 1-for-1.7 reverse stock split of the Company’s common stock, which became effective on July 13, 2021.
In the Event of a Qualified Initial Public Offering, each share of convertible preferred stock would automatically be converted into shares of common stock at the then-effective conversion price upon the consummation of the Company’s sale of its common stock in a bona fide, firm commitment underwriting pursuant to a registration statement under the Securities Act of 1933, as amended, yielding at least $30.0 million net to the Company (adjusted to reflect subsequent stock dividends, stock splits, or recapitalizations).
The conversion price per share of the Series A, B, C, D, E, F, G and H convertible preferred stock would have been reduced if the Company issued any additional stock without consideration or for consideration per share less than the Series A, B, C, D, E, F, G and H convertible preferred stock conversion price in effect for that series.
Conversion Price Ratchet Adjustments in the Event of a Qualified Initial Public Offering
In the event of an IPO, if the IPO price per share was less than $15.65879 per share (or 1.5 times the Series D original issuance price), the conversion price of the Series D convertible preferred stock would automatically adjust to be the lower of (i) the conversion price then in effect for the Series D or (ii) two-thirds (2/3) of the original conversion price of $10.43919 per share.
OUTBRAIN INC.
Notes to Consolidated Financial Statements
As of and For Years Ending December 31, 2021 and 2020
If the IPO price per share was less than $22.8055 per share (or 2.0 times the Series F original issuance price), the conversion price of the Series F convertible preferred stock would automatically adjust to be the lower of the (i) the conversion price then in effect for the Series F convertible preferred stock or (ii) the Series F convertible preferred stock original issuance price of $11.40275 multiplied by a fraction, the denominator of which is the Series F convertible preferred stock preference of $22.8055 per share and the numerator of which is the IPO price. Accordingly, upon the Company’s IPO at $20.00 per share, Series F was converted to common stock at a ratio of 1.14-to-1.
If the IPO price per share was less than $15.00131 per share (or the Series G original issuance price) the conversion price of the Series G convertible preferred stock would automatically be adjusted to the IPO price concurrently with the closing of the IPO.
9. Stock-based Compensation
Equity Incentive Plans
In July 2021, the Board and the Company’s stockholders approved, the 2021 Long-Term Incentive Plan (the “2021 LTIP”), which became effective in connection with the closing of the Company’s IPO. A total of 5,050,000 shares of the Company’s common stock have been reserved for issuance under the 2021 LTIP, which is subject to automatic annual increases. The 2021 LTIP may be used to grant, among other award types, stock options, restricted stock awards (“RSAs”) and restricted stock units (“RSUs”). The number of shares of common stock reserved for future issuance under the 2021 LTIP will also be increased pursuant to provisions for annual automatic evergreen increases. The Company’s previous awards issued under its 2007 Omnibus Securities and Incentive Plan, as amended and restated on January 21, 2009 (“2007 Plan”), remain subject to the 2007 Plan. As of December 31, 2021, approximately 172,000 and 5,050,000 shares were available for grant under the 2007 Plan and the 2021 LTIP, respectively.
The Company recognizes stock-based compensation for stock-based awards, including stock options, RSAs, RSUs and stock appreciation rights (“SARs”) based on the estimated fair value of the awards. The Company estimates the fair value of its stock option awards on the grant date using the Black-Scholes option pricing model. The fair value of RSAs and RSUs is the fair value of the Company’s common stock on the date of grant.
In its accompanying consolidated statements of operations, the Company recognized stock-based compensation as follows:
| | | | | | | | | | | | | | | | | |
| Year Ended December 31, |
| 2021 | | 2020 | | 2019 |
| (in thousands) |
| Research and development | $ | 3,959 | | | $ | 810 | | | $ | 672 | |
| Sales and marketing | 8,656 | | | 2,071 | | | 2,067 | |
| General and administrative | 13,692 | | | 707 | | | 1,137 | |
| Total stock-based compensation | $ | 26,307 | | (1) | $ | 3,588 | | | $ | 3,876 | |
(1)Includes $16.5 million of stock-based compensation expense recorded in connection with the Company’s stock option awards, RSAs, RSUs and SARs for which the service condition has been met and a performance condition was satisfied upon the Company’s IPO, which was a qualifying liquidity event. Stock-based compensation expense for unvested awards will be recognized over the remainder of the requisite service period.
OUTBRAIN INC.
Notes to Consolidated Financial Statements
As of and For Years Ending December 31, 2021 and 2020
Determination of Fair Value
There were 0 stock options granted in 2019. The estimated grant-date fair value of all of the Company’s stock options granted in 2021 and 2020 was calculated using the Black-Scholes option pricing model, based on the following assumptions and inputs, each of which is subjective and generally requires significant judgment:
| | | | | | | | | | | |
| Year Ended December 31, |
| 2021 | | 2020 |
| Grant date fair value | $ | 5.95 | | $ | 4.61 |
| Expected term (in years) | 6.03 | | 6.02 |
| Risk-free interest rate | 1.29 | % | | 0.52 | % |
| Expected volatility | 43 | % | | 44 | % |
| Dividend rate | 0 | % | | 0 | % |
Expected term.
The expected term represents the period that the Company’s stock-based awards are expected to be outstanding. For option grants that are considered to be “plain vanilla,” the Company determines expected term using the simplified method. The simplified method deems the term to be the average of the time-to-vesting and the contractual life of the stock-based awards. For other option grants, the Company considers several factors in estimating the expected term including the expected lives used by a peer group of companies within the Company’s industry that are considered to be comparable to its business, the historical option exercise behavior of the Company’s employees and post-vesting employment termination behavior taking into account the contractual life of the award. The expected term for options or warrants issued to non-employees is the contractual term.
Risk-Free Interest Rate
The risk-free interest rate is based on the U.S. Treasury yield curve in effect at the date of grant for zero-coupon U.S. Treasury notes with maturities approximately equal to the stock-based awards’ expected term.
Expected Volatility.
Because the Company has a short trading history of its common stock, expected volatility was derived from the average historical stock volatilities of several actively traded public companies within the Company’s industry that it considers to be comparable to its business over a period equivalent to the expected term of the stock-based awards.
Dividend rate.
The expected dividend rate was assumed to be zero as the Company has not paid and does not anticipate paying any dividends in the foreseeable future.
Fair value of common stock.
For stock options granted subsequent to the Company’s IPO, fair value is based on the closing price of its common stock reported on Nasdaq on the date of grant. Prior to the Company’s IPO, because there was no public market for its common stock, the fair value was determined by its board of directors, with input from management and valuation reports performed by third-party valuation specialists.
OUTBRAIN INC.
Notes to Consolidated Financial Statements
As of and For Years Ending December 31, 2021 and 2020
The following table summarizes stock option activity for the year ended December 31, 2021:
| | | | | | | | | | | | | | | | | | | | | | | |
| Stock Options |
| Number of Shares | | Weighted- Average Exercise Price | | Weighted- Average Remaining Contractual Term (Years) | | Aggregate Intrinsic Value of Outstanding Options (In thousands) |
| Outstanding—December 31, 2020 | 5,475,481 | | | $ | 6.36 | | | | | |
| Granted | 37,624 | | | $ | 13.87 | | | | | |
| Exercised | (1,725,491) | | | $ | 3.29 | | | | | |
| Forfeited | (304,714) | | | $ | 4.66 | | | | | |
| Outstanding - December 31, 2021 | 3,482,900 | | | $ | 8.11 | | | 4.87 | | $ | 20,513 | |
| Exercisable—December 31, 2021 | 2,648,522 | | | $ | 7.19 | | | 3.58 | | $ | 18,032 | |
The following table summarizes RSU activity for the year ended December 31, 2021:
| | | | | | | | | | | |
| RSUs |
| Number of Shares | | Weighted- Average Grant Date Fair Value |
| Outstanding—December 31, 2020 | 3,924,500 | | | $ | 9.35 | |
| Granted | 601,079 | | | $ | 13.53 | |
| Vested | (2,514,210) | | | $ | 9.00 | |
| Forfeited | (163,227) | | | $ | 10.50 | |
| Outstanding—December 31, 2021 | 1,848,142 | | | $ | 11.51 | |
Stock Options
The aggregate intrinsic value of options exercised was $16.4 million and $3.4 million for the years ended December 31, 2021 and 2020, respectively. As of December 31, 2021, total unrecognized stock-based compensation related to unvested stock options was $3.9 million, which is expected to be recognized over a weighted-average period of 2.7 years.
Restricted Stock and Restricted Stock Units
All of the Company’s RSAs and certain of the Company’s RSUs had a performance condition, which was met upon the Company’s IPO and the expense was recognized based on the requisite service period that has been met to date. As of December 31, 2021, the unrecognized stock-based compensation cost related to unvested RSUs was $22.3 million, which is expected to be recognized over a weighted average period of 2.8 years and there was no remaining stock-based compensation cost related to RSAs.
Stock Appreciation Rights (SARs)
In 2014, the Company granted SARs with a contractual term of 10 years, to certain employees. These awards vest subject to performance conditions and can be cash or share settled, at the option of the employee, and are subject to liability accounting due to vesting upon the Company’s IPO, which will be remeasured at the end of each reporting period until these awards are settled. As of December 31, 2021, 3,390 SAR awards were outstanding with a fair value of $8.49, a weighted average remaining contractual term of 2.7 years and an aggregate intrinsic value of $0.02 million.
OUTBRAIN INC.
Notes to Consolidated Financial Statements
As of and For Years Ending December 31, 2021 and 2020
Stock-Based Awards Granted Outside of Equity Incentive Plans
Warrants
From 2007 to 2016, the Company issued equity classified warrants to purchase shares of common stock to certain third-party advisors, consultants and financial institutions with exercise prices ranging from $0.002 to $7.65 per share. In July 2021, 244,619 warrants that would have expired if not exercised prior to the Company’s IPO were exercised. The exercise period of the warrants is until the earlier of the closing of an IPO, the closing of a deemed liquidation event or the end of the warrant term. These warrants vest immediately.
The following table summarizes warrant activity outside of the Plan and related information:
| | | | | | | | | | | | | | | | | | | | | | | |
| Warrants Outstanding |
| Number of Shares | | Weighted- Average Exercise Price | | Weighted- Average Remaining Contractual Term (Years) | | Aggregate Intrinsic Value of Outstanding Warrants (in thousands) |
| |
| Outstanding—December 31, 2020 | 621,089 | | | $ | 4.81 | | | 3.89 | | $ | 1,858 | |
| Warrants exercised | (244,619) | | | 0.57 | | | | | |
| Outstanding and exercisable—December 31, 2021 | 376,470 | | | $ | 7.57 | | | 3.37 | | $ | 2,420 | |
Employee Stock Purchase Plan
In July 2021, the Board and the Company’s stockholders approved a new 2021 Employee Stock Purchase Plan (the “ESPP”), which became effective in connection with the closing of the Company’s IPO. A total of 1,263,000 shares of the Company’s common stock have been reserved for issuance under the ESPP, which is subject to automatic annual increases.
10. Net Income (Loss) Per Common Share
Prior to the Company’s IPO in 2021, Company applied the two-class method to calculate basic and diluted income (loss) per share attributable to common stockholders as shares of its convertible preferred stock, when outstanding, were participating securities due to their participation rights. The two-class method is an earnings allocation method under which earnings per share is calculated for common stock considering a participating security’s rights to undistributed earnings as if all such earnings had been distributed during the period. The Company’s participating securities were not included in the computation of loss per share attributable to common stockholders in periods of net loss because the convertible preferred stockholders had no contractual obligation to participate in losses. Subsequent to its adoption of ASU 2020-06 on January 1, 2021, the Company utilized the if-converted method to calculate the dilutive impact of Convertible Notes and its previously outstanding convertible preferred stock on its earnings per share for the year ended December 31, 2021.
OUTBRAIN INC.
Notes to Consolidated Financial Statements
As of and For Years Ending December 31, 2021 and 2020
| | | | | | | | | | | | | | | | | |
| Year Ended December 31, |
| 2021 | | 2020 | | 2019 |
| (In thousands, except share and per share data) |
| Numerator: | | | | | |
| Basic and diluted: | | | | | |
| Net income (loss) | $ | 10,995 | | | $ | 4,357 | | | $ | (20,514) | |
| Less: undistributed income allocated to participating securities | — | | | (2,688) | | | — | |
| Net income (loss) attributable to common stockholders | $ | 10,995 | | | $ | 1,669 | | | $ | (20,514) | |
| | | | | |
| Denominator: | | | | | |
| Basic weighted-average shares used in computing net income (loss) attributable to common stockholders, basic | 35,159,757 | | | 16,816,178 | | | 15,275,129 | |
| Weighted average dilutive share equivalents: | | | | | |
| Preferred stock, stock options, warrants and RSUs | 18,734,590 | | | 3,370,624 | | | — | |
| Diluted weighted-average shares used in computing net income (loss) attributable to common stockholders | 53,894,347 | | | 20,186,802 | | | 15,275,129 | |
| | | | | |
| Net income (loss) per share attributable to common stockholders: | | | | | |
| Basic | $ | 0.31 | | | $ | 0.10 | | | $ | (1.34) | |
| Diluted | $ | 0.20 | | | $ | 0.08 | | | $ | (1.34) | |
The following weighted-average shares have been excluded from the calculation of diluted income (loss) per share attributable to common stockholders for each period presented because they are anti-dilutive:
| | | | | | | | | | | | | | | | | |
| Year Ended December 31, |
| 2021 | | 2020 | | 2019 |
| Convertible preferred stock | — | | | 27,652,451 | | | 27,652,451 | |
| Options to purchase common stock | 1,080,703 | | | 1,867,546 | | | 2,572,310 | |
| Convertible debt | 9,440,000 | | | — | | | — | |
| Warrants | — | | | 297,299 | | | 425,092 | |
| Restricted stock units | — | | | 233,782 | | | 405,415 | |
| Total shares excluded from diluted net income (loss) per share | 10,520,703 | | | 30,051,078 | | | 31,055,268 | |
11. Income Taxes
The components of (loss) income before income taxes and the income tax (benefit) provision are as follows:
| | | | | | | | | | | | | | | | | |
| Year Ended December 31, |
| 2021 | | 2020 | | 2019 |
| (In thousands) | | |
| United States | $ | (38,175) | | | $ | (8,213) | | | $ | (13,028) | |
| Foreign | 23,640 | | | 15,863 | | | (2,006) | |
| (Loss) income before provision for income taxes | $ | (14,535) | | | $ | 7,650 | | | $ | (15,034) | |
OUTBRAIN INC.
Notes to Consolidated Financial Statements
As of and For Years Ending December 31, 2021 and 2020
| | | | | | | | | | | | | | | | | |
| Year Ended December 31, |
| 2021 | | 2020 | | 2019 |
| (In thousands) | | |
| Current provisions for income taxes: | | | | | |
| Federal | $ | — | | | $ | — | | | $ | (43) | |
| State | 541 | | | 81 | | | 12 | |
| Foreign | 5,739 | | | 5,468 | | | 5,652 | |
| Total current | 6,280 | | | 5,549 | | | 5,621 | |
| Deferred tax benefit: | | | | | |
| Federal | (25,787) | | | 226 | | | 170 | |
| State | (5,558) | | | 46 | | | 40 | |
| Foreign | (465) | | | (2,528) | | | (351) | |
| Total deferred tax benefit | (31,810) | | | (2,256) | | | (141) | |
| (Benefit) provision for income taxes | $ | (25,530) | | | $ | 3,293 | | | $ | 5,480 | |
The reconciliation of the statutory federal income tax and the Company’s effective income tax is as follows:
| | | | | | | | | | | | | | | | | |
| Year Ended December 31, |
| 2021 | | 2020 | | 2019 |
| Tax at statutory federal rate | 21.0 | % | | 21.0 | % | | 21.0 | % |
| State tax—net of federal benefit | 1.9 | % | | (3.9) | % | | 1.8 | % |
| Foreign withholding taxes | (2.9) | % | | 25.4 | % | | — | |
| Foreign rate differential | 3.2 | % | | (9.6) | % | | (0.9) | % |
| Stock compensation and other permanent items | (24.9) | % | | 10.0 | % | | (16.5) | % |
| Tax rate change | (4.4) | % | | (3.4) | % | | — | |
| Uncertain tax positions | (18.9) | % | | (11.2) | % | | (13.7) | % |
| Change in valuation allowance | 209.4 | % | | (32.0) | % | | (34.7) | % |
| GILTI Inclusion—US | (19.3) | % | | 59.4 | % | | — | |
| Foreign tax credit carryforwards | 4.9 | % | | (5.9) | % | | — | |
| Capital loss carryforwards | — | % | | (19.9) | % | | — | |
| Return to provision adjustments | 5.4 | % | | 11.8 | % | | 8.0 | % |
| Other | 0.2 | % | | 1.3 | % | | (1.5) | % |
| Effective tax rate | 175.6 | % | | 43.0 | % | | (36.5) | % |
OUTBRAIN INC.
Notes to Consolidated Financial Statements
As of and For Years Ending December 31, 2021 and 2020
Deferred taxes are the result of temporary differences between the bases of assets and liabilities for financial reporting and income tax purposes. Deferred tax assets and liabilities at December 31, 2021 and 2020 were comprised of the following:
| | | | | | | | | | | |
| December 31, |
| 2021 | | 2020 |
| (In thousands) |
| Deferred tax assets: | | | |
| Net operating loss carryforwards | $ | 21,498 | | | $ | 31,930 | |
| Foreign tax credit carryforwards | 1,797 | | | 479 | |
| Capital loss carryforwards | 3,388 | | | 4,036 | |
| Stock-based compensation | 396 | | | 861 | |
| Accruals, reserves, and other | 6,458 | | | 6,409 | |
| Senior notes interest & deferred financing fees | 10,275 | | | — | |
| Allowance for doubtful accounts | 1,017 | | | 1,003 | |
| Gross deferred tax assets | 44,829 | | | 44,718 | |
| Valuation allowance | (10,731) | | | (41,201) | |
| Total deferred tax assets | 34,098 | | | 3,517 | |
| Deferred tax liabilities: | | | |
| Intangible assets and capitalized software | (2,859) | | | (4,139) | |
| Total deferred tax liabilities | (2,859) | | | (4,139) | |
| Net deferred tax liability | $ | 31,239 | | | $ | (622) | |
As of December 31, 2020, the Company had a valuation allowance against its U.S. deferred tax assets of $40.7 million. The Company regularly assesses the need for the valuation allowance on its deferred tax assets, and to the extent that it determines that an adjustment is needed, such adjustment will be recorded in the period that the determination is made. During the fourth quarter of 2021, the Company reassessed the need for a valuation allowance, considering, among other things, its cumulative pre-tax book income, excluding one-time expenses, in the three-year period ended December 31, 2021. After weighing all of the evidence, the Company determined that the positive evidence in favor of releasing a portion of the valuation allowance, particularly the evidence that was objectively verifiable, outweighed the negative evidence against releasing the allowance as of December 31, 2021 on certain U.S. deferred tax assets.
The positive evidence that weighed in favor of releasing the U.S valuation allowance on certain deferred tax assets at December 31, 2021 included the following factors:
•The Company’s U.S. entities have cumulative pre-tax book income for the three-year period ending December 31, 2021, excluding one-time expenses related to its IPO and Senior Note issuance;
•The Company’s U.S. entities are expected to have consolidated federal and state taxable income in 2021 and in future years, which is expected to be offset against net operating loss carryforwards to the extent allowable by federal and state tax laws; and
•Federal net operating losses generated prior to 2018 have a twenty-year carry-over period. As such, the Company anticipates that most of its U.S. net operating loss carryforwards will be utilized before their statutory expiration date.
The negative evidence considered included a history of U.S. federal taxable losses prior to 2018.
As a result of its analysis, the Company concluded that it is more likely than not that the majority of the U.S. deferred tax assets will be realized. As a result, during the fourth quarter of 2021, the Company released $31.8 million of its U.S. valuation allowance.
As of each reporting date, the Company will consider existing evidence, both positive and negative, that could impact its view with regard to future realization of deferred tax assets.It is possible that the valuation allowance could change in the next 12 months.
OUTBRAIN INC.
Notes to Consolidated Financial Statements
As of and For Years Ending December 31, 2021 and 2020
Recognition of deferred tax assets is appropriate when realization of these assets is more likely than not. Based upon the weight of available evidence, which includes the Company’s historical operating performance and the recorded cumulative net losses in prior fiscal periods, the Company recorded a valuation allowance of $10.7 million and $41.2 million against the U.S. and U.K. deferred tax assets as of December 31, 2021 and December 31, 2020, respectively. The net valuation allowance decreased by $30.5 million and $2.4 million for the years ended December 31, 2021 and 2020, respectively.
As of December 31, 2021 and 2020, the Company had U.S. federal net operating loss carryforwards of $56.6 million and $105.8 million, respectively. The federal net operating loss carryforwards will expire at various amounts beginning in the year ending December 31, 2032, if not utilized. As of December 31, 2021 and 2020, the Company had state net operating loss carryforwards of $120.5 million and $126.3 million, respectively. State net operating losses will expire at various amounts beginning in the year ending December 31, 2025, if not utilized. As of December 31, 2021 and 2020, the Company had U.K. foreign tax credits of $1.8 million and $0.5 million, respectively. These foreign tax credits can be carried forward indefinitely.
Utilization of the net operating losses may be subject to an annual limitation provided for in the Code under Section 382 and similar state codes. As of December 31, 2021, $3.2 million of federal net operating losses are currently limited from use under such provisions and any annual limitation could result in the expiration of net operating loss carryforwards before utilization.
While the Company has recognized the U.S. federal tax impact on a portion of the undistributed earnings of its foreign subsidiaries under the Tax Cuts and Jobs Act, enacted in 2017 (“Tax Act”), its policy with respect to foreign earnings remains unchanged and the Company considers them to be indefinitely reinvested. Upon distribution of those earnings in the form of a dividend or otherwise, the Company could be subject to taxes, including withholding taxes payable to various foreign countries, for which a deferred tax liability is not currently recognized.
Unrecognized Tax Benefits
The activity related to the gross amount of unrecognized tax benefits is as follows:
| | | | | | | | | | | | | | | | | |
| Year Ended December 31, |
| 2021 | | 2020 | | 2019 |
| (In thousands) |
| Beginning balance | $ | 1,232 | | | $ | 2,087 | | | $ | 33 | |
| Decreases due to tax settlements and expirations of statutes of limitations | (728) | | | (1,243) | | | (33) | |
| Additions based on tax positions related to prior year | 2,323 | | | 67 | | | 1,793 | |
| Additions based on tax positions related to current year | 445 | | | 321 | | | 294 | |
| Ending balance | $ | 3,272 | | | $ | 1,232 | | | $ | 2,087 | |
If recognized, the Company’s gross unrecognized tax benefits would not have a material impact on its effective tax rate for the year ended December 31, 2021. While it is often difficult to predict the outcome of any particular uncertain tax position, the Company believes it is reasonably possible that its unrecognized tax benefits will decrease by approximately $0.4 million during the next 12 months. The Company further expects that the amount of unrecognized tax benefits will continue to change in the future as a result of ongoing operations, the outcomes of audits, and the expiration of the statute of limitations. This change is not expected to have a significant impact on the Company’s results of operations or financial condition.
The Company recognizes accrued interest and penalties related to unrecognized tax benefits in its income tax (benefit) provision. For the years ended December 31, 2021, 2020 and 2019, the Company recognized $(0.1) million, $(0.1) million, and $0.4 million of accrued interest and penalties, respectively, which are reflected in the table above.
The Company is subject to taxation in the United States, various states, and several foreign jurisdictions. The Company establishes reserves for open tax years for uncertain tax positions that may be subject to challenge by various taxing authorities. The consolidated tax provision and related accruals include the impact of such reasonably estimable losses and related interest and penalties as deemed appropriate. United States and foreign jurisdictions have statute of limitations generally ranging from 3
OUTBRAIN INC.
Notes to Consolidated Financial Statements
As of and For Years Ending December 31, 2021 and 2020
to 5 years. However, the statute of limitations does not begin for years that a net operating loss carryforward was generated until the loss is applied against taxable income. In that scenario, the taxing authority can only make adjustments in the original loss year to the extent of the net operating loss. Open audit years in the United States are 2013 through 2021, in the U.K. are 2017 through 2021 and in Israel are 2020 and 2021.
12. Segment Information
The following table represents total revenue based on where the Company’s marketers are physically located:
| | | | | | | | | | | | | | | | | |
| Year Ended December 31, |
| 2021 | | 2020 | | 2019 |
| (In thousands) |
| USA | $ | 372,855 | | | $ | 288,789 | | | $ | 258,377 | |
| Europe, the Middle East and Africa (EMEA) | 523,580 | | | 398,923 | | | 347,696 | |
| Other | 119,195 | | | 79,430 | | | 81,260 | |
| Total revenue | $ | 1,015,630 | | | $ | 767,142 | | | $ | 687,333 | |
The Company’s property, equipment and capitalized software, net by geographic location is summarized as follows:
| | | | | | | | | | | |
| December 31, |
| 2021 | | 2020 |
| (In thousands) |
| USA | $ | 25,246 | | | $ | 22,069 | |
| EMEA | 2,638 | | | 2,264 | |
| Other | 124 | | | 423 | |
| Total property, equipment and capitalized software, net | $ | 28,008 | | | $ | 24,756 | |
13. Subsequent Events
On February 28,December 14, 2022, the Company’s Board of Directors approved a stocknew share repurchase program, under whichauthorizing the Company is authorized to purchaserepurchase up to $30 million of the Company'sits common stock, par value $0.001 per share, with no requirement to purchase any minimum number of shares. The manner, timing, and actual number of shares repurchased under the program will depend on a variety of factors, including price, general business and market conditions, and other investment opportunities. Shares may be repurchased through privately negotiated transactions or open market purchases, including through the use of trading plans intended to qualify under Rule 10b5-1 under the Exchange Act. The repurchase program may be commenced, suspended, or terminated at any time by the Company at its discretion without prior notice. As of December 31, 2023, the remaining repurchase availability under the Company’s $30 million share repurchase program was $12.4 million, reflecting repurchases of 3,729,462 shares for $17.8 million in 2023. Commission costs associated with share repurchases and excise taxes accrued as a result of the Inflation Reduction Act of 2022 do not reduce the remaining authorized amount under the repurchase programs.
On November 19,During 2022, the Company repurchased 6,389,129 shares with a fair value of $30.2 million, including commissions, under its prior $30 million share repurchase program authorized in February 2022.
In addition to its publicly announced programs, the Company periodically withholds shares to satisfy employee tax withholding obligations arising in connection with the vesting of restricted stock units and exercise of options and warrants in accordance with the terms of the Company’s equity incentive plans and the underlying award agreements. During 2023, 2022 and 2021, the Company entered intowithheld 163,265 shares, 245,465 shares, and 1,032,995 shares, respectively, with a definitive agreement,fair value of $0.8 million, $2.5 million, and $14.2 million, respectively, to satisfy the minimum employee tax withholding obligations.
OUTBRAIN INC.
Notes to Consolidated Financial Statements
As of and For Years Ending December 31, 2023 and 2022
Accumulated Other Comprehensive Loss
The following table details the changes in accumulated other comprehensive income (loss) (“AOCI”), net of tax:
| | | | | | | | | | | | | | | | | |
| Foreign Currency Translation Loss | | Unrealized (Loss) Gain on Investments in Marketable Securities(1) | | Total Accumulated Other Comprehensive Loss |
| Balance–January 1, 2021 | $ | (4,290) | | | $ | — | | | $ | (4,290) | |
| Other comprehensive income, net of tax | (184) | | | — | | | (184) | |
| Balance–December 31, 2021 | (4,474) | | | — | | | (4,474) | |
| Other comprehensive loss, net of tax | (3,870) | | | (1,569) | | | (5,439) | |
| Balance–December 31, 2022 | (8,344) | | | (1,569) | | | (9,913) | |
| Other comprehensive (loss) income before reclassifications, net of tax | (695) | | | 1,136 | | | 441 | |
| Realized losses reclassified to earnings, net of tax | — | | | 420 | | | 420 | |
| Other comprehensive (loss) income, net of tax | $ | (695) | | | $ | 1,556 | | | $ | 861 | |
| Balance–December 31, 2023 | $ | (9,039) | | | $ | (13) | | | $ | (9,052) | |
(1) Unrealized (loss) income before reclassifications on investments on marketable securities is net of taxes of $(0.4) million and $0.5 million, respectively, in 2023 and 2022. Realized losses on available securities that were reclassified to earnings in 2023 are net of taxes of $(0.1) million. There were no amounts reclassified from AOCI to earnings in 2022 or 2021.
13. Stock-based Compensation
Equity Incentive Plans
In July 2021, the Board and the Company’s stockholders approved the 2021 Long-Term Incentive Plan (the “2021 LTIP”), which became effective in connection with the closing of the Company’s IPO. The 2021 LTIP may be used to grant, among other award types, stock options and RSUs. The number of shares of common stock reserved for future issuance under the 2021 Plan will also be increased pursuant to provisions for annual automatic evergreen increases. The Company’s previous awards issued under its 2007 Omnibus Securities and Incentive Plan, as amended and restated on January 21, 2009 (“2007 Plan”), remain subject to the 2007 Plan. As of December 31, 2023, 6,301,466 and 766,241 and shares were available for grant under the 2021 LTIP and the 2007 Plan, respectively. The Company generally issues new shares for stock option exercises and vesting of restricted stock units.
The Company recognizes stock-based compensation for stock-based awards, including stock options, RSUs and SARs based on the estimated fair value of the awards. The Company estimates the fair value of its stock option awards on the grant date using the Black-Scholes option pricing model. The fair value of RSUs is the fair value of the Company’s common stock on the date of grant. The Company accounts for forfeitures as they occur.
The following table summarizes stock-based compensation expense recognized in the Company’s consolidated statements of operations for the periods presented:
| | | | | | | | | | | | | | | | | | | | |
| Year Ended December 31, | |
| 2023 | | 2022 | | 2021 | |
| (In thousands) | |
| Research and development | $ | 2,971 | | | $ | 2,355 | | | $ | 3,959 | | |
| Sales and marketing | 4,587 | | | 4,938 | | | 8,656 | | |
| General and administrative | 4,583 | | | 4,367 | | | 13,692 | | |
| Total stock-based compensation | $ | 12,141 | | | $ | 11,660 | | | $ | 26,307 | | (1) |
| Tax benefit related to stock-based compensation expense | $ | 1,727 | | | $ | 1,560 | | | $ | 4,482 | | |
__________________________
(1) Includes $16.5 million of stock-based compensation expense recorded during the three months ended September 30, 2021, in connection with the Company’s stock option awards, restricted stock awards, RSUs and SARs for which the service condition has been met and a performance condition was satisfied upon the Company’s IPO, which was a qualifying liquidity event. Stock-based compensation expense for unvested awards will be recognized over the remainder of the requisite service period.
OUTBRAIN INC.
Notes to Consolidated Financial Statements
As of and For Years Ending December 31, 2023 and 2022
During the years ended December 31, 2023, 2022 and 2021, approximately $0.6 million, $0.9 million and $0.2 million, respectively, of stock-based compensation expense was capitalized by and among the Company as part of capitalized software development costs within property, equipment and capitalized software, net.
Stock Options
The following table summarizes stock option activity for the year ended December 31, 2023:
| | | | | | | | | | | | | | | | | | | | | | | |
| Stock Options |
| Number of Shares | | Weighted- Average Exercise Price | | Weighted- Average Remaining Contractual Term (Years) | | Aggregate Intrinsic Value of Outstanding Options (In thousands) |
| Outstanding — December 31, 2022 | 2,681,436 | | | $ | 9.08 | | | 4.49 | | $ | — | |
| Granted | — | | | $ | — | | | | | |
| Exercised | — | | | $ | — | | | | | |
| Forfeited/expired | (271,883) | | | $ | 8.29 | | | | | |
| Outstanding — December 31, 2023 | 2,409,553 | | | $ | 9.17 | | | 3.73 | | $ | — | |
| Exercisable — December 31, 2023 | 2,195,933 | | | $ | 8.98 | | | 3.41 | | $ | — | |
The aggregate intrinsic value of options exercised in 2022 and 2021 was $3.0 million and $16.4 million, respectively. As of December 31, 2023, total unrecognized stock-based compensation related to unvested stock options was $1.0 million, which is expected to be recognized over a weighted-average period of 1.0 years.
There were no stock options granted in 2023 or 2022. The estimated grant-date fair value of 37,624 stock options granted in 2021 was calculated using the Black-Scholes option pricing model, based on the following assumptions and inputs, each of which is subjective and generally requires significant judgment:
| | | | | |
| Year Ended December 31, |
| 2021 |
| Grant date fair value | $5.95 |
| Expected term (in years) | 6.03 |
| Risk-free interest rate | 1.29 | % |
| Expected volatility | 43 | % |
| Dividend rate | 0 | % |
Expected term. The expected term represents the period over which the Company’s option awards are expected to be outstanding, determined using the simplified method, based on the average of the time to the vest date and the shareholderscontractual term.
Risk-Free Interest Rate. The risk-free interest rate is based on the U.S. Treasury yield curve on the date of video intelligence AG (“vi”),grant for zero-coupon U.S. Treasury notes with maturities corresponding to the awards’ expected term.
Expected Volatility. Due to the Company’s short trading history, expected term is estimated using average historical stock volatilities of comparable actively traded public companies within its industry over a Swiss-based contextual video technology companyperiod equal to the awards’ expected term.
Dividend rate. The expected dividend rate was assumed to be zero as the Company has not paid and does not anticipate paying any dividends in the foreseeable future.
Fair value of common stock. For stock options granted subsequent to the Company’s IPO, fair value is based on the closing price of its common stock reported on Nasdaq on the date of grant. Prior to the Company’s IPO, because there was no public market for digital media owners,its common stock, the fair value was determined by its board of directors, with input from management and valuation reports performed by third-party valuation specialists.
OUTBRAIN INC.
Notes to Consolidated Financial Statements
As of and For Years Ending December 31, 2023 and 2022
Restricted Stock Units
The following table summarizes RSU activity for the acquisition year ended December 31, 2023:
| | | | | | | | | | | |
| RSUs |
| Number of Shares | | Weighted-Average Grant Date Fair Value |
| Outstanding—December 31, 2022 | 2,785,510 | | | $ | 9.87 | |
| Granted | 2,583,691 | | | $ | 4.81 | |
| Vested | (1,392,500) | | | $ | 8.63 | |
| Forfeited | (469,618) | | | $ | 8.27 | |
| Outstanding—December 31, 2023 | 3,507,083 | | | $ | 6.85 | |
The above rollforward includes 90,000 performance-based RSUs with a grant date fair value of all4.82 per share granted during the twelve months ended months ended December 31, 2023. Expense related to performance-based RSUs is recognized ratably during the 3-year performance period, based on the probability of attaining the performance targets. The potential number of shares that may be earned is determined on a pro-rata basis based on performance up to a maximum of 100%.
All of the Company’s restricted stock awards and certain of the Company’s RSUs issued prior to the Company’s IPO had a performance condition, which was satisfied upon the IPO and the expense was recognized based on the requisite service period that has been met to date. Stock-based compensation expense for unvested awards is being recognized over the remainder of the service period.
For restricted stock units granted subsequent to the Company’s IPO, the fair value is based on the closing price of its common stock reported on Nasdaq on the date of grant. Prior to the Company’s IPO, because there was no public market for its common stock, the fair value was determined by its board of directors, with input from management and valuation reports performed by third-party valuation specialists. The weighted-average grant-date fair value for restricted stock units granted in 2023, 2022 and 2021 was $4.81, $8.98 and $13.53, respectively. As of December 31, 2023, the unrecognized stock-based compensation cost related to unvested RSUs was $23.0 million, which is expected to be recognized over a weighted average period of 2.6 years.
Stock Appreciation Rights (SARs)
In 2014, the Company granted SARs with a contractual term of 10 years, to certain employees, which vest subject to performance conditions and can be cash or share settled, at the option of the employee. The Company’s SARs vested upon the Company’s IPO and are accounted for as liability awards, with remeasurement at the end of each reporting period until these awards are settled. There were 2,861 and 3,390 SARs awards outstanding as of December 31, 2023 and 2022, respectively, reflecting forfeitures of 529 SARs in 2023. These awards have a weighted average exercise price of $7.67 and expire in September 2024.
Stock-Based Awards Granted Outside of Equity Incentive Plans
Warrants
The Company issued equity classified warrants to purchase shares of vi forcommon stock to certain third-party advisors, consultants and financial institutions, which expire between 2024 and 2026. As of December 31, 2023 and 2022, there were 188,235 warrants outstanding with a purchaseweighted average excise price of $7.57. The weighted average remaining contractual term as of December 31, 2023 was 1.37 years.
Employee Stock Purchase Plan
In July 2021, the Board and the Company’s stockholders approved a new 2021 Employee Stock Purchase Plan (the “ESPP”), which became effective in connection with the closing of the Company’s IPO. A total of approximately $55 million. The acquisition was completed on January 5, 2022. The purchase price was paid in2,352,280 shares of the form of cash and OutbrainCompany’s common stock withhave been reserved for issuance under the first installment of $37.3 million in cash and the equity portion paid at closing, and the substantial majority of the remaining cash balance payable in the third quarter of 2022. The equity portion of the purchase priceESPP, which is subject to a post-closing adjustment based on market priceannual automatic evergreen increases. As of our stockDecember 31, 2023, no shares have been purchased under the ESPP as it is not yet active.
OUTBRAIN INC.
Notes to be determined one year from closing, at which time any required adjustment is to be paid in cash. Aggregate consideration forConsolidated Financial Statements
As of and For Years Ending December 31, 2023 and 2022
14. Net Income (Loss) Per Common Share
The following table presents the acquisition of vi will not exceed approximately $55 million in total. The purposecomputation of the acquisition was to expand the Company’s video product offerings to include in-stream high-quality video content, delivering a better user experiencebasic and more valuediluted net income (loss) per share attributable to its advertisers. This acquisition will be accounted for as a bcommon stockholders:
| | | | | | | | | | | | | | | | | |
| Year Ended December 31, |
| 2023 | | 2022 | | 2021 |
| (Dollars in thousands) |
| Numerator: | | | | | |
| Basic and diluted: | | | | | |
| Net income (loss) attributed to common stockholders - basic | $ | 10,242 | | | $ | (24,581) | | | $ | 10,995 | |
Adjustments related to convertible debt (1) | (13,930) | | | — | | | — | |
| Net (loss) income attributable to common stockholders - diluted | $ | (3,688) | | | $ | (24,581) | | | $ | 10,995 | |
| | | | | |
| Denominator: | | | | | |
| Basic weighted-average shares | 50,900,422 | | | 55,615,385 | | | 35,159,757 | |
| Weighted average dilutive share equivalents: | | | | | |
Convertible debt (1) | 6,064,877 | | | — | | | — | |
| Preferred stock, stock options, warrants and RSUs | — | | | — | | | 18,734,590 | |
| Diluted weighted-average shares | 56,965,299 | | | 55,615,385 | | | 53,894,347 | |
| | | | | |
| Net income (loss) per share attributable to common stockholders: | | | | | |
| Basic | $ | 0.20 | | | $ | (0.44) | | | $ | 0.31 | |
| Diluted | $ | (0.06) | | | $ | (0.44) | | | $ | 0.20 | |
____________________
(1)usiness combination andThe Company uses the resultsif-converted method to calculate the dilutive impact of the acquired entity will be included in our results of operations beginningConvertible Notes, which assumes share settlement as of the acquisition date in 2022. beginning of the period if the effect is more dilutive than cash settlement.
The following weighted-average shares have been excluded from the calculation of diluted net income (loss) per share attributable to common stockholders for each period presented because they are anti-dilutive:
| | | | | | | | | | | | | | | | | |
| Year Ended December 31, |
| 2023 | | 2022 | | 2021 |
| Convertible debt | — | | | 9,440,000 | | | 9,440,000 | |
| Options to purchase common stock | 2,523,643 | | | 2,681,436 | | | 1,080,703 | |
| Warrants | 188,235 | | | 188,235 | | | — | |
| Restricted stock units | 3,326,964 | | | 2,785,510 | | | — | |
| Total shares excluded from diluted net income (loss) per share | 6,038,842 | | | 15,095,181 | | | 10,520,703 | |
OUTBRAIN INC.
Notes to Consolidated Financial Statements
As of and For Years Ending December 31, 2023 and 2022
15. Segment and Geographic Information
The Company is inhas one operating and reporting segment.
The following table represents total revenue based on where the processCompany’s marketers are physically located:
| | | | | | | | | | | | | | | | | |
| Year Ended December 31, |
| 2023 | | 2022 | | 2021 |
| (In thousands) |
| USA | $ | 286,039 | | | $ | 330,333 | | | $ | 372,855 | |
| Europe, the Middle East and Africa (EMEA) | 552,621 | | | 553,051 | | | 523,580 | |
| Other | 97,158 | | | 108,698 | | | 119,195 | |
| Total revenue | $ | 935,818 | | | $ | 992,082 | | | $ | 1,015,630 | |
The Company’s long-lived assets by geographic location, which are comprised of performing a business valuationproperty, equipment and preparing its purchase price allocation.capitalized software, net and operating lease right-of-use assets, net are summarized below:
| | | | | | | | | | | |
| December 31, |
| 2023 | | 2022 |
| (In thousands) |
| USA | $ | 44,466 | | | $ | 43,191 | |
| EMEA | 9,685 | | | 7,181 | |
| Other | 455 | | | 583 | |
| Total long-lived assets, net | $ | 54,606 | | | $ | 50,955 | |
Item 9. Changes in and Disagreements With Accountants on Accounting and Financial Disclosures
None.
Item 9A. Controls and Procedures
Evaluation of Disclosure Controls and Procedures
Our management, with the participation of our co-Chief Executive Officers (“co-CEOs”) and Chief Financial Officer (“CFO”), has evaluated the effectiveness of our disclosure controls and procedures (as defined in Rules 13a-15(e) or 15d-15(e) under the Securities Exchange Act of 1934, as amended (the “Exchange Act”)), as of December 31, 2021.2023. Based on such evaluation, our co-CEOs and CFO have concluded that as of December 31, 2021,2023, our disclosure controls and procedures are designed at a reasonable assurance level and are effective to provide reasonable assurance that information we are required to disclose in reports that we file or submit under the Exchange Act is recorded, processed, summarized, and reported within the time periods specified in the rules and forms of the SEC, and that such information is accumulated and communicated to our management, including our co-CEOs and CFO, as appropriate, to allow timely decisions regarding required disclosure.
Changes in Internal Control over Financial Reporting
There were no changes to our internal control over financial reporting that occurred during the three months ended December 31, 20212023 that materially affected, or are reasonably likely to materially affect, our internal control over financial reporting.
Inherent Limitations on Effectiveness of Controls
Our management, including our co-CEOs and CFO, does not expect that our disclosure controls and procedures or internal control over financial reporting will prevent all errors and all fraud. A control system, no matter how well designed and implemented, can provide only reasonable, not absolute, assurance that the control system’s objectives will be met. Further, the design of a control system must reflect the fact that there are resource constraints and the benefits of controls must be considered relative to their costs. Because of the inherent limitations in all control systems, no evaluation of controls can provide absolute assurance that all control issues within a company are detected.
Management’s Report on Internal Control over Financial Reporting
Internal control over financial reporting includes maintaining records that, in reasonable detail, accurately and fairly reflect our transactions; providing reasonable assurance that transactions are recorded as necessary for the preparation of our consolidated financial statements in accordance with accounting principles generally accepted in the United States of America; providing reasonable assurance that receipts and expenditures of company assets are made in accordance with management authorization; and providing reasonable assurance that unauthorized acquisition, use or disposition of company assets that could have a material effect on the consolidated financial statements would be prevented or detected on a timely basis. Because of its inherent limitations, internal control over financial reporting is not intended to provide absolute assurance that a misstatement of our consolidated financial statements would be prevented or detected.
Under the supervision and with the participation of our Co-CEOs and CFO, our management conducted an evaluation of the effectiveness of our internal control over financial reporting based on the criteria set forth in “Internal Control—Integrated Framework” issued by the Committee of Sponsoring Organizations of the Treadway Commission (2013 framework). Based on this assessment, our management concluded that our internal control over financial reporting was effective at the reasonable assurance level as of December 31, 2023.
Attestation Report of the Independent Registered Public Accounting Firm
This Annual Report does not include aan attestation report of management’s assessmentour registered public accounting firm regarding internal control over financial reporting or an attestation report of our independent registered public accounting firm due to a transition periodan exemption established by the rulesJOBS Act for “emerging growth companies.”
Item 9B. Other Information
None.(a) Amended and Restated Bylaws
Effective March 7, 2024, the Board amended and restated the Company’s Amended and Restated Bylaws (as so amended and restated, the “Bylaws”) to (i) update certain provisions to reflect certain amendments to Delaware law, including with respect to meeting adjournment procedures; (ii) address matters relating to Rule 14a-19 (“universal proxy rules”) under the Exchange Act, including the requirement to certify compliance with the universal proxy rules; (iii) revise the procedures and disclosure requirements set forth in the Company’s advance notice provisions with respect to director nominations and business proposals (other than proposals submitted pursuant to Exchange Act Rule 14a-8); (iv) authorize the Board to prescribe rules for, and clarify the power of the chair to adjourn, a meeting of stockholders; (v) amend the quorum provision for stockholder meetings to clarify that the quorum requirement is consistent with that set forth in the Company’s certificate of incorporation; and (vi) make certain ministerial changes, clarifications, and other conforming revisions. The Bylaws are effective as of March 7, 2024, other than with respect to the advance notice provision for proposals of business set forth in Article I, Section 2 of the Bylaws, which will become effective on April 2, 2024, with the predecessor provision in the Company’s previous bylaws remaining in effect through April 1, 2024.
The foregoing summary is qualified in its entirety by reference to the full text of the Bylaws, a copy of which is filed as Exhibit 3.3 to this Annual Report on Form 10-K and incorporated by reference herein.
2024 Annual Meeting Date
The Company has set June 13, 2024 as the date for its 2024 Annual Meeting of Stockholders.
(b) Trading Plan Arrangements
On November 14, 2023, Yaron Galai, Co-Chief Executive Officer, adopted a Rule 10b5-1 trading arrangement that is intended to satisfy the affirmative defense of Rule 10b5-1(c) for the sale of up to 250,000 shares of Outbrain Inc. common stock commencing on March 5, 2024 and expiring on December 31, 2024.
Item 9C. Disclosure Regarding Foreign Jurisdictions that Prevent Inspections
Not applicable.
PART III
Item 10. Directors, Executive Officers and Corporate Governance
Information relating to the directors and executive officers of the Company, as well as information relating to compliance with Section 16(a) of the Securities Exchange Act of 1934, as required by this Item 10, will be contained in our definitive Proxy Statement to be filed with the SEC in connection with our 20222024 annual meeting of stockholders pursuant to Regulation 14A not later than 120 days after December 31, 20212023 (the "2022“2024 Proxy Statement"Statement”), and such information is incorporated herein by reference.
The Company’s corporate governance policies and procedures, including the Code of Business Conduct and Ethics and Charters of the Committees of the Board are available, free of charge, on its website under the headings Investors / Investors/Governance at https://investors.outbrain.com/governance/documents-charters, or by writing to Outbrain Inc., 111 West 19th Street, New York, New York 10011, c/o Corporate Secretary. The Company’s Code of Business Conduct applies to all of its directors, officers and employees.
Item 11. Executive Compensation
Information relating to executive compensation and the Compensation Committee, as required by this Item 11, will be contained in the 20222024 Proxy Statement, and such information is incorporated herein by reference.
Item 12. Security Ownership of Certain Beneficial Owners and Management and Related Stockholder Matters
Information relating to certain beneficial ownership of certain stockholders and management, as well as certain other information required by this Item 12, will be contained in the 20222024 Proxy Statement, and such information is incorporated herein by reference.
Item 13. Certain Relationships and Related Party Transactions, and Director Independence
Information relating to director independence and certain relationships and related transactions, as required by this Item 13, will be contained in the 20222024 Proxy Statement, and such information is incorporated herein by reference.
Item 14. Principal Accountant Fees and Services
Information relating to fees paid to and services performed by KPMG LLP and our Audit Committee’s pre-approval policies and procedures with respect to non-audit services, as required by this Item 14, will be contained in the 20222024 Proxy Statement, and such information is incorporated herein by reference.
PART IV
Item 15. Exhibits and Financial Statement Schedules
| | | | | |
| (a) (1) Financial Statements | Page |
| |
| |
| |
| |
| |
| |
| |
| |
| (a) (2) Financial Statement Schedules | |
| None. | |
| (a) (3) Exhibits | |
| See the Exhibit Index of this Annual Report on Form 10-K | |
EXHIBIT INDEX
| | | | | | | | |
| Exhibit No. | | Description |
| 3.1 | | |
| 3.2 | | |
| 3.3* | | |
| 4.1 | | |
4..24.2 | | |
4.3*4.3 | | |
| 4.4 | | |
| 4.5 | | |
| 4.6 | | |
4.7*4.7 | | |
| 10.1 | | |
| 10.2 | | |
10.3†10.3 | | |
| 10.4† | | |
10.4†10.5† | | |
10.5†10.6† | | |
10.6†10.7† | | |
10.7†10.8† | | |
10.8†10.9† | | |
| 10.10† | | |
| 10.9 | |
| | | | | |
10.1010.11 | | Senior Subordinated Secured Note Purchase Agreement dated July 1, 2021 by and between the Registrant, Baupost Private Investments A-2, L.L.C., Baupost Private Investments B-2, L.L.C., Baupost Investments C-2, L.L.C., Baupost Private Investments P-2, L.L.C., Baupost Private Investments Y-2, L.L.C., Baupost Private Investments BVI-2, L.L.C., Baupost Private Investments BVII-2, L.L.C., Baupost Private Investments BVIII-2, L.L.C., Baupost Private Investments BVIV-2, L.L.C. and The Bank of New York Mellon (incorporated by reference to Exhibit 10.17 to the Company’s Form S-1/A filed with the SEC on July 6, 2021).
|
| | | | | | | | |
Exhibit No.10.12 | | Description |
10.11 | | |
| 21.1* | | |
| 23.1* | | |
| 24.1* | | |
| 31.1* | | |
| 31.2* | | |
| 31.3* | | |
32.1*v | | |
| 97* | | |
| 101.INS* | | XBRL Instance Document |
| 101.SCH* | | XBRL Taxonomy Extension Schema Document |
| 101.CAL* | | XBRL Taxonomy Extension Calculation Linkbase Document |
| 101.DEF* | | XBRL Taxonomy Extension Definition Linkbase Document |
| 101.LAB* | | XBRL Taxonomy Extension Label Linkbase Document |
| 101.PRE* | | XBRL Taxonomy Extension Presentation Linkbase Document |
| 104* | | Cover Page Interactive Data File (formatted as Inline XBRL and contained in Exhibit 101) |
_______________________
* Filed herewith.
v This certification is not deemed filed for purposes of Section 18 of the Securities Exchange Act of 1934, as amended, or otherwise subject to the liability of that section, nor shall it be deemed incorporated by reference into any filing under the Securities Act of 1933, as amended, or the Exchange Act.
† Compensatory plan or agreement.
Item 16. Form 10-K Summary
None.
SIGNATURES
Pursuant to the requirements of Section 13 or 15(d) of the Securities Exchange Act of 1934, the registrant has duly caused this report to be signed on its behalf by the undersigned, thereunto duly authorized.
| | | | | | | | |
| OUTBRAIN INC. |
| By: | /s/ David Kostman |
| | Name: David Kostman |
| | Title: Co-Chief Executive Officer |
Date: March 18, 20228, 2024
POWER OF ATTORNEY
KNOW ALL PERSONS BY THESE PRESENTS, that each person whose signature appears below constitutes and appoints Yaron Galai, David Kostman, Elise GarofaloJason Kiviat and Veronica Gonzalez, jointly and severally, his or her attorney-in-fact, with the power of substitution, for him or her in any and all capacities, to sign any amendments to this Annual Report on Form 10-K and to file the same, with exhibits thereto and other documents in connection therewith, with the Securities and Exchange Commission, hereby ratifying and confirming all that each of said attorneys-in-fact, or substitute or substitutes, may do or cause to be done by virtue hereof.
Pursuant to the requirements of the Securities Exchange Act of 1934, this report has been signed below by the following persons on behalf of the registrant and in the capacities and on the dates indicated.
| | | | | | | | | | | | | | |
| Signatures | | Title | | Date |
| | | | |
| /s/ Yaron Galai | | Co-Founder and Co-Chief Executive Officer and Chairman
of the Board (Principal Executive Officer)(principal executive officer) | | March 18, 20228, 2024 |
| Yaron Galai | | | |
| | | | |
| /s/ David Kostman | | Co-Chief Executive Officer and Director
(principal executive officer) | | March 18, 20228, 2024 |
| David Kostman | | | |
| | | | |
/s/ Ori LahavJason Kiviat | | Co-Founder, Chief Technology Officer and
General Manager, Israel | | March 18, 2022 |
Ori Lahav | | | |
/s/ Elise Garofalo | | Chief Financial Officer (Principal Financial Officer and
Principal Accounting Officer)(principal financial officer) | | March 18, 20228, 2024 |
Elise GarofaloJason Kiviat | | | |
| | | | |
| /s/ Wenkai Bradshaw | | Chief Accounting Officer and SVP, Corporate Controller
(principal accounting officer) | | March 8, 2024 |
| Wenkai Bradshaw | | | |
| | | | |
| /s/Yoni Cheifetz | | Director | | March 18, 20228, 2024 |
| Jonathan (Yoni) Cheifetz | | | |
| | | | |
| /s/Nithya B. Das | | Director | | March 8, 2024 |
| Nithya B. Das | | | |
| | | | |
| /s/Shlomo Dovrat | | Director | | March 18, 20228, 2024 |
| Shlomo Dovrat | | | |
| /s/Arne Wolter | | Director | | March 18, 2022
Arne Wolter | | | |
| /s/ Kate Taneyhill Jhaveri | | Director | | March 18, 20228, 2024 |
| Kate Taneyhill Jhaveri | | | |
| | | | |
/s/Dom VidalYaffa Krindel | | Director | | March 18, 20228, 2024 |
Dominique VidalYaffa Krindel | | | |
| | | | |
| /s/Arne Wolter | | Director | | March 8, 2024 |
| Arne Wolter | | | |