UNITED STATES
SECURITIES AND EXCHANGE COMMISSION
Washington, D.C. 20549
FORM 10-K
(Mark One)
☒ Annual Report pursuant to Section 13 or 15(d) of the Securities Exchange Act of 1934
For the fiscal year ended December 31, 20202023 or
☐ Transition Report pursuant to Section 13 or 15(d) of the Securities Exchange Act of 1934
Commission File Number 0-53713
OTTER TAIL CORPORATION
(Exact name of registrant as specified in its charter)
| | | | | |
Minnesota (State or other jurisdiction of incorporation or organization) | 27-0383995 (I.R.S. Employer Identification No.) |
| |
215 South Cascade Street, Box 496, Fergus Falls, Minnesota (Address of principal executive offices) | 56538-0496 (Zip Code) |
Registrant's telephone number, including area code: 866-410-8780
Securities registered pursuant to Section 12(b) of the Act:
| | | | | | | | |
| Title of each class | Trading Symbol(s) | Name of each exchange on which registered |
| Common Shares, par value $5.00 per share | OTTR | The Nasdaq Stock Market LLC |
Securities registered pursuant to Section 12(g) of the Act: None
Indicate by check mark if the registrant is a well-known seasoned issuer, as defined in Rule 405 of the Securities Act. Yes ☑ No ☐
Indicate by check mark if the registrant is not required to file reports pursuant to Section 13 or Section 15(d) of the Act. Yes ☐ No ☑
Indicate by check mark whether the registrant (1) has filed all reports required to be filed by Section 13 or 15(d) of the Securities Exchange Act of 1934 during the preceding 12 months (or for such shorter period that the registrant was required to file such reports), and (2) has been subject to such filing requirements for the past 90 days. Yes ☑ No ☐
Indicate by check mark whether the registrant has submitted electronically every Interactive Data File required to be submitted pursuant to Rule 405 of Regulation S-T during the preceding 12 months (or for such shorter period that the registrant was required to submit such files). Yes ☑ No ☐
Indicate by check mark whether the registrant is a large accelerated filer, an accelerated filer, a non-accelerated filer or a smaller reporting company. See the definitions of “large accelerated filer,” “accelerated filer,” “smaller reporting company” and “emerging growth company” in Rule 12b-2 of the Exchange Act. (Check one):
| | | | | | | | | | | | | | | | | |
| | Large Accelerated Filer ☑ | | Accelerated Filer ☐ | | |
| | Non-Accelerated Filer ☐ | | Smaller Reporting Company ☐ | | Emerging Growth Company ☐ |
If an emerging growth company, indicate by check mark if the registrant has elected not to use the extended transition period for complying with any new or revised financial accounting standards provided pursuant to Section 13(a) of the Exchange ActAct. ☐
Indicate by check mark whether the registrant has filed a report on and attestation to its management's assessment of the effectiveness of its internal control over financial reporting under Section 404(b) of the Sarbanes-Oxley Act (15 U.S.C. 7262(b)) by the registered public accounting firm that prepared or issued
its audit report. ☑
If securities are registered pursuant to Section 12(b) of the Act, indicate by check mark whether the financial statements of the registrant included in the filing reflect the correction of an error to previously issued financial statements. ☐
Indicate by check mark whether any of those error corrections are restatements that required a recovery analysis of incentive-based compensation received by any of the registrant’s executive officers during the relevant recovery period pursuant to §240.10D-1(b).☐
Indicate by check mark whether the registrant is a shell company (as defined in Rule 12b-2 of the Exchange Act). Yes ☐ No ☑
TheAs of June 30, 2023, the aggregate market value of common stock held by non-affiliates computed by reference to the last sales price on June 30, 2020 was$1,546,518,975. $3,646,181,401.
Indicate the number of shares outstanding of each of the registrant's classes of common stock, as of the latest practicable date:
41,510,45541,710,521 Common Shares ($5 par value) as of February 16, 2021.January 31, 2024.
DOCUMENTS INCORPORATED BY REFERENCE
The Registrant's definitive Proxy Statement for its 20212024 Annual Meeting of Shareholders is incorporated by reference into Part III of this Form 10-K.
| | | | | | | | |
| | Description | Page |
| | |
| | | |
| | |
| | |
| | |
| ITEM 1. | | |
| ITEM 1A. | | |
| ITEM 1B. | | |
| ITEM 1C. | | |
| ITEM 2. | | |
| ITEM 3. | | |
| ITEM 3A. | | |
| ITEM 4. | | |
| | |
| ITEM 5. | | |
| ITEM 6. | | |
| ITEM 7. | | |
| ITEM 7A. | | |
| ITEM 8. | | |
| | | |
| | |
| | |
| | | |
| | | |
| | | |
| | | |
| | |
| ITEM 9. | | |
| ITEM 9A. | | |
| ITEM 9B. | | |
| ITEM 9C. | | |
| | |
| ITEM 10. | | |
| ITEM 11. | | |
| ITEM 12. | | |
| ITEM 13. | | |
| ITEM 14. | | |
| | |
| ITEM 15. | | |
| ITEM 16. | | |
| | |
The following abbreviations or acronyms are used in the text. | | | | | | | | | | | | | | |
ACE | Affordable Clean Energy | | MNDOC | Minnesota Department of Commerce |
| AFUDC | Allowance for Funds Used During Construction | | MPCAkwh | Minnesota Pollution Control Agencykilowatt-hour |
| AME | Available Maximum Energy | | LSA | Lignite Sales Agreement |
| ARO | Asset Retirement Obligation | | MPUCMDT | Minnesota Public Utilities CommissionMetering and Distribution Technology |
| ARP | Alternative Revenue Program | | MISO | Midcontinent Independent System Operator |
| ASC | Accounting Standards Codification | | MW | Megawatt |
| BTD | BTD Manufacturing, Inc. | | MPUC | MVP | Multi-Value ProjectMinnesota Public Utilities Commission |
| CCMC | Coyote Creek Mining Company, L.L.C. | | MWNAV | megawattsNet Asset Value |
COCCS2
| carbon dioxideCarbon Capture and Sequestration | | NDDEQ | North Dakota Department of Environmental Quality |
ECRCDD | Environmental Cost RecoveryCooling Degree Day | | NDPSC | North Dakota Public Service Commission |
EEICIS | Edison Electric InstituteCritical Security Controls | | NERC | North American Electric Reliability Corporation |
EEPCO2
| Carbon dioxide | | Energy Efficiency Plan | Northern Pipe | Northern Pipe Products, Inc. |
EPACOSO | Committee of Sponsoring Organizations of the Treadway Commission | | OTC | Environmental Protection AgencyOtter Tail Corporation |
| ECO | Energy Conservation and Optimization Rider | | OTP | Otter Tail Power Company |
| EEI | Edison Electric Institute | | Paris Agreement | United Nations Framework Convention on Climate Change |
| EEP | Energy Efficiency Plan | | PFAS | Polyfluoroalkyl substances |
| EGU | Electric Generating Unit | | PIR | Phase-in Rider |
| EPA | Environmental Protection Agency | | PSLRA | Private Securities Litigation Reform Act of 1995 |
| ERISA | Employee Retirement Income Security Act of 1974 | | PTCs | Production tax credits |
| ESSRP | Executive Survivor and Supplemental Retirement Plan | | PACEPVC | Partnership in Assisting Community ExpansionPolyvinyl chloride |
| EUIC | Electric Utility Infrastructure Costs Rider | | RHR | Regional Haze Rule |
| FASB | Financial Accounting Standards Board | | ROE | Return on equity |
| FCA | Fuel Clause Adjustment | | REC | Renewable Energy Certificate |
| FERC | Federal Energy Regulatory Commission | | PTCsRRR | Production tax creditsRenewable Resource Rider |
GCRFOB | Generation Cost RecoveryFree on Board | | PVC | Polyvinyl chloride |
GHG | Greenhouse Gas | | RHR | Regional Haze Rule |
IRP | Integrated Resource Plan | | ROE | Return on equity |
kV | kiloVolt | | SDPUC | South Dakota Public Utilities Commission |
kWGCR | kiloWattGeneration Cost Recovery Rider | | SRECsSEC | Solar renewable energy creditsSecurities and Exchange Commission |
kwhGHG | kilowatt-hourGreenhouse Gas | | SIP | State implementation plan |
| HDD | Heating Degree Day | | SOFR | Secured Overnight Financing Rate |
| ICSP | Information and Cybersecurity Program | | T.O. Plastics | T.O. Plastics, Inc. |
LSAIRP | Lignite Sales AgreementIntegrated Resource Plan | | TCR | Transmission Cost Recovery Rider |
MerricourtITCs | Merricourt Wind Energy CenterInvestment Tax Credits | | TSR | Total Shareholder Return |
VaristarkV | Varistar CorporationkiloVolt | | VIE | Variable Interest Entity |
MISOkW | Midcontinent Independent System Operator, Inc.kiloWatt | | Vinyltech | Vinyltech Corporation |
| MNCIP | Minnesota Conservation Improvement Program | | |
| | | | |
| | | | | | | | |
| WHERE TO FIND MORE INFORMATION | | |
We make available free of charge at our website (www.ottertail.com) our annual reports on Form 10-K, quarterly reports on Form 10-Q, current reports on Form 8-K, proxy and information statements, Forms 3, 4 and 5 filed on behalf of directors and executive officers and any amendments to these reports filed or furnished pursuant to Section 13(a) or 15(d) of the Securities Exchange Act of 1934, as soon as reasonably practicable after such material is electronically filed with or furnished to the Securities and Exchange Commission (SEC). These reports are also available on the SEC's website (www.sec.gov). Information on our and the SEC's websites is not deemed to be incorporated by reference into this report on Form 10-K. | | |
| FORWARD-LOOKING INFORMATION |
This report on Form 10-K contains forward-looking statements within the meaning of the Private Securities Litigation Reform Act of 1995 (the Act)PSLRA). When used in this Form 10-K and in future filings by the Company with the SEC, in the Company’s press releases and in oral statements, words such as “anticipate,” “believe,” “could,"can,"“could,” “estimate,” “expect,” "future," "goal," “intend,” "likely," “may,” “outlook,” “plan,” “possible,” “potential,” "predict," "probable," "projected ," “should,” "target," “will,” “would” or similar expressions are intended to identify forward-looking statements within the meaning of the Act.PSLRA. Such statements are based on current expectations and assumptions and entail various risks and uncertainties that could cause actual results to differ materially from those expressed in such forward-looking statements. Such risks and uncertainties include the various factors set forth in Item 1A. Risk Factors of this report on Form 10-K and in our other SEC filings.
PART I
Otter Tail Corporation (OTC) has interests in diversified operations that include an electric utility and manufacturing and plastic pipe businesses with corporate offices located in Fergus Falls, Minnesota and Fargo, North Dakota.
We classify our five operating companies into three reportable segments consistent with our business strategy and management.management structure. The following table depicts our three segments and the subsidiary entities included within each segment:
| | | | | | | | | | | | | | |
| ELECTRIC SEGMENT | | MANUFACTURING SEGMENT | | PLASTICS SEGMENT |
| Otter Tail Power Company (OTP) | | BTD Manufacturing, Inc. (BTD) | | Northern Pipe Products, Inc. (Northern Pipe) |
| | T.O. Plastics, Inc. (T.O. Plastics) | | Vinyltech Corporation (Vinyltech) |
Electric includes the generation, purchase, transmission, distribution and sale of electric energy in western Minnesota, eastern North Dakota and northeastern South Dakota. OTP,Otter Tail Power (OTP), our largest operating subsidiary and primary business since 1907, serves more than 133,000 customers in 422more than 400 communities across a predominantly rural and agricultural service territory.
Manufacturing consists of businesses engaged in the following manufacturing activities: contract machining; metal parts stamping,stamping; fabrication and painting; and production of plastic thermoformed horticultural containers, life science and industrial packaging, material handling components and extruded raw material stock. These businesses have manufacturing facilities in Georgia, Illinois and Minnesota and sell products primarily in the United States.
Plastics consists of businesses producing polyvinyl chloride (PVC) pipe at plants in North Dakota and Arizona. The PVC pipe is sold primarily in the western half of the United States and Canada.
Throughout the remainder of this report, we use the terms "Company", "us", "our", or "we" to refer to Otter Tail CorporationOTC and its subsidiaries collectively. We will also refer to our Electric, Manufacturing and Plastics segments and our individual subsidiaries as indicated above.
INVESTMENT AND GROWTH STRATEGY
We maintain a moderate risk profile by investing in rate base growth opportunities in our Electric segment and organic growth opportunities in our Manufacturing and Plastics segments.segments (collectively, our manufacturing platform). This strategy and risk profile are designed to provide a more predictable and growing earnings stream, maintainsupport quality credit ratings, and provide for dividend payments.
Our long-term focus remains on executing our credit qualitystrategy to grow our business and preserveachieving operational, commercial and talent excellence to strengthen our ability to fund our dividend.position in the markets we serve. Our goal is to deliverlong-term financial objectives include achieving a compounded annual growth rate in earnings per share between fivein the range of 5 - 7%, with a long-term earnings mix of approximately 65% from our Electric segment and seven percent over35% from our manufacturing platform. We also are targeting an annual increase in our dividend to be in the next several years, using 2020 diluted earnings per share as the base for measurement.range of 5 - 7%. We expect our earnings growth and cash flow generation to come frombe driven by rate base investments in our Electric segment and from planned earnings growth arising from existing capacities and planned investments within our Manufacturing and Plastics segments.
Over the past three years, we delivered earnings growth well in excess of our 5 - 7% target due to unique industry conditions within the PVC pipe industry, which led to extraordinary revenue, earnings and cash flow growth in our Plastics Segment. We expect these industry conditions to gradually normalize over the course of 2024 and into 2025. As they do, we expect earnings and cash flow generation within our Plastics segment to moderate from current levels. Once these industry conditions have normalized, we expect to achieve our long-term financial objectives as outlined above.
We will continue to review our business portfolio to identify additional opportunities to improve our risk profile, enhance our credit metrics and generate additional sources of cash to support the organic growth opportunities in our electric utility.Electric, Manufacturing, and Plastics segments. We will also evaluate opportunities to allocate capital to potential acquisitions withinacquisitions. We are a committed long-term owner and do not acquire companies in pursuit of short-term gains. However, we will divest of businesses which no longer fit into our Manufacturingstrategy and Plastics segments.risk profile over the long term.
We maintain a set of criteria used in evaluating the strategic fit of our operating businesses. The operating company should:
•Maintain a minimum level of net earnings and a return on invested capital in excess of the Company’s weighted averageweighted-average cost of capital,
•Have a strategic differentiation from competitors and a sustainable cost advantage,
•Operate within a stable and growing industry and be able to quickly adapt to changing economic cycles, and
•Have a strong management team committed to operational and commercial excellence.
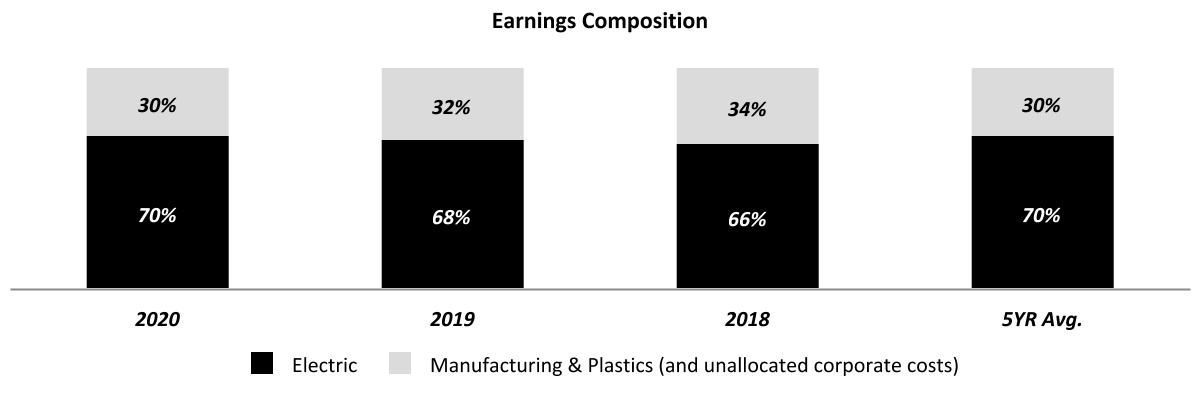
Over time, we expect our Electric segment will provide approximately 75% of our overall earnings and our Manufacturing and Plastics segments will collectively provide approximately 25% of our overall earnings and continue to be a fundamental part of our strategy.
Our actual mix of earnings in 2020, 2019, 2018and the average for the five-year periodyears ended December 31, 2020 is2023, 2022 and 2021 was as follows:
HUMAN CAPITAL
Our employees are a critical resource and an integral part of our success. We strive to provide an environment of opportunity and accountability where people are valued and empowered to do their best work. We are focused on the health and safety of our employees and creating a culture of inclusion, excellence and learning. Our human capital management efforts include monitoringlearning, and our executive annual incentive plan reflects those commitments. We monitor various metrics and objectives associated with i) employee safety, ii) workforce stability, iii) management and workforce demographics, including gender, racial and ethnic diversity, iv) leadership development and succession planning and v) productivity. We have established the following programs in furtherance of these efforts:
•Safety -Safety is one of our core values. We engageIn managing our business, we focus on the safety of our employees and have implemented safety programs and management practices to promote a third party to conduct conformity assessments annually.culture of safety. Safety is also a metric used and evaluated in determining annual incentive compensation. We continually monitor the Occupational Safety and Health Administration Total Recordable Incident Rate (number of work-related injuries per 100 employees for a one-year period) and Lost Time Incident Rate.Rate (number of employees who lost time due to work-related injuries per 100 employees for a one-year period). New cases are reported and evaluated for corrective action during monthly safety callsmeetings attended by safety professionals at all locations. Our 2023 Total Recordable Incident Rate was 1.70, compared to 2.08 in 2022 and our Lost Time Incident Rate was 0.53 in 2023, compared to 0.49 in 2022.
•Employee and Leadership Development, Succession Planning and Training Programs - We extend leadershipinvest in training and professional development intofor various levels of employees, management and leaders throughout the organizationCompany to ensure all have the necessary training and skills to perform their work well, and to build enterprise-wide understanding of our culture, strategy and processes. Annual succession planning, individual development planning, mentoring, and supervisory and leadership development programs all play a role in ensuring a capable leadership team now and in the future. Our skill progression and technical training programs help ensure we haveto retain a skilledstable and stableskilled workforce.
•Workforce Stability - Recruiting, retaining and developing employees is an important factor in our continued success and growth. We regularly evaluate our recruiting programs, employee retention and turnover rates.
Employee Engagement - To enhance productivity and employee engagement,the effectiveness of our workforce and to help our companies continue to be places where our employees choose to work and thrive, we have undertaken a multi-year series of employee engagement surveys. We use the feedback to help shape the futureemployee programs of our organization.
•Human Rights - We are committed to the protection of our employee’s freedom of expression and freedom of organization and assembly.
Diversity, Equity, and Inclusion -We communicate annuallyexpect, and are committed to, diversity, equity and inclusion as part of who we are, what we value, and how we achieve individual, business and community success. We hold every employee accountable for their behavior in maintaining a workplace free of discrimination and harassment. We have implemented education initiatives for all employees, aimed at inclusive leadership and a respectful workplace, focused on identities and culture, unconscious bias, the power of diverse teams and culturally sensitive conversations. We have implemented initiatives to improve upon our demographic profile, including revised hiring processes and a commitment to diverse slates of interview candidates.
Code of ConductBusiness Ethics -We require employees to help ensure understandingcomplete training on several topics associated with our code of the common principlesbusiness ethics to reinforce our commitment to compliance with laws, regulations and values that guide who we are and how we do business.
Across our operating companies and including our corporate team as
As of December 31, 2020,2023, we employed 2,0742,655 full-time employees:employees as shown in the table below:
| | | | | |
| Segment/Organization | Employees |
| |
| Electric Segment | |
OTP(1) | 790 | | 647 |
| Manufacturing Segment | |
| BTD | 1,0471,458 | |
| T.O. Plastics | 163192 | |
| Segment Total | 1,2101,650 | |
| Plastics Segment | |
| Northern Pipe | 10098 | |
| Vinyltech | 7980 | |
| Segment Total | 179178 | |
| Corporate | 3837 | |
| Total | 2,0742,655 | |
(1) Includes all full-time employees of Otter Tail Power Company, including employees working at jointly owned facilities. Labor costs associated with employees working at jointly owned facilities are allocated to each of the co-owners based on their ownership interest. | |
At December 31, 2020, 3722023, 378 employees of OTP arewere represented by local unions of the International Brotherhood of Electrical Workers under two separate collective bargaining agreements expiring on August 31, 20232026 and October 31, 2023.2026. OTP has not experienced any strike, work stoppage or strike vote, and considers its present relations with employees to be good.
None of the employees of our other operating companies are represented by local unions.
| | | | | | | | | | | |
| % Female | | % Racially and Ethnically Diverse |
| | | |
| Board of Directors | 36 | % | | 9 | % |
| CEO Direct Reports | 33 | % | | — | % |
| Management | 21 | % | | 4 | % |
| Non-Management Employees | 15 | % | | 15 | % |
| | | |
| | | | | |
| ELECTRIC | Contribution to Operating Revenues: 50% (2020)39% (2023), 50% (2019)38% (2022), 49% (2018)40% (2021) |
OTP, headquartered in Fergus Falls, Minnesota, is a vertically integrated, regulated utility with generation, transmission and distribution facilities to serve its more than 133,000 residential, industrialcommercial and commercialindustrial customers in a service area encompassing approximately 70,000 square miles of western Minnesota, eastern North Dakota and northeastern South Dakota.
CUSTOMERS
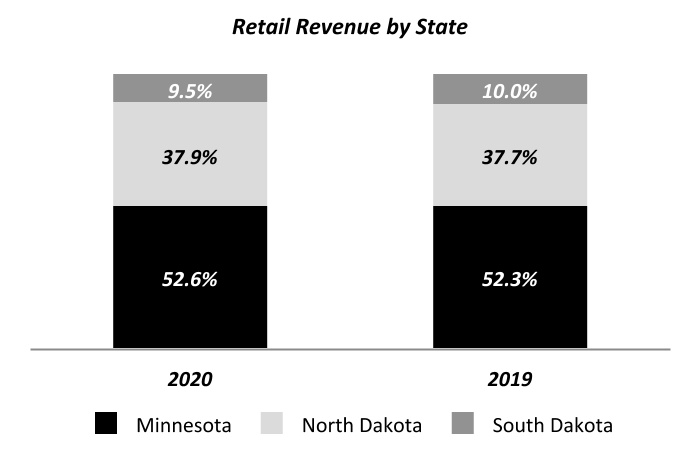
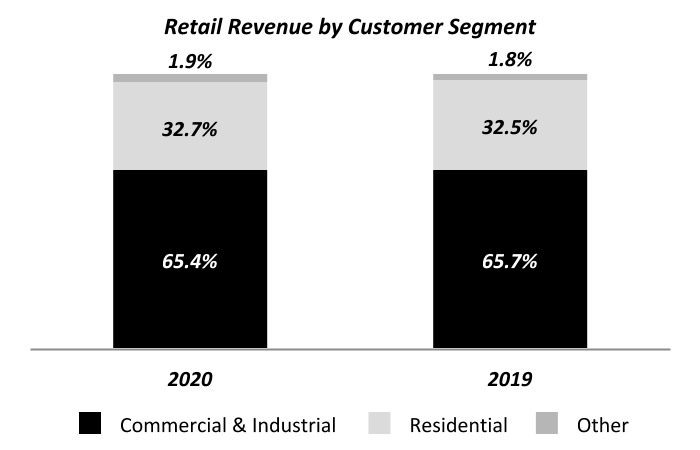
Our service territory is predominantly rural and agricultural and includes over 400 communities, most of which have populations of less than 10,000. While our customer base includes relatively few large customers, sales to commercial and industrial customers are significant, with one industrial customertwo customers accounting for 11%21% of segment operating revenues for the year ended December 31, 2020.2023 and 16% for the year ended December 31, 2022.
The following summarizescharts summarize our retail electric revenues by state and by customer segment for the years ended December 31, 20202023 and 2019:2022:
In addition to retail revenue, our Electric segment also earnsgenerates operating revenues from the transmission of electricity for others over the transmission assets we wholly or jointly own with other transmission service providers, and from the sale of electricity we generate and sell into the wholesale electricity market.
COMPETITIVE CONDITIONS
Retail electric sales are made to customers in assigned service territories. As a result, most retail customers do not have the ability to choose their electric supplier. Competition is present in some areas from municipally owned systems, rural electric cooperatives and, in certain respects, from on-site generators and co-generators. Electricity also competes with other forms of energy.
The degree of competition may vary from time to time depending on relative costs and supplies of other forms of energy and advances in technology; however, we believe OTP is well positioned to be successful in a competitive environment. A comparison of OTP's electric retail rates to the rates of other investor-owned utilities, cooperatives and municipals in the states OTP serves indicates OTP's rates are competitive.
Competition also arises from customers supplying their own power through distributed generation, which is the generation of electricity on-site or close to where it is needed in small facilities designed to meet local needs. Distributed energy resources are utility- or customer-owned resources on the distribution grid that can include combined heat and power, solar photovoltaic, wind, battery storage, thermal storage and demand-response technologies.
The degree of competition may vary from time to time depending on relative costs and supplies of other forms of energy and advances in technology. Irrespective of the competitive environment, we are focused on providing value to our customers and ensuring our retail rates remain among the lowest in the region and in the nation.
The following table presents our average retail rate per kilowatt-hour (kwh) by customer class and in total for the years ended December 31, 2023 and 2022:
| | | | | | | | | | | |
| Revenue per kwh | 2023 | | 2022 |
| | | |
| Residential | 10.82 | ¢ | | 10.99 | ¢ |
| Commercial & Industrial | 7.02 | ¢ | | 7.54 | ¢ |
| Total Retail | 7.90 | ¢ | | 8.41 | ¢ |
Wholesale electricity markets are competitive under the FERC'sFederal Energy Regulatory Commission (FERC) open access transmission tariffs, which require utilities to provide nondiscriminatory access to all wholesale users. In addition, the FERC has established a competitive process for the construction and operation of certain new electric transmission facilities whereby electricunder federal regulation. Certain states have laws which provide the incumbent transmission providers, includingowner the Midcontinent Independent System Operator, Inc. (MISO), of which OTP is a member, are required to remove from their tariffs a federal right of first refusal to construct and own new transmission facilities selected in a regional transmission plan for purposes of cost allocation.
Franchisesfacilities.
OTP has franchises to operate as an electric utility in substantially all of the incorporated municipalities it serves. Franchise rights generally require periodic renewal. No franchises are required to serve unincorporated communities in any of the three states that OTP serves.
GENERATION AND PURCHASED POWER
OTP primarily relies on company-owned generation, supplemented by power purchase power agreements, to supply the energy to meet our customer needs. Wholesale market purchases and sales of electricity are used as necessary to balance supply and demand. Our mix of owned generation and wholesale market energy purchases to meet customer demand as seasonal or other variations occur.are impacted by wholesale energy prices and the relative cost of each energy source.
As of December 31, 2020,2023, OTP’s wholly or jointly owned plants and facilities, as well as in place power purchase agreements, and their dependable kilowatt (kW) capacity was:were: | | | | | | | | |
| | Capacity /
Purchased Power
in kW |
| | |
| Owned Generation: | | |
| Baseload Plants | | |
Big Stone Plant(1) | | 256,000256,900 | |
Coyote Station(2) | | 149,000148,400 | |
Hoot Lake Plant | | 143,100 | |
Total Baseload Net PlantPlants | | 548,100405,300 | |
| Combustion Turbine and Small Diesel Units | | |
| Astoria Station | | 107,900249,700 | |
Hydroelectric FacilitiesAll Other | | 2,500102,800 | |
| Total Combustion Turbine and Small Diesel Units | | 352,500 | |
| Owned Wind Facilities (rated at nameplate) | | |
Merricourt Wind Energy Center (75 turbines) | | 150,000 | |
| Ashtabula III | | Luverne Wind Farm (33 turbines)62,400 | |
| Luverne | | 49,500 | |
Ashtabula Wind Center (32 turbines) | | 48,000 | |
Langdon Wind Center (27 turbines) | | 40,500 | |
| Total Owned Wind Facilities | | 288,000350,400 | |
TotalHoot Lake Solar | | 946,50049,900 | |
(1) Hydroelectric Facilities
| | 2,600Reflects OTP's 53.9% ownership percentage of jointly-owned facility | | |
(2) Total Owned Generation Capacity
| | 1,160,700Reflects OTP's 35.0% ownership percentage of jointly-owned facility | | |
In addition to the owned facilities described above, OTP had the following purchased power agreements in place on December 31, 2020:
| | | | | |
| Power Purchase Agreements: | | Purchased Power
in kW
| |
| Purchased Wind Power (rated at nameplate and greater than 2,000 kW) | |
Ashtabula Wind III | 62,400 | |
| Edgeley | | 21,000 | |
| Langdon | | 19,500 | |
| Total Purchased Wind | | 102,90040,500 | |
Purchase ofTotal Generating Capacity (in excess of 1 year and 500 kW) | |
Great River Energy (through May 2021)
| 50,0001,201,200 | |
| | |
(1) Reflects OTP's 53.9% ownership percentage of jointly owned facility. | | |
(2) Reflects OTP's 35.0% ownership percentage of jointly owned facility. | | |
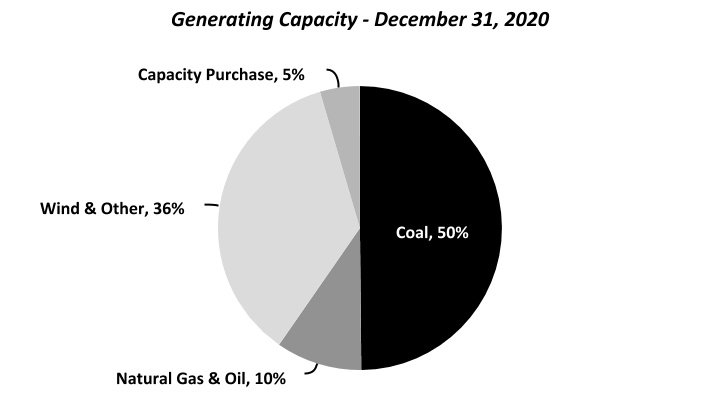
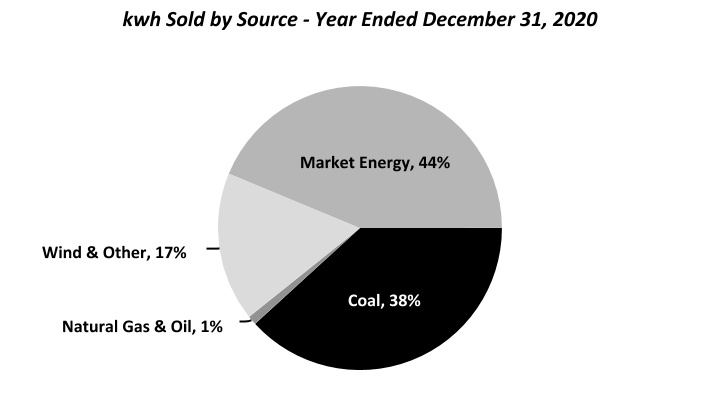
The following summarizescharts summarize the percentage of our generating capacity by source, including owned and jointly-ownedjointly owned facilities and through power and capacity purchase arrangements, as of December 31, 2020,2023 and the percentage of retail kilowatt-hours (kwh) sold by source during the year ended December 31, 2020:2022:
Under MISOMidcontinent Independent System Operator (MISO) requirements, OTP is required to haveprovide sufficient capacity through wholly or jointly-ownedjointly owned generating capacity or purchased power purchase agreements to meet its monthly weather-normalized forecast demand, plus a reserve obligation. OTP met its obligation forMISO operates under a seasonal resource adequacy construct in which generation resources are accredited and planning reserve margin requirements are implemented on a seasonal basis. Current planning reserve margin requirements range between 7.4% and 25.5%, depending on the 2019-2020 planning year and anticipates meeting this obligation prospectively.season.
The following charts summarize the percentage of retail kwh sold by source during the years ended December 31, 2023 and 2022:
Capacity Retirements and Additions
Hoot Lake Plant, our 142-meagwatt coal-fired power plant in Fergus Falls, Minnesota is approved for retirement in mid-2021.
As part of our investment plan to meet our future energy needs, we have the following projects at various stages of planning and construction or have been recently completed:undertaken, completed, or acquired:
MerricourtAshtabula III Wind Energy Center (Merricourt)Farm is a 150-megawatt62-megawatt (MW) wind farm located in southeasterneastern North Dakota. ConstructionThe facility was purchased for approximately $50 million in January 2023. Prior to the purchase of the wind farm commenced in 2019 andassets, we were purchasing the facility was in commercial operation in December 2020 atwind-generated electricity from the wind farm pursuant to a cost of approximately $260.0 million.
Astoria Station Natural Gas Plant (Astoria) is a 245-megawatt simple cycle natural gas combustion turbine generation facility near Astoria, South Dakota. Construction began in 2019 and we anticipate the facility will be substantially complete in the first quarter of 2021. We anticipate total project costs will be $152.5 million.power purchase agreement.
Hoot Lake Plant Solar (HLP Solar) is a 49-megawatt49-MW solar farm under development on landconstructed on and around our Hoot Lake Plant property in Fergus Falls, Minnesota. The project will include up to 150,000 solar panels at an anticipatedMinnesota, with a total cost of $60.0approximately $60 million. The facility was placed into commercial operation in August 2023.
Wind Energy Facility Upgrades consisting of the replacement and upgrade of hubs, gearboxes, blades, generators and other components of our Ashtabula, Ashtabula III, Langdon and Luverne wind facilities at a total cost of approximately $230 million. Once complete, we expect the increased energy production from these facilities will be equivalent to an additional 40-MW of generation. We anticipate subject to permitting and regulatory approval, the repowering of our Langdon facility will be completed in commercial operation no later2024 and the remaining facilities to be completed in 2025. Once complete, the energy production from each of these facilities is eligible for production tax credits (PTCs) over a ten-year period. We expect these projects will lower customer costs through a combination of fuel savings and the tax credit benefits afforded to our customers.
ENERGY TRANSITION
OTP is committed to transitioning to a lower-carbon and increasingly clean energy future, while maintaining affordable and reliable electricity to serve our customers. We have developed the following goals in furtherance of our efforts to support the energy transition:
Own or purchase energy generation that is 55% renewable by 2030.
Reduce carbon emissions from owned generation resources 50% by 2030 from 2005 levels.
Reduce carbon emissions from owned generation resources 97% by 2050 from 2005 levels.
We have based these goals on our December 2023 supplemental Integrated Resource Plan (IRP) filing in Minnesota. While modified from our previously published goals, they reflect current market conditions, including the impact of higher natural gas prices, and higher than originally forecasted dispatch levels of our co-owned, coal-fired power plants.
We have undertaken numerous initiatives to reduce our carbon footprint and mitigate greenhouse gas (GHG) emissions in the endprocess of 2023.generating electricity for our customers. Our recent initiatives include retiring the 140-MW coal-fired Hoot Lake Plant, adding the 150-MW Merricourt Wind Energy Center and the 49-MW Hoot Lake Solar facility to our resource mix and sponsoring energy conservation programs. We anticipate our Minnesota retail sales will be 80% carbon free by 2030, in compliance with Minnesota clean energy requirements.
From 2005 through 2023, we have reduced our carbon dioxide (CO2) emissions approximately 39% and increased the amount of renewable generation resources we own or purchase through power purchase agreements by approximately 420-MW. We currently own or contract energy generation that is 37% renewable.
The following chart depicts our energy resource mix, which is the electricity we used to serve our customers in 2005 and 2023, and the projected mix in 2030 and 2050. The amounts include energy generated from owned resources, procured through power purchase agreements and energy purchased in the wholesale market:
RESOURCE MATERIALS
Coal is the principal fuel burned at our jointly owned Big Stone and Coyote and Hoot LakeStation generating plants. Coyote Station, a mine-mouth facility, burns North Dakota lignite coal. Hoot Lake Plant and Big Stone Plant burnburns western subbituminous coal transported by rail. We source coal for our coal-fired power plants through requirements contracts which do not include minimum purchase requirements but do require all coal necessary for the operation of the respective plant to be purchased from the counterparty. Our coal supply contracts for our Hoot Lake Plant, Big Stone Plant and Coyote Station have expiration dates in 2023, 20222024 and 2040, respectively.
The supply agreement between the Coyote Station owners, including OTP, and the coal supplier includes provisions requiring the Coyote Station owners to purchase the membership interests and pay off or assume loan and lease obligations of the coal supplier, as well as complete mine closing and post-mining reclamation, in the event of certain early termination events and at the expiration of the coal supply agreement in 2040. See below and Note 1 to our consolidated financial statements included in this report on Form 10-K for additional information.
Coal is transported to our non-mine-mouth facilities, Big Stone Plant and Hoot Lake Plant by rail and is provided under a common carrier rate which includes a mileage-based fuel surcharge.
We purchase natural gas for use at our combustion turbine facilities based on anticipated short-term resource needs. We procure natural gas from multiple vendors at spot prices in a liquid market primarily under firm delivery contracts.
TRANSMISSION AND DISTRIBUTION
Our transmission and distribution assets deliver energy from energy generation sources to our customers. In addition, we earn revenue from the transmission of electricity over our wholly or jointly owned transmission assets for others under approved rate tariffs. As of December 31, 2020,2023, we were the wholesole or partialjoint owner of over 8,900approximately 14,000 miles of transmission and distribution lines.
Midcontinent Independent System Operator Inc. (MISO)
MISO is an independent, non-profit organization that operates the transmission facilities owned by other entities, including OTP, within its regional jurisdiction and administers energy and generation capacity markets. MISO has operational control of our transmission facilities above 100 kV.kilovolts (kV). MISO seeks to optimize the efficiency of the interconnected system, provide solutions to regional planning needs and minimize risk to reliability through its security coordination, long-term regional planning, market monitoring, scheduling and tariff administration functions.
Transmission Additions
In 2022, MISO approved several projects within the first tranche of its long-range transmission plan, which includes two new 345 kV transmission projects. OTP will have a varying level of ownership interest in these projects, which will be completed over several years and are at various stages of planning and development:
Jamestown-Ellendale includes the construction of a new 345 kV transmission line in southeastern North Dakota spanning approximately 95 miles from Jamestown, North Dakota to Ellendale, North Dakota. This project is in the initial stages of planning and development. This jointly owned project is expected to be completed in 2028 and our capital investment is estimated to be approximately $230 million.
Big Stone South-Alexandria-Big Oaks includes the construction of a new 345 kV transmission line in eastern South Dakota and western Minnesota and the addition of a second circuit to an existing 345 kV line in central Minnesota. The new transmission line will span approximately 100 miles between Big Stone, South Dakota and Alexandria, Minnesota. A second circuit will be added to the existing transmission line spanning from Alexandria, Minnesota to Big Oaks, Minnesota. This project is in the initial stages of planning and development. This jointly owned project is expected to be completed in 2031 and our capital investment is estimated to be approximately $190 million.
SEASONALITY
Electricity demand is affected by seasonal weather differences, with peak demand occurring in the summer and winter months. As a result, our Electric segment operating results mayregularly fluctuate on a seasonal basis. In addition, fluctuations in electricity demand within the same season but
between years can impact our operating results. We monitor the level of heating and cooling degree days in a period to assess the impact of weather-related effects on our operating results between periods.
PUBLIC UTILITY REGULATION
OTP is subject to regulation of rates and other matters in each of the three states in which it operates and by the federal government for, certainamong other matters, the interstate operations.transmission of electricity. OTP operates under approved retail electric tariff rates in all three states it serves. Tariff rates are designed to recover plant investments, a return on those investments, and operating costs. In addition to determining rate tariffs, state regulatory commissions also authorize ROE,return on equity (ROE), capital structure, and depreciation rates of our plant investments. Decisions by our regulators can significantly impact our operating results, financial position, and cash flows.
Below is a summary of the regulatory agencies with jurisdiction of electric rates over OTP along with the percentage of electric revenue for the year ended December 31, 2020 covered by each regulatory agency:
| | | | | | | | | | | | | | |
| Regulatory | | | % of | |
| Agency | | | Revenue | Areas of Regulation |
| | | | |
Minnesota Public Utilities Commission
(MPUC)
| | | 47% | Retail rates, issuance of securities, depreciation rates, capital structure, public utility services, construction of major facilities, establishment of exclusive assigned service areas, contracts with subsidiaries and other affiliated interests and other matters. Selection or designation of sites for new generating plants (50,000 kW or more) and routes for transmission lines (100 kV or more). Review and approval of fifteen-year Integrated Resource Plan. |
North Dakota Public Service Commission
(NDPSC) | | | 34% | Retail rates, certain issuances of securities, construction of major utility facilities and other matters. Approval of site and routes for new electric generating facilities (500(>500 kW or more for wind generating facilities; 50,000>50,000 kW for non-wind generating facilities) and high voltage transmission lines (115 kV or more)(>115 kV). Review and approval of ten-year facility plan.fifteen-year Integrated Resource Plan. |
South Dakota Public Utilities Commission
(SDPUC) | | | 9% | Retail rates, public utility services, construction of major facilities, establishment of assigned service areas and other matters. Approval of sites and routes for new electric generating facilities (100,000 kW or more) and most transmission lines (115 kV or more). |
Federal Energy Regulatory Commission
(FERC) | | | 10% | Wholesale electricity sales, transmission and sale of electric energy in interstate commerce, interconnection of facilities, hyrdoelectrichydroelectric licensing and accounting policies and practices. Compliance with NERCNorth American Electric Reliability Corporation (NERC) reliability standards, including standards on cybersecurity and protection of critical infrastructure. |
In addition to base rates, which are established through periodic rate case proceedings within each state jurisdiction, there are other mechanisms for recovery of plantour capital investments including a return on investment, and operating expenses.expenses between rate cases. The following is a summary oftable summarizes these recovery mechanisms:
| | | | | | | | | | | | | | |
| Recovery Mechanism | | Jurisdiction(s) | | Additional Information |
| | | | |
| Fuel Clause Adjustment (FCA) | | MN, ND, SD | | Provides for periodic billing adjustments for changes in prudently incurred costs of fuel and purchased power. In North and South Dakota, fuel and purchased power costs are generally adjusted on a monthly basis with over or under collections from the previous month applied to the next monthly billing.basis. In Minnesota, fuel and purchased power costs are estimated on an annual basis and the accumulated difference between actual and estimated cost per kwh areis refunded or recovered, subject to regulatory approval, in subsequent periods. |
| Transmission Cost Recovery Rider (TCR) | | MN, ND, SD | | Provides for the recovery of costs outside of a general rate case for investments in new or modified electric transmission or distribution assets. |
Environmental Cost Recovery Rider (ECR) | | MN, ND, SD | | Provides for recovery of costs outside of a general rate case for investments inassets and certain environmental improvement projects.MISO transmission service and related costs. |
| Renewable Resource Rider (RRR) | | MN, ND | | Provides for the recovery of costs outside of a general rate case for investments in certain new renewable energy projects. |
| Energy Conservation and Optimization Rider (ECO) | | MN | | Under Minnesota law, OTP is required to save 1.75% of its gross retail energy revenues through the energy conservation and optimization program. Recovery of these costs outside of a general rate case occurs through the ECO rider. |
| Electric Utility Infrastructure Costs Rider (EUIC) | | MN | | Provides for the recovery of costs for investments made to replace or modify existing infrastructure if the replacement or modification conserves energy or uses energy more efficiently. |
| Metering and Distribution Technology Cost Recovery Rider (MDT) | | ND | | Provides for the recovery of costs for advanced metering infrastructure, outage management systems and demand response projects. |
| Generation Cost Recovery Rider (GCR) | | ND | | Provides for the recovery of costs outside of a general rate case for investments in new generation facilities. |
| Energy Efficiency Plan (EEP) | | SD | | Provides for the recovery of costs from energy efficiency investments. |
| Phase-In Rider (PIR) | | SD | | Provides for the recovery of costs outside of a general rate case for investments in new generation facilities. |
Conservation Improvement Program (CIP) | | MN | | Under Minnesota law, OTP is required to invest at least 1.5% of its gross operating revenues on energy conservation improvements. Recovery of these costs outside of a general rate case occurs through the CIP. |
Energy Efficiency Plan (EEP) | | SD | | Provides for the recovery of costs from energy efficiency investments.facilities and advanced grid infrastructure. |
Renewable Energy Standard
Minnesota has a renewable energy standard requiring utilities to generate or procure sufficient renewable generation such that the following percentages of total retail electric sales to Minnesota customers come from qualifying renewable sources: 17% by 2016; 20% by 2020 and 25% by 2025. We met the current renewable sources requirements with a combination of owned renewable generation and purchases from renewable generation sources. Minnesota law also requires 1.5% of total Minnesota electric sales by public utilities to be supplied by solar energy by 2020. For a public utility with between 50,000 and 200,000 retail electric customers, such as OTP, at least 10% of the 1.5% requirement must be met by solar energy generated by or procured from solar photovoltaic devices with a nameplate capacity of 40 kWs or less. OTP has purchased sufficient solar renewable energy credits (SRECs) to meet 100% of its 2020 obligation and approximately 70% of its 2021 obligation.
Under certain circumstances and after consideration of costs and reliability issues, the MPUC may modify or delay implementation of the standards. We are evaluating potential options for maintaining compliance and meeting the solar energy standard beyond 2021.
Integrated Resource Plan (IRP)Planning
Under Minnesota law, utilities are required to submit for approval by the MPUCMinnesota Public Utilities Commission (MPUC) a 15-year advance IRP.Integrated Resource Plan (IRP). An IRP is a set of resource options a utility could use to meet the service needs of its customers over the forecast period, including an explanation of the utility’s supply and demand circumstances, and the extent to which each resource option would be used to meet those service needs. The MPUC’s findings of fact and conclusions regarding IRPs are considered to be prima facie evidence, subject to rebuttal, in future rate reviews and other proceedings. Typically, IRPs are submitted every two years.
On April 26, 2017In 2021, the MPUC approved OTP’s 2017-2031North Dakota Legislative Assembly enacted a provision requiring investor-owned electric utilities to submit an IRP filing with modificationsto the North Dakota Public Service Commission (NDPSC) and setting requirementsgranted the NDPSC the authority to adopt rules and regulations for the next IRP.preparation and submission of IRPs. The approvedNDPSC's rules and regulations were finalized and became effective on January 1, 2023. Under the finalized regulation, utilities are required to submit a 15-year advance IRP with modifications included the following items:every three years.
•The addition of 200 MW of wind resources in the 2018 to 2020 timeframe.
•The addition of 30 MW of solar resources by 2020 to comply with Minnesota's Solar Energy Standard.
•The addition of up to 250 MW of peaking capacity in 2021.
•Average annual energy savings of 46.8 gigawatt-hours (1.6% of retail sales).
•The addition of 100 MW to 200 MW of wind resources in the 2022 to 2023 timeframe.
The MPUC has granted us an extension for filing our next IRP to September 1, 2021. The extension provides additional time to assess the potential impact of two key Environmental Protection Agency (EPA) regulations: the federal Regional Haze Rule (RHR) and the Affordable Clean Energy (ACE) Rule. In connection with the extension, OTP made a supplemental filing on December 31, 2020 summarizing the results of scenario modeling evaluating RHR compliance cost options and a Coyote Station 2028 retirement scenario. The filing indicated, when modeled with externalities, that capital investments in additional environmental controls at Coyote Station does not result in the lowest-cost mix of resources for our customers. This IRP supplemental filing includes only a subset of our resource planning analysis and it is not conclusive. In addition, we cannot conclude how RHR will impact Coyote Station as key milestones remain in developing the state implementation plan in North Dakota. Finally, OTP is one of four partners in Coyote Station and cannot make a unilateral decision on its future. We expect to have more definitive information about the most cost-effective resource mix to meet customer needs when the next IRP is filed on September 1, 2021.
Capital Structure Petition
Minnesota law requires an annual filing of a capital structure petition with the MPUC. In this filing the MPUC reviews and approves OTP's capital structure. Once approved, OTP may issue securities without further petition or approval, provided the issuance is consistent with the purposes and amounts set forth in the approved petition. The MPUC approved OTP’s most recentcurrent capital structure petitionapproved by the MPUC on July 15, 2020, allowingAugust 29, 2023, allows for an equity-to-total-capitalization ratio between 47.5%48.3% and 58.1%59.1%, with total capitalization not to exceed $1.70 billion until$1.958 billion.
Renewable Energy Standard
Minnesota has a renewable energy standard requiring utilities to generate or procure sufficient renewable generation such that the following percentages of total retail electric sales to Minnesota customers come from qualifying renewable sources: 25% by 2025 and 55% by 2035. Qualifying renewable sources are classified as wind, hydropower, hydrogen, and certain biomass generation. We met the current renewable sources requirements with a combination of owned renewable generation and purchases from renewable generation sources. Minnesota law also requires 1.5% of total Minnesota retail electric sales by public utilities to be supplied by solar energy. For a public utility with between 50,000 and 200,000 retail electric customers, such as OTP, at least 10% of the 1.5% requirement must be met by solar energy generated by or procured from solar photovoltaic devices with a nameplate capacity of 40 kW or less. We met the current solar requirement with a combination of owned solar generation and solar renewable energy certificate (REC) purchases. We plan to comply with the requirements of this standard in the future through a combination of our existing and projected renewable generation fleet and the purchase of RECs.
Minnesota Clean Energy Bill
In February 2023, Minnesota enacted the Clean Energy Bill, which requires electric utilities to generate or procure sufficient electricity from carbon-free resources, to provide retail customers in Minnesota with at least the following percentages of carbon-free electric energy: 80% by 2030, 90% by 2035, and 100% by 2040. Carbon-free resources include wind, solar, hydropower, and nuclear generation. To provide flexibility, the law allows electric utilities to use RECs to offset carbon emissions and for the MPUC issuesto consider whether a new capital structure order for 2021.regulated utility's requirement to meet established standards should be delayed due to affordability or reliability impacts. We expect to meet these requirements based on our existing and projected renewable generation fleet and the purchase of RECs.
ENVIRONMENTAL REGULATION
OTP is subject to stringent federal and state environmental standards and regulations regarding, among other things, air, water and solid waste pollution. OTP's facilities have been designed, constructed and, as necessary, updated to operate in compliance with applicable environmental regulations. However, new or amended laws and regulations or changes in interpretations of current laws and regulations may require additional pollution control equipment or emission reduction measures, and there can be no assurance that our facilities will remain economic to operate. Prudent expenditures incurred to comply with environmental regulations are eligible to be recovered in rates grantedauthorized by regulators in jurisdictions in which we operate; however, there can be no assurance that future costs will be grantedauthorized for recovery. Alternatively, additional pollution control equipment or other emission reduction measures may prove to be uneconomic, withpotentially leading to the potentialexiting of a facility earlier than originally planned. As it relates to leadour jointly owned facilities, we may determine it is necessary to antransfer, sell or otherwise divest of our ownership, or the ownership group may determine the early closure or repurposing of a facility.facility is necessary.
Financial Impacts
For the five-year period ended December 31, 2020,2023, OTP invested approximately $13.5$6.6 million including $0.4 million in 2020, in environmental control facilities. Our 2021 and 2022 construction budgets include approximatelyfacilities, including $1.4 million and $1.2in 2023. Our construction budget for the next five years includes approximately $7.5 million for such expenditures.of capital investments in environmental control equipment. The timing and amount of our expenditures may change as the regulatory environment changes.
Among current regulatory requirements,Emerging Regulation
The Environmental Protection Agency (EPA) adopted the Regional Haze Rule (RHR) could have the most significant impact on our operating results, financial condition and cash flows.
The EPA adopted the RHR in 1999 as an effort to improve visibility in national parks and wilderness areas. The RHR requires states, in coordination with the EPA and other governmental agencies, to develop and implement state implementation plans to(SIPs) that work towards achieving natural visibility conditions by the year 2064.2064; to set goals to ensure reasonable progress is being made; and periodically evaluate whether those goals and progress are on track or whether additional emission reductions are appropriate. The second RHR implementation period covers the years 2018-2028, with state implementation plans to be submitted to the EPA by July 31, 2021. States are required to assess reasonable progress with the RHR and determine what additional emission reductions are appropriate, if any. 2018-2028.
Coyote Station OTP's co-owned coal-fired power plant in North Dakota is subject to assessment in the second implementation period under the North Dakota state implementation plan.SIP for the RHR. The North Dakota Department of Environmental Quality (NDDEQ) submitted its proposed RHR SIP to the EPA for approval in August 2022. In its plan, the NDDEQ concluded it is not reasonable to require additional emission controls during this planning period. The EPA submitted comments during the development of the SIP requesting NDDEQ to reassess its determination for Coyote Station. See Note 13 to our consolidated financial statements included in the report on Form 10-K for additional information.
In April 2023, the EPA released a proposal to tighten aspects of the Mercury and Air Toxics Standards, including the reduction of emissions limits for filterable particulate matter, and requiring the use of continuous emissions monitoring systems to demonstrate compliance. Until the EPA takes final action on this rulemaking, we are unable to predict the ultimate impact, however, there could be a cost of compliance which could have a material impact on our operating results, financial condition and liquidity.
Climate Change and Greenhouse Gas Regulation
Present and future federal, state, regional and international environmental regulations to address globalGlobal climate change and reduce greenhouse gas (GHG) emissions may havepresents a significant impact on our utility business.energy and environmental policy challenge. Combustion of fossil fuels for the generation of electricity is a considerable source of CO2 emissions, which is the primary GHG emitted by our utility operations. The federal government and many states are pursuing climate policies to regulate GHG emissions as part of a broad-based effort to limit global warming.
RegulatoryIn February 2021, the U.S. rejoined the United Nations Framework Convention on Climate Change (the Paris Agreement), which is a legally binding international treaty on climate change adopted by over 190 countries. The goal of the Paris Agreement is to limit the global temperature increase to well below 2° Celsius compared to pre-industrial levels and to pursue efforts to limit the temperature increase to 1.5° Celsius. The Biden Administration set goals of reducing GHG emissions by 50% to 52% from 2005 levels in 2030 and reaching 100% carbon pollution-free electricity by 2035 as part of the U.S. plan to achieve the goals under the Paris Agreement.
In February 2023, Minnesota enacted the Clean Energy Bill, which requires electric utilities to generate or procure sufficient electricity from carbon-free resources to provide retail customers in Minnesota with at least the following percentages of carbon-free electric energy: 80% by 2030, 90% by 2035, and 100% by 2040.
The implementation of climate change programs, such as the Paris Agreement, the Minnesota Clean Energy Bill, and other federal or state regulations targeting GHG emissions may have a significant impact on our utility business. Specific regulatory measures to address climate change continue to evolve.
In May 2023, the EPA proposed new regulations under Section 111 of the Clean Air Act to regulate GHG emissions from existing and new fossil fuel-based electric generating units (EGU). The proposal provides requirements for different types of fossil fuel-based EGUs with various compliance dates.
•For existing coal-fired steam generating units that were in operation before January 2021,8, 2014 and that plan to operate past December 31, 2039, the EPA's Affordable Clean Energy Rule (ACE Rule) was vacatedproposal would (subject to certain exceptions) set emissions standards that reflect the use of carbon capture and sequestration (CCS) with 90% capture of CO2 emissions beginning in 2030.
•For existing coal-fired steam generating units that are scheduled to be retired between January 1, 2032 and December 31, 2039, the proposed rule would, in general, set emissions standards that reflect the use of co-firing 40% natural gas with coal beginning in 2030.
•For existing coal-fired steam generating units that will either (a) retire by January 1, 2032, or (b) retire between 2032 and December 21, 2034 and will operate at a 20% annual capacity factor limit in the U.S. Courtmeantime, the proposed rule would simply require routine maintenance and no increase in emission rate.
The proposal also includes emission standards for existing large (greater than 300 mega-watt), frequently used (those that operate at a capacity factor over 50%) natural gas combustion turbines, including which emission standard would reflect the use of Appeals forCCS by 2035 or co-firing with low-GHG hydrogen at incremental portions in 2032 (30% of volume) and 2038 (96% of volume). Under the District of Columbia Circuit and remandedproposed rule, each state must submit a plan to the EPA for further consideration. Future federal regulatory measures, including in response to implement standards that are at least as stringent as the vacatedEPA’s emission guidelines, unless states demonstrate that due to remaining useful life and other factors, a facility cannot reasonably achieve the standards. The EPA is proposing to require states to submit their plans within 24 months of the effective date of the final regulation. This proposed rule ACE Rule, will be impacted byhas the Biden administration's prioritiespotential to impact the emissions controls needed at OTP’s coal-fired power plants, which could have an impact on our operating results, financial condition and objectives. While the eventual outcome of GHG regulation is unknown, we are taking steps to reduce our carbon footprint and mitigate CO2 emission levels in the process of generating electricity for our customers. Our initiatives include increasing the efficiency of our plants, adding renewable energy to our resource mix, and sponsoring energy conservation programs.liquidity.
While the future financial impact of any current, proposed, or pending litigation or regulation of GHG or other emissions is unknown at this time, any capital or operating costs incurred for additional pollution control equipment or emission reduction measures could materially adversely impact our future operating results, financial position, and cash flowsliquidity unless such costs could be recovered through related rates and/or future market prices for energy.
| | | | | |
| MANUFACTURING | Contribution to Operating Revenues: 30% (2023), 27% (2020)(2022), 30% (2019), 29% (2018)28% (2021) |
Manufacturing consists of businesses engaged in the following activities: contract machining, metal parts stamping, fabrication and painting, and production of plastic thermoformed horticultural containers, life science and industrial packaging, and material handling components and extruded raw material stock. The following is a brief description of each of these businesses:
BTD Manufacturing, Inc. (BTD), with headquarters locatedfacilities in Detroit Lakes and Lakeville, Minnesota, Washington, Illinois and Dawsonville, Georgia, provides metal fabrication services for custom machine parts and metal components through metal stamping, tool and die, machining, tube bending, welding and assembly in its facilities in Detroit Lakes and Lakeville, Minnesota, Washington, Illinois and Dawsonville, Georgia.assembly.
T.O. Plastics, Inc. (T.O. Plastics), with facilities in Otsego and Clearwater, Minnesota, manufactures extruded and thermoformed plasticplastics products, including custom parts for customers in several industries and its own line of horticulture containers. Examples ofcontainers and custom packaging products produced include clamshell packing, blister packs, returnable palletsfor the medical and handling trays for shipping and storing odd-shaped or difficult-to-handle parts.industrial product markets.
CUSTOMERS
Our metal fabrication business primarily serves Midwestern and Southeastern U.S. manufacturers in the recreational vehicle, agricultural, oil and gas, lawn and garden, agricultural, construction, and industrial and energy equipment end markets. Our plastic products business serves primarily U.S. customers in the
horticulture, medical and life sciences, industrial, recreational and electronics industries. The principal method of production distribution is by direct shipment to our customers through direct customer pick-up or common carrier ground transportation.
No single customer or product of our manufacturingManufacturing segment businesses accounted for 10% or more of our consolidated operating revenuerevenues in 2020.2023. However, the top threetwo customers combined to account for 46%30% of our 2020 Manufacturing segment operating revenue.revenues for the year ended December 31, 2023 and 40% for the year ended December 31, 2022.
COMPETITIVE CONDITIONS
The various marketsWe compete in which we compete are characterized by intensea highly fragmented market with competition from both foreigndomestic and domestic manufacturers. Theseinternational entities. Our competitors vary in size, ranging from small companies focused on certain end markets or geographical area, to large companies with broad manufacturing capabilities and geographical reach. Competition can be geographically regionalized as customers procure products locally to manage cost and minimize logistical complexities. Certain competitors may have many established manufacturers with broader product lines, more manufacturing capacity, and greater distribution capabilities greater capital resources, excess capacity, labor advantages and larger marketing, research and development staffs and facilities than our own.we do.
We believe the principal competitive factors in our Manufacturing segment are product performance, quality, price, technical innovation, cost effectiveness, customer service and breadth of product line. We intend to continue to compete based on high-performancehigh quality products, innovative production technologies, cost-effective manufacturing techniques, close customer relations and support, and increasing product offerings.
RESOURCE MATERIALS
We use raw materials in the products we manufacture, including, among others, steel, aluminum, and polystyrene and other plastics resins. Managing price volatility and ensuring raw material availability are important aspects of our business. We attempt to pass increases in the costs of these raw materials onthrough to our customers. Increases in the costs of raw materials that cannot be passed on to customers could have a negative effect on profit margins. Additionally, a certain amount of residual material (scrap) is a by-product of the manufacturing and production processes. Declines in commodity prices for these scrap materials due to weakened demand or excess supply can negatively impact the profitability of our Manufacturing segment as it reduces their ability to mitigate the costcosts associated with excess material.
ENVIRONMENTAL REGULATION
Our manufacturing businesses are subject to environmental, health and safety laws and regulations, including those governing discharges to air and water, the management and disposal of hazardous substances, the cleanup of contaminated sites and health and safety matters.
| | | | | |
| PLASTICS | Contribution to Operating Revenues: 23% (2020)31% (2023), 20% (2019)35% (2022), 22% (2018)32% (2021) |
Plastics consists of businesses producing PVC pipe at plants in North Dakota and Arizona. The following is a brief description of these businesses:
Northern Pipe Products, Inc. (Northern Pipe), located in Fargo, North Dakota, manufactures and sells PVC pipe for municipal water, rural water, wastewater, storm drainage systems and other uses in the northern, midwestern, south-central and western regions of the United States as well as central and western Canada.
Vinyltech Corporation (Vinyltech), located in Phoenix, Arizona, manufactures and sells PVC pipe for municipal water, wastewater, water reclamation systems and other uses in the western, northwest and south-central regions of the United States.
PVC pipe is manufactured through aan extrusion process, known as extrusion. During this process,during which PVC compound (a dry powder-like substance) is introduced into an extrusion machine, where it is heated to a molten state and then forced through a sizing apparatus to produce the pipe. The newly extruded pipe is pulled through a series of water-cooling tanks, marked to identify the type of pipe and cut to finished lengths. Together our Plastic segment businesses have the current capacity to produce approximately 300 million pounds of PVC pipe annually.
CUSTOMERS
PVC pipe products are marketed through a combination of independent sales representatives, company salespersons and customer service representatives. Customers for our PVC pipe products consist primarily of wholesalers and distributors, and the principal method for distribution of our products is by common carrier ground transportation. No single customer of the PVC pipe companies accounted for 10% or more of our consolidated operating revenues in 2020.2023. However, two customers, both of which are distributors of PVC pipe, combined to account for 45%36% of our 2020 Plastics segment operating revenue.revenues for the year ended December 31, 2023 and 46% for the year ended December 31, 2022.
COMPETITIVE CONDITIONS
The plastic pipe industry is fragmented and competitive due to the number of producers, the small number of raw material suppliers and the fungible nature of the product. Due to shipping costs, competition is usually regional instead of national in scope. The principal factors of competition are price, customer service and product performance. We compete not only against other plastic pipe manufacturers, but also ductile iron, high-density polyethylene, steel and concrete pipe producers. Pricing pressure will continue to affect our operating margins in the future.
We will continue to compete based on our high-quality products, cost-effective production techniques and close customer relations and support.support, including our responsiveness and reliability.
RESOURCE MATERIALS
PVC resins are acquired in bulk and shipped to our facilities by rail. There are four vendors from which we can source our PVC resin requirements. Two vendors provided over 99%In 2023 we sourced all of totalour PVC resin from three vendors. Our contractual arrangements to acquire resin generally include estimated annual order quantities with no required minimum purchases, in 2020.and include variable pricing based on market prices for resin. The supply of PVC resin may also be limited primarily due to manufacturing capacity and the limited availability of raw material components. Most U.S. resin production plants are located in the Gulf Coast region. These plants are subject to the risk of damage and production shutdowns because of exposure to hurricanes or other extreme weather events that occur in this part of the United States. The loss of a key vendor, or any interruption or delay in the supply of PVC resin could disrupt the ability of theour Plastics segment businesses to manufacture products, cause customers to cancel orders or result in increased expenses for obtaining PVC resin from alternative sources, if such sources were available. We believe we have good relationships with our key raw material vendors.
Due to the commodity nature of PVC resin and PVC pipe and the dynamic supply and demand factors worldwide, historically the markets for both PVC resin and PVC pipe have been very cyclical with significant fluctuations in prices and gross margins.
In addition to PVC resin, we use certain other materials, such as stabilizers, gaskets and lumber, in the process of manufacturing and shipping our PVC pipe products. We generally source these materials from a limited number of suppliers, and supply chain constraints or disruptions related to these materials could disrupt our ability to manufacture or ship products and could result in increased costs.
Demand for our PVC pipe products can be impacted by seasonal weather differences, with generally lower sales volumes realized in the first quarter of the year when cold temperatures and frozen ground across the northern portion of our footprint can delay or prevent construction activity and consequently delay or prevent customer orders of PVC pipe.
ENVIRONMENTAL REGULATION
Our plastics businesses are subject to environmental, health and safety laws and regulations, including those governing discharges to air and water, the management and disposal of hazardous substances, the cleanup of contaminated sites and health and safety matters.
RISK FACTORS AND CAUTIONARY STATEMENTS
Our businesses are subject to various risks and uncertainties. Any of the risks described below or elsewhere in this report on Form 10-K or in our other SEC filings could materially adversely affect our business, operating results, financial condition operating results and cash flows.liquidity. Additional risks and uncertainties we are not presently aware of or that we currently consider immaterial may also affect our business, operating results, financial condition operating results and cash flows.
Oversight of Risk and Related Processes
A key accountability of the Board of Directors is the oversight of material risk. Management and the Board of Directors have responsibility for overseeing the identification and mitigation of top risks. Management identifies and analyzes risks to determine the impact and other attributes such as timing, likelihood and management control. Identification and analysis occur formally through a top risk assessment conducted by senior management, the financial disclosure process, and internal auditing and compliance with financial and operational controls. Management also identifies and analyzes risk through development of goals and key performance indicators, which include risk identification to determine barriers to implementing our strategy. We promote a culture of compliance, including tone at the top. The process for risk mitigation includes adherence to our code of conduct and compliance policies, operation of formal risk management structures and overall business management to mitigate the risks inherent in the implementation of strategy. We manage and further mitigate risks through formal risk management structures, including a management executive risk committee and services such as internal audit/business risk management and legal. Management communicates regularly with our Board of Directors and key stakeholders regarding risk. Senior management presents and communicates a periodic risk assessment to our Board of Directors which provides information on the risks management believes are material, including the earnings impact, timing, likelihood and management control. The Board of Directors approaches oversight, management and mitigation of risk as an integral and continuous part of its governance of Otter Tail Corporation. The Board of Directors regularly reviews management’s top risk assessment and analyzes areas of existing and future risks and opportunities. Finally, the Board of Directors conducts an annual strategy session where our future plans and initiatives are reviewed.liquidity.
OPERATIONAL RISKS
The economic effects of the COVID-19 pandemic and measures taken to arrest its spread, as well as any emergency measures we take in response, could adversely impact our business, including our operating results, financial condition and liquidity.
The outbreak and global spread of COVID-19, which has been declared a pandemic by the World Health Organization, has adversely impacted economic activity and conditions worldwide and is currently impacting our business operations. The extent to which COVID-19 will continue to impact our business is highly uncertain and will depend on future developments, including the efficacy and availability of vaccines, the spread of COVID-19 variants and the extent of federal, state and local government responses affecting the economy. In particular, the COVID-19 pandemic could, among other things:
•reduce customer demand in our Manufacturing segment, where we experienced a significant but temporary decline in orders in 2020 as many of our customers temporarily closed their plants, which led to actions to reduce our operations, including furloughing of employees and eliminating positions;
•reduce customer demand in our Electric segment, including demand from commercial and industrial customers;
•reduce customer demand in our Plastics segment;
•result in lower PVC pipe sales due to potential delays or cancellation of public water and wastewater infrastructure projects caused by funding shortfalls;
•lead to disruptions of our workforce;
•force us to temporarily close certain plants or construction sites if precautions to prevent the spread of the virus at those locations are not effective;
•increase our bad debt expenses, particularly in our Electric segment;
•increase our future pension benefit cost and funding requirements;
•increase health insurance premiums;
•disrupt the supply chains, delivery systems or construction workforce related to our Electric segment maintenance requirements and capital expenditure plans, resulting in further delays and increased costs;
•disrupt global financial markets, reducing our ability to access capital necessary to finance such expenditures, and which could in the future negatively affect our liquidity; and
•result in a recession or market correction that could materially affect our business and the value of our common stock.
We continue to monitor developments involving our workforce, customers, construction contractors, suppliers and vendors and take steps to mitigate against additional impacts, but given the unprecedented and evolving nature of these circumstances, we cannot predict the full extent of the impact that COVID-19 will have on our operating results, financial condition and liquidity.
Our strategy includes large capital investments, which are subject to risks.
Our business strategy includes major capital investments at our existingoperating companies. Our capital investment program planned for the next five years includes investments in renewable generation, transmission asset additions and upgrades, and technology and infrastructure projects. These capital projects are planned years in advance of their in-service dates and are subject to various risks including: obtaining necessary permits, licenses and approvals in a timely manner; adverse changes in regulatory treatment or public policy; changes in commodity pricing equipment andor construction costs; technology changes; delivery delays of critical materialsmaterials; obtaining necessary permits and components; delays caused by construction accidents, injuries or public health crises; adverse weather conditions; unforeseen product defects; limited access to capital;licenses; and other adverse conditions. Capital investments in our Electric segment are subject torequire regulatory approval and are at risksubject to the risks of not being granted timely approval or full recoveryallowed to be fully recovered. In addition, our ability to construct and own utility assets may be impacted by regulatory requirements to competitively bid such investments, which could impact the amount and timing of our capital investments. TheA lack of direct ownership, or the inability to complete capital projects on budget and in a timely manner could adversely impact our financial condition and operating results.
Our acquisition or disposition strategies are subject to risk and may adversely impact our financial position and operating results.
As part of our business strategy, we continually assess our mix of businesses and potential strategic acquisitions or dispositions. This investment strategy is subject to various risks including the ability to identify appropriate acquisition candidates or successfully negotiateachieve our strategic financial goals and finance any acquisitions. In addition, difficulties in integrating the operations, services, products and personnel of the acquired business, and the potential loss of key employees, customers and suppliers of the acquired business could adversely impact our operating results and financial condition and operating results.
The sale of any of our businesses may result in the recognition of a loss, if the business is sold for less than its book value and may expose us to risk arising from indemnification obligations that arose out of the conduct of the business prior to the sale. These obligations may include such things as warranty and environmental obligations or the recoverability of certain assets sold as part of the transaction. Unforeseen costs related to these obligations could impact our operating results.condition.
Weather impacts, including normal seasonal fluctuation and extreme weather eventsfluctuations, could adversely affect our operating results.
Our Electric segment business is seasonal and weather patterns can have a materialhad an impact on our financial performance.performance in the past and may again in the future. Demand for electricity is normally greater in the winter and summer months. Unusually mild summers and winters could have an adverse effect on our financial condition and results of operations. In addition, ourOur Plastics segment businesses arecan be affected by weather’sseasonal weather prohibiting or delaying construction projects at any time of the year in any geography, but specifically times of the year when frozen ground and cold temperatures in many parts of the country can delay construction projects, all of which can result in reduced customer demand and could have an adverse effect on our financial condition, operating results and liquidity.
We are subject to physical and transition risks associated with climate change and extreme weather events.
Longer term shifts in climate patterns may impact on contractors whose work can be delayedour customers' demand for electricity, interrupt our business operations and thereforedamage our facilities; reduce the need for PVC pipe during winteravailability of natural resources, such as water; and cause disruptions in our supply chains.
Climate change may increase the frequency and severity of extreme weather andevents, such as prolonged periods of extreme wet conditions.
Our businesses are located in areas that could be subject tocold or heat, and natural disasters, such as severe snow and ice storms, tornadoes, flooding and fires.wildfires. These factorsacute events could result in the interruption of our business operations and damage to our facilities. An extreme weather event within our utility service areasarea could directly affect our capital assets, causing disruption in service to customers, and result in reduced operating revenues and repair or replacement costs, due to downed wires and poles or damage to other operating equipment.
In additionthe past, severe weather events in the Gulf Coast region of the U.S. have disrupted the supply of PVC resin, the primary material input of our Plastics segment businesses. As most U.S. PVC resin production plants are located in the Gulf Coast region, an area prone to variations in seasonal weather patterns, more widespread climate change may also create physicalhurricane activity and financial risk to our businesses. Physical risks of climate change, such as more frequent or moreother extreme weather events, changesour access to PVC resin may be impacted by the volume and magnitude of hurricane and storm activity in temperature and precipitation patterns, changes to ground and surface water availability, and other phenomena,this region, which could affect some or allimpact our Plastics segment businesses.
Increased risk of our operations. Severe weather or other natural disasters, relatedsuch as wildfires, could have financial consequences, including limiting our ability to secure sufficient insurance coverage, or lead to increased insurance cost. While we carry liability insurance, given an extreme event, if we were found to be liable for damages, amounts that exceed our coverage limit could negatively impact our financial condition, operating results and liquidity.
These risks may also negatively impact our credit ratings, which may limit our access to capital markets and increase our borrowing costs. In addition, to the extent investors view climate change, fossil fuel combustion and GHG emissions as a financial risk, our stock price or our ability to access capital markets on favorable terms and conditions could be destructiveadversely impacted.
We may experience transition risks in moving towards low carbon generation and result in increased costsmanufacturing. For example, we may face challenges with the adoption of new technologies, meeting changing customer expectations and disruptions in our operations. Extreme weather conditions, suchcommitting to voluntary GHG emissions reduction goals, as uncommonly long periods of highwell as complying with evolving local, state or low ambient temperature, in general require more utility system backup, addingfederal regulatory requirements intended to costs and contributing to increased system stress on our utility infrastructure, which could cause service interruptions.reduce GHG emissions.
The loss of, or significant reduction in revenue from, any of our key customers could have an adverse effect on our operating results.
While no single customer providesprovided more than 10% of our consolidated operating revenue,revenues, each of our segments have customers which accountaccounted for over 10% of the segment’s operating revenues. In 2020, one customer2023, two customers accounted for 11%21% of Electric segment revenue, threerevenues, two customers combined to account for 46%30% of Manufacturing segment operating revenuerevenues and two customers combined to account for 45%36% of Plastics segment operating revenue.revenues. The loss of any one of these customers or a significant decline in sales to these customers, would have a significant negative impact on the segment's financial positioncondition and operating results, and could have a significant negative impact on the Company’s consolidated financial positioncondition, operating results and operating results.liquidity.
We are subject to counterparty credit risk.
We extend credit to our customers in the ordinary course of business in each of our operating segments. Our customers' ability to pay depends on a variety of factors including macroeconomic conditions, local economic conditions including unemployment rates, and industry conditions in which our commercial and industrial customers operate. Increased customer delinquencies and bad debts could adversely impact our operating results and liquidity.
Our operations are subject to environmental, health and safety laws and regulations.
We are subject to numerous federal, state, and local environmental, health and safety laws and regulations governing, among other things, discharges to air and water, natural resources, hazardous waste and toxic substances, the cleanup of contaminated sites, and health and safety matters. Our failure to comply with applicable laws and regulations could result in civil or criminal fines or penalties, enforcement actions, and regulatory or judicial orders enjoining or curtailing operations or requiring corrective measures, which could materially and adversely affect our business. Compliance with these laws and regulations is a significant factor in our business. We have incurred and expect to continue to incur capital expenditures and operating costs to comply with applicable current and future laws and regulations.
Our businesses continue to be subject to additional and changing environmental, health and safety laws and regulations, and we could incur additional costs complying with requirements that are promulgated in the future. New laws or regulations or changes to existing laws and regulations in the future may result in disruptions to our business, changes in customer preferences, or changes in customer demand, which could adversely impact our financial condition, operating results and liquidity.
Recently, various federal and state agencies have heightened their scrutiny of per- and polyfluoroalkyl substances (PFAS), which are manufactured chemicals used in a variety of consumer and industrial products. Regulators have recently proposed additional chemicals be designated as hazardous substances, including a proposal to designate perfluorooctanesulfonic acid and perfluorooctanoic acid, two of the most common PFAS chemicals, as hazardous substances, which could have wide-ranging impacts on companies across various industries, including ours. We are investigating whether PFAS compounds are used in our manufacturing or operating processes that occur in our various businesses. At this time, we cannot predict the outcome or the severity of the impact, if any, of future laws or regulations enacted to address PFAS.
A cyber incident, security breach or system failure could adversely affect our business and operating results.
The operation of our business is dependent on the secure functionfunctioning of our computer hardware and software systems. Furthermore, all our businesses require us to collect and maintain sensitive customer data,systems, as well as confidential employeethat of third-party service providers and shareholder information, which is subject to electronic theft or loss. We alsovendors we use third-party vendors to electronically process certain of our business transactions. Information systems, both ours and those of third parties, are vulnerable to security breaches by computer hackers and cyber terrorists, and the negligent or intentional breach of established controls and procedures, or mismanagement of confidential information by employees. WeCyber-attacks or other security breaches may also be impacted by attacks and data security breachesperpetrated through the use of financial institutions, merchantsartificial intelligence, which could introduce additional complexity to such an attack or third-party processors.breach. While we employ a defense-in-depth strategy and regularly conduct cybersecurity assessments, we cannot be certain our information security systems and protocols and those of our vendors and other third parties are sufficient to withstand a cyber-attack or other security breach.
A major cyber incident could result in significant expenses to investigate and repair security breaches or system damage, and could lead to litigation, fines, other remedial action, heightened regulatory scrutiny and damage to our reputation. For example, we may be subject to liability under various federal, state and international disclosure laws and data protection laws. These laws are subject to change and expansion and may require additional operational changes and costs to comply.
The misappropriation, corruption or loss of personally identifiable information and other confidential data could lead to significant monetary damages, regulatory enforcement actions and breach notification and mitigation expenses, such as credit monitoring, and result in reputational damage affecting relations with shareholders, customers, regulators and regulators.others. In addition to property and casualty insurance, which may cover restoration of data, certain physical damage or third-party injuries, we have cybersecurity insurance related to a breach event. However, damage and claims arising from such incidents may not be covered or may exceed the amount of any available insurance.
The inability to attract and retain a qualified workforce could have an adverse effect on our operations.
The success of our business is heavily dependsdependent on the leadership of our executive officers and key employees to implementfor implementation of our strategy. In addition, all of our businesses rely on a qualified workforce, including technical employees who possess certain specialized knowledge.knowledge and skills. The inability to attract and maintainretain a skilled and stable workforce at necessary staffing levels, whether due to decreases in hiring rates, increases in employee retirements, increases in terminations, or any combination thereof, may negatively affect our ability to service our customers, manufacture products or successfully manage our business and achieve our objectives. Competition for skilled workers
Our acquisition or divestiture strategies are subject to risk and could adversely impact our financial position and operating results.
As part of our business strategy, we continually assess our mix of businesses and potential strategic acquisitions or divestitures. This investment strategy is high and can leadsubject to increased labor expenses, decreased productivity and potentially lost business opportunities. Our ability to maintain productivity, relationships with customers, competitive costs, and quality services is limited byvarious risks, including the ability to employidentify appropriate acquisition candidates, or successfully negotiate and finance any acquisitions. In addition, difficulties in integrating the necessary skilledoperations, services, products and personnel of the acquired business, and the potential loss of key employees, customers and suppliers of the acquired business could negatively affectadversely impact our financial condition and operating results, financial position and cash flows.results.
FINANCIAL RISKS
We are subject to capital market and interest rate risks.
We rely on access to debt and equity capital markets as a source of liquidity to fund our investment initiatives, including rate base growth investments in our Electric segment and opportunities for investment, including acquisitions, in our Manufacturing and Plastics segments. Capital markets are impacted by global and domestic economic conditions, monetary policy, commodity prices, geopolitical events and other factors. If we are unable to access capital on acceptable terms and at reasonable costs, our ability to implement our business plans may be adversely affected. In addition, higher market interest rates on outstanding variable-rate, short-term indebtedness could also impact our operating results. In 2023, rising market interest rates caused the applicable rate of interest on our short-term indebtedness to increase significantly. However, the impact to our operating results was not significant due to our low level of outstanding borrowings on our short-term indebtedness. Our operating results could be
impacted if we significantly increase our short-term borrowings or issue new long-term debt, and interest rates remain elevated or continue to increase.
A decrease in our credit ratingratings could increase our borrowing costs and result in additional contractual costs.
We rely on our investment grade credit ratings to provide acceptable costs for accessing the capital markets. A downgrade of our credit ratings could result in higher borrowing costs thereby negatively impacting our operating results and limiting our ability to access capital markets, which may negatively impact our ability to implement our business plans. In addition, OTP is a party to contracts that require the posting of collateral or settlement of applicable contracts if credit ratings fall below certain levels.
Our pension and other postretirement benefit plans are subject to investment and interest rate risks.
The financial obligations and related costs of our pension and other postretirement benefit plans are affected by numerous factors. Assumptions related to future costs, investment returns, actuarial estimates and interest rates have a significant effect on our funding obligations and the cost recognized forrelated to these plans. If our pension plan assets do not achieve our estimated long-term rate of return or if our other estimates prove to be inaccurate, our financial position, operating results, financial condition and cash flowsliquidity may be adversely impacted. In addition, our funding requirements could be impacted by changes to the Pension Protection Act.
We rely on our subsidiaries to provide sufficient earnings and cash flows to allow us to meet our financial obligations and pay dividends to our shareholders.
Otter Tail Corporation is a holding company with no significant operations of its own. The primary source of funds for payment of our financial obligations and dividends to our shareholders is from cash provided by our subsidiary companies. Our ability to meet our financial obligations and pay dividends on our common stock principally depends on the earnings, cash flows, capital requirements and general financial positionpositions of our subsidiary companies. In addition, OTP is subject to federal and state regulations which may restrict its ability to pay dividends. Finally, we are also reliant on our subsidiary companies to maintain compliance with financial covenants under our various shortshort- and long-term debt agreements. Our debt agreements include restrictions on the payment of cash dividends upon an event of default.
Changes in tax laws could materially affect our financial condition and operating results.
Our provision for income taxes and tax obligations are impacted by various tax laws and regulations, including the availability of various tax credits, IRS tax policies such as tax normalization and, at times, the ability to carryforward net operating losses.losses and tax credits. Changes in tax laws, regulations and interpretations could have an adverse effect on our financial condition and operating results. Tax law changes that reduce or eliminate production or investment tax credits (ITCs), or the ability to transfer or sell these credits, may impact the economics of constructing certain electric generation resources, which may adversely impact our planned investments.
A significant impairment of our goodwill would negatively impact our financial positioninvestments, and operating results.
As of December 31, 2020, we had $37.6 million of goodwill recorded on our consolidated balance sheet. We have recorded goodwill for businesses in our Manufacturing and Plastics segments. Goodwill is tested for impairment annually or whenever events or changes in circumstances indicate impairment may have occurred. The goodwill impairment test requires us to estimate the fair value of the businesses being tested. Estimating the fair value of a business unit requires significant judgments and estimates, including estimates of future operating results and cash flows, among others. These estimates can be affected by numerous factors, including changes in economic, industry or market conditions, changes in business operations, changes in competition or changes in technologies. Any changes in key assumptions or material differences between actual and forecasted financial performance could affect our fair value estimates and lead to a goodwill impairment charge that could adversely affect our financial positioncondition and operating results, as well as impact compliance with financing agreement covenants.results.
ELECTRIC SEGMENT RISKS
General economic and industry conditions impact our business.
Several factors, many of which are beyond our control, may contribute to reduced demand for energy from our customers or increase the cost of providing energy to our customers. These risks include economic growth or decline in our service areas, demographic changes in our customer base and changes in customer demand or load growth due to, among other items, proliferation of distributed generation, energy efficiency initiatives and technological advancements. In addition, customer demand could be impacted by increased competition in our service territories or the loss of a service territory or franchise. Other risks include increased transmission or interconnection costs, generation curtailment and changes in the manner in which wholesale power is purchased and sold. A decrease in revenues or an increase in expenses related to our electric operations could negatively impact our financial condition, operating results and liquidity.
Our utility business is significantly impacted by government legislation and regulation.
We areOTP is subject to federal and state legislation government regulations and comprehensive regulation by federal and state regulatory actions that may have a negative impact on ouragencies, including the public utility commissions in each of the three states in which OTP operates, and by the FERC. State utility commissions regulate, among other matters, the establishment of assigned service areas, the siting and construction of major facilities, the capital structure of the utility business, and resultsthe allowed rates to charge customers for providing energy and utility service. Each state utility commission operates independent of operations. The electric ratesone another; therefore, OTP is allowedsubject to charge for itsand must adhere to the decisions of each independent state commission. The FERC regulates, among other matters, wholesale energy transactions, hydroelectric licensing, transmission and sale of electric services are oneenergy in interstate commerce, and the interconnection of the most important items influencing ourelectric facilities.
Our financial position,condition, operating results and liquidity. The rates OTP charges its electric customersliquidity are subject to reviewsignificantly impacted by, and determination by state and federal regulators. Ourdependent upon, our ability to obtain rate adjustments to maintain reasonable rates of return depends on regulatory action under applicable statutesrecover the costs associated with providing utility service and regulations and we cannot provide assurance that rate adjustments will be obtained or reasonable rates ofearn a return on our utility capital will be authorized.investments. There is no assurance the applicable regulatory authoritythat each state utility commission will judge all our utility costs to have been prudently incurred or that rates will produce full recovery of such costs. In addition, there could be changes in the federal or state regulatory environment that wouldframework could impair theour ability of OTP to recover utility costs historically collected from theirour customers. OTPDiverging public policy priorities across the jurisdictions we serve, and a lack of inter-jurisdictional consensus, may impact our ability to recover the cost of, and return on, our capital investments and our operating costs; it may impact our future capital investment opportunities; and may result in inefficiencies which could negatively impact our financial position, operating results and liquidity.
In addition to the recovery of our utility costs, our profitability is impacted by our authorized ROE, which can be impacted by macroeconomic factors such as interest rates. There can be no assurance that each state utility commission or the FERC will fileauthorize a rate cases with, or seek cost recovery authorization from, federal and state regulatory authorities.of return which allows us to achieve our financial goals. An adverse decision by one or more regulatory authorities concerning the level or method of determining electric utility rates, the authorized returns on equity, recoverability of fuel, purchase power and other costs, approval of depreciation rates, implementation of enforceable federal reliability standards or other regulatory matters, permitted business activities (such as ownership or operation of nonelectric businesses) or any prolonged delay in rendering a decision in a rate or other proceeding (including with respect to the recovery of capital expenditures in rates) could adversely impact our financial condition, operating results.results and liquidity.
Inflationary cost pressures have increased the cost of constructing our utility assets and operating our utility business. There can be no assurance that our state regulatory commissions will authorize recovery of rising costs. Regulatory commissions may also limit future capital investments or the rate of return allowed on such investments in response to inflationary cost pressures and customer bill impacts. Such limitations could negatively impact our financial position, operating results and liquidity.
Our generating facilities are subject to risks that could result in early closure or the sale of our ownership interest.
Changes in operational or economic factors, environmental regulation or risks of litigation could result in the early closure or the sale of our interest in a generating facility. In the event of an early closure, a significant asset impairment charge could be required, and we would be obligated to pay for our share of the costs of closure of the generating facility, including costs associated with decommissioning, remediation, reclamation and restoration of the property, and any costs of terminating contracts associated with the generating facility, such as coal supply arrangements. In the event of a sale of our interest in a generating facility, we may not be able to negotiate the sale on favorable terms, which could result in the recognition of a loss on the sale and other potential liabilities. There can be no assurance that we would be authorized by any of our state utility commissions to recover any costs or losses associated with the early closure of or sale of our interest in a generating facility.
The loss of a major generating facility would require OTP to identify and obtain approval for other sources of generation for its customers, if available, and potentially expose us to higher purchased power costs. In addition, OTP may not be able to obtain timely regulatory approval for new generation resources to replace closed or sold facilities.
Our IRP, as revised in two supplemental filings in 2023, outlined our plan to withdraw from our 35% ownership interest in Coyote Station, a jointly owned coal-fired generation plant, in the event we are required to make a major, non-routine capital investment in the plant. In the event we were to withdraw from our ownership, we will seek to recover all costs related to the withdrawal from Coyote Station; however, there is a risk we may not be granted recovery of such costs. A full or partial denial of recovery of the costs of withdrawal could significantly impact our operating results, financial condition and liquidity.
Joint ownership of coal-fired generation facilities could impact our ability to manage changing regulations and economic conditions.
We own our coal-fired generation facilities jointly with other co-owners with varying ownership interests in such facilities. Our ability to make determinations on our IRP in order to best navigate changing environmental regulations and economic conditions may be impacted by our rights and obligations under the co-ownership agreements and related agreements, and our ability to reconcile a divergence in the interests of OTP and the co-owners of these generation facilities. Such a divergence could impair our ability to effectively manage these changing conditions to meet our strategic objectives and could adversely impact our financial condition, operating results and liquidity.
Federal and state environmental regulation could require us to incur substantial capital expenditures, and increased operating costs or make it no longer economically viable to operate some of our facilities.
We are subject to federal, state and local environmental laws and regulations relating to air quality, water quality, waste management, natural resources and health safety. These laws and regulations regulate the modification and operation of existing facilities, the construction and operation of new facilities and the proper storage, handling, cleanup and disposal of hazardous waste and toxic substances. Compliance with these legal requirements requiresmay require us to commit significant resources and funds toward environmental monitoring, installation and operation of pollution control equipment, payment of emission fees and securing environmental permits. Obtaining environmental permits can entail significant expense and cause substantial construction delays. Failure to comply with environmental laws and regulations, even if caused by factors beyond our control, may result in civil or criminal liabilities, penalties and fines.
Coyote Station, one of OTP's jointly owned coal-fired power plants, is subject to assessment under the second implementation period of RHR as part of the state of North Dakota's RHR SIP. We cannot predict with certainty the impact the SIP may have on our business until the plan has been approved or otherwise acted on by the EPA, including its potential implementation of an alternative federal implementation plan. However, significant emission control investments could be required. Alternatively, investments in emission control equipment may prove to be uneconomic and result in the early closure or the sale of, or withdrawal from, our interest in Coyote Station.
Existing environmental laws or regulations may be revised and new laws or regulations may be adopted or become applicable to us. The multiple jurisdictions that govern our electric utility business may not agree as to the appropriate resource mix, which may lead to costs incurred to comply with one jurisdiction that are not recoverable across all jurisdictions served by the same assets. Revised or additional regulations which result in increased compliance costs or additional operating restrictions, particularly if those costs are not fully recoverable from customers, could have a material effect on our financial condition, operating results and make itliquidity, making the operation of some of our facilities no longer economically viable to operate some of our facilities.viable.
Legislation, regulation, litigation or other actions related to climate change and greenhouse gas emissions and other air pollutants could materially impact us.
Current and future federal, state, regional and international regulations to address global climate change and reduce greenhouse gas GHG emissions, and other air pollutants, including measures such as mandated levels of renewable generation, mandatory reductions in CO2 emission levels, taxes on CO2 emissions, or cap-and-trade regimes, could require us to incur significant new costs which could negatively impact our financial position,condition, operating results and cash flowsliquidity if such costs cannot be recovered through rates granted by ratemakingrate-making authorities or through increased market prices for electricity. Future federal regulatory rulemaking will be impacted by
In 2021, the Biden administration's priorities and objectives, which may include more stringent requirements forAdministration introduced new targets aimed at reducing economy-wide net GHG emissions and other air pollutantsby 50% to 52% from 2005 levels by 2030. In addition, the Administration set a goal to reach 100% carbon pollution-free electricity by 2035. As a part of achieving these targets, the EPA proposed new regulations in May 2023 under Section 111 of the Clean Air Act to regulate GHG emissions from existing and new fossil fuel-firedfuel-based EGUs. As detailed above, this proposal would require states to implement stringent emissions standards for most coal-fired steam generating units and certain larger natural gas combustion plants. Until the EPA takes final action on this rulemaking, we are unable to evaluate the precise impacts; however, the proposed rule has the potential to impact the emissions controls needed at OTP’s coal-fired power plants, and other objectives that maywhich could have an impact on our operating results, financial position or cash flows.condition and liquidity. The EPA may implement additional new regulations targeting power plants to
State implementation plans for compliance with the second implementation period of the RHR are due in mid-2021. Coyote Station, OTP's jointly-owned coal-fired power plant, is subject to assessment under the RHR as part of the state of North Dakota's state implementation plan. We cannot predict thesupport its aforementioned economy-wide GHG reduction goals, which could impose substantial costs on and impact the state implementation plan have on us until the plan is finalized and adopted. However, significant emission control investments could be required, or in light of the costs for such emission control equipment, there are scenarios where it may not be economically feasible to invest in such equipment and an early retirement of, or the saleoperations of our interest in, Coyote Station would be necessary. The costs of such a retirement or sale would be material, a significant asset impairment charge could be required and OTP would be subject to state commission approval to recover such costs from customers. In addition, it may be necessary to pursue replacement electric generation facilities as an alternative,utility business, which may require incurring significant investment in new facilities that would be subject to regulatory permitsmaterially impact our financial condition, operating results and approvals.liquidity.
In addition to complying with legislation and regulation, we could be subject to litigation related to climate change. CostsIn recent years, there has been an increase in litigation against electric utilities and fossil fuel producers. If OTP were subjected to such litigation, the costs of such litigation could be significant and an adverse outcome could require substantial capital expenditures, changes in operations and possible payment of penalties or damages which could affect our financial condition, operating results and cash flowsliquidity if the costs are not recoverable in rates or covered by insurance.
To the extent investors view climate change, fossil fuel combustion, and GHG emissions as a financial risk, our stock price or our ability to access capital markets on favorable terms and conditions could be adversely impacted.
Violations of extensive legal and regulatory compliance requirements maycould have a negative impact on our business and results of operations.
We are subject to an extensive legal and regulatory framework imposed under federal and state laws and regulatory agencies, including the FERC and the NERC.North American Electric Reliability Corporation (NERC). We could be subject to potential financial penalties for compliance violations. Our transmission systems and electric generation facilities are subject to the NERC mandatory reliability standards, including cybersecurity standards. If a serious reliability incident didwere to occur, it could have a material effect on our operations or financial results. Some states have the authority to impose substantial penalties in the event of non-compliance. We attempt to mitigate the risk of regulatory penalties through formal training. However, there is no guarantee our compliance program will be sufficient to ensure against violations.
In addition, energy policy initiatives at the state or federal level could increase incentives for distributed generation, or authorize municipal utility formation or acquisition of service territory, or local initiatives could introduce generation or distribution requirements that could change the current integrated utility model.
These laws and regulations significantly influence our operations and may affect our ability to recover costs from our customers. We are required to have numerous permits, licenses, approvals and certificates from the agencies and other organizations that regulate our business. We believe we have obtained the necessary approvals for our existing operations and that our business is conducted in accordance with applicable laws and regulatory requirements; however, we are unable to predict the impact on our operating results from the future regulatory activities of any of these agencies and other organizations. Changes in regulations or the imposition of additional regulations could have a material adverse impact on our financial condition, operating results of operations.and liquidity.
Our transmission and generation facilities could be vulnerable to cyber and physical attack.
OTP owns electric transmission and generation facilities subject to mandatory and enforceable standards advanced by the NERC. These bulk electric system facilities provide the framework for the electrical infrastructure of OTP’s service territory and interconnected systems, the operation of which is dependent on information technology systems. Further, the information systems that operate OTP’s electric system are interconnected to external networks. Parties that wish to disrupt the U.S. bulk power system or OTP’s operations could view OTP’s computer systems, software or networks as attractive targets for cyber-attack.
In addition, OTP’s generation and transmission facilities are spread throughout a large service territory. These facilities could be subject to physical attack or vandalism that could disrupt OTP’s operations or conceivably the regional or U.S. bulk power system.
OTP is subject to mandatory cybersecurity and physical security regulatory requirements. OTP implements the NERC standards for operating its transmission and generation assets and staysremains abreast of best practices within the business and the utility industry to protect its computers and computer-controlled systems from outside attack. We rely on industry acceptedindustry-accepted security measures and technology to securely maintain confidential and proprietary information necessary for the operation of our systems. In an effort to reduce the likelihood and severity of cyber intrusions, we have cybersecurity processes and controls and disaster recovery plans designed to protect and preserve the confidentiality, integrity and availability of data and systems. We also take prudent and reasonable steps to protect the physical security of our generation and transmission facilities. However, all these measures and technology may not adequately prevent security breaches, ransomware attacks or other cyber-attacks, or enable us to recover effectively from such a breach or attack. Any significant interruption or failure of our information systems or any significant breach of security due to cyber-attacks, hacking or internal security breaches or physical attack of our generation or transmission facilities could adversely affect our business and our financial condition, operating results of operations.and liquidity.
Our generatinggeneration, transmission, and distribution facilities are subject to operational risks which include circumstances that could result in unscheduled plant outagesinjuries, loss of life, property damage, and increased costs.fires.
The operation of electric generatingour generation, transmission, and distribution facilities involves many risks including facility shutdowns due to equipment or process failures; labor disputes;failures, accidents and workforce safety matters, environmental damage, property damage, operator error;error, and the occurrence of catastrophic events such as fires, explosions and floods;floods. Diminished availability or performance of those facilities could result in facility shutdowns, reduced customer satisfaction, reputational harm, and regulatory inquiries and fines.
Accidents, fires, explosions, catastrophic failures, general system damage or dysfunction, intentional acts of destruction, and other unplanned events related to our infrastructure would increase repair costs and may expose us to liability for personal injury, loss of life, and property damage. Fires alleged to have been caused by our transmission, distribution, or generation infrastructure, or that allegedly result from our contractors’ operating or maintenance practices, could also expose us to claims for fire suppression and clean-up costs, evacuation costs, fines and penalties, and liability for economic damages, personal injury, loss of life, property damage, and environmental pollution, whether based on claims of negligence, trespass, or otherwise. We maintain insurance coverage for such operating and event risks, but insurance coverage is subject to the dependence on a specific fuel source;terms and limitations of the riskavailable policies and may not be sufficient in amount to cover our ultimate liability. We may be unable to fully recover costs in excess of performance below expected levelsinsurance through customer rates or regulatory mechanisms. If the amount of outputinsurance is insufficient or efficiency. Weotherwise unavailable, and if we are unable to fully recover in rates the costs of uninsured losses, our financial condition, operating results and liquidity could be materially affected.
We are subject to costsrisks associated with any unexpected failurethe procurement and transportation of fuel to produce or deliver power, including failures caused by a breakdown or forced outage, as well as repairing damages toour coal and natural gas powered generation facilities.
We rely on a limited number of suppliers to provide coal and a limited number of service providers to transport coal transportationand natural gas to our facilities. A counterparty's failure to perform by any of these counterpartiestheir obligations may arise due to liquidity challenges or insolvency, operational deficiencies or other circumstances such as severe weather or natural disasters, which could impact our ability to provide service to our customers or require us to seek alternative sources for these products and services, if available, whichavailable. A prolonged failure to perform by one or more of our current suppliers or service providers could lead to increased costs adversely impacting our operating results.
Our generating facilities are subject to operational risks that could result in early closure or a sale of our interest.
Early closure of, or the sale of our interest in, a generating facility due to operational or economic factors, environmental regulation or risks of litigation could have a material adverse impact on our operating results. In the event of an early closure, a significant asset impairment charge could be required and we would be obligated to pay for costs of closure of our share of the generating facility. We may not be able to recover our remaining investment and the costs associated with the early closure, include costs associated with decommissioning, remediation, reclamation and restoration of the property, and any costs of terminating contracts associated with the generating facility, such as coal supply arrangements. In the event of a sale of our interest in a generating facility, we may not be able to negotiate the sale on favorable terms,other consequences which could result in the recognition of a loss on the salenegatively impact our financial condition, operating results and other potential liabilities.
The loss of a major generating facility would require OTP to identify and receive approval for other sources of generation for its customers, if available, and expose it to higher purchased power costs. In addition, OTP may not be able to obtain timely regulatory approval for new generation resources to replace closed facilities.
We are subject to risks associated with energy markets.
Our electric business is subject to the risks associated with energy markets, including market supply and changing energy prices. If we are faced with shortages in market supply, we may be unable to fulfill our contractual obligations to our retail, wholesale and other customers at previously anticipated costs. This could force us to obtain alternative energy or fuel supplies at higher costs, or suffer increased liabilityliabilities for unfulfilled contractual obligations. Any significantly higher than expected energy or fuel costs wouldcould negatively affect our financial performance.condition, operating results and liquidity.
MANUFACTURING SEGMENT RISKS
Competition from foreign and domestic manufacturers, theThe price and availability of raw materials trade policy and tariffs affecting prices and markets for raw material and manufactured products, prices and supply of scrap or recyclable material and general economic conditions could affect the revenues and earnings ofadversely impact our manufacturing businesses.operating results.
Our manufacturing businesses are subject to intense risks associated with competition from foreign and domestic manufacturers, many of whom have broader product lines, greater distribution capabilities, greater capital resources, larger marketing, research and development personnel and facilities and other capabilities that may place downward pressure on margins and profitability. The companies in our Manufacturing segment use a variety of raw materials in the products they manufacture including, among others, steel, aluminum, and polystyrene and other plastics resins. Costs for these itemsThe price and availability of the raw materials used in our manufacturing processes are based on global supply and demand conditions, which can fluctuate significantly.create volatile pricing and supply disruptions as conditions change. Federal trade policies, including imposed and proposed tariffs, could significantly increase thecan also impact prices and delivery offor these raw materials such as steel and aluminum thatmaterials. If we are criticalunable to pass cost increases through to our manufacturing businesses. Ifcustomers or are unable to procure adequate or timely raw material inputs for use in our manufacturing businesses are not able to pass on cost increases to their customers, itprocesses, our financial condition, operating results and liquidity could have a negative effect on profit margins in our Manufacturing segment. be negatively impacted.
Additionally, a certain amount of residual material (scrap) is a by-product of the manufacturing and production processes used by our manufacturing companies. Declines in commodity prices for these scrap materials due to weakened demand or excess supply can negatively impact the profitability of our manufacturing companies as it reduces their ability to mitigate the cost associated with excess material. Changes in macroeconomic conditions can negatively impact demand in
Competition from domestic and foreign manufacturers could affect the end-use markets for products and parts that we manufacture, resulting in reduced sales and profits. There is no assurance the initiatives underway to increase revenues and improve margins atearnings of our manufacturing businesses.
Our manufacturing businesses willare subject to intense competition from domestic and foreign manufacturers, many of whom have broader product lines, greater distribution capabilities, greater capital resources, larger marketing, research and development personnel and facilities, and other capabilities. Our ability to compete on product performance, competitive pricing, technological innovation and customer service is critical to our ongoing success. If we are unable to compete in these and potentially other areas, our business and financial condition, operating results and liquidity could be successful.adversely impacted.
Economic conditions in the end markets in which our customers operate cancould have an adverse impact on our operating results of operations and cash flowsliquidity.
Our manufacturing businesses derive a large amount of their revenues from customers in the following industry sectors: recreational vehicle/powersports, lawn and garden, construction, agriculture, energy horticultural and life science.horticulture. Factors affecting any of these industries in general or any of our customers in particular, could adversely affect us because our net salesoperating results as growth in our operating revenues is largely dependsdependent on the continued growth of our customers’ businesses in their respective industries. These factors include:
•seasonality of demand for our customers’ products which may cause our manufacturing capacity to be underutilized for periods of time;
•our customers’ failure to successfully market their products, to gain or retain widespread commercial acceptance of their products or to compete effectively in their industries;
•loss of market share for our customers’ products which may lead our customers to reduce or discontinue purchasing our products and components and to reduce prices, thereby exerting pricing pressure on us;
•economic conditions in the markets in which our customers operate; in particular,operate, the United States in particular, including recessionary periods such as a global economic downturn;
•our customers’ decisiondecisions to insourcebring the production of components in-house that hashave traditionally been outsourced to us; and
•product design changes or manufacturing process changes that may reduce or eliminate demand for the components we supply.
We expect future sales will continue to depend on the success of our customers. If economic conditions or demand for our customers’ products deteriorate,deteriorates, we may experience a material adverse effect on our business,financial condition, operating results and financial condition.liquidity.
Our business and operating results may be adversely affected if we are not able to maintain our manufacturing, engineering and technological expertise.
The markets for our manufacturing businesses are characterized by changing technology and evolving process development. The continued success of our businesses will depend on our ability to:
•hire, retain and expand our pool of qualified engineering and trade-skilled personnel;
•maintain technological leadership in our industry;
•implement new and expand on current robotics, automation and tooling technologies; and
•anticipate or respond to changes in manufacturing processes in a cost-effective and timely manner.
We may not be ableunable to develop the capabilities required by our customers in the future. The emergence of new technologies, industry standards or customer requirements may render our equipment, inventory or processes obsolete or uncompetitive.noncompetitive. We may havebe required to acquire new technologies and equipment to remain competitive. The acquisition and implementation of new technologies and equipment may require us to incur significant expense and capital investment, which could reduce our margins and affect our operating results. When we establish or acquire new facilities, we may not be able to maintain or develop our manufacturing, engineering and technological expertise due to a lack of trained
personnel, effectiveineffective training of new staff or technical difficulties with machinery. Failure to anticipate and adapt to customers’ changing technological needs and requirements to hire and retain a sufficient number of engineers, and to maintain manufacturing, engineering and technological expertise may have a material adverse effecteffects on our businessesfinancial condition, operating results and operating results.
Our manufacturing operations are subject to environmental, health and safety laws and regulations that could result in liabilities to us.
Our manufacturing operations, which include painting and coating processes, are subject to environmental, health and safety laws and regulations, including those governing discharges to air and water, the management and disposal of hazardous substances, the cleanup of contaminated sites and health and safety matters. We could incur material costs, including cleanup costs, civil and criminal fines, penalties and third-party claims for cost recovery, property damage or personal injury as a result of violations of or liabilities under such laws and regulations. The ultimate cost of remediating contaminated sites, if any, is difficult to accurately predict and could exceed estimates. In addition, as environmental, health and safety laws and regulations have tended to become stricter, we could incur additional costs complying with requirements that are promulgated in the future.liquidity.
PLASTICS SEGMENT RISKS
External factors beyond our control could cause fluctuations in demand for our PVC pipe products and changes in our prices and margins, which could adversely impact our operating results.
Our PVC pipe products, sold through distributors and wholesalers, are primarily used in municipal and rural water projects, wastewater projects, storm drainage systems and reclamation systems. External factors beyond our control can cause volatility in demand for our products and sales prices impacting our operating margins. These factors can magnify the impact of economic cycles on our business and results of operations. Examples of external factors include:
•general economic conditions including housing and construction markets which can be cyclical;
•increases in interest rates;
•severe weather and natural disasters;
•governmental regulation in the United States; and
•funding shortages for municipal water and wastewater projects.
Extraordinary industry supply and demand dynamics beginning in 2021 and continuing through 2023 led to a rapid and significant increase in sales prices for PVC pipe and led to a significant expansion in our operating margins. As industry conditions normalize, sales prices for PVC pipe are expected to moderate from current levels resulting in decreased operating margins prospectively. The pace and magnitude of the decline in product pricing could materially impact our operating results.
Changes in PVC resin prices could negatively affect our plastics business.
The PVC pipe industry is highly sensitive to commodity raw material pricing volatility. Historically, when resin prices were rising or stable, margins and sales volumes were higher and when resin prices were falling, sales volumes and margins were lower. Changes in PVC resin prices can negatively affect PVC pipe prices, profit margins on PVC pipe sales and the value of our finished goods inventory.
Our plastics operations are highly dependent on a limited number of vendors for PVC resin and a limited supply of PVC resin.resin and other materials.
We rely on a limited number of vendors to supply the PVC resin used in our plastics business. Two vendors provided over 99%businesses. In 2023, we sourced all of our total purchases of PVC resin in 2020.needs from three vendors. In addition, the supply of PVC resin may be limited primarily due to manufacturing capacity and the limited availability of raw material components. Most U.S. resin production plants are located in the Gulf Coast region, which mayregion. This could increase the risk of a shortage of resin in the event of a hurricane, orother extreme weather events and other natural disasterdisasters in that region. The loss of a key vendor or any interruption or delay in the availability or supply of PVC resin could disrupt our ability to deliver our plastic products, cause customers to cancel orders or require us to incur additional expenses to obtain PVC resin from alternative sources, if such sources arewere available.
Although PVC resin is the most significant raw material input in our PVC pipe manufacturing process, we also use certain other materials, such as stabilizers, gaskets, lumber, banding and others in the process of manufacturing and shipping our PVC pipe products. We generally source these materials from a limited number of suppliers and any significant supply chain constraints or disruptions related to these materials could also disrupt our ability to manufacture or ship products and could result in increased costs.
We compete against many other manufacturers of PVC pipe and manufacturers of alternative products. Customers may not distinguish our products from those of our competitors.
The plastic pipe industry is fragmented and competitive due to the number of producers and the fungible nature of the product. We compete not only against other plastic pipe manufacturers, but also against ductile iron, steel and concrete pipe manufacturers. Due to shipping costs, competition is usually regional instead of national in scope and the principal areas of competition are a combination of price, service, warranty and product performance. Our inability to compete effectively in each of these areas and to distinguish our plastic pipe products from competing products may adversely affect the financial performance of our plastics business.businesses.
Changes in PVC resin prices can negatively affect our plastics business.
The PVC pipe industry is highly sensitive to commodity raw material pricing volatility. Historically, when resin prices are rising or stable, margins and sales volume have been higher and when resin prices are falling, sales volumes and margins have been lower. Changes in PVC resin prices can negatively affect PVC pipe prices, profit margins on PVC pipe sales and the value of our finished goods inventory.
External factors beyond our control can cause fluctuations in demand for our PVC pipe products and changes in our prices and margins, which could adversely impact our operating results.
Our PVC pipe products, sold through distributors and wholesalers, are primarily used in municipal and rural water projects, wastewater projects, storm drainage systems and reclamation systems. External factors beyond our control can cause volatility in raw material prices, demand for our products, prices of our product and volumes and deterioration in operating margins. These factors can magnify the impact of economic cycles on our business and results of operations. Examples of external factors include:
•general economic conditions including housing and construction markets which can be cyclical;
•increases in interest rates;
•severe weather and natural disasters;
•governmental regulation in the United States;
•funding shortages for municipal water and wastewater projects can also adversely impact demand for our products.
•pandemics and other public health threats.
GENERAL RISK FACTORS
Economic conditions could negatively impact our businesses.
Our businesses are affected by local, national and worldwide economic conditions. Tighteningconditions, including the impact of inflation, tightening of credit in financial markets, could adversely affect the ability of customers to finance purchases of our goods and services, resultingeconomic recessions or other changes in decreased orders, cancelled or deferred orders, slower payment cycles, and increased bad debt and customer bankruptcies.economic conditions. Our businesses may also be adversely affected by decreases in the general level of economic activity, such as decreases in business and consumer spending. A decline in the level of economic activity and uncertainty regarding energy and commodity prices could adversely affect our results of operations and our future growth. Inflationary pressures may lead to rising material and commodity costs and increased labor costs. Our operating results and liquidity would be adversely impacted if we were unable to recover these increased costs from our customers. Tightening of credit in financial markets could adversely affect the ability of customers to finance purchases of our goods and services, resulting in decreased orders, cancelled or deferred orders, slower payment cycles, and increased bad debt and customer bankruptcies.
If we are unable to achieve the organic growth we expect, our financial performance may be adversely affected.
We expect much of our growth in the next few years will come from major capital investmentinvestments at existing companies. To achieve the organic growth we expect, we must have access to the capital markets, be successful with capital expansion programs related to organic growth, develop new products and services, expand our markets and increase efficiencies in our businesses. Competitive and economic factors could adversely
affect our ability to do this. If we are unable to achieve and sustain consistent organic growth, we will be less likely to meet our earnings growth targets, which may adversely affect the market price of our common shares.
The effects of a major public health crisis, such as an epidemic or pandemic, and measures taken to reduce and slow the spread of the disease could adversely impact our business.
| | | | | | | | | | | |
| ITEM 1B. | UNRESOLVED STAFF COMMENTS | | |
None.
CYBERSECURITY RISK
The operation of our businesses is dependent on the secure functioning of our computer infrastructure and digital information systems. Furthermore, all our businesses require us to collect and maintain sensitive customer data, as well as confidential employee and shareholder information, which is subject to electronic theft or loss. We also use third-party service providers to electronically process certain of our business transactions and perform certain cyber-related functions, such as system monitoring and critical infrastructure protection and maintenance. The confidentiality, integrity, and availability of information systems, both ours and those of our third-party service providers, are vulnerable to security breaches by computer hackers and cyber terrorists and the negligent or intentional breach of established controls and procedures or mismanagement of confidential information by employees. We may also be impacted by attacks and data security breaches of financial institutions, merchants or other business partners. As part of our utility operations, we own electric generation, transmission and distribution facilities that are part of an interconnected regional grid, the operation of which is dependent on information technology systems. Parties who wish to disrupt the U.S. bulk power system or our utility operations could view our computer systems, software or networks as attractive targets for cyber-attack. Although we have not historically experienced material cyber incidents, we and other utilities are subject to cyber-attacks of increasing frequency and sophistication, and any significant interruption or failure of our information systems or any significant breach of security due to cyber-attacks, hacking or internal security breaches, could adversely affect our business and our financial condition, operating results and liquidity.
RISK MANAGEMENT AND STRATEGY
Our cybersecurity policies and practices, which are based on the Center for Information Security (CIS) Critical Security Controls, are governed by our information and cybersecurity governance program. The CIS Critical Security Controls are a set of 18 cybersecurity-related controls which aid companies in designing an effective control environment and are viewed as best practices by organizations worldwide. A significant number of our cybersecurity policies and practices associated with our electric utility operations are also subject to regulation by multiple governmental and other agencies.
Our information and cybersecurity governance program is the foundation of our cybersecurity risk management strategy. The program includes policies which authorize and guide the development of procedures, standards, and guidelines for personnel activities, incident prevention and reporting, and compliance monitoring. Cybersecurity policies, procedures and controls are reviewed and approved by our Information and Cybersecurity Program (ICSP) group annually, with amendments made as deemed necessary for any updates for regulatory compliance and best practices, legal privacy protection and information protection, or to reflect current technology or new methods for ensuring secure business procedures.
We perform a corporate risk assessment annually, which includes specific consideration and assessment of cybersecurity risk. As part of our risk assessment process, we incorporate results from procedures performed by third-party consultants. We utilize third-party consultants to complete risk quantification analysis and perform penetration and vulnerability testing and monitoring, as well as overall cybersecurity control testing. Potential risks associated with the use of third-party service providers are monitored and managed through an established service provider management policy. Service providers must meet certain security requirements such as security incident or data breach notification and response protocols, data encryption requirements, and data disposal commitments.
In managing cybersecurity risk, we employ a defense-in-depth strategy and regularly monitor our cyber environment for potential new threats. Our strategy includes employee training and awareness on cybersecurity risks and related best practices, required password complexity, the use of multi-factor authentication, information security protocols, anti-virus and anti-ransomware software, a patch management program, the execution of tabletop exercises on a periodic basis, established policies and protocols for cyber incident response planning and reporting, and ongoing internal cybersecurity testing.
GOVERNANCE
At the management level, our cyber program is managed by our ICSP group. The ICSP group consists of Information Technology (IT) managers, IT security subject matter experts, and internal audit personnel and is led by our Vice President of IT who has more than 25 years of experience in IT, enterprise security, and cyber risk management, a Bachelor's degree of Science, CIS, Information Technology and Master's of Business, Information Systems, and holds Certified Information Systems Security Professional, Certified Information Security Manager, and Certified Data Privacy Solution Engineer designations. The ICSP group is in charge of developing, maintaining, and measuring compliance with the information and cybersecurity governance program, as well as monitoring cyber incidents and implementing mitigation measures as part of an evolving, dynamic external environment. Our approach to cybersecurity incident reporting and response planning is governed by our incident response plans established for
each of our business units. The plans outline the processes related to detecting, assessing, investigating, mitigating, and remediating cyber incidents, as well the communication and reporting plan and the required personnel to be included in the process and communications.
Our cybersecurity risk management is integrated into our overall risk management system through our internal business risk management process. Our business risk management group works closely with our ICSP group to regularly assess and identify possible material risks from cybersecurity threats, including, but not limited to, financial, operations, reputational and regulatory impact to the Company, as well as impacts on our employees and customers. Their risk assessment results are reported to the Executive Risk Committee on a quarterly basis. The Executive Risk Committee, which is comprised of our executive officers, meets quarterly to identify and assess short-, medium- and long-term risks, and to ensure adequate mitigation strategies are implemented. During these meetings, the Executive Risk Committee reviews significant and emerging risks, including cybersecurity risks, and assesses the Company’s plans to mitigate or otherwise manage and monitor those risks.
Our Board of Directors provides oversight of our cybersecurity program through quarterly and annual risk review and cybersecurity reporting. On a quarterly basis, cybersecurity risk and mitigation strategies are reviewed as part of our business risk management group's reporting to the Board of Directors, which includes the reporting of significant business risks, including cybersecurity mitigation strategies employed to manage these risks, and a review of any emerging risks. Annually, our Vice President of IT provides an overview of our cybersecurity program to the Board of Directors, including a review of key strategies, emerging risks and a summary of key performance indicators. In addition, annually the Board of Directors reviews the results of our penetration and vulnerability testing.
The Coyote Station,following provides a summary of our properties which commenced operation in 1981, is a 414,000 kW (nameplate rating) mine-mouth plant located in the lignite coal fields near Beulah, North Dakota and is jointly ownedare material to our operations, by OTP, Northern Municipal Power Agency, Montana-Dakota Utilities Co. and Northwestern Public Service Company. OTP is the operating agent of the Coyote Station and owns 35% of the plant.
OTP, jointly with Northwestern Public Service Company and Montana-Dakota Utilities Co., owns the 414,000 kW (nameplate rating) Big Stone Plant in northeastern South Dakota which commenced operation in 1975. OTP is the operating agent of Big Stone Plant and owns 53.9% of the plant.
Located near Fergus Falls, Minnesota, the Hoot Lake Plant is comprised of two separate generating units: a unit built in 1959 (53,500 kW nameplate rating) and a unit added in 1964 (75,000 kW nameplate rating) and modified in 1988 to provide cycling capability, allowing this unit to be more efficiently brought online from a standby mode. These two generating units have a combined nameplate rating of 128,500 kW. Current plans are for both units to be retired from service in 2021.
OTP owns the 245,000 kW (nameplate rating) Astoria Station simple-cycle natural gas-fired combustion turbine generation facility near Astoria, South Dakota, scheduled to begin commercial operation in March 2021.
OTP owns 27 wind turbines at the Langdon, North Dakota Wind Energy Center with a nameplate rating of 40,500 kW, 32 wind turbines at the Ashtabula Wind Energy Center located in Barnes County, North Dakota with a nameplate rating of 48,000 kW, 33 wind turbines at the Luverne Wind Farm located in Griggs and Steele Counties, North Dakota with a nameplate rating of 49,500 kW and 75 wind turbines at the Merricourt Wind Energy Center located in McIntosh and Dickey Counties, North Dakota with a name plate rating of 150,000 kW.
Assegment, as of December 31, 2020, OTP’s transmission2023.
ELECTRIC SEGMENT
The following reflects our wholly or jointly owned material electric generation facilities which are interconnected with linesas of other public utilities, consisted of 780 miles of 345 kV lines, of which 731 miles are jointly owned; 495 miles of 230 kV lines, of which 70 miles are jointly owned; 917 miles of 115 kV lines; and 4,011 miles of lower voltage lines, principally 41.6 kV. OTP owns the uprated portion of 48 miles of the 345 kV lines, with Minnkota Power Cooperative retaining title to the original 230 kV construction, and OTP owns an undivided interest in the remaining 345 kV line miles. OTP is a joint owner, with other regional utilities, in transmission lines with the following ownership interests: 14.8% in the 70 mile Bemidji-Grand Rapids 230 kV line, approximately 14.2% of 242 miles of energized line in the Fargo–Monticello 345 kV project, approximately 4.8% of 255 miles of energized line in the Brookings to Southeast Twin Cities 345 kV project, 50.0% of 72 miles of energized line in the Big Stone South–Brookings 345 kV project, and 50.0% of 162 miles of energized line in the Big Stone South–Ellendale 345 kV project.December 31, 2023:
| | | | | | | | | | | | | | |
| Description | Location | Year
Placed in Service | Fuel Type | Capacity - kW
(Nameplate Rating) |
| | | | |
Big Stone Plant(1) | Big Stone City, SD | 1975 | Subbituminous Coal | 223,146 | |
Coyote Station(2) | Beulah, ND | 1981 | Lignite Coal | 144,900 | |
| Jamestown Combustion Turbines | Jamestown, ND | 1975 | Fuel Oil | 48,108 | |
| Lake Preston Combustion Turbine | Lake Preston, SD | 1978 | Fuel Oil | 24,100 | |
| Solway Combustion Turbine | Solway, MN | 2003 | Natural Gas/Fuel Oil | 44,500 | |
| Astoria Station | Astoria, SD | 2021 | Natural Gas | 245,000 | |
| Langdon Wind Energy Center | Cavalier County, ND | 2007 | Wind | 40,500 | |
| Ashtabula Wind Energy Center | Barnes County, ND | 2008 | Wind | 48,000 | |
| Luverne Wind Energy Center | Griggs and Steele Counties, ND | 2009 | Wind | 49,500 | |
| Merricourt Wind Energy Center | McIntosh and Dickey Counties, ND | 2020 | Wind | 150,000 | |
| Ashtabula III Wind Energy Center | Barnes County, ND | 2023(3) | Wind | 62,400 | |
| Hoot Lake Solar | Otter Tail County, MN | 2023 | Solar | 49,900 | |
| | | | |
(1) OTP holds a 53.9% joint ownership interest in this jointly owned facility. The nameplate capacity indicated reflects OTP's ownership percentage. |
(2) OTP holds a 35.0% joint ownership interest in this jointly owned facility. The nameplate capacity indicated reflects OTP's ownership percentage. |
(3) Originally placed in service in 2010 and owned by an unrelated third party. OTP acquired this facility in 2023. |
In addition to our generation facilities, we wholly or jointly own transmission and distribution lines as of December 31, 2023 as follows: | | | | | |
| Miles |
| |
| Transmission | |
345 kV(3) | 891 | |
230 kV(4) | 496 | |
| 115 kV | 961 | |
| Less than 115 kV | 4,005 | |
| Distribution | |
| Less than 115 kV | 7,998 | |
| |
(3) As of December 31, 2023, OTP held a 14.2% ownership interest of 242 miles, a 4.8% ownership interest of 250 miles, and a 50.0% ownership interest of 234 miles of the 345 kV transmission lines, with the remaining miles being wholly owned. |
(4) As of December 31, 2023, OTP held a 14.8% ownership interest of 70 miles of the 230 kV transmission lines, with the remaining miles being wholly owned. |
MANUFACTURING AND PLASTICS SEGMENTS
The following reflects the material properties of our Manufacturing and Plastic segments as of December 31, 2023:
| | | | | | | | | | | |
| Segment/Location | Owned/Leased | Facility Type/Use | Approximate
Square Feet |
| | | |
| Manufacturing Segment | | | |
| Washington, IL | Leased | Office/Manufacturing/Warehouse | 217,508 | |
| Detroit Lakes, MN | Owned | Office/Manufacturing/Warehouse | 353,812 | |
| Lakeville, MN | Leased | Office/Manufacturing/Warehouse | 413,000 | |
| Dawsonville, GA | Owned | Office/Manufacturing/Warehouse | 172,000 | |
| Buford, GA | Leased | Warehouse | 71,357 | |
| Clearwater, MN | Owned | Office/Manufacturing/Warehouse | 203,840 | |
| Otsego, MN | Leased | Manufacturing/Warehouse | 86,400 | |
| Plastics Segment | | | |
| Fargo, ND | Owned | Office/Manufacturing/Warehouse | 122,441 | |
| Phoenix, AZ | Owned | Office/Manufacturing/Warehouse | 87,336 | |
| | | |
We are currently undertaking an expansion project at our Georgia location which will add approximately 162,000 square feet of manufacturing and warehouse space, and will replace the warehouse facility that is currently being leased. We anticipate the project will be completed in 2025. We are also undertaking an expansion project at our Arizona location which will add approximately 65,000 square feet of manufacturing, warehouse, and office space. We anticipate the project will be completed in 2024.
We believe the facilities described above, all of which are utilized byalong with the Electric segment, the Company owns and has investments in offices and service buildings utilized by each of its manufacturing and plastic pipe companies. The Company’s subsidiaries own facilities and equipment used in the manufacture of PVC pipe, thermoformed products, heavy metal fabricated products, metal parts stamping, fabricating, painting and contract machining.
Management of the Company believes the facilities and equipment described aboveplanned expansions, are adequate for the Company’sour present business.
| | | | | | | | |
| ITEM 3A. | INFORMATION ABOUT OUR EXECUTIVE OFFICERS | |
Set forth below is a summary of the principal occupations and business experience during the past five years of the executive officers as defined by rules of the SEC. Each of the executive officers has been employed by the Company for more than five years in an executive or management position either with the Company or its wholly owned subsidiary, Otter Tail Power Company.
| | | | | | | | |
| Name and Age | Date Elected to Office | Current Position |
| | |
Charles S. MacFarlane (56)(59) | 04/13/15 | President and Chief Executive Officer |
| Todd R. Wahlund (53) | Kevin G. Moug (61)01/01/24 | 04/09/01 | Vice President, Chief Financial Officer and Senior Vice President |
Timothy J. Rogelstad (54)(57) | 04/14/14 | Senior Vice President, Electric Platform |
John S. Abbott (62)(65) | 02/11/15 | Senior Vice President, Manufacturing Platform |
Jennifer O. Smestad (50)(53) | 01/01/18 | Vice President, General Counsel and Corporate Secretary |
| | |
Chuck MacFarlane has served as the Company’s President and Chief Executive Officer and as a member of the Company’s boardBoard of directorsDirectors since April 13, 2015.
Todd Wahlund was appointed to succeed Kevin Moug, Chief Financial Officer and Senior Vice President, subsequent to Mr. Moug's retirement on December 31, 2023. Mr. Wahlund has served as Chief Financial Officer and Senior Vice President of the Company since April 9, 2001.January 1, 2024, and previously served as Chief Financial Officer and Vice President, Finance for OTP from May 1, 2018 to December 31, 2023.
Timothy Rogelstad has served as President of OTP and Senior Vice President, Electric Platform of the Company since April 14, 2014.
John Abbott has served as Senior Vice President, Manufacturing Platform, since February 5,11, 2015.
Jennifer Smestad was appointed to the position ofhas served as Vice President, General Counsel and Corporate Secretary of the Company, effectivesince January 1, 2018. Ms. Smestad joined the Company on May 14, 2001 as an Associate General Counsel and has served in various legal capacities of increasing responsibility at the Company and at OTP. She most recentlyalso served as General Counsel for OTP fromsince March 1, 2013 to the present.2013.
The term of office for each of the executive officers is one year and any executive officer elected may be removed by the vote of the board of directors at any time during the term. There are no family relationships between any of the executive officers or directors.
| | | | | | | | | | | |
| ITEM 4. | MINE SAFETY DISCLOSURES | | |
Not Applicable.
PART II
| | | | | |
| ITEM 5. | MARKET FOR THE REGISTRANT'S COMMON EQUITY, RELATED STOCKHOLDER MATTERS AND ISSUER PURCHASES OF EQUITY SECURITIES |
Our common stock is traded on the Nasdaq Global Select Market under the Nasdaq symbol “OTTR”. As of December 31, 2020,2023, there were approximately 12,34410,650 holders of record of our common stock.
We do not have a publicly announced stock repurchase program and we did not repurchase any equity securities during the yearquarter ended December 31, 2020.2023.
PERFORMANCE GRAPH COMPARISON OF FIVE-YEAR CUMULATIVE TOTAL RETURN
This graph compares the cumulative total shareholder return on our common shares for the last five years with the cumulative return of Thethe Nasdaq Stock Market Index and the Edison Electric Institute (EEI) Index over the same period (assuming the investment of $100 in each vehicle on December 31, 2015,2018, and reinvestment of all dividends).
| | | | | | | | | | | | | | | | | | | | | | | | | | | | | | | | | | | |
| 2015 | | 2016 | | 2017 | | 2018 | | 2019 | | 2020 |
| | | | | | | | | | | |
| OTTR | $ | 100.00 | | | $ | 159.07 | | | $ | 178.72 | | | $ | 205.42 | | | $ | 218.12 | | | $ | 187.64 | |
| EEI | $ | 100.00 | | | $ | 117.44 | | | $ | 131.19 | | | $ | 136.02 | | | $ | 171.09 | | | $ | 169.10 | |
| Nasdaq | $ | 100.00 | | | $ | 113.01 | | | $ | 137.17 | | | $ | 129.71 | | | $ | 170.14 | | | $ | 206.32 | |
| | | | | | | | | | | |

| | | | | | | | | | | | | | | | | | | | | | | | | | | | | | | | | | | |
| 2018 | | 2019 | | 2020 | | 2021 | | 2022 | | 2023 |
| | | | | | | | | | | |
| OTTR | $ | 100.00 | | | $ | 105.64 | | | $ | 90.88 | | | $ | 156.27 | | | $ | 133.22 | | | $ | 197.24 | |
| EEI | $ | 100.00 | | | $ | 125.79 | | | $ | 124.33 | | | $ | 145.61 | | | $ | 147.29 | | | $ | 134.47 | |
| Nasdaq | $ | 100.00 | | | $ | 131.17 | | | $ | 159.07 | | | $ | 200.26 | | | $ | 160.75 | | | $ | 203.23 | |
| | | | | | | | | | | |
| | | | | |
| ITEM 7. | MANAGEMENT'S DISCUSSION AND ANALYSIS OF FINANCIAL CONDITION AND RESULTS OF OPERATIONS |
You should read the following discussion and analysis of our financial condition and results of operations together with our financial statements and the related notes appearing under Item 8 of this Form 10-K. Otter Tail Corporation and its subsidiaries form a diverse group of businesses with operations classified into three segments: Electric, Manufacturing and Plastics. Our Electric business is a vertically integrated, regulated utility with generation, transmission and distribution facilities to serve our customers in western Minnesota, eastern North Dakota and northeastern South Dakota. Our Manufacturing segment provides metal fabrication for custom machine parts and metal components, and manufactures extruded and thermoformed plastic products. Our Plastics segment manufactures PVC pipe for use in, among other applications, municipal and rural water, wastewater and water reclamation projects.
Our strategy includes investing in rate base growth opportunities in our Electric segment and capitalizing on organic growth opportunities in our Manufacturing and Plastics segments. Investments in our Electric segment willare expected to produce increased earnings and cash flows, lower our overall risk, create a more predictable earnings stream, improve our credit quality and preserve our ability to fund our dividend. Organic growth inOur Electric segment is complemented by our Manufacturing and Plastics segments comes fromsegment businesses, which we expect to contribute to earnings growth by capitalizing
on market expansion new productsopportunities and services, increased efficiencies and targeted capital investments.
Allincreasing utilization of our businesses in 2020 were confronted with operational or financial challenges resulting from the coronavirus (COVID-19) pandemic. Throughout the pandemic, we focused on maintaining the health and safety of our employees, customers and communities and ensuring continued electrical reliability and continuous delivery of products to our customers.
We expect reliable utility performanceexisting capacities, along with rate base investment opportunities over the next five years will provide us with a strong and growing base of revenues, earnings and cash flows. We also lookplanned investments to our manufacturing and plastic pipe companies to provide organic growth as well. Organic, internal growth comes from new products and services, market and plant expansioncreate additional capacity and increased efficiencies. We expect muchCollectively, our mix of businesses is expected to contribute to the achievement of our long-term targeted annual growth in these businessesearnings per share of 5 - 7%.
2023 FINANCIAL RESULTS
In 2023, our diversified business model generated record financial results, producing net income of $294.2 million, or $7.00 per diluted share, an increase of 4% from $284.2 million, or $6.78 per diluted share, in 2022. Our financial results for the next few years will come from utilizing expanded plant capacity from capital investments made in previous years. We will also evaluate opportunities to allocate capital to potential acquisitions across our reporting segments. We are a committed long-term owner and do not acquire companies in pursuit of short-term gains. However, we will divest operating companies that no longer fit into our strategy and risk profile over the long term.
Our Electric segment continued the construction of rate base investments, including our Merricourt wind farm and Astoria Station natural gas combustion turbine in 2020. Merricourt is a 150-megawatt wind farm in southeastern North Dakota. Construction commenced in 2019 and the project was substantially completed in December 2020. Astoria Station is a 245-megawatt simple cycle natural gas combustion turbine generation facility near Astoria, South Dakota. Construction began in 2019 and we anticipate the facility will be in commercial operation in the first quarter of 2021. These rate base investments contributed to our Electric segmentyear were driven by earnings growth in 2020.
The operating results of our Electric and Manufacturing segment were most significantly impactedsegments, as well as lower corporate costs, as we benefited from returns on our short-term investments funded by the effects of COVID-19 with product demand significantly decreasing insignificant cash flows our businesses have generated over the second quarterlast three years. Our Plastics segment again produced extraordinary financial results as our customers slowed or temporarily shutdown their plant operations. Demand rebounded in certain end markets in the third and fourth quarters of 2020. Our Manufacturing businesses effectively managed their operations to meet the level of demand in the marketplace.
Our Plastic segment businesses were ablewe continued to capitalize on opportunitiesfavorable industry dynamics; however, earnings in this segment did decline modestly from the marketplace arising due to supply disruptions and increasing global demand for PVC resin. Our ability to meet this demand created opportunities for increased product sales volumes and gross profit margins and resultedrecord level achieved in a 33% increase in operating income in 2020.
2022. In 2020 we accessed the capital markets to finance our capital investments. We issued $75.0 million of debt during 2020 and issued 1.3 million shares of common stock for net proceeds of $49.7 million under our various equity programs. Finally,2023, we paid an annual dividend of $1.48$1.75 per share, or $60.3$73.1 million, completing our 82nd85th consecutive year of dividend payments to our shareholders.
Our net income in 2020 was $95.9 million, or $2.34 per diluted share, an increase of 10.4% from 2019 of $86.8 million, or $2.17 per diluted share. Our financial results were primarily driven by earnings in our Electric segment produced earnings growth of 6% in 2023, from returns on our rate base investments$80.0 million in 2022 to $84.4 million in 2023, primarily due to increased rider revenue, increased commercial and management of ourindustrial sales, and lower pension and other postretirement benefit costs, partially offset by increased operating and maintenance expenses and the impact of unfavorable weather.
Our Manufacturing segment produced earnings growth of 2% in our Plastics segments2023, from $21.0 million in 2022 to $21.5 million in 2023, primarily due to increased sales volumes at our metal fabrication business driven by strong end market demand across several markets we serve, and gross profit margins.incremental volumes from additional work with existing customers. Increased sales volumes at our metal fabrication business were partially offset by increased labor and overhead costs, as well as decreased horticulture product sales volumes at our plastic thermoforming business.
Our Plastics segment earnings declined 4%, from $195.4 million in 2022 to $187.7 million in 2023. We experienced an unprecedented level of earnings in 2022, resulting from extraordinary industry supply and demand dynamics. Industry dynamics have begun to moderate, but at a modest pace, as further described below. Our Plastics segment businesses continued to capitalize on these industry conditions in 2023, producing earnings significantly in excess of pre-2021 levels.
Our earnings mix in 20202023 was 70%29% from our Electric segment and 30%71% from the combination of our Manufacturing and Plastics segments andexcluding unallocated corporate costs. Electric segment earnings as a percentage of our total earnings were less than our long-term estimatetarget of 75%65% due to very strongthe unique market conditions occurring in the plastics industry.
PVC PIPE SUPPLY AND DEMAND CONDITIONS
Extraordinary supply and demand conditions in the PVC industry beginning in 2021 have led to a significant expansion in operating margins and elevated earnings in our Plastics segment earningsover the past three years. Periodic disruptions in 2020.
COVID-19
We continue to monitor the progressionsupply of resin, the novel coronavirus (COVID-19) and its impact on our businesses, employees, customers, construction contractors and vendors. As this pandemic continues, we are followingprimary material input used in the directives and advicemanufacturing of government leaders and medical professionals and have adopted practices to help curtail the spread of the virus and mitigate its impact on our communities, employees, construction contractors, customers and business operations. Our Electric segment business provides a critical service to our customers and our manufacturing businesses provide products and support to critical infrastructure industries. We continue to operate our businesses in a manner that is safePVC pipe, coupled with robust demand for our employees and our customers.
COVID-19 and the resulting economic conditions have had a material negative impact on the results of operations in our Manufacturing segment, and,resin, led to a lesser extent, also impactedsignificant increase in the resultscost of operationsresin beginning in 2021. Low industry volumes of PVC pipe and robust end market demand for the product led to a rapid and significant increase in sales prices for PVC pipe, significantly outpacing the increase in resin input costs, leading to increased operating margins within our Electric and Plastics segments, but have not had a material impact on our consolidated financial position or liquidity.segment.
Customer demand in our Manufacturing segment declined significantlyDemand for PVC pipe began to soften in the second quarterhalf of 2020. Sales2022, as distributors and contractors reduced purchase volumes strengthened in response to uncertain and competitive market conditions. Softening demand continued through the third and fourth quartersfirst half of the year due to strong recreational vehicle and lawn and garden end-market demand. Within our Electric segment, we experienced reduced demand from commercial and industrial customers, increased costs for bad debts, and had to manage through COVID-19-related disruptions at our construction sites, including Merricourt and Astoria Station, which posed a risk of construction delays and increased project costs. In our Plastics segment, we experienced lower2023, but sales volumes in the second quarterhalf of 2020 as distributors reduced inventory levels given the uncertaintyyear exceeded those in the previous year. Resin prices have declined from the previous year and although sales prices for PVC pipe have also declined, they have declined at a slower pace than resin prices, continuing to produce expanded operating margins from those experienced in 2022.
The unique market dynamics impacting our Plastics segment resulted in a significant increase in earnings in the last three years compared to historical levels. We expect these market conditions to gradually normalize over the impactcourse of COVID-19. Sales volumes recovered2024 and gross profit margins increased in the third and fourth quarters due to increasing demand and concerns of supply disruptions.
Beginning in April 2020, in response to the actual and anticipated impact of COVID-19 oninto 2025. The marketplace dynamics impacting our business operations, we implemented a variety of policies, including furloughs, shift and pay reductions, wage and hiring freezes, suspension of certain employee benefits, a workforce reduction and other cost reduction efforts to mitigate the negative impact to our financial results. We continued to monitor the impacts of the pandemic on our businesses throughout the remainder of 2020 and adjusted our response as circumstances evolved.
We expect COVID-19 and the resulting economic conditions will continue to impact demand from commercial and industrial customers within our Electric segment and could disrupt customer demand within our Manufacturing and Plastics segments as the pandemic evolves. We also expect bad debt costs withinare fluid and subject to change and may impact our Electric segment will remain elevated due to the economic disruption created by the pandemic. COVID-19 also could cause disruptions in our capital expenditure plans, including project delays and increased project costs.
We continue to monitor developments involving our workforce, customers, construction contractors, suppliers and vendors and the financial effects on our business. However, due to the unprecedented and evolving nature of this pandemic, we cannot predict the full extent COVID-19 will have on ouroperating results of operations, financial condition and liquidity.prospectively.
| | | | | |
| FINANCIAL AND OTHER METRICS | |
Heating Degree Days (HDDs) is a measure of how much (in degrees), and for how long (in days), the outside air temperature was below a certain normalized level. Normal weather conditions are defined as the 20-year average of actual historical weather conditions. This measure is commonly used in calculations relating to the energy consumption required to heat buildings.
Cooling Degree Days (CDDs) is a measure of how much (in degrees), and for how long (in days), the outside air temperature was above a certain normalized level. This measure is commonly used in calculations relating to the energy consumption required to cool buildings.
Otter Tail Power Company (OTP)OTP generally bases its forecasted kilowatt-hour (kwh)kwh sales and rates on expected consumption under a normal level of HDDs and CDDs over a given period of time in its service territory. Increased or decreased levels of consumption for certain customer classifications are attributed to deviation from the norms and are a significant factor influencing consumption of electricity across our service territory. We present HDDs and CDDs to provide an indication of the impact of weather on kwh sales, revenues and earnings relative to forecast, and on period-to-period results.
Utility Rate Base is the value of property on which a public utility is permitted to earn a specified rate of return in accordance with rules set by a regulatory agency. In general, the rate base consists of the value of property used by the utility in providing service. Rate base can also include:include cash, working capital, materials and supplies, construction work in progress, deductions for accumulated provisions for depreciation, contributions in aid of construction, customer advances for construction, accumulated deferred income taxes, and, in some cases, accumulated deferred investment tax credits, dependent on the method that is used in the calculation, which can vary from jurisdiction to jurisdiction.ITCs. We present actual and forecasted levels of utility rate base in our outlook to provide an indication of expected investments on which we expect to earn future returns.
For a comparison of fiscal year 20192022 to 2018,2021, see Part II, Item 7 “Management’s Discussion and Analysis of Financial Condition and Results of Operations” in our report on Form 10-K for the fiscal year ended December 31, 2019,2022, filed with the SEC on February 20, 2020 and incorporated by reference into this report on Form 10-K.15, 2023. Provided below is a summary and discussion of our operating results on a consolidated basis followed by a discussion of the operating results of each of our segments, Electric, Manufacturing and Plastics. Intersegment transactions were not material in 2020 or 2019 and amounted to less than $0.1 million of operating revenues and operating expenses for each year. In addition to the segment results, we provide an overview of our Corporate costs. Our Corporate costs do not constitute a reportable segment, but rather consist of unallocated general corporate expenses, such as corporate staff and overhead costs, the results of our captive insurance company and other items excluded from the measurement of segment performance. Corporate costs are added to operating segment totals to reconcile to totals on our consolidated statements of income.
CONSOLIDATED RESULTS
The following table summarizes our consolidated results of operations for the years ended December 31, 20202023 and 2019: | | | | | | | | | | | | | | | | | | | | | | | |
| (in thousands) | 2020 | | 2019 | | $ change | | % change |
| | | | | | | |
| Operating Revenues | $ | 890,107 | | | $ | 919,503 | | | $ | (29,396) | | | (3.2) | % |
| Operating Expenses | 742,221 | | | 784,623 | | | (42,402) | | | (5.4) | |
| Operating Income | 147,886 | | | 134,880 | | | 13,006 | | | 9.6 | |
| Interest Charges | 34,447 | | | 31,411 | | | 3,036 | | | 9.7 | |
| Nonservice Cost Components of Postretirement Benefits | 3,437 | | | 4,293 | | | (856) | | | (19.9) | |
| Other Income | 6,055 | | | 5,112 | | | 943 | | | 18.4 | |
| Income Before Income Taxes | 116,057 | | | 104,288 | | | 11,769 | | | 11.3 | |
| Income Tax Expense | 20,206 | | | 17,441 | | | 2,765 | | | 15.9 | |
| Net Income | $ | 95,851 | | | $ | 86,847 | | | $ | 9,004 | | | 10.4 | % |
| | | | | | | | | | | | | | | | | | | | | | | |
| (in thousands) | 2023 | | 2022 | | $ change | | % change |
| | | | | | | |
| Operating Revenues | $ | 1,349,166 | | | $ | 1,460,209 | | | $ | (111,043) | | | (7.6) | % |
| Operating Expenses | 971,247 | | | 1,069,770 | | | (98,523) | | | (9.2) | |
| Operating Income | 377,919 | | | 390,439 | | | (12,520) | | | (3.2) | |
| Interest Expense | (37,677) | | | (36,016) | | | (1,661) | | | 4.6 | |
| Nonservice Components of Postretirement Benefits | 10,597 | | | 1,075 | | | 9,522 | | | n/m |
| Other Income | 12,650 | | | 2,037 | | | 10,613 | | | n/m |
| Income Before Income Taxes | 363,489 | | | 357,535 | | | 5,954 | | | 1.7 | |
| Income Tax Expense | 69,298 | | | 73,351 | | | (4,053) | | | (5.5) | |
| Net Income | $ | 294,191 | | | $ | 284,184 | | | $ | 10,007 | | | 3.5 | % |
Operating Revenues decreased $29.4$111.0 million primarily due to reduced demandon a consolidated basis in our Manufacturing segment as our customers were impacted by the economic effects of COVID-19. In addition,2023. Electric segment operating revenues were impacted by lower recoveries ofdecreased 4% primarily due to decreased fuel recovery and purchased power costswholesale revenues and the impact of unfavorable weather, but partially offset by increased rider revenues and increased commercial and industrial sales. Manufacturing segment operating revenues earned onincreased 1% primarily due to higher sales volumes in our rate base investments.metal fabrication business. Plastics segment revenue increased in 2020operating revenues decreased 18% due to favorable market conditions benefitinga combination of decreased sales volumes and sales prices. See our segment disclosures below for additional discussion of items impacting operating revenues.
Operating Expenses decreased $42.4$98.5 million in 20202023. Electric segment operating expenses decreased primarily due to decreased purchased power costs resulting from lower market energy prices and lower fuel costs of products solddue to decreased natural gas prices. Operating expenses in our Manufacturing segment as a result of the reduced sales volumes and lower fuel and purchased power costs in our Electric segment. Partially offsetting these decreases were higher costs of products sold in our Plastics segmentincreased primarily due to increased sales volumes in 2020our metal fabrication business and an increase in committed contributionscertain variable compensation costs. Operating expenses in our Plastics segment decreased primarily due to our charitable foundations.lower sales volumes and decreased PVC resin costs. See our segment disclosures below for additional discussion of items impacting operating expenses.
Interest ChargesExpense increased $3.0$1.7 million in 20202023 due to debt issuancesan increase in our average short-term borrowings, primarily used to fund capital investments in our Electric segment, in the fourth quarter of 2019 and the first and third quarters of 2020, and increased outstanding borrowings underinterest rates on our short-term debt arrangements. The increase in our short and long-term debt borrowings were largely used to finance the rate base investments in our Electric segment.borrowings.
Nonservice Cost Components of Postretirement Benefits decreased $0.9improved by $9.5 million in 2020 mostly2023, having a positive impact on net income, primarily due to a decreasechange in actuarial assumptions used to measure our pension plan nonservice costs, mainly actuarial loss amortization expenses, partially offset by interest cost increases onbenefit and postretirement benefit plans.obligations, including an increase in the discount rate applied and an increase in the expected return on assets assumption.
Other Income increased $0.9$10.6 million in 20202023 primarily due to a $1.5 millionan increase in allowance for equity funds used during construction (AFUDC)investment income earned on Electric segment construction work in progress, mainly for the Minnesota share of the Astoria Station project, partially offset by $0.6 million of decreases in theour short-term cash values ofequivalent investments and investment gains from our corporate-owned life insurance policies interest income and other miscellaneous income.compared to investment losses in the previous year.
Income Tax Expense increased $2.8decreased $4.1 million in 20202023 primarily due to increased income before income taxes along with reductionsan increase in certain permanent differences. These increases were partially offsetPTCs produced by production tax credits generated in 2020 from our Merricourt wind farm placed in service in the fourth quarter of 2020.and solar generation assets. Our effective tax rate was 17.4%19.1% in 20202023 and 16.7%20.5% in 2019.2022. See Note 12 to our consolidated financial statements included in thethis report on Form 10-K for additional information regarding factors impacting our effective tax rate in 2020 and 2019.rate.
ELECTRIC SEGMENT RESULTS
The following table summarizes the operating results of operations for our Electric segment for the years ended December 31, 20202023 and 2019:2022:
| | (in thousands) | (in thousands) | 2020 | | 2019 | | $ change | | % change | (in thousands) | 2023 | | 2022 | | $ change | | % change |
| | Retail Sales Revenue | |
| Retail Sales Revenue | |
| Retail Sales Revenue | Retail Sales Revenue | $ | 389,522 | | | $ | 406,478 | | | $ | (16,956) | | | (4.2) | % | $ | 455,840 | | | $ | | $ | 470,300 | | | $ | | $ | (14,460) | | | (3.1) | | (3.1) | % |
| Transmission Services Revenues | Transmission Services Revenues | 44,001 | | | 40,542 | | | 3,459 | | | 8.5 | |
| Wholesale Revenues | Wholesale Revenues | 4,857 | | | 5,007 | | | (150) | | | (3.0) | |
| Other Electric Revenues | Other Electric Revenues | 7,750 | | | 7,070 | | | 680 | | | 9.6 | |
| Total Operating Revenue | Total Operating Revenue | 446,130 | | | 459,097 | | | (12,967) | | | (2.8) | |
| Production Fuel | Production Fuel | 46,296 | | | 59,256 | | | (12,960) | | | (21.9) | |
| Purchased Power | Purchased Power | 61,698 | | | 72,066 | | | (10,368) | | | (14.4) | |
| Operation and Maintenance Expenses | 150,848 | | | 153,529 | | | (2,681) | | | (1.7) | |
| Operating and Maintenance Expenses | |
| Depreciation and Amortization | Depreciation and Amortization | 63,171 | | | 60,044 | | | 3,127 | | | 5.2 | |
| Property Taxes | Property Taxes | 17,034 | | | 15,785 | | | 1,249 | | | 7.9 | |
| Operating Income | Operating Income | $ | 107,083 | | | $ | 98,417 | | | $ | 8,666 | | | 8.8 | % | Operating Income | $ | 106,521 | | | $ | | $ | 113,138 | | | $ | | $ | (6,617) | | | (5.8) | | (5.8) | % |
| Electric kilowatt-hour (kwh) Sales (in thousands) | | | | |
Electric kwh Sales (in thousands) | |
Electric kwh Sales (in thousands) | |
Electric kwh Sales (in thousands) | |
| Retail kwh Sales | Retail kwh Sales | 4,776,687 | | | 4,969,089 | | | (192,402) | | | (3.9) | % |
| Wholesale kwh Sales – Company Generation | 236,528 | | | 198,569 | | | 37,959 | | | 19.1 | |
| Retail kwh Sales | |
| Retail kwh Sales | | 5,772,215 | | | 5,592,368 | | | 179,847 | | | 3.2 | % |
| Wholesale kwh Sales | |
| Heating Degree Days | Heating Degree Days | 6,174 | | | 7,240 | | | (1,066) | | | (14.7) | |
| Cooling Degree Days | Cooling Degree Days | 534 | | | 392 | | | 142 | | | 36.2 | |
|
Results of operations for theOur Electric segment operating results are impacted by fluctuations in weather conditions and the resulting demand for electricity for heating and cooling. The following table showspresents heating and cooling degree days as a percent of normal.normal for the years ended December 31, 2023 and 2022:
| | | | 2020 | | 2019 | | 2023 | | 2022 |
| | Heating Degree Days | Heating Degree Days | 97.2 | % | | 115.6 | % |
| Heating Degree Days | |
| Heating Degree Days | | 98.4 | % | | 112.5 | % |
| Cooling Degree Days | Cooling Degree Days | 116.3 | % | | 85.0 | % | Cooling Degree Days | 127.2 | % | | 113.5 | % |
|
The following table summarizes the estimated effect on diluted earnings per share of the difference in retail kwh sales under actual weather conditions and expected retail kwh sales under normal weather conditions in 2020for the years ended December 31, 2023 and 2019,2022, and between years.years:
| | | | | | | | | | | | | | | | | |
| | 2020 vs Normal | | 2020 vs 2019 | | 2019 vs Normal |
| | | | | |
| Effect on Diluted Earnings Per Share | $ | — | | | $ | (0.08) | | | $ | 0.08 | |
| | | | | |
| | | | | | | | | | | | | | | | | |
| | 2023 vs Normal | | 2023 vs 2022 | | 2022 vs Normal |
| | | | | |
| Effect on Diluted Earnings Per Share | $ | 0.02 | | | $ | (0.09) | | | $ | 0.11 | |
| | | | | |
Retail Sales RevenueRevenues decreased $17.0$14.5 million driven by:primarily due to the following:
•A $25.6$26.2 million decrease in revenue relatedfuel recovery revenues, primarily due to the recovery of decreased fuel andlower purchased power and fuel costs arising from decreased market energy costs and natural gas prices, as described below.
•A $5.2 million decrease in revenues from the unfavorable impact of weather compared to servelast year.
•Our Minnesota rate case, which was finalized in 2022, included a determination of the final interim rate refund and resulted in an additional $4.1 million of retail customers. Decreased demand causedrevenue last year.
The decreases in retail revenues described above were partially offset by the milder winter weather and COVID-19-related impacts on ourfollowing:
• A $10.5 million increase in retail revenues from increased sales volumes from commercial and industrial customers, contributed toincluding the impact of a 19.0% decreasenew commercial customer load in kwhs generated for system use. Purchased power costs decreased, despite a 6.9%North Dakota added during 2022.
• A $9.6 million increase in kwhs purchased,rider revenues, including recovery of our investment in the Ashtabula III wind farm, which we acquired in January 2023, and the recovery of our investment in Hoot Lake Solar, which was completed during the year, as well as operating costs associated with these facilities.
Wholesale Revenues decreased $6.1 million primarily due to a 19.9%49% decrease in purchased powerwholesale electric prices driven by decreased fuel costs.
Production Fuel costs decreased $4.8 million due to a 17% decrease in fuel cost per kwh resulting from a decreasedecreases in market demand between periods.
•A $4.4 million decrease in revenue related to decreased kwh consumption due to milder winter weather in 2020 compared with 2019, reflected in the 14.7% decrease in HDDs in 2020 compared with 2019. The decrease in consumption due to the decrease in HDDs was onlynatural gas prices, partially offset by an increase in consumption related to a 36.2% increase in CDDs in the summer of 2020 compared with the summer of 2019.
•A $2.9 million decrease due to decreased kwh sales to commercial and industrial customers mainly due to COVID-19-related impacts in 2020.
These decreases in revenue were partially offset by:
•An $11.0 million increase in Minnesota and North Dakota Renewable Rider Adjustment revenues related to earning a return on funds invested in Merricourt while the project was under construction.
•A $3.1 million increase in revenues from the North Dakota Generation Rider which went into effect in July 2019 to provide a return on funds invested in Astoria Station while the generation project is under construction.
•A $1.0 million increase due to a positive price variance arising from variances in sales under different tariffs.
•An $0.8 million increase in Conservation Improvement Program (CIP) and transmission cost recovery revenues.
Transmission Services Revenues increased $3.5 million due to increases of $1.9 million in transmission tariff revenues and $1.6 million in revenues from the recovery of infrastructure investment costs from interconnected generators.
Other Electric Revenue increased $0.7 million, which includes $1.9 million from the recovery of infrastructure investment costs from a large commercial customer in 2020, partially offset by a $1.2 million decrease in revenue from steam sales to an ethanol producer driven by lower natural gas prices resulting in the producer switching to an alternative generation source to meet its steam requirements.
Production Fuel costsdecreased $13.0 million mainly as a result of a 22.0% decrease in kwhs generated from our fuel-burning plants due to lower customer demand and a 6.9% increase in kwh purchases for system use. Decreased system demand and lower prices for alternative fuels and generation sources, which drove market prices for electricity down in 2020, contributed to decreases in generation of 37.7% at Big Stone Plant and 36.7% at Hoot Lake Plant. These decreases were partially offset by a 13.7% increase in generation at Coyote Station, which was offline for maintenance during the entire second quarter of 2019.natural gas-burning plants.
Purchased Power costs to serve retail customers decreased $10.4$22.0 million as a result of a 19.9% decrease in purchased power prices, partially offset by a 6.9% increase in kwhs purchased. The increase in kwhs purchased was mainly due to a 14% decrease in market prices for electricity in 2020 driven by low prices for natural gas-fired generation in combination with lower demand in 2020the price of purchased power per kwh, primarily due to COVID-19-related declinesdecreased market energy costs, as well as decreased purchase volumes due to the acquisition of the Ashtabula III wind farm and completion of our Hoot Lake Solar project in the current year. Prior to the acquisition of Ashtabula III, OTP purchased the wind generated electricity use by commercial and industrial consumers.from the facility under the terms of a power purchase agreement.
Operating and Maintenance Expense decreased $2.7increased $9.9 million mainlyprimarily due to:
•A $2.8$3.9 million decreaseincrease in contracted serviceslabor and materialsbenefit costs partially due to increased health insurance costs, wage increases, and supplies expenses, mainly related to the Coyote Station's extended maintenance outage and Hoot Lake Plant turbine repairs in the second quarter of 2019 with no comparable expenses in 2020.increased headcount.
•A $2.7$2.2 million decreaseincrease in transmission tariff expenses relatedvegetative maintenance costs.
•A $1.9 million increase in insurance expense due in part to decreased rates.the addition of Ashtabula III and Hoot Lake Solar to our generation fleet during the year.
•A $1.3 million decreaseincrease in travel, mealsmaintenance related to the addition and employee education expenses due to COVID-19-related travel restrictions.
•A $0.8 million decrease in pollution control reagent costs due to a 22.4% decrease in kwhs generated at Otter Tail Power Company's coal- burning plants.operation of Ashtabula III.
These decreases in expense increases were partially offset by:
•A $2.0 million increase in customer bad debt expense provisions, mainly dueby, among other items, decreased outage-related costs and travel costs compared to adoption of COVID-19-related service suspension and debt collection policies and financial constraints on some customers due to COVID-19.
•A $1.0 million increase in contribution commitments to Otter Tail Power Company's charitable foundation.
•A $0.6 million increase in land easement payments related to Merricourt.
•A $0.6 million increase in CIP expenditures.
•A $0.5 million increase in labor and benefit costs.the previous year.
Depreciation and Amortizationexpense increased $3.1$3.3 million mainlyprimarily due to 2019 capital additions for generationthe acquisition of Ashtabula III and transmission plant, a new customer information system, andcontinued investment in distribution facilities during the inception of depreciation of Merricourt assets in the fourth quarter of 2020.
Property Taxes increased $1.2 million due to property additions and increased valuations on existing property.year.
MANUFACTURING SEGMENT RESULTS
The following table summarizes the operating results of operations for our Manufacturing segment for the years ended December 31, 20202023 and 2019:2022:
| | (in thousands) | (in thousands) | 2020 | | 2019 | | $ change | | % change | (in thousands) | 2023 | | 2022 | | $ change | | % change |
| | Operating Revenues | Operating Revenues | $ | 238,769 | | | $ | 277,204 | | | $ | (38,435) | | | (13.9) | % |
| Cost of Products Sold | 180,432 | | | 215,179 | | | (34,747) | | | (16.1) | |
| Other Operating Expenses | 27,301 | | | 29,895 | | | (2,594) | | | (8.7) | |
| Operating Revenues | |
| Operating Revenues | | $ | 402,781 | | | $ | 397,983 | | | $ | 4,798 | | | 1.2 | % |
| Cost of Products Sold (excluding depreciation) | |
| Selling, General, and Administrative Expenses | |
| Depreciation and Amortization | Depreciation and Amortization | 14,933 | | | 14,261 | | | 672 | | | 4.7 | |
| Operating Income | Operating Income | $ | 16,103 | | | $ | 17,869 | | | $ | (1,766) | | | (9.9) | % | Operating Income | $ | 29,140 | | | $ | | $ | 29,065 | | | $ | | $ | 75 | | | 0.3 | | 0.3 | % |
Operating Revenues decreased $38.4increased $4.8 million primarily due to the combination of the following:
•At BTD, operating revenues decreased $37.3 million. Parts revenue was down $37.5increased $12.5 million mainlyprimarily due to decreaseda combination of higher sales volumes across alland increased pricing. Sales volumes increased 12% compared to the previous year due to strong end markets served by BTD,market demand in order of magnitude:several segments, including the construction, industrial, and energy equipment, lawnagricultural segments, and garden, recreational vehicleincremental volumes from additional work with existing customers. Sales price increases were implemented during the year in response to labor and agricultural end markets. The decreasednon-steel material cost inflation. Sales price increases and sales mainly resulted from customers implementing temporary plant shutdowns due to the COVID-19 pandemic. Lower prices related to the pass through of lower material costs accounted for an $18.5 million decrease in parts revenue,volume growth were partially offset by $1.7 milliondecreased steel prices, resulting in revenue increases duean 11% decrease in material costs, which are passed through to product mix exclusive of the pass through of material cost reductions.customers.
•At T.O. Plastics, operating revenues decreased $1.1 million. A $1.3$7.7 million increase in horticultural product sales was more than offset by decreases of $1.7 million in life science product sales, $0.5 million in industrial sales and $0.2 million in extrusion sales. However, COVID-19 had a negative impact on life science product sales as elective and non-critical surgeries and medical procedures were cancelled or delayed. Industrial product sales decreasedprimarily due to COVID-19-related impacts on customer’slower sales volumes. Sales volumes decreased 19% primarily due to decreased sales of horticulture products, as order and service activities.delivery lead times for these products have normalized after volatility experienced in the previous year, and customers reduced their inventory levels and are beginning to return to normal seasonal buying patterns.
Cost of Products Sold decreased $34.7$4.8 million primarily due to the combination of the following:
•Cost of products sold at BTD decreased $34.2increased $0.8 million primarily due to higher sales volumes, as a resultdiscussed above. Cost of both the decreased sales volumeproducts sold also increased due to lower productivity and inflationary cost pressures which resulted in higher non-steel material, labor and overhead costs. The increase in labor costs and lower level of productivity was partially attributable to increased shift incentives and overtime wages combined with increased staffing levels to meet higher production volumes and the $18.5 million in lowertime required for new employees to achieve peak productivity. The impacts of higher sales volumes and increased labor and overhead costs were largely offset by decreased material costs, passed through to customers, but also due to labor cost decreases due to second quarter 2020 workforce reductions.as discussed above.
•Cost of products sold at T.O. Plastics decreased $0.6 million due to a $2.1 million decrease in material costs related to the decrease in sales volume, mostly offset by increases in other indirect costs and an increase in rental costs for more warehouse space.
Other Operating Expenses decreased $2.6$5.6 million primarily due to a $2.1lower sales volumes of horticulture products, as discussed above.
Selling, General, and Administrative Expenses increased $7.2 million decrease in operating expenses at BTD, mainlyprimarily due to reductionsincreased employee compensation from an increase in travelheadcount, inflationary cost pressure and outside services expenditures related to initiatives taken at BTD to mitigate the negative impacts on sales related to COVID-19. Operating expenses at T.O. Plastics decreased $0.5 million, including a $0.3 million write off of the value of destroyed property in 2019 related to the March 2019 partial roof collapse. T.O. Plastics travel and other selling expenses decreasedvariable compensation driven by $0.2 million due to restrictions on activity in response to COVID-19-related safety initiatives.current year financial performance.
BTD incurred $1.0 million in termination costs in the second quarter of 2020, with $0.9 million charged to cost of products sold and $0.1 million charged to operating expense, related to headcount reductions across all its sites in response to the ongoing reduction in sales volume.
Depreciation and Amortization increased $0.7$2.3 million due to an increase of $0.4 million at BTD related to recentcapital expenditures during the year, which included investments in equipmentfacility improvements and tooling, and a $0.3 million increase at T.O. Plastics including several large tooling and equipment projects and the additionpurchases of a pelletizer room.equipment.
PLASTICS SEGMENT RESULTS
The following table summarizes the operating results of operations for our Plastics segment for the years ended December 31, 20202023 and 2019:2022:
| | (in thousands) | (in thousands) | 2020 | | 2019 | | $ change | | % change | (in thousands) | 2023 | | 2022 | | $ change | | % change |
| | Operating Revenues | Operating Revenues | $ | 205,249 | | | $ | 183,257 | | | $ | 21,992 | | | 12.0 | % |
| Cost of Products Sold | 148,835 | | | 139,974 | | | 8,861 | | | 6.3 | |
| Other Operating Expenses | 14,987 | | | 11,393 | | | 3,594 | | | 31.5 | |
| Operating Revenues | |
| Operating Revenues | | $ | 418,026 | | | $ | 512,527 | | | $ | (94,501) | | | (18.4) | % |
| Cost of Products Sold (excluding depreciation) | |
| Selling, General, and Administrative Expenses | |
| Depreciation and Amortization | Depreciation and Amortization | 3,604 | | | 3,451 | | | 153 | | | 4.4 | |
| Operating Income | Operating Income | $ | 37,823 | | | $ | 28,439 | | | $ | 9,384 | | | 33.0 | % | Operating Income | $ | 254,402 | | | $ | | $ | 264,578 | | | $ | | $ | (10,176) | | | (3.8) | | (3.8) | % |
Operating Revenues increased $22.0decreased $94.5 million primarily due to an 8.0% increasea 14% decrease in pounds of PVC pipe soldin combinationsales volumes. Sales volume decreases were attributable to softer end market demand coupled with a 3.7% increase in the price per pound sold. The sales volume increase resulted from improved market conditionsdistributor inventory management, as these customers reduced their inventory levels during the thirdfirst half of the year after previously building higher inventory levels in response to market uncertainty and fourth quarterssupply chain challenges. Operating revenue decreases were also the result of 2020 driven by strong construction markets and concerns over raw material supply and product availability due to two resin suppliers invoking force majeure, anticipated impactsa 5% decrease in sales prices, as prices in 2023 decreased from hurricanes, significant global demand for PVC resin and limited pipe inventory across the country.record highs in 2022.
Cost of Products Sold increased $8.9decreased $84.0 million due to the increase in sales volume, partially offset by a 1.5%26% decrease in the cost per pound of PVC pipe sold, primarily due to lower material input costs.
Other Operating Expenses increased $3.6 million including a $2.0 million contribution commitment to Otter Tail Corporation’s charitable foundationresin costs, as well as the 14% decrease in 2020 and additional increases in other expenses, primarily performance-based compensation.sales volumes discussed above.
CORPORATE COSTS
The following table summarizes Corporate results of operations for the years ended December 31, 20202023 and 2019:2022:
| | (in thousands) | (in thousands) | 2020 | | 2019 | | $ change | | % change | (in thousands) | 2023 | | 2022 | | $ change | | % change |
| | Other Operating Expenses | $ | 12,794 | | | $ | 9,515 | | | $ | 3,279 | | | 34.5 | % |
| Selling, General, and Administrative Expenses | |
| Selling, General, and Administrative Expenses | |
| Selling, General, and Administrative Expenses | | $ | 12,042 | | | $ | 16,202 | | | $ | (4,160) | | | (25.7) | % |
| Depreciation and Amortization | Depreciation and Amortization | 329 | | | 330 | | | (1) | | | (0.3) | |
| Operating Loss | Operating Loss | $ | 13,123 | | | $ | 9,845 | | | $ | 3,278 | | | 33.3 | % | Operating Loss | $ | 12,144 | | | $ | | $ | 16,342 | | | $ | | $ | (4,198) | | | (25.7) | | (25.7) | % |
Other OperatingSelling, General, and Administrative Expenses increased $3.3decreased $4.2 million mainly as a result of a $2.5 million contribution commitmentprimarily due to Otter Tail Corporation’s charitable foundationlower health care costs related to our self-funded health insurance program in 2020 and a $1.5 million increase2023 compared to higher claim costs in labor and benefit expenses, partially offset by a $0.6 million decrease in corporate costs charged to subsidiaries.2022.
The following provides a summary of ourOTP's current general rates and a summary of recent rate case filings, and rate rider filings, and other regulatory filings that have or are expected to have a material impact on our operating results, financial position, or cash flows.
GENERAL RATESRATE CASES
The following includes a summary of electric base ratesrate cases as determined in OTP's most recent general rate case in each state:
| | | | | | | | | | | | | | | | | |
| | Revenue | | Allowed | |
| Implementation | Requirement | Return on | Return | Equity |
| Jurisdiction | Date | (in millions) | Rate Base | on Equity | Ratio |
| | | | | |
| Minnesota | 06/01/19 | $ | 198.6 | | 7.51 | % | 9.41 | % | 52.50 | % |
| North Dakota | 02/01/19 | 153.1 | | 7.64 | | 9.77 | | 52.50 | |
South Dakota(1) | 08/01/19 | 35.5 | | 7.09 | | 8.75 | | 52.92 | |
| | | | | |
| (1) Includes an earnings sharing mechanism to share with South Dakota customers any weather-normalized earnings above the authorized ROE of 8.75%. The mechanism requires annual customer refunds of 50% of any weather-normalized revenue creating earnings in excess of the authorized ROE up to a maximum of 9.50% and 100% refunds revenue creating earnings above 9.50%. | |
| | | | | | | | | | | | | | | | | |
| | Revenue | | Allowed | |
| Implementation | Requirement | Return on | Return | Equity |
| Jurisdiction | Date | (in millions) | Rate Base | on Equity | Ratio |
| | | | | |
| Minnesota | 07/01/22 | $ | 209.0 | | 7.18 | % | 9.48 | % | 52.50 | % |
| North Dakota | 02/01/19 | 153.1 | | 7.64 | | 9.77 | | 52.50 | |
South Dakota(1) | 08/01/19 | 35.5 | | 7.09 | | 8.75 | | 52.92 | |
| | | | | |
| (1) Includes an earnings sharing mechanism to share with South Dakota customers any weather-normalized earnings above the authorized ROE of 8.75%. The mechanism requires 50% of any weather-normalized revenue creating annual earnings in excess of the authorized ROE up to a maximum of 9.50% be returned to customers and 100% returns of revenue creating annual earnings above 9.50%. | |
MinnesotaNorth Dakota Rate Case: On November 2, 2020,2023, OTP filed a request with the MPUCNDPSC for an increase in revenue recoverable under general rates in Minnesota.North Dakota. In its filing, OTP requested a net increase in annual revenue of approximately $14.5$17.4 million, or 6.77%8.4%, based on an allowed rate of return on rate base of 7.59%7.85% and an allowed rate of return on equity of 10.20%10.6% on an equity ratio of 52.5%53.5% of total capital. Through this proceeding, OTP has proposed changes to the mechanism of cost and investment recovery, with some costsrecovery moving from riders into base rates and fuel, and purchased power and conservation program costs moving out of base rates and into riders.rates. The filing also includes a proposal to implement a sales adjustment mechanism to address potential significant load additions or losses. The filing included an interim rate request of a net increase in annual revenue decoupling mechanism proposal. Such mechanisms are designed to separate a utility's revenue from changes in energy sales. The decoupling mechanism uses a tracker balance inof $12.4 million, or 6.0%, which authorized customer marginswas approved by the NDPSC on December 13, 2023, and interim rates went into effect on January 1, 2024. These interim rate revenues, when collected, are subject to a true-up mechanism to maintain or cap a given levelpotential refund until the finalization of revenues.the rate case.
On December 3, 2020, the MPUC approved an interim annual rate increase
RATE RIDERS
The following table includes a summary of substantial pending and recently concluded rate rider proceedings:
| | | | | | | | | | | | | | | | | | | | | | | | | | | | | | | | | | | | | | |
| Recovery | | | | | | Filing | | Amount | | Effective | | |
| Mechanism | | Jurisdiction | | Status | | Date | | (in millions) | | Date | | Notes |
| | | | | | | | | | | | |
| RRR - 2023 | | MN | | Approved | | 11/01/22 | | $17.5 | | 07/01/23 | | Recovery of Hoot Lake Solar costs, Ashtabula III costs, and true up for PTCs from Merricourt. |
| ECO - 2023 | | MN | | Approved | | 04/03/23 | | 9.7 | | 10/01/23 | | Recovery of energy conservation improvement costs as well as a demand side management financial incentive. |
| RRR - 2024 | | MN | | Requested | | 12/04/23 | | 8.0 | | 07/01/24 | | Recovery of Hoot Lake Solar costs, Ashtabula III costs, wind upgrade project costs at our four owned wind facilities, and true up of PTCs for Merricourt. |
RRR - 20192023 | | MNND | | Approved | | 06/21/1912/30/22 | | $12.2 | | 12.5 05/01/23 | | Recovery of Merricourt, Ashtabula III and other costs. |
| RRR - 2022 | | ND | | Approved | | 01/05/22 | | 7.8 | | 04/01/22 | | Recovery of Merricourt costs, Ashtabula III costs, and deferred taxes and PTCs. |
| TCR - 2023 | | ND | | Approved | | 09/15/22 | | 7.5 | | 01/01/2023 | | Includes return on Merricourt constructionRecovery of transmission project costs. |
TCR - 20182024 | | MN | | Approved | | 05/07/20 | | 10.3 | | | 01/21/20 | | See below for additional details. |
RRR - 2020 | | ND | | Approved | | Approved11/02/23 | | 03/18/204.5 | | 5.8 01/01/24 | | | 04/01/20 | | Includes return on Merricourt constructionRecovery of transmission project costs. |
GCR - 20202022 | | ND | | Approved | | 06/10/2003/01/22 | | 6.2 3.3 | | | 07/01/2022 | | Includes return on Astoria Station construction costs. |
TCR - 2020 | | ND | | Approved | | 08/31/20 | | 5.6 | | | 01/21/20 | | Includes recovery of new transmission assets. |
TCR - 2020 | | SD | | Approved | | 01/29/20 | | 2.3 | | 03/02/20 | | Annual update to transmissiongeneration cost recovery rider. |
PIRMDT - 20202023 | | ND | | SD | | Approved | | 05/31/2007/08/22 | | 1.63.1 | | 09/01/20 | | Includes return on Merricourt and Astoria Station construction costs. |
TCR - 2021 | | ND | | Approved | | 11/18/20 | | 5.6 | | 01/01/2123 | | Includes recoveryRecovery of eight new transmissionadvanced metering infrastructure, outage management system and demand response projects. |
RRRPIR - 20212022 | | NDSD | | RequestedApproved | | 12/31/2006/01/22 | | 11.83.0 | | — 09/01/22 | | Recovery of Ashtabula III, Merricourt, Astoria Station, Advanced Grid Infrastructure project costs, and impact of load growth credits. |
| TCR - 2023 | | SD | | Approved | | Includes return on Merricourt construction11/01/22 | | 3.0 | | 03/01/23 | | Recovery of transmission project costs. |
| TCR - 2021 | | SD | | Requested | | 10/30/20 | | 2.2 | | — | | Includes recovery of two new transmission projects. |
| | | | | | | | | | | | |
| | | | | | | | | | | | |
| | | | | | | | | | | | |
Minnesota TCR: RESOURCE PLANNING
On May 1, 2017,March 31, 2023, OTP submitted a supplemental resource plan filing to the MPUC, orderedthe NDPSC, and the South Dakota Public Utilities Commission (SDPUC). The supplemental filing updated OTP’s original 2022 Integrated Resource Plan (2022 IRP), which was filed on September 1, 2021. In the supplemental filing, OTP outlined its updated plan for meeting all customers’ anticipated capacity and energy needs while maintaining system reliability and low electric service rates in light of several changes that had occurred since the original filing, including significant winter and spring reserve planning margins adopted by MISO, tax credits made available for renewable energy projects under the Inflation Reduction Act, the enactment of the Clean Energy Bill in Minnesota, and volatility experienced in energy and capacity markets.
On December 15, 2023, OTP submitted a second supplemental resource plan filing to includethe MPUC outlining an updated plan specifically for meeting Minnesota customers’ anticipated capacity and energy needs while maintaining system reliability and low electric service rates. Based on feedback received on the preferred plan outlined in the TCR rider retail rate baseMarch 31, 2023 supplemental filing and the inability to reach a consensus on certain aspects of the plan, the second supplemental filing includes a proposal to bifurcate OTP's resource planning by jurisdiction.
Under bifurcated resource planning, it is anticipated that OTP would develop two separate resource plans, one plan developed for Minnesota and a second developed for North Dakota and South Dakota. Each plan would be developed incorporating the assumption that all existing generation resources, except Hoot Lake Solar, would continue to be allocated to all jurisdictions using established jurisdictional allocators. Hoot Lake Solar is currently directly allocated to only Minnesota. As new generation resources are needed for each plan, those generation resources would be allocated to the jurisdiction that is needing the resource. To the extent a common generation resource is needed for both plans, that resource would be allocated using established jurisdictional allocators. This method of resource planning would diverge from OTP’s historical practice of planning on an integrated basis for all jurisdictions served.
With the proposal of bifurcated resource planning, the supplemental filing outlines OTP’s preferred plan for Minnesota only. The preferred plan in this supplemental filing includes:
•repowering four of our existing wind facilities in 2025;
•the addition of approximately 200 megawatts of solar generation in 2025;
•the addition of approximately 100 megawatts of wind generation in 2026;
•the addition of on-site liquefied natural gas fuel storage at our Astoria Station natural gas plant in 2027;
•the designation of Coyote Station, a jointly owned coal-fired generation plant, as an Available Maximum Emergency (AME) Resource beginning in 2029 and annually thereafter;
•a withdrawal from our 35 percent ownership interest in Coyote Station in the event we are required to make a major, non-routine capital investment in the plant; and
•the addition of approximately 50 megawatts of wind generation in 2032.
The preferred plan requests the MPUC issue an order requiring the Minnesota’s jurisdictionally allocated share of OTP's investments in certain transmission assets and all revenues receivedthe generation from other utilities under MISO's tariffed ratesCoyote Station be designated as a credit in its TCR revenue requirement calculations. The order had the effectan AME Resource beginning March 1, 2029, subject to additional analysis to be performed by OTP. AME Resources are
On August 18, 2017, OTP filed an appeal of the MPUC order with the Minnesota Court of Appeals to contest the portion of the order requiring OTP to jurisdictionally allocate costs of the FERC transmission projectsresources called on only in the TCR rider. On June 11, 2018,event of a maximum generation event, such as in the Minnesota Courtcases of Appeals reversed the MPUC's order. On July 11, 2018 the MPUC filed a petition for review of the decisionextreme heat, cold, or other extreme events. Designating Coyote Station as an AME Resource would allow us to retain Coyote Station’s capacity, thereby providing an important reliability benefit. This also helps ensure we remain compliant with market monitoring regulations and our contractual obligations to the co-owners of Coyote Station while advancing our compliance with Minnesota's carbon-free standard. The supplemental filing requests Minnesota Supreme Court, which granted review of the appellate court decision. The Minnesota Supreme Court issued its opinion on April 22, 2020, concluding the MPUC lacked authority to amend an existing TCR rider approved under Minnesota state lawcustomer rates continue to include the recovery of an allocated share of OTP’s costs and revenues associated with these transmission projectsowning the plant, and affirminga return on those costs, as well as the decisionfixed costs of operating the Minnesota Courtplant. The variable cost of Appeals.
On October 22, 2020,operating the MPUC approved OTP's request for a Minnesota TCR rider update with the exclusionplant, which consists primarily of these transmission projects. In addition, the MPUC approved the inclusion of three new projects previously requested in the Minnesota TCR rider eligibility petition. Updated rates went into effect in January 2021. With this decision, one-half of the projected TCR rider tracker balance at December 2020 of $13.4 million willvariable fuel costs, would not be included in the 2021 TCR rider annual revenue requirement, with the remainder included in the next annual update. The annual updates provide for recovery of approximately $2.6 million in MISO revenues creditsattributed to Minnesota customers, throughexcept when the TCR rider priorplant is called upon to September 30, 2020. Asserve Minnesota customers in emergency situations.
The supplemental IRP filing made December 15, 2023 outlines our proposed resource plan for Minnesota. We anticipate filing future resource plans on a result, OTP recognized additional rider revenue of $2.6 million during the year ended December 31, 2020.bifurcated basis in North Dakota and South Dakota.
LIQUIDITY OVERVIEW
We believe our financial condition is strong and our cash, other liquid assets, operating cash flows, existing lines of credit, access to capital markets, and borrowing ability, because of investment-grade credit ratings, when taken together, provide us ample liquidity to conduct business operations and fund our capital expenditures related to expansion of existing businesses and development of new projects.expenditure program. Our liquidity, including our operating cash flows and access to capital markets, cancould be impacted by macroeconomic factors outside of our control, such as those which may be caused by COVID-19.control. In addition, our liquidity could be impacted by non-compliance with covenants under our various debt instruments. As of December 31, 2020,2023, we were in compliance with all debt covenants (see the Financial Covenant section under Capital Resources below).
We continue to have sufficient liquidity under our credit facilities to support our business based on the current economic environment. We are closely monitoring our liquidity and capital market conditions given the uncertainty surrounding the impact of COVID-19, which could have an adverse effect on the availability and terms of future debt and equity financing.
The following table presents the status of our lines of credit as of December 31, 20202023 and 2019:2022:
| | 2020 | | 2019 |
| | | 2023 | | | | | 2023 | | 2022 |
| (in thousands) | (in thousands) | Line Limit | | Amount Outstanding | | Letters
of Credit | | Amount Available | | Amount Available | (in thousands) | Line Limit | | Amount Outstanding | | Letters
of Credit | | Amount Available | | Amount Available |
| | Otter Tail Corporation Credit Agreement | $ | 170,000 | | | $ | 65,166 | | | $ | — | | | $ | 104,834 | | | $ | 164,000 | |
| OTC Credit Agreement | |
| OTC Credit Agreement | |
| OTC Credit Agreement | |
| OTP Credit Agreement | OTP Credit Agreement | 170,000 | | | 15,831 | | | 14,101 | | | 140,068 | | | 154,524 | |
| Total | Total | $ | 340,000 | | | $ | 80,997 | | | $ | 14,101 | | | $ | 244,902 | | | $ | 318,524 | |
We have an internal risk tolerance metricOTC and OTP are each party to maintain a minimumseparate credit agreements (the OTC Credit Agreement and OTP Credit Agreement, respectively) which provide for unsecured revolving lines of $50 million of liquidity under the Otter Tail Corporation Credit Agreement.credit. Should additional liquidity be needed, this agreementthe OTC Credit Agreement includes an accordion feature allowing us to increase the amount available to $290 million, subject to certain terms and conditions. The OTP Credit Agreement also includes an accordion feature allowing OTP to increase that facility to $250 million, subject to certain terms and conditions.
As of December 31, 2023, we had $249.4 million of available liquidity under our credit facilities and $230.4 million of available cash and cash equivalents, resulting in total available liquidity of $479.8 million, compared to total available liquidity of $441.2 million as of December 31, 2022.
CASH FLOWS
The following is a discussion of our cash flows for the years ended December 31, 20202023 and 2019:2022:
| | (in thousands) | (in thousands) | 2020 | | 2019 | (in thousands) | 2023 | | 2022 |
| | Net Cash Provided by Operating Activities | Net Cash Provided by Operating Activities | $ | 211,921 | | | $ | 185,037 | |
| Net Cash Provided by Operating Activities | |
| Net Cash Provided by Operating Activities | |
|
Net Cash Provided by Operating Activities increased $26.9$15.2 million primarily due to a $9.0 millionan increase in net income, a $11.3 million decreasethe absence of any pension contribution in discretionary contributions2023 due to ourthe plan's funded pension planstatus, and a $10.3 million reduction inthe timing of customer collections of forecasted fuel costs, partially offset by increased working capital. Our workingWorking capital decrease wasincreased primarily the result of increased accounts payable due to increased construction program costsan increase in receivables in our Electric segment. Our working capital level was also impacted by a decrease in inventories in our ManufacturingPlastics segment, due to strongincreased sales volumes in the fourth quarter of 2020the current year, and increased outstanding receivables of $6.3 million primarily from our Manufacturing and Plastics segmentsa decrease in payables due to strong sales volumesthe timing of capital investment spending in the fourth quarter of 2020. Our average collection period on outstanding receivables onour Electric segment and inventory purchases in our Plastics segment compared to last year.
Unique market dynamics experienced by our Plastics segment businesses in 2023 and 2022 resulted in a consolidated basis increasedsignificant increase in our overall cash from approximately 31 daysoperations compared to prior periods, and we do not expect cash from operations at these levels to continue in 2019 to approximately 34 days in 2020.future years.
| | (in thousands) | (in thousands) | 2020 | | 2019 | (in thousands) | 2023 | | 2022 |
| | Net Cash Used in Investing Activities | Net Cash Used in Investing Activities | $ | 375,652 | | | $ | 209,472 | |
| Net Cash Used in Investing Activities | |
| Net Cash Used in Investing Activities | |
|
Net Cash Used in Investment Activitiesincreased $166.2$114.2 million driven by ourprimarily due to a higher amount of Electric segment capital investment plan,compared to last year, including constructionthe purchase of the Ashtabula III wind farm, investments in our MerricourtHoot Lake Solar facility and Astoria Station projects.several wind repowering projects, transmission and distribution asset investments, and investments in new technology. Capital expenditures in our Manufacturing and Plastics segments increased $23.1 million as a result of investments in additional equipment and facility expansion projects at our Plastics segment facility in Arizona and our Manufacturing segment facility in Georgia.
| | | | | | | | | | | |
| (in thousands) | 2020 | | 2019 |
| | | |
| Net Cash Provided by Financing Activities | $ | 143,695 | | | $ | 44,773 | |
| | | |
| | | | | | | | | | | |
| (in thousands) | 2023 | | 2022 |
| | | |
| Net Cash Used in Financing Activities | $ | 3,835 | | | $ | 96,779 | |
| | | |
Net Cash Provided byUsed in Financing Activities decreased $92.9 million primarily due to increased $98.9 million as we issued debt and equityshort-term borrowings on our OTP credit facility, which were primarily used to fund capital expenditures in 2020 and increased borrowings under our short-term debt agreements primarily to finance our Electric segment, capital investments. Weincluding the acquisition of the Ashtabula III wind farm. Our financing activities in 2023 included net short-term borrowings of $73.2 million compared to net short-term repayments of $83.0 million in 2022. There was no change in our long-term debt in 2023. In 2022, OTP issued $75.0$60.0 million of long-term debt, in 2020 and increased borrowings under our short-term debt arrangements by $75.0 million. In addition, we raised net proceeds of $49.7 million from issuances of common shares under our various equity programs, including our At-the-Market offering program and our Automatic Dividend Reinvestment and Share Purchase Plan. We also paid $60.3 million in common dividends in 2020. Financing activities in 2019 included the issuance of $100 million of long-term debt and the issuance of common shares generating net proceeds of $17.0 million. Proceeds from these debt and equity issuances wereretirements, which was primarily used to fund Electric segment construction coststhe repayment of short-term credit facility borrowings and repay $12.6fund capital expenditures. In 2023, we made dividend payments of $73.1 million compared to $68.8 million in short-term debt. We paid $55.7 million in common dividends in 2019.2022.
CAPITAL EXPENDITURES
We have aOur capital expenditure program for expanding, upgrading and improving our plants and operating equipment. Typical uses of cash for capital expenditures areplan includes investments in electric generation facilities, and environmental upgrades, transmission and distribution lines, manufacturing facilities and upgrades, equipment used in the manufacturing process, and computer hardware and information systems. TheOur capital expenditure programplan is subject to review and is revised in light of changes in demands for energy, technology, environmental laws, regulatory changes, business expansion opportunities, the costs of labor, materials and equipment and our financial condition.
The following provides a summary of capital expenditures for the years ended December 31, 20202023 and 20192022 for our Electric segment and non-electric businesses and anticipated capital expenditures for the five year period 20212024 through 2025:2028:
| | (in millions) | |
| (in millions) | |
| (in millions) | (in millions) | 2019 | | 2020 | | 2021 | | 2022 | | 2023 | | 2024 | | 2025 | | Total | | | 2022 | 2023 | | | 2024 | | 2025 | | 2026 | | 2027 | | 2028 | | Total |
| | Electric Segment: | Electric Segment: | | | | | | | | | | | | | | | |
| Renewables and Natural Gas Generation | | | $ | 31 | | | $ | 104 | | | $ | 3 | | | $ | 1 | | | $ | 1 | | | $ | 140 | |
| Technology and Infrastructure | | | 6 | | | 25 | | | 32 | | | 28 | | | 18 | | | 109 | |
| Distribution Plant Replacements | | | 24 | | | 27 | | | 30 | | | 30 | | | 27 | | | 138 | |
| Transmission (includes replacements) | | | 23 | | | 25 | | | 31 | | | 30 | | | 29 | | | 138 | |
| Electric Segment: | |
| Electric Segment: | | | | | | | | | | |
| Renewables | |
| Transmission | |
| Distribution | |
| Other | Other | | | 29 | | | 30 | | | 25 | | | 23 | | | 21 | | | 128 | |
| Total Electric Segment | Total Electric Segment | $ | 187 | | | $ | 357 | | | | $ | 113 | | | $ | 211 | | | $ | 121 | | | $ | 112 | | | $ | 96 | | | $ | 653 | |
| Manufacturing and Plastics Segments | Manufacturing and Plastics Segments | 20 | | | 15 | | | | 20 | | | 20 | | | 36 | | | 15 | | | 18 | | | 109 | |
| Total Capital Expenditures | Total Capital Expenditures | $ | 207 | | | $ | 372 | | | | $ | 133 | | | $ | 231 | | | $ | 157 | | | $ | 127 | | | $ | 114 | | | $ | 762 | |
| | Total Electric Utility Average Rate Base | $ | 1,170 | | | $ | 1,385 | | | | $ | 1,585 | | | $ | 1,630 | | | $ | 1,720 | | | $ | 1,754 | | | $ | 1,769 | | |
| Rate Base Growth | | | 14.4 | % | | 2.8 | % | | 5.5 | % | | 2.0 | % | | 0.9 | % | |
|
CONTRACTUAL OBLIGATIONS
The following table summarizes our contractual obligations at December 31, 20202023 and the effect these obligations are expected to have on our liquidity and cash flow in future periods. | | (in millions) | (in millions) | Total | | Less than
1 Year | | 1-3
Years | | 3-5
Years | | More than
5 Years | (in millions) | Total | | Less than
1 Year | | 1-3
Years | | 3-5
Years | | More than
5 Years |
| | Debt Obligations | Debt Obligations | $ | 848 | | | $ | 221 | | | $ | 30 | | | $ | — | | | $ | 597 | |
| Debt Obligations | |
| Debt Obligations | |
| Interest on Debt Obligations | |
| Coal Contracts | Coal Contracts | 573 | | | 23 | | | 47 | | | 49 | | | 454 | |
| Interest on Debt Obligations | 484 | | | 35 | | | 55 | | | 54 | | | 340 | |
| Other Purchase Obligations (including land easements) | 77 | | | 33 | | | 4 | | | 4 | | | 36 | |
| Capacity and Energy Requirements | Capacity and Energy Requirements | 184 | | | 16 | | | 24 | | | 24 | | | 120 | |
| Postretirement Benefit Obligations | Postretirement Benefit Obligations | 118 | | | 4 | | | 11 | | | 12 | | | 91 | |
| Other Purchase Obligations (including land easements) | |
| Operating Lease Obligations | Operating Lease Obligations | 22 | | | 5 | | | 8 | | | 6 | | | 3 | |
| Total Contractual Cash Obligations | Total Contractual Cash Obligations | $ | 2,306 | | | $ | 337 | | | $ | 179 | | | $ | 149 | | | $ | 1,641 | |
Coal contract obligations are based on estimated coal consumption and costs for the delivery of coal to Coyote Station from Coyote Creek Mining Company (CCMC) under the lignite sales agreementLignite Sales Agreement (LSA) that ends in 2040. Postretirement benefit obligations include estimated cash expenditures for the payment of retiree medical and life insurance benefits and supplemental pension benefits under our unfunded Executive Survivor and Supplemental Retirement Plan (ESSRP), but do not include amounts to fund our noncontributory funded pension plan, as we are not currently required to make a contributionany contributions to that plan.
COMMON STOCK DIVIDENDS
We paid dividends to our common stockholdersshareholders totaling $60.3$73.1 million, or $1.48$1.75 per share, in 2020.2023. The determination of the amount of future cash dividends to be paid will depend on, among other things, our financial condition, improvement inlevel of earnings per share,and cash flows from operations, the level of our capital expendituresexpenditure plan and our future business prospects. As a result of certain statutory limitations or regulatory or financing agreements, restrictions could occur on the amount of distributions allowed to be made by OTC subsidiaries to OTC. These intercompany distributions serve as the primary source of funding for dividends paid to our subsidiaries.shareholders. See noteNote 14 to our consolidated financial statements included in this report on Form 10-K for additional information. The decision to declare a dividend is reviewed quarterly by our Board of Directors. On February 1, 20215, 2024, our Board of Directors increased the quarterly dividend from $0.37$0.4375 to $0.39$0.4675 per common share.
Financial flexibility is provided by operating cash flows, unusedborrowing capacity under our lines of credit, strong financial coverages, investment grade credit ratings and alternative financing arrangements such as leasing. Equity or debtDebt financing will be required in the five-year period 2021from 2024 through 2025 given the expansion plans related2028 to refinance maturing debt and to finance our capital investments within our Electric segmentsegment. Our financing plans are subject to fund constructionchange and are impacted by our planned level of new rate base and transmissioncapital investments, in the event we decidea decision to reduce borrowings under our lines of credit, to refund or retire early any of our presently outstanding debt, to complete acquisitions or for other corporate purposes.
REGISTRATION STATEMENTS
On May 3, 20182021, we filed a shelf registration statement with the SEC under which we may offer for sale, from time to time, either separately or together in any combination, equity, debt or other securities described in the shelf registration statement. The registration statement throughexpires in May 2024, at which time we anticipate filing a new shelf registration statement. No shares were issued pursuant to the expiration date of May 3, 2021.
On November 8, 2019 we entered into a Distribution Agreement with KeyBank under which we may offer and sell our common shares from time to time through KeyBank, as our distribution agent, up to an aggregate sales price of $75.0 million through an At-the-Market offering program. In 2020, we received proceeds of $37.0 million1, net of commissions paid to KeyBank of $0.5 million1 from the issuance of 868,4841 shares under this program. In total from the inception of the program through December 31, 2020, we have received proceeds under this program of $54.4 million.registration statement in 2023.
On May 3, 20182021, we also filed a shelfsecond registration statement with the SEC for the issuance of up to 1,500,000 common shares under ouran Automatic Dividend Reinvestment and Share Purchase Plan, (the Plan), which permitsprovides shareholders, retail customers of OTP and other interested investors a method of purchasing our common shares by reinvesting their dividends or making optional cash investments. Shares purchased by participants inunder the Plan toplan may be either new issue common shares or common shares purchased inon the open market. The shelf registration for the Planstatement expires onin May 3, 2021.2024, at which time we plan to file a new registration statement. In 2020,2023, we issued 320,173105,663 shares for proceeds of $13.4 million under the Plan.plan. All shares issued under the plan to date have been open market purchases and there have been no new issue shares, resulting in no proceeds received by the Company. As of December 31, 2020, 899,8592023, 1,145,330 shares remainremained available for purchase or issuance under the Plan.
We intend to file new shelf registration statements in 2021 following the expiration of our current registration statements on May 3, 2021.plan.
SHORT-TERM DEBT
Otter Tail Corporation and Otter Tail Power Company are each party to a credit agreement (theThe OTC Credit Agreement and OTP Credit Agreement respectively) which provide for unsecured revolving lines of credit. The agreements generally bear interest at LIBORthe Secured Overnight Financing Rate (SOFR) plus an applicable credit spread, which is subject to adjustment based on the credit ratings of the issuer. The LIBOR credit spread for the OTC Credit Agreement and OTP Credit Agreement was 1.50% and 1.25%, respectively, atweighted-average interest rate on all outstanding borrowings as of December 31, 2020.2023 and 2022 was 6.70% and 5.61%.
The following is a summary of key provisions and borrowing information as of and for the year ended December 31, 2020:2023:
| | (in thousands, except interest rates) | (in thousands, except interest rates) | OTC Credit Agreement | | OTP Credit Agreement | (in thousands, except interest rates) | OTC Credit Agreement | | OTP Credit Agreement |
| | Borrowing Limit | |
| Borrowing Limit | |
| Borrowing Limit | Borrowing Limit | $ | 170,000 | | | $ | 170,000 | |
Borrowing Limit if Accordion Exercised1 | Borrowing Limit if Accordion Exercised1 | 290,000 | | | 250,000 | |
| Amount Restricted Due to Outstanding Letters of Credit at Year-End | Amount Restricted Due to Outstanding Letters of Credit at Year-End | — | | | 14,101 | |
| Amount Outstanding at Year-End | Amount Outstanding at Year-End | 65,166 | | | 15,831 | |
| Average Amount Outstanding During Year | Average Amount Outstanding During Year | 32,355 | | | 734 | |
| Maximum Amount Outstanding During the Year | Maximum Amount Outstanding During the Year | 65,166 | | | 15,831 | |
| Interest Rate at Year-End | Interest Rate at Year-End | 1.6 | % | | 1.4 | % | Interest Rate at Year-End | 6.85 | % | | 6.70 | % |
| Maturity Date | October 31, 2024 | | October 31, 2024 |
| Expiration Date | | Expiration Date | October 29, 2027 | | October 29, 2027 |
| | 1Each facility includes an accordion featuring allowing the borrower to increase the borrowing limit if certain terms and conditions are met. | |
1Each facility includes an accordion feature allowing the borrower to increase the borrowing limit if certain terms and conditions are met. | |
| 1Each facility includes an accordion feature allowing the borrower to increase the borrowing limit if certain terms and conditions are met. | |
| 1Each facility includes an accordion feature allowing the borrower to increase the borrowing limit if certain terms and conditions are met. | |
LONG-TERM DEBT
At December 31, 2020,2023, we had $767.2$827.0 million of principal outstanding under long-term debt arrangements. Note 9 to our consolidated financial statements included in this report on Form 10-K includes information regarding these instruments. The agreements generally provide for unsecured borrowings at fixed rates of interest with maturities ranging from 20212026 to 2050. One OTP debt instrument with a principal balance of $140.0 million matures in December 2021. We anticipate issuing long-term debt in 2021 with the proceeds used to satisfy this maturing instrument.2052.
1In the fourth quarter of 2020, we received proceeds of $11.5 million, net of commission of $0.1 million, from the issuance of 280,400 shares.
Financial Covenants
Certain of our short- and long-debtlong-term debt agreements require Otter Tail CorporationOTC and OTP to maintain certain financial covenants. As of December 31, 2020,2023, we were in compliance with these financial covenants as further described below:
Otter Tail CorporationOTC, under its financial covenants, may not permit its ratio of Interest-Bearing Debt to Total Capitalization to exceed 0.60 to 1.00, may not permit its Interest and Dividend Coverage Ratio to be less than 1.50 to 1.00, and may not permit its Priority Indebtedness to exceed 10% of our Total Capitalization. As of December 31, 2020,2023, our Interest-Bearing Debt to Total Capitalization was 0.490.39 to 1.00, our Interest and Dividend Coverage Ratio was 4.5510.85 to 1.00 and we had no Priority Indebtedness outstanding.
OTP, under its financial covenants, may not permit its ratio of Debt to Total Capitalization to exceed 0.60 to 1.00, may not permit its Interest and Dividend Coverage Ratio to be less than 1.50 to 1.00, and may not permit its Priority Debt to exceed 20% of its Total Capitalization. As of December 31, 2020,2023, OTP's Interest-Bearing Debt to Total Capitalization was 0.46 to 1.00, its Interest and Dividend Coverage Ratio was 3.663.54 to 1.00 and it had no Priority Indebtedness outstanding.
None of our debt agreements include any provisions that would trigger an acceleration of the related debt as a result of changes in the credit rating levels assigned to the related obligor by rating agencies.
Credit Ratings
The credit ratings of Otter Tail CorporationOTC and OTP as of December 31, 20202023 are summarized below:
| | | | | | | | | | | | | | | | | | | | | | | |
| Otter Tail Corporation | | OTPOtter Tail Power Company |
| Moody's | Fitch | S&P | | Moody's | Fitch | S&P |
| | | | | | | |
| Corporate Credit/Long-Term Issuer Default Rating | Baa2 | BBB-BBB | BBB | | A3 | BBBBBB+ | BBB+ |
| Senior Unsecured Debt | n/a | BBB-BBB | n/a | | n/a | BBB+A- | BBB+n/a |
| Outlook | Stable | Stable | NegativeStable | | Stable | Stable | Stable |
| | | | | | | |
| | | | | |
OFF-BALANCE-SHEET ARRANGEMENTS | |
As of December 31, 2020 we have outstanding letters of credit totaling $17.4 million, a portion of which reduces our borrowing capacity under our lines of credit. No outstanding letters of credit are reflected in outstanding short-term debt on our consolidated balance sheets. We do not have any other off-balance-sheet arrangements or any relationships with unconsolidated entities or financial partnerships. These entities are often referred to as structured finance special purpose entities or variable interest entities, which are established for the purpose of facilitating off-balance-sheet arrangements or for other contractually narrow or limited purposes. We are not exposed to any financing, liquidity, market or credit risk that could arise if we had such relationships.
| | | | | |
CRITICAL ACCOUNTING POLICIES INVOLVING SIGNIFICANT ESTIMATES | |
FinancialPreparation of financial statements prepared in accordance with accounting principles generally accepted in the United States of America and the Company’s discussion and analysis of its financial condition and operating results requires management to make assumptions, estimates and judgments that affect the reported amounts of assets, liabilities, revenues and expenses, and related disclosure of contingent assets and liabilities.amounts. While we believe the estimates, assumptions, and judgments we use in preparing our consolidated financial statements are appropriate and are based on the best available information, they are subject to future events and uncertainties regarding their outcome and therefore actual results may materially differ from these estimates. Management has discussed the application of these critical accounting policies and the development of these estimates with the Audit Committee of our Board of Directors. The following critical accounting policies affect the moremost significant judgments and estimates used in the preparation of our consolidated financial statements.
REGULATORY ACCOUNTING
Our utility business is subject to regulation of rates and other matters by state utility commissions in Minnesota, North Dakota and South Dakota and by the FERC for certain interstate operations. Accordingly, our utility business must adhere to the accounting requirements of regulated operations, which requires the recognition of regulatory assets and regulatory liabilities for amounts that otherwise would impact the statement of income or comprehensive income when it is probable that such amounts will be collected from customers or credited to customers through the rate-making process. This guidance also provides recognition criteria for adjustments to rates outside of a general rate case proceeding which are provided for to encourage or incentivize investments in certain areas such as conservation, renewable energy, pollution reduction or control, improved infrastructure of the transmission grid or other programs that provide benefits to the general public under public policy, laws or regulations. Regulatory assets generally represent costs that have been incurred but have been deferred because future recovery from customers, as established through the rate-making process, is probable. Regulatory liabilities generally represent amounts to be refunded to customers or amounts currently collected from customers for future costs.
We assess the probability of recovery of regulatory assets and the obligations arising from regulatory liabilities on a quarterly basis. Our probability estimates incorporate numerous factors, including recent rate making decisions, historical precedents for similar matters, the regulatory environments in which we operate and the impact these incurred costs may have on our customers. Changes in our assessments regarding the likelihood of recovery or settlement of our regulatory assets and liabilities may have a material impact on our operating results and financial position. Further, if we determine that all or a portion of our utility business no longer meets the criteria for continued application of regulatory accounting, or our regulators disallow recovery of a previously incurred cost or eliminate a regulatory liability, we would be required to remove the associated regulatory assets and liabilities from our consolidated balance sheetsheets and recognize those amounts in the consolidated statement of income as an expense or income item, or in the consolidated statement of comprehensive income as a loss or gain item, in the period in which this accounting treatment is no longer applicable.
As of December 31, 2023 and 2022, we had regulatory assets of $111.8 million and $119.7 million and regulatory liabilities of $302.0 million and $261.8 million. If future recovery of amounts recorded as regulatory assets was no longer probable we would be required to recognize an expense or loss in the period in which recovery was deemed to no longer be probable.
PENSION AND OTHER POSTRETIREMENT BENEFITS OBLIGATIONS AND COSTS
Pension and postretirement benefit liabilities and expenses are determined by actuaries using assumptions about the discount rate, expected return on plan assets, rate of compensation increase and healthcare cost-trend rates. See noteNote 10 to our consolidated financial statements included in this report on Form 10-K for additional information on our pension and postretirement benefit plans and related assumptions.
These benefits, for any individual employee, can be earned and related expenses can be recognized and a liability accrued over periods of up to 30 or more years. These benefits can be paid out for up to 40 or more years after an employee retires. Estimates of liabilities and expenses related to these benefits are among our most critical accounting estimates. Although deferral and amortization of fluctuations in actuarially determined benefit obligations and expenses are provided for when actual results on a year-to-year basis deviate from long-range assumptions, compensation increases and healthcare cost increases or a reduction in the discount rate applied from one year to the next can significantly increase our benefit expenses in the year of the change. Likewise, compensation decreases and healthcare cost decreases or an increase in the discount rate applied from one year to the next can significantly decrease our benefit expenses in the year of the change. Also, a reductionchange in the expected rate of return on pension plan assets in our funded pension plan or realized rates of return on plan assets that are well above or below assumed rates of return or an increasea change in the anticipated life expectancy of plan participants could result in significant increases or decreases in recognized pension benefit expenses in the year of the change or for many years thereafter because actuarial losses can be amortized over the average remaining service lives of active employees.
We estimate the discount rate through the use of a hypothetical bond portfolio method, which incorporates yields on a collection of high credit quality bonds that produce cash flows similar to our anticipated future benefit payments.
We estimate the assumed long-term rate of return on plan assets based on asset category studies using historical market returns achieved by our asset portfolio allocation over long-term periods, as well as long-term projected return levels.
Pension plan assets are invested in a portfolio according to our return, liquidity and diversification objectives to provide a source of funding for plan obligations and manage contributions to the plan. The pension benefit costprincipal process for 2021 for our noncontributory funded pension planachieving these objectives is expected to be $8.4 million compared to $6.8 million in 2020, reflecting a decrease in the estimatedasset allocation given the long-term risk, return, correlation and liquidity characteristics of each particular asset class.
At December 31, 2023, we set the discount rate used to measure our pension plan obligations at 5.57% and at 5.53% to measure postretirement healthcare obligations, a six and one basis point increase, respectively, from the estimates used at December 31, 2022. Our estimates used to determine annual benefit cost accrualsfor 2023 included a discount rate of 5.51% for pension benefits and 5.52% for postretirement healthcare costs, a 248 and 251 basis point increase, respectively, from 3.47%2022 estimates. The 5.52% discount rate for postretirement healthcare costs was adjusted to 6.06% effective September 30, 2023, in 2020connection with a remeasurement of our plan liability due to 2.78% in 2021.an amendment to the plan. The adjustment to 6.06% was a 305 basis point increase from the 2022 estimate. In addition, we estimated our assumed rate of return on pension plan assets is 6.51%to be 7.00% for 20212023, a 70 basis point increase from our 2022 estimate.
The following table summarizes the impact on 2023 pension and postretirement costs for a 25 basis point increase or decrease, holding all other variables constant, on certain key assumptions:
| | | | | | | | | | | |
| (in thousands) | +0.25 | | -0.25 |
| | | |
| Pension Plan: | | | |
| Discount Rate | $ | 65 | | | $ | (72) | |
| Rate of Increase in Future Compensation | 259 | | | 245 | |
| Long-Term Return on Plan Assets | (926) | | | 926 | |
| Other Postretirement Benefits: | | | |
| Discount Rate | 13 | | | 3 | |
| | | |
For 2024, we expect pension and other postretirement benefit income to be $8.5 million compared with 6.88% for 2020. In selectingto $9.5 million of income in 2023, due to the discount rate, we considerimpacts of updated actuarial assumptions. See additional information at footnote 10 of the yields of fixed income debt securities, which have ratings of “Aa” published by recognized rating agencies, along with bond matching models specific to our plan’s cash flows as a basis to determine the rate.consolidated financial statements.
Subsequent increases or decreases in actual rates of return on plan assets over assumed rates, increases or decreases in the discount rate, increases in future compensation levels, and increases in retiree healthcare cost inflation rates could significantly change projected costs.
The following table summarizes the impact on 2020 pension and postretirement costs for a 0.25 increase or decrease, holding all other variables constant, on certain key assumptions:
| | | | | | | | | | | |
| (in thousands) | +0.25 | | -0.25 |
| | | |
| Pension Plan: | | | |
| Discount Rate | $ | (1,158) | | | $ | 1,160 | |
| Rate of Increase in Future Compensation | 625 | | | (610) | |
| Long-Term Return on Plan Assets | (800) | | | 800 | |
| Other Postretirement Benefits: | | | |
| Discount Rate | (366) | | | 302 | |
| | | |
We believe the estimates made for our pension and other postretirement benefits are reasonable based on the information that is known at the point in time the estimates are made. These estimates and assumptions are subject to a number of variables and are subject to change.
GOODWILL IMPAIRMENT
Goodwill is required to be evaluated annually for impairment and more frequently as events or circumstances require. Goodwill is tested for impairment at the reporting unit level. We have identified two reporting units which carry a material amount of goodwill.
The goodwill impairment test is a single-step quantitative assessment which compares the estimated fair value of the reporting unit to its carrying value. An impairment charge is recognized if the carrying amount exceeds the estimated fair value in an amount that is equal to the excess but limited to the amount of recorded goodwill of the reporting unit. An optional qualitative impairment assessment may be performed prior to and may eliminate the need to perform the quantitative assessment.
Estimating the fair value of a reporting unit under the quantitative impairment method requires significant judgments and estimates. We estimate the fair value of our reporting units primarily using an income approach, which includes a discounted cash flow methodology to arrive at a fair value estimate by determining the present value of projected future cash flows over a specified period plus a terminal value to reflect cash flows beyond the projection period. The discount rate applied to the estimated future cash flows reflects our estimate of the weighted-average cost of capital of comparable entities. To supplement our income approach, we reference various market indications of fair value, where available, and includesinclude fair value estimates using multiples derived from comparable enterprise values to EBITDAearnings before interest, taxes, depreciation, and revenue multiples, comparable price earnings ratiosamortization (EBITDA), and, if available, comparable sales transactions for comparative peer companies.
Our discounted cash flow methodology incorporates significant estimates, which include assumptions of future operating results and cash flows, which are impacted by economic and industry conditions, the amount and timing of estimated capital expenditures, an estimated terminal growth rate and the selection of an appropriate weighted-average cost of capital, among others.
Our goodwill impairment testing performed in the fourth quarter of 20202023 indicated no impairment was present for either reporting unit and the estimated fair value of each reporting unit substantially exceeded the respective carrying value. As part of our testing, we perform various sensitivity analyses to understand if our conclusions are sensitive to changes in certain assumptions. A 1% decrease in projected operating revenues, a one hundred basis point decrease in projected gross profit margins and a twenty five basis point increase in the discount rate would not lead to a goodwill impairment charge for either reporting unit.
We believe the estimates and assumptions used in our impairment assessments are reasonable and based on the best information available. However, these estimates and assumptions inherently include aan inherent degree of uncertainty. Significant adverse changes in our expectations for any of these estimates could result in an impairment charge in a future period which may materially impact our operating results and financial position.
| | | | | |
| ITEM 7A. | QUANTITATIVE AND QUALITATIVE DISCLOSURES ABOUT MARKET RISK |
Market risk is the potential loss arising from adverse changes in market rates and prices. We are primarily exposed to interest rate and commodity price risk.
Interest Rate Risk
Our exposure to interest rate risk as of December 31, 2020 arises from outstanding short-term debt which is subject to variable rates of interest based on benchmark interest rates, primarily LIBOR. As of December 31, 2020 we had $81.0 million of short-term debt outstanding. Holding other variables constant, a one percentage point change in interest rates would have had an approximate $0.3 million impact to interest charges in 2020 based upon our average outstanding short-term debt during the year.
All of our outstanding long-term debt obligations on December 31, 2020 have fixed interest rates and thus are not subject to interest rate risk. We manage our interest rate risk through the issuance of fixed-rate debt with varying maturities, by limiting the amount of variable interest rate debt, and the utilization of short-term borrowings to allow flexibility in the timing and placement of long-term debt.
We have not used hedging instruments to manage interest risk arising from our portfolio of borrowings. We maintain a ratio of fixed-rate debt to total debt within a certain range. It is our policy to enter into interest rate transactions and other financial instruments only to the extent considered necessary to meet our stated objectives. We do not enter into interest rate transactions for speculative or trading purposes.
Commodity Price Risk
The companiesOur Electric segment business is exposed to market risk arising from changes in commodity prices for wholesale energy and natural gas. OTP purchases energy in the wholesale market to supplement its own electricity generation and to respond to changes in demand and variability in generating plant output. In addition, OTP procures natural gas as a fuel source for its combustion turbine peaking facilities. OTP's exposure to price risk for these commodities is largely mitigated by the current ratemaking process and regulatory framework, which generally allows recovery of purchased power and fuel costs from our electric customers.
OTP, where prudent, seeks to further manage its exposure to commodity price variability and reduce volatility in prices for its retail customers through the use of derivative instruments, primarily financial swap agreements. OTP does not engage in derivative and hedging activities for trading purposes. As of December 31, 2023, OTP was party to financial swap agreements with an aggregate notional amount of 187,400 megawatt-hours of electricity with various settlement dates throughout 2024. As of December 31, 2023, the aggregate fair value of these instruments was $4.2 million, reflected as a liability on our consolidated balance sheets. Holding other variables constant, a ten percent change in energy prices would have had an approximate $0.7 million impact on the fair value of these instruments.
Our Manufacturing segment businesses are exposed to market risk related toarising from changes in commodity prices for certain raw material inputs, including steel, aluminum, and polystyrene and other plastics resins. TheWe manage commodity price and availabilityrisk by passing changes in the cost of these rawinput materials could affectthrough to our customers. If our efforts to manage commodity price risk are unsuccessful, the operating revenues and earnings of our Manufacturing segment.segment could be impacted.
The companies in ourOur Plastics segment businesses are exposed to market risk related toarising from changes in commodity prices for PVC resins,resin, the primary raw material commodity used to manufacture PVC pipe. The PVC pipe industry as a whole is highly sensitive to commodity raw material pricing volatility.volatility in PVC resin prices, with frequent adjustments to PVC pipe sale prices to reflect volatility in PVC resin costs. Historically, when resin prices are rising or stable, sales volume hasvolumes have been higher andhigher. In contrast, when resin prices are falling, sales volume hasvolumes have been lower. Operating income may decline when the supply of PVC pipe increases faster than demand. Due to the commodity nature of PVC resin and the dynamic supply and demand factors worldwide, it is very difficultgross profit margins can fluctuate significantly from period to predict gross margin percentages or to assume that historical trends will continue.period.
We do not engage in any hedging activities within our Manufacturing and Plastics segments to manage our commodity price risk.
Interest Rate Risk
Our exposure to interest rate risk arises from our outstanding short-term debt which is subject to variable rates of interest based on benchmark interest rates, primarily SOFR, and our cash equivalent investments, which earn income at a rate that fluctuates daily, based on changes in U.S. treasury rates. As of December 31, 2023 and 2022, we had $81.4 million and $8.2 million of short-term debt outstanding. Holding other variables constant, a 100 basis point change in interest rates during 2023 would have had an approximate $0.5 million impact to interest expense in 2023 based on our average outstanding short-term debt during the year. As of December 31, 2023 and 2022, we had $219.7 million and $105.8 million invested in cash equivalent investments. Holding other variables constant, a 100 basis point change in the average interest rates during 2023 would have had an approximate $1.5 million impact to our investment income in 2023 based on our average outstanding investment balance during the year.
All of our outstanding long-term debt obligations as of December 31, 2023 and 2022 had fixed interest rates and were not subject to material interest rate risk. We manage our interest rate risk through the issuance of fixed-rate debt with varying maturities, by limiting the amount of variable interest rate debt and the utilization of short-term borrowings to allow flexibility in the timing and placement of long-term debt.
We have not used hedging instruments to manage interest risk arising from our portfolio of borrowings. We maintain a ratio of fixed-rate debt to total debt within a certain range. It is our policy to enter into interest rate transactions and other financial instruments only to the extent considered necessary to meet our stated objectives. We do not enter into interest rate transactions for speculative or trading purposes.
| | | | | |
| ITEM 8. | FINANCIAL STATEMENTS AND SUPPLEMENTARY DATA |
REPORT OF INDEPENDENT REGISTERED PUBLIC ACCOUNTING FIRM
To the Shareholdersshareholders and the Board of Directors of Otter Tail Corporation
Opinions on the Financial Statements and Internal Control over Financial Reporting
We have audited the accompanying consolidated balance sheets of Otter Tail Corporation and subsidiaries (the “Company”"Company") as of December 31, 20202023 and 2019,2022, the related consolidated statements of income, comprehensive income, shareholders’shareholders' equity, and cash flows, for each of the three years in the period ended December 31, 2020,2023, and the related notes and the schedules listed in the Index at Item 15 (collectively referred to as the “financial statements”"financial statements"). We also have audited the Company’s internal control over financial reporting as of December 31, 2020,2023, based on criteria established in Internal Control—Control — Integrated Framework (2013) issued by the Committee of Sponsoring Organizations of the Treadway Commission (COSO).
In our opinion, the financial statements referred to above present fairly, in all material respects, the financial position of the Company as of December 31, 20202023 and 2019,2022, and the results of its operations and its cash flows for each of the three years in the period ended December 31, 2020,2023, in conformity with accounting principles generally accepted in the United States of America. Also, in our opinion, the Company maintained, in all material respects, effective internal control over financial reporting as of December 31, 2020,2023, based on the criteria established in Internal Control—Control — Integrated Framework (2013) issued by COSO.
Basis for Opinions
The Company’s management is responsible for these financial statements, for maintaining effective internal control over financial reporting, and for its assessment of the effectiveness of internal control over financial reporting, included in the accompanying Management’s Report Regarding Internal ControlsControl Over Financial Reporting. Our responsibility is to express an opinion on these financial statements and an opinion on the Company’s internal control over financial reporting based on our audits. We are a public accounting firm registered with the Public Company Accounting Oversight Board (United States) (PCAOB) and are required to be independent with respect to the Company in accordance with the U.S. federal securities laws and the applicable rules and regulations of the Securities and Exchange Commission and the PCAOB.
We conducted our audits in accordance with the standards of the PCAOB. Those standards require that we plan and perform the auditaudits to obtain reasonable assurance about whether the financial statements are free of material misstatement, whether due to error or fraud, and whether effective internal control over financial reporting was maintained in all material respects.
Our audits of the financial statements included performing procedures to assess the risks of material misstatement of the financial statements, whether due to error or fraud, and performing procedures to respond to those risks. Such procedures included examining, on a test basis, evidence regarding the amounts and disclosures in the financial statements. Our audits also included evaluating the accounting principles used and significant estimates made by management, as well as evaluating the overall presentation of the financial statements. Our audit of internal control over financial reporting included obtaining an understanding of internal control over financial reporting, assessing the risk that a material weakness exists, and testing and evaluating the design and operating effectiveness of internal control based on the assessed risk. Our audits also included performing such other procedures as we considered necessary in the circumstances. We believe that our audits provide a reasonable basis for our opinions.
Definition and Limitations of Internal Control over Financial Reporting
A company’s internal control over financial reporting is a process designed to provide reasonable assurance regarding the reliability of financial reporting and the preparation of financial statements for external purposes in accordance with generally accepted accounting principles. A company’s internal control over financial reporting includes those policies and procedures that (1) pertain to the maintenance of records that, in reasonable detail, accurately and fairly reflect the transactions and dispositions of the assets of the company; (2) provide reasonable assurance that transactions are recorded as necessary to permit preparation of financial statements in accordance with generally accepted accounting principles, and that receipts and expenditures of the company are being made only in accordance with authorizations of management and directors of the company; and (3) provide reasonable assurance regarding prevention or timely detection of unauthorized acquisition, use, or disposition of the company’s assets that could have a material effect on the financial statements.
Because of its inherent limitations, internal control over financial reporting may not prevent or detect misstatements. Also, projections of any evaluation of effectiveness to future periods are subject to the risk that controls may become inadequate because of changes in conditions, or that the degree of compliance with the policies or procedures may deteriorate.
Critical Audit MattersMatter
The critical audit mattersmatter communicated below are mattersis a matter arising from the current-period audit of the financial statements that werewas communicated or required to be communicated to the audit committee and that (1) relaterelates to accounts or disclosures that are material to the financial statements and (2) involved our especially challenging, subjective, or complex judgments. The communication of critical audit matters does not alter in any way our opinion on the financial statements, taken as a whole, and we are not, by communicating the critical audit mattersmatter below, providing a separate opinionsopinion on the critical audit mattersmatter or on the accounts or disclosures to which they relate.it relates.
Rate and Regulatory Matters—Impact of Rate Regulation on the Financial Statements—Refer to Notes 1 and 5 to the financial statements.
Critical Audit Matter Description
The Company’s regulated Electric segment accounts for the financial effects of regulation in accordance with ASC 980, Regulated Operations.Operations. This guidance allows for the recording of a regulatory asset or liability for certain costs or credits which otherwise would be recognized in the statement of income or comprehensive income based on an expectation that the cost will be recovered or returned in future rates. This guidance also provides for adjustments to rates outside of a general rate case proceeding to encourage or incentivize investments in certain areas such as conservation, renewable energy, pollution reduction or control, improved infrastructure of the transmission grid or other programs that provide benefits to the general public under public policy, laws or regulationsregulations.
The Company is subject to rate regulation of rates and other matters by state and federal regulatory agencies (collectively, the “Commissions”), which have jurisdiction with respect to the rates of electric distribution companies in Minnesota, North Dakota and South Dakota. The Company assessassesses the probability of recovery of regulatory assets and the obligations arising from regulatory liabilities on a quarterly basis. Probability estimates incorporate numerous factors, including recent rate making decisions, historical precedents for similar matters, the regulatory environments in which the Company operates, and the impact thesethat incurred costs may have on customers.
Accounting for the economics of rate regulation impacts multiple financial statement line items and disclosures, such as property, plant, and equipment, regulatory assets and liabilities, operating revenues and expenses, depreciation expense, income taxes and multiple disclosures in the notes to the financial statements. There is a risk that the Commissions will not approve full recovery of the costs of providing utility service or full recovery of all amounts invested in the utility business and a reasonable return on that investment. As a result, we identified the impact of rate regulation as a critical audit matter due to the significant judgments made by management to support its assertions about impacted account balances and disclosures and the high degree of subjectivity involved in assessing the impact of future regulatory orders on the financial statements. Management judgments include assessing the likelihoodrecording of (1) recoveryregulatory assets for certain costs which otherwise would be recognized in the statement of income or comprehensive income based on an expectation that the costs will be recovered in future rates and the recording of incurred costs, (2) a disallowanceregulatory liabilities for certain credits which would otherwise be recognized in the statement of capital expendituresincome or operating costscomprehensive income based on an expectation that management believes were prudently incurred, and (3) a refundthe amount will be returned to customers.customers in future rates. Given that management’s accounting judgements are based on assumptions about the outcome of future decisions by the Commissions, auditing these judgments required specialized knowledge of accounting for rate regulation and the rate setting process due to its inherent complexities.
How the Critical Audit Matter Was Addressed in the Audit
Our audit procedures related to the uncertainty of future decisions by the Commissions included the following, among others:
•We tested the effectiveness of management’s controls over the evaluation of the likelihood of (1) the recovery in future rates of costs incurred as property, plant, and equipment and deferred as regulatory assets, and (2) a refund or a future reduction in rates that should be reported as regulatory liabilities. We also tested the effectiveness of management’s controls over the initial recognition of amounts as property, plant, and equipment; regulatory assets or liabilities; andliabilities, the monitoring and evaluation of regulatory developments that may affect the likelihood of recovering costs in future rates or of a future reduction in rates.
•We evaluatedrates, and the Company’srelated disclosures relatedin the notes to the impacts of rate regulation, including the balances recorded and regulatory developments.financial statements.
•We evaluated the Company’s disclosures related to the impacts of rate regulation, including the balances recorded and regulatory developments.
•We read relevant regulatory orders issued by the Commissions for the Company, regulatory statutes, interpretations, procedural memorandums, filings made by interveners, and other publicly available information to assess the likelihood of recovery in future rates or of a future reduction in rates based on precedents of the Commissions’ treatment of similar costs under similar circumstances. We evaluated the external information and compared to management’s recorded regulatory asset and liability balances for completeness.
•We inquired of management about property, plant, and equipment that may be abandoned. We inspected the capital-projects budget and construction-in-process listings and inquired of management to identify projects that are designed to replace assets that may be retired prior to the end of the useful life. We inspected minutes of the board of directors and regulatory orders and other filings with the Commissions to identify any evidence that may contradict management’s assertion regarding probability of an abandonment.
•We compared actual spend for projects that have been capitalized to property, plant, and equipment to budget. We evaluated regulatory filings for any evidence that intervenors are challenging full recovery of the cost of any capital projects.
•We obtained an analysis from management and letters from internal and external legal counsel, as appropriate, regarding probability of recovery for regulatory assets or refund or future reduction in rates for regulatory liabilities not yet addressed in a regulatory order to assess management’s assertion that amounts are probable of recovery or a future reduction in rates.
Goodwill—Manufacturing Reporting Unit—Refer to Notes 1 and 7 to the financial statements
Critical Audit Matter Description
The Company’s evaluation of goodwill for impairment involves the comparison of the fair value of each reporting unit to its carrying value. The Company performs quantitative assessments of goodwill annually as of December 31 (the “measurement date”) and more frequently as events or circumstances require. The Company estimates the fair value of its Manufacturing reporting unit by primarily using the discounted cash flow model. The determination of the fair value using the discounted cash flow model requires management to make significant estimates and assumptions related to forecasts of future operating results and cash flows. The Manufacturing reporting unit’s operating results and cash flows are sensitive to changes in demand. The goodwill balance was $37.6 million as of December 31, 2020, of which $18.3 million was allocated to the Manufacturing
reporting unit. The fair value of the Manufacturing reporting unit exceeded its carrying value as of the measurement date and, therefore, no impairment was recognized.
We identified goodwill for the Manufacturing reporting unit as a critical audit matter because of the significant judgments made by management to estimate its fair value and the difference between its fair value and carrying value and the sensitivity of the Manufacturing reporting unit’s operations to changes in demand. This required a high degree of auditor judgment and an increased extent of effort when performing audit procedures to evaluate the reasonableness of management’s estimates and assumptions related to forecasts of future operating results and cash flows.
How the Critical Audit Matter Was Addressed in the Audit
Our audit procedures related to forecasts of future operating results and cash flows used by management to estimate the fair value of the Manufacturing reporting unit included the following, among others:
•We tested the effectiveness of controls over management’s goodwill impairment evaluation, including those over the determination of the fair value of the Manufacturing reporting unit, such as controls related to forecasts of future operating results and cash flows.
•We evaluated management’s ability to accurately forecast future operating results and cash flows by comparing actual results to management’s historical forecasts.
•We evaluated the reasonableness of management’s operating results and cash flow forecasts by comparing the forecasts to:
–Historical operating results and cash flows.
–Internal communications to management and the Board of Directors.
–Forecasted information included in Company press releases as well as in analyst and industry reports for the Company and certain of its peer companies.
/s/ Deloitte & Touche LLP
Minneapolis, Minnesota
February 19, 202114, 2024
We have served as the Company’sCompany's auditor since 1944.
OTTER TAIL CORPORATION
CONSOLIDATED BALANCE SHEETS | | December 31, |
| December 31, | | | December 31, |
| (in thousands, except share data) | (in thousands, except share data) | 2020 | | 2019 | (in thousands, except share data) | 2023 | | 2022 |
| | Assets | |
| Assets | |
| Assets | Assets | | | | | | |
| Current Assets | Current Assets | | | | Current Assets | | | |
| Cash and Cash Equivalents | Cash and Cash Equivalents | $ | 1,163 | | | $ | 21,199 | |
| Receivables, net of allowance for credit losses | Receivables, net of allowance for credit losses | 113,959 | | | 107,631 | |
| Inventories | Inventories | 92,165 | | | 97,851 | |
| Regulatory Assets | Regulatory Assets | 21,900 | | | 21,650 | |
| Other Current Assets | Other Current Assets | 5,645 | | | 6,529 | |
| Total Current Assets | Total Current Assets | 234,832 | | | 254,860 | |
| Noncurrent Assets | Noncurrent Assets | |
| Investments | Investments | 51,856 | | | 45,374 | |
| Investments | |
| Investments | |
| Property, Plant and Equipment, net of accumulated depreciation | Property, Plant and Equipment, net of accumulated depreciation | 2,049,273 | | | 1,753,794 | |
| Regulatory Assets | Regulatory Assets | 168,395 | | | 144,138 | |
| Intangible Assets, net of accumulated amortization | Intangible Assets, net of accumulated amortization | 10,144 | | | 11,290 | |
| Goodwill | Goodwill | 37,572 | | | 37,572 | |
| Other Noncurrent Assets | Other Noncurrent Assets | 26,282 | | | 26,567 | |
| Total Noncurrent Assets | Total Noncurrent Assets | 2,343,522 | | | 2,018,735 | |
| Total Assets | Total Assets | $ | 2,578,354 | | | $ | 2,273,595 | |
| | Liabilities and Shareholders' Equity | Liabilities and Shareholders' Equity | |
| Liabilities and Shareholders' Equity | |
| Liabilities and Shareholders' Equity | |
| Current Liabilities | |
| Current Liabilities | |
| Current Liabilities | Current Liabilities | |
| Short-Term Debt | Short-Term Debt | $ | 80,997 | | | $ | 6,000 | |
| Current Maturities of Long-Term Debt | 140,087 | | | 183 | |
| Short-Term Debt | |
| Short-Term Debt | |
| | Accounts Payable | |
| Accounts Payable | |
| Accounts Payable | Accounts Payable | 130,805 | | | 120,775 | |
| Accrued Salaries and Wages | Accrued Salaries and Wages | 26,908 | | | 22,730 | |
| Accrued Taxes | Accrued Taxes | 18,831 | | | 17,525 | |
| Regulatory Liabilities | Regulatory Liabilities | 16,663 | | | 7,480 | |
| Other Current Liabilities | Other Current Liabilities | 22,495 | | | 15,048 | |
| Total Current Liabilities | Total Current Liabilities | 436,786 | | | 189,741 | |
| Noncurrent Liabilities and Deferred Credits | Noncurrent Liabilities and Deferred Credits | |
| Pensions Benefit Liability | 114,055 | | | 98,970 | |
| Pension Benefit Liability | |
| Pension Benefit Liability | |
| Pension Benefit Liability | |
| Other Postretirement Benefits Liability | Other Postretirement Benefits Liability | 67,359 | | | 71,437 | |
| Regulatory Liabilities | Regulatory Liabilities | 233,973 | | | 239,906 | |
| Deferred Income Taxes | Deferred Income Taxes | 153,376 | | | 131,941 | |
| Deferred Tax Credits | Deferred Tax Credits | 17,405 | | | 18,626 | |
| Other Noncurrent Liabilities | Other Noncurrent Liabilities | 60,002 | | | 51,911 | |
| Total Noncurrent Liabilities and Deferred Credits | Total Noncurrent Liabilities and Deferred Credits | 646,170 | | | 612,791 | |
| Commitments and Contingencies (Note 13) | Commitments and Contingencies (Note 13) | 0 | | 0 | Commitments and Contingencies (Note 13) | | | |
| Capitalization | Capitalization | |
| Long-Term Debt, net of current maturities | 624,432 | | | 689,581 | |
| Long-Term Debt | |
| Long-Term Debt | |
| Long-Term Debt | |
| Shareholders' Equity | Shareholders' Equity | |
Common Shares: 50,000,000 share authorized of $5 par value; 41,469,879 and 40,157,591 outstanding at December 31, 2020 and 2019 | 207,349 | | | 200,788 | |
Common Stock: 50,000,000 shares authorized of $5 par value; 41,710,521 and 41,631,113 outstanding at December 31, 2023 and 2022 | |
Common Stock: 50,000,000 shares authorized of $5 par value; 41,710,521 and 41,631,113 outstanding at December 31, 2023 and 2022 | |
Common Stock: 50,000,000 shares authorized of $5 par value; 41,710,521 and 41,631,113 outstanding at December 31, 2023 and 2022 | |
| Additional Paid-In Capital | Additional Paid-In Capital | 414,246 | | | 364,790 | |
| Retained Earnings | Retained Earnings | 257,878 | | | 222,341 | |
| Accumulated Other Comprehensive Loss | (8,507) | | | (6,437) | |
| Accumulated Other Comprehensive Income | |
| Total Shareholders' Equity | Total Shareholders' Equity | 870,966 | | | 781,482 | |
| Total Capitalization | Total Capitalization | 1,495,398 | | | 1,471,063 | |
| Total Liabilities and Shareholders' Equity | Total Liabilities and Shareholders' Equity | $ | 2,578,354 | | | $ | 2,273,595 | |
See accompanying notes to consolidated financial statements.
OTTER TAIL CORPORATION
CONSOLIDATED STATEMENTS OF INCOME | | Years Ended December 31, |
| Years Ended December 31, | | | Years Ended December 31, |
| (in thousands, except per-share amounts) | (in thousands, except per-share amounts) | 2020 | | 2019 | | 2018 | (in thousands, except per-share amounts) | 2023 | | 2022 | | 2021 |
| | Operating Revenues | |
| Operating Revenues | |
| Operating Revenues | Operating Revenues | | | | | | | | |
| Electric | Electric | $ | 446,088 | | | $ | 459,048 | | | $ | 450,198 | |
| Product Sales | Product Sales | 444,019 | | | 460,455 | | | 466,249 | |
| Total Operating Revenues | Total Operating Revenues | 890,107 | | | 919,503 | | | 916,447 | |
| Operating Expenses | Operating Expenses | |
| Electric Production Fuel | Electric Production Fuel | 46,296 | | | 59,256 | | | 66,815 | |
| Electric Production Fuel | |
| Electric Production Fuel | |
| Electric Purchased Power | Electric Purchased Power | 61,698 | | | 72,066 | | | 68,355 | |
| Electric Operating and Maintenance Expenses | Electric Operating and Maintenance Expenses | 150,848 | | | 153,529 | | | 155,534 | |
| Cost of Products Sold (excluding depreciation) | Cost of Products Sold (excluding depreciation) | 329,257 | | | 355,119 | | | 354,559 | |
| Other Nonelectric Expenses | 55,051 | | | 50,782 | | | 51,544 | |
| Nonelectric Selling, General, and Administrative Expenses | |
| Depreciation and Amortization | Depreciation and Amortization | 82,037 | | | 78,086 | | | 74,666 | |
| Electric Property Taxes | Electric Property Taxes | 17,034 | | | 15,785 | | | 15,585 | |
| Total Operating Expenses | Total Operating Expenses | 742,221 | | | 784,623 | | | 787,058 | |
| Operating Income | Operating Income | 147,886 | | | 134,880 | | | 129,389 | |
| Other Income and Expense | Other Income and Expense | |
| Interest Charges | 34,447 | | | 31,411 | | | 30,408 | |
| Interest Expense | |
| Interest Expense | |
| Interest Expense | |
| Nonservice Cost Components of Postretirement Benefits | Nonservice Cost Components of Postretirement Benefits | 3,437 | | | 4,293 | | | 5,509 | |
| Other Income | 6,055 | | | 5,112 | | | 3,461 | |
| Other Income (Expense), net | |
| Income Before Income Taxes | Income Before Income Taxes | 116,057 | | | 104,288 | | | 96,933 | |
| Income Tax Expense | Income Tax Expense | 20,206 | | | 17,441 | | | 14,588 | |
| Net Income | Net Income | $ | 95,851 | | | $ | 86,847 | | | $ | 82,345 | |
| | Weighted-Average Common Shares Outstanding: | Weighted-Average Common Shares Outstanding: | |
| Weighted-Average Common Shares Outstanding: | |
| Weighted-Average Common Shares Outstanding: | |
| Basic | |
| Basic | |
| Basic | Basic | 40,710 | | | 39,721 | | | 39,600 | |
| Diluted | Diluted | 40,905 | | | 39,954 | | | 39,892 | |
| Earnings Per Share: | Earnings Per Share: | |
| Basic | Basic | $ | 2.35 | | | $ | 2.19 | | | $ | 2.08 | |
| Basic | |
| Basic | |
| Diluted | Diluted | $ | 2.34 | | | $ | 2.17 | | | $ | 2.06 | |
See accompanying notes to consolidated financial statements.
OTTER TAIL CORPORATION
CONSOLIDATED STATEMENTS OF COMPREHENSIVE INCOME | | | | | | | | | | | | | | | | | |
| Years Ended December 31, |
| (in thousands) | 2020 | | 2019 | | 2018 |
| | | | | |
| Net Income | $ | 95,851 | | | $ | 86,847 | | | $ | 82,345 | |
| Other Comprehensive Income (Loss): | | | | | |
| Unrealized Gain (Loss) on Available-for-Sale Securities: | | | | | |
| Reversal of Previously Recognized Losses (Gains) Realized on Sale of Investments and Included in Other Income During Period | 13 | | | 16 | | | (105) | |
| Unrealized Gains (Losses) Arising During Period | 184 | | | 147 | | | (61) | |
| Income Tax (Expense) Benefit | (42) | | | (34) | | | 35 | |
| Available-for-Sale Securities, net of tax | 155 | | | 129 | | | (131) | |
| Pension and Postretirement Benefit Plans: | | | | | |
| Actuarial (Losses) Gains net of Regulatory Allocation Adjustment | (3,571) | | | (2,779) | | | 1,919 | |
| Amortization of Unrecognized Postretirement Benefit Losses and Costs | 550 | | | 565 | | | 985 | |
| Income Tax Benefit (Expense) | 796 | | | 576 | | | (755) | |
| Adjustment to Income Tax Expense Related to 2017 Tax Cuts and Jobs Act | 0 | | | 0 | | | (531) | |
| Pension and Postretirement Benefit Plan, net of tax | (2,225) | | | (1,638) | | | 1,618 | |
Total Other Comprehensive Income (Loss) | (2,070) | | | (1,509) | | | 1,487 | |
| Total Comprehensive Income | $ | 93,781 | | | $ | 85,338 | | | $ | 83,832 | |
| | | | | | | | | | | | | | | | | |
| Years Ended December 31, |
| (in thousands) | 2023 | | 2022 | | 2021 |
| | | | | |
| Net Income | $ | 294,191 | | | $ | 284,184 | | | $ | 176,769 | |
| Other Comprehensive Income (Loss): | | | | | |
| Unrealized Gain (Loss) on Available-for-Sale Securities, net of tax (expense) benefit of $(51), $115 and $52 | 192 | | | (432) | | | (196) | |
| Pension and Other Postretirement Benefit Plan, net of tax expense of $14, $2,769 and $766 | 41 | | | 7,871 | | | 2,179 | |
Total Other Comprehensive Income | 233 | | | 7,439 | | | 1,983 | |
| Total Comprehensive Income | $ | 294,424 | | | $ | 291,623 | | | $ | 178,752 | |
See accompanying notes to consolidated financial statements.
OTTER TAIL CORPORATION
CONSOLIDATED STATEMENTS OF SHAREHOLDERS' EQUITY | | | | | | | | | | | | | | | | | | | | | | | | | | | | | | | | | | | |
| (in thousands, except common shares outstanding) | Common
Shares
Outstanding | | Par Value,
Common
Shares | | Additional Paid-In Capital | | Retained
Earnings | | Accumulated Other Comprehensive Income (Loss)1 | | Total Shareholders' Equity |
| | | | | | | | | | | |
| Balance, December 31, 2017 | 39,557,491 | | | $ | 197,787 | | | $ | 343,450 | | | $ | 161,286 | | | $ | (5,631) | | | $ | 696,892 | |
| Common Stock Issuances, Net of Expenses | 178,601 | | | 893 | | | (986) | | | | | | | (93) | |
| Common Stock Retirements and Forfeitures | (71,208) | | | (356) | | | (2,655) | | | | | | | (3,011) | |
| Net Income | | | | | | | 82,345 | | | | | 82,345 | |
| Other Comprehensive Income | | | | | | | | | 1,487 | | | 1,487 | |
| Stock Compensation Expense | | | | | 4,441 | | | | | | | 4,441 | |
| Common Dividends ($1.34 per share) | | | | | | | (53,198) | | | | | (53,198) | |
| Balance, December 31, 2018 | 39,664,884 | | | $ | 198,324 | | | $ | 344,250 | | | $ | 190,433 | | | $ | (4,144) | | | $ | 728,863 | |
| Common Stock Issuances, Net of Expenses | 547,931 | | | 2,740 | | | 17,036 | | | | | | | 19,776 | |
| Common Stock Retirements and Forfeitures | (55,224) | | | (276) | | | (2,454) | | | | | | | (2,730) | |
| Net Income | | | | | | | 86,847 | | | | | 86,847 | |
| Other Comprehensive Loss | | | | | | | | | (1,509) | | | (1,509) | |
| Stranded Tax Transfer | | | | | | | 784 | | | (784) | | | 0 | |
| Stock Compensation Expense | | | | | 5,958 | | | | | | | 5,958 | |
| Common Dividends ($1.40 per share) | | | | | | | (55,723) | | | | | (55,723) | |
| Balance, December 31, 2019 | 40,157,591 | | | $ | 200,788 | | | $ | 364,790 | | | $ | 222,341 | | | $ | (6,437) | | | $ | 781,482 | |
| Common Stock Issuances, Net of Expenses | 1,350,505 | | | 6,752 | | | 45,050 | | | | | | | 51,802 | |
| Common Stock Retirements and Forfeitures | (38,217) | | | (191) | | | (1,878) | | | | | | | (2,069) | |
| Net Income | | | | | | | 95,851 | | | | | 95,851 | |
| Other Comprehensive Loss | | | | | | | | | (2,070) | | | (2,070) | |
| Stock Compensation Expense | | | | | 6,284 | | | | | | | 6,284 | |
| Common Dividends ($1.48 per share) | | | | | | | (60,314) | | | | | (60,314) | |
| Balance, December 31, 2020 | 41,469,879 | | | $ | 207,349 | | | $ | 414,246 | | | $ | 257,878 | | | $ | (8,507) | | | $ | 870,966 | |
| | | | | | | | | | | | | | | | | |
1Accumulated Other Comprehensive Income (Loss) as of December 31 is comprised of the following: |
| (in thousands) | 2020 | | 2019 | | 2018 |
| Unrealized Gain (Loss) on Marketable Equity Securities: | | | | | |
| Before Tax | $ | 265 | | | $ | 68 | | | $ | (95) | |
| Tax Effect | (56) | | | (14) | | | 20 | |
| Stranded Tax Effect | 0 | | | 0 | | | (10) | |
| Unrealized Gain (Loss) on Marketable Equity Securities, net of tax | 209 | | | 54 | | | (85) | |
| Unamortized Actuarial Losses and Prior Service Costs Related to Pension and Postretirement Benefits: | | | | | |
| Before Tax | (11,793) | | | (8,772) | | | (6,558) | |
| Tax Effect | 3,077 | | | 2,281 | | | 1,705 | |
| Stranded Tax Effect | 0 | | | 0 | | | 794 | |
| Unamortized Actuarial Losses and Prior Service Costs Related to Pension and Postretirement Benefits, net of tax | (8,716) | | | (6,491) | | | (4,059) | |
| Accumulated Other Comprehensive Loss: | | | | | |
| Before Tax | (11,528) | | | (8,704) | | | (6,653) | |
| Tax Effect | 3,021 | | | 2,267 | | | 1,725 | |
| Stranded Tax Effect | 0 | | | 0 | | | 784 | |
| Net Accumulated Other Comprehensive Loss | $ | (8,507) | | | $ | (6,437) | | | $ | (4,144) | |
| | | | | | | | | | | | | | | | | | | | | | | | | | | | | | | | | | | |
| (in thousands, except common stock outstanding) | Common
Stock
Outstanding | | Par Value,
Common
Stock | | Additional Paid-In Capital | | Retained
Earnings | | Accumulated
Other
Comprehensive
Income (Loss) | | Total Shareholders' Equity |
| | | | | | | | | | | |
| Balance, December 31, 2020 | 41,469,879 | | | $ | 207,349 | | | $ | 414,246 | | | $ | 257,878 | | | $ | (8,507) | | | $ | 870,966 | |
| | | | | | | | | | | |
| Stock Issued Under Dividend Reinvestment and Stock Purchase Plans, Net of Expenses | 11,540 | | | 58 | | | 446 | | | — | | | — | | | 504 | |
| Stock Issued Under Share-Based Compensation Plans, Net of Shares Withheld for Employee Taxes | 70,105 | | | 351 | | | (1,840) | | | — | | | — | | | (1,489) | |
| Net Income | — | | | — | | | — | | | 176,769 | | | — | | | 176,769 | |
| Other Comprehensive Income | — | | | — | | | — | | | — | | | 1,983 | | | 1,983 | |
| Stock Compensation Expense | — | | | — | | | 6,908 | | | — | | | — | | | 6,908 | |
| Common Dividends ($1.56 per share) | — | | | — | | | — | | | (64,864) | | | — | | | (64,864) | |
| Balance, December 31, 2021 | 41,551,524 | | | $ | 207,758 | | | $ | 419,760 | | | $ | 369,783 | | | $ | (6,524) | | | $ | 990,777 | |
| | | | | | | | | | | |
| Employee Stock Purchase Plan Expenses | — | | | — | | | (219) | | | — | | | — | | | (219) | |
| Stock Issued Under Share-Based Compensation Plans, Net of Shares Withheld for Employee Taxes | 79,589 | | | 398 | | | (3,321) | | | — | | | — | | | (2,923) | |
| Net Income | — | | | — | | | — | | | 284,184 | | | — | | | 284,184 | |
| Other Comprehensive Income | — | | | — | | | — | | | — | | | 7,439 | | | 7,439 | |
| Stock Compensation Expense | — | | | — | | | 6,814 | | | — | | | — | | | 6,814 | |
| Common Dividends ($1.65 per share) | — | | | — | | | — | | | (68,755) | | | — | | | (68,755) | |
| Balance, December 31, 2022 | 41,631,113 | | | $ | 208,156 | | | $ | 423,034 | | | $ | 585,212 | | | $ | 915 | | | $ | 1,217,317 | |
| | | | | | | | | | | |
| Employee Stock Purchase Plan Expenses | — | | | — | | | (339) | | | — | | | — | | | (339) | |
| Stock Issued Under Share-Based Compensation Plans, Net of Shares Withheld for Employee Taxes | 79,408 | | | 397 | | | (3,485) | | | — | | | — | | | (3,088) | |
| Net Income | — | | | — | | | — | | | 294,191 | | | — | | | 294,191 | |
| Other Comprehensive Income | — | | | — | | | — | | | — | | | 233 | | | 233 | |
| Stock Compensation Expense | — | | | — | | | 7,753 | | | — | | | — | | | 7,753 | |
| Common Dividends ($1.75 per share) | — | | | — | | | — | | | (73,061) | | | — | | | (73,061) | |
| Balance, December 31, 2023 | 41,710,521 | | | $ | 208,553 | | | $ | 426,963 | | | $ | 806,342 | | | $ | 1,148 | | | $ | 1,443,006 | |
See accompanying notes to consolidated financial statements.
OTTER TAIL CORPORATION
CONSOLIDATED STATEMENTS OF CASH FLOWS | | Years Ended December 31, |
| Years Ended December 31, | | | Years Ended December 31, |
| (in thousands) | (in thousands) | 2020 | | 2019 | | 2018 | (in thousands) | 2023 | | 2022 | | 2021 |
| | Operating Activities | |
| Operating Activities | |
| Operating Activities | Operating Activities | | | | | | | | |
| Net Income | Net Income | $ | 95,851 | | | $ | 86,847 | | | $ | 82,345 | |
| Adjustments to Reconcile Net Income to Net Cash Provided by Operating Activities: | Adjustments to Reconcile Net Income to Net Cash Provided by Operating Activities: | |
| Depreciation and Amortization | Depreciation and Amortization | 82,037 | | | 78,086 | | | 74,666 | |
| Depreciation and Amortization | |
| Depreciation and Amortization | |
| Deferred Tax Credits | Deferred Tax Credits | (1,221) | | | (1,348) | | | (1,405) | |
| Deferred Income Taxes | Deferred Income Taxes | 15,201 | | | 11,507 | | | 19,224 | |
| Change in Deferred Debits and Other Assets | (26,130) | | | (15,502) | | | 941 | |
| Discretionary Contribution to Pension Plan | Discretionary Contribution to Pension Plan | (11,200) | | | (22,500) | | | (20,000) | |
| Change in Noncurrent Liabilities and Deferred Credits | 34,421 | | | 33,534 | | | (2,414) | |
| Allowance for Equity/Other Funds Used During Construction | (4,063) | | | (2,553) | | | (2,194) | |
| Investment (Gains) Losses | |
| Stock Compensation Expense | Stock Compensation Expense | 6,284 | | | 5,958 | | | 4,441 | |
| Other—Net | (463) | | | 76 | | | 0 | |
| Cash (Used for) Provided by Current Assets and Current Liabilities: | |
| Change in Receivables | (6,328) | | | (1,860) | | | (8,559) | |
| Change in Inventories | 5,686 | | | 8,419 | | | (18,236) | |
| Change in Other Current Assets | (573) | | | 2,919 | | | (754) | |
| Change in Payables and Other Current Liabilities | 19,744 | | | (171) | | | 14,997 | |
| Change in Interest Payable and Income Taxes Receivable | 2,675 | | | 1,625 | | | 396 | |
| Other, net | |
| Changes in Operating Assets and Liabilities: | |
| Receivables | |
| Receivables | |
| Receivables | |
| Inventories | |
| Regulatory Assets | |
| Other Assets | |
| Accounts Payable | |
| Accrued and Other Liabilities | |
| Regulatory Liabilities | |
| Pension and Other Postretirement Benefits | |
| Net Cash Provided by Operating Activities | Net Cash Provided by Operating Activities | 211,921 | | | 185,037 | | | 143,448 | |
| Investing Activities | Investing Activities | |
| Capital Expenditures | Capital Expenditures | (371,553) | | | (207,365) | | | (105,425) | |
| Capital Expenditures | |
| Capital Expenditures | |
| Proceeds from Disposal of Noncurrent Assets | Proceeds from Disposal of Noncurrent Assets | 5,011 | | | 8,519 | | | 2,378 | |
| Cash Used for Investments and Other Assets | (9,110) | | | (10,626) | | | (4,372) | |
| Purchases of Investments and Other Assets | |
| Net Cash Used in Investing Activities | Net Cash Used in Investing Activities | (375,652) | | | (209,472) | | | (107,419) | |
| Financing Activities | Financing Activities | |
| Change in Checks Written in Excess of Cash | 4,849 | | | (2,814) | | | (345) | |
| Net Short-Term Borrowings (Repayments) | 74,997 | | | (12,599) | | | (93,772) | |
| Net Borrowings (Repayments) on Short-Term Debt | |
| Net Borrowings (Repayments) on Short-Term Debt | |
| Net Borrowings (Repayments) on Short-Term Debt | |
| Proceeds from Issuance of Common Stock | Proceeds from Issuance of Common Stock | 52,432 | | | 20,338 | | | 0 | |
| Common Stock Issuance Expenses | (648) | | | (577) | | | (108) | |
| Payments for Shares Withheld for Employee Tax Obligations | (2,069) | | | (2,730) | | | (3,011) | |
| Proceeds from Issuance of Long-Term Debt | Proceeds from Issuance of Long-Term Debt | 75,000 | | | 100,000 | | | 100,000 | |
| Short-Term and Long-Term Debt Issuance Expenses | (370) | | | (950) | | | (761) | |
| Payments for Retirement of Long-Term Debt | Payments for Retirement of Long-Term Debt | (182) | | | (172) | | | (189) | |
| Dividends Paid | Dividends Paid | (60,314) | | | (55,723) | | | (53,198) | |
Net Cash Provided by Financing Activities | 143,695 | | | 44,773 | | | (51,384) | |
| Payments for Shares Withheld for Employee Tax Obligations | |
| Other, net | |
| Net Cash Used in Financing Activities | |
| Net Change in Cash and Cash Equivalents | Net Change in Cash and Cash Equivalents | (20,036) | | | 20,338 | | | (15,355) | |
| Cash and Cash Equivalents at Beginning of Period | Cash and Cash Equivalents at Beginning of Period | 21,199 | | | 861 | | | 16,216 | |
| Cash and Cash Equivalents at End of Period | Cash and Cash Equivalents at End of Period | $ | 1,163 | | | $ | 21,199 | | | $ | 861 | |
| | Supplemental Disclosures of Cash Flow Information | Supplemental Disclosures of Cash Flow Information | |
| Supplemental Disclosures of Cash Flow Information | |
| Supplemental Disclosures of Cash Flow Information | |
| Cash Paid During the Year for: | Cash Paid During the Year for: | |
| Interest (net of amount capitalized) | $ | 33,199 | | | $ | 30,132 | | | $ | 28,109 | |
| Cash Paid During the Year for: | |
| Cash Paid During the Year for: | |
| Interest, net of amount capitalized | |
| Interest, net of amount capitalized | |
| Interest, net of amount capitalized | |
| Income Taxes | Income Taxes | $ | 5,177 | | | $ | 4,797 | | | $ | 6,109 | |
| Supplemental Disclosure of Noncash Investing Activities | Supplemental Disclosure of Noncash Investing Activities | |
| Transactions Related to Capital Additions Not Settled in Cash | $ | 34,265 | | | $ | 37,429 | | | $ | 13,757 | |
| Accrued Property, Plant and Equipment Additions | |
| Accrued Property, Plant and Equipment Additions | |
| Accrued Property, Plant and Equipment Additions | |
See accompanying notes to consolidated financial statements
OTTER TAIL CORPORATION
NOTES TO CONSOLIDATED FINANCIAL STATEMENTS
1. Summary of Significant Accounting Policies
Overview
Otter Tail Corporation (OTC) and its subsidiaries (collectively, the "Company", "us", "our" or "we") form a diverse, multi-platform business consisting of a vertically integrated, regulated utility with generation, transmission and distribution facilities complimentedcomplemented by manufacturing businesses providing metal fabrication for custom machine parts and metal components, manufacturing of extruded and thermoformed plastic products, and manufacturing of PVC pipe products. We classify our business into 3three segments: Electric, Manufacturing and Plastics. Note 2 includes an additional description of the segments and financial information regarding each segment.
Principles of Consolidation
These consolidated financial statements are presented in accordance with U.S. generally accepted accounting principles and include the accounts of Otter Tail CorporationOTC and its wholly owned subsidiaries. All intercompany balances and transactions have been eliminated in consolidation except, as applicable, profits on sales to our regulated electric utility company from our nonregulated businesses, which is in accordance with the accounting requirements of regulated operations.
Use of Estimates
We use estimates based on the best information available in recording transactions and balances resulting from business operations. As better information becomes available, (oror actual amounts are known),known, the recorded estimates are revised. Consequently, operating results can be affected by revisions to prior accounting estimates.
Reclassifications
Certain reclassifications of amounts previously reported have been made to the accompanying consolidated balance sheetsstatements of cash flows to maintain consistency and comparability between periods presented. Other, net operating cash flows previously reported for the years ended December 31, 2022 and 2021, included $3.3 million of investment losses and $4.5 million of investment gains, respectively, which are presented separately in the current year, and excluded $1.7 million and $0.8 million of allowance for equity funds used during construction (AFUDC), which were previously presented separately. The reclassifications had no impact on previously reported currentnet cash provided by operating activities, net cash used in investing activities, net cash used in financing activities, or cash and cash equivalents. Certain prior period amounts related to deferred tax assets total assets, current liabilities, noncurrent liabilities and deferred credits, or shareholders' equity.tax liabilities included in footnote 12 have been reclassified to conform to the current year presentation.
Regulatory Accounting
Our regulated electric utility company, Otter Tail Power Company (OTP), is subject to regulation of rates and other matters by state utility commissions in Minnesota, North Dakota and South Dakota and by the Federal Energy Regulatory Commission (FERC)FERC for certain interstate operations. OTP accounts for the financial effects of regulation in accordance with accounting guidance for regulated operations. This guidance allows for the recording of a regulatory asset for certain costs which otherwise would be recognized in the statement of income or comprehensive income based on an expectation that the cost will be recovered in future rates. This guidance also requires the recording of a regulatory liability for certain credits which would otherwise be recognized in the statement of income or comprehensive income based on an expectation that the amount will be returned to customers in future rates. Amounts recorded as regulatory assets and regulatory liabilities are generally recognized in the statements of income at the time they are reflected in customer rates. In the event OTP ceases to meet the criteria to apply the guidance for regulated operations, the regulatory assets and liabilities that no longer meet such criteria would be removed from the consolidated balance sheetsheets and included in the consolidated statement of income as an expense or income item, or in the consolidated statement of comprehensive income as a loss or gain item, in the period in which the application of this guidance ceases.
The accounting policies followed by OTP are subject to the Uniform System of Accounts of the FERC. These accounting policies differ in some respects from those used by our nonelectric businesses.
Cash Equivalents
We consider all highly liquid debt instrumentsinvestments purchased with maturity dates of 90 days or less to be cash equivalents.
Concentration of Deposits
We hold deposits with financial institutions which potentially subject us to a concentration risk. These deposits are guaranteed by the Federal Deposit Insurance Corporation up to an insurance limit of $250,000. Currently, our cash deposits exceed federally insured levels.
Revenue from Contracts with Customers
Due to our diverse business operations, the recognition of revenue from contracts with customers depends on the product produced and sold or service performed. We recognize revenue from contracts with customers at prices that are fixed or determinable as evidenced by an agreement with the customer, when we have met our performance obligation under the contract and it is probable that we will collect the amount to which we are entitled in exchange for the goods or services transferred or to be transferred to the customer. Depending on the product produced and sold or service performed and the terms of the agreement with the customer, we recognize revenue either over time, in the case of delivery or transmission of electricity or related services or the production and storage of certain custom-made products, or at a point in time for the delivery of standardized products and other products made to customer specifications where the terms of the contract require transfer of the completed product. Provisions for sales returns, early payment terms discounts, and volume-based variable pricing incentives are recorded as reductions to revenue at the time revenue is recognized based on customer history, historical information and current trends. We include revenues received for shipping and handling in operating revenues. Expenses paid for shipping and handling are recorded as part of cost of goodsproducts sold. Sales or other taxes collected from customers are excluded from operating revenues.
Electric Segment Revenues. Most Electric segment revenues are earned from the generation, transmission and sale of electricity to retail customers at rates approved by state regulatory commissions. OTP also earns revenue from the transmission of electricity for others over the transmission assets it owns separately, or jointly with other transmission service providers, under rate tariffs established by the independent transmission system operator and approved by the FERC. A third source of revenue for OTP comes from the generation and sale of electricity to wholesale customers at contract or market rates. Revenues from all these sources meet the criteria to be classified as revenue from contracts with customers and are recognized over time as energy is delivered or transmitted. Revenue is recognized based on the metered quantity of electricity
delivered or transmitted at the applicable rates. For electricity delivered and consumed after a meter is read but prior to the end of the reporting period, OTP records revenue and an unbilled receivable based on estimates of the kilowatt-hours (kwh)amount of energy delivered to the customer.
Manufacturing Segment Revenues. Our Manufacturing segment businesses earn revenue predominantly from the production and delivery of custom-made or standardized parts and products to customers across several industries and certain businesses also earn revenue from the production and sale of tools and dies to other manufacturers. For the production and delivery of standardized products and other products made to customer specifications where the terms of the contract require transfer of the completed product, we have met our performance obligation and recognize revenue at the point in time when the product is shipped. At this point we have no further obligation to provide services related to such products. The shipping terms used in these transactions are FOBfree on board (FOB) shipping point.
Plastics Segment Revenues. Our Plastics segment businesses earn revenue predominantly from the sale and delivery of standardized polyvinyl chloride (PVC)PVC pipe products produced at their manufacturing facilities. Revenue from the sale of these products is recognized at the point in time when the product is shipped based on prices agreed to in a purchase order. For revenue recognized on shipped products,as there is no further obligation to provide services related to such products. Theproducts and the shipping terms used in these instances are FOB shipping point. We have one customer within our Plastics segment for which we produce and store a product made to the customer’s specifications and design under a build and hold agreement. For sales to this customer, we recognize revenue as the custom-made product is produced, adjusting the amount of revenue for volume rebate variable pricing considerations we expect the customer will earn and applicable early payment discounts we expect the customer will take. Ownership of the pipe transfers to the customer prior to delivery and we are paid a negotiated fee for storage of the pipe. Revenue for storage of the pipe is also recognized over time as the pipe is stored.
Alternative Revenue
In addition to recognizing revenue from contracts with customers, our Electric segment business also records revenue under alternative revenue program (ARPs)(ARP) requirements. Certain rate rider mechanisms qualify as ARP revenues as they provide for adjustments to rates outside of a general rate case proceeding to encourage or incentivize investments in certain areas such as conservation, renewable energy, pollution reduction or control, improved infrastructure of the transmission grid or other programs that provide benefits to the general public under public policy, laws or regulations. ARP riders generally provide for the recovery of specified costs and investments and include an incentive component to provide the regulated utility with a return on amounts invested.
We accrue ARP revenue on the basis of cost incurred, investments made and returns on those investments that qualify for recovery through established riders. ARP revenue is disclosed separately from revenue from contracts with customers and we have elected to report ARP revenue on a net basis, whereby amounts initially recorded as ARP revenue in a period are presented net of the reversal of amounts previously recognized as ARP revenue that are reclassified and recorded as revenue from contracts with customers when such amounts are included in the price of electricity to customers.
Receivables and Allowance for Credit Losses
We grant credit to our customers in the normal course of business with repayment terms generally ranging from 30 to 90 days after the invoice date. Late fees are assessed on certain receivables once they are 30 days past due. Unbilled receivables represent estimates of energy delivered to customers but not yet billed.
Receivables are stated at the billed or estimated unbilled amount less an allowance for estimated credit losses. An allowance for credit losses is established based on losses expected to occur over the contractual life of the receivable. We estimate an allowance for credit losses on our trade and unbilled receivables by evaluating historical aging and write-off history, adjusted for current and forecasted economic conditions, for groups of receivables that share similar economic characteristics. Other receivables are evaluated by reviewing individual accounts, considering aging, financial condition of the debtor, recent payment history and other relevant factors. Account balances are written-off in the period they are deemed to be uncollectible.
Inventories
Inventories are valued at the lower of cost or net realizable value. CostCosts for fuel, material and supply inventories of our Electric segment are determined on an average cost basis. CostCosts for raw material, work in process and finished goods inventories of our Manufacturing and Plastics segments are determined on a first-in first-out (FIFO) basis.
Inventories consist of the following as of December 31, 20202023 and 2019:2022:
| | (in thousands) | (in thousands) | 2020 | | 2019 | (in thousands) | 2023 | | 2022 |
| | Finished Goods | Finished Goods | $ | 22,046 | | | $ | 31,863 | |
| Finished Goods | |
| Finished Goods | |
| Work in Process | Work in Process | 16,210 | | | 16,508 | |
| Raw Material, Fuel and Supplies | Raw Material, Fuel and Supplies | 53,909 | | | 49,480 | |
| Total Inventories | Total Inventories | $ | 92,165 | | | $ | 97,851 | |
Investments
Corporate-ownedWe invest in and hold, through rabbi trusts, corporate-owned life insurance policies to provide future funding for obligations under our supplemental pension plan and a nonqualified deferred compensation plan. The polices are recorded at cash surrender value. Debt, marketable equity securities,value and there are no restrictions on our ability to surrender the policies.
We hold debt, mutual fund, and money market fundsfund investments either as investments within our captive insurance entity or to provide future funding for obligations under nonqualified deferred compensation plans. These investments are recorded at fair value. Debt securities are deemed to be available-for-sale securities, accordingly unrealized gains and losses are generally excluded from earnings and recognized in accumulated other comprehensive income. We evaluate whether declines in fair value of debt securities below the cost basis are other-than-temporary. Declines in fair value deemed to be other-than-temporary result in the recognition of unrealized losses, or a portion thereof, in earnings. Unrealized gains and losses on marketable equity securitiesmutual and money market funds are recognized in earnings immediately.
The following is a summary of our investments at December 31, 20202023 and 2019:2022:
| | (in thousands) | (in thousands) | 2020 | | 2019 | (in thousands) | 2023 | | 2022 |
| | Corporate-Owned Life Insurance Policies | Corporate-Owned Life Insurance Policies | $ | 36,825 | | | $ | 33,117 | |
| Debt Securities | 9,260 | | | 8,184 | |
| Corporate-Owned Life Insurance Policies | |
| Corporate-Owned Life Insurance Policies | |
| Corporate and Government Debt Securities | |
| Mutual Funds | |
| Money Market Funds | Money Market Funds | 4,075 | | | 2,363 | |
| Marketable Equity Securities | 1,662 | | | 1,586 | |
| Other Investments | Other Investments | 34 | | | 124 | |
| Total Investments | Total Investments | $ | 51,856 | | | $ | 45,374 | |
The amount of unrealized gains and losses on debt securities as of December 31, 20202023 and 2019 are2022 is not material and no unrealized losses were deemed to be other-than-temporary. In addition, the amount of unrealized gains and losses on marketable equity securities still held as of December 31, 20202023 and 2019 are2022 is not material.
Property, Plant and Equipment Retirements and Depreciation
UtilityElectric plant is stated at original cost. The cost of additions includes contracted work, direct labor and materials, allocable overheads and allowance for funds used during construction.AFUDC. The amount of interest capitalized onto electric utility plant was $2.1$1.9 million in 2020, $1.72023, $0.9 million in 20192022 and $1.2$0.6 million in 2018.2021. The cost of depreciable units of property retired less salvage is charged to accumulated depreciation. Amounts recovered in rates for future removal costs are recorded as regulatory liabilities. Removal costs, when incurred, are charged against the regulatory liability. Maintenance, repairs and replacement of minor items of property are charged to operating expenses.expenses as incurred. The provisions for utility depreciation for financial reporting purposes are made on the straight-line method based on the estimated remaining service lives of the properties. Gains or losses on group asset dispositions are takenrecorded to the accumulated provision for depreciation reserve and impact current and future depreciation rates.
Property, plant and equipment of nonelectric operations are carried at historical cost and are depreciated on a straight-line basis over the assets’ estimated useful lives. The cost of additions includes contracted work, direct labor and materials, allocable overheads and capitalized interest. No interest was capitalized in 2020, 20192023, 2022 or 2018.2021. Maintenance and repairs are expensed as incurred. Gains or losses on asset dispositions are included in the determination of operating income.
The estimated service lives for rate-regulated electric assets and nonelectric assets are included below: | | | | Service Life Range | | Service Life Range |
| (years) | (years) | Low | | High | (years) | Low | | High |
| | Electric Assets: | |
| Electric Assets: | |
| Electric Assets: | Electric Assets: | | | | | | |
| Production Plant | Production Plant | 9 | | 82 | Production Plant | 21 | | 114 |
| Transmission Plant | Transmission Plant | 51 | | 75 | Transmission Plant | 51 | | 75 |
| Distribution Plant | Distribution Plant | 15 | | 70 | Distribution Plant | 10 | | 70 |
| General Plant | General Plant | 5 | | 55 | General Plant | 5 | | 56 |
| Nonelectric Assets: | Nonelectric Assets: | |
| Equipment | Equipment | 2 | | 12 |
| Equipment | |
| Equipment | | 2 | | 20 |
| Buildings and Leasehold Improvements | Buildings and Leasehold Improvements | 5 | | 40 | Buildings and Leasehold Improvements | 2 | | 40 |
|
Jointly Owned Facilities
OTP is a joint owner in 2two coal-fired steam-powered electric generation plants: Big Stone Plant near Big Stone City, South Dakota and Coyote Station near Beulah, North Dakota. OTP is also a joint owner, with other regional utilities, in 5five major transmission lines. OTP's interest in each jointly owned facility is reflected in the consolidated balance sheets on a pro-rata basis and OTP's share of direct revenue and expenses are included in operating revenues and expenses in the consolidated statements of income. Each participant in the jointly owned facilities financefinances their own investment.investments.
Goodwill and Other Intangible Assets
Goodwill is recognized and initially measured as any excess of the acquisition-date consideration transferred in a business combination over amounts recognized for the net identifiable assets acquired. Goodwill is not amortized, but is tested for impairment annually, or more frequently if
an event occurs or circumstances change that would more likely than not result in an impairment of goodwill. Impairment testing is performed at the reporting unit level, which is defined as an operating segment or one level below an operating segment. We perform our impairment testing in the fourth quarter of each year and have identified three reporting units that carry a goodwill balance.
Our impairment testing includes both an optional qualitative assessment and the quantitative impairment assessment. Our qualitative assessment includes an analysis of relevant events and circumstances to determine if it is more likely than not that the fair value of the reporting unitsunit exceeds its book value. If, after this assessment, we determine that it is not more likely than not that the fair value of a reporting unit is less than its carrying amount, no additional analysis is necessary. In contrast, if after the assessment we determine it is more likely than not that the fair value of a reporting unit is less than its carrying amount, or if we elect to skip the optional qualitative assessment, the quantitative impairment assessment is performed. The quantitative assessment is a single-step test that identifies both the existence of impairment and the amount of impairment loss by comparing the estimated fair value of a reporting unit to its carrying value, with any excess carrying value ofover the fair value being recognized as an impairment loss.
Intangible assets with finite lives, which primarily consist of customer relationships, are carried at costestimated fair value at the time of acquisition less accumulated amortization. The costcosts of the intangible assets are amortized over their estimated useful lives, which generally range from 15 to 20 years.
Cloud Computing Costs
We capitalize implementation costs incurred in cloud computing arrangements that are service contracts consistent with capitalized implementation costs incurred to develop or obtain internal-use software. Costs are amortized on a straight-line basis over the life of the associated contract. Capitalized implementation costs are amortized over periods up to ten years. Capitalized costs and related accumulated amortization are included in other noncurrent assets on the consolidated balance sheets. Below are the amounts of capitalized cost and related accumulated amortization as of December 31, 2023 and 2022: | | | | | | | | | | | |
| (in thousands) | 2023 | | 2022 |
| | | |
| Cloud Computing Costs | $ | 12,782 | | | $ | 9,024 | |
| Accumulated Amortization | $ | (1,505) | | | $ | (897) | |
| Cloud Computing Costs, net | $ | 11,277 | | | $ | 8,127 | |
Amortization expense of capitalized implementation costs for each of the years ended December 31, 2023, 2022 and 2021 totaled $1.3 million, $1.4 million, and $0.5 million.
Leases
We recognize right-of-use lease assets and a corresponding lease liability at the lease commencement date. The length of our lease agreements varyvaries from less than one year year to approximately ten years. We have elected to not record lease assets and liabilities for leases with a lease term at commencement of 12 months or less; such leases are expensed on a straight-line basis over the lease term. If a lease contains an option to extend the lease term and there is reasonable certainty the option will be exercised, the option is considered in the lease term at inception. We have elected to not separate non-lease components (e.g., common area maintenance) from lease components on real estate leases, accordingly the recognized lease asset and lease liability incorporate in their measurement payments for non-lease components. Certain leases include variable lease payments as the amounts are subject to change over the lease term. We are unable to determine the interest rate implicit in our leases thus we apply our incremental borrowing rate to capitalize the right-of-use asset and lease liability. We estimate our incremental borrowing rate by incorporating considerations of lease term and lessee entity.
We elected at the time of adopting the current leasing guidance on January 1, 2019 under an allowed practical expedient to continue with the historical accounting treatment for land easement arrangements in effect at the adoption date. Accordingly, we have not recognized any lease assets or liabilities for such arrangements.
Recoverability of Long-Lived Assets
We review our long-lived assets including, among other assets, property, plant and equipment, amortizing intangible assets and right-of-use lease assets, whenever events or changes in circumstances indicate the carrying amount of the assets may not be recoverable. We determine potential impairment by comparing the carrying amount of the assets with the net cash flows expected to be provided by operating activities of the business or related assets. If the sum of the expected future net cash flows is less than the carrying amount of the assets, an impairment loss would be recognized. Such an impairment loss would be measured as the amount by which the carrying amount exceeds the fair value of the asset, where fair value is based on the discounted cash flows expected to be generated by the asset.
Asset Retirement Obligations
Legal obligations related to the future retirement of long-lived assets are recognized as asset retirement obligations (ARO). An ARO is recognized in the period in which the legal obligation is incurred and the amount of the obligation can be reasonably estimated, with an offsetting increase to the associated long-lived asset. AROs are initially recognized at fair value and increased with the passage of time (accretion), with accretion expense recognized in the consolidated statements of income.. ARO estimates are revised periodically with any adjustment reflected in the ARO and associated long-lived asset.
Income Taxes
We use the asset and liability method to account for income taxes. Under this method, deferred tax assets and liabilities are recognized for the expected future tax consequences of all temporary differences between the carrying amounts of assets and liabilities and their respective tax bases. Deferred taxes are recorded using the tax rates scheduled by tax law to be in effect in the periods when the temporary differences reverse. Deferred tax assets are reduced by a valuation allowance when it is more likely than not that a portion or all of the deferred tax assets will not be realized. The realizability of deferred tax assets takesis determined by taking into consideration forecasts of future taxable income, the reversal of other existing temporary differences, available net operating loss carryforwards and available tax planning strategies. Changes in valuation allowances are included in the provision for income taxes in the period of the changes.
We recognize the tax effects of all tax positions that are more-likely-than-not to be sustained on audit based solely on the technical merits of those positions as of the balance sheet date. Changes in the recognition or measurement of such positions are recognized in the provision for income taxes in the period of the changes. We classify interest and penalties on tax uncertainties as components of the provision for income taxes.
We amortize investmenthave elected to account for transferable tax credits as a component of our income tax provision. We recognize the benefit of PTCs as a reduction of income tax expense in the period the credit is generated, which corresponds to the period the energy production occurs. We apply the deferral method of accounting for ITCs and state wind energy credits. Under this method, ITCs and state wind energy credits are amortized as a reduction to income tax expense over the estimated useful lives of the related property.underlying property that gave rise to the credit.
Deferred Compensation Plans
The Company sponsors two nonqualified deferred compensation plans for the benefit of executive officers and other select employees. Each plan allows participants to defer a specified amount or percentage of base wages or incentive compensation into the plan, subject to certain limitations. The Company, at its discretion, may make employer contributions to either plan during any annual period. Participant and employer deferred amounts are segregated into one or more accounts chosen by the participant. Participants earn a return on deferred amounts based on notional investments in the segregated accounts. Participants can elect lump sum distributions or annual installments of deferred balances during the participant's employment or upon retirement. As of December 31, 2023 and 2022, our liability to participants under these deferred compensation plans was $24.6 million and $20.6 million. Company contributions to these plans were $1.2 million, $0.9 million and $1.1 million for the years ended December 31, 2023, 2022 and 2021. Gains or (losses) recognized due to changes in our payment obligations in connection with these plans amounted to ($3.3 million), $3.1 million, and ($2.2 million) for the years ended December 31, 2023, 2022 and 2021.
Stock-Based Compensation
Stock-based compensation awards are measured at the grant dategrant-date fair value of the award and compensation expense is recognized on a straight-line basis over the applicable service or performance period. The service period may be limited to the period until such time that a recipient is retirement eligible as determined under the award agreement. Awards granted to employees eligible for retirement on the date of grant are expensed in the period of grant. We recognize the effects of award forfeitures as they occur.
Fair Value Measurements
Fair value is defined as the price that would be received for an asset or paid to transfer a liability (an exit price) in the principal or most advantageous market for the asset or liability in an orderly transaction between market participants. Three levels of inputs may be used to measure fair value:
Level 1 – Quoted prices are available in active markets for identical assets or liabilities as of the reported date. The types of assets and liabilities included in Level 1 are highly liquid and actively traded instruments with quoted prices, such as equities listed byon the New York Stock Exchange and commodity derivative contracts listed on the New York Mercantile Exchange.
Level 2 – Pricing inputs are other than quoted prices in active markets but are either directly or indirectly observable as of the reported date. The types of assets and liabilities included in Level 2 are typically either comparable to actively traded securities or contracts, such as treasury securities with pricing interpolated from recent trades of similar securities, or priced with models using highly observable inputs, such as commodity options priced using observable forward prices and volatilities.
Level 3 – Significant inputs to pricing have little or no observability as of the reporting date. The types of assets and liabilities included in Level 3 are those with inputs requiring significant management judgment or estimation and may include complex and subjective models and forecasts.
In instances where the determination of the fair value measurement is based on inputs from different levels within the hierarchy, the level in the hierarchy within which the entire fair value measurement falls is based on the lowest level input that is significant to the fair value measurement in its entirety.
Related Parties
The Otter Tail Corporation Foundation and Otter Tail Power Company Foundation are independent not-for-profit charitable entities affiliated with the Company and are not included in the consolidated financial statements of Otter Tail Corporation. Contribution obligations to the two foundations totaling $5.5 million and $4.3 million were recognized as of December 31, 2023 and 2022. Cash contributions paid to the two foundations during the years ended December 31, 2023, 2022 and 2021 were $4.3 million, $4.5 million, and $3.8 million.
Variable Interest Entity
In October 2012, the Coyote Station owners, including OTP, entered into a lignite sales agreement (LSA)an LSA with Coyote Creek Mining Company, L.L.C. (CCMC),LLC, a subsidiary of The North American Coal Corporation, for the purchase of lignite coal to meet the coal supply requirements of Coyote Station for the period beginning in May 2016 and ending in December 2040. The price per ton paid by the Coyote Station owners under the LSA reflects the cost of production, along with an agreed upon profit and capital charge. CCMC was formed for the purpose of mining coal to meet the coal fuel supply requirements of Coyote Station from May 2016 through December 2040 and, based on the terms of the LSA, is considered a variable interest entity (VIE) due to the transfer of all operating and economic risk to the Coyote Station owners, as the agreement is structured so that the price of the coal would cover all costs of operations as well as future reclamation costs. The Coyote Station owners are required to buy certain assets of CCMC at book value should they terminate the contract prior to the end of the contract term and are providing a guarantee of the value of the equity of CCMC because the Coyote Station owners are required to buy the membership interests of CCMC at the end of the contract term at equity value. Under current accounting standards, the primary beneficiary of a VIE is required to include the assets, liabilities, results of operations and cash flows of the VIE in its consolidated financial statements. No single owner of Coyote Station owns a majority interest in Coyote Station and none, individually, has the power to direct the activities that most significantly impact CCMC. Therefore, none of the owners individually, including OTP, is considered athe primary beneficiary of the VIE and the Company is not required to include CCMC in its consolidated financial statements.
If the LSA terminates prior to the expiration of its term or the production period terminates prior to December 31, 2040 and the Coyote Station owners purchase all of the outstanding membership interests of CCMC, the owners will satisfy (oror, if permitted by CCMC’s applicable lenders, assume)assume all of CCMC’s obligations owed to CCMC’s lenders under its loans and leases. The Coyote Station owners have limited rights to assign their rights and obligations under the LSA without the consent of CCMC’s lenders during any period in which CCMC’s obligations to its lenders remain outstanding. In the event the contract is terminated prior to the end of the term due to certain events, OTP’s maximum loss exposure, to additional costs, as a result of its involvement with CCMC, and potential impairment loss if recovery of those costs is denied by regulatory authorities, could be as high as $50.0$40 million, or OTP’s 35% share of CCMC’s unrecovered costs as of December 31, 2020.2023, if recovery of such a loss is denied by regulatory authorities.
NewRecent Accounting Standards AdoptedPronouncements
Credit Losses.Segment Reporting. In June 2016November 2023, the Financial Accounting Standards Board (FASB) issued newamended authoritative guidance codified in Accounting Standards Codification (ASC) 326, Financial Instruments-Credit Losses, changing how entities account280, Segment Reporting. The amended guidance expands annual and interim disclosure requirements for credit losses on receivables and certain other assetsreportable segments, primarily through expanded disclosures about significant segment expenses. The updated standard is effective for interim andour annual periods beginning on or after December 31, 2019. The guidance requiresin 2024 and interim periods beginning in the usefirst quarter of a current expected credit loss model, which may result in earlier recognition of credit losses than under previous accounting standards. We adopted this guidance on January 1, 2020.fiscal 2025. Adoption of the amended guidance must be applied retrospectively to all prior periods presented in the financial statements. We are currently evaluating the impact that the updated standard did notwill have a material impact on our consolidated financial statements and we did not record a cumulative effect adjustment to retained earnings on adoption as allowed for under the guidance.statement disclosures.
Cloud Computing Costs.Income Taxes. In August 2018December 2023, the FASB issued newamended authoritative guidance codified in ASC 350-40,Internal-Use Software, to address a customer's accounting for implementation costs incurred740, Income Taxes. The amended guidance requires additional disaggregated information in a cloud computing arrangement thateffective tax rate reconciliation disclosures and additional disaggregated information about income taxes paid. The updated standard is a service contract. The amendment aligns the requirements for capitalizing implementation costs incurred in a hosting arrangement that is a service contract with the requirements for capitalizing implementation costs incurred to develop or obtain internal-use software. The amendment also provides guidance for the presentation implementation costs in a cloud computing arrangement in the statement of financial position, the statement of income, and the statement of cash flows. The amendment was effective for interim andour annual periods beginning in 2025. The amended guidance is to be applied on or after December 15, 2019,a prospective basis with early adoption permitted in any interim period.the option to apply the standard retrospectively. We adoptedare currently evaluating the amendmentimpact that the updated standard will have on January 1, 2020. There was no impact to our consolidated financial statements on adoption, but we began capitalizing implementation costs incurred in cloud computing arrangements post-adoption.statement disclosures.
2. Segment Information
We classify our business into 3three segments, Electric, Manufacturing and Plastics, consistent with our business strategy, organizational structure and our internal reporting and review processes used by our chief operating decision maker to make decisions regarding allocation of resources, to assess operating performance and to make strategic decisions.
Electric includes the production, transmission, distribution and sale of electric energy in Minnesota, North Dakota and South Dakota by OTP. In addition, OTP is a participant in the Midcontinent Independent System Operator, Inc. (MISO)MISO markets. OTP’s operations have been our primary business since 1907.
Manufacturing consists of businesses in the following manufacturing activities: contract machining, metal parts stamping, fabrication and painting, and production of plastic thermoformed horticultural containers, life science and industrial packaging, and material handling components. These businesses have manufacturing facilities in Georgia, Illinois and Minnesota and sell products primarily in the United States.
Plastics consists of businesses producing PVC pipe at plants in North Dakota and Arizona. The PVC pipe is sold primarily in the western half of the United States and Canada.
Certain assets, income and costsexpenses are not allocated to our operating segments. Corporate operating costsresults include items such as corporate staff and overhead costs, the results of our captive insurance company, gains or losses on our investments and otherreturns on our cash equivalent investments. These items and others are excluded from the measurement of operating segment performance.
Corporate assets consist primarily of cash, investments, prepaid expenses, investments and fixed assets. Corporate is not an operating segment, rather it is added to operating segment totals to reconcile to consolidated amounts.
Information for each segment and our unallocated corporate costs for the years ended December 31, 2020, 20192023, 2022 and 20182021 are as follows:
| | | | | | | | | | | | | | | | | |
| (in thousands) | 2020 | | 2019 | | 2018 |
| | | | | |
Operating Revenue1 | | | | | |
| Electric | $ | 446,088 | | | $ | 459,048 | | | $ | 450,198 | |
| Manufacturing | 238,770 | | | 277,204 | | | 268,409 | |
| Plastics | 205,249 | | | 183,251 | | | 197,840 | |
| Total | $ | 890,107 | | | $ | 919,503 | | | $ | 916,447 | |
| Depreciation and Amortization | | | | | |
| Electric | $ | 63,171 | | | $ | 60,044 | | | $ | 55,935 | |
| Manufacturing | 14,933 | | | 14,261 | | | 14,794 | |
| Plastics | 3,604 | | | 3,451 | | | 3,719 | |
| Corporate | 329 | | | 330 | | | 218 | |
| Total | $ | 82,037 | | | $ | 78,086 | | | $ | 74,666 | |
| Operating Income (Loss) | | | | | |
| Electric | $ | 107,083 | | | $ | 98,417 | | | $ | 88,031 | |
| Manufacturing | 16,103 | | | 17,869 | | | 18,266 | |
| Plastics | 37,823 | | | 28,439 | | | 32,917 | |
| Corporate | (13,123) | | | (9,845) | | | (9,825) | |
| Total | $ | 147,886 | | | $ | 134,880 | | | $ | 129,389 | |
| Interest Charges | | | | | |
| Electric | $ | 29,848 | | | $ | 26,548 | | | $ | 26,365 | |
| Manufacturing | 2,215 | | | 2,345 | | | 2,230 | |
| Plastics | 644 | | | 718 | | | 609 | |
| Corporate | 1,740 | | | 1,800 | | | 1,204 | |
| Total | $ | 34,447 | | | $ | 31,411 | | | $ | 30,408 | |
| Income Tax Expense (Benefit) | | | | | |
| Electric | $ | 12,480 | | | $ | 12,867 | | | $ | 5,685 | |
| Manufacturing | 2,939 | | | 2,784 | | | 3,393 | |
| Plastics | 9,718 | | | 7,309 | | | 8,728 | |
| Corporate | (4,931) | | | (5,519) | | | (3,218) | |
| Total | $ | 20,206 | | | $ | 17,441 | | | $ | 14,588 | |
| Net Income (Loss) | | | | | |
| Electric | $ | 66,778 | | | $ | 59,046 | | | $ | 54,431 | |
| Manufacturing | 11,048 | | | 12,899 | | | 12,839 | |
| Plastics | 27,582 | | | 20,572 | | | 23,819 | |
| Corporate | (9,557) | | | (5,670) | | | (8,744) | |
| Total | $ | 95,851 | | | $ | 86,847 | | | $ | 82,345 | |
| Capital Expenditures | | | | | |
| Electric | $ | 356,581 | | | $ | 187,362 | | | $ | 87,287 | |
| Manufacturing | 10,587 | | | 14,268 | | | 13,316 | |
| Plastics | 4,322 | | | 5,452 | | | 4,199 | |
| Corporate | 63 | | | 283 | | | 623 | |
| Total | $ | 371,553 | | | $ | 207,365 | | | $ | 105,425 | |
| | | | | |
1Amounts reflect operating revenues to external customers. Intersegment operating revenues are not material for any period presented. | | | | |
| | | | | | | | | | | | | | | | | |
| (in thousands) | 2023 | | 2022 | | 2021 |
| | | | | |
| Operating Revenue | | | | | |
| Electric | $ | 528,359 | | | $ | 549,699 | | | $ | 480,321 | |
| Manufacturing | 402,781 | | | 397,983 | | | 336,294 | |
| Plastics | 418,026 | | | 512,527 | | | 380,229 | |
| Total | 1,349,166 | | | 1,460,209 | | | 1,196,844 | |
| Depreciation and Amortization | | | | | |
| Electric | 75,330 | | | 72,050 | | | 71,343 | |
| Manufacturing | 18,495 | | | 16,202 | | | 15,436 | |
| Plastics | 4,027 | | | 4,205 | | | 4,354 | |
| Corporate | 102 | | | 140 | | | 225 | |
| Total | 97,954 | | | 92,597 | | | 91,358 | |
| Operating Income (Loss) | | | | | |
| Electric | 106,521 | | | 113,138 | | | 106,964 | |
| Manufacturing | 29,140 | | | 29,065 | | | 24,114 | |
| Plastics | 254,402 | | | 264,578 | | | 132,760 | |
| Corporate | (12,144) | | | (16,342) | | | (14,130) | |
| Total | 377,919 | | | 390,439 | | | 249,708 | |
| Interest Expense | | | | | |
| Electric | 33,864 | | | 31,950 | | | 33,043 | |
| Manufacturing | 2,295 | | | 2,796 | | | 2,239 | |
| Plastics | 602 | | | 585 | | | 587 | |
| Corporate | 916 | | | 685 | | | 1,902 | |
| Total | 37,677 | | | 36,016 | | | 37,771 | |
| Income Tax Expense (Benefit) | | | | | |
| Electric | 1,648 | | | 5,065 | | | 1,663 | |
| Manufacturing | 5,390 | | | 5,321 | | | 4,704 | |
| Plastics | 66,066 | | | 68,688 | | | 34,374 | |
| Corporate | (3,806) | | | (5,723) | | | (4,689) | |
| Total | 69,298 | | | 73,351 | | | 36,052 | |
| Net Income (Loss) | | | | | |
| Electric | 84,424 | | | 79,974 | | | 72,458 | |
| Manufacturing | 21,454 | | | 20,950 | | | 17,186 | |
| Plastics | 187,748 | | | 195,374 | | | 97,823 | |
| Corporate | 565 | | | (12,114) | | | (10,698) | |
| Total | 294,191 | | | 284,184 | | | 176,769 | |
| Capital Expenditures | | | | | |
| Electric | 240,695 | | | 147,869 | | | 140,031 | |
| Manufacturing | 23,284 | | | 17,954 | | | 20,690 | |
| Plastics | 23,029 | | | 5,245 | | | 11,040 | |
| Corporate | 126 | | | 66 | | | 68 | |
| Total | $ | 287,134 | | | $ | 171,134 | | | $ | 171,829 | |
The following provides the identifiable assets by segment and corporate assets as of December 31, 20202023 and 2019:2022:
| | (in thousands) | (in thousands) | 2020 | | 2019 | (in thousands) | 2023 | | 2022 |
| | Identifiable Assets | Identifiable Assets | |
| Identifiable Assets | |
| Identifiable Assets | |
| Electric | |
| Electric | |
| Electric | Electric | $ | 2,233,399 | | | $ | 1,931,525 | |
| Manufacturing | Manufacturing | 191,005 | | | 195,742 | |
| Plastics | Plastics | 99,767 | | | 92,049 | |
| Corporate | Corporate | 54,183 | | | 54,279 | |
| Total | Total | $ | 2,578,354 | | | $ | 2,273,595 | |
Concentrations
Our Plastics segment businesses use PVC resin as a critical component within their PVC pipe manufacturing process. There are a limited number of PVC resin suppliers in the U.S., and in 2023, we sourced all of our PVC resin needs from three vendors. Although there are a limited number of PVC resin suppliers, we believe that other suppliers could provide PVC resin on comparable terms. Additionally, most U.S. resin production plants are located in the Gulf Coast region. These plants are subject to the risk of damage and production shutdowns because of exposure to hurricanes or other extreme weather events that occur in this region. The loss of a key vendor, or any interruption or delay in the supply of PVC resin could cause production delays, a possible loss of sales, or result in increased costs to secure resin, all of which would adversely affect our operating results.
Entity-Wide Information
No single customer accounted for over 10% of our consolidated operating revenues for the years ended December 31, 2020, 20192023, 2022 and 2018.2021. All of our long-lived assets are located within the United States and substantially all of our operating revenues are tofrom customers located within the United States.
3. Revenue
We present our operating revenues tofrom external customers, in total and by amounts arising from contracts with customers and ARP arrangements, disaggregated by revenue source and segment for the years ended December 31, 2020, 20192023, 2022 and 2018:2021:
| | (in thousands) | (in thousands) | 2020 | | 2019 | | 2018 | (in thousands) | 2023 | | 2022 | | 2021 |
| | Operating Revenues | Operating Revenues | |
| Operating Revenues | |
| Operating Revenues | |
| Electric Segment | Electric Segment | |
| Electric Segment | |
| Electric Segment | |
| Retail: Residential | |
| Retail: Residential | |
| Retail: Residential | Retail: Residential | $ | 127,260 | | | $ | 131,988 | | | $ | 125,045 | |
| Retail: Commercial and Industrial | Retail: Commercial and Industrial | 254,951 | | | 267,125 | | | 256,331 | |
| Retail: Other | Retail: Other | 7,311 | | | 7,365 | | | 6,875 | |
| Total Retail | Total Retail | 389,522 | | | 406,478 | | | 388,251 | |
| Transmission | Transmission | 44,001 | | | 40,542 | | | 46,947 | |
| Wholesale | Wholesale | 4,857 | | | 5,007 | | | 7,735 | |
| Other | Other | 7,708 | | | 7,021 | | | 7,265 | |
| Total Electric Segment | Total Electric Segment | 446,088 | | | 459,048 | | | 450,198 | |
| Manufacturing Segment | Manufacturing Segment | |
| Metal Parts and Tooling | Metal Parts and Tooling | 199,463 | | | 236,032 | | | 223,765 | |
| Metal Parts and Tooling | |
| Metal Parts and Tooling | |
| Plastic Products and Tooling | Plastic Products and Tooling | 34,055 | | | 35,173 | | | 35,836 | |
| Other | 5,252 | | | 5,999 | | | 8,808 | |
| Scrap Metal | |
| Total Manufacturing Segment | Total Manufacturing Segment | 238,770 | | | 277,204 | | | 268,409 | |
| Plastics Segment | Plastics Segment | |
| PVC Pipe | PVC Pipe | 205,249 | | | 183,251 | | | 197,840 | |
| PVC Pipe | |
| PVC Pipe | |
| Total Operating Revenue | Total Operating Revenue | 890,107 | | | 919,503 | | | 916,447 | |
| Less: Noncontract Revenues Included Above | Less: Noncontract Revenues Included Above | | — | | | — | |
| Electric Segment - Alternative Revenue Program Revenues | 6,936 | | | 1,032 | | | (439) | |
| Electric Segment - ARP Revenues | |
| Electric Segment - ARP Revenues | |
| Electric Segment - ARP Revenues | |
| Total Operating Revenues from Contracts with Customers | Total Operating Revenues from Contracts with Customers | $ | 883,171 | | | $ | 918,471 | | | $ | 916,886 | |
4. Receivables
Receivables as of December 31, 20202023 and 20192022 are as follows:
| | (in thousands) | (in thousands) | 2020 | | 2019 | (in thousands) | 2023 | | 2022 |
| | Receivables | Receivables | |
| Receivables | |
| Receivables | |
| Trade | |
| Trade | |
| Trade | Trade | $ | 87,048 | | | $ | 79,286 | |
| Other | Other | 8,939 | | | 8,773 | |
| Unbilled Receivables | Unbilled Receivables | 21,187 | | | 20,911 | |
| Total Receivables | Total Receivables | 117,174 | | | 108,970 | |
| Less Allowance for Credit Losses | Less Allowance for Credit Losses | 3,215 | | | 1,339 | |
| Receivables, net of allowance for credit losses | Receivables, net of allowance for credit losses | $ | 113,959 | | | $ | 107,631 | |
The following is a summary of activity in the allowance for credit losses for the years ended December 31, 20202023 and 2019:2022:
| | (in thousands) | (in thousands) | 2020 | | 2019 | (in thousands) | 2023 | | 2022 |
| | Beginning Balance | Beginning Balance | $ | 1,339 | | | $ | 1,407 | |
| Beginning Balance | |
| Beginning Balance | |
| Additions Charged to Expense | Additions Charged to Expense | 3,138 | | | 986 | |
| Reductions for Amounts Written-Off, Net of Recoveries | (1,262) | | | (1,054) | |
| Reductions for Amounts Written Off, Net of Recoveries | |
| Ending Balance | Ending Balance | $ | 3,215 | | | $ | 1,339 | |
5. Regulatory Matters
Regulatory Assets and Liabilities
The following presents our current and long-term regulatory assets and liabilities as of December 31, 20202023 and 20192022 and the period we expect to recover or refund such amounts:
| | Period of | | 2020 | | 2019 |
| Period of | | | Period of | | 2023 | | 2022 |
| (in thousands) | (in thousands) | Recovery/Refund | | Current | | Long-Term | | Current | | Long Term | (in thousands) | Recovery/Refund | | Current | | Long-Term | | Current | | Long-Term |
| | Regulatory Assets | Regulatory Assets | |
| Regulatory Assets | |
| Regulatory Assets | |
Pension and Other Postretirement Benefit Plans1 | |
Pension and Other Postretirement Benefit Plans1 | |
Pension and Other Postretirement Benefit Plans1 | Pension and Other Postretirement Benefit Plans1 | See below | | $ | 11,037 | | | $ | 146,071 | | | $ | 9,090 | | | $ | 130,783 | |
Alternative Revenue Program Riders2 | Alternative Revenue Program Riders2 | Up to 3 years | | 8,871 | | | 9,373 | | | 8,464 | | | 2,844 | |
Asset Retirement Obligations1 | Asset Retirement Obligations1 | Asset lives | | 0 | | | 8,462 | | | 0 | | | 7,772 | |
| ISO Cost Recovery Trackers1 | Up to 2 years | | 1,079 | | | 867 | | | 2,033 | | | 1,170 | |
Unrecovered Project Costs1 | Up to 3 years | | 361 | | | 2,989 | | | 859 | | | 478 | |
Deferred Rate Case Expenses1 | Various | | 360 | | | 230 | | | 260 | | | 489 | |
Debt Reacquisition Premiums1 | Up to 30 years | | 192 | | | 341 | | | 201 | | | 548 | |
| Deferred Income Taxes | |
Fuel Clause Adjustments1 | |
Derivative Instruments1 | |
Other1 | Other1 | Various | | 0 | | | 62 | | | 743 | | | 54 | |
| Total Regulatory Assets | Total Regulatory Assets | | $ | 21,900 | | | $ | 168,395 | | | $ | 21,650 | | | $ | 144,138 | |
| Regulatory Liabilities | Regulatory Liabilities | |
| Deferred Income Taxes | Deferred Income Taxes | Asset lives | | $ | 0 | | | $ | 134,719 | | | $ | 0 | | | $ | 141,707 | |
| Deferred Income Taxes | |
| Deferred Income Taxes | |
| Plant Removal Obligations | Plant Removal Obligations | Asset lives | | 0 | | | 98,707 | | | 0 | | | 97,726 | |
| Fuel Clause Adjustment | Up to 1 year | | 10,947 | | | 0 | | | 3,982 | | | 0 | |
| Fuel Clause Adjustments | |
| Alternative Revenue Program Riders | Alternative Revenue Program Riders | Up to 1 year | | 3,581 | | | 470 | | | 2,857 | | | 0 | |
| North Dakota PTC Refunds | |
| Pension and Other Postretirement Benefit Plans | Pension and Other Postretirement Benefit Plans | Up to 1 year | | 1,959 | | | 0 | | | 471 | | | 0 | |
| Deferred Rate Case Expenses | Various | | 0 | | | 0 | | | 0 | | | 401 | |
| ISO Cost Recovery Trackers | Up to 2 years | | 0 | | | 10 | | | 0 | | | 0 | |
| | Other | |
| | Other | |
| | Other | Other | Various | | 176 | | | 67 | | | 170 | | | 72 | |
| Total Regulatory Liabilities | Total Regulatory Liabilities | | $ | 16,663 | | | $ | 233,973 | | | $ | 7,480 | | | $ | 239,906 | |
| 1Costs subject to recovery without a rate of return. | 1Costs subject to recovery without a rate of return. | | |
1Costs subject to recovery without a rate of return. | |
1Costs subject to recovery without a rate of return. | |
2Amount eligible for recovery includes an incentive or rate of return. | 2Amount eligible for recovery includes an incentive or rate of return. | |
2Amount eligible for recovery includes an incentive or rate of return. | |
2Amount eligible for recovery includes an incentive or rate of return. | |
Pension and Other Postretirement Benefit Plans represent benefit costs and actuarial losses and gains subject to recovery or refund through rates as they are expensed or amortized. These unrecognized benefit costs and actuarial losses and gains are eligible for treatment as regulatory assets or liabilities based on their probable inclusion in future electric rates.
Alternative Revenue Program Riders regulatory assets and liabilities are revenuerevenues not yet collected from customers or amounts subject to refund, respectively, primarily due to investments in qualifying transmission, conservation, renewable resource, environmental and other generation assets.assets, and the impact of decoupling.
Asset Retirement Obligations represent the difference in timing of recognition of expense arising from these obligations and the amount recovered from customers.
ISO Cost Recovery Trackers Fuel Clause Adjustmentsrepresents represent the under- or over-collection of fuel costs incurredrelative to serve Minnesota customersthe estimated cost of fuel included in customer rates, which will be collected from or the under collection of revenue based on expected versus actual construction costs on eligible projects.returned to customers.
Unrecovered Project CostsDerivative Instruments reflect costs incurred for abandoned generationrepresent unrealized gains and transmission assets and accelerated depreciation expenselosses recognized on a to-be-retired generation asset expectedderivative instruments. On final settlement of such instruments, any realized gains or losses are paid to beor recovered from customers.
Deferred Rate Case ExpensesIncome Taxes relaterepresent the revaluation of accumulated deferred income taxes arising from the change in the federal income tax rate in 2017. This amount is being refunded to costs incurred in conjunction with recent rate cases that are currently or are expected to be recovered from customers.
Debt Reacquisition Premiums represent costs to retire debt which are being recovered from customers over the remaining originalestimated lives of the reacquired debt.
Deferred Income Taxes representsproperty assets from which the deferred income tax benefits, arising primarily from property-related timing differences, that will be refunded to customers as these timing differences reverse.taxes originated.
Plant Removal Obligations represent amounts collected from customers to be used to cover actual removal costs as incurred.
Fuel Clause AdjustmentsNorth Dakota PTC Refunds represent PTCs earned from the over-collectionMerricourt Wind Energy Center. These amounts are being allocated to customers over the life of fuel costs to be returned to customers.the asset.
Regulatory Matters
Minnesota TCR.Other On October 22, 2020, the MPUC approved OTP's request for a Minnesota TCR rider update. This rider update request followed a Minnesota Supreme Court opinion issued on April 22, 2020, concluding the MPUC lacked the authority to amend an existing TCR rider approved under Minnesota state law toregulatory assets and liabilities include the costs and revenues associated with certain OTP transmission assets. Accordingly, the rider update excluded the costs and revenues associated with these assets, which had the effect of allowing OTPother amounts that we expect to recover from, or return to, customers in future periods, such as
the appropriatecost of abandoned projects, costs incurred in connection with recent rate cases, and other items.
North Dakota Rate Case
On November 2, 2023, OTP filed a request with the NDPSC for an increase in revenue recoverable under general rates in North Dakota. In its filing, OTP requested a net increase in annual revenue of $17.4 million, or 8.4%, based on an allowed rate of return on these assets from Minnesota customers dating backrate base of 7.85% and an allowed rate of return on equity of 10.6% on an equity ratio of 53.5% of total capital. Through this proceeding, OTP has proposed changes to the last TCR rider updatemechanism of cost and investment recovery, with recovery moving from riders into base rates. The filing also includes a proposal to implement a sales adjustment mechanism to address potential significant load additions or losses. The filing included an interim rate request of a net increase in September 2016. As a result, OTP recognized additional riderannual revenue of $2.6$12.4 million, duringor 6.0%, which was approved by the year endedNDPSC on December 31, 2020.
Depreciable Lives. On July 30, 202013, 2023, and interim rates went into effect on January 1, 2024. These interim rate revenues, when collected, are subject to potential refund until the MPUC ordered a reduction in the remaining depreciable lives of Hoot Lake Plant and seven hydroelectric plants. The MPUC stipulated recoverabilityfinalization of the resulting increase in depreciation expense would be determined in OTP's next rate case. Based on the relevant facts and circumstances, we concluded the additional depreciation expense is probable of recovery and we have recognized a regulatory asset for the amount of incremental expense in 2020, which amounted to $2.8 million.
6. Property, Plant and Equipment
Major classes of property, plant and equipment as of December 31, 20202023 and 20192022 include:
| | (in thousands) | (in thousands) | 2020 | | 2019 | (in thousands) | 2023 | | 2022 |
| | Electric Plant in Service | |
| Electric Plant in Service | |
| Electric Plant in Service | Electric Plant in Service | | | | | | |
| Production | Production | $ | 1,172,362 | | | $ | 915,996 | |
| Transmission | Transmission | 690,647 | | | 647,474 | |
| Distribution | Distribution | 545,221 | | | 526,146 | |
| General | General | 123,122 | | | 123,268 | |
| Electric Plant in Service | Electric Plant in Service | 2,531,352 | | | 2,212,884 | |
| Construction Work in Progress | Construction Work in Progress | 203,078 | | | 177,584 | |
| Total Gross Electric Plant | Total Gross Electric Plant | 2,734,430 | | | 2,390,468 | |
| Less Accumulated Depreciation and Amortization | Less Accumulated Depreciation and Amortization | 778,988 | | | 731,110 | |
| Net Electric Plant | Net Electric Plant | $ | 1,955,442 | | | $ | 1,659,358 | |
| Nonelectric Property, Plant and Equipment | Nonelectric Property, Plant and Equipment | |
| Equipment | Equipment | $ | 197,389 | | | $ | 187,904 | |
| Equipment | |
| Equipment | |
| Buildings and Leasehold Improvements | Buildings and Leasehold Improvements | 55,441 | | | 53,412 | |
| Land | Land | 5,900 | | | 6,040 | |
| Nonelectric Property, Plant and Equipment | Nonelectric Property, Plant and Equipment | 258,730 | | | 247,356 | |
| Construction Work in Progress | Construction Work in Progress | 9,290 | | | 7,654 | |
| Total Gross Nonelectric Property, Plant and Equipment | Total Gross Nonelectric Property, Plant and Equipment | 268,020 | | | 255,010 | |
| Less Accumulated Depreciation and Amortization | Less Accumulated Depreciation and Amortization | 174,189 | | | 160,574 | |
| Net Nonelectric Property, Plant and Equipment | Net Nonelectric Property, Plant and Equipment | 93,831 | | | 94,436 | |
| Net Property, Plant and Equipment | Net Property, Plant and Equipment | $ | 2,049,273 | | | $ | 1,753,794 | |
Depreciation expense for the years ended December 31, 2020, 20192023, 2022 and 20182021 totaled $78.6$90.8 million, $71.9$84.4 million and $69.7$85.8 million.
The following table provides OTP’s ownership percentages and amounts included in the December 31, 20202023 and 20192022 consolidated balance sheets for OTP’s share of each of these jointly owned facilities: | | (dollars in thousands) | (dollars in thousands) | Ownership
Percentage | | Electric Plant
in Service | | Construction
Work in
Progress | | Accumulated
Depreciation | | Net Plant | (dollars in thousands) | Ownership
Percentage | | Electric Plant
in Service | | Construction
Work in
Progress | | Accumulated
Depreciation | | Net Plant |
| | December 31, 2020 | | | | | | | | | |
| December 31, 2023 | |
| December 31, 2023 | |
| December 31, 2023 | | | | |
| Big Stone Plant | Big Stone Plant | 53.9 | % | | $ | 332,611 | | | $ | 2,552 | | | $ | (103,504) | | | $ | 231,659 | |
| Coyote Station | Coyote Station | 35.0 | % | | 180,991 | | | 732 | | | (108,603) | | | 73,120 | |
| Big Stone South–Ellendale 345 kV line | Big Stone South–Ellendale 345 kV line | 50.0 | % | | 106,353 | | | 0 | | | (2,433) | | | 103,920 | |
| Fargo–Monticello 345 kV line | Fargo–Monticello 345 kV line | 14.2 | % | | 78,184 | | | 0 | | | (8,029) | | | 70,155 | |
| Big Stone South–Brookings 345 kV line | Big Stone South–Brookings 345 kV line | 50.0 | % | | 53,036 | | | 0 | | | (2,822) | | | 50,214 | |
| Brookings–Southeast Twin Cities 345 kV line | Brookings–Southeast Twin Cities 345 kV line | 4.8 | % | | 26,291 | | | 0 | | | (2,468) | | | 23,823 | |
| Bemidji–Grand Rapids 230 kV line | Bemidji–Grand Rapids 230 kV line | 14.8 | % | | 16,331 | | | 0 | | | (2,670) | | | 13,661 | |
| December 31, 2019 | |
| Jamestown– Ellendale 345 kV line | |
| Big Stone South–Alexandria 345 kV line | |
| Alexandria–Big Oaks 345 kV line | |
| December 31, 2022 | |
| Big Stone Plant | |
| Big Stone Plant | |
| Big Stone Plant | Big Stone Plant | 53.9 | % | | $ | 337,197 | | | $ | 384 | | | $ | (98,654) | | | $ | 238,927 | |
| Coyote Station | Coyote Station | 35.0 | % | | 184,493 | | | 83 | | | (108,248) | | | 76,328 | |
Big Stone South–Ellendale 345 kV line1 | 50.0 | % | | 106,343 | | | 0 | | | (819) | | | 105,524 | |
| Big Stone South–Ellendale 345 kV line | |
| Fargo–Monticello 345 kV line | Fargo–Monticello 345 kV line | 14.2 | % | | 78,184 | | | 0 | | | (7,011) | | | 71,173 | |
| Big Stone South–Brookings 345 kV line | Big Stone South–Brookings 345 kV line | 50.0 | % | | 53,036 | | | 0 | | | (2,016) | | | 51,020 | |
| Brookings–Southeast Twin Cities 345 kV line | Brookings–Southeast Twin Cities 345 kV line | 4.8 | % | | 26,286 | | | 0 | | | (2,086) | | | 24,200 | |
| Bemidji–Grand Rapids 230 kV line | Bemidji–Grand Rapids 230 kV line | 14.8 | % | | 16,331 | | | 0 | | | (233) | | | 16,098 | |
|
7. Intangible Assets
The following tablestable summarizes our goodwill by segment as of December 31, 20202023 and 2019:2022:
| | (in thousands) | (in thousands) | 2020 | | 2019 | (in thousands) | 2023 | | 2022 |
| | Manufacturing | Manufacturing | $ | 18,270 | | | $ | 18,270 | |
| Manufacturing | |
| Manufacturing | |
| Plastics | Plastics | 19,302 | | | 19,302 | |
| Total Goodwill | Total Goodwill | $ | 37,572 | | | $ | 37,572 | |
Our annual goodwill impairment testing, performed in the fourth quarters of 20202023 and 2019,2022, indicated no impairment existed as of the test date.
The following table summarizes the components of our intangible assets at December 31, 20202023 and 2019:2022:
| | (in thousands) | (in thousands) | Gross
Amount | | Accumulated
Amortization | | Net Carrying
Amount | (in thousands) | Gross
Amount | | Accumulated
Amortization | | Net Carrying
Amount |
| | December 31, 2020 | |
| December 31, 2023 | |
| December 31, 2023 | |
| December 31, 2023 | |
| Customer Relationships | |
| Customer Relationships | |
| Customer Relationships | Customer Relationships | $ | 22,491 | | | $ | 12,370 | | | $ | 10,121 | |
| Other | Other | 26 | | | 3 | | | 23 | |
| Total | Total | $ | 22,517 | | | $ | 12,373 | | | $ | 10,144 | |
| December 31, 2019 | |
| December 31, 2022 | |
| Customer Relationships | |
| Customer Relationships | |
| Customer Relationships | Customer Relationships | $ | 22,491 | | | $ | 11,259 | | | $ | 11,232 | |
| Other | Other | 179 | | | 121 | | | 58 | |
| Total | Total | $ | 22,670 | | | $ | 11,380 | | | $ | 11,290 | |
|
Amortization expense for these intangible assets was as follows for each of the years ended December 31, 2020, 20192023, 2022 and 2018: 2021 totaled $1.1 million.
| | | | | | | | | | | | | | | | | |
| (in thousands) | 2020 | | 2019 | | 2018 |
| | | | | |
| Amortization Expense | $ | 1,146 | | | $ | 1,186 | | | $ | 1,315 | |
| | | | | |
Estimated annualAnnual amortization expense for these intangible assets for the next five years is:
| | (in thousands) | (in thousands) | 2021 | | 2022 | | 2023 | | 2024 | | 2025 | (in thousands) | 2024 | | 2025 | | 2026 | | 2027 | | 2028 |
| | Estimated Amortization Expense | $ | 1,100 | | | $ | 1,100 | | | $ | 1,100 | | | $ | 1,100 | | | $ | 1,092 | |
| Amortization Expense | |
| Amortization Expense | |
| Amortization Expense | |
|
8. Leases
We lease coal rail cars, warehouse and office space, land, and certain office, manufacturing, and material handling, and other equipment under varying terms and conditions. All leases are classified as operating leases.
The components of lease cost and lease cash flows for the years ended December 31, 20202023, 2022, and 20192021 are as follows:
| | (in thousands) | (in thousands) | 2020 | | 2019 | (in thousands) | 2023 | | 2022 | | 2021 |
| | Lease Cost | Lease Cost | |
| Lease Cost | |
| Lease Cost | |
| Operating Lease Cost | |
| Operating Lease Cost | |
| Operating Lease Cost | Operating Lease Cost | $ | 5,837 | | | $ | 5,371 | |
| Variable Lease Cost | Variable Lease Cost | 1,166 | | | 1,068 | |
| Short-Term Lease Cost | |
| Total Lease Cost | Total Lease Cost | $ | 7,003 | | | $ | 6,439 | |
| | Lease Cash Flows | Lease Cash Flows | |
| Lease Cash Flows | |
| Lease Cash Flows | |
| Operating Cash Flows from Operating Leases | |
| Operating Cash Flows from Operating Leases | |
| Operating Cash Flows from Operating Leases | Operating Cash Flows from Operating Leases | $ | 5,431 | | | $ | 4,893 | |
|
A summary of operating lease right-of-use lease assets and lease liabilities as of December 31, 20202023 and 20192022 is as follows:
| | (in thousands) | (in thousands) | | 2020 | | 2019 | (in thousands) | | 2023 | | 2022 |
| Right of Use Lease Assets1 | Right of Use Lease Assets1 | | $ | 19,114 | | | $ | 21,851 | |
Right of Use Lease Assets1 | |
Right of Use Lease Assets1 | |
| Lease Liabilities | Lease Liabilities | |
Current2 | |
Current2 | |
Current2 | Current2 | | 4,479 | | | 4,136 | |
Long-Term3 | Long-Term3 | | 15,314 | | | 18,193 | |
| Total Lease Liabilities | Total Lease Liabilities | | $ | 19,793 | | | $ | 22,329 | |
| 1Included in Other Noncurrent Assets in the consolidated balance sheets. | 1Included in Other Noncurrent Assets in the consolidated balance sheets. | |
1Included in Other Noncurrent Assets in the consolidated balance sheets. | |
1Included in Other Noncurrent Assets in the consolidated balance sheets. | |
2Included in Other Current Liabilities in the consolidated balance sheets. | |
2Included in Other Current Liabilities in the consolidated balance sheets. | |
2Included in Other Current Liabilities in the consolidated balance sheets. | 2Included in Other Current Liabilities in the consolidated balance sheets. | |
3Included in Other Noncurrent Liabilities in the consolidated balance sheets. | 3Included in Other Noncurrent Liabilities in the consolidated balance sheets. | |
3Included in Other Noncurrent Liabilities in the consolidated balance sheets. | |
3Included in Other Noncurrent Liabilities in the consolidated balance sheets. | |
Operating lease assets obtained in exchange for new operating liabilities amounted to $1.4$3.6 million and $6.3$3.7 million for the years ended December 31, 20202023 and 2019.2022.
Maturities of lease liabilities as of December 31, 20202023 for each of the next five years and in the aggregate thereafter are as follows: | | (in thousands) | (in thousands) | Operating Leases | (in thousands) | Operating Leases |
| | 2021 | $ | 5,387 | |
| 2022 | 4,282 | |
| 2023 | 3,905 | |
| 2024 | |
| 2024 | |
| 2024 | 2024 | 3,376 | |
| 2025 | 2025 | 2,545 | |
| 2026 | |
| 2027 | |
| 2028 | |
| Thereafter | Thereafter | 3,301 | |
| Total Lease Payments | Total Lease Payments | $ | 22,796 | |
| Less: Interest | Less: Interest | 3,003 | |
| Present Value of Lease Liabilities | Present Value of Lease Liabilities | $ | 19,793 | |
The weighted-average remaining lease term and the weighted-average discount rate as of December 31, 20202023 and 20192022 are as follows:
| | | | | | | | | | | |
| 2020 | | 2019 |
| | | |
| Weighted-Average Remaining Lease Term (in years) | 5.3 | | 6.0 |
| Weighted-Average Discount Rate | 5.45 | % | | 5.30 | % |
| | | |
Prior to adopting new lease accounting guidance on January 1, 2019, we accounted for operating leases by recognizing lease cost on a straight-line basis over the lease term. Lease expense for the year ended December 31, 2018 was $6.3 million. | | | | | | | | | | | |
| 2023 | | 2022 |
| | | |
| Weighted-Average Remaining Lease Term (in years) | 3.4 | | 4.2 |
| Weighted-Average Discount Rate | 5.40 | % | | 4.73 | % |
| | | |
9. Short-Term and Long-Term Borrowings
The following is a summary of our outstanding shortshort- and long-term borrowings by borrower, Otter Tail Corporation (OTC)OTC or Otter Tail Power Company (OTP),OTP, as of December 31, 20202023 and 2019:2022:
| | 2020 | | 2019 |
| 2023 | | | 2023 | | 2022 |
| (in thousands) | (in thousands) | OTC | | OTP | | Total | | OTC | | OTP | | Total | (in thousands) | OTC | | OTP | | Total | | OTC | | OTP | | Total |
| | Short-Term Debt | |
| Short-Term Debt | |
| Short-Term Debt | Short-Term Debt | $ | 65,166 | | | $ | 15,831 | | | $ | 80,997 | | | $ | 6,000 | | | $ | 0 | | | $ | 6,000 | |
| Current Maturities of Long-Term Debt | Current Maturities of Long-Term Debt | 169 | | | 139,918 | | | 140,087 | | | 183 | | | 0 | | | 183 | |
| Long-Term Debt, net of current maturities | Long-Term Debt, net of current maturities | 79,695 | | | 544,737 | | | 624,432 | | | 79,812 | | | 609,769 | | | 689,581 | |
| Total | Total | $ | 145,030 | | | $ | 700,486 | | | $ | 845,516 | | | $ | 85,995 | | | $ | 609,769 | | | $ | 695,764 | |
Short-Term Debt
The following is a summary of our lines of credit as of December 31, 20202023 and 2019:2022:
| | 2020 | | 2019 |
| | | 2023 | | | | | 2023 | | 2022 |
| (in thousands) | (in thousands) | Line Limit | | Amount Outstanding | | Letters
of Credit | | Amount Available | | Amount Available | (in thousands) | Line Limit | | Amount Outstanding | | Letters
of Credit | | Amount Available | | Amount Available |
| | OTC Credit Agreement | OTC Credit Agreement | $ | 170,000 | | | $ | 65,166 | | | $ | 0 | | | $ | 104,834 | | | $ | 164,000 | |
| OTC Credit Agreement | |
| OTC Credit Agreement | |
| OTP Credit Agreement | OTP Credit Agreement | 170,000 | | | 15,831 | | | 14,101 | | | 140,068 | | | 154,524 | |
| Total | Total | $ | 340,000 | | | $ | 80,997 | | | $ | 14,101 | | | $ | 244,902 | | | $ | 318,524 | |
Otter Tail CorporationOTC is party to a ThirdFifth Amended and Restated Credit Agreement (the OTC Credit Agreement) and OTP is party to a SecondFourth Amended and Restated Credit Agreement (the OTP Credit Agreement). The agreements both of which provide for $170.0 million unsecured revolving lines of credit to support operations. Borrowings may be used for workingoperations, fund capital needs and other capital requirements, toexpenditures, refinance certain indebtedness and provide for the issuance of letters of credit in an aggregate amount not to exceed $40$40.0 million forunder the OTC Credit Agreement and $50$50.0 million forunder the OTP Credit Agreement. Each credit facility includes an accordion provision allowing the borrower to increase the available borrowing capacity under the facility, subject to certain termsconditions, up to $290.0 million and conditions. The borrowing capacity can be increased to $290$250.0 million forunder the OTC Credit Agreement and to $250 million for the OTP Credit Agreement. EachAgreement, respectively.
Borrowings under each credit facility chargesare subject to a variable rate of interest on outstanding balances and applies a commitment fee is charged based on the average unused amount available to be drawn under the respective facility. The variable rate of interest to be charged is based on a benchmark interest rate, either SOFR or a Base Rate, as defined in the Prime Rate, the Federal Funds Rate or LIBOR, ascredit agreements, selected by the borrower at the time of an advance, subject to the conditions of each agreement, plus an applicable credit spread. The credit spread ranges from 0zero to 2.00%, depending on the benchmark interest rate selected, and is subject to adjustment based on the credit ratings of the relevant borrower. As of December 31, 2020, the LIBOR based credit spread was 1.50% and 1.25% under the OTC Credit Agreement and OTP Credit Agreement, respectively. The weighted-average interest rate on all outstanding borrowings as of December 31, 20202023 and 20192022 was 1.61%6.70% and 3.20%5.61%.
Each credit facility contains a number of restrictions on the borrower, including restrictions on itsthe ability to merge, sell assets, make investments, create or incur liens on assets, guarantee the obligations of any other party and engage in transactions with related parties. Each credit facilityThe agreements also contains customary affirmative covenants, includingrequire the borrower to maintain various financial covenants, as further described below, and certain events of default.below. Each credit facility expires on October 31, 2024.
Both the OTC Credit Agreement and the OTP Credit Agreement include LIBOR as a benchmark interest rate in determining the applicable rate of interest to charge on outstanding borrowings. LIBOR is currently expected to be eliminated by January 1, 2022. Both credit agreements contain a provision to determine how interest rates will be established in the event a replacement for LIBOR has not been identified before the agreement expires. The agreements require the parties to jointly agree on an alternate rate of interest, such as the Secured Overnight Financing Rate, that gives due consideration to prevailing market convention for determining a rate of interest for syndicated loans in the United States at such time. The parties will enter into amendments to these agreements to reflect any alternate rate of interest and other related changes to the agreements as may be applicable. If for any reason an agreement cannot be reached on an alternate rate of interest, then any borrowings under the agreements will be determined using the Prime Rate plus a margin based on the borrower's long-term debt ratings at the time of borrowing.29, 2027.
Long-Term Debt
The following is a summary of outstanding long-term debt by borrower as of December 31, 20202023 and 2019:2022:
| | | | | | | | | | | | | | | | | | | | | | | | | | | | | | | | |
| | | | | | | | (in thousands) |
| Entity | | Debt Instrument | | Rate | | Maturity | | 2020 | | 2019 |
| | | | | | | | | | |
| OTC | | Guaranteed Senior Notes | | 3.55% | | 12/15/26 | | $ | 80,000 | | | $ | 80,000 | |
| OTP | | Series 2011A Senior Unsecured Notes | | 4.63% | | 12/01/21 | | 140,000 | | | 140,000 | |
| OTP | | Series 2007B Senior Unsecured Notes | | 6.15% | | 08/20/22 | | 30,000 | | | 30,000 | |
| OTP | | Series 2007C Senior Unsecured Notes | | 6.37% | | 08/02/27 | | 42,000 | | | 42,000 | |
| OTP | | Series 2013A Senior Unsecured Notes | | 4.68% | | 02/27/29 | | 60,000 | | | 60,000 | |
| OTP | | Series 2019A Senior Unsecured Notes | | 3.07% | | 10/10/29 | | 10,000 | | | 10,000 | |
| OTP | | Series 2020A Senior Unsecured Notes | | 3.22% | | 02/25/30 | | 10,000 | | | 0 | |
| OTP | | Series 2020B Senior Unsecured Notes | | 3.22% | | 08/20/30 | | 40,000 | | | 0 | |
| OTP | | Series 2007D Senior Unsecured Notes | | 6.47% | | 08/20/37 | | 50,000 | | | 50,000 | |
| OTP | | Series 2019B Senior Unsecured Notes | | 3.52% | | 10/10/39 | | 26,000 | | | 26,000 | |
| OTP | | Series 2020C Senior Unsecured Notes | | 3.62% | | 02/25/40 | | 10,000 | | | 0 | |
| OTP | | Series 2013B Senior Unsecured Notes | | 5.47% | | 02/27/44 | | 90,000 | | | 90,000 | |
| OTP | | Series 2018A Senior Unsecured Notes | | 4.07% | | 02/07/48 | | 100,000 | | | 100,000 | |
| OTP | | Series 2019C Senior Unsecured Notes | | 3.82% | | 10/10/49 | | 64,000 | | | 64,000 | |
| OTP | | Series 2020D Senior Unsecured Notes | | 3.92% | | 02/25/50 | | 15,000 | | | 0 | |
| OTC | | PACE Note | | 2.54% | | 03/18/21 | | 169 | | | 351 | |
| Total | | | | | | | | $ | 767,169 | | | $ | 692,351 | |
| Less: | Current Maturities Net of Unamortized Debt Issuance Costs | | | | | | 140,087 | | | 183 | |
| Unamortized Long-Term Debt Issuance Costs | | | | | | 2,650 | | | 2,587 | |
| Total Long-Term Debt Net of Unamortized Debt Issuance Costs | | | | $ | 624,432 | | | $ | 689,581 | |
During the year ended December 31, 2020, OTP issued in a private placement pursuant to our 2019 Note Purchase Agreement, its Series 2020A, Series 2020B, Series 2020C and Series 2020D notes for aggregate proceeds of $75.0 million. | | | | | | | | | | | | | | | | | | | | | | | | | | | | | | | | |
| | | | | | | | (in thousands) |
| Entity | | Debt Instrument | | Rate | | Maturity | | 2023 | | 2022 |
| | | | | | | | | | |
| OTC | | Guaranteed Senior Notes | | 3.55% | | 12/15/26 | | $ | 80,000 | | | $ | 80,000 | |
| OTP | | Series 2007C Senior Unsecured Notes | | 6.37% | | 08/02/27 | | 42,000 | | | 42,000 | |
| OTP | | Series 2013A Senior Unsecured Notes | | 4.68% | | 02/27/29 | | 60,000 | | | 60,000 | |
| OTP | | Series 2019A Senior Unsecured Notes | | 3.07% | | 10/10/29 | | 10,000 | | | 10,000 | |
| OTP | | Series 2020A Senior Unsecured Notes | | 3.22% | | 02/25/30 | | 10,000 | | | 10,000 | |
| OTP | | Series 2020B Senior Unsecured Notes | | 3.22% | | 08/20/30 | | 40,000 | | | 40,000 | |
| OTP | | Series 2021A Senior Unsecured Notes | | 2.74% | | 11/29/31 | | 40,000 | | | 40,000 | |
| OTP | | Series 2007D Senior Unsecured Notes | | 6.47% | | 08/20/37 | | 50,000 | | | 50,000 | |
| OTP | | Series 2019B Senior Unsecured Notes | | 3.52% | | 10/10/39 | | 26,000 | | | 26,000 | |
| OTP | | Series 2020C Senior Unsecured Notes | | 3.62% | | 02/25/40 | | 10,000 | | | 10,000 | |
| OTP | | Series 2013B Senior Unsecured Notes | | 5.47% | | 02/27/44 | | 90,000 | | | 90,000 | |
| OTP | | Series 2018A Senior Unsecured Notes | | 4.07% | | 02/07/48 | | 100,000 | | | 100,000 | |
| OTP | | Series 2019C Senior Unsecured Notes | | 3.82% | | 10/10/49 | | 64,000 | | | 64,000 | |
| OTP | | Series 2020D Senior Unsecured Notes | | 3.92% | | 02/25/50 | | 15,000 | | | 15,000 | |
| OTP | | Series 2021B Senior Unsecured Notes | | 3.69% | | 11/29/51 | | 100,000 | | | 100,000 | |
| OTP | | Series 2022A Senior Unsecured Notes | | 3.77% | | 05/20/52 | | 90,000 | | | 90,000 | |
| Total | | | | | | | | 827,000 | | | 827,000 | |
| | | | | | | | | |
| Less: | Unamortized Long-Term Debt Issuance Costs | | | | | | 2,941 | | | 3,179 | |
| Total Long-Term Debt Net of Unamortized Debt Issuance Costs | | | | $ | 824,059 | | | $ | 823,821 | |
Our guaranteed and unsecured notes require the borrower to maintain various financial covenants, as further described below. These notes provide for prepayment options allowing for a full or partial repaymentprepayment at 100% of the principal amount so repaid,prepaid, together with unpaid accrued interest and a make-whole amount, as defined. These notes also include restrictions on the borrowers,borrower, including its ability to merge, sell assets, create or incur liens on assets, guarantee the obligations of any other party and engage in transactions with related parties.
Aggregate maturities of long-term debt obligations at December 31, 20202023 for each of the next five years are as follows:
| | (in thousands) | (in thousands) | 2021 | | 2022 | | 2023 | | 2024 | | 2025 | (in thousands) | 2024 | | 2025 | | 2026 | | 2027 | | 2028 |
| | Debt Maturities | Debt Maturities | $ | 140,169 | | | $ | 30,000 | | | $ | 0 | | | $ | 0 | | | $ | 0 | |
| Debt Maturities | |
| Debt Maturities | |
|
Financial Covenants
Certain of OTC's and OTP's short-term and long-term debt agreements require the borrower, whether OTC or OTP, to maintain certain financial covenants, including a maximum debt to total capitalization of 0.60 to 1.00, a minimum interest and dividend coverage ratio of 1.50 to 1.00, and a maximum level of priority indebtedness. As of December 31, 2020,2023, OTC and OTP were in compliance with these financial covenants.
Guaranties
OTC's obligations under the terms of its Guaranteed Senior Notes are unconditionally and irrevocably guaranteed by its subsidiaries, Varistar Corporation, BTD Manufacturing, Inc., Northern Pipe Products, Inc., and Vinyltech Corporation.
10. Employee Postretirement Benefits
Pension Plan and Other Postretirement Benefits
Pension Plan
We sponsorThe Company sponsors a noncontributory funded pension plan (the Pension Plan), an unfunded, nonqualified Executive Survivor and Supplemental Retirement Plan (ESSRP), both accounted for as defined benefit pension plans, and a postretirement healthcare plan accounted for as an other postretirement benefit plan.
The Pension Plan, which coverspreviously covered substantially all corporate employees and OTP nonunion employees, hired priorwas closed to September 1, 2006, and all unionnew employees of OTP hired prior to November 1, 2013, excluding Coyote Station employees. Coyote Station employees hired before January 1, 2009 are covered under the plan.in 2013. The plan provides 100% vesting after five vesting years of service and for retirement compensation to all covered employees at age 65, with reduced compensation in cases of retirement prior to age 62. We reserve the right to discontinue the plan, but no change or discontinuance may affect the pensions theretofore vested.
The pension plan has a trustee who is responsible for pension payments to retirees and a separate pension fund manager responsible for managing the plan's assets. An independent actuary assists us in performing the necessary actuarial valuations for the plan.
Participants are fully vested after completing five years of vesting service. The plan assets consist of common stock and bonds of public companies, U.S. government securities,equity funds, fixed income funds, cash and cash equivalents and alternative investments. None of the plan assets are invested in common stock or debt securities of the Company.
The ESSRP, an unfunded plan, provides for defined benefit payments to executive officers and certain key management employees on their retirement for life, or to their beneficiaries on their death. The ESSRP was amended and restated in 2019 to i) freeze the participation in the
The following table lists componentsrestoration retirement benefit component of net periodic pensionthe plan and ii) freeze benefit costaccruals under the restoration retirement benefit component of the plan for all participants of the years ended December 31, 2020, 2019 and 2018:
| | | | | | | | | | | | | | | | | |
| (in thousands) | 2020 | | 2019 | | 2018 |
| | | | | |
| Service Cost–Benefit Earned During the Period | $ | 6,621 | | | $ | 5,491 | | | $ | 6,459 | |
| Interest Cost on Projected Benefit Obligation | 13,053 | | | 14,412 | | | 13,452 | |
| Expected Return on Assets | (22,021) | | | (21,297) | | | (21,199) | |
| Amortization of Prior Service Cost: | | | | | |
| From Regulatory Asset | 0 | | | 5 | | | 16 | |
From Other Comprehensive Income1 | 0 | | | 9 | | | 0 | |
| Amortization of Net Actuarial Loss: | | | | | |
| From Regulatory Asset | 8,924 | | | 4,642 | | | 7,135 | |
From Other Comprehensive Income1 | 220 | | | 114 | | | 183 | |
Net Periodic Pension Cost2 | $ | 6,797 | | | $ | 3,376 | | | $ | 6,046 | |
1Corporate cost included in nonservice cost components of postretirement benefits.
| | | | | | | | | | | | | | | | | |
2Allocation of costs: | 2020 | | 2019 | | 2018 |
| | | | | |
Service costs included in OTP capital expenditures | $ | 1,842 | | | $ | 1,365 | | | $ | 1,542 | |
| Service costs included in electric operation and maintenance expenses | 4,621 | | | 3,994 | | | 4,756 | |
| Service costs included in other nonelectric expenses | 159 | | | 132 | | | 161 | |
| Nonservice costs capitalized | 48 | | | (526) | | | (99) | |
| Nonservice costs included in nonservice cost components of postretirement benefits | 127 | | | (1,589) | | | (314) | |
Weighted average assumptions usedplan except any participants deemed to determine net periodic pension cost for the years ended December 31, 2020, 2019 and 2018:
| | | | | | | | | | | | | | | | | |
| | 2020 | | 2019 | | 2018 |
| | | | | |
| Discount Rate | 3.47 | % | | 4.50 | % | | 3.90 | % |
| Long-Term Rate of Return on Plan Assets | 6.88 | % | | 7.25 | % | | 7.50 | % |
| Rate of Increase in Future Compensation Level: | | | | | |
| Participants to Age 39 | 4.50 | % | | 4.50 | % | | 4.50 | % |
| Participants Age 40 to Age 49 | 3.50 | % | | 3.50 | % | | 3.50 | % |
| Participants Age 50 and Older | 2.75 | % | | 2.75 | % | | 2.75 | % |
| | | | | |
The following table presents amounts recognizedpostretirement healthcare plan, closed to new participants in the consolidated balance sheets as of December 31, 2020 and 2019:
| | | | | | | | | | | |
| (in thousands) | 2020 | | 2019 |
| | | |
| Regulatory Assets: | | | |
| Unrecognized Prior Service Cost | $ | 0 | | | $ | 0 | |
| Unrecognized Actuarial Loss | 137,500 | | | 120,592 | |
| Total Regulatory Assets | $ | 137,500 | | | $ | 120,592 | |
| Accumulated Other Comprehensive Loss: | | | |
| Unrecognized Prior Service Cost | $ | 0 | | | $ | 0 | |
| Unrecognized Actuarial (Gain) Loss | 128 | | | (82) | |
| Total Accumulated Other Comprehensive Loss | $ | 128 | | | $ | (82) | |
| Noncurrent Liability | $ | 67,718 | | | $ | 55,004 | |
Funded status as of December 31, 2020 and 2019:
| | | | | | | | | | | |
| (in thousands) | 2020 | | 2019 |
| | | |
| Accumulated Benefit Obligation | $ | (385,302) | | | $ | (346,723) | |
| Projected Benefit Obligation | $ | (428,396) | | | $ | (384,785) | |
| Fair Value of Plan Assets | 360,678 | | | 329,781 | |
| Funded Status | $ | (67,718) | | | $ | (55,004) | |
The following table2010, provides a reconciliationportion of health insurance benefits for retired and covered corporate and OTP employees. To be eligible for retiree health insurance benefits, the changes in the fair valueemployee must be 55 years of age with a minimum of 10 years of service. The plan assets and the plan’s benefit obligations for the years ended December 31, 2020 and 2019:
| | | | | | | | | | | |
| (in thousands) | 2020 | | 2019 |
| | | |
| Reconciliation of Fair Value of Plan Assets: | | | |
| Fair Value of Plan Assets at January 1 | $ | 329,781 | | | $ | 269,783 | |
| Actual Return on Plan Assets | 35,474 | | | 52,640 | |
| Discretionary Company Contributions | 11,200 | | | 22,500 | |
| Benefit Payments | (15,777) | | | (15,142) | |
| Fair Value of Plan Assets at December 31 | $ | 360,678 | | | $ | 329,781 | |
| Estimated Asset Return | 10.7 | % | | 19.3 | % |
| Reconciliation of Projected Benefit Obligation: | | | |
| Projected Benefit Obligation at January 1 | $ | 384,785 | | | $ | 328,442 | |
| Service Cost | 6,621 | | | 5,491 | |
| Interest Cost | 13,053 | | | 14,412 | |
| Benefit Payments | (15,777) | | | (15,142) | |
| Actuarial Loss | 39,714 | | | 51,582 | |
| Projected Benefit Obligation at December 31 | $ | 428,396 | | | $ | 384,785 | |
Weighted average assumptions used to determine benefit obligations at December 31, 2020 and 2019: | | | | | | | | | | | |
| | 2020 | | 2019 |
| | | |
| Discount Rate | 2.78 | % | | 3.47 | % |
| Rate of Increase in Future Compensation Level: | | | |
| Participants to Age 39 | 4.50 | % | | 4.50 | % |
| Participants Age 40 to Age 49 | 3.50 | % | | 3.50 | % |
| Participants Age 50 and Older | 2.75 | % | | 2.75 | % |
| | | |
The assumed long-term rate of return on plan assets is based primarily on asset category studies using historical market return and volatility data with forward looking estimates based on existing financial market conditions and forecasts of capital markets. Modest excess return expectations versus some market indices are incorporated into the return projections based on the actively managed structure of the investment programs and their records of achieving such returns historically. We review our rate of return on plan asset assumptions annually. The assumptions are largely based on the asset category rate-of-return assumptions developed annually with our pension plan investment advisors, as well as input from actuaries who work with the pensionan unfunded plan and benchmarkingaccordingly holds no plan assets.
Pension Plan Assets. We have established a Retirement Plans Administration Committee to peer companies with similar asset allocation strategies.
Market-related value of plan assets. Our expected return on plan assets is determined based on the expected long-term rate of return on plan assetsdevelop and the market-related value of plan assets.
We base actuarial determination of pension plan expense or income on a market-related valuation of assets, which reduces year-to-year volatility. This market-related valuation calculation recognizes investment gains or losses over a five-year period from the year in which they occur. Investment gains or losses for this purpose are the difference between the expected return calculated using the market-related value of assets and the actual return based on the fair value of assets. Since the market-related valuation calculation recognizes gains or losses over a five-year period, the future value of the market-related assets will be impacted as previously deferred gains or losses are recognized.
| | | | | | | | | | | |
| Measurement Dates: | 2020 | | 2019 |
| | | |
| Net Periodic Pension Cost | 2020-01-01 | | 2019-01-01 |
| End of Year Benefit Obligations | January 1, 2020 projected to December 31, 2020 | | January 1, 2019 projected to December 31, 2019 |
| Market Value of Assets | 2020-12-31 | | 2019-12-31 |
| | | |
Cash flows. Wehad no minimum funding requirement as of December 31, 2020 but made discretionary plan contributions of $10.0 million in January 2021.
The following benefit payments, which reflect expected future service, as appropriate, are expected to be paid out from plan assets: | | | | | | | | | | | | | | | | | | | | | | | | | | | | | | | | | | | |
| (in thousands) | 2021 | | 2022 | | 2023 | | 2024 | | 2025 | | Years 2026-2030 |
| | | | | | | | | | | |
| Benefit Payments | $ | 16,536 | | | $ | 17,050 | | | $ | 17,694 | | | $ | 18,298 | | | $ | 18,856 | | | $ | 100,797 | |
| | | | | | | | | | | |
The following objectives guide themonitor our investment strategy offor our pension plan (the Plan): Pension Plan assets. Our investment strategy includes the following objectives:
•The assets of the Planplan will be invested in accordance with all applicable laws in a manner consistent with fiduciary standards including Employee Retirement Income Security Act standards of 1974 (ERISA) (if applicable). Specifically:
◦The safeguards and diversity that a prudent investor would adhere to must be present in the investment program.
◦All transactions undertaken on behalf of the Pension Plan must be in the best interest of plan participants and their beneficiaries.
•The primary objective of the Plan is to provide a source of retirement income for its participants and beneficiaries.
•The near-term primary financial objective of the Plan is to improve and protect the funded status of the Plan.plan.
•A secondary financial objective is to minimize pension funding and expense volatility where possible.
TheWe have developed an asset allocation strategy developed bytarget, measured at investment market value, to provide guideline percentages of investment mix. This investment mix is intended to achieve the Company’s Retirement Plans Administration Committee (the Committee) is based on the current needsfinancial objectives of the Plan and the objectives listed above. An asset/liability review is conducted annually or as often as necessary to assess the impact of various asset allocations on funded status and other financial variables.plan. The current needs of the Plan, the overall investment objectives above, the investment preferences and risk tolerance of the Committee and the desired degree of diversification suggest the need for an investment allocation including multiple asset classes.
The asset allocation in the table below contains guideline percentages, at market value, of the total Plan invested in various asset classes. The Permitted Rangepermitted range is a guide and will at times not reflect the actual asset allocation as this will be dictated bydue to market conditions, the independent actions of the Committee and/or Investment Managersour investment managers and required cash flows to and from the Pension Plan. The Permitted Range anticipates this fluctuation and provides flexibility for the Investment Managers’ portfolios to vary around the target without the need for immediate rebalancing. The Investment Manager will proactively monitor the asset allocation and will direct the purchases and sales to remain within the stated ranges.
The policy of the Plan is to invest assets in accordance with the allocations shown below: | | | | | | | | | | | | | | | | | | | | | | | | | | | | | | | | | | | | | | | | | | | | | | | | | | | | | | | | | | | |
| | Permitted Range |
| Asset Class / PBO Funded Status | < 85% PBO | | >=85% PBO | | >=90% PBO | | >=95% PBO | | >=100% PBO |
| | | | | | | | | | | | | | | | | | | |
| Equity | 39% | — | 59% | | 34% | — | 54% | | 24% | — | 44% | | 14% | — | 34% | | 0% | — | 20% |
| Investment Grade Fixed Income | 22% | — | 42% | | 30% | — | 50% | | 40% | — | 60% | | 53% | — | 73% | | 70% | — | 100% |
Below Investment Grade Fixed Income1 | 0% | — | 15% | | 0% | — | 15% | | 0% | — | 15% | | 0% | — | 10% | | 0% | — | 10% |
Other2 | 5% | — | 20% | | 5% | — | 20% | | 5% | — | 20% | | 0% | — | 15% | | 0% | — | 15% |
| | | | | | | | | | | | | | | | | | | |
1Includes (but not limited to) High Yield Bond Fund and Emerging Markets Debt funds. | | | | | | | | | | | | | | |
2Other category may include cash, alternatives, and/or other investment strategies that may be classified other than equity or fixed income, such as the Dynamic Asset Allocation fund or the SEI Energy Debt Collective Fund. | | | | | | |
Pension plan asset allocations at December 31, 2020 and 2019, by asset category are as follows:
| | | | | | | | | | | |
| Asset Allocation | 2020 | | 2019 |
| | | |
Global MGD Volatility Fund (mixed equities fund) | 19.3 | % | | 20.4 | % |
| Large Capitalization Equity Securities | 11.8 | | | 11.3 | |
| International Equity Securities | 9.9 | | | 9.3 | |
| Emerging Markets Equity Fund | 4.5 | | | 4.2 | |
| Small and Mid-Capitalization Equity Securities | 4.5 | | | 4.1 | |
| SEI Dynamic Asset Allocation Fund | 3.2 | | | 3.1 | |
| Equity Securities | 53.2 | | | 52.4 | |
| Fixed-Income Securities and Cash | 44.2 | | | 44.7 | |
| Other – SEI Energy Debt Collective Fund | 2.6 | | | 2.9 | |
| | 100.0 | % | | 100.0 | % |
pension fund assets measured at fair valueactual asset allocation as of December 31, 2023 and included2022: | | | | | | | | | | | | | | | | | | | | | | | |
| | Permitted | | Actual Allocation |
| Asset Class | Range | | 2023 | | 2022 |
| | | | | | | |
| Return Enhancement | 35 | | – | 60% | | 48 | % | | 48 | % |
| Risk Management | 40 | | – | 80% | | 51 | | | 51 | |
| Alternatives | 0 | | – | 20% | | 1 | | | 1 | |
| Total | | | | | 100 | % | | 100 | % |
Return Enhancement investments are those that seek to provide equity-like, long-term capital appreciation. Examples include equity securities, including dynamic asset allocation funds, and higher yielding fixed income securities, such as high yield bonds and emerging market debt.
Risk Management investments seek to decrease downside risk or act as a hedge against plan liabilities. Examples are cash and fixed income instruments.
Alternative investments seek to either provide return enhancement through long-term appreciation or risk management through decreased downside risk. The defining characteristic of these asset types is uncorrelated source of returns, less liquidity and private market access. Examples include investments in Level 1 ofthe SEI Energy Debt Collective Fund.
The following presents the fair value inputs classified within the fair value hierarchy used to measure Pension Plan assets at December 31, 2023 and 2022 and assets measured using the NAVnet asset value (NAV) practical expedient to fair valuation as of December 31, 2020 and 2019:expedient:
| | | | | | | | | | | |
| (in thousands) | 2020 | | 2019 |
| | | |
| Assets in Level 1 of the Fair Value Hierarchy | $ | 351,458 | | | $ | 320,241 | |
| SEI Energy Debt Collective Fund at NAV | 9,220 | | | 9,540 | |
| Total Assets | $ | 360,678 | | | $ | 329,781 | |
Fair Value Measurements of Pension Fund Assets: The following table presents the Company’s pension fund assets measured at fair value and included in Level 1 of the fair value hierarchy as of December 31, 2020 and 2019:
| | | | | | | | | | | |
| (in thousands) | 2020 | | 2019 |
| | | |
Global MGD Volatility Fund (mixed equities fund) | $ | 69,607 | | | $ | 67,184 | |
| Large Capitalization Equity Securities Mutual Fund | 42,697 | | | 37,357 | |
| International Equity Securities Mutual Funds | 35,607 | | | 30,653 | |
| Small and Mid-Capitalization Equity Securities Mutual Fund | 16,111 | | | 13,447 | |
| SEI Dynamic Asset Allocation Mutual Fund | 11,729 | | | 10,168 | |
| Emerging Markets Equity Fund | 16,146 | | | 13,792 | |
| Fixed Income Securities Mutual Funds | 159,192 | | | 147,639 | |
| Cash Management – Money Market Fund | 369 | | | 1 | |
| Total Assets | $ | 351,458 | | | $ | 320,241 | |
| | | | | | | | | | | | | | | | | | | | | | | | | | | | | |
| (in thousands) | Level 1 | | Level 2 | | Level 3 | | NAV | | Total |
| | | | | | | | | |
| December 31, 2023 | | | | | | | | | |
| | | | | | | | | |
| Equity Funds | $ | 127,159 | | | $ | — | | | $ | — | | | $ | — | | | $ | 127,159 | |
| Fixed Income Funds | 167,604 | | | — | | | — | | | — | | | 167,604 | |
| Hybrid Funds | 10,980 | | | — | | | — | | | — | | | 10,980 | |
| U.S. Treasury Securities | 23,218 | | | — | | | — | | | — | | | 23,218 | |
| SEI Energy Debt Collective Fund | — | | | — | | | — | | | 1,518 | | | 1,518 | |
| Total | 328,961 | | | — | | | — | | | 1,518 | | | 330,479 | |
| December 31, 2022 | | | | | | | | | |
| | | | | | | | | |
| Equity Funds | 124,327 | | | — | | | — | | | — | | | 124,327 | |
| Fixed Income Funds | 156,424 | | | — | | | — | | | — | | | 156,424 | |
| Hybrid Funds | 9,756 | | | — | | | — | | | — | | | 9,756 | |
| U.S. Treasury Securities | 19,587 | | | — | | | — | | | — | | | 19,587 | |
| SEI Energy Debt Collective Fund | — | | | — | | | — | | | 3,703 | | | 3,703 | |
| Total | $ | 310,094 | | | $ | — | | | $ | — | | | $ | 3,703 | | | $ | 313,797 | |
The investments held by the SEI Energy Debt Collective Fund on December 31, 20202023 and 20192022 consist mainly of below investment grade high yieldingyield bonds and loans of U.S. energy companies which trade at a discount to fair value. Redemptions are allowed semi-annually with a 95-day notice
period, subject to fund director consent and certain gate, holdback and suspension restrictions. Subscriptions are allowed monthly with a three-year lock up on subscriptions. The fund’s assets are valued in accordance with valuations reported by the fund’s sub-advisor or the fund’s underlying investments or other independent third-party sources, although SEI in its discretion may use other valuation methods, subject to compliance with ERISA, (as applicable). The fund’s assets are valued as of the close of business on the last business day of each calendar month and are available 30 days after the end of a calendar quarter.applicable. On an annual basis, as determined by the investment manager in its sole discretion, an independent valuation agent is retained to provide a valuation of the illiquid assets of the fund and of any other asset of the fund, as determined by the investment manager in its sole discretion. We review and verify the reasonableness of the year-end valuations.
Executive Survivor and Supplemental Retirement Plan (ESSRP)
The ESSRP is an unfunded nonqualified benefit plan for certain executive officers and key management employees that provides for defined benefit payments to these employees on their retirement for life or to their beneficiaries on their death. In addition, the ESSRP provides for survivor benefit payments to beneficiaries of the plan participants. On December 26, 2019, the Company’s Board of Directors amended and restated the ESSRP to provide for (i) the freezing of participation in the restoration retirement benefit component of the ESSRP and (ii) the freezing of benefit accruals under the restoration retirement benefit component of the ESSRP for all participants, except those designated as a grandfathered participant, effective December 31, 2019.
The following table lists components of net periodic pension benefit cost for the years ended December 31, 2020, 2019 and 2018:
| | | | | | | | | | | | | | | | | |
| (in thousands) | 2020 | | 2019 | | 2018 |
| | | | | |
| Service Cost–Benefit Earned During the Period | $ | 179 | | | $ | 418 | | | $ | 408 | |
| Interest Cost on Projected Benefit Obligation | 1,449 | | | 1,735 | | | 1,589 | |
| Amortization of Prior Service Cost: | | | | | |
| From Regulatory Asset | 0 | | | 5 | | | 20 | |
From Other Comprehensive Income1 | 0 | | | 17 | | | 34 | |
| Amortization of Net Actuarial Loss: | | | | | |
| From Regulatory Asset | 93 | | | 124 | | | 206 | |
From Other Comprehensive Income1 | 341 | | | 348 | | | 722 | |
Net Periodic Pension Cost2 | $ | 2,062 | | | $ | 2,647 | | | $ | 2,979 | |
1Funded Status. Amortization of prior service costs and net actuarial losses from other comprehensive income are included in nonservice cost components of postretirement benefits on the face of the Company’s consolidated statements of income.
| | | | | | | | | | | | | | | | | |
2Allocation of costs: | 2020 | | 2019 | | 2018 |
| | | | | |
| Service costs included in electric operation and maintenance expenses | $ | 0 | | | $ | 104 | | | $ | 99 | |
| Service costs included in other nonelectric expenses | 179 | | | 314 | | | 309 | |
| Nonservice costs included in nonservice cost components of postretirement benefits | 1,883 | | | 2,229 | | | 2,571 | |
Weighted average assumptions used to determine net periodic pension cost for the years ended December 31, 2020, 2019 and 2018:
| | | | | | | | | | | | | | | | | |
| | 2020 | | 2019 | | 2018 |
| | | | | |
| Discount Rate | 3.36 | % | | 4.46 | % | | 3.85 | % |
| Rate of Increase in Future Compensation Level | 3.50 | % | | 3.40 | % | | 2.92 | % |
| | | | | |
The following table presents amounts recognized in the consolidated balance sheets as of December 31, 2020 and 2019:
| | | | | | | | | | | |
| (in thousands) | 2020 | | 2019 |
| | | |
| Regulatory Assets: | | | |
| Unrecognized Prior Service Cost | $ | 0 | | | $ | 0 | |
| Unrecognized Actuarial Loss | 2,681 | | | 2,170 | |
| Total Regulatory Assets | $ | 2,681 | | | $ | 2,170 | |
| Projected Benefit Obligation Liability – Net Amount Recognized | $ | (47,894) | | | $ | (43,966) | |
| Accumulated Other Comprehensive Loss: | | | |
| Unrecognized Prior Service Cost | $ | 1 | | | $ | 1 | |
| Unrecognized Actuarial Loss | 12,030 | | | 9,170 | |
| Total Accumulated Other Comprehensive Loss | $ | 12,031 | | | $ | 9,171 | |
The following table provides a reconciliation of the changes in the fair value of plan assets and the plan’s projectedactuarially computed benefit obligationsobligation for the years ended December 31, 20202023 and 20192022 and a statementthe funded status of the funded statusplans as of December 31, of both years:
| | | | | | | | | | | |
| (in thousands) | 2020 | | 2019 |
| | | |
| Reconciliation of Fair Value of Plan Assets: | | | |
| Fair Value of Plan Assets at January 1 | $ | 0 | | | $ | 0 | |
| Actual Return on Plan Assets | 0 | | | 0 | |
| Employer Contributions | 1,505 | | | 1,475 | |
| Benefit Payments | (1,505) | | | (1,475) | |
| Fair Value of Plan Assets at December 31 | $ | 0 | | | $ | 0 | |
| Reconciliation of Projected Benefit Obligation: | | | |
| Projected Benefit Obligation at January 1 | 43,966 | | | 39,699 | |
| Service Cost | 179 | | | 418 | |
| Interest Cost | 1,449 | | | 1,735 | |
| Benefit Payments | (1,505) | | | (1,475) | |
| Curtailments | 0 | | | (1,671) | |
| Actuarial Loss | 3,805 | | | 5,260 | |
| Projected Benefit Obligation at December 31 | $ | 47,894 | | | $ | 43,966 | |
Weighted average assumptions used to determine benefit obligations at December 31, 20202023 and 2019:
| | | | | | | | | | | |
| | 2020 | | 2019 |
| | | |
| Discount Rate | 2.61 | % | | 3.36 | % |
| Rate of Increase in Future Compensation Level: | 3.00 | % | | 3.50 | % |
| | | |
Cash flows: The ESSRP is unfunded and has no assets; contributions are equal to the benefits paid to plan participants. The following benefit payments, which reflect future service, as appropriate, are expected to be paid: 2022:
| | Pension Benefits (Pension Plan) | | | Pension Benefits (Pension Plan) | | Pension Benefits (ESSRP) | | Postretirement Benefits |
| (in thousands) | (in thousands) | 2021 | | 2022 | | 2023 | | 2024 | | 2025 | | Years 2026-2030 | (in thousands) | 2023 | | 2022 | | 2023 | | 2022 | | 2023 | | 2022 |
| | Change in Fair Value of Plan Assets: | |
| Change in Fair Value of Plan Assets: | |
| Change in Fair Value of Plan Assets: | |
| Fair Value of Plan Assets at January 1 | |
| Fair Value of Plan Assets at January 1 | |
| Fair Value of Plan Assets at January 1 | |
| Actual Return on Plan Assets | |
| Company Contributions | |
| Benefit Payments | Benefit Payments | $ | 1,575 | | | $ | 2,049 | | | $ | 2,723 | | | $ | 2,707 | | | $ | 2,645 | | | $ | 14,348 | |
| Participant Premium Payments | |
| Fair Value of Plan Assets at December 31 | |
| Change in Benefit Obligation: | |
| Benefit Obligation at January 1 | |
| Benefit Obligation at January 1 | |
| Benefit Obligation at January 1 | |
| Service Cost | |
| Interest Cost | |
| | Benefit Payments | |
| Benefit Payments | |
| Benefit Payments | |
| Participant Premium Payments | |
| Plan Amendments | |
| Actuarial (Gain) Loss | |
| Benefit Obligation at December 31 | |
| Funded Status | |
| | Amounts Recognized in Consolidated Balance Sheets at December 31: | |
| Amounts Recognized in Consolidated Balance Sheets at December 31: | |
| Amounts Recognized in Consolidated Balance Sheets at December 31: | |
| Noncurrent Assets | |
| Noncurrent Assets | |
| Noncurrent Assets | |
| Current Liabilities | |
| Noncurrent Liabilities and Deferred Credits | |
| Net Asset (Liability) | |
Other Postretirement Benefits
We provide a portion of health insurance benefits for retired OTP and corporate employees. The retiree health insurance benefits will be available for all corporate employees and OTP nonunion employees hired prior to September 1, 2006, and all union employees of OTP hired prior to November 1, 2010, excluding Coyote Station employees. Coyote Station employees hired before January 1, 2009 are covered under the plan. To be eligible for retiree health insurance benefits the employee must be 55 years of age with a minimum of 10 years of service. There are no plan assets.
We elected to obtain post-65 prescription drug subsidies for our non-union plan participants beginning in 2020 and for our union plan participants beginning in 2021 from an employer group waiver plan. As a result, we will no longer apply for prescription drug subsidies for these participants. The net effect of these plan amendments reduced the projectedaccumulated benefit obligation for the plan by $20.9of our Pension Plan was $288.8 million and $283.2 million as of December 31, 20192023 and $3.92022. The accumulated benefit obligation of our ESSRP was $35.8 million and $35.6 million as of December 31, 2020, respectively.2023 and 2022.
In 2023, the Company amended its postretirement healthcare plan to eliminate, for Medicare-eligible participants, the employer-sponsored group waiver medical plan and instead allow participants to select an individual medical plan through a private marketplace exchange. The netCompany now provides these plan participants with an annual reimbursement to subsidize their medical premiums. The effect of the plan amendment reduced the Company’s projected benefit obligation by $20.1 million. The reduced benefit obligation included a $2.6 million reduction attributable to an increase in the discount rate used to measure the plan liability, which was 6.06% at the time of the amendment, compared to 5.52% used at December 31, 2022. The $17.5 million of savings from these changes will beattributable to the plan change is being recognized as a reduction to expense over 4.8 years, the expected remaining service period to retirement-age eligibility for active participants.
The following assumptions were used to determine benefit obligations as of December 31, 2023 and 2022: | | | | | | | | | | | | | | | | | | | | | | | | | | | | | | | | | | | |
| Pension Benefits (Pension Plan) | | Pension Benefits (ESSRP) | | Postretirement Benefits |
| | 2023 | | 2022 | | 2023 | | 2022 | | 2023 | | 2022 |
| | | | | | | | | | | |
| Discount Rate | 5.57 | % | | 5.51 | % | | 5.53 | % | | 5.51 | % | | 5.53 | % | | 5.52 | % |
| Long-Term Rate of Compensation Increase | n/a | | n/a | | 3.00 | % | | 3.00 | % | | n/a | | n/a |
Participants up to Age 39(1) | 4.50 | % | | 4.50 | % | | n/a | | n/a | | n/a | | n/a |
Participants Ages 40 to 49(2) | 4.50 | % | | 3.50 | % | | n/a | | n/a | | n/a | | n/a |
Participants Age 50 and Older(3) | 3.75 | % | | 2.75 | % | | n/a | | n/a | | n/a | | n/a |
| Healthcare Cost Immediate Trend Rate | n/a | | n/a | | n/a | | n/a | | 6.97 | % | | 7.50 | % |
| Healthcare Cost Ultimate Trend Rate | n/a | | n/a | | n/a | | n/a | | 4.00 | % | | 4.00 | % |
| Year the Rate Reaches the Ultimate Trend Rate | n/a | | n/a | | n/a | | n/a | | 2048 | | 2048 |
| | | | | | | | | | | |
(1) Amount reflects rate of compensation increases for both union and non-union employees. |
(2) Amount reflects rate of compensation increases for union employees. The rate of compensation increases for non-union employees is 3.50%. |
(3) Amount reflects rate of compensation increases for union employees. The rate of compensation increases for non-union employees is 3.00%. |
The measurement of the plan asset or benefit obligation recognized for our Pension Plan, ESSRP and postretirement healthcare benefit plan included the following significant actuarial adjustments:
•For the Pension Plan, an increase in the discount rate in 2023 and 2022 reduced our obligation by $2.2 million and $117.1 million. Changes in retirement rate, percentage married, spouse age, benefit election, benefit commencement age and wage assumptions increased our benefit obligation in 2023 by $7.9 million. Changes in plan participant census data increased our benefit obligation by $3.1 million in 2023. Actual returns on Pension Plan assets in 2023 were $34.2 million, compared to an expected return of $25.9 million, impacting our obligation by $8.3 million.
•For the ESSRP, an increase in the discount rate in 2023 and 2022 reduced our obligation by $0.1 million and $10.2 million.
•For the postretirement healthcare plan, a plan amendment during 2023, as described above, decreased our benefit obligation by $17.5 million. An increase in the discount rate in 2023 and 2022 reduced our obligation by $1.3 million and $17.9 million. Revised estimates of healthcare cost trends and participant contribution assumptions increased the benefit obligation by $1.1 million in 2023.
Net Periodic Benefit Cost. A portion of servicecost may be capitalized as a cost of self-constructed property, plant and equipment. When recognized in the consolidated statements of income, service cost is recognized within one of the components of operating expenses. Nonservice cost components of net periodic benefit cost may be deferred and recognized as a regulatory asset under the accounting guidance for regulated operations. When recognized in the consolidated statements of income, nonservice cost components are recognized as nonservice cost components of postretirement benefits.
The following table lists the components of net periodic benefit cost of our defined benefit pension plans and other postretirement benefits for the years ended December 31, 2023, 2022 and 2021:
| | | | | | | | | | | | | | | | | | | | | | | | | | | | | | | | | | | | | | | | | | | | | | | | | | | | | |
| Pension Benefits (Pension Plan) | | Pension Benefits (ESSRP) | | Postretirement Benefits |
| (in thousands) | 2023 | | 2022 | | 2021 | | 2023 | | 2022 | | 2021 | | 2023 | | 2022 | | 2021 |
| | | | | | | | | | | | | | | | | |
| Service Cost | $ | 3,698 | | | $ | 6,576 | | | $ | 7,462 | | | $ | 72 | | | $ | 195 | | | $ | 187 | | | $ | 565 | | | $ | 1,338 | | | $ | 1,722 | |
| Interest Cost | 16,436 | | | 12,344 | | | 11,660 | | | 1,889 | | | 1,341 | | | 1,228 | | | 2,416 | | | 2,041 | | | 1,891 | |
| Expected Return on Assets | (25,914) | | | (23,684) | | | (22,359) | | | — | | | — | | | — | | | — | | | — | | | — | |
| Amortization of Prior Service Cost | — | | | — | | | — | | | — | | | — | | | — | | | (6,649) | | | (5,733) | | | (5,733) | |
| Amortization of Net Actuarial Loss | — | | | 7,865 | | | 10,914 | | | — | | | 567 | | | 620 | | | — | | | 3,063 | | | 3,774 | |
| Net Periodic Benefit Cost | $ | (5,780) | | | $ | 3,101 | | | $ | 7,677 | | | $ | 1,961 | | | $ | 2,103 | | | $ | 2,035 | | | $ | (3,668) | | | $ | 709 | | | $ | 1,654 | |
The following table includes the impact of regulation on the recognition of periodic benefit cost arising from pension and other postretirement benefits for the years ended December 31, 2023, 2022 and 2021:
| | | | | | | | | | | | | | | | | |
| (in thousands) | 2023 | | 2022 | | 2021 |
| | | | | |
| Net Periodic Benefit Cost | $ | (7,487) | | | $ | 5,913 | | | $ | 11,366 | |
| Net Amount Amortized Due to the Effect of Regulation | 1,225 | | | 1,121 | | | 21 | |
| Net Periodic Benefit Cost Recognized | $ | (6,262) | | | $ | 7,034 | | | $ | 11,387 | |
The following assumptions were used to determine net periodic benefit cost for the years ended December 31, 2020, 20192023, 2022 and 2018: 2021:
| | | | | | | | | | | | | | | | | |
| (in thousands) | 2020 | | 2019 | | 2018 |
| | | | | |
| Service Cost–Benefit Earned During the Period | $ | 1,847 | | | $ | 1,286 | | | $ | 1,526 | |
| Interest Cost on Projected Benefit Obligation | 2,393 | | | 3,083 | | | 2,583 | |
| Amortization of Prior Service Cost | | | | | |
| From Regulatory Asset | (4,677) | | | 0 | | | 0 | |
From Other Comprehensive Income1 | (115) | | | 0 | | | 0 | |
| Amortization of Net Actuarial Loss | | | | | |
| From Regulatory Asset | 4,206 | | | 1,571 | | | 1,648 | |
From Other Comprehensive Income1 | 104 | | | 38 | | | 42 | |
Net Periodic Postretirement Benefit Cost2 | $ | 3,758 | | | $ | 5,978 | | | $ | 5,799 | |
| Effect of Medicare Part D Subsidy | $ | 1,123 | | | $ | (179) | | | $ | (470) | |
1Corporate cost included in nonservice cost components | | | | | | | | | | | | | | | | | | | | | | | | | | | | | | | | | | | | | | | | | | | | | | | | | | | | | |
| Pension Benefits (Pension Plan) | | Pension Benefits (ESSRP) | | Postretirement Benefits |
| | 2023 | | 2022 | | 2021 | | 2023 | | 2022 | | 2021 | | 2023 | | 2022 | | 2021 |
| | | | | | | | | | | | | | | | | |
| Discount Rate | 5.51 | % | | 3.03 | % | | 2.78 | % | | 5.51 | % | | 2.93 | % | | 2.61 | % | | 5.52 | % | | 3.01 | % | | 2.75 | % |
| Long-Term Rate of Return on Plan Assets | 7.00 | % | | 6.30 | % | | 6.51 | % | | n/a | | n/a | | n/a | | n/a | | n/a | | n/a |
| Long-Term Rate of Compensation Increase | n/a | | n/a | | n/a | | 3.00 | % | | 3.00 | % | | 3.00 | % | | n/a | | n/a | | n/a |
| Participants to Age 39 | 4.50 | % | | 4.50 | % | | 4.50 | % | | n/a | | n/a | | n/a | | n/a | | n/a | | n/a |
| Participants Ages 40 to 49 | 3.50 | % | | 3.50 | % | | 3.50 | % | | n/a | | n/a | | n/a | | n/a | | n/a | | n/a |
| Participants Age 50 and Older | 2.75 | % | | 2.75 | % | | 2.75 | % | | n/a | | n/a | | n/a | | n/a | | n/a | | n/a |
| | | | | | | | | | | | | | | | | |
We develop our estimated discount rate through the use of
postretirement benefits. | | | | | | | | | | | | | | | | | |
2Allocation of costs: | 2020 | | 2019 | | 2018 |
| | | | | |
| Service costs included in OTP capital expenditures | $ | 514 | | | $ | 320 | | | $ | 364 | |
| Service costs included in electric operation and maintenance expenses | 1,289 | | | 935 | | | 1,124 | |
| Service costs included in other nonelectric expenses | 44 | | | 31 | | | 38 | |
| Nonservice costs capitalized | 532 | | | 1,167 | | | 1,020 | |
| Nonservice costs included in nonservice cost components of postretirement benefits | 1,379 | | | 3,525 | | | 3,253 | |
Weighteda hypothetical bond portfolio method. This method derives the discount rate from the average assumptions usedyield of a collection of high credit quality bonds which produce cash flows similar to determine net periodic postretirementour anticipated future benefit cost forpayments. We estimate the years ended December 31, 2020, 2019assumed long-term rate of return on plan assets based primarily on asset category studies using historical market return and 2018:
| | | | | | | | | | | | | | | | | |
| | 2020 | | 2019 | | 2018 |
| | | | | |
| Discount Rate | 3.43 | % | | 4.44 | % | | 3.81 | % |
| | | | | |
The following table presents the amounts not yet recognized in the consolidated balance sheetsas components of net periodic benefit cost as of December 31, 20202023 and 2019: 2022:
| | | | | | | | | | | |
| (in thousands) | 2020 | | 2019 |
| | | |
| Regulatory Asset: | | | |
| Unrecognized Prior Service Credit | $ | (19,579) | | | (20,363) | |
| Unrecognized Net Actuarial Loss (Gain) | 32,238 | | | $ | 35,322 | |
| Net Regulatory Asset | $ | 12,659 | | | $ | 14,959 | |
| Projected Benefit Obligation Liability – Net Amount Recognized | $ | (70,185) | | | $ | (71,437) | |
| Accumulated Other Comprehensive (Income) Loss: | | | |
| Unrecognized Prior Service Credit | $ | (386) | | | (501) | |
| Unrecognized Net Actuarial Loss (Gain) | 21 | | | 184 | |
| Accumulated Other Comprehensive (Income) Loss: | $ | (365) | | | $ | (317) | |
| | | | | | | | | | | | | | | | | | | | | | | | | | | | | | | | | | | |
| Pension Benefits (Pension Plan) | | Pension Benefits (ESSRP) | | Postretirement Benefits |
| (in thousands) | 2023 | | 2022 | | 2023 | | 2022 | | 2023 | | 2022 |
| | | | | | | | | | | |
| Regulatory Assets (Liabilities): | | | | | | | | | | | |
| Unrecognized Prior Service Cost | $ | — | | | $ | — | | | $ | — | | | $ | — | | | $ | (18,845) | | | $ | (8,400) | |
| Unrecognized Actuarial Loss | 85,227 | | | 85,367 | | | 1,061 | | | 979 | | | 1,759 | | | 3,993 | |
| Net Regulatory Assets (Liabilities) | 85,227 | | | 85,367 | | | 1,061 | | | 979 | | | (17,086) | | | (4,407) | |
| Accumulated Other Comprehensive Income (Loss): | | | | | | | | | | | |
| Unrecognized Prior Service Cost | — | | | — | | | — | | | — | | | 498 | | | 99 | |
| Unrecognized Actuarial Gain (Loss) | 1,994 | | | 1,978 | | | (1,403) | | | (1,093) | | | 707 | | | 818 | |
| Total Accumulated Other Comprehensive Income (Loss) | $ | 1,994 | | | $ | 1,978 | | | $ | (1,403) | | | $ | (1,093) | | | $ | 1,205 | | | $ | 917 | |
TableCash Flows. We did not make any contributions to our Pension Plan in 2023. We made discretionary contributions of Contents$20.0 million and $10.0 million in 2022 and 2021. As of December 31, 2023, we had no minimum funding requirements for our Pension Plan. Contributions to our ESSRP and postretirement healthcare plan are equal to the benefits paid to plan participants.The following table provides a reconciliationreflects anticipated benefit payments to be paid in each of the changesnext five years and in the fair value of plan assets and the plan’s projected benefit obligations and accrued postretirement benefit costaggregate for the years ended December 31, 2020five year period thereafter under our pension plans and 2019: postretirement healthcare plan:
| | | | | | | | | | | |
| (in thousands) | 2020 | | 2019 |
| | | |
| Reconciliation of Fair Value of Plan Assets: | | | |
| Fair Value of Plan Assets at January 1 | $ | 0 | | | $ | 0 | |
| Actual Return on Plan Assets | 0 | | | 0 | |
| Company Contributions | 2,662 | | | 2,757 | |
| Benefit Payments (Net of Medicare Part D Subsidy) | (6,694) | | | (7,164) | |
| Participant Premium Payments | 4,032 | | | 4,407 | |
| Fair Value of Plan Assets at December 31 | $ | 0 | | | $ | 0 | |
| Reconciliation of Projected Benefit Obligation: | | | |
| Projected Benefit Obligation at January 1 | $ | 71,437 | | | $ | 71,561 | |
| Service Cost (Net of Medicare Part D Subsidy) | 1,847 | | | 1,286 | |
| Interest Cost (Net of Medicare Part D Subsidy) | 2,393 | | | 3,083 | |
| Benefit Payments (Net of Medicare Part D Subsidy) | (6,694) | | | (7,164) | |
| Participant Premium Payments | 4,032 | | | 4,407 | |
| Plan Amendments | (3,891) | | | (20,864) | |
| Actuarial Loss | 1,061 | | | 19,128 | |
| Projected Benefit Obligation at December 31 | $ | 70,185 | | | $ | 71,437 | |
| Reconciliation of Accrued Postretirement Cost: | | | |
| Accrued Postretirement Cost at January 1 | $ | (56,795) | | | $ | (53,574) | |
| Expense | (3,758) | | | (5,978) | |
| Net Company Contribution | 2,662 | | | 2,757 | |
| Accrued Postretirement Cost at December 31 | $ | (57,891) | | | $ | (56,795) | |
Weighted average assumptions used to determine benefit obligations at December 31, 2020 and 2019:
| | | | | | | | | | | |
| | 2020 | | 2019 |
| | | |
| Discount Rate | 2.75 | % | | 3.43 | % |
| | | |
Assumed healthcare cost-trend rates as of December 31, 2020 and 2019: | | | | | | | | | | | |
| | 2020 | | 2019 |
| | | |
| Healthcare Cost-Trend Rate Assumed for Next Year | 6.44 | % | | 6.72 | % |
| Rate to Which the Cost-Trend Rate is Assumed to Decline | 4.50 | % | | 4.50 | % |
| Year the Rate Reaches the Ultimate Trend Rate | 2038 | | 2038 |
| | | |
| | | | | | | | | | | |
| Measurement Dates: | 2020 | | 2019 |
| | | |
| Net Periodic Postretirement Benefit Cost | 2020-01-01 | | 2019-01-01 |
| End of Year Benefit Obligations | January 1, 2020 projected to December 31, 2020 | | January 1, 2019 projected to December 31, 2019 |
| | | |
Cash flows: The following benefit payments, which reflect expected future service, as appropriate, net of participant premium payments, are expected to be paid: | | (in thousands) | (in thousands) | 2021 | | 2022 | | 2023 | | 2024 | | 2025 | | Years 2026-2030 | (in thousands) | 2024 | | 2025 | | 2026 | | 2027 | | 2028 | | 2029-2033 |
| | Benefit Payments | $ | 2,825 | | | $ | 2,955 | | | $ | 3,079 | | | $ | 3,199 | | | $ | 3,295 | | | $ | 16,893 | |
| | Projected Pension Plan Benefit Payments | |
| Projected Pension Plan Benefit Payments | |
| Projected Pension Plan Benefit Payments | |
| Projected ESSRP Benefit Payments | |
| Projected Postretirement Benefit Payments | |
| Total | |
401K Plan
We sponsor a 401K plan for the benefit of all corporate and subsidiary company employees. Contributions made to these plans totaled $5.3$7.8 million for 2020, $5.32023, $6.7 million for 20192022 and $4.5$6.5 million for 2018.2021.
11. Asset Retirement Obligations (AROs)
We have recognized ARO'sAsset Retirement Obligations (AROs) related to our coal-fired generation plants, natural gas combustion turbineturbines, solar facility, and wind turbines. The cost of AROs include items such as site restoration, closure of ash pits, and removal of certain structures, generators, asbestos and storage tanks. We have other legal obligations associated with the retirement of a variety of other long-lived tangible assets used in electric operations where the estimated settlement costs are individually and collectively immaterial. We have 0no assets legally restricted for the settlement of any AROs. As of December 31, 2023 and 2022, $0.1 million and $2.7 million, respectively, was included in other current liabilities and $36.4 million and $22.5 million, respectively, was included in other noncurrent liabilities in the consolidated balance sheets related to AROs.
A reconciliation of the carrying amounts of AROs for the years ended December 31, 20202023 and 20192022 is as follows:
| | | | | | | | | | | |
| (in thousands) | 2020 | | 2019 |
| | | |
| Beginning Balance | $ | 12,656 | | | $ | 9,117 | |
| New Obligations Recognized | 8,062 | | | 0 | |
| Adjustments Due to Revisions in Cash Flow Estimates | 3,110 | | | 3,099 | |
| Accrued Accretion | 570 | | | 440 | |
| Settlements | (577) | | | 0 | |
| Ending Balance | $ | 23,821 | | | $ | 12,656 | |
The new AROs recognized during the year ended December 31, 2020 arise from obligations associated with our Merricourt wind farm and Astoria Station natural gas plant. | | | | | | | | | | | |
| (in thousands) | 2023 | | 2022 |
| | | |
| Beginning Balance | $ | 25,182 | | | $ | 24,191 | |
| New Obligations Recognized | 4,506 | | | — | |
| Adjustments Due to Revisions in Cash Flow Estimates | 8,394 | | | — | |
| Accrued Accretion | 1,191 | | | 991 | |
| Settlements | (2,796) | | | — | |
| Ending Balance | $ | 36,477 | | | $ | 25,182 | |
12. Income Taxes
Income before income taxes for the years ended December 31, 2020, 20192023, 2022 and 2018 arose in its entirety from2021 consists entirely of domestic earnings.
The provision for income taxes charged to income for the years ended December 31, 2020, 20192023, 2022 and 20182021 consisted of the following:
| | (in thousands) | (in thousands) | 2020 | | 2019 | | 2018 | (in thousands) | 2023 | | 2022 | | 2021 |
| | Current | Current | |
| Current | |
| Current | |
| Federal Income Taxes | |
| Federal Income Taxes | |
| Federal Income Taxes | Federal Income Taxes | $ | 4,881 | | | $ | 5,156 | | | $ | 4,960 | |
| State Income Taxes | State Income Taxes | 2,415 | | | 1,333 | | | 1,395 | |
| Deferred | Deferred | |
| Federal Income Taxes | Federal Income Taxes | 11,450 | | | 8,859 | | | 8,065 | |
| Federal Income Taxes | |
| Federal Income Taxes | |
| State Income Taxes | State Income Taxes | 3,751 | | | 3,167 | | | 4,410 | |
| Tax Credits | Tax Credits | |
| Production Tax Credits | (1,250) | | | 0 | | | (3,111) | |
| North Dakota Wind Tax Credit Amortization, Net of Federal Taxes | (1,033) | | | (1,033) | | | (1,033) | |
| North Dakota Wind Tax Credit Amortization, Net of Federal Tax | |
| North Dakota Wind Tax Credit Amortization, Net of Federal Tax | |
| North Dakota Wind Tax Credit Amortization, Net of Federal Tax | |
| Investment Tax Credit Amortization | Investment Tax Credit Amortization | (8) | | | (41) | | | (98) | |
| Total | Total | $ | 20,206 | | | $ | 17,441 | | | $ | 14,588 | |
The reconciliation of the statutory federal income tax rate to our effective tax rate for each of the years ended December 31, 2020, 20192023, 2022 and 20182021 is as follows:
| | | | | | | | | | | | | | | | | |
| 2020 | | 2019 | | 2018 |
| | | | | |
| Federal Statutory Rate | 21.0 | % | | 21.0 | % | | 21.0 | % |
| Increases (Decreases) in Tax from: | | | | | |
| State Taxes on Income, Net of Federal Tax | 4.0 | | | 3.4 | | | 5.3 | |
| Differences Reversing in Excess of Federal Rates | (3.6) | | | (3.2) | | | (3.6) | |
| Production Tax Credits (PTCs) | (1.1) | | | 0 | | | (3.2) | |
| North Dakota Wind Tax Credit Amortization, Net of Federal Taxes | (0.9) | | | (1.0) | | | (1.1) | |
| Allowance for Equity Funds Used During Construction | (0.7) | | | (0.5) | | | (0.4) | |
| Corporate-Owned Life Insurance | (0.6) | | | (0.7) | | | 0 | |
| Excess Tax Deduction on Stock Awards | (0.4) | | | (0.7) | | | (0.7) | |
| Other, Net | (0.3) | | | (1.6) | | | (2.3) | |
| Effective Tax Rate | 17.4 | % | | 16.7 | % | | 15.0 | % |
| | | | | | | | | | | | | | | | | | | | | | | | | | |
| 2023 | | 2022 | | 2021 |
| Income Taxes at Federal Statutory Rate | $ | 76,332 | | 21.0 | % | | $ | 75,082 | | 21.0 | % | | $ | 44,692 | | 21.0 | % |
| Increases (Decreases) in Tax from: | | | | | | | | |
| State Taxes on Income, Net of Federal Tax | 14,429 | | 4.0 | | | 15,049 | | 4.2 | | | 9,962 | | 4.7 | |
| Production Tax Credits (PTCs) | (17,394) | | (4.8) | | | (14,985) | | (4.2) | | | (12,503) | | (5.9) | |
| Amortization of Excess Deferred Income Taxes | (2,205) | | (0.6) | | | (1,625) | | (0.5) | | | (4,262) | | (2.0) | |
| North Dakota Wind Tax Credit Amortization, Net of Federal Tax | (586) | | (0.2) | | | (586) | | (0.2) | | | (586) | | (0.3) | |
| Other, Net | (1,278) | | (0.3) | | | 416 | | 0.2 | | | (1,251) | | (0.6) | |
| Income Taxes at Effective Tax Rate | $ | 69,298 | | 19.1 | % | | $ | 73,351 | | 20.5 | % | | $ | 36,052 | | 16.9 | % |
The eligibility periodPTCs, North Dakota wind tax credits, and excess deferred income taxes related to earnthe federal PTCs expired for certain of our wind farms in 2018. In 2020, we began to generate PTCs from our Merricourt wind farm placed in servicetax rate reduction in the fourth quarter2017 Tax Cuts and Jobs Act are returned to customers as a reduction of the year.rates they are charged and result in a reduction of operating revenues.
Deferred tax assets and liabilities were composed of the following on December 31, 20202023 and 2019:2022:
| | (in thousands) | (in thousands) | 2020 | | 2019 | (in thousands) | 2023 | | 2022 |
| | Deferred Tax Assets | Deferred Tax Assets | | | |
| Benefit Liabilities | $ | 41,292 | | | $ | 38,130 | |
| Retirement Benefits Liabilities | 40,650 | | | 36,206 | |
| Tax Credit Carryforward | 35,132 | | | 48,910 | |
| Regulatory Tax Liability | 33,124 | | | 35,700 | |
| Deferred Tax Assets | |
| Deferred Tax Assets | | | | |
| Employee Benefits | |
| Regulatory Liabilities | |
| Tax Credit Carryforwards | |
| Cost of Removal | Cost of Removal | 25,920 | | | 25,604 | |
| Differences Related to Property | 7,486 | | | 6,979 | |
| Asset Retirement Obligations | |
| Net Operating Loss Carryforward | Net Operating Loss Carryforward | 1,379 | | | 1,475 | |
| Other | Other | 3,423 | | | 6,077 | |
| Valuation Allowance | (800) | | | (800) | |
| Total Deferred Tax Assets | Total Deferred Tax Assets | $ | 187,606 | | | $ | 198,281 | |
| Deferred Tax Liabilities | Deferred Tax Liabilities | |
| Differences Related to Property | Differences Related to Property | $ | (271,064) | | | $ | (268,495) | |
| Differences Related to Property | |
| Differences Related to Property | |
| Retirement Benefits Regulatory Asset | Retirement Benefits Regulatory Asset | (40,650) | | | (36,206) | |
| Excess Tax Over Book Pension | (18,696) | | | (17,556) | |
| Pension Expense | |
| Other | Other | (10,572) | | | (7,965) | |
| Total Deferred Tax Liabilities | Total Deferred Tax Liabilities | $ | (340,982) | | | $ | (330,222) | |
| Deferred Income Taxes | Deferred Income Taxes | $ | (153,376) | | | $ | (131,941) | |
Schedule of expirationThe following is a schedule of tax credits and tax net operating losses available as of December 31, 2020:2023 and the respective periods of expiration:
| | (in thousands) | (in thousands) | Amount | | 2022-2032 | | 2033-2038 | | 2039-2043 | (in thousands) | Amount | | 2024-2029 | | 2030-2037 | | 2038-2043 |
| | Federal Tax Credits | $ | 10,440 | | | $ | 0 | | | $ | 7,896 | | | $ | 2,544 | |
| State Net Operating Losses | |
| State Net Operating Losses | |
| State Net Operating Losses | State Net Operating Losses | 1,729 | | | 1,729 | | | 0 | | | 0 | |
| State Tax Credits | State Tax Credits | 30,509 | | | 0 | | | 1,002 | | | 29,507 | |
|
The following table summarizes the activity for unrecognized tax benefits for the years ended December 31, 2020, 20192023, 2022 and 2018:2021:
| | (in thousands) | (in thousands) | 2020 | | 2019 | | 2018 | (in thousands) | 2023 | | 2022 | | 2021 |
| | Balance on January 1 | Balance on January 1 | $ | 1,488 | | | $ | 1,282 | | | $ | 684 | |
| Increases (decreases) for tax positions taken during a prior period | (178) | | | 37 | | | 6 | |
| Balance on January 1 | |
| Balance on January 1 | |
| Increases for tax positions taken during a prior period | |
| Increases for tax positions taken during the current period | Increases for tax positions taken during the current period | 175 | | | 339 | | | 778 | |
| Decreases due to settlements with taxing authorities | Decreases due to settlements with taxing authorities | (575) | | | 0 | | | 0 | |
| Decreases as a result of a lapse of applicable statutes of limitations | Decreases as a result of a lapse of applicable statutes of limitations | (139) | | | (170) | | | (186) | |
| Balance on December 31 | Balance on December 31 | $ | 771 | | | $ | 1,488 | | | $ | 1,282 | |
The balance of unrecognized tax benefits as of December 31, 20202023 would reduce our effective tax rate if recognized. The total amount of unrecognized tax benefits as of December 31, 20202023 is not expected to change significantly within the next 12 months. We classify interest and penalties on tax uncertainties as components of the provision for income taxes in the consolidated statements of income. There was 0 amount accrued for interest on tax uncertainties as of December 31, 2020.
The Company and its subsidiaries file a consolidated U.S. federal income tax return and various state income tax returns. As of December 31, 2020,2023, with limited exceptions, we are no longer subject to examinations by taxing authorities for tax years prior to 20172020 for federal and North Dakota income taxes and prior to 20152019 for Minnesota state income taxes.
13. Commitments and Contingencies
Commitments
Construction and Other Purchase Commitments:Commitments. AtAs of December 31, 2020 OTP2023, we had commitments under contracts including its share offor construction programproject materials, equipment, plant maintenance, and other commitments,services extending into 2022 of2046 which totaled approximately $40$17.1 million. OTP’s other commitments charged to rent expense totaled $0.1 million, $0.3 million and $0.3 million in 2020, 2019 and 2018, respectively.
On October 1, 2019 T.O. Plastics entered into a six-year resin supply agreement that commenced on January 1, 2020. Under this resin supply agreement, there are no specified delivery volumes, rather, T.O. Plastics is required to purchase all of a specified class of regrind resin delivered by the supplier at a periodically negotiated price per pound. Based on current forecasted production levels, T.O. Plastics anticipates the quantity of resin delivered under the supply agreement will not exceed its requirements over the six-year term of the supply agreement or exceed the market cost of alternative sources of the resin. T.O. Plastics estimates it will pay the supplier approximately $1.9 million annually under this agreement.
Electric Utility Capacity and Energy Requirements and Coal Purchase and Delivery Contracts:Requirements. OTP has commitments for the purchase of capacity and energy requirements under contractual agreements, including wind power purchase agreements extending into 2044.2048. Generally, the terms of OTP's wind power purchase agreements require OTP alsoto purchase all of the electricity generated by a particular wind farm and do not include fixed or minimum payments. The required payments are variable and the amounts due are determined based upon the amount of electricity generated. Capacity and energy requirement costs under these agreements totaled $5.6 million, $13.1 million and $11.5 million for the years ended December 31, 2023, 2022 and 2021.
Coal Purchase Commitments. OTP has contracts providing for the purchase and delivery of a significant portion of its current coal requirements. OTP’s current coal purchase agreementsagreement with CCMC for Coyote Station expire atexpires December 31, 2040. All of Coyote Station’s coal requirements for the endperiod covered must be purchased under this agreement. The agreement is structured so that the price of 2040. OTP’s currentthe coal purchase agreements for Big Stone Plant expire atcovers all of CCMC's operating, financing, and future
mine reclamation costs. In the endtable below we have estimated the future payments to be made under the terms of 2022.the agreement until its maturity. OTP has an agreement with Peabody COALSALES, LLC for the purchase of subbituminous coal for Big Stone Plant’s coal requirements through December 31, 2022.2024. There is no fixed minimum purchase requirement, and no amounts for this agreement have been included in the table below; however, under this agreement but all of Big Stone Plant’s coal requirements for the period covered must be purchased under this agreement. OTP has an all-requirements agreement with Navajo Transitional Energy Co.Coal purchase costs under these two agreements totaled $43.7 million, $45.1 million and $40.4 million for the purchase of subbituminous coal for Hoot Lake Plant throughyears ended December 31, 2023. There are no fixed minimum purchase requirements under this agreement.2023, 2022 and 2021.
OTP Land Easements:Easement Payments. OTP has commitments to make future payments for land easements not classified as leases, extendingleases. The contractual terms of these easements are generally 99 years or do not have a stated maturity date, however, per the terms of the agreements, our requirement to make payment ends once we cease use of the land. As such, in the table below, we have included payments under these easements through the estimated useful lives of the facilities associated with the easement. The commitments under these arrangements extend into 2050 of2055 and total approximately $36.7$62.4 million. Land easement payments charged to rent expensecosts under these agreements totaled $1.8 million, $1.4 million and $1.3 million $0.6 millionfor the years ended December 31, 2023, 2022 and $0.6 million in 2020, 2019 and 2018, respectively.2021.
Our construction program and otherfuture commitments and commitments under capacity and energy agreements, coal purchase and coal delivery contracts and land easements as of December 31, 2020, are2023 were as follows:
| | (in thousands) | (in thousands) | Construction Program
and Other Commitments | | Capacity and Energy
Requirements | | Coal Purchase
Commitments | | Land
Easement
Payments | (in thousands) | Construction Program
and Other Commitments | | Capacity and Energy
Requirements | | Coal Purchase
Commitments | | Land
Easement
Payments |
| | 2021 | $ | 31,195 | | | $ | 16,280 | | | $ | 22,935 | | | $ | 1,900 | |
| 2022 | 957 | | | 11,854 | | | 22,793 | | | 1,361 | |
| 2023 | 233 | | | 11,854 | | | 23,955 | | | 1,386 | |
| 2024 | |
| 2024 | |
| 2024 | 2024 | 240 | | | 11,828 | | | 24,369 | | | 1,410 | |
| 2025 | 2025 | 247 | | | 11,784 | | | 25,103 | | | 1,436 | |
| Beyond 2025 | 6,951 | | | 120,756 | | | 454,020 | | | 29,202 | |
| 2026 | |
| 2027 | |
| 2028 | |
| Beyond 2028 | |
| Total | Total | $ | 39,823 | | | $ | 184,356 | | | $ | 573,175 | | | $ | 36,695 | |
Contingencies
FERC ROE:ROE. In November 2013 and February 2015, customers filed complaints with the FERC seeking to reduce the ROE component of the transmission rates that MISO transmission owners, including OTP, may collect under the MISO tariff rate. FERC's most recent order, issued on November 19, 2020, adopted a revised ROE methodology and set the base ROE at 10.02% (10.52% with an adder) effective for the fifteen-month period from November 2013 to February 2015 and on a prospective basis beginning in September 2016. The order also dismissed any complaints covering the period from February 2015 to May 2016. TheOn August 9, 2022, the U.S. Court of Appeals for the District of Columbia Circuit vacated the FERC order citing a lack of reasoned explanation by FERC in its adoption of its revised ROE methodology as outlined in its November 2020 opinionorder. The U.S. Court of Appeals remanded the matter to FERC to reopen the proceedings.
Significant uncertainty exists as to how FERC will proceed on remand and there is subject to judicial review.no prescribed timeline under which FERC must act. We have deferred recognition and recorded a refund liability of $3.4$2.8 million as of December 31, 2020.2023. This refund liability reflects our best estimate of amounts previously collected from customers under the MISO tariff rate that may be required refundsto be refunded to customers once all regulatory and judicial proceedings are finalized.complete and a final ROE is established for the periods outlined above.
Regional Haze Rule (RHR):. The RHR was adopted in an effort to improve visibility in national parks and wilderness areas. The RHR requires states, in coordination with the EPA and other governmental agencies, to develop and implement plans to achieve natural visibility conditions. The second RHR implementation period covers the years of 2018 and 2028, with2018-2028. States are required to submit a state implementation plansplan (SIP) to be submitted toassess reasonable progress with the EPA by July 31, 2021.RHR and determine what additional emission reductions are appropriate, if any.
Coyote Station, OTP's jointly-ownedjointly owned coal-fired power plant in North Dakota, is subject to assessment in the second implementation period under the North Dakota state implementationSIP. The NDDEQ submitted its SIP to the EPA for approval in August 2022. In its plan, of the second assessment period ofNDDEQ concluded it is not reasonable to require additional emission controls during this planning period. The EPA has previously expressed disagreement with the RHR. NDDEQ's recommendation to forgo additional emission controls and has indicated that such a plan is not likely to be accepted.
We cannot predict with certainty the impact the state implementation planSIP may have on our business until the plan is finalized and adopted.SIP has been approved or otherwise acted on by the EPA. However, significant emission control investments could be required and the recovery of such costs from customers would require regulatory approval. Alternatively, investments in emission control equipment may prove to be uneconomic and result in a requiredthe early retirement of, or the sale of our interest in Coyote Station.Station, subject to regulatory approval. We cannot estimate the ultimate financial effects such a retirement or sale may have on our consolidated operating results, financial position or cash flows, but such amounts could be material and the recovery of such costs from customersin rates would be subject to regulatory approval.
Self-Funding of Transmission Upgrades. The FERChas granted transmission owners within MISO the unilateral authority to determine the funding mechanism for interconnection transmission upgrades that are necessary to accommodate new generation facilities connecting to the electrical grid. Under existing FERC orders, transmission owners can unilaterally determine whether the generator pays the transmission owner in advance for the transmission upgrade or, alternatively, the transmission owner can elect to fund the upgrade and recover over time from the generator the cost of and a return on the upgrade investment (a self-funding). FERC’s orders granting transmission owners this unilateral funding authority has been judicially contested on the basis that transmission owners may be motivated to discriminate among generators in making
funding determinations. In the most recent judicial hearing, the petitioners argued to the U.S. Court of Appeals for the District of Columbia that FERC did not comply with a previous judicial order to fully develop a record regarding the risk of discrimination and the financial risk absorbed by transmission owners for generator-funded upgrades. On December 2, 2022, the Court of Appeals ruled in favor of the petitioners remanding the matter to FERC, instructing the agency to adequately explain the basis of its orders. The Court of Appeals decision did not vacate transmission owners’ unilateral funding authority.
OTP, as a transmission owner in MISO, has exercised its authority and elected to self-fund previous transmission upgrades necessary to accommodate new system generation. Under such an election, OTP is recovering the cost of the transmission upgrade and a return on that investment from the generator over a contractual period of time. Should FERC, on remand from the Court of Appeals, eliminate transmission owners’ unilateral funding authority, on either a prospective or retrospective basis, our financial results would be impacted. We cannot at this time reasonably predict the outcome of this matter given the uncertainty as to how and when FERC may respond to the judicial remand.
Other Contingencies:Contingencies. We are party to litigation and regulatory enforcement matters arising in the normal course of business. We regularly analyze relevant information and, as necessary, estimate and record accrued liabilities for matters in which a loss is probable of occurring and can be reasonably estimated. We believe the effect on our consolidated operating results, financial position and cash flows, if any, for the disposition of all matters pending as of December 31, 2020, other than those relating to the RHR,2023 will not be material.
14. Stockholders' Equity
Capital Structure
In addition to authorized and outstanding common shares,stock, the Company has 1.5 million1,500,000 authorized no par value cumulatedcumulative preferred shares and 1.0 million1,000,000 authorized no par value cumulative preference shares. NaNNo cumulative preferred or cumulative preference shares were outstanding at December 31, 20202023 or 2019.2022.
Shelf Registrations
On May 3, 20182021, upon the expiration of a prior shelf registration, we filed a shelf registration statement with the Securities and Exchange Commission (SEC)SEC under which the Companywe may offer for sale, from time to time, either separately or together in any combination, equity, debt or other securities described in the shelf registration statement. The registration statement which expires onin May 3, 2021.
On November 8, 2019, we entered into a Distribution Agreement with KeyBanc Capital Markets Inc.(KeyBanc). Pursuant2024. No shares were issued pursuant to the terms of the Distribution Agreement, we may offer and sell our common shares from time to time under an At-the-Market offering program through KeyBanc, as the distribution agent, for the offer and sale of the shares up to an aggregate sales price of $75.0 million. In 2020, we received net proceeds of $37.0 million, net of commissions paid to KeyBank of $0.5 million from the issuance of 868,484 shares under this program. In total from inception of the program through December 31, 2020, we have received proceeds of $54.4 million from the issuance of shares under this program.shelf registration in 2023.
On May 3, 2018,2021, upon the expiration of a prior shelf registration, we filed a second shelf registration statement with the SEC for the issuance of up to 1,500,000 common shares under an Automatic Dividend Reinvestment and Share Purchase Plan, (the Plan), which permitsprovides shareholders, retail customers of OTP and other interested investors a method of purchasing our common shares by reinvesting their dividends and/or making optional cash investments. Shares purchased by participants inunder the Plan toplan may be either new issue common shares or common shares purchased inon the open market. The shelf registration for the Plan expires on May 3, 2021. In 2020,2023, we received proceeds of $13.4 million from the sale of 320,173issued 105,663 common shares under this program.program and no proceeds were received, as all shares issued were purchased on the open market. As of December 31, 2020, 899,8592023, 1,145,330 shares remainremained available for purchase or issuance under the Plan.plan. The shelf registration for the plan expires in May 2024.
Dividend Restrictions
Otter Tail CorporationOTC is a holding company with no significant operations of its own. The primary source of funds for payments of dividends to our shareholders is from dividends paid orintercompany distributions made by our subsidiaries.OTC's subsidiaries to OTC. As a result of certain statutory limitations or regulatory or financing agreements, restrictions could occur on the amount of distributions allowed to be made by ourOTC's subsidiaries. Both the OTC Credit Agreement and OTP Credit Agreement contain restrictions on the payment of cash dividends upon a default or event of default, including failure to maintain certain financial covenants. As of December 31, 2020,2023, we were in compliance with these financial covenants.
Under the Federal Power Act, a public utility may not pay dividends from any funds properly included in a capital account. What constitutes “funds properly included in a capital account” is undefined in the Federal Power Act orand the related regulations; however, the FERC has consistently interpreted the provision to allow dividends to be paid as long as i) the source of the dividends is clearly disclosed, ii) the dividend is not excessive and iii) there is no self-dealing on the part of corporate officials.
The MPUC indirectly limits the amount of dividends OTP can pay to the CompanyOTC by requiring an equity-to-total-capitalization ratio between 47.5%48.3% and 58.1%59.1%, with total capitalization not to exceed $2.0 billion based on OTP’s 2020 capital structure petition effective by orderrequirements as of the MPUC on July 15, 2020.December 31, 2023. As of December 31, 2020,2023, OTP’s equity-to-total-capitalization ratio including short-term debt was 53.7%54.2% and its net assets restricted from distribution totaled approximately $634$771.3 million. Under
15. Accumulated Other Comprehensive Income (Loss)
The Company's other comprehensive income (loss) consists of unamortized actuarial losses and prior service costs related to pension and other postretirement benefits and unrealized gains and losses on marketable securities classified as available-for-sale. The income tax expense or benefit associated with amounts reclassified from accumulated other comprehensive income (loss) and reflected in the 2020 capital structure petition, total capitalizationconsolidated statement of income are recognized in the same period as the amounts are reclassified.
The following table shows the changes in accumulated other comprehensive Income (loss) for OTP cannot exceed $1.7 billion.the years ended December 31, 2023, 2022 and 2021:
| | | | | | | | | | | | | | | | | |
| (in thousands) | Pension and Other Postretirement Benefits | | Net Unrealized Gain (Losses) on Available-for-Sale Securities | | Total |
| | | | | |
| Balance, December 31, 2020 | $ | (8,716) | | | $ | 209 | | | $ | (8,507) | |
| Other Comprehensive Income (Loss) Before Reclassifications, net of tax | 1,638 | | | (132) | | | 1,506 | |
| Amounts Reclassified from Accumulated Other Comprehensive Income (Loss) | 541 | | (1) | (64) | | (2) | 477 | |
| Total Other Comprehensive Income (Loss) | 2,179 | | | (196) | | | 1,983 | |
| Balance, December 31, 2021 | (6,537) | | | 13 | | | (6,524) | |
| Other Comprehensive Income (Loss) Before Reclassifications, net of tax | 7,331 | | | (433) | | | 6,898 | |
| Amounts Reclassified from Accumulated Other Comprehensive Income (Loss) | 540 | | (1) | 1 | | (2) | 541 | |
| Total Other Comprehensive Income (Loss) | 7,871 | | | (432) | | | 7,439 | |
| Balance, December 31, 2022 | 1,334 | | | (419) | | | 915 | |
| Other Comprehensive Income Before Reclassifications, net of tax | 59 | | | 180 | | | 239 | |
| Amounts Reclassified from Accumulated Other Comprehensive Income (Loss) | (18) | | (1) | 12 | | (2) | (6) | |
| Total Other Comprehensive Income | 41 | | | 192 | | | 233 | |
| Balance, December 31, 2023 | $ | 1,375 | | | $ | (227) | | | $ | 1,148 | |
(1) Included in the computation of net periodic pension and other postretirement benefit costs. See Note 10 for further information. |
(2) Included in other income (expense), net on the accompanying consolidated statements of income. |
15.16. Share-Based Payments
Employee Stock Purchase Plan
The 1999 Employee Stock Purchase Plan authorizes the issuance of 1,400,000 common shares, allowing eligible employees to purchase our common shares through payroll withholding at a discount of up to 15% off the market price at the end of each six-month purchase period. ForEmployee withholding amounts may not be less than $10 or more than $2,000 per month, subject to certain limitations, as described in the plan. A plan participant may cease making payroll deductions at any time. A participant may not purchase periods between January 1, 2018more than 2,000 shares in a given six month purchase period under the plan and June 30, 2019,may not purchase more than $25,000 (fair market value) of common shares under the plan and all other purchase price was 100%plans (if any) in a calendar year. A participant may withdraw from the plan at any time and elect to receive the balance of their contributions to the market price atplan that have not yet been used to purchase shares. Shares purchased under the endplan are automatically enrolled in the Company's dividend reinvestment plan. Shares purchased under the plan may not be assigned, transferred, pledged, or otherwise disposed, except for certain situations allowed by the plan, such as upon death, for a period of each six-month purchase period. For purchase periods beginning18 months after June 30, 2019, the purchase price is 85% of the market price at the end of each six-month purchase period.purchase. At our discretion, shares purchased under the plan can be either new issue shares or shares purchased in the open market. AsThe plan shall automatically terminate when all of December 31, 2020, 318,101the shares were available for purchaseauthorized under the plan.plan have been issued.
We recognize the 15% discount to the fair market value of the purchased shares as stock-based compensation expense, which amounted to$0.2 $0.3 million, $0.3 million and $0.1$0.2 million for the years ended December 31, 20202023, 2022 and 2019. NaN expense was recognized during2021. For the yearyears ended December 31, 2018.2023, 2022 and 2021 the amount of shares issued under the plan amounted to 26,348, 26,420 and 27,975 shares. As of December 31, 2023, there were 237,367 shares available for purchase under the plan.
Share-Based Compensation Plan
The 20142023 Stock Incentive Plan, which was approved by our shareholders in April 2014,2023, authorizes the issuance of 1,900,000979,891 common shares, including 500,000 newly requested common shares, for the granting of stock options, stock appreciation rights, restricted stock, restricted stock units, dividend equivalents, performance awards and other stock and stock-based awards. In addition, common shares subject to any outstanding awards under our prior stock incentive plans that are forfeited, canceled or reacquired by the Company will become available for re-issuance under the 2023 Stock Incentive Plan. As of December 31, 2020, 897,7982023, 943,192 shares were available for issuance under the plan. The plan terminates on December 31, 2023.April 17, 2033.
We grant restricted stock awards to our employees and members of our Board of Directors and stock performance awards to our executive officers and certain other key employees as part of our long-term compensation and retention program. Stock-based compensation cost, recognized within operating expenses in the consolidated statements of income, amounted to $6.1$7.4 million, $5.9$6.6 million and $4.4$6.7 million for the years ended December 31, 2020, 20192023, 2022 and 2018.2021. The related income tax benefit recognized for these periods amounted to $2.1$1.6 million, $2.3$1.7 million and $1.9$1.8 million.
Restricted Stock Awards. Restricted stock awards are granted to executive officers and other key employees and members of the Company's Board of Directors. The awards vest, depending on award recipient, either ratably over a period of three to four years or cliff vest after four years. Vesting is accelerated in certain circumstances, including upon retirement. Awards granted to members of the Board of Directors are deemed issued and outstanding upon grant and carry the same voting and dividend rights of unrestricted outstanding common stock. Awards granted to executive officers and other key employees are eligible to receive dividend equivalent payments during the vesting period, subject to forfeiture under the terms of the agreement, but such awards are not deemed issued or outstanding upon grant and do not provide for voting rights.
The grant dategrant-date fair value of each restricted stock award is determined based on the market price of the Company's common stock on the date of grant adjusted to exclude the value of dividends for those awards that do not receive dividend or dividend equivalent payments during the vesting period.
The following is a summary of restricted stock award activity for the year ended December 31, 2020:
| | | | | | | | | | | |
| Shares | | Weighted Average
Grant-Date
Fair Value |
| | | |
| Nonvested, Beginning of Year | 133,847 | | | $ | 39.70 | |
| Granted | 56,500 | | | 45.97 | |
| Vested | (57,773) | | | 35.49 | |
| Forfeited | (3,910) | | | 41.12 | |
| Nonvested, End of Year | 128,664 | | | $ | 44.30 | |
| | | | | | | | | | | |
| Shares | | Weighted-Average
Grant-Date
Fair Value |
| | | |
| Nonvested, Beginning of Year | 141,551 | | | $ | 49.83 | |
| Granted | 55,205 | | | 68.03 | |
| Vested | (45,493) | | | 50.02 | |
| Forfeited | (2,350) | | | 52.02 | |
| Nonvested, End of Year | 148,913 | | | $ | 56.48 | |
The weighted-average grant dategrant-date fair value of granted awards was $45.97, $48.18$68.03, $59.95 and $41.39$43.55 during the years ended December 31, 2020, 20192023, 2022 and 2018.2021. The fair value of vested awards was $2.8$3.1 million, $2.4$3.0 million and $2.2$2.1 million during the years ended December 31, 2020, 20192023, 2022 and 2018.2021. As of December 31, 2020,2023, there was $2.4$3.4 million of unrecognized compensation costscost for nonvestedunvested restricted stock awards to be recognized over a weighted-average period of 1.811.7 years.
Stock Performance Awards. Stock performance awards are granted to executive officers and certain other key employees. The awards vest at the end of a three-year performance period. The number of common shares awarded, if any, at the end of the performance period ranges from 0zero to 150% of the target amount based on two performance measures: i) total shareholder return relative to a peer group (TSR component) and ii) return on equity.equity (ROE component). The awards have no voting or dividend rights during the vesting period. Vesting of the awards is accelerated in certain circumstances, including onupon retirement. The amount of common shares awarded on an accelerated vesting is based either on actual performance at the end of the performance period or the amount of common shares earned at target.period.
The grant dategrant-date fair value of the ROE component of the stock performance awards granted during the years ended December 31, 2020, 20192023, 2022 and 20182021 was determined using the grant date stock price and a discounted cash flow analysis to adjust for expected unearned dividends during the vesting period. The grant-date fair value of the TSR component of the stock performance awards granted during the years ended December 31, 2023, 2022 and 2021 was determined using a Monte Carlo fair value simulation model incorporating the following assumptions:
| | 2023 | | | 2023 | | 2022 | | 2021 |
| | 2020 | | 2019 | | 2018 |
| | Risk-free interest rate | |
| Risk-free interest rate | |
| Risk-free interest rate | Risk-free interest rate | 1.42 | % | | 2.52 | % | | 2.23 | % | 4.15 | % | | 1.52 | % | | 0.18 | % |
| Expected term (in years) | Expected term (in years) | 3.00 | | 3.00 | | 3.00 | Expected term (in years) | 3.00 | | 3.00 |
| Expected volatility | Expected volatility | 19.00 | % | | 21.00 | % | | 22.00 | % | Expected volatility | 34.00 | % | | 32.00 | % | | 32.00 | % |
| Dividend yield | Dividend yield | 2.80 | % | | 3.00 | % | | 3.20 | % | Dividend yield | 2.50 | % | | 2.90 | % | | 3.60 | % |
|
The risk-free interest rate was derived from yields on U.S. government bonds of a similar term. The expected term of the award is equal to the three-year performance period. Expected volatility was estimated based on actual historical volatility of our common stock over a three-yearfive-year period. Dividend yield was estimated based on historic and future yield estimates.
The following is a summary of stock performance award activity for the year ended December 31, 20202023 (share amounts reflect awards at target):
| | | | Shares | | Weighted Average
Grant-Date
Fair Value | | Shares | | Weighted-Average
Grant-Date
Fair Value |
| | Nonvested, Beginning of Year | |
| Nonvested, Beginning of Year | |
| Nonvested, Beginning of Year | Nonvested, Beginning of Year | 161,000 | | | $ | 36.57 | |
| Granted | Granted | 55,000 | | | 47.79 | |
| Vested | Vested | (52,000) | | | 30.25 | |
| Forfeited | Forfeited | 0 | | | 0 | |
| Nonvested, End of Year | Nonvested, End of Year | 164,000 | | | $ | 42.32 | |
The weighted-average grant dategrant-date fair value of granted awards was $47.79, $42.87$61.97, $54.91 and $35.73$38.34 during the years ended December 31, 2020, 20192023, 2022 and 2018.2021. The fair value of vested awards was $3.4$5.3 million, $6.1$5.1 million and $4.7$2.5 million during the years ended December 31, 2020, 20192023, 2022 and 2018.
2021. As of December 31, 2020,2023, there was $0.8$0.4 million of unrecognized compensation costscost of nonvestedunvested stock performance awards to be recognized over a weighted-average period of 0.570.67 years.
16.17. Earnings Per Share
The numerator used in the calculation of both basic and diluted earnings per common share is net income. The denominator used in the calculation of basic earnings per common share is the weighted averageweighted-average number of common shares outstanding during the period. The denominator used in the calculation of diluted earnings per common share is derived by adjusting basic shares outstanding for the dilutive effect of potential common shares outstanding, which consist of shares associated with time and performance based stock awards and our employee stock purchase plan shares.plan.
The following includes the computation of the denominator for basic and diluted weighted-average shares outstanding for the years ended December 31, 2020, 20192023, 2022 and 2018:2021:
| | (in thousands) | (in thousands) | 2020 | | 2019 | | 2018 | (in thousands) | 2023 | | 2022 | | 2021 |
| | Weighted Average Common Shares Outstanding – Basic | Weighted Average Common Shares Outstanding – Basic | 40,710 | | | 39,721 | | | 39,600 | |
| Weighted Average Common Shares Outstanding – Basic | |
| Weighted Average Common Shares Outstanding – Basic | |
| Effect of Dilutive Securities: | Effect of Dilutive Securities: | |
| Stock Performance Awards | |
| Stock Performance Awards | |
| Stock Performance Awards | Stock Performance Awards | 116 | | | 147 | | | 212 | |
| Restricted Stock Awards | Restricted Stock Awards | 63 | | | 81 | | | 78 | |
| Employee Stock Purchase Plan Shares and Other | Employee Stock Purchase Plan Shares and Other | 16 | | | 5 | | | 2 | |
| Dilutive Effect of Potential Common Shares | Dilutive Effect of Potential Common Shares | 195 | | | 233 | | | 292 | |
| Weighted Average Common Shares Outstanding – Diluted | Weighted Average Common Shares Outstanding – Diluted | 40,905 | | | 39,954 | | | 39,892 | |
The amount of shares excluded from diluted weighted-average common shares outstanding because such shares were anti-dilutive was not material for the years ended December 31, 2020, 20192023, 2022 and 2018.2021.
17.18. Derivative Instruments
OTP enters into derivative instruments to manage its exposure to future commodity price variability, specifically future wholesale energy and natural gas prices, and reduce volatility in prices for our retail electric customers. These derivative instruments are not designated as qualifying hedging transactions but provide for an economic hedge against future price variability. The instruments are recorded at fair value on the consolidated balance sheets, with changes in fair value recorded in the consolidated statements of income. However, in accordance with rate-making and cost recovery processes, we recognize a regulatory asset or liability to defer losses or gains from derivative activity until settlement of the associated derivative instrument.
As of December 31, 2023 and 2022 OTP had outstanding pay-fixed, receive-variable swap agreements with an aggregate notional amount of 187,400 and 295,000 megawatt-hours of electricity. The contracts outstanding as of December 31, 2023 had various settlement dates throughout 2024. As of December 31, 2023 and 2022, the fair value of these derivative instruments was $4.2 million and $7.1 million, which are included in other current liabilities on the consolidated balance sheets. During the years ended December 31, 2023 and 2022, contracts matured and were settled in an aggregate amount of a $16.5 million loss and a $1.0 million gain, respectively. Gains and losses recognized on the settlement of derivative instruments are returned to, or recovered from, our electric customers through fuel recovery mechanisms in each state. When recognized in the statement of income, these gains or losses are included in electric purchased power.
19. Fair Value Measurements
The following tables present our assets measured at fair value on a recurring basis as of December 31, 20202023 and 20192022 classified by the input method used to measure fair value: | | (in thousands) | Level 1 | | Level 2 | | Level 3 |
| Level 1 | | | Level 1 | | Level 2 | | Level 3 |
| December 31, 2023 | |
| | December 31, 2020 | |
| Assets | |
| | Assets | |
| | Assets | |
| Investments: | |
| Investments: | |
| Investments: | Investments: | |
| Money Market Funds | Money Market Funds | $ | 4,075 | | | $ | 0 | | | $ | 0 | |
| Marketable Equity Securities | 1,662 | | | 0 | | | 0 | |
| Money Market Funds | |
| Money Market Funds | |
| Mutual Funds | |
| Corporate Debt Securities | Corporate Debt Securities | 0 | | | 2,627 | | | 0 | |
| Government-Backed and Government-Sponsored Enterprises’ Debt Securities | 0 | | | 6,633 | | | 0 | |
| Government Debt Securities | |
| | Total Assets | Total Assets | $ | 5,737 | | | $ | 9,260 | | | $ | 0 | |
| December 31, 2019 | |
| Total Assets | |
| Total Assets | |
| Liabilities | |
| Derivative Instruments | |
| Derivative Instruments | |
| Derivative Instruments | |
| Total Liabilities | |
| | December 31, 2022 | |
| December 31, 2022 | |
| December 31, 2022 | |
| | Assets | |
| | Assets | |
| | Assets | |
| Investments: | |
| Investments: | |
| Investments: | Investments: | |
| Money Market Funds | Money Market Funds | $ | 2,363 | | | $ | 0 | | | $ | 0 | |
| Marketable Equity Securities | 1,586 | | | 0 | | | 0 | |
| Money Market Funds | |
| Money Market Funds | |
| Mutual Funds | |
| Corporate Debt Securities | Corporate Debt Securities | 0 | | | 2,124 | | | 0 | |
| Government-Backed and Government-Sponsored Enterprises’ Debt Securities | 0 | | | 6,060 | | | 0 | |
| Government Debt Securities | |
| Total Assets | Total Assets | $ | 3,949 | | | $ | 8,184 | | | $ | 0 | |
| Liabilities | |
| Derivative Instruments | |
| Derivative Instruments | |
| Derivative Instruments | |
| Total Liabilities | |
The level 2 fair value measurements for Government-Backedgovernment and Government-Sponsored Enterprises’ and Corporate Debt Securitiescorporate debt securities are determined on the basis of valuations provided by a third-party pricing service which utilizes industry accepted valuation models and observable market inputs to determine valuation. Some valuations or model inputs used by the pricing service may be based on broker quotes.
The level 2 fair value measurements for derivative instruments are determined by using inputs such as forward electric commodity prices, adjusted for location differences. These inputs are observable in the marketplace throughout the full term of the instrument, can be derived from observable data, or are supported by observable levels at which transactions are executed in the marketplace.
In addition to assets recorded at fair value on a recurring basis, we also hold financial instruments that are not recorded at fair value in the consolidated balance sheets but for which disclosure of the fair value of these financial instruments is provided. The following reflects the carrying value and estimated fair value of these assets and (liabilities)liabilities as of December 31, 20202023 and 2019:2022:
| | | | | | | | | | | | | | | | | | | | | | | |
| | December 31, 2020 | | December 31, 2019 |
| (in thousands) | Carrying
Amount | | Fair Value | | Carrying
Amount | | Fair Value |
| | | | | | | |
| Cash and Cash Equivalents | $ | 1,163 | | | $ | 1,163 | | | $ | 21,199 | | | $ | 21,199 | |
| Short-Term Debt | (80,997) | | | (80,997) | | | (6,000) | | | (6,000) | |
| Long-Term Debt | (764,519) | | | (858,455) | | | (689,764) | | | (742,279) | |
| | | | | | | |
| | | | | | | | | | | | | | | | | | | | | | | |
| | December 31, 2023 | | December 31, 2022 |
| (in thousands) | Carrying
Amount | | Fair Value | | Carrying
Amount | | Fair Value |
| | | | | | | |
| Assets: | | | | | | | |
| Cash and Cash Equivalents | $ | 230,373 | | | $ | 230,373 | | | $ | 118,996 | | | $ | 118,996 | |
| Total | 230,373 | | | 230,373 | | | 118,996 | | | 118,996 | |
| Liabilities: | | | | | | | |
| Short-Term Debt | 81,422 | | | 81,422 | | | 8,204 | | | 8,204 | |
| Long-Term Debt | 824,059 | | | 710,839 | | | 823,821 | | | 681,615 | |
| Total | $ | 905,481 | | | $ | 792,261 | | | $ | 832,025 | | | $ | 689,819 | |
| | | | | | | |
The following methods and assumptions were used to estimate the fair value of each class of financial instruments for which it is practicable to estimate that value:instruments:
Cash Equivalents: The carrying amount approximates fair value because of the short-term maturity of thosethese instruments.
Short-Term Debt: The carrying amount approximates fair value because the debt obligations are short-term in nature and the balances outstanding are subject to variable rates of interest which reset frequently, a Level 2 fair value input.
Long-Term Debt: The fair value of long-term debt is estimated based on current market indications for borrowings of similar maturities with similar terms, a Level 2 fair value input.
| | | | | |
| ITEM 9. | CHANGES IN AND DISAGREEMENTS WITH ACCOUNTANTS ON ACCOUNTING AND FINANCIAL DISCLOSURE |
None.
| | | | | |
| ITEM 9A. | CONTROLS AND PROCEDURES |
Evaluation of Disclosures Controls and Procedures. Under the supervision and with the participation of the Company’s management, including the Chief Executive Officer and the Chief Financial Officer, the Company evaluated the effectiveness of the design and operation of its disclosure controls and procedures (as defined in Rule 13a-15(e) under the Securities Exchange Act of 1934 (the Exchange Act)) as of December 31, 2020,2023, the end of the period covered by this report. Based on that evaluation, the Chief Executive Officer and Chief Financial Officer concluded that the Company’s disclosure controls and procedures were effective as of December 31, 2020.2023.
Changes in Internal Control over Financial Reporting. There were no changes in the Company’s internal control over financial reporting (as defined in Rules 13a-15(f) under the Exchange Act) during the fourth quarter ended December 31, 20202023 that have materially affected, or are reasonably likely to materially affect, the Company’s internal control over financial reporting.
Management’s Report Regarding Internal Control Over Financial Reporting. Management is responsible for the preparation and integrity of the consolidated financial statements and representations in this report on Form 10-K. The consolidated financial statements of the Company have been prepared in conformity with generally accepted accounting principles applied on a consistent basis and include some amounts that are based on informed judgments and best estimates and assumptions of management.
In order to assure the consolidated financial statements are prepared in conformance with generally accepted accounting principles, management is responsible for establishing and maintaining adequate internal control over financial reporting, as such term is defined in Exchange Act Rule 13a-15(f). These internal controls are designed only to provide reasonable assurance, on a cost-effective basis, that transactions are carried out in accordance with management’s authorizations and assets are safeguarded against loss from unauthorized use or disposition.
Management has completed its assessment of the effectiveness of the Company’s internal control over financial reporting as of December 31, 2020.2023. In making this assessment, management used the criteria set forth by the Committee of Sponsoring Organizations of the Treadway Commission in Internal Control - Integrated Framework (2013) to conduct the required assessment of the effectiveness of the Company’s internal control over financial reporting. Based on this assessment, management concluded that, as of December 31, 2020,2023, the Company’s internal control over financial reporting was effective based on those criteria. The Company’s independent registered public accounting firm, Deloitte & Touche LLP, has audited the Company’s consolidated financial statements included in this report on Form 10-K and issued an attestation report on the Company’s internal control over financial reporting.
Attestation Report of Independent Registered Public Accounting Firm. The attestation report of Deloitte & Touche LLP, the Company’s independent registered public accounting firm, regarding the Company’s internal control over financial reporting is provided in Item 8 of this report on Form 10-K.
| | | | | |
| ITEM 9B. | OTHER INFORMATION |
None.
| | | | | |
| ITEM 9C. | DISCLOSURE REGARDING FOREIGN JURISDICTIONS THAT PREVENT INSPECTIONS |
Not applicable.
PART III
| | | | | |
| ITEM 10. | DIRECTORS, EXECUTIVE OFFICERS AND CORPORATE GOVERNANCE |
The information required by this Item regarding Directors is incorporated by reference to the information under “Election of Directors” in the Company's definitive Proxy Statement for the 20212024 Annual Meeting. The information regarding executive officers and family relationships is set forth in Item 3A of this report on Form 10-K. The information required by this Item regarding the Company’s procedures for recommending nominees to the board of directors is incorporated by reference to the information under “Corporate Governance – Director Nomination Process” in the Company’s definitive Proxy Statement for the 20212024 Annual Meeting. The information required by this Item regarding the Audit Committee and the Company’s Audit Committee financial experts is incorporated by reference to the information under “Committees of the Board of Directors – Audit Committee” in the Company’s definitive Proxy Statement for the 20212024 Annual Meeting.
The Company has adopted a code of conductbusiness ethics that applies to all of its directors, officers (including its principal executive officer, principal financial officer, and its principal accounting officer or controller or person performing similar functions) and employees. The Company’s code of conductbusiness ethics is available on its website at www.ottertail.com. The Company intends to satisfy the disclosure requirements under Item 5.05 of Form 8-K regarding an amendment to, or waiver from, a provision of its code of conductbusiness ethics by posting such information on its website at the address specified above. Information on the Company’s website is not deemed to be incorporated by reference into this report on Form 10-K.
| | | | | |
| ITEM 11. | EXECUTIVE COMPENSATION |
The information required by this Item is incorporated by reference to the information under “Compensation Discussion and Analysis,”Analysis”, “Report of Compensation Committee,”and Human Capital Management Committee”, “Executive Compensation,”Compensation”, “Pay Ratio Disclosure” and “Director Compensation” in the Company's definitive Proxy Statement for the 20212024 Annual Meeting.
| | | | | |
| ITEM 12. | SECURITY OWNERSHIP OF CERTAIN BENEFICIAL OWNERS AND MANAGEMENT AND RELATED STOCKHOLDER MATTERS |
The information required by this Item regarding security ownership is incorporated by reference to the information under “Security Ownership of Certain Beneficial Owners” in the Company’s definitive Proxy Statement for the 20212024 Annual Meeting.
EQUITY COMPENSATION PLAN INFORMATION
The following table sets forth information as of December 31, 20202023 about the Company’s common stock that may be issued under all its equity compensation plans: | | | | Number of securities
to be issued upon
exercise of
outstanding options,
warrants and rights | | | Weighted average
exercise price of
outstanding
options, warrants
and rights | | Number of securities remaining
available for future issuance under
equity compensation plans
(excluding securities reflected in
column (a)) | | | Number of securities
to be issued upon
exercise of
outstanding options,
warrants and rights | | | Weighted average
exercise price of
outstanding
options, warrants
and rights | | Number of securities remaining
available for future issuance under
equity compensation plans
(excluding securities reflected in
column (a)) | |
| Plan Category | Plan Category | (a) | | | (b) | | (c) | | Plan Category | (a) | | | (b) | | (c) | |
| | Equity compensation plans approved by security holders: | Equity compensation plans approved by security holders: | | | | | | |
| 2014 Stock Incentive Plan | 314,151 | | (1) | | $ | 0.00 | | | 897,798 | | (2) |
| 1999 Stock Incentive Plan | 541 | | (3) | | $ | 0.00 | | | — | | (4) |
| Equity compensation plans approved by security holders: | |
| Equity compensation plans approved by security holders: | | | | |
| 2023 Stock Incentive Plan | | 2023 Stock Incentive Plan | 409,880 | | (1) | | N/A | | 943,192 | | (2) |
| 1999 Employee Stock Purchase Plan | 1999 Employee Stock Purchase Plan | | | | N/A | | 318,101 | | (5) | 1999 Employee Stock Purchase Plan | — | | | | | N/A | | 237,367 | | (3) | (3) |
| Equity compensation plans not approved by security holders | Equity compensation plans not approved by security holders | — | | | | — | | | — | | | Equity compensation plans not approved by security holders | — | | | | | — | | | — | | — | | | |
| Total | Total | 314,692 | | | | $ | 0.00 | | | 1,215,899 | | | Total | 409,880 | | | | | — | | | 1,180,559 | | 1,180,559 | | | |
(1)Includes 82,500, 83,400,89,100, 83,700 and 59,477118,500 performance-based share awards, assuming a maximum payout, granted in 2020, 20192023, 2022 and 2018,2021, respectively, 90,885and 118,580 restricted stock units outstanding as of December 31, 2020, and 718 stock units as part of the director deferred compensation program and excludes 37,776 shares of restricted stock issued under the 2014 Stock Incentive Plan.2023.
(2)The 20142023 Stock Incentive Plan provides for the issuance of any shares available under the plan in the form of restricted stock, restricted stock units, performance awards and other types of stock-based awards, in addition to the granting of options, warrants or stock appreciation rights.
(3)Director deferred compensation program stock units under the 1999 Stock Incentive Plan.
(4)The 1999 Stock Incentive Plan provided for the issuance of any shares available under the plan in the form of restricted stock, restricted stock units, performance awards and other types of stock-based awards, in addition to the granting of options, warrants or stock appreciation rights. The 1999 Stock Incentive Plan expired by its terms on December 13, 2013 and no more awards may be granted thereunder.
(5)Shares to be issued based on employee’s election to participate in the plan.
| | | | | |
| ITEM 13. | CERTAIN RELATIONSHIPS AND RELATED TRANSACTIONS, AND DIRECTOR INDEPENDENCE |
The information required by this Item is incorporated by reference to the information under “Policy and Procedures Regarding Transactions with Related Persons,”Persons”, “Election of Directors” and “Committees of the Board of Directors” in the Company’s definitive Proxy Statement for the 20212024 Annual Meeting.
| | | | | |
| ITEM 14. | PRINCIPAL ACCOUNTANT FEES AND SERVICES |
The information required by this Item is incorporated by reference to the information under “Ratification of Independent Registered Public Accounting Firm – Fees” and “Ratification of Independent Registered Public Accounting Firm – Pre-Approval of Audit/Non-Audit Services Policy” in the Company’s definitive Proxy Statement for the 20212024 Annual Meeting.
PART IV
| | | | | |
| ITEM 15. | EXHIBITS AND FINANCIAL STATEMENT SCHEDULES |
1. Financial Statements | | | | | |
| | Page |
| |
| Consolidated Balance Sheets | |
| Consolidated Statements of Income | |
| |
| |
| |
| |
2. Financial Statement Schedules
Schedule I - Condensed Financial Information of Registrant
Schedule II - Valuation and Qualifying Accounts and Reserves
SCHEDULE I - CONDENSED FINANCIAL INFORMATION OF REGISTRANT
OTTER TAIL CORPORATION (PARENT COMPANY)
CONDENSED BALANCE SHEETS
| | December 31, |
| December 31, | | | December 31, |
| (in thousands) | (in thousands) | 2020 | | 2019 | (in thousands) | 2023 | | 2022 |
| | Assets | Assets | |
| Assets | |
| Assets | |
| Current Assets | |
| Current Assets | |
| Current Assets | Current Assets | |
| Cash and Cash Equivalents | Cash and Cash Equivalents | $ | 0 | | | $ | 4,959 | |
| Accounts Receivable | 148 | | | 0 | |
| Cash and Cash Equivalents | |
| Cash and Cash Equivalents | |
| | Accounts Receivable from Subsidiaries | |
| Accounts Receivable from Subsidiaries | |
| Accounts Receivable from Subsidiaries | Accounts Receivable from Subsidiaries | 2,734 | | | 2,144 | |
| Interest Receivable from Subsidiaries | Interest Receivable from Subsidiaries | 117 | | | 117 | |
| | Other | |
| Other | |
| Other | Other | 1,063 | | | 2,537 | |
| Total Current Assets | Total Current Assets | 4,062 | | | 9,757 | |
| Investments in Subsidiaries | Investments in Subsidiaries | 1,061,009 | | | 860,646 | |
| Notes Receivable from Subsidiaries | Notes Receivable from Subsidiaries | 79,069 | | | 79,251 | |
| Deferred Income Taxes | Deferred Income Taxes | 28,793 | | | 25,505 | |
| Other Assets | Other Assets | 40,848 | | | 36,140 | |
| Total Assets | Total Assets | $ | 1,213,781 | | | $ | 1,011,299 | |
| | Liabilities and Stockholders' Equity | Liabilities and Stockholders' Equity | |
| Liabilities and Stockholders' Equity | |
| Liabilities and Stockholders' Equity | |
| Current Liabilities | Current Liabilities | |
| Short-Term Debt | $ | 65,166 | | | $ | 6,000 | |
| Current Maturities of Long-Term Debt | 169 | | | 183 | |
| Current Liabilities | |
| Current Liabilities | |
| | Accounts Payable to Subsidiaries | |
| | Accounts Payable to Subsidiaries | |
| | Accounts Payable to Subsidiaries | Accounts Payable to Subsidiaries | 7 | | | 7 | |
| Notes Payable to Subsidiaries | Notes Payable to Subsidiaries | 134,352 | | | 89,611 | |
| Other | Other | 12,931 | | | 9,629 | |
| Total Current Liabilities | Total Current Liabilities | 212,625 | | | 105,430 | |
| Other Noncurrent Liabilities | Other Noncurrent Liabilities | 50,495 | | | 44,575 | |
| Commitments and Contingencies | Commitments and Contingencies | 0 | | 0 | Commitments and Contingencies | | | |
| Capitalization | Capitalization | |
| Long-Term Debt, Net of Current Maturities | 79,695 | | | 79,812 | |
| Common Shareholder Equity | 870,966 | | | 781,482 | |
| Long-Term Debt | |
| Long-Term Debt | |
| Long-Term Debt | |
| Common Stockholders' Equity | |
| Total Capitalization | Total Capitalization | 950,661 | | | 861,294 | |
| Total Liabilities and Stockholders' Equity | Total Liabilities and Stockholders' Equity | $ | 1,213,781 | | | $ | 1,011,299 | |
See accompanying notes to condensed financial statements.
OTTER TAIL CORPORATION (PARENT COMPANY)
CONDENSED STATEMENTS OF INCOME | | Years Ended December 31, |
| Years Ended December 31, | | | Years Ended December 31, |
| (in thousands) | (in thousands) | 2020 | | 2019 | | 2018 | (in thousands) | 2023 | | 2022 | | 2021 |
| | Income | Income | |
| Income | |
| Income | |
| Equity Income in Earnings of Subsidiaries | |
| Equity Income in Earnings of Subsidiaries | |
| Equity Income in Earnings of Subsidiaries | Equity Income in Earnings of Subsidiaries | $ | 106,379 | | | $ | 93,731 | | | $ | 91,446 | |
| Interest Income from Subsidiaries | Interest Income from Subsidiaries | 2,859 | | | 3,063 | | | 2,839 | |
| Other Income | Other Income | 1,317 | | | 1,566 | | | 550 | |
| Total Income | Total Income | 110,555 | | | 98,360 | | | 94,835 | |
| Expense | Expense | |
| Operating Expenses | 14,007 | | | 10,529 | | | 9,916 | |
| Interest Charges | 4,599 | | | 4,863 | | | 4,043 | |
| Interest Charges from Subsidiaries | 136 | | | 306 | | | 387 | |
| Nonelectric Selling, General, and Administrative Expenses | |
| Nonelectric Selling, General, and Administrative Expenses | |
| Nonelectric Selling, General, and Administrative Expenses | |
| Interest Expense | |
| Interest Expense from Subsidiaries | |
| Nonservice Cost Components of Postretirement Benefits | Nonservice Cost Components of Postretirement Benefits | 1,150 | | | 1,297 | | | 1,422 | |
| Total Expense | Total Expense | 19,892 | | | 16,995 | | | 15,768 | |
| Income Before Income Taxes | Income Before Income Taxes | 90,663 | | | 81,365 | | | 79,067 | |
| Income Tax (Benefit) Expense | (5,188) | | | (5,482) | | | (3,278) | |
| Income Tax Benefit | |
| Net Income | Net Income | $ | 95,851 | | | $ | 86,847 | | | $ | 82,345 | |
See accompanying notes to condensed financial statements.
OTTER TAIL CORPORATION (PARENT COMPANY)
CONDENSED STATEMENTS OF CASH FLOWS
| | Years Ended December 31, |
| Years Ended December 31, | | | Years Ended December 31, |
| (in thousands) | (in thousands) | 2020 | | 2019 | | 2018 | (in thousands) | 2023 | | 2022 | | 2021 |
| | Cash Flows from Operating Activities | Cash Flows from Operating Activities | |
| Cash Flows from Operating Activities | |
| Cash Flows from Operating Activities | |
| Net Cash Provided by Operating Activities | |
| Net Cash Provided by Operating Activities | |
| Net Cash Provided by Operating Activities | Net Cash Provided by Operating Activities | $ | 54,027 | | | $ | 52,263 | | | $ | 56,947 | |
| Cash Flows from Investing Activities | Cash Flows from Investing Activities | |
| Investment in Subsidiaries | Investment in Subsidiaries | (150,000) | | | (34,990) | | | (24,764) | |
| Investment in Subsidiaries | |
| Investment in Subsidiaries | |
| Debt Repaid by Subsidiaries | Debt Repaid by Subsidiaries | 182 | | | 1,338 | | | 774 | |
| Cash Used in Investing Activities | (2,419) | | | (257) | | | (623) | |
| Net Cash (Used in) Provided by Investing Activities | (152,237) | | | (33,909) | | | (24,613) | |
| Other, net | |
| Net Cash Used in Investing Activities | |
| Cash Flows from Financing Activities | Cash Flows from Financing Activities | |
| Change in Checks Written in Excess of Cash | 125 | | | (31) | | | 31 | |
| Net Short-Term (Repayments) Borrowings | 59,166 | | | (3,215) | | | 9,215 | |
| Borrowings from (Repayments to) Subsidiaries | 44,741 | | | 28,985 | | | (1,281) | |
| Net (Repayments) Borrowings on Short-Term Debt | |
| Net (Repayments) Borrowings on Short-Term Debt | |
| Net (Repayments) Borrowings on Short-Term Debt | |
| Borrowings from Subsidiaries | |
| Proceeds from Issuance of Common Stock | Proceeds from Issuance of Common Stock | 52,432 | | | 20,338 | | | 0 | |
| Common Stock Issuance Expenses | (648) | | | (577) | | | (108) | |
| Payments for Retirement of Capital Stock | (2,069) | | | (2,730) | | | (3,011) | |
| Short-Term and Long-Term Debt Issuance Expenses | 0 | | | (270) | | | (164) | |
| Payments for Shares Withheld for Employee Tax Obligations | |
| Payments for Retirement of Long-Term Debt | Payments for Retirement of Long-Term Debt | (182) | | | (172) | | | (189) | |
| Dividends Paid | Dividends Paid | (60,314) | | | (55,723) | | | (53,198) | |
| Net Cash Used in Financing Activities | 93,251 | | | (13,395) | | | (48,705) | |
| Other, net | |
| Net Cash Provided by (Used in) Financing Activities | |
| Net Change in Cash and Cash Equivalents | Net Change in Cash and Cash Equivalents | (4,959) | | | 4,959 | | | (16,371) | |
| Cash and Cash Equivalents at Beginning of Period | Cash and Cash Equivalents at Beginning of Period | 4,959 | | | 0 | | | 16,371 | |
| Cash and Cash Equivalents at End of Period | Cash and Cash Equivalents at End of Period | $ | 0 | | | $ | 4,959 | | | $ | 0 | |
See accompanying notes to condensed financial statements.
Otter Tail Corporation (Parent Company)OTTER TAIL CORPORATION (PARENT COMPANY)
NOTES TO CONDENSED FINANCIAL STATEMENTS
Incorporated by Reference
Otter Tail Corporation’sOTC’s consolidated statements of comprehensive income and common shareholders’ equity in Part II, Item 8 are incorporated by reference.
Basis of Presentation
The condensed financial information of Otter Tail CorporationOTC is presented to comply with Rule 12-04 of Regulation S-X. The unconsolidated condensed financial statements do not reflect all of the information and notes normally included with financial statements prepared in accordance with GAAP.generally accepted accounting principles. Therefore, these condensed financial statements should be read with the consolidated financial statements and related notes included in this report on Form 10-K.
Otter Tail Corporation’sOTC’s investments in subsidiaries are presented under the equity method of accounting. Under this method, the assets and liabilities of subsidiaries are not consolidated. The investments in net assets of the subsidiaries are recorded in the balance sheets. The income from operations of the subsidiaries is reported on a net basis as equity income in earnings of subsidiaries.
Related Party Transactions
Outstanding receivables from and payables to ourOTC's subsidiaries as of December 31, 20202023 and 20192022 are as follows:
| | (in thousands) | (in thousands) | Accounts
Receivable | | Interest
Receivable | | Current
Notes
Receivable | | Long-Term
Notes
Receivable | | Accounts
Payable | | Current
Notes
Payable |
| (in thousands) | |
| (in thousands) | | Accounts
Receivable | | Interest
Receivable | | | | Long-Term
Notes
Receivable | | Accounts
Payable | | Current
Notes
Payable |
| | December 31, 2020 | |
| December 31, 2023 | |
| December 31, 2023 | |
| December 31, 2023 | |
| Otter Tail Power Company | |
| Otter Tail Power Company | |
| Otter Tail Power Company | Otter Tail Power Company | $ | 2,698 | | | $ | 0 | | | $ | 0 | | | $ | 0 | | | $ | 7 | | | $ | 0 | |
| Northern Pipe Products, Inc. | Northern Pipe Products, Inc. | 0 | | | 8 | | | 0 | | | 5,169 | | | 0 | | | 9,103 | |
| Vinyltech Corporation | Vinyltech Corporation | 0 | | | 17 | | | 0 | | | 11,500 | | | 0 | | | 18,004 | |
| BTD Manufacturing, Inc. | BTD Manufacturing, Inc. | 0 | | | 77 | | | 0 | | | 52,000 | | | 0 | | | 30,344 | |
| T.O. Plastics, Inc. | T.O. Plastics, Inc. | 0 | | | 15 | | | 0 | | | 10,400 | | | 0 | | | 3,101 | |
| Varistar Corporation | Varistar Corporation | 0 | | | 0 | | | 0 | | | 0 | | | 0 | | | 73,800 | |
| Otter Tail Assurance Limited | Otter Tail Assurance Limited | 36 | | | 0 | | | 0 | | | 0 | | | 0 | | | 0 | |
| | | $ | 2,734 | | | $ | 117 | | | $ | 0 | | | $ | 79,069 | | | $ | 7 | | | $ | 134,352 | |
| December 31, 2019 | |
| December 31, 2022 | |
| Otter Tail Power Company | |
| Otter Tail Power Company | |
| Otter Tail Power Company | Otter Tail Power Company | $ | 2,056 | | | $ | 0 | | | $ | 0 | | | $ | 0 | | | $ | 7 | | | $ | 0 | |
| Northern Pipe Products, Inc. | Northern Pipe Products, Inc. | 0 | | | 8 | | | 0 | | | 5,351 | | | 0 | | | 3,056 | |
| Vinyltech Corporation | Vinyltech Corporation | 4 | | | 17 | | | 0 | | | 11,500 | | | 0 | | | 15,099 | |
| BTD Manufacturing, Inc. | BTD Manufacturing, Inc. | 0 | | | 77 | | | 0 | | | 52,000 | | | 0 | | | 18,474 | |
| T.O. Plastics, Inc. | T.O. Plastics, Inc. | 0 | | | 15 | | | 0 | | | 10,400 | | | 0 | | | 3,099 | |
| Varistar Corporation | Varistar Corporation | 0 | | | 0 | | | 0 | | | 0 | | | 0 | | | 49,883 | |
| Otter Tail Assurance Limited | Otter Tail Assurance Limited | 84 | | | 0 | | | 0 | | | 0 | | | 0 | | | 0 | |
| $ | 2,144 | | | $ | 117 | | | $ | 0 | | | $ | 79,251 | | | $ | 7 | | | $ | 89,611 | |
| $ | |
Dividends
Dividends paid to Otter Tail CorporationOTC (the Parent) from its subsidiaries were as follows:
| | (in thousands) | (in thousands) | 2020 | | 2019 | | 2018 | (in thousands) | 2023 | | 2022 | | 2021 |
| | Cash Dividends Paid to Parent by Subsidiaries | Cash Dividends Paid to Parent by Subsidiaries | $ | 55,614 | | | $ | 55,660 | | | $ | 53,134 | |
| Cash Dividends Paid to Parent by Subsidiaries | |
| Cash Dividends Paid to Parent by Subsidiaries | |
|
See Otter Tail Corporation’sOTC’s notes to consolidated financial statements in Part II, Item 8 for other disclosures.
SCHEDULE II - VALUATION AND QUALIFYING ACCOUNTS AND RESERVES
OTTER TAIL CORPORATION
Below is a summary of activity within valuation and qualifying accounts for the years ended December 31, 2020, 20192023, 2022 and 2018:2021:
| | | | | | | | | | | | | | | | | | | | | | | |
| (in thousands) | Balance, January 1 | | Charged to Cost and Expenses | | Deductions1 | | Balance, December 31 |
| | | | | | | |
| Allowance for Credit Losses | | | | | | | |
| 2020 | $ | 1,339 | | | $ | 3,138 | | | $ | (1,262) | | | $ | 3,215 | |
| 2019 | 1,407 | | | 986 | | | (1,054) | | | 1,339 | |
| 2018 | 1,094 | | | 1,353 | | | (1,040) | | | 1,407 | |
| Deferred Tax Asset Valuation Allowance | | | | | | | |
| 2020 | $ | 800 | | | $ | 0 | | | $ | 0 | | | $ | 800 | |
| 2019 | 600 | | | 200 | | | 0 | | | 800 | |
| 2018 | 0 | | | 600 | | | 0 | | | 600 | |
| | | | | | | |
1Amounts under Allowance for Credit Losses reflect deductions to the allowance for amounts written-off, net of recoveries. | | | | |
| | | | | | | | | | | | | | | | | | | | | | | |
| (in thousands) | Balance, January 1 | | Charged to Cost and Expenses | | Deductions 1, 2 | | Balance, December 31 |
| | | | | | | |
| Allowance for Credit Losses | | | | | | | |
| 2023 | $ | 1,648 | | | $ | 2,014 | | | $ | (1,140) | | | $ | 2,522 | |
| 2022 | 1,836 | | | 909 | | | (1,097) | | | 1,648 | |
| 2021 | 3,215 | | | 93 | | | (1,472) | | | 1,836 | |
| Deferred Tax Asset Valuation Allowance | | | | | | | |
| 2023 | $ | — | | | $ | — | | | $ | — | | | $ | — | |
| 2022 | — | | | — | | | — | | | — | |
| 2021 | 800 | | | — | | | (800) | | | — | |
| | | | | | | |
1Amounts under Allowance for Credit Losses reflect deductions to the allowance for amounts written-off, net of recoveries. | | | | |
2Amounts under Deferred Tax Asset Valuation Allowance reflect a release of a valuation allowance based on current expectations of the realizability of the associated deferred tax asset. |
3. Exhibits
The following Exhibits are filed as part of, or incorporated by reference into, this report. | | | | | | | |
| | |
| No. | | | Description |
| | | |
| | | |
| | | |
2-A3.1 | | | —Asset Purchase Agreement,Third Restated Articles of Incorporation, dated as of November 16, 2016, among Otter Tail Power Company, EDF Renewable Development, Inc., Power Partners Midwest, LLC, EDF-RE US Development, LLC and Merricourt Power Partners, LLC.**/***April 12, 2021. |
2-B3.2 | | | |
2-C4.1 | | | —First Amendment to Asset Purchase Agreement and Turnkey Engineering, Procurement and Construction Services Agreement dated June 11, 2019, with EDF Renewables Development, Inc., f/k/a, EDF Renewable Development, Inc., Power Partners Midwest, LLC, EDF-RE US Development, LLC and Merricourt Power Partners, LLC.***Description of Securities |
3-A10.1.0 | | | |
3-B | | | |
4-A | | | |
4-A-110.1.1 | | | |
4-A-210.1.2 | | | |
4-A-310.1.3 | | | |
4-B10.2 | | | —Third Amended and Restated Credit Agreement dated as of October 29, 2012 among Otter Tail Corporation, the Banks named therein, Bank of America, N.A. and JPMorgan Chase Bank, N.A., as Co-Syndication Agents, KeyBank National Association, as Documentation Agent, U.S. Bank National Association, as administration agent for the Banks and U.S. Bank National Association, Merrill Lynch, Pierce, Fenner & Smith Incorporated and J.P. Morgan Securities LLC, as Joint Lead Arrangers and Joint Book Runners. |
4-B-1 | | | —First Amendment to Third Amended and Restated Credit Agreement, dated as of October 29, 2013, among Otter Tail Corporation, U.S. Bank National Association, as Administrative Agent and as a Bank, Bank of America, N.A. and JPMorgan Chase Bank, N.A., each as a Co-Syndication Agent and as a Bank, KeyBank National Association, as Documentation Agent and as a Bank, and Bank of the West and Union Bank, N.A., as Banks. |
4-B-2 | | | —Second Amendment to Third Amended and Restated Credit Agreement, dated as of November 3, 2014, among Otter Tail Corporation, U.S. Bank National Association, as Administrative Agent and as a Bank, Bank of America, N.A. and JPMorgan Chase Bank, N.A., each as a Co-Syndication Agent and as a Bank, KeyBank National Association, as Documentation Agent and as a Bank, and Bank of the West as a Bank. |
4-B-3 | | | —Third Amendment to Third Amended and Restated Credit Agreement, dated as of October 29, 2015, among Otter Tail Corporation, U.S. Bank National Association, as Administrative Agent and as a Bank, Bank of America, N.A. and JPMorgan Chase Bank, N.A., each as a Co-Syndication Agent and as a Bank, KeyBank National Association, as Documentation Agent and as a Bank, and Bank of the West as a Bank. |
4-B-4 | | | —Fourth Amendment to Third Amended and Restated Credit Agreement, dated as of October 31, 2016, among Otter Tail Corporation, U.S. Bank National Association, as Administrative Agent and as a Bank, Bank of America, N.A. and JPMorgan Chase Bank, N.A., each as a Co-Syndication Agent and as a Bank, KeyBank National Association, as Documentation Agent and as a Bank, and Bank of the West as a Bank. |
4-B-5 | | | —Fifth Amendment to Third Amended and Restated Credit Agreement, dated as of October 31, 2017, among Otter Tail Corporation, U.S. Bank National Association, as Administrative Agent and as a Bank, Bank of America, N.A. and JPMorgan Chase Bank, N.A., each as a Co-Syndication Agent and as a Bank, KeyBank National Association, as Documentation Agent and as a Bank, and Bank of the West as a Bank. |
4-B-6 | | | —Sixth Amendment to Third Amended and Restated Credit Agreement, dated as of October 31, 2018, among Otter Tail Corporation, U.S. Bank National Association, as Administrative Agent and as a Bank, Bank of America, N.A. and JPMorgan Chase Bank, N.A., each as a Co-Syndication Agent and as a Bank, KeyBank National Association, as Documentation Agent and as a Bank, and Bank of the West as a Bank. |
4-B-7 | | | —Seventh Amendment to Third Amended and Restated Credit Agreement, dated as of October 31, 2019, among Otter Tail Corporation, U.S. Bank National Association, as Administrative Agent and as a Bank, Bank of America, N.A. and JPMorgan Chase Bank, N.A., each as a Co-Syndication Agent and as a Bank, KeyBank National Association, as Documentation Agent and as a Bank, and Wells Fargo Bank, National Association, as a Bank. |
4-C | | | —Second Amended and Restated Credit Agreement dated as of October 29, 2012 among Otter Tail Power Company, the Banks named therein, JPMorgan Chase Bank, N.A. and Bank of America, N.A., as Co-Syndication Agents, KeyBank National Association and CoBank, ACB, as Co-Documentation Agents, U.S. Bank National Association, as administrative agent for the Banks, and U.S. Bank National Association, Merrill Lynch, Pierce, Fenner & Smith Incorporated and J.P. Morgan Securities LLC, as Joint Lead Arrangers and Joint Book Runners. |
4-C-1 | | | —First Amendment to Second Amended and Restated Credit Agreement, dated as of October 29, 2013, among Otter Tail Power Company, U.S. Bank National Association, as Administrative Agent and as a Bank, Bank of America, N.A. and JPMorgan Chase Bank, N.A., each as a Co-Syndication Agent and as a Bank, KeyBank National Association, as Documentation Agent and as a Bank, CoBank, ACB, as a Co-Documentation Agent and as a Bank, and Wells Fargo Bank, National Association and Union Bank, N.A., as Banks. |
4-C-2 | | | —Second Amendment to Second Amended and Restated Credit Agreement, dated as of November 3, 2014, among Otter Tail Power Company, U.S. Bank National Association, as Administrative Agent and as a Bank, Bank of America, N.A. and JPMorgan Chase Bank, N.A., each as a Co-Syndication Agent and as a Bank, KeyBank National Association, as Documentation Agent and as a Bank, CoBank, ACB, as a Co-Documentation Agent and as a Bank, and Wells Fargo Bank, National Association as a Bank. |
4-C-3 | | | —Third Amendment to Second Amended and Restated Credit Agreement, dated as of October 29, 2015, among Otter Tail Power Company, U.S. Bank National Association, as Administrative Agent and as a Bank, Bank of America, N.A. and JPMorgan Chase Bank, N.A., each as a Co-Syndication Agent and as a Bank, KeyBank National Association, as Documentation Agent and as a Bank, CoBank, ACB, as a Co-Documentation Agent and as a Bank, and Wells Fargo Bank, National Association as a Bank. |
| | | | | | | |
| | |
No. | | | Description |
4-C-4 | | | —Fourth Amendment to Second Amended and Restated Credit Agreement, dated as of October 31, 2016, among Otter Tail Power Company, U.S. Bank National Association, as Administrative Agent and as a Bank, Bank of America, N.A. and JPMorgan Chase Bank, N.A., each as a Co-Syndication Agent and as a Bank, KeyBank National Association, as Documentation Agent and as a Bank, CoBank, ACB, as a Co-Documentation Agent and as a Bank, and Wells Fargo Bank, National Association as a Bank. |
4-C-5 | | | —Fifth Amendment to Second Amended and Restated Credit Agreement, dated as of October 31, 2017, among Otter Tail Power Company, U.S. Bank National Association, as Administrative Agent and as a Bank, Bank of America, N.A. and JPMorgan Chase Bank, N.A., each as a Co-Syndication Agent and as a Bank, KeyBank National Association, as Documentation Agent and as a Bank, CoBank, ACB, as a Co-Documentation Agent and as a Bank, and Wells Fargo Bank, National Association as a Bank. |
4-C-6 | | | —Sixth Amendment to Second Amended and Restated Credit Agreement, dated as of October 31, 2018, among Otter Tail Power Company, U.S. Bank National Association, as Administrative Agent and as a Bank, Bank of America, N.A. and JPMorgan Chase Bank, N.A., each as a Co-Syndication Agent and as a Bank, KeyBank National Association, as Documentation Agent and as a Bank, CoBank, ACB, as a Co-Documentation Agent and as a Bank, and Wells Fargo Bank, National Association as a Bank. |
4-C-7 | | | —Seventh Amendment to Second Amended and Restated Credit Agreement, dated as of October 31, 2019, among Otter Tail Power Company, U.S. Bank National Association, as Administrative Agent and as a Bank, Bank of America, N.A. and JPMorgan Chase Bank, N.A., each as a Co-Syndication Agent and as a Bank, KeyBank National Association, as Documentation Agent and as a Bank, CoBank, ACB, as a Co-Documentation Agent and as a Bank, and Wells Fargo Bank, National Association, as a Bank. |
4-D | | | |
4-E | | | |
4-F10.3 | | | |
4-G10.4 | | | |
4-H10.5 | | | |
4-I10.6 | | | |
10-A10.7 | | | |
| 10.8 | | | |
| 10.9.0 | | | —Agreement for Sharing Ownership of Generating Plant by and between the Company, Montana-Dakota Utilities Co., and Northwestern Public Service Company (dated as of January 7, 1970). Previously filed as Exhibit 10-F in Form 10-K for the year ended December 31, 1989. |
10-A-110.9.1 | | | —Letter of Intent for purchase of share of Big Stone Plant from Northwestern Public Service Company (dated as of May 8, 1984). Previously filed as Exhibit 10-F-1 in Form 10-K for the year ended December 31, 1989. |
10-A-210.9.2 | | | —Supplemental Agreement No. 1 to Agreement for Sharing Ownership of Big Stone Plant (dated as of July 1, 1983). Previously filed as Exhibit 10-F-2 in Form 10-K for the year ended December 31, 1991. |
10-A-310.9.3 | | | —Supplemental Agreement No. 2 to Agreement for Sharing Ownership of Big Stone Plant (dated as of March 1, 1985). Previously filed as Exhibit 10-F-3 in Form 10-K for the year ended December 31, 1991. |
10-A-410.9.4 | | | —Supplemental Agreement No. 3 to Agreement for Sharing Ownership of Big Stone Plant (dated as of March 31, 1986). Previously filed as Exhibit 10-F-4 in Form 10-K for the year ended December 31, 1991. |
10-A-510.9.5 | | | |
10-A-610.9.6 | | | —Amendment I to Letter of Intent dated May 8, 1984, for purchase of share of Big Stone Plant. Previously filed as Exhibit 10-F-5 in Form 10-K for the year ended December 31, 1992. |
10-B10.10 | | | |
10-C10.11.0 | | | —Agreement for Sharing Ownership of Coyote Station Generating Unit No. 1 by and between the Company, Minnkota Power Cooperative, Inc., Montana-Dakota Utilities Co., Northwestern Public Service Company and Minnesota Power & Light Company (dated as of July 1, 1977). Previously filed as Exhibit 5-H in filing 2-61043. |
10-C-110.11.1 | | | —Supplemental Agreement No. One, dated as of November 30, 1978, to Agreement for Sharing Ownership of Coyote Generating Unit No. 1. Previously filed as Exhibit 10-H-1 in Form 10-K for the year ended December 31, 1989. |
10-C-210.11.2 | | | —Supplemental Agreement No. Two, dated as of March 1, 1981, to Agreement for Sharing Ownership of Coyote Generating Unit No. 1 and Amendment No. 2 dated March 1, 1981, to Coyote Plant Coal Agreement. Previously filed as Exhibit 10-H-2 in Form 10-K for the year ended December 31, 1989. |
10-C-310.11.3 | | | —Amendment, dated as of July 29, 1983, to Agreement for Sharing Ownership of Coyote Generating Unit No. 1. Previously filed as Exhibit 10-H-3 in Form 10-K for the year ended December 31, 1989. |
10-C-410.11.4 | | | —Agreement, dated as of September 5, 1985, containing Amendment No. 3 to Agreement for Sharing Ownership of Coyote Generating Unit No. 1, dated as of July 1, 1977, and Amendment No. 5 to Coyote Plant Coal Agreement, dated as of January 1, 1978. Previously filed as Exhibit 10-H-4 in Form 10-K for the year ended December 31, 1992. |
10-C-510.11.5 | | | |
10-C-610.11.6 | | | |
10-D10.12.0 | | | |
10-D-110.12.1 | | | |
10-D-210.12.2 | | | |
10-E10.13.0 | | | |
10-F-1 | | | |
| | | | | | | |
| | |
| No. | | | Description |
10-F-1a10.13.1 | | | |
10-F-1b10.13.2 | | | |
10-F-210.14 | | | |
10-F-310.15 | | | |
10-F-410.16 | | | |
10-F-510.17 | | | |
10-F-610.18 | | | |
10-F-710.19 | | | |
10-F-8 | | | |
10-F-9 | | | |
10-F-10 | | | |
10-F-11 | | | |
10-F-12 | | | |
10-F-12a10.20 | | | |
10-F-12b | | | |
10-F-13 | | | |
10-F-1410.21 | | | |
10-F-15 | | | |
10-F-16 | | | |
10-F-17 | | | |
10-G | | | |
10-H | | | |
10-I-1 | | | |
10-I-2 | | | |
10-I-310.22 | | | |
10-I-410.23 | | | |
10-I-510.24 | | | |
10-I-610.25 | | | |
| 10.26 | | | |
10-J10.27 | | | |
| 10.28 | | | |
21-A10.29 | | | |
| 10.30 | | | |
| 10.31 | | | |
| 10.32 | | | |
| 10.33 | | | |
| 21 | | | |
23-A23 | | | |
24-A24 | | | |
| 31.1 | | | |
| 31.2 | | | |
| 32.1 | | | |
| 32.2 | | | |
| 97 | | | |
| 101.SCH | | | —Inline XBRL Taxonomy Extension Schema Document. |
| 101.CAL | | | —Inline XBRL Taxonomy Extension Calculation Linkbase Document. |
| 101.LAB | | | —Inline XBRL Taxonomy Extension Label Linkbase Document. |
| 101.PRE | | | —Inline XBRL Taxonomy Extension Presentation Linkbase Document. |
| 101.DEF | | | —Inline XBRL Taxonomy Extension Definition Linkbase Document. |
| 104 | | | —Cover Page Interactive Data File (formatted as Inline XBRL and contained in Exhibit 101). |
| | | |
*Management contract, compensatory plan or arrangement required to be filed pursuant to Item 601(b)(10)(iii)(A) of Regulation S-K.
**Confidential information has been omitted from this Exhibit and filed separately with the Securities and Exchange Commission pursuant to a confidential treatment request under Rule 24b-2.
***Certain information has been omitted pursuant to Item 601(b)(2) of Regulation S-K. The Company hereby undertakes to furnish copies of any of the omitted schedules and exhibits to the Securities and Exchange Commission upon request.
Pursuant to Item 601(b)(4)(iii) of Regulation S-K, copies of certain instruments defining the rights of holders of certain long-term debt of the Company are not filed, and in lieu thereof, the Company agrees to furnish copies thereof to the Securities and Exchange Commission upon request.
| | | | | |
| ITEM 16. | FORM 10-K SUMMARY |
None.
SIGNATURES
Pursuant to the requirements of Section 13 or 15(d) of the Securities Exchange Act of 1934, the registrant has duly caused this report to be signed on its behalf by the undersigned, thereunto duly authorized.
| | | | | | | | |
| | OTTER TAIL CORPORATION |
| | |
| | By: | /s/ Kevin G. MougTodd R. Wahlund |
| | | Kevin G. Moug
Todd R. Wahlund Vice President and Chief Financial Officer and Senior Vice President
(authorized officer and principal financial officer) |
| | |
| | | Dated: February 19, 202114, 2024 |
Pursuant to the requirements of the Securities Exchange Act of 1934, this report has been signed below by the following persons on behalf of the registrant and in the capacities and on the dates indicated:
Signature and Title
| | | | | | | | | | | |
| Charles S. MacFarlane | ) | | |
| President and Chief Executive Officer | ) | | |
| (principal executive officer) and Director | ) | | |
| | ) | | |
Kevin G. MougTodd R. Wahlund | ) | | |
Vice President and Chief Financial Officer and Senior Vice President | ) | | |
| (principal financial and accounting officer) | ) | | |
| | ) | By | /s/ Charles S. MacFarlane |
| Nathan I. Partain | ) | | Charles S. MacFarlane |
| Chairman of the Board and Director | ) | | Pro Se and Attorney-in-Fact |
| | ) | | DatedDated: February 19, 202114, 2024 |
| Karen M. Bohn, Director | ) | | |
| | ) | | |
| Jeanne H. Crain, Director | ) | | |
| ) | | |
| John D. Erickson, Director | ) | | |
| ) | | |
| Steven L. Fritze, Director | ) | | |
| | ) | | |
| Kathryn O. Johnson, Director | ) | | |
| | ) | | |
Timothy J. O’Keefe,Michael E. LeBeau, Director | ) | | |
| ) | | |
| Mary E. Ludford, Director | ) | | |
| James B. Stake, Director ) | | |
| ) | | |
| Thomas J. Webb, Director | ) | | |