UNITED STATES
SECURITIES AND EXCHANGE COMMISSION
Washington, D.C. 20549
____________________________
FORM 10-K
____________________________
(Mark One)
| | | | | |
| ☒ | ANNUAL REPORT PURSUANT TO SECTION 13 OR 15(d) OF THE SECURITIES EXCHANGE ACT OF 1934 |
For the fiscal year ended January 31, 20222024
OR
| | | | | |
| ☐ | TRANSITION REPORT PURSUANT TO SECTION 13 OR 15(d) OF THE SECURITIES EXCHANGE ACT OF 1934 |
For the transition period from _______ to ________
Commission file number 001-40958
____________________________
RENT THE RUNWAY, INC.
(Exact name of registrant as specified in its charter)
| | | | | | | | |
| Delaware | | 80-0376379 |
(State or other jurisdiction of incorporation or organization) | | (I.R.S. Employer Identification No.) |
| | |
10 Jay Street Brooklyn, New York 11201 | | 11201 |
| (Address of Principal Executive Offices) | | (Zip Code) |
Registrant's telephone number, including area code: (212) 524-6860
____________________________
Securities registered pursuant to Section 12(b) of the Act:
| | | | | | | | |
| Title of each class | Trading Symbol(s) | Name of each exchange on which registered |
| Class A common stock, par value $0.001 per share | RENT | The Nasdaq StockCapital Market LLC |
Securities registered pursuant to Section 12(g) of the Act: None
Indicate by check mark if the registrant is a well-known seasoned issuer, as defined in Rule 405 of the Securities Act. Yes ☐ No ☒
Indicate by check mark if the registrant is not required to file reports pursuant to Section 13 or Section 15(d) of the Act. Yes ☐ No ☒
Indicate by check mark whether the registrant: (1) has filed all reports required to be filed by Section 13 or 15(d) of the Securities Exchange Act of 1934 during the preceding 12 months (or for such shorter period that the registrant was required to file such reports); and (2) has been subject to such filing requirements for the past 90 days. Yes ☒ No ☐
Indicate by check mark whether the registrant has submitted electronically every Interactive Data File required to be submitted pursuant to Rule 405 of Regulation S-T (§232.405 of this chapter) during the preceding 12 months (or for such shorter period that the registrant was required to submit such files). Yes ☒ No ☐
Indicate by check mark whether the registrant is a large accelerated filer, an accelerated filer, a non-accelerated filer, a smaller reporting company, or an emerging growth company. See the definitions of “large accelerated filer,” “accelerated filer,” “smaller reporting company” and “emerging growth company” in Rule 12b-2 of the Exchange Act.
| | | | | | | | | | | | | | |
| Large accelerated filer | ☐ | | Accelerated filer | ☐☒ |
| Non-accelerated filer | ☒☐ | | Smaller reporting company | ☐☒ |
| | | Emerging growth company | ☒ |
If an emerging growth company, indicate by check mark if the registrant has elected not to use the extended transition period for complying with any new or revised financial accounting standards provided pursuant to Section 13(a) of the Exchange Act. ☐
Indicate by check mark whether the registrant has filed a report on and attestation to its management’s assessment of the effectiveness of its internal control over financial reporting under Section 404(b) of the Sarbanes-Oxley Act (15 U.S.C. 7262(b)) by the registered public accounting firm that prepared or issued its audit report. ☐
Indicate by check mark whether any of those error corrections are restatements that required a recovery analysis of incentive-based compensation received by any of the registrant’s executive officers during the relevant recovery period pursuant to §240.10D-1(b). ☐
Indicate by check mark whether the registrant is a shell company (as defined in Rule 12b-2 of the Act). Yes ☐ No ☒
The registrant was not a public company as of the last business day of its most recently completed second fiscal quarter and, therefore, cannot calculate the aggregate market value of itsthe voting and non-voting common equity held by non-affiliates of the registrant as of such date.
July 31, 2023 (the last business day of the registrant’s most recently completed second fiscal quarter), was approximately $
The registrant had outstanding 60,893,680outstanding 3,516,973 shares of Class A common stock and 3,035,822155,269 shares of Class B common stock as of April 11, 2022.5, 2024. The foregoing reflects the reverse stock split of the registrant’s Class A common stock and Class B common stock that became effective on April 2, 2024 and began trading on a post-split adjusted basis on April 3, 2024.
DOCUMENTS INCORPORATED BY REFERENCE
Portions of the registrant’s Definitive Proxy Statement to be filed with the Securities and Exchange Commission no later than 120 days after the end of the registrant’s fiscal year ended January 31, 2022,2024, are incorporated by reference in Part III of this Annual Report on Form 10-K.
Table of Contents
| | | | | | | | |
| | Page |
| Part I | |
| | |
| | |
| | |
| | |
| | |
| | |
| | |
| | |
| Part II | | |
| | |
| | |
| [Reserved] | |
| | |
| | |
| | |
| | |
| | |
| | |
| | |
| | |
| Part III | |
| | |
| | |
| | |
| | |
| | |
| | |
| Part IV | |
| | |
| | |
| | |
| |
Unless the context otherwise requires, we use the terms the “Company,” “RTR,” “Rent the Runway,” “we,” “us” and “our” in this Annual Report on Form 10-K, or Annual Report, to refer to Rent the Runway, Inc. and, where appropriate, our consolidated subsidiaries.
Risk Factor Summary
Investing in our Class A common stock involves numerous risks, including the risks described in Part I, Item 1A. “Risk Factors” in this Annual Report on Form 10-K. You should carefully consider these risks before making an investment. Below are some of these risks, any one of which could materially adversely affect our business, financial condition, results of operations, and prospects.
•We have grown rapidly in recent years and have limited experience at our current scale of operations. If we are unable to manage our growth effectively, our brand, company culture, and financial performance may suffer.
•The COVID-19 pandemic has had, and may in the future continue to have, a material adverse impact on our business.
•The global fashion industry is highly competitive and rapidly changing, and we may not be able to compete effectively.
•We rely on consumer discretionary spending and have been, and may in the future be, adversely affected by economic downturns and other macroeconomic conditions or trends.
•Our continued growth depends on our ability to attract new, and retain existing, customers, which may require significant investment in paid marketing channels. If we are unable to cost-effectively grow our customer base, our business, financial condition and results of operations would be harmed.
•If we fail to retain customers, our business, financial condition, and results of operations would be harmed.
•If we are unable to accurately forecast customer demand or trends, manage our products effectively and plan for future expenses, our operating results could be adversely affected.
•We face risks arising from the restructuring of our operations, which could adversely affect our financial condition, results of operations, cash flows, or business reputation.
•We rely heavily on the effective operation of our proprietary technology systems and software, as well as those of our third-party vendors and service providers, for our business to effectively operate and to safeguard confidential information.
•Shipping and logistics are a critical part of our business and our supply chain and any changes or interruptions in shipping or logistics operations could adversely affect our operating results.
•We have identified material weaknesses in our internal control over financial reporting. If we are unable to remediate the material weaknesses in a timely manner, identify additional material weaknesses in the future or otherwise fail to maintain effective internal control over financial reporting, which may result in material misstatements of our consolidated financial statements or cause us to fail to meet our periodic reporting obligations, our ability to comply with applicable laws and regulations and our access to the capital markets to be impaired.
•Our business is subject to a large number of U.S. and non-U.S. laws and regulations, many of which are evolving.
•We are subject to U.S. and certain foreign export and import controls, sanctions, embargoes, anti-corruption laws, and anti-money laundering laws and regulations. Compliance with these legal standards could impair our ability to compete in domestic and international markets, and we could face criminal liability and other serious consequences for violations, which could harm our business.
•We rely on the experience and expertise of our Co-Founder and Chief Executive Officer, senior management team, key technical and strategic employees and hourly personnel.
•Failure to adequately maintain and protect our intellectual property and proprietary rights could harm our brand, devalue our proprietary content, and adversely affect our ability to compete effectively.
•We are subject to rapidly changing and increasingly stringent laws and industry standards relating to data privacy, data security, data protection, and consumer protection. The restrictions, obligations, and costs imposed by these laws, or our actual or perceived failure to comply with them, could materially impair our ability to grow our business, negative impact the results of our operations and subject us to liabilities that adversely affect our business, operations, and financial performance.
•We face risks associated with brand partners from whom our products are sourced or co-manufactured.
•We rely on third parties for elements of the payment processing infrastructure underlying our business. If these third-party elements become unavailable or unavailable on favorable terms, our business could be adversely affected.
•We depend on search engines, social media platforms, mobile application stores, content-based online advertising and other online sources to attract consumers to and promote our website and our mobile application, which may be affected by third-party interference beyond our control and, as we grow, our customer acquisition costs will continue to rise.
•Any failure by us, our brand partners, or our third-party manufacturers to comply with our vendor code of conduct, product safety, labor, or other laws, or to provide safe factory conditions for their workers, may damage our reputation and brand, and harm our business.
•We face risks associated with our indebtedness and potential need for additional capital, including that new financing or restructuring or refinancing may not be available on acceptable terms or at all and that our operations may be adversely impacted by the covenants in our current debt agreement or future financing agreements.
•Failure to meet the Nasdaq Capital Market’s continued listing requirements and other Nasdaq rules could adversely affect the price of our Class A common stock and make it more difficult for us to sell securities in a future financing or for you to sell our Class A common stock.
•The dual class structure of our common stock has the effect of concentrating voting control with those stockholders who held our capital stock prior to the listing of our Class A common stock on Nasdaq, including our Co-Founders, and their affiliates, which will limit the ability to influence the outcome of important transactions, including a change of control.
•Our share price may be volatile, and investors may be unable to sell their shares at or above the price they purchased them.
•COVID-19 had, and future COVID-19 outbreaks may in the future have, a material adverse impact on our business. Other future pandemics or public health crises may have a similar adverse impact on our business.
If we are unable to adequately address these and other risks we face, our business may be harmed.
FORWARD-LOOKING STATEMENTS
This Annual Report on Form 10-K contains forward-looking statements. We intend such forward-looking statements to be covered by the safe harbor provisions for forward-looking statements contained in Section 27A of the Securities Act of 1933, as amended (the “Securities Act”), and Section 21E of the Securities Exchange Act of 1934, as amended (the “Exchange Act”). All statements other than statements of historical fact contained in this Annual Report may be forward-looking statements. In some cases, you can identify forward-looking statements by terms such as “aims,” “may,” “will,” “should,” “expects,” “plans,” “anticipates,” “could,” “intends,” “targets,” “projects,” “contemplates,” “believes,” “estimates,” “forecasts,” “predicts,” “potential” or “continue” or the negative of these terms or other similar expressions. Forward-looking statements contained in this Annual Report include, but are not limited to statements regarding our future results of operations and financial position, industry and business trends, share-based compensation, business strategy and initiatives, including rental product depth strategy, promotional and marketing strategy and onboarding initiatives, sustainability initiatives, business plans, impacts from our Impact StrategySeptember 2022 and related goals,January 2024 restructuring plans and other cost savings initiatives, anticipated cost savings from our 2023 transportation deal with a major national carrier, anticipated future expenditures, product acquisition expectations, compliance with Nasdaq continued listing requirements, impacts from our five-item base subscription offering, anticipated expenditures and compliance with our debt covenants, market growth and our objectives for future operations.
The forward-looking statements in this Annual Report on Form 10-K are only predictions. We have based these forward-looking statements largely on our current expectations and projections about future events and financial trends that we believe may affect our business, financial condition and results of operations. Forward-looking statements involve known and unknown risks, uncertainties and other important factors that may cause our actual results, performance or achievements to be materially different from any future results, performance or achievements expressed or implied by the forward-looking statements, including, but not limited to, the important factors discussed in Part I, Item 1A, “Risk Factors” in this Annual Report for the year ended January 31, 2022.2024. The forward-looking statements in this Annual Report are based upon information available to us as of the date of this Annual Report, and while we believe such information forms a reasonable basis for such statements, such information may be limited or incomplete, and our statements should not be read to indicate that we have conducted an exhaustive inquiry into, or review of, all potentially available relevant information. These statements are inherently uncertain and investors are cautioned not to unduly rely upon these statements.
You should read this Annual Report on Form 10-K and the documents that we reference in this Annual Report and have filed as exhibits to this Annual Report with the understanding that our actual future results, levels of activity, performance and achievements may be materially different from what we expect. We qualify all of our forward-looking statements by these cautionary statements. These forward-looking statements speak only as of the date of this Annual Report. Except as required by applicable law, we do not plan to publicly update or revise any forward-looking statements contained in this Annual Report, whether as a result of any new information, future events or otherwise.
FISCAL YEAR
InOur fiscal year ends on January 31 of the next calendar year. For example, in this Annual Report on Form 10-K, references to “fiscal year 2022”2024” refer to the fiscal year ending January 31, 2023,2025 and references to “fiscal year 2021”2023” refer to the fiscal year endedending January 31, 2022, references to “fiscal year 2020” refer to the fiscal year ended January 31, 2021 and references to “fiscal year 2019” refer to the fiscal year ended January 31, 2020.2024.
Part I
Item 1. Business
Overview
Our mission is to power women to feel their best every day.
Since our founding in November 2009, we have built the world’s first and largest shared designer closet with over 19,000thousands of styles by over 780hundreds of brand partners. We give customers access to our “unlimited closet” through our Subscriptionsubscription offering (“Subscription”) or the ability to rent a-la-carte through our reserve offering (“Reserve”). We also give our subscribers and customers the ability to buy our products through our Resale offering. Our Closet in the Cloud offers a wide assortment of items for every occasion, from evening wear and accessories to ready-to-wear, workwear, denim, casual, maternity, outerwear, blouses, knitwear, loungewear, jewelry, handbags, activewear and ski wear, home goods and kidswear.wear. We have served over 2.5approximately 3 million lifetime customers across all of our offerings and we had 159,544173,247 total subscribers (active and paused) as of January 31, 2022.2024. We had 125,954 active subscribers as of January 31, 2024. In fiscal year 2021, 84%2023, 88% of our total revenue was generated by subscribers, compared to 89%86% in fiscal year 2020.2022.
We have created a two-sided discovery engine: customers are findingfind new brands they love and brand partners are findingfind new customers they need. For customers, we unlock freedom of self-expression through access to our “Unlimited Closet” that has a constantly rotating supply of styles for all occasions, seasons, moods and price points. This leads to deep engagement with our platform as customers discover new brands they love. Brand partners are able to tap into our large, engaged community to discover new customers and get unparalleled data insights. All of this helps them grow and run their businesses and encourages them to partner more closely with us over time.
When our customers use Rent the Runway, they experience the magic of accessing an “Unlimited Closet” while saving money and time and reducing clothing waste. We deliver significant financial value to customers, with our average subscriber wearing clothes worth more than 2025 times what she pays for a monthly RTR subscriptionSubscription on an annualized basis (more than $40,000$45,000 in designer retail value in fiscal year 202120231). We have become an everyday utility; our average subscriber wears Rent the Runway around 80 days per year.
Our tremendous selection is enabled by our designer brand partnerships. We source our products directly from or in partnership with, our brand partners that include many of the most renowned and relevant names in the fashion industry. The transformative nature of our customer value proposition means our customers are typically younger and different from other audiences our brands are exposed to. According to our June 2021 Rent the Runway Brand Survey, approximately 91% of our brand partners work with us because we introduce them to new, desirable customers and deepen awareness of their brands. Over the last 1214 years, we have fostered strong relationships with our brand partners and have retained nearly 100% of our brand partners.experienced extremely limited voluntary attrition. Our Closet in the Cloud connects our deeply engaged customers and our differentiated brand partners on a powerful platform built around our brand, data, logistics and technology advantages.
•Brand Partner Advantage. Our assortment contains thousands of new, current season styles that luxury competitors simultaneously carry - all available for subscription,Subscription, Reserve, andand/or Resale at much lower prices. We believe our engaged and loyal customer base paired with the data that we provideoffer to our brand partners makes us an essential destination for many of the world’s most important brands. In addition, as of June 2021, 67% of our brand partners believe that RTR is an important part of their business’s sustainability strategy. As we have grown,Over time, our commercial relationships with our brand partners have evolved towards more capital efficient forms of rental product acquisition.
•Data Advantage. We capture a vast amount of unique, actionable data on our customers and products. We leverage this data to create benefits for our customers (deep personalization of styles and fit), brand partners (understanding of customer demand patterns and garment lifecycle) and our business (higher subscriber lifetime value and better product return on investment).
1 We calculate designer retail values using original retail and/or comparable value prices. An original retail price is the price at which the manufacturer suggested that retailers in the marketplace, including department stores and specialty retailers, sell the item in new condition. A comparable value price is used for our Exclusive Designs and is based on an evaluation of prices for new comparable merchandise sold elsewhere in the marketplace.
•Technology and Logistics Advantage. We have developed a proprietary operating system for the sharing economy of physical goods that pairs proprietary intelligent software with differentiated infrastructure and hardware. Our expertise in vertically integrated just-in-time reverse logistics and garment science allows us to achieve multi-year monetization on our garments. We have also built a custom front-end platform that supports all of our consumer-facing offerings in one easy experience for the customer.
How It Works
We offer customers three ways to access our closet: monthly subscription or “Subscription”, a-la-carte rentals or “Reserve” and purchasing through our Resale offering.
Subscription
Pick a Plan. When customers subscribe, they select from a menu of entry plans. Beginning in March 2023, we added an extra item to each shipment per plan at no extra cost to our subscribers. Each plan now starts with fourfive items, or “spots,” per shipment, and varies based on how often the subscriber wishes to receive new shipments, each a “swap.” Today, the majority of our subscribers onboard into plans that offer one, two, three or four shipments per month for $94, $144, $193 or $235 per month, respectively.
Customize. Subscribers can customize their plans to adapt to their changing lifestyles, needs and budgets by adding or removing spots for $27 or $31 per item per month and shipments for $39 - $50 per shipment per month, as they see fit.
Choose Items. After picking a plan, subscribers browse our broad assortment of items to build their first shipment.
Wear, Repeat. When subscribers place an order, we aim to deliver their order within two to three business days of shipping from our fulfillment centers in our patented, reusable garment bags, cleaned and ready to wear.
Subscribers wearkeep items for as long as they would like and may choose to return some or all of their items with each new shipment. When subscribers select the items they want to return on our app, we allow them to immediately start building their next shipment, maximizing their time with items at home. Our subscribers typically visit our app fivemultiple times per week.
Subscribers are asked to give us real-time feedback on the size, fit and quality of the items they rent. The structured data we collect through our “happiness survey”from customer feedback allows us to both improve her experience as well as optimize our garment care and, therefore, our return on investment of the items returned. Our customers also have the option of leaving photo reviews of items they rented to share their experience with the Rent the Runway community, including fit information, occasions they rented for and styling tips. Once subscribers confirm their new shipment, they can return their items in RTR’s reusable garment bag to the nearest preferred shipping partner location or any Rent the Runway drop-off point in RTR’s reusable garment bag.using a prepaid return label. In select markets,addition, a majority of our subscribers also have the option to schedule anreturn their items via our at-home pick-up. To maximize convenience, all shipments arrive with a prepaid return label, allowing subscribers to easily send their rentals back.pickup offering that we introduced in 2021. As of January 31, 2024, our at-home pickup offering covered 86% of our subscriber base.
Reserve
When customers want to rent items a-la-carte for an upcoming event, they book styles for four or eight days through our Reserve offering. After selecting pieces, they typically select a delivery date one to two days before their event. We provide a free backup size of the customer’s choosing and the option to rent a backup style at a discount. At the end of the four- or eight-day rental period, customers simply return their items in the reusable garment bag using the prepaid shipping label included with their rental. Just like our Subscription offering, our customers have the option of leaving a review, and we clean and care for items on behalf of our customers when they are returned.
Resale
In addition to renting, customers also shop pre-loved styles from our closet at a discount to retail price, ranging from 10-85%up to 90% off of designer retail value (which we calculate using original retail and/or comparable value prices). Customers can purchase any styles they love; no subscriptionA Subscription is required.not required for purchase. Our subscribers also have the option to purchase items they already have at home, opening a spot in their next shipment. Prices forWe plan to increase the focus on our resale items are dynamically calculated by our pricing algorithm which takes in data on rental history,Resale business as a lever to drive customer trends and the impact of removing an item from rental circulation to optimize for lifetime return on investment on each product.
Our Customer Value Proposition
Through our platform, we have helped over 2.5approximately 3 million lifetime customers discover the transformative power of utilizing our Closet in the Cloud across all of our offerings. Our customer base is diverse and spans age, household income distribution and U.S. geography.
Subscribers are customers who have ongoing access to our Closet in the Cloud via our monthly Subscription offering. The portion of our customers who are subscribers accounted for 84%88% of our revenue in fiscal year 2021.2023. As of January 31, 2022,2024, we had 115,240125,954 Active Subscribers on Rent the Runway and 159,544173,247 total subscribers including paused subscribers.subscribers, and during fiscal year 2023, we had 135,211 Average Active Subscribers. Many of our subscribers started as customers in Reserve and Resale and we continue to see activation from Reserve and Resale customers into subscribers for many years.
•Variety and Discovery. With over 19,000thousands of styles across over 780hundreds of brands in our Closet in the Cloud, Rent the Runway gives customers the ability to always wear something new to them and inspires customers to expand their fashion tastes without risk of buyer’s remorse. According to our March 2024 Subscriber Survey, 82% of our subscribers say RTR allows them to experiment with different clothing without commitment.
•Value. Rent the Runway makes thousands of designer styles accessible through our Subscription offering for a flat monthly price or through our Reserve offering on a per item basis. We deliver significant financial value to customers, with our average subscriber wearing clothes worth more than 2025 times what she pays for a monthly RTR subscriptionSubscription on an annualized basis.
•Self-Confidence. According to our April 2021March 2023 Subscriber Survey, 83% of our subscribers say RTR makes them the most confident version of themselves at work or in social settings. Because there is no commitment to keep an item rented from RTR, we fuel greater self-expression for our customers.
•Personalization and Convenience. We use our rich customer data to create a personalized storefront for customers based on their style preferences, browsing history and past rentals. Our understanding of our customer improves with each interaction, and we use our personalization algorithm to provide personalized size recommendations to each customer at the item level. By showing customers designs they will love and items that are attractively styled, and likely to fit, we continue to drive strong loyalty and monetization.
•Customer Experience and Community. Our customers are deeply engaged, as evidenced by the 24.543.0 million customer reviews submitted throughposted as of January 2022. Our2024. We continue to make enhancements to our review process designed to allow customers use the millions of reviews posted by our community to make smarter choices and feel good about their selections. As our community has grown, Rent the Runway has also benefited from powerful virality and word-of-mouth marketing. 81%80% of subscribers have shared RTR with at least five people; 32%43% have shared with over 2010 people and 78%75% of our customers posted themselves wearing Rent the Runway on social media, as indicated by our April 2021March 2023 Subscriber Survey.
•Sustainability. Renting on the RTR platform results in net environmental savings across water, energy and carbon emissions when compared to purchasing new garments even when accounting for two-way shipping, cleaning and other operations.2 See “Our ESG (Environmental, Social, and Governance) Impact Strategy” below for additional detail.our Impact Strategy goals. Our business model aims for customers to substitute purchases with rentals and we have been successful in doing so, as 83%87% of our subscribers have bought less fast fashion since using RTR3 and 89%82% buy fewer clothes than they used to prior to joining RTR as indicated by our April 2021 Subscriber Survey.4.
2 According to the Life Cycle Assessment Study (the “LCA Study”) we commissioned in 2021 with Green Story and SgT, third-party consultants specializing in apparel life cycle assessments.
Our Unique Brand Partner Approach
We acquire our products through three channels: Wholesale, Share by RTR and Exclusive Designs. The portion of our products sourced through Share by RTR and Exclusive Designs - our more capital-efficient sources - has grown from approximately 26% in fiscal year 2019 to approximately 55%61% in fiscal year 2021.2023. We procure virtually 100% of our products directly from or in collaboration with brand partners and our business model has been built on shared success with brands. As they deepenThrough their relationshiprelationships with us, they get access to moreunique data and more customers.exposure to a broad customer base, and our variety of sourcing channels provides brands with flexibility that is designed to meet their needs and ours. Our partnerships with brands have created a significant product and cost advantage. Because we source directly from brands, we also can better control our assortment and acquire styles in the volumes and sizes we want, we have access to current season items and all of our items are guaranteed authentic without the cost or infrastructure of traditional authentication platforms. See Part II, Item 7, “Management’s Discussion and Analysis of Financial Condition and Results of Operations—Our Product Acquisition Strategy.”
Wholesale
Wholesale includes products we acquire directly from our brand partners, typically at a discount to wholesale price based on our scale. We have observed that the original retail prices set by the brands are often at aan approximately 2.5x mark-up to the wholesale price. As we continue to expand our selection and grow the share of our assortment acquired from a designer, we benefit from greater discounts on product acquisition. Wholesale represented 45%39% of our product acquisition in fiscal year 2021.2023.
Share by RTR
Through Share by RTR, we acquire items directly from brand partners on consignment, at zero to low upfront cost and revenue share with our brands each time an item is rented. Brands also pay usThe revenue share fees are calculated net of a logistics expensefee charged to the brands for each rental. If a piece is in greater demand, it will drive higher revenue, which could result in brands earning more on the item over time than if it had been sold through Wholesale.Wholesale, generally subject to a maximum cap. Share by RTR aligns incentives between brands and RTR and alleviates product risk as it is largely a pay-for-performance model. Our Share by RTR arrangements with brands target delivering 75% to 100% of comparable Wholesale cost to the brand in the first year; however there is no minimum commitment other than the upfront payment if applicable. Nearly all Share by RTR deals consummated after September 2020 include a cap on total potential payments to the brand partner. Share by RTR represented 33% of our product acquisition in fiscal year 2021.2023. Increases (or decreases) in the proportion of total items acquired via Share by RTR as well as the usage of Share by RTR items will increase (or decrease) variable expenses recorded in the rentalRental product depreciation and revenue share line item on our consolidated statement of operations. See Part II, Item 7, “Management’s Discussion and Analysis of Financial Condition and Results of Operations—Our Product Acquisition Strategy.”
Exclusive Designs
We leverage our data to create highly desirable Exclusive Designs in collaboration with select brand partners, celebrities and influencers that we manufacture through third-party partners to be more durable and at approximately 50% lower cost than wholesale.Wholesale. We provide a data blueprint to brands and, based on this data, they design new collections for us that carry their brand name.
2 According to the Life Cycle Assessment Study (the “LCA Study”) we commissioned in 2021 with Green Story and SgT, third-party consultants specializing in apparel life cycle assessments.
3Per our March 2023 Subscriber Survey.
4Per our November 2022 Subscriber Survey.
Our Exclusive Designs collections enable our brand partners to innovate their businesses and enter into new product lines at reduced cost to them. All of the styles are exclusive to rent on RTR for a period of time, after which brands may monetize these exclusive designs through other channels, typically subject to a royalty fee payment to Rent the Runway, which we have not begun to earn to date. Increases (or decreases) in the proportion of total items acquired via Exclusive Designs as well as the usage of Exclusive Designs items may increase (or decrease) variable expenses recorded in the rentalRental product depreciation and revenue share line item on our consolidated statement of operations. See “Management’s Discussion and Analysis of Financial Condition and Results of Operations—Our Business Model—Our Product Acquisition Strategy.” We also have a small number of products bearing our trademarks, which are non-exclusive designs produced by third party partners at a significantly lower average cost than Wholesale to strategically fill assortment gaps, or our owned brands.gaps. Exclusive Designs accounted for 22%28% of our product acquisition in fiscal year 2021.2023.
Rent the Runway Virality andOur Marketing Strategy
Our brand and deeply engaged consumer base have historically allowed us to acquire customers efficiently. Since our founding, we have spent less thanthan 10% of total revenue on marketing, and our growth has been mostly organic. Over 80% of our customers over the last 1214 years have been acquired organically. As of January 2022, we have had over three trillion earned media impressions since 2018. As we have scaled, we have seen the value of the Rent the Runway brand grow and increasingly become a significant point of differentiation with consumers and brand partners. We believe we have an opportunity to continue to increase brand awareness and as of June 2021,December 2023, our unaided brand awareness was 20%19% among U.S. women ages 18 - 45 with a household income of $50,000 or more and 27% among U.S. women ages 18 - 45 with a household income of $100,000 or more.
Many of our customers share a love of the Rent the Runway experience and value proposition, which starts conversations both online and offline and leads to word of mouth adoption. Because of how customers use Rent the Runway, renting bold dynamic pieces, ourOur clothing often becomes a visual billboard and advertisement for our platform. WhenMany women wearshare their Rent the Runway they feel confident and often want to share their experience on social media and in their personal lives, which driveshelps drive our organic growth and brand awareness. This means that whenWhen our customers are wearing RTR and someone compliments them or asks about what they are wearing, 96%97% of our customerssubscribers share that it’s Rent the Runway as opposed to the designer brand name. The majorityAccording to our March 2023 Subscriber Survey, nearly half of our subscribers have posted themselves wearing RTR on their social media over five times. Renting from us is an inherently social behavior: 86%76% of our subscribers rent along with a friend or colleague. Our high level of continued organic growth has also been driven by the strong press coverage thatIn fiscal year 2024, we have generated.plan to increase our efforts to drive brand awareness and grow traffic through brand campaigns, new marketing channels and focusing on full funnel marketing efforts and enhanced lifecycle marketing.
While aThe majority of our new customers have historically come to Rent the Runway organically, a trend that continued in fiscal year 2023. We plan to continue to drive organic growth by focusing on social-first, mid-funnel strategies. Our current marketing initiatives are focused on growing our base of new customers, re-engaging lapsed customers, and retaining existing customers. Additionally, we are focused on investing in the customer experience, including optimization of our funnel and the Subscription experience, as a way to re-engage and retain subscribers. We also view paid marketing as aan important way to supplement our organic growth. Our paid efforts have included both middle-of-the-funnel prospecting and bottom-of-the-funnel direct response campaigns which also benefit from our top-of-the-funnel brand marketing efforts that drive awareness. To date, our primary channels for paid marketing have been focused on social media marketing, influencers and our brand ambassadors, programmatic directed spend and affiliate marketing.
Our Data AdvantageApproach
One of our significant differentiators is the vast amount of quality, actionable data that we are able to collect on our customers and our products. We leverage this data to create benefits for our customers, our brand partners and our business.
We capture more than 5,200thousands of unique data points per subscriber per year and up to 27over 20 unique data points per item each time it is rented across four channels including website data, post-wear data, operations data and customer data. We also identify and tag over 70approximately 75 detailed attributes per style. By mapping our interactions with our products’ inherent attributes, we create a strong feedback loop which allows us to optimize the supply of products in ways we believe that would be difficult for traditional retailers to achieve or replicate. This is one of our biggest competitive advantages.
OurWe believe that our differentiated business model enables us to collect substantially more data than others in our space and we use this data to continuously improve the customer experience. Customers learn that providing data enhances their experience on the platform over time, which enables us to collect even more data from them. This flywheel helps propel the exponential growth of our post-wear, customer and operations data. We use our data to create what we believe are the most relevant assortments and personalized experiences for our customers, which in turn driveshelps to drive loyalty. As we learn more about a customer, our personalized features give us greater ability to direct her towards the items that optimize both customer lifetime value and rental product return on investment for us.
Our data advantage benefits brand partners in numerous ways:
•Understanding the Garment Life Cycle: We help partners grow their business through the data we provide. Product longevity data often help our brands increase the life of their garments, which can support their sustainability goals.
•Understanding Customer Demand: As our customers wear (or don’t wear) and review items, we can assess demand due to our robust attribution of products (over 70 attributes) paired with customer interaction data. This data highlights growth opportunities for brands as well as areas for improvement.
Our data also allows us to continually optimize the return on investment on products and customer lifetime value, which are dependent on the following inputs, all of which continuously improve as our business scales.
•Scientific Product Acquisition: Our data provides a comprehensive picture of our products by bringing together customer feedback, operations data and inherent product attributes. Our analytics teams utilize this data to optimize the styles we need and the quantity per style.
•Price Optimization: Our dynamicWe optimize pricing algorithm optimizes howon our products are consumed across Subscription, Reserve rentals and Resale by takingusing datato take into account demand signals and the expected useful life and turns of each item. We have the flexibility to optimize prices for revenue, gross margin and product return on investment based on the business needs.
•Lower Cost Product: We leverage our data to create highly desirable Exclusive Designs in collaboration with our brand partners, influencers and celebrities that we manufacture to be more durable at significantly lower cost.
•Longer Product Life: Our feedback to brands helps us customize for higher longevity of our products - we understand how to clean and care for garments to maximize multi-year monetization and incremental turns per unit.
Data Science Capabilities and Algorithms
Data is the fabric of Rent the Runway and powers our technology and logistics and data science efforts across all parts of our business,operations, from recommender systems to pricing algorithms and forecasting. Experimentation and algorithm development are deeply embedded in all parts of our business. We have created 40+ data science algorithms that help us continuously achieve better outcomes for the business including in two of our biggest levers: customer lifetime value and product monetization. As our data sets grow, our algorithms become more powerful and gain leverage.business.
Some of our most impactful proprietary algorithms include:
•Deep 1:1 Personalization: For each customer and item, we compute several scores that measure the affinity of item and customer through factorization machines and deep learning. We leverage these personalization scores across the business to: rank products on our subscriber personalized storefront and in search results, recommend a specific size within a style on product pages, compute general product relevance at the subscriber level and inform product acquisition, inform sizing of new apparel designs with our brand partners and more.
•Retention Predictive Model: We leverage a retention predictive model to understand the relative importance of more than 200various drivers of loyalty and long-term value, at the single customer level to understand which interventions have the highest probability of improving customer retention. We regularly leverage this data to experiment with different approaches to retain customers based on this model in a targeted and personalized way.
•Computer Vision for Products: For each style in our assortment, we generate an embedding with over 2,000 visual style embeddingsdimensions using deep learning that capture color, pattern shape, sleeve length, etc. We leverage this data as a feature in our recommender systems, to cluster styles to inform product acquisition and provide product attributes in our product catalog amongst other uses.
Our Technology and Logistics AdvantagePlatform
We have built a cohesive platform that pairs proprietary and third-party intelligent software with differentiated infrastructure and hardware all tailored to the sharing economy of physical goods. Our proprietary software leveragesand key integrations with third-parties leverage our vast and unique dataset to optimize key outcomes for RTR.
Proprietary and Third-Party Software and Systems
Because our product offering is highly innovative, weWe have purpose-built a technology stack to support three key areas of our business:
•Customer Facing e-Commerce (including 2-Way e-commercee-Commerce)
•Rental Reverse Logistics
•Merchandising & Products Control
Customer Facing e-Commerce (including 2-Way e-commercee-commerce)
We have a 2-way relationship with our customers — in that nearly every item is returned and the customer provides feedback. We have built a custom frontend platformplatforms that supportssupport Subscription, Reserve and Resale in one easycohesive experience for the customer. Thiscustomer, which allows us to optimize theour product offering for the customer based on her needs.
In fiscal year 2023, we made improvements across our technology stack, including continued improvements to our cloud infrastructure, to enable greater scale, enhanced resiliency and faster site speed. We continue to focus on improving the performance of our website and mobile application, including increasing site speed and reliability to improve the customer experience and keep pace with industry standards.
Rental Reverse Logistics
We designed our patented technology and reverse logistics operations to support the processes in our fulfillment centers and ensure that we can process orders efficiently and extend the useful life of our products.
•Garment Science:
◦Cleaning Intelligence: We have over a decade of data and expertise in optimizing the life of a garment by leveraging different cleaning and care methods.
◦Cleaning Automation: Automation supports dynamic sorting of items into as many as 2623 different cleaning programs.
◦Garment Care and Restoration: All units undergo one or more quality audits before being available to rent for the next customer.
•Intelligent Fulfillment Network: Our unified booking engine, the “brain” of our distribution capabilities, dynamically manages decisions such as which fulfillment center to ship a unit from or which transportation type to select to reduce cost. We are therefore able to maintain uptime throughout the year, such as during snowstorms or power outages by moving demand to another facility.
•Optimized Storage: Garments and accessories are stored in multi-story pick modules that utilize both on-hanger and flat pack storage solutions. All items are stored randomly, maximizing the utilization of cubic storage space. Random storage allows for efficient putaway of garments and dynamically created pick paths that save labor cost.
•RFID: We tag each unit and all reusable garment bags with RFID tags, which increases throughput, reduces cost, improves inventoryrental product control and enables new forms of automation. Since launching RFID tags in 2021, hundreds of thousands of scans each day are created by these tags in a fraction of a second, replacing manual barcode scans that took much longer.
•Fulfillment Efficiency: We have automated various parts of the fulfillment process including picking, order consolidation and packing. Our fulfillment engine dynamically prioritizes customer orders based on promised delivery date, transportation departure schedules and available capacity.
•Transportation Innovation: Convenient places to return rentals are an important part of our customer experience. We have invested in an outbound and inbound network that allows our customers to receive packages and return their items efficiently via national returns logistics providers, and Rent the Runway-specific return methods, such as physical drop-off points,including through our convenient at-home pickup and RTR drop-off boxes in retail stores or corporate offices.program.
Merchandising and Product Control
Our proprietary product catalog system is the backbone of our inventoryrental product management. A flexible taxonomy supports myriad types of products which goes well beyond women’s fashion, and allows us to ingest and manage items at the SKU level, functionality that does not typically exist in off-the-shelf inventory management systems. This system uses a combination of manual and dynamic image algorithm drivenimage-algorithm-driven attribution to assign product attributes per style, making the ingestion of new styles into the Rent the Runway catalog fast and easy without sacrificing valuable data collection. The catalog serves as the starting point for products at RTR, and drives many areas of the Rent the Runway website and operation including quality control, search, navigation, and filtering.
While we have built the majority of our circular platform, we strategically leverage third-party software for commodity functionality where our problems are not unique. These include pieces of the customer experience customerand service tools and enterprise resource planning capabilities.
Logistics Infrastructure
Within our warehouses, we have integrated best-in-class garment care equipment, internally and externally developed software and proprietary cleaning programs to deliver high-end garment processing at massive scale. We have also builtimplemented large-scale, innovative automation and other processes for garment storage, picking, shipping, receiving and restoration of garments to excellent condition. These processes resulthave resulted in labor and other cost savings, while increasing our total shipment capacity and increasing the total lifetimelongevity of products, our biggest asset.
•Strategic Distribution: We have two fulfillment centers, in Arlington, Texas and Secaucus, New Jersey totaling 540,000approximately 486,000 square feet. We have the capacity to store more than two million garments and accessories on multiple floors across our fulfillment centers. We aim to deliver industry leading fulfillment promises with a goal of delivering orders within two to three business days in most markets.days.
•Garment Care Hardware: Our facilities are equipped with a curated set of over 430450 pieces of digitally integrated garment care hardware including wet cleaning, dry cleaning and spray cleaning machines; dryers, steam tunnels, pressers, spotting boards, auto-baggers and commercial sewing machines.
•Processing: Garments flow through the facility on both rail and belt-driven conveyance guided by RFID tags linked to a massive array of cleaning instructions set by our proprietary operating system. A variety of item types are sorted based on cleaning, storage and repair methods. After discrete processing, they fall back into continuous flow and random storage, which drives labor efficiency and maximizes use of physical space.
•Proven Scalability: Our infrastructure is highly scalable and we expect our weekly processing capacity to increase over time. We believe that the process improvements we have made enablehave enabled us to expand our capacity to handle overat least 4x our active subscriber count at the end of fiscal year 20212023 in our two current facilities with minimal additional investment.
•Transportation Management: In August 2023, we completed a new transportation deal with a major national carrier to lock in competitive rates and consolidate the vast majority of our shipping needs. We believe this partnership will enable us to continue serving our customers with premium delivery and return service, and to further expand our elevated returns and delivery experience like At-Home Pick Up and Saturday Delivery. We also partner with a wide variety of national, regional and local last mileother service providers in certain markets in order to close the loop betweenserve our fulfillment centers and our customers. Our transportation management system allows us to rate shop across these providers and opt into the best shipping method based upon cost and capacity.customers effectively.
Our 2024 Strategy
Our belief is that we can drive future growth by investing in and improving the customer experience. Unlike traditional e-commerce companies, we are an experience-based company that our subscribers engage with multiple times a week. Our goal is to make customers’ time spent with Rent the Runway as efficient and delightful as possible and plan to continue to invest in our customer experience. Our plans include continuing to innovate and improve our on site experience for both prospects and active customers, with a focus on styling, merchandising, onboarding, and checkout to improve customer conversion and retention. We are also continuing to focus on improving our customers' experience with our rental product by maintaining availability and increasing the depth of our buys.
In addition, we plan to devote substantial attention to our marketing efforts. We expect to increase our efforts to drive brand awareness and grow traffic through brand campaigns, new marketing channels and focusing on full funnel marketing efforts and enhanced lifecycle marketing.
Finally, in fiscal year 2024, we are also focused on achieving our profitability goals, including by profitably growing revenue, reducing our variable costs, right sizing our rental product buy strategy while increasing our percentage of Share by RTR items, and seeking additional efficiencies in operating expenses.
Our ESG (Environmental, Social, and Governance) Impact Strategy
Our mission has remained the same since our founding: powering women to feel their best every day. We believe our platform is powering a new frontier for fashion, one in which women buy less and wear more, disrupting a centuries old industry and contributing to a more sustainable future.
We believe that shared access to fashion has the power to curb the negativeDriving positive environmental and social impacts that stem from excess related to the fashion industry. Driving positive impact is core to our business model: buyingwe enable our customers to buy less and wearingwear more. As such, weOur Impact Strategy goals are focusedoutlined below. Further information, including detailed progress against these goals, can be found on expanding and deepening our positive impact, both from within our business as well as through engagement with a wider ecosystem of partners who play critical roles in driving change.website, which is not incorporated herein.
Ambition 1. We believe our Impact Strategy is a holistic approach to tackling pressing environmental and social issues, while advancing and complementing our business strategy. We have specific and measurable short-term goals to tackle pressing environmental and social issues that we believe we – as a rental subscription model – are uniquely equipped to address.
We plan to report against the following goals annually, starting with our Form 10-K for fiscal year 2022.
Ambition 1: Harnesswill harness the power of ourbusiness model to set the standard for sustainable fashion.
Priority 1:1. Reduce carbon emissions from our business so that we operate with net zero emissions by 20402040.
•Displace the need for new production of 500,000 garments by fiscal year end 2026.
•Power our owned and operated facilities (stores, offices,(offices and warehouses) with 100% renewable electricity by fiscal year end 2026.
•Quantify our supply chain emissions (i.e., Scope 3 baseline) by fiscal year end 2024.2025 (fiscal year 2023 update).
•Sustainably source 50% of key materials - cotton, polyester, and polyesterlinen - we use for Exclusive Designs by fiscal year end 2026.2026 (fiscal year 2023 update).
Priority 2:2. Minimize waste from our businessbusiness.
•Divert 90% of waste from our warehouse operations from landfill by fiscal year end 2026.
•Eliminate unnecessary single use plastic packagingin shipments to customers and only utilize reusable, compostable or 100% recycledrecyclable content for necessary plastic packaging to customers by fiscal year end 2023.
Ambition 2:2. Create a culture and cultivate a community where all people are inspired, empowered and thrive.
Priority 1:1. Ensure our workforce remains diverse and for leadership to reflect the population of individual contributorscontributors.
•Maintain on average 40% representation of racial and ethnic minorities3 for the USU.S. corporate workforce through fiscal year end 2026.
•Maintain on average 50% representation of individuals identifying as women and non-binary in the USU.S. workforce through fiscal year end 2026.
•Double representation of LatinX leadership in the new hire classes at our Secaucus warehouse by fiscal year end 2026.
•Double representation of Black and LatinX leadership in new hire classes at our Dallas warehouse by fiscal year end 2026.
Priority 2:2. Use our platform to support and amplify diversity in fashionfashion.
•$106 million cumulative spend with Black designers between fiscal year 2022 and fiscal year end 2026.
•Ensure at least 40% representation of racial and ethnic minorities in our marketing materials and imagery by fiscal year end 2026.
Our Impact Strategy is not the start ofWe experience seasonality in our ESG efforts; we believe that we have a strong track record of programsbusiness, which has been impacted and initiatives that have yielded notable accomplishments, including:
Environmental
•In 2021, we commissioned a Life Cycle Assessment to understand the environmental impact of our platform, which confirmed that renting from RTR results in net environmental savings compared to purchasing new clothing. We estimate, on a weighted average basis per rental garment, a net:
◦24% reduction in water usage,
◦6% reduction in kWh of energy usage, and
◦3% reduction in pounds of CO2 emissions.4
3American Indian or Alaskan Native, Asian, Black or African American, Hispanic/Latino, Native Hawaiian or other Pacific Islander, Middle Eastern or North African, or two or more races. While we recognize that these racial and ethnic categories do not reflect the complexities of an individual's identity nor do they acknowledge the systemic and historical exclusion of these communities, we use these categories for reporting as required by the U.S. Equal Opportunity Commission.
4 Percentage of savings are based on (a) the calculation of individual environmental impact of each category as presentedmay in the LCA Study, weighted by (b) the percentage of estimated total wears for each of the 12 categories, as measured from 2010 through 2021.
•Our rental model displaced the need for production of 1.3 million estimated new garments over the past decade.5
•As of June 2021, RTR performed 4.1 million garment repairs to extend the useful life of our rental garments, and diverted 1.1 million decommissioned rental items from going into a landfill via resale, donation or recycling.
•RTR launched our patented garment bag in 2014, setting a new standard for reusable packaging.
Social
•RTR equalized leave benefits across all hourly and salaried U.S. employees on our corporate, customer experience and warehouse teams in 2018.
•RTR has invested more than $1 million to support Black-owned businesses since June 2020.
•RTR increased the penetration of racial and ethnic minority designers featured on our platform from 4% of brands in the fall of 2020 to 10% in spring 2021. Furthermore, we increased the representation of racial and ethnic minority models featured on our platform from 40% in fiscal year 2019 to 54% in fiscal year 2020.
•RTR has prioritized diversity, equity, and inclusion in our U.S. employee population, and as of June 2021:
◦70% of employees identify as women and 57% of our employees identify as a racial and ethnic minority;
◦75% of the members of our executive team identify as women and 50% identify as a racial and ethnic minority; and
◦55% of our senior leadership identify as women and 45% identify as a racial and ethnic minority.
•55% of RTR’s Board of Directors identify as women.
The Nominating and ESG Committee of the Board of Directors oversees our ESG strategy and progress and receives regular updates from management. Our President and Chief Operating Officer directs the development and implementation of our sustainability strategy and initiatives and is supported by our Senior Director of Sustainability, who manages the program.
Seasonality
Historically, our business has been subject to seasonal fluctuation. We typically realize a higher portion of revenue from our Reserve rentals during our third and fourth fiscal quarter as a result of increased wedding and holiday events. However, in 2020 and 2021 we saw fewer large-scale holiday and special eventsfuture change due to the effects of COVID-19, pandemic.the macro environment, and business decisions. For our Subscription rentals, we typically acquire the highest number of subscribers in March through May and September through November, as these are the times customers naturally think about changing over their wardrobes. We generally see a higher rate of subscribers pause in the summer, and in mid-December through the end of January.
We also experience seasonality in the timing of expenses and capital outlays. Transportation expense, and therefore fulfillment cost, is typically highest in the fourth fiscal fourth quarter, given typical timing of carrier rate increases, higher service levels, such as more costly and expedited shipping, and competition during holidays. Our most significant product capital expenditures typically occur in the first fiscal quarter and the third fiscal quarter, when we acquire product for the upcoming fall and spring seasons, thoughseasons. However, the impact on cash is typically dependent on timing of receipt of product.
For additional information, see the section of Part I, Item 1A, “Risk Factors — Risks Relating To Our Business and Industry — Our business is affected by seasonality.”
5 Displacement by category was calculated by the total amount of wears of RTR products (or “Rental Wears”), then estimating how many garments otherwise would have been bought and worn in the traditional manner (which is not a rental model, known here as “Linear Wears”) had the RTR Rental Wears not taken place. Specifically, this displacement is calculated by (Rental Wears - Linear Wears) / Linear Wears. The displacement per category was then multiplied by the estimated number of units across all product categories from 2010 to 2021. Environmental savings are based on results of the LCA Study and specifically the net upstream production impact across 12 product categories assessed in the LCA Study: blouses, sweaters, skirts, jeans, pants, jumpsuits, daytime dresses, maxi dresses, gowns, cocktail dresses, jackets and coats. These categories represented approximately 85% of our 2019 product assortment. Examples of categories not included in our calculations include accessories and home goods. These savings calculations reflect the difference between the rental model and the full environmental cost of purchasing under the linear model, while the savings referenced below under “Environmental Savings”, reflect the difference in environmental savings between purchasing under a rental model as opposed to a linear model.
Competition
The fashion industry is highly fragmented and competitive. Our competitors include other fashion rental companies and also a range of traditional and online retail and resale fashion companies. Our ability to remain competitive depends on the continued shift from an ownership to an access model. While other competitors may change their business models and endeavor to expand into the rental and resale space, online fashion rental and resale presents unique operational and technical challenges.
We compete primarily on the basis of brand recognition, customer and brand partner experience, product mix and quality, quality of our e-commerce experiences and services, and price. Additionally, we experience competition for consumer discretionary spending from other product and experiential categories. We believe we are able to compete effectively because there are numerous trends in our favor that support the continued growth and success of online fashion rental. For example, key trends include consumers prioritizing access over ownership, consumers increasingly seeking variety and newness, growth in online shopping, an increasingly female workforce, and consumers valuing sustainability as it relates to fashion choices. See the section of Part I, Item 1A titled “Risk Factors — Risks Relating To Our Business and Industry — The global fashion industry is highly competitive and rapidly changing, and we may not be able to compete effectively.”
Government Regulation
We are subject to a wide variety of complex laws and regulations in the United States and other jurisdictions in which we operate. The laws and regulations govern many issues related to our business practices, including those regarding consumer protection, worker classification, wage and hour, sick pay and leaves of absence, anti-discrimination and harassment, whistleblower protections, background checks, privacy, data security,cybersecurity, intellectual property, health and safety, environmental, competition, fees and payments, pricing, product liability and disclosures, property damage, communications, employee benefits, taxation, unionization and collective bargaining, contracts, arbitration agreements, class action waivers, terms of service, and accessibility of our mobile app or website.
These laws and regulations are constantly evolving and may be interpreted, applied, created, superseded, or amended in a manner that could harm our business. These changes may occur immediately or develop over time through judicial decisions or as new guidance or interpretations are provided by regulatory and governing bodies, such as federal, state and local administrative agencies. As we expand our business into new markets or introduce new features or offerings into existing markets, regulatory bodies or courts may claim that we are subject to additional requirements, or that we are prohibited from conducting business in certain jurisdictions.
Additionally, because we receive, use, store, transmit, and disclose personal data relating to customers on our platform, we are subject to numerous laws and regulations in the United States and other countries where we do business, as well as industry standards, relating to privacy, data security and data protection, direct marketing, and online advertising. Such laws, regulations, and industry standards include, but are not limited to, Section 5(a) of the Federal Trade Commission Act, the Telephone Consumer Protection Act of 1991 and all regulations promulgated thereunder, the Controlling the Assault of Non-Solicited Pornography And Marketing Act of 2003, the California Consumer Privacy Act of 2018, the California Privacy Rights Act of 2020, the California Online Privacy Protection Act, and the Payment Card Industry (“PCI”) Data Security Standard.
See Part I, Item 1A, “Risk Factors — Risks Related to Our Legal and Regulatory Environment” for additional information about the laws and regulations we are subject to and the risks to our business associated with such laws and regulations.
Intellectual Property
Our intellectual property is an important component of our business. We rely on a combination of trademarks, copyrights, patents, trade secrets, license agreements, confidentiality procedures, non-disclosure agreements, employee non-disclosure and invention assignment agreements, and other legal and contractual rights, and policies and procedures, to establish and protect our proprietary rights.
As of January 31, 2022,2024, we had five issued patents in the United States that expire between 2031 and 2038 no allowed patent applications in the United States, and one patent application (including active PCT applications) pending in the United States and globally.three issued foreign patents. While we believe our patents and patent applications in the aggregate generally enhance our competitive position, no single patent or patent application is material to us as a whole.
We register our brand names and product names, taglines and logos in the United States to the extent we determine appropriate and cost-effective. As of January 31, 2022,2024, we had a total of 2625 registered trademarks in the United States and 4968 registered trademarks in non-U.S. jurisdictions.jurisdictions, as well as certain pending trademark applications. As of January 31, 2022,2024, we had also registered a total of 1115 copyrights. We also register domain names for certain websites that we use in our business, such as www.renttherunway.com, as well as similar variations to protect our brands and marks from cybersquatters.
We control access to and use of our proprietary technology and other confidential information through the use of internal and external controls, including contractual protections with employees, contractors, customers, and partners. It is our practice to enter into confidentiality and invention assignment agreements (or similar agreements) with our employees, consultants, and contractors involved in the development of intellectual property on our behalf. We also enter into confidentiality agreements with other third parties in order to limit access to, and disclosure and use of, our confidential information and proprietary information. We further controlalso place limitations on the use of our proprietary technology and intellectual property through provisions in our terms of service. We intend to pursueadopt additional actionsmeasures to establish and protect our intellectual property rights to the extent we believe it would be beneficial and cost effective.
Employees and Human Capital Resources
As of January 31, 2022,2024, we had a total of 958938 full-time employees and 138166 part-time employees in the United States and Ireland.Ireland, the majority of whom are based in our fulfillment centers in New Jersey and Texas. As of January 31, 2022,2024, our technology team consisted of 206140 employees, across engineering, data analytics, IT, product, software quality assurance, user experience and design, including a team of 5559 in Galway, Ireland, primarily in engineering and data analytics. Our investments in technology have matured our technology stack over time and enabled us to scale more efficiently and meet our technology goals while reducing our fiscal year 2023 technology headcount year over year. None of our employees are represented by a labor union or covered by collective bargaining agreements and we have not experienced any work stoppages.
We strive to make Rent the Runway a diverse, inclusive, and safe workplace, with opportunities for our employees to grow and develop in their careers, supported by competitive compensation and benefits programs. Our culture is underpinned by our Core Values, including that we are all Founders of Rent the Runway, and we all Dream BIG and go after it, adapt and learn from everything we do and debating, honest conversations and collaborating make the company stronger.
See “Our ESG (Environmental, Social and Governance) Impact Strategy” for more information about our values, goals and human capital measures and objectives.
Corporate Information
We were incorporated as Rent the Runway, Inc. in Delaware on March 3, 2009. We completed our initial public offering (“IPO”) in October 2021. For additional information regarding reclassification of our stockholder equity in connection with our IPO, see Note 2 - Summary of Significant Accounting Policies in the Notes to the Consolidated Financial Statements included in Part II, Item 8. Our Class A common stock trades on The Nasdaq Global SelectCapital Market (“Nasdaq”) under the symbol RENT. Our principal executive offices are located at 10 Jay Street, Brooklyn, New York 11201 and our website address is www.renttherunway.com.
We provide free access to various reports that we file with, or furnish to, the United States Securities and Exchange Commission (the “SEC”) through our website, as soon as reasonably practicable after they have been filed or furnished. These reports include, but are not limited to, our annual reports on Form 10-K, quarterly reports on Form 10-Q, current reports on Form 8-K, and any amendments to those reports. Our SEC reports can also be accessed through the SEC's website at www.sec.gov. Also available on our website are printable versions of our Code of Conduct, Corporate Governance Guidelines and charters of the standing committees of our board of directors.
Our Code of Conduct applies to all of our directors, officers and employees, including our principal executive officer, principal financial officer, principal accounting officer and controller, or persons performing similar functions. A copy of the code is available on our Investor Relations website at investors.renttherunway.com in the “Governance” section. In addition, we intend to post on our website all disclosures that are required by law or by Nasdaq rules concerning any amendments to, or waivers from, any provision of our Code of Conduct.
Information on our website does not constitute part of this Annual Report on Form 10-K or any other report we file or furnish with the SEC.
Item 1A. RISK FACTORS
Investing in our Class A common stock involves a high degree of risk. You should consider and read carefully all of the risks and uncertainties described below, as well as other information included in this Annual Report on Form 10-K, including our consolidated financial statements and related notes appearing elsewhere in this filing, before making an investment decision. The risks described below are not the only ones we face. The occurrence of any of the following risks or additional risks and uncertainties not presently known to us or that we currently believe to be immaterial could materially and adversely affect our business, financial condition, or results of operations. In addition, the impacts of the COVID-19 pandemic may exacerbate the risks described below as well as risks and uncertainties not presently known to us.
Risks Related to Our Business and Industry
We have grown rapidly in recent years and have limited experience at our current scale of operations.operations and our historical growth rates are not necessarily indicative of our future performance. If we are unable to drive future growth or manage our growth effectively, our brand, company culture, and financial performance may suffer.
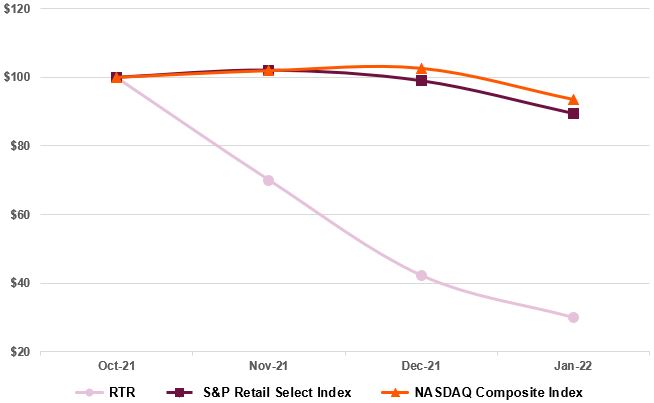
We have grown rapidly overin the last several years, due in large part to the growth in demand for our Subscription offerings, and therefore,offerings; however, our recenthistorical growth rates and financial performance should not necessarily be considered indicative of our future performance. The COVID-19 pandemic materially adversely affected our fiscal year 2020 operating and financial results, resulting in our total revenue decreasing 38.7% from $256.9 million in fiscal year 2019 to $157.5 million. During fiscal year 2021, revenue has sequentially increased each quarter. Revenue for fiscal year 2021 increased 29.1% to $203.3 million from $157.5 million in fiscal year 2020. To effectively manage and capitalize on our growth, we must continue to expand our brand awareness and marketing, enhance customer experience and attract and retain customers (particularly subscribers), iterate our subscription products, invest in digital consumer innovation, expand our brand awareness and marketing, and upgrade our management information and reverse logistics systems and other processes. Our continued growth hasand growth strategies have in the past strained, and could in the future strain, our existing resources, and we could experience ongoing operating difficulties in managing our business across numerous jurisdictions, including difficulties in hiring, training, and managing a diverse and growing employee base. Failure to scale and preserve our company culture as we grow could also harm our future success, including our ability to retain and recruit personnel and to effectively focus on and pursue our corporate objectives.
Our growth strategy is focused on continuing to grow, engage, and retain our subscriber and customer base, expanding our brand partner relationships and product assortment, increasing our brand awareness, advertising and other marketing spending, and continuing to invest in our offerings and technology. The majority of our revenue is generated by our subscribers. Our base subscription plans range in price and customers can customize their subscription monthly by purchasing additional slots and shipments. Our subscriptions renew automatically on a monthly basis and subscribers may disable automatic renewal by canceling or pausing their subscription prior to the next month’s bill date. As a result, even though a significant number of subscribers have historically renewed their monthly subscription, there can be no assurance that we will be able to retain a significant portion of subscribers beyond the existing monthly subscription periods. In addition, any limitation or restriction imposed on our ability to bill our subscribers on a recurring basis, whether due to new regulations or otherwise, may significantly lower our subscription retention rate. We also offer our customers the option to rent or buy items via our Reserve offering and Resale offering, respectively. Our subscriptionSubscription plans and offerings do not have demonstrably long track records of success and may not grow as much or as fast as we expect. IfFor example, our active subscriber growth rate decreased year over year in fiscal year 2023 and, although we are focused on growth initiatives, may continue to decline in the future. In addition, our annual revenue was roughly flat year-over-year in fiscal year 2023. We presently anticipate a modest increase in our year-over-year revenue growth rate in fiscal year 2024; however, if our growth rate declines, investors’rates continue to decline, the perception of our business, financial condition and results of operations by investors and our third-party service providers and brand partners may be adversely affected. To the extent our growth rate slows, our business performance will become increasingly dependent on our ability to retain revenue from existing subscribers and increase sales to existing customers.
The fashion industry is rapidly evolving and our business may not develop as we expect. Overall growth of our revenue will depend on a number of factors, including our ability to:
•change traditional consumer buying habits and normalize clothing subscription, rental and resale;
•price our subscription,Subscription, Reserve and Resale offerings so that we are able to attract new customers, and retain and expand our relationships with existing customers;
•accurately forecast our revenue and plan our fulfillment, operating expenses and capital expenditures;
•ensure that we maintain an adequate depth and breadth of available products to meet evolving customer demandsdemand and respond swiftly and appropriately to new and changing styles, trends or desired consumer preferences;
•accurately forecast our revenue and plan our fulfillment, operating expenses and capital expenditures;
•provide customers with a high-quality, seamless user experience and order fulfillment, as well as customer service and support that meets their needs;
•acquire customers into varying levels of subscription programs at different price points;
•improve our website and app performance and successfully identify and acquire, partner or invest in products, technologies, or businesses that we believe could complement or expand our business;
•successfully maintain and grow our relationships with existing and new brand partners, including continuing to maintain and grow our Share by RTR and Exclusive Design offerings;
•avoid disruptions in acquiring and distributing our products and offerings, including maintaining sufficient rental product levels to support demand;offerings;
•provide customers with a high-quality experience, including customer servicebe effective and support that meets their needs;efficient in our paid marketing;
•maintain and enhance our reputation and the value of our brand;
•hire, integrate and retain talented personnel across all levels of our organization;
•successfully compete with other companies that are currently in, or may in the future enter, the industry or the markets in which we operate, and respond to developments from these competitors such as pricing changes and the introduction of new offerings;
•comply with existing and new laws and regulations applicable to our business;
•successfully expand into new and penetrate existing geographic markets in the United States;
•successfully develop new offerings and innovate and enhance our existing offerings and their features, including in response to new trends, competitive dynamics or the needs of customers and subscribers;
•effectively manage growth of our business, personnel, and operations, including expanding our shipping and distribution networkcapabilities and fulfillment center operations, as well as our logistics footprint and the number of facilities we operate in the future;
•effectively manage our costs related to our business and operations; and
•avoid or manage interruptions in our business from information technology downtime, cybersecurity incidents and other factors that could affect our physical and digital infrastructure; and
•successfully identify and acquire, partner or invest in products, technologies, or businesses that we believe could complement or expand our business.infrastructure.
Because we have a limited history operating our business at its current scale, it is difficult to evaluate our current business and future prospects, including our ability to plan for and model future growth. Our limited operating experience at this scale, combined with the rapidly evolving nature of the market in which we sell our offerings, substantial uncertainty concerning how these markets may develop, and other economic factors beyond our control, reduces our ability to accurately forecast quarterly or annual revenue. Failure to manage our future growth effectively could have an adverse effect on our business, financial condition, and results of operations.
We also expect to continue to expend substantial financial and other resources to grow our business, and we may fail to allocate our resources in a manner that results in increased revenue growth in our business. Additionally, we may encounter unforeseen capital or operating expenses, difficulties, complications, delays, and other unknown factors that may result in losses in future periods.periods and undermine our profitability goals. If our revenue growth does not meet our expectations in future periods, our business, financial condition, and results of operations may be harmed, and we may not achieve or sustain profitability in the future.
The COVID-19 pandemic has had, and may in the future continue to have, a material adverse impact on our business.
The COVID-19 pandemic and the travel restrictions, quarantines, and related public health measures and actions taken by governments and the private sector have adversely affected global economies, financial markets and the overall environment for our business, and the extent to which it may continue to impact our future results of operations and overall financial performance remains uncertain. New variants of COVID-19, such as Delta and Omicron, continue to be identified and lead to evolving recommendations and restrictions by workforces and federal, state and local government officials. The global macroeconomic effects of the pandemic may persist for an indefinite period of time, even after the pandemic has subsided. In addition, we cannot predict the impact the COVID-19 pandemic has had and will have on our brand partners, manufacturers, vendors and other third-party service providers, and we may continue to be materially adversely impacted as a result of the negative past, present and future impact upon these parties.
The COVID-19 pandemic materially adversely affected our operating and financial results during fiscal year 2020 due to the occurrence of the following events or circumstances, among others:
•the global shelter-in-place restrictions significantly reduced our number of Active Subscribers and engagement with all of our offerings because of the decrease in special events, social gatherings and interactions outside the home;
•a significant number of subscribers paused or canceled their subscriptions or downgraded to lower-priced plans, and we experienced significant decreased demand for our Reserve offering and customers canceled their existing orders for special events;
•subscribers engaged less, which impacted the success of our organic marketing and reduced the volume of our data and business insights;
•disruptions of the operations of our brand partners and delays in shipment and delivery of our products;
•pausing all of our paid marketing spend and eliminating or significantly reducing investments in growth initiatives;
•carrying more products relative to customer demand, negatively impacting gross margins;
•performance-based revenue share payments to brands were decreased due to lower total revenue, impacting our brand partner relationships and value proposition;
•implementing temporary salary cuts, employee layoffs and furloughs, and pausing recruiting efforts, which negatively impacted employee morale and resulted in an increase in regrettable employee attrition; and
•the closure of our brick-and-mortar retail stores, which was perceived negatively by some customers.
In fiscal year 2021, our operating and financial results continued to be impacted by the COVID-19 pandemic. In the fourth quarter of fiscal year 2021, the Omicron variant negatively impacted us in three key ways by:
•significantly decreasing revenue from our Reserve business as most holiday events were canceled;
•reducing subscriber acquisition in the second half of the quarter; and
•driving a higher rate of subscriber pause.
In fiscal year 2021, results also continued to be impacted by consumers working primarily from home and by special events and occasions not yet being back to pre-pandemic levels.
As the recovery period continues, particularly in the United States, the effects of the COVID-19 pandemic, including the identification and spread of new variants of the virus, may continue to have a negative impact on our business operations and long-term financial results of operations due to the occurrence of the following events or circumstances, among others:
•the difficulty in accurately predicting the timing of potential new variants and/or the pace of our business recovery, particularly changes in demand, subscriber levels and pause activity, and Reserve and Resale orders, leading to potentially over-spending and lower profitability if demand and engagement are not as expected;
•our inability to meet increased demand and provide an optimal customer experience as a result of difficulty in hiring additional employees, particularly in our fulfillment, operations and customer experience functions;
•continuing supply chain disruptions and/or disruptions in the operations of our brand partners, which could impact our ability to acquire an adequate depth and breadth of products at favorable prices in a timely manner to match demand; and
•possible resurgences of the COVID-19 pandemic that lead to new or additional shelter-in-place orders, travel advisories, and/or reduced social activities and events, which may dampen future demand for our products and offering.
The continued scope and duration of the pandemic, whether additional actions may be taken to contain the virus, the impact on our customers and partners, the speed and extent to which markets fully recover from the disruptions caused by the pandemic, and the impact of these factors on our business, will depend on future developments that are highly uncertain and cannot be predicted with confidence. In addition, to the extent COVID-19 adversely affects our operations and global economic conditions more generally, it may also have the effect of heightening many of the other risks described in these Risk Factors.
Although we anticipate that our operating results in future fiscal years will begin to reflect a more normal operating environment, the current economic and public health climate has created a high degree of uncertainty and there is no assurance that our scale, number of customers and revenue will return to or surpass pre-pandemic levels for a sustained period of time. As such, we continue to closely monitor this global health crisis and will continue to reassess our strategy and operational structure on a regular, ongoing basis as the situation evolves. See Part II, Item 7, “Management’s Discussion and Analysis of Financial Position and Results of Operations” for more details on the impact of the COVID-19 pandemic.
The global fashion industry is highly competitive and rapidly changing, and we may not be able to compete effectively.effectively.
We compete with other fashion rental companies and also with a range of traditional and online retail and resale fashion companies and we expect competition to continue to increase in the future. To be successful, we need to continue to attract and retain customers and brand partners.
We believe our ability to compete effectively depends on many factors within and beyond our control, including:
•our ability to normalize fashion rental and change traditional retail shopping habits and norms;
•how effectively differentiated our offerings, customer experience and value proposition are from those of our competitors;
•how effectively we market and communicate how to use our Subscription, Reserve and Reserve offerings;Resale offerings and attract and retain customers;
•our ability to expand and maintain an appealing depth and breadth of our products to meet customer demand;
•the price at which we are able to offer our Subscription, Reserve and Resale offerings;
•the amount, diversity, and quality of brands that we or our competitors offer;
•our ability to acquire products on favorable and efficient terms, including our ability to attract new brand partners and retain existing brand partners in our Share by RTR and Exclusive Design programs and acquire products on favorable and efficient terms;programs;
•the speed and cost at which we can deliver products to our customers and the ease with which they can return our products;
•the effectiveness of our customer service;
•further developing our data science capabilities for brand partners;
•the strength of our brand, including maintaining favorable brand recognition and effectively marketing our services and value proposition to customers;
•the amount, diversity, and quality of brands that we or our competitors offer;
•the price at which we are able to offer our Subscription, Reserve and Resale offerings;
•the success of our reverse-logistics processes in delivering products in good condition to customers; and
•anticipating and successfully responding to changing apparel trends and consumer shopping preferences.
Many competitors or potential competitors have or may have longer operating histories, greater brand recognition, existingbetter user experiences, stronger consumer and supplier relationships, less complicated business models, and significantly greater financial, marketing and other resources. In addition, they may be able to innovate and provide products and services faster and with more selection than we can, including as a result of their vertical integrations that better enables them to acquire market share. TheyCertain fashion rental competitors have lower priced subscription offerings than we do and/or offer more items per shipment. In addition, competitors and potential competitors may be willing to price their products and services more aggressively in order to gain market share or generally employ a low-cost pricing model and be able to manufacture goods on a more cost-effective basis because they are vertically integrated, producing higher volumes, andand/or have stronger relationships with manufacturing partners. In addition, brands set pricing for their own new retail items, which can include promotional discounts that may adversely affect the relative value of rental and/or resale items offered by us, and, in turn, our revenue, results of operations and financial condition. Additional competitors are expanding and may continue to expand into the rental and resale space in which we operate and we remain vulnerable to the marketing power and high level of customer recognition of these larger competitors and to the risk that these competitors or other smaller entrants could attract our customer base.
Furthermore, we are revolutionizing the fashion industry by changing the way women get dressed. Although we believe that there are numerous trends in our favor that support the continued growth and success of online fashion rental, changing traditional retail and e-commerce shopping habits is difficult, particularly the shift from an ownership to an access model. Our business model may not achieve acceptance as broadly and within the time frame that we expect by customers and brand partners. In addition, the trends in our favor may evolve and no longer provide compelling support for our business model. If online fashion rental does not achieve broad acceptance by consumers and our brand partners, our growth could be limited and our competitiveness hampered.
Our inability to respond effectively to competitive pressures, improved performance by our competitors, failure to achieve broad acceptance and changes in the fashion retail markets could result in lost market share and have a material adverse effect on our business, financial condition, and results of operations.
We rely on consumer discretionary spending and have been, and may in the future be, adversely affected by economic downturns and other macroeconomic conditions or trends.
We are subject to variable industry and global economic conditions and their impact on consumer discretionary spending. Some of the factors that may negatively influence consumer spending include high levels of unemployment; recession; higher consumer debt levels; inflation; reductions in net worth, declines in asset values, and related market uncertainty; home foreclosures and reductions in home values; fluctuating interest rates and credit availability; fluctuating fuel and other energy costs; fluctuating commodity prices; and general uncertainty regarding the overall future political and economic environment. We have experienced many of these factors due to the recent volatile macroeconomic environment and have seen negative impacts on customer demand at varying levels as a result.
Furthermore, increases in consumer discretionary spending tend to fluctuate and may decrease, particularly if there is a recession and/or higher inflation leading to increased price sensitivity. Economic conditions in certain regions may also be affected by natural disasters, such as hurricanes, tropical storms, earthquakes, and wildfires; other public health crises; wars, terrorism and political tensions; and other major unforeseen events. Although we believe the value proposition of our offering and business model may be strengthened in an inflationary environment where the cost of purchasing clothing and accessories increases, consumer purchases or rental of discretionary items, including the products that we offer, frequently decline during recessionary periods or periods of economic uncertainty, when disposable income is reduced or when there is a reduction in consumer confidence.
Additionally, adverse economic changes could reduce consumer confidence, and could thereby negatively affect our operating results. In the event of a prolonged economic downturn or acute recession, significant inflation, or increased supply chain shortages, consumer spending habits could be adversely affected, and we could experience lower than expected revenue, net income, and Adjusted EBITDA. In challenging and uncertain economic environments, we cannot predict the degree of uncertainty, whether or when such circumstances may improve or worsen or what impact such circumstances could have on our business. Any of these developments could harm our business, financial condition and results of operations.
Our continued growth depends on our ability to attract new, and retain existing, customers, which may require significant investment in paid marketing channels. If we are unable to cost-effectively grow our customer base, our business, financial condition and results of operations would be harmed.
The growth of our business is dependent upon our ability to continue to grow by cost-effectively adding new customers and retaining existing customers. Historically, a substantial portion of new customer acquisition has originated from organic word-of-mouth and other non-paid referrals. Our current marketing initiatives are focused on re-engaging lapsed and paused customers, retaining existing customers and growing our base of new customers.In addition, in fiscal year 2024, we are focused on growing traffic and conversion rates and refreshing our lifecycle marketing engine. Although we will continueexpect to encouragemake significant investments in these areas going forward, these investments may not result in an increase in customer engagement, loyalty or higher customer engagement. As a result, our levels of paid and word-of-mouth referrals, there is no guarantee that we will be successful and our organic growth may continue to fluctuate and/or overall growth may decline.
Paid marketing is also a key part of our growth strategy and while we previously paused paidare currently focused on enhancing our current processes and approach, including by continuing to leverage technology to measure our effectiveness and efficiency. During 2023, we allocated a portion of our budgeted marketing during portionsexpense to rental product purchases in the second half of 2023. We believe this change negatively impacted subscriber acquisition in the third and fourth quarters of 2023. We also utilize promotional pricing to attract customers and subscribers who may have heightened price sensitivity and not be willing to pay full price for our offering when the promotion period expires. In the third quarter and fourth quarters of 2023, we reduced promotional pricing for Subscription, which we believe negatively impacted subscriber acquisition. However, we believe that being less promotional going forward will enhance retention and customer experience and is in the best interest of the pandemic as along-term health of the business. This approach may not be successful or sustainable and is likely to result of COVID-19,in lower subscriber acquisition in the short term. In addition, it is likely that we have increasedwill conduct additional experiments and may make changes to our spendingpromotions strategy in the future, depending on market conditions and plan to significantly increase spending and run marketing campaigns to acquire additional subscribers and customers, all of which could impact our overall profitability.other factors. We may incur marketing expenses significantly in advance of the time we anticipate recognized revenue associated with such expenses,expenses. In addition, our paid marketing may be unsuccessful for various reasons, including not effectively reachreaching potential customers or being cost-effective (particularly as costs increase for performance marketing), changes in regulations (e.g., privacy) or third-party interference could limit the abilityeffectiveness of search engines, and social media platforms, and other tools for marketing, potential customers may decide not to rent through our platform or the spend of new customers may not yield the intended return on investment, any of which could negatively affect our results of operations. MoreoverIn addition, the success of our marketing initiatives overall depends upon our marketing team and leadership, which has experienced recent transition as we focus on building creative and strategic talent on the team. If our team building efforts or marketing strategies are not successful or are not executed successfully, our growth may decline and we may not achieve our profitability goals.
Further, customer preferences may change and customers may not rent through our platform as frequently or spend as much with us. We strive to drive conversion of new subscribers from current and former customers; however, if their behavior changes or they are not satisfied with our offering for any reason, our ability to grow subscribers may be impacted. If we are not able to continue to expand our customer base through cost-effective methods, we may not meet our revenue and profitability goals, our revenue may grow slower than expected or decline.decline, and investors may lose confidence in our business. Relatedly, an inability to attract and retain customers could harm our ability to attract and retain brand partners, who may decide to partner with alternative platforms.
If we fail to retain customers, our business, financial condition, and results of operations would be harmed.
A high proportion of our revenue comes from highly engagedlonger-tenured subscribers. A decrease in the number of existing customers, their tenures with us, and/or a reduction in the amount existing customers spend on our offerings could negatively affect our operating results.
Our number of customers and the amounts they spend on our offerings may decline materially or fluctuate as a result of many factors, including, among other things:
•the quality, consumer appeal, price, and reliability of our offerings;
•dissatisfaction with changes we make to our offerings and products;
•the perceived value of our offerings, especially in response to price increases;increases and changes in the macroeconomic environment;
•our ability to quality control the products delivered to our customers and their fit;
•ensuring on-time delivery of orders;
•the ease with which customers can find items they are looking for;for, including the effectiveness of our search and discovery tools and rental product availability;
•the performance of our website and mobile app, including site speed and reliability;
•a negative customer service experience;
•intense competition in the fashion industry;
•negative publicity that impacts our brand and reputation;
•changes in consumer preferences regarding the use of pre-loved apparel;
•lack of market acceptance of our business model;
•the unpredictable nature of the continued impact of the COVID-19 pandemic or a future outbreak of disease or similar public health concern;
•the failure (or perceived failure) to meet customer expectations regarding our environmental, social and governance (“ESG”), initiatives; and
•changes in efficiency of our historic or current customer acquisition methods.
If existing customers no longer find our offerings and products appealing, or appropriately priced or easy to use, or if we are unable to provide high-quality support to customers to help them resolve issues in a timely and acceptable manner, they may stop using our offerings, negative publicity may be generated and word-of-mouth and other referrals may be hampered. For example, we recently announced a price increase for our subscription plans. If our customers no longer perceive our subscription plans as appropriately priced and cancel or pause their subscriptions, our business and financial results could be harmed. We are focused on investing in our customer and delivering even more value to her, including by adding an extra item to each shipment since the first quarter of fiscal year 2023, increasing the depth and breadth of our rental product selection, and emphasizing the value proposition of our offering in our marketing materials; however these or other initiatives to retain customers may not be successful at improving customer satisfaction, subscriber retention and/or revenues and may require additional costs or lead to unanticipated consequences. Even if our existing customers continue to find our offerings and products appealing and our customer service satisfactory, they may decide to downgrade to a less frequent, lower cost subscription andand/or rent fewer items over time as their demand for apparel and accessories declines. For example, as a result of changes to daily life due to the COVID-19 pandemic, including increased rates of working remotely from home, many customers’ demands for a variety of apparel was, and in the future may be, reduced price sensitivity and/or eliminated.changing demand or other reasons. If customers who rent most frequently and rent a significant amount of items from us were todowngrade their subscriptions or make fewer or lower priced rentals, or stop using our offerings, our financial results could be negatively affected.
We have a history of losses, and we may be unable to achieve or sustain profitability.
We had a net loss of $(171.1)$(113.2) million and $(211.8)$(138.7) million for the years ended January 31, 20212024 and January 31, 2022,2023, respectively, and have in the past had net losses. As of January 31, 2022,2024, we had an accumulated deficit of $(801.2)$(1,053.1) million. Because we have a short operating history at scale, it is difficult for us to predict our future operating results. We will need to generate and sustain increased revenue and manage our costs to achieve profitability. Even if we do, we may not be able to sustain or increase our profitability.
Our ability to generate profit depends on our ability to grow revenuescustomers and revenue and drive operational efficiencies in our business to generate better margins. We expectIn fiscal years 2022 and 2023, we took significant steps to incur increasedreduce our operating costs, improve our margins, and make progress towards profitability, which is an important financial goal for us over time. Nevertheless, our efforts may be unsuccessful and we may continue to generate net losses in the near term in order to:
•acquire products;rental product, which impacts rental product depreciation and revenue share expenses;
•fulfill customer orders and provide customer service;
•increase the engagement, enhance retention and improve the experience, of customers;
•drive customer acquisition and brand awareness through marketing and promotional initiatives;
•invest in technology, including to enhance our website and mobile offerings and functionality;
•attract, motivate and retain our employees;
•develop new offerings;
•generally support a larger customer base; and
•invest in our operations, including our logistics fulfillment, capacity and capacity,footprint, and other capital expenditures to support the growth in our business.
We may discover unanticipated costs or that these initiatives are more expensive than we currently anticipate, and we may not succeed in increasing our revenue sufficiently to offset these expenses or realize the benefitsoperating efficiencies and profitability we anticipate. We will also expect to face greater compliance costs over time associated with the increased scope of our business and being a public company. Any failureIf we are not able to adequately increase revenue or manage operating costs could prevent us from achieving or sustaining profitability. We may not realize the operating efficiencies we expect to achieve through our efforts to scale the business, reduce friction in the rental experience, and optimize costs. As such, due to theseother factors and others,outside of our control, we may continue to incur net losses and not be able to achieve or sustain profitability in the near term or at all. If we are unable to achieve or sustain profitability, the value of our business and the trading price of our Class A common stock may be negatively impacted.
If we fail to anticipate and respond successfully to new and changing fashion trends and consumer preferences and accurately forecast consumer demand, our business could be harmed.
Our success is, in large part, dependent upon our ability to identify fashion trends, predict and gauge the tastes of our customers, and provide availability of items and a service that satisfies customer demand in a timely manner. However, lead times for many of our purchasing and design decisions may make it difficult for us to respond rapidly to new or changing apparel trends or customer acceptance of products chosen by us. We generally enter into contracts with our designer brand partners in advance of anticipated rentals and typically before apparel trends are confirmed by customer rentals.
We have not always predicted our customers’ preferences and acceptance levels of our products with accuracy. We have observed that our customers live, work, socialize and travel differently than they did prior to the COVID-19 pandemic and that these behaviors continue to evolve, which influences what they wear and has made trend predictions challenging. We may misjudge demand and over or under purchase rental product. In addition, external events may disrupt or change customer preferences and behaviors in ways we are not able to anticipate. For example,During the COVID-19 pandemic has resulted in significant changes to daily life, working arrangements,second quarter of 2023, lower rental product depth levels negatively impacted active subscribers, particularly new subscribers, and social events, which has impactedwe have focused our efforts on improving and maintaining rental product depth levels during the typethird and fourth quarters of apparel our customers seek to rent. We generally enter into purchase contracts in advance of anticipated rentals and typically before apparel trends are confirmed by customer rentals. We have not always predicted our customers’ preferences and acceptance levels of our products with accuracy.
Additionally, our success is dependent on the ability of our brand partners to anticipate, identify and respond to the latest fashion trends and consumer demands and to translate such trends and demands into product options in a timely manner. The failure of our brand partners to anticipate, identify or respond swiftly and appropriately to new and changing styles, trends or desired consumer preferences, to accurately anticipate and forecast demand for certain product offerings or to provide relevant and timely product offerings to rent on our platform may lead to lower demand for our offerings, which could have a material adverse effect on our business and financial condition.
Further, although we use our data and business insights to predict our customers’ preferences and gauge demand for our products, there is no guarantee that our data and business insights will accurately anticipate demand. ToAs has occurred in the extent we misjudgepast, if our teams do not predict customer demand and tastes well or if our algorithms do not help us reorder the market forright products or write off the service we offer or fail to execute on trends and deliver attractiveright products to customers,in a timely manner, we may not effectively attract and retain customers effectivelyor manage our products and our operating results will be adversely affected.
Shipping and logistics are a critical part of our business and our supply chain and any changes or interruptions in shipping or logistics operations could adversely affect our operating results.
We currently primarily rely on several third-partya national and regional shipping vendorscarrier for our outbound and inbound logistics. A substantial portion of our shipmentsHowever, we continue to maintain relationships with tier two and from customers are currently conducted through a single vendor—we havetier three carriers in order to provide redundancies and manage potential shipping disruptions from time to time transitioned, and are currentlytime. While we have confidence in the process of transitioning, shipments from this vendor to multiple other vendors, andour current strategy, we cannot predict changes in market conditions or how this transitionrelying on a single national carrier may impact our costs and our customer sentiment and satisfaction.satisfaction, which could lead to unanticipated costs and/or have a material adverse effect on our business and financial condition.
Additionally, our business relies on the successful management of reverse logistics needed to ingest, clean, and restock returned items quickly and efficiently in order to offer them for rental or resale to other customers. If we are not able to maintain appropriate staffing levels or negotiate acceptable pricing and other terms with thesethird-party vendors or they experience performance problems or other difficulties, our operating results and customers’ experience could be negatively impacted.
Our ability to receive inbound products efficiently and ship products to and from customers may be negatively affected by many events outside of our control, including inclement weather, public health crises such as the COVID-19 pandemic, governmental regulations, labor disputes and other factors. We are also subject to risks of damage or loss during delivery by our shipping vendors. If our customers do not receive their orders in good condition or on time, they could become dissatisfied and cease using our services, which would adversely affect our business and operating results. Our shipping vendors have faced and may continue to face increased volumes which, in turn, has caused and could in the future cause a decrease in their service levels, including shipping delays, or result in an increase ofin their prices. We have recently experienced increased shipping costs in recent years, and these costs may continue to increase in the future. In addition, although we have achieved efficiencies in our supply chain operations in recent years, these efficiencies may not be sustainable or meet our broader business objectives. Increases in shipping costs, or otherin particular for our primary shipping vendor, could result in increased costs to us and adversely impact our business. In addition, significant shipping difficulties or disruptions or any failure by our brand partners or third-party carriers to deliver high-quality products to us or to our customers, as applicable, in a timely manner or to otherwise adequately serve our customers could damage our reputation and brand and may substantially harm our business.
In addition to offering the ability to return products through ourby dropping off items with third-party shipping vendors, we offer multiple physical drop-off pointsat-home pickup for customers located in certain cities, including,multiple markets. We believe at-home pickup is more convenient for example, New York City, Boston, Nashville, Houston,many customers. Although we have had positive customer feedback and San Franciscoadoption to return their orders.date, at-home pickup is a newer offering and may not be successful over the long-term. In the event that we do not successfully and cost-effectively manage theseat-home pickup logistics, it will make it more difficult for us to maintain our products, and satisfy our customers and efficiently manage shipping costs, which will negatively affect our brand, financial condition and results of operations.
If we are unable to accurately forecast customer demand, acquire and manage our products effectively and plan for future expenses, our operating results could be adversely affected.
We are vulnerable to demand and pricing shifts and to suboptimal selection and timing of product purchases. We obtain substantially all of our products directly from over 780hundreds of brand partners through three key ways: 1) Wholesale, 2) Share by RTR, and 3) Exclusive Designs. For our business to be successful and have sufficient product to meet consumer demand, our brand and manufacturing partners must be willing and able to provide us with products in specific quantities and styles of sufficient quality, in compliance with regulatory requirements, at acceptable costs and payment schedules and on a timely basis. We typically do not enter into long-term contracts with our brand and manufacturing partners and, as such, we operate without significant contractual assurances of continued supply, pricing or access to products. Although we believe we have had limited voluntary attrition of brand partners to date, a brand partner could choose to no longer work with us or provide less favorable terms for a variety of reasons, including as a result of the COVID-19 pandemiccurrent operating, financial, market and resulting impacts.supply chain conditions. In addition, some of our brand partners may not have the capacity to supply us with sufficient products to keep pace with our growth plans, especially if we plan to demand significantly greater amounts of products. In such cases, our ability to pursue our growth strategy will depend in part upon our ability to expand capacity with existing brand partners or develop new brand partnerspartner relationships.
During fiscal year 2021, we expanded
We have been focused on expanding our relationships with brand partners and we are continuing to work to increase the proportion of our products procured under Exclusive Designs and Share by RTR arrangements, which reducesare our upfront costmore capital-efficient ways of products.acquiring rental product. For our Exclusive Designs, RTR generally sources the materials and relies upon third-party manufacturing partners to produce products. For Wholesale and Share by RTR items, entering into contracts in advance of a particular season requires brand partners to agree to incur costs related to sourcing and manufacturing products before we have paid for them, which requires the brand partners to continue to trust us. If we were viewed as less financially viable by our brand partners and/or their financing partners or factoring companies, including as a result of our Nasdaq listing compliance and status, we may receive less favorable terms and conditions from our brand partners, including requiring upfront payments or other demonstrations of credit. The cash flow benefits we currently experience from our brand partners’ willingness to revenue share could be adversely affected if revenue share terms change or if brand partners no longer wish to revenue share due to (1) lack of trust in us, (2) lack of revenue earned in comparison to the projections we provided, or (3) their inability to continue to spread their earnings out over the time period that the products are earning revenue on our website, among other reasons. For our Exclusive Design arrangements, we must continue to increase the number of brand partners with whom we work, design an assortment of styles that meet customer demand, maintain and enhance our third-party manufacturing capabilities and partnerspartner relationships and ensure the products manufactured meets brand partners’, customers’ and our quality standards. Our ability to obtain a sufficient selection or volume of products on a timely basis at competitive prices could suffer as a result of any deterioration or change in our partner relationships or events that adversely affect them and, in turn, could have a material adverse effect on our business.
We also procure and manufacture products outside of the United States. Global sourcing and foreign trade involve numerous factors and uncertainties beyond our control including increased shipping costs, limitations in factory capacity, the imposition of additional import or trade restrictions, including legal or economic restrictions on overseas brand partners’ or manufacturers’ ability to produce and deliver products, increased custom duties and tariffs, unforeseen delays in customs, more restrictive quotas, loss of a most favored nation trading status, currency exchange rates, transportation delays, foreign government regulations, political instability and economic uncertainties in the countries from which we or our brand partners source our products. As a result of the COVID-19 pandemic, most of our product sourcing in fiscal years 2020 and 2021 was handled remotely via video and teleconference instead of in-person. Future extended disruptions in travel may limit our ability to source products in-person, which may lead to suboptimal products and harm our business. For the next several quarters, we anticipate facing, and having to address challenges relating to, inefficiencies in the global transportation network as a result of the COVID-19 pandemiceconomic uncertainty and trends that may also impact our business operations.operations, including transportation efficiencies. Additionally, oil supply disruptions related to Russia’s invasion of Ukraine have led and could continue to lead to increased fuel and shipping prices. Further, certain trade restrictions related to the Xinjiang region of China that impose a ban on virtually all imports from that region could affect the sourcing and availability of raw materials, such as cotton, used in the manufacturing of certain products.products and lead to our products and materials and those of our brand and/or manufacturing partners being held for inspection by the United States Customs & Border Patrol and delayed or rejected for entry, which could adversely impact the customer experience and our business. In addition, negative press or consumer sentiment about internationally sourced products may lead to reduced demand for our products. These and other issues affecting our international brand partners, manufacturers or internationally sourced products could have a material adverse effect on our business, financial condition, and results of operations.
We also rely on our merchandising team to order styles that our customers will rent and we rely on our data science to inform the levels of and which products we purchase, including when to reorder items that are renting well and when to sell or write-off items that are not renting well. If our teams do not predict customer demand and tastes well or if our algorithms do not help us reorder the right products or write off the right products timely, we may not effectively manage our products and our operating results could be adversely affected.
Furthermore, we must execute our cleaning and repair protocols and reverse logistics operations efficiently and at a significant scale to maximize the utilization of units and reduce the number of units purchased, the failure of which may adversely affect our operating results. We cannot control products while they are out of our possession or prevent all damage while in our fulfillment centers, during shipping, or while with customers, third-party suppliers or partners. We may incur additional expenses and our reputation could be harmed if customers and potential customers believe that our products are not of high quality or may be damaged.
If we fail to maintain and enhance our brand, our ability to attract and retain customers will be impaired and our business, financial condition, and results of operations may suffer.
Maintaining and enhancing our appeal and reputation as a stylish, revolutionary and trusted brand is critical to attracting and retaining customers and brand partners. The successful promotion of our brand and awareness of our offerings and products will dependdepends on a number of factors, including our marketing efforts, ability to continue to develop our offerings and products, the quality and appeal of our products, and ability to successfully differentiate our offerings from competitive offerings. We expect to invest substantial resources to promote and maintain our brand, but there is no guarantee that our brand development strategies will enhance the recognition of our brand or lead to increased customer acquisition and sales. The strength of our brand will dependdepends largely on our ability to provide a compelling customer value proposition for our rental and resale offerings and continued customer engagement and word of mouth organic marketing. BrandOur efforts to improve our customer experience may not be successful. In addition, brand promotion activities may not yield increased revenue, and even if they do, the increased revenue may not offset the expenses we incur in promoting and maintaining our brand and reputation.
Furthermore, whether accurate or not, negative publicity about our business, operations, or employees, and customer complaints has in the past, and could in the future, harm our reputation, customer trust and referrals of our services, brand partner confidence, vendor confidence, employee morale and culture, and our ability to recruit new employees effectively. In addition, negative publicity related to our brand partners, influencers and other vendors that we have partnered with may damage our reputation, even if the publicity is not directly related to us. Negative commentary concerning us or our brand partners may also be posted on social media platforms at any time and may have an adverse impact on our brand, reputation and business. The harm of negative publicity, particularly on social media platforms, may be immediate, without affording us an opportunity for redress or correction.
If we fail to maintain, protect, and enhance our brand successfully or to maintain and grow loyalty among customers, or if we incur substantial expenses in unsuccessful attempts to maintain, protect, and enhance our brand, we may fail to attract or increase the engagement of customers, and our business, financial condition, and operating results may suffer.
If we are not able to improve our website and mobile app performance, keep pace with technological changes, and enhance our current offerings, and develop new offerings in a timely way to respond to the changing needs of partners and customers, our business, financial performance, and growth may be harmed.
Our industry is characterized by rapidly changing technology, new service and product introductions, and changing customer demands and preferences, and we are not able to predict the effect of these changes on our business. In addition, we believe that our future success depends, in part, on our ability to anticipate and respond effectively to new technology disruption and developments and keep pace more generally with technological changes and trends. These may include new software applications or related services based on artificial intelligence (such as our AI search beta launch), augmented reality, machine learning, or robotics or more generally evolving trends in e-commerce. For example, we are currently focused on improving the performance of our website and mobile application for our customers, including increasing site speed and reliability; however, our efforts may be unsuccessful. The technologies that we currently use to support our business platform are highly interconnected and complex (as discussed elsewhere in these risk factors) and may become inadequate or obsolete, and the cost of incorporating new technologies into our offerings and services may be substantial. AnyIn addition, any failure by us to adequately integrate technological developments in our approach to data management could harm our ability to leverage data, including customer data, collected through our technology and our systems, which could have a negative effect on our business. If we are unable to adequately utilize our data in support of our operations due technical or other limitations, our ability to drive leverage in operational efficiencies and to attract new customers and retain existing customers could be impaired. In addition, if we are unable to successfully leverage new technology to automate and otherwise enhance and drive efficiencies in our operations, our business, results of operations and financial condition could be harmed.
Our partners and customers may not be satisfied with our technological or other platform enhancements or new offerings or may perceive that these offerings do not respond to their needs or create value for them. Our customers may also be dissatisfied with the product mix we currently offer or will offer in the future.
Additionally, as we invest in and experiment with new offerings or changes to our platform, our partners and customers may find these changes to be disruptive and may perceive them negatively. For example, in 2021, we phased out our “unlimited swaps” subscription plan and shifted to our current subscription plans with different price points based on usage. We have increasedIn addition, our Resaleat-home pickup offering offers customers in certain markets a new way to return their items without going to a physical drop off location. In March 2023, we changed our subscription programs to provide customers with one additional item per shipment at no extra charge, which could introduce the uncertainty of merchandise returnsis intended to provide more value to our customers and negatively impact our business. We also have expanded the categories of products we offer, such as kidswear and home accessories, and may further expand our categories in the future.increase retention. These new plans and offerings do not have demonstrably long track records of success for us.us and could result in higher fulfillment costs and lower gross margins, higher product spend, and/or other unforeseen impacts on the business. In addition, developing new offerings and services is complex, and the timetable for their public launch is difficult to predict and may vary from our historical experience. As a result, the introduction of new offerings may occur after anticipated release dates, or they may be introduced as pilot programs, which may not be continued for various reasons. In addition, new offerings may not be successful due to defects or errors, negative publicity, or our failure to market them effectively. New offerings may not drive revenue growth, customer acquisition or retention, may require substantial investment and planning, and may bring us more directly into competition with companies that are better established or have greater resources than we do. If we do not continue to cost-effectively develop new offerings that satisfy our brand partners and customers, then our competitive position and growth prospects may be harmed. In addition, changes to subscription plans or new offerings may have lower margins than we anticipate or than existing offerings, and our revenue from the new offerings may not be enough to offset the cost of developing and maintaining them, which could adversely affect our business, financial performance, and growth.
We rely heavily on the effective operation of our proprietary technology systems and software, as well as those of our third-party vendors and service providers, for our business to effectively operate and to safeguard confidential information.
We rely heavily on the Internet, computer systems, hardware, in-house proprietary technology, third-party software and infrastructure, and customized off-the-shelf technology solutions across our business.business (collectively, our “IT Systems”). We own and manage some of these IT Systems but also rely on third parties for a range of IT Systems and related products and services. Our ability to effectively manage all areas of our business, particularly our product management and fulfillment operations, depends significantly on the reliability and capacity of these systems.IT Systems. We are critically dependent on the integrity, connectivity, security and consistent operations of these systems,our IT Systems, which are highly dependent on coordination of our internal business, operations, product and engineering teams. For example, in September 2019, we experienced a software outage at our Secaucus, New Jersey facility, during which we were unable to fulfill thousands of Reserve and Subscription orders on a timely basis and made the decision to stop taking new orders until the issue was adequately resolved. We also experienced significant negative customer reviews and negative press as a result of the outage, which we believe damaged our customer relationships, reputation and brand. The outage also resulted in substantial financial losses and increased costs largely due to: lost revenues, customer refunds, credits, promotions and/or related payments, and incremental labor and shipping costs. Our insurance policy covered a substantial portion of these losses but not all of them. While we have taken remediation measures in response to the outage, similaradditional outages or other disruptions have occurred and may occur in the future, which could harm our ability to meet customer expectations, fulfill orders, manage our products, and achieve our objectives for operating efficiencies and profitability.
The technology underlying our platform is highly interconnected and complex, and maywe detect bugs, errors, and vulnerabilities from time to time in the ordinary course of business. Because of the complexity of our technology, it is likely to contain additional undetected bugs, errors or vulnerabilities. Duevulnerabilities, some of which may have a material adverse effect on our business or operations. We are unable to comprehensively apply patches or confirm that measures are in place to mitigate all such vulnerabilities, or that patches will be applied before vulnerabilities are exploited by a threat actor. Moreover, due to the interconnected nature of the software underlying our platform,IT Systems, updates to parts of our code (including for product launches), third-party code, and application programming interfaces, on which we rely and that maintain the functionality of our systems,IT Systems, are often very complex and could have an unintended impact on other sections of our code, which may result in errors or vulnerabilities to our platform and/or launch delays that negatively impact the customer experience and functionality of our offerings. In some cases, such as our mobile application, certain errors mayare only able to be correctable through updates distributed through slower, third-party mechanisms, such as app stores, and may need to comply with third-party policies and procedures to be made available, which may add additional delays due to app review and customer delay in updating their mobile apps. In addition, our systemsIT Systems and business operations are increasingly reliant on machine learning systems and artificial intelligence technologies, which are complex, expected to pose new or unknown cybersecurity risks and challenges, and may have errors or inadequacies that are not easily detectable. These systems may inadvertently reduce the efficiency of our systems,IT Systems, or may cause unintentional or unexpected outputs that are incorrect, do not match our business goals, do not comply with our policies, or otherwise are inconsistent with our brand, guiding principles and mission. Any errors or vulnerabilities discovered in our code or IT Systems generally could also result in damage to our reputation, loss of our customers, unauthorized disclosure of personal and confidential information, loss of revenue or liability for damages, any of which could adversely affect our growth prospects and our business.
Any significant technology disruption or failure, cyberattack or data security incident could adversely affect our business, financial condition and operations.
Our ability to effectively manage our business, particularly our product management, order and fulfillment operations, depends significantly on the reliability and capacity of the Internet and our in-house proprietary technology, third-party software and infrastructure, and customized off-the-shelf solutions (collectively, “IT Systems”).IT Systems. We also collect, process and store sensitive and confidential information, including our proprietary business information and information regarding our customers, employees, suppliers and business partners, including personally identifiable information.information (collectively, “Confidential Information”). The secure processing, maintenance and transmission of this informationConfidential Information is critical to our operations. Our IT Systems orand those of our service providers and business partners may be subject to damage or interruption from power outages or damages, telecommunications problems, data corruption, software errors, network failures, acts of war or terrorist attacks, fire, flood and natural disasters. Our existing safety systems, data backup, access protection, user management and information technology emergency planning may not be sufficient to identify, detect, prevent, or recover from data corruption or loss or long-term network or operational outages. In addition, we may have to upgrade our existing IT Systems or choose toand incorporate new technology systems from time to time in order for such systems to support the increasing needs of our expanding business. Costs and potential problems and interruptions associated with the implementation of new or upgraded systems and technology or with maintenance or adequate support of existing systems could disrupt or reduce the efficiency of our operations. In addition, our failure to implement upgrades to our IT Systems, whether due to cost savings or resource constraints, failure to identify the need or other reasons, could negatively impact our business.
OurAdditionally, despite various security measures that have been implemented, our IT Systems and those of our third-party service providers and business partners may beas well as the Confidential Information stored thereon are vulnerable to numerous and evolving cybersecurity risks that threaten their confidentiality, integrity and availability, including security incidents, attacks by diverse threat actors (including hackers, hacktivists, and state-sponsored organizations) acts of vandalism, malware, social engineering, denial or degradation of service attacks, computer viruses, software bugs or vulnerabilities, supply chain attacks, phishing attacks, ransomware attacks, credential stuffing attacks, misplaced or lost data, human errors, malicious insiders or other similar events. If unauthorized parties gain access to our Confidential Information, IT Systems or other information, or those of our third-party service providers or business partners, they may be able to steal, publish, sell, delete, use inappropriately or modify private and sensitive information, including credit card information and personally identifiable information or proprietary business information, any or all of which could harm our business, financial condition and results of operations. Ransomware
In particular, ransomware attacks, including those from organized criminal threat actors, nation-states and nation-state supported actors, are becoming increasingly prevalent and can lead to significant interruptions, delays, or outages in our operations, loss of data, loss of income, significant extra expenses to restore data or systems, reputational loss and the diversion of funds. To alleviate the financial, operational and reputational impact of a ransomware attack, it may be necessary to make extortion payments, but we may be unable to do so if applicable laws or governmental pressure prohibit or preventsprevent such payments. We are also a frequent target of credential stuffing and account takeover attacks, for example where email addresses and passwords involved in security incidents reported by other companies are used to attempt to gain unauthorized access to our platform or IT Systems. In addition, employees may intentionally or inadvertently cause data or security incidents that result in unauthorized release of personalPersonal Information or confidential information.other Confidential Information. Further, company-issued laptops or other devices have been, and may in the future be, lost, stolen, or infected with malware. Because the techniques and tools (including artificial intelligence) used to circumvent security systems change frequently, are becoming increasingly sophisticated, are designed to evade detection and remove forensic evidence, are often not recognized until launched against a target and may originate from less regulated and remote areas around the world, we may be unable to timely or effectively anticipate, detect or recover from cyberattacks or security incidents in the future.
There can also be no assurance that our cybersecurity risk management program and processes, including our policies, controls or procedures, will be fully implemented, complied with or effective in protecting our Confidential Information and IT Systems. For example, as further described later in these risk factors, we have identified material weaknesses in certain controls related to our IT Systems. Certain of the aforementioned types of cyberattacks and security incidents have occurred in the past to us and our third-party providers, and may occur in the future, resulting in unauthorized, unlawful, or inappropriate access to, inability to access, disclosure of, or loss of sensitive, proprietary and confidential information.Confidential Information. For example, although no sensitive information was affected, our platform has been the subject of phishing attempts, credential stuffing attacks (i.e., email addresses and passwords involved in security incidents reported by other companies have been used to attempt to gain unauthorized access to our platform) and brute force attacks (i.e., attempts to try different username and password credentials to gain access to our platform)., and other account takeover tactics. The security measures we employ to prevent, detect, and mitigate unauthorized use of user credentials and potential harm to our users from the theft of or misuse of user credentials on our network may not be, and have not always been, effective in every instance.
We also rely on a number of third-party providers of products and services to operate our critical internal and external operations, such as the processing of confidentialPersonal Information and personally identifiable information.other Confidential Information. Examples of third parties include, but are not limited to, our shipping partners, human resources information system, payment processor, and various IT Systems providers. These service providers may not have adequate security measures and could experience a security incident that compromises the confidentiality, integrity, or availability of the IT Systems they operate for us or the informationConfidential Information they process on our behalf and may not be able to contain or recover from such incidents or to notify us in a timely manner. Moreover, we or our third-party service providers may be more vulnerable to such attacks in remote or hybrid work environments, which have increased in response to the COVID-19 pandemic.environments. Any cyberattack, security incident, or material disruption or slowdown affecting our Confidential Information or IT Systems or those of our third-party service providers or business partners, could result in costly investigations and litigation (including class action lawsuits), civil or criminal penalties, operational changes or other response measures, restoration and remediation costs, loss of consumer confidence in our security measures, negative publicity, and/or reputational harm, any of which could have a material adverse effect on our business, financial condition, and results of operations.
While we maintain cyber insurance that may help provide coverage for these types of events, we cannot provide assurances that our insurance will be adequate to cover costs and liabilities related to these incidents. Any such incident, attack, virusincidents or other event could result in costly investigations and litigation exceedingthat applicable insurance coverage or contractual rightswill be available to us in particular because certain data privacy laws, including the California Consumer Privacy Act (the “CCPA”), grant individuals a private rightfuture on economically reasonable terms or at all.
Our e-commerce business faces distinct risks, such as fulfillment of orders, and our failure to successfully manage these risks could have a negative impact on our profitability.
As an e-commerce business, we encounter risks and difficulties frequently experienced by businesses with significant internet operations. The successful operation of our business as well as our ability to provide a positive customer experience that will generate subscription,Subscription, Reserve rental and Resale orders depend on efficient and uninterrupted e-commerce order-taking and fulfillment operations. If we are unable to allow real-time and accurate visibility to product availability when customers are ready to order, quickly and efficiently fulfill our customers’ orders using the fulfillment and payment methods they demand, provide a convenient and consistent experience for our customers regardless of the ultimate channel or effectively manage our online sales, our ability to compete and our results of operations could be adversely affected. We have two fulfillment centers in Arlington, Texas and Secaucus, New Jersey that we depend on for our fulfillment operations. We currently lease these facilities. Although we have recently renewed our lease in Secaucus, NJ, we cannot guarantee that we will be able to renew or negotiate new or renewed leases in the future at this location or in Texas on terms acceptable to us or at all. If we are unable to secure such leases, or if we can only secure such leases on economic terms that are less than optimal for us, it may materially adversely impact our results of operations.
Risks associated with our e-commerce business include:
•our ability to provide a delightful and effective search and discovery experience for our customers;
•our failure to successfully execute planned enhancements to our website and mobile application performance to improve site speed and reliability in order to keep pace with industry standards and meet customer expectations;
•uncertainties associated with our website and mobile application, including changes in required technology interfaces, website downtime and other technical failures, anticipated or unanticipated costs and technical issues, as weour ability to upgrade our systems software successfully, inadequate system capacity, computer viruses, human error, and/or security incidents, legal claims related to our systems operations and fulfillment;incidents;
•disruptions in internet service or power outages;
•reliance on third parties for computer hardware and software, as well as delivery of products to our customers;
•rapid technology changes;
•credit or debit card fraud and other payment processing related issues;
•changes in applicable federal, state and international regulations;
•legal claims related to our e-commerce operations and fulfillment, including liability for online content;
•cybersecurity, consumer privacy and consumer protection concerns and regulation; and
•natural disasters or adverse weather conditions.
Our online offerings also expose us to broader applicability of regulations, as well as additional regulations, such as the rules relating to registration of internet sellers, certain anti-money laundering, trade sanction, anti-corruption, anti-bribery and international trade laws. Problems in any of these areas could result in a reduction in sales, increased costs, sanctions or penalties and damage to our reputation and brands.
We rely on third parties to support our business, including, among other things, portions of our technology development and support and certain payment processing services. We have experienced, and may in the future experience, adverse changes to the terms of our agreements with vendors and other commercial partners based on perception of our creditworthiness. If we are viewed as less financially viable by third-party providers, including as a result of our Nasdaq listing compliance and status, we may receive less favorable terms and conditions, including requiring upfront payments or other demonstrations of credit.
In addition, we must keep up to date with competitive technology trends, including the use of new or improved technology, checkout and payment options, creative user interfaces, virtual and augmented reality and other e-commerce marketing tools such as paid search and mobile applications, among others, which may increase our costs and which may not increase sales or attract customers. Our competitors, some of whom have greater resources than we do, may also be able to benefit from changes in e-commerce technologies or adapt better than us, which could harm our competitive position.
Our quarterly and annual results of operations may fluctuate, which may make it difficult to predict our future performance.
Our results of operations could vary significantly from quarter to quarter and year to year because of a variety of factors, many of which are outside of our control. Even if our revenue increases, our revenue growth rates may decline in the future as a result of a variety of factors, including macroeconomic factors, increased competition, and the maturation of our business. As a result, comparing our results of operations on a period-to-period basis or our revenue growth rate for any prior period may not be meaningful. In addition to other risk factors discussed in this section,Annual Report, factors that may contribute to the variability of our quarterly and annual results include:
•our success in attracting and retaining customers and subscribers;
•maintaining successful relationships with brand partners and our ability to acquire products at acceptable prices and offer a compelling mix of products that are available for subscription, a-la-carte rentalSubscription, Reserve or purchaseResale at any given time;
•the amount and timing of our fulfillment costs, operating expenses and capital expenditures;
•the timing and success of product launches, including pricing changes, new services and features we may introduce;
•the success of our marketing and promotional efforts;
•adverse economic and market conditions such as those related to the COVID-19 pandemic, and other adverse global events that negatively impact commerce and consumer behavior and that could lead to inflationary pressures and supply chain disruptions;
•disruptions or defects in our software or operations, such as privacy or data security incidents, outages, or other incidents that impact the availability, reliability, or performance of our business;
•the impact of competitive developments and our response to those developments;
•our ability to manage our business and future growth;
•our ability to recruit and retain employees including fulfillment center labor to process, itemize, list, pack and ship our products; and
•changes to financial accounting standards and the interpretation of those standards, which may affect the way we recognize and report our financial results.
The impact of one or more of the foregoing and other factors may cause our results of operations to vary significantly. As such, period-over-period comparisons of our results of operations may not be meaningful and should not be relied upon as an indication of future performance.
Fluctuations in our operating results and key metrics may be particularly pronounced in the current economic environment due to the uncertainty caused by, and the unprecedented nature of, the COVID-19 pandemic, consumer spending patterns, and the impacts and timing of the reopening of the offline economy and lessening of restrictions on movement. Fluctuations in our operating results and key metrics may cause thoseour results to fall below our financial guidance or other projections, or the expectations of analysts or investors, which could cause the price of our Class A common stock to decline.
Fluctuations in our results could also cause a number of other problems. For example, analysts or investors might change their models for valuing our Class A common stock, we could experience liquidity issues, our ability to retain or attract key personnel may diminish, and other unanticipated issues may arise. We believe that our operating results and key metrics may vary in the future and that period-to-period comparisons of our operating results may not be meaningful. For example, our overall historical growth rate and the impacts of the COVID-19 pandemic may have overshadowed the effect of seasonal variations on our historical operating results. These seasonal effects may become more pronounced over time, which could also cause our operating results and key metrics to fluctuate.
We face risks arising from the restructuring of our operations, which could adversely affect our financial condition, results of operations, cash flows, or business reputation.
We have taken and plan to continue to take actions intended to further reduce our cost structure. For example, in September 2022 and January 2024, we announced restructuring plans intended to reduce costs, streamline our organizational structure and drive operational efficiencies and growth. These plans or other future restructuring plans present significant risks that could have a material adverse effect on our operations, financial condition, results of operations, cash flow, or business reputation. Such risks include:
•the failure to achieve targeted cost savings and efficiency, and growth, cash flow and profitability goals;
•a decrease in employee morale, a negative impact to our corporate culture, and heightened regrettable attrition, including by critical employees, each of which we’ve observed to some extent and are focused on addressing;
•an increase in employment claims;
•actual or perceived disruption of service or reduction in service standards to customers;
•the loss of institutional knowledge and/or employee expertise, which could lead to inefficiencies or business disruptions, some of which may be significant and our efforts to address may not be successful; and
•the delay or failure to meet our operational standards, needs, or goals due to fewer employees, including potential single points of failure, or due to reduced or reallocated resources generally.
Environmental, social and governance matters may adversely impact our business and reputation.
There has been increased focus, including by consumers, investors, employees and other stakeholders, as well as by governmental and non-governmental organizations, on environmental, social and governanceESG matters generally and with regard to the fashion industry specifically. We expect that anthis increased focus on ESG considerations will affect some aspects of our operations. For example, we expect to be subject to various disclosure requirements (such as information on greenhouse gas emissions, climate risks, use of offsets, and emissions reduction claims) from the SEC’s climate disclosure rule and the State of California, among other regulations or requirements. These requirements may not always be uniform across jurisdictions, which may result in increased complexity, and cost, for compliance. Separately, various regulators have adopted, or are considering adopting, regulations on environmental marketing claims, including but not limited to the use of “sustainable”, “eco-friendly”, “recyclable” or similar language in product marketing. Any of the foregoing may require us to make additional investments or incur additional costs for the collection of data and/or preparation of disclosures and associated internal controls, and in turn, may adversely impact our business, operating results and financial condition.
We have and plan to continue undertaking ESG initiatives. AnyFurther, any failure by us to meet our Impact Strategy goals for any reason, including due to the potential changes to the prioritization of these goals, or a loss of confidence on the part of customers, investors, employees, brand partners and other stakeholders as it relates to our ESG initiatives could negatively impact our brand or the demand for our offerings, or lead to enforcement actions or litigation, adversely affecting our financial condition, results of operations and prospects. These impacts could be difficult and costly to overcome, even if such concerns were based on inaccurate or misleading information. In addition, achieving our ESG initiativesImpact Strategy goals or complying with ESG-related disclosure requirements may result in increased costs in our supply chain, fulfillment and/or corporate business operations, and could deviate from our initial estimates and have a material adverse effect on our business and financial condition. Furthermore, if our competitors’ corporate responsibility performance is perceived to be greater than ours, we may lose potential or current customers, we may be unable to recruit and retain employees effectively, and potential or current investors may elect to invest with our competitors instead.
StandardsVoluntary or required standards and research regarding environmental, social and governance initiatives could change and become more onerous for both for us and our third-party suppliers and vendors to meet successfully. Evolving data and research could undermine or refute our current claims and beliefs that we have made in reliance on current research, which could also result in costs, a decrease in revenue and negative market perception that could have a material adverse effect on our business and financial condition. Alternatively, if we are unable to satisfy such new criteria, investors may conclude that our policies or actions with respect to corporate responsibility are inadequate. We risk damage to our brand and reputation in the event that our corporate responsibility procedures or standards do not meet the standards set by various constituencies.
A variety of organizations measure the performance of companies on such ESG topics, and the results of these assessments are widely publicized. In addition, investment in funds that specialize in companies that perform well in such assessments are increasingly popular, and major institutional investors have publicly emphasized the importance of such ESG measures to their investment decisions. Topics taken into account in such assessments include, among others, the company’s efforts and impacts on climate change and the environment and human and labor rights, ethics and compliance with law, human capital and diversity, equity and inclusion matters, and the role of the Company’s board of directors in supervising various sustainabilityESG issues. Unfavorable ESG ratings could lead to negative investor sentiment toward us and/or our industry, which could have a negative impact on our access to and costs of capital. In light of investors’ and other stakeholders’ increased focus on ESG matters, there can be no certainty that we will manage such issues successfully, or that we will successfully meet our stakeholders’ or society’s ESG expectations or achieve our ESG goals and financial goals. Additionally, many of our third-party suppliers and vendors may be subject to similar expectations, which may augment or create additional risks, including risks that may not be known to us.
The effects of climate change and related regulatory, customer and investor responses may adversely impact our business.
31Our corporate offices, fulfillment centers and facilities of our brand and manufacturing partners are subject to risks relating to climate change and other environmental impacts. For example, the physical effects of climate change, such as more intense, prolonged, and/or frequent severe weather events, natural disasters and/or significant changes in climate patterns or temperatures, may result in facility damage, supply chain interruptions (including but not limited to challenges regarding the availability and quality of water and raw materials), changes in the availability and/or cost of insurance, as well as other adverse impacts. Similarly, our carbon emissions and our business’ overall impact on the environment could subject us to reputational, market and/or regulatory risks and could result in changes in consumer preferences. Climate change and other environmental concerns may cause social, economic and physical disruptions in the places where we operate, including disruptions to our supply chain and to local infrastructure and transportation systems which could limit material availability and quality, disrupt our data management and communications systems, increase product costs, impact our ability to ship and deliver products, prevent access to our physical locations and negatively impact the economy, consumer confidence and discretionary spending. In addition, implementing changes to mitigate these risks may result in substantial short- and long-term additional operational expenses, which may materially affect our profitability.
We rely on the experience and expertise of our Co-Founder and Chief Executive Officer, senior management team, key technical and strategic employees and hourly personnel.
OurWe believe that our success and future growth depend largely upon the continued services of our senior management team, including our Co-Founder, Chief Executive Officer and Chair, Jennifer Y. Hyman. From time to time, there have been and may be future changes in our executive management team resulting from the hiring or departure of these executives. Our executive officers are employed on an at-will basis, which means they may terminate their employment with us at any time. The loss of one or more of our executive officers, the failure to appropriately manage executive transitions, or the failure by our executive team to effectively work with our employees and lead our company, could harm our business. We do not maintain key man life insurance with respect to any member of management or other employee.
In addition, our future success will depend upon our ability to attract and retain employees, particularly for key roles, such as engineering and technology (including data science, analytics,science), brand, marketing, buying and planning, and logistics, as well as hourly fulfillment workers and customer service agents. Such efforts willhave required, and are expected to continue to require significant time, expense, and attention as there is intense competition for such individuals, particularly in New York City, Galway, New Jersey and Texas, and new hires require significant training and time before they achieve full productivity. In additionWe may be unable to maintainingmaintain competitive wage and salary levels, which are likely tomay increase further due to inflation and the potential laws increasing minimum wages. Our inability to maintain competitive wage increases,and salary levels could increase attrition and make recruiting more difficult. Alternatively, we may be required to increase current compensation levels to attract and retain employees, which could negatively impact our profitability goals. In addition, prospective and existing employees often consider the value of the equity awards they may receive in connection with their employment.employment and our stock price has declined significantly since our 2021 IPO. If the perceived value of our equity awards declinesis inadequate or experiences significant volatility, it may adversely affect our ability to recruit and retain key employees. In July 2023, we completed an option exchange designed to incentivize and retain employees, directors and other service providers by providing the ability to exchange outstanding stock options for RSUs, which was approved by stockholders. This option exchange, however, may not have the intended incentivization and retention benefits, particularly in light of our current stock price performance. Further our continued efforts to optimize our cost structure and organization design has made, and in the future may, make it more difficult to attract and retain employees for key roles.
Our corporate employees primarily worked remotely from March 2020 to April 2022. As COVID-19 restrictions lifted,Since then, we have recently reopened our offices and moved to a hybrid working model for New York City and Galway,Galway. We have continued to shift to a more office-centric model in which employees will be present in the office two to three days per week.New York City. If the hybridour current model is not aligned with our employees’ preferences, it may adversely affect our ability to recruit and retain employees. In addition, the hybrid modelemployees and may negatively impact our company culture, collaboration and productivity.productivity, and may be something that we need to revisit in the future.
We have recently experienced in the past, and may in the future experience, voluntary attrition at significant rates for various reasons, including challenges with employee morale following our recent restructurings, perception of our business and financial condition, challenging labor market conditions such as rising wages, and a decreased level of workforce participation. If we are unable to attract and retain qualified employees in a timely fashion, particularly in critical areas of operations such as engineering, data science and analytics, and our hourly fulfillment workers,for the key roles described above, our ability to achieve our strategic objectives will be adversely impacted, and our business and future growth prospects will be harmed.
We believe that our company culture has contributed to our success and if we cannot maintain this culture as we grow, our business could be harmed.
We believe that our company culture has been critical to our success. Our company culture stands for being entrepreneurial, passionate, kind and positive. Our ability to continue to cultivate and maintain this culture is essential to our growth and continued success. We face a number of challenges that may affect our ability to sustain our corporate culture, including:
•failure to maintain and/or improve employee morale and engagement in light of our office-centric approach in our New York City headquarters, our 2022 and 2023 restructuring plans, perception of our business and financial condition, and our continued efforts to ensure a cost-conscious and efficient workforce that supports our growth and profitability goals;
•failure to identify, attract, reward, and retain people in leadership positions in our organizationemployees who share and further our culture, values, and mission;
•the increasingevolving size, complexity and geographic diversity of our workforce, and our ability to promote a uniform and consistent culture across all our offices and employees;
•the employee and market perception of our ESG efforts, which may impact employee morale and recruiting efforts;
•competitive pressures to move in directions that may divert us from our mission, vision, and values;
•our move to a hybrid working model for corporate employees in New York City and Galway and the remote working model for customer service employees;
•the continued challenges of a rapidly-evolving industry; and
•the increasing need to develop expertise in new areas of business that affect us.
In particular, Diversity, Equity and Inclusion is a strategic imperative for us. Wewe are focused on driving inclusiveness, innovation and stronger business results by attracting a diverse talent pool and continuing to foster an inclusive work environment for all our employees. Although we have adopted policies to promote compliance with laws and regulations as well as to foster a respectful workplace for all employees, our employees may fail to abide by these policies. In addition to damaging our reputation, actual or alleged misconduct could tarnish our culture and reputation, result in negative publicity, affect the confidence of our stockholders, regulators and other parties and could have a material adverse effect on our business, financial condition and operating results.
Material changes in the pricing practices of our brand and manufacturing partners and/or the costs of raw materials could negatively impact our profitability.
Our brand and manufacturing partners may increase their pricing if raw materials, labor, or other costs become more expensive or subject to other pricing pressures. The inputs used to manufacture products are subject to availability constraints and price volatility. In addition, our brand partners may pass the increase in sourcing costs to us through price increases, thereby impacting our margins. For example, if our manufacturing partners increase their costs, our Exclusive Designs may not be as cost-effective to produce, which could negatively impact our ability to meet our financial goals. The fabrics used in our products are made of raw materials including petroleum-based products and cotton. Significant price fluctuations or shortages in petroleum, cotton, or other raw materials could significantly increase our cost of revenue and the cost associated with procuring products via Exclusive Designs. Moreover, in the event of a significant disruption in the supply of the fabrics or raw materials used in the manufacture of the products we offer, such as due to restrictions on Xinjiang cotton, we and/or our partners might not be able to locate alternative suppliers of materials of comparable quality at an acceptable price. For example, disruptions in the supply chain as a result of the COVID-19 pandemic and relatedthe recent inflationary environment has increased raw material costs, impacting pricing of our products, and caused shipping delays for certain of our products.
We rely on consumer discretionary spending and have been, and may in the future be, adversely affected by economic downturns and other macroeconomic conditions or trends.
We are subject to variable industry and global economic conditions and their impact on consumer discretionary spending. Some of the factors that may negatively influence consumer spending include high levels of unemployment; higher consumer debt levels; reductions in net worth, declines in asset values, and related market uncertainty; home foreclosures and reductions in home values; fluctuating interest rates and credit availability; fluctuating fuel and other energy costs; fluctuating commodity prices; and general uncertainty regarding the overall future political and economic environment. We have experienced many of these factors due to the COVID-19 pandemic and related responses and have seen negative impacts on customer demand at varying levels as a result. For example, we experienced a significant decrease in consumer demand during the COVID-19 pandemic due to shelter-at-home orders and more limited social events, increased unemployment and work-from-home trends, and general economic uncertainty.
Furthermore, any increases in consumer discretionary spending or immediately after times of crisis may be temporary, such as those related to government stimulus programs or the tail of the COVID-19 pandemic in the United States, and consumer spending may decrease again. Economic conditions in certain regions may also be affected by natural disasters, such as hurricanes, tropical storms, earthquakes, and wildfires; other public health crises; wars, terrorism and political tensions; and other major unforeseen events. Consumer purchases or rental of discretionary items, including the products that we offer, generally decline during recessionary periods or periods of economic uncertainty, when disposable income is reduced or when there is a reduction in consumer confidence.
Additionally, adverse economic changes could reduce consumer confidence, and could thereby negatively affect our operating results. In challenging and uncertain economic environments, we cannot predict when macroeconomic uncertainty may arise, whether or when such circumstances may improve or worsen or what impact such circumstances could have on our business. Any of these developments could harm our business, financial condition and results of operations.
Our business is affected by seasonality.
Our business is subject to seasonal fluctuations. We typically realize a higher portion of revenue from our Reserve rentals during our third and fourth fiscal quarter as a result of increased wedding and holiday events. However, in fiscal year 2020 and fiscal year 2021 we saw fewer large-scale holiday and special events due to the COVID-19 pandemic. For our subscriptionSubscription rentals, we typically acquire the highest number of subscribers in March through May and September through November, as these are the times customers naturally think about changing over their wardrobes. WeWe generally see a higher rate of subscribers pause in the summer, and in mid-December through the end of January. In the third and fourth fiscal quarters, our Reserve business historically (prior to COVID-19) benefited from increased wedding and holiday events but this seasonality has varied since the onset of COVID-19. Adverse events, such as higher unemployment, inflation, deteriorating economic conditions, or fewer large-scale holiday and special events, due to the COVID-19 pandemic, can deter consumers from shopping and renting. Any significant decrease in customers or revenue during periods of high seasonal acquisition could have a disproportionately large impact on our operating results and financial condition for that year. Any factors that harm our operating results during these periods, including disruptions in our brand partners’ supply chains or unfavorable economic conditions, including as a result of the COVID-19 pandemic, could have a disproportionate effect on our results of operations for our entire fiscal year.
We also experience seasonality in the timing of expenses and capital outlays. In anticipation of increased rental activity during seasonal peaks, we maytypically incur significant additional expenses, includingsuch as rental product capital expenditures. We may also incur expenses for additional marketing andand/or additional staffing in our customer support operations. In addition, we maytypically experience an increase in our net shipping costs due to ensuring timely delivery forduring peak seasons.seasons, such as around the holidays. In the future, our seasonal subscriber or revenue patterns may become more pronounced or may change, may strain our personnel and operational activities, and may cause a shortfall in net salesrevenue as compared with expenses in a given period, which could substantially harm our business, financial condition and results of operations.
Furthermore, our rapid growth in recent years may obscure the extent to which seasonality trends have affected our business and may continue to affect our business, and the effects of the COVID-19 pandemic may alterhave altered our historical seasonality trends. Accordingly, yearly or quarterly comparisons of our operating results may not be useful and our results in any particular period will not necessarily be indicative of the results to be expected for any future period. Seasonality in our business can also be affected by introductions of new or enhanced products and offerings, including the costs associated with such introductions.
We may require additional capital to support the growth of our business and satisfy our debt obligations, and this capital might not be available on acceptable terms, if at all.all.
We have funded our operations since inception primarily through equity and debt financings and revenue generated from our offerings. Our goal is to be a profitable company; however, we cannot be certain when or if our operations will generate sufficient cash to fully fund our ongoing operations or the growth of our business. We also intend to continue to make investments to develop and grow our business. For example, in the future, we may need additional funding to satisfy our debt obligations, to obtain rental products, for marketing, and for headcount or other operating expenses and capital expenditures, to develop new features or enhance our offerings, to improve our operating infrastructure, and/or to acquire complementary businesses and technologies. However, we believe that our current market capitalization, business performance and/or current level of indebtedness may adversely impact efforts to raise additional capital. If we are unable to obtain adequate financing or financing on terms satisfactory to us, our ability to support our business growth, and respond to business challenges could be significantly impaired, and our business may be adversely affected. Additionally, in recent periods, there has been volatility in and disruptions to the global economy, including the equity and debt financial markets. Such weakness and volatility in capital markets and the economy in general could limit our access to capital markets and increase our costs of borrowing.
If we incur additional debt, the debt holders would have rights senior to holders of common stock to make claims on our assets, and the terms of any debt could restrict our operations, including our ability to pay dividends on our common stock. Furthermore, if we issue additional equity securities, stockholders will experience dilution, and the new equity securities could have rights senior to those of our common stock. Because our decision to issue securities in the future will depend on numerous considerations, including factors beyond our control, we cannot predict or estimate the amount, timing, or nature of any future issuances of debt or equity securities. As a result, our stockholders bear the risk of future issuances of debt or equity securities reducing the value of our common stock and diluting their interests.
our cash and cash equivalents in accounts with major U.S. and international financial institutions, and our deposits at these institutions exceed insured limits. Market conditions can impact the viability of these institutions. In the event of failure of any of the financial institutions where we maintain our cash and cash equivalents, there can be no assurance that we would be able to access uninsured funds in a timely manner or at all. Any inability to access or delay in accessing these funds could adversely affect our business and financial position. Our level of indebtedness could have a material adverse effect on our ability to generate sufficient cash to fulfill our obligations under such indebtedness, to react to changes in our business and to incur additional indebtedness to fund future needs.
As of January 31, 2022,2024, we had $260.8$306.7 million aggregate principal amount of borrowings under a credit facility with Double Helix Pte Ltd. as administrative agent for Temasek Holdings (the “Amended(as subsequently amended, the “2023 Amended Temasek Facility”). The 2023 Amended Temasek Facility matures in October 2026. If our cash flows and capital resources are insufficient to fund our debt service obligations, we may be forced to reduce or delay investments and capital expenditures or to sell assets, seek additional capital or restructure or refinance our indebtedness. Our ability to restructure or refinance our current or future debt will depend on the condition of the capital markets and our financial condition at such time. Any refinancing of our debt could be at higher interest rates and may require us to comply with more onerous covenants, which could further restrict our business operations. The terms of existing or future debt instruments may restrict us from adopting some of these alternatives. We cannot provide assurance that our business will be able to generate sufficient levels of cash or that future borrowings or other financings will be available to us in an amount sufficient to enable us to service our indebtedness and fund our other liquidity needs. These financing risks, in addition to potential rising interest rates and changes in market conditions, if realized, could negatively impact our business, financial condition and results of operations. See “Note 78 —Long-Term Debt” in the Notes to Consolidated Financial Statements for more information on our indebtedness.
Our 2023 Amended Temasek Facility contains financial covenants and other restrictions on our actions that may limit our operational flexibility or otherwise adversely affect our business, financial condition and results of operations.
The terms of our 2023 Amended Temasek Facility include a number of covenants that limit our ability to (subject to negotiated exceptions), among other things, incur additional indebtedness, incur liens on assets, enter into agreements related to mergers and acquisitions, dispose of assets or pay dividends and make distributions. Additionally, the 2023 Amended Temasek Facility includes a minimum liquidity maintenance covenant of $50.0$30 million and amendsprovides that the call protection applicableCompany may not exceed mutually agreed upon quarterly and annual spend levels for rental product capital, fixed operating, and marketing expenditures during fiscal year 2024 of $51 million, $100 million (excluding $10 million of specified permitted expenditures), and $30 million, respectively, on an annual basis, and to-be-agreed levels for fiscal years 2025 and 2026, subject to the loans outstanding thereunder.debt holders’ consent and certain exceptions. The terms of our 2023 Amended Temasek Facility may restrict our current and future operations and could adversely affect our ability to finance our future operations or capital needs. In addition, complying with these covenants may make it more difficult for us to successfully execute our business strategy and compete against companies which are not subject to such restrictions.
A failure by us to comply with the covenants specified in the 2023 Amended Temasek Facility could result in an event of default under the agreement, which would give the lender the right to declare all borrowings outstanding, together with accrued and unpaid interest and fees, to be immediately due and payable. If the debt under the Credit Agreement were to be accelerated, we may not have sufficient cash or be able to borrow sufficient funds to refinance the debt or sell sufficient assets to repay the debt, which could adversely affect our business, financial condition and results of operations.
We have identified material weaknesses in our internal control over financial reporting. If we are unable to remediate the material weaknesses in a timely manner, identify additional material weaknesses in the future or otherwise fail to maintain effective internal control over financial reporting, which may result in material misstatements of our consolidated financial statements or cause us to fail to meet our periodic reporting obligations, our ability to comply with applicable laws and regulations and our access to the capital markets to be impaired.
In connection with the preparation of our consolidated financial statements as of January 31, 2021, we identified material weaknesses in our internal control over financial reporting, as of January 31, 2021, as described below. As of January 31, 2022,2024, these material weaknesses were still in the process of being remediated. A material weakness is a deficiency, or a combination of deficiencies, in internal control over financial reporting such that there is a reasonable possibility that a material misstatement of our annual or interim financial statements will not be prevented or detected on a timely basis.
We did not maintain sufficient evidence of the operation of controls to achieve complete, accurate and timely financial accounting, reporting and disclosures nor were monitoring controls evidenced at a sufficient level to provide the appropriate level of oversight of activities related to our internal control over financial reporting. This material weakness contributed to the following additional material weaknesses:
We did not design and maintain effective controls to ensure (i) the appropriate segregation of duties in the operation of manual controls and (ii) journal entries were reviewed at the appropriate level of precision.
We did not design and maintain effective controls over information technology (“IT”) general controls for information systems and applications that are relevant to the preparation of our financial statements. Specifically, we did not design and maintain (i) program change management controls to ensure that information technologyIT program and data changes affecting financial IT applications and underlying accounting records are identified, tested, authorized and implemented appropriately, (ii) user access controls to ensure appropriate segregation of duties and that adequately restrict user and privileged access to our financial applications, programs and data to appropriate personnel, (iii) computer operations controls to ensure that critical batch jobs are monitored and data backups are authorized and monitored and (iv) testing and approval controls for program development to ensure that new software development is aligned with business and IT requirements.
These IT control deficiencies, when aggregated, could impact maintaining effective segregation of duties, as well as the effectiveness of IT-dependent controls (such as automated controls that address the risk of material misstatement to one or more assertions, along with the IT controls and underlying data that support the effectiveness of system-generated data and reports) that could result in misstatements potentially impacting all financial statement accounts and disclosures that would not be prevented or detected.
The material weaknesses described above did not result in a misstatement to our annual or interim consolidated financial statements. However, each of these material weaknesses could result in a misstatement of substantially all account balances or disclosures that would result in a material misstatement to the annual or interim consolidated financial statements that would not be prevented or detected.
To address theseWe continue to implement measures designed to remediate the identified material weaknesses, we have commenced actions to formalizeweaknesses. The measures include (i) formalizing the company’sCompany’s framework and policies with respect to maintaining evidence in the operation of control procedures, (ii) improving our control framework to include the appropriate segregation of duties and improve ourcontrols over the preparation and review of journal entries, and (iii) designing and implementing IT general controls segregationfor systems and applications impacting internal control over financial reporting.
We have performed extensive work with personnel responsible for the design and operating effectiveness of dutiesinternal control over financial reporting in our efforts to ensure that appropriate controls are in place and journal entry controls. In particular, weappropriate evidence is maintained. We are implementingcontinuing to implement comprehensive access control protocols for our enterprise resource planning environment in order to implement restrictions on user and privileged access to certain applications, establishing additional controls over segregation of duties and the preparation and review of journal entries, implementing controls to review the activities for those users who have privileged access and program change management controls to ensure that IT program and data changes affecting financial IT applications and underlying accounting records are identified, tested, authorized and implemented appropriately.
The implementation of these remediation efforts is in progress, may require additional expenditures to implement, and will require validation and testing of the design and operating effectiveness of internal controls over a sustained period of financial reporting cycles, and as a result, the timing of when we will be able to fully remediate the material weaknesses described above is uncertain. We can give no assurance that our efforts will remediate these material weaknesses in our internal control over financial reporting, or that additional material weaknesses will not be identified in the future. If the steps we take do not remediate the material weaknesses we have identified in a timely manner, or if we fail to implement and maintain effectiveour internal control over financial reporting is not effective, there could be errors in our annual or interim consolidated financial statements that could result in a restatement of our financial statements, and could cause us to fail to meet our reporting obligations, any of which could diminish investor confidence in us and cause a decline in the price of our Class A common stock.
Additionally, ineffective internal control over financial reporting could expose us to an increased risk of financial reporting fraud and the misappropriation of assets and subject us to potential delisting from the stock exchange on which we list or to other regulatory investigations and civil or criminal sanctions. If we are unable to remediate the material weakness we have identified in a timely manner, or if additional material weaknesses exist or are discovered in the future, and we are unable to remediate any such material weakness, our reputation, results of operations and financial condition could suffer.
The requirements of being a public company may strain our resources, divert management’s attention, and affect our ability to attract and retain executive management and qualified board members.
As a public company, we are subject to the reporting requirements of the Securities Exchange Act of 1934, as amended (the “Exchange Act”), the listing standards of Nasdaq, and other applicable securities rules and regulations. We expect that the requirements of these rules and regulations will continue to increase our legal, accounting, and financial compliance costs, make some activities more difficult, time-consuming and costly, and place significant strain on our personnel, systems, and resources. As a result of the complexity involved in complying with the rules and regulations applicable to public companies, our management’s attention may be diverted from other business concerns, which could harm our business, financial condition, and results of operations. Furthermore, severalmost members of our management team do not have prior experience in running a public company. Although weWe have already hired additionalcertain employees and engaged consultants to assist us in complying with these requirements,requirements; however we intend tomay invest substantialadditional resources in our compliance efforts, including hiring more employees or employees with additional credentials or engaging outside consultants, which willmay increase our operating expenses. If our efforts to comply with new laws, regulations, and standards differ from the activities intended by regulatory or governing bodies due to ambiguities related to their application and practice, regulatory authorities may initiate legal proceedings against us and our business may be harmed.
In addition, being a public company that is subject to these rules and regulations has made it more expensive for us to obtain director and officer liability insurance. In the future, we may be required to accept reduced coverage or incur substantially higher costs to obtain coverage. These rules and regulations may also make it more difficult for us to attract and retain qualified members of our board of directors, particularly members who can serve on our audit committee and compensation committee, and qualified executive officers.
As a result of being a public company, we are obligated to develop and maintain proper and effective internal control over financial reporting, and any failure to maintain the adequacy of these internal controls may adversely affect investor confidence in our company and, as a result, the value of our Class A common stock.
We are not required, pursuant to Section 404 of the Sarbanes-Oxley Act (“Section 404”), to furnish a report by management on, among other things, the effectiveness of our internal control over financial reporting until the year following our first annual report required to be filed with the SEC.reporting. This assessment will need to includeincludes disclosure of any material weaknesses identified by our management in our internal control over financial reporting. In addition, our independent registered public accounting firm will be required to attest to the effectiveness of our internal control over financial reporting in our first annual report required to be filed with the SEC following the date we are no longer an “emerging growth company.” OurAt such time, our compliance with Section 404 will require that we incur substantial expenses and expend significant management efforts. We will need to hire additional accounting and financial staff with appropriate public company experience and technical accounting knowledge and compile the system and process documentation necessary to perform the evaluation needed to comply with Section 404.
In addition to the material weaknesses in internal control over financial reporting identified in connection with the audit of our financial statements as of and for the fiscal year 2020, subsequent testing by us or our independent registered public accounting firm may reveal additional deficiencies in our internal control over financial reporting that are deemed to be material weaknesses. During the evaluation and testing process of our internal controls, if we identify additional material weaknesses in our internal control over financial reporting, we will be unable to certify that our internal control over financial reporting is effective. We cannot provide assurance that there will not be additional material weaknesses in our internal control over financial reporting in the future. Any failure to maintain internal control over financial reporting could severely inhibit our ability to accurately report our financial condition or results of operations. If we are unable to conclude that our internal control over financial reporting is effective, or if we or our independent registered public accounting firm determines we have additional material weaknesses in our internal control over financial reporting, we could lose investor confidence in the accuracy and completeness of our financial reports, the market price of our Class A common stock could decline, and we could be subject to sanctions or investigations by the SEC or other regulatory authorities. Failure to remedy any material weakness in our internal control over financial reporting, or to implement or maintain other effective control systems required of public companies, could also restrict our future access to the capital markets.
We are an “emerging growth company” and a “smaller reporting company,” and we cannot be certain if the reduced reporting and disclosure requirements applicable to emerging growth companies and smaller reporting companies will make our Class A common stock less attractive to investors.
We are an “emerging growth company,” as defined in the Jumpstart Our Business Startups Act of 2012 (“JOBS Act”), and we may take advantage of certain exemptions from reporting requirements that are applicable to other public companies that are not “emerging growth companies,” including:
•the auditor attestation requirements of Section 404;
•reduced disclosure obligations regarding executive compensation in our periodic reports and proxy statements; and
•exemptions from the requirements of holding a non-binding advisory stockholder vote on executive compensation and non-binding advisory stockholder vote to approve any golden parachute payments not previously approved.
Pursuant to Section 107 of the JOBS Act, as an emerging growth company, we have elected to use the extended transition period for complying with new or revised accounting standards until those standards would otherwise apply to private companies. As a result, our consolidated financial statements may not be comparable to the financial statements of issuers who are required to comply with the effective dates for new or revised accounting standards that are applicable to public companies, which may make our Class A common stock less attractive to investors. In addition, if we cease to be an emerging growth company, we will no longer be able to use the extended transition period for complying with new or revised accounting standards.
We will remain an emerging growth company until the earliest of:
•the last day of the fiscal year following the fifth anniversary of our IPO;
•the last day of the first fiscal year in which our annual gross revenue is $1.07$1.235 billion or more;
•the date on which we have, during the previous rolling three-year period, issued more than $1 billion in non-convertible debt securities; and
•the date we qualify as a “large accelerated filer,” with at least $700 million of equity securities held by non-affiliates.
We cannot predict if investorsare also a "smaller reporting company" as defined in the Exchange Act. We may take advantage of certain of the scaled disclosures available to smaller reporting companies as long as we qualify as such, even after we are no longer an EGC, including reduced disclosure obligations regarding executive compensation in our periodic reports and proxy statements.
The COVID-19 pandemic had a material adverse impact on our business. Other future pandemics or public health crises may have a similar adverse impact on our business.
The COVID-19 pandemic materially adversely affected our operating and financial results during fiscal year 2020 in many ways, including a significant reduction in Active Subscribers resulting from the decrease in special events, social gatherings and interactions outside the home, delays in the shipment and delivery of our products due to disruptions of the operations of our brand partners, and the implementation of temporary salary cuts, employee layoffs and furloughs, and pausing recruiting efforts, which negatively impacted employee morale and resulted in an increase in regrettable employee attrition.
Future pandemics or public health crises may have similar adverse effects on our business. Although we anticipate that our operating results in future fiscal years will findreflect a more normal operating environment, the current economic climate has created a high degree of uncertainty and there is no assurance that our Class A common stock less attractive ifscale, number of customers, revenue or growth will return to or surpass pre-pandemic levels for a sustained period of time. As such, we choosecontinue to relyclosely monitor this global health crisis and will continue to reassess our strategy and operational structure on these exemptions. If some investors find our Class A common stock less attractivea regular, ongoing basis as a result, there may be a less active trading market for our Class A common stock, and our stock price may be more volatile.the situation evolves.
Strategic investments, partnerships, alliances, or acquisitions could be difficult to identify, pose integration challenges, divert the attention of management, disrupt our business, dilute stockholder value, and adversely affect our business, financial condition, and results of operations.
Our success will depend,depends, in part, on our ability to expand our services and grow our business in response to changing technologies, customer demands, and competitive pressures. We may choose to expand our services and grow our business by entering into partnerships or alliances with third parties rather than through internal development or through the acquisition of complementary businesses and technologies. The identification of suitable alliance partners or acquisition candidates can be difficult, time-consuming, and costly, and we may not be able to successfully complete identified transactions. In addition, if we pursue and complete an acquisition, we may not be able to successfully integrate the acquired business. The risks we face in connection with partnerships and acquisitions include:
•a partnership or acquisition may disrupt our ongoing business, divert resources, increase our expenses, and distract our management;
•an acquisition may negatively affect our financial results because it may require us to incur charges or assume substantial debt or other liabilities, may cause adverse tax consequences or unfavorable accounting treatment, may expose us to claims and disputes by stockholders and third parties, including intellectual property claims and disputes, or may not generate sufficient financial return to offset additional costs and expenses related to the acquisition;
•we may encounter difficulties or unforeseen expenditures in integrating the business, offerings, technologies, personnel, or operations of any company that we partner with or acquire; and
•if we incur debt or issue a significant amount of equity securities to fund such joint venture or acquisition, such debt may subject us to material restrictions on our ability to conduct our business, as well as financial maintenance covenants and such equity securities may cause dilution for our existing stockholders and earning per share may decrease.
The occurrence of any of these foregoing risks could adversely affect our business, financial condition, and results of operations and expose us to unknown risks or liabilities.
Our reported financial results may be adversely affected by changes in accounting principles generally accepted in the United States.
GAAP is subject to interpretation by the Financial Accounting Standards Board (the “FASB”), the SEC, and various bodies formed to promulgate and interpret appropriate accounting principles. The accounting for our business is complicated, particularly in the area of revenue recognition, and is subject to change based on the evolution of our business model, interpretations of relevant accounting principles, enforcement of existing or new regulations, and changes in SEC or other agency policies, rules, regulations, and interpretations of accounting regulations. Changes to our business model and accounting methods, principles, or interpretations could result in changes to our financial statements, including changes in revenue and expenses in any period, or in certain categories of revenue and expenses moving to different periods, may result in materially different financial results, and may require that we change how we process, analyze, and report financial information and our financial reporting controls.
If our estimates or judgments relating to our critical accounting policies prove to be incorrect, our results of operations could be adversely affected.
The preparation of financial statements in conformity with GAAP requires management to make estimates and assumptions that affect the amounts reported in our consolidated financial statements and accompanying notes appearing elsewhere in this AnnualAnnual Report. We base our estimates on historical experience and on various other assumptions that we believe to be reasonable under the circumstances, as provided in Part II, Item 7, “Management’s Discussion and Analysis of Financial Condition and Results of Operations—Critical Accounting Policies and Estimates.” The results of these estimates form the basis for making judgments about the carrying values of assets, liabilities, and equity, and the amount of revenue and expenses. Significant estimates and judgments include the useful life and salvage value of rental product, incremental borrowing rate to determine lease liabilities and right-of-use assets, and the valuation of share-based compensation and warrants.warrants, and recoverability of long-lived assets. Our results of operations may be adversely affected if our assumptions change or if actual circumstances differ from those in our assumptions, which could cause our results of operations to fall below the expectations of securities analysts and investors, resulting in a decline in the market price of our Class A common stock.
The estimates of market opportunity and forecasts of market growth included in our public disclosures may prove to be inaccurate, and even if the markets in which we compete achieve the forecasted growth, our business could fail to grow at similar rates, or at all.
The estimates of market opportunity and forecasts of market growth included in our public disclosures may prove to be inaccurate. Market opportunity estimates and growth forecasts are subject to significant uncertainty and are based on assumptions and estimates that may not prove to be accurate, including as a result of any of the risks described in this Annual ReportReport..
The variables that go into the calculation of our market opportunity are subject to change over time, and there is no guarantee that any particular number or percentage of addressable customers and subscribers covered by our market opportunity estimates will become a customer or subscriber or generate any particular level of revenues for us. In addition, our ability to expand in any of our target markets depends on a number of factors, including the cost, performance and perceived value associated with our products and offerings. Even if the markets in which we compete meet the size estimates and growth forecasted in our public disclosures, our business could fail to grow at similar rates, or at all. Our growth is subject to many factors, including our success in implementing our business strategy, which is subject to many risks and uncertainties. Accordingly, the forecasts of market growth included in our public disclosures should not be taken as indicative of our future growth.
Expansion of our operations internationally requires management attention and resources, involves additional risks, and may be unsuccessful.
We do not currently offer our products and services internationally. In the event we decide to expand our geographic market internationally, we will need to adapt to different local cultures, standards, laws, and policies. The business model we employ may not appeal as strongly to customers in international markets. Our entry into new markets will also require us to become familiar with different trends and customer preferences in such markets. In addition, consumer shopping behavior may continue to evolve and we may need to adapt our service to such changes.
Furthermore, to succeed with customers in international locations, we will need to locate fulfillment centers in foreign markets, hire local employees and source products appealing to local preferences, and we will have to invest in these facilities, employees and products before proving we can successfully run foreign operations. We may not be successful in expanding into additional international markets or in generating revenue from foreign operations for a variety of reasons, including:
•lower acceptance of our offerings and the concept of renting apparel and accessories and the need to localize our products offerings;
•competition from local incumbents that understand the local market and may operate more effectively;
•regulatory requirements, taxes, trade laws, trade sanctions and economic embargoes, tariffs, export quotas, custom duties, or other trade restrictions, or any unexpected changes thereto; and
•risks resulting from changes in currency exchange rates.
If we invest substantial time and resources to establish and expand our operations internationally and are unable to do so successfully and in a timely manner, our operating results would suffer.
Risks Related to Our Legal and Regulatory Environment
Our business is subject to a large number of U.S. and non-U.S. laws and regulations, many of which are evolving.
We are subject to numerous evolving laws and regulations in the United States and around the world, including those relating to consumer protection, environmental protection, intellectual property, consumer product safety, privacy and information security, taxation, and immigration, labor, and other employment law matters, such as workplace safety, particularly in our fulfillment centers, and wage and hour regulations. There has been a recentcontinued regulatory focus on automatically renewing Subscription offerings.subscription offerings, such as ours. For example, California’s Automatic Renewal Law, and the federal Restore Online Shoppers’ Confidence Act (the “ROSCA”), require companies to adhere to enhanced disclosure and cancellation requirements when entering into automatically renewing contracts with subscription customers. Regulators and private plaintiffs have brought enforcement and litigation actions against companies, challenging automatic renewal and subscription programs.
We strive to comply with all applicable laws; however, despite our efforts, we may not have fully complied in the past and may not in the future. If we fail to comply with existing or future laws or regulations, or if these laws or regulations are violated by our brand partners, suppliers or vendors, we may be subject to criminal and civil liabilities, fines, or sanctions and, while incurring substantial legal fees and costs and reputational harm. In addition, compliance and remediation efforts can be costly.
We are subject to U.S. and certain foreign export and import controls, sanctions, embargoes, anti-corruption laws, and anti-money laundering laws and regulations. Compliance with these legal standards could impair our ability to compete in domestic and international markets, and we could face criminal liability and other serious consequences for violations, which could harm our business.
We are subject to export control laws and regulations (including the U.S. Export Administration Regulations), U.S. Customs and import regulations, various economic and trade sanctions regulations administered by the U.S. Treasury Department’s Office of Foreign Assets Control, the U.S. Foreign Corrupt Practices Act of 1977 (the “FCPA”), as amended, the U.S. domestic bribery statute contained in 18 U.S.C. § 201, the U.S. Travel Act, the USA PATRIOT Act, and other state and national anti-bribery and anti-money laundering laws in the countries in which we conduct activities. Anti-corruption laws are interpreted broadly and generally prohibit companies and their employees, agents, contractors, and other partners from authorizing, promising, offering, or providing, directly or indirectly, corrupt payments of anything of value to recipients in the public or private sector to obtain or retain business or an improper business advantage. As a public company, we also are subject to the FCPA’s accounting provisions, which require us to make and keep complete and accurate books and records, and to maintain a system of adequate internal accounting controls. We have brand partners, suppliers, and vendors operating outside the United States and may engage other third parties to sell our products and services or to obtain necessary permits, licenses, patent registrations, and other regulatory approvals outside the United States. We can be held liable for the corrupt or other illegal activities of our employees, agents, contractors, and other partners, even if we do not explicitly authorize such activities. Although we have policies and controls in place to promote compliance with these laws and regulations, there are no assurances that these policies and controls will always prevent illegal or improper acts by employees, agents, third parties, or business partners. Violations of the laws and regulations described above may result in substantial civil and criminal fines and penalties, imprisonment, the loss of export or import privileges, debarment, tax reassessments, breach of contract and fraud litigation, reputational harm, investigation costs, and other consequences, any of which could have a material adverse effect on our business, financial condition, and results of operations.
From time to time, we may be subject to legal proceedings, regulatory disputes, and governmental inquiries that could cause us to incur significant expenses, divert ourmanagement’s attention, and materially harm our business, financial condition, and operating results.
From time to time, we may be subject to claims, lawsuits, government investigations, and other proceedings involving products liability, competition and antitrust, intellectual property, privacy, consumer protection, securities, tax, labor and employment, commercial disputes, environmental regulations, and other matters that could adversely affect our business operations and financial condition. For example, on November 14, 2022, a purported stockholder of the Company filed a putative class action lawsuit in the Eastern District of New York against the Company, certain of its officers and directors, and the underwriters of its IPO, entitled Rajat Sharma v. Rent the Runway, Inc., et al. The complaint, which has since been amended, alleges that we violated Sections 11, 12(a)(2) and 15 of the Securities Act of 1933, as amended, by making allegedly materially misleading statements, and by omitting material facts necessary to make the statements made therein not misleading. The lawsuit seeks, among other things, compensatory damages, attorneys’ fees and costs and such other relief as deemed just and proper by the court. See Note 16, “Commitments and Contingencies” in the Notes to the Consolidated Financial Statementsfor more details.
In addition, in recent years, we have seen a rise in the number and potential significance of these disputes and inquiries and evolving areas of focus for regulators and private plaintiffs. For example, there has been an increase in consumer class action lawsuits relating to subscription products. Litigation and regulatory proceedings may be protracted and expensive, and the results are difficult to predict. Certain of these matters include speculative claims for substantial or indeterminate amounts of damages and include claims for injunctive relief. Additionally, our litigation costs could be significant. Adverse outcomes with respect to litigation or any of these legal proceedings may result in significant settlement costs or judgments, penalties and fines, or require us to modify our products and offerings, all of which could negatively affect our revenue growth. The results of litigation, investigations, claims, and regulatory proceedings cannot be predicted with certainty, and determining reserves for pending litigation and other legal and regulatory matters requires significant judgment. There can be no assurance that our expectations will prove correct, and even if these matters are resolved in our favor or without significant cash settlements, these matters, and the time and resources necessary to litigate or resolve them, could harm our business, financial condition, and results of operations.
In addition, as a public company, our business and financial condition are more visible than as a private company, which may result in an increased risk of threatened or actual litigation, including by competitors and other third parties. If such claims are successful, our business, financial condition, and results of operations would be harmed, and even if the claims do not result in litigation or are resolved in our favor, these claims, and the time and resources necessary to resolve them, would divert the resources of our management and harm our business, financial condition, and results of operations.
Failure to adequately obtain, maintain, protect and enforce our intellectual property and proprietary rights could harm our brand, devalue our proprietary content, and adversely affect our ability to compete effectively.
Our success depends in part on our ability to obtain, maintain, protect, and enforce our intellectual property rights, including those in our proprietary technologies, know-how, and brand. To protect our rights to our intellectual property, we rely on a combination of trademark, copyright patent, and trade secret laws, domain name registrations, confidentiality agreements, and other contractual arrangements with our employees, affiliates, customers, strategic partners, vendors, and others. However, the protective steps we have taken and plan to take may be inadequate to deter infringement, misappropriation or other violations of our intellectual property or proprietary rights and we may be unable to broadly enforce all of our intellectual property rights. Failure to adequately protect and enforce our intellectual property could harm our brand, devalue our proprietary technology and content, and adversely affect our ability to compete effectively.
If we fail to protect our intellectual property rights adequately, our competitors may gain access to our intellectual property and proprietary technology and develop and commercialize substantially identical offerings or technologies. We may not timely or successfully register our trademarks in all jurisdictions, which could enable third parties to use our brand name and thus create potential roadblocksimpediments to any expansion ofefforts to expand the business outside of the U.S. The copyright registrations we have obtained for our website may not adequately protect all material contained on our website, and these registrations do not cover any material that is not part of our website. The patent prosecution process is expensive and time-consuming. We may not be able to prepare, file and prosecute all necessary or desirable patent applications at a commercially reasonable cost or in a timely manner or in all relevant jurisdictions, creating an opportunity for third parties to patent the same technology while preventing us from continuing to use it. It is also possible that we may fail to identify patentable aspects of inventions made in the course of development and commercialization activities before it is too late to obtain patent protection on them. Moreover, depending on the terms of any future in-licenses to which we may become a party, we may not have the right to control the preparation, filing and prosecution of patent applications, or to maintain the patents, covering technology in-licensed from third parties. Any patents, trademarks, copyrights, or other intellectual property rights that we have or may obtain may be challenged or circumvented by others or invalidated or held unenforceable through administrative proceedings or litigation. There can be no assurance that our patent applications will result in issued patents, or that any such patents will be of sufficient scope to adequately protect our proprietary technology or provide us with any meaningful competitive advantage. Moreover, failure to comply with applicable procedural, documentary, maintenance, renewal, fee payment and other similar requirements with the United States Patent and Trademark Office or other similar governmental agencies or administrative bodies could result in abandonment or lapse of the affected intellectual property rights. Further, the laws of some foreign countries may not be as protective of intellectual property rights as those in the United States, and mechanisms for enforcement of intellectual property rights in those countries may be inadequate. Accordingly, despite our efforts to obtain and protect our intellectual property, it may be possible for unauthorized third parties to copy our offerings and capabilities and use information that we regard as proprietary to create offerings that compete with ours.
We generally enter into confidentiality and invention assignment agreements with our employees and consultants, as well as agreements with other third parties, including suppliers and other partners, that contain confidentiality obligations and assignment provisions. However, we cannot guarantee that we have entered into such agreements with each party that has developed intellectual property for us or that may have had access to our proprietary information and technology, know-how, and trade secrets. Moreover, no assurance can be given that these agreements will be effective in controlling access to our proprietary information or preventing the unauthorized distribution, use, misappropriation, reverse engineering, or disclosure of our proprietary intellectual property and other proprietary rights, information, technology, know-how, and trade secrets. These agreements may be breached, and we may not have adequate remedies for any such breach. If any of our trade secrets were to be disclosed to or independently developed by a competitor, our competitive position would be harmed, possibly leaving us without an adequate remedy to make us whole.
We may be required to spend significant financial and managerial resources to monitor and protect our intellectual property rights. Litigation may be necessary in the future to enforce our intellectual property rights and to protect our trade secrets. Litigation brought to protect and enforce our intellectual property rights could be costly, time-consuming, and distracting to management. In the alternative, the failure to enforce our intellectual property rights could result in the impairment or loss of portions of our intellectual property rights. Further, our efforts to enforce our intellectual property rights may be met with defenses, counterclaims, and countersuits attacking the validity and enforceability of our intellectual property rights, and if such defenses, counterclaims, or countersuits are successful, it could result in the loss, impairment or narrowing of valuable intellectual property rights. In patent litigation in the United States, counterclaims alleging invalidity and/or unenforceability are common, and there are numerous grounds upon which a third party can assert invalidity or unenforceability of a patent. In an infringement proceeding, a court may decide that the patent claims we are asserting are invalid and/or unenforceable, or may refuse to stop the other party from using the technology at issue on the grounds that our patent claims do not cover the technology in question. Third parties may also raise similar claims before administrative bodies in the United States or abroad, even outside the context of litigation. Such mechanisms include re-examination, post grant review, inter partes review and equivalent proceedings in foreign jurisdictions (for example, opposition proceedings). Such proceedings could result in revocation of our patents, or could result in narrowing the scope of the patent claims so that they no longer cover our technology. The outcome following legal assertions of invalidity and unenforceability is unpredictable. With respect to the validity question, for example, we cannot be certain that there is no invalidating prior art, of which we, our patent counsel, and the patent examiner were unaware during prosecution. If a defendant were to prevail on a legal assertion of invalidity and/or unenforceability, we may lose some, and perhaps all, of the patent protection on our technology. An adverse result in any litigation or defense proceedings could put one or more of our patents at risk of being invalidated or interpreted narrowly, could put our patent applications at risk of not issuing, and could have a material adverse impact on our business by making the technology at issue freely available for others to use. Our inability to protect our proprietary technology against unauthorized copying or use, as well as any costly litigation or diversion of our management’s attention and resources, could delay further sales or the implementation of our offerings and capabilities, impair the functionality of our offerings and capabilities, delay or prevent introductions of new offerings, result in our substituting inferior or more costly technologies into our offerings, allow our competitors to gain momentum or overtake us, or injure our brand and reputation. Furthermore, because of the substantial amount of discovery required in connection with intellectual property litigation, there is a risk that some of our confidential information could be compromised by disclosure during this type of litigation. There could also be public announcements of the results of hearings, motions, or other interim proceedings or developments. If securities analysts or investors perceive these results to be negative, it could have a material adverse effect on the price of our Class A common stock.
We may incur costs to defend against, face liability or be vulnerable to intellectual property infringement, misappropriation, and other claims and allegations brought against us by others, which could result in substantial damages and diversion of management’s efforts and attention.
Third parties may assert claims against us alleging that we infringe upon, misappropriate, dilute or otherwise violate their intellectual property rights, particularly as we expand our business. These risks have been amplified by the increase in third parties whose sole or primary business is to assert such claims. These claims, regardless of their merit, could be expensive and time consuming to defend and could divert management resources. We cannot predict the outcome of lawsuits or administrative proceedings, and we cannot ensure that the results of any such actions will not have an adverse effect on our business, financial condition or results of operations. TheseIf these claims are resolved against us, theywe could result inincur significant monetary liability, or prevent uswe could be prevented from renting or selling some of our products or using some of our technology. In addition, a finding of liability or other resolution of claims may require us to change our business model, redesign or rebrand our products, replace portions of our technology platform, license rights from third parties, cease using certain brand names or other intellectual property rights altogether, or make substantial payments for royalty or license fees, legal fees, disgorgement of profits, corrective advertising, settlement payments or other costs or damages. Further, licenses may not be available to us on reasonable terms, if at all. Any of these events could harm our business and cause our results of operations, liquidity and financial condition to suffer.
Our use of third-party open-source software could adversely affect our ability to offer our products and offerings and subjects us to possible litigation.
We use third-party open-source software in connection with the development and deployment of our software applications and will likely use third-party open sourceopen-source software in the future. Some open-source licenses require that source code that is developed using open sourceopen-source software be made available to the public at no cost and that any modifications or derivative works to certain open sourceopen-source software continue to be licensed under open sourceopen-source licenses, which in some circumstances could include valuable proprietary code. In some circumstances this could require valuable proprietary code to be made available as open-source software, and may also prohibit charging fees to licensees. While we employ practices designed to monitor our compliance with the licenses of open-source software and try to ensure that we do not use any of the open-source software in a manner that would require us to disclose our proprietary source code or preclude us from charging fees, we cannot guarantee that we will be successful. We cannot guarantee that all open-source software is reviewed prior to use in our platform, or that our developers have not incorporated (and will not in the future incorporate) open-source software into our products and offerings without our knowledge. Furthermore, there are an increasing number of open-source software license types, almost none of which have been tested in a court of law, resulting in a dearth of guidance regarding the proper legal interpretation of such licenses. As a result, there is a risk that open-source software licenses could be construed in a manner that imposes unanticipated conditions or restrictions on our ability to market or provide our products and offerings. If we were to receive a claim of non-compliance with the terms of any of our open-source licenses, we may be required purchase a costly license, to publicly release certain portions of our proprietary source code, to limit or prohibitcease our use of some or all of our software, or expend substantial time and resources to re-engineer some or all of our software. We could also be precluded from charging fees for third-party use of our proprietary code.
In addition, the use of third-party open-source software typically carries greater technical and legal risks than the use of third-party commercial software because open-source licensors generally do not provide support, warranties or controls on the functionality or origin of the software. To the extent that our platform depends upon the successful operation of open-source software, any undetected errors or defects could prevent the deployment or impair the functionality of our systems and injure our reputation. Use of open-source software may also present additional security risks because the public availability of such software may make it easier for hackers and other third parties to compromise our platform. Any of the foregoing could be harmful to our business, financial condition, or results of operations and could help our competitors develop offerings that are similar to or better than ours.
We are subject to rapidly changing and increasingly stringent laws and industry standards relating to data privacy, data security, data protection, and consumer protection. The restrictions, obligations and costs imposed by these laws, or our actual or perceived failure to comply with them, could materially impair our ability to grow our business and negatively impact the results of our operations and subject us to liabilities that adversely affect our business, operations, and financial performance.
We collect, process, store, and use a wide variety of data from current and prospective customers, including personal information, such as home addresses, creditpayment card numbers (through our payment processor) and geolocation. These activities are regulated by a variety of federal, state, local, and foreign data privacy, data security, data protection and consumer protection laws and regulations, as well as industry standards and guidelines, which have become increasingly stringent in recent years. We have in the past and may continue to be subject to allegations that we have violated one or more of these laws.
U.S. data privacy and data security laws are complex and changing rapidly, with the frequent imposition of new and changing requirements across our business. Many U.S. states have enacted laws regulating the online collection, use, and disclosure of personal information and are requiring that companies implement reasonable data security measures. Laws in all U.S. states and territories also require businesses to notify affected individuals, governmental entities, and/or credit reporting agencies of certain security incidents affecting personal information.
Further, the CCPA took effect on January 1, 2020. The CCPA gives California residents expanded rights related to their personal information, including thea private right to accessof action and delete their personal information,statutory damages for certain violations, and receive detailed information about how their personal information is used and shared. The CCPA also createdimposes significant compliance obligations on in-scope businesses, including restrictions on “sales” and certain disclosures of personal information that allow California residents to opt-out of certain sharing of their personal information and may restrict theour use of cookies and similar technologies for advertising purposes, and could cause us to incur additional CCPA compliance costs or create adverse effects as a result of its restrictions. The CCPA provides for civil penalties for violations, and creates a private right of action for data security incidents that is expected to increase data security-related litigation. Additionally, the California Privacy Rights Act (the “CPRA”), passed in California in November 2020. The CPRA will restrict use of certain categories of sensitive personal information that we handle; further restrict the use of cross-context behavioral advertising techniques on which our products and offerings may rely on in the future; expand requirements on businesses that “sell” personal information under the CCPA to businesses like ours that “share” it; require all businesses with any California employees to limit uses of employee data; establish restrictions on the retention of personal information; expand the types of data security incidents subject to the private right of action; and establish the California Privacy Protection Agency to implement and enforce the new law, as well as impose administrative fines. The majority of the CPRA’s provisions will go into effect on January 1, 2023, and additional compliance investment and potential business process changes will likely be required. Similar laws have been proposed in other states and at the federal level, reflecting a trend toward more stringent privacy legislation in the United States. For example, in March 2021, Virginia enactedsince the Virginia Consumer Data Protection Act (the “CDPA”), aCCPA went into effect, comprehensive privacy statutestatutes that sharesshare similarities with the CCPA CPRA,are now in effect and legislation proposedenforceable in Virginia, Colorado, Connecticut, and Utah, and will soon be enforceable in several other states. Some observers have noted that the CCPA, CPRA, and CDPA could mark the beginning of a trend toward more stringent privacy legislation in the United States.states as well. The enactment of such laws could have potentially conflicting requirements that would make compliance challenging, resulting in further uncertainty and requiring us to incur additional costs and expenses in an effort to comply. We expect to continue to invest in compliance initiatives and potentially implement business process changes to support our compliance efforts.
In addition, the Telephone Consumer Protection Act (the “TCPA”), imposes significant restrictions on the ability to make telephone calls or send text messages to mobile telephone numbers, without theincluding requirements to obtain prior consent of the person being contacted.contacted in certain circumstances. We use text messages frequently to communicate service-related issues towith our customers. Efforts to comply with the TCPA do not prevent third-party claims (including class action lawsuits) that we have violated the TCPA from being brought, and such claims could be costly to litigate, and if successful, expose us to substantial statutory damages. TheLikewise, the Controlling the Assault of Non-Solicited Pornography and Marketing Act (the “CAN-SPAM”), imposes specific restrictions and requirements on our efforts to send marketing materials via email, including notice obligations and content requirements that must be includedaddressed in our marketing emails and the ability for recipients to unsubscribe from such emails. The Federal Trade Commission enforces CAN-SPAM, and our efforts to comply with CAN-SPAM may not prevent claimsState Attorneys General also enforce a broad range of “unfair” or “deceptive” trade practice rules and regulations that we have violated the law, which could be costly to resolve, and if successful, expose us to potentially substantial costs, penalties, and potential injunctive relief.relief in connection with all aspects of our sales, advertising, and marketing activities.
We are also subject to the European Union General Data Protection Regulation (the “GDPR”), due to certain of our employees being based in Ireland. The GDPR, which is wide-ranging in scope and applies extraterritorially, imposes severalsubstantial requirements and restrictions relating to the processing of personal data. Thedata, including the personal data of our employees based in Ireland. In addition, GDPR compliance requirements continue to rapidly evolve, which poses compliance challenges for many companies, including us.The GDPR also imposes strict rules on the transfer of personal data out of the EU, including to the U.S. In addition, GDPR compliance requirements are constantly, which have significantly evolved in recent years, including as a result of various challenges and rapidly evolving. For example,court rulings. We expect such rules to continue evolving and face additional challenges in July 2020, the Court of Justice of the European Union invalidated the EU-U.S. Privacy Shield data transfer mechanism, and other data transfer mechanisms such as the Standard Contractual Clauses, have also faced challenged in European courts, potentially limiting how organizations can lawfully transfer personal data from EEAfuture, adding to the U.S. Notably, the GDPR imposes large penalties for noncompliance, including the potential for fines of up to €20 million or 4% of the annual global revenues of the noncompliant entity, whichever is greater.
legal complexity and uncertainty. In addition, privacy advocates and industry groups have regularly proposed, and may propose in the future, self-regulatory standards by which we are legally or contractually bound. If we fail to comply with these contractual obligations or standards, we may face substantial liability or fines. Consumer resistance to the collection and sharing of the data used to deliver targeted advertising, increased visibility of consent or “do not track” mechanisms and “opt-out preference signals” as a result of industry regulatory or legal developments, the adoption by consumers of browser settings or “ad-blocking” software, and the development and deployment of new technologies (including technologies using artificial intelligence) could materially impact our ability to collect data or reduce our ability to deliver relevant promotions or media, which could materially impair the results of our operations. In addition, the U.S. Federal Trade Commission and U.S. State Attorneys General, and international regulators, are increasingly active in investigating and bringing enforcement actions against companies on claims related to notice, transparency, choice and processing of personal informationPersonal Information in the context of sales and marketing and advertising activities.
Further, we are subject to the PCI Data Security Standard, which is a multifaceted security standard that is designed to protect creditpayment card account data as mandated by payment card industry entities. We rely on vendors to handle PCI matters for us and to ensure PCI compliance. Despite our compliance efforts, we may become subject to claims that we have violated the PCI Data Security Standard, based on past, present, and future business practices, which could subject us to fines, restrictions and expulsion from card acceptance programs, have an adverse impact on our business and reputation, and be costly for us to defend.
We may not be successful in achieving compliance with the rapidly evolving privacy, data security, and data protection requirements discussed above, as well as other data privacy, security and consumer protection frameworks that currently, or may in the future, apply to us, despite our efforts to comply, as allcomply. All of these frameworks are constantly evolving and are not always consistent with each other, leading to uncertainty in interpretation. Any actual or perceived non-compliance could result in litigation (including class action lawsuits) and proceedings against us by governmental entities, customers or others, fines and civil or criminal penalties, limited ability or inability to operate our business, offer services, or market our business in certain jurisdictions, negative publicity and harm to our brand and reputation, and reduced overall demand for our products and offerings. Such occurrences could adversely affect our business, financial condition, and results of operations. Our insurance policies may not be adequate to compensate us for the potential losses arising from any such disruptions in or failure or security intrusion of our systems or third-party systems where information important to our business operations is stored. In addition, such insurance may not be available to us in the future on economically reasonable terms, or at all. Further, our insurance policies may not cover any or all claims made against us and could have high deductibles, and defending a suit, regardless of its merit, could be costly and divert management attention.
From time to time, we may be subject to legal proceedings, regulatory disputes, and governmental inquiries that could cause us to incur significant expenses, divert ourmanagement’s attention, and materially harm our business, financial condition, and operating results.
From time to time, we may be subject to claims, lawsuits, government investigations, and other proceedings involving products liability, competition and antitrust, intellectual property, privacy, consumer protection, securities, tax, labor and employment, commercial disputes, environmental regulations, and other matters that could adversely affect our business operations and financial condition. In recent years, we have seen a rise in the number and potential significance of these disputes and inquiries and evolving areas of focus for regulators and private plaintiffs. For example, there has been an increase in consumer class action lawsuits relating to subscription products. Litigation and regulatory proceedings may be protracted and expensive, and the results are difficult to predict. Certain of these matters include speculative claims for substantial or indeterminate amounts of damages and include claims for injunctive relief. Additionally, our litigation costs could be significant. Adverse outcomes with respect to litigation or any of these legal proceedings may result in significant settlement costs or judgments, penalties and fines, or require us to modify our products and offerings, all of which could negatively affect our revenue growth. The results of litigation, investigations, claims, and regulatory proceedings cannot be predicted with certainty, and determining reserves for pending litigation and other legal and regulatory matters requires significant judgment. There can be no assurance that our expectations will prove correct, and even if these matters are resolved in our favor or without significant cash settlements, these matters, and the time and resources necessary to litigate or resolve them, could harm our business, financial condition, and results of operations.
In addition, as a public company, our business and financial condition will become more visible, which may result in an increased risk of threatened or actual litigation, including by competitors and other third parties. If such claims are successful, our business, financial condition, and results of operations would be harmed, and even if the claims do not result in litigation or are resolved in our favor, these claims, and the time and resources necessary to resolve them, would divert the resources of our management and harm our business, financial condition, and results of operations.
We could incur significant liabilities related to, and significant costs in complying with, environmental, health and safety laws and regulations.
Our operations are subject to a variety of federal, state, local and foreign laws and regulations relating to permitting requirements, health, safety and the protection of the environment. These environmental, health and safety laws and regulations include those relating to, among other things, the generation, storage, handling, use and transportation of hazardous and non-hazardous materials; the emission and discharge of hazardous and non-hazardous materials into the environment; and the health and safety of our employees.employees; and the maintenance of our facilities and operations. Our compliance efforts are expected to require ongoing investments and may be costly to maintain.
Despite our efforts, we may become subject to claims that we have violated such laws and regulations based on past, present, and future practices, which could have an adverse impact on our business and reputation, and be costly for us to defend. Failure to comply with such laws and regulations, which tend to become more stringent over time, can result in significant fines, penalties, costs, liabilities or restrictions on operations, injunctive relief, civil or criminal sanctions, and could expose us to costs of investigation or remediation, as well as tort claims for property damage or personal injury, and could negatively affect our business, financial condition or results of operations.
We manage our waste materials as non-hazardous waste, but we cannot guarantee that our supply chain or the products we use will not contain hazardous materials or result in the generation of hazardous waste. Further, liability for the improper release or disposal of waste, even if non-hazardous, can be joint and several and significant and there can be no assurance that we will not have to expend material amounts to remediate the consequences of the generation or disposal of waste in the future, particularly with respect to our dry cleaning operations. Further, we may be responsible as a lessee operator for the costs of investigation, removal or remediation of hazardous or non-hazardous substances or waste located on or in or emanating from our leased properties, as well as any property damage. There can be no assurance that our future operations, properties, uses or conditions will not result in the imposition of liability upon us under environmental laws or other regulations, or expose us to third-party actions such as tort suits.
Furthermore, we rely on third-party suppliers to provide chemicals, cleaning supplies, and handling instructions that comply with applicable health, safety and environmental regulations.regulations, and to support other compliance initiatives from time to time. A failure of such suppliers to provide adequate advice, abide by applicable regulations, or the terms of our contractual relationships may subject us to material liabilities.
Our ability to utilize our net operating loss carryforwards and certain other tax attributes to offset taxable income or taxes may be limited.
As of January 31, 2022,2024, we had federal net operatingoperating loss carryforwards of $560.5$631.1 million, $152.1$152.0 million of which will expire at various times through 2038. Furthermore, we had state net operating loss carryforwards of $32.0$598.0 million, which will expire at various times through 2041. Portions of these net operating loss carryforwards could expire unused and be unavailableunavailable to offset future income tax liabilities. Under the legislation enacted in 2017, commonly referred to as the Tax Cuts and Jobs Act (the “Tax Act”), as modified by the Coronavirus Aid, Relief, and Economic Security (the “CARES Act”),While our U.S. federal net operating losses incurred in taxable years beginning after December 31, 2017, may be carried forward indefinitely, but the deductibility of such federal net operating losses in taxable years beginning after December 31, 2020, is limited. It is uncertain how various states will respond to the Tax Act and the CARES Act. ForIn addition, for state income tax purposes, there may be periods during which the use of net operating loss carryforwards is suspended or otherwise limited, which could accelerate or permanently increase state taxes owed.
In addition, under Sections 382 and 383 of the Internal Revenue Code of 1986, as amended, and corresponding provisions of state law, if a corporation undergoes an “ownership change,” (very generally defined as a greater than 50% change, by value, in the corporation’s equity ownership by certain shareholders or groups of shareholders over a rolling three-year period), the corporation’s ability to use its pre-change net operating loss carryforwards and other pre-change tax attributes to offset its post-change income or taxes may be limited. In 2021, we completed a Section 382 analysis covering the period beginning in March 2009 and ending in March 2021. From the study, we concluded we experienced an ownership change in 2010 (but not since then) and $1.3 million of net operating losses (“NOLs”) were subject to the limitation. However, all of those NOLs were available by the year ended January 31, 2017. We may have experienced since March 2021 and may experience in the future additional ownership changes as a result of subsequent shifts in our stock ownership, some of which may be outside of our control. Any ownership change may result in the imposition of additional limitations on our ability to utilize our NOLs existing at the time of the ownership change. Future regulatory changes could also limit our ability to utilize our NOLs. To the extent we are not able to offset future taxable income with our NOLs, our cash flows may be adversely affected. We have recorded a full valuation allowance against our U.S. deferred tax assets, which includes net operating loss carryforwards.
Changes in our effective tax rate or tax liability may have an adverse effect on our results of operations.
We are subject to income and other taxes in the United States on a federal and state basis, as well as subject to taxation in Ireland. Our effective tax rate or tax liability could be adversely affected due to several factors, including:
•changes in the relative amounts of income before taxes in the various jurisdictions in which we operate that have differing statutory tax rates;
•changes in the United States or foreign tax laws, tax treaties, and regulations or the interpretation of them;their interpretation;
•changes to our assessment about our ability to realize our deferred tax assets that are based on estimates of our future results, the prudence and feasibility of possible tax planning strategies, and the economic and political environments in which we do business;
•the outcome of current and future tax audits, examinations, or administrative appeals; and
•limitations or adverse findings regarding our ability to do business in some jurisdictions.
In the event any tax audit or other proceeding is determined adversely to us, the resulting liabilities (including any penalties and interest) may have an adverse effect on our cash flows. If we expand the scale of our international business activities, any changes in the United States or foreign taxation of such activities may increase our worldwide effective tax rate and harm our business, financial condition, and results of operations. In particular, newNew income or other tax laws or regulations could be enacted at any time, which could adversely affect our business operations and financial performance. Further, existing tax laws and regulations could be interpreted, modified, or applied adversely to us. For example,Any such new laws or regulations or the Tax Act enacted many significant changes to the U.S. tax laws. Future guidance from the IRSinterpretation, modification or application of existing laws and other tax authorities with respect to the Tax Act may affect us, and certain aspects of the Tax Act could be repealed or modified in future legislation. In addition, proposals have been made by the current presidential administration and congress that could enact significant changes to the taxation of business entities including, among others, a permanent increase in the corporate income tax rate, an increase in the tax rate applicable to the global intangible low-taxed income and elimination of certain exemptions, and the imposition of minimum taxes or surtaxes on certain types of income. We are currently unable to predict whether such changes will occur and, if so, the ultimate impact on our business. To the extent that such changes have a negative impact on us, our suppliers or our customers, including as a result of related uncertainty, these changesregulations may materially and adversely impact our business, financial condition, results of operations and cash flows.
Risks Related to Our Dependence on Third Parties
We face risks associated with brand and manufacturing partners from whom our products are sourced or co-manufactured.
We obtain substantially all of our products directly from over 780hundreds of brand partners through Wholesale, Share by RTR, and Exclusive Designs arrangements with designer and/or manufacturing partners. The benefits we currently experience from these relationships could be adversely affected if they:
•discontinue selling products to us or manufacturing our Exclusive Designs;
•enter into arrangements with competitors that could impair our ability to source their products, including by giving our competitors exclusivity arrangements or limiting our access to certain products;
•raise the prices they charge us;
•are not satisfied with the value proposition we offer them;
•do not view our brand or financial profile favorably;
•change pricing terms to require us to pay a significant portion of the cost of items on delivery or upfront;
•experience negative publicity or reputational issues;
•do not follow our vendor code of conduct and/or violate legal and regulatory requirements;
•experience supply chain disruptions that cause lead times to be lengthened;lengthened or missed entirely; or
•fail to execute on the design we have provided for co-manufactured products.
Events that adversely impact our brand and manufacturing partners could impair our ability to obtain adequate and timely products. We also source and manufacture products outside of the United States and we and many of our brand partners use manufacturers in the same geographic region.regions. As a result we may be subject to magnified impact from such events including, among others, difficulties or problems associated with our partners’ business, the financial instability and labor problems of partners, product quality and safety issues, natural or man-made disasters, inclement weather conditions, war, acts of terrorism and other political instability, economic conditions, imposition of additional import or trade restrictions, including legal or economic restrictions on overseas partners’ ability to produce and deliver products, increased custom duties and tariffs, unforeseen delays in customs clearance of goods, more restrictive quotas, loss of a most favored nation trading status, currency exchange rates, transportation delays, port of entry issues, the availability of their raw materials and increased production costs.
Our brand partners and manufacturers may be forced to reduce their production or operations, shut down their operations or file for bankruptcy. Our ability to obtain products timely and cost effectively may also depend on our brand partners’ ability to obtain financing, including through factoring companies and other entities, which may also assess our creditworthiness and procurement ability. To the extent our brand partners are unable to secure sufficient credit, they may not be able to produce merchandise, which would impact our ability to purchase merchandise from them. The occurrence of one or more of these events could impact our ability to acquire products, which may result in a less appealing assortment of styles for our customers and reduced availability of the styles we are able to obtain. Similarly, the occurrence of a contagious disease or illness could cause delays or increase costs in the manufacture of certain products. For example, the COVID-19 pandemic caused delays in some shipments from our brand partners.
We rely on third parties for elements ofto provide the payment processing infrastructure underlying our business. If these third-party elementsproviders become unavailable or unavailable on favorable terms, our business could be adversely affected.
We rely on third parties including for ourto provide payment processing infrastructure, to accept card payments from customers and in connection withthrough our banking partners, to remit payments to suppliers. These third parties may refuse to renew our agreements with them on commercially reasonable terms or at all. Furthermore, we rely on a single payment processor, which may increase our risks of being unable to process payments and deliver our products in a timely and cost-effective manner. In the event of interruption, we may not be able to develop alternate or secondary processing without incurring material additional costs and substantial delays. If these companiesproviders become unwilling or unable to provide these services to us on acceptable terms or at all, our business may be disrupted. For certain payment methods, including credit and debit cards, we generally pay interchange fees and other processing and gateway fees, and such fees result in significant costs. Online payment providers have also required, and may in the future require, us to provide demonstrations of credit based on providers’ perceptions of our creditworthiness. In addition, online payment providers are under continued pressure to pay increased fees to banks to processsettle funds, and there is no assurance that such online payment providers will not pass any increased costs on to us.us, as and when such costs increase. If these fees or other obligations increase over time, our operating costs will increase, which could adversely affect our business, financial condition, and results of operations.
Outages or other failures of theour payment processing infrastructure underlying our businessprocessors could harm our business and cause customers to lose trust in our payment operations and cause them to discontinue use of our products and services. If the quality or convenience of our payment processing infrastructure declines for any reason,or does not keep pace with industry standards, the attractiveness of our business to customers could be adversely affected. For example, we plan to enhance our payment operations in the future; however, our efforts may be unsuccessful or delayed for various reasons and may fail to meet customer expectations. If we are forced to migrate to other third-party payment service providers for any reason, the transition would require significant time and management resources, and may not be available on acceptable terms or be as effective, efficient, or well-received by our customers.
Our business relies on third-party cloud infrastructures, and any disruption of, or interference with, our use of cloud infrastructures could adversely affect our business, financial condition or results of operations.
We have very recentlyIn 2022, we migrated a substantial portion of our primary production environment, core architecture, and data centers to a new third-party cloud provider, which provides a distributed computing infrastructure as a service platform for business operations. We also use another third-party cloud provider for other portions of our business. Our third-party cloud providers provide the cloud computing infrastructure we use to host our website and mobile application, serve our customers and support our operations and many of the internal tools we use to operate our business. Our website, mobile application, and internal tools and operations use computing, storage, data transfer and other functions and services provided by our third-party cloud providers. We do not have control over the operations of the facilities of our third-party cloud providers. In addition, our third-party cloud providers’ facilities may be vulnerable to damage or interruption from earthquakes, hurricanes, floods, fires, cybersecurity attacks, terrorist attacks, power losses, telecommunications failures and other events beyond our control. In the event that any third-party provider’s systems or service abilities are hindered by any of the events discussed above, particularly in a region where our website is mainly hosted, our ability to operate our business may be impaired. A decision to close their facilities without adequate notice or other unanticipated problems or disruptions could result in lengthy interruptions to our business. Further, our agreements with our third-party cloud providers do not provide us with an adequate remedy for every scenario that could negatively affect our business.business and limit our third-party cloud providers’ liability. All of the aforementioned risks may be exacerbated if our business continuity and disaster recovery plans prove to be inadequate.
Additionally, data stored with our third-party cloud providers may experiencebe subject to cybersecurity risks that threaten the confidentiality, availability, and integrity of such data, including threats or attacks from computer malware, ransomware, viruses, social engineering (including phishing attacks), denial of service or other attacks, employee theft or misuse and general hacking. Any of these security incidents could result in unauthorized access to, damage to, disablement or encryption of, use or misuse of, disclosure of, modification of, destruction of, or loss of our data or our customers’ data or disrupt our ability to provide our products and offerings, including due to any failure by us or our service providers to properly configure our cloud environment. Our business’ continuing and uninterrupted performance is critical to our success. Customers may become dissatisfied by any system failure that interrupts our ability to provide our merchandise and offerings to them. We may not be able to easily switch our third-party cloud operations to another cloud or other data center provider if there are disruptions or interference with cloud services and, even if we do switch our operations, other cloud and data center providers are subject to the same risks. Sustained or repeated system failures would reduce the attractiveness of our products and offerings, thereby reducing revenue. Moreover, negative publicity arising from these types of disruptions could damage our brand and reputation and may adversely impact our business.
Our third-party cloud providers do not have an obligation to renew their agreements with us on terms acceptable to us.us or at all. Although alternative data center providers couldmay be able to host our business on a substantially similar basis to our current third-party cloud providers, transitioning our cloud infrastructure to alternative providers could potentially be disruptive, and we could incur significant one-time costs. If we are unable to renew our agreement for our cloud services on commercially acceptable terms, our agreements with our third-party cloud providers are prematurely terminated, or we add additional infrastructure providers, we may experience costs or downtime in connection with the transfer to, or the addition of, new data center providers. If our third-party cloud providers or other infrastructure providers increase the costs of their services, our business, financial condition or results of operations could be materially and adversely affected.
We depend on search engines, social media platforms, mobile application stores, content-based and cross-context behavioralonline advertising and other online sources to attract consumers to and promote our website and our mobile application, which may be affected by third-party actions or interference beyond our control and, as we grow, our marketing and/or customer acquisition costs will continue to rise.
Our success depends on our ability to attract consumers to our website and mobile application and convert them into customers in a cost-effective manner. We depend, in large part, on search engines, social media platforms, mobile application stores, content-based online and cross-context behavioral advertising and other online sources for traffic to our website and mobile application.
With respect to search engines, we are included in search results for both paid search listings, where we purchase specific search terms resulting in inclusion of our advertisements, and free search listings, which depend on algorithms used by search engines. For paid search listings, if one or more of the search engines or other online sources on which we rely for purchased listings modifies or terminates its relationship with us, our expenses could rise, we could lose consumers who access our advertisements and traffic to our website could decrease, any of which could have a material adverse effect on our business, financial condition, and results of operations. For free search listings, if search engines on which we rely for algorithmic listings modify their algorithms, our websites may appear less prominently or not at all in search results, which could result in reduced traffic to our websites.
Our ability to maintain and increase the number of consumers directed to our products from digital platforms is not entirely within our control. Search engines, social media platforms and other online sources often revise their algorithms products, and APIs, and introduce new advertising products. If one or more of the search engines or other online sources on which we rely for traffic to our website and our mobile application were to modify its general methodology for how it displays our advertisements or keyword search results resultingor change their APIs without sufficient notice, as they have in the past and may again in the future, fewer consumers clickingmay click through to our website and our mobile application or have difficulty accessing our sites, and our business and operating results are likely to suffer. Our efforts to attract consumers and convert them into customers also rely heavily on the use of cookies and similar tracking technologies, and our ability to use and benefit from such technologies may be restricted or prohibited by changes in the law, market practice, or technology, or third parties who are not under our control. For example, Apple recently moved toutilizes “opt-in” privacy models for mobile applications using its operating system such as ours, requiring such applications to give consumers the choice to voluntarily chooseallow or deny the use of tracking technologies to receiveengage in targeted ads,advertising and similar activities, which may reduce the efficacy of our marketing tracking. In addition, if our online display advertisements are no longer effective or are not able to reach certain customers due to their use of ad-blocking software, our business and operating results could suffer. Furthermore, changes in customer acceptance or usage of our online sources for traffic could adversely impact the effectiveness of our advertising.
Additionally, changes in regulations could limit the ability of search engines and social media platforms including, but not limited to, Google and Facebook, to collect data from users and engage in targeted advertising, making them less effective in disseminating our advertisements to our target customers. For example, the proposed Designing Accounting Safeguards to Help Broaden Oversight and Regulations on Data (DASHBOARD) Act would mandate annual disclosure to the SEC of the type and “aggregate value” of user data used by harvesting companies, such as, but not limited to, Facebook, Google and Amazon, including how revenue is generated by user data and what measures are taken to protect the data. If the costseffectiveness of advertising onmarketing through search engines and social media platforms diminishes, or if costs of through such channels increase, we may incur additional marketing expenses or be required to allocate a larger portion of our marketing spend to other channels and our business and operating results could be adversely affected.
Furthermore, we depend on the Apple App Store to distribute our mobile application, and because many of our customers access our products through our mobile application, we depend onany changes to the Apple App Store to distributeterms and conditions or how the Apple App Store functions in connection with our mobile application.application could adversely affect our business. Apple has broad discretion to change its respective terms and conditions, including those relating to the amount of (and requirement to pay) certain fees associated with our use of the Apple App Store, to interpret its respective terms and conditions in ways that may limit, eliminate or otherwise interfere with our ability to distribute our mobile application through its stores, the features we provide and the manner in which we market in-application products. We cannot provide assurance that Apple will not limit, eliminate or otherwise interfere with the distribution of our mobile application, the features we provide and the manner in which we market our mobile application. To the extent it does so, our business, financial condition, and results of operations could be adversely affected.
As existing social media platforms continue to rapidly evolve and new platforms develop, we must continue to maintain a presence on these platforms and establish presences on new or emerging social media platforms. If we are unable to cost-effectively use social media platforms as marketing tools or if the social media platforms we use change their policies or algorithms, we may not be able to fully optimize such platforms, and our ability to maintain and acquire consumers and our financial condition may suffer. Furthermore, as laws and regulations and public opinion rapidly evolve to govern the use of these platforms and devices, the failure by us, our employees, our network of social media influencers, our sponsors or third parties acting at our direction to abide by applicable laws and regulations in the use of these platforms and devices or otherwise could subject us to regulatory investigations, class action lawsuits, liability, fines or other penalties and have an adverse effect on our business, financial condition, results of operations and prospects.
Any failure by us, our brand partners, or our third-party manufacturers to comply with our vendor code of conduct, product safety, labor, or other laws, or to provide safe factory conditions for their workers, may damage our reputation and brand, and harm our business.
Our standard vendor terms and conditions, vendor code of conduct, and other policies require our brand and manufacturing partners to comply with applicable laws and certain business standards, however, we often have limited visibility into their supply chains, practices, and level of compliance The failure of these partners to comply with our vendor code of conduct or applicable laws and regulations could damage our reputation, lead to negative press and/or customer sentiment, or result in costly litigation against us.
The products we rent or sell to our customers isare subject to regulation by the Federal Consumer Product Safety Commission, the Federal Trade Commission, and similar state and international regulatory authorities. As a result, such products could in the future be subject to mandatory recalls and other remedial actions. Product safety, labeling, and licensing concerns may also result in us voluntarily removing selected products from our assortment. Such recalls or voluntary removal of products can result in, among other things, lost revenue, diverted resources, potential harm to our reputation, and increased customer service costs and legal expenses, which could have a material adverse effect on our operating results.
It is possible that some of the products we rent or sell may expose us to product liability claims and litigation or regulatory action relating to personal injury. Although we maintain liability insurance, we cannot be certain that our coverage will be adequate for liabilities actually incurred or that insurance will continue to be available to us on economically reasonable terms or at all. In addition, our partners may not have sufficient resources or insurance to satisfy their indemnity and defense obligations to us in connection with product liability claims or regulatory actions.
We may incur significant losses from fraud.
We have in the past incurred and may in the future incur losses from various types of fraud, including claims that a customer did not authorize a purchase, customers who have closed bank accounts or have insufficient funds to satisfy payments, customers who use stolen credit cards to make purchases, customers who fraudulently rented multiple products at once and customers who have failed to return rentals. In addition to the direct costs of such losses, if the fraud is related to credit card transactions and becomes excessive, it could result in us paying higher fees or losing the right to accept credit cards for payment. In addition, under current credit card practices, we are typically liable for fraudulent credit card transactions. We have implemented fraud prevention measures, such as detection tools to identify irregular or high risk customer order patterns, to reduce the risk of fraud. However, these measures may be insufficient to prevent or detect fraud and our failure to adequately prevent fraudulent transactions could damage our reputation, result in litigation or regulatory action, and lead to costs, fees, and expenses that could substantially impact our operating results.
If our insurance coverage is insufficient for the needs of our business or our insurance providers are unable to meet their obligations, we may not be able to mitigate the risks facing our business.
We procure third-party insurance policies to cover various operations-related risks including employment practices liability, workers’ compensation, property and business interruptions, cybersecurity and data security incidents, crime, directors’ and officers’ liability, and general business liabilities. In addition, we are required to maintain certain levels of insurance coverage in certain commercial agreements, such as our real estate leases, and in our Credit Facility Amendment. We cannot guarantee that we will continue to receivemaintain adequate insurance coverage on favorable terms.terms that meets our coverage needs and/or contractual obligations. Insurance providers may discontinue their coverage or significantly increase the cost of coverage, and we cannot guarantee that we would be able to secure replacement coverage on reasonable terms or at all. In addition, if our insurance carriers change the terms of our policies in a manner not favorable to us, our insurance costs could increase. Further, if the insurance coverage we maintain is not adequate to cover losses that occur, or if we are required to purchase additional insurance for other aspects of our business (including due to contractual requirements), we could be liable for significant additional costs. Additionally, if any of our insurance providers becomes insolvent, it would be unable to pay any operations-related claims that we make.
Insurance providers have also raised premiums and deductibles for many businesses, including ours, and may do so in the future. As a result, our insurance and claims expense could increase, or we may decide to raise our deductibles or self-insured retentions when our policies are renewed or replaced. Our business, financial condition, and results of operations could be adversely affected if the cost per claim, premiums, the severity of claims, or the number of claims significantly exceeds our historical experience and coverage limits; we experience a claim in excess of our coverage limits; our insurance providers fail to pay on our insurance claims; we experience a claim for which coverage is not provided; or the number of claims under our deductibles or self-insured retentions differs from historical averages.
Risks Related to Ownership of Our Class A Common Stock
The dual class structure of our common stock and stockholders’ agreement among us and certain stockholders has the effect of concentrating voting control with those stockholders who held our capital stock prior to the listing of our Class A common stock on Nasdaq, including our Co-Founders, and their affiliates, which will limit an investor’s ability to influence the outcome of important transactions, including a change of control.
Our Class B common stock has 20 votes per share, and our Class A common stock has one vote per share. Because of the twenty-to-one voting ratio between our Class B and Class A common stock, the holders of our Class B common stock collectively could continue to control a significant percentage of the combined voting power of our common stock and therefore be able to control all matters submitted to our stockholders for approval until the date of automatic conversion described below, when all outstanding shares of Class B common stock and Class A common stock will convert automatically into shares of a single class of common stock. In addition, we and certain stockholders, including our CEO and Co-Founder Jennifer Y. Hyman, entered into a stockholders’ agreement in connection with our IPO with respect to the election of directors. This concentrated control may limit or preclude an investor’s ability to influence corporate matters for the foreseeable future, including the election of directors, amendments of our organizational documents, and any merger, consolidation, sale of all or substantially all of our assets, or other major corporate transaction requiring stockholder approval. In addition, this may prevent or discourage unsolicited acquisition proposals or offers for our capital stock that investors may believe are in their best interests.
Future transfers by holders of Class B common stock will generally result in those shares converting to Class A common stock, subject to limited exceptions, such as certain transfers effected for estate planning purposes. In addition, each share of Class B common stock will convert automatically into one share of Class A common stock upon the date that is the earlier of (i) the transfer of such share to a person that is not in the same Permitted Ownership Group (as defined in theour Amended Charter)and Restated Certificate of Incorporation (“Amended Charter”)) as such Permitted Class B Holder (as defined in the Amended Charter), (ii) November 1, 2028, or (iii) with respect to any shares held by any person in our Co-Founder’s Permitted Ownership Group, (A) such time as a Co-Founder is removed or resigns from the Board of Directors, or otherwise ceases to serve as a director on the Board of Directors, (B) such time as a Co-Founder ceases to be either an employee, officer or consultant, or (C) the date that is 12 months after the death or disability of a Co-Founder.
We are required to meet the Nasdaq Capital Market’s continued listing requirements and other Nasdaq rules, or we may risk delisting. Delisting could negatively affect the price of our Class A common stock, which could make it more difficult for us to sell securities in a future financing or for you to sell our Class A common stock.
We are required to meet the continued listing requirements of the Nasdaq Capital Market and other Nasdaq rules, including those regarding director independence and independent committee requirements, minimum stockholders’ equity, minimum share price and certain other corporate governance requirements. In particular, we are required to maintain a minimum bid price for our listed Class A common stock of $1.00 per share and maintain a minimum market value of $35 million for our listed securities. If we do not meet these continued listing requirements, our Class A common stock could be delisted. On October 20, 2023, we received a letter from The Nasdaq Stock Market LLC indicating that, for the last thirty consecutive business days, the bid price for our Class A common stock had closed below the minimum $1.00 per share requirement for continued listing on The Nasdaq Capital Market under Nasdaq Listing Rule 5550(a)(2) (the “Bid Price Rule”). In accordance with Nasdaq Listing Rule 5810(c)(3)(A), we were provided an initial period of 180 calendar days, or until April 17, 2024, to regain compliance. The letter stated that the Nasdaq staff would provide written notification that we have achieved compliance with the Bid Price Rule if at any time before April 17, 2024, the bid price of our Class A common stock closed at $1.00 per share or more for a minimum of ten consecutive business days.
In addition, on March 27, 2024, we received a letter from The Nasdaq Stock Market LLC indicating that the Company is no longer in compliance with the minimum market value of listed securities of $35,000,000 required for continued listing on The Nasdaq Capital Market under Nasdaq Listing Rule 5550(b)(2) (the “Minimum Market Value Rule”). In accordance with Nasdaq Listing Rule 5810(c)(3)(C), we were provided a period of 180 calendar days, or until September 23, 2024, to regain compliance. The letter stated that the Nasdaq staff would provide written notification that we have achieved compliance with the Minimum Market Value Rule if at any time before September 23, 2024, the Company’s market value of listed securities closed at $35,000,000 or more for a minimum of ten consecutive business days.
Neither letter had an immediate effect on the listing or trading of our Class A common stock.
On March 21, 2024, a reverse stock split of our Class A and Class B common stock was approved by our stockholders and our Board subsequently determined to effect the reverse stock split at a ratio of 1-for-20. This amendment became effective on April 2, 2024 and we began trading on a post-split basis on April 3, 2024 (the “Reverse Stock Split”). The Reverse Stock Split is intended to allow us to regain compliance with the Bid Price Rule; however there can be no assurance that we will be successful in doing so, or in maintaining our compliance once achieved, if our stock price declines below $1.00 in the future. In addition, there can be no assurance that we will be successful in regaining compliance with the Minimum Market Value Rule.
If we do not regain compliance with the Bid Price Rule by April 17, 2024, or compliance with the Minimum Market Value Rule by September 23, 2024, and if it appears to the Nasdaq staff at such time that we will not be able to cure the applicable deficiency, Nasdaq would notify us that our securities would be subject to delisting. In the event of such a notification, we may appeal the Nasdaq staff’s determination to delist our securities. There can be no assurance that the Nasdaq staff would grant our request for continued listing subsequent to any delisting notification.
Delisting from the Nasdaq Capital Market would cause us to pursue eligibility for trading of these securities on other markets or exchanges, or on the “pink sheets.” In such case, our stockholders’ ability to trade, or obtain quotations of the market value of our Class A common stock would be severely limited because of lower trading volumes and transaction delays. These factors could contribute to lower prices and larger spreads in the bid and ask prices of these securities. There can be no assurance that our securities, if delisted from the Nasdaq Capital Market in the future, would be listed on a national securities exchange, a national quotation service, the over-the-counter markets or the pink sheets. Delisting from the Nasdaq Capital Market, or even the issuance of a notice of potential delisting, would also result in negative publicity, make it more difficult for us to raise additional capital, adversely affect the market liquidity of our securities, decrease securities analysts’ coverage of us or diminish investor, supplier and employee confidence.
Our share price may be volatile, and our investors may be unable to sell shares at or above the price they paid for them.
The market price of our Class A common stock has declined significantly since our IPO, has been volatile and is likely to continue to be volatile and could be subject to wide fluctuations in response to the risk factors described in this Annual Report, and others within or beyond our control, including:
•actual or anticipated fluctuations in our revenue or other operating metrics;
•our actual or anticipated operating performance and the operating performance of our competitors;
•changes in the financial projections we provide to the public or our failure to meet these projections;
•the perceived adequacy of our ESG efforts;
•positive or negative publicity;
•failure of securities analysts to initiate or maintain coverage of us, changes in financial estimates by any securities analysts who follow our company, or our failure to meet the estimates or the expectations of investors;
•any major change in our board of directors, management, or key personnel;
•the economy as a whole and market conditions in our industry;
•rumors and market speculation involving us or other companies in our industry;
•announcements by us or our competitors of significant innovations, new products, services, features, integrations, or capabilities, acquisitions, strategic investments, partnerships, joint ventures, or capital commitments;
•the legal and regulatory landscape and changes in the application of existing laws or adoption of new laws that impact our business, including changes in e-commerce and tax laws;
•legal and regulatory claims, litigation, or pre-litigation disputes and other proceedings;
•the paceimpact of the COVID-19 pandemic recovery and its impact on our business or the fashion industry and sharing economy generally;
•sales or expected sales of our Class A common stock by us, our officers, directors, principal stockholders, and employees;
•if securities or industry analysts publish research about our business, or if they publish unfavorable research; and
•other events or factors, including those resulting from war, incidents of terrorism, or responses to these events.
Our investors may not realize any return on their investment in us and may lose some or all of their investment. In addition, stock markets, and the trading of e-commerce companies’ and technology companies’ stocks in particular, have experienced significant price and volume fluctuations that have affected and continue to affect the market prices of equity securities of many companies. Stock prices of many companies have fluctuated in a manner often unrelated to the operating performance of those companies. These fluctuations may be even more pronounced in the trading marketIt is common for our Class A common stock shortly following the listing of our Class A common stock on Nasdaq as a result of the supply and demand forces described above. In the past, stockholders have institutedto institute securities class action litigation following periods of stock volatility. If we wereWe are currently subject to become involved in securities litigation itwhich could subject us to substantial costs, divert resources and the attention of management from our business, and materially adversely affect our business, financial condition and results of operations.
operations, and we could be subject to additional securities litigation in the future. Company insiders have the ability to control or significantly influence all matters submitted to stockholders for approval.
Our executive officers, directors, and greater than 5% stockholders party to our stockholders’ agreement entered into in connection with our IPO, in the aggregate, beneficially own over 50% of the voting power of our outstanding common stock as of January 31, 2022.2024. This concentration of ownership may have the effect of delaying, deferring, or preventing a change in control, impeding a merger, consolidation, takeover, or other business combination involving us, or discouraging a potential acquirer from making a tender offer or otherwise attempting to obtain control of our business, even if such a transaction would benefit other stockholders.
Our management has broad discretion in the use of our cash resources and may not use them effectively.
Our management has broad discretion, subject to our 2023 Amended Temasek Facility, in the application of our cash resources, including the proceeds from our IPO, which may include working capital, to fund growth and for other general corporate purposes. We may also use a portion of our cash resources to acquire or make investments in businesses, products, offerings, and technologies. We may also spend or invest these proceeds in a way with which our stockholders disagree. The failure by our management to apply these funds effectively could adversely affect our ability to pursue our growth strategies and expand our business. Pending their use, we may invest these funds in a way that does not produce income or that loses value.
We cannot predict whether our dual class structure will result in a lower or more volatile trading price of our Class A common stock, in adverse publicity, or other adverse consequences. For example, certain index providers have announced restrictions on including companies with multiple-class share structures in certain of their indices. In July 2017, FTSE Russell announced that it plans to require new constituents of its indices to have greater than 5% of the company’s voting rights in the hands of public stockholders, and S&P Dow Jones announced that it will no longer admit companies with multiple-class share structures to certain of its indices. Affected indices include the Russell 2000 and the S&P 500, S&P MidCap 400, and S&P SmallCap 600, which together make up the S&P Composite 1500. Also in 2017, MSCI, a leading stock index provider, opened public consultations on their treatment of no-vote and multi-class structures and temporarily barred new multi-class listings from certain of its indices; however, in October 2018, MSCI announced its decision to include equity securities “with unequal voting structures” in its indices and to launch a new index that specifically includes voting rights in its eligibility criteria. Under such announced policies, the dual class structure of our common stock would make us ineligible for inclusion in certain indices and, as a result, mutual funds, exchange-traded funds, and other investment vehicles that attempt to passively track those indices would not invest in our Class A common stock. These policies are relatively new and it is unclear what effect, if any, they will have on the valuations of publicly-traded companies excluded from such indices, but it is possible that they may depress valuations, as compared to similar companies that are included. Because of the dual class structure of our common stock, we will likely be excluded from certain indices, and we cannot provide assurance that other stock indices will not take similar actions. Given the sustained flow of investment funds into passive strategies that seek to track certain indices, exclusion from certain stock indices would likely preclude investment by many of these funds and would make our Class A common stock less attractive to other investors. As a result, the trading price of our Class A common stock could be adversely affected.
Our business and financial performance may differ from any projections that we disclose or any information that may be attributed to us by third parties.
From time to time, we may provide guidance regarding our projected business and/or financial performance. However, any such projections involve risks, assumptions, and uncertainties, and our actual results could differ materially from such projections. Factors that could cause or contribute to such differences include, but are not limited to, those identified in these Risk Factors,the risk factors described in this Annual Report, some or all of which are not predictable or within our control. Other unknown or unpredictable factors also could adversely impact our performance, and we undertake no obligation to update or revise any projections, whether as a result of new information, future events, or otherwise. In addition, various news sources, bloggers, and other publishers often make statements regarding our historical or projected business or financial performance, and you should not rely on any such information even if it is attributed directly or indirectly to us.
Our trading price and trading volume could decline if securities or industry analysts do not publish research about our business, or if they publish unfavorable research.
The trading market for our common stock depends in part on the research and reports that analysts publish about our business. We do not have any control over the content and opinions included in their reports. The trading price of our Class A common stock could decline if one or more equity research analysts downgrade our stock or publish other unfavorable commentary or research. If one or more equity research analysts cease coverage of our company, or fail to regularly publish reports on us, the demand for our Class A common stock could decrease, which in turn could cause our trading price or trading volume to decline.
Future sales of our common stock in the public market could cause our share price to fall.
The sale of substantial amounts of shares of our common stock in the public market, or the perception that such sales could occur, could harm the prevailing market price of shares of our Class A common stock. These sales, or the possibility that these sales may occur, also might make it more difficult for us to sell equity securities in the future at a time and at a price that we deem appropriate.
In the future, we may sell additional Class A common stock, other series of common stock, convertible securities, or other equity securities, including preferred securities, in one or more transactions at prices and in a manner we determine from time to time. We also expect to issue Class A common stock to employees, consultants, and directors pursuant to our equity incentive plans. If we sell Class A common stock, other series of common stock, convertible securities, or other equity securities in subsequent transactions, or Class A common stock or Class B common stock is issued pursuant to equity incentive plans, investors may be materially diluted. New investors in subsequent transactions could gain rights, preferences, and privileges senior to those of holders of our Class A common stock.
In addition, we may issue our capital stock or securities convertible into our capital stock from time to time in connection with a financing, acquisition, investments, or otherwise. Additional issuances of our stock will result in dilution to existing holders of our stock. Also, to the extent outstanding stock options to purchase our stock are exercised or restricted stock units (“RSUs”) settle, there will be further dilution. The amount of dilution could be substantial depending upon the size of the issuance or exercise. Any such issuances could result in substantial dilution to our existing stockholders and cause the trading price of our Class A common stock to decline.
Upon the expiration of our lock-up agreement and as restrictions on resale end, the market price of our shares of Class A common stock could drop significantly if the holders of these restricted shares sell them or are perceived by the market as intending to sell them. These factors could also make it more difficult for us to raise additional funds through future offerings of our shares of Class A common stock or other securities.
We, our executive officers, directors and the holders of substantially all of our outstanding stock prior to our IPO signed lock-up agreements with the underwriters that, subject to certain customary exceptions, restrict the sale of the shares of our common stock and certain other securities held by them for 180 days following the date of the final prospectus filed in connection with our initial public offering. Goldman Sachs & Co. LLC, Morgan Stanley & Co. LLC and Barclays Capital Inc. may, in their sole discretion and at any time without notice, release all or any portion of the shares or securities subject to any such lock-up agreements.
We do not intend to pay dividends for the foreseeable future. Consequently, any gains from an investment in our Class A common stock will likely depend on whether the price of our Class A common stock increases.
We have never declared or paid any cash dividends on our Class A common stock, and we do not intend to pay any cash dividends in the foreseeable future. We expect to retain future earnings, if any, to fund the development and growth of our business and for general corporate purposes. Any future determination to pay dividends on our capital stock will be at the discretion of our board of directors. Furthermore, our ability to pay dividends may also be restricted by the terms of our Amended Temasek Facility or any future debt or preferred equity securities of us or our subsidiaries. Accordingly, investors may need to sell theirIf shares of our Class A common stock become subject to realizethe penny stock rules, it would become more difficult to trade them.
The SEC has adopted regulations which generally define a return“penny stock” to be an equity security that has a market price of less than $5.00 per share or an exercise price of less than $5.00 per share, subject to specific exemptions, including an exemption for any securities listed on their investment,a national securities exchange. The rules impose additional sales practice requirements on broker-dealers for transactions involving “penny stock”, with some exceptions. If shares of our Class A common stock were delisted from the Nasdaq Capital Market and determined to be “penny stock”, broker-dealers may find it more difficult to trade such securities and investors may not be ablefind it more difficult to sell their shares atacquire or abovedispose of such securities on the price they paid for them.secondary market.
Certain provisions in our corporate charter documents and under Delaware law may prevent or hinder attempts by our stockholders to change our management or to acquire a controlling interest in us, and the trading price of our Class A common stock may be lower as a result.
There are provisions in our Amended Charter and Amended and Restated Bylaws (“Amended Bylaws”) that may make it difficult for a third party to acquire, or attempt to acquire, control of our company, even if a change in control were considered favorable by our stockholders. These anti-takeover provisions include:
•authorization of the issuance of “blank check” preferred stock that our board of directors could use to implement a stockholder rights plan;
•provide for a dual class common stock structure in which holders of our Class B common stock, which has 20 votes per share, have the ability to control the outcome of matters requiring stockholder approval, even if they own significantly less than a majority of the outstanding shares of our Class B and Class A common stock, including the election of directors and significant corporate transactions, such as a merger or other sale of our company or its assets;
•a classified board of directors so that not all members of our board of directors are elected at one time;
•a requirement that our directors may only be removed for cause;
•the ability of our directors to fill all board vacancies, subject to the rights granted pursuant to the stockholders’ agreement;
•a prohibition on stockholder actions by written consent, thereby requiring that all stockholder actions be taken at a meeting of our stockholders;
•advance notice procedures for stockholder director nominees and annual meeting matters (other than the parties to our stockholders; agreement for nominations made pursuant to the terms of the stockholders’ agreement);
•an inability of our stockholders to call special meetings of stockholders;
•the ability of our directors to amend our Amended Bylaws without stockholder consent;
•the requirement of a super-majority to amend some provisions in our Amended Charter and Amended Bylaws; and
•a prohibition on cumulative voting for directors.
Although we have opted out of Section 203 of the General Corporation Law of the State of Delaware, (the “DGCL”), our Amended Charter contains provisions that are similar to Section 203. Specifically, our Amended Charter provides that, subject to certain exceptions, we will not be able to engage in a “business combination” with any “interested stockholder” for three years following the date that the person became an interested stockholder, unless certain requirements are met. A “business combination” includes, among other things, a merger or consolidation involving us and the “interested stockholder” or the sale of more than 10% of our assets or to an interested stockholder. In general, an “interested stockholder” is any entity or person beneficially owning 15% or more of our outstanding voting stock and any affiliates or associates of such entity or person.
Any provision in our Amended Charter, Amended Bylaws, or Delaware law that has the effect of delaying or deterring a change in control could limit the opportunity for our stockholders to receive a premium for their shares of our Class A common stock, and could also affect the price that some investors are willing to pay for our Class A common stock.
Our Amended Charter designates the Court of Chancery of the State of Delaware and the federal district courts of the United States of America as the exclusive forums for substantially all disputes between us and our stockholders, which could limit our stockholders’ ability to obtain a favorable judicial forum for disputes with us or our directors, officers, or employees.
Our Amended Charter provides that the Court of Chancery of the State of Delaware is the exclusive forum for the following types of actions or proceedings under Delaware statutory or common law: any derivative action or proceeding brought on our behalf, any action asserting a breach of fiduciary duty, any action asserting a claim against us arising under the Delaware General Corporation Law, our Amended Charter, or our Amended Bylaws (as either may be amended or restated), and any action asserting a claim against us that is governed by the internal affairs doctrine or as to which the Delaware General Corporation Law confers exclusive jurisdiction on the Court of Chancery of the State of Delaware. This provision would not apply to suits brought to enforce a duty or liability created by the Securities Exchange Act of 1934, as amended, or Exchange Act. Furthermore, Section 22 of the Securities Act creates concurrent jurisdiction for federal and state courts over all Securities Act actions. Accordingly, both state and federal courts have jurisdiction to entertain such claims. To prevent having to litigate claims in multiple jurisdictions and the threat of inconsistent or contrary rulings by different courts, among other considerations, our Amended Charter further provides that the federal district courts of the United States of America are the exclusive forum for resolving any complaint asserting a cause of action arising under the Securities Act.
While the Delaware courts have determined that such choice of forum provisions are facially valid, a stockholder may nevertheless seek to bring a claim in a venue other than those designated in the exclusive forum provisions. In such instance, we would expect to vigorously assert the validity and enforceability of the exclusive forum provisions of our Amended Charter. This may require significant additional costs associated with resolving such action in other jurisdictions and there can be no assurance that the provisions will be enforced by a court in those other jurisdictions.
These exclusive forum provisions may limit a stockholder’s ability to bring a claim in a judicial forum that it finds favorable for disputes with us or our directors, officers, or other employees, which may discourage lawsuits against us and our directors, officers, and other employees. If a court were to find either exclusive-forum provision in our Amended Charter to be inapplicable or unenforceable in an action, we may incur further significant additional costs associated with resolving the dispute in other jurisdictions, all of which could seriously harm our business.
Our Amended Charter provides that the doctrine of “corporate opportunity” does not apply with respect to any directors (or their affiliates) who are not our employees.
Our Amended Charter provides that the doctrine of “corporate opportunity” does not apply with respect to any director (or their respective affiliates) who is not employed by us or our subsidiaries. The doctrine of corporate opportunity generally provides that a corporate fiduciary may not develop an opportunity using corporate resources or information obtained in their corporate capacity for their personal advantage, acquire an interest adverse to that of the corporation or acquire property that is reasonably incident to the present or prospective business of the corporation or in which the corporation has a present or expectancy interest, unless that opportunity is first presented to the corporation and the corporation chooses not to pursue that opportunity. The doctrine of corporate opportunity is intended to preclude officers, directors or other fiduciaries from personally benefiting from opportunities that belong to the corporation. Pursuant to our Amended Charter, to the extent permitted by Delaware law, we renounce any present or expectancy interest that we have in, or right to be offered an opportunity to participate in, specified business opportunities that are from time to time presented to our directors, or their respective affiliates (other than those who are employed by us or our subsidiaries). Any directors, or their respective affiliates, other than those directors, or affiliates who are employed by us or our subsidiaries, have no duty to communicate or present corporate opportunities to us, and have the right to either hold any corporate opportunity for their (and their affiliates’) own account and benefit or to recommend, assign or otherwise transfer such corporate opportunity to persons other than us, including to any directors, or their respective affiliates (other than those who are employed by us or our subsidiaries). Notwithstanding the foregoing, pursuant to our Amended Charter, we do not renounce our present or expectancy interest in any business opportunity that is expressly offered to a director, executive officer or employee of us or our subsidiaries, solely in his/her capacity as a director, executive officer or employee.
Item 1B. Unresolved Staff Comments
None.
Item 1C. Cybersecurity
Cybersecurity Risk Management and Strategy
We have developed and implemented a cybersecurity risk management program intended to protect the confidentiality, integrity, and availability of our critical systems and information. Our cybersecurity risk management program includes a cybersecurity incident response plan.
We design and assess our program based on the National Institute of Standards and Technology Cybersecurity Framework (NIST CSF). This does not imply that we meet any particular technical standards, specifications, or requirements, only that we use the NIST CSF as a guide to help us identify, assess, and manage cybersecurity risks relevant to our business. Our cybersecurity risk management program is managed separately from our other risk management programs.
Key elements of our cybersecurity risk management program include but are not limited to the following:
•risk assessments designed to help identify material cybersecurity risks to our critical systems and information;
•a security team principally responsible for managing our cybersecurity risk assessment processes, our security controls, and our response to cybersecurity incidents;
•the use of external service providers, where appropriate, to assess, test or otherwise assist with aspects of our security controls;
•cybersecurity awareness training of our employees, incident response personnel, and senior management;
•a cybersecurity incident response plan that includes procedures for responding to cybersecurity incidents; and
•a risk management process for certain third-party service providers, suppliers, and vendors based on, among other things, their criticality to our operations, access to RTR data, cybersecurity risk profile, and business requirements.
We describe whether and how risks from identified cybersecurity threats, including as a result of any previous cybersecurity incidents, have materially affected or are reasonably likely to materially affect us, including our business strategy, results of operations, or financial condition, under the headings: “Any significant technology disruption or failure, cyberattack or data security incident could adversely affect our business, financial condition and operations.” and “Our business relies on third-party cloud infrastructures, and any disruption of, or interference with, our use of cloud infrastructures could adversely affect our business, financial condition or results of operations.” included as part of our risk factor disclosures in Part I, Item 1A of this Annual Report on Form 10-K.
Cybersecurity Governance
Our full Board considers cybersecurity risk as part of its risk oversight function and oversees management’s implementation of our cybersecurity risk management program. The Board receives quarterly reports from management on cybersecurity risks. In addition, management is responsible for updating the Board, where it deems appropriate, regarding any cybersecurity incidents it considers to be significant.
Our SVP, Engineering and our VP, Technology & CISO are the members of our management team who are primarily responsible for assessing and managing our material risks from cybersecurity threats. Their team has primary responsibility for our overall cybersecurity risk management program and they supervise our internal cybersecurity personnel and our external cybersecurity consultants. Our management team has deep expertise in e-commerce and consumer retail. In addition, our VP, Technology & CISOs experience includes developing secure products as well as head of security and CISO positions at both public and private companies.
Under the supervision of our SVP, Engineering and our VP, IT, Infra & Security, the security team takes steps to stay informed about and monitor efforts to prevent, detect and respond to, as well as recovery efforts with respect to cybersecurity risks and incidents through various means, which may include briefings from internal security personnel; threat intelligence and other information obtained from governmental, public or private sources, including external consultants engaged by us; and alerts and reports produced by security tools deployed in our IT environment.
Item 2. Properties
Our corporate headquarters is located in Brooklyn, New York, which consists of approximately 47,000 square feet of space under a lease that expires in November 2032. We also lease a corporate space and photo studio in New York, New York and lease and operate two fulfillment centers in Secaucus, New Jersey and Arlington, Texas totaling approximately 540,000 square feet, under leases that expire in August 20242029 and May 2030, respectively. We also lease a corporate spacecommercial spaces in New York City and Galway, Ireland.
We believe our facilities are suitable for our current needs. We intend to expand our facilities or add new facilities as we grow and believe that suitable additional or alternative space will be available as needed to accommodate such growth.
Item 3. Legal Proceedings
The information contained in “Note 1516 — Commitments and Contingencies” in the Notes to the Consolidated Financial Statements is incorporated by reference into this Item.
Item 4. Mine Safety Disclosures
Not applicable.
Part II
Item 5. Market for Registrant's Common Equity, Related Stockholder Matters and Issuer Purchases of Equity Securities
Market Information
Our Class A common stock has beenis listed on the Nasdaq Global SelectCapital Market under the symbol “RENT” and began trading on October 27, 2021. Prior to that date, there was no public trading market for our common stock.“RENT.”
Holders of Record
As of April 11, 2022,5, 2024, there were approximately 291159 stockholders of record of our Class A common stock and seven stockholders of record of our Class B common stock. The number of stockholders of record is based upon the actual number of holders registered on this date and does not include holders of common stock in “street name” by brokers or other entities on behalf of stockholders.
Dividend Policy
We have never declared or paid any cash dividends on our capital stock. We currently intend to retain all future earnings and do not anticipate declaring or paying any dividends in the foreseeable future. Any future determination to declare dividends will be made at the discretion of our board of directors, subject to compliance with applicable law and contractual restrictions in the agreements governing our current and future indebtedness, and will depend on a number of then-existing factors, including our business prospects, results of operations, financial condition, cash requirements and availability and other factors that our board of directors may deem relevant.
Recent Sales of Unregistered Securities
None.
Use of Proceeds from our IPO
The offer and sale of the shares in the IPO was registered under the Securities Act pursuant to a registration statement on Form S-1 (File No. 333-260027), which was declared effective by the SEC on October 26, 2021.
There has been no material change in the expected use of the net proceeds from our IPO, as described in our final prospectus filed with the SEC on October 27, 2021 pursuant to Rule 424(b) under the Securities Act of 1933. As of the date of this filing, all net proceeds have been applied.
Issuer Purchases of Equity Securities
None.
Performance Graph
The following performance graph and related information shall not be deemed “soliciting material” or to be “filed” with the SEC, nor shall such information be incorporated by reference into any future filing under the Securities Act or the Exchange Act, whether made before or after the date hereof and irrespective of any general incorporation language in any such filing, or otherwise subject to the liabilities under the Securities Act or Exchange Act, except to the extent that we specifically incorporate it by reference into such filing.
The following graph shows a comparison from October 27, 2021 (the date our common stock commenced trading on Nasdaq), through January 31, 2022,2024, of the cumulative total returns for our common stock, the Nasdaq Composite Index and the S&P Retail Select Index. The graph assumes $100 was invested at the market close on October 27, 2021 in our Class A common stock, the Nasdaq Composite Index, and the S&P Retail Select Index, respectively. Such returns are based on historical results and are not intended to suggest future performance. The Nasdaq Composite Index and S&P Retail Select Index assume reinvestment of any dividends. The performance shown in the graph below is not intended to forecast or be indicative of future stock price performance.
Item 6. [Reserved]
Item 7. Management’s Discussion and Analysis of Financial Condition and Results of Operations
The following discussion of our financial condition and results of operations should be read in conjunction with our audited consolidated financial statements and the related notes included elsewhere in this Annual Report on Form 10-K. The following discussion focuses on fiscal years 20212023 and 20202022 financial condition and results of operations and year-to-year comparisons between fiscal years 20212023 and 2020. Similar discussion2022. Discussion of our fiscal year 20192021 financial condition and results of operations and year-to-year comparisons between fiscal years 20202022 and 2019 can be found2021 are included in Part II, Item 7, “Management’s Discussion and Analysis of Financial Condition and Results of Operations” in our final prospectus (File No. 333-260027) (the “Prospectus”) dated October 27, 2021 pursuant to Rule 424(b)(4) underAnnual Report on Form 10-K for the Securities Act of 1933, as amended (the “Securities Act”), for our initial public offering (the “IPO”).fiscal year ended January 31, 2023.
In addition to historical financial information, the following discussion contains forward-looking statements that reflect our plans, estimates and beliefs. Our actual results may differ materially from those described in or implied by any forward-looking statements. Factors that could cause or contribute to these differences include those discussed below and elsewhere in this Annual Report on Form 10-K, particularly in Part I, Item 1A, “Risk Factors”.
Overview
We give customers ongoing access to our “unlimited closet” — with over 19,000thousands of styles by over 780hundreds of designer brands — through our Subscription offering or the ability to rent a-la-carte through our Reserve offering. We also give our subscribers and customers the ability to buy our products through our Resale offering.offering, which offers customers pre-loved styles from our closet at a discount to retail price, up to 90% off of designer retail value. These offerings allow us to engage and serve our subscribers and customers across diverse use cases from everyday life to special occasions. We have served over 2.5approximately 3 million lifetime customers across all of our offerings and we had 159,544173,247 ending total subscribers65 (active and paused) as of January 31, 2022.2024. We had 125,954 active subscribers as of January 31, 2024. The majority of our revenue is highly recurring and is generated by our subscribers. For the years ended January 31, 20222024 and 2021,2023, respectively, 84%88% and 89%86% of our total revenue (including Reserve and Resale revenue) was generated by subscribers while they were active or paused.
The variety, breadth and quantity of products we carry is important to our business, and we strategically manage the capital efficient acquisition of a high volume of items every year. We have successfully disproved the myth that fashion apparel items and accessories only last one season as we are able to rent or “turn” our products multiple times over many years. We price our items at a fraction of their retail or comparable value, creating an attractive price and value proposition for our subscribers and customers.
We source virtually all of our products, which includes apparel accessories and home goods,accessories, directly from, or in partnership with, designer brands. Prior to 2018, we purchased nearly all of our products from our brand partners typically at a discount to wholesale cost, which we refer to as “Wholesale” items. In late 2018, we began to procure products through Share by RTR and Exclusive Designs. See “—Our Product Acquisition Strategy” below for a description of the three ways in which we procure products.
6On October 29, 2021, we closed our initial public offering (“IPO”), in which we issued and sold 850,000 shares at the public offering price of $420.00 per share. We received net proceeds of $327.3 million after deducting underwriting discounts and commissions and offering expenses.
5 Ending total subscribers represents the number of subscribers with an active or paused membership as of the last day of the period and excludes subscribers who had an active or paused subscription during the period, but ended their subscription prior to the last day of the fiscal period.
Recent Developments
Recent Business DevelopmentsDebt Restructuring
Initial Public Offering. On October 29, 2021, we closed our IPO, in which we issued and sold 17,000,000 shares at the public offering price of $21.00 per share. We received net proceeds of $327.3 million after deducting underwriting discounts and commissions and offering expenses.
Debt Paydown and Amendment. Concurrent withOn December 1, 2023, we entered into an amendment to our IPO, we paid down our senior secured term loan with Ares Corporate Opportunities Fund V, L.P. (the “Ares Facility”) of $80.7 million in full and $60.0 million of our subordinated, junior lien term loan with Double Helix Pte Ltd. as administrative agent for Temasek Holdings (the “Temasek(as amended by the 2023 Amendment, the “2023 Amended Temasek Facility”), resulting in a total debt repayment of $140.7 million. We also refinanced the remaining. The 2023 Amended Temasek Facility, among other things, (i) eliminates all interest (both payment-in-kind and cash interest) for a period of six full fiscal quarters beginning with the fourth quarter of fiscal year 2023; (ii) reduces the minimum liquidity maintenance covenant under the 2023 Amended Temasek Facility from $50 million to $30 million; and (iii) provides that we may not exceed mutually agreed upon quarterly and annual spend levels for rental product capital expenditures, fixed operating expenditures and marketing expenditures during fiscal year 2024 of $51 million, $100 million (excluding $10 million of specified permitted expenditures), and $30 million, respectively, and to-be-agreed levels for fiscal years 2025 and 2026, subject to the debt holder’s consent and certain exceptions. The maximum expenditure amounts are consistent with our anticipated spend for fiscal year 2024 and reflect lower amounts relative to fiscal year 2023 for rental product capital expenditures and fixed operating expenditures and roughly flat amounts for marketing expenditures.
Corporate Restructuring Plan
On January 9, 2024, we announced a restructuring plan to focus our workforce and cost structure on key growth opportunities and support our profitability goals. The plan primarily included total workforce reductions of approximately 10% of corporate employees (primarily a reduction in force, with some open role closures/reduced backfills).
Restructuring charges of $2.0 million for severance and related costs were recognized during the year ended January 31, 2024 and are reflected in Restructuring charges on our Consolidated Statements of Operations. We recorded asset impairment charges of $1.1 million during the year ended January 31, 2024 related to the discontinuation of a software implementation project in connection with the January 2024 restructuring plan. The charge is reflected in Loss on asset impairment related to restructuring on our Consolidated Statements of Operations. We may incur additional restructuring charges in the future.
The January 2024 restructuring plan is expected to generate total annual operating expense savings of approximately $12 million, which primarily includes the reduction in force, with some open role closures/reduced backfills, and excludes potential hiring of new employees or other additions to the Company’s costs and expenses. The restructuring plan was substantially completed by the end of the fourth quarter of fiscal year 2023 and is expected to be fully completed by the end of the second quarter of fiscal year 2024.
See Note 4, “Restructuring and Related Charges” in the Notes to the Consolidated Financial Statements for more details on these charges.
Reverse Stock Split
In March 2024, our stockholders approved, and our Board of Directors selected a 1-for-20 reverse stock split of our outstanding shares of Class A common stock and Class B common stock (the “Amended Temasek Facility”“Reverse Stock Split”). The Reverse Stock Split became effective on April 2, 2024 and began trading on a post-split basis on April 3, 2024. Accordingly, all share and per share amounts for all periods presented in the accompanying financial statements and notes thereto have been retroactively adjusted, where applicable, to reflect the Reverse Stock Split. Shares of Class A common stock and Class B common stock underlying outstanding warrants, stock options, and restricted stock units were proportionately decreased and the respective per share value and exercise prices, if applicable, were proportionately adjusted.
Additional Key Fiscal Fourth Quarter, Fiscal Year 2023 and Recent Business Highlights:
•Increased rental product in-stock rates through our depth strategy, which significantly improved the customer experience, led to a 20 point increase in Subscription Net Promoter scores from the second quarter of fiscal year 2023 to the fourth quarter of fiscal year 2023 and increased customer loyalty by 10% in the fourth quarter of fiscal year 2023 compared to the fourth quarter of fiscal year 2022.
•Transformed prospect experience with merchandising-heavy, use-case based hubs, showing the customer how we are a solution for her needs for work, events, travel and every day. New prospect experience has already driven increases in conversion.
•Achieved significant growth in our 'Try Before You Buy' resale business with record quarterly and annual resale revenue. We believe that our model is a competitive advantage for us as we are able to offer exceptional pricing to customers on rental product they already have at home and already love, in order to increase customer loyalty, fund rental product newness and generate strong margins.
•Grew Concierge Program to nearly 40% of early-term customers offering 1:1 styling advice to customers alongside help with their orders. The Concierge Program has driven higher loyalty and we believe is ready for continued scale.
•Hired Natalie McGrath as Chief Marketing Officer to re-engage our customer growth flywheel. Natalie joined us on March 4, 2024 from Afterpay where she led Marketing for North America and Europe. We have started the year reigniting brand love by celebrating women in our core customer demographic. We launched LinkedIn and "Real Runway" campaigns, which both share influential women’s stories. Our LinkedIn campaign called for nominations and self-nominations of women’s achievements in the workplace, and garnered approximately 630 million total impressions.
Key Operating and Financial Results. We have achieved the following operating and financial results for the years ended January 31, 20222024 and 20212023, respectively:
•Revenue was $203.3298.2 million and $157.5$296.4 million, respectively, representing 29.1%0.6% growth year-over-yearyear-over-year;
•115,240125,954 and 54,797126,712 ending Active Subscribers76 (excluding paused subscribers), respectively, representing 110% growth year-over-year.a change of (1)% year-over-year;
•159,544135,211 and 95,245128,586 Average Active Subscribers7, respectively, representing 5% growth year-over-year;
•173,247 and 171,998 ending Total Subscribers (including paused subscribers), respectively, representing 68%1% growth year-over-yearyear-over-year;
•Gross Profit was $69.7$119.7 million and $15.5$120.0 million, respectively, representing a gross margin of 34.3%40.1% and 9.8%40.5%, respectivelyrespectively;
•Net Loss was $(211.8)$(113.2) million and $(171.1)$(138.7) million, respectively. Net Loss as a percentage of revenue was (104.2)(38.0)%, as compared to (108.6)and (46.8)% in fiscal year 2020. Net Loss in fiscal year 2021, respectively, and included $(51.5)$3.1 million and $7.7 million of non-recurring or one-timerestructuring and related charges, that were primarily non-cash, including a $(24.9) million non-recurring, non-cash loss on the revaluation of warrants that were exercised or reclassified at IPO, a $(12.2) million non-recurring, primarily non-cash loss on the extinguishment of debt paid down concurrently with the IPO, and a $(14.4) million non-cash charge associated with the one-time satisfaction of the liquidity based vesting conditions for certain RSUs upon the effectiveness of our IPO.respectively;
•Adjusted EBITDA was $(19.2)$26.9 million and $(20.3)$6.7 million, respectively, representing an Adjusted EBITDA margin of (9.4)%9.0% and (12.9)%2.3%, respectivelyrespectively;
•Net cash used in operating activities plus net cash used in investing activities was $(64.8)$(70.3) million and $(101.2)$(92.0) million, respectively; and
•Net cash used in operating activities plus net cash used in investing activities as a percentage of revenue was (31.9)(23.6)% and (64.3)(31.0)%, respectively.respectively; and
•Cash and Cash Equivalents was $247.6$84.0 million and $95.3$154.5 million, respectively, after paydownrespectively.
6 Active Subscribers is defined as ending total subscribers as of $140.7 million of debt and accrued interest (approximately one-thirdperiod end, excluding paused subscribers.
7 Average Active Subscribers represents the mean of the company’s pre-IPO debt balance) withbeginning of quarter and end of quarter Active Subscribers for a portionquarterly period; and for other periods, represents the mean of the IPO proceeds.Average Active Subscribers of every quarter within that period.
Our Product Acquisition Strategy
We acquire and monetize products in three ways: Wholesale, Share by RTR and Exclusive Designs. Wholesale items are acquired directly from brand partners, typically at a discount to wholesale price. Share by RTR items are acquired directly from brand partners on consignment, at zero to low upfront cost with performance-based revenue share payments to our brand partners over time. Exclusive Designs items are designed using our data in collaboration with our brand partners. These units are manufactured through third-party partners with a low upfront fee and minimal revenue share payments to our brand partners over time.
7 Active Subscribers is defined as ending total subscribers as of period end, excluding paused subscribers.
Our three product acquisition methods are strategic levers to manage our capital efficiency, profitability and product risk. Our Exclusive Designs channel uses data insights to acquire items at a lower cost, which are designed to generate higher profitability over time. Share by RTR meaningfully reduces our upfront spendpurchases of rental product and de-risks our investment since we pay brands primarily based on item performance. Our Share by RTR arrangements with brands target delivering 85%delivering 75% to 100% of comparable wholesaleWholesale cost to the brand in the first year; however there is no minimum commitment other than the upfront payment, if applicable. Nearly all Share by RTR deals consummated after September 2020 include a cap on total potential payments to the brand partner.
In fiscal year 2021, 45%The chart below summarizes the percentage of new items were acquired through Wholesale, 33% through Share by RTR and 22% through Exclusive Designs, compared to 46% Wholesale, 36% Share by RTR and 18% Exclusive Designs in fiscal year 2020.via each method. In total, approximately 55%61% of new items were acquired through the more capital-efficient channels in fiscal year 2021,2023, approximately 54%58% in fiscal year 20202022 and approximately 26%55% in fiscal year 2019.2021. Both our purchasing power and the diversification into Share by RTR and Exclusive Designs have led to a decrease in average upfront cost per itemrental product capital expenditures (or Purchases of Rental Product as presented in the Consolidated Statement of Cash Flows) as a percentage of revenue over time. We expectplan to further decrease the percentage of units acquired through Wholesale and increase the percentage of units acquired through our more capital-efficient channels, Exclusive Designs and Share by RTR over time. We expect to incur considerably lower Purchases of Rental Product in fiscal year 2022.2024 relative to fiscal year 2023 due to fiscal year 2023 being impacted by the need to make rental product depth adjustments.
| | | | | | | | | | | | | | | | | |
| Description | Consolidated Statement of Operations | Consolidated Balance Sheets | Consolidated Statement of Cash Flows | Percent of Items Acquired in FY 20212023 / 20202022 / 20192021 |
| WHOLESALE | Items are acquired directly from brands partners, typically at a discount to wholesale price | Cost is recognized through straight-line depreciation, with a three-year useful life and 20% salvage value, in the "Rental Product Depreciation and Revenue Share" line ⁽¹⁾ | Total cost is capitalized as "Rental Products" in long-term assets | Total cost is recognized as a capital expenditure ("Purchases of Rental Product") at time of acquisition | 45%39% / 46%42% / 74%45% |
| SHARE BY RTR ⁽²⁾ | Items are acquired directly from brand partners on consignment, at zero to low upfront cost, with performance-based revenue share payments to our brand partners over time | Upfront and performance-based revenue share payments are expensed as incurred in the "Rental Product Depreciation and Revenue Share" line | Items are not capitalized on the balance sheet as we do not own them | Upfront revenue share payments flow through Net Income as incurred | 33% / 36%27% / 15%33% |
| | | | | | | | | | | | | | | | | |
| EXCLUSIVE DESIGNS ⁽²⁾⁽³⁾ | Items are designed using our data in collaboration with our brand partners
We manufacture through third-party partners and pay the brand partner an upfront fee and minimal revenue share payments | Upfront and performance-based revenue share payments are expensed as incurred in the "Rental Product Depreciation and Revenue Share" line
Manufacturing cost is recognized through straight-line depreciation, with a three-year useful life and 20% salvage value, in the "Rental Product Depreciation and Revenue Share" line ⁽¹⁾ | Manufacturing cost is capitalized as "Rental Products" in long-term assets | Upfront and revenue share payments flow through Net Income as incurred
Manufacturing cost is recognized as a capital expenditure ("Purchases of Rental Product") at time of acquisition | 22%28% / 18%31% / 11%22% |
| For additional details, refer to the section titled "Business - Our Unique Brand Partner Approach." |
⁽¹⁾ The cost of accessory items, which made up less than 10% of the gross book value of rental product as of January 31, 2022,2024, is recognized through straight-line depreciation with two-year useful life and 30% salvage value. |
| ⁽²⁾ For both Share by RTR and Exclusive Designs, the Company shares a percentage of revenue less a logistics fee with the brand. This revenue includes (i) revenue attributable to each item in connection with one-time reserve rentals; (ii) revenue attributable to each item from Subscription (this is based on the number of days at home during a subscription period); and (iii) revenue attributable to each item in connection with Resale of such items, less any liquidation costs. Both the percentage of revenue, and the logistics fees, can vary depending on the brand partner. Most Share by RTR items earn revenue until a cap has been reached, at which point, title generally passes from the brand to the Company. |
⁽³⁾ IncludesAlso includes a small number of products bearing our trademarks, which are non-Exclusive Designs produced by third-party partners, or our owned brands. These products are purchased at a significantly lower average cost than Wholesale. |
For additional details about our business model and our product acquisition strategy, see Part I, Item 1, “Business”.
Key Factors Affecting Our Performance
We believe that our performance and future success depend on a variety of factors that present significant opportunities for our business, but also present risks and challenges that could adversely impact our growth and profitability.
Subscribers and Customers
Ability to Attract and Retain Subscribers and Customers and Our Attractive Cohort Trends. We believe that we have a significant market opportunity ahead of us to increase our base of subscribers and customers, and that our long-term growth depends in large part on our continued ability to acquire and retain customerssubscribers and subscribers.customers.
We provide a flexible offering that allows our subscribers to customize their subscription as their everyday life changes, choosing to pause and reactivate their membership as needed. We have also historically seen that many subscribers who cancel their subscription will return and resubscribe when membership again makes sense for their everyday life. Our strategies in fiscal year 2023 were focused on investing in and improving the customer experience to drive growth, including improving rental product in-stock levels, which we believe impacted subscriber growth in the second and third quarters of fiscal year 2023. Our data indicates that newer subscribers were most negatively impacted by lower rental product in-stock levels. We have implemented plans to address these lower in-stock levels through higher levels of rental product depth per style in future rental product purchases. We have seen an improvement to retention in the third and fourth quarters of fiscal year 2023 and expect these changes to have an even greater positive impact during fiscal year 2024. We believe that improving retention in the first 90 days of a subscription, which is when the majority of subscriber churn typically occurs, can increase loyalty and subscriber growth. Further, in the second quarter of fiscal year 2023, we experimented with changes to our initial promotion prices for Subscription, which impacted subscriber acquisition. We further reduced promotions in the third quarter of fiscal year 2023, as we believe that being less promotional going forward will have improved effects on retention and the overall health of the business over the longer-term and enable us to invest these resources into the customer experience. We expect our promotional activities to be below historical averages in the near to medium term, which is anticipated to reduce subscriber acquisition in the near term; however, depending on market conditions and other factors, we will likely conduct additional experiments and may make changes to our promotions strategy in the future, which could impact subscriber acquisition.
We partly assess the health of our business by analyzing the performance of our historical customer cohorts over time. A significant portion of our total revenue in each year is generated fromWe place customers acquired in previous years. We therefore believe that the performance of our customer cohorts supports our strategies of investing in subscriber and customer acquisition and retention and enhancing the scale of our platform.
The chart below indicates cumulative revenue per customer by customer cohort, which is defined as cumulative total revenue generated by a cohort across all of our product offerings, divided by the original number of customers in the cohort. Customers are placed in cohorts based on the fiscal year in which they first transacted with RTR. Data points reflect only the monthly cohorts that have reached each respective life to date period. Our customer cohorts demonstrate the continued spend and expansionA significant portion of our customers:total revenue in each fiscal year is generated from customers acquired in previous years. For example, approximately one-third of our revenue in fiscal year 2023 was generated by customers who placed their first order with us in fiscal year 2017 or prior.
•Each successive customer cohort has higher spending patterns, except forWe also assess the FY 2020 cohort, which was most impacted by COVID-19.
•Higher spending is driven by increased customer loyalty and customers renting for more days per year, particularly through our Subscription offering.
•Our FY 2021 cohort which is less impacted by COVID-19, exhibited better trends than the FY 2016-2020 historical cohorts.
•Over the last three years, we have increasingly directed customers to our higher revenue Subscription offerings, which has driven a year-over-year improvement in cumulative revenue per customer by cohort as a greater percentageproductivity of our historical customer cohorts by measuring the revenue and profit we generate from all new customers are subscribers. Afterover their lifetime (“LTV”) against customer acquisition costs (“CAC”). We define LTV as cumulative total revenue generated across all of our product offerings (which includes Subscription and Reserve Rental Revenue and Other Revenue) by current or previous subscribers or customers, minus fulfillment expenses, rental product depreciation and revenue share expenses, credit card fees and customer service personnel and related expenses incurred to generate such revenue divided by the first six months asnumber of new customers acquired during that period. Any LTV generated by a customer we see an inflection in spending as our most loyal customers remain onis assigned to the platform.
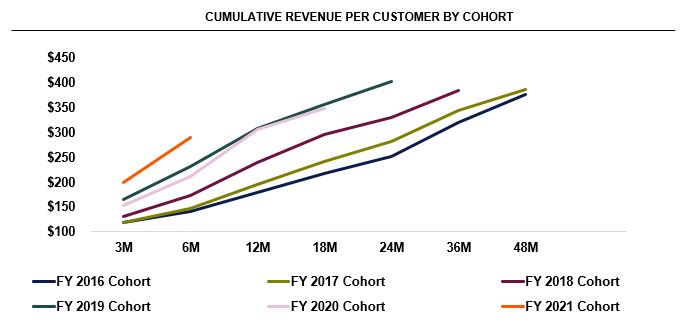
original cohort year that the customer first joined. We define CAC as total marketing expense, other than employee expenses,excluding marketing personnel and related costs incurred in a fiscal year divided by the number of new customers acquired in that period. We acquire customers efficiently as evidenced by over 80% of our lifetime customers having joined organically.
As seen in the table below, our LTV to CAC ratio has remained relatively consistent for our fiscal year 2018 through fiscal year 2023 customer cohorts, with the exception of our fiscal year 2020 cohort which was impacted by the COVID-19 pandemic. The fiscal year 2021 cohort, which benefited from strong loyalty post-recovery from the pandemic, exhibited an LTV to CAC ratio of 0.7x in its first six months and 1.3x in its first twelve months, implying that we recovered our customer acquisition cost between six months and twelve months for this cohort. Our fiscal year 2023 cohort thus far is exhibiting an LTV to CAC ratio of 0.5x in its first six months. We also specifically assessanticipate that thebehavior of subscribers given they contribute improvement in our customer experience due to the majorityimproved trends of our revenue. Cumulative revenue per subscriber by cohort is defined as cumulative total revenue generated across allin-stock rate in fiscal year 2023, and further expected improvement in fiscal year 2024 from our plan to reignite our lifecycle marketing strategy, will benefit the retention and lifetime value of our product offerings (which includes Subscription and Reserve Rental Revenue and Other Revenue) bycustomer cohorts. Cohorts have continued to grow over time as our most loyal customers who are current or previous subscribers, dividedcontinued to spend with us, as demonstrated by the original number of subscribersstrength in the cohort. Subscribers are placed in cohorts based on the fiscal year in which they first joined a subscription program. Data points reflect only the monthly cohorts that have reached each respective life to date period.2018, 2019, 2020 and 2021 cohorts.
•Our FY 2020 subscriber cohort generated an average of $255, $395 and $622 in cumulative revenue within 3, 6 and 12 months, respectively.
•Our FY 2021 subscriber cohort exhibited better trends in FY 2021 compared to our FY 2018, FY2019 and FY 2020 cohorts, generating $300 in cumulative revenue in 3 months and $497 in 6 months, largely due to the changes we made in 2021 to our subscription programs which have resulted in higher gross margins and revenue per order.
We provide a flexible offering that allows our subscribers to customize their subscription as their everyday life changes, choosing to pause and reactivate their membership as needed. We have historically seen that many subscribers who cancel their subscription will often return to the platform and resubscribe when membership again makes sense for their everyday life.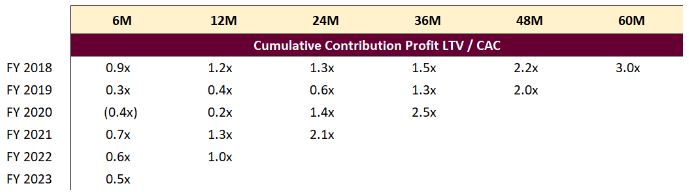
Brands and Products
Ability to Acquire, Manage and Monetize Products Efficiently. Our ability to deliver an elevated experience for our subscribers and customers that keeps them loyal to RTR depends on us having the right assortment. For example, in fiscal year 2023 we focused on enhancing the availability of the items on our site and increasing the depth of our buys (i.e., purchasing more units of particular styles). Due to our deep partnerships with brands, flexibility in our buying timelines and ability to react to advantageous retail purchasing environments, we can acquire products directly from thembrands in multiple ways, and due to ourcost effective ways. Our expertise in reverse logistics and garment restoration we canalso provides us with the ability to monetize our products effectively over their useful life. Diversifying our product acquisition away from 100% Wholesale has driven higher overall product return on investment and reduced the capital needs of the business. In fiscal year 2021,2023, approximately 55%61% of new items were acquired through our more capital efficient non-Wholesale channels, compared to 54%58% in fiscal year 20202022 and 26%55% in fiscal year 2019.2021. We plan to further increase the percentage of units acquired through Exclusive Designs and Share by RTR in fiscal year 2024. We continuously evaluate our product acquisition mix to maximize our strategic priorities.
UpfrontPurchases of rental product includes the cost per item is defined as total upfront spend for items acquired in a period divided by the number of items acquired. We define total upfront spend as the total costs ofwholesale products acquired in athe period excluding performance based revenue share payments which are paid out over time. Total upfront spend includes the total acquisition cost for Wholesale items, upfront payments to brand partners for Share by RTR and Exclusive Designs items, third party manufacturing or other similar acquisition costs for Exclusive Designs items, and other ancillary upfront costs such as freight, where applicable. For fiscal year 2021Many factors impact the purchases of rental product including our average upfront cost per item was $95, representingdepth and acquisition mix strategy, the proportion of subscribers to total customers, timing of when those subscribers are acquired, the formality of styles, brand assortment, opportunities in the market and timing of when the rental product is received and paid for. Purchases of rental product as a 14% decrease from an average upfront costpercentage of $111revenue in fiscal year 2019. Our diversification into non-Wholesale channels has meaningfully reduced2023 was 26% as a result of lower sales and the impact of the adjustment to our upfront spend.rental product depth in fiscal year 2023. Purchases of rental product as a percentage of revenue was 21% and 15% in fiscal year 2022 and 2021, respectively. We anticipate this percentage to decrease in fiscal year 2024 compared with fiscal year 2023 due to higher sales projections and the impact of the aforementioned adjustment to our rental product depth in fiscal year 2023. Due to seasonality factors, we track our progress on purchases of rental product as a percentage of revenue on a full year basis, as quarterly expenditures are not necessarily reflective of full year trends. In addition, we intend to comply with the mutually agreed upon quarterly and annual spend levels for rental product capital expenditures during fiscal year 2024 in our 2023 Amended Temasek Facility.
Ability to Achieve Leverage in our Cost Structure. Improving operational efficiency of our platform is imperative to maintainingor increasing profitability. We expect certain of our operating costs to increase as order volume increases and as we make investments to grow subscribers and revenue and to enhance the customer experience. In September 2022, we announced a restructuring plan that reduced operating expenses by approximately $27 million in the four quarters following the restructuring compared to the annualized run rate for the second quarter of fiscal year 2022. In January 2024, we announced a restructuring plan expected to generate total annual operating expense savings of approximately $12 million, which primarily includes the reduction in force, with some open role closures/reduced backfills, and excludes potential hiring of new employees or other additions to the Company’s costs and expenses. Though we anticipate quarterly fluctuations in operating leverage, with these reductions and continuous improvements to our cost structure, we do not expect theseour fixed costs to generallydecrease as a percentage of total revenue in fiscal year 2024, and over time we anticipate that our operating costs will grow at the same pace asmore slowly than our total revenue on an annual basis. In addition, we intend to comply with the mutually agreed upon quarterly and annual spend levels relating to our operating costs (i.e., fixed operating expenditures and marketing expenditures) during fiscal year 2024 in our 2023 Amended Temasek Facility.
We use technology and customer data to drive efficiency across products, fulfillment expenses and operating costs. Our data has allowed us to build a differentiated and proprietary rental reverse logistics platform with a vertically integrated cleaning and restoration process. We have invested in technology and automation in order to drive operating leverage and higher margins as we grow and scale our business.
Over time, we have improved our margins, profitability and cash flow, and we believe we will continue to benefit from economies of scale andscale. We are focused on driving additional efficiencies in our operating expenses and growing profitability to also cover rental product depreciation, in addition to fulfillment, revenue share and operating expenses.
We use Adjusted EBITDA to assess our operating performance and the operating leverage of our business prior to capital expenditures. We also measure the cash consumption of the business including capital expenditures by assessing net cash used in operating activities and net cash used in investing activities on a combined basis.
Seasonality
We experience seasonality in our business, which has been impacted and may in the future change due to the effects of COVID-19, the COVID-19 pandemic.macro environment, and business decisions. For our subscriptionSubscription rentals, we typically acquire the highest number of subscribers in March through May and September through November, as these are the times customers naturally think about changing over their wardrobes. We generally see a higher rate of subscribers pause in the summer, and in mid-December through the end of January. We historically had typically realized a higher portion of revenue from Reserve rentals during ourIn the third and fourth fiscal quarters, as a result ofour Reserve business historically (prior to COVID-19) benefited from increased wedding and holiday events.
The thirdevents but this seasonality has varied since the onset of COVID-19. In fiscal year 2022, we believe that a price increase of our Subscription programs in April 2022 affected traditional seasonal patterns. In fiscal year 2023, changes in rental product in-stock levels and fourth fiscal quarters of 2021 demonstrated subscriberchanges to promotional prices also disrupted typical seasonality. Given continued business changes, our future seasonality patterns that are generally consistent with ourmay not resemble historical trends, though our fourth quarter of 2021 saw a higher rate of pause activity due to the Omicron variant impact. In addition, our seasonality trends are seeing effects from COVID-19 generally, as Reserve orders and revenue are impacted by fewer large-scale holiday and special events compared to pre-COVID-19, especially those typically occurring in the third and fourth quarters. Subscriber acquisition was also impacted by COVID-19 in the fourth quarter of 2021 due to fewer large-scale holiday and special events.trends.
We also experience seasonality in the timing of expenses and capital outlays. Transportation expense, and therefore fulfillment cost, is typically highest in the fourth fiscal fourth quarter, given typical timing of carrier rate increases, higher service levels, such as more costly and expedited shipping, and competition during holidays. Our most significant product capital expenditures typically occur in the first fiscal quarter and the third fiscal quarter, when we acquire product for the upcoming fall and spring seasons, thoughseasons. However, the impact on cash is historically dependent on timing of receipt of product.
For additional information, see the section of Part I, Item 1A, “Risk Factors — Risks Relating To Our Business and Industry — Our business is affected by seasonality.”
Impact of COVID-19Macro and Consumer Environment on Our Business
The COVID-19 pandemic materially adversely affected our fiscal year 2020 operating
There remains significant uncertainty in the current macroeconomic and consumer environment, driven by several factors, including inflationary pressures, higher interest rates, potential risk of recession, ongoing industry-wide supply chain issues, instability in the financial results. In March 2020, we instituted numerous healthsystem, the wars in Ukraine and safety measuresthe Middle East and took immediate financial actionsCOVID-19. These factors have impacted, and are expected to withstand COVID-19 including pausing of paid advertisingcontinue to impact, consumer discretionary spending and marketing activitiespurchasing behavior, price sensitivity, wage rates, transportation costs, and other cost-saving measures to reduce operating and capital expenditures in the short term, including salary reductions, closing of brick and mortar stores and right sizing of labor incosts associated with our fulfillment centers. These actions significantly reduced these costs as a percentage of revenue throughout fiscal year 2020. Rental product depreciation and revenue share as a percentage of revenue increased throughout fiscal year 2020 due to the levels of rental product on hand relative to the reduced subscriber levels.business.
In fiscal year 2021,We continue to review and learn how changes in customer behavior post the COVID-19 pandemic may impact our financial results continuedbusiness and demand, particularly in a challenging macro environment. We believe that Active Subscriber levels have been impacted by seasonal changes in consumer behavior and macro factors, such as higher levels of remote work and evolving demand for work wear, inflationary pressures and sensitivity to increased pricing, or other factors, and may continue to be impacted by the COVID-19 pandemic. In particular,these factors in the first quarter of fiscal year 2021 subscriber acquisition and engagement increased as shelter-at-home restrictions were lifted. In the fourth quarter of fiscal year 2021 the Omicron variant negatively impacted us in three key ways by: 1) significantly decreased revenue from our Reserve business as most holiday events were canceled; 2) reduced subscriber acquisition in the second half of quarter; and 3) drove a higher rate of subscriber pause. In fiscal year 2021, results also continued to be impacted by consumers working primarily from home and by special events and occasions not being back to pre-pandemic levels.future.
We expect the effects of the COVID-19 pandemic and related macro-economic trends, including the spread of potential new variants, to have a continued impact on our business, results of operations, growth rates, and financial condition into fiscal year 2022. In fiscal year 2022, we currently expect an operating environment that, while improved from fiscal year 2021, continues to be impacted by COVID-19. However, we also believe that the backlog of special events and leisure travel that have been pushed to 2022 and 2023 will contribute to additional COVID-19 recovery in those periods.
We continue to take actions to adjust to the changing COVID-19 business environment and related inflationary pressure. For example, in light of potential pricing sensitivity in the current macro-economic environment, we are focused on investing in our customer and delivering even more value to her, and emphasizing the value proposition of our offering in our marketing materials. In addition, we increased wage rates throughoutduring fiscal year 2021years 2022 and 2023 to attract and retain talent at our fulfillment centers and we expect to continue to be impacted by rising labor costs in fiscal year 2022.the future. We also expect transportation costs to continue to increasedecrease as a percentage of sales in fiscal year 2022,2024 due to transportation efficiencies and the impact of our new transportation contract with a major national carrier, effective in September 2023. While we are focused on diversifying ourexpect to be able to reduce transportation networkcosts as a percentage of sales in fiscal year 2024, we plan to continue to mitigate theselonger-term rising costs by seeking to optimize shipping methods and service delays. Examples of these mitigation efforts include increasing volumes with regionalimprove contractual and last-mile carriers and consolidating shipments, such as through the launch of an at-home pickup service in certain markets.pricing terms. Although we continue to face a challenging environment, due to the COVID-19 pandemic, rising wages, a decreased level of workforce participation and nationwide shipping carrier delays, we have been able to and plan to continue hiringinvest in our customers, manage our staffing and are diversifyingfurther leverage our transportation networkpartners to help to drive growth and efficiencies in order to support increasing and/or fluctuating demand for our offerings.business.
The full extent to which the COVID-19 pandemic, including the spread of any new variants,macro environment will directly or indirectly impact our business, results of operations, growth rates, and financial condition will depend on future developments that are highly uncertain and cannot be accurately predicted. Given thethis uncertainty, we cannot estimate the financial impact of the pandemicmacro environment on our future results of operations, cash flows, or financial condition.condition. For additional details, see Part I, Item 1A, “Risk Factors” of this Annual Report on Form 10-K.
Key Business and Financial Metrics
In addition to the measures presented in our consolidated financial statements, we use the following key business and financial metrics to help us evaluate our business, identify trends affecting our business, formulate business plans, and make strategic decisions. The calculation of the key business and financial metrics discussed below may differ from similarly titled metrics used by other companies, securities analysts or investors, limiting the usefulness of those measures for comparative purposes. These key business and financial metrics are not meant to be considered as indicators of our financial performance in isolation from or as a substitute for our financial information prepared in accordance with GAAPgenerally accepted accounting principles in the United States (“U.S. GAAP”) and should be considered in conjunction with other metrics and components of our results of operations, such as each of the other key business and financial metrics, and our revenue and net loss.
| | Years Ended January 31, |
| 2022 | | 2021 | | 2020 |
| Years Ended January 31, | | | Years Ended January 31, |
| 2024 | | | 2024 | | 2023 | | 2022 |
| | Active Subscribers | Active Subscribers | 115,240 | | | 54,797 | | | 133,572 | |
| Active Subscribers | |
| Active Subscribers | |
| Average Active Subscribers | |
| Gross Profit | Gross Profit | $ | 69.7 | | | $ | 15.5 | | | $ | 53.6 | |
| Adjusted EBITDA (1) | Adjusted EBITDA (1) | $ | (19.2) | | | $ | (20.3) | | | $ | (18.0) | |
__________
(1)Adjusted EBITDA is a non-GAAP financial measure; for a reconciliation to the most directly comparable U.S. GAAP financial measure, net loss, and why we consider Adjusted EBITDA to be a useful metric, see “—Non-GAAP Financial Metrics” below.
Active Subscribers: Active Subscribers represents the number of subscribers with an active membership as of the last day of any given period and excludesexcludes paused subscribers. In fiscal year 2020, we saw our Active Subscribers decrease due to the COVID-19 pandemic. However, a significant number of our subscribers put their membership on pause rather than canceling. As of January 31, 2022,2024, we had 115,240125,954 Active Subscribers, a change of (1)% year-over-year. Our Active Subscribers decreased year-over-year, which we believe was primarily due to the impact of lower rental product in-stock levels, changes in our promotional strategy and lower marketing spend.
Average Active Subscribers: Average Active Subscribers represents the mean of the beginning of quarter and end of quarter Active Subscribers for a quarterly period; and for other periods, represents the mean of the Average Active Subscribers of every quarter within that period. As of January 31, 2024, we had 135,211 Average Active Subscribers, up 110% year-over-year. Our Active Subscribersfrom 128,586 as of January 31, 2022, were impacted by the Omicron variant of COVID-19, which reduced subscriber acquisition in the second half of the fourth quarter and drove2023 or a higher rate of subscriber pause.5% increase year-over-year.
Gross Profit and Gross Margin: We define Gross Profit as total revenue less costs related to activities to fulfill customer orders and rental product acquisition costs, presented as fulfillment expense,and rental product depreciation and revenue share.share, respectively, on the consolidated statement of operations. We depreciate owned apparel assets over three years and owned accessory assets over two years net of 20% and 30% salvage values, respectively, and recognize the depreciation on a straight-line basis and remaining cost of items when sold or retired on our consolidated statement of operations. Rental product depreciation expense is time-based and reflects all rental product items we own. We use Gross Profit and Gross Profit as a percentage of revenue, or Gross Margin, to measure the continued efficiency of our business after the cost of our products and fulfillment costs are included.
Gross Profit was $69.7$119.7 million for the year ended January 31, 20222024 compared to $15.5$120.0 million for the year ended January 31, 20212023 representing Gross Margins of 34.3%40.1% and 9.8%40.5%, respectively. The increase inrespectively. Gross Profit and Gross Margin for the year ended January 31, 2022 was driven by2024 decreased slightly due to the improvement in some areasimpact of fulfillment costs and lowerhigher rental product depreciation and revenue share which representedcosts as a lower percentage of total revenue than in the prior periods. The increase wassales, partially offset by higher operations wage rates and transportation costs.lower fulfillment costs as a percentage of sales, despite adding an additional unit to all subscription shipments in March 2023. We expectwill seek to have the opportunitycontinue to improve Gross Profit and Gross Margin over time by driving growth in total revenue and revenue per subscriber,drive fulfillment and operational efficiency gains over time and strategically evolvingevolve our mix of revenue and product acquisition.acquisition to offset cost increases.
Adjusted EBITDA and Adjusted EBITDA Margin: We define Adjusted EBITDA as net loss, adjusted to exclude interest expense, rental product depreciation, other depreciation and amortization, share-based compensation expense, write-off of liquidated rental product assets, certain non-recurring or one-time costs (see below footnotes to the reconciliation table), non-ordinary course legal expenses, restructuring charges, loss on asset impairment related to restructuring, income taxes,tax (benefit) expense, warrant liability revaluation gains / losses, debt extinguishment gains / losses, other income and expense, and other gains / losses. We define Adjusted EBITDA Margin as Adjusted EBITDA as a percentage of total revenue, net for a period. Adjusted EBITDA was $(19.2)$26.9 million for the year ended January 31, 20222024 compared to $(20.3)$6.7 million for the year ended January 31, 2021,2023, representing margins of (9.4)%9.0% and (12.9)%2.3%, respectively. Adjusted EBITDA and Adjusted EBITDA Margin have increasedsignificantly improved for the year ended January 31, 20222024 due to the improvement in Gross Profit and Gross Margin,impact of the September 2022 restructuring plan, and improved operating leverage across technology, marketing and general and administrative expenses excluding one-time costseven with additional strategic investments. In the third quarter of fiscal year 2022, we launched a two-pronged pilot with Amazon to (1) sell our brand new Exclusive Design products wholesale and share-based compensation. (2) launch a new liquidation partnership, which together contributed $5.1 million to Adjusted EBITDA in fiscal year 2022.
We believe we have the opportunity to improve Adjusted EBITDA and offset cost increases as we increase revenue and drive higher revenue per subscriber, fulfillment and operational efficiency gains and operating expense leverage. In particular, we continue to expect our January 2024 restructuring plan to significantly reduce fixed costs and improve operating expense leverage in fiscal year 2024 compared to fiscal year 2023.
Components of Results of Operations
Total Revenue, Net
Our total revenue, net consists of Subscription and Reserve rental revenue and Other revenue. Total revenue is presented net of promotional discounts, credits and refunds and taxes.
Subscription and Reserve Rental Revenue. We generate Subscription and Reserve rental revenue from subscription and Reserve rental fees. We recognize subscription fees ratably over the subscription period, commencing on the date the subscriber enrolls in a subscription program. These fees are collected upon enrollment and any revenue from an unrecognized portion of the subscription period is deferred to the following fiscal period. We recently announced a price increase for our subscription plans, which we expect will generally increase revenue per subscriber by program over time. We recognize Reserve fees over the rental period, which starts on the date of delivery of the product to the customer. Reserve orders can be placed up to two months prior to the rental start date (formerly four months prior to the rental start date, effective October 2023) and the customer’s payment form is charged upon order confirmation. We defer recognizing the rental fees and any related promotions for Reserve rentals until the date of delivery, and then recognize those fees evenly over the four- or eight-day rental period.
Other Revenue. We generate Other revenue primarily from the sale of products while they are in rental condition. We offer the ability for subscribers and customers to purchase products at a discount to retail price. Payment for the sale of products occurs upon order confirmation while the associated revenue is recognized either at the time the sold product is delivered to the customer or when purchased, if the item is already at home with the customer. From time to time, Other revenue may include revenue generated from pilots and other growth initiatives which may cause quarterly fluctuations in the Other revenue line.
Costs and Expenses
Fulfillment. Fulfillment expenses consist of all costs to receive, process and fulfill customer orders. This primarily includes shipping costs to/from customers and personnel and related costs, which includesinclude salaries and bonuses, and employee benefit costs. Personnel and related costs are related to processing inbound and outbound customer orders, cleaning, restoring and repairing items received from customers, tracking and managing items within our fulfillment center network and ingesting new items received from brands. Fulfillment expenses also include costs of packing materials, cleaning supplies, and other fulfillment-related expenses. We expect fulfillment costs to increase in the future as order volume increases and because costs to ship and process orders to/from customers are expected to increaseFulfillment expense may fluctuate due to increasing prices in the transportationvarious factors including commercial terms and market which we started to see in the third and fourth quarters of fiscal year 2021. Wetrends. Fulfillment expense may also expect fulfillment expense to increase due to competitive pressures in the labor market which could lead to continued higher wage rates. We increased warehouse wage rates during the year ended January 31, 2022 and believe we will continue to be impacted by rising wage rates. We expect to continue to invest in automation and other process improvements to support and drive efficiencies in our operations. To the extent we are successful in becoming more efficient in fulfilling orders, and at a magnitude that is able to offset increasinglong-term increases in shipping costs, wage rates and cleaning/packing supply price increases, we would expect these expenses to decrease as a percentage of total revenue over the longer term.
Technology. Technology expenses consist of personnel and related costs for employees engaged in software development and engineering, quality assurance, product, customer experience, data science, analytics and information technology-related efforts, net of personnel costs associated with capitalized software. Technology expenses also include professional services, third-party hosting expenses, website monitoring costs, and software and license fees. We expect toOver the long term, these expenses may increase technology expenses(in total dollars) as we continue to improve the customer and subscriber experience and invest in our technology stack and infrastructure to support overall growth in our business and distribution network.business. While these expenses may vary from period to period as a percentage of total revenue, we expect them to decrease as a percentage of total revenue over the longer term.
Marketing. Marketing expenses include online and mobile marketing, search engine optimization and email costs, marketing personnel and related costs, agency fees, brand marketing, printed collateral, consumer research, and other related costs. We expect marketingMarketing expenses unrelated to personnel costs may increase asif we intend to increase marketing spend to drive the growth of our business and increase our brand awareness. The trend and timing of our brand marketing expenses will depend in part on the timing of marketing campaigns.
General and Administrative. General and administrative (“G&A”) expenses consist of all other personnel and related costs includingfor customer service, finance, tax, legal, human resources, fashion and photography and fixed operations costs. General and administrative expenses also includeincludes occupancy costs (including warehouse-related), photography costs, professional services, credit card fees, general corporate and warehouse expenses, other administrative costs, gains and losses due to foreign exchange rate fluctuations associated with consolidating our foreign subsidiary at each period end, and gains and losses associated with asset disposals and operating lease terminations.terminations We expect to increase generalincur lower fixed cost G&A expense dollars and administrativeas a percentage of total revenue in the short term as a result of our restructuring plan. Over the longer term, these expenses may increase as we grow our infrastructure to support operating as a public company and the overall growth of the business. We also expect rentRent expense and other facilities-related costs tomay increase in the future as we expand our distribution networkdue to inflation or to support overall business growth and fulfillment cost-reduction initiatives.efficiencies. While these expenses may vary from period to period as a percentage of total revenue, we expect them to decrease as a percentage of total revenue over the longer term.
Rental Product Depreciation and Revenue Share. Rental product depreciation and revenue share expenses consist of depreciation and write-offs of rental products, and payments under revenue share arrangements with brand partners. We depreciate the cost, less an estimated salvage value, of our owned products (Wholesale and Exclusive Designs items), over the estimated useful lives of these items and, if applicable, accelerate depreciation of the items when they are no longer in rental condition. We recognize the cost of items acquired under Share by RTR, as incurred, through upfront payments and performance-based revenue share payments. We expect rental product depreciation and revenue share expenses to increase in absolute dollars as we continue to support subscriber and customer growth. The amount and proportion of rental product depreciation and revenue share will vary from period to period based on how and when we acquire items as well as the mix of our rental product base.
Other Depreciation and Amortization. Other depreciation and amortization expenses consist of depreciation and amortization amounts for fixed assets, intangible assets including capitalized software, and financing right-of-use assets.
Restructuring Charges. Restructuring charges consist of severance and related costs associated with the January 2024 and September 2022 restructuring plans.
Loss on Asset Impairment Related to Restructuring. Loss on asset impairment related to restructuring consists of asset impairment charges related to the discontinuation of a software implementation project and two warehouse operations projects in connection with the January 2024 and September 2022 restructuring plans.
Interest Income / (Expense). Interest income / (expense) consists primarily of accrued paid-in-kind interest, cash interest and debt issuance cost amortization associated with our 2023 Amended Temasek Facility going forward. The 2023 Amended Temasek Facility eliminates all interest (both payment-in-kind and cash interest) for a period of six full fiscal quarters beginning with the fourth quarter of fiscal year 2023.
Gain / (Loss) on Warrant Liability Revaluation, Net. Gain / (loss) on warrant liability revaluation is associated with revaluing liability classified warrants to the respective fair value at period end or prior to conversion. As of January 31, 2022,2024, all outstanding warrants are equity classified and therefore do not require remeasurement going forward.
Gain / (Loss) on Debt Extinguishment, Net. Gain / (loss) on debt extinguishment is associated with debt extinguishment including the write off of the unamortized debt issuance costs which most recently occurred at the time of our IPO.costs. These are primarily non-cash and are associated with debt paydownpayment transactions which are non-recurring.
Other Income / (Expense). Other income / (expense) consists primarily of proceeds from previous insurance claims, and proceeds from monetizing tax credits associated with growth.growth and Irish refundable tax credits.
Income Tax Benefit / (Expense). Income taxes consist primarily of state minimum taxes and Irish refundable tax credits.foreign taxes. We have established a valuation allowance for our U.S. federal and state deferred tax assets, including net operating losses. We expect to maintain this valuation allowance until it becomes more likely than not that the benefit of our federal and state deferred tax assets will be realized by way of expected future taxable income in the United States.
Results of Operations
The results of operations presented below should be reviewed in conjunction with the consolidated financial statements and notes included elsewhere in this Annual Report on Form 10-K. The following tables set forth our results of operations for the periods presented:
| | Years Ended January 31, |
| 2022 | | 2021 | | 2020 |
| (in millions) |
| Years Ended January 31, | | | Years Ended January 31, |
| 2024 | | | 2024 | | 2023 | | 2022 |
| (in millions) | | | (in millions) |
| Revenue: | Revenue: | |
| Subscription and Reserve rental revenue | |
| Subscription and Reserve rental revenue | |
| Subscription and Reserve rental revenue | Subscription and Reserve rental revenue | $ | 185.8 | | | $ | 135.9 | | | $ | 235.4 | |
| Other revenue | Other revenue | 17.5 | | | 21.6 | | | 21.5 | |
| Total revenue, net | Total revenue, net | 203.3 | | | 157.5 | | | 256.9 | |
| Costs and expenses: | Costs and expenses: | |
| Fulfillment | |
| Fulfillment | |
| Fulfillment | Fulfillment | 61.9 | | | 53.0 | | | 118.1 | |
| Technology | Technology | 45.3 | | | 37.7 | | | 40.2 | |
| Marketing | Marketing | 26.5 | | | 8.1 | | | 22.9 | |
| General and administrative | General and administrative | 104.4 | | | 77.2 | | | 98.9 | |
| Rental product depreciation and revenue share | Rental product depreciation and revenue share | 71.7 | | | 89.0 | | | 85.2 | |
| Other depreciation and amortization | Other depreciation and amortization | 19.4 | | | 23.0 | | | 21.6 | |
| Restructuring charges | |
| Loss on asset impairment related to restructuring | |
| Total costs and expenses | Total costs and expenses | 329.2 | | | 288.0 | | | 386.9 | |
| Operating loss | Operating loss | (125.9) | | | (130.5) | | | (130.0) | |
| Interest income / (expense), net | Interest income / (expense), net | (53.0) | | | (46.6) | | | (24.0) | |
| Gain / (loss) on warrant liability revaluation, net | Gain / (loss) on warrant liability revaluation, net | (24.9) | | | 0.4 | | | — | |
| Gain / (loss) on debt extinguishment, net | Gain / (loss) on debt extinguishment, net | (12.2) | | | (0.6) | | | — | |
| Other income / (expense), net | Other income / (expense), net | 3.9 | | | 6.2 | | | (0.1) | |
| Net loss before income tax benefit / (expense) | Net loss before income tax benefit / (expense) | (212.1) | | | (171.1) | | | (154.1) | |
| Income tax benefit / (expense) | Income tax benefit / (expense) | 0.3 | | | — | | | 0.2 | |
| Net loss | Net loss | $ | (211.8) | | | $ | (171.1) | | | $ | (153.9) | |
Comparison of the years ended January 31, 20222024 and 20212023
Total Revenue, Net. Total revenue, net was $203.3$298.2 million for the year ended January 31, 2022,2024, an increase of $45.8$1.8 million, or 29.1%0.6%, compared to $157.5$296.4 million for the year ended January 31, 2021.2023. This increase was primarily driven by the increase in overall demand, includingAverage Active Subscribers and units purchased per subscriber count, directly attributable.
In fiscal year 2024, we expect revenue to increase as we grow our customer base, improve the COVID-19 recovery comparedcustomer experience and continue to last year.focus on our resale revenue.
Subscription and Reserve Rental Revenue. Subscription and Reserve rental revenue was $185.8$264.9 million for the year ended January 31, 2022, an increase2024, a decrease of $49.9$(3.7) million, or 36.7%(1.4)%, compared to $135.9$268.6 million for the year ended January 31, 2021. 2023. This increasedecrease was primarily driven by the 110% year-over-yearlower reserve revenue and lower add-on rates, and was partially offset by an increase in active subscriber count and the increase in Reserve rental revenue as a result of the COVID-19 pandemic recovery asAverage Active Subscribers compared to the same period last year.In the fourth quarter of fiscal year 2021 Omicron negatively impacted our Reserve revenue as most holiday events were canceled. In addition, our active subscriber count was impacted due to a reduction in subscriber acquisition in the second half of the fourth quarter and a higher rate of subscriber pause.We recently announced a price increase for our subscription plans, which we expect will generally increase revenue per subscriber by program over time.
Other Revenue. Other revenue was $17.5$33.3 million for the year ended January 31, 2022, a decrease2024, an increase of $4.1$5.5 million, or 19.0%19.8%, compared to $21.6$27.8 million for the year ended January 31, 2021.2023. This decreaseincrease was primarily driven by an intentional mix shift of revenue during fiscal year 2020 (and especially atincrease in Average Active Subscribers and the peak of the COVID-19 pandemic) from Subscription and Reserve rental revenue toitems purchased per subscriber. Other revenue which was not the Company’s strategy in fiscal year 2021. In the prior period, we launched additional resale initiatives and increased promotional activities for resale items in order to increase revenue from subscribers. These promotional activities were reduced in fiscal year 2021 which resulted in Other revenue representing 8.6%represented 11.2% of total revenue, downup from 13.7%9.4% in fiscalthe same period last year. During the year 2020.ended January 31, 2023, we also recognized $2.3 million of revenue recognized from a pilot to sell our brand new Exclusive Design products wholesale to a third party retailer.
Costs and Expenses. Total costs and expenses were $329.2$378.2 million for the year ended January 31, 2022, an increase2024, a decrease of $41.2$(21.8) million, or 14.3%(5.4)%, compared to $288.0$400.0 million for the year ended January 31, 2021.2023. This increasedecrease was primarily driven by $26.6 million of share-based compensation, of which $14.4 million was due tocost savings from the one-time satisfaction ofSeptember 2022 restructuring plan and the liquidity-based vesting conditions for certain RSUs previously outstanding and certain RSUs which were granted upon the effectivenessimplementation of our IPOnew transportation contract in October 2021. The increase was also driven, to a lesser extent, by an increase in marketing initiatives, fulfillment expenses to support demand related growth, and hiring to support our increased growth and transition to a public company. The increaseSeptember 2023, which reduced costs compared to the priorsame period was partially offset by lower rental product depreciation driven by fewer units sold and fewer units on hand requiring depreciation, as product depreciation is time based.last year.
Fulfillment. Fulfillment expenses were $61.9$86.0 million for the year ended January 31, 2022, an increase2024, a decrease of $8.9$(6.2) million, or 16.8%(6.7)%, representing 30.4%28.8% of revenue, compared to $53.0$92.2 million for the year ended January 31, 2021,2023, representing 33.7%31.1% of revenue. The increasedecrease in fulfillment dollars and as a percentage of revenue was primarily driven by transportation and processing cost efficiencies and higher revenue per shipment that offset an increase in demand-related growthunits per shipment due to the 5 item plan and an increase in wage rates during fiscal years 2022 and transportation costs which are expected2023. During the year ended January 31, 2023, we also recognized $1.2 million of fulfillment expenses related to continue inthe pilot to sell our brand new Exclusive Design products wholesale to a third-party retailer.
In fiscal year 2022, partially offset by2024, we expect fulfillment labor process improvements. Fulfillmentexpenses to increase due to increases in volume and expected annual rate increases; however, we expect fulfillment expenses as a percentage of total revenue were 30.4% for the year ended January 31, 2022 compared with 33.7% last year.to decrease as a result of higher revenue per order and continued transportation and processing efficiencies.
Technology. Technology expenses were $45.3$49.1 million for the year ended January 31, 2022, an increase2024, a decrease of $7.6$(6.3) million, or 20.2%(11.4)%, compared to $37.7$55.4 million for the year ended January 31, 2021.2023. This increasedecrease was primarily driven by an increase in personnel costs during fiscal year 2021cost savings from the September 2022 restructuring plan. We were able to support futurerealize these benefits while supporting growth initiatives compared toincluding enhanced search, fit and discovery experience for the prior period which was impacted by COVID-19 related personnel cost reductions. This increase was also driven by $4.2 million of share-based compensation for technology personnel, of which $1.9 million is related to the one-time satisfaction of the liquidity-based vesting conditions for certain RSUs upon the effectiveness of our IPO in October 2021.consumer. Technology expenses were 22.3%16.5% of revenue for the year ended January 31, 20222024 compared to 18.7% for the same period last year as we saw increased operating leverage with higher revenue and included the one timea lower cost base post-restructuring. Technology related share-based compensation charge representing 0.9% of revenue. Technologyexpense was $5.5 million for the year ended January 31, 2024 and was $5.9 million for the same period last year.
In fiscal year 2024, we expect technology expenses to decrease in dollars and as a percentage of total revenue were 23.9% last year. We expect technology expensescompared to increase in fiscal year 2022, driven by2023 as a result of our January 2024 restructuring plan and our continued strategic investments.focus on managing costs.
Marketing. Marketing expenses were $26.5$31.2 million for the year ended January 31, 2022, an increase2024, a decrease of $18.4$(3.9) million, or 227.2%(11.1)%, compared to $8.1$35.1 million for the year ended January 31, 2021.2023. This increase decrease was driven by the increased marketing initiatives as compared to the same period last year which had reduced paid and brand marketing spend during the COVID-19 pandemic, in addition to marketing personnel cost reductions. The current period also includes $1.0 million of share-based compensation for marketing personnel, of which $0.3 million is related to the one-time satisfaction of the liquidity-based vesting conditions for certain RSUs upon the effectivenessreallocation of our IPObudgeted marketing expenses to rental product purchases in October 2021, which represented 0.1% of revenue. fiscal year 2023. Marketing expenses unrelated to personnel costs were $20.628.5 million in the year ended January 31, 20222024 and 10.1%9.5% of revenue, of which 1.2% was relatedcompared to a small brand campaign. Marketing expenses unrelated to personnel costs were $4.2$30.7 millionlast year and 2.7%10.3% of total revenue. Werevenue for the same period last year.
In fiscal year 2024, we expect marketing expenses to increaseremain roughly flat in absolute dollars incompared to fiscal year 2022,2023. The timing of our marketing expenses during the year will depend in particular inpart on the first half, in order to drive subscriber growth and higher recurring revenue earlier in the year.timing of marketing campaigns.
General and Administrative. General and administrative (“G&A”) expenses were $104.4$101.6 million for the year ended January 31, 2022, an increase2024, a decrease of $27.2$(7.4) million, or 35.2%(6.8)%, compared to $77.2$109.0 million infor the year ended January 31, 2021. 2023. This increasedecrease was driven by $21.4 million of share-based compensation for G&A personnel, of which $12.2 million was related to the one-time satisfaction of the liquidity-based vesting conditions for certain RSUs previously outstanding and certain RSUs which were granted upon the effectiveness of our IPO in October 2021. The increase was also driven, to a lesser extent, by the increase in personnel costs required to support our growth and transition to a public company and increased legal and consulting fees required to support our public company transition. The prior period was also more impacted by cost saving initiatives atsavings from the onset of COVID-19 including personnel cost reductions. The increase was partially offset by lower customer experience personnel costs due to fewer subscribers requiring support duringSeptember 2022 restructuring plan. During the year ended January 31, 2022, compared to the support required at the onset of COVID-19 and2023, we recognized proceeds from a new liquidation partnership which reduced G&A expenses by $2.3 million. $1.5 million increase in the gain/loss from liquidated rental product sales. G&A expenses as a percentage of revenue were 51.4%34.1%, compared to 36.8% last year, as we saw increased operating leverage with higher revenue and included $12.2million of costs associated with the one-timea lower cost base post-restructuring. G&A related share-based compensation charge representing 6.0%expense was $20.5 million for the year ended January 31, 2024 and was $19.0 million for the year ended January 31, 2023. The increase was primarily due to incremental share-based compensation expense due to equity award modifications related to the transition of revenue.the Chief Financial Officer and Chief Operating Officer roles.
In fiscal year 2024, we expect G&A expenses to decrease in dollars and as a percentage of revenue were 49.0% last year.compared to fiscal year 2023 as a result of the January 2024 restructuring plan.
Rental Product Depreciation and Revenue Share. Rental product depreciation and revenue share was $71.7$92.5 million for the year ended January 31, 2022, a decrease2024, an increase of $17.3$8.3 million, or 19.4%9.9%, compared to $89.0$84.2 million infor the year ended January 31, 2021.2023. The increase was primarily driven by higher Share by RTR units acquired, higher purchases of rental product and an increase in other revenue. Rental product depreciation and revenue share was 35.3%31.0% of revenue in the year ended January 31, 2022, down2024, up from 56.5%28.4% in the prior period. The decrease is a result of same period last year primarily due to the factors discussed abovefewer units sold and fewer units on hand requiring depreciation, as product depreciation is time based, partially offset by an increase in revenue share..
Other Depreciation and Amortization. Other depreciation and amortization was $19.4$14.7 million for the year ended January 31, 2022,2024, a decrease of $3.6$(1.7) million, or 15.7%(10.4)%, compared to $23.0$16.4 million infor the year ended January 31, 2021.2023. This decrease was primarily driven by the decrease inlower depreciation and amortization associated with capitalized software amortizationcomputers, equipment and lower depreciation associatedsoftware.
Restructuring Charges. Restructuring charges were $2.0 million for the year ended January 31, 2024, a decrease of $(0.4) million, or (16.7)%, compared to $2.4 million for the year ended January 31, 2023. The restructuring charges during the year ended January 31, 2024 related to the January 2024 restructuring plan and the charges during the year ended January 31, 2023 related to the September 2022 restructuring plan.
Loss on Asset Impairment Related to Restructuring. Loss on asset impairment related to restructuring was $1.1 million for the year ended January 31, 2024, a decrease of $(4.2) million, or (79.2)%, compared to $5.3 million for the year ended January 31, 2023. The loss on asset impairment during the year ended January 31, 2024 related to the discontinuation of a software implementation project in connection with our reusable garment bags. Reusable bag depreciation is time based and fewer bags were purchased and depreciated, as a resultthe January 2024 restructuring plan compared to the discontinuation of two warehouse operations projects during the reduction year ended January 31, 2023 in shipment volume in fiscal year 2020 which was more heavily impacted by COVID-19.connection with the September 2022 restructuring plan.
Interest Income / (Expense), Net. Interest expense, net was $53.0$(33.7) million for the year ended January 31, 2022, an increase2024, a decrease in expense of $6.43.1 million, or 13.7%(8.4)%, compared to $46.6$(36.8) million for the year ended January 31, 2021.2023. This increasedecrease was drivendriven by lowered cash interest from the incremental accrued payment-in-kind2023 Amended Temasek Facility (including prior iterations thereof), partially offset by higher paid-in-kind (“PIK”) and higher cash interest related to the additional Ares debt incurred in October 2020 and paid down in full in October 2021.earned. Of the $53.0$(33.7) million total interest expense in the year ended January 31, 2022, $38.82024, $(22.5) million was the accrual of paid-in kind (“PIK”)PIK interest, $8.3 million was cash, financing lease interest and other interest and $5.9$(11.7) million was debt discount amortization, and $0.5 million was the net of cash interest, interest earned and financing lease and other interest, compared with $36.9to $(14.3) million of PIK interest, $4.7$(18.2) million net of cash interest, financing lease interest and other interest and $5.0$(4.3) million of debt discount amortization in the year ended January 31, 2021.2023.
Gain / (Loss) on Warrant Liability Revaluation, Net.
Gain / (loss) on warrant liability revaluation, net was $(24.9) million for the year ended January 31, 2022, a decrease of $25.3 million compared to $0.4 million for the year ended January 31, 2021. This decrease was driven by the non-recurring and non-cash revaluation of liability classified warrants associated with prior lender facilities to their fair value in the current period or prior to conversion. As of January 31, 2022, all outstanding warrants are equity classified and therefore remeasurement after the third quarter of
In fiscal year 2021 is not required.
Gain / (Loss) on Debt Extinguishment, Net. Gain / (loss) on debt extinguishment, net was $(12.2) million for the year ended January 31, 2022, an increase of $11.6 million, compared to $(0.6) million for the year ended January 31, 2021. The costs in the current period were associated with the fees and unamortized debt issuance costs2024, we expect interest expense related to the Ares debt paydown upon the IPO in October 2021, compared2023 Amended Temasek Facility to the prior lender debt extinguishment in the prior period. These charges were primarily non-cashdecrease and are associated with debt paydown transactions which are non-recurring.cash interest expense to be zero.
Other Income / (Expense), Net. Other income / (expense), net was $3.9$0.7 million for the year ended January 31, 2022,2024, a decrease of $2.3$(0.8) million, compared to $6.2$1.5 million for the year ended January 31, 2021.2023. This decrease was primarily driven by $5.0$0.4 million of insurance claim proceeds and $1.3monetization of tax credits during the year ended January 31, 2024 compared to $1.4 million of monetizedmonetization of tax credits settled during fiscalthe year 2020 compared to $4.0 million of insurance claim proceeds, settled during fiscal year 2021ended January 31, 2023.
Non-GAAP Financial Metrics
In addition to our results determined in accordance with GAAP, we believe the following non-GAAP financial metrics are useful in evaluating our performance. These non-GAAP financial metrics are not meant to be considered as indicators of our financial performance in isolation from, or as a substitute, for our financial information prepared in accordance with GAAP and should be read only in conjunction with financial information presented on a GAAP basis. There are limitations to the use of the non-GAAP financial metrics presented in this Annual Report. For example, our non-GAAP financial metrics may not be comparable to similarly titled measures of other companies. Other companies, including companies in our industry, may calculate non-GAAP financial metrics differently than we do, limiting the usefulness of those measures for comparative purposes.
The reconciliation of the below non-GAAP financial metrics to the most directly comparable GAAP financial measure is presented below. We encourage reviewing the reconciliation in conjunction with the presentation of the non-GAAP financial metrics for each of the periods presented. In future periods, we may exclude similar items, may incur income and expenses similar to these excluded items, and may include other expenses, costs and non-recurring items.
Adjusted EBITDA and Adjusted EBITDA Margin. Adjusted EBITDA and Adjusted EBITDA Margin are key performance measures used by management to assess our operating performance and the operating leverage of our business prior to capital expenditures. Our Adjusted EBITDA margins have improved from (12.9)%2.3% in the year ended January 31, 2023 to 9.0% in the year ended January 31, 2024. The pilot to sell brand new Exclusive Design products wholesale to a third party retailer and launch of a new liquidation partnership together contributed $5.1 million to Adjusted EBITDA in the year ended January 31, 20212023. Adjusted EBITDA Margin significantly improved for the to (9.4)% in the year ended January 31, 20222024. due to the impact of the restructuring plans, and improved operating leverage across technology, marketing and general and administrative expenses even with additional strategic investments.
The following table presents a reconciliation of net loss, the most comparable GAAP financial measure, to Adjusted EBITDA for the periods presented:
| | Years Ended January 31, |
| 2022 | | 2021 | | 2020 |
| (in millions) |
| | Years Ended January 31, | | | | Years Ended January 31, |
| | 2024 | | | | 2024 | | 2023 | | 2022 |
| | (in millions) | | | | (in millions) |
| Net loss | Net loss | | $ | (211.8) | | | $ | (171.1) | | | $ | (153.9) | |
| Interest (income) / expense, net (1) | Interest (income) / expense, net (1) | | 53.0 | | | 46.6 | | | 24.0 | |
| Rental product depreciation | Rental product depreciation | | 50.3 | | | 69.9 | | | 75.7 | |
| Other depreciation and amortization (2) | Other depreciation and amortization (2) | | 19.4 | | | 23.0 | | | 21.6 | |
| Share-based compensation (3) | Share-based compensation (3) | | 26.6 | | | 8.2 | | | 6.8 | |
| Write-off of liquidated assets (4) | Write-off of liquidated assets (4) | | 4.8 | | | 3.3 | | | 4.1 | |
| Non-recurring adjustments (5) | Non-recurring adjustments (5) | | 5.3 | | | 4.2 | | | 3.8 | |
| Non-ordinary course legal fees (6) | |
| Restructuring charges (7) | |
| Loss on asset impairment related to restructuring (8) | |
| Income tax (benefit) / expense | Income tax (benefit) / expense | | (0.3) | | | — | | | (0.2) | |
| (Gain) / loss on warrant liability revaluation, net (6) | | 24.9 | | | (0.4) | | | — | |
| (Gain) / loss on debt extinguishment, net (7) | | 12.2 | | | 0.6 | | | — | |
| Other (income) / expense, net (8) | | (3.9) | | | (6.2) | | | 0.1 | |
| Other (gains) / losses (9) | | 0.3 | | | 1.6 | | | — | |
| (Gain) / loss on warrant liability revaluation, net (9) | |
| (Gain) / loss on debt extinguishment, net (10) | |
| Other (income) / expense, net (11) | |
| Other (gains) / losses (12) | |
| Adjusted EBITDA | Adjusted EBITDA | | $ | (19.2) | | | $ | (20.3) | | | $ | (18.0) | |
| Adjusted EBITDA Margin (10) | | (9.4) | % | | (12.9) | % | | (7.0) | % |
| Adjusted EBITDA Margin (13) | | Adjusted EBITDA Margin (13) | | 9.0 | % | | 2.3 | % | | (9.4) | % |
__________
(1)Includes debt discount amortization of $11.7 million in the year ended January 31, 2024, $4.3 million in the year ended January 31, 2023, and $5.9 million in the year ended January 31, 2022, $5.0 million in the year ended January 31, 2021, and $4.0 in the year ended January 31, 2020.2022.
(2)IncludesReflects non-rental product depreciation and capitalized software amortization.
(3)Reflects the non-cash expense for share-based compensation. The year ended January 31, 2022 includes $14.4 million related to theof costs incurred for one-time satisfaction of the liquidity-basedIPO-related RSU vesting conditions for certain RSUs previously outstanding and certain RSUs which were granted upon the effectiveness of our IPO in October 2021.events.
(4)Reflects the write-off of the remaining book value of liquidated productsrental product that had previously been held for sale.
(5)Non-recurring adjustments for the year ended January 31, 20222024 includes $5.2 million of public readiness preparation costs, for the year ended January 31, 2021 includes $3.2$1.7 million of costs primarily related to COVID-19 related matters including severance, furlough benefits, one-time bonuses,debt refinancing and related legal fees and $0.5 million of shipping carrier transition costs,the option exchange and for the year ended January 31, 2020, $2.82023 includes $1.3 million of costs related to a September 2019 software outage and $1.0 million related to legal costs and settlements.public company SOX readiness.
(6)IncludesNon-ordinary course legal fees for the years ended January 31, 2024 and 2023 includes $0.3 million and $0.1 million, respectively, of costs related to a class action lawsuit.
(7)Reflects restructuring charges primarily related to severance and related costs in connection with the January 2024 and September 2022 restructuring plans.
(8)Reflects the asset impairment charges related to the discontinuation of a software implementation project in connection with the January 2024 restructuring plan in the year ended January 31, 2024 and the discontinuation of warehouse operations projects in connection with the September 2022 restructuring plan in the year ended January 31, 2023.
(9)Reflects the expense associated with revaluing prior liability classified lender warrants to the respective fair value at period end, or prior to conversion. As of January 31, 2022, all outstanding warrants are equity classified and therefore do not require remeasurement going forward.
(7)(10)Includes debt extinguishment costs related to debt paydown in the periods presented.
(8)(11)Primarily includes $(4.0)$1.4 million of insurance claim proceeds for the year ended January 31, 2022 and $(5.0) million of insurance claim proceeds and $(1.3) million of proceeds from monetizingmonetized tax credits for the year ended January 31, 2021.2023.
(9)(12)Includes costs associated with the write-off of asset disposals,gains / losses recognized in relation to foreign exchange, operating lease terminations and foreign exchange.the related surrender of fixed assets (see “Note 5 - Leases – Lessee Accounting” in the Notes to the Consolidated Financial Statements).
(10)(13)Adjusted EBITDA Margin calculated as Adjusted EBITDA as a percentage of revenue.
Liquidity and Capital Resources
Since our founding, we have financed our operations primarily from net proceeds from the sale of redeemable preferred stock, common stock and debt financings. As of January 31, 2022,2024, we had cash and cash equivalents of $247.6$84.0 million and restricted cash of $12.0$10.0 million ($5.45.2 million current and $6.6$4.8 million noncurrent), and an accumulated deficit of $(801.2)$(1,053.1) million.
As disclosed above, onOn October 29, 2021, we closed our IPO, in which we issued and sold 17,000,000850,000 shares at a public offering price of $21.00$420.00 per share. We received net proceeds of $327.3 million after deducting underwriting discounts and commissions and offering expenses.
ConcurrentThe Company is a borrower under a loan agreement with our IPO,Double Helix Pte Ltd., as administrative agent for Temasek Holdings. In January 2023, we paid down our senior secured term loanentered into an amendment and restatement of $80.7such facility (the “2022 Amended Temasek Facility”). The 2022 Amended Temasek Facility extended the maturity date from October 2024 to October 2026, reduced cash interest payments by over $20 million (including accruedin cash in the next two fiscal years while the total interest rate remains unchanged during this period, with subsequent increases thereafter. In connection with the 2022 Amended Temasek Facility, we also granted warrants to purchase 100,000 shares of Class A Common Stock at an exercise price of $100.00 per share, along with other clarifications and updates. In December 2023, we entered into the 2023 Amended Temasek Facility. The 2023 Amended Temasek Facility eliminated all interest (payment-in-kind and cash interest) for six full fiscal quarters beginning with Ares Corporate Opportunities Fund V, L.P. (the “Ares Facility”) in fullthe fourth quarter of fiscal year 2023, reduced the minimum liquidity maintenance covenant from $50 million to $30 million, and $60.0provided that the Company may not exceed mutually agreed upon quarterly and annual spend levels for rental product capital, fixed operating, and marketing expenditures during fiscal year 2024 of $51 million, $100 million (excluding $10 million of our Temasek Facilityspecified permitted expenditures), and refinanced$30 million, respectively, on an annual basis, and to-be-agreed levels for fiscal years 2025 and 2026, subject to the remaining Temasek Facility, resulting in a total debt repayment of $140.7 million.holders’ consent and certain exceptions. Our total indebtedness as of January 31, 20222024 was $260.8$306.7 million. For a description of the terms of our current and prior credit agreements, see “Note 78 – Long-Term Debt” in the Notes to the Consolidated Financial Statements.
We expect thatWhile we have experienced operating losses and negative cash flow historically, we expect to achieve cash flows from operations could continueplus cash flows used in the foreseeable future as we continue to acquire products and increase other investmentsinvesting break-even in our business. fiscal year 2024. We believe our existing cash and cash equivalents, and cash generated from our operations, will be sufficient to sustain our business operations toand satisfy our debt service obligations and to comply with our amended debt covenants the $30 million minimum liquidity maintenance covenant for at least the next 12twelve months. We also plan to comply with the maximum expenditure covenants under the 2023 Amended Temasek Facility for at least the next twelve months from the date ofthe accompanying financial statements included elsewhere in this Annual Report.Report are issued. As noted above, our 2023 Amended Temasek Facility eliminates all interest (both payment-in-kind and cash interest) for a period of six full fiscal quarters beginning with the fourth quarter of fiscal year 2023.In September 2022, we announced a restructuring plan to reduce costs, streamline our organizational structure and drive operational efficiencies, which generated annual operating expense savings of approximately $27 million (relative to the second quarter of fiscal year 2022 run rate) in the four quarters following the September 2022 restructuring. In January 2024, we announced a restructuring plan expected to generate total annual operating expense savings of approximately $12 million, which primarily includes the reduction in force, with some open role closures/reduced backfills, and excludes potential hiring of new employees or other additions to the Company’s costs and expenses.
Our future capital requirements will depend on many factors, including, but not limited to, growth in the number of customers and Active Subscribersdemand for our business, rental product spend and the timing of investments in technology and personnel to support the overall growth of our business.business. To the extent that current and anticipated future sources of liquidity are insufficient to fund our future business activities and requirements and service our debt obligations or if we fail to comply with the covenants specified in the 2023 Amended Temasek Facility, inclusive of the $30 million minimum liquidity maintenance covenant, we may be required to seek additional equitycapital or debt financing.restructure or refinance our indebtedness. The sale of additional equity would result in additional dilution to our stockholders. The incurrence of debt financing would result in debt service obligations and the instruments governing such debt could provide for operating and financing covenants that would restrict our operations. There can be no assurances that we will be able to raise additional capital.capital which could negatively affect our liquidity in the future. In the event that additional financing is required from outside sources, we may not be able to negotiate terms acceptable to us or at all. In particular,If this occurs, our repayment obligations under the recent COVID-19 pandemic has caused disruption in the global financial markets, which could reduce our ability2023 Amended Temasek Facility may be accelerated and we may be unable to access capital and negatively affect our liquidity in the future.meet such obligations. If we are unable to raise additional capital when required, or if we cannot expand our operations or otherwise capitalize on our business opportunities because we lack sufficient capital, our business, results of operations, financial condition, and cash flows would be adversely affected.
Cash Flows
The following table summarizes our cash flows for the periods presented:
| | | | | | | | | | | | | | | | | |
| Years Ended
January 31, |
| 2022 | | 2021 | | 2020 |
| (in millions) |
| Net cash (used in) provided by operating activities | $ | (42.3) | | | $ | (42.8) | | | $ | (37.6) | |
| Net cash (used in) provided by investing activities | (22.5) | | | (58.4) | | | (138.6) | |
| Net cash (used in) provided by financing activities | 215.2 | | | 168.5 | | | 177.9 | |
| Net increase in cash and cash equivalents and restricted cash | 150.4 | | | 67.3 | | | 1.7 | |
| Cash and cash equivalents and restricted cash at beginning of period | 109.2 | | | 41.9 | | | 40.2 | |
| Cash and cash equivalents and restricted cash at end of period | $ | 259.6 | | | $ | 109.2 | | | $ | 41.9 | |
| | | | | | | | | | | | | | | | | |
| Years Ended January 31, |
| 2024 | | 2023 | | 2022 |
| (in millions) |
| Net cash (used in) provided by operating activities | $ | (15.7) | | | $ | (47.7) | | | $ | (42.3) | |
| Net cash (used in) provided by investing activities | (54.6) | | | (44.3) | | | (22.5) | |
| Net cash provided by (used in) financing activities | 0.7 | | | (4.0) | | | 215.2 | |
| Net (decrease) increase in cash and cash equivalents and restricted cash | (69.6) | | | (96.0) | | | 150.4 | |
| Cash and cash equivalents and restricted cash at beginning of period | 163.6 | | | 259.6 | | | 109.2 | |
| Cash and cash equivalents and restricted cash at end of period | $ | 94.0 | | | $ | 163.6 | | | $ | 259.6 | |
We also measure the cash consumption of the business including capital expenditures, by assessing net cash used in operating activities and net cash used in investing activities on a combined basis, which improved from $(101.2)was $(70.3) million infor the year ended January 31, 20212024 and to $(64.8)$(92.0) million infor the year ended January 31, 20222023. The cash consumption of the business was lower in fiscal year 2023 compared with the same period of fiscal year 2022 primarily due to lower operating costs as a result of the September 2022 restructuring plan and lower purchases of property and equipment compared to the prior period
of rental product were higher than the same period last year to support our rental product strategy. We also opportunistically purchased additional rental product to take advantage of attractive pricing in the current environment, which partially offset the lower cash consumption in the first three quarters of fiscal year 2023 compared to the prior year. The sum of net cash used in operating activities and net cash used in investing activities, as a percentage of revenue, improved from (64.3)was (23.6)% infor the year ended January 31, 20212024 and to (31.9)(31.0)% infor the year ended January 31, 20222023.
Net cash (used in) provided by operating activities. For the year ended January 31, 2022,2024, net cash used in operating activities was $(42.3)$(15.7) million, which consisted of a net loss of $(211.8)$(113.2) million, partially offset by non-cash charges of $171.3132.5 million, reclassification of the proceeds from the sale of rental product of $12.9$23.3 million and a net change of $11.1$(11.7) million in our operating assets and liabilities. The non-cash charges were primarily comprised of $49.7$56.1 million of rental product depreciation and write-off expenses, $38.8$22.5 million of payment-in-kind interest, $24.9 million loss on remeasurement of warrant liability, $26.6$26.2 million of share-based compensation, $5.9$11.7 million of debt discount amortization, $12.2 million loss on debt extinguishment (primarily non-cash), $19.5$15.0 million of other fixed and intangible asset depreciation and amortization, and $(6.3)$1.1 million consisting of previously accrued PIK interest which was settled inasset impairment charges related to the perioddiscontinuation of a software implementation project in connection with the extinguishmentJanuary 2024 restructuring plan, of our Ares Facility.which $0.1 million is included in accrued expenses related to the asset impairment (see the Supplemental Cash Flow Information in Part II, Item 8. “Financial Statements and Supplementary Data”).
For the year ended January 31, 2021,2023, net cash used in operating activities was $(42.8)$(47.7) million, which consisted of a net loss of $(171.1)$(138.7) million, partially offset by non-cash charges of $145.2$116.1 million, reclassification of the proceeds offrom the sale of rental product of $17.9 million and a net change of $1.0$(7.2) million in our operating assets and liabilities. The non-cash charges were primarily comprised of $70.8$50.2 million of rental product depreciation and write-off expenses, $36.9$14.3 million of payment-in-kind interest, $8.2$25.4 million of share-based compensation, $5.0$4.3 million of debt discount amortization, $0.6 million loss on debt extinguishment and $24.1$17.0 million of other propertyfixed and equipment and softwareintangible asset depreciation and amortization.the loss on the surrender of fixed asset write-offs related to the partial termination of the lease of the corporate headquarters (see “Note 5 - Leases - Lessee Accounting” in the Notes to the Consolidated Financial Statements) and $5.3 million consisting of asset impairment charges related to the discontinuation of warehouse operations projects in connection with the September 2022 restructuring plan, of which $0.4 million is included in accrued expenses related to the asset impairment (see the Supplemental Cash Flow Information in Part II, Item 8. “Financial Statements and Supplementary Data”).
Net cash (used in) provided by investing activities. For the year ended January 31, 2022,2024, net cash used in investing activities was $(22.5)$(54.6) million, primarily consisting of $(30.8)$(77.9) million of purchases of rental product incurred in the period and $(10.3)$(4.6) million of purchases of fixed and intangible assets. The investment in rental product does not include an additional $6.5$3.3 million of cost for units received in the current period but not yet paid for, but does include $(3.6)$(5.4) million of cost for units paid for in the current period but received in the prior period (see the Supplemental Cash Flow Information in Part II, Item 8. Financial“Financial Statements and Supplementary Data)Data”). The investment in rental product was to support our growth in customer demand as a result of the COVID-19 recovery.rental product strategy. The majority of the investment in fixed and intangible assets was primarily related to investments in automation assets, additional processing machinerycapitalized software and equipment for our Secaucus and Arlington warehouses, reusable bags and capitalized technology labor. leasehold improvements. The cash used in investing activities was partially offset by $12.9$23.3 million of proceeds from the sale of owned rental productsproduct and $5.7$4.6 million of proceeds from salesthe liquidation of liquidated rental products.product.
For the year ended January 31, 2021,2023, net cash used in investing activities was $(58.4)$(44.3) million, primarily consisting of $(54.9)$(62.1) million of purchases of rental product incurred in the period and $(23.8)$(8.9) million of purchases of fixed and intangible assets. The investment in rental product did not include the additional $3.6$5.4 million of cost for units received in the current period but not yet paid for, but did include $(3.7)$(6.5) million of cost for units paid for in the current period but received in the prior period (see Supplemental Cash Flow Information in Part II, Item 8. Financial“Financial Statements and Supplementary Data)Data”). The investment in rental product was to support growth in planned customer demand prior to the onset of COVID-19.demand. The majority of the investment in fixed and intangible assets was related to the build-out of our new headquarters in Brooklyn, NY, the investmentinvestments in automation assets, and additional processing machinery and equipment for our warehouses in addition to capitalized technology labor . Thethe Secaucus and Arlington warehouses. The cash used in investing activities was partially offset by $17.9 million of proceeds from sales of owned rental products and $2.4$8.8 million of proceeds from salesthe liquidation of liquidated rental products.product.
Net cash provided by (used in) financing activities. During the year ended January 31, 2022,2024, net cash provided by financing activities was $215.2$0.7 million, consisting primarily of $327.3 million from the sale of Class A common stock in our IPO which is net of the underwriting discounts of $(24.1) million and deferred equity issuance costs of $(5.6) million, $21.2 million from the issuance of redeemable preferred stock, $3.3 million from the exercise of options and $3.1 million of net proceeds from short term financing agreements and other financing payments. The cash from financing activities was partially offset by $(139.7) million in debt payments and extinguishment costs.
During the year ended January 31, 2021,2023, net cash provided byused in financing activities was $168.5$(4.0) million, consisting primarily of net proceeds from issuance of debt of $111.0 million and proceeds from the issuance of redeemable preferred stock of $60.4 million.other financing payments.
Contractual Obligations and Commitments
In October 2021, we paid down outstanding principal and accrued interest of our Ares Facility in full and a portion of our Temasek Facility. Additionally,December 2023, we entered into the 2023 Amended Temasek Facility.Facility, which eliminated all interest (both payment-in-kind and cash interest) for a period of six full fiscal quarters beginning with the fourth quarter of fiscal year 2023, reduced the minimum liquidity maintenance covenant from $50 million to $30 million, and provided that we may not exceed mutually agreed upon quarterly and annual spend levels for rental product capital expenditures, fixed operating expenses and marketing expenditures during fiscal year 2024 and to-be-agreed levels for fiscal years 2025 and 2026. See Note 8 — Long-Term Debt in the Notes to the Consolidated Financial Statements for more information. As of January 31, 2022,2024, we had approximately $260.8$306.7 million of total debt outstanding, none of which is payablematures within the next 12 months. See “Note 78 — Long-Term Debt” in the Notes to the Consolidated Financial Statements for more information.
As of January 31, 2022, we had approximately $88.9 million of long-term operating lease obligations of which $13.6 million of lease obligations are payable within the next 12 months. See also “Note 45 – Leases – Lessee Accounting” and “Note 16 - Subsequent Events” in the Notes to the Consolidated Financial Statements which describes a reduction of $10.6 million in the Company’sfor our minimum fixed lease obligations subsequent tounder existing lease agreements as of January 31, 2024, including the Company’s fiscal year-end.discussion of the recent extension of our Secaucus lease.
Critical Accounting Estimates
Management’s discussion and analysis of our financial condition and results of operations is based on our consolidated financial statements, which have been prepared in accordance with GAAP. The preparation of our financial statements requires us to make estimates using assumptions that affect the reported amounts of assets and liabilities at the date of the financial statements, as well as the reported revenue generated and expenses incurred during the reporting periods, as well as related disclosures. Our estimates are based on our historical experience and on various other factors that we believe are reasonable under the circumstances, the results of which form the basis for making judgments about the carrying value of assets and liabilities and the amount of revenue and expenses that are not readily apparent from other sources. Actual results may differ from these estimates under different assumptions or conditions, and any such differences may be material. We believe that the accounting estimates discussed below are critical to understanding our historical and future performance, as these policies relate to the more significant areas involving management’s judgments and estimates.
Rental Product
We consider rental product to be a long-term productive asset and, as such, classify it as a noncurrent asset on the consolidated balance sheets.Consolidated Balance Sheets. Rental product is stated at cost, less accumulated depreciation. We depreciate rental product, less salvage value, over the useful lives of the assets using the straight-line method. Depreciation on rental products is an estimate based on the following assumptions:
•Useful life: our projection of the period over which we can monetize our rental products through our Subscription or Reserve rental offerings
•Salvage value: our projection of the proceeds that can be expected to be generated from rental product once it is no longer considered rentable, expressed as a percentage of the acquisition cost
The useful life is determined based on historical trends and an assessment of any future changes. The salvage value considers the historical trends and projected liquidation proceeds for the assets. A change in the assumption used for useful life or salvage value would either increase or decrease accumulated depreciation and depreciation expense reflected on our consolidated balance sheetsConsolidated Balance Sheets within rentalRental product, net and on our consolidated statementsConsolidated Statements of operationsOperations within rentalRental product depreciation and revenue share, respectively. Our historical results and assessment of any future changes continue to support the use of these assumptions.
Right-of-Use Assets and Lease Liabilities
Right-of-use (“ROU”) assets and lease liabilities are measured and recognized at the lease commencement date or lease modification date based on the present value of fixed lease payments over the expected lease term. Because the majority of our leases do not include an implicit discount rate, we use an estimated incremental borrowing rate (“IBR”), to determine the present value of future minimum lease payments. The sensitivity of the estimate is due to the judgement used in the determination of the synthetic credit rating and the development of the related benchmark yield curves.
Share-Based Compensation
We measure share-based compensation expense for all equity classified awards based on the estimated fair value of the awards on the date of grant. The fair value of stock options is recognized as compensation expense on a straight-line basis over the requisite service period of the award. We estimate grant date fair value of stock options using the Black-Scholes option pricing model, which requires the input of subjective assumptions, including the following:
•Fair value of common stock. Following the closing of our IPO, the fair market value of our common stock is based on the closing price as reported on the date of grant on the Nasdaq Stock Market, on which the Company’s stock is traded. Prior to the close of our IPO, because our common stock was not yet publicly traded, we were required to estimate the fair value of its common stock. The fair value of the shares of common stock underlying the stock options was historically determined by a third-party valuation firm and approved by our board of directors. The fair value of our common stock was determined by considering a number of objective and subjective factors, including: the valuation of comparable companies, sales of preferred stock to unrelated third parties, our operating and financial performance, the lack of liquidity of common stock and general and industry specific economic outlook, among other factors.
•Expected volatility. As a result of the lack of historical and implied volatility data of our common stock, the expected stock price volatility has been estimated based on the historical volatilities of a specified group of companies in itsour industry for a period equal to the expected life of the option. We selected companies with comparable characteristics, including enterprise value, risk profiles, and position within the industry, and with historical share price information sufficient to meet the expected term of the stock options. The historical volatility data has been computed using the daily closing prices for the selected companies.
•Expected term. The expected term of stock options represents the weighted-average period the stock options are expected to remain outstanding and is estimated under the simplified method using the vesting and contractual terms.
•Risk-free interest rate. The expected risk-free rate assumption is based on the U.S. Treasury instruments whose term is consistent with the expected term of the stock options.
•Expected dividend yield. The expected dividend assumption is based on our history and expectation of dividend. We have not paid dividends and do not expect to do so in the foreseeable future.
Upon grant of awards, we also estimate an amount of forfeitures that will occur prior to vesting. We estimate forfeitures based on the dynamic forfeiture model based on our historical forfeitures of stock options adjusted to reflect future changes in facts and circumstances, if any. There were no stock options granted during the years January 31, 2024 and 2023.
Impairment Evaluation
Long-lived assets, such as rental product, fixed assets, intangible assets, and right-of-use lease assets, are reviewed for impairment triggers when events or changes in circumstances indicate the carrying value of such assets may not be recoverable. If circumstances require a long-lived asset or asset group be tested for possible impairment, the Company first compares the undiscounted cash flows expected to be generated by that asset or asset group to its carrying amount. If the carrying amount of the long-lived asset or asset group is not recoverable on an undiscounted cash flow basis, an impairment is recognized to the extent that the carrying amount exceeds its fair value. Fair value is determined using various valuation techniques including discounted cash flow models, quoted market values, and third-party independent appraisals, as necessary.
Given the Company’s stock price decline during the third quarter, the Company concluded a triggering event had occurred and performed an impairment analysis of its long-lived assets as of October 31, 2023. The Company performed a quantitative assessment using the undiscounted future cash flows expected to be generated by the use and eventual disposition of the Company’s long-lived assets group. The assessment included consideration of key factors including projected enterprise cash flows, market capitalization and the fair value of the Temasek debt. Based on the quantitative assessment, undiscounted cash flows expected to be generated by the use and eventual disposition of the Company’s long-lived assets exceeded their carrying values and therefore no impairment was recognized for the year ended January 31, 2024.
Warrants
Warrants held prior to the IPO which did not meet the criteria for equity treatment were recorded as liabilities. Accordingly, we classified the warrants as liabilities at their fair value and adjusted the warrants to fair value at each previous reporting period. This liability wasThe liabilities were subject to re-measurement at each balance sheet date until exercised, and any change in fair value was recognized in our consolidated statementsConsolidated Statements of operations.Operations. The warrants were valued using athe Black-Scholes option pricing model. The assumptions used in preparing the model include estimates such as fair value of the underlying shares, expected volatility, expected term, risk-free interest rate and expected dividend yield. ThisThe valuation model used unobservable market share price input on a recurring basis, and therefore the liability was classified as Level 3. As of January 31, 2022,2024 and January 31, 2023, the Company had no outstanding warrants classified as liabilities.
Recent Accounting Pronouncements
See “Note 2 — Summary of Significant Accounting Policies” in the Notes to Consolidated Financial Statements for a description of recently adopted accounting pronouncements and recently issued accounting pronouncements not yet adopted.
JOBS Act
We currently qualify as an “emerging growth company” under the Jumpstart Our Business Startups Act of 2012, or the JOBS Act. Accordingly, we are provided the option to adopt new or revised accounting guidance either (i) within the same periods as those otherwise applicable to non-emerging growth companies or (ii) within the same time periods as private companies. We have elected to adopt new or revised accounting guidance within the same time period as private companies until the earlier of the date we (i) are no longer an emerging growth company or (ii) affirmatively and irrevocably opt out of the extended transition period. Accordingly, our utilization of these transition periods may make it difficult to compare our financial statements to those of non-emerging growth companies and other emerging growth companies that have opted out of the transition periods afforded under the JOBS Act.
Item 7A. Quantitative and Qualitative Disclosures About Market Risk
Market risk represents the risk of loss that may impact our financial position because of adverse changes in financial market prices and rates. Our market risk exposure is primarily a result of exposure resulting from potential changes in inflation.inflation.
Interest Rate Risk
As of January 31, 2022,2024, we had cash and cash equivalents of $247.6$84.0 million and $260.8 $306.7 million of debt outstanding under the 2023 Amended Temasek Facility. Cash and cash equivalents consistsconsist primarily of cash held in financial institutions within the United States and Ireland and cash in transit from third-party credit card providers. Borrowings under the 2023 Amended Temasek Facility bear interest at fixed rates. We have minimal exposure to market risk relating to changes in interest rates as they can affect the amount of interest income we earn on our cash. We do not enter into investments for trading or speculative purposes and have not used any derivative financial instruments to manage our interest rate risk exposure.exposure. As of January 31, 2022,2024, a hypothetical 10% change in interest rates would not have resulted in a material impact on our consolidated financial statements.
Foreign Currency Risk
Our net revenue is denominated in U.S. dollars and a portion of our operating expenses are incurred outside the United States, denominated in foreign currencies. Accordingly, our results of operations are subject to fluctuations due to changes in foreign currency exchange rates, particularly changes in the euro. Additionally, fluctuations in foreign currency exchange rates may cause us to recognize transaction gains and losses in our consolidated statementsConsolidated Statements of operations.Operations. As the impact of foreign currency exchange rates has not been material to our historical results of operations, we have not entered into derivative or hedging transactions, but we may do so in the future if our exposure to foreign currency becomes more significant. As of January 31, 2022, 2024, a hypothetical 10% change in the relative value of the U.S. dollar to other currencies would not have had a material effect on our results of operations.operations.
Inflation Risk
We do not believe thatIn recent months, persistent inflation has had a material effect on our business, financial condition continued to result in rising transportation, wages, rental product and other costs in the United States and overseas . For results of operations. For a discussion of recent wage increases and transportation costs related, in part, to inflationary pressures, see “Impact of COVID-19Macro and Consumer Environment on Our Business” in Part II, Item 7. “Management’s Discussion and Analysis of Financial Condition and Results of Operations.” If our costs become subject to significant inflationary pressures, we may not be able to fully offset such higher costs with increased revenue. Our inability or failure to do so could harm our business, financial condition, and results of operations.operations.
Item 8. Financial Statements and Supplementary Data
| | | | | |
| Page |
| |
| |
| |
| |
| |
| Notes to Consolidated Financial Statements | |
| |
| |
| |
| |
| |
| |
| |
| |
| |
| |
| |
| |
| |
| |
| |
| |
| |
| |
| |
| |
| |
| |
Report of Independent Registered Public Accounting Firm
To the Board of Directors and Stockholders of Rent the Runway, Inc.
Opinion on the Financial Statements
We have audited the accompanying consolidated balance sheets of Rent the Runway, Inc. and its subsidiary (the “Company”) as of January 31, 20222024 and 2021,2023, and the related consolidated statements of operations, of changes in redeemable preferred stock and stockholders’ equity (deficit) and of cash flows for each of the three years in the period ended January 31, 2022,2024, including the related notes (collectively referred to as the “consolidated financial statements”). In our opinion, the consolidated financial statements present fairly, in all material respects, the financial position of the Company as of January 31, 20222024 and 2021,2023, and the results of its operations and its cash flows for each of the three years in the period ended January 31, 20222024 in conformity with accounting principles generally accepted in the United States of America.
Basis for Opinion
These consolidated financial statements are the responsibility of the Company’s management. Our responsibility is to express an opinion on the Company’s consolidated financial statements based on our audits. We are a public accounting firm registered with the Public Company Accounting Oversight Board (United States) (PCAOB) and are required to be independent with respect to the Company in accordance with the U.S. federal securities laws and the applicable rules and regulations of the Securities and Exchange Commission and the PCAOB.
We conducted our audits of these consolidated financial statements in accordance with the standards of the PCAOB. Those standards require that we plan and perform the audits to obtain reasonable assurance about whether the consolidated financial statements are free of material misstatement, whether due to error or fraud. The Company is not required to have, nor were we engaged to perform, an audit of its internal control over financial reporting. As part of our audits we are required to obtain an understanding of internal control over financial reporting but not for the purpose of expressing an opinion on the effectiveness of the Company's internal control over financial reporting. Accordingly, we express no such opinion.
Our audits included performing procedures to assess the risks of material misstatement of the consolidated financial statements, whether due to error or fraud, and performing procedures that respond to those risks. Such procedures included examining, on a test basis, evidence regarding the amounts and disclosures in the consolidated financial statements. Our audits also included evaluating the accounting principles used and significant estimates made by management, as well as evaluating the overall presentation of the consolidated financial statements. We believe that our audits provide a reasonable basis for our opinion.
/s/ PricewaterhouseCoopers LLP
New York, New York
April 14, 202211, 2024
We have served as the Company’s auditor since2020.
| | |
RENT THE RUNWAY, INC. Consolidated Balance Sheets |
(In millions, except share and per share amounts) | | January 31, | | January 31, |
| 2022 | | 2021 |
| January 31, | | | January 31, |
| 2024 | | | 2024 | | 2023 |
| Assets | Assets | | | |
| Current assets: | Current assets: | |
| Current assets: | |
| Current assets: | |
| Cash and cash equivalents | |
| Cash and cash equivalents | |
| Cash and cash equivalents | Cash and cash equivalents | $ | 247.6 | | | $ | 95.3 | |
| Restricted cash, current | Restricted cash, current | 5.4 | | | 3.4 | |
| Prepaid expenses and other current assets | Prepaid expenses and other current assets | 11.7 | | | 4.7 | |
| Total current assets | Total current assets | 264.7 | | | 103.4 | |
| Restricted cash | Restricted cash | 6.6 | | | 10.5 | |
| Rental product, net | Rental product, net | 76.3 | | | 97.6 | |
| Fixed assets, net | Fixed assets, net | 57.2 | | | 64.7 | |
| Intangible assets, net | Intangible assets, net | 6.4 | | | 7.8 | |
| Operating lease right-of-use assets | Operating lease right-of-use assets | 31.5 | | | 34.9 | |
| Other assets | Other assets | 4.8 | | | 1.8 | |
| Total assets | Total assets | $ | 447.5 | | | $ | 320.7 | |
| Liabilities, Redeemable Preferred Stock and Stockholders’ Equity (Deficit) | | | |
| Liabilities and Stockholders’ Equity (Deficit) | |
| Current liabilities: | Current liabilities: | |
| Current liabilities: | |
| Current liabilities: | |
| Accounts payable | |
| Accounts payable | |
| Accounts payable | Accounts payable | $ | 15.9 | | | $ | 7.2 | |
| Accrued expenses and other current liabilities | Accrued expenses and other current liabilities | 30.0 | | | 14.1 | |
| Deferred revenue | Deferred revenue | 10.4 | | | 5.6 | |
| Customer credit liabilities | Customer credit liabilities | 6.9 | | | 7.0 | |
| Operating lease liabilities | Operating lease liabilities | 5.6 | | | 6.7 | |
| Total current liabilities | Total current liabilities | 68.8 | | | 40.6 | |
| Long-term debt, net | Long-term debt, net | 260.8 | | | 355.1 | |
| Operating lease liabilities | Operating lease liabilities | 46.4 | | | 51.5 | |
| Warrant liability | — | | | 11.8 | |
| Other liabilities | Other liabilities | 0.4 | | | 0.3 | |
| Total liabilities | Total liabilities | 376.4 | | | 459.3 | |
| Commitments and Contingencies (Note 15) | 0 | | 0 |
| Redeemable preferred stock, $0.001 par value; 0 and 35,236,646 shares authorized as of January 31, 2022 and 2021, respectively; 0 and 31,137,921 shares issued and outstanding as of January 31, 2022 and 2021, respectively; liquidation preference of $0.0 million and $393.7 million as of January 31, 2022 and 2021, respectively | — | | | 388.1 | |
| Commitments and Contingencies (Note 16) | | Commitments and Contingencies (Note 16) | | | |
| Stockholders’ equity (deficit) | Stockholders’ equity (deficit) | |
| Common stock, $0.001 par value; 0 and 60,000,000 shares authorized as of January 31, 2022 and 2021, respectively; 0 and 10,456,521 shares issued and outstanding as of January 31, 2022 and 2021, respectively | — | | | — | |
| Class A common stock, $0.001 par value; 300,000,000 and 0 shares authorized as of January 31, 2022 and 2021, respectively; 60,104,058 and 0 shares issued and outstanding as of January 31, 2022 and 2021, respectively | 0.1 | | | — | |
| Class B common stock, $0.001 par value; 50,000,000 and 0 shares authorized as of January 31, 2022 and 2021, respectively; 2,932,739 and 0 shares issued and outstanding as of January 31, 2022 and 2021, respectively | — | | | — | |
| Preferred stock, $0.001 par value; 10,000,000 and 0 shares authorized as of January 31, 2022 and 2021, respectively; 0 and 0 shares issued and outstanding as of January 31, 2022 and 2021, respectively | — | | | — | |
Class A common stock, $0.001 par value; 300,000,000 shares authorized as of January 31, 2024 and 2023; 3,390,587 and 3,097,826 shares issued and outstanding as of January 31, 2024 and 2023, respectively (1) | |
Class A common stock, $0.001 par value; 300,000,000 shares authorized as of January 31, 2024 and 2023; 3,390,587 and 3,097,826 shares issued and outstanding as of January 31, 2024 and 2023, respectively (1) | |
Class A common stock, $0.001 par value; 300,000,000 shares authorized as of January 31, 2024 and 2023; 3,390,587 and 3,097,826 shares issued and outstanding as of January 31, 2024 and 2023, respectively (1) | |
Class B common stock, $0.001 par value; 50,000,000 shares authorized as of January 31, 2024 and 2023; 154,928 and 153,312 shares issued and outstanding as of January 31, 2024 and 2023, respectively (1) | |
| Preferred stock, $0.001 par value; 10,000,000 shares authorized as of January 31, 2024 and 2023; 0 shares issued and outstanding as of January 31, 2024 and 2023 | |
| Additional paid-in capital | Additional paid-in capital | 872.2 | | | 62.7 | |
| Accumulated deficit | Accumulated deficit | (801.2) | | | (589.4) | |
| Total stockholders’ equity (deficit) | Total stockholders’ equity (deficit) | 71.1 | | | (526.7) | |
| Total liabilities, redeemable preferred stock and stockholders’ equity (deficit) | $ | 447.5 | | | $ | 320.7 | |
| Total liabilities and stockholders’ equity (deficit) | |
(1) Amounts have been adjusted to reflect the 1-for-20 reverse stock split that became effective on April 2, 2024. See Note 2, “Summary of Significant Accounting Policies” and Note 13, “Stockholders’ Equity” for additional details.
The accompanying notes are an integral part of these consolidated financial statements.
| | |
RENT THE RUNWAY, INC. Consolidated Statements of Operations |
(In millions, except share and per share amounts)
| | Year Ended January 31, |
| 2022 | | 2021 | | 2020 |
| | Years Ended January 31, | | | | Years Ended January 31, |
| | 2024 | | | | 2024 | | 2023 | | 2022 |
| Revenue: | Revenue: | | | | | | |
| Subscription and Reserve rental revenue | |
| Subscription and Reserve rental revenue | |
| Subscription and Reserve rental revenue | Subscription and Reserve rental revenue | | $ | 185.8 | | | $ | 135.9 | | | $ | 235.4 | |
| Other revenue | Other revenue | | 17.5 | | | 21.6 | | | 21.5 | |
| Total revenue, net | Total revenue, net | | 203.3 | | | 157.5 | | | 256.9 | |
| Costs and expenses: | Costs and expenses: | | | | | | |
| Fulfillment | |
| Fulfillment | |
| Fulfillment | Fulfillment | | 61.9 | | | 53.0 | | | 118.1 | |
| Technology | Technology | | 45.3 | | | 37.7 | | | 40.2 | |
| Marketing | Marketing | | 26.5 | | | 8.1 | | | 22.9 | |
| General and administrative | General and administrative | | 104.4 | | | 77.2 | | | 98.9 | |
| Rental product depreciation and revenue share | Rental product depreciation and revenue share | | 71.7 | | | 89.0 | | | 85.2 | |
| Other depreciation and amortization | Other depreciation and amortization | | 19.4 | | | 23.0 | | | 21.6 | |
| Restructuring charges | |
| Loss on asset impairment related to restructuring | |
| Total costs and expenses | Total costs and expenses | | 329.2 | | | 288.0 | | | 386.9 | |
| Operating loss | Operating loss | | (125.9) | | | (130.5) | | | (130.0) | |
| Interest income / (expense), net | Interest income / (expense), net | | (53.0) | | | (46.6) | | | (24.0) | |
| Gain / (loss) on warrant liability revaluation, net | Gain / (loss) on warrant liability revaluation, net | | (24.9) | | | 0.4 | | | — | |
| Gain / (loss) on debt extinguishment, net | Gain / (loss) on debt extinguishment, net | | (12.2) | | | (0.6) | | | — | |
| Other income / (expense), net | Other income / (expense), net | | 3.9 | | | 6.2 | | | (0.1) | |
| Net loss before income tax benefit / (expense) | Net loss before income tax benefit / (expense) | | (212.1) | | | (171.1) | | | (154.1) | |
| Income tax benefit / (expense) | Income tax benefit / (expense) | | 0.3 | | | — | | | 0.2 | |
| Net loss | Net loss | | $ | (211.8) | | | $ | (171.1) | | | $ | (153.9) | |
| Net loss per share attributable to common stockholders, basic and diluted | | $ | (8.51) | | | $ | (15.36) | | | $ | (14.04) | |
| Weighted-average shares used in computing net loss per share attributable to common stockholders, basic and diluted | | 24,874,061 | | | 11,138,851 | | | 10,964,634 | |
Net loss per share attributable to common stockholders, basic and diluted (1) | |
Weighted-average shares used in computing net loss per share attributable to common stockholders, basic and diluted (1) | |
The accompanying notes are an integral part of these consolidated financial statements.
| | |
RENT THE RUNWAY, INC. Consolidated Statements of Changes in Redeemable Preferred Stock and Stockholders’ Equity (Deficit) |
(In millions, except share amounts)
| | Redeemable
Preferred Stock | | | Common Stock | | Additional
Paid-in
Capital | | Accumulated
Deficit | | Total
Stockholders’
Equity (Deficit) |
| Shares | | Amount | | | Shares | | Amount | |
| Balances as of January 31, 2019 | 20,891,652 | | | $ | 196.7 | | | | 10,100,658 | | | $ | — | | | $ | 45.4 | | | $ | (267.0) | | | $ | (221.6) | |
| Issuance of redeemable preferred stock | 6,100,619 | | | 133.8 | | | | — | | | — | | | — | | | — | | | — | |
| Stock issued under stock incentive plan | — | | | — | | | | 270,978 | | | — | | | 1.8 | | | 1.8 | |
| Share-based compensation expense | — | | | — | | | | — | | | — | | | 6.8 | | | 6.8 | |
| Adjustment to accumulated deficit, cumulative effect of ASC 606 adoption | — | | | — | | | | — | | | — | | | — | | | 2.6 | | | 2.6 | |
| Net loss | — | | | — | | | | — | | | — | | | — | | | (153.9) | | | (153.9) | |
| Balances as of January 31, 2020 | 26,992,271 | | | 330.5 | | | | 10,371,636 | | | — | | | 54.0 | | | (418.3) | | | (364.3) | |
| Issuance of redeemable preferred stock | 4,145,650 | | | 57.6 | | | | — | | | — | | | — | | | — | | | — | |
| Stock issued under stock incentive plan | — | | | — | | | | 84,885 | | | — | | | 0.5 | | | — | | | 0.5 | |
| Share-based compensation expense | — | | | — | | | | — | | | — | | | 8.2 | | | — | | | 8.2 | |
| Net loss | — | | | — | | | | — | | | — | | | — | | | (171.1) | | | (171.1) | |
| Redeemable
Preferred Stock | | | Redeemable
Preferred Stock | | | Common Stock | | Additional
Paid-in
Capital | | Accumulated
Deficit | | Total
Stockholders’
Equity (Deficit) |
| Shares | |
| Balances as of January 31, 2021 | |
| Balances as of January 31, 2021 | |
| Balances as of January 31, 2021 | Balances as of January 31, 2021 | 31,137,921 | | | 388.1 | | | | 10,456,521 | | | — | | | 62.7 | | | (589.4) | | | (526.7) | |
| Issuance of redeemable preferred stock | Issuance of redeemable preferred stock | 1,437,541 | | | 21.2 | | | | — | | | — | | | — | | | — | | | — | |
| Conversion of redeemable preferred stock | Conversion of redeemable preferred stock | (32,575,462) | | | (409.3) | | | | 32,575,462 | | | 0.1 | | | 409.2 | | | — | | | 409.3 | |
| Stock issued under stock incentive plan | Stock issued under stock incentive plan | — | | | — | | | | 583,439 | | | — | | | 3.3 | | | — | | | 3.3 | |
| Stock issued as part of IPO, net of offering costs | Stock issued as part of IPO, net of offering costs | — | | | — | | | | 17,000,000 | | | — | | | 327.3 | | | — | | | 327.3 | |
| Issuance of warrants | Issuance of warrants | — | | | — | | | | — | | | — | | | 6.4 | | | — | | | 6.4 | |
| Exercise of warrants | Exercise of warrants | — | | | — | | | | 2,421,375 | | | — | | | 35.5 | | | — | | | 35.5 | |
| Reclassification of warrants | Reclassification of warrants | — | | | — | | | | — | | | — | | | 1.2 | | | — | | | 1.2 | |
| Share-based compensation expense | Share-based compensation expense | — | | | — | | | | — | | | — | | | 26.6 | | | — | | | 26.6 | |
| Net loss | Net loss | — | | | — | | | | — | | | — | | | — | | | (211.8) | | | (211.8) | |
| Balances as of January 31, 2022 | Balances as of January 31, 2022 | — | | | $ | — | | | | 63,036,797 | | | $ | 0.1 | | | $ | 872.2 | | | $ | (801.2) | | | $ | 71.1�� | |
| | Stock issued under stock incentive plan | |
| Issuance of warrants | |
| Share-based compensation expense | |
| Net loss | |
| Balances as of January 31, 2023 | |
| Stock issued under stock incentive plan | |
| Share-based compensation expense | |
| Net loss | |
| Balances as of January 31, 2024 | |
(1) Amounts have been adjusted to reflect the 1-for-20 reverse stock split that became effective on April 2, 2024. See Note 2, “Summary of Significant Accounting Policies” and Note 13, “Stockholders’ Equity” for additional details. Redeemable Preferred Stock is stated at original share amounts.
The accompanying notes are an integral part of these consolidated financial statements.
| | |
RENT THE RUNWAY, INC. Consolidated Statements of Cash Flows |
(In millions)
| | Year Ended
January 31, |
| 2022 | | 2021 | | 2020 |
| Years Ended January 31, | | | Years Ended January 31, |
| 2024 | | | 2024 | | 2023 | | 2022 |
| OPERATING ACTIVITIES | OPERATING ACTIVITIES | | | | | |
| Net loss | |
| Net loss | |
| Net loss | Net loss | $ | (211.8) | | | $ | (171.1) | | | $ | (153.9) | |
| Adjustments to reconcile net loss to net cash (used in) provided by operating activities: | Adjustments to reconcile net loss to net cash (used in) provided by operating activities: | |
| Rental product depreciation and write-offs | Rental product depreciation and write-offs | 45.6 | | | 55.9 | | | 61.6 | |
| Rental product depreciation and write-offs | |
| Rental product depreciation and write-offs | |
| Write-off of rental product sold | Write-off of rental product sold | 4.7 | | | 14.0 | | | 14.0 | |
| Other depreciation and amortization | Other depreciation and amortization | 19.5 | | | 24.1 | | | 21.6 | |
| Loss from lease termination and write-off of fixed and intangible assets | |
| Loss on asset impairment related to restructuring | |
| Proceeds from rental product sold | Proceeds from rental product sold | (12.9) | | | (17.9) | | | (19.3) | |
| (Gain) / loss from liquidation of rental product | (Gain) / loss from liquidation of rental product | (0.6) | | | 0.9 | | | 0.5 | |
| Accrual of paid-in-kind interest | Accrual of paid-in-kind interest | 38.8 | | | 36.9 | | | 19.0 | |
| Settlement of paid-in-kind interest | Settlement of paid-in-kind interest | (6.3) | | | — | | | — | |
| Amortization of debt discount | Amortization of debt discount | 5.9 | | | 5.0 | | | 4.0 | |
| Loss on debt extinguishment | Loss on debt extinguishment | 12.2 | | | 0.6 | | | — | |
| Share-based compensation expense | Share-based compensation expense | 26.6 | | | 8.2 | | | 6.8 | |
| Remeasurement of warrant liability | Remeasurement of warrant liability | 24.9 | | | (0.4) | | | — | |
| Changes in operating assets and liabilities: | Changes in operating assets and liabilities: | |
| Prepaid expenses and other current assets | Prepaid expenses and other current assets | (7.0) | | | 0.3 | | | (2.4) | |
| Prepaid expenses and other current assets | |
| Prepaid expenses and other current assets | |
| Operating lease right-of-use assets | Operating lease right-of-use assets | 3.4 | | | (0.4) | | | (34.5) | |
| Other assets | Other assets | (3.0) | | | 1.8 | | | (1.3) | |
| Accounts payable, accrued expenses and other current liabilities | Accounts payable, accrued expenses and other current liabilities | 18.4 | | | (4.5) | | | 6.0 | |
| Deferred revenue and customer credit liabilities | Deferred revenue and customer credit liabilities | 4.7 | | | (7.3) | | | 1.5 | |
| Operating lease liabilities | Operating lease liabilities | (6.2) | | | 11.4 | | | 46.8 | |
| Other liabilities | Other liabilities | 0.8 | | | (0.3) | | | (8.0) | |
| Net cash (used in) provided by operating activities | Net cash (used in) provided by operating activities | (42.3) | | | (42.8) | | | (37.6) | |
| INVESTING ACTIVITIES | INVESTING ACTIVITIES | | | | | |
| Purchases of rental product | Purchases of rental product | (30.8) | | | (54.9) | | | (117.7) | |
| Purchases of rental product | |
| Purchases of rental product | |
| Proceeds from liquidation of rental product | Proceeds from liquidation of rental product | 5.7 | | | 2.4 | | | 3.6 | |
| Proceeds from sale of rental product | Proceeds from sale of rental product | 12.9 | | | 17.9 | | | 19.3 | |
| Purchases of fixed and intangible assets | Purchases of fixed and intangible assets | (10.3) | | | (23.8) | | | (43.8) | |
| Net cash (used in) provided by investing activities | Net cash (used in) provided by investing activities | (22.5) | | | (58.4) | | | (138.6) | |
| FINANCING ACTIVITIES | FINANCING ACTIVITIES | | | | | |
| Proceeds from issuance of common stock upon IPO, net of offering costs | Proceeds from issuance of common stock upon IPO, net of offering costs | 327.3 | | | — | | | — | |
| Proceeds from issuance of common stock upon IPO, net of offering costs | |
| Proceeds from issuance of common stock upon IPO, net of offering costs | |
| Proceeds from issuance of redeemable preferred stock | Proceeds from issuance of redeemable preferred stock | 21.2 | | | 60.4 | | | 133.8 | |
| Proceeds from exercise of stock options under stock incentive plan | Proceeds from exercise of stock options under stock incentive plan | 3.3 | | | 0.5 | | | 1.8 | |
| Proceeds from line of credit | — | | | 15.0 | | | 86.0 | |
| Principal repayments on line of credit | — | | | (59.0) | | | (92.6) | |
| Proceeds from long-term debt | — | | | 155.0 | | | 50.0 | |
| Principal repayments on long-term debt | Principal repayments on long-term debt | (135.0) | | | — | | | — | |
| Debt extinguishment costs | Debt extinguishment costs | (4.7) | | | — | | | — | |
| Proceeds from short-term financing agreements | Proceeds from short-term financing agreements | 5.0 | | | — | | | — | |
| Other financing payments | Other financing payments | (1.9) | | | (3.4) | | | (1.1) | |
| Net cash (used in) provided by financing activities | 215.2 | | | 168.5 | | | 177.9 | |
| Net increase in cash and cash equivalents and restricted cash | 150.4 | | | 67.3 | | | 1.7 | |
| Net cash provided by (used in) financing activities | |
| Net (decrease) increase in cash and cash equivalents and restricted cash | |
| Cash and cash equivalents and restricted cash at beginning of period | Cash and cash equivalents and restricted cash at beginning of period | 109.2 | | | 41.9 | | | 40.2 | |
| Cash and cash equivalents and restricted cash at end of period | Cash and cash equivalents and restricted cash at end of period | $ | 259.6 | | | $ | 109.2 | | | $ | 41.9 | |
The accompanying notes are an integral part of these consolidated financial statements.
| | |
RENT THE RUNWAY, INC. Consolidated Statements of Cash Flows |
(in millions)
| | | | | | | | | | | | | | | | | |
| Year Ended
January 31, |
| 2022 | | 2021 | | 2020 |
| Reconciliation of Cash and Cash Equivalents and Restricted Cash to the Consolidated Balance Sheets: | | | | | |
| Cash and cash equivalents | $ | 247.6 | | | $ | 95.3 | | | $ | 31.4 | |
| Restricted cash, current | 5.4 | | | 3.4 | | | 10.5 | |
| Restricted cash, noncurrent | 6.6 | | | 10.5 | | | — | |
| Total cash and cash equivalents and restricted cash | $ | 259.6 | | | $ | 109.2 | | | $ | 41.9 | |
| | | | | |
| | | | | |
| Supplement Cash Flow Information: | | | | | |
| Cash payments (receipts) for: | | | | | |
| Interest paid on loans | $ | 10.2 | | | $ | 3.7 | | | $ | 1.5 | |
| Interest paid on financing leases | 0.1 | | | — | | | 0.1 | |
| Fixed operating lease payments (reimbursements), net | 15.8 | | | 2.6 | | | 7.0 | |
| Fixed assets and intangibles received in the prior period | 0.5 | | | 2.1 | | | 9.6 | |
| Rental product received in the prior period | 3.6 | | | 3.7 | | | 4.7 | |
| Non-cash financing and investing activities: | | | | | |
| Financing lease right-of-use asset amortization | $ | 0.3 | | | $ | 0.2 | | | $ | 0.1 | |
| ROU assets obtained in exchange for lease liabilities (1) | 0.9 | | | 0.1 | | | 40.0 | |
| Adjustments to ROU assets or lease liabilities due to modification or other reassessment events | 0.3 | | | 5.2 | | | — | |
| Purchases of fixed assets and intangibles not yet settled | 0.8 | | | 0.5 | | | 2.1 | |
| Purchases of rental product not yet settled | 6.5 | | | 3.6 | | | 3.6 | |
(1) Includes non-cash ROU assets obtained in exchange for lease liabilities in accordance with the adoption of ASC 842 as of February 1, 2019. | | | | | | | | | | | | | | | | | |
| Years Ended January 31, |
| 2024 | | 2023 | | 2022 |
| Reconciliation of Cash and Cash Equivalents and Restricted Cash to the Consolidated Balance Sheets: | | | | | |
| Cash and cash equivalents | $ | 84.0 | | | $ | 154.5 | | | $ | 247.6 | |
| Restricted cash, current | 5.2 | | | 3.1 | | | 5.4 | |
| Restricted cash, noncurrent | 4.8 | | | 6.0 | | | 6.6 | |
| Total cash and cash equivalents and restricted cash | $ | 94.0 | | | $ | 163.6 | | | $ | 259.6 | |
| | | | | |
| | | | | |
| Supplemental Cash Flow Information: | | | | | |
| Cash payments (receipts) for: | | | | | |
| Interest paid on loans | $ | 9.6 | | | $ | 19.8 | | | $ | 10.2 | |
| Interest paid on financing leases | 0.2 | | | 0.1 | | | 0.1 | |
| Fixed operating lease payments, net | 11.1 | | | 13.5 | | | 15.8 | |
| Fixed assets and intangibles received in the prior period | 0.1 | | | 0.8 | | | 0.5 | |
| Rental product received in the prior period | 5.4 | | | 6.5 | | | 3.6 | |
| Non-cash financing and investing activities: | | | | | |
| Financing lease right-of-use asset amortization | $ | 0.6 | | | $ | 0.5 | | | $ | 0.3 | |
| ROU assets obtained in exchange for lease liabilities | — | | | 1.2 | | | 0.9 | |
| Adjustments to ROU assets or lease liabilities due to modification or other reassessment events to operating and finance leases | 10.3 | | | (1.2) | | | 0.3 | |
| Purchases of fixed assets and intangibles not yet settled | 0.3 | | | 0.1 | | | 0.8 | |
| Purchases of rental product not yet settled | 3.3 | | | 5.4 | | | 6.5 | |
| Reconciliation of loss on asset impairment: | | | | | |
| Accrued expense related to the loss on asset impairment | $ | 0.1 | | | $ | 0.4 | | | $ | — | |
The accompanying notes are an integral part of these consolidated financial statements.
| | |
RENT THE RUNWAY, INC. Notes to Consolidated Financial Statements |
(Dollars in millions, except share and per share amounts)
1.Business
Description of Business
Rent the Runway, Inc.’s (the “Company”) mission is to powerempower women to feel their best every day. Launched in November 2009, the Company has built the world’s first and largest shared designer closet with over 19,000thousands of styles by over hundreds of brand partners780 brand partners.. The Company gives customers access to its “unlimited closet” through its Subscriptionsubscription offering (“Subscription”) or the ability to rent a-la-carte through its reserve offering (“Reserve”). The Company’s corporate headquarters is located in Brooklyn, New York and theits operational facilities are located in Secaucus, New Jersey, and Arlington, Texas. Its wholly-owned subsidiary, Rent the Runway Limited (the “Subsidiary”), is located in Galway, Ireland, and is focused on software development and support activities.
All revenue is currently generated in the United States. Substantially all revenue is derived from rental subscription fees and a-la-carte rental fees, with a portion derived from the sale of apparel and accessories and other fees.
2.Summary of Significant Accounting Policies
Basis of Presentation
The consolidated financial statements include the accounts of the Company and its Subsidiary.subsidiary. All intercompany accounts and transactions have been eliminated in consolidation. The Company’s consolidated financial statements were prepared in accordance with generally accepted accounting principles in the United States (“U.S. GAAP”GAAP”). Certain amountsAs further discussed in the financial statementsReverse Stock Split section below, all per share amounts and common shares amounts have been reclassifiedadjusted on a retroactive basis to conformreflect the Reverse Stock Split (as defined below).
Reverse Stock Split
The Company’s Amended and Restated Certificate of Incorporation as of October 29, 2021 authorizes the Company to issue 300,000,000 shares of Class A common stock, par value $0.001 per share, 50,000,000 shares of Class B common stock, par value $0.001 and 10,000,000 shares of preferred stock, par value $0.001 per share.
In March 2024, the Company’s stockholders approved, and the Company’s Board of Directors selected, a 1-for-20 reverse stock split of outstanding shares of Class A common stock and Class B common stock (the “Reverse Stock Split”). The 1-for-20 Reverse Stock Split became effective on April 2, 2024 and began trading on the Nasdaq Capital Market on a post-split basis on April 3, 2024. Following the Reverse Stock Split, the number of authorized shares of Class A common stock remained at 300,000,000, the number of authorized shares of Class B common stock remained at 50,000,000, and the number of authorized shares of preferred stock remained at 10,000,000. The Reverse Stock Split reduced the total number of issued and outstanding shares of Class A common stock from 67,812,037 to 3,390,587 and Class B common stock from 3,098,580 to 154,928 as of January 31, 2024. The Reverse Stock Split reduced the total number of issued and outstanding shares of Class A common stock from 61,956,536 to 3,097,826 and Class B common stock from 3,066,251 to 153,312 as of January 31, 2023. The par value per share of Class A common stock and Class B common stock remained at $0.001. The Company filed an Amendment to the current presentation.Twelfth Amended and Restated Certificate of Incorporation with the Secretary of State of the State of Delaware on April 2, 2024 to implement the 1-for-20 Reverse Stock Split.
| | |
RENT THE RUNWAY, INC. Notes to Consolidated Financial Statements |
(Dollars in millions, except share and per share amounts)
The Company’s stockholders’ equity, in the aggregate, remained unchanged following the Reverse Stock Split. Per share net loss increased because there were fewer shares of Class A common stock and Class B common stock outstanding. There were no other accounting consequences, including changes to the amount of stock-based compensation expense to be recognized in any period, that arose as a result of the Reverse Stock Split. No fractional shares were issued in connection with the Reverse Stock Split. Instead, holders of Class A common stock and Class B common stock holding fractional shares were entitled to receive, in lieu of such fractional shares, a cash payment in an amount determined based on the closing price of the Company’s Class A common stock on the effective date of the Reverse Stock Split. The cash payments were immaterial to the Company’s consolidated financial statements. The Reverse Stock Split impacted all stockholders uniformly and did not affect any stockholder’s percentage of ownership or proportionate voting power other than very minor impacts from the treatment of fractional shares.
Fiscal Year
The Company operatesCompany’s fiscal year ends on a fiscalJanuary 31 of the next calendar ending January 31. Allyear. For example, references to “fiscal year 2024” refer to the fiscal year 2019 reflect the results of the 12-month period ending January 31, 2020. All2025 and references to “fiscal year 2023” refer to the fiscal year 2020 reflect the results of the 12-month period ending January 31, 2021. All references to fiscal year 2021 reflect the results of the 12-month period ending January 31, 2022. All references to fiscal year 2022 reflect the results of the 12-month period ending January 31, 2023.2024.
Segment Information
Operating segments are defined as components of an entity for which discrete financial information is available that is regularly reviewed by the chief operating decision maker (“CODM”) in deciding how to allocate resources and in assessing performance. The Company’s Chief Executive Officer is the Company’s CODM. The Company has 1one operating and reportable segment as the CODM reviews financial information on a consolidated basis for purposes of making operating decisions, allocating resources, and evaluating financial performance. All revenue is attributed to customers based in the United States and substantially all the Company’s long-lived assets are located in the United States.
Initial Public Offering
On October 27, 2021, the Company completed its initial public offering (“IPO”) and the Company’s Class A common stock began public trading on the Nasdaq Stock Market LLC under the symbol “RENT”. In connection with the IPO, the Company issued and sold 17,000,000850,000 shares of its Class A common stock at a public offering price of $21.00$420.00 per share. The Company received proceeds of $327.3 million from the IPO which are net of underwriting discounts of $24.1 million and offering costs paid by the Company of $5.6 million. Offering costs, including legal, accounting, printing and other costs directly related to the IPO have been recorded in Additionaladditional paid-in capital against the proceeds from the IPO on the Company’s consolidated balance sheet.
| | |
RENT THE RUNWAY, INC.
Notes to Consolidated Financial Statements
|
(Dollars in millions, except share and per share amounts)
At the closing of the IPO, the Company’s then outstanding redeemable preferred stock converted into 32,575,4621,628,773 shares of the Company’s Class A common stock. The carrying value of the redeemable preferred stock of $409.3 million was reclassified to common stock and additional paid-in-capital.
In connection with the effectiveness of the Company’s IPO registration statement on Form S-1 (the “registration statement”), the Company recognized $14.4 million in share-based compensation expense for (i) certain restricted stock units (“RSUs”) that containcontained both service-based and liquidity-based vesting conditions that were satisfied in connection withupon the effectiveness of the registration statement and (ii) the fully vested portion of certain RSU awards that were granted upon the effectiveness of the IPO.
| | |
RENT THE RUNWAY, INC. Notes to Consolidated Financial Statements |
(Dollars in millions, except share and per share amounts)
In connection with the IPO, the Company adopted an amended and restated certificate of incorporation (the “amended charter”) and adopted amended and restated bylaws (the “amended bylaws”). The amended charter authorized capital stock consisting of:
•300,000,000 shares of Class A common stock, par value $0.001 per share;
•50,000,000 shares of Class B common stock, par value $0.001 per share; and
•10,000,000 shares of preferred stock, par value $0.001 per share.
Holders of Class A common stock are entitled to 1one vote per share, and the holders of Class B common stock are entitled to 20twenty votes per share. Immediately after the effectiveness of the amended charter, 2,932,739146,636 shares of Class A common stock held by the Company’s co-founders were exchanged for an equivalent number of shares of Class B common stock. In addition, the terms of certain outstanding equity awards held by the Company’s co-founders were modified to provide that such awards are exercisable or settle into shares of Class B common stock.
Use of Estimates
The preparation of financial statements in conformity with U.S. GAAP requires management to make estimates and assumptions that affect the reported amounts of assets and liabilities at the date of the financial statements and the reported amounts of revenue and expenses during the reporting period. The Company bases its estimates on historical experience, market conditions, and on various other assumptions that are believed to be reasonable. Actual results could differ from those estimates. Significant items subject to such estimates and assumptions include the useful life and salvage value of rental product, incremental borrowing rate (“IBR”) to determine lease liabilities, and the valuation of share-based compensation and warrants.warrants, and recoverability of long-lived assets.
As of January 31, 2022,2024, the effects of the ongoing COVID-19 pandemicmacroeconomic environment on the Company’s business, results of operations, and financial condition continue to evolve. As a result, many of the Company’s estimates and assumptions required increased judgment and carry a higher degree of variability and volatility. As additional information becomes available, the Company’s estimates may change materially in future periods.
Concentrations of Credit Risks
Financial instruments that potentially subject the Company to concentrations of credit risk consist primarily of cash and cash equivalents. The Company places its cash investments with high credit quality financial institutions. The Company believes no significant credit risk exists with respect to these financial instruments.
No single customer accounted for more than 5% of the Company’s revenue during the years ended January 31, 2022, 2021,2024, 2023, and 2020.
| | |
RENT THE RUNWAY, INC.
Notes to Consolidated Financial Statements
|
(Dollars in millions, except share and per share amounts)
Fair Value Measurements and Financial Instruments
Fair value accounting is applied for all financial assets and liabilities and non-financial assets and liabilities that are recognized or disclosed at fair value in the consolidated financial statements on a recurring basis, at least annually. Fair value is defined as the price that would be received to sell an asset or paid to transfer a liability in an orderly transaction between market participants at the measurement date.
| | |
RENT THE RUNWAY, INC. Notes to Consolidated Financial Statements |
(Dollars in millions, except share and per share amounts)
Assets and liabilities recorded at fair value in the consolidated financial statements are categorized based upon the level of judgment associated with the inputs used to measure their fair value. Hierarchical levels, which are directly related to the amount of subjectivity, associated with the inputs to the valuation of these assets or liabilities, are as follows:
Level 1: Observable inputs, such as quoted prices in active markets for identical assets and liabilities.
Level 2: Inputs other than the quoted prices in active markets that are observable either directly or indirectly.
Level 3: Unobservable inputs, in which there is little or no market data which require the Company to develop its own assumptions.
Observable inputs are based on market data obtained from independent sources. Unobservable inputs reflect the Company’s assessment of the assumptions market participants would use to value certain financial instruments. This hierarchy requires the Company to use observable market data, when available, and to minimize the use of unobservable inputs when determining fair value. The categorization of financial instruments within the valuation hierarchy is based upon the lowest level of input that is significant to the fair value measurement.
The carrying amounts of financial instruments, including cash, cash equivalents and restricted cash approximate fair value as of January 31, 2022 and 2021, due to the relatively short duration of these instruments. The carrying value of the Company’s long-term debt instruments approximate their fair values as of January 31, 2022 and 2021.
Cash, Cash Equivalents and Restricted Cash
The Company considers all highly liquid investments with a maturity of three months or less when purchased to be cash equivalents. Cash and cash equivalents include funds in transit from banks for customer credit card transactions that settle in less than seven days. These funds totaled $3.5$3.3 million and $1.8$3.4 million as of January 31, 20222024 and 2021,2023, respectively.
As of January 31, 20222024 and 2021,2023, the Company had $12.0$10.0 million and $13.9$9.1 million, respectively, of current and noncurrent restricted cash that consisted primarily of letters of credit pledged as security deposits for the headquarters and operational facilities leases.leases and letters of credit for rental product purchases and credit card transactions.
Rental Product, Net
The Company considers rental product to be a long-term productive asset and, as such, classifies it as a noncurrent asset on the consolidated balance sheets.
| | |
RENT THE RUNWAY, INC.
Notes to Consolidated Financial Statements
|
(Dollars in millions, except share and per share amounts)
Consolidated Balance Sheets.Rental product is stated at cost, less accumulated depreciation. The Company depreciates rental product, less an estimated salvage value, over the estimated useful lives of the assets using the straight-line method. The useful life is determined based on historical trends and an assessment of any future changes. The salvage value considers the historical trends and projected liquidation proceeds for the assets. The estimated useful lives and salvage values are described below:
| | | | | | | | | | | |
| | Useful Life | | Salvage Value |
| Apparel | 3 years | | 20 | % |
| Accessories | 2 years | | 30 | % |
In accordance with its policy, the Company reviews the estimated useful lives and salvage values of rental product on an ongoing basis.
| | |
RENT THE RUNWAY, INC. Notes to Consolidated Financial Statements |
(Dollars in millions, except share and per share amounts)
The Company offers its customers an opportunity to purchase items in rentable condition prior to the end of their estimated useful life. In such instances, the Company considers the disposal of such rental product to be a sale and, as such, records the proceeds as other revenue and the net book value of the items at the time of sale as rental product depreciation in the consolidated statements of operations. The Company records write-offs for the remaining net book value of rental product sold on the consolidated statements of operations within rentalRental product depreciation and revenue share. Write-offs for losses on lost, damaged, and unreturned apparel and accessories are also recorded within rentalRental product depreciation and revenue share.
Once it is no longer considered rentable, rental product in a sellable condition is classified as held for sale and written down to salvage value. The value of rental product held for sale as of January 31, 20222024 and 20212023 was $2.1$3.0 million and $6.4$3.0 million, respectively. The accelerated depreciation related to rental product held for sale was $3.9$4.9 million $7.7, $6.9 million and $14.8$3.9 million for the years ended January 31, 2022, 2021,2024, 2023, and 2020,2022, respectively. The accelerated depreciation is presented on the consolidated statements of operations within rentalRental product depreciation and revenue share.
When rental product is liquidated, the Company records the gain or loss calculated as proceeds, net of the remaining salvage value and costs to sell, within general and administrative expenses on the consolidated statement of operations. The gain or loss from the liquidation of rental product is included as an adjustment to reconcile net loss to net cash used by operating activities in the consolidated statements of cash flows.
The purchases of rental product as well as the proceeds from the sale and liquidation of rental product are classified as cash flows from investing activities on the consolidated statements of cash flows because the predominant activity of the rental product purchased is to generate subscriptionrental revenue and a-la-carte rental revenue,such classification is consistent with otherthe classification of long-term asset activity.activity. Proceeds from the liquidation of rental product, net of costs to sell, were $5.7$4.6 million, $2.4$8.8 million and $3.6$5.7 million for the years ended January 31, 20222024, 20212023 and 2020,2022, respectively. Proceeds from the sale of rental product were $12.9$23.3 million, $17.9 million and $19.3$12.9 million for the years ended January 31, 20222024, 2021,2023, and 20202022, respectively.
The Company mitigates residual value risk of its rental product primarily by utilizing specific cleaning, repair and restoration methods relying on its years of process know-how to maintain the condition of the rental product over its useful life, and by employing various in-house and third-party liquidation strategies to maximize liquidation value and overall return on rental product. The Company also utilizes its own-developed technology in combination with its customer service department to recover rental items from delinquent customers.
| | |
RENT THE RUNWAY, INC.
Notes to Consolidated Financial Statements
|
(Dollars in millions, except share and per share amounts)
Revenue Recognition
Subscription and a-la-carte rental fees (“Subscription and Reserve rental revenue”) are recognized in accordance with Accounting Standard Update (“ASU”) 2016-02, Leases, Topic 842 (“ASC 842”). Other revenue, primarily related to the sale of rental product, is recognized under ASU 2014-09, Revenue from Contracts with Customers, Topic 606 (“ASC 606”) at the date of delivery of the product to the customer. Other revenue represented 9%11%, 14%9%, and 8%9% of total revenue for the years ended January 31, 2022,2024, 20212023 and 2020,2022, respectively.
Revenue is presented net of promotional discounts, customer credits and refunds. Promotional discounts are recognized in accordance with either ASC 842 or ASC 606, based on the guidance applied to the rental fees or product sales to which the promotional discounts are related. Revenue is presented net of taxes that are collected from customers and remitted to governmental authorities.
| | |
RENT THE RUNWAY, INC. Notes to Consolidated Financial Statements |
(Dollars in millions, except share and per share amounts)
The Company recognizes a liability at the time a customer credit or a gift card is issued, and revenue is recognized upon redemption of the credit or gift card. The Company’s customer credit liability is presented on the consolidated balance sheets.Consolidated Balance Sheets. During the year ended January 31, 2022, $1.92024, $1.5 million of credits included in the customer credit liability as of January 31, 20212023 were redeemed. Customer credits and gift cards do not have expiration dates. Over time, a portion of these instruments is not redeemed. The Company recognizes breakage income related to these instruments based on the redemption pattern method. The Company continues to maintain the full liability for the unredeemed portion of the credits and gift cards when the Company has any legal obligation to remit such credits to government authorities in relevant jurisdictions. The Company has not issued any new gift cards during the years ended January 31, 2024, 2023, and 2022.
Subscription and Reserve Rental Revenue
Subscription fees are recognized ratably over the subscription period, commencing on the date the subscriber enrolls in the rental program. The fees are collected upon enrollment. The subscription automatically renews on a monthly basis until cancelled or paused by the customer. Subscribers can pause or cancel their subscriptions at any time.
The Company recognizes fees for a-la-carte rentals ratably over the rental period, which starts with the date of delivery of rental product to the customer. A-la-carte rental orders can be placed up to fourtwo months prior to the rental start date (formerly four months prior to October 2023) and the customer’s payment form is charged upon order confirmation. The Company defers recognizing the fees and any related promotions for a-la-carte rentals until the date of delivery, and then recognizes those fees ratably over the four- or eight-day rental period.
The Company accrues for credits and refunds issued subsequent to the balance sheet date that relate to rentals prior to the balance sheet date. These amounts were not material as of January 31, 20222024 and 20212023.
For lessors, ASC 842 provides a practical expedient to elect not to evaluate whether certain sales taxes and other similar taxes imposed by a governmental authority on a specific lease revenue-producing transaction are the primary obligation of the lessor as owner of the underlying leased asset. This practical expedient was applied by the Company and it excludes these taxes from the measurement of lease revenue and the associated expense.
| | |
RENT THE RUNWAY, INC.
Notes to Consolidated Financial Statements
|
(Dollars in millions, except share and per share amounts)
Other Revenue
Other revenue consists primarily of revenue from the sale of rental product. The Company recognizes revenue from the sale of rental product in accordance with ASC 606. Sale of rental product occurs when a customer purchases rental product at a discounted price, calculated as a percentage of retail value. Payment is due upon order confirmation and there is no financing component. The single performance obligation associated with rental product sales is generally satisfied upon delivery of the rental product to the customer. The Company does not have any material contractual receivables, assets or liabilities with respect to other revenue as of January 31, 20222024 and 20212023.
From time to time, other revenue may include revenue generated from pilots and other growth initiatives which may cause quarterly fluctuations in the Other revenue line.
Lease -– Lessee Accounting
The Company adopted ASC 842 with an effective date of February 1, 2019 for both lessee and lessor accounting. Refer to the Subscription and Reserve Rental Revenue section above for the Company’s accounting policy related to lessor accounting.
| | |
RENT THE RUNWAY, INC. Notes to Consolidated Financial Statements |
(Dollars in millions, except share and per share amounts)
The Company determines whether a contract is or contains a lease at contract inception. Right-of-use (“ROU”) assets and lease liabilities are measured and recognized at the lease commencement date based on the present value of lease payments over the expected lease term. As most of the Company’s leases do not provide an implicit rate, the Company uses its IBR as of the effective date or the commencement date of the lease, whichever is later, to determine the present value of lease payments. The Company considers its credit risk, term of the lease, total lease payments and adjusts for the impacts of collateral, as necessary, when calculating its IBR.
Lease payments are based on fixed amounts explicit in the lease agreements. Certain real estate leases include payments at variable amounts based on operating expenses of the lessor, such as common area charges, real estate taxes and insurance. Most equipment leases include variable sales tax payments based on state sales tax rates. Additionally, the Company procures a portion of its rental product from brand partners under revenue share arrangements, which are considered variable lease payments. See Note 4 -5 – Leases – Lessee Accounting for additional details.
For lessees, the guidance provides a practical expedient, by class of underlying asset, to elect a combined single lease component presentation. This practical expedient was applied by the Company as a lessee to all asset classes.
With respect to ROU assets, operating lease ROU assets are presented as a separate line item on the Company’s consolidated balance sheets,Consolidated Balance Sheets, while finance lease ROU assets are included in fixedFixed assets, net on the consolidated balance sheets.Consolidated Balance Sheets. With respect to lease liabilities, operating lease liabilities are presented as separate line items, while finance lease liabilities are included in Accrued expenses and other current liabilities and other long-termOther liabilities on the consolidated balance sheets,Consolidated Balance Sheets, based on the remaining term of the underlying lease agreements. The Company does not recognize ROU assets or lease liabilities for short-term leases (i.e., those with a term of twelve months or less) and recognizes the related lease expense on a straight-line basis over the lease term, as applicable.
Fixed and Intangible Assets, Net
Fixed and intangible assets are stated at cost less accumulated depreciation and amortization.
Depreciation and amortization of fixed and intangible assets isare calculated on a straight-line basis over the estimated useful lives of the assets.
| | |
RENT THE RUNWAY, INC.
Notes to Consolidated Financial Statements
|
(Dollars in millions, except share and per share amounts)
The estimated useful lives of fixed and intangible assets are described below:
| | | | | |
| Leasehold improvements | Lesser of estimated useful life or lease term |
| Machinery and equipment | 5 to 6 years |
| Furniture and fixtures | 5 years |
| Computer hardware | 3 years |
| Reusable packaging | 1.5 years |
| Capitalized third-party software | 3 years |
| Capitalized internally developed software | 2 years |
The Company capitalizes third-party and internally developedinternally-developed software costs in connection with its proprietary systems and its enterprise resource planning system that are incurred during the application development stage. Costs related to preliminary project activities and post implementation operating activities are expensed as incurred.
| | |
RENT THE RUNWAY, INC. Notes to Consolidated Financial Statements |
(Dollars in millions, except share and per share amounts)
Prepaid Expenses and Other Current Assets
Prepaid expenses and other current assets consist primarily of accounts receivable, net, interest receivable, prepaid insurance, prepaid technology expenses and prepaid taxes.
Accounts receivable, net consists primarily of amounts due from third party liquidation and Exclusive Design wholesale partners that do not bear interest. The Company records an allowance for doubtful accounts taking into consideration historical losses adjusted for current market conditions, the financial condition of the customer, the amount of receivables in dispute, and the current receivables aging and payment patterns. Accounts receivable, net was $1.3 million and $4.0 million as of January 31, 2024 and 2023, respectively. The allowance for doubtful accounts was immaterial as of January 31, 2024 and 2023. As of January 31, 2023, one third-party partner represented the majority of the Company’s accounts receivable balance.
Other Assets
Other assets consist primarily of capitalized implementation costs incurred in cloud computing arrangements and deposits for periods that exceed one year from the balance sheet date.
Expenses
Fulfillment
Fulfillment expenses consist of fulfillment costs to receive, process and fulfill customer orders, including fulfillment labor payroll and related costs, third-party shipping expenses, cost of packaging materials, cleaning expenses, and other fulfillment related costs.
Technology
Technology expenses consist of technology payroll and related costs, professional services, and third-party software and license fees.
Marketing
Marketing expenses include online and mobile marketing, search engine optimization and email costs, marketing payroll and related expenses, agency fees, printed collateral, consumer research, and other related costs. Advertising costs amounted to $20.6$28.5 million, $4.2$30.7 million, and $18.1$20.6 million for the years ended January 31, 2022, 2021,2024, 2023, and 2020,2022, respectively. Costs associated with advertising campaigns are expensed when the advertising first appears in the media, and other advertising costs are expensed as incurred.
General and Administrative
General and administrative expenses are comprised of all other employee payroll and related expenses, including customer service costs, occupancy costs (including warehouse-related), professional services, credit card fees, general warehouse and corporate expenses, and other administrative costs.
| | |
RENT THE RUNWAY, INC.
Notes to Consolidated Financial Statements
|
(Dollars in millions, except share and per share amounts)
Rental Product Depreciation and Revenue Share
Rental product depreciation and revenue share expenses are comprised of depreciation and write-offs of rental product, and payments under revenue share arrangements with brand partners.
Other Depreciation and Amortization
Other depreciation and amortization expenses are comprised of depreciation and amortization amounts for fixed assets, intangible assets, and financing right-of-use assets.
| | |
RENT THE RUNWAY, INC. Notes to Consolidated Financial Statements |
(Dollars in millions, except share and per share amounts)
The classification of expenses varies across industries. Accordingly, the Company’s categories of expenses may not be comparable to those of other companies.
Share-Based Compensation
The Company recognizes all employee share-based compensation as an expense in the consolidated financial statements. Equity classified awards are measured at the grant date fair value of the award. The Company estimates grant date fair value of stock options using the Black-Scholes option pricing model. The fair value of stock options is recognized as compensation expense on a straight-line basis over the requisite service period of the award. Determining the fair value of options at the grant date requires judgment, including the expected term that stock options will be outstanding prior to exercise, the associated volatility, and the expected dividend yield. The fair value of common stock post-IPO is based on the closing price of the common stock on the date of grant as reported on the Nasdaq Stock Market.Nasdaq. Upon grant of awards, the Company also estimates an amount of forfeitures that will occur prior to vesting. There were no stock options granted during the years ended January 31, 2024 and 2023.
The Company has granted two types of RSUs. Prior to the effectiveness of the Company’s IPO, the Company granted RSUs which vest only upon satisfaction of both time-based service and liquidity-based conditions. The Company records share-based compensation expense for such RSUs on an accelerated attribution method over the requisite service period and only once the liquidity-based condition is satisfied. The liquidity-based vesting condition was satisfied upon the effectiveness of the Company’s IPO. Share-based compensation related to any remaining time-based service for these RSUs after the liquidity-based event is recorded over the remaining requisite service period. Post IPO, the Company has granted RSUs which vest upon satisfaction of a single time-based service condition.conditions. The Company records share-based compensation expense for these RSUs on a straight-line basis over the requisite service period. See Note 13 -14 – Share-based Compensation Plans for a description of the accounting for share-based awards.
Income Taxes
The Tax Cuts and Jobs Act (the “Tax Act”) was enacted on December 22, 2017 and introduced significant changes to U.S. income tax law. The Company implemented the effects of the Tax Act and its impact was not material to the consolidated financial statements.
Deferred tax assets and liabilities are recognized for the future tax consequences attributable to differences between the financial statement carrying amounts of existing assets and liabilities and their respective tax bases and operating loss and tax credit carryforwards. Deferred tax assets and liabilities are measured using enacted tax rates expected to apply to taxable income in the years in which those temporary differences are expected to be recovered or settled. The measurement of deferred tax assets is reduced, if necessary, by a valuation allowance for any tax benefits for which future realization is uncertain. The effect on deferred tax assets and liabilities of a change in tax rates is recognized in income in the period that includes the enactment date. The Company recognizes interest and penalties related to unrecognized tax benefits in income tax expense.
| | |
RENT THE RUNWAY, INC.
Notes to Consolidated Financial Statements
|
(Dollars in millions, except share and per share amounts)
The Company recognizes the effect of income tax positions only if those positions are more likely than not to be sustained. Recognized income tax positions are measured at the amount that is greater than 50% likely of being realized. Changes in recognition or measurement are reflected in the period in which the change in judgment occurs.
The Financial Accounting Standards Board (“FASB”) Staff Q&A Topic No. 5, Accounting for Global Intangible Low-Taxed Income (“GILTI”), states that an entity can make an accounting policy election to either recognize deferred taxes for temporary differences that are expected to reverse as GILTI in future years or provide for the tax expense related to GILTI resulting from those items in the year the tax is incurred. The Company has elected to recognize the resulting tax on GILTI as a period expense in the period the tax is incurred.
| | |
RENT THE RUNWAY, INC. Notes to Consolidated Financial Statements |
(Dollars in millions, except share and per share amounts)
Long-Lived Asset Impairment
Long-lived assets, such as rental product, fixed assets, intangible assets, and right-of-use lease assets, are reviewed for impairment triggers when events or changes in circumstances indicate the carrying value of such assets may not be recoverable. If circumstances require a long-lived asset or asset group be tested for possible impairment, the Company first compares the undiscounted cash flows expected to be generated by that asset or asset group to its carrying amount. If the carrying amount of the long-lived asset or asset group is not recoverable on an undiscounted cash flow basis, an impairment is recognized to the extent that the carrying amount exceeds its fair value. Fair value is determined using various valuation techniques including discounted cash flow models, quoted market values, and third-party independent appraisals, as necessary.
During the year ended January 31, 2024, the Company evaluated whether events or circumstances had changed such that it would indicate it is more likely than not that the carrying value of its long-lived assets may not be recoverable (triggering event). Given the Company’s stock price decline during the third quarter, the Company concluded a triggering event had occurred and performed an impairment analysis of its long-lived assets group (which constitutes the Company’s sole reporting unit) as of October 31, 2023. The Company performed a quantitative assessment using the undiscounted future cash flows expected to be generated by the use and eventual disposition of the Company’s long-lived assets group. The assessment included consideration of key factors including projected enterprise cash flows, market capitalization and the fair value of the Temasek debt. Based on the quantitative assessment, the undiscounted cash flows expected to be generated by the use and eventual disposition of the Company’s long-lived assets exceeded their carrying values. Therefore, no impairment was recognized as a result of this analysis for the year ended January 31, 2024.
In connection with the January 2024 restructuring plan as described in Note 4, Restructuring and Related Charges, the Company recorded asset impairment charges of $1.1 million during the year ended January 31, 2024 related to the discontinuation of a software implementation project.
In connection with the September 2022 restructuring plan as described in Note 4, Restructuring and Related Charges, the Company recorded asset impairment charges of $5.3 million during the year ended January 31, 2023. These asset impairment charges consisted of a $4.9 million write-off of fixed assets and a $0.4 million write-off of accrued expenses, both relating to the discontinuation of two warehouse operations projects. No impairment losses were recognized during the yearsyear ended January 31, 2022 2021 and 2020 except for the write-off of apparel and accessories in the normal course of business (see Rental Product disclosure).
Net Loss per Share Attributable to Common Stockholders
The Company computes net loss per share attributable to common stockholders under the two-class method required for multiple classes of common stock and participating securities. Basic net loss per share attributable to common stockholders is calculated by dividing the net loss attributable to common stockholders by the weighted-average number of shares of common stock outstanding during the period.
Diluted net loss per share attributable to common stockholders is computed by giving effect to all potentially dilutive securities outstanding for the period. For purposes of this calculation, redeemable preferred stock, stock options to purchase common stock, and warrants to purchase common stock, and redeemable preferred stockRSUs are considered potentially dilutive securities but have been excluded from the calculation of diluted net loss per share attributable to common stockholders as their effect is anti-dilutive.
The shares of common stock associated with the equity-classified common stock warrants with an exercise price of $0.01 were considered outstanding for the purposes of computing basic and diluted net loss per share attributable to common stockholders because the shares could be issued for little or no consideration, were fully vested, and were exercisable after the original issuance date.
| | |
RENT THE RUNWAY, INC. Notes to Consolidated Financial Statements |
(Dollars in millions, except share and per share amounts)
Refer to Note 15, Net Loss per Share Attributable to Common Stockholders, for information about the Company’s stock split, which became effective on April 2, 2024, and the corresponding impact on the net loss per share calculation for the years ended January 31, 2024, 2023 and 2022.
Commitments and Contingencies
Liabilities for loss contingencies arising from claims, assessments, litigation, and other sources are recorded when it is probable that a liability has been incurred and the amount can be reasonably estimated. Legal costs incurred in connection with loss contingencies are expensed as incurred.
Insurance Proceeds
During the yearsyear ended January 31, 2022, and 2021, the Company recorded insurance recoveries of $4.0 million and $5.0 million, respectively, related to a network issue during the year ended January 31, 2020.
| | |
RENT THE RUNWAY, INC.
Notes to Consolidated Financial Statements
|
(Dollars in millions, except share and per share amounts)
These amounts are The amount is recorded in other income / (expense), net in the consolidated statements of operations.
Foreign Currency
The functional currency of the Subsidiary is the U.S. dollar,Dollar, which is the functional currency of the Company. The local currency of the Subsidiary is Euro.the euro. Monetary assets and liabilities of the Subsidiary are remeasured at the rate of exchange in effect on the balance sheet date; income and expenses are remeasured at the average exchange rates throughout the year. The related remeasurement adjustments are included in general and administrative expenses in the consolidated statements of operations.
Recently Issued and Adopted Accounting Pronouncements
Recently Adopted Accounting Pronouncements
Internal-Use Software
In August 2018, the FASB issued ASU 2018-15, Intangibles – Goodwill and Other – Internal-Use Software (Subtopic 350-40): Customer’s Accounting for Implementation Costs Incurred in a Cloud Computing Arrangement that is a Service Contract. The ASU allows implementation costs incurred by customers in cloud computing arrangements to be deferred and recognized over the term of the arrangement. The ASU also requires amortization expense be recognized in the same line item as the related fees associated with the arrangement and related capitalized implementation costs be presented in the same line as the prepayment for the hosting fee. This standard is effective for annual reporting periods beginning after December 15, 2020, and interim periods within those years, and early adoption is permitted. The Company adopted this standard on February 1, 2021, and the adoption of this standard did not have a material impact on the consolidated financial statements.
Recently Issued Accounting Pronouncements
Debt - Debt with Conversion and Other Options and Derivatives and Hedging
In August 2020, the FASB issued ASU 2020-06, Debt—Debt with Conversion and Other Options (Subtopic 470-20) and Derivatives and Hedging—Contracts in Entity’s Own Equity (Subtopic 815-40): Accounting for Convertible Instruments and Contracts in an Entity’s Own Equity. The new guidance reduces complexity and improves comparability of financial reporting associated with accounting for convertible instruments and contracts in an entity’s own equity. This standard is effective for annual reporting periods beginning after December 15, 2023, and interim periods within those years, and early adoption is permitted. The Company is currently evaluating the impact this standard will have on its consolidated financial statements.
Income Taxes
In December 2019, the FASB issued ASU 2019-12, Income Taxes (Topic 740): Simplifying the Accounting for Income Taxes. The new guidance simplifies the accounting for income taxes by removing certain exceptions to the general principles in Topic 740 and also improves the consistency in application of other areas by clarifying and amending existing guidance. This standard is effective for annual reporting periods beginning after December 15, 2021, and interim periods within those years, and early adoption is permitted. Certain amendments of this standard may be adopted on a retrospective basis, modified retrospective basis or prospective basis. The adoption of this standard is not expected to have a material impact on the consolidated financial statements.
| | |
RENT THE RUNWAY, INC.
Notes to Consolidated Financial Statements
|
(Dollars in millions, except share and per share amounts)
Financial Instruments – Credit Losses
In June 2016, the FASB issued ASU 2016-13, Financial Instruments – Credit Losses (Topic 326): Measurement of Credit Losses on Financial Instruments, which requires an entity to utilize a new impairment model known as the current expected credit loss (“CECL”) model to estimate its lifetime “expected credit loss” and record an allowance that, when deducted from the amortized cost basis of the financial asset, presents the net amount expected to be collected on the financial asset. The CECL model is expected to result in more timely recognition of credit losses. This guidance also requires new disclosures for financial assets measured at amortized cost, loans, and available-for-sale debt securities. This standard is effective for annual reporting periods beginning after December 15, 2022, and interim periods within those years, and early adoption is permitted. The Company adopted this standard on February 1, 2023, and the adoption of this standard did not have a material impact on the consolidated financial statements.
Recently Issued Accounting Pronouncements
Income Taxes (Topic 740): Improvements to Income Tax Disclosures
| | |
RENT THE RUNWAY, INC. Notes to Consolidated Financial Statements |
(Dollars in millions, except share and per share amounts)
In December 2023, the FASB issued ASU 2023-09, Income Taxes (Topic 740): Improvements to Income Tax Disclosures. The amendments primarily require enhanced disclosures and disaggregation of income tax information by jurisdiction in the annual income tax rate reconciliation and quantitative and qualitative disclosures regarding income taxes paid. These amendments are to be applied prospectively, with the option to apply the standard retrospectively, for annual periods beginning after December 15, 2025. Early adoption is permitted. The Company is currently evaluating the impact that the adoption of this standard will have on itsthe consolidated financial statements.
Segment Reporting (Topic 280): Improvements to Reportable Segment Disclosures
In November 2023, the FASB issued ASU 2023-07, Segment Reporting (Topic 280): Improvements to Reportable Segment Disclosures, to improve reportable segment disclosure requirements primarily through enhanced disclosures about significant segment expenses. This standard is effective for fiscal years beginning after December 15, 2023, and interim periods in fiscal years beginning after December 15, 2024. The ASU must be applied retrospectively for all periods presented in the financial statements. Early adoption is permitted. The Company is currently evaluating the impact that the adoption of this standard will have on the consolidated financial statements.
Debt – Debt with Conversion and Other Options and Derivatives and Hedging
In August 2020, the FASB issued ASU 2020-06, Debt—Debt with Conversion and Other Options (Subtopic 470-20) and Derivatives and Hedging—Contracts in Entity’s Own Equity (Subtopic 815-40): Accounting for Convertible Instruments and Contracts in an Entity’s Own Equity. The new guidance reduces complexity and improves comparability of financial reporting associated with accounting for convertible instruments and contracts in an entity’s own equity. This standard is effective for annual reporting periods beginning after December 15, 2023, and interim periods within those years, and early adoption is permitted. The adoption of this standard is not expected to have a material impact on the consolidated financial statements.
3.Liquidity and Impact of COVID-19 Pandemic
The Company has incurred a net losslosses from operations since inception and has historically relied upon debt and equity financing to fund its operations. In addition, the COVID-19 pandemicThe Company has hadexperienced year-over-year revenue growth and a significant adverse impact on the Company’s business. Asreduction in net losses in fiscal years 2023 and 2022 and is making progress towards achieving a result, the Company experienced a significant declinebreak-even position after consideration of cash flows from operations less cash flows used in Active Subscribers, subscription revenue and a-la-carte rental revenue. While the Company experienced active subscriber and revenue growthinvesting during the year endedending January 31, 2022,2025 as a result of the restructuring actions described below and the Company’s plans to reduce rental product spend due to rental product depth adjustments in fiscal year 2023 and other investments to align with the overall growth of the business and to comply with the Company’s recently amended debt covenants. To the extent that the strength or pace of the Company’s COVID-19 recovery lags from what is currently anticipated or is not sustained, the Company is impacted by macroeconomic trends, or other factors, including, but not limited to, demand for our business, the Company plans to further reduce fixed and variable costs accordingly and has established plans to preserve existing cash liquidity, which could include reducingincludes additional reductions to labor, operating expenses, and/or capital expenditures.
The Company has a history of successfully implementing restructuring plans. The September 2022 restructuring plan generated annual operating expense savings of approximately $27 million (relative to the second quarter of fiscal year 2022 run rate). In October 2021,January 2024, the Company completed its IPO and issued 17,000,000 sharesannounced an additional restructuring plan expected to generate total annual operating expense savings of its Class A common stock at $21.00 per share. The Company received proceeds of $327.3approximately $12 million, which are netprimarily includes the reduction in force, with some open role closures/reduced backfills, and excludes potential hiring of new employees or other additions to the Company’s costs and expenses. Actual savings may differ from these estimates. Refer to Note 4, Restructuring and Related Charges, for discussion of the underwriting discountsrestructuring plans.
| | |
RENT THE RUNWAY, INC. Notes to Consolidated Financial Statements |
(Dollars in millions, except share and per share amounts)
On December 1, 2023, the Company entered into a Tenth Amendment to Credit Agreement with Double Helix Pte Ltd. as administrative agent for Temasek Holdings (the “Credit Facility Amendment”) to the 2022 Amended Temasek Facility (as amended by the 2023 Amendment, the “2023 Amended Temasek Facility”). The 2023 Amended Temasek Facility, among other things, modifies the Company’s obligations under the 2022 Amended Temasek Facility (as defined herein) to (i) eliminate all interest (both payment-in-kind and cash interest) for a period of six full fiscal quarters beginning with the fourth quarter of fiscal year 2023; (ii) reduce the minimum liquidity maintenance covenant under the 2023 Amended Temasek Facility from $50 million to $30 million; and direct offering costs(iii) provide that the Company may not exceed mutually agreed upon quarterly and annual spend levels for rental product capital expenditures, fixed operating expenditures and marketing expenditures during fiscal year 2024 of $5.6 million.$51 million, $100 million (excluding $10 million of specified permitted expenditures), and $30 million, respectively, on an annual basis and to-be-agreed levels for fiscal years 2025 and 2026, subject to the debt holder’s consent and certain exceptions as defined in the agreement.
As of January 31, 2022,2024, the Company held cash and cash equivalents of $247.6 million.$84.0 million and long-term debt of $306.7 million with a maturity date of October 2026. In the event that the Company fails to comply with the covenants specified in the 2023 Amended Temasek Facility, the lender has the right to declare all borrowings outstanding, together with accrued and unpaid interest and fees, to be immediately due and payable. The Company believes that it will have sufficient liquidity from cash on-hand and future operations to sustain its business operations, to satisfy its debt service obligationsthe $30 million minimum liquidity maintenance covenant and to comply with its amended debtthe maximum expenditure covenants under the 2023 Amended Temasek Facility for at least the next twelve months from the date these financial statements are available to be issued.
4.Restructuring and Related Charges
January 2024 Restructuring Plan
On January 9, 2024, the Company announced a restructuring plan to focus its workforce and cost structure on key growth opportunities and support its profitability goals. The plan included a reduction in workforce of approximately 10% of its corporate employees (primarily a reduction in force, with some open role closures/reduced backfills, and excludes potential hiring of new employees or other additions to the Company’s costs and expenses).
Restructuring charges of $2.0 million for severance and related costs were recognized during the year ended January 31, 2024 and are reflected in Restructuring charges on the Company’s Consolidated Statements of Operations. Accrued restructuring charges were $0.7 million as of January 31, 2024.
The Company recorded asset impairment charges of $1.1 million during the year ended January 31, 2024 related to the discontinuation of a software implementation project in connection with the January 2024 restructuring plan. The charge is reflected in Loss on asset impairment related to restructuring on the Company’s Consolidated Statements of Operations. The Company may incur additional restructuring charges in the future.
September 2022 Restructuring Plan
On September 12, 2022, the Company announced a restructuring plan to reduce costs, streamline its organizational structure and drive operational efficiencies. The plan primarily included total workforce reductions of approximately 24% of corporate employees (primarily a reduction in force, with some open role closures/reduced backfills), reorganizing certain functions and reallocating resources to continue to focus on customer experience and growth initiatives.
Restructuring charges of $2.4 million for severance and related costs were recognized during the year ended January 31, 2023 and are reflected in Restructuring charges on the Company’s Consolidated Statements of Operations. Accrued restructuring charges as of January 31, 2023 were immaterial.
| | |
RENT THE RUNWAY, INC. Notes to Consolidated Financial Statements |
(Dollars in millions, except share and per share amounts)
The Company recorded asset impairment charges of $5.3 million, which consisted of a $4.9 million write-off of fixed assets and a $0.4 million write-off of accrued expenses, during the year ended January 31, 2023, both related to the discontinuation of two warehouse operations projects in connection with the September 2022 restructuring plan. The charge is reflected in Loss on asset impairment related to restructuring on the Company’s Consolidated Statements of Operations.
5.Leases - Lessee Accounting
As a lessee, the Company has operating real estate leases for its operational facilities, retail locations and corporate headquarters. The Company has operating and finance leases for its computers and equipment. Additionally, the Company procures a portion of its rental product from brand partners under revenue share arrangements, which are considered operating leases. All revenue share payments are recognized as variable lease costs and recorded in rentalRental product depreciation and revenue share in the consolidated statementsConsolidated Statements of operations.Operations.
The Company’s real estate and equipment lease terms generally range from 2less than one year to 1214 years and certain agreements include renewal options. To the extent that the Company is reasonably certain to exercise a lease renewal option, the assumption is included in the calculation of ROU assets and lease liabilities.
During the year ended January 31, 2023, the Company amended the operating lease for its corporate headquarters in Brooklyn, NY, the terms of which terminated one floor of the leased space. The partial lease termination of the corporate headquarters leased space resulted in a reduction of $10.6 million in the Company’s future minimum fixed lease obligations as of the lease modification date. The Company treated the partial lease termination amendment as a lease modification as of the effective date which resulted in an adjustment of $3.7 million and $1.4 million to the related lease liabilities and right-of-use assets, respectively. The Company recorded a gain on the partial termination of $1.8 million and a loss on surrender of the related fixed assets, primarily leasehold improvements, of $1.9 million, both of which are recorded on the Consolidated Statements of Operations within General and administrative expenses.
During the year ended January 31, 2021, 2024, the Company signed an amendment to extendamended the operating lease for its fulfillment center at 100 Metro Way in Secaucus, NJ, the terms of which extended the lease term of its operational facilities in Secaucus, New Jersey, whichfor an additional five years to August 31, 2029. The lease modification resulted in an adjustmentadjustment of $5.1$9.9 million to the related ROU assets and lease liabilities as a result ofand right-of-use assets. The Company did not exercise its renewal option with respect to its lease modification accounting. No other renewal options were includedfor 55 Metro Way in the ROU assets and lease liabilitiesSecaucus, NJ, which is anticipated to expire in accordance with its terms on the consolidated balance sheets asAugust 31, 2024.
As of January 31, 20222024 and 2021.2023, the weighted-average remaining lease term for operating leases was 7.50 years and 8.38 years, respectively, and the weighted-average discount rate was 16.12% and 16.26%, respectively. As of January 31, 2024 and 2023, the weighted-average remaining lease term for financing leases was 4.73 years and 2.18 years, respectively, and weighted-average discount rate was 16.44% and 16.41%, respectively.
| | |
RENT THE RUNWAY, INC. Notes to Consolidated Financial Statements |
(Dollars in millions, except share and per share amounts)
During the year ended January 31, 2021, the Company decided it would no longer fully utilize the space within three of its real estate leases and obtained subleases for those leased facilities. The subleases do not relieve the Company of its primary lease obligations. The sublessor agreements are considered operating leases, maintaining the historical classification of the underlying lease. The Company does not recognize any underlying assets for the subleases as a lessor of operating lease. The net amount received from the subleases is recorded within general and administrative expenses.
As of January 31, 2022 and 2021, the weighted-average remaining lease term for operating leases was 8.93 years and 9.43 years, respectively, and the weighted-average discount rate was 16.82% and 16.77%, respectively. As of January 31, 2022 and 2021, the weighted-average remaining lease term for financing leases was 2.25 years and 2.41 years, respectively, and weighted-average discount rate was 11.77% and 14.24%, respectively.
The following table summarizes the components of lease costs incurred by the Company during the years ended January 31, 2022, 20212024, 2023 and 20202022:
| | January 31, |
| 2022 | | 2021 | | 2020 |
| January 31, | | | January 31, |
| 2024 | | | 2024 | | 2023 | | 2022 |
| Operating lease costs | Operating lease costs | $ | 12.9 | | | $ | 13.1 | | | $ | 11.7 | |
| Short-term lease costs | Short-term lease costs | 0.1 | | | 2.4 | | | 0.9 | |
| Total fixed lease costs | Total fixed lease costs | 13.0 | | | 15.5 | | | 12.6 | |
| Variable lease costs | Variable lease costs | 22.7 | | | 19.8 | | | 11.9 | |
| Total lease costs | Total lease costs | 35.7 | | | 35.3 | | | 24.5 | |
| Sublease income | Sublease income | (4.0) | | | (1.8) | | | — | |
| Total lease costs, net | Total lease costs, net | $ | 31.7 | | | $ | 33.5 | | | $ | 24.5 | |
The following table summarizes the Company’s minimum fixed lease obligations under existing agreements as a lessee, excluding variable payments and short-term lease payments, as of January 31, 2022:2024:
| | | | | | | | | | | |
| Operating | | Financing |
| Fiscal year: | | | |
| 2022 | $ | 13.6 | | | $ | 0.4 | |
| 2023 | 11.6 | | 0.3 |
| 2024 | 10.4 | | 0.1 |
| 2025 | 9.1 | | 0.0 |
| 2026 | 9.1 | | 0.0 |
| Thereafter | 48.7 | | 0.0 |
| Total minimum lease payments | 102.5 | | 0.8 |
| Imputed interest | (50.5) | | (0.1) |
| Lease liabilities as of January 31, 2022 | $ | 52.0 | | | $ | 0.7 | |
See Note 16 - Subsequent Events which describes a reduction of $10.6 million in the Company’s minimum fixed lease obligations subsequent to the Company’s fiscal year-end. | | | | | | | | | | | |
| Operating | | Financing |
| Fiscal year: | | | |
| 2024 | $ | 10.8 | | | $ | 0.6 | |
| 2025 | 11.3 | | | 0.3 | |
| 2026 | 11.3 | | | 0.1 | |
| 2027 | 11.2 | | | 0.1 |
| 2028 | 11.3 | | | 0.1 |
| Thereafter | 28.8 | | | 0.3 |
| Total minimum lease payments | 84.7 | | | 1.5 | |
| Imputed interest | (36.0) | | | (0.5) | |
| Lease liabilities as of January 31, 2024 | $ | 48.7 | | | $ | 1.0 | |
| | |
RENT THE RUNWAY, INC.
Notes to Consolidated Financial Statements
|
(Dollars in millions, except share and per share amounts)
5.Rental Product, Net
Rental product consisted of the following:
| | | | | | | | | | | |
| January 31, | | January 31, |
| 2022 | | 2021 |
| | | |
| Apparel | $ | 164.4 | | | $ | 183.8 | |
| Accessories | 6.8 | | | 8.9 | |
| 171.2 | | | 192.7 | |
| Less accumulated depreciation | (94.9) | | | (95.1) | |
| Rental product, net | $ | 76.3 | | | $ | 97.6 | |
Depreciation and write-offs related to rental product, including write-offs of rental products sold, was $50.3 million, $69.9 million, and $75.7 million for the years ended January 31, 2022, 2021, and 2020, respectively.
| | |
RENT THE RUNWAY, INC. Notes to Consolidated Financial Statements |
(Dollars in millions, except share and per share amounts)
6.Fixed and Intangible Assets,Rental Product, Net
Fixed and intangible assetsRental product, net consisted of the following:
| | | | | | | | | | | |
| January 31, | | January 31, |
| 2022 | | 2021 |
| Leasehold improvements | $ | 55.4 | | | $ | 55.0 | |
| Machinery and equipment | 48.3 | | | 44.5 | |
| Reusable packaging | 6.0 | | | 5.6 | |
| Computer hardware | 5.1 | | | 5.9 | |
| Furniture and fixtures | 4.3 | | | 4.5 | |
| Financing lease ROU assets | 1.4 | | | 0.7 | |
| 120.5 | | | 116.2 | |
| Less accumulated depreciation | (63.3) | | | (51.5) | |
| Fixed assets, net | $ | 57.2 | | | $ | 64.7 | |
| | | |
| Software assets | $ | 23.2 | | | $ | 20.2 | |
| Less accumulated amortization | (16.8) | | | (12.4) | |
| Intangible assets, net | $ | 6.4 | | | $ | 7.8 | |
| | | | | | | | | | | |
| January 31, | | January 31, |
| 2024 | | 2023 |
| | | |
| Apparel | $ | 165.3 | | | $ | 156.7 | |
| Accessories | 6.6 | | | 5.9 | |
| 171.9 | | | 162.6 | |
| Less accumulated depreciation | (77.9) | | | (83.9) | |
| Rental product, net | $ | 94.0 | | | $ | 78.7 | |
Depreciation and write-offs related to fixed assetsrental product, including write-offs of rental products sold, was $14.8$57.1 million $18.4, $52.9 million, and $16.5$50.3 million for the years ended January 31, 2024, 2023, and 2022, 2021, and respectively.2020, respectively. Amortization of intangible assets was $4.7 million, $5.7 million, and $5.1 million for the years ended January 31, 2022, 2021, and 2020, respectively. See Note 4 — Leases – Lessee Accounting for further details related to the finance lease ROU assets included in fixed assets on the consolidated balance sheets.
As of January 31, 2022, expected amortization of intangible assets (excluding software projects not yet deployed) is as follows:
| | | | | |
| |
| Fiscal year: | |
| 2022 | $ | 3.3 | |
| 2023 | 1.2 | |
| 2024 | 0.2 | |
| Thereafter | — | |
| Total future amortization | $ | 4.7 | |
| | |
RENT THE RUNWAY, INC. Notes to Consolidated Financial Statements |
(Dollars in millions, except share and per share amounts)
7.Fixed and Intangible Assets, Net
Fixed and intangible assets, net consisted of the following:
| | | | | | | | | | | |
| January 31, | | January 31, |
| 2024 | | 2023 |
| Leasehold improvements | $ | 54.5 | | | $ | 53.8 | |
| Machinery and equipment | 46.8 | | | 45.9 | |
| Reusable packaging | 2.9 | | | 3.5 | |
| Computer hardware | 4.5 | | | 4.5 | |
| Furniture and fixtures | 4.0 | | | 3.9 | |
| Financing lease ROU assets | 2.6 | | | 2.2 | |
| 115.3 | | | 113.8 | |
| Less accumulated depreciation | (79.6) | | | (69.1) | |
| Fixed assets, net | $ | 35.7 | | | $ | 44.7 | |
| | | |
| Software assets | $ | 22.3 | | | $ | 20.9 | |
| Less accumulated amortization | (18.9) | | | (16.8) | |
| Intangible assets, net | $ | 3.4 | | | $ | 4.1 | |
Depreciation related to fixed assets was $12.0 million, $12.7 million, and $14.8 million for the years ended January 31, 2024, 2023, and 2022, respectively. Amortization of intangible assets was $2.7 million, $3.7 million, and $4.7 million for the years ended January 31, 2024, 2023, and 2022, respectively. See Note 5 — Leases – Lessee Accounting for further details related to the finance lease ROU assets included in Fixed assets, net on the Consolidated Balance Sheets.
As of January 31, 2024, expected amortization of intangible assets (excluding software projects not yet deployed) is as follows:
| | | | | |
| |
| Fiscal year: | |
| 2024 | $ | 1.7 | |
| 2025 | 0.5 | |
| 2026 | — | |
| Thereafter | — | |
| Total future amortization | $ | 2.2 | |
| | |
RENT THE RUNWAY, INC. Notes to Consolidated Financial Statements |
(Dollars in millions, except share and per share amounts)
8.Long-Term Debt
Summary
The following table summarizes the Company’s line of credit and long-term debt outstanding as of January 31, 20222024 and 20212023:
| | | | | | | | | | | |
| January 31, | | January 31, |
| 2022 | | 2021 |
| Bank of America Line of Credit | $ | — | | | $ | — | |
| Temasek Facility principal outstanding | 271.6 | | | 230.0 | |
| Add: payment-in-kind interest | 3.5 | | | 62.2 | |
| Less: unamortized debt discount | (14.3) | | | (1.9) | |
| Temasek Facility, net | 260.8 | | | 290.3 | |
| | | |
| Ares Facility principal outstanding | — | | | 75.0 | |
| Add: payment-in-kind interest | — | | | 1.6 | |
| Less: unamortized debt discount | — | | | (10.9) | |
| Ares Facility, net | — | | | 65.7 | |
| Total net carrying value | 260.8 | | | 356.0 | |
| Less: current portion of long-term debt | — | | | (0.9) | |
| Total noncurrent line of credit and long-term debt | $ | 260.8 | | | $ | 355.1 | |
Bank of America Line of Credit
In April 2019, the Company entered into a Credit Agreement with Bank of America and an asset-backed revolving credit facility (the “Line of Credit”) was put in place with Bank of America as agent and a lender, and Barclays Bank PLC and Goldman Sachs Bank USA as additional lenders. The Line of Credit provided for revolving advances up to an aggregate amount of $100.0 million, with an incremental uncommitted accordion of $50.0 million.
The Line of Credit contained various events of default, the occurrence of which could have resulted in termination of the lenders’ commitments to lend and the acceleration of all obligations under the Line of Credit. In October 2020, the Company entered into a new secured term loan senior credit agreement with Ares Corporate Opportunities Fund V, L.P. (the “Ares Facility” described below) and repaid all outstanding principal on the Line of Credit, and terminated the credit commitments. During the year ended January 31, 2021, the Company recognized a $0.6 million loss on debt extinguishment related to this transaction. | | | | | | | | | | | |
| January 31, | | January 31, |
| 2024 | | 2023 |
| Temasek Facility principal outstanding | $ | 271.6 | | | $ | 271.6 | |
| Add: payment-in-kind interest | 40.3 | | | 17.8 | |
| Less: unamortized debt discount | (5.2) | | | (16.9) | |
| Temasek Facility, net | 306.7 | | | 272.5 | |
| Less: current portion of long-term debt | — | | | — | |
| Total noncurrent long-term debt | $ | 306.7 | | | $ | 272.5 | |
Temasek Facility
In July 2018, the Company entered into a subordinated, junior lien term loan agreement with Double Helix Pte Ltd. as administrative agent for Temasek Holdings (the “Temasek Facility”). The Company drew $100.0 million under the Temasek Facility at closing with the ability to draw an additional $100.0 million in multiple drawings at any time prior to July 23, 2020 (the “Initial Temasek Commitments”) based on meeting certain performance and financial tests at each draw.
In November 2019, the Company drew an additional $50.0 million of the Initial Temasek Commitments and amended the Temasek Facility to include an additional $30.0 million of committed availability (the “Subsequent Temasek Commitments”). In March 2020, the Company drew the remaining $50.0 million of the Initial Temasek Commitments and the $30.0 million of the Subsequent Temasek Commitments.
| | |
RENT THE RUNWAY, INC.
Notes to Consolidated Financial Statements
|
(Dollars in millions, except share and per share amounts)
Prior to the termination of the Ares Facility (defined below), the Temasek Facility was both lien-subordinated and payment-subordinated to the Ares Facility (described below) pursuant to a Subordination Agreement entered into in October 2020 that functionsfunctioned as both a secured lender intercreditor agreement and a subordination agreement (for payment subordination); the Ares Facility was senior debt, and the Temasek facility was subordinated debt with respect to the Ares Facility.
The Initial Temasek Commitments had an interest rate of 15% per annum that accrued as noncash interest. The Subsequent Temasek Commitments had a cash interest rate of 13% per annum, payable quarterly. The Temasek Facility required mandatory prepayment upon certain defined triggering events as well as optional prepayments, but such mandatory prepayments were not required to be made while the Ares Facility was outstanding.
In October 2021, the Company used proceeds from the IPO to pay down the Subsequent Temasek Commitments of $30.0 million outstanding principal and interest in full. Concurrently, the Company entered into an amendment to the Temasek Facility (the “Temasek“2021 Temasek Facility Amendment”). The Temasek Facility as amended by the 2021 Temasek Facility Amendment is referred to as the “Amended“2021 Amended Temasek Facility”. This transaction was accounted for as a debt modification. The terms of the 2021 Temasek Facility Amendment providesprovided for, among other things, (i) an extension of the maturity to October 2024, (ii) an outstanding principal under the 2021 Amended Temasek Facility of $271.6 million (with no additional debt proceeds having been funded and after giving effect to the repayment described below), and (iii) an amended interest rate of 12% with up to 5% payable in kind. On the effective date of the 2021 Temasek Facility Amendment, the Company paid down an additional $30.0 million of the outstanding principal of the 2021 Amended Temasek Facility, for a total of $60.0 million principal paydown on the Temasek Facility and 2021 Amended Temasek Facility.
The Amended Temasek Facility requires the Company to comply with specified nonfinancial covenants including, but not limited to, restrictions on the incurrence
| | |
RENT THE RUNWAY, INC. Notes to Consolidated Financial Statements |
(Dollars in millions, except share and acquisitions, modifications of certain agreements and its fiscal year, and granting of liens. Additionally, the Amended Temasek Facility includes a minimum liquidity maintenance covenant of $50.0 million and amends the call protection applicable to the loans outstanding thereunder including the ability to refinance at a lower penalty within 12 months from the date of the amendment. The Amended Temasek Facility contains various events of default, the occurrence of which could result in the acceleration of obligations under each respective facility.per share amounts)
In July 2018, in connection with the Initial Temasek Commitments, the Company recorded a debt discount of $11.7 million, of which $1.4 million related to closing fees paid and $10.3 million related to the allocation of proceeds to the warrants issued. See Note 12 — Stockholders’ Equity for the details of the warrants outstanding in relation to the Temasek Facility. These amounts were accreted to the principal amount of the Temasek Facility through the recognition of noncash interest expense. The
The effective interest rate for the Temasek Facility for the period from the date of issuance through the date of the 2021 Temasek Facility Amendment was 15.95%. The debt discount associated with the Initial Temasek Commitments was fully accreted when the Company entered into the 2021 Temasek Facility Amendment.
In October 2021, in connection with the 2021 Amended Temasek Facility, the Company recorded a debt discount of $15.3 million, of which $0.2 million related to lender fees, $5.3 million related to the allocation of proceeds to warrants issued in relation to the 2021 Amended Temasek Facility, $1.0 million related to the extension of the term of warrants issued in relation to the Temasek Facility, and $8.8 million related to fees incurred to amend the 2021 Amended Temasek Facility. These amounts are being accreted to the principal amount of the 2021 Amended Temasek Facility through the recognition of noncash interest expense.
In January 2023, the Company entered into an amendment to the 2021 Amended Temasek Facility (the “2022 Temasek Facility Amendment”). The 2021 Amended Temasek Facility as further amended by the 2022 Temasek Facility Amendment is referred to as the “2022 Amended Temasek Facility”. This transaction was accounted for as a debt modification. The terms of the amendment provided for, (i) an extension of the maturity to October 2026, (ii) a reduction of the cash portion of the interest rate to 2% per year through July 2024, increasing to 5% thereafter for the duration of the 2022 Amended Temasek Facility, and (iii) a 1% increase in the total interest rate in February 2024 from 12% to 13% and annual rate increases of 1% thereafter for the duration of the 2022 Amended Temasek Facility. In connection with the 2022 Temasek Facility Amendment, the Company granted a warrant to purchase up to 100,000 shares of the Company’s Class A common stock at an exercise price of $100.00 per share. The warrant will expire on January 31, 2030. The effective interest rate for the 2021 Amended Temasek Facility for the period from the date of issuance through the date of the 2022 Amended Temasek Facility was 14.29%. The effective interest rate for the 2022 Amended Temasek Facility as of January 31, 2023 was 15.15%.
In January 2023, in connection with the 2022 Amended Temasek Facility, the Company recorded a debt discount of $6.9 million related to the allocation of proceeds to warrants issued. These amounts are being accreted to the principal amount of the 2022 Amended Temasek Facility through the recognition of noncash interest expense.
In December 2023, the Company entered into an amendment to the 2022 Amended Temasek Facility (the “2023 Temasek Facility Amendment”). The 2022 Amended Temasek Facility as further amended by the 2023 Temasek Facility Amendment is referred to as the “2023 Amended Temasek Facility”. This transaction was 14.29%accounted for as a troubled debt restructuring. The terms of the amendment provide for, (i) elimination of all interest (both payment-in-kind and cash interest) for a period of six full fiscal quarters beginning with the fourth quarter of fiscal year 2023; (ii) reduction of the minimum liquidity maintenance covenant under the 2023 Amended Temasek Facility from $50 million to $30 million; and (iii) additional covenants requiring the Company to comply with mutually agreed upon quarterly and annual spend levels for rental product capital expenditures, fixed operating expenditures and marketing expenditures during fiscal year 2024 of $51 million, $100 million (excluding $10 million of specified permitted expenditures), and $30 million, respectively, on an annual basis and to-be-agreed levels for fiscal years 2025 and 2026, subject to the debt holders’ consent and certain exceptions. The Company did not record a gain in connection with the restructuring as the total undiscounted future cash payments specified in the 2023 Temasek Facility Amendment exceeded the carrying value of debt. The effective interest rate for the 2023 Amended Temasek Facility as of January 31, 2024 was 8.44%.
| | |
RENT THE RUNWAY, INC. Notes to Consolidated Financial Statements |
(Dollars in millions, except share and per share amounts)
Other than described above, the 2023 Amended Temasek Facility did not change the covenants under the 2022 Amended Temasek Facility, which require the Company to comply with specified nonfinancial covenants including, but not limited to, restrictions on the incurrence of debt, payment of dividends, investments, sale of assets, mergers and acquisitions, modifications of certain agreements and its fiscal year, and granting of liens. The 2023 Amended Temasek Facility also contains various events of default, including failure to comply with the minimum liquidity maintenance covenant and maximum expenditure thresholds, the occurrence of which could result in the acceleration of outstanding borrowings under the 2023 Amended Temasek Facility for the Company.
The Company determined that all of the embedded features of the Temasek Facility, 2021 Amended Temasek Facility, 2022 Amended Temasek Facility, and 2023 Amended Temasek Facility were clearly and closely related to the debt host and did not require bifurcation as a derivative liability, or the fair value of the feature was immaterial to the Company’s consolidated financial statements.
Ares Facility
In October 2020, the Company entered into the Ares Facility with Alter Domus (US) LLC as administrative agent for Ares Corporate Opportunities Fund V, L.P. (“Ares”). The Company received gross proceeds equal to $75.0 million (the “Ares Original Principal”). In conjunction with the incurrence of the Ares Facility, the Company received proceeds from Ares of $25.0 million for the issuance of 1,695,955 shares of Series G redeemable preferred stock. The total transaction resulted in the receipt of $100.0 million in exchange for the Ares Facility, Series G redeemable preferred stock and issuance of common stock warrants (the “Ares Financing Transaction”).
The Ares Facility had an interest rate of 8% per annum accrued as noncash interest. The Ares Facility required quarterly principal payments of 0.25% of the original principal amount. The remaining principal balance would have become due in 2023. The Ares Facility required an exit payment of $1.5 million which was to be paid once the Ares Facility matured or the Ares Original Principal was paid in full.
The Ares Facility was secured by a first priority lien over substantially all assets of the Company. The Ares Facility required the Company to comply with substantially the same specified nonfinancial covenants as the Temasek Facility, including but not limited to, restrictions on the incurrence of debt, making of investments, the payment of dividends, sale of assets, mergers and acquisitions, modifications of certain agreements and its fiscal year, and granting of liens. The Ares Facility also required the Company to meet specified financial covenants that are measured based on predefined consolidated EBITDA thresholds. The Ares Facility required mandatory prepayment upon defined triggering events as well as permitting optional prepayments and certain of the mandatory prepayment triggering items are subject to a prepayment premium. The Ares Facility contained various events of default, the occurrence of which could result in the acceleration of obligations under the Ares Facility.
The Company allocated the debt discount and debt issuance costs amongst the various instruments issued in the Ares Financing Transaction. The amount allocated as a debt discount was $10.4 million, of which $1.7 million related to fees paid to the lender and $8.7 million related to the allocation of proceeds to the warrants issued. The Company also recorded debt issuance costs of $1.6 million related to other third-party costs incurred in obtaining the Ares Facility. See Note 10— Fair Value Measurements for the details of the warrants issued in relation to the Ares Financing Transaction. These amounts were being accreted to the principal amount of the Ares Facility through the recognition of noncash interest expense. The effective interest rate for the period from the date of issuance through the date of repayment was 13.35%.
The Company determined that all of the embedded features of the Ares Facility were either clearly and closely related to the debt host and did not require bifurcation as a derivative liability, or the fair value of the feature was immaterial to the Company’s consolidated financial statements.
In October 2021, the Company paid down the Ares Facility outstanding principal and accrued interest in full and terminated the Ares Facility. The Company recognized a $12.2 million loss on debt extinguishment related to this transaction.transaction for the year ended January 31, 2022. There were no outstanding balances as of January 31, 2024 and 2023.
Covenants
The Company waswas in compliance with allall applicable financial and nonfinancial covenants as of January 31, 2022.2024 and through the date of this filing.
| | |
RENT THE RUNWAY, INC. Notes to Consolidated Financial Statements |
(Dollars in millions, except share and per share amounts)
8.9.Income Taxes
The Company’s net loss before income tax benefit / (expense) from income taxes includes the following components:
| | Year Ended January 31, |
| 2022 | | 2021 | | 2020 |
| Year Ended January 31, | | | Year Ended January 31, |
| 2024 | | | 2024 | | 2023 | | 2022 |
| Domestic | Domestic | $ | (212.6) | | | $ | (171.4) | | | $ | (154.1) | |
| Foreign | Foreign | 0.5 | | 0.3 | | 0.0 | Foreign | 1.0 | | 0.6 | | 0.5 |
| Net loss before income tax benefit / (expense) | Net loss before income tax benefit / (expense) | $ | (212.1) | | | $ | (171.1) | | | $ | (154.1) | |
Total income taxes allocated to operations are as follows:
| | Year Ended January 31, |
| 2022 | | 2021 | | 2020 |
| Year Ended January 31, | | | Year Ended January 31, |
| 2024 | | | 2024 | | 2023 | | 2022 |
| Current provision: | Current provision: | | | | | |
| Federal | |
| Federal | |
| Federal | Federal | $ | — | | | $ | — | | | $ | — | |
| State and local | State and local | — | | — | | — | State and local | — | | — |
| Foreign | Foreign | — | | — | | — | Foreign | (0.2) | | — |
| Total current provision | Total current provision | — | | — | | — | Total current provision | (0.2) | | — |
| Deferred provision: | Deferred provision: | | | | | |
| Federal | Federal | — | | — | | — |
| Federal | |
| Federal | | — | | — |
| State and local | State and local | — | | — | | — | State and local | — | | — |
| Foreign | Foreign | 0.3 | | | — | | | 0.2 | |
| Total deferred provision | Total deferred provision | 0.3 | | | — | | | 0.2 | |
| Total income tax benefit / (expense) | Total income tax benefit / (expense) | $ | 0.3 | | | $ | — | | | $ | 0.2 | |
| | |
RENT THE RUNWAY, INC. Notes to Consolidated Financial Statements |
(Dollars in millions, except share and per share amounts)
The significant components of the Company’s net deferred tax assets (liabilities) are as follows:
| | Year Ended January 31, |
| 2022 | | 2021 |
| Year Ended January 31, | | | Year Ended January 31, |
| 2024 | | | 2024 | | 2023 |
| Deferred tax assets: | Deferred tax assets: | | | |
| Federal and state net operating loss carryforwards | |
| Federal and state net operating loss carryforwards | |
| Federal and state net operating loss carryforwards | Federal and state net operating loss carryforwards | $ | 149.7 | | | $ | 122.6 | |
| Customer credit liabilities | Customer credit liabilities | 1.9 | | | 2.1 | |
| Interest limitation | Interest limitation | 40.5 | | | 22.0 | |
| Fixed assets | |
| Capitalized R&D expenses | |
| Tax credits | Tax credits | 4.2 | | | 3.3 | |
| Share-based compensation | Share-based compensation | 3.3 | | | 3.5 | |
| Operating lease liabilities | Operating lease liabilities | 14.4 | | | 16.5 | |
| Other | Other | 0.4 | | | 0.4 | |
| Total deferred tax assets | Total deferred tax assets | 214.4 | | | 170.4 | |
| Deferred tax liabilities: | Deferred tax liabilities: | | | |
| Fixed assets | Fixed assets | (4.2) | | | (0.9) | |
| Fixed assets | |
| Fixed assets | |
| Operating lease right-of-use assets | Operating lease right-of-use assets | (8.9) | | | (10.3) | |
| Total deferred tax liabilities | Total deferred tax liabilities | (13.1) | | | (11.2) | |
| Net deferred tax assets before valuation allowance | Net deferred tax assets before valuation allowance | 201.3 | | | 159.2 | |
| Less valuation allowance | Less valuation allowance | (201.0) | | | (159.0) | |
| Net deferred tax assets | Net deferred tax assets | $ | 0.3 | | | $ | 0.2 | |
Provisions enacted in the Tax Reform Act in December 2017 related to the capitalization of research and experimental expenditures became effective on January 1, 2022. These provisions require us to capitalize research and experimental expenditures and amortize them for tax purposes over five or fifteen years, depending on where the research is conducted. The capitalized expenses do not significantly impact our effective tax rate.
As of January 31, 20222024 and 2021,2023, the Company maintained a valuation allowance against all of its U.S. deferred tax assets since, in the judgment of management, the realization of these assets was not considered more likely than not. The net change in the total valuation allowance for the years ended January 31, 20222024 and 20212023 was an increase of $42.0$23.7 million and $49.1$31.4 million, respectively. The Company’s deferred tax assets are included in otherOther assets on the consolidated balance sheets.Consolidated Balance Sheets.
As of January 31, 2022,2024, the Company had federal net operating loss tax carryforwards of approximately $560.5$631.1 million. Approximately $152.1$152.0 million of the net operating loss carryforwards will expire at various times through 2038, while $408.4$479.1 million will not expire.
| | |
RENT THE RUNWAY, INC. Notes to Consolidated Financial Statements |
(Dollars in millions, except share and per share amounts)
In general, under Section 382 of the Internal Revenue Code of 1986, as amended (the “Code”), a corporation that undergoes an “ownership change” is subject to limitations on its ability to utilize its net operating losses (“NOLs”) to offset future taxable income. The Company has determined that as of March 2021, it had undergone one ownership change on February 16, 2010, and its NOLs arising before that date are subject to Section 382 limitations. These limitations will not materially limit the use of such NOLs to offset the Company’s future taxable income. Any ownership change occurring after March 2021 may result in the imposition of additional limitations on the Company’s ability to utilize NOLs existing at the time of the ownership change.
| | |
RENT THE RUNWAY, INC.
Notes to Consolidated Financial Statements
|
(Dollars in millions, except share and per share amounts)
The benefit for income taxes differs from the amount computed by applying the statutory U.S. Federal income tax rate to pretax loss because of the effect of the following items:
| | Year Ended January 31, |
| 2022 | | 2021 | | 2020 |
| Year Ended January 31, | | | Year Ended January 31, |
| 2024 | | | 2024 | | 2023 | | 2022 |
| Compute “expected” tax benefit | Compute “expected” tax benefit | 21.00 | % | | 21.00 | % | | 21.00 | % | Compute “expected” tax benefit | 21.00 | % | | 21.00 | % | | 21.00 | % |
| State income taxes, net of federal benefit | State income taxes, net of federal benefit | (0.01) | % | | (0.01) | % | | (0.01) | % | State income taxes, net of federal benefit | (0.02) | % | | (0.01) | % | | (0.01) | % |
| Valuation of warrants | Valuation of warrants | (2.47) | % | | — | % | | — | % | Valuation of warrants | — | % | | — | % | | (2.47) | % |
| Nondeductible transaction costs | Nondeductible transaction costs | (0.44) | % | | — | % | | — | % | Nondeductible transaction costs | — | % | | — | % | | (0.44) | % |
| Nondeductible compensation | Nondeductible compensation | (1.17) | % | | — | % | | — | % | Nondeductible compensation | (2.55) | % | | (1.95) | % | | (1.17) | % |
| Share-based compensation | Share-based compensation | (0.35) | % | | (0.38) | % | | (0.40) | % | Share-based compensation | (0.09) | % | | (0.48) | % | | (0.35) | % |
| Current year change in valuation allowance | Current year change in valuation allowance | (16.90) | % | | (21.55) | % | | (20.91) | % | Current year change in valuation allowance | (19.74) | % | | (19.34) | % | | (16.90) | % |
| Other | Other | 0.48 | % | | 0.94 | % | | 0.43 | % | Other | 1.26 | % | | 1.00 | % | | 0.48 | % |
| Income tax benefit (expense) | Income tax benefit (expense) | 0.14 | % | | — | % | | 0.11 | % | Income tax benefit (expense) | (0.14) | % | | 0.22 | % | | 0.14 | % |
The Company has not recognized deferred tax liabilities for outside basis differences (including undistributed earnings) relating to the Company’s foreign subsidiary because such amounts have been indefinitely reinvested. The Company has determined that it is impracticable to estimate the unrecorded deferred tax liability associated with the foreign subsidiary for which the Company is asserting indefinite reinvestment.
The following table summarizes the unrecognized tax benefit activity for the periods indicated:
| | Year Ended January 31, |
| 2022 | | 2021 | | 2020 |
| Year Ended January 31, | | | Year Ended January 31, |
| 2024 | | | 2024 | | 2023 | | 2022 |
| Balance as of the beginning of the period | Balance as of the beginning of the period | $ | 0.6 | | | $ | — | | | $ | — | |
| Additions based on tax positions related to the current year | Additions based on tax positions related to the current year | 0.1 | | | 0.2 | | | — | |
| Additions for tax positions of prior years | Additions for tax positions of prior years | — | | | 0.4 | | | — | |
| Reductions for tax positions of prior years | Reductions for tax positions of prior years | — | | | — | | | — | |
| Lapse of statute of limitations | Lapse of statute of limitations | — | | | — | | | — | |
| Settlements | Settlements | — | | | — | | | — | |
| Balance as of the end of the period | Balance as of the end of the period | $ | 0.7 | | | $ | 0.6 | | | $ | — | |
The amount of unrecognized tax benefits included on the consolidated balance sheetsConsolidated Balance Sheets as of January 31, 20222024 and 20212023 are $0.7$1.2 million and $0.6$0.9 million, respectively.
| | |
RENT THE RUNWAY, INC. Notes to Consolidated Financial Statements |
(Dollars in millions, except share and per share amounts)
The total amount of unrecognized tax benefits relating to the Company’s tax positionsposition is subject to change based on future events including, but not limited to, the settlements of ongoing audits and/or the expiration of applicable statutes of limitations. The outcomes and timing of such events are highly uncertain and a reasonable estimate of the range of gross unrecognized tax benefits, excluding interest and penalties, that could potentially be reduced during the next 12 months cannot be made.made at this time.
| | |
RENT THE RUNWAY, INC.
Notes to Consolidated Financial Statements
|
(Dollars in millions, except share and per share amounts)
The Company is subject to United States federal and state taxation, as well as subject to taxation in Ireland. The Company may be subject to examination by the Internal Revenue Service (“IRS”) and as of January 31, 2022,2024, tax year 20162020 and years filed thereafter remain open to examination. These examinations may result in proposed adjustments to the Company’s income tax liability or tax attributes with respect to years under examination as well as subsequent periods.
The provision for income taxes involves a significant amount of management judgment regarding interpretation of relevant facts and laws in the jurisdictions in which the Company operates. Future changes in applicable laws, projected levels of taxable income and tax planning could change the effective tax rate and tax balances recorded by the Company. In addition, tax authorities periodically review income tax returns filed by the Company and can raise issues regarding its filing positions, timing and amount of income and deductions, and the allocation of income among the jurisdictions in which the Company operates. A significant period of time may elapse between the filing of an income tax return and the ultimate resolution of an issue raised by a revenue authority with respect to that return. Any adjustments as a result of any examination may result in additional taxes or penalties against the Company. If the ultimate result of these audits differs from original or adjusted estimates, they could have a material impact on the Company’s tax provision.
On March 27, 2020,August 16, 2022, Congress passed the Coronavirus Aid, Relief, and Economic SecurityInflation Reduction Act (“CARES Act”) was enacted and signed into law. Among other things, the CARES Act has modified the Internal Revenue Code of 1986, as amended, including, but not limited to: (1) modifications2022. The key tax provisions applicable to the business interest deduction limitation forCompany are a 15% corporate minimum tax years 2021on book income and 2020; (2) a technical correction of the recovery period of qualified improvement property from 391% excise tax on stock repurchases effective January 1, 2023. We do not expect these tax law changes to 15 years; and (3)have a repeal of the 80% taxable income limitationmaterial impact on the deduction of NOLs for tax years beginning before January 1, 2021Company’s consolidated financial position; however, we will continue to evaluate their impact as well as a five-year carryback period allowed for NOLs generated in tax years beginning after December 31, 2017 and before January 1, 2021.
Under ASC 740, the effects of new legislation must be recognized in the period of enactment. Therefore, the effects of the CARES Act was accounted for in the year ended January 31, 2021. The Company evaluated the provisions of the CARES Act and determined that there is no material impact for the year ended January 31, 2021.further information becomes available.
9.10.Accrued Expenses and Other Current LiabilitiesLiabilities
Accrued expenses and other current liabilities consisted of the following:
| | January 31, | | January 31, |
| 2022 | | | 2021 |
| January 31, | | | January 31, | | January 31, |
| 2024 | | | 2024 | | | 2023 |
| Accrued operating and general expenses | |
| Revenue share payable | Revenue share payable | $ | 6.7 | | | | $ | 4.3 | |
| Accrued operating and general expenses | 13.6 | | | 3.8 | |
| Accrued interest | |
| Accrued payroll related expenses | Accrued payroll related expenses | 4.0 | | | 3.4 | |
| Short-term financing | Short-term financing | 3.5 | | | — | |
| Sales and other taxes | Sales and other taxes | 1.6 | | | 1.0 | |
| Current portion of long-term debt | — | | | 0.9 | |
| Gift card liability | Gift card liability | 0.6 | | | 0.7 | |
| Accrued expenses and other current liabilities | Accrued expenses and other current liabilities | $ | 30.0 | | | | $ | 14.1 | |
The borrowing rate for the short-term financing obligation was 8.80% as of January 31, 2024.
| | |
RENT THE RUNWAY, INC. Notes to Consolidated Financial Statements |
(Dollars in millions, except share and per share amounts)
11.Fair Value Measurements
The Company follows the guidance in ASC 820 for its financial assets and liabilities that are remeasured and reported at fair value at each reporting period, and non-financial assets and liabilities that are re-measured and reported at fair value at least annually.
| | |
RENT THE RUNWAY, INC.
Notes to Consolidated Financial Statements
|
As of January 31, 2024 and 2023, the carrying amounts of the Company’s cash and cash equivalents, current and noncurrent restricted cash, prepaid expenses and other current assets, accounts payable and accrued expenses and other current liabilities approximated their estimated fair value due to their relatively short maturities.
(DollarsThe Company’s long-term debt is reported at carrying value on the Consolidated Balance Sheets. Refer to Note 8 – Long-Term Debt. The Company estimates the fair value of its long-term debt using a discounted cash flow approach based on the Company’s implied credit spread using the median of option adjusted spreads for similar financial instruments with similar credit ratings, and, as such, long-term debt is classified as Level 3 within the fair value hierarchy. The Company classified the long-term debt as Level 3 compared to Level 2 in millions, except share and per share amounts)the prior year due to a change to the valuation model. As of January 31, 2024, the estimated fair value of the Company’s long-term debt was $305.9 million.
Observable inputs are based on market data obtained from independent sources. Unobservable inputs reflect the Company’s assessment of the assumptions market participants would use to value certain financial instruments. This hierarchy requires the Company to use observable market data, when available, and to minimize the use of unobservable inputs when determining fair value.
The Company’s assets andwarrant liabilities that are measuredwere reported at fair value on a recurring basis, by level, within the fair value hierarchy are summarized as follows:
| | | | | | | | | | | | | | | | | | | | |
| | | | January 31, | | January 31, |
| Description | | Level | | 2022 | | 2021 |
| Liabilities: | | | | | | |
| Warrant liability – Common stock warrants | | 3 | | $ | — | | | $ | 11.2 | |
| Warrant liability – Preferred stock warrants | | 3 | | — | | | 0.6 | |
| Total liabilities | | | | $ | — | | | $ | 11.8 | |
Company’s Consolidated Balance Sheets. The warrant liabilities were valued using a Black-Scholes option pricing model. The assumptions used in preparing the model include estimates such as volatility, contractual terms, dividend yield, expiration dates and risk-free interest rates. Prior to the Company’s IPO, this valuation model used unobservable market share price input on a recurring basis, and therefore was considered a Level 3 liability.
The following table presents a roll forward of the fair value of the levelLevel 3 liabilities for the yearsyear ended January 31, 2022 and 2021:2022:
| | | | | |
| | Warrant
Liability |
Balance as of January 31, 20202021 | $ | 0.611.8 | |
Issuance of warrants | 11.6 |
Changes in estimated fair value | (0.4) |
Balance as of January 31, 2021 | 11.8 | |
Issuance ofcommon stock warrants | 0.5 | |
| Changes in estimated fair value | 24.4 | |
| Exercise of warrants | (35.5) | |
| Reclassification to equity-classified warrants | (1.2) | |
| Balance as of January 31, 2022 | $ | — | |
The Company issued a warrant for 1,651,701 shares of common stock related to the Ares Financing Transaction with a fair value at issuance of $11.6 million and there were no changes in the estimated fair value, exercise or reclassification of the liability-classified warrants during the year ended January 31, 2021.
The Company issued an additional warrant to Ares for 40,828 shares of common stock with a fair value at issuance of $0.5 million, included in the lossgain / (loss) on warrant liability revaluation, net on the consolidated statement of operations for the year ended January 31, 2022.
See Note 12 — Stockholders’ EquityThe warrants for additional details about the Company’s warrants.
The Ares warrants for82,585 and 2,041 shares of common stock, respectively, were automatically exercised and converted to an aggregate of 1,691,72384,586 shares of Class A Common Stockcommon stock through cashless exercise upon completion of the Company’s IPO. These warrants were adjusted to a fair value of $35.5 million immediately prior to exercise.
| | |
RENT THE RUNWAY, INC. Notes to Consolidated Financial Statements |
(Dollars in millions, except share and per share amounts)
The TriplePoint warrants that were outstanding as of January 31, 2021 for an aggregate of 88,0374,401 shares of Series D redeemable preferred stock were converted to warrants for shares of Class A common stock as of the IPO date.effective date of the IPO. These warrants were reclassified to stockholders’ equity as of the effective date of the IPO, as the redemption provision from the shares underlying these warrants was eliminated. These warrants were adjusted to fair value of $1.2 million immediately prior to reclassification.reclassification.
The following table presents the key assumptions used in the Black-Scholes option pricing model for the valuation of the liability-classified warrants as of January 31, 2021. There were no outstanding liability-classified warrants as of January 31, 2022.2024 and | | | | | | | | |
| | January 31, |
| | 20212023. |
Valuation assumptions: | | |
Expected dividend yield | | — | % |
Expected volatility | | 87.68 | % |
Expected term (in years) | | 6.75 |
Risk-free interest rate | | 0.79 | % |
11.12.Redeemable Preferred Stock
During the year ended January 31, 2020,2022, the Company sold 6,039,272 shares of Series F and issued 61,347 shares of Series B preferred stock upon exercise of warrants in exchange for $133.8 million. During the year ended January 31, 2021, the Company sold 4,145,6501,437,541 shares of Series G redeemable preferred stock in exchange for $57.6 million. During the year ended January 31, 2022, the Company sold an additional 1,437,541 shares of Series G redeemable preferred stock for $21.2 million. Upon consummation of the IPO, the Company accreted the carrying value of $409.3 million of the redeemable preferred stock to the liquidation value of $414.9 million and the Company’s 32,575,462 outstanding shares of redeemable preferred stock were converted into 32,575,4621,628,773 shares of the Company’s Class A common stock. The accretion to liquidation value did not have a net impact on the Company’s additional paid-in capital. There was no outstanding redeemable preferred stock as of January 31, 2024 and 2023. Refer to Note 2, Summary of Significant Accounting Policies for discussion of the Company’s Reverse Stock Split.
Redemption
The redeemable preferred stock was redeemable upon a liquidation event, such as voluntary or involuntary liquidation, dissolution, or winding up of the Company, which is outside of the Company’s control. Accordingly, these shares were considered contingently redeemable and were classified outside of stockholders’ deficit as mezzanine equity on the consolidated balance sheets.Consolidated Balance Sheets. The Company accreted the carrying values of the redeemable preferred stock to their liquidation values upon the Company’s IPO.
| | |
RENT THE RUNWAY, INC. Notes to Consolidated Financial Statements |
12.
(Dollars in millions, except share and per share amounts)
13.Stockholders’ Equity
Reverse Stock Split
In March 2024, the Company’s stockholders approved, and the Company’s Board of Directors selected, a 1-for-20 reverse stock split (the “Reverse Stock Split”) of outstanding shares of Class A common stock and Class B common stock. The Reverse Stock Split became effective on April 2, 2024 and began trading on the Nasdaq Capital Market on a post-split basis on April 3, 2024. Following the Reverse Stock Split, the number of authorized shares of Class A common stock remained at 300,000,000, the number of authorized shares of Class B common stock remained at 50,000,000, and the number of authorized shares of preferred stock remained at 10,000,000. The Reverse Stock Split reduced the total number of issued and outstanding shares of Class A common stock from 67,812,037 to 3,390,587 and Class B common stock from 3,098,580 to 154,928 as of January 31, 2024. The Reverse Stock Split reduced the total number of issued and outstanding shares of Class A common stock from 61,956,536 to 3,097,826 and Class B common stock from 3,066,251 to 153,312 as of January 31, 2023. The par value of Class A common stock and Class B common stock remained unchanged at $0.001. The Company filed an Amendment to the Twelfth Amended and Restated Certificate of Incorporation with the Secretary of State of the State of Delaware on April 2, 2024 to implement the Reverse Stock Split. All per share amounts and common shares amounts have been adjusted on a retroactive basis to reflect the Reverse Stock Split for all periods. In addition, Class A common stock and Class B common stock decreased by $0.1 and $0.1, respectively and additional paid-in capital increased by $0.1 and $0.1, respectively, in the Consolidated Balance Sheets as of January 31, 2024 and 2023 and Statements of Changes in Redeemable Preferred Stock and Stockholders’ Equity (Deficit) as of January 31, 2024, 2023, and 2022.
The Company’s stockholders’ equity, in the aggregate, remained unchanged following the Reverse Stock Split. Per share net loss increased because there were fewer shares of Class A common stock and Class B common stock outstanding. There were no other accounting consequences, including changes to the amount of stock-based compensation expense to be recognized in any period, that arose as a result of the Reverse Stock Split. No fractional shares were issued in connection with the Reverse Stock Split. Instead, holders of Class A common stock and Class B common stock holding fractional shares were entitled to receive, in lieu of such fractional shares, a cash payment in an amount determined based on the closing price of the Company’s Class A common stock on the effective date of the Reverse Stock Split. The cash payments were immaterial to the Company’s consolidated financial statements. The Reverse Stock Split impacted all stockholders uniformly and did not affect any stockholder’s percentage of ownership or proportionate voting power other than very minor impacts from the treatment of fractional shares.
Common Stock
Holders of Class A common stock are entitled to 1one vote per share and holders of Class B common stock are entitled to 20twenty votes per share, as well as dividends if and when declared by the Board of Directors and, upon liquidation, dissolution, winding up or other liquidation event of the Company, all assets available for distribution to common stockholders. There are no redemption provisions with respect to common stock.
| | |
RENT THE RUNWAY, INC.
Notes to Consolidated Financial Statements
|
(Dollars in millions, except share and per share amounts)
Preferred Stock
Upon the IPO, the Company authorized 10,000,000 shares of preferred stock, with a par value of $0.001 per share. No shares were issued or outstanding as of January 31, 2022.2024.
Warrants
As of January 31, 2022 and 2021, the Company had the following outstanding warrants:
| | | | | | | | | | | | | | | | | | | | | | | | | | | | | |
| January 31, 2022 |
| Outstanding Warrants | Date
Issued | | Number of
Shares | | Class of
Shares | | Exercise
Price | | Fair Value
at Issuance |
| Equity classified: | | | | | | | | | |
| TriplePoint | Nov-16 | | 82,891 | | | Common | | $ | 7.54 | | | $ | 0.3 | |
| TriplePoint | Jun-17 | | 18,236 | | | Common | | 7.54 | | | 0.1 | |
| TriplePoint | Sep-17 | | 14,920 | | | Common | | 7.54 | | | 0.1 | |
| TriplePoint | Jan-18 | | 16,578 | | | Common | | 7.54 | | | 0.1 | |
| TriplePoint | Apr-18 | | 16,578 | | | Common | | 7.54 | | | 0.1 | |
| TriplePoint | Nov-15 | | 35,215 | | | Common | | 17.04 | | | 0.2 | |
| TriplePoint | Jun-16 | | 28,172 | | | Common | | 17.04 | | | 0.2 | |
| TriplePoint | Sep-16 | | 24,650 | | | Common | | 17.04 | | | 0.1 | |
| Double Helix (Temasek) | Jul-18 | | 730,000 | | | Common | | 27.40 | | | 1.3 | |
| Double Helix (Temasek) | Oct-21 | | 394,343 | | | Common | | 21.00 | | | 5.3 | |
| | | 1,361,583 | | | | | | | 7.8 | |
There were no outstanding liability-classified warrants as of January 31, 2022.
| | | | | | | | | | | | | | | | | | | | | | | | | | | | | |
| | January 31, 2021 |
| Outstanding Warrants | Date
Issued | | Number of
Shares | | Class of
Shares | | Exercise
Price | | Fair Value
at Issuance |
| Equity classified: | | | | | | | | | |
| TriplePoint | Nov-16 | | 82,891 | | | Common | | $ | 7.54 | | | $ | 0.3 | |
| TriplePoint | Jun-17 | | 18,236 | | | Common | | 7.54 | | | 0.1 | |
| TriplePoint | Sep-17 | | 14,920 | | | Common | | 7.54 | | | 0.1 | |
| TriplePoint | Jan-18 | | 16,578 | | | Common | | 7.54 | | | 0.1 | |
| TriplePoint | Apr-18 | | 16,578 | | | Common | | 7.54 | | | 0.1 | |
| Double Helix (Temasek) | Jul-18 | | 730,000 | | | Common | | 0.01 | | | 9.0 | |
| Double Helix (Temasek) | Jul-18 | | 730,000 | | | Common | | 27.40 | | | 1.3 | |
| | | 1,609,203 | | | | | | | $ | 11.0 | |
| Liability classified: | | | | | | | | | |
| TriplePoint | Nov-15 | | 35,215 | | | Series D | | $ | 17.04 | | | $ | 0.2 | |
| TriplePoint | Jun-16 | | 28,172 | | | Series D | | 17.04 | | | 0.2 | |
| TriplePoint | Sep-16 | | 24,650 | | | Series D | | 17.04 | | | 0.1 | |
| 10 Jay | Oct-20 | | 76,627 | | | Series G | | 14.74 | | | — | |
| Ares | Oct-20 | | 1,651,701 | | | Common | | 0.01 | | | 11.6 | |
| | | 1,816,365 | | | | | | | $ | 12.1 | |
| | |
RENT THE RUNWAY, INC. Notes to Consolidated Financial Statements |
(Dollars in millions, except share and per share amounts)
Warrants
As of January 31, 2024 and 2023, the Company had the following outstanding warrants, adjusted on a retroactive basis to reflect the Reverse Stock Split as discussed above:
| | | | | | | | | | | | | | | | | | | | | | | | | | | | | |
| Outstanding Warrants | Date
Issued | | Number of
Shares | | Class of
Shares | | Exercise Price (Per Warrant) | | Fair Value
at Issuance |
| Equity classified: | | | | | | | | | |
| TriplePoint | Nov-16 | | 4,144 | | | Common | | $ | 150.80 | | | $ | 0.3 | |
| TriplePoint | Jun-17 | | 911 | | | Common | | 150.80 | | | 0.1 | |
| TriplePoint | Sep-17 | | 746 | | | Common | | 150.80 | | | 0.1 | |
| TriplePoint | Jan-18 | | 828 | | | Common | | 150.80 | | | 0.1 | |
| TriplePoint | Apr-18 | | 828 | | | Common | | 150.80 | | | 0.1 | |
| TriplePoint | Nov-15 | | 1,760 | | | Common | | 340.77 | | | 0.2 | |
| TriplePoint | Jun-16 | | 1,408 | | | Common | | 340.77 | | | 0.2 | |
| TriplePoint | Sep-16 | | 1,232 | | | Common | | 340.77 | | | 0.1 | |
| Double Helix (Temasek) | Oct-21 | | 19,717 | | | Common | | 420.00 | | | 5.3 | |
| Double Helix (Temasek) | Jan-23 | | 100,000 | | | Common | | 100.00 | | | 6.9 | |
| | | 131,574 | | | | | | | $ | 13.4 | |
The warrant for 36,500 shares of common stock issued to Double Helix (Temasek) in July 2018 with an exercise price of $548.00 per share expired unexercised during the year ended January 31, 2023. See Note 8 - Long-Term Debt for details of the warrants issued to Temasek in January 2023.
As of January 31, 2024 and 2023, all outstanding warrants were equity-classified and recorded as additional paid-in capital. Equity-classified contracts are not subsequently remeasured unless reclassification is required from equity to liability classification.
The fair value iswas estimated using the Black-Scholes option pricing model. The fair value is subjective and is affected by changes in inputs to the valuation model including the fair value per share of the underlying stock, the expected term of each warrant, volatility of the Company’s stock and peer company stock, and risk-free rates based on the U.S. Treasury yield curves.
The Company issued preferred and common stock warrants in conjunction with the issuance of certain long-term debt. The preferred stock warrants were accounted for as liabilities primarily because the shares underlying the warrants contained contingent redemption features outside the control of the Company. The liability classified warrants were subject to remeasurement at each balance sheet date. With each such re-measurement, the liability classified warrants were adjusted to current fair value recognized as a gain or loss in the consolidated statementsConsolidated Statements of operations.Operations. The Company reassessed the classification of the warrants at each balance sheet date. If the classification changed as a result of events during the period, theliability classified warrants were reclassified as oflast remeasured in the date of the event that caused the reclassification.
As ofyear ended January 31, 2022, all outstanding warrants were equity-classified2022.
| | |
RENT THE RUNWAY, INC. Notes to Consolidated Financial Statements |
(Dollars in millions, except share and recorded as additional paid-in capital. As of January 31, 2021, all outstanding common stock warrants, with the exception of Ares Facility common stock warrants, were equity-classified and recorded as additional paid-in capital, and all preferred stock warrants were recorded as liabilities. Equity-classified contracts are not subsequently remeasured unless reclassification is required from equity to liability classification.
per share amounts)
13.
14.Share-based Compensation Plans
2009 Stock Incentive Plan and 2019 Stock Incentive Plan
In 2009, the Company adopted its stock incentive plan (the “2009 Plan”) to grant equity to employees and service providers. In 2019, the Company adopted a new stock incentive plan (the “2019 Plan”) which replaced the 2009 Plan. The Company has granted RSUs and stock options, each of which is settleable in shares. Options are generally granted for a 10-year term, and generally vest and become fully exercisable over four years of service. RSU awards have both service-based and liquidity-based vesting conditions. The liquidity-based vesting condition was satisfied in connection with the effectiveness of the Company’s IPO. The service-based requirement of RSUs iswas typically satisfied over four years. While no shares are available for future issuance under the 2009 Plan or the 2019 Plan, they continue to govern outstanding equity awards granted thereunder. Outstanding awards granted under the 2009 Plan and 2019 Plan are exercisable for or settled in shares of Class A common stock, or, if approved by the board of directors, shares of Class B common stock.
Amended and Restated 2021 Incentive Award Plan
The Company's Amended and Restated 2021 Incentive Award Plan (the "2021 Plan") was adopted by its board of directors and approved by stockholders in October 2021 and became effective upon the effective date of the IPO. The 2021 Plan replaced the 2019 Plan and no further grants will be made under the 2019 Plan. The terms of equity awards granted under the 2021 Plan in the year ended January 31, 2022 arewere generally consistent with those granted under the 2019 Plan, as described above. RSUs granted under the 2021 Plan in the year ended January 31, 2022 generally vest over four years and do not have liquidity-based vesting conditions. RSUs granted under the 2021 Plan in fiscal year 2022during the years ended January 31, 2024 and 2023 have a shorter vesting period of one to two years.years. As of January 31, 2022,2024, there were 8,251,139 shares490,431 shares of Class A common stock available for issuance under the 2021 Plan. There will not be any further equity grants of Class B common stock.
| | |
RENT THE RUNWAY, INC.
Notes to Consolidated Financial Statements
|
(Dollars in millions, except share and per share amounts)
The grant date fair value of each option award is estimated on the date of grant using the Black-Scholes option pricing model. The option pricing model considers several variables and assumptions in estimating the fair value of share-based awards. Because the Company’s shares are only recently publicly traded and there is a lack of historical company-specific data available, the expected term is estimated under the simplified method using the vesting and contractual terms, and expected volatility is estimated based on the average historical volatility of similar entities with publicly traded shares. The risk-free rate for the expected term of the option is based on the U.S. Treasury yield curve at the date of grant. The weighted-average assumptions for grants made during the periods presented, were as follows:
| | | | | | | | | | | | | | | | | |
| Year Ended January 31, |
| 2022 | | 2021 | | 2020 |
| Valuation assumptions: | | | | | |
| Expected dividend yield | — | % | | — | % | | — | % |
| Expected volatility | 68.26 | % | | 63.91 | % | | 56.04 | % |
| Expected term (in years) | 6.00 | | 4.89 | | 6.10 |
| Risk-free interest rate | 1.02 | % | | 0.34 | % | | 1.91 | % |
| | | | | |
| Year Ended January 31, |
| 2022 |
| Valuation assumptions: | |
| Expected dividend yield | — | % |
| Expected volatility | 68.26 | % |
| Expected term (in years) | 6.00 |
| Risk-free interest rate | 1.02 | % |
Stock Options
Stock option activity during the period indicated is as follows:
| | | | | | | | | | | | | | | | | | | | | | | |
| Number of
Shares | | Weighted
Average
Exercise
Price | | Weighted
Average
Remaining
Contract
Term
(in years) | | Aggregate
Intrinsic
Value |
| Balances as of January 31, 2021 | 6,060,107 | | | $ | 6.76 | | | 6.45 | | $ | 3.7 | |
| Granted | 4,556,962 | | | 8.04 | | | | | |
| Exercised | (546,934) | | | 6.34 | | | | | |
| Forfeited | (599,965) | | | 7.61 | | | | | |
| Balances as of January 31, 2022 | 9,470,170 | | | $ | 7.33 | | | 7.17 | | $ | 2.1 | |
| Exercisable as of January 31, 2022 | 4,291,573 | | | $ | 6.68 | | | 5.16 | | $ | 2.1 | |
The weighted average grant date fair values ofThere were no stock options granted forduring the yearyears ended January 31, 2022 was $5.15. The total intrinsic value of stock options exercised for the year ended January 31, 2022 was $1.5 million.2024 and 2023.
As of January 31, 2022, there was $16.8 million of unrecognized compensation cost related to stock options granted that is expected to be recognized over a weighted average period of 3.1 years.
The Company currently uses authorized and unissued shares to satisfy exercising of stock option awards.
| | |
RENT THE RUNWAY, INC. Notes to Consolidated Financial Statements |
(Dollars in millions, except share and per share amounts)
On October 26, 2020,Stock Options
Stock option activity during the Company’s Board approvedperiod indicated is as follows, adjusted on a one-time stock option repricing, which repriced certain outstanding stock options held by then current employees and directors with an option exercise price of $12.43 and above. There were 2,565,149 outstanding eligible stock options that were amendedretroactive basis to reduce such exercise price to $7.01 per share,reflect the current fair market value of the Company’s common stock on theReverse Stock Split as discussed in Note 13, Stockholders’ Equity:
| | | | | | | | | | | | | | | | | | | | | | | |
| Number of
Shares | | Weighted
Average
Exercise
Price | | Weighted
Average
Remaining
Contract
Term
(in years) | | Aggregate
Intrinsic
Value |
| Balances as of January 31, 2023 | 402,756 | | | $ | 146.60 | | | 6.37 | | $ | 0.4 | |
| Granted | — | | | — | | | | | |
| Exercised | — | | | — | | | | | |
| Forfeited | (360,143) | | | 145.20 | | | | | |
| Balances as of January 31, 2024 | 42,613 | | | $ | 157.80 | | | 4.79 | | $ | — | |
| Exercisable as of January 31, 2024 | 39,383 | | | $ | 155.40 | | | 4.70 | | $ | — | |
The weighted average grant date of the approval of the repricing. Except for the modified exercise price, all other terms and conditions of each of the eligible stock options remained in full force and effect. The repricing was recorded as a stock option modification whereby the incremental fair value of each optionstock options granted for the year ended January 31, 2022 was determined using the Black-Scholes option pricing model at the date$103.00. The total intrinsic value of the modification, and $1.2 million was recognized related to vestedstock options as incremental compensation expense duringexercised for the year ended January 31, 2021.2023 was nominal and for the year ended January 31, 2022 was $1.5 million.
As of January 31, 2024, there was $0.3 million of unrecognized compensation cost related to stock options granted that is expected to be recognized over a weighted average period of 1.41 years.
During the year ended January 31, 2024, the Company completed an option exchange designed to incentivize and retain employees, directors and other service providers by providing the ability to exchange outstanding stock options for RSUs representing the right to receive Class A common stock. Stock options relating to 331,370 shares of Class A and Class B common stock were forfeited in exchange for 132,546 RSUs which generally vest over two years. The Company is recognizing the remaining $1.1will recognize $0.8 million of incremental stock compensation costs onexpense from the RSUs granted as a straight-line basisresult of the option exchange which will be recognized over the remaining requisite servicetwo year vesting period.
The Company currently uses authorized and unissued shares to satisfy the exercise of stock option awards.
RSUs
RSUs activity during the period indicated is as follows:follows, adjusted on a retroactive basis to reflect the Reverse Stock Split as discussed in Note 13, Stockholders’ Equity:
| | | | | | | | | | | |
| | Number of
Shares | | Weighted
Average
Grant-Date
Fair Value
per Share |
| Unvested and outstanding as of January 31, 2021 | 1,509,601 | | | $ | 12.17 | |
| Granted | 1,184,465 | | | 9.79 | |
| Exercised | (50,883) | | | 17.25 | |
| Forfeited | (214,609) | | | 8.32 | |
| Unvested and outstanding as of January 31, 2022 | 2,428,574 | | | $ | 11.32 | |
| | | | | | | | | | | |
| | Number of
Shares | | Weighted
Average
Grant-Date
Fair Value
per Share |
| Unvested and outstanding as of January 31, 2023 | 298,722 | | | $ | 112.80 | |
| Granted | 492,784 | | | 49.80 | |
| Vested/Released | (294,377) | | | 87.00 | |
| Forfeited | (92,164) | | | 82.80 | |
| Unvested and outstanding as of January 31, 2024 | 404,965 | | | $ | 59.40 | |
| | |
RENT THE RUNWAY, INC. Notes to Consolidated Financial Statements |
(Dollars in millions, except share and per share amounts)
The weighted average grant date fair values of RSUs granted for the years ended January 31, 2023 and January 31, 2022 were $96.60 and $195.80 per share, respectively.
As of January 31, 2022,2024, there was $6.1$10.9 million of unrecognized compensation cost related to RSUs granted that is expected to be recognized over a weighted average period of 1.71.5 years. TheOf the total unrecognized compensation cost, $2.1 million related to RSUs granted as a result of the option exchange.
During the year ended January 31, 2022, the Company recognized $14.4 million of compensation cost in connection with theupon effectiveness of the Company’s IPO, related to (i) certain RSUs that contain both service-based and liquidity-based vesting conditions satisfied upon the effectiveness of the registration statement and (ii) the fully vested portion of certain RSU awards that were granted upon the effectiveness of the IPO.
Share-Based Compensation Summary
The classification of share-based compensation byfor the years ended January 31, 2024, 2023 and 2022, respectively, presented within each line item withinof the consolidated statementsConsolidated Statements of operationsOperations is as follows:
| | | | | | | | | | | | | | | | | |
| | Year Ended January 31, |
| 2022 | | 2021 | | 2020 |
| Technology | $ | 4.2 | | | $ | 2.0 | | | $ | 1.7 | |
| Marketing | 1.0 | | | 0.4 | | | 0.4 | |
| General and administrative | 21.4 | | | 5.8 | | | 4.7 | |
| Total share-based compensation | $ | 26.6 | | | $ | 8.2 | | | $ | 6.8 | |
| | |
RENT THE RUNWAY, INC.
Notes to Consolidated Financial Statements
|
| | | | | | | | | | | | | | | | | |
| | Year Ended January 31, |
| 2024 | | 2023 | | 2022 |
| Technology | $ | 5.5 | | | $ | 5.9 | | | $ | 4.2 | |
| Marketing | 0.2 | | | 0.5 | | | 1.0 | |
| General and administrative | 20.5 | | | 19.0 | | | 21.4 | |
| Total share-based compensation | $ | 26.2 | | | $ | 25.4 | | | $ | 26.6 | |
The Company recognized $2.4 million of incremental share-based compensation expense in General and administrative expenses during the year ended January 31, 2024 due to equity award modifications related to the transition of the Chief Financial Officer role.
(Dollars in millions, except share and per share amounts)The Company recognized $1.5 million of share-based compensation expense during the year ended January 31, 2024, including incremental share-based compensation expense as a result of the option exchange discussed above.
14.15.Net Loss per Share Attributable to Common Stockholders
The Company computes net loss per share attributable to common stockholders under the two-class method required for multiple classes of common stock and participating securities. The rights of the Class A common stock and Class B common stock are substantially identical, other than voting rights. Accordingly, the net loss per share attributable to common stockholders will be the same for Class A and Class B common stock on an individual or combined basis.
The following table sets forth the computation of basic and diluted net loss per share attributable to common stockholders:
| | | | | | | | | | | | | | | | | |
| Year Ended January 31, |
| 2022 | | 2021 | | 2020 |
| Numerator: | | | | | |
| Net loss attributable to common stockholders | $ | (211.8) | | | $ | (171.1) | | | $ | (153.9) | |
| Denominator: | | | | | |
| Weighted-average shares used in computing net loss per share attributable to common stockholders, basic and diluted | 24,874,061 | | | 11,138,851 | | | 10,964,634 | |
| Net loss per share attributable to common stockholders, basic and diluted | $ | (8.51) | | | $ | (15.36) | | | $ | (14.04) | |
The following potentially dilutive outstanding securities based on amounts outstanding at each period end were excluded from the computation of diluted loss per share attributable to common stockholders because including them would have been anti-dilutive:
| | | | | | | | | | | | | | | | | |
| Year Ended January 31, |
| 2022 | | 2021 | | 2020 |
| | | | | |
| Redeemable preferred stock | — | | | 31,137,921 | | | 26,992,271 | |
| Stock options | 9,470,170 | | | 6,060,107 | | | 7,023,534 | |
| Common stock warrants | 1,361,583 | | | 2,530,904 | | | 879,203 | |
| Preferred stock warrants | — | | | 164,664 | | | 103,791 | |
| RSUs | 2,428,574 | | | — | | | — | |
| Total | 13,260,327 | | | 39,893,596 | | | 34,998,799 | |
As of January 31, 2021, RSUs to be settled in 1,509,601 shares of common stock were excluded from the table above because they were subject to liquidity-based vesting conditions that were not satisfied. There were no outstanding RSUs as of January 31, 2020.
15.Commitments and Contingencies
The Company had restricted cash balances for cash collateralized standby letters of credit as of January 31, 2022 and 2021of $12.0 million and $13.9 million, primarily to satisfy security deposit requirements on its leases.
| | |
RENT THE RUNWAY, INC. Notes to Consolidated Financial Statements |
(Dollars in millions, except share and per share amounts)
The following table sets forth the computation of basic and diluted net loss per share attributable to common stockholders, adjusted on a retroactive basis to reflect the Reverse Stock Split as discussed in Note 13, Stockholders’ Equity:
| | | | | | | | | | | | | | | | | |
| Year Ended January 31, |
| 2024 | | 2023 | | 2022 |
| Numerator: | | | | | |
| Net loss attributable to common stockholders | $ | (113.2) | | | $ | (138.7) | | | $ | (211.8) | |
| Denominator: | | | | | |
| Weighted-average shares used in computing net loss per share attributable to common stockholders, basic and diluted | 3,418,382 | | | 3,212,746 | | | 1,243,703 | |
| Net loss per share attributable to common stockholders, basic and diluted | $ | (33.12) | | | $ | (43.17) | | | $ | (170.30) | |
The following potentially dilutive outstanding securities based on amounts outstanding at each period end, adjusted on a retroactive basis to reflect the Reverse Stock Split as discussed in Note 13, Stockholders’ Equity, were excluded from the computation of diluted loss per share attributable to common stockholders because including them would have been anti-dilutive:
| | | | | | | | | | | | | | | | | |
| Year Ended January 31, |
| 2024 | | 2023 | | 2022 |
| | | | | |
| Stock options | 42,613 | | | 402,756 | | | 473,898 | |
| Common stock warrants | 131,574 | | | 131,574 | | | 68,079 | |
| RSUs | 404,965 | | | 298,722 | | | 121,379 | |
| Total | 579,152 | | | 833,052 | | | 663,356 | |
16.Commitments and Contingencies
The Company had restricted cash balances for cash collateralized standby letters of credit as of January 31, 2024 and 2023of $10.0 million and $9.1 million, respectively, primarily to satisfy security deposit requirements on its leases. The restricted cash balances also consisted of letters of credit for rental product purchases and credit card transactions.
Legal Proceedings
From time to time in the normal course of business, various claims and litigation have been asserted or commenced against the Company. Due to uncertainties inherent in litigation and other claims, the Company can give no assurance that it will prevail in any such matters, which could subject the Company to significant liability for damages. Any claims or litigation could have an adverse effect on the Company’s results of operations, cash flows, or business and financial condition in the period the claims or litigation are resolved. Accruals for loss contingencies are recorded when a loss is probable, and the amount of such loss can be reasonably estimated. Although the results of litigation and claims cannot be predicted with certainty, the Company currently believes that the final outcome of these ordinary course matters will not have a material adverse effect on its business.
As of January 31, 2022, there was no litigation or contingency with at least a reasonable possibility of a material loss.
16.Subsequent Events
During the first quarter of fiscal year 2022, the Company amended the operating lease for its corporate headquarters in Brooklyn, NY, the terms of which partially terminated one floor of the leased space. The Company treated the partial lease termination amendment as a lease modification as of the effective date. The partial termination reduces the total minimum lease payments, as disclosed in Note 4 — Leases – Lessee Accounting, by $10.6 million.
| | |
RENT THE RUNWAY, INC. Notes to Consolidated Financial Statements |
(Dollars in millions, except share and per share amounts)
On November 14, 2022, a purported stockholder of the Company filed a putative class action lawsuit in the Eastern District of New York against the Company, certain of its officers and directors, and the underwriters of its IPO, entitled Rajat Sharma v. Rent the Runway, Inc., et al. 22-cv-6935. The complaint alleges that the defendants violated Sections 11 and 15 of the Securities Act of 1933, as amended (the “Securities Act”), by making allegedly materially misleading statements, and by omitting material facts necessary to make the statements made therein not misleading concerning, inter alia, the Company’s growth at the time of the IPO. The lawsuit seeks, among other things, compensatory damages, an award of attorneys’ fees and costs and such other relief as deemed just and proper by the court. On June 8, 2023, the court appointed Delaware Public Employees’ Retirement System and Denver Employees Retirement Plan as lead plaintiffs. On August 21, 2023, lead plaintiffs filed an amended complaint against the Company, certain of its officers and directors, and the underwriters of its IPO. The amended complaint alleges that defendants violated Sections 11, 12(a)(2) and 15 of the Securities Act by allegedly making certain false and misleading statements, and by omitting material facts necessary to make the statements made therein not misleading, concerning, among other things, the Company’s growth prospects and fulfillment costs at the time of the IPO. The lawsuit seeks an award of damages, attorney’s fees and costs, and such other relief as the court deems just and proper. All defendants have moved to dismiss the amended complaint and that motion, which was fully submitted on February 23, 2024, remains pending. The Company intends to vigorously defend itself against these claims. The Company believes it has meritorious defenses to the claims asserted in the amended complaint and any liability for such claims is not currently probable and the potential loss or range of loss is not reasonably estimable.
Item 9. Changes in and Disagreements With Accountants on Accounting and Financial Disclosure
None.
Item 9A. Controls and Procedures
Disclosure Controls and Procedures
Our management, with the participation of our principal executive officer and principal financial officer, evaluated, as of the end of the period covered by this Annual Report on Form 10-K, the effectiveness of our disclosure controls and procedures (as defined in Rules 13a-15(e) and 15d-15(e) under the Securities Exchange Act of 1934, as amended (the “Exchange Act”)). Based on our evaluation, our principal executive officer and principal financial officer have concluded that the Company’s disclosure controls and procedures (as such term is defined in Rule(s) 13a-15(e) and 15d-15(e) under the Exchange Act) were not effective as of January 31, 20222024 because of the material weaknesses in our internal control over financial reporting described below.
Material WeaknessesNotwithstanding the below identified material weaknesses, management believes the consolidated financial statements as included in Part II, Item 8 of this Annual Report on Form 10-K present fairly, in all material respects, the Company's financial condition, results of operations and cash flows as of and for the periods presented in accordance with generally accepted accounting principles in the United States.
Management’s Report on Internal Control Over Financial Reporting
Management is responsible for establishing and maintaining adequate internal control over financial reporting, as such term is defined in Rules 13a-15(f) and 15d-15(f) under the Exchange Act. Our management, under the supervision and with the participation of our principal executive officer and principal financial officer, conducted an assessment of the effectiveness of our internal control over financial reporting as of January 31, 2024, based on the framework and criteria established in Internal Control - Integrated Framework (2013) issued by the Committee of Sponsoring Organizations of the Treadway Commission. Based on this assessment, management concluded that, as of January 31, 2024, our internal control over financial reporting was not effective due to the existence of material weaknesses described below.
In connection with the audit of our financial statements as of and for the year ended January 31, 2021, we identified material weaknesses in our internal control over financial reporting. A material weakness is a deficiency, or a combination of deficiencies, in internal control over financial reporting such that there is a reasonable possibility that a material misstatement of our annual or interim financial statements will not be prevented or detected on a timely basis. As of January 31, 2022, these material weaknesses are still in the process of being remediated.
We did not maintain sufficient evidence of the operation of controls to achieve complete, accurate and timely financial accounting, reporting and disclosures nor were monitoring controls evidenced at a sufficient level to provide the appropriate level of oversight of activities related to our internal control over financial reporting. This material weakness contributed to the following additional material weaknesses:
We did not design and maintain effective controls to ensure (i) the appropriate segregation of duties in the operation of manual controls and (ii) journal entries were reviewed at the appropriate level of precision.
We did not design and maintain effective controls over information technology (“IT”) general controls for information systems and applications that are relevant to the preparation of our financial statements. Specifically, we did not design and maintain (i) program change management controls to ensure that information technology program and data changes affecting financial IT applications and underlying accounting records are identified, tested, authorized and implemented appropriately, (ii) user access controls to ensure appropriate segregation of duties and that adequately restrict user and privileged access to our financial applications, programs and data to appropriate personnel, (iii) computer operations controls to ensure that critical batch jobs are monitored and data backups are authorized and monitored and (iv) testing and approval controls for program development to ensure that new software development is aligned with business and IT requirements.
These IT control deficiencies, when aggregated, could impact maintaining effective segregation of duties, as well as the effectiveness of IT-dependent controls (such as automated controls that address the risk of material misstatement to one or more assertions, along with the IT controls and underlying data that support the effectiveness of system-generated data and reports) that could result in misstatements potentially impacting all financial statement accounts and disclosures that would not be prevented or detected.
These material weaknesses did not result in a misstatement to our annual or interim consolidated financial statements. However, each of these material weaknesses could result in a misstatement of substantially all account balances or disclosures that would result in a material misstatement to our annual or interim consolidated financial statements that would not be prevented or detected.
Notwithstanding the above identified material weaknesses, management believes the consolidated financial statements as included in Part II, Item 8 of this
This Annual Report on Form 10-K present fairly,does not include an attestation report of the Company’s independent registered public accounting firm regarding internal control over financial reporting pursuant to the JOBS Act because the Company is an “emerging growth company” as defined in all material respects,Rule 12b-2 under the Company's financial condition, results of operations and cash flows as of and for the periods presented in accordance with generally accepted accounting principles in the United States.Exchange Act.
Remediation Efforts to Address Material Weaknesses
To address theseWe continue to implement measures designed to remediate the identified material weaknesses, we have commenced actions to formalizeweaknesses. The measures include (i) formalizing the Company’s framework and policies with respect to maintaining evidence in the operation of control procedures, (ii) improving our control framework to include the appropriate segregation of duties and improve ourcontrols over the preparation and review of journal entries, and (iii) designing and implementing IT general controls segregationfor systems and applications impacting internal control over financial reporting.
We have performed extensive work with personnel responsible for the design and operating effectiveness of dutiesinternal control over financial reporting in our efforts to ensure that appropriate controls are in place and journal entry controls. In particular, weappropriate evidence is maintained. We are implementingcontinuing to implement comprehensive access control protocols for our enterprise resource planning environment in order to implement restrictions on user and privileged access to certain applications, establishing additional controls over segregation of duties and the preparation and review of journal entries, implementing controls to review the activities for those users who have privileged access and program change management controls to ensure that IT program and data changes affecting financial IT applications and underlying accounting records are identified, tested, authorized and implemented appropriately.
The implementation of these remediation efforts is in progress, may require additional expenditures to implement, and will require validation and testing of the design and operating effectiveness of internal controls over a sustained period of financial reporting cycles, and as a result, the timing of when we will be able to fully remediate the material weaknesses is uncertain. We may also conclude that additional measures may be required to remediate the material weaknesses in our internal control over financial reporting, which may necessitate additional implementation and evaluation time. We will continue to assess the effectiveness of our internal control over financial reporting and take steps to remediate the known material weaknesses expeditiously.
Changes in Internal Control Over Financial Reporting
Management’s Annual Report on Internal Control over Financial Reporting
This Annual Report on Form 10-K does not include a report of management’s assessment regarding ourThere have been no changes in the Company’s internal control over financial reporting (as defined in Rules 13a-15(f) and 15d-15(f) underthat occurred during the Exchange Act)quarter ended January 31, 2024, that have materially affected, or an attestation report of our independent registered accounting firm dueare reasonably likely to a transition period established by rules ofmaterially affect, the SEC for newly public companies. Additionally, our independent registered accounting firm will not be required to opine on the effectiveness of ourCompany’s internal control over financial reporting pursuant to Section 404 until we are no longer an “emerging growth company” as defined in the JOBS Act.
Item 9B. Other Information
None.
On April 8, 2024, Melanie Harris, Dan Nova and Carley Roney resigned as directors of the Company, effective April 15, 2024. The resignations were not a result of any disagreement with the Company on any matter relating to the Company’s operations, policies or practices. In light of the changes in Board composition, effective April 15, 2024, Emil Michael has been appointed to serve on the Audit Committee of the Board and Jenny Fleiss has been appointed to serve as Chair of the Nominating and Corporate Governance Committee of the Board,
Item 9C. Disclosure Regarding Foreign Jurisdictions that Prevent Inspections
Not applicable.
Part III
Item 10. Directors, Executive Officers, and Corporate Governance
The information required by this item is incorporated by reference from our Proxy Statement for the 20222024 Annual Meeting of Stockholders (“Proxy Statement”) to be filed with the SEC within 120 days of the year ended January 31, 2022.2024.
Item 11. Executive Compensation
The information required by this item is incorporated by reference from our Proxy Statement.
Item 12. Security Ownership of Certain Beneficial Owners and Management
The information required by this item is incorporated by reference from our Proxy Statement.
Item 13. Certain Relationships and Related Transactions and Director Independence
The information required by this item is incorporated by reference from our Proxy Statement.
Item 14. Principal Accountant Fees and Services
The information required by this item is incorporated by reference from our Proxy Statement.
Part IV
Item 15. Exhibits and Financial Statement Schedules
The following documents are filed as part of this Annual Report on Form 10-K:
1. Financial Statements
Our consolidated financial statements are listed in the “Financial Statements and Supplementary Data” under Part II, Item 8, of this Annual Report on Form 10-K.
2. Financial Statement Schedules
All financial statement schedules have been omitted because they are not required or are not applicable, or the required information is shown in our consolidated financial statements or the notes thereto.
3. Exhibits
| | Incorporated by Reference | | Filed / Furnished Herewith |
| | | | Incorporated by Reference | | | | | | Incorporated by Reference | | Filed / Furnished Herewith |
Exhibit
Number | Exhibit
Number | | Description of Exhibit | | Form | | File No. | | Exhibit | | Filing date | | Filed / Furnished Herewith |
| | 3.1 | 3.1 | | | | 8-K | | 001-40958 | | 3.1 | | 10/29/2021 | |
| | 3.1 | |
| | 3.1 | |
| 3.2 | 3.2 | | | | 8-K | | 001-40958 | | 3.2 | | 10/29/2021 | |
| 3.2 | |
| 3.2 | |
| | 3.3 | |
| | 3.3 | |
| | 3.3 | |
| | 4.1 | |
| | 4.1 | |
| | 4.1 | 4.1 | | | | S-1 | | 333-260027 | | 4.1 | | 10/04/2021 | |
| 4.2 | 4.2 | | | | S-1 | | 333-260027 | | 4.2 | | 10/04/2021 | |
| 4.2 | |
| 4.2 | |
| 4.3 | |
| 4.3 | |
| 4.3 | 4.3 | | | | S-1/A | | 333-260027 | | * | | | | | | | | | | | | * |
| 10.1+ | 10.1+ | | | | S-1/A | | 333-260027 | | 10.2 | | 10/18/2021 | |
| 10.2+ | 10.2+ | | | | S-1/A | | 333-260027 | | 10.3 | | 10/18/2021 | |
| 10.2+ | |
| 10.2+ | |
| 10.3+ | |
| 10.3+ | |
| 10.3+ | 10.3+ | | | | S-1/A | | 333-260027 | | 10.4 | | 10/18/2021 | |
| 10.4+ | 10.4+ | | | | S-1/A | | 333-260027 | | 10.5 | | 10/18/2021 | |
| 10.4+ | |
| 10.4+ | |
| 10.5+ | |
| 10.5+ | |
| 10.5+ | 10.5+ | | | | S-1/A | | 333-260027 | | 10.6 | | 10/18/2021 | |
| 10.6+ | 10.6+ | | | | S-1/A | | 333-260027 | | 10.7 | | 10/18/2021 | |
| 10.6+ | |
| 10.6+ | |
| 10.7+ | 10.7+ | | | | S-1/A | | 333-260027 | | 10.8 | | 10/18/2021 | |
| 10.7+ | |
| 10.7+ | |
| 10.8+ | |
| 10.8+ | |
| 10.8+ | 10.8+ | | | | S-1/A | | 333-260027 | | 10.9 | | 10/18/2021 | |
| | 10.9+ | 10.9+ | | | | S-1/A | | 333-260027 | | 10.10 | | 10/18/2021 | |
| | 10.10+ | | | | S-1/A | | 333-260027 | | 10.11 | | 10/18/2021 | |
| 10.9+ | |
| | 10.9+ | |
|
| | | | | | | | | | | | | | | | | | | | | | | | | | | | | | | | | | | | | | |
| 10.11+ | | | | S-1/A | | 333-260027 | | 10.12 | | 10/18/2021 | | |
| | | | | | | | | | | | |
| 10.12+ | | | | S-1/A | | 333-260027 | | 10.1 | | 10/18/2021 | | |
| | | | | | | | | | | | |
| 10.13+ | | | | S-1/A | | 333-260027 | | 10.13 | | 10/18/2021 | | |
| | | | | | | | | | | | |
| 10.14+ | | | | S-1/A | | 333-260027 | | 10.14 | | 10/22/2021 | | |
| | | | | | | | | | | | |
| 10.15+ | | | | S-1/A | | 333-260027 | | 10.19 | | 10/18/2021 | | |
| 10.16+ | | | | 10-Q | | 001-40958 | | 10.9 | | 12/10/2021 | | |
| 10.17+ | | | | S-1/A | | 333-260027 | | 10.15 | | 10/18/2021 | | |
| 10.18+ | | | | S-1/A | | 333-260027 | | 10.16 | | 10/18/2021 | | |
| 10.19+ | | | | S-1/A | | 333-260027 | | 10.17 | | 10/18/2021 | | |
| 10.20+ | | | | S-1/A | | 333-260027 | | 10.18 | | 10/18/2021 | | |
| 10.21† | | Seventh Amendment to the Credit Agreement dated as of July 23, 2018, dated as of October 18, 2021 (as previously amended on December 21, 2018, April 24, 2019, November 26, 2019, June 2, 2020, August 18, 2020, and October 26, 2020), and as may be further amended, restated, supplemented or otherwise modified in accordance with the terms thereof), by and among the Company, the lenders from time to time party thereto and Double Helix Pte Ltd, as administrative agent. | | S-1/A | | 333-260027 | | 10.20 | | 10/18/2021 | | |
| 10.22 | | | | 8-K | | 001-40958 | | 10.1 | | 10/29/2021 | | |
| 10.23† | | | | S-1 | | 333-260027 | | 10.21 | | 10/04/2021 | | |
| 10.24† | | | | S-1 | | 333-260027 | | 10.22 | | 10/04/2021 | | |
| 10.25† | | | | S-1/A | | 333-260027 | | 10.23 | | 10/18/2021 | | |
| 10.26† | | | | S-1/A | | 333-260027 | | 10.24 | | 10/18/2021 | | |
| 10.27† | | | | | | | | | | | | * |
| | | | | | | | | | | | | | | | | | | | | | | | | | | | | | | | | | | | | | |
| 10.10+ | | | | S-1/A | | 333-260027 | | 10.11 | | 10/18/2021 | | |
| | | | | | | | | | | | |
| 10.11+ | | | | S-1/A | | 333-260027 | | 10.12 | | 10/18/2021 | | |
| | | | | | | | | | | | |
| 10.12+ | | | | S-1/A | | 333-260027 | | 10.1 | | 10/18/2021 | | |
| | | | | | | | | | | | |
| 10.13+ | | | | S-1/A | | 333-260027 | | 10.13 | | 10/18/2021 | | |
| | | | | | | | | | | | |
| 10.14+ | | | | S-1/A | | 333-260027 | | 10.14 | | 10/22/2021 | | |
| | | | | | | | | | | | |
| 10.15+ | | | | S-1/A | | 333-260027 | | 10.15 | | 10/18/2021 | | |
| 10.16 | | | | 10-Q | | 001-40958 | | 10.1 | | 6/10/2022 | | |
| 10.17+ | | | | S-1/A | | 333-260027 | | 10.16 | | 10/18/2021 | | |
| 10.18+ | | | | S-1/A | | 333-260027 | | 10.17 | | 10/18/2021 | | |
| 10.19†X | | Seventh Amendment to the Credit Agreement dated as of July 23, 2018, dated as of October 18, 2021 (as previously amended on December 21, 2018, April 24, 2019, November 26, 2019, June 2, 2020, August 18, 2020, and October 26, 2020), and as may be further amended, restated, supplemented or otherwise modified in accordance with the terms thereof), by and among the Company, the lenders from time to time party thereto and Double Helix Pte Ltd, as administrative agent. | | S-1/A | | 333-260027 | | 10.20 | | 10/18/2021 | | |
| 10.20 | | | | 8-K | | 001-40958 | | 10.1 | | 10/29/2021 | | |
| 10.21†X | | | | S-1 | | 333-260027 | | 10.21 | | 10/04/2021 | | |
| 10.22†X | | | | S-1 | | 333-260027 | | 10.23 | | 10/04/2021 | | |
| 10.237†X | | | | S-1 | | 333-260027 | | 10.24 | | 10/04/2021 | | |
| 10.24† | | | | 10-K | | 001-40958 | | 10.27 | | 4/14/2022 | | |
| | | | | | | | | | | | | | | | | | | | | | | | | | | | | | | | | | | | | | |
| 10.25 | | Eighth Amendment to the Credit Agreement dated as of August 15, 2022 (as previously amended on July 23, 2018, December 21, 2018, April 24, 2019, November 26, 2019, June 2, 2020, August 18, 2020, October 26, 2020, and October 18, 2021), and as may be further amended, restated, supplemented or otherwise modified in accordance with the terms thereof), by and among the Company, the lenders from time to time party thereto and Double Helix Pte Ltd. as administrative agent | | 10-Q | | 001-40958 | | 10.1 | | 9/13/2022 | | |
| 10.26 | | | | 10-K | | 001-40958 | | 10.3 | | 4/13/2023 | | |
| 10.27†X | | Tenth Amendment to the Credit Agreement, dated as of December 1, 2023, (as previously amended on July 23, 2018, December 21, 2018, April 24, 2019, November 26, 2019, June 2, 2020, August 18, 2020, October 26, 2020, October 18, 2021 and January 31, 2023), by and among the Company, the lenders from time to time party thereto and Double Helix Pte Ltd., as administrative agent. | | | | | | | | | | * |
| 10.28+ | | | | 8-K | | 001-40958 | | 10.1 | | 1/09/2024 | | |
| 10.29+ | | | | 10-Q | | 001-40958 | | 10.1 | 10.1 | 12/06/2023 | 45266 | |
| 10.30+ | | | | 8-K | | 001-40958 | | 10.1 | | 4/12/2023 | | |
| 10.31+ | | | | 8-K | | 001-40958 | | 10.2 | | 4/12/2023 | | |
| 10.32† | | | | | | | | | | | | * |
| 10.33+ | | | | | | | | | | | | * |
| 21.1 | | | | | | | | | | | | * |
| 23.1 | | | | | | | | | | | | * |
| 31.1 | | | | | | | | | | | | * |
| | | | | | | | | | | | |
| 31.2 | | | | | | | | | | | | * |
| | | | | | | | | | | | |
| 32.1 | | | | | | | | | | | | ** |
| | | | | | | | | | | | |
| 32.2 | | | | | | | | | | | | ** |
| 97.1 | | | | | | | | | | | | * |
| | | | | | | | | | | | |
| 101.INS | | Inline XBRL Instance Document - the instance document does not appear in the Interactive Data File because its XBRL tags are embedded within the Inline XBRL document. | | | | | | | | | | * |
| | | | | | | | | | | | |
| | | | | | | | | | | | | | | | | | | | | | | | | | | | | | | | | | | | | | |
21.1 | | | | | | | | | | | | * |
23.1 | | | | | | | | | | | | * |
31.1 | | | | | | | | | | | | * |
| | | | | | | | | | | | |
31.2 | | | | | | | | | | | | * |
| | | | | | | | | | | | |
32.1 | | | | | | | | | | | | ** |
| | | | | | | | | | | | |
32.2 | | | | | | | | | | | | ** |
| | | | | | | | | | | | |
101.INS | | Inline XBRL Instance Document - the instance document does not appear in the Interactive Data File because its XBRL tags are embedded within the Inline XBRL document. | | | | | | | | | | * |
| | | | | | | | | | | | |
| 101.SCH | | Inline XBRL Taxonomy Extension Schema Document | | | | | | | | | | * |
| | | | | | | | | | | | |
| 101.CAL | | Inline XBRL Taxonomy Extension Calculation Linkbase Document | | | | | | | | | | * |
| | | | | | | | | | | | |
| 101.DEF | | Inline XBRL Taxonomy Extension Definition Linkbase Document | | | | | | | | | | * |
| | | | | | | | | | | | |
| 101.LAB | | Inline XBRL Taxonomy Extension Label Linkbase Document | | | | | | | | | | * |
| | | | | | | | | | | | |
| 101.PRE | | Inline XBRL Taxonomy Extension Presentation Linkbase Document | | | | | | | | | | * |
| | | | | | | | | | | | |
| 104 | | Cover Page Interactive Data File (formatted as Inline XBRL and contained in Exhibit 101) | | | | | | | | | | * |
| | | | | | | | | | | | |
* Filed herewith
** Furnished herewith
+ Indicates management contract or compensatory plan
† Certain portions of this exhibit (indicated by “[***]”) have been omitted pursuant to Regulation S-K, Item (601)(b)(10) because the omitted information (i) is not material and (ii) is treated as confidential by the Company
X Certain schedules (or similar attachments) to this exhibit have been omitted pursuant to Regulation S-K, Item 601(a)(5). The registrant agrees to furnish a copy of any omitted schedule (or similar attachment) to the Securities and Exchange Commission upon request.
Item 16. Form 10-K Summary
None.
SIGNATURES
Pursuant to the requirements of Sections 13 or 15(d) of the Securities Exchange Act of 1934, the registrant has duly caused this Report to be signed on its behalf by the undersigned thereunto duly authorized.
| | | | | | | | |
| RENT THE RUNWAY, INC. |
| | |
Date: April 14, 202211, 2024 | By: | /s/ Jennifer Y. Hyman |
| | Jennifer Y. Hyman |
| | Chief Executive Officer |
Pursuant to the requirements of the Securities Exchange Act of 1934, this Report has been signed below by the following persons on behalf of the registrant and in the capacities and on the dates indicated.
| | | | | | | | | | | | | | |
| Signature | | Title | | Date |
| /s/ Jennifer Y. Hyman | | Chief Executive Officer and Director (Principal Executive Officer) | | April 14, 202211, 2024 |
| Jennifer Y. Hyman | | |
| | | | |
/s/ Scarlett O’SullivanSiddharth Thacker | | Chief Financial Officer (Principal Financial Officer and Principal Accounting Officer) | | April 14, 202211, 2024 |
Scarlett O’SullivanSiddharth Thacker | | |
| | | | |
| /s/ Tim Bixby | | Director | | April 14, 202211, 2024 |
| Tim Bixby | | |
| | | | |
| /s/ Jennifer Fleiss | | Director | | April 14, 202211, 2024 |
| Jennifer Fleiss | | |
| | | | |
| /s/ Scott Friend | | Director | | April 14, 202211, 2024 |
| Scott Friend | | |
| | | | |
| /s/ Melanie Harris | | Director | | April 14, 202211, 2024 |
| Melanie Harris | | |
| | | | |
| /s/ Beth Kaplan | | Director | | April 14, 202211, 2024 |
| Beth Kaplan | | |
| | | | |
| /s/ Emil Michael | | Director | | April 11, 2024 |
| Emil Michael | | |
| | | | |
| /s/ Dan Nova | | Director | | April 14, 202211, 2024 |
| Dan Nova | | |
| | | | |
| /s/ Gwyneth Paltrow | | Director | | April 14, 202211, 2024 |
| Gwyneth Paltrow | | |
| | | | |
| /s/ Carley Roney | | Director | | April 14, 202211, 2024 |
| Carley Roney | | |
| | | | |
| /s/ Dan Rosenweig | | Director | | April 14, 2022
Dan Rosenweig | | |
| | | | |
| /s/ Mike Roth | | Director | | April 14, 202211, 2024 |
| Mike Roth | | |