UNITED STATES
SECURITIES AND EXCHANGE COMMISSION
Washington, DC 20549
FORM 10-K
xAnnual Report Pursuant to Section 13 OR 15(d) of the Securities Exchange Act of 1934
| |
| x | Annual Report Pursuant to Section 13 OR 15(d) of the Securities Exchange Act of 1934 |
For the Fiscal Year Ended December 31, 20102013
oTransition Report Pursuant to Section 13 or 15(d) of the Securities Exchange Act of 1934
| |
| o | Transition Report Pursuant to Section 13 or 15(d) of the Securities Exchange Act of 1934 |
For the transition period from to .
Commission File Number:
000-51515
CORE-MARK HOLDING COMPANY, INC.
(Exact name of registrant as specified in its charter)
|
| |
| Delaware | 20-1489747 |
| (State or other jurisdiction of incorporation or organization) | (I.R.S. Employer Identification No.) |
| | |
395 Oyster Point Boulevard, Suite 415 South San Francisco, California 94080 | (650) 589-9445 |
| (Address of Principal Executive Offices, including Zip Code) | (Registrant's Telephone Number, including Area Code) |
Securities Registered Pursuant to Section 12(b) of the Act:
|
| |
Title of each class | Name of each exchange on which registered |
| Common Stock, par value $0.01 per share | NASDAQ Global Market |
Securities registered pursuant to Section 12(g) of the Act: None
Indicate by check mark if the registrant is a well-known seasoned issuer, as defined in Rule 405 of the Securities Act.
Yes ox No xo
Indicate by check mark if the registrant is not required to file reports pursuant to Section 13 or Section 15(d) of the Act. Yes o No x
Indicate by check mark whether the registrant (1) has filed all reports required to be filed by Section 13 or 15(d) of the Securities Exchange Act of 1934 during the preceding 12 months (or for such shorter period that the registrant was required to file such reports), and (2) has been subject to such filing requirements for the past 90 days. Yes x No o
Indicate by check mark whether the registrant has submitted electronically and posted on its corporate Web site, if any, every Interactive Data File required to be submitted and posted pursuant to Rule 405 of Regulation S-T during the preceding 12 months (or for such shorter period that the registrant was required to submit and post such files). Yes ox No o
Indicate by check mark if disclosure of delinquent filers pursuant to Item 405 of Regulation S-K is not contained herein, and will not be contained, to the best of registrant's knowledge, in definitive proxy or information statements incorporated by reference in Part III of this Form 10-K or any amendment to this Form 10-K. o
Indicate by check mark whether the registrant is a large accelerated filer, an accelerated filer, a non-accelerated filer, or a smaller reporting company. See the definitions of “large accelerated filer,” “accelerated filer” and “smaller reporting company” in Rule 12b-2 of the Exchange Act. |
| |
Large accelerated filer ox | Accelerated filer xo |
Non-accelerated filer o | Smaller reporting company o |
(Do not check if a smaller reporting company) |
Indicate by check mark whether the registrant is a shell company (as defined in Rule 12b-2 of the Act). Yes o No x
State the aggregate market value of the voting and non-voting common equity held by non-affiliates computed by reference to the price at which the common equity was last sold, or the average bid and asked price of such common equity, as of June 30, 201028, 2013, the last business day of the registrant's most recently completed second fiscal quarter: $289,526,950.$711,883,006
As of February 28, 201114, 2014, the Registrantregistrant had 11,282,05611,532,968 shares of its common stock issued and outstanding.
DOCUMENTS INCORPORATED BY REFERENCE
See PartsThe information called for by Part III and IV. Registrant's Proxy Statement for the 2011 Annual Meeting of Stockholders isthis Form 10-K will be included in an amendment to this Form 10-K or incorporated by reference to Part III in this Form 10-K.the registrant's 2014 definitive proxy statement to be filed pursuant to Regulation 14A.
FORM 10-K
FOR THE YEAR ENDED DECEMBER 31, 2013
SPECIAL NOTE REGARDING FORWARD-LOOKING STATEMENTS
Except for historical information, the statements madeStatements in this Annual Report on Form 10-K that are not statements of historical fact are forward-looking statements made pursuant to the safe-harbor provisions of the Private Securities Litigation ReformExchange Act of 1995. Forward-looking statements are based on certain assumptions or estimates, discuss future expectations, describe future plans1934 and strategies, contain projectionsthe Securities Act of results of operations or of financial conditions or state other forward-looking information. Our ability to predict results or the actual effect of future plans or strategies is inherently uncertain.1933.
Although we believe that the expectations reflected in such forward-looking statements are based on reasonable assumptions, actual results and performance could differ materially from those set forth in the forward-looking statements. Forward-looking statements in some cases can be identified by the use of words such as “may,” “will,” “should,” “potential,” “intend,” “expect,” “seek,” “anticipate,” “estimate,” “believe,” “could,” “would,” “project,” “predict,” “continue,” “plan,” “propose” or other similar words or expressions. These forward-lookingForward-looking statements are made only as of the date of this Form 10-K and are based on theour current intent, beliefs, plans and expectations of our management and are subject to certainexpectations. They involve risks and uncertainties that could cause actual results to differ materially from historical results or those discusseddescribed in or implied by such forward-looking statements.
FactorsA detailed discussion of risks and uncertainties that mightcould cause or contributeactual results and events to differ materially from such differences include, but are not limited to, our dependence on the convenience retail industry for our revenues; uncertain economic conditions; competition; price increases; our dependence on relatively few suppliers; the low-margin nature of cigarette and consumable goods distribution; certain distribution centers' dependence on a few relatively large customers; competitionforward-looking statements is included in the labor market; product liability claims and manufacturer recalls of products; fuel price increases; our dependence on our senior management; our ability to successfully integrate acquired businesses; currency exchange rate fluctuations; our ability to borrow additional capital; governmental regulations and changes thereto, including the Family Smoking Prevention and Tobacco Control Act which was signed into law in June 2009 and granted the U.S. Food & Drug Administration the authority to regulate the production and marketing of tobacco products in the U.S.; earthquake and natural disaster damage; failure or disruptions to our information systems; a greater decline than anticipated in cigarette sales volume; our ability to implement marketing strategies; our reliance on manufacturer discount and incentive programs; tobacco and other product liability claims; and competition from sales of deep-discount cigarette brands and illicit and other low priced sales of cigarettes. Refer to Part I, Item 1A, “Risk Factors” of this Form 10-K. Except as providedrequired by law, we undertake no obligation to publicly update or revise any forward-looking statements, whether as a result of new information, future events or otherwise.
SEC Regulation G - Non-GAAP Information
The financial statements in this Annual Report are prepared in accordance with generally accepted accounting principles in the United States of America (“GAAP”). Core-Mark Holding Company, Inc. (“Core-Mark”) uses certain non-GAAP financial measures including remaining gross profit, remaining gross profit margin, Adjusted EBITDA and net sales, less excise taxes. We believe these non-GAAP financial measures provide meaningful supplemental information for investors regarding the performance of our business and facilitate a meaningful period to period evaluation. Management uses these non-GAAP financial measures in order to have comparable financial results to analyze changes in Core-Mark’s underlying business. These non-GAAP measures should be considered as a supplement to, and not as a substitute for, or superior to, financial measures calculated in accordance with GAAP.
PART I
ITEM 1. BUSINESS
Unless the context indicates otherwise, all references in this Annual Report on Form 10-K to Core-Mark, the Company, we, us,“Core-Mark”, “the Company”, “we”, “us”, or our“our” refer to Core-Mark Holding Company, Inc. and its subsidiaries.
Company Overview
Core-Mark is one of the largest marketers of fresh and broad-line supply solutions to the convenience retail industry in North America, in terms of annual sales, providing sales and marketing, distribution and logistics services to customer locations across the U.S. and Canada. Our origins date back to 1888, when Glaser Bros., a family-owned-and-operated candy and tobacco distribution business, was founded in San Francisco, California.
Core-Mark offers retailers the ability to participate intake advantage of manufacturer and Company-sponsored sales and marketing programs, merchandising and product category management services as well asand the use of information systems and data services that are focused on minimizing retailers' investment in inventory, while seeking to maximize their sales.sales and profits. In addition, our wholesale distributing capabilities provide valuable services to both manufacturers of consumer products and convenience retailers. Manufacturers benefit from our broad retail coverage, inventory management, efficiency in processing small orders and efficient processingfrequency of small orders.deliveries. Convenience retailers benefit from our distribution capabilities by gaining access to a broad product line, optimizing inventory management and accessing trade credit.
We operate in an industry where, in 2009,2012, based on the NACSNational Association forof Convenience and Petroleum Retailing 2010Stores (NACS) 2013 State of the Industry (“SOI”) Report, total in-store sales at convenience retail locations in the U.S. increased 4.9%2.2% to approximately $182.4$199 billion and were generated through an estimated 145,000approximately 149,000 stores. According to a more recent report from NACS, the number of convenience stores across thegrew 1.4% in 2013 to approximately 151,000 stores. The U.S. We estimate that approximately 50% of the products that these stores sell are supplied by wholesale distributors such as Core-Mark. The convenience retail industry gross profit for in-store sales wasdecreased 1.3% to approximately $58.6$62.5 million in 2012 from $63.3 billion in 2009 and $55.6 billion in 2008.2011. Over the ten years from 19992003 through 2009,2013, U.S. convenience in-store sales increased by a compounded annual growth rate of 6.2%5.5%. In Canada, based on the Canadian Convenience Store Association (CCSA) 2013 Industry Report, we estimate that total in-store sales at convenience locations were approximately $23.1 billion generated through approximately 23,100 stores.
We operate a network of 28 distribution centers (excluding two distribution facilities we operate as a third party logistics provider) in the U.S. and Canada, which distribute a diverse line of national, regional and private label convenience store products to approximately 26,000over 30,000 customer locations in all 50 states ofin the U.S. and five Canadian provinces. The products we distribute include cigarettes, other tobacco products, candy, snacks, fast food, groceries, fresh products, dairy, bread, non-alcoholic beverages, general merchandise and health and beauty care products. Cigarettes comprised approximately 68.0% of our total net sales in 2013, while approximately 70.5% of our gross profit in 2013 was generated from our food/non-food products.
We service traditional convenience stores as well as alternative outlets selling consumer packaged goods. We estimate that on average 45% to 50% of the products sold in convenience products.stores are supplied by broad-line wholesale distributors such as Core-Mark. Our traditional convenience store customers include many of the major national and super-regional convenience store operators, as well as thousands of multi- and single-store customers. Our alternative outlet customers comprise a variety of store formats, including druggrocery stores, grocerydrug stores, liquor stores, cigarette and tobacco shops, hotel gift shops, military exchanges, college bookstores,and corporate campuses, casinos, movie theaters, hardware stores, airport concessions and airport concessions.other specialty and small format stores that carry convenience products.
We operate a network of 24 distribution centers (excluding two distribution facilities we operate as a third party logistics provider) in the U.S. and Canada. We distribute approximately 43,000 Stock Keeping Units ("SKUs") of packaged consumable goods to our customers and also provide an array of information and data services that enable our customers to better manage retail product sales and marketing functions.
In 2010, our consolidatedOur net sales increased grew from $7.3 billion in 2010 to $9.8 billion in 2013, yielding an annual compounded growth rate of approximately 10%, while our annual Adjusted EBITDA11.3%(1) increased from $70.0 million to $7,266.8$109.5 million, from $6,531.6 million in 2009. Cigarettes comprisedor approximately 70.5%16%, compounded annually during the same period. Our growth has been driven primarily by our business strategies described more fully below. We believe these strategies have positioned us to continue to grow our approximate 4% market share of total netin-store sales within the convenience store channel in 2010, while approximately 69.0%North America and to take advantage of our gross profit was generated from food/non-food products.growth opportunities with other retail store formats.
| |
| (1) | Adjusted EBITDA is a non-GAAP financial measure and should be considered as a supplement to, and not as a substitute for, or superior to, financial measures calculated in accordance with GAAP. Adjusted EBITDA is equal to net income adding back net interest expense, provision for income taxes, depreciation and amortization, LIFO expense, stock-based compensation expense and net foreign currency transaction losses. |
Competitive Strengths
We believe we have the following fundamental competitive strengths, which areform the foundation offor our business strategy:
Experience in the Industry. Our origins date back to 1888, when Glaser Bros., a family-owned-and-operated candy and tobacco distribution business, was founded in San Francisco, California. The executive management team, as of the end of 2013, comprised of our CEO and 14 senior managers, hashad an average tenure of over 1520 years and applies theirapplied its expertise to critical functional areas including logistics, sales and marketing, purchasing, information technology, finance, business development, human resources and retail store support.
Innovation &and Flexibility. Wholesale distributors typically provide convenience retailers access to a broad product line, the ability to place small quantity orders, inventory management and access to trade credit. As a large, full-service wholesale distributor, we offer retailers the ability to participate ina wide array of manufacturer and Company-sponsored sales and marketing programs, merchandising and product category management services as well asand the use of information systems that are focused on minimizing retailers' investment in inventory, while seeking to maximize their sales.sales and profit.
Distribution Capabilities. The wholesale distribution industry is highly fragmented and historically has consisted of a large number of small, privately-owned businesses and a small number of large, full-service wholesale distributors serving multiple geographic regions. Relative to smaller competitors, large distributors such as Core-Mark benefit from several competitive advantages including: increased purchasing power, the ability to service large national chain accounts, economies of scale in sales and operations, the ability to spread fixed costs over a larger revenue base and the resources to invest in information technology and other productivity enhancing technology.productivity-enhancing technologies.
Business Strategy
Our objective is to increase overall return to shareholdersstockholders by growing our market share, revenues and profitability. To achieve that objective, we have becomeAs one of the largest marketers of fresh and broad-line supply solutions to the convenience retail industry in North America. In orderAmerica, with the proven capability of effectively selling into other retail channels, we are well-positioned to continue meeting this objective. Our business strategy also includes the following initiatives, designed to further enhance the value we provide to our value to the retailer, we plan to:retail customers:
DriveLeverage our Vendor Consolidation Initiative (“VCI”). We expect our VCI program will allow us to continue to grow our sales by capitalizing on the highly fragmented nature of the distribution channelsupply chain that services the convenience retail industry. A convenience retailer generally receives store merchandise through a large number of uniquedirect-store deliveries. This represents a highly inefficient and costly process for the individual stores.retailers. Today, we estimate that Core-Mark sells on average 45% to 50% of what a convenience retailer purchases from their vendors. Our VCI program offers convenience retailersthe retailer the ability to receive one deliverymultiple weekly deliveries for the bulk of their products, including dairy and other perishable items, thus simplifyingmerchandise they would historically purchase from direct-store-delivery companies. This simplifies the supply chain and eliminatingprovides retailers with an opportunity to improve inventory turns and working capital, eliminate operational costs.and transaction costs, and greatly diminish their out-of-stocks on best-selling items.
Deliver Fresh Products. We believe there is an increasing trend among consumers to purchase fresh food and dairy products from convenience stores.and other retail formats. To meet this expected demand, we have modified and upgraded our refrigerated capacity, including investing in chill docks state-of-the-art ordering devices and tri-temperature trailers, which enables usprovides the infrastructure to deliver a significant range of chilled items including milk, produce and other fresh foods to retail outlets. We have also established partnerships with strategically locatedstrategically-located dairies, fresh kitchens and bakeries and commissaries to further enable us to deliver the freshest product possible.possible, with premium consumer items such as sandwiches, wraps, cut-fruit, parfaits, pastries, doughnuts, bread and home meal replacement solutions. We continue to expand the deliveryarray of fresh products through the development of unique and comprehensive marketing programs and we have rebrandedequipment programs that assist the Company to properly reflect the role this freshretailer in showcasing their “fresh” product line will play in our and the industry's future.offering. We believe our investments in infrastructure, and branding, combined with our strategically located suppliers and in-house expertise, position us as the leader in providing fresh products and programs to the convenience stores.retail industry. Proper execution of VCI, with the cornerstone being dairy distribution, provides Core-Mark the critical mass necessary to offer retailers a multiple weekly delivery platform, which facilitates the proper handling and dating of "Fresh" products.
Expand our Presence Eastward. We believe there is significant opportunity for us to increase our market sharepresence and revenue growth by continuing to expand our presence east of the Mississippi.Mississippi River. According to The Association for Convenience & Petroleum Retailing 2010the 2013 SOI Report, during 2009,2012, aggregate U.S. traditional convenience retail in-store sales were approximately $182.4$199 billion through approximately 145,000149,000 stores with the majority61% of those stores located eastin the eastern portion of the Mississippi.country. We believe our continued expansion eastwardin the Eastern U.S. will be accomplished through acquisitions and by acquiringgaining new customers, both national and regional, through a combination of exemplary service, VCI programs, fresh product deliveries, innovative marketing strategies, and competitive pricing.
In January 2008,Some of our recent expansion activities include:
On May 7, 2013, we openedsigned a three year distribution agreement with Turkey Hill, a subsidiary of the Kroger Co. (“Kroger”) and the largest of Kroger's convenience divisions, to service all their convenience stores, which are located across
Pennsylvania, Ohio and Indiana. With the addition of the Turkey Hill stores, we serviced approximately 700 Kroger convenience locations as of December 31, 2013.
On December 17, 2012, we acquired J.T. Davenport & Sons, Inc. (“Davenport”), a large convenience wholesaler based in North Carolina, which services customers in the eight states of North Carolina, South Carolina, Georgia, Maryland, Ohio, Kentucky, West Virginia and Virginia. This acquisition increased our market presence primarily in the Southeastern United States and further enhanced our ability to cost effectively service national and regional retailers.
On September 7, 2011, we signed a distribution agreement (“the Customer Agreement”) with Alimentation Couche-Tard Inc. ("Couche-Tard") to service Couche-Tard corporate stores, under the Circle K brand, within Couche-Tard's Southeast, Gulf Coast and Florida markets. We added a new distribution facility near Toronto, Ontario. This facility expanded our existing market geographylocated in Canada. Tampa, Florida in 2011 as a result of the Customer Agreement. As of December 31, 2013, we serviced nearly 1,000 Circle K stores in these markets.
In addition to organic growth, we intend to explore select acquisitions of other wholesale distributors which complement our business. In June 2008,May 2011, we acquired Auburn Merchandise Distributors, Inc.Forrest City Grocery Company (“AMD” or “New England”) to further expand our presence and infrastructure in the Northeastern region of the U.S. In August 2010, we acquired Finkle Distributors, Inc. (“FDI”FCGC”), a convenience wholesalerregional wholesale distributor providing Core-Mark with additional infrastructure and market share by servicing customers in New York, PennsylvaniaArkansas, Mississippi, Tennessee and the surrounding states, to continue to expand our market share in the Northeastern region of the U.S. (see Note 3 -- Acquisitions to our consolidated financial statements).states.
Continue Building Sustainable Competitive Advantage. We believe our ability to increase sales and profitability with existing and new customers is highly dependent upon our ability to deliver consistently high levels of service, innovative marketing programs, and information technology solutions and logistics support. To that fundamental end, we are committed to further improving operational efficiencies in our distribution centers while containing our costs in order to enhance profitability. To further enhance our competitive advantage, we have beenWe were one of the first to recognize emerging trends and to offer retailers our unique marketing programsstrategic solutions such as VCI and Fresh. In addition, we continue to leverage our Focused Marketing Initiative (“FMI”), which is designed to drive deeper entrenchment with our customer base and to further differentiate us in the market place. The FMI program is centered on increasing the sales and profitability of the independent store through improved category insights, optimized retail price strategy, demographic decision-making along with providing Core-Mark's marketing solutions to create a complete retail marketing strategy. We believe this innovationour innovative approach, which focuses on building a trusted partnership with our customers, has established us as the market leader in providing valuable marketing and supply chain solutions into the convenience retail industry.
Customers, Products and Suppliers
We service approximately 26,000over 30,000 customer locations in all 50 states ofin the U.S. and five Canadian provinces. Our customers represent manyprimary customer base consists of the large national, regional, and regionalindependent convenience retailers in the U.S. and CanadaCanada. In addition, we are expanding our distribution into alternative channels including drug stores and leading alternative outlet customers.large-scale retailers. Our top ten customers accounted for approximately 32.6%35.4% of our net sales in 2010, and no single2013 including Couche-Tard, our largest customer, which accounted for 10% or more14.7% of our total sales in 2010.net sales.
Below is a comparison of our net sales mix by primary product category for the last three years (in millions):
| | | | Year ended December 31, | | | | | | | | | | | | | |
| | | 2010 | | 2009 | | 2008 | Year Ended December 31, |
| | | Net Sales | | % of Net Sales | | Net Sales | | % of Net Sales | | Net Sales | | % of Net Sales | 2013 | | 2012 | | 2011 |
| Product Category | | Net Sales | | % of Net Sales | | Net Sales | | % of Net Sales | | Net Sales | | % of Net Sales |
| Cigarettes | | $ | 5,119.7 | | | 70.5 | % | | $ | 4,589.1 | | | 70.3 | % | | $ | 4,124.8 | | | 68.2 | % | $ | 6,642.0 |
| | 68.0 | % | | $ | 6,139.4 |
| | 69.0 | % | | $ | 5,710.6 |
| | 70.4 | % |
| Food | | 840.9 | | | 11.6 | % | | 738.0 | | | 11.3 | % | | 710.1 | | | 11.7 | % | 1,342.3 |
| | 13.7 |
| | 1,178.6 |
| | 13.4 |
| | 995.7 |
| | 12.3 |
|
| Candy | | 426.0 | | | 5.8 | % | | 405.0 | | | 6.2 | % | | 401.3 | | | 6.7 | % | 527.2 |
| | 5.4 |
| | 489.5 |
| | 5.5 |
| | 459.8 |
| | 5.7 |
|
| Other tobacco products | | 503.6 | | | 6.9 | % | | 434.0 | | | 6.6 | % | | 402.7 | | | 6.7 | % | 787.8 |
| | 8.1 |
| | 687.8 |
| | 7.7 |
| | 607.9 |
| | 7.5 |
|
| Health, beauty & general | | 220.6 | | | 3.0 | % | | 209.5 | | | 3.2 | % | | 220.1 | | | 3.6 | % | 327.3 |
| | 3.4 |
| | 269.2 |
| | 3.0 |
| | 237.5 |
| | 2.9 |
|
| Non-alcoholic beverages | | 152.0 | | | 2.1 | % | | 151.7 | | | 2.3 | % | | 180.9 | | | 3.0 | % | |
| Beverages | | 139.1 |
| | 1.4 |
| | 125.6 |
| | 1.4 |
| | 100.9 |
| | 1.2 |
|
| Equipment/other | | 4.0 | | | 0.1 | % | | 4.3 | | | 0.1 | % | | 5.0 | | | 0.1 | % | 1.9 |
| | — |
| | 2.3 |
| | — |
| | 2.5 |
| | — |
|
| Total food/non-food products | | 2,147.1 | | | 29.5 | % | | 1,942.5 | | | 29.7 | % | | 1,920.1 | | | 31.8 | % | 3,125.6 |
| | 32.0 |
| | 2,753.0 |
| | 31.0 |
| | 2,404.3 |
| | 29.6 |
|
| Total net sales | | $ | 7,266.8 | | | 100.0 | % | | $ | 6,531.6 | | | 100.0 | % | | $ | 6,044.9 | | | 100.0 | % | $ | 9,767.6 |
| | 100.0 | % | | $ | 8,892.4 |
| | 100.0 | % | | $ | 8,114.9 |
| | 100.0 | % |
Cigarette Products. We purchase cigarette products from major U.S. and Canadian manufacturers. With cigarettes accounting for approximately $5,119.7$6,642.0 million, or 70.5%68.0% of our total net sales, and 31.0%29.5% of our total gross profit in 2010,2013, we control major purchases of cigarettes centrally in order to optimize inventory levels and purchasing opportunities. The daily replenishment of inventory and brand selection is controlled by our distribution centers.
In the U.S., legislation was introduced in 2008 to fund the State Children's Health Insurance Program (“SCHIP”) by raising the federal cigarette excise tax from 39¢ to $1.01 per pack. Federal excise tax is included as a component of our product cost charged by the manufacturer. The legislation, which was signed into law in February 2009, became effective April 1, 2009. As a result, our net cigarette sales were inflated in 2009, due primarily to the significant price increases from manufacturers in response to the SCHIP legislation.
U.S. and Canadian cigarette consumption has generallysteadily declined over the last ten years.from 2002 to 2012. Based on 2010the 2012 statistics provided by the Tobacco Merchants Association (“TMA”) published in early 2011 and2013 compiled from the U.S. Department of Agriculture-EconomicAgriculture - Economic Research Service, total cigarette consumption in the U.S. declined from 456425 billion cigarettes in 20002002 to 299294 billion cigarettes in 2010,
2012, or 34%a compounded annual decline of approximately 3.6%. PriorTotal cigarette consumption also declined in Canada from 37 billion cigarettes in 2002 to 2007, we had benefited from25 billion cigarettes in 2012, or a shift in cigarette and tobacco sales to the convenience retail segmentcompounded annual decline of approximately 3.8%, based on statistics reportedprovided by NACS. In 2010, convenience retailers were the largest trade class for cigarette sales accounting for approximately 70% ofTMA. Our total industry volume according to the R.J. Reynolds' 2010 Industry Report. The shift in cigarette carton sales from other channelsincreased 7.6% in 2013 attributable primarily to our acquisition of Davenport in December of 2012 and net market gain shares. Excluding the acquisition of Davenport, our carton sales in the U.S. declined 1.8%. Our carton sales in Canada decreased 7.5% in 2013 on a comparative basis to the convenience retail segment may no longer be adequateprior year due primarily to compensate forthe loss of two non-major customers in the fourth quarter of 2012. Although we anticipate overall cigarette consumption declines. However,will continue to decline, we expect to offset the majority of the impact from these declines through market share expansion, growth in our non-cigarette categories and incremental gross profit that resultsfrom cigarette manufacturer price increases. We expect cigarette manufacturers will continue to raise prices as carton sales decline in order to maintain or enhance their overall profitability.
Total cigarette consumption also declined in Canada from 43 billion cigarettes in 2000 to 25 billion cigarettes in 2010, or a 42% reduction in consumption, based on the 2010 statistics provided by TMA.
In 2010, our carton sales in the U.S. increased 1.1%, excluding the impact resulting from the acquisition of Finkle Distributors, Inc., in August 2010. Our carton sales in Canada increased 7.5% primarily through market share gains driven by our expansion in the Toronto market.
We have no long-term cigarette purchase agreements and buy substantially all of our products on an as neededas-needed basis. Cigarette manufacturers historically have offeredoffer structured incentive programs to wholesalers based on maintaining market share and executing promotional programs. These programs are subject to change by the manufacturers without notice.
In addition to exciseExcise taxes are levied by the federal government, excise taxes on cigarettes and other tobacco products by the U.S. and Canadian federal governments and are also imposed by the various states, localities and provinces. We collect state, local and provincial excise taxes from our customers and remit these amounts to the appropriate authorities.authorities based on the credit terms, if applicable, extended by each jurisdiction. Excise taxes are a significant component of our revenuenet sales and cost of sales. During 2010, we included in2013, net sales and cost of sales included offsetting amounts of approximately $1,756.5$2,050.8 million ofrelated to state, local and provincial excise taxes. As of December 31, 2010,2013, state cigarette excise taxes in the U.S. jurisdictions we serve ranged from $0.17 per pack of 20 cigarettes in the state of Missouri to $4.35 per pack of 20 cigarettes in the state of New York. In the Canadian jurisdictions we serve, provincial excise taxes ranged from C$2.47 per pack of 20 cigarettes in Ontario to C$5.485.80 per pack of 20 cigarettes in the Northwest Territories.
Manitoba. Federal excise taxes are levied on the manufacturers who pass the tax on to us as part of the product cost and thus are not a component of our excise taxes.
Food/Non-food Products. Our food products include fast food, candy, snacks, groceries, non-alcoholic beverages and fresh products such as sandwiches, juices, salads, produce, dairy and bread. Our non-food products include cigars, tobacco, health and beauty care products, general merchandise and equipment. SalesNet sales of the combined food/non-food product categories grew 10.5%13.5% in 20102013 to $2,147.1$3,125.6 million, which was 29.5%32.0% of our total net sales. More specifically, sales in the food category grew 13.9% to $1,342.3 million, by far the largest contributor to our overall food/non-food sales improvement. This is consistent with our strategy to grow food/non-food products at a faster pace than cigarettes through a combination of market share gains and execution of our VCI, Fresh, FMI and acquisition strategies.
Gross profitsprofit for food/non-food categories grew $6.7$52.8 million, or 2.6%16.2%, to $265.9$378.6 million in 2013, which was 69.0%70.5% of our total gross profit. Food/non-food products generated gross margins of 13.40%13.0% excluding excise taxes in 2010,2013, while the cigarette category generated gross margins of 3.39%3.3% excluding excise taxes. Gross margin growth in our food/non-food categories was negatively impacted by a $5.3 million reduction in floor stock income dueIn order to lower manufacturers' price inflation.
Due totake advantage of the significantly higher margins earned by food/non-food products, two of our key business strategies, VCI and ourthe delivery of fresh initiative,products, focus primarily on the higherhighest margin categories in the foodfood/non-food group. TheseThere is a special emphasis on fresh categories, which include items such as milk, fresh bread, fresh sandwiches, fresh fruit, fresh produce, fresh baked goods, healthy snackshome meal replacements and home replacement meals. This drive toward more healthy andother fresh foods being sold in the convenience markets is a recognized major trend in the industry.products. We have invested amade significant amount of capital investments over the years to position our Company to havecreate the proper infrastructure to successfully deliver these highly perishable items. Our objective
Another primary aspect of our VCI strategy is to consolidatetake cost out of the current fragmented naturesupply chain by putting more of convenience store vendor distribution by consolidating suchthe product that the retailers purchase on our delivery trucks. We targeted $100 million of incremental sales for the last five years, which contributed to the growth in our food/non-food sales and gross profit dollars. In addition, our FMI strategy was created to assist our independent retailer to sell more food/non-food items as dairy and bread and to increase profitability.
We completed five acquisitions between 2006 and 2012. At the time of acquisition, most of these companies generally had a higher index of cigarette sales than our company-wide average; however, through our marketing programs we are able to grow “fresh food”the higher margin food/non-food categories of these acquired businesses as we bring our strategies to their customers. In addition, our market share forhas grown steadily over the customers we service as they fight forlast several years, due, in part, to our capability to deliver fresh and perishable categories. We believe that fresh items are increasingly driving consumer “share of stomach” fordecisions, and fresh foods with other retailers. Ultimately the defragmentation of vendor deliveries coupled with market share gains in fresh foods for the stores we serviceproducts will increase our customers' sales and profits and in turn improve our sales and profits.
continue to be an important category going forward.
Our Suppliers. We purchase products for resale from approximately 4,4004,700 trade suppliers and manufacturers located across the U.S. and Canada. In 2010,2013, we purchased approximately 62%64% of our products from our top 20 suppliers, with our top two suppliers, Philip Morris USA, Inc. and R.J. Reynolds representingTobacco Company, accounting for approximately 28% and 13%14% of our purchases, respectively. We coordinate our purchasing from suppliers by negotiating, on a corporate-wide basis, special arrangements to obtain volume discounts and additional incentives, while also taking advantage of promotional and marketing incentives offered to us as a wholesale distributor. In addition, buyers in each of our distribution facilities purchase products, particularly food, directly from the manufacturers, improving product mix and availability for individual markets.
Seasonality
We typically generate slightly higher revenuesnet sales and higher gross profits during the warm weather months (May(April through September) than in other times throughout the year. We believe this occurs because the convenience store industry which we serve tends to be busier during this period due to vacationvacations and travel. Duringother travel by consumers. We generated approximately 53%, 52% and 53% of our net sales during the second and third quarters of 2010, 20092013, 2012, and 2008, we generated approximately 53% of our net sales for each fiscal year.2011, respectively.
Operations
We operate a network of 2428 distribution centers in the U.S. and Canada (excluding two distribution facilities we operate as a third party logistics provider). TwentyTwenty-four of our distribution centers are located in the U.S. and four are located in Canada. The map below depicts the scope of our operations and the names of our distribution centers.
Map of Operations
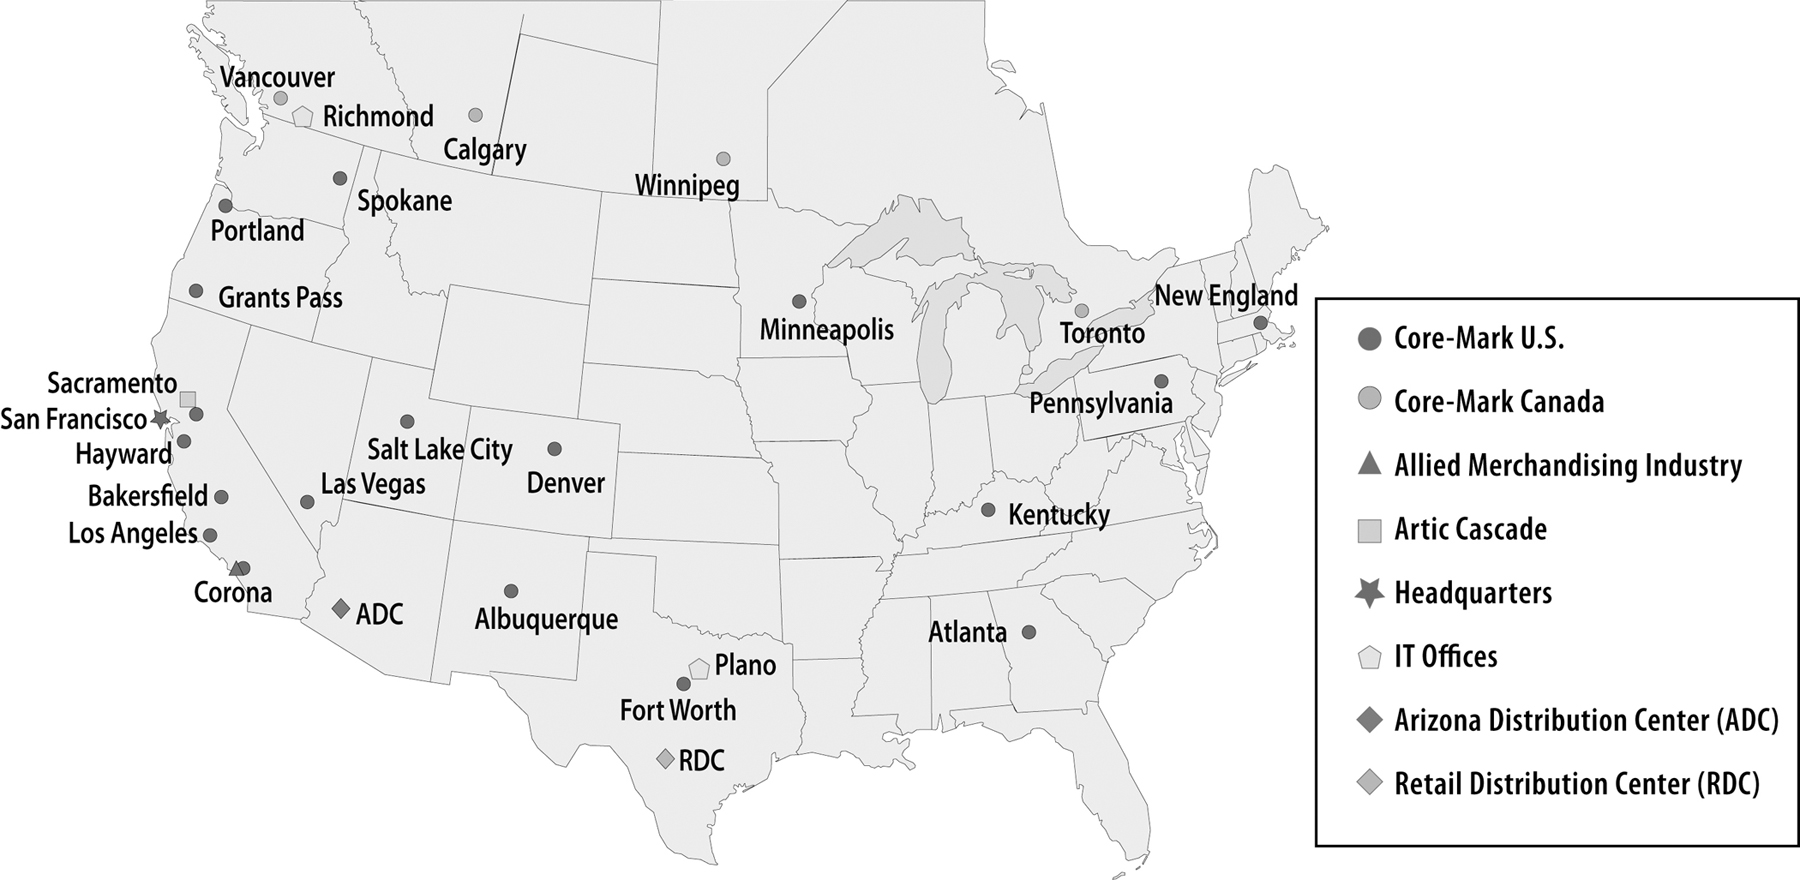
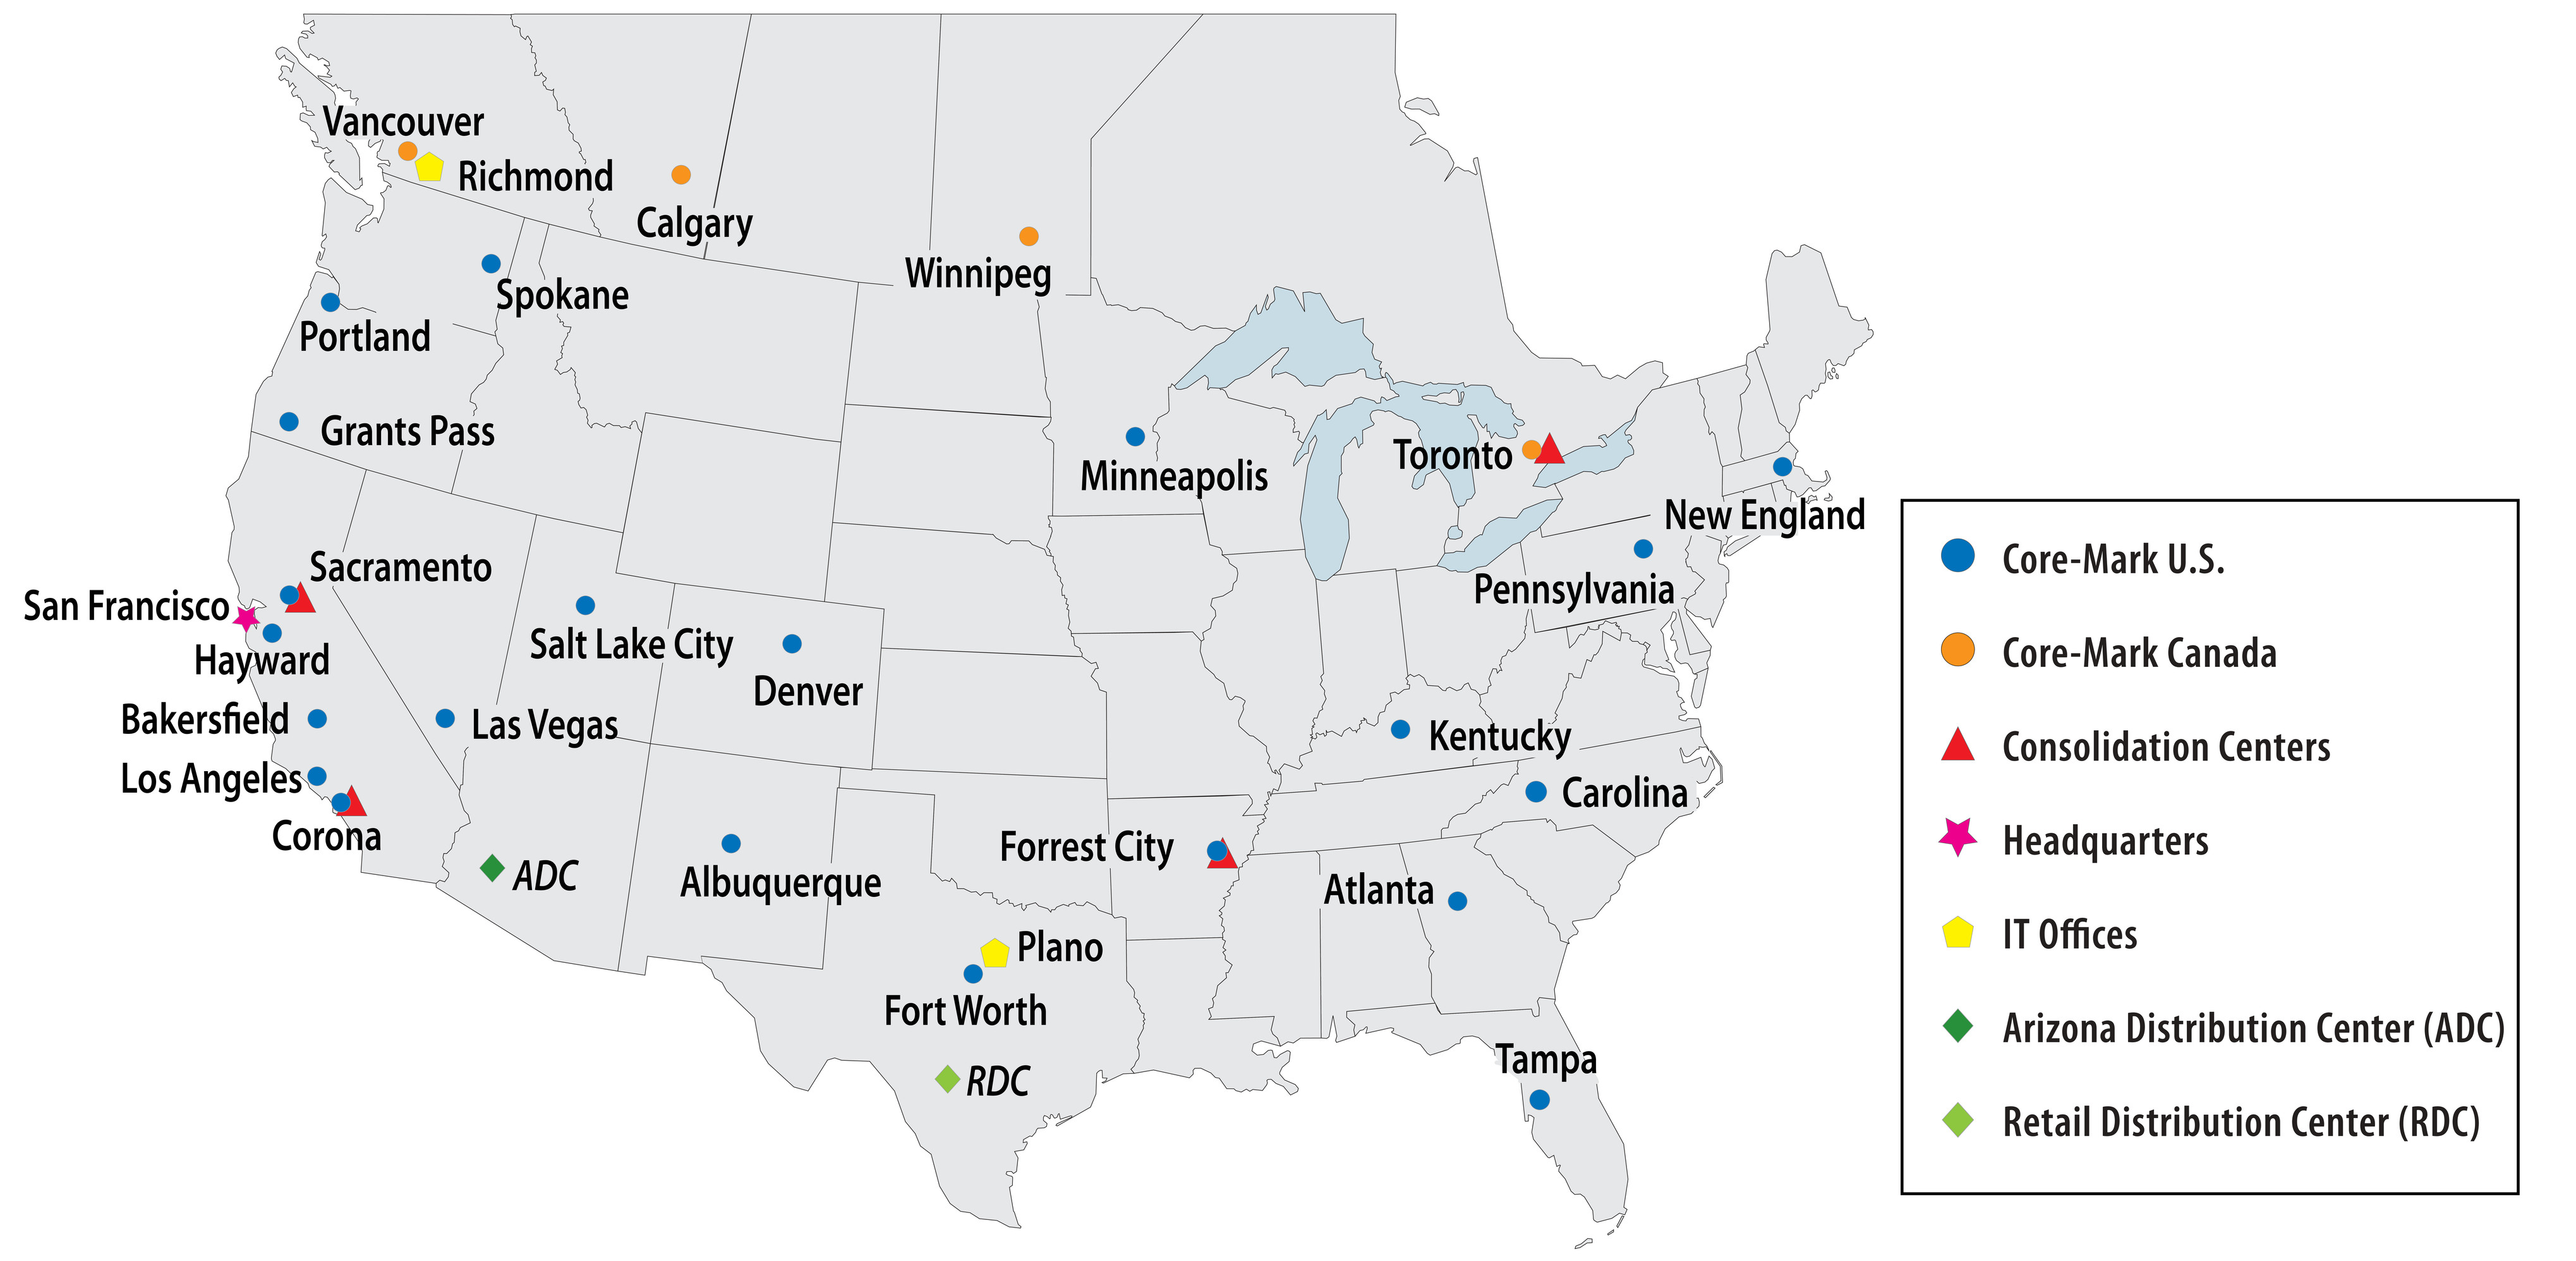
Two of the facilities weWe operate four consolidation centers, including one that opened in Toronto, Canada in the U.S., Artic Cascade and Allied Merchandising Industry, are consolidating warehousesfourth quarter of 2013, which buy products from our suppliers in bulk quantities and then distribute the products to many of our other distribution centers. By using Artic Cascade, located in Sacramento, California, to obtainThe products at lower cost frompurchased by our consolidation centers include frozen product vendors, we are able to offer a broader selection of quality products to retailers at more competitive prices. Allied Merchandising Industry, located in Corona, California, purchases the majority of our non-food products, other than cigarettes and tobacco products, for our distribution centers, enabling us to reduce our overall general merchandise andchilled items, health and beauty care product inventory.and general merchandise products. The new center in Toronto was launched with an exclusive distribution arrangement with a retail beverage manufacturer. We expect to obtain additional consolidated purchasing opportunities for Canada in 2014. We operate two additional facilities as a third party logistics provider. One distribution facility located in Phoenix, Arizona, referred to as the Arizona Distribution Center (“ADC”), is dedicated solely to supporting the logistics and management requirements of one of our major customers, Alimentation Couche-Tard Inc.Couche-Tard. The second distribution facility located in San Antonio, Texas, referred to as the Retail Distribution Center (“RDC”), is dedicated solely to supporting another major customer, CST Brands, Inc. (formerly, Valero Energy Corporation.Corporation).
We purchase a variety of brand name and private label products, totaling approximately 43,000in excess of 53,000 SKUs, including approximately 1,700 cigarette products, from our suppliers and manufacturers. Cigarette products represent less than 5% of our total SKUs purchased. We offer customers a variety of food and food/non-food products, including fast food, candy, snacks, groceries, fresh products, dairy, bread, non-alcoholic beverages, other tobacco products, general merchandise and health and beauty care products.
A typical convenience store order consists of a mix of dry, frozen and chilled products. Our receivers, stockers, order selectors, stampers, forklift drivers and loaders received, storedstocked and picked approximately 454615 million, 426551 million and 435476 million items (a carton of 10 packs of cigarettes is one item) or 7196 million, 6586 million and 6671 million cubic feet of product, during the years ended December 31, 2010, 20092013, 2012 and 2008,2011, respectively, while limiting the service error rate to approximately twoless than 2.7 errors per thousand items shipped in 2010.
Our proprietary Distribution Center Management System ("DCMS") platform provides our distribution centers with the flexibility to adapt to our customers' information technology requirements in an industry that does not have a standard information technology platform. Actively integrating our customers onto our platform is a priority which enables fast, efficient and reliable service.2013.
Our proprietary Distribution Center Management System platform provides our distribution centers with the flexibility to adapt rapidly to changing business needs and allows them to provide our customers with necessary information technology requirements and integration capabilities.
Distribution
At December 31, 2010,2013, we had approximately 9911,300 transportation department personnel, including delivery drivers, shuttle drivers, routers, training supervisors and managers who focus on achieving safe, on-time deliveries. Our daily orders are picked and loaded nightly in reverse order of scheduled delivery. At December 31, 2010,2013, our trucking fleet consisted of approximately 700over 800 tractors, trucks and vans, of which nearlymostly all were leased. We have made a significant investment over the past few years in upgrading our trailer fleet to tri-temperature (“tri-temp”), which gives us the capability to deliver frozen, chilled and non-refrigerated goods in one delivery. As of December 31, 2010,2013, approximately 70%80% of our trailers were tri-temp, with the remainder capable of delivering refrigerated and non-refrigerated foods. This provides us the multiple temperature zone capability needed to support our focus on delivering fresh products to our customers. In addition, in 2013, we began converting portions of our fleet to tractors, which use compressed natural gas ("CNG"). At December 31, 2013, we had 57 CNG tractors. We plan to convert a large portion of our fleet to CNG tractors in order to lower our fuel costs with the added benefit of reducing carbon emissions. Our fuel consumption costs for 2010in 2013 totaled approximately $9.5$16.9 million, net of fuel surcharges passed on to customers, which represented an increase of approximately $4.6 million,16%, from $4.9$14.6 million in 2009,2012, due primarily to higher fuel prices, a 6.9%11.9% increase in miles driven excluding FDI,due to the addition of Davenport and the acquisition of FDI.growth in our business.
Competition
We estimate that, as of December 31, 2010,2013, there were overapproximately 300 wholesale distributors serving traditional convenience retailers in the U.S. and Canada. We believe that McLane Company, Inc., a subsidiary of Berkshire Hathaway, Inc., and Core-Mark are the two largest convenience wholesale distributors measured(measured by annual sales,sales) in North America. There are alsotwo other large regional companies that provide products to specific regionsareas of the country, such as The H.T. Hackney Company in the Southeast and Eby-Brown Company in the Midwest and Mid-Atlantic and Southeast and GSC Enterprises, Inc. in Texas and surrounding states, andregions. In addition there are several hundred local distributors serving small regional chains and independent convenience retailers. In Canada, there are feweris one large national company, Wallace & Carey, Inc., one regional company, which services the Ontario market, Karrys Bros., Limited, and more recently one large national grocery wholesaler, Sobeys Inc., aside from Core-Mark, that make up the competitive landscape.
Beyond the traditional wholesale distributors compared to the U.S. In addition,supply channels, we face potential competition from at least three other supply avenues. First, certain manufacturers such as The Coca Cola Company, Hostess Brands, Inc., Frito- Lay North America, Inc.Budweiser, Miller-Coors, Coca-Cola, Frito-Lay and PepsiCo Inc. deliver their products directly to convenience retailers. Secondly, club wholesalers such as Costco and Sam's Club provide a limited selection of products at generally competitive prices; however, they often have limited delivery options and limited services. Finally, some large convenience retail chains self-distribute products due to the geographic density of their stores and their belief that they can economically service such locations.
Competition within the industry is based primarily on the range and quality of the services provided, price, variety of products offeredproduct selection and the reliability of deliveries.wholesalers' logistics. We operate from a perspective that focuses heavily on flexibility and providing outstanding customer service through our distribution centers, order fulfillment rates, on-time delivery performance using delivery equipment sized for the small format store, innovative marketing solutions and merchandising support, as well as competitive pricing. We believe this represents a contrast to some large competitors whothat offer a standardized logistics approach, with emphasis on uniformity of product lines, and company determined delivery schedules using large delivery equipment designed for large format stores, while also providing competitive order fulfillment rates and pricing. Thestores. While this emphasis on thea standardized logistics approach while responsive toallows for competitive pricing, iswe do not in our opinionbelieve it is best suited for retailers looking for more customized solutions and support from their supply partners in addition to competitive pricing. SomeAlternatively, some small competitors focus on customer service and long standinglong-standing customer relationships but often times lack the range of offerings of the larger distributor.distributors. We believe that our unique combination of service, marketing solutions and price is a compelling combination that is highly attractive to customersretailers and mayhelps to enhance their growth and profitability.
WeIn the U.S. we purchase cigarettes primarily from manufacturers covered by the tobacco industry's Master Settlement Agreement (“MSA”), which was signed in November 1998. Competition amongst cigarette wholesalers is based primarily on service, price and variety, whereas competition amongst manufacturers for cigarette sales is based primarily on brand positioning, price, product attributes, consumer loyalty, promotions, marketing and retail presence. Cigarette brands produced by the major tobacco product manufacturers generally require competitive pricing, substantial marketing support, retail programs and other financial incentives to maintain or improve a brand's market position. Historically, major tobacco product manufacturers have had a competitive advantage in the U.S. because significant cigarette marketing restrictions and the scale of investment required to compete made gaining consumer awareness and trial of new brands difficult.
We also face competition from the diversion into the U.S. and Canadian markets of cigarettes intended for sale outside of such markets, including the sale of cigarettes in non-taxable jurisdictions, inter-state/provincial and international smuggling of cigarettes,
the sale of counterfeit cigarettes by third parties, increased imports of foreign low priced brands, the sale of cigarettes by third parties over the internet and by other means designed to avoid collection of applicable taxes, including the saletaxes. The competitive environment has been characterized by a continued influx of cigarettes in non-taxable jurisdictions, importscheap products that challenge sales of foreign, low-priced brandshigher priced and the diversion into the U.S. market of cigarettes intended for sale outside the U.S. fully taxed cigarettes.
We also believe the competitive environment has been impacted by alternative smoking products, such as snus, electronic cigarettes and snuff, higherthe emergence of nicotine consumption through vapor devices. In addition, cigarette prices continue to rise due to higher federal and statecontinuing pressure on taxing jurisdictions to raise revenues through excise taxes andtaxes. Further, cigarette list price increasesprices have historically increased for cigarettes manufactured bythose manufacturers who are parties to the MSA, and the impact of restrictions on marketing imposed by the U.S. Food and Drug Administration ("FDA").MSA. As a result, the lowestlower priced products of numerous small share brands manufactured by companies that are not parties to the MSAnon-MSA participants have held their market share, putting profitability pressure on the profitability of premium cigarettes.MSA products.
Working Capital Practices
We sell products on credit terms to our customers that averaged, as measured by days sales outstanding, about nine days for 2010, 2009each of 2013, 2012 and 2008.2011. Credit terms may impact pricing and are competitive within our industry. An increasing number of our
customers remit payment electronically, which facilitates efficient and timely monitoring of payment risk. Canadian days sales outstanding in receivables tend to be lower as Canadian industry practice is for shorter credit terms than in the U.S.
We maintain our inventory of products based on the level of sales of the particular product and manufacturer replenishment cycles. The number of days a particular item of inventory remains in our distribution centers varies by product and is principally driven by the turnover of that product and economic order quantities. We typically order and carry in inventory additional amounts of certain critical products to assure high order fulfillment levels for these items. Periodically, we may carry higher levels of inventory to take advantage of anticipated manufacturer price increases. The number of days of cost of sales in inventory averaged about 1516 days during 2010, 2009in each of 2013, 2012 and 2008.
2011 with the cigarette category averaging 10 days and food/non-food categories averaging 30 days. We obtain terms from our vendors and certain taxing jurisdictions based on industry practices, and consistent with our credit standing. We take advantage of the full complement of term offerings, which may include enhanced cash discounts for earlier payment.payment or prepayment. Terms for our accounts payable and cigarette and tobacco taxes payable range anywhere from three days prepaid to 60 days credit. Days payable outstanding for both categories, excluding the impact of prepayments, during 2010each of 2013, 2012 and 20092011 averaged about 11 days, compared to 12 days in 2008.days.
Employees
The following chart provides a breakdown of our employees by function and geographic region (including employees at our third party logistic facilities) as of December 31, 2010:2013:
TOTAL EMPLOYEES BY BUSINESS FUNCTIONS
| | | | | U.S. | | Canada | | Total | U.S. | | Canada | | Total |
| Sales and Marketing | | 1,091 | | | 83 | | | 1,174 | | 1,256 |
| | 65 |
| | 1,321 |
|
| Warehousing and Distribution | | 2,376 | | | 267 | | | 2,643 | | 3,255 |
| | 297 |
| | 3,552 |
|
| Management, Administration, Finance and Purchasing | | 478 | | | 104 | | | 582 | | 628 |
| | 116 |
| | 744 |
|
| Total Categories | | 3,945 | | | 454 | | | 4,399 | | 5,139 |
| | 478 |
| | 5,617 |
|
Three of our distribution centers, Hayward, Las Vegas and Calgary, have employees who are covered by collective bargaining agreements with local affiliates of The International Brotherhood of Teamsters (Hayward and Las Vegas) and United Food and Commercial Workers (Calgary). Approximately 213210 employees, or 4.8%4% of our workforce, are unionized. There have been no disruptions in customer service, strikes, work stoppages or slowdowns as a result of union activities, and we believe we have satisfactory relations with our employees.
Regulation
As a distributor of food products in the U.S., we are subject to the Federal Food, Drug and Cosmetic Act and regulations promulgated by the FDA.U.S. Food and Drug Administration (“FDA”). The FDA regulates the holding requirements for foodsfood products through its current good manufacturing practice regulations, specifies the standards of identity for certain foods and prescribes the format and content of certain information required to appear on food product labels. A limited number of the over-the-counter medications that we distribute are subject to the regulations of the U.S. Drug Enforcement Administration.Administration (“DEA”). In Canada, similar standards related to food and over-the-counter medications are governed by Health Canada. The products we distribute are also subject to federal, state, provincial and local regulation through such measures as the licensing of our facilities, enforcement by state, provincial and local health agencies of relevant standards for the products we distribute and regulation of our trade practices in connection with the sale of our products. Our facilities are inspected periodically by federal, state, provincial and local authorities, including the Occupational Safety and Health Administration under the U.S. Department of Labor (“OSHA”), which require us to comply with certain health and safety standards to protect our employees.
We are also subject to regulation by numerous other federal, state, provincial and local regulatory agencies including, but not limited to, the U.S. Department of Labor, which sets employment practice standards for workers, the U.S. and Canadian Departments of Transportation, which regulate transportation of perishable goods, and similar state, provincial and local agencies. Non-compliance with, or significant changes to, these laws or the implementation of new laws, could have a material effect on our results of operations.
In September 2011, the Tobacco Products Labeling Regulations (Cigarettes and Little Cigars) came into force in Canada with strengthened labeling requirements for cigarettes and little cigar packages. The requirements include graphic health warnings and health information messages which are prominently displayed on the front and back of most tobacco packages and focus primarily on the health hazards posed by tobacco use.
We voluntarily participate in random quality inspections of all of our distribution centers, conducted by the American Institute of Baking (“AIB”). The AIB publishes standards as a tool to permit operators of distribution centers to evaluate the food safety risks within their operations and determine the levels of compliance with the standards. AIB conducts an inspection, which is composed of food safety and quality criteria. AIB conducts its inspections based on five categories: adequacy of the company's
food safety program, pest control, operational methods and personnel practices, maintenance of food safety and cleaning practices. Within these five categories, the AIB evaluates over 100 criteria items. AIB's independent evaluation is summarized and posted on its website for our customers' review. In 2010, nearly 97%2013, 96.8% of the audits of our distribution centers received the highest rating from the AIB with the remaining 3% receiving the second highest rating.
a score of 900 or greater (on a possible 1,000 point scale).
Registered Trademarks
We have registered trademarks including the following: Arcadia Bay®, Arcadia Bay Coffee Company®, BOONDOGGLES™, Cable Car®, Core-Mark®, Core-Mark International®, EMERALD®,, Java Street®, QUICKEATS®, Richland ValleyTM, SmartStock®, and Tastefully Yours®..
Segment and Geographic Information
We operate in two reportable geographic segmentsareas -- the U.S. and Canada. See Note 15 --16 - Segment and Geographic Information to our consolidated financial statements.
Corporate and Available Information
The office of ourOur corporate headquarters is located at 395 Oyster Point Boulevard, Suite 415, South San Francisco, California, 94080 and theour telephone number is (650) 589-9445.
Our internet website address is www.core-mark.com. We provide free access to various reports that we file with or furnish to the U.S. Securities and Exchange Commission (“SEC”) through our website, as soon as reasonably practicable after they have been filed or furnished. These reports include, but are not limited to, our annual reports on Form 10-K, quarterly reports on Form 10-Q and any amendments to those reports. Our SEC reports can be accessed through the “Investor Relations” section of our website under “Financials and Filings”, or through www.sec.gov. Also available on our website are printable versions of Core-Mark's Audit Committee Charter, Compensation Committee Charter, Nominating and Corporate Governance Committee Charter, Code of Business Conduct and Ethics, and Corporate Governance Guidelines and Principles.Principles and other corporate information. Copies of these documents may also be requested from:
Core-Mark International
395 Oyster Point Blvd, Suite 415
South San Francisco, CA 94080
Attention: Investor Relations
Corporate Governance-Governance---CodeCode of Business Conduct and Ethics and Whistle Blower Policy:
Our Code of Business Conduct and Ethics is designed to promote honest, ethical and lawful conduct by all employees, officers and directors and is postedavailable on the “Investor Relations” section of our website at www.core-mark.com under “Corporate Governance.”
Additionally, the Audit Committee (“Audit Committee”) of the Board of Directors of Core-Mark has established procedures to receive, retain, investigate and act on complaints and concerns of employees, shareholdersstockholders and others regarding accounting, internal accounting controls and auditing matters, including complaints regarding attempted or actual circumvention of internal accounting controls or complaints regarding violations of the Company's accounting policies. The procedures are also described inon our website address at www.core-mark.com under Corporate Governance“Corporate Governance” in the “Investor Relations” section.
ITEM 1. A. RISK FACTORS
You should carefully consider the following risks together with allOur business is subject to a variety of risks. Set forth below are certain of the other information contained in this Annual Report on Form 10-K. Additionalimportant risks and uncertainties not currently known to us may also materially adversely affect our business, financial condition or resultsthat we face, the occurrence of operations.
This Annual Report on Form 10-K contains forward-looking statements that involve risks and uncertainties. Our actual results may differ significantly from the results discussed in the forward-looking statements. Factors that might cause such differences include, but are not limited to, the risk factors set forth below(see Special Note Regarding Forward-Looking Statements prior to Item 1. Business).
Risks Related to the Economy and Market Conditions
Current difficult economic conditions may reduce demand for our products and increase credit risks.
Continuing difficult economic conditions, including increased unemployment and underemployment rates, significant declines in real estate values, large losses to consumer retirement and investment accounts and increases in food prices, have resulted in reduced consumer confidence and curtailed consumer spending. If these economic conditions persist or deteriorate further, we expect that convenience retail operators will experience continued weakness and further reductions in same store sales, which will adversely affect demand for our products and lead to reduced sales and increased pressures on margins. In addition, ongoing uncertainty in the financial markets and the resulting pressures on liquidity may place a number of our convenience retail customers under financial stress, which could increase our credit risk and potential bad debt exposure. These economic and market conditions may have a material adverse effect on our business, and operating results.
Our business is sensitive to gasoline prices and related transportation costs, whichfinancial condition or results of operations. These risks are not the only ones we face. We could adversely affect business.
Our operating results are sensitive to, and mayalso be adversely affected by unexpected increases in fuel or other transportation-related costs, including costs from the use of third party carriers, temporary staff and overtime. Our retailers have reportedadditional factors that are presently unknown to us or that when gasoline prices increased they have experienced a decrease in the proportion of their customers' expenditures on food/non-food products comparedwe currently believe to customers' expenditures on cigarettes. The shift in expenditures may place pressure on our sales and gross margins since sales of food/non-food products result in higher margins than sales of cigarettes do.
Historically, we have been able to pass on a substantial portion of increases in our own fuel or other transportation costsbe immaterial to our customers in the form of fuel surcharges, but our ability to continue to pass through price increases, either from manufacturers or costs incurred in the business, including fuel costs, is not assured. If we are unable to continue to pass on fuel and transportation-related cost increases to our customers, our operating results could be materially and adversely affected.
As a result of recent recessionary economic conditions, our pension plan is currently underfunded and we will be required to make cash payments to the plan, reducing the cash available for our business.
We record a liability associated with the underfunded status of our pension plans when the benefit obligation exceeds the fair value of the plan assets. Included in claims liabilities on our balance sheet as of December 31, 2010 is $8.5 million related to the underfunded pension obligation compared with $11.6 million as of December 31, 2009. The decrease in the underfunded status of our pension plans from 2009 to 2010 is due primarily to an increase in Company contributions and a higher return than expected on invested plan assets for 2010. If the performance of the assets in the plan does not meet our expectations, or if other actuarial assumptions are modified, our future cash payments to the plan could be substantially higher than we expect. We contributed $3.4 million to our plan in 2010, compared to $0.2 million and $0.4 million in 2009 and 2008, respectively. The pension plan is subject to the Employee Retirement Income Security Act of 1974 ("ERISA"). Under ERISA, the Pension Benefit Guaranty Corporation ("PBGC") has the authority to terminate an underfunded pension plan under limited circumstances. In the event our pension plan is terminated for any reason while it is underfunded, we will incur a liability to the PBGC that may be equal to the entire amount of the underfunding in the pension plan.
Risks Related to Our Business and Industry
We are dependent on the convenience retail industry, for our revenues, and our results of operations wouldcould suffer if there isit experiences an overall decline or consolidation in the convenience retail industry.consolidation.
The majority of our sales are made under purchase orders and short-term contracts with convenience retail stores which inherently involve significant risks. These risks include declining sales in the convenience retail industry due to general economic conditions, credit exposureincluding rising gasoline prices, which may impact “in store” retail sales, competition from our customers,grocery stores and other retail outlets, termination of customer relationships without notice,and consolidation of our customer basebase. Such events could cause us to experience decreases in revenues and consumer movement toward purchasing from club stores. Anyput pressure on our margins. In addition, any decline in the convenience store industry may place a number of these factorsour convenience retail customers under financial stress, which could negatively affectincrease our resultscredit risk and potential bad debt exposure.
Many of operations.
We face competitionthe markets in our distribution marketswhich we compete are highly competitive and if we are unable to compete effectively in any distribution market, we may lose market share and suffer a decline in sales and profitability.profitability in these markets if we are unable to outperform our competition.
Our distribution centers operate in highly competitive markets. We face competition from local, regional and national tobacco and consumable products distributors on the basis of service, price, reliability, delivery schedules, and variety of products offered, schedulesoffered. We also face competition from club stores and reliability of deliveries and the range and quality of services provided.alternate sources that sell consumable products to convenience retailers. Some of our competitors, including aMcLane Company, Inc. (a subsidiary of Berkshire Hathaway Inc., McLane Company, Inc., the largest convenience wholesale distributor in the U.S.), have substantial financial resources and long standinglong-standing customer relationships. In addition, heightened competition among our existing competitors, or by new entrants into the distribution market, could create additional competitive pressures that may reduce our margins and adversely affect our business. If we fail to successfully respond to these competitive pressures or to implement our strategies effectively, we may lose market share and our results of operations could suffer.
IncreasingOur failure to maintain relationships with large customers could potentially harm our business.
We have relationships with many large regional and national convenience store chains. While we expect to maintain these relationships for the growth and profitability of our distribution business is particularly dependent upon our ability to retain existing customers and attract additional customers. The ability to attract additional customers through our existing network of distribution centers is especially important because it enables us to leverage our distribution centers and other fixed assets. Our ability to retain existing customers and attract new customers is dependent upon our ability to provide industry-leading customer service, offer competitive products at low prices, maintain high levels of productivity and efficiencyforeseeable future, any termination, non-renewal or reduction in distributing products to our customers while integrating new customers into our distribution system, and offer marketing, merchandising and ancillary services that we provide value to such customers could cause our customers. If we are unablerevenues and operating results to execute these tasks effectively, we may not be able to attract a significant number of new customers and our existing customer base could decrease, either or both of which could have an adverse impact on our results of operations.suffer.
We may lose business if cigarettemanufacturers or other manufacturers decidelarge retail customers convert to engage in direct distribution of their products.
In the past, certain large manufacturers and customers have elected to engage in direct distribution or third party distribution of their products and eliminate wholesale distributors such as Core-Mark. If other manufacturers or retail customers make similar decisionselections in the future, our revenues and profits would be adversely affected and there can be no assurance that we will be able to take actionmitigate such losses.
Our business is sensitive to compensate for such losses.fuel prices and related transportation costs, which could adversely affect our business.
Our operating results are sensitive to, and may be adversely affected by, unexpected increases in fuel or other transportation-related costs, including costs from the use of third party carriers, temporary staff and overtime. Historically, we have been able to pass on a substantial portion of increases in our own fuel or other transportation costs to our customers in the form of fuel or delivery surcharges, but our ability to continue to pass through these increases, is not assured. If we are unable to continue to pass on fuel and transportation-related cost increases to our customers or do not realize the benefits we expect from converting a large percentage of our trucks to operate on natural gas, our operating results could be materially and adversely affected.
Cigarette and consumable goods distribution is a low-margin business sensitive to economic conditions.inflation and deflation.
We derive most of our revenues from the distribution of cigarettes, other tobacco products, candy, snacks, fast food, groceries, fresh products, dairy, non-alcoholic beverages, general merchandise and health and beauty care products. Our industry is characterized by a high volume of sales with relatively low profit margins. Our food/non-food sales are at prices that aregenerally priced based on the manufacturer's cost of the product plus a percentage markup. As a result, our profit levels may be negatively impacted during periods of cost deflation or stagnation for these products, even though our gross profit as a percentage of the price of goods sold may remain relatively constant. Alternatively,In addition, periods of product cost inflation may also have a negative impact on our gross profit margins and earnings with respect to sales of cigarettes. Grosscigarettes because gross profit on cigarette sales are generally fixed on a cents per carton basis. Therefore, as cigarette prices
increase, gross profit generally decreases as a percentpercentage of sales. In addition, if the cost of the cigarettes that we purchase increases due to manufacturer price increases, reduced or eliminated manufacturer discounts and incentive programs or increases in applicable excise tax rates, our inventory carrying costs and accounts receivable could rise. To the extent that we are unable to passrise, placing pressure on product cost increases to our customers, our profit margins and earnings could be negatively impacted.working capital requirements.
We rely on funding from manufacturer discount and incentive programs and cigarette excise stamping allowances;allowances, and any material changes in these programs could adversely affect our results of operations.
We receive payments from the manufacturers ofon the products we distribute for allowances, discounts, volume rebates and other merchandising and incentive programs. These payments are a substantial benefit to us. The amount and timing of these payments are affected by changes in the programs by the manufacturers, our ability to sell specified volumes of a particular product, attaining specified levels of purchases by our customers and the duration of carrying a specified product. In addition, we receive discounts from statescertain taxing jurisdictions in connection with the purchasecollection of excise stamps for cigarettes.taxes. If the manufacturers or statestaxing jurisdictions change or discontinue these programs or change the timing of payments, or if we are unable to maintain the volume of our sales required by such programs, our results of operations could be negatively affected.
We depend on relatively few suppliers for a large portion of our products, and any interruptions in the supply of the products that we distribute could adversely affect our results of operations.
We obtain the products we distribute from third party suppliers. At December 31, 2010,2013, we had approximately 4,4004,700 vendors, and during 20102013 we purchased approximately 62%64% of our products from our top 20 suppliers, with our top two suppliers, Philip Morris USA, Inc. and R. J.R.J. Reynolds Tobacco Company, representing approximately 28% and 13%14% of our purchases, respectively. We do not have any long-term contracts with our suppliers committing them to provide products to us. Our suppliers may not provide the products we distribute in the quantities we request on favorable terms, or at all. We are also subject to delays caused by interruption in production due to conditions outside our control, such as job actionsslow-downs or strikes by employees of suppliers, inclement weather, transportation
interruptions, regulatory requirements and natural disasters or other catastrophic events.disasters. Our inability to obtain adequate supplies of the products we distribute could cause us to fail to meet our obligations to our customers and reduce the volume of our sales and profitability.
SomeOur ability to operate effectively could be impaired by the risks and costs associated with expansion activities.
Market share growth is one of our distribution centers are dependentkey company initiatives. To accomplish this growth we have focused on strategic acquisitions and securing large regional and national customers as key elements of success. Any significant expansion activity comes with inherent risks. Acquisitions may entail various risks such as identifying suitable candidates, realizing acceptable rates of return on the investment, identifying potential liabilities, obtaining adequate financing, negotiating acceptable terms and conditions, and successfully integrating operations and converting systems post acquisition. Integrating a few relatively large customers,new customer has similar risks of realizing acceptable returns on invested working capital, negotiating acceptable pricing and service levels, while managing resources and business interruptions as we integrate the new business into our failurecurrent infrastructure. We may realize higher costs or lower margins than originally anticipated and may experience disruption to maintain our relationships with these customers could substantially harm ourbase business, and prospects.
Some of our distribution centers are dependent on relationships with a single customermay not realize the anticipated benefits or a few customers, and we expect our reliance on these relationshipssavings from expansion activities to continue for the foreseeable future. Any terminationextent or non-renewal of customer relationships could severely and adversely affectin the revenues generated by certain of our distribution centers. Any future termination, non-renewal or reduction in services that we provide to these select customers would cause our revenues to decline and our operating results to suffer.time frame expected.
We may be subject to product liability claims and counterfeit product claims which could materially adversely affect our business, and our operations could be subject to disruptions asbusiness.
As a result of manufacturer recalls of products.
Core-Mark, as with other distributorsdistributor of food and consumer products, faceswe face the risk of exposure to product liability claims in the event that the use of productsa product sold by us causes injury or illness. With respect to product liability claims, we believeIn addition, certain products that we have sufficient liability insurance coverage and indemnities from manufacturers. However, product liability insurance may not continue to be available at a reasonable cost, or, if available, may not be adequate to cover all of our liabilities. We generally seek contractual indemnification and insurance coverage from parties supplying the products we distribute but this indemnification or insurance coverage is limited, as a practical matter, to the creditworthiness of the indemnifying party and the insured limits of any insurance provided by suppliers. Some of our local suppliers are relatively small companies with limited financial resources. If we do not have adequate insurance, if contractual indemnification is not available or if a party cannot fulfill its indemnification obligation, product liability relating to defective products could materially adversely impact our results of operations.
In addition, we may be requiredsubject to manage a recall of products on behalf of a manufacturer. Managing a recall could disrupt our operations as we might be required to devote substantial resources toward implementing the recall, which could materially adversely affect our ability to provide quality service to our customers.
Adverse publicity or lack of confidence in our products could adversely affect reputation and reduce earnings.
counterfeiting. Our business could be adversely affected if consumers lose confidence in the safety and quality of certainthe food products and servicesother products we distribute. Adverse publicityFurther, our operations could be subject to disruptions as a result of manufacturer recalls. This risk may discourage consumersincrease as we continue to expand our distribution of fresh products. If we do not have adequate insurance, if contractual indemnification from buyingthe supplier or manufacturer of the defective, contaminated or counterfeit product is not available, or if a supplier or manufacturer cannot fulfill its indemnification obligations to us, the liability relating to such product claims or disruption as a result of recall efforts could materially adversely impact our products or using our services. In addition, such adverse publicity may result in product liability claims, a loss of reputation, and product recalls which would have a material adverse effect on our sales and operations.
Unexpected outcome in legal proceedings may result in adverse effect on results of operations.
On occasion, we are a party to legal proceedings, including matters involving personnel and employment issues, personal injury, antitrust claims and other proceedings arising in the ordinary course of business. Furthermore, there are an increasing number of cases being filed against companies generally, which include class-action allegations under federal and state wage and hour laws. We estimate our exposure to these legal proceedings and establish reserves for the estimated liabilities. Assessing and predicting the outcome of these matters involves substantial uncertainties. Although not currently anticipated by management, unexpected outcomes in these legal proceedings, or changes in our evaluation of the proceedings, could have a material adverse impact on our finances and results of operations.
Our ability to operate effectively could be impaired by the risks and costs associated with the efforts to grow our business through acquisitions.
Efforts to grow our distribution business may include acquisitions. Acquisitions entail various risks such as identifying suitable candidates, effecting acquisitions at acceptable rates of return, obtaining adequate financing and acceptable terms and conditions. Successful integration of new operations will depend on our ability to manage those operations, fully assimilate the operations into our distribution network, realize opportunities for revenue growth presented by strengthened product offerings and expanded geographic market coverage, maintain the customer base and eliminate redundant and excess costs. We may not realize the anticipated benefits or savings from an acquisition to the extent or in the time frame anticipated, if at all, or such benefits and savings may include higher costs than anticipated.
We may not be able to achieve the expected benefits from the implementation of new marketing initiatives.
We are taking action to improvecontinuously improving our competitive performance through a series of strategic marketing initiatives. The goal of this effort is to develop and implement a comprehensive and competitive business strategy, addressing the special needs of the
convenience industry environment, increaseincreasing our market position within the industry and ultimately createcreating increased shareholder value.
We may not be able to successfully execute our new marketing initiatives to realize the intended synergies, business opportunities and growth prospects. Many of the risk factors previously mentioned, such as increased competition, may limit our ability to capitalize on business opportunities and expand our business. Our efforts to capitalize on business opportunities may not bring the intended result. Assumptions underlying estimates of expected revenue growth or overall cost savings may not be met or economic conditions may deteriorate. Customer acceptance of new distribution formats developedthat we implement may not be as anticipated hampering our abilityor competitive pressures may cause us to attract new customerscurtail or maintain our existing customer base. Additionally, our management may have its attention diverted from other important activities while trying to execute new marketing initiatives. Ifabandon these or other factors limit our ability to execute our strategic initiatives, our expectations of future results of operations, including expectedresulting in lower revenue growth and unachieved cost savings, may not be met.savings.
Our information technology systems may be subject to failure, disruptions or disruptions,security breaches which could compromise our ability to conduct business, seriously harm our business.business and adversely affect our financial results.
Our business is highly dependent on DCMS. The convenience retail industry does not have a standardour customized enterprise information technology ("IT") platform. Therefore, actively integrating our customers into our IT platform is a priority, and our DCMS platform provides our distribution centers with the flexibility to adapt to our customers' IT requirements.systems. We also rely on DCMSour information technology systems and our internal information technology staff to maintain the information required to operate our distribution centers and to provide our customers with fast, efficient and reliable deliveries. We have taken steps to increase redundancy in our ITinformation technology systems and have disaster recovery plans in place to mitigate unforeseen events that could disrupt our systems' service. However, if our DCMS failssystems fail or isare not reliable, we may suffer disruptions in service to our customers and our results of operations could suffer.We may upgrade and replace various components of our proprietary ERP system periodically with the goal of maintaining and improving overall functionality, performance and service. Some of our upgrades may include the implementation of leading software solutions or enhanced customizations to our existing systems. There are inherent risks associated with any system project and there can be no guarantee any implementation will be free of disruptions or other operational problems.
In addition, we retain sensitive data, including intellectual property, proprietary business information and personally identifiable information, in our secure data centers and on our networks. We may face threats to our data centers and networks of unauthorized access, security breaches and other system disruptions. Despite our security measures, our infrastructure may be vulnerable to attacks by experienced hackers or other disruptive problems. Any such security breach may compromise information stored on our networks and may result in significant data losses or theft of intellectual property, proprietary business information or personally identifiable information belonging to us or our customers, business partners or employees.
We may be subject to various claims and lawsuits that could result in significant expenditures.
The nature of our business exposes us to the potential for various claims and litigation related to labor and employment, personal injury, property damage, business practices, environmental liability and other matters. Any material litigation or a catastrophic accident or series of accidents could have a material adverse effect on our business, financial position and results of operations.
We depend on our senior management.management and other key personnel.
We substantially depend on the continued services and performance of our senior executive officers as named in our Proxy Statement.Statement and other key employees. We do not maintain key person life insurance policies on these individuals, and we do not have employment agreements with any of them. The loss of the services of any of our senior executive officers or other key personnel could harm our business.
We operate in a competitiveShortages of qualified labor marketcould negatively impact our business and a portion of our employees are covered by collective bargaining agreements.profitability.
Our continued success will depend partly on our ability to attract and retain qualified personnel. We compete with other businesses in each of our markets with respect to attracting and retaining qualified employees. While current market conditions have provided us with a surplus of qualified employee candidates, in the future, aA shortage of qualified employees, especially drivers, in a market could require us to enhance our wage and benefit packages in order to compete effectively in the hiring and retention of qualified employees or to hire more expensive temporary employees. In addition, atAny such shortage of qualified employees could decrease our ability to effectively serve our customers and might lead to lower profits because of higher labor costs.
Unions may attempt to organize our employees.
As of December 31, 2010, 213,2013, 210, or 4.8%4%, of our employees were covered by collective bargaining agreements with labor organizations, which expire at various times.
We cannot assure you that we will be able to renew our respective collective bargaining agreements on favorable terms, that employees at other facilities will not unionize or that our labor costs will not increase,increase. In addition, the National Labor Relations Board is becoming more active with the passage of administrative rules that we will be ablecould impact our ability to recover any increases inmanage our labor costs through increased prices charged to customers or thatforce. To the extent we will not suffer business interruptions as a result of strikes or other work stoppages. If we fail to attract and retain qualified employees, to controlstoppages or slow downs, or our labor costs orincrease and we are not able to recover any increased labor costssuch increases through increased prices charged to our customers or offsets by productivity gains, our results of operations could be materially adversely affected.
Employee health benefit costs represent a significant expense to us and may negatively affect our profitability.
With over 3,600 employeesand their families participating in our health plans, our expenses relating to employee health benefits are substantial. In past years, we have experienced significant increases in certain of these costs, largely as a result of economic factors beyond our control, including, in particular, ongoing increases in health care costs well in excess of the rate of inflation. Continued increasing health care costs, as well as changes in laws, regulations and assumptions used to calculate health and benefit expenses, may adversely affect our business, financial position and results of operations. In addition, the implementation of the Patient Protection and Affordable Care Act (“ACA”) may significantly increase our employee healthcare-related costs. While we have taken steps to minimize the impact of ACA, there is no guarantee our efforts will be successful.
If we are unable to comply with governmental regulations that affect our business or if there are substantial changes in these regulations, our business could be adversely affected.
As a distributor of food and other consumable products, we are subject to regulation by the FDA, Health Canada and similar regulatory authorities at the state, provincial and local levels. In addition, our employees operate tractor trailers, trucks, forklifts and various other powered material handling equipment and we are therefore subject to regulation by the U.S. and Canadian Departments of Transportation. Our operations are also subject to regulation by OSHA, the DEA and a myriad of other federal, state, provincial and local agencies. Each of these regulatory authorities has broad administrative powers with respect to our operations. Regulations, and the costs of complying with those regulations, have been increasing in recent years. If we fail to adequately comply with government regulations, we could experience increased inspections or audits, regulatory authorities could take remedial action including imposing fines or shutting down our operations or we could be subject to increased compliance costs. If any of these events were to occur, our results of operations would be adversely affected.
Natural disaster damage could have a material adverse effect on our business.
Our headquarters and several of our warehouses in California, as well as one of our data centers and one warehouse located near Vancouver, British Columbia, Canada, are in or near high hazard earthquake zones. In addition, one of our data centers is located in Plano, Texas, which is susceptible to wind storms. We also have operations in areas that have been affected by natural disasters such as hurricanes, tornados, floods, and ice and snow storms. While we maintain insurance to cover us for such potential losses, our insurance may not be sufficient in the event of a significant natural disaster or payments under our policies may not be received timely enough to prevent adverse impacts on our business. Our customers could also be affected by like events, which could adversely impact our sales and results of operations.
Insurance and claims expenses could have a material adverse effect on us.
We have a combination of both self-insurance and high-deductible insurance programs for the risks arising out of the services we provide and the nature of our operations throughout North America, including claims exposure resulting from personal injury, property damage, business interruption and workers' compensation. Workers' compensation, automobile and general liabilities are determined using actuarial estimates of the aggregate liability for claims incurred and an estimate of incurred but not reported claims. Our accruals for insurance reserves reflect certain actuarial assumptions and management judgments, which are subject to a high degree of variability. If the number or severity of claims for which we are retaining risk increases, our financial condition and results of operations could be adversely affected. If we lose our ability to self-insure these risks, our insurance costs could materially increase and we may find it difficult to obtain adequate levels of insurance coverage.
Risks Related to the Distribution of Cigarettes and Other Tobacco Products
Our sales volume is largely dependent upon the distribution of cigarette products,cigarettes, sales of which are declining.declining generally.
The distribution of cigarette and other tobacco productscigarettes is currently a significant portion of our business. In 2010,2013, approximately 70.5%68.0% of our revenues camenet sales (which includes excise taxes) and 29.5% of our gross profit were generated from the distribution of cigarettes and 31.0% of our gross profit was generated from cigarettes. Due to increases in the prices of cigarettes, and other tobacco products, restrictions on marketing and promotions by cigarette manufacturers, increases in cigarette regulation and excise taxes, health concerns, increased pressure from anti-tobacco groups, the rise in popularity of electronic cigarettes and other factors, cigarette consumption in the U.S. and Canadian cigarette and tobacco marketCanada has generally been declining since 1980 and is expected to continue to decline.
Prior to 2007 our cigarette sales had benefited from a shift in sales togradually over the convenience retail segment, and as a result of this shift, convenience store cigarette sales had not declined in proportion to the decline in overall consumption. However, our cigarette carton sales began to decline in 2007, experienced further declines in 2008 and 2009 and increased modestly in 2010.past few decades. We expect consumption trends of legal cigarette and tobacco products will continue to be negatively impacted by rising prices, diminishing social acceptance and legislative and regulatory actions that create limitations on where a consumer can smoke, and how products can be promoted and produced.the factors described above. In addition, we expect rising prices will stimulatemay lead to a higher percentage of consumers to purchase frompurchasing cigarettes through illicit markets, over the internet and by other means designed to fulfill consumer demand. We believe thisavoid payment of cigarette taxes. If we are unable to sell other products to make up for these declines in cigarette unit sales, our operating results may adversely impact our cigarette carton volume, primarily in
the U.S., in future periods.suffer.
Legislation and other matters are negatively affecting the cigarette and tobacco industry.
The tobacco industry is subject to a wide range of laws and regulations regarding the marketing, distribution, sale, taxation and use of tobacco products imposed by local, state, federal and foreign governments.governmental entities. Various state and provincial governmentsjurisdictions have adopted or are considering legislation and regulations restricting displays and marketing of tobacco products, establishing fire safety standards for cigarettes, raising the minimum age to possess or purchase tobacco products, requiring the disclosure of ingredients used in the manufacture of tobacco products, imposing restrictions on public smoking, restricting the sale of tobacco products directly to consumers or other recipients over the internet and other tobacco product regulation. For example, the U.S. Supreme Court has recently determined that lawsuits may proceed against tobacco manufacturers based on alleged deceptive advertising in the marketing of so-called “light” cigarettes. In June 2009, the Family Smoking Prevention and Tobacco Control Act was signed into law, which grantedaddition, the FDA the authorityhas been empowered to regulate the production and marketing of tobacco products in the U.S. The new legislation establishes a new FDA office that will regulate changes to nicotine yields and the chemicals and flavors used in tobacco products (including cigars and pipe products), require ingredient listings be displayed on tobacco products, prohibit the use of certain terms which may attract youth or mislead users as to the risks involved with using tobacco products, as well as limit or otherwise impact the marketing of tobacco products by requiring additional labels or warnings as well as pre-approval of the FDA. This new FDA office is to be financed through user fees paid by tobacco companies prorated based on market share. This newSuch legislation and related regulation couldis likely to continue adversely impactimpacting the market for tobacco products and, accordingly, our sales of such products.
In Canada, many provincial legislaturesprovinces have enacted legislation authorizing and facilitating the recovery by provincial governments of tobacco-related health care costs from the tobacco industry by way of lawsuit. The Supreme CourtSome Canadian provincial governments have either
already initiated lawsuits to recover health care costsor indicated an intention that such lawsuits will be filed. It is unclear at this time how such restrictions and in Alberta, the government has promised that a lawsuit is being prepared for filing. Alllawsuits may affect Core-Mark and its Canadian provinces have legislation that controls the usage and sale of tobacco products and typically these restrict or prevent the sale of cigarette and tobacco products from health care facilities, public post-secondary campuses and certain public use facilities. Some of these laws also prohibit sales from pharmacies and stores containing a pharmacy.operations.
Cigarettes and other tobacco products are subject to substantialIf excise taxes and, if these taxes are increased or credit terms are reduced, our sales of cigarettes and other tobacco products could decline.decline and our liquidity could be negatively impacted.
Cigarettes and tobacco products are subject to substantial excise taxes in the U.S. and Canada. Significant increases in cigarette-related taxes and/or fees have been proposed or enacted and are likely to continue to be proposed or enacted by various taxing jurisdictions within the U.S. and Canada. States continue to pass ballot measures that may result inCanada as a means of increasing excise taxes on cigarettes and other tobacco products. In February 2009, U.S. legislation was signed into law which funds the SCHIP program by raising the federal cigarette excise tax from 39¢ to $1.01 per pack. This legislation was effective April 1, 2009.
government revenues. These tax increases are expected to continue to have an adversenegatively impact on sales of cigarettes due to lower consumption levels andconsumption. Additionally, they may cause a shift in sales from premium brands to discount brands, illicit channels or electronic cigarettes as smokers seek lower priced options.
Taxing jurisdictions have the premiumability to change or rescind credit terms currently extended for the non-premium or discount cigarette segments or to sales outsideremittance of legitimate channels. In addition, state and local governments may require us to prepay for excise tax stamps placed on packages of cigarettes and other tobacco products that we sell.collect on their behalf. If these excise taxes are substantially increased or credit terms are substantially reduced, it could have a negative impact on our liquidity. Accordingly, we may be required to obtain additional debt financing, which we may not be able to obtain on satisfactory terms or at all.
Our inability to prepay the excise taxes may prevent or delay our purchasedistribution of cigarettes and other tobacco products which could materially adversely affect our abilityexposes us to supply our customers.
In the U.S. we purchase cigarettes primarily from manufacturers covered by the tobacco industry's Master Settlement Agreement (“MSA”), which results in our facing certain potential liabilities and financial risks including competition from lower priced sales of cigarettes produced by manufacturers who do not participate in the MSA.liabilities.
In June 1994, the Mississippi attorney general brought an action against various tobacco industry members on behalf of the state to recover state funds paid for health care costs related to tobacco use. Most other states sued the major U.S. cigarette manufacturers based on similar theories. The cigarette manufacturer defendants settled the first four of these cases with Mississippi, Florida, Texas and Minnesota by separate agreements. These states are referred to as non-MSA states. In November 1998, the major U.S. tobacco product manufacturers entered into the MSAa Master Settlement Agreement (“MSA”) with 46 states, the District of Columbia and certain U.S. territories. The other four states--Mississippi, Florida, Texas and Minnesota (the “non-MSA states”)--settled their litigations with the major cigarette manufacturers by separate agreements. The MSA and the other state settlement agreements settled health care cost recovery actions and monetary claims relating to future conduct arising out of the use of, or exposure to, tobacco products, imposed a stream of future payment obligations on major U.S. cigarette manufacturers and placed significant restrictions on the ability to market and sell cigarettes. The payments required under the MSA result in the products sold by the participating manufacturers to be priced at higher levels than non-MSA manufacturers.
In order to limit our potential tobacco related liabilities, we try to limit our purchasesaddition, the growth in market share of cigarettes from non-MSA manufacturers for sale in MSA states. The benefits of liability limitations and indemnities we are entitled to underdiscount brands since the MSA do
not apply to sales of cigarettes manufactured by non-MSA manufacturers. From time to time, however, we find it necessary to purchase a limited amount of cigarettes from non-MSA manufacturers. For example, during a transition period while integrating distribution operations fromwas signed has had an acquisition we may need to purchase and distribute cigarettes manufactured by non-MSA manufacturers to satisfyadverse impact on the demands of customerstotal volume of the acquired business. With respect to sales of such non-MSA cigarettes that we could be subject to litigation that could expose us to liabilities for which we would not be indemnified.sell.
If the tobacco industry's MSA is invalidated, or tobacco manufacturers cannot meet their obligations to indemnify us, we could be subject to substantial litigation liability.
In connection with the MSA, we arewere indemnified by most of the tobacco product manufacturers from which we purchase cigarettes and other tobacco products for liabilities arising from our sale of the tobacco products that they supply to us. To date, litigation challenging the validity ofShould the MSA including claims that the MSA violates antitrust laws, has not been successful. However, if such litigation were toever be successful and the MSA is invalidated, we could be subject to substantial litigation due to our salesdistribution of cigarettes and other tobacco products, and we may not be indemnified for such costs by the tobacco product manufacturers in the future. In addition, even if we continue to beare indemnified by cigarette manufacturers that are parties to the MSA, future litigation awards against such cigarette manufacturers and our Company could be so large as to eliminate the ability ofprevent the manufacturers to satisfyfrom satisfying their indemnification obligations.
We face competition from sales of discount brands and illicit and other low priced sales of cigarettes.
In the U.S., we purchase cigarettes for sale in MSA states primarily from manufacturers that are parties to the MSA. As a result, we are adversely impacted by sales of brands from non-MSA manufacturers and discount brands manufactured by small manufacturers that are not participants to the MSA. The cigarettes subject to the MSA that we sell have been burdened by MSA related payments and are thus negatively impacted by widening price gaps between those brands and discount brands for the past several years. Growth in market share of discount brands since the MSA was signed in 1998 has had an adverse impact on the volume of the cigarettes that we sell.
We also face competition from the diversion into the U.S. market of cigarettes intended for sale outside the U.S., the sale of cigarettes in non-taxable jurisdictions, inter-state and international smuggling of cigarettes, increased imports of foreign low priced brands, the sale of cigarettes by third parties over the internet and by other means designed to avoid collection of applicable taxes. The competitive environment has been characterized by a continued influx of cheap products that challenge sales of higher priced and taxed cigarettes manufactured by parties to the MSA. In Canada, we face competitive pressures as well, primarily from discount brands and the sale of counterfeit cigarettes by third parties. Increased sales of counterfeit cigarettes, sales by third parties over the internet, or sales by means to avoid the collection of applicable taxes, could have an adverse effect on our total results of operations.
Risks Related to Financial Matters, Financing and Foreign Exchange
Changes to federal, state or provincial income tax legislation could have a material adverse effect on our business and Financingresults of operations.
From time to time, new tax legislation is adopted by the federal government and various states or other regulatory bodies. Significant changes in tax legislation could adversely affect our business or results of operations in a material way. For example, in the U.S. the federal government has proposed legislation, which effectively could limit, or even eliminate, use of the LIFO inventory method for financial and income tax purposes. Although the final outcome of these proposals cannot be ascertained at this time, the ultimate financial impact to us of the transition from LIFO to another inventory method could be material to our operating results.
Our pension plan is currently underfunded and we will be required to make cash payments to the plan, reducing the cash available for our business.
We record a liability associated with the underfunded status of our pension plan when the benefit obligation exceeds the fair value of the plan assets. Our December 31, 2013 balance sheet includes $2.1 million in pension liabilities related to underfunded pension obligations, compared to $10.0 million in underfunded pension obligations as of December 31, 2012. The funded level of our pension plan improved to 95% as of December 31, 2013 and we have adopted a dynamic strategy to reduce the plan’s investment risk as its funded status improves. This strategy will reduce the allocation to return seeking assets and increase the allocation to liability hedging assets over time with the intention of reducing volatility of the funded status and pension costs. We expect this strategy will reduce the risk associated with the funding level of our pension plan, but if the performance of the assets in our pension plan does not meet our expectations, or if other actuarial assumptions are modified, our future cash payments to our pension plan could be substantially higher than we expect.
The pension plan is subject to the Employee Retirement Income Security Act of 1974 (“ERISA”). Under ERISA, the Pension Benefit Guaranty Corporation (“PBGC”) has the authority to terminate an underfunded pension plan under limited circumstances. In the event our pension plan is terminated for any reason while it is underfunded, we will incur a liability to the PBGC that may be equal to the entire amount of the underfunding in the pension plan. If this were to occur, our working capital and results of operations could be adversely impacted.
There can be no assurance that we will continue to declare cash dividends in the future or in any particular amounts and if there is a reduction in dividend payments, our stock price may be harmed.
Since the fourth quarter of 2011, we have paid a quarterly cash dividend to our stockholders. We intend to continue to pay quarterly dividends subject to capital availability and periodic determinations by our Board of Directors that cash dividends are in the best interest of our stockholders and are in compliance with all applicable laws and agreements to which we are a party. Future dividends may be affected by a variety of factors such as available cash, anticipated working capital requirements, overall financial condition, credit agreement restrictions, future prospects for earnings and cash flows, capital requirements for acquisitions, stock repurchase programs, reserves for legal risks and changes in federal and state income tax laws or corporate laws. Our Board of Directors may, at its discretion, decrease or entirely discontinue the payment of dividends at any time. Any such action could have a material, negative effect on our stock price.
Currency exchange rate fluctuations could have an adverse effect on our revenues and financial results.
We generate a significant portion of our revenues in Canadian dollars, approximately 16%11% in 20102013 and 15%13% in 2009.2012. We also incur a significant portion of our expenses in Canadian dollars. To the extent that we are unable to match revenues received in Canadian dollars with costs paid in the same currency, exchange rate fluctuations in Canadian dollars could have an adverse effect on our revenues and financial results. During times of a strengthening U.S. dollar, our reported sales and earnings from our Canadian operations will be reduced because the Canadian currency will be translated into fewer U.S. dollars. Conversely, during times of a weakening U.S. dollar, our reported sales and earnings from our Canadian operations will be increased because the Canadian currency will be translated into more U.S. dollars. Accounting principles generally accepted in the United States of America (“U.S. GAAP”) require that foreign currency transaction gains or losses on short-term intercompany transactions be recorded currently as gains or losses within the income statement. To the extent we incur losses on such transactions, our net income and earnings per share will be reduced.
We may not be able to borrow additional capital to provide us with sufficient liquidity and capital resources necessary to meet our future financial obligations.
We expect that our principal sources of funds will be cash generated from our operations and, if necessary, borrowings under oura $200 million Credit Facility.revolving credit facility, initially dated as of October 12, 2005, as amended or otherwise modified from time to time, between us, as Borrowers, the Lenders named therein, and JPMorgan Chase Bank, N.A., as administrative agent (our “Credit Facility”). While we believe our sources of liquidity are adequate, we cannot assure you that these sources will be available or continue to provide us with sufficient liquidity and capital resources required to meet our future financial obligations, or to provide funds for our working capital, capital expenditures and other needs. As such, additional equity or debt financing may be necessary, but we may not be able to expand our existing Credit Facility or obtain new financing on terms satisfactory to us, or at all.us.
Our operating flexibility is limited in significant respects by the restrictive covenants in our Credit Facility.
Our Credit Facility imposes restrictions on us that could increase our vulnerability to general adverse economic and industry conditions by limiting our flexibility in planning for and reacting to changes in our business and industry. Specifically, these restrictions limitplace limits on our ability, among other things, to: incur additional indebtedness, pay dividends, and make distributions, issue stock of subsidiaries, make investments, repurchase stock, create liens, enter into transactions with affiliates, merge or consolidate, or transfer and sell our assets. In addition, under our Credit Facility, under certain circumstances we are required to meet a fixed charge coverage ratio. Our ability to comply with this covenant may be affected by factors beyond our control and a breach of the covenant could result in an event of default under our Credit Facility, which would permit the lenders to declare all amounts incurred thereunder to be immediately due and payable and terminate their commitments to make further extensions of credit.
Risks RelatedChanges to Government Regulation and Environment
If we are unable to comply with governmental regulations that affect our business or if there are substantial changes in these regulations, our business could be adversely affected.
As a distributor of food products, we are subject to regulation by the FDA, Health Canada and similar regulatory authorities at the state, provincial and local levels. In addition, our employees operate tractor trailers, trucks, forklifts and various other powered material handling equipment and we are therefore subject to regulation by the U.S. and Canadian Departments of Transportation.
Our operations are also subject to regulation by the Occupational Safety and Health Administration, the Drug Enforcement Agency and other federal, state, provincial and local agencies. Each of these regulatory authorities has broad administrative powers with respect to our operations. If we fail to adequately comply with government regulationsaccounting rules or regulations become more stringent, we could experience increased inspections, regulatory authorities could take remedial action including imposing fines or shutting down our operations or we could be subject to increased compliance costs. If any of these events were to occur, our results of operations would be adversely affected.
Earthquake and natural disaster damage could have a material adverse effect on our business.
Our headquarters and operations in California, as well as one of our data centers located in Richmond, British Columbia, Canada, are located in or near high hazard earthquake zones. In addition, one of our data centers is located in Plano, Texas, which is susceptible to wind storms. We also have operations in areas that have been affected by natural disasters such as hurricanes, tornados, flooding, ice and snow storms. While we maintain insurance to cover us for such potential losses, our insurance may not be sufficient in the event of a significant natural disaster or payments under our policies may not be received timely enough to prevent adverse impacts on our business. Our customers could also be affected by like events, which could adversely impact our sales.
Tax legislation could impact future cash flows.
The 2012 U.S. budget proposal that was released in February 2011includes potential changes to current tax law, including the repeal of the LIFO (Last-In, First-Out) method of inventory accounting. As currently drafted, LIFO would be repealed for tax years beginning after 2012 and LIFO reserves existing at that time would be taxed ratably over a ten year period. Should LIFO be repealed, the payment of income taxes, and any future tax deferral prior to the date of repeal, over the ten year period, would reduce the amount of money that we have for our operations, working capital, capital expenditures, expansions, acquisitions or general corporate or other business activities, which could materially and adversely affect our business, financial condition and results of operations.
New accounting standards could result in changes to our methods of quantifying and recording accounting transactions, and could affect our financialoperating results and financial position.
Changes to U.S. GAAPaccounting rules or regulations could arise from new and revised standards, interpretations and other guidance issued by the Financial Accounting Standards Board (“FASB”), the SEC, the Public Company Accounting Oversight Board and others. In addition, the SEC is considering a potential requirement for U.S. issuers to report future financial results in accordance with International Financial Reporting Standards ("IFRS") rather than U.S. GAAP. The U.S. Government may also issue new or revised Cost Accounting Standards or Cost Principles. The effects of such changes may include prescribing an accounting method where none had been previously specified, prescribing a single acceptable method of accounting from among several acceptable methods that currently exist or revoking the acceptability of a current method and replacing it with an entirely different method, among others. Such changes could result in unanticipated effects on our results of operations, financial position and other financial measures, including significant additional costs to implement and maintain the new accounting standards.
Our actual business and financial results could differ as a result of the accounting methods, estimates and assumptions that we use in preparing our financial statements, which may negatively impact our results of operations and financial condition.
To prepare financial statements in conformity with GAAP, management is required to exercise judgment in selecting and applying accounting methodologies and making estimates and assumptions. These methods, estimates, and assumptions are subject to uncertainties and changes, which affect the reported values of assets and liabilities, revenues and expenses, and disclosures of contingent assets and liabilities. Areas requiring significant estimates by our management include but are not limited to the following: allowance for doubtful accounts, LIFO inventory valuation, provisions for income taxes, vendor rebates and promotional allowances, impairment of goodwill, impairment of long-lived and other intangible assets, valuation of assets and liabilities in connection with business combinations, valuation of pension assets and obligations, stock-based compensation expense and accruals for estimated liabilities, including litigation and insurance reserves.
ITEM 1. B. UNRESOLVED STAFF COMMENTS
None.
ITEM 2. PROPERTIES
Our headquarters are located in South San Francisco, California, and consist of approximately 26,00027,000 square feet of leased office space. We also lease approximately 13,000 square feet for use by our information technology and tax personnel in Richmond, British Columbia, and approximately 6,000 square feet for use by our information technology personnel in Plano, Texas.Texas, and approximately 3,000 and 2,000 square feet of additional office space in Fort Worth, Texas and Phoenix, AZ, respectively. We lease approximately 2.83.9 million square feet and own approximately 0.40.7 million square feet of distribution space.
|
| | |
Distribution Center Facilities by City and State of Location(1) |
| Albuquerque, New Mexico | Las Vegas, Nevada | Tampa, Florida |
| Atlanta, Georgia | Leitchfield, Kentucky | Whitinsville, Massachusetts |
Atlanta, GeorgiaBakersfield, California | Los Angeles, California | Wilkes-Barre, Pennsylvania |
Bakersfield, California | Leitchfield, Kentucky | Calgary, Alberta |
Corona, California(2) | Minneapolis, Minnesota | Toronto, OntarioCalgary, Alberta |
| Denver, Colorado | Portland, Oregon | Toronto, Ontario(5) |
Forrest City, Arkansas(4) | Sacramento, California(3) | Vancouver, British Columbia |
| Fort Worth, Texas | Sacramento, California(3)
Salt Lake City, Utah | Winnipeg, Manitoba |
| Grants Pass, Oregon | Salt Lake City, UtahSanford, North Carolina | |
| Hayward, California | Spokane, Washington | |
(1) Excluding outside storage facilities or depots and two facilities that we operate as third party logistics provider. Depots are defined as a secondary location for a division which may include any combination of sales offices, operational departments and/or storage. We own distribution center facilities located in Leitchfield, Kentucky and Wilkes-Barre, Pennsylvania. All other facilities listed are leased. The facilities we own are subject to encumbrances under our principal credit facility.
(2) This facility includes a distribution center and our Allied Merchandising Industry consolidating warehouse.
(3) This facility includes a distribution center and our Artic Cascade consolidating warehouse.
| |
| (1) | Excluding outside storage facilities or depots and two distribution facilities that we operate as a third party logistics provider. Depots are defined as a secondary location for a division which may include any combination of sales offices, operational departments and/or storage. We own distribution center facilities located in Wilkes-Barre, Pennsylvania; Leitchfield, Kentucky; and Forrest City, Arkansas. All other facilities listed are leased. The facilities we own are subject to encumbrances under our Credit Facility. |
| |
| (2) | This location includes two facilities, a distribution center and our AMI consolidating warehouse. |
| |
| (3) | This facility includes a distribution center and our Artic Cascade consolidating warehouse. |
| |
| (4) | This facility includes a distribution center and our AMI-Artic East consolidating warehouse. |
| |
| (5) | This facility includes a distribution center and our Canadian Consolidation operations |
We also operate distribution centers on behalf of two of our major customers,customers: one in Phoenix, Arizona for Alimentation Couche-Tard Inc.(for Couche-Tard), and one in San Antonio, Texas for(for CST Brands, Inc., formerly, Valero Energy Corporation.Corporation). Each facility is leased by the specific customer solely for their use and operated by Core-Mark.
ITEM 3.LEGAL PROCEEDINGSWe are a plaintiff in a lawsuit against Sonitrol Corporation. The case arose from the December 21, 2002 arson fire at our Denver warehouse in which Sonitrol failed to detect and respond to a four-hour burglary and subsequent arson. In 2010, a jury found in favor of us and our insurers. Sonitrol appealed the judgment to the Colorado Appellate Court and on July 19, 2012, the Appellate Court upheld the trial court's ruling on two of the three issues being appealed but set aside the judgment and remanded the case back to the District Court for trial on the sole issue of damages. The Appellate Court's ruling was appealed by Sonitrol to the Colorado Supreme Court on September 21, 2012. On April 29, 2013, the Colorado Supreme Court denied Sonitrol's appeal and the case was returned to the District Court to resolve the sole issue of damages. A trial date has been set for April 7, 2014. We are unable to predict when this litigation will be finally resolved and the ultimate outcome. Any monetary recovery from the lawsuit would be recognized only if and when it is finally paid to us.
As of December 31, 2010, we were not involved in any material legal proceedings.
ITEM 4. (REMOVED AND RESERVED)MINE SAFETY DISCLOSURES
Not applicable.
PART II
ITEM 5. MARKET FOR REGISTRANT'S COMMON EQUITY, RELATED STOCKHOLDER MATTERS
AND ISSUER PURCHASES OF EQUITY SECURITIES
Market and Stockholders
Our common stock trades on the NASDAQ Global Market under the symbol “CORE.” According to the records of our transfer agent, we had 3,0192,063 stockholders of record as of February 28, 201114, 2014.
The following table provides the range of high and low sales prices of our common stock as reported by the NASDAQ Global Market for the periods indicated:
| | | | | | | | |
| | | Low Price | | High Price |
| Fiscal 2010 | | | | |
| 4th Quarter | | $ | 30.14 | | | $ | 37.19 | |
| 3rd Quarter | | 25.61 | | | 31.85 | |
| 2nd Quarter | | 26.25 | | | 31.88 | |
| 1st Quarter | | 29.21 | | | 34.51 | |
| | | | | |
| | | Low Price | | High Price |
| Fiscal 2009 | | | | |
| 4th Quarter | | $ | 25.93 | | | $ | 33.20 | |
| 3rd Quarter | | 24.73 | | | 30.12 | |
| 2nd Quarter | | 17.55 | | | 27.35 | |
| 1st Quarter | | 15.60 | | | 22.01 | |
We have not declared or paid any cash dividends on our common stock. The credit agreement for our Credit Facility places limitations on our ability to pay cash dividends on our common stock. The payment of any future dividends will be determined by our board of directors in light of then existing conditions, including our earnings, financial condition and capital requirements, strategic alternatives, restrictions in financing agreements, business conditions and other factors.
|
| | | | | | | |
| | Low Price | | High Price |
| Fiscal 2013 | | | |
| 4th Quarter | $ | 63.86 |
| | $ | 75.93 |
|
| 3rd Quarter | 62.65 |
| | 67.26 |
|
| 2nd Quarter | 50.26 |
| | 63.75 |
|
| 1st Quarter | 46.09 |
| | 51.72 |
|
| | | | |
| | Low Price | | High Price |
| Fiscal 2012 | | | |
| 4th Quarter | $ | 40.06 |
| | $ | 49.24 |
|
| 3rd Quarter | 43.29 |
| | 50.56 |
|
| 2nd Quarter | 34.78 |
| | 48.17 |
|
| 1st Quarter | 37.01 |
| | 42.74 |
|
PERFORMANCE COMPARISON
The graph below presents a comparison of cumulative total return to stockholders for Core-Mark's common stock at the period Core-Mark had securities trading on the NASDAQ Global Market,end of each year from 2008 through 2013, as well as the cumulative total returns of the NASDAQ Non-Financial Stock Index, the Russell 2000 Index and a peer group of companies (“the Performance Peer Group”).
Cumulative total return to stockholders is measured by the change in the share price for the period, plus any dividends, divided by the share price at the beginning of the measurement period. Core-Mark's cumulative stockholder return is based on an investment of $100 on December 30, 2005,31, 2008, and is compared to the total return of the NASDAQ Non-Financial Stock Index, the Russell 2000 Index, and the weighted-average performance of the Performance Peer Group over the same period with a like amount invested, including the assumption that any dividends have been reinvested. We regularly compare our performance to the Russell 2000 Index since it includes primarily companies with relatively small market capitalization similar to us.
The companies composing the Performance Peer Group are Sysco Corp. (SYY), Nash Finch Company (NAFC)(NAFC, through its last trading day of November 19, 2013), United Natural Foods, Inc. (UNFI) and AMCON Distributing Co. (DIT).
COMPARISON OF CUMULATIVE TOTAL RETURN
AMONG CORE-MARK, NASDAQ NON-FINANCIAL STOCK AND RUSSELL 2000 INDEXES
AND THE PERFORMANCE PEER GROUP
| | | | | | | | | | | | | | | | | | | | | | | | | | | | | | | | | | | | | | | | | | | | |
| | | Investment Value at |
| | | 12/30/05 | | 03/31/06 | | 06/30/06 | | 09/29/06 | | 12/29/06 | | 03/30/07 | | 06/29/07 | | 09/28/07 | | 12/31/07 | | 03/31/08 | | 06/30/08 |
| CORE | | $ | 100.00 | | | $ | 119.94 | | | $ | 112.23 | | | $ | 98.24 | | | $ | 104.86 | | | $ | 111.85 | | | $ | 112.79 | | | $ | 110.44 | | | $ | 90.03 | | | $ | 90.09 | | | $ | 82.13 | |
| NASDAQ Index | | $ | 100.00 | | | $ | 106.25 | | | $ | 98.14 | | | $ | 102.11 | | | $ | 109.66 | | | $ | 110.66 | | | $ | 120.05 | | | $ | 125.84 | | | $ | 124.39 | | | $ | 106.45 | | | $ | 108.77 | |
| Russell 2000 | | $ | 100.00 | | | $ | 113.94 | | | $ | 108.21 | | | $ | 108.69 | | | $ | 118.37 | | | $ | 120.67 | | | $ | 126.00 | | | $ | 122.10 | | | $ | 116.51 | | | $ | 104.98 | | | $ | 105.59 | |
| Performance Peer Group | | $ | 100.00 | | | $ | 105.72 | | | $ | 100.69 | | | $ | 109.74 | | | $ | 121.70 | | | $ | 112.81 | | | $ | 111.16 | | | $ | 119.19 | | | $ | 106.87 | | | $ | 97.84 | | | $ | 93.99 | |
| | | | | | | | | | | | | | | | | | | | | | | |
| | | 09/30/08 | | 12/31/08 | | 03/31/09 | | 06/30/09 | | 09/30/09 | | 12/31/09 | | 03/31/10 | | 06/30/10 | | 09/30/10 | | 12/31/10 | | |
| CORE | | $ | 78.34 | | | $ | 67.46 | | | $ | 57.12 | | | $ | 81.69 | | | $ | 89.75 | | | $ | 103.32 | | | $ | 95.96 | | | $ | 85.89 | | | $ | 97.05 | | | $ | 111.57 | | | |
| NASDAQ Index | | $ | 97.16 | | | $ | 56.94 | | | $ | 56.42 | | | $ | 68.45 | | | $ | 79.67 | | | $ | 85.86 | | | $ | 90.74 | | | $ | 80.06 | | | $ | 90.83 | | | $ | 101.80 | | | |
| Russell 2000 | | $ | 104.42 | | | $ | 77.15 | | | $ | 65.61 | | | $ | 79.18 | | | $ | 94.45 | | | $ | 98.11 | | | $ | 106.79 | | | $ | 96.20 | | | $ | 107.06 | | | $ | 124.46 | | | |
| Performance Peer Group | | $ | 107.15 | | | $ | 81.34 | | | $ | 80.50 | | | $ | 81.81 | | | $ | 90.01 | | | $ | 102.54 | | | $ | 108.65 | | | $ | 106.72 | | | $ | 108.81 | | | $ | 113.52 | | | |
Sales of Unregistered Securities
Common Stock and Warrants Issued Pursuant to the Plan of Reorganization in 2004
Pursuant to the plan of reorganization (May 2004) described in Exhibit 2.1 and incorporated by reference (see Part IV, Item 15, Exhibit Index of this Form 10-K), herein referred to as “Fleming's bankruptcy” or “plan of reorganization,” on August 23, 2004 we issued an aggregate of 9,800,000 shares of our common stock and warrants to purchase an aggregate of 990,616 shares of our common stock to the Class 6(B) creditors of Fleming (our former parent company). We refer to the warrants we issued to the Class 6(B) creditors as the Class 6(B) warrants. We received no cash consideration at the time we issued the Class 6(B) warrants. The Class 6(B) warrants have an exercise price of $20.93 per share. The shares of common stock and the Class 6(B) warrants were issued pursuant to an exemption from registration under Section 1145(a) of the Bankruptcy Code. We also issued warrants to purchase an aggregate of 247,654 shares of our common stock to the holders of our Tranche B Notes, which we refer to as the Tranche B warrants. The Tranche B warrants have an exercise price of $15.50 per share. Shares of our common stock issued upon exercise of the Tranche B warrants are issued pursuant to an exemption from registration under Section 4(2) of the Securities Act of 1933. Both the Class 6(B) and Tranche B warrants may be exercised at the election of the holder at any time prior to August 23, 2011, at which time any outstanding warrants will be net issued. Instructions for exercising warrants can be found in the “Investor Relations” section of our website at www.core-mark.com.
During 2010, 246,912 of the Class 6(B) warrants were exercised in cash and cashless transactions, and a total of 233,380 shares of common stock have been issued since inception pursuant to exercises of Class 6(B) warrants. The exercise of such warrants was also done pursuant to an exemption from registration under Section 1145(a) of the Bankruptcy Code. During 2010, there were no Tranche B warrants exercised in cash or cashless transactions, and the total number of shares of common stock issued since inception pursuant to Tranche B warrants as of December 31, 2010 remained at 73,507 shares.
Issuer Purchases of Equity Securities
There were no repurchases of our common stock during the three months ended December 31, 2010.
|
| | | | | | | | | | | | | | | | | | | | | | | | |
| | | Investment Value at |
| | | 12/31/08 | | 12/31/09 | | 12/31/10 | | 12/31/11 | | 12/31/12 | | 12/31/13 |
| CORE | | $ | 100.00 |
| | $ | 153.16 |
| | $ | 165.38 |
| | $ | 184.91 |
| | $ | 225.58 |
| | $ | 365.05 |
|
| Russell 2000 | | $ | 100.00 |
| | $ | 127.09 |
| | $ | 161.17 |
| | $ | 154.44 |
| | $ | 179.75 |
| | $ | 249.53 |
|
| NASDAQ Index | | $ | 100.00 |
| | $ | 150.81 |
| | $ | 178.60 |
| | $ | 178.37 |
| | $ | 209.06 |
| | $ | 292.89 |
|
| Performance Peer Group | | $ | 100.00 |
| | $ | 126.37 |
| | $ | 139.15 |
| | $ | 143.29 |
| | $ | 162.50 |
| | $ | 197.84 |
|
Dividends
On October 19, 2011, we announced the commencement of a quarterly dividend program. In 2013, the Board of Directors declared quarterly cash dividends of $0.19 per common share on May 2, 2013 and August 1, 2013 and $0.22 per common share on November 1, 2013. In lieu of the first quarter 2013 dividend, the Board of Directors declared an accelerated cash dividend of $2.2 million, or $0.19 per common share on December 20, 2012, which was paid on December 31, 2012. We paid dividends of $7.1 million and $10.3 million in 2013 and 2012, respectively. Our Credit Facility places certain limits on our ability to pay cash dividends on our common stock. Our intentions are to continue increasing our dividends per share over time; however, the payment of any future dividends will be determined by our Board of Directors in light of then existing conditions, including our earnings, financial condition and capital requirements, strategic alternatives, restrictions in financing agreements, business conditions and other factors.
Issuer Purchases of Equity Securities
In May 2013, our Board of Directors authorized a $30.0 million increase to our stock repurchase plan. At the time of the increase, we had $2.3 million remaining under our stock repurchase plan that was then in place. The timing and amount of the purchases are based on market conditions, our cash and liquidity requirements, relevant securities laws and other factors. The share repurchase program may be discontinued or amended at any time. The program has no expiration date and expires when the amount authorized has been expended or the Board withdraws its authorization.
In 2013, we repurchased 126,872 shares of common stock for a total cost of $7.2 million, or an average price of $56.60 per share. In 2012, we repurchased 118,800 shares of common stock for a total cost of $5.2 million, or an average price of $43.34 per share. As of December 31, 2013, we had $28.7 million available for future share repurchases under the program.
The following table provides the repurchases of common stock shares during the three months ended December 31, 2013:
|
| | | | | | | | | | | | | | |
| | | | | | | | Approximate |
| | | | | | Total Cost | | Dollar Value |
| | | | | | of Shares | | of Shares that |
| | | | | | Purchased as | | May Yet be |
| | Total | | | | Part of Publicly | | Purchased Under |
| | Number | | Average | | Announced Plans | | the Plans |
| Calendar month | of Shares | | Price Paid | | or Programs | | or Programs |
| in which purchases were made: | Repurchased | | per Share (1) | | (in millions) | | (in millions) |
| | | | | | | | |
| October 1, 2013 to October 31, 2013 | — |
| | $ | — |
| | $ | — |
| | $ | 30.1 |
|
| November 1, 2013 to November 30, 2013 | — |
| | — |
| | — |
| | 30.1 |
|
| December 1, 2013 to December 31, 2013 | 20,232 |
| | 72.34 |
| | 1.4 |
| | 28.7 |
|
| Total repurchases for the three months ended December 31, 2013 | 20,232 |
| | $ | 72.34 |
| | $ | 1.4 |
| | $ | 28.7 |
|
| | | | | | | | |
| |
| (1) | Includes related transaction fees. |
ITEM 6. SELECTED FINANCIAL DATA
Core-Mark Holding Company, Inc., or Core-Mark, is the ultimate parent holding company for Core-Mark International, Inc. and our wholly-owned subsidiaries.
Basis of Presentation
The selected consolidated financial data for the five years 2010,from 2009, to 2008, 2007 and 20062013 are derived from Core-Mark'sour audited consolidated financial statements included in our Annual Reports on Form 10-K. The following financial data should be read in conjunction with the consolidated financial statements and notes thereto and with Item 7, Management's Discussion and Analysis of Financial Condition and Results of Operations.
SELECTED CONSOLIDATED FINANCIAL DATA | | | | | Core-Mark Holding Company, Inc. and Subsidiaries | Core-Mark Holding Company, Inc. |
| | | Year Ended December 31, | | | Year Ended December 31, |
| (in millions except per share amounts) | | 2010(a) | | 2009(b) | | 2008(c) | | 2007 | | 2006(d) | 2013(a)(b) | | 2012(a)(b) | | 2011(b) | | 2010(c) | | 2009(d) |
| Statement of Operations Data: | | | | | | | | | | | | | | | | | | | |
| Net sales | | $ | 7,266.8 | | | $ | 6,531.6 | | | $ | 6,044.9 | | | $ | 5,560.9 | | | $ | 5,314.4 | | $ | 9,767.6 |
| | $ | 8,892.4 |
| | $ | 8,114.9 |
| | $ | 7,266.8 |
| | $ | 6,531.6 |
|
Gross profit (e) | | 385.3 | | | 401.6 | | | 359.1 | | | 332.6 | | | 297.7 | | 537.1 |
| | 476.8 |
| | 434.1 |
| | 385.3 |
| | 401.6 |
|
Warehousing and distribution expenses (e) | | 211.8 | | | 197.3 | | | 197.6 | | | 174.1 | | | 151.1 | | 297.1 |
| | 262.7 |
| | 234.6 |
| | 211.8 |
| | 197.3 |
|
| Selling, general and administrative expenses | | 142.5 | | | 137.3 | | | 129.4 | | | 119.0 | | | 106.6 | | 168.3 |
| | 153.7 |
| | 150.8 |
| | 142.5 |
| | 137.3 |
|
| Amortization of intangible assets | | 2.7 |
| | 3.0 |
| | 3.0 |
| | 2.1 |
| | 2.0 |
|
| Income from operations | | 28.9 | | | 65.0 | | | 30.1 | | | 37.7 | | | 38.5 | | 69.0 |
| | 57.4 |
| | 45.7 |
| | 28.9 |
| | 65.0 |
|
Interest expense, net (f) | | 2.2 | | | 1.4 | | | 1.2 | | | 1.0 | | | 4.2 | | 2.2 |
| | 1.8 |
| | 2.0 |
| | 2.2 |
| | 1.4 |
|
| Net income | | 17.7 | | | 47.3 | | | 17.9 | | | 24.1 | | | 20.6 | | 41.6 |
| | 33.9 |
| | 26.2 |
| | 17.7 |
| | 47.3 |
|
| Per share data: | | | | | | | | | | | | | | | | | | | |
| Basic net income per common share | | $ | 1.64 | | | $ | 4.53 | | | $ | 1.71 | | | $ | 2.30 | | | $ | 2.05 | | $ | 3.62 |
| | $ | 2.96 |
| | $ | 2.30 |
| | $ | 1.64 |
| | $ | 4.53 |
|
| Diluted net income per common share | | $ | 1.55 | | | $ | 4.35 | | | $ | 1.64 | | | $ | 2.15 | | | $ | 1.87 | | $ | 3.58 |
| | $ | 2.91 |
| | $ | 2.23 |
| | $ | 1.55 |
| | $ | 4.35 |
|
| Shares used to compute net income per share: | | | | | | | | | | | | | | | | | | | |
| Basic | | 10.8 | | | 10.5 | | | 10.5 | | | 10.5 | | | 10.0 | | 11.5 |
| | 11.5 |
| | 11.4 |
| | 10.8 |
| | 10.5 |
|
| Diluted | | 11.4 | | | 10.9 | | | 10.9 | | | 11.2 | | | 11.0 | | 11.6 |
| | 11.6 |
| | 11.7 |
| | 11.4 |
| | 10.9 |
|
| Other Financial Data: | | | | | | | | | | | | | | | | | | | |
Excise taxes (g) | | $ | 1,756.5 | | | $ | 1,516.0 | | | $ | 1,474.4 | | | $ | 1,349.4 | | | $ | 1,313.3 | | $ | 2,050.8 |
| | $ | 1,987.0 |
| | $ | 1,951.5 |
| | $ | 1,756.5 |
| | $ | 1,516.0 |
|
Cigarette inventory holding profits/FET (h) | | 6.1 | | | 25.2 | | | 3.1 | | | 7.3 | | | 4.1 | | |
Cigarette inventory holding gains/FET (h) | | 9.0 |
| | 7.8 |
| | 8.2 |
| | 6.1 |
| | 25.2 |
|
OTP tax items (i) | | 0.6 | | | 0.6 | | | 1.4 | | | 13.3 | | | — | | — |
| | — |
| | 0.8 |
| | 0.6 |
| | 0.6 |
|
| LIFO expense | | 16.6 | | | 6.7 | | | 11.0 | | | 13.1 | | | 2.9 | | 8.7 |
| | 12.3 |
| | 18.3 |
| | 16.6 |
| | 6.7 |
|
Depreciation and amortization (j) | | 19.7 | | | 18.7 | | | 17.4 | | | 14.9 | | | 13.2 | | 27.2 |
| | 25.3 |
| | 22.4 |
| | 19.7 |
| | 18.7 |
|
| Stock-based compensation | | 4.8 | | | 5.1 | | | 3.9 | | | 5.3 | | | 4.4 | | 4.6 |
| | 5.8 |
| | 5.5 |
| | 4.8 |
| | 5.1 |
|
| Capital expenditures | | 13.9 | | | 21.1 | | | 19.9 | | | 20.8 | | | 12.8 | | 18.0 |
| | 28.6 |
| | 24.1 |
| | 13.9 |
| | 21.1 |
|
Adjusted EBITDA (k) | | 109.5 |
| | 100.8 |
| | 91.9 |
| | 70.0 |
| | 95.5 |
|
| | | | | | | | | | | | | | | | | | | | |
| | | December 31, | | | December 31, |
| | | 2010 | | 2009 | | 2008 | | 2007 | | 2006 | 2013 | | 2012 | | 2011 | | 2010 | | 2009 |
| Balance Sheet Data: | | | | | | | | | | | | | | | | | | | |
| Total assets | | $ | 708.8 | | | $ | 677.9 | | | $ | 612.6 | | | $ | 577.1 | | | $ | 555.6 | | $ | 956.8 |
| | $ | 919.2 |
| | $ | 870.2 |
| | $ | 708.8 |
| | $ | 677.9 |
|
| Total debt, including current maturities | | 1.0 | | | 20.0 | | | 30.8 | | | 29.7 | | | 78.0 | | |
Total debt, including current maturities(l) | | 58.8 |
| | 85.6 |
| | 63.3 |
| | 1.0 |
| | 20.0 |
|
(a) The selected consolidated financial data for 2010 includes approximately $105.9 million of incremental sales related to increased cigarette prices by manufacturers in response to the increase in federal excise taxes mandated by the SCHIP legislation. The 2010 data also includes the results of operations of FDI, which was acquired in August 2010.
(b) The selected consolidated financial data for 2009 includes approximately $534.0 million of incremental sales related to increased cigarette prices by manufacturers in response to the increase in federal excise taxes mandated by the SCHIP
legislation and $36.7 million of related cigarette inventory holding profits, offset by $11.5 million of net floor stock tax.
(c) The selected consolidated financial data for 2008 includes the results of operations of the Toronto division, which started operations in late January 2008, and also the New England division following its acquisition in June 2008.
(d) The selected consolidated financial data for 2006 includes the results of operations of the Pennsylvania division following its acquisition in June 2006.
(e) Gross margins may not be comparable to those of other entities because warehousing and distribution expenses are not included as a component of our cost of goods sold.
(f) Interest expense, net, is reported net of interest income and includes amortization of debt issuance costs. | |
(a) (g) State, local and provincial excise taxes (predominantly cigarettes and tobacco) paid by the Company are included in net sales and cost of goods sold.
(h) Cigarette inventory holding profits represent income related to cigarette and excise tax stamp inventories on hand at the time either cigarette manufacturers increase their prices or states increase their excise taxes, for which the Company is able to pass such increases on to its customers. This income is recorded as an offset to cost of goods sold and recognized as the inventory is sold. This income is not predictable and is dependent on inventory levels and the timing of manufacturer price increases or state excise tax increases. In 2009, we realized significant cigarette inventory holding profits due to the price increases in response to the federal excise taxes ("FET") levied on manufacturers by the SCHIP legislation.
(i) We received an OTP (Other Tobacco Products) tax gain resulting from a state tax method change in the amount of $0.6 million in 2010. We received OTP tax refunds of $0.6 million in 2009, $1.4 million in 2008 and $13.3 million in 2007.
(j) Depreciation and amortization includes depreciation on property and equipment and amortization of purchased intangibles.
| The selected consolidated financial data includes the results of operations of J.T. Davenport & Sons, Inc., which was acquired on December 17, 2012. |
| |
| (b) | The selected consolidated financial data includes the results of operations of FCGC, which was acquired in May 2011, and the Tampa, Florida division, which commenced operations in September 2011. |
| |
| (c) | The selected consolidated financial data includes approximately $105.9 million of incremental sales related to increased cigarette prices by manufacturers in response to the increase in federal excise taxes mandated by the State Children's Health Insurance Program (“SCHIP”) legislation. The financial data also includes the results of operations of Finkle Distributors, Inc., which was acquired in August 2010. |
| |
| (d) | The selected consolidated financial data includes approximately $534.0 million of incremental sales related to increased cigarette prices by manufacturers in response to the increase in federal excise taxes mandated by the SCHIP legislation and $36.7 million of related cigarette inventory holding gains, offset by $11.5 million of net floor stock tax. |
| |
| (e) | Gross profit may not be comparable to those of other entities because warehousing and distribution expenses are not included as a component of our cost of goods sold. |
| |
| (f) | Interest expense, net, is reported net of interest income. |
| |
| (g) | State, local and provincial excise taxes (predominantly cigarettes and tobacco) paid by the Company are included in net sales and cost of goods sold. |
| |
| (h) | Cigarette inventory holding gains represent income related to cigarette inventories on hand at the time cigarette manufacturers increase their prices for which the Company is able to pass such increases on to its customers. This income is recorded as an offset to cost of goods sold and recognized as the inventory is sold. Although we have realized cigarette inventory holding gains in each of the last five years, this income is not predictable and is dependent on inventory levels and the timing of manufacturer price increases. In 2009, we realized significant cigarette inventory holding gains due to the price increases in response to the federal excise taxes (“FET”) levied on manufacturers by the SCHIP legislation. |
| |
| (i) | We received an Other Tobacco Products (“OTP”) tax settlement of $0.8 million in 2011. We recognized a $0.6 million OTP tax gain resulting from a state tax method change in 2010 and received OTP tax refunds of $0.6 million in 2009. |
| |
| (j) | Depreciation and amortization includes depreciation on property and equipment and amortization of purchased intangibles. |
| |
| (k) | Adjusted EBITDA is a non-GAAP measure and should be considered as a supplement to, and not as a substitute for, or superior to, financial measures calculated in accordance with GAAP. Adjusted EBITDA is equal to net income adding back net interest expense, provision for income taxes, depreciation and amortization, LIFO expense, stock-based compensation expense and net foreign currency transaction losses. |
| |
| (l) | Includes debt and capital lease obligations. |
| |
| ITEM 7. | MANAGEMENT'S DISCUSSION AND ANALYSIS OF FINANCIAL CONDITION AND RESULTS OF OPERATIONS |
ITEM 7.MANAGEMENT'S DISCUSSION AND ANALYSIS OF FINANCIAL CONDITION AND RESULTS
OF OPERATIONS
The following discussion and analysis of financial condition, results of operations, liquidity and capital resources should be read in conjunction with the accompanying audited consolidated financial statements and notes thereto that are included under Part II, Item 8, of this Form 10-K. Also refer to “Special Note Regarding Forward-Looking Statements,” which is included after Table of Contents in this Form 10-K.
Our Business
Core-Mark is one of the largest marketers of fresh and broad-line supply solutions to the convenience retail industry in North America. We offer a full range of products, marketing programs and technology solutions to approximately 26,000over 30,000 customer locations in the U.S. and Canada. Our customers include traditional convenience stores, grocery stores, drug stores, liquor stores and other specialty and small format stores that carry convenience products. Our product offering includes cigarettes, other tobacco products, candy, snacks, fast food, groceries, fresh products, dairy, bread, non-alcoholic beverages, general merchandise and health and beauty care products. We operate a network of 2428 distribution centers in the U.S. and Canada (excluding two distribution facilities we operate as a third party logistics provider). Our core business objective is to help our customers increase their sales and profitability.
Overview of 2013 Results
In 2013, we remained focused on growing market share and increasing our food/non-food revenues and gross profit by leveraging our “Fresh” product offering, driving our Vendor Consolidation Initiative (“VCI”), and providing customer category management expertise in order to make our independent retailers more relevant and profitable. We experienced sales growth and market share gains in 2013, resulting primarily from our acquisition of J.T. Davenport & Sons, Inc. (“Davenport”), the establishment of a distribution arrangement with a major customerand the execution of our core strategies. Further, we added approximately 1,000 new customer locations which now exceed 30,000 across the 50 states in the U.S. and Canada.five Canadian provinces, and we continue to expand into other retail channels.
We derive our netNet sales in 2013 increased 9.8% or $875.2 million, to $9,767.6 million compared to $8,892.4 million for 2012, driven primarily by the addition of Davenport, market share gains and an increase in food/non-food sales in the remaining business.
Gross profit in 2013 increased $60.3 million, or 12.6%, to $537.1 million from sales to convenience store customers. Our$476.8 million during 2012. Remaining gross profit is derived primarily by applying a markup to the cost of the product at the time of the sale and from cost reductions derived from vendor credit term discounts received and other vendor incentive programs. Our operating expenses are comprised primarily of sales personnel costs; warehouse personnel costs related to receiving, stocking and selecting product for delivery; delivery costs such as delivery personnel, truck leases and fuel; costs relating to the rental and maintenance of our facilities; and other general and administrative costs.
Overview of 2010 Results
Net sales for 2010(1) increased 11.3%$55.5 million, or 11.5%, to $7.27 billion compared to $6.53 billion$536.8 million in 2009, driven by an 11.6%2013 from $481.3 million for 2012. The increase in our cigaretteremaining gross profit was due primarily to increased sales attributable to Davenport and a 10.5% increasesales growth in our food/non-food sales. Salesproducts driven primarily by increased sales in both categories benefited from favorable foreign exchange rates and the acquisition of Finkle Distributors, Inc. ("FDI"), which we acquired in the third quarter of 2010.
The increase in food/non-food net sales was led by our food and other tobacco products (“OTP”)e-cigarette categories. This increase was a result of deeper sales to existing customers driven by the success of our marketing initiatives that focus on fresh foods and vendor consolidation (“VCI”). We added over 2,000 stores to our “Fresh and Local” food program during 2010, which drove a 38% increase in our fresh product, dairy and bread line items within our food category. In addition, we benefited from new customers, favorable foreign exchange rates and the FDI acquisition previously mentioned.
Cigarette net sales for 2010 increased due to price and excise tax inflation and a 3.0% increase in carton volume including FDI, or a 1.8% increase without. During 2010, carton sales in the U.S. increased 1.1% excluding FDI, driven primarily by market share gains. Carton sales in Canada increased 7.5%, led by customer growth in our Toronto division. Longer term, we continue to expect that overall cigarette consumption may be negatively impacted by rising prices, legislative actions, diminishing social acceptance and sales through illicit markets. However, we expect to offset the majority of the impact from these declines through market share expansion, growth in our non-cigarette categories and incremental gross profitthat resultsfrom cigarette manufacturer price increases. We expect cigarette manufacturers will raise prices as carton sales decline in order to maintain or enhance their overall profitability.
Despite the growth in our sales during 2010, we continue to monitor current macroeconomic conditions, including consumer confidence, spending, employment, fuel costs, and inflation/deflation levels. We believe these macroeconomic factors may have put pressure on other wholesalers and influenced the competitive landscape which ultimately impacted our margins. A significant change in macroeconomic conditions could materially impact our operating results.
Our remaining gross profit1 increased $12.7 million, or 3.3%, to $395.2 million during 2010 from $382.5 million last year. Remaining gross profit margin1 decreased 42 increased nine basis points to 5.50% in 2013 from 5.86% last year to 5.44% this year.5.41% in 2012. The net decline was due primarily to competitive pricing pressures which were most severe earlier this year. Remaining gross profit margins did improve somewhatincrease in the second half of the year, and we expect to make continued progress toward growing margins over time. We believe the margins in the fresh food line items will continue to improve and were not significantly impacted by the competitive pricing pressures affecting the more traditional categories. A return of meaningful product inflation and/or manufacturer promotions, coupled with market share expansion and deeper selling into existing accounts, is expected to help improve margins in the future. The convenience retail industry continues to move towards fresh foods, a more efficient supply chain and flexibility of service. We believe we are in a strong position to capitalize on these market trends.
1 Remaining gross profit and remaining gross profit margin was driven primarily by a shift in sales mix toward higher margin food/non-food items, which increased overall remaining gross profit margin by 26 basis points, offset by the addition of Davenport and a new major customer, which collectively reduced margins by 12 basis points. In addition, increases in cigarette manufacturers' prices compressed remaining gross profit margin by approximately five basis points in 2013.
Operating expenses as a percentage of net sales were 4.79% in 2013 compared to 4.72% for 2012. We continue to see upward pressure on operating expenses as a percent of sales due to a shift in net sales to food/non-food categories. This is due, in part, to the lower selling price points for these categories as well as an increase in the cubic feet of product we are non-GAAP financial measuresprocessing through our warehouses and delivering to our customers, which we providedrives operating costs higher as a percent of sales. To the extent our food/non-food sales continue to segregateincrease at a higher rate year-over-year than cigarettes, our operating expenses, especially warehouse and distribution expenses, may increase as a percentage of total net sales.
Income before income taxes increased by $10.6 million, or approximately 19.1%, to $66.0 million for 2013, driven primarily by the effectsaddition of Davenport, sales growth in our food/non-food categories and a $3.6 million decrease in LIFO expense cigarette inventory holding profits and other major non-recurring items that significantly affect the comparability of gross profit and related margins.compared to 2012. Net income increased by 22.7% to $41.6 million from $33.9 million in 2012. Adjusted EBITDA(2 ) was $109.5 million in 2013 compared to $100.8 million for 2012.
| |
| (1) | Remaining gross profit and remaining gross profit margin are non-GAAP financial measures which we provide to segregate the effects of cigarette inventory holding gains, LIFO expense and other items that significantly affect the comparability of gross profit and related margins (see the calculation of remaining gross profit and remaining gross profit margin in “Comparison of Sales and Gross Profit by Product Category” below). |
| |
| (2) | Adjusted EBITDA is a non-GAAP financial measure and should be considered as a supplement to, and not as a substitute for, or superior to, financial measures calculated in accordance with generally accepted accounting principles in the United States of America (“GAAP”) (see the calculation of Adjusted EBITDA in “Liquidity and Capital Resources” below). |
Operating income for 2010 was $28.9 million compared to $65.0 million last year. The decline was due primarily to a $19.1 million reduction in cigarette holding gains, net of federal excise taxes ("FET"), a $9.9 million increase in LIFO expense, a $5.3 million reduction in income earned primarily from manufacturer price increases, and approximately $5.5 million of additional operating expenses which are more fully discussed in our MD&A. In addition, competitive pressures on margins previously discussed were offset in part by operating expense leverage of approximately 25 basis points. Improved health care and workers' compensation costs helped to offset a $4.6 million increase in net fuel costs during the year, along with improved productivity and leverage in our other labor costs. Increases or decreases in future fuel costs or in the fuel surcharges we pass on to our customers may materially impact our financial results depending on the extent and timing of these changes.
Business and Supply Expansion
We continue to expandbenefit from the expansion of our presence eastward, expandbusiness and the execution of our core strategies focused primarily on enhancing our fresh product deliveryoffering, leveraging VCI and driveproviding category management expertise to our vendor consolidation initiative. customers. Our strategies take costs and inefficiencies out of the supply chain, bringing our customers an avenue to offer high quality fresh foods and optimize their consumer product offering. We believe each of these, when adopted, will increase the retailers' profits.
Some of our more recent expansion activities include:
| |
• | In 2010, as part of our selling strategy of providing “fresh” product to our retailers to meet consumer demand, we grew the number of stores participating in our proprietary “Fresh and Local” program by over 2,000 locations, increasing total participation to approximately 4,100 stores. A main component of the program is to assist independent convenience store operators in obtaining equipment solutions to properly implement a “fresh” program. Once the equipment solution is in place, we turn our focus to providing fresh product solutions to the convenience retailer, and we also add additional deliveries in order for them to stock the freshest possible product including fresh sandwiches, fresh bakery items, fruits, salads, vegetables and dairy products. We have partnered with local bakeries and commissaries to further enable us to deliver the freshest product possible aligned with geographical preferences. This program was in addition to our other sales and marketing initiatives focused on increasing sales for fresh products. |
| |
• | On August 2, 2010, we acquired substantially all of the assets of FDI, located in Johnstown, New York, for approximately $36.0 million. FDI is a regional, convenience wholesaler servicing customers in New York, Pennsylvania and the surrounding states. The acquired assets consist primarily of accounts receivable, inventory and fixed assets. Results of operations have been included in our consolidated statements of operations since the date of acquisition. Upon completion of the acquisition, we transitioned warehouse operations to our New England and Pennsylvania divisions. As a result of the acquisition, we expect to bring our industry leading Vendor Consolidation and Fresh initiatives to a larger population of convenience retailers primarily in the Northeast (see Note 3 -- Acquisitions to our consolidated financial statements).
|
| |
• | We entered into a five-year contract with BP Products North America in February 2010 to provide all of the ampm® proprietary products to its 1,200 stores nationwide. This agreement expands our existing relationship with BP Products North America from a focus in western states to a national basis. In addition, Core-Mark is now designated as the approved supplier for traditional nonproprietary products, in a move designed to further advance ampm®'s ongoing progress in supply chain efficiencies, marketing program effectiveness and consistency of offerings. |
| |
• | During the latter part of 2010, Core-Mark began marketing and distributing Jamba Juice's proprietary line of fresh deli wraps, salads and sandwiches. This "Grab 'n Go" line placed a face on fresh items which typically are marketed and sold without the benefit of brand recognition from the consumer within the convenience store channel. Over 150 convenience stores accepted this Core-Mark exclusive marketing opportunity and began merchandising and selling the product. In 2011 Core-Mark expects to expand the number of stores participating in the fresh Jamba Juice "Grab 'n Go" offering and also expects to considerably expand on the breadth of the Jamba Juice labeled product in areas such as fruit cups, yogurts, trail mix, nuts and others. The co-developed items will provide health-oriented food items for the convenience channel. |
| |
• | In June 2008, we acquired substantially all of the assets of Auburn Merchandise Distributors, Inc. (“AMD”), located in Whitinsville, Massachusetts, a wholly-owned subsidiary of Warren Equities, Inc., for approximately $28.7 million. The assets purchased included primarily accounts receivable, inventory and fixed assets. The AMD acquisition expanded our presence and infrastructure in the Northeastern region of the U.S., as its facility and the majority of its customers are located there (see Note 3 -- Acquisitions to our consolidated financial statements).
|
| |
• | We opened a distribution facility near Toronto, Ontario, in January 2008, to expand our existing market geography in Canada, and we signed a long-term supply agreement with Couche-Tard, a Canadian retailer that operates over 600 stores in the province of Ontario. |
In March 2013, we signed a five year agreement with Imperial Oil to service approximately 500 Esso branded stores located in Ontario and the Western Provinces of Canada. We successfully rolled out service to all the Esso stores in October 2013.
On May 7, 2013, we signed a three year distribution agreement with Turkey Hill, a subsidiary of the Kroger Co. (“Kroger”) and the largest of Kroger's convenience divisions, to service all their convenience stores, which are located across Pennsylvania, Ohio and Indiana. With the addition of the Turkey Hill stores, we serviced approximately 700 Kroger convenience locations as of December 31, 2013.
On December 17, 2012, we acquired Davenport, a large convenience wholesaler based in North Carolina, which services customers in the eight states of North Carolina, South Carolina, Georgia, Maryland, Ohio, Kentucky, West Virginia and Virginia. This acquisition increased Core-Mark's market presence in the Southeastern United States and further enhanced our ability to cost effectively service national and regional retailers (see Note 3 - Acquisitions).
We continue to add breadth to our proprietary “Fresh and Local™” program by expanding our fresh item solutions. During 2013, we realized sales and margin growth in our “Fresh” categories resulting from improving our customers’ product assortment, in-store marketing efforts and spoils management. As of December 31, 2013, there were approximately 9,200 participating stores in our “Fresh and Local™” program and sales for our Fresh categories grew by approximately 26% in 2013 compared to 2012.
Other Business Developments
ImpactDividends
In 2013, our Board of Directors declared quarterly cash dividends of $0.19 per common share on May 2, 2013 and August 1, 2013 and declared a quarterly cash dividend of $0.22 per common share on November 1, 2013. In lieu of the Passagefirst quarter 2013 dividend, our Board of Family Smoking Prevention and Tobacco Control Act
In June 2009, the Family Smoking Prevention and Tobacco Control Act was signed into law, which granted the FDA the authority to regulate the production and marketing of tobacco products in the U.S. The new legislation established a new FDA office that has the authority to regulate changes to nicotine yields and the chemicals and flavors used in tobacco products, require ingredient listings be displayed$0.19 per common share on tobacco products, prohibit the use of certain terms which may attract youth or mislead users as to the risks involved with using tobacco products, and limit or otherwise impact the advertising and marketing of tobacco products by requiring additional labels or warnings, as well as pre-approval by the FDA. This new FDA office is to be financed through user fees paid by tobacco companies prorated based on market share. To date, this legislation and its associated regulations have not had a material impact on our business.
Federal Excise Tax Liability Impact for the State Children's Health Insurance Program
In February 2009, the State Children's Health Insurance Program (“SCHIP”) was signed into law, which increased federal cigarette excise taxes levied on manufacturers of cigarettes from 39¢ to $1.01 per pack effective April 1, 2009. In March 2009, most U.S. manufacturers increased their list pricesDecember 20, 2012, which resulted in an increasea dividend payment of approximately 28%$2.2 million on Core-Mark's product purchasesDecember 31, 2012. We paid dividends of approximately $7.1 million in response to the passage of the SCHIP legislation. Net cigarette sales for 2010 and 2009 include approximately $105.9 million and $534.0 million, respectively, of increased sales from these price increases. Cigarette inventory holding profits were $6.1 million for 20102013 compared to cigarette inventory holding profits of $36.7 million, partially offset by a net federal floor stock tax of $11.5 million, for the same period in 2009. The significant cigarette inventory holding profits in 2009 were due primarily to increases in cigarette prices by manufacturers in response to the anticipated increase in federal excise taxes mandated by the SCHIP legislation. We paid approximately $12.7 million of federal excise floor taxes and received $1.2$10.3 million in reimbursements from cigarette and tobacco manufacturers for a net floor stock tax amount of $11.5 million, which was reflected as an increase to our cost of goods sold in 2009.2012.
Share Repurchase Program
DuringIn May 2013, our Board of Directors authorized a $30 million increase to our stock repurchase plan. At the year ended December 31, 2010, no sharestime of common stock were repurchasedincrease, we had $2.3 million remaining under our sharestock repurchase program. During the year ended December 31, 2009,plan that was then in place. In 2013, we repurchased 98,646126,872 shares of common stock at an average price of $22.77 per share for a total cost$56.60 compared to repurchases of $2.2 million. During the year ended December 31, 2008, we repurchased 396,716118,800 shares of common stock at an average price of $27.66 per share for a total cost of $11.0 million.
$43.34 in 2012. As of December 31, 2010 there was $16.82013 and 2012, we had $28.7 million and $5.8 million, respectively, available for future share repurchases under our share repurchasethe program. Our available funds for future share repurchases were re-established at $30 million under the February 2010 amendment to our Credit Facility (see Note 7 -- Long-Term Debt to our consolidated financial statements).
Results of Operations
Comparison of 20102013 and 20092012 (1)
| | | | | | | | | | | | | | | | | | | | | | | | |
| | | | | 2010 | | 2009 |
| | | 2010 | | Amounts (in millions) | | % of Net sales | | % of Net sales, less excise taxes | | Amounts (in millions) | | % of Net sales | | % of Net sales, less excise taxes |
| | | Increase (Decrease) (in millions) | | | | | | |
| Net sales | | $ | 735.2 | | | $ | 7,266.8 | | | 100.0 | % | | — | % | | $ | 6,531.6 | | | 100.0 | % | | — | % |
| Net sales — Cigarettes | | 530.6 | | | 5,119.7 | | | 70.5 | | | 64.0 | | | 4,589.1 | | | 70.3 | | | 64.0 | |
| Net sales — Food/non-food | | 204.6 | | | 2,147.1 | | | 29.5 | | | 36.0 | | | 1,942.5 | | | 29.7 | | | 36.0 | |
Net sales, less excise taxes (2) | | 494.7 | | | 5,510.3 | | | 75.8 | | | 100.0 | | | 5,015.6 | | | 76.8 | | | 100.0 | |
Gross profit (3) | | (16.3 | ) | | 385.3 | | | 5.3 | | | 7.0 | | | 401.6 | | | 6.1 | | | 8.0 | |
| Warehousing and | | | | | | | | | | | | | | |
| distribution expenses | | 14.5 | | | 211.8 | | | 2.9 | | | 3.8 | | | 197.3 | | | 3.0 | | | 3.9 | |
| Selling, general and | | | | | | | | | | | | | | |
| administrative expenses | | 5.2 | | | 142.5 | | | 2.0 | | | 2.6 | | | 137.3 | | | 2.1 | | | 2.7 | |
| Income from operations | | (36.1 | ) | | 28.9 | | | 0.4 | | | 0.5 | | | 65.0 | | | 1.0 | | | 1.3 | |
| Interest expense | | 0.9 | | | (2.6 | ) | | — | | | — | | | (1.7 | ) | | — | | | — | |
| Interest income | | 0.1 | | | 0.4 | | | — | | | — | | | 0.3 | | | — | | | — | |
| Foreign currency transaction | | | | | | | | | | | | | | |
| gains (losses), net | | (1.7 | ) | | 0.5 | | | — | | | — | | | 2.2 | | | — | | | — | |
| Income before taxes | | (38.6 | ) | | 27.2 | | | 0.4 | | | 0.5 | | | 65.8 | | | 1.0 | | | 1.3 | |
Net income (4) | | (29.6 | ) | | 17.7 | | | 0.2 | | | 0.3 | | | 47.3 | | | 0.7 | | | 0.9 | |
(1) Amounts and percentages have been rounded for presentation purposes and might differ from unrounded results.
(2) Net sales, less excise taxes is a non-GAAP financial measure which we provide to separate the increase in sales due to actual sales growth and increases in state, local and provincial excise taxes which we are responsible for collecting and remitting. Federal excise taxes are levied on the manufacturers who pass the taxes on to us as part of the product cost and thus are not a component of our excise taxes. Although increases in cigarette excise taxes result in higher net sales, our overall gross profit percentage may decrease as a result of increases in excise taxes since gross profit dollars generally remain the same (see Comparison of Sales and Gross Profit by Product Category, page 32).
(3) Gross margins may not be comparable to those of other entities because warehousing and distribution expenses are not included as a component of our cost of goods sold.
(4) The decrease in net income compared to 2009 was due primarily to a $19.1 million reduction in cigarette holding gains, a $5.3 million reduction in income earned primarily from manufacturer price increases, an increase in LIFO expense of $9.9 million and $5.5 million of additional expenses in 2010.
Consolidated Net Sales. Net sales for 2010 increased by $735.2 million, or 11.3%, to $7,266.8 million from $6,531.6 million in 2009. Excluding the effects of foreign currency fluctuations, sales from the FDI acquisition and approximately $105.9 million of incremental sales resulting from manufacturers' cigarette price increases in response to the SCHIP legislation, net sales increased by 6.1% in 2010 compared to 2009. This increase was the result of sales gains from new and existing customers and inflation of cigarette prices and excise taxes.
Net Sales of Cigarettes. Net sales of cigarettes for 2010 increased by $530.6 million, or 11.6%, to $5,119.7 million from $4,589.1 million in 2009. Net cigarette sales for 2010 increased 10.0%, excluding the effects of foreign currency fluctuations. The increase in net cigarette sales in 2010 was driven by an 8.3% increase in the average sales price per carton, due primarily to manufacturer price and excise tax increases, and an overall increase in carton sales of 3.0%, or 1.8% excluding sales from the FDI acquisition. Our carton sales in 2010 increased 1.1% in the U.S., excluding FDI, and increased 7.5% in Canada, attributable primarily to market share gains in our Toronto division. Total net cigarette sales as a percentage of total net sales were 70.5% in 2010 compared to 70.3% in 2009.
Net Sales of Food/Non-food Products. Net sales of food and non-food products for 2010 increased $204.6 million, or 10.5%, to $2,147.1 million from $1,942.5 million in 2009. The following table provides net sales by product category for our food/non-food products (in millions)(1):
| | | | | | | | | | | | | | |
| | 2010 | | 2009 | | Increase / (Decrease) |
| Product Category | Net Sales | | Net Sales | | Dollars | | Percentage |
| Food | $ | 840.9 | | | $ | 738.0 | | | $ | 102.9 | | | 13.9 | % |
| Candy | 426.0 | | | 405.0 | | | 21.0 | | | 5.2 | % |
| Other tobacco products | 503.6 | | | 434.0 | | | 69.6 | | | 16.0 | % |
| Health, beauty & general | 220.6 | | | 209.5 | | | 11.1 | | | 5.3 | % |
| Non-alcoholic beverages | 152.0 | | | 151.7 | | | 0.3 | | | 0.1 | % |
| Equipment/other | 4.0 | | | 4.3 | | | (0.3 | ) | | (5.5 | )% |
| | | | | | | | |
| Total Food/Non-food Products | $ | 2,147.1 | | | $ | 1,942.5 | | | $ | 204.6 | | | 10.5 | % |
|
| | | | | | | | | | | | | | | | | | | | | | | |
| | | | 2013 | | 2012 |
| | Increase (Decrease) | | Amounts | | % of Net sales | | % of Net sales, less excise taxes | | Amounts | | % of Net sales | | % of Net sales, less excise taxes |
| Net sales | $ | 875.2 |
| | $ | 9,767.6 |
| | 100.0 | % | | — | % | | $ | 8,892.4 |
| | 100.0 | % | | — | % |
| Net sales — Cigarettes | 502.6 |
| | 6,642.0 |
| | 68.0 |
| | 62.3 |
| | 6,139.4 |
| | 69.0 |
| | 63.1 |
|
| Net sales — Food/non-food | 372.6 |
| | 3,125.6 |
| | 32.0 |
| | 37.7 |
| | 2,753.0 |
| | 31.0 |
| | 36.9 |
|
Net sales, less excise taxes (2) | 811.4 |
| | 7,716.8 |
| | 79.0 |
| | 100.0 |
| | 6,905.4 |
| | 77.7 |
| | 100.0 |
|
Gross profit (3) | 60.3 |
| | 537.1 |
| | 5.5 |
| | 7.0 |
| | 476.8 |
| | 5.4 |
| | 6.9 |
|
| Warehousing and | | | | | | | | | | | | | |
| distribution expenses | 34.4 |
| | 297.1 |
| | 3.1 |
| | 3.9 |
| | 262.7 |
| | 3.0 |
| | 3.8 |
|
| Selling, general and | | | | | | | | | | | | | |
| administrative expenses | 14.6 |
| | 168.3 |
| | 1.7 |
| | 2.2 |
| | 153.7 |
| | 1.7 |
| | 2.2 |
|
| Amortization of | | | | | | | | | | | | | |
| intangible assets | (0.3 | ) | | 2.7 |
| | — |
| | — |
| | 3.0 |
| | — |
| | — |
|
| Income from operations | 11.6 |
| | 69.0 |
| | 0.7 |
| | 0.9 |
| | 57.4 |
| | 0.6 |
| | 0.8 |
|
| Interest expense | 0.5 |
| | (2.7 | ) | | — |
| | — |
| | (2.2 | ) | | — |
| | — |
|
| Interest income | 0.1 |
| | 0.5 |
| | — |
| | — |
| | 0.4 |
| | — |
| | — |
|
| Foreign currency transaction | | | | | | | | | | | | | |
| losses, net | 0.6 |
| | (0.8 | ) | | — |
| | — |
| | (0.2 | ) | | — |
| | — |
|
| Income before taxes | 10.6 |
| | 66.0 |
| | 0.7 |
| | 0.9 |
| | 55.4 |
| | 0.6 |
| | 0.8 |
|
| Net income | 7.7 |
| | 41.6 |
| | 0.4 |
| | 0.5 |
| | 33.9 |
| | 0.4 |
| | 0.5 |
|
Adjusted EBITDA (4) | 8.7 |
| | 109.5 |
| | 1.1 |
| | 1.4 |
| | 100.8 |
| | 1.1 |
| | 1.5 |
|
(1) Amounts and percentages have been rounded for presentation purposes and might differ from unrounded results.
Excluding the effects of foreign currency fluctuations, net sales of food/non-food products increased 9.0% in 2010 compared to 2009. The increase, primarily in our food and other tobacco products categories, was driven by our sales and marketing initiatives, sales gains from new customers and sales from the FDI acquisition. Total net sales of food and non-food products as a percentage of total net sales was 29.5% for 2010 compared to 29.7% for 2009.
Gross Profit. Gross profit represents the portion of sales remaining after deducting the cost of goods sold during the period. Vendor incentives, cigarette holding profits, federal floor stock taxes and changes in LIFO reserves are classified as elements of cost of goods sold. Gross profit for 2010 decreased by $16.3 million, or 4.1%, to $385.3 million from $401.6 million in 2009. This decrease in gross profit was due primarily to realizing $19.1 million more of cigarette inventory holding profits, net of floor stock tax, during 2009 largely related to the increase in federal excise tax mandated by the SCHIP legislation. In addition, LIFO expense increased by $9.9 million compared to the prior year, due primarily to the cigarette category, which reflected multiple price increases during the year.
The following table provides the components comprising the change in gross profit as a percentage of net sales for 2010 and 2009(1):
| | | | | | | | | | | | | | | | | | | |
| | 2010 | | 2009 |
| | Amounts (in millions) | | % of Net sales | | % of Net sales, less excise taxes | | Amounts (in millions) | | % of Net sales | | % of Net sales, less excise taxes |
| Net sales | $ | 7,266.8 | | | 100.0 | % | | — | | | $ | 6,531.6 | | | 100.0 | % | | — | |
Net sales, less excise taxes (2) | 5,510.3 | | | 75.8 | | | 100.0 | % | | 5,015.6 | | | 76.8 | | | 100.0 | % |
| Components of gross profit: | | | | | | | | | | | |
| Cigarette inventory holding profits | $ | 6.1 | | | 0.08 | % | | 0.11 | % | | $ | 36.7 | | | 0.56 | % | | 0.73 | % |
Net federal floor stock tax (3) | — | | | — | | | — | | | (11.5 | ) | | (0.18 | ) | | (0.23 | ) |
OTP tax items (4) | 0.6 | | | 0.01 | | | 0.01 | | | 0.6 | | | 0.01 | | | 0.01 | |
| LIFO expense | (16.6 | ) | | (0.23 | ) | | (0.30 | ) | | (6.7 | ) | | (0.10 | ) | | (0.13 | ) |
Remaining gross profit (5) | 395.2 | | | 5.44 | | | 7.17 | | | 382.5 | | | 5.86 | | | 7.63 | |
| Gross profit | $ | 385.3 | | | 5.30 | % | | 6.99 | % | | $ | 401.6 | | | 6.15 | % | | 8.01 | % |
(1) Amounts and percentages have been rounded for presentation purposes and might differ from unrounded results.
(2) Net sales, less excise taxes is a non-GAAP financial measure which we provide to separate the increase in sales due to actual | |
| (1) | Amounts and percentages have been rounded for presentation purposes and might differ from unrounded results. |
| |
| (2) | Net sales, less excise taxes is a non-GAAP financial measure which we provide to separate the increase in sales due to product sales growth and increases in state, local and provincial excise taxes which we are responsible for collecting and remitting. Federal excise taxes are levied on the manufacturers who pass the taxes on to us as part of the product cost and thus are not a component of our excise taxes. Although increases in cigarette excise taxes result in higher net sales, our overall gross profit percentage may be reduced; however we do not expect increases in excise taxes to negatively impact gross profit per carton (see Comparison of Sales and Gross Profit by Product Category). |
| |
| (3) | Gross profit may not be comparable to those of other entities because warehousing and distribution expenses are not included as a component of our cost of goods sold. |
| |
| (4) | Adjusted EBITDA is a non-GAAP financial measure and should be considered as a supplement to, and not as a substitute for, or superior to, financial measures calculated in accordance with GAAP (see calculation of Adjusted EBITDA in “Liquidity and Capital Resources” below). |
Net Sales. Net sales for 2013 increased by $875.2 million, or 9.8%, to $9,767.6 million from $8,892.4 million in 2012. Excluding excise taxes, net sales increased by 11.8% in 2013 due primarily to the addition of Davenport, net market share gains and incremental net sales to existing customers driven primarily by the success of our core strategies.
Net Sales of Cigarettes. Net sales of cigarettes for 2013 increased by $502.6 million, or 8.2%, to $6,642.0 million from $6,139.4 million in 2012. Net sales of cigarettes, excluding excise taxes, increased by 10.4% for the same periods. The increase in net cigarette sales was driven primarily by sales from Davenport, net market share gains and a 2.3% increase in the average price per carton, offset by a 1.8% decrease in carton sales. In the U.S., cigarette carton sales decreased by 1.2% excluding incremental carton sales from Davenport. Carton sales in Canada decreased by 7.5% due primarily to the loss of two non-major customers in the fourth quarter of 2012. Total net cigarette sales as a percentage of total net sales were 68.0% in 2013 compared to 69.0% for 2012.
We believe long-term cigarette consumption will be negatively impacted by rising prices, legislative actions, diminishing social acceptance and sales through illicit markets. We expect cigarette manufacturers will raise prices as carton sales decline in order to maintain or enhance their overall profitability, thus mitigating the effects of the decline to the distributor. In addition,
industry data indicates that convenience retailers are more than offsetting cigarette volume profit declines through higher sales of food/non-food products. We expect this trend to continue as the convenience industry adjusts to consumer demands.
Net Sales of Food/Non-food Products. Net sales of food/non-food products for 2013 increased $372.6 million, or 13.5%, to $3,125.6 million from $2,753.0 million in 2012. The following table provides net sales by product category for our food/non-food products (in millions)(1):
|
| | | | | | | | | | | | | | |
| | 2013 | | 2012 | | Increase / (Decrease) |
| Product Category | Net Sales | | Net Sales | | Amounts | | Percentage |
| Food | $ | 1,342.3 |
| | $ | 1,178.6 |
| | $ | 163.7 |
| | 13.9 | % |
| Candy | 527.2 |
| | 489.5 |
| | 37.7 |
| | 7.7 |
|
| Other tobacco products | 787.8 |
| | 687.8 |
| | 100.0 |
| | 14.5 |
|
| Health, beauty & general | 327.3 |
| | 269.2 |
| | 58.1 |
| | 21.6 |
|
| Beverages | 139.1 |
| | 125.6 |
| | 13.5 |
| | 10.7 |
|
| Equipment/other | 1.9 |
| | 2.3 |
| | (0.4 | ) | | (17.4 | ) |
| Total Food/Non-food Products | $ | 3,125.6 |
| | $ | 2,753.0 |
| | $ | 372.6 |
| | 13.5 | % |
| |
(1) | Amounts and percentages have been rounded for presentation purposes and might differ from unrounded results. |
The increase in food/non-food sales in 2013 was driven primarily by sales from Davenport, net market share gains and incremental net sales from existing customers. Continued success in implementing our core strategies, benefiting primarily the food category, was a meaningful driver to the improvement in net sales to existing customers during 2013. In addition, we continued to see higher sales of smokeless tobacco products in our other tobacco products category (“OTP”) and e-cigarettes included in our health, beauty & general product category. We believe the trend toward increased use of smokeless tobacco products and e-cigarettes by consumers will continue and will help offset the impact of expected continued declines in cigarette consumption. This shift could potentially result in improved profitability over time due to the profit margins associated with smokeless tobacco products and e-cigarettes, being generally higher than the profit margins we earn on cigarette carton sales. Total net sales of food/non-food products as a percentage of total net sales increased to 32.0% in 2013 compared to 31.0% in 2012.
Gross Profit. Gross profit represents the amount of profit after deducting cost of goods sold from net sales during the period. Vendor incentives, inventory holding gains and changes in LIFO reserves are components of cost of goods sold and therefore part of our gross profit. Gross profit for 2013 increased by $60.3 million, or 12.6%, to $537.1 million from $476.8 million in 2012 due primarily to the addition of Davenport, an increase in sales of higher margin food and e-cigarette products and a $3.6 million decrease in LIFO expense. Gross profit margin was 5.50% of total net sales for 2013 compared to 5.36% for 2012.
The following table provides the components comprising the change in gross profit as a percentage of net sales for 2013 and 2012 (in millions)(1):
|
| | | | | | | | | | | | | | | | | | | | | | | |
| | | | 2013 | | 2012 |
| | Increase (Decrease) | | Amounts | | % of Net sales | | % of Net sales, less excise taxes | | Amounts | | % of Net sales | | % of Net sales, less excise taxes |
| Net sales | $ | 875.2 |
| | $ | 9,767.6 |
| | 100.0 | % | | — | % | | $ | 8,892.4 |
| | 100.0 | % | | — | % |
Net sales, less excise taxes (2) | 811.4 |
| | 7,716.8 |
| | 79.0 |
| | 100.0 |
| | 6,905.4 |
| | 77.7 |
| | 100.0 |
|
| Components of gross profit: | | | | | | | | | | | | | |
Cigarette inventory holding gains(3) | $ | 1.2 |
| | $ | 9.0 |
| | 0.09 | % | | 0.12 | % | | $ | 7.8 |
| | 0.09 | % | | 0.11 | % |
| LIFO expense | 3.6 |
| | (8.7 | ) | | (0.09 | ) | | (0.12 | ) | | (12.3 | ) | | (0.14 | ) | | (0.18 | ) |
Remaining gross profit (4) | 55.5 |
| | 536.8 |
| | 5.50 |
| | 6.96 |
| | 481.3 |
| | 5.41 |
| | 6.97 |
|
| Gross profit | $ | 60.3 |
| | $ | 537.1 |
| | 5.50 | % | | 6.96 | % | | $ | 476.8 |
| | 5.36 | % | | 6.90 | % |
| |
| (1) | Amounts and percentages have been rounded for presentation purposes and might differ from unrounded results. |
| |
| (2) | Net sales, less excise taxes is a non-GAAP financial measure which we provide to separate the increase in sales due to product sales growth and increases in state, local and provincial excise taxes which we are responsible for collecting and remitting. Federal excise taxes are levied on the manufacturers who pass the tax on to us as part of the product cost and thus are not a component of our excise taxes. Although increases in cigarette excise taxes result in |
higher net sales, our overall gross profit percentage may be reduced; however we do not expect increases in excise taxes to negatively impact gross profit per carton (see Comparison of Sales and Gross Profit by Product Category).
(3) The amount of cigarette inventory holding gains attributable to the U.S. and Canada were $8.3 million and $0.7 million, respectively, for 2013, compared to $7.0 million and $0.8 million, respectively, for 2012.
| |
| (4) | Remaining gross profit is a non-GAAP financial measure which we provide to segregate the effects of LIFO expense, cigarette inventory holding gains and other items that significantly affect the comparability of gross profit. |
Remaining gross profit increased $55.5 million, or 11.5%, to $536.8 million for 2013 from $481.3 million in 2012. In 2013, our remaining gross profit for food/non-food products was approximately 70.8% of our total remaining gross profit compared to 68.6% for 2012.
Remaining gross profit margin was 5.50% of total net sales in 2013 compared to 5.41% in 2012. The increase in remaining gross profit margin was driven primarily by a shift in sales mix toward higher margin food/non-food items, which increased overall remaining gross profit margin by 26 basis points, offset by the addition of Davenport and a new major customer which reduced margins collectively by 12 basis points. In addition, increases in cigarette manufacturer prices lowered remaining gross profit margin by five basis points in 2013 compared with 2012.
Cigarette remaining gross profit per carton decreased by 3.5% in 2013 compared to 2012 due primarily to carton sales of Davenport and to the new major customer.
Food/non-food remaining gross profit increased by $49.7 million, or 15.1%, in 2013 compared to 2012. Food/non-food remaining gross profit margin increased 16 basis points to 12.15% in 2013 compared with 11.99% in 2012. Excluding Davenport and the new major customer, food/non-food remaining gross profit margin increased by 23 basis points driven primarily by sales growth in our food category and e-cigarette products, offset by OTP, which had higher sales in 2013 but lower gross profit margins relative to other food/non-food products.
To the extent we capture large chain business, our gross profit margins may be negatively impacted. However, large chain customers generally require less working capital, allowing us, in most cases, to offer lower prices to achieve a favorable return on our investment. Our focus is to strike a balance between large chain business, which generally has lower gross profit margins, and independently-owned convenience stores, which comprise over 64% of the overall convenience store market and generally have higher gross profit margins. In addition, although price inflation did not materially impact our results from operations on a comparable basis in 2013, our gross profit can be positively or negatively impacted on a comparable basis depending on the relative level of price inflation or deflation period over period.
Operating Expenses. Our operating expenses include costs related to Warehousing and Distribution, Selling, General and Administrative and Amortization of Intangible Assets. In 2013, operating expenses increased by $48.7 million, or 11.6%, to $468.1 million from $419.4 million in 2012. The increase in operating expenses was due primarily to the addition of Davenport and an increase in sales volume of food/non-food products. As a percentage of net sales, total operating expenses was 4.8% in 2013 compared to 4.7% in 2012. A shift in sales to food/non-food products increased operating expenses as a percentage of net sales in 2013 since food/non-food products have lower sales price points than the cigarette category.
Warehousing and Distribution Expenses. Warehousing and distribution expenses increased by $34.4 million, or 13.1%, to $297.1 million in 2013 from $262.7 million in 2012. The increase in warehousing and distribution expenses was due primarily to the addition of Davenport and a 7.6% increase in cubic feet of product handled for the remainder of the business compared to the prior year. As a percentage of total net sales, warehousing and distribution expenses were 3.1% and 3.0% for 2013 and 2012, respectively, yet on a cost per cubic foot basis, decreased 0.7% on a comparable basis.
Selling, General and Administrative (“SG&A”) Expenses. SG&A expenses increased by $14.6 million, or 9.5% in 2013 to $168.3 million from $153.7 million in 2012. The increase in SG&A expenses was due primarily to expenses attributable to Davenport and an increase of approximately $1.2 million related to integration and business expansion activities in the Eastern U.S. In addition, SG&A expenses in 2012 include a $1.8 million benefit related to the favorable resolution of legacy worker’s compensation and insurance claims. As a percentage of net sales, SG&A expenses were 1.7% for both 2013 and 2012.
Interest Expense. Interest expense includes both interest and loan amortization fees related to borrowings and facility fees and interest on capital lease obligations. Interest expense was $2.7 million and $2.2 million in 2013 and 2012, respectively. The increase in interest expense was due primarily to expenses related to a capital lease arrangement for a warehouse facility entered into in December 2012. Average borrowings in 2013 were $35.3 million with an average interest rate of 1.8%, compared to average borrowings of $26.3 million and an average interest rate of 2.1% in 2012.
Foreign Currency Transaction Losses, Net. Foreign currency transaction losses were $0.8 million in 2013 compared to $0.2 million in 2012. The change was due primarily to the fluctuation in the Canadian/U.S. dollar exchange rate.
Income Taxes. Our effective tax rate was 37.0% for 2013 compared to 38.8% for 2012. The decrease in our effective tax rate for 2013 was due primarily to a higher proportion of earnings from states with lower tax rates and a net benefit of $0.9 million, compared to a net benefit of $0.5 million in 2012, related primarily to adjustments of prior year’s estimates and the expiration of the statute of limitations for uncertain tax positions.
Results of Operations
Comparison 2012 and 2011 (in millions) (1):
|
| | | | | | | | | | | | | | | | | | | | | | | |
| | | | 2012 | | 2011 |
| | Increase (Decrease) | | Amounts | | % of Net sales | | % of Net sales, less excise taxes | | Amounts | | % of Net sales | | % of Net sales, less excise taxes |
| Net sales | $ | 777.5 |
| | $ | 8,892.4 |
| | 100.0 | % | | — | % | | $ | 8,114.9 |
| | 100.0 | % | | — | % |
| Net sales — Cigarettes | 428.8 |
| | 6,139.4 |
| | 69.0 |
| | 63.1 |
| | 5,710.6 |
| | 70.4 |
| | 64.1 |
|
| Net sales — Food/non-food | 348.7 |
| | 2,753.0 |
| | 31.0 |
| | 36.9 |
| | 2,404.3 |
| | 29.6 |
| | 35.9 |
|
Net sales, less excise taxes (2) | 742.0 |
| | 6,905.4 |
| | 77.7 |
| | 100.0 |
| | 6,163.4 |
| | 76.0 |
| | 100.0 |
|
Gross profit (3) | 42.7 |
| | 476.8 |
| | 5.4 |
| | 6.9 |
| | 434.1 |
| | 5.3 |
| | 7.0 |
|
| Warehousing and | | | | | | | | | | | | | |
| distribution expenses | 28.1 |
| | 262.7 |
| | 3.0 |
| | 3.8 |
| | 234.6 |
| | 2.9 |
| | 3.8 |
|
| Selling, general and | | | | | | | | | | | | | |
| administrative expenses | 2.9 |
| | 153.7 |
| | 1.7 |
| | 2.2 |
| | 150.8 |
| | 1.9 |
| | 2.4 |
|
| Amortization of | | | | | | | | | | | | | |
| intangible assets | — |
| | 3.0 |
| | — |
| | — |
| | 3.0 |
| | — |
| | — |
|
| Income from operations | 11.7 |
| | 57.4 |
| | 0.6 |
| | 0.8 |
| | 45.7 |
| | 0.6 |
| | 0.7 |
|
| Interest expense | (0.2 | ) | | (2.2 | ) | | — |
| | — |
| | (2.4 | ) | | — |
| | — |
|
| Interest income | — |
| | 0.4 |
| | — |
| | — |
| | 0.4 |
| | — |
| | — |
|
| Foreign currency transaction | | | | | | | | | | | | | |
| losses | (0.3 | ) | | (0.2 | ) | | — |
| | — |
| | (0.5 | ) | | — |
| | — |
|
| Income before taxes | 12.2 |
| | 55.4 |
| | 0.6 |
| | 0.8 |
| | 43.2 |
| | 0.5 |
| | 0.7 |
|
| Net income | 7.7 |
| | 33.9 |
| | 0.4 |
| | 0.5 |
| | 26.2 |
| | 0.3 |
| | 0.4 |
|
Adjusted EBITDA (4) | 8.9 |
| | 100.8 |
| | 1.1 |
| | 1.5 |
| | 91.9 |
| | 1.1 |
| | 1.5 |
|
| |
| (1) | Amounts and percentages have been rounded for presentation purposes and might differ from unrounded results. |
| |
| (2) | Net sales, less excise taxes is a non-GAAP financial measure which we provide to separate the increase in sales due to product sales growth and increases in state, local and provincial excise taxes which we are responsible for collecting and remitting. Federal excise taxes are levied on the manufacturers who pass the taxes on to us as part of the product cost and thus are not a component of our excise taxes. Although increases in cigarette excise taxes result in higher net sales, our overall gross profit percentage may be reduced; however we do not expect increases in excise taxes to negatively impact gross profit per carton (see Comparison of Sales and Gross Profit by Product Category). |
| |
| (3) | Gross profit may not be comparable to those of other entities because warehousing and distribution expenses are not included as a component of our cost of goods sold. |
| |
| (4) | Adjusted EBITDA is a non-GAAP financial measure and should be considered as a supplement to, and not as a substitute for, or superior to, financial measures calculated in accordance with GAAP (see calculation of adjusted EBITDA in “Liquidity and Capital Resources” below). |
Net Sales. Net sales for 2012 increased by $777.5 million, or 9.6%, to $8,892.4 million from $8,114.9 million in 2011. The increase was due primarily to market share gains in the Southeastern U.S., sales attributable to FCGC, cigarette price inflation and an additional 6.4% increase in food/non-food sales driven primarily by higher sales to new and existing customers.
Net Sales of Cigarettes. Net sales of cigarettes for 2012 increased by $428.8 million, or 7.5%, to $6,139.4 million from $5,710.6 million in 2011. This increase in net cigarette sales in 2012 was driven primarily by sales attributable to our market share gains in the Southeastern U.S. and FCGC in 2012. In addition, there was a2.4% increase in the average sales price per carton due primarily to cigarette manufacturer price increases. Total carton sales during 2012 increased 5.9%, consisting of an increase of 7.5% in the U.S., offset by a decrease of 7.5% in Canada. Excluding incremental carton sales attributable to the market share gains in the Southeastern U.S. and FCGC, carton sales declined by 1.4% in the U.S., which was less than the overall industry decline of approximately 3.0%. The decline in Canada related primarily to the loss of one customer, representing less than 0.3% of total cartons sold by the Company, and a focused reduction in service to certain customers which resulted in improved profitability for the Canadian region in 2012. While we have experienced only slight declines in carton sales on a comparative basis, we believe long-term cigarette consumption will be negatively impacted by rising prices, legislative actions, diminishing social acceptance and sales through illicit markets. We expect cigarette manufacturers will raise prices as carton sales decline in order to maintain
or enhance their overall profitability, thus mitigating the effects of the decline to the distributor. In addition, industry data indicates that convenience retailers are more than offsetting cigarette volume profit declines through higher sales of food/non-food products. We expect this to continue as the convenience industry adjusts to consumer demands. Total net cigarette sales as a percentage of total net sales were 69.0% in 2012 compared to 70.4% in 2011.
Net Sales of Food/Non-food Products. Net sales of food/non-food products for 2012 increased $348.7 million, or 14.5%, to $2,753.0 million from $2,404.3 million in 2011. The following table provides net sales by product category for our food/non-food products (in millions)(1):
|
| | | | | | | | | | | | | | |
| | 2012 | | 2011 | | Increase / (Decrease) |
| Product Category | Net Sales | | Net Sales | | Amounts | | Percentage |
| Food | $ | 1,178.6 |
| | $ | 995.7 |
| | $ | 182.9 |
| | 18.4 | % |
| Candy | 489.5 |
| | 459.8 |
| | 29.7 |
| | 6.5 |
|
| Other tobacco products | 687.8 |
| | 607.9 |
| | 79.9 |
| | 13.1 |
|
| Health, beauty & general | 269.2 |
| | 237.5 |
| | 31.7 |
| | 13.3 |
|
| Beverages | 125.6 |
| | 100.9 |
| | 24.7 |
| | 24.5 |
|
| Equipment/other | 2.3 |
| | 2.5 |
| | (0.2 | ) | | (8.0 | ) |
| Total Food/Non-food Products | $ | 2,753.0 |
| | $ | 2,404.3 |
| | $ | 348.7 |
| | 14.5 | % |
| |
| (1) | Amounts and percentages have been rounded for presentation purposes and might differ from unrounded results. |
Sales associated with market share gains in the Southeastern U.S. and FCGC represented approximately 59% of the increase in food/non-food sales for 2012. The remaining 41% increase in food/non-food sales was due primarily to higher sales in our food category driven by our sales and marketing initiatives with existing and new customers and higher sales of smokeless tobacco products included in our OTP and health, beauty & general product categories, which we believe was driven primarily by increased restrictions on where people are allowed to smoke in public. Total net sales of food/non-food products as a percentage of total net sales increased to 31.0% for 2012 compared to 29.6% in 2011.
Gross Profit. Gross profit represents the amount of profit after deducting cost of goods sold from net sales during the period. Vendor incentives, inventory holding gains and changes in LIFO reserves are components of cost of goods sold and therefore part of our gross profit. Gross profit for 2012 increased by $42.7 million, or 9.8%, to $476.8 million from $434.1 million in 2011 due primarily to our market share gains in the Southeastern U.S., FCGC and an increase in sales in our food/non-food category. Gross profit margin was 5.36% of total net sales for 2012 compared to 5.35% for 2011. Inflation from cigarette price increases in 2012 compressed our gross profit margin by approximately four basis points.
The following table provides the components comprising the change in gross profit as a percentage of net sales for 2012 and 2011 (in millions)(1):
|
| | | | | | | | | | | | | | | | | | | | | | | |
| | | | 2012 | | 2011 |
| | Increase (Decrease) | | Amounts | | % of Net sales | | % of Net sales, less excise taxes | | Amounts | | % of Net sales | | % of Net sales, less excise |
| Net sales | $ | 777.5 |
| | $ | 8,892.4 |
| | 100.0 | % | | — | % | | $ | 8,114.9 |
| | 100.0 | % | | — | % |
Net sales, less excise taxes(2) | 742.0 |
| | 6,905.4 |
| | 77.7 |
| | 100.0 |
| | 6,163.4 |
| | 76.0 |
| | 100.0 |
|
| Components of gross profit: | | | | | | | | | | | | | |
Cigarette inventory holding gains(3) | $ | (0.4 | ) | | $ | 7.8 |
| | 0.09 | % | | 0.11 | % | | $ | 8.2 |
| | 0.10 | % | | 0.13 | % |
Net candy holding gain(4) | (5.9 | ) | | — |
| | — |
| | — |
| | 5.9 |
| | 0.07 |
| | 0.10 |
|
OTP tax items(5) | (0.8 | ) | | — |
| | — |
| | — |
| | 0.8 |
| | 0.01 |
| | 0.01 |
|
| LIFO expense | 6.0 |
| | (12.3 | ) | | (0.14 | ) | | (0.18 | ) | | (18.3 | ) | | (0.22 | ) | | (0.30 | ) |
Remaining gross profit(6) | 43.8 |
| | 481.3 |
| | 5.41 |
| | 6.97 |
| | 437.5 |
| | 5.39 |
| | 7.10 |
|
| Gross profit | $ | 42.7 |
| | $ | 476.8 |
| | 5.36 | % | | 6.90 | % | | $ | 434.1 |
| | 5.35 | % | | 7.04 | % |
| |
| (1) | Amounts and percentages have been rounded for presentation purposes and might differ from unrounded results. |
| |
| (2) | Net sales, less excise taxes is a non-GAAP financial measure which we provide to separate the increase in sales due to product sales growth and increases in state, local and provincial excise taxes which we are responsible for collecting and remitting. Federal excise taxes are levied on the manufacturers who |
pass the tax on to us as part of the product cost and thus are not a component of our excise taxes. Although increases in cigarette excise taxes result in higher net sales, our overall gross profit percentage may decrease sincebe reduced; however we do not expect increases in excise taxes to negatively impact gross profit dollars generally remain the sameper carton (see Comparison of Sales and Gross Profit by Product Category page 32).
| |
| (3) | The amount of cigarette inventory holding gains attributable to the U.S. and Canada were $7.0 million and $0.8 million, respectively, for 2012, compared to $7.4 million and $0.8 million, respectively, for 2011. |
| |
| (4) | In 2011, we recognized a $5.9 million net candy holding gain resulting from U.S. manufacturer price increases. The net candy holding gain was estimated as the amount in excess of our normal manufacturer incentives for those products sold during the year. |
| |
| (5) | We received an OTP tax settlement of $0.8 million in 2011. |
| |
| (6) | Remaining gross profit is a non-GAAP financial measure which we provide to segregate the effects of LIFO expense, cigarette inventory holding gains and other items that significantly affect the comparability of gross profit. |
(3) In February 2009, SCHIP was signed into law and imposed a floor stock tax on tobacco products held for sale on April 1,
2009. The net floor stock tax was recorded as an increase to our cost of goods sold in the second quarter of 2009.
(4) We recognized a $0.6 million Other Tobacco Products ("OTP ") tax gain resulting from a state tax method change in 2010. We recognized an OTP tax refund of $0.6 million in 2009.
(5) Remaining gross profit is a non-GAAP financial measure which we provideincreased $43.8 million, or 10.0%, to segregate the effects of LIFO expense, cigarette inventory holding profits, FET associated with the SCHIP legislation and other major non-recurring items that significantly affect the comparability of gross profit.
Our$481.3 million for 2012 from $437.5 million in 2011. The increase in remaining gross profit was 5.44% of total net sales for 2010 compared with 5.86%driven by a $32.2 million, or 10.8%, increase in 2009. The incremental sales related to the cigarette price increases associated with SCHIP reduced ourfood/non-food remaining gross profit and a 2.3% per carton increase in cigarette remaining gross profit. Remaining gross profit margin for 2012 increased slightly to 5.41% from 5.39% for 2011. The increase in remaining gross profit margin was driven by our marketing strategies focused primarily on our food/non-food commodities offset by lower profit margins under the new Southeastern customer agreement with Couche-Tard, lower income from manufacturer price increases, as well as margin compression resulting from price increases by approximately eight basis pointscigarette manufacturers in 2010.2012.
Cigarette remaining gross profit decreased approximately 1.6% onincreased 8.3% in 2012 compared to 2011 due primarily to a cents5.9% increase in cartons sold, driven by market share gains in the Southeastern United States and sales by FCGC. On a per carton basis, cigarette remaining gross profit increased 2.3% in 20102012 compared with to 2011.
2009 dueFood/non-food remaining gross profit increased $32.2 million, or 10.8%, for 2012 compared to 2011, despite a decrease of $3.6 million in inventory holding gains. The increase in food/non-food remaining gross profit was driven primarily by market share gains in the Southeastern U.S., FCGC and growth in sales to the effect of competitive pricing pressures.existing customers. Remaining gross profit margin for our food/non-food category decreased approximately 76 basis points in 2010 to 12.60%for 2012 was 11.99% compared to 13.36%12.39% for 2011. The new Southeastern customer agreement with Couche-Tard and business acquired with other larger chain customers in 2009. The decrease in total2012 compressed remaining gross profit was attributable primarily to contract renewals, competitive pricing pressures and a net reduction of $5.3 million related tofor food/non-food by approximately 39 basis points. In addition, lower income earned primarily from manufacturer price increases.increases for food/non-food in 2012 reduced remaining gross profit margin by 17 basis points compared to 2011.Our gross profit can be positively or negatively impacted on a comparable basis depending on the relative level of price inflation or deflation period over period and the timing of certain vendor incentives. In addition, to the extent that we continue to capture additional large chain business, our gross profit margins may be negatively impacted. However, large chain customers generally require less working capital, allowing us, in most cases, to offer lower prices to achieve a favorable return on our investment. Our focus is to strike a balance between large chain business, which generally have lower gross profit margins and independently owned convenience stores, which generally have higher gross profit margins and comprise over 65% of the overall convenience store market in the U.S.2010,
In 2012, our remaining gross profit for food/non-food products increased towas approximately 68.5%68.6% of our total remaining gross profit compared to 67.9%68.1% in 2009.2011.
Operating Expenses. Our operating expenses include costs related to warehousing, distribution,Warehousing and selling, generalDistribution, Selling, General and administrative activities.Administrative and Amortization of Intangible Assets. In 2010,2012, operating expenses increased $19.8$31.0 million, or 5.9%8.0%, to $356.4$419.4 million from $336.6$388.4 million in 2011. 2009T.he increase in operating expenses was due primarily to the new Florida distribution center, additional costs to support the increased sales volume and the acquisition of FCGC in May 2011. Additional items impacting operating expenses for the year ended December 31, 2012 are discussed below. As a percentage of net sales, total operating expenses declined to 4.9% in 20104.7% for 2012 compared to 5.2% in 2009. Our operating expenses in 2010 included $5.5 million of additional expenses consisting of $2.8 million of integration expenses associated with the FDI acquisition, $1.6 million of costs related to the settlement of insurance claims we inherited from Fleming, our former parent, and $1.1 million of expenses4.8% for advisory and due diligence activities necessary to analyze multiple offers from potential acquirers. Operating expenses also included $7.1 million of expenses related to the operations of FDI. Our operating expenses in 2009 included $0.9 million of costs to convert our New England division onto our information systems platform. Excluding the items above, operating expenses in 2010 increased $8.1 million, or 2.4%, to $343.8 million.2011.
Warehousing and Distribution Expenses. Warehousing and distribution expenses in 2012 increased $14.5$28.1 million, or 7.3%12.0%, to $211.8$262.7 million from $234.6 million in 2010 from $197.3 million in 2009. Included2011. The increase in warehousing and distribution expenses for 2010 were $4.3 million of incremental net fuel costs, excluding FDI, and $4.0 million of expenses relatedwas due primarily to the operationsnew Florida distribution center, additional costs to support the increased sales volume, the addition of FDI which we acquired this year. TheFCGC and a $2.5 million increase in healthcare claims and workers compensation costs. In addition, warehousing and distribution expenses for 2012 were impacted by temporary operational inefficiencies at certain divisions resulting primarily in higher labor costs, and a $1.0 million increase in net fuel costs, was due primarilylargely to higher fuel prices and an increase in mileage due primarilymiles driven. Although the price we pay for fuel increased only modestly in 2012, future increases or decreases in fuel costs, or in the fuel surcharges we pass on to market share expansion.our customers, may materially impact our financial results depending on the extent and timing of these changes. As a percentage of net sales, warehousing and distribution expenses were 2.9%3.0% for 20102012 compared with 3.0%to 2.9% for 2009.2011.
Selling, General and Administrative (“SG&A”) Expenses. SG&A expenses in 2012 increased $5.2$2.9 million, or 3.8%1.9%, in 2010to $142.5$153.7 million from $137.3$150.8 million in 2009.2011. The increase in SG&A expenses was due primarily to the addition of the Florida distribution center, the acquisition of FCGC and $1.3 million of Davenport acquisition costs, partially offset by a $1.8 million reduction in 2010expenses resulting from the favorable resolution of legacy workers' compensation and insurance claims. SG&A expenses for 2011 included $3.1$2.7 million of acquisition and start-up costs related to the operations of FDI, $2.8 million of integration expenses associated with the FDI acquisition, $1.6FCGC and $1.8 million of costs related to the settlement
start-up of the Florida distribution center and $1.1 million of expenses for advisory and due diligence activities necessaryother infrastructure costs to analyze multiple offers from potential acquirers. SG&A expenses for 2009 included $0.9 million of costs related tosupport the integration of our New England division onto our information systems platform. Excluding the items above, SG&A expenses decreased $2.5 million, or 1.8%, to $133.9 million. The decrease is due primarily to reductions in health care and workers' compensation costs and cost savings initiatives.new Southeastern customer agreement with Couche-Tard. As a percentage of net sales, SG&A expenses declined to 2.0%1.7% for 20102012 compared with 2.1%to 1.9% for the same period in 2009.2011.
Interest Expense. Interest expense includes both debt interest and loan amortization fees related to borrowings.borrowings and facility fees. Interest expense was $2.6$2.2 million for 20102012 compared to $1.7$2.4 million for the same period in 2009.2011. The increasedecrease was due primarily to higherlower fees for unused facility and letter of credit participation, fees that resulted from increased rates with the extension of our revolving Credit Facility in February 2010, partially offset by a reductionan increase in average borrowings in the current period versus the prior year period.during 2012. Average borrowings for 20102012 were $3.1$26.3 million with an average interest rate of 2.9%2.1%, compared to average borrowings of $8.2$21.1 million and an average interest rate of 2.0%2.2% for the same period in 2009.2011.
Interest Income. In 2010, interestInterest income was $0.4 million compared to $0.3$0.4 million for 2009.both 2012 and 2011. Our interest income was derived primarily from earnings on cash balances kept in trust, checking accounts and overnight deposits.
Foreign Currency Transaction Gains (Losses),Losses, Net. We realized foreign currency transaction gainslosses of $0.5$0.2 million for 20102012 compared to gains of $2.2$0.5 million in 2009.2011. The fluctuationchange was due primarily to the level of investment in our Canadian operations and to changesfluctuation in the Canadian/U.S. exchange rate.
Income Taxes. Our effective tax rate was 34.9%38.8% for 20102012 compared to 28.1%39.4% for 2011. The decrease in our effective tax rate for 2012 was due primarily to a higher proportion of earnings from states with lower tax rates and the impact of non-deductible acquisition related costs recognized in each period (see 2009 (seeNote 9 --10 - Income Taxes to our consolidated financial statements for a reconciliation of the differences between the federal statutory tax rate and the effective tax rate). Included inIn both 2012 and 2011, the provision for income taxes for 2010 was a $0.7 million net benefit, including $0.1 million of interest recovery, compared toincluded a net benefit of $6.7$0.5 million including $2.1 million of interest recovery, for the same period in 2009. The net benefits related primarily to the expiration of the statute of limitations for uncertain tax positions and revisions toadjustments of prior year estimates based upon the finalization of our tax returns.year's estimates.
Results of Operations
Comparison of 2009 and 2008(1)
| | | | | | | | | | | | | | | | | | | | | | | | |
| | | | | 2009 | | 2008 |
| | | 2009 | | Amounts (in millions) | | % of Net sales | | % of Net sales, less excise taxes | | Amounts (in millions) | | % of Net sales | | % of Net sales, less excise taxes |
| | | Increase (Decrease) (in millions) | | | | | | |
| Net sales | | $ | 486.7 | | | $ | 6,531.6 | | | 100.0 | % | | — | % | | $ | 6,044.9 | | | 100.0 | % | | — | % |
| Net sales — Cigarettes | | 464.3 | | | 4,589.1 | | | 70.3 | | | 64.0 | | | 4,124.8 | | | 68.2 | | | 60.7 | |
| Net sales — Food/non-food | | 22.4 | | | 1,942.5 | | | 29.7 | | | 36.0 | | | 1,920.1 | | | 31.8 | | | 39.3 | |
Net sales, less excise taxes (2) | | 445.1 | | | 5,015.6 | | | 76.8 | | | 100.0 | | | 4,570.5 | | | 75.6 | | | 100.0 | |
Gross profit (3) | | 42.5 | | | 401.6 | | | 6.1 | | | 8.0 | | | 359.1 | | | 5.9 | | | 7.9 | |
| Warehousing and | | | | | | | | | | | | | | |
| distribution expenses | | (0.3 | ) | | 197.3 | | | 3.0 | | | 3.9 | | | 197.6 | | | 3.3 | | | 4.3 | |
| Selling, general and | | | | | | | | | | | | | | |
| administrative expenses | | 7.9 | | | 137.3 | | | 2.1 | | | 2.7 | | | 129.4 | | | 2.1 | | | 2.8 | |
| Income from operations | | 34.9 | | | 65.0 | | | 1.0 | | | 1.3 | | | 30.1 | | | 0.5 | | | 0.7 | |
| Interest expense | | (0.5 | ) | | (1.7 | ) | | — | | | — | | | (2.2 | ) | | — | | | (0.1 | ) |
| Interest income | | (0.7 | ) | | 0.3 | | | — | | | — | | | 1.0 | | | — | | | — | |
| Foreign currency transaction | | | | | | | | | | | | | | |
| gains (losses), net | | 8.5 | | | 2.2 | | | — | | | — | | | (6.3 | ) | | (0.1 | ) | | (0.1 | ) |
| Income before taxes | | 43.2 | | | 65.8 | | | 1.0 | | | 1.3 | | | 22.6 | | | 0.4 | | | 0.5 | |
| Net income | | 29.4 | | | 47.3 | | | 0.7 | | | 0.9 | | | 17.9 | | | 0.3 | | | 0.4 | |
(1) Amounts and percentages have been rounded for presentation purposes and might differ from unrounded results.
(2) Net sales, less excise taxes is a non-GAAP financial measure which we provide to separate the increase in sales due to actual sales growth and increases in state, local and provincial excise taxes which we are responsible for collecting and remitting. Federal excise taxes are levied on the manufacturers who pass the taxes on to us as part of the product cost and thus are not a component of our excise taxes. Although increases in cigarette excise taxes result in higher net sales, our overall gross profit percentage may decrease as a result of increases in excise taxes since gross profit dollars generally remain the same (see Comparison of Sales and Gross Profit by Product Category, page 32).
(3) Gross margins may not be comparable to those of other entities because warehousing and distribution expenses are not included as a component of our cost of goods sold.
Consolidated Net Sales. Net sales increased by $486.7 million, or 8.1%, to $6,531.6 million for 2009 from $6,044.9 million in 2008. Excluding the effects of foreign currency fluctuations, net sales increased by 9.1% in 2009 compared to 2008. The increase in net sales was attributable primarily to approximately $534.0 million from manufacturer price increases in response to the SCHIP legislation and incremental sales of $136.9 million from our New England and Toronto divisions, which were acquired or became operational in 2008, partially offset by a reduction in the volume of cigarette carton sales and one less selling day in 2009 compared to 2008. The significant cigarette price increasesand the resulting increase in our net sales impact certain year over year comparisons on a percent of net sales basis.
Net Sales of Cigarettes. Net sales of cigarettes for 2009 increased by $464.3 million, or 11.3%, to $4,589.1 million from $4,124.8 million in 2008. Net cigarette sales for 2009 increased 12.4%, excluding the effects of foreign currency fluctuations. The increase in net cigarette sales in 2009 was driven by a 19.1% increase in the average sales price per carton due primarily to manufacturer price increases and incremental sales of $115.5 million from our New England and Toronto divisions, partially offset by a decline in average daily carton sales in the U.S. of 9.9%, excluding the New England division. We believe the decline in average daily carton sales in the U.S. is due in part to the significant price increases during 2009 which led to reduced carton sales. Average daily carton sales in Canada increased 14.4% primarily through market share gains. Total net cigarette sales as a percentage of total net sales increased to 70.3% in 2009 compared to 68.2% in 2008.This increase was due primarily to the significant price increases from the manufacturers in response to the SCHIP legislation.
Net Sales of Food/Non-food Products. Net sales of food and non-food products for 2009 increased $22.4 million, or 1.2%, to $1,942.5 million from $1,920.1 million in 2008. The following table provides net sales by product category for our food/non-food products (in millions)(1):
| | | | | | | | | | | | | | |
| | 2009 | | 2008 | | Increase / (Decrease) |
| Product Category | Net Sales | | Net Sales | | Dollars | | Percentage |
| Food | $ | 738.0 | | | $ | 710.1 | | | $ | 27.9 | | | 3.9 | % |
| Candy | 405.0 | | | 401.3 | | | 3.7 | | | 0.9 | % |
| Other tobacco products | 434.0 | | | 402.7 | | | 31.3 | | | 7.8 | % |
| Health, beauty & general | 209.5 | | | 220.1 | | | (10.6 | ) | | (4.8 | )% |
| Non-alcoholic beverages | 151.7 | | | 180.9 | | | (29.2 | ) | | (16.1 | )% |
| Equipment/other | 4.3 | | | 5.0 | | | (0.7 | ) | | (14.0 | )% |
| | | | | | | | |
| Total Food/Non-food Products | $ | 1,942.5 | | | $ | 1,920.1 | | | $ | 22.4 | | | 1.2 | % |
(1) Amounts and percentages have been rounded for presentation purposes and might differ from unrounded results.
Excluding the effects of foreign currency fluctuations, net sales of food and non-food products increased 2.2% in 2009 compared to 2008. The increase in net food/non-food sales was attributable to incremental sales of $21.4 million from our New England and Toronto divisions, our sales and marketing initiatives, impacting primarily the food category, and price inflation in the Other Tobacco Products category related primarily to SCHIP. The increase was offset partially by a reduction in non-alcoholic beverages resulting from a change in the marketing and distribution methods of some beverage manufacturers. Total net sales of food and non-food products as a percentage of total net sales were 29.7% for 2009 compared to 31.8% for 2008.
Gross Profit. Gross profit represents the portion of sales remaining after deducting the cost of goods sold during the period. Vendor incentives, cigarette holding profits, the federal floor stock tax and changes in LIFO reserves are classified as elements of cost of goods sold. Gross profit for 2009 increased by $42.5 million, or 11.8%, to $401.6 million from $359.1 million in 2008. Gross profit for 2009 was significantly higher compared to 2008 as we realized $36.7 million of cigarette inventory holding profits due primarily to increased cigarette prices by manufacturers in response to the increase in federal excise taxes mandated by the SCHIP legislation, partially offset by $11.5 million of FET related to SCHIP.
The following table provides the components comprising the change in gross profit as a percentage of net sales for 2009 and 2008(1):
| | | | | | | | | | | | | | | | | | | |
| | 2009 | | 2008 |
| | Amounts (in millions) | | % of Net sales | | % of Net sales, less excise taxes | | Amounts (in millions) | | % of Net sales | | % of Net sales, less excise taxes |
| Net sales | $ | 6,531.6 | | | 100.0 | % | | — | | | $ | 6,044.9 | | | 100.0 | % | | — | |
Net sales, less excise taxes (2) | 5,015.6 | | | 76.8 | | | 100.0 | % | | 4,570.5 | | | 75.6 | | | 100.0 | % |
| Components of gross profit: | | | | | | | | | | | |
| Cigarette inventory holding profits | $ | 36.7 | | | 0.56 | % | | 0.73 | % | | $ | 3.1 | | | 0.05 | % | | 0.07 | % |
Net federal floor stock tax (3) | (11.5 | ) | | (0.18 | ) | | (0.23 | ) | | — | | | — | | | — | |
OTP tax items (4) | 0.6 | | | 0.01 | | | 0.01 | | | 1.4 | | | 0.02 | | | 0.03 | |
| LIFO expense | (6.7 | ) | | (0.10 | ) | | (0.13 | ) | | (11.0 | ) | | (0.18 | ) | | (0.24 | ) |
Remaining gross profit (5) | 382.5 | | | 5.86 | | | 7.63 | | | 365.6 | | | 6.05 | | | 8.00 | |
| Gross profit | $ | 401.6 | | | 6.15 | % | | 8.01 | % | | $ | 359.1 | | | 5.94 | % | | 7.86 | % |
(1) Amounts and percentages have been rounded for presentation purposes and might differ from unrounded results.
(2) Net sales, less excise taxes is a non-GAAP financial measure which we provide to separate the increase in sales due to actual sales growth and increases in state, local and provincial excise taxes which we are responsible for collecting and remitting. Federal excise taxes are levied on the manufacturers who pass the tax on to us as part of the product cost and thus are not a component of our excise taxes. Although increases in cigarette excise taxes result in higher net sales, our overall gross profit percentage may decrease since gross profit dollars generally remain the same (see Comparison of Sales and Gross Profit by Product Category, page 32).
(3) In February 2009, SCHIP was signed into law and imposed a floor stock tax on tobacco products held for sale on April 1, 2009. The net floor stock tax was recorded as an increase to our cost of goods sold in the second quarter of 2009.
(4) We received OTP (Other Tobacco Products) tax refunds of $0.6 million and $1.4 million in 2009 and 2008, respectively.
(5) Remaining gross profit is a non-GAAP financial measure which we provide to segregate the effects of LIFO expense, cigarette inventory holding profits, FET associated with the SCHIP legislation and other major non-recurring items that significantly affect the comparability of gross profit.
Our remaining gross profit was 5.86% of total net sales for 2009 compared with 6.05% in 2008. The cigarette price increases associated with SCHIP that increased our total net sales also reduced our remaining gross profit margins by approximately 52 basis points in 2009.
Cigarette remaining gross profit increased approximately 24.5% on a cents per carton basis in 2009 compared with 2008 due primarily to increased margins as a result of the manufacturers' price increases. We believe cigarette margins may revert closer to normal historical margins over time. Remaining gross profit for our food/non-food categories decreased approximately 17 basis points in 2009 to 13.36% compared to 13.53% in 2008, due primarily to an $8.1 million reduction in floor stock income earned from manufacturer price increases. In 2009, our remaining gross profit for food/non-food products declined to approximately 67.9% of our total remaining gross profit compared to 71.1% in 2008. The decline was due primarily to the impact of SCHIP which resulted in higher cigarette remaining gross profit in 2009.
Operating Expenses. Our operating expenses include costs related to warehousing, distribution, and selling, general and administrative activities. In 2009, operating expenses increased $7.6 million, or 2.3%, to $336.6 million from $329.0 million in 2008. The increase in operating expenses was driven by a 6.1% increase in selling, general and administrative expenses. As a percentage of net sales, total operating expenses were 5.2% in 2009 compared to 5.4% in 2008. Operating expenses, as a percent to total net sales, were favorably impacted by approximately 46 basis points due to the SCHIP related cigarette price increases which increased our total net sales.
Warehousing and Distribution Expenses. Warehousing and distribution expenses decreased by $0.3 million, or 0.2%, to $197.3 million in 2009 from $197.6 million in 2008. The decrease in warehousing and distribution expenses was due primarily to a decrease in net fuel costs of $4.5 million and increases in warehousing efficiencies at certain divisions offset by incremental expenses of $3.4 million from our New England division, acquired in June 2008, and an increase in health care and workers' compensation costs of $3.6 million. The increase in health care and workers' compensation costs for 2009 was due primarily to higher overall medical costs and an increase in the severity of certain claims. As a percentage of net sales, warehousing and distribution expenses were 3.0% for 2009 compared with 3.3% for 2008. The impact of SCHIP related cigarette price increases on total net sales favorably impacted warehousing and distribution expenses as a percent of sales by approximately 27 basis points.
Selling, General and Administrative (“SG&A”) Expenses. SG&A expenses increased $7.9 million, or 6.1%, in 2009 to $137.3 million from $129.4 million in 2008. The increase in SG&A expenses for 2009 was due primarily to $3.6 million of incremental expenses from our New England and Toronto divisions, salary merit increases of $2.0 million and an increase in employee incentives consisting of $1.3 million and $1.2 million of bonus and stock compensation, respectively. As a percentage of net sales, SG&A expenses were 2.1% for both 2009 and 2008. The impact of price increases associated with SCHIP favorably impacted SG&A expenses as a percent to total net sales by approximately 19 basis points.
Interest Expense. Interest expense includes both debt interest and amortization of fees related to borrowings. Interest expense was $1.7 million for 2009 compared to $2.2 million in 2008. Average borrowings for 2009 were $8.2 million compared to $21.1 million for 2008. During 2009, the weighted-average interest rate on borrowings from our revolving credit facility was 2.0% compared to 3.8% in 2008. The decline in interest rates was the result of general decreases in both bank prime and LIBOR borrowing rates. Interest expense declined period over period due to lower average interest rates and lower average borrowings.
Interest Income. In 2009, interest income was $0.3 million compared to $1.0 million for 2008. Our interest income was derived primarily from earnings on cash balances kept in trust, checking accounts and overnight deposits. Interest income was lower in 2009 due primarily to a reduction in prevailing interest rates.
Foreign Currency Transaction Gains (Losses), Net. We incurred foreign currency transaction gains of $2.2 million for 2009 compared to losses of $6.3 million in 2008. The fluctuation was due primarily to the level of investment in our Canadian operations and to changes in the Canadian/U.S. exchange rate.
Income Taxes. Our effective tax rate was 28.1% for 2009 compared to 20.8% for 2008 (seeNote 9 -- Income Taxes to our consolidated financial statements for a reconciliation of the differences between the federal statutory tax rate and the effective tax rate). Included in the provision for income taxes for 2009 was a $6.7 million net benefit, inclusive of a net interest recovery of $2.1 million related to unrecognized tax benefits, compared to a net benefit of $3.2 million, inclusive of net interest expense of $0.1 million, for 2008. The net benefits related primarily to the expiration of the statute of limitations for uncertain tax positions, revisions to prior year estimates based upon finalization of tax returns and state tax credits claimed for prior years.
Comparison of Sales and Gross Profit by Product Category
The following table summarizes our cigarette and food/non-food product sales, LIFO expense, gross profit and other relevant financial data for 20102013, 20092012 and 20082011 (dollars in(in millions)(1):
| | | | 2010 | | 2009 | | 2008 | 2013 | | 2012 | | 2011 |
| Cigarettes | | | | | | | | | | |
Net sales (2) | $ | 5,119.7 | | | $ | 4,589.1 | | | $ | 4,124.8 | | |
Excise taxes in sales (3) | $ | 1,594.2 | | | $ | 1,381.0 | | | $ | 1,350.9 | | |
Net sales, less excise taxes (4) | $ | 3,525.5 | | | $ | 3,208.1 | | | $ | 2,773.9 | | |
| Net sales | | $ | 6,642.0 |
| | $ | 6,139.4 |
| | $ | 5,710.6 |
|
Excise taxes in sales (2) | | 1,832.8 |
| | 1,782.4 |
| | 1,762.1 |
|
Net sales, less excise taxes (3) | | 4,809.2 |
| | 4,357.0 |
| | 3,948.5 |
|
| LIFO expense | | 7.5 |
| | 8.0 |
| | 10.4 |
|
Gross profit (4) | | 158.5 |
| | 151.0 |
| | 137.4 |
|
| Gross profit % | | 2.39 | % | | 2.46 | % | | 2.41 | % |
| Gross profit % less excise taxes | | 3.30 | % | | 3.47 | % | | 3.48 | % |
Remaining gross profit (6) | | $ | 157.0 |
| | $ | 151.2 |
| | $ | 139.6 |
|
| Remaining gross profit % | | 2.36 | % | | 2.46 | % | | 2.44 | % |
| Remaining gross profit % less excise taxes | | 3.26 | % | | 3.47 | % | | 3.54 | % |
| | | | | | | |
| Food/Non-food Products | | | | | | |
| Net sales | | $ | 3,125.6 |
| | $ | 2,753.0 |
| | $ | 2,404.3 |
|
Excise taxes in sales (2) | | 218.0 |
| | 204.6 |
| | 189.4 |
|
Net sales, less excise taxes (3) | | 2,907.6 |
| | 2,548.4 |
| | 2,214.9 |
|
| LIFO expense | $ | 11.3 | | | $ | 6.6 | | | $ | 4.7 | | 1.2 |
| | 4.3 |
| | 7.9 |
|
Gross profit (5) | $ | 119.4 | | | $ | 142.4 | | | $ | 104.1 | | 378.6 |
| | 325.8 |
| | 296.7 |
|
| Gross profit % | 2.33 | % | | 3.10 | % | | 2.52 | % | 12.11 | % | | 11.83 | % | | 12.34 | % |
| Gross profit % less excise taxes | 3.39 | % | | 4.44 | % | | 3.75 | % | 13.02 | % | | 12.78 | % | | 13.40 | % |
Remaining gross profit (6) | $ | 124.6 | | | $ | 122.9 | | | $ | 105.7 | | $ | 379.8 |
| | $ | 330.1 |
| | $ | 297.9 |
|
| Remaining gross profit % | 2.43 | % | | 2.68 | % | | 2.56 | % | 12.15 | % | | 11.99 | % | | 12.39 | % |
| Remaining gross profit % less excise taxes | 3.53 | % | | 3.83 | % | | 3.81 | % | 13.06 | % | | 12.95 | % | | 13.45 | % |
| | | | | | | | | | | |
| Food/Non-food Products | | | | | | |
| Totals | | | | | | |
| Net sales | $ | 2,147.1 | | | $ | 1,942.5 | | | $ | 1,920.1 | | $ | 9,767.6 |
| | $ | 8,892.4 |
| | $ | 8,114.9 |
|
Excise taxes in sales (3) | $ | 162.3 | | | $ | 135.0 | | | $ | 123.5 | | |
Net sales, less excise taxes (4) | $ | 1,984.8 | | | $ | 1,807.5 | | | $ | 1,796.6 | | |
Excise taxes in sales (2) | | 2,050.8 |
| | 1,987.0 |
| | 1,951.5 |
|
Net sales, less excise taxes (3) | | 7,716.8 |
| | 6,905.4 |
| | 6,163.4 |
|
| LIFO expense | $ | 5.3 | | | $ | 0.1 | | | $ | 6.3 | | 8.7 |
| | 12.3 |
| | 18.3 |
|
Gross profit (7) | $ | 265.9 | | | $ | 259.2 | | | $ | 255.0 | | |
Gross profit (4) (5) | | 537.1 |
| | 476.8 |
| | 434.1 |
|
| Gross profit % | 12.38 | % | | 13.34 | % | | 13.28 | % | 5.50 | % | | 5.36 | % | | 5.35 | % |
| Gross profit % less excise taxes | 13.40 | % | | 14.34 | % | | 14.19 | % | 6.96 | % | | 6.90 | % | | 7.04 | % |
Remaining gross profit (6) | $ | 270.6 | | | $ | 259.6 | | | $ | 259.9 | | $ | 536.8 |
| | $ | 481.3 |
| | $ | 437.5 |
|
| Remaining gross profit % | 12.60 | % | | 13.36 | % | | 13.53 | % | 5.50 | % | | 5.41 | % | | 5.39 | % |
| Remaining gross profit % less excise taxes | 13.63 | % | | 14.36 | % | | 14.46 | % | 6.96 | % | | 6.97 | % | | 7.10 | % |
| | | | | | | |
| Totals | | | | | | |
Net sales (2) | $ | 7,266.8 | | | $ | 6,531.6 | | | $ | 6,044.9 | | |
Excise taxes in sales (3) | $ | 1,756.5 | | | $ | 1,516.0 | | | $ | 1,474.4 | | |
Net sales, less excise taxes (4) | $ | 5,510.3 | | | $ | 5,015.6 | | | $ | 4,570.5 | | |
| LIFO expense | $ | 16.6 | | | $ | 6.7 | | | $ | 11.0 | | |
Gross profit (5),(7) | $ | 385.3 | | | $ | 401.6 | | | $ | 359.1 | | |
| Gross profit % | 5.30 | % | | 6.15 | % | | 5.94 | % | |
| Gross profit % less excise taxes | 6.99 | % | | 8.01 | % | | 7.86 | % | |
Remaining gross profit (6) | $ | 395.2 | | | $ | 382.5 | | | $ | 365.6 | | |
| Remaining gross profit % | 5.44 | % | | 5.86 | % | | 6.05 | % | |
| Remaining gross profit % less excise taxes | 7.17 | % | | 7.63 | % | | 8.00 | % | |
(1) Amounts and percentages have been rounded for presentation purposes and might differ from unrounded results.
(2) Cigarette net sales include $105.9 million and $534.0 million of incremental sales for 2010 and 2009, respectively, from price increases primarily associated with the implementation of SCHIP, which was signed into law in February 2009. Our gross profit percentage for the year ended December 31, 2009 was negatively impacted by SCHIP price increases.
(3) Excise taxes included in our net sales consist of state, local and provincial excise taxes which we are responsible for collecting and remitting. Federal excise taxes are levied on the manufacturers who pass the tax on to us as part of the product cost and thus are not a component of our excise taxes. Although increases in cigarette excise taxes result in higher net sales, our overall gross profit percentage may decrease since gross profit dollars generally remain the same.
| |
| (1) | Amounts and percentages have been rounded for presentation purposes and might differ from unrounded results. |
| |
| (2) | Excise taxes included in our net sales consist of state, local and provincial excise taxes which we are responsible for collecting and remitting. Federal excise taxes are levied on the manufacturers who pass the tax on to us as part of the product cost and thus are not a component of our excise taxes. Although increases in cigarette excise taxes result in higher net sales, our overall gross profit percentage may be reduced since gross profit dollars generally remain the same. |
| |
| (3) | Net sales, less excise taxes is a non-GAAP financial measure which we provide to separate the increase in sales due to product sales growth and increases in excise taxes. |
(4) Net sales, less excise taxes is a non-GAAP financial measure which we provide to separate the increase in sales due to actual sales growth and increases in excise taxes.
(5) Cigarette gross profit includes (i) cigarette holding profits related to manufacturer price increases and increases in state, local and provincial excise taxes, (ii) federal excise floor taxes and (iii) LIFO effects. Cigarette holding profits for the years 2010, 2009 and 2008 were $6.1 million, $36.7 million and $3.1 million, respectively. The increase in cigarette inventory holding profits for the year ended December 31, 2009 was due primarily to increases in cigarette prices by manufacturers in response to the increases in federal excise taxes mandated by the SCHIP legislation. Cigarette gross profit for the year ended December 31, 2009 was negatively impacted by $10.6 million of federal excise floor tax net of manufacturer reimbursements related to SCHIP.
(6) Remaining gross profit is a non-GAAP financial measure which we provide to segregate the effects of LIFO expense, cigarette inventory holding profits and other major non-recurring items, such as FET associated with the SCHIP legislation and OTP tax items, that significantly affect the comparability of gross profit.
(7) Food/non-food gross profit includes (i) holding profits related to manufacturer price increases, (ii) increases in state, local and provincial excise taxes, (iii) federal excise floor taxes and (iv) LIFO effects. Included in food/non-food gross profit for the year ended December 31, 2009 is $0.9 million of federal excise floor taxes related to SCHIP. In addition, included in food/non-food gross profit for 2010, 2009 and 2008 is an OTP tax gain of $0.6 million resulting from a state tax method change and OTP tax refunds of $0.6 million and $1.4 million, respectively, all of which were recorded as a reduction to our costs of goods sold in the applicable year.
| |
| (4) | Cigarette gross profit includes (i) cigarette inventory holding gains related to manufacturer price increases, (ii) increases in state, local and provincial excise taxes and (iii) LIFO effects. Cigarette inventory holding gains for the years 2013, 2012 and 2011 were $9.0 million, $7.8 million and $8.2 million, respectively. |
| |
| (5) | Food/non-food gross profit includes (i) inventory holding gains related to manufacturer price increases, (ii) increases in state, local and provincial excise taxes, (iii) LIFO effects, (iv) OTP tax items and (v) a net candy holding gain. Included in food/non-food gross profit for 2011 was a $5.9 million net candy holding gain and an OTP tax settlement of $0.8 million. |
| |
| (6) | Remaining gross profit is a non-GAAP financial measure which we provide to segregate the effects of LIFO expense, cigarette inventory holding gains and other items that significantly affect the comparability of gross profit. |
Liquidity and Capital Resources
Our cash and cash equivalents as of December 31, 20102013 were $16.1$11.0 million compared to $17.7$19.1 million as ofat December 31, 2009.2012. Our restricted cash as ofat December 31, 20102013 was $12.8$12.1 million compared to $12.4$10.9 million as ofat December 31, 2009.2012. Restricted cash represents primarily represents funds that have been set aside in trust as required by one of the Canadian provincial taxing authorities to secure amounts payable for cigarette and tobacco excise taxes.
Our liquidity requirements arise primarily from the funding of our working capital, capital expenditures, and debt service requirements of our credit facilities.Credit Facility, income taxes, repurchases of common stock and dividend payments. We have historically funded our liquidity requirements through our currentcash flows from operations and external borrowings. For the year ended December 31, 2010,2013, our cash flows from operating activities provided $74.9$59.1 million and at December 31, 2013, we had $161.4$122.7 million of borrowing capacity available inunder our revolving credit facility as of December 31, 2010.Credit Facility.
Based on our anticipated cash needs, availability under our revolving credit facilityCredit Facility and the scheduled maturity of our debt, we expect that our current liquidity will be sufficient to meet all of our anticipated operating needs during the next twelve months.
Cash flows from operating activities
Year ended December 31, 2013
Net cash provided by operating activities decreased by $12.1 million to $59.1 million for the year ended December 31, 2013 compared to $71.2 million for the same period in 2012. This decrease was due primarily to a $20.0 million decrease in net cash provided by working capital, offset by an increase of $7.9 million in net income adjusted for non-cash items. The decrease in working capital was due primarily to an increase in inventory attributable to speculative inventory purchases, the addition of new customers and related higher levels of food/non-food inventory to support sales growth. In addition, working capital increased due to higher accounts receivables resulting from increased sales volume, and the timing of prepayments of cigarette purchases from certain manufacturers. These factors were partially offset by an increase in accounts payable, which was driven primarily by an increase in non-cigarette sales volume, and cigarette and tobacco taxes payable due primarily to timing of year-end stamp purchases.
Year ended December 31, 20102012
Net cash provided by operating activities increased by $41.8$59.9 million to $74.9$71.2 million for the year ended December 31, 20102012 compared to $33.1$11.3 million for the same period in 2009.2011. This increase was due to a $52.8 million increase in net cash provided by working capital and a $7.1 million increase in net income adjusted for non-cash items. The increase in net cash provided by operating activitiesworking capital was due primarily to a $68.6 million increasedecrease in cash provided by working capital.
A significant use of cash occurred in 2009 as a resultinventory and accounts receivable levels during 2012, excluding the impact of the SCHIP legislation which increased accounts receivable, prepaymentsDavenport acquisition. Accounts and inventory by approximately $35 million, and did not recur in 2010. This was partially offset by an increase in cash used to buy inventoryother receivables, net, were lower at the end of 2010 in order to maintain appropriate LIFO levels. In addition, prepayments decreased2012, due to the timing of collections. The decrease in inventory was due primarily to lower levels of year-end purchases related to seasonal promotional opportunities, new business and holiday timing. In addition, during 2012 we generated less working capital from accounts payable and cigarette and tobacco taxes payable, increased due primarily towhich declined consistent with the FDI acquisition and the establishmentlower levels of credit terms in one additional state earlier this year.inventory.
The increase in cash provided by working capital was offset by a $26.8 million decrease in net income adjusted for non-cash items due primarily to a $19.1 million reduction in cigarette holding profits included in prior year net income related to the SCHIP legislation and a $5.3 million reduction in income earned primarily from manufacturer price increases.
Year ended December 31, 2009
Net cash provided by operating activities decreased by $22.5 million to $33.1 million for the year ended December 31, 2009 compared with $55.6 million for the same period in 2008. The decrease in cash provided by operating activities was due primarily to a $61.6 million net decrease in working capital, driven by the timing of vendor prepayments and increased cigarette prices resulting from the SCHIP legislation, which resulted in higher accounts receivable and inventory balances. This decrease in working capital was partially offset by a $39.1 million increase in net income plus adjustments for non-cash items such as depreciation, amortization and LIFO expense, which was driven primarily by income from cigarette price increases related to the SCHIP legislation.
Cash flows from investing activities
Year ended December 31, 2010
Net cash used in investing activities increased by $29.9 million to $50.5 million for the year ended December 31, 2010 compared with $20.6 million for the same period 2009. This increase was due primarily to the acquisition of FDI. We paid approximately $35.9 million, net of cash received, for the acquired assets, which consisted primarily of purchased accounts receivable, inventory and fixed assets. Capital expenditures decreased by $7.2 million to $13.9 million in 2010 compared with $21.1 million for 2009. Capital expenditures during 2010 consisted primarily of additions to our trucking fleet and warehouse equipment. We estimate that fiscal 2011 capital expenditures will not exceed $24 million.
Year ended December 31, 20092013
Net cash used in investing activities decreased by $28.5$36.6 million to $20.6$24.0 million for the year ended December 31, 20092013 compared with $49.1to $60.6 million for the same period 2008.in 2012. This decrease was due primarily to a $30.4 million reduction in cash used for acquisitions. In June 2008,2012, we paid $34.3 million in connection with the acquisition of Davenport, and, in 2013, we paid an additional $3.6 million to the previous owners of Davenport related primarily to certain post-closing purchase price adjustments. The decrease in net cash used in investing activities was also due to lower capital expenditures, which decreased by approximately $10.4 million to $18.0 million in 2013 compared to $28.4 million in 2012. The decrease in capital expenditures is attributable primarily to the postponement of certain projects to 2014.
Year ended December 31, 2012
Net cash used in investing activities decreased by $14.5 million to $60.6 million for the year ended December 31, 2012 compared to $75.1 million for the same period in 2011. This decrease was due primarily to a $16.8 million reduction in cash used for acquisitions. In 2012 we acquired AMD andDavenport for $34.0 million, net of acquired cash, compared with the acquisition of FCGC in 2011 for which we paid approximately $28.0$50.8 million, which consisted primarilynet of purchased accounts receivable, inventory and fixed assets, offset by approximately $1.6 million of cash received in the acquisition.acquired cash. Capital expenditures increased by $1.2$4.5 million to $21.1$28.6 million in 20092012 compared with $19.9$24.1 million for 2008.in 2011. The increase in capital expenditures was due primarily to expansion projects at certain warehouses.
Cash flows from financing activities
Year ended December 31, 20102013
Net cash used in financing activities increased by $16.1$37.4 million to $25.3$43.5 million for 2010the year ended December 31, 2013 compared with $9.2to $6.1 million for 2009. Thethe same period in 2012. This increase in net cash used in financing activities was due primarily to a $14.5 million decrease in book overdrafts and an increasenet repayments of $8.5$27.0 million in net repayments under our revolving credit facility, partially offset by a $6.1 million increase in proceeds received from the exercise of stock options and warrants. The decrease in book overdrafts was due primarily to the level of cash on hand and timing of vendor payments2013 compared to the same periodnet borrowings of $11.3 million in 2009.2012.
Year ended December 31, 20092012
Net cash used in financing activities decreased by $1.8 million to $9.2was $6.1 million for 20092012 compared with $11.0to net cash provided of $62.9 million for 2008. We had net repayments on our revolving linethe same period in 2011, a change of credit of $10.7 million during 2009 compared$69.0 million. This change was due primarily to $0.1 million of borrowings during 2008. Additionally, cash payments to repurchase our common stock pursuant to our share repurchase program decreased from $11.0 million in 2008 to $2.2 million in 2009. Thea decrease in net cash used in financing activities was also offset by an increaseborrowings under our Credit Facility of $50.7 million, a decrease of $21.9 million in book overdrafts, duecaused by the level of cash on hand in relation to the timing of excise tax payments.vendor payments and an $8.4 million increase in cash used to pay dividends to stockholders, all of which were offset by a $13.8 million decrease in cash used to repurchase common stock in 2012.
Adjusted EBITDA
Adjusted EBITDA is a measure used by management to measure operating performance. We believe Adjusted EBITDA provides meaningful supplemental information for investors regarding the performance of our business and allows investors to view results in a manner similar to the method used by our management. Adjusted EBITDA is also among the primary measures used externally by our investors, analysts and peers in our industry for purposes of valuation and comparing our results to other companies in our industry. Adjusted EBITDA is not defined by GAAP and the discussion of Adjusted EBITDA should be considered as a supplement to, and not as a substitute for, or superior to, financial measures calculated in accordance with GAAP. We may define Adjusted EBITDA differently than other companies and therefore such measures may not be comparable to ours.
The following table provides the components of Adjusted EBITDA for years ended December 31, 2013, 2012 and 2011 (in millions):
|
| | | | | | | | | | | |
| | Year Ended December 31, |
| | 2013 | | 2012 | | 2011 |
| Net income | $ | 41.6 |
| | $ | 33.9 |
| | $ | 26.2 |
|
Interest expense, net (1) | 2.2 |
| | 1.8 |
| | 2.0 |
|
| Provision for income taxes | 24.4 |
| | 21.5 |
| | 17.0 |
|
| Depreciation and amortization | 27.2 |
| | 25.3 |
| | 22.4 |
|
| LIFO expense | 8.7 |
| | 12.3 |
| | 18.3 |
|
| Stock-based compensation expense | 4.6 |
| | 5.8 |
| | 5.5 |
|
| Foreign currency transaction losses (gains), net | 0.8 |
| | 0.2 |
| | 0.5 |
|
| Adjusted EBITDA | $ | 109.5 |
| | $ | 100.8 |
| | $ | 91.9 |
|
| |
| (1) | Interest expense, net, is reported net of interest income. |
Adjusted EBITDA for 2013 increased 8.6% to $109.5 million compared to $100.8 million for 2012. Included in Adjusted EBITDA for 2013 is approximately $2.8 million of expenses related to integration and business expansion activities in the Eastern U.S. Adjusted EBITDA for 2012 includes $1.3 million of acquisition costs offset by a $1.8 million benefit associated with the favorable recovery of legacy workers’ compensation and insurance claims. Excluding the aforementioned items, Adjusted EBITDA increased 12.0% year-over-year, driven primarily by the addition of Davenport and growth in our food/non-food business.
Our Credit Facility
In October 2005, we entered into a five-year revolving credit facility (“Our Credit Facility”) withFacility has a capacity of $250 million and an expiration date of October 2010.
In February 2010, we entered into a third amendment to our Credit Facility (the “Third Amendment”), which extended our credit facility for four years, to February 2014, and decreased the lenders' revolving loan commitments by $50 million to $200 million at our request. The Third Amendment also provides forwhich is expandable up to an additional $100 million of lenders' revolving commitments, (formerly $75 million), subject to certain provisions contained therein. Pricing under the new facility increased asprovisions. On May 30, 2013, we entered into a result of generally higher prices in the bank loan market. The basis points addedfifth amendment to LIBOR increased to a range of 275 to 350 basis points, up from a range of 100 to 175 basis points, tied to achieving certain operating results as defined in the Credit Facility. Additionally, unused facility fees and letter of credit participation fees increased. The Third Amendment also increased our basket for permitted acquisitions followingFacility (the "Fifth Amendment"), which, among other things, extended the dateterm of the ThirdCredit Facility from May 2016 to May 2018 and reduced the margin on LIBOR or CDOR borrowing rates. In addition, the Fifth Amendment provides for future stock repurchases of up to $125an aggregate of $50 million, not to exceed $15 million in any year and re-established our basketa $75 million ceiling for permitted stock repurchases at $30 million. At the date of signing the Amendment, we incurred fees of approximately $1.8 million, which will be amortizeddividends allowable over the term of the amendment.Credit Facility.
All obligations under the Credit Facility are secured by first priority liens upon substantially all of our present and future assets. The terms of the Credit Facility permit prepayment without penalty at any time (subject to customary breakage costs with respect to LIBOR-LIBOR or CDOR-basedCDOR based loans prepaid prior to the end of an interest period).
The Credit Facility contains restrictive covenants, including among others, limitations on dividends and other restricted payments, other indebtedness, liens, investments and acquisitions and certain asset sales. WeAs of December 31, 2013, we were in compliance with all of the covenants under the Credit Facility as of December 31, 2010.Facility.
Amounts borrowed, outstanding letters of credit and amounts available to borrow, net of certain reserves required under the Credit Facility, were as follows (in millions):
| | | | | | | | | | December 31, | | December 31, |
| | December 31, 2010 | | December 31, 2009 | 2013 | | 2012 |
| Amounts borrowed | $ | — | | | $ | 19.2 | | $ | 46.3 |
| | $ | 73.3 |
|
| Outstanding letters of credit | $ | 26.2 | | | $ | 26.1 | | 21.8 |
| | 19.8 |
|
| Amounts available to borrow | $ | 161.4 | | | $ | 196.9 | | |
Amounts available to borrow (1) | | 122.7 |
| | 97.7 |
|
| |
| (1) | Excluding $100 million expansion feature. |
The decrease in amounts available to borrow is primarily the result of the Credit Facility having been reduced by $50 million in February 2010. The maximum amount available to borrow at December 31, 2010 is subject to the lower ceiling of $200 million permitted by the Third Amendment. The Third Amendment also provides for up to an additional $100 million of lenders' revolving commitments (formerly $75 million), subject to certain provisions contained therein.
Average borrowings during the yearyears ended December 31, 20102013 and 2012 were $3.1$35.3 million and $26.3 million, respectively, with amounts borrowed at any one time during the years then ended ranging from zero to a high of $34.8 million. For the same period in 2009, average borrowings were $8.2$112.0 million with amounts borrowed ranging fromand zero to a high of $61.1 million.$91.5 million, respectively.
OurThe weighted-average interest rate on our Credit Facility for the years ended December 31, 2013 and 2012 was 1.8% and 2.1%, respectively. The weighted-average interest rate is calculated based on ourthe daily cost of borrowing, which was computed onreflecting a blend of prime and LIBOR rates. The weighted-average interest rate on our revolvingWe paid fees for unused credit facility for the years ended December 31, 2010 and 2009 was 2.9% and 2.0%, respectively. We paid total unused facility fees and letter of credit participation, fees, which are included in interest expense, of $1.8$0.8 million, $0.9 million, and $0.8$1.3 million for 20102013, 2012 and 2009.2011, respectively. We recorded charges related to amortization of debt issuance costs, which are included in interest expense, of $0.4 million, $0.4 million, and $0.5 million for the years ended December 31, 2013, 2012, and 2011, respectively. Unamortized debt issuance costs were $1.7$1.4 million and $1.5 million as of December 31, 20102013 and $0.4 million as of December 31, 2009.2012, respectively.
Contractual Obligations and Commitments
Contractual Obligations. The following table presents information regarding our contractual obligations that existed as of December 31, 20102013 (in millions):
| | | | Total | | 2011 | | 2012 | | 2013 | | 2014 | | 2015 | | 2016 and Thereafter | Total | | Less than 1 Year | | 1 - 3 Years | | 3 - 5 Years | | More than 5 Years |
Credit Facility (1) | $ | — | | | $ | — | | | $ | — | | | $ | — | | | $ | — | | | $ | — | | | $ | — | | $ | 46.3 |
| | $ | — |
| | $ | — |
| | $ | 46.3 |
| | $ | — |
|
Purchase obligations (2) | — | | | — | | | — | | | — | | | — | | | — | | | — | | 24.4 |
| | 6.8 |
| | 3.8 |
| | 3.8 |
| | 10.0 |
|
| Letters of credit | 26.2 | | | 26.2 | | | — | | | — | | | — | | | — | | | — | | 21.8 |
| | 21.8 |
| | — |
| | — |
| | — |
|
| Operating leases | 173.2 | | | 29.3 | | | 25.7 | | | 20.5 | | | 15.8 | | | 13.5 | | | 68.4 | | 213.7 |
| | 33.8 |
| | 60.0 |
| | 47.9 |
| | 72.0 |
|
Capitalized leases (3) | 1.0 | | | 0.2 | | | 0.1 | | | 0.1 | | | 0.1 | | | 0.1 | | | 0.4 | | 12.5 |
| | 1.2 |
| | 2.2 |
| | 1.6 |
| | 7.5 |
|
Total contractual obligation (4)(5)(6) | $ | 200.4 | | | $ | 55.7 | | | $ | 25.8 | | | $ | 20.6 | | | $ | 15.9 | | | $ | 13.6 | | | $ | 68.8 | | |
Total contractual obligations (4)(5)(6) | | $ | 318.7 |
| | $ | 63.6 |
| | $ | 66.0 |
| | $ | 99.6 |
| | $ | 89.5 |
|
| |
| (1) | DoesRepresents amounts borrowed under our Credit Facility and does not include interest costs associated with the Credit Facility which had a weighted-average interest rate of 2.9% for the year ended December 31, 2010.
Facility. |
(2) Purchase orders for the purchase of inventory and other services are not included in the table above because purchase orders represent authorizations to purchase rather than binding agreements. For the purposes of this table, contractual obligations for purchase of goods or services are defined as agreements that are enforceable and legally binding and that specify all significant terms, including: fixed or minimum quantities to be purchased; fixed, minimum or variable price provisions, and the approximate timing of the transaction. Our purchase orders are based on our current inventory needs and are fulfilled by our suppliers within short time periods. We also enter into contracts for outsourced services; however, the obligations under these contracts are not significant and the contracts generally contain clauses allowing for cancellation without significant penalty.
(3) Represents refrigeration and other equipment. Current maturities of capital leases are included in accrued liabilities, and non-current maturities are included in long-term debt.
(4) We have not included in the table above Claims Liabilities of $30.6 million, net of current portion, which includes health and welfare, workers' compensation and general and auto liabilities because it does not have a definite payout by year. They are included in a separate line in the Consolidated Balance Sheet and discussed in Note 2 -- Summary of Significant Accounting Policies to our consolidated financial statements.
(5) As discussed in Note 12 -- Employee Benefit Plans to our consolidated financial statements, we have an $8.5 million long-term obligation arising from an underfunded pension plan. Future minimum pension funding requirements are not included in the schedule above as they are not available for all periods presented.
(6) The table excludes unrecognized tax liabilities of $1.2 million because a reasonable and reliable estimate of the timing of
future tax payments or settlements, if any, cannot be determined (see Note 9 -- | |
| (2) | Our purchase obligations at December 31, 2013 were related primarily to delivery equipment and purchases of compressed natural gas for our trucking fleet. Purchase orders for the purchase of inventory and other services are not included in the table above because purchase orders represent authorizations to purchase rather than binding agreements. For purposes of this table, contractual obligations for purchase of goods or services are defined as agreements that are enforceable and legally binding and that specify all significant terms, including: fixed or minimum quantities to be purchased; fixed, minimum or variable price provisions; and the approximate timing of the transaction. Our purchase orders are based on our current inventory needs and are fulfilled by our suppliers within short time periods. We also enter into contracts for outsourced services; however, the obligations under these contracts are not significant and the contracts generally contain clauses allowing for cancellation without significant penalty. |
| |
| (3) | Represents present value of future minimum lease payments for warehouse facility, refrigeration and other office and warehouse equipment. Current maturities of capital leases are included in accrued liabilities, and non-current maturities are included in long-term debt. Interest costs associated with the capitalized leases are not included in the table above. |
| |
| (4) | We have not included in the table above claims liabilities of $28.2 million, net of current portion, which includes health and welfare, workers' compensation and general and auto liabilities because it does not have a definite payout by year. They are included in a separate line in the Consolidated Balance Sheet and discussed in Note 2 - Summary of Significant Accounting Policies to our consolidated financial statements. |
| |
| (5) | As discussed in Note 11 - Employee Benefit Plans to our consolidated financial statements, we have a $2.1 million long-term obligation arising from an underfunded pension plan. Future minimum pension funding requirements are not included in the schedule above as they are not available for all periods presented. |
| |
| (6) | The table excludes unrecognized tax liabilities of $0.6 million because a reasonable and reliable estimate of the timing of future tax payments or settlements, if any, cannot be determined (see Note 10 - Income Taxes to our consolidated financial statements). |
Off-Balance Sheet Arrangements
Letter of Credit Commitments. As of December 31, 2010,2013, our standby letters of credit issued under our Credit Facility were $26.2$21.8 million related primarily to casualty insurance and tax obligations. The majority of the standby letters of credit mature in one year. However, in the ordinary course of our business, we will continue to renew or modify the terms of the letters of credit to support business requirements. The liabilities underlying the letters of credit are reflected on our consolidated balance sheets.
Operating Leases. The majority of our sales offices, warehouse facilities and trucks are subject to lease agreements which expire at various dates through 2022,2032, excluding renewal options. These leases generally require us to maintain, insure and pay any related taxes. In most instances, we expect the leases that expire will be renewed or replaced in the normal course of our business.
Third Party Distribution Centers. We currently manage two regional distribution centers for third party convenience store operators who engage in self-distribution. Under the agreement relating to one of these facilities, the third party has a “put” right under which it may require us to acquire the facility. If the put right is exercised, we will be required to (1) purchase the inventory in the facilities at cost, (2) purchase the physical assets of the facilities at fully depreciated cost and (3) assume the obligations of the third party as lessees under the leases related to those facilities. While we believe the likelihood that this put option will be exercised is remote, if it were exercised, we would be required to make aggregate capital expenditures of approximately $4.0$2.0 million based on current estimates. The amount of capital expenditures would vary depending on the timing of any exercise of such put right and does not include an estimate of the cost to purchase inventory because such purchases would simply replace other planned inventory purchases and would not represent an incremental cost. In the event the third party terminates self-distribution, they are required to enter into a five year distribution agreement with us to supply their stores.
Critical Accounting Policies and Estimates
This Management's Discussion and Analysis of our Financial Condition and Results of Operations is based on our consolidated financial statements, which have been prepared in accordance with accounting principles generally accepted in the U.S. The preparation of our consolidated financial statements requires estimates and assumptions that affect the reported amounts of assets and liabilities as of the date of the financial statements and the reported amounts of net sales and expenses during the reporting period. The critical accounting polices used in the preparation of the consolidated financial statements are those that are important both to the presentation of financial condition and results of operations and require significant judgments with regards to estimates. We base our estimates on historical experience and on various assumptions we believe are reasonable under the circumstances, the results of which form the basis for making judgments about the carrying value of assets and liabilities that are not readily apparent from other sources. We believe the current assumptions and other considerations used to estimate amounts reflected in our financial statements are appropriate; however, actual results could differ from these estimates.
We believe that the following represent the more critical accounting policies, which are subject to estimates and assumptions used in the preparation of our financial statements.
Allowance for Doubtful Accounts
We maintain an allowance for doubtful accounts for losses we estimate will arise from our trade customers' inability to make required payments. We evaluate the collectability of accounts receivable and determine the appropriate allowance for doubtful accounts based on historical experience and a review of specific customer accounts. In determining the adequacy of allowances for customer receivables, we analyze factors such as the value of any collateral, customer financial statements, historical collection experience, aging of receivables, general economic conditions and other factors. It is possible that the accuracy of the estimation
process could be materially affected by different judgments as to the collectability based on information considered and further deterioration of accounts. If circumstances change (i.e., further evidence of material adverse creditworthiness, additional accounts become credit risks, store closures or deterioration in general economic conditions), our estimates of the recoverability of amounts due us could be reduced by a material amount.
The allowance for doubtful accounts at December 31, 2010, 20092013, 2012 and 20082011 amounted to 4.8%3.8%, 5.6%4.5% and 6.0%4.2%, respectively, of netgross trade accounts receivable.
Bad debt expense associated with our trade customer receivables was $1.4$1.1 million in 2013 and $2.0 million for 2010, $1.8 million for 2009both 2012 and $1.6 million for 2008.2011. As a percentage of net sales, our bad debt expense was less than 0.1% for 2010, 20092013, 2012 and 2008.2011.
Vendor and Sales Incentives
Vendors' Discounts, Rebates and Promotional Allowances --
Periodic payments from vendors in various forms including rebates, promotional allowances and volume or other purchase discounts are reflected in the carrying value of the related inventory when earned and as cost of goods sold as the related merchandise is sold. Up-front consideration received from vendors linked to purchase or other commitments is initially deferred and amortized ratably to cost of goods sold or as the performance of the activities specified by the vendor to earn the fee is completed. Cooperative marketing incentives from suppliers are recorded as reductions to cost of goods sold to the extent the vendor considerations exceed the costs relating to the programs. These amounts are recorded in the period the related promotional or merchandising programs were provided. Some of theCertain vendor incentive promotions require that we make assumptions and judgments regarding, for example, the likelihood of achieving market share levels or attaining specified levels of purchases. Vendor incentives are at the discretion of our vendors and can fluctuate due to changes in vendor strategies and market requirements.
Customers' Sales Incentives -- We also provide sales rebates or discounts to our customers on a regular basis. The customers' sales incentives are recorded as a reduction to sales revenue as the “sales incentive” is earned by the customer. Additionally, we may provide racking allowances for the customers' commitments to continue using us as the supplier of their products. These allowances may be paid at the inception of the contract or on a periodic basis. Allowances paid at the inception of the contract are capitalized and amortized over the period of the distribution agreement as a reduction to sales.
Claims Liabilities and Insurance Recoverables
We maintain reserves related to workers' compensation, general and auto liability and health and welfare programs that are principally self-insured. Our workers' compensation, general and auto liability insurance policies currently include a deductible of $500,000 per occurrence and we maintain excess loss insurance that covers any health and welfare costs in excess of $200,000 per person per year.
Our reserves for workers' compensation, general and auto insurance liabilities are estimated based on applying an actuarially derived loss development factor to our incurred losses, including losses for claims incurred but not yet reported. Actuarial projections of losses concerning workers' compensation, general and auto insurance liabilities are subject to a high degree of variability. Among the causes of this variability are unpredictable external factors affecting future inflation rates, health care costs, litigation trends, legal interpretations, legislative reforms, benefit level changes and claim settlement patterns. Our reserve for health and welfare claims includes an estimate of claims incurred but not yet reported, which is derived primarily from historical experience.
Our claim liabilities and the related recoverables from insurance carriers for estimated claims in excess of the deductible amounts and other insured events are presented in their gross amounts because there is no right of offset. The following is a summary of our net reserves as of December 31, 20102013 and December 31, 20092012 (in millions):
| | | | | | | | | | | | | | | | | | | | | | | |
| | 2010 | | 2009 |
| | Current | | Long-Term | | Total | | Current | | Long-Term | | Total |
| Gross claims liabilities: | | | | | | | | | | | |
| Workers' compensation liability | $ | 5.5 | | | $ | 29.4 | | | $ | 34.9 | | | $ | 5.8 | | | $ | 31.3 | | | $ | 37.1 | |
| Auto & general liability | 0.9 | | | 0.9 | | | 1.8 | | | 0.9 | | | 1.0 | | | 1.9 | |
| Health & welfare liability | 2.3 | | | 0.3 | | | 2.6 | | | 1.7 | | | 0.3 | | | 2.0 | |
| Total gross claims liabilities | $ | 8.7 | | | $ | 30.6 | | | $ | 39.3 | | | $ | 8.4 | | | $ | 32.6 | | | $ | 41.0 | |
| | | | | | | | | | | | |
| Insurance recoverables | $ | (2.5 | ) | | $ | (19.5 | ) | | $ | (22.0 | ) | | $ | (2.7 | ) | | $ | (21.0 | ) | | $ | (23.7 | ) |
| | | | | | | | | | | | |
| Reserves (net): | | | | | | | | | | | |
| Workers' compensation liability | $ | 3.3 | | | $ | 10.3 | | | $ | 13.6 | | | $ | 3.5 | | | $ | 10.8 | | | $ | 14.3 | |
| Auto & general liability | 0.6 | | | 0.5 | | | 1.1 | | | 0.5 | | | 0.5 | | | 1.0 | |
| Health & welfare liability | 2.3 | | | 0.3 | | | 2.6 | | | 1.7 | | | 0.3 | | | 2.0 | |
| Reserves (net): | $ | 6.2 | | | $ | 11.1 | | | $ | 17.3 | | | $ | 5.7 | | | $ | 11.6 | | | $ | 17.3 | |
|
| | | | | | | | | | | | | | | | | | | | | | | |
| | 2013 | | 2012 |
| | Current | | Long-Term | | Total | | Current | | Long-Term | | Total |
| Gross claims liabilities: | | | | | | | | | | | |
| Workers' compensation | $ | 8.1 |
| | $ | 26.1 |
| | $ | 34.2 |
| | $ | 4.8 |
| | $ | 26.2 |
| | $ | 31.0 |
|
| Auto & general insurance | 2.3 |
| | 2.1 |
| | 4.4 |
| | 1.1 |
| | 1.6 |
| | 2.7 |
|
| Health & welfare | 2.5 |
| | — |
| | 2.5 |
| | 2.6 |
| | 0.3 |
| | 2.9 |
|
| Total gross claims liabilities | $ | 12.9 |
| | $ | 28.2 |
| | $ | 41.1 |
| | $ | 8.5 |
| | $ | 28.1 |
| | $ | 36.6 |
|
| | | | | | | | | | | | |
| Insurance recoverables | $ | (5.3 | ) | | $ | (17.2 | ) | | $ | (22.5 | ) | | $ | (2.1 | ) | | $ | (17.6 | ) | | $ | (19.7 | ) |
| | | | | | | | | | | | |
| Reserves (net): | | | | | | | | | | | |
| Workers' compensation | $ | 3.6 |
| | $ | 9.9 |
| | $ | 13.5 |
| | $ | 2.9 |
| | $ | 9.1 |
| | $ | 12.0 |
|
| Auto & general insurance | 1.5 |
| | 1.1 |
| | 2.6 |
| | 0.9 |
| | 1.1 |
| | 2.0 |
|
| Health & welfare | 2.5 |
| | — |
| | 2.5 |
| | 2.6 |
| | 0.3 |
| | 2.9 |
|
| Reserves (net) | $ | 7.6 |
| | $ | 11.0 |
| | $ | 18.6 |
| | $ | 6.4 |
| | $ | 10.5 |
| | $ | 16.9 |
|
The decreaseincrease in these reserves for 2010 is2013 was due primarily to better workers compensationa higher number of claims experience and settlementreported losses for our general and auto insurance liability, combined with the addition of several large dollar claims.our new division in North Carolina. A 10% change in our incurred but not reported estimates would increase or decrease the estimated reserves for our workers' compensation liability, general and auto insurance liability and health and welfare liability as of December 31, 20102013 by $0.8$0.7 million, $0.1 million and $0.2 million, respectively.
Pension Liabilities
We sponsored a qualified defined-benefit pension plan and a post-retirement benefit plan (collectively, "the Pension Plans"the “Pension Plans”) for employees hired before September 1986.1986 and certain employees of Fleming, our former parent company. As discussed in Note 12 --11 - Employee Benefit Plans to our consolidated financial statements, our qualified defined-benefit pension plan was underfunded by $8.5$2.1 million and $11.6$10.0 million at December 31, 20102013 and 2009,2012, respectively. There have been no new entrants to the pension or non-pension post-retirement benefit plans after those benefit plans were frozen on September 30, 1989. Pursuant to the plan of reorganization (May 2004) described in Exhibit 2.1 and incorporated by reference (see Part IV, Item 15, Exhibit Index of this Form 10-K), we were assigned the obligations for three former Fleming defined-benefit pension plans, and these plans were merged into our defined benefit pension plan effective December 2007. All of the pension and post-retirement benefit plans are collectively referred to as the “Pension Plans.”
The determination of the obligation and expense associated with our Pension Plans are dependent, in part, on our selection of certain assumptions used by our independent actuaries in calculating these amounts. These assumptions are disclosed in Note 1211 to the consolidated financial statements and include, among other things, the weighted-average discount rate, the expected weighted-average long-term rate of return on plan assets and the rate of compensation increases. Actual results in any given year will often differ from actuarial assumptions because of economic and other factors. In accordance with U.S. GAAP, actual results that differ from the actuarial assumptions are accumulated and amortized over future periods and, therefore, affect recognized expense and the recorded obligation in such future periods. While we believe our assumptions are appropriate, significant differences in actual results or changes in our assumptions may materially affect our pension and other post-retirement obligations and the future expense.
We select the weighted-average discount rates for each benefit plan as the rate at which the benefits could be effectively settled as of the measurement date. In selecting an appropriate weighted-average discount rate we use a yield curve methodology, matching the expected benefits at each duration to the available high quality yields at that duration and calculating an equivalent yield, which is the ultimate discount rate used. The weighted-average discount rate used to determine the pension obligation and pension expense was 5.73%were 4.60% and 6.26% in 20103.80%, respectively, for 2013 and 2009, respectively.3.80% and 4.72%, respectively, for 2012. A lower weighted-average discount rate increases the present value of benefit obligations and increases pension expense. Expected return on pension plan assets is based on historical experience of our portfolio and the review of projected returns by asset class on broad, publicly traded equity and fixed-income indices, as well as target asset allocation. Our target asset allocation mix is designed to meet our long-term pension and post-retirement benefit plan requirements. Our assumed weighted-average rate of return on our assets was 7.35% 7.0% and7.3%for both 20102013 and 2009.2012, respectively.
Sensitivity to changes in the major assumptions for our pension plans as of December 31, 20102013 is as follows (dollars in(in millions):
|
| | | | | |
| | Percentage Point Change | | Projected Benefit Obligation Decrease (Increase) | | Expense Decrease (Increase) |
| Expected return on plan assets | +/- .25 pt | | $0.0 /(0.0)N/A | | $0.1 / (0.1) |
| Discount rate -- Pension | +/- .25 pt | | $0.8 /(0.8)/ (0.8) | | $0.0 / (0.0) |
| Discount rate -- Post-retirement | +/- .25 pt | | $0.1 /(0.1)/ (0.1) | | $0.0 / (0.0) |
Stock-Based CompensationLong-Lived and Other Intangible Assets Impairment
We accountreview our intangible and other long-lived assets for stock-based compensation expensepotential impairment at least quarterly. Long-lived and other intangible assets are required to be tested for impairment when events and circumstances exist that indicate the carrying amounts of those assets may not be recoverable. Long-lived assets consist primarily of land, buildings, furniture, fixtures and equipment, leasehold improvements and other intangible assets. An impairment of long-lived assets exists when the carrying amount of a long-lived asset, or asset group, exceeds its fair value. Impairment losses are recorded when the carrying amount of the impaired asset is not recoverable. Recoverability is determined by estimatingcomparing the fair valuescarrying amount of awards at their grant dates and expensing the fair values, netasset (or asset group) to the undiscounted cash flows which are expected to be generated from its use. Our estimates of estimated forfeitures, using the straight-line amortization method for awards with vesting based on service and ratably for awards based on performance conditions. Determining the appropriate fair value model and calculating the fair value of stock-based awards at the grant date requires considerable judgment, including estimating stock price volatility, expected life of share awards and forfeiture rates. We develop our estimatesfuture cash flows are based on historical dataexperience and market information which can change significantly over time. Currently we use the Black-Scholes option valuation model to value stock option awards. If we were to use alternative valuation methodologies, the amount we expense for stock-based payments could be significantly different (see Note 11 -- Stock-Based Compensation Plans to our consolidated financial statements).
Recent Accounting Pronouncements
Disclosures about Fair Value Measurements
In January 2010, the Financial Accounting Standards Board issued Accounting Standards Update (“ASU”) No. 2010-06,Improving Disclosures about Fair Value Measurements. ASU 2010-06 requires additional disclosures about fair value measurements, including transfers inmanagement's expectations of relevant customers and out of the fair value hierarchy Levels 1markets and 2 and a higher level of disaggregation basedother operational factors. These estimates project
on naturefuture cash flows several years into the future and risk forcan be affected by factors such as competition, inflation and other economic conditions. Assets to be disposed of are reported at the different typeslower of financial instruments. For the reconciliation of Level 3carrying amount or fair value measurements, information about purchases,less the cost to sell such assets. We did not record impairment losses related to long-lived and other intangible assets or assets identified for abandonment as a result of facility closures or facility relocation in any of the years ended December 31, 2013, 2012 and 2011.
Goodwill Impairment
Goodwill represents the excess of the purchase consideration of an acquired business over the fair value of the identifiable tangible and intangible assets acquired and liabilities assumed in a business combination. Goodwill is not subject to amortization but must be evaluated for impairment. We test goodwill for impairment annually or whenever events or circumstances indicate that it is more likely than not that the fair value of a reporting unit is below its carrying amount. Each quarter, or whenever events or circumstances change, we assess the related qualitative factors to determine whether it is necessary to perform the two-step quantitative goodwill impairment test. The tests to evaluate goodwill for impairment are performed at the operating division level. In the first step of the quantitative impairment test, we compare the fair value of the operating division to its carrying value. If the fair value of the operating division is less than its carrying value, we perform a second step to determine the implied fair value of goodwill associated with the division. If the carrying value of goodwill exceeds the implied fair value of goodwill, such excess represents the amount of goodwill impairment for which an impairment loss would be recorded. Determining the fair value of a reporting unit involves the use of significant estimates and assumptions. The estimated fair value of each operating division is based on the discounted cash flow method, which is based on historical and forecasted amounts specific to each reporting unit and considers sales, issuancesgross profit, operating profit and settlements shouldcash flows and general economic and market conditions, as well as the impact of planned business and operational strategies and other estimates and assumptions for future growth rates, working capital and capital expenditures. We base our fair value estimates on assumptions we believe to be presented separately.reasonable at the time, but such assumptions are subject to inherent uncertainty.
In connection with our annual goodwill impairment testing performed during 2013, the first step of the test indicated that the fair values of the applicable reporting units exceeded their carrying value within a range of between 7% and 10%, and accordingly, no further testing of goodwill was required. However, changes in the judgments and estimates underlying our analysis of goodwill for possible impairment, including expected future cash flows and discount rate, could result in a significantly different estimate of the fair value of the reporting units in the future and could result in impairment of goodwill.
We have historically performed our annual impairment testing of goodwill on November 30 of each year. In 2013, we changed the annual impairment testing date from November 30to October 1. We believe this change, which represents a change in the method of applying an accounting principle, is preferable in the circumstances as it provides additional time for us to quantify the fair value of our operating divisions and meet reporting requirements. The change in the annual goodwill impairment testing date is not intended to nor does it delay, accelerate, or avoid an impairment charge. We determined that it was impracticable to objectively determine projected cash flows and related valuation estimates that would have been used as of each October 1 for periods prior to October 1, 2013 without the use of hindsight. As such, we have prospectively applied the change in the annual impairment testing date from October 1, 2013. We did not record any impairment charges related to goodwill during the years ended December 31, 2013, 2012 and 2011.
Recent Accounting Pronouncements
On July 18, 2013, the FASB issued Accounting Standards Update (ASU) No. 2013-11, Presentation of an Unrecognized Tax Benefit When a Net Operating Loss Carryforward, a Similar Tax Loss, or a Tax Credit Carryforward Exists, which requires an entity to present an unrecognized tax benefit as a reduction of a deferred tax asset for a net operating loss (NOL) carryforward, or similar tax loss or tax credit carryforward, rather than as a liability when (1) the uncertain tax position would reduce the NOL or other carryforward under the tax law of the applicable jurisdiction and (2) the entity intends to use the deferred tax asset for that purpose. This ASU isaccounting standard update will be effective for annual and interim reporting periodsour beginning after December 15, 2009 for most of the new disclosures and for periods beginning after December 15, 2010 for the new Level 3 disclosures. Comparative disclosures are not required in the first yearquarter of 2014 and applied prospectively with early adoption permitted. We do not believe that the disclosures are required. Weadoption of this accounting standard will have incorporated ASU 2010-06 into the disclosures that accompanya material impact on our consolidated financial statements.
Forward-Looking TrendTrends and Other Information
Cigarette Industry Trends
Cigarette Consumption
Aggregate cigarette consumption
Cigarette carton sales for the industry have been in North America has declined steadily since 1980. Prior to 2007, our cigarette sales had benefited fromdecline in the U.S. and Canada for more than a decade and in recent years we have seen a shift in sales to the convenience retail segment,other tobacco products including smokeless products and as a result of this shift, our carton sales had not declined in proportion to the decline in overall consumption. However, our cigarette carton sales started declining in 2007, experienced further declines in 2008 and 2009 and increased modestly in 2010.e-Cigarettes. We believe overall cigarette consumption will continue to decline in the foreseeable future due to factors such as increasing legislative controls which regulate cigarette sales and where consumers may or may not smoke, the accelerationincreases in the frequencyprices of cigarettes, increases
in cigarette regulation and amount of excise tax increases which reduces demand, manufacturer price increases andtaxes, health concerns, increased pressure from anti-tobacco groups and other factors, all of which may lead to reduced consumption or consumers purchasing cigarettes from illicit markets.
Consistent with the industry, our cigarette carton sales have declined on average over the part of consumers. The shiftlast five years on a comparable basis. However, these declines in cigarette carton sales from other channelshave been mitigated by increases in cigarette prices by the manufacturers. In addition, our same store carton decline is often masked by market share gains or channel shifting where cartons traditionally sold in one retail segment shifts to the convenience retail segment may no longer be adequate(e.g. drug or grocery channels shifting to compensate for consumption declines. However, we expect to offset the majority of the impact from these declines throughconvenience channels). These market share expansion, growth ingains, and equally important, price increases have driven our non-cigarette categories and incremental grossability to make more profitthat results dollars from cigarette manufacturer price increases. We expectsales during this long secular decline in demand. Despite our belief that this secular decline will continue at about the same pace, we also believe that we will continue to grow our gross profit dollars from cigarette sales based on our expectation that cigarette manufacturers will continue to raise prices as carton sales decline in orderand that we will continue to maintain or enhance their overall profitability.
Cigarette Regulation
In June 2009, the Family Smoking Prevention and Tobacco Control Act was signed into law, which granted the U.S. Food & Drug Administration (“FDA”) the authority to regulate the production and marketing of tobacco products in the U.S. The new legislation established a new FDA office that has the authority to regulate changes to nicotine yields and the chemicals and flavors used in tobacco products, require ingredient listings be displayed on tobacco products, prohibit the use of certain terms which may attract youth or mislead users as to the risks involved with using tobacco products, and limit or otherwise impact the advertising and marketing of tobacco products by requiring additional labels or warnings, as well as pre-approval by the FDA. This new FDA office is to be financed through user fees paid by tobacco companies prorated based ontake market share. To date, this legislation and its associated regulations have not had a material impact on our business.
Excise Taxes
Cigarette and tobacco products are subject to substantial excise taxes in the U.S. and Canada. Significant increases in cigarette-related taxes and/or fees have been levied by the taxing authorities in the past and are likely to continue to be levied in the future especially as these governmental jurisdictions come under additional pressure to raise revenues. Federal excise taxes are levied on the cigarette manufacturer, whereas state, provincial and local excise taxes are levied on the wholesaler. We increase cigarette prices as state, provincial and local excise tax increases are assessed on cigarette products that we sell. As a result, generally, increases in excise taxes do not increase overall gross profit dollars in the same proportion, but increases may result in a decline in overall gross profit percentage. In February 2009, SCHIP was signed into law and increased federal cigarette excise taxes levied on manufacturers from 39¢ to $1.01 per pack of cigarettes effective and after April 1, 2009. This substantial increase in excise taxes we believe caused the manufacturers to increase their prices to us, which in turn increased our working capital requirements. We also believe it has contributed to a further decline in consumer cigarette consumption which has adversely impacted our cigarette carton sales and decreased our gross profit as a percentage of sales.
CigaretteExcise Tax Inventory Holding ProfitsGains
Distributors such as Core-Mark may, from time to time, may earn higher gross profits on cigarette inventory and excise tax stamp quantities on hand either at the time cigarette manufacturers increase their prices or when states, localities or provinces increase their excise taxes and allow us to recognize inventory holding profits.gains. These profitsgains are recorded as an offset to cost of goods sold as the inventory is sold. Our cigarette holding profits prior to 2009 averaged approximately $5.1 million per year from 2005 to 2008 and represent a normal historical trend. For the year ended December 31, 2009 our cigarette inventory holding profits, net of FET associated with the SCHIP legislation,gains were $25.2$9.0 million, or 6.3%, of our gross profit, as compared to $3.1 million, or 0.9%1.7%, of our gross profit for the same period in 2008. The significant holding profits in 2009 were attributable to an average increase of approximately 28% of our cigarette manufacturer list prices, one of the largest increases we have seen in recent history. We believe these price increases were in response to the passage of the SCHIP legislation, and we have not included them in our average trends since they distort an average that we believe is more indicative of future trends. For the year ended December 31, 2010, our cigarette inventory holding profits were $6.12013, $7.8 million, or 1.6%, of our gross profit.profit for 2012 and $8.2 million, or 1.9% of our gross profit for 2011. We expect cigarette manufacturers will continue to raise prices as carton sales decline in order to maintain or enhance their overall profitability and the various taxing jurisdictions will raise excise taxes to make up for lost tax dollars related to consumption declines.
Food and Food/Non-food Product Trends
We focus virtually all our marketing efforts primarily on growing our food/non-food product sales. These products typically earnhave significantly higher profit margins than cigarettes and ourcigarette products. Our goal is to continue to increase food/non-food product sales in the future to potentially offset the potential
decline in cigarette carton salescartons as well as enhance our profits and the associated gross profits.
Since the endthose of 2008, manufacturer pricing trends have reflected a lack of inflation and in some cases deflation for the cost of non-tobaccoproducts. As a result, we experienced below average floor stock income during 2010 and 2009 compared to prior periods. Some indications suggest inflation trends are changing, but it is unknown at what pace prices will return to more normal levels of inflation.our customers.
We have specifically focused more heavily on fresh and healthy offerings because we believe that over the long termlong-term the convenience industryshopper is movingtrending toward a more heavily weighted offering of fresh and healthier foods.these type items. These products tend to earn somewhat higher margins than most other food/non-food products we distribute. Industry experts have indicated that fresh food is driving more and more shopping trips among consumers, and we are positioning ourselves and our customers to benefit from that trend. Ultimately, the consumer will determine what products are sold in the convenience store, but trends indicate that perishable foods will serve a more dominantimportant role in the convenience retail channel in the future.
Generally we benefit from price inflation in products. Price is controlled by the manufacturer and thus future levels of price inflation cannot be estimated by us. Historically we have seen inflation in non-cigarette categories during times of steep commodity price increases and steep fuel price inflation.
General Economic Trends
Uncertain Economic Conditions
While somewhat recently improved,Protracted challenging economic conditions, including high unemployment and underemployment rates, depressed real estate values, losses to consumer retirement and investment accounts, increases in food and other commodity prices and the global financial economic downturn that begangeneral geopolitical environment at any given time may result in 2008 continues to negatively affectweakened consumer confidence and spending. Economic pressures in the U.S. and Canada, including reduced access to credit, high levels and fear of unemployment, increases in energy and fuel costs, and housing market volatility, have resulted in curtailed consumer retail spending. Reducedspending in certain sectors. If these economic conditions are severe and/or persist for a prolonged period, we expect that our customers would experience reduced sales, which, in turn, would adversely affect demand for our products and could lead to reduced sales and liquidity concerns due to such factorsincreased pressures on our margins. In addition, severe adverse economic conditions may place a number of our convenience store ownersretail customers under financial stress, which maycould increase our credit risk and potential bad debt exposure. ShouldThese economic and market conditions in our key markets not show continued improvement,may have a material adverse effect on our business financial condition and operating results could be negatively impacted.results.
InflationInflation/Deflation
Historically, we have generally benefited from manufacturer price increases, both as a result of inventory floor stockholding gains and our cost plus pricing structure. However, significant increases in cigarette product costs and cigarette excise taxes adversely impact our gross profit as a percentage of sales, because for cigarettes we are paid on a cents per carton basis.basis for cigarette sales. As a result, cigarette gross profit percentages typically decline from marked increases in the underlying product costs or excise tax increases, regardless of the fact that absolute gross profit dollars on a cents per carton basis may have increased. This is due to the disparity in the absolute dollars of the underlying product costs and excise taxes compared to the cents per carton that we make in gross profit. Inversely,
Our food/non-food sales are generally priced based on the manufacturer's cost of the product plus a percentage markup. As a result, we generally benefit from food/non-food price increasesincreases. However, becauseduring periods of cost deflation or stagnation for these categories, we mostly mark up product costs usingproducts our profit levels may be negatively impacted, even though our gross profit as a percentage of the price of goods sold may remain relatively constant. To the extent that we are unable to pass on product cost of good sold.increases and underlying carrying costs to our customers, our profit margins and earnings could be negatively impacted.
Inflation can also result in increases in LIFO expense, adversely impacting our gross profit percentage (see Note 2 --- Summary of Significant Accounting Policies to our consolidated financial statements).
ITEM 7. A. QUANTITATIVE AND QUALITATIVE DISCLOSURES ABOUT MARKET RISK
Our majormost significant exposure to market risk comes from changes in short-term interest rates on our variable rate debt. Depending upon the borrowing option chosen, the interest charged is generally based upon the prime rate or LIBOR plus an applicable margin. If interest rates increased 32.918 basis points (which approximates 10% of the weighted-average interest rate on our average borrowings during the year ended December 31, 2010)2013), our results fromof operations and cash flows would not be materially affected.
We are exposed to foreign currency risk, primarily through our operations in Canada which conduct business in Canadian dollars. We record gains and losses within our shareholders'stockholders' equity due to the translation of the Canadian branches' financial statements into U.S. dollars. A 10% unfavorable change in the weighted average Canadian/U.S. dollar exchange rate for 20102013 would have negatively impacted our net sales for 20102013 by 1.6%1.1% and would not have materially impacted our operating income. Additionally, we incur foreign currency transaction gains and losses related to the level of activity between the U.S. and Canada. In 2013, we realized foreign currency transaction losses of $0.8 million. A 10% unfavorable change in the Canadian/U.S. dollar noon exchange rate on December 31, 20102013 would have resulted in a $2.6 million increase inhad an immaterial impact on foreign currency transaction losses for 2010 which are included in our Consolidated Statements of Operations. We2013.We did not engage in hedging transactions during 2010, 20092013, 2012, or 2008.2011.
| |
| ITEM 8. | FINANCIAL STATEMENTS AND SUPPLEMENTARY DATA |
ITEM 8.FINANCIAL STATEMENTS AND SUPPLEMENTARY DATA
|
| |
| | Page |
| (a) Financial Statements filed as part of this Annual Report on Form 10-K | |
| | |
| 1. Financial Statements | |
| | |
| A. Audited Financial Statements | |
| | |
| |
| | |
| |
| | |
| |
| |
| |
| | |
| |
| | |
| |
| | |
| |
| | |
| 2. Financial Statement Schedule | |
| | |
| |
REPORT OF INDEPENDENT REGISTERED PUBLIC ACCOUNTING FIRM
To the Board of Directors and Stockholders of
Core-Mark Holding Company, Inc.:
We have audited the accompanying consolidated balance sheets of Core-Mark Holding Company, Inc. and subsidiaries (the “Company”) as of December 31, 20102013 and 2009,2012, and the related consolidated statements of operations, comprehensive income, stockholders' equity, and comprehensive income, and cash flows for each of the three years in the period ended December 31, 2010.2013. Our audits also included the financial statement schedule listed in the Index at Item 8(a)(2). We also have audited the Company's internal control over financial reporting as of December 31, 2010,2013, based on criteria established in Internal Control-Integrated Framework (1992) issued by the Committee of Sponsoring Organizations of the Treadway Commission. The Company's management is responsible for these financial statements and financial statement schedule, for maintaining effective internal control over financial reporting, and for its assessment of the effectiveness of internal control over financial reporting, included in the accompanying Management's Report on Internal Control over Financial Reporting. Our responsibility is to express an opinion on these financial statements and financial statement schedule and an opinion on the Company's internal control over financial reporting based on our audits.
We conducted our audits in accordance with the standards of the Public Company Accounting Oversight Board (United States). Those standards require that we plan and perform the audit to obtain reasonable assurance about whether the financial statements are free of material misstatement and whether effective internal control over financial reporting was maintained in all material respects. Our audits of the financial statements included examining, on a test basis, evidence supporting the amounts and disclosures in the financial statements, assessing the accounting principles used and significant estimates made by management, and evaluating the overall financial statement presentation. Our audit of internal control over financial reporting included obtaining an understanding of internal control over financial reporting, assessing the risk that a material weakness exists, testing and evaluating the design and operating effectiveness of internal control based on the assessed risk. Our audits also included performing such other procedures as we considered necessary in the circumstances. We believe that our audits provide a reasonable basis for our opinions.
A company's internal control over financial reporting is a process designed by, or under the supervision of, the company's principal executive and principal financial officers, or persons performing similar functions, and effected by the company's board of directors, management, and other personnel to provide reasonable assurance regarding the reliability of financial reporting and the preparation of financial statements for external purposes in accordance with generally accepted accounting principles. A company's internal control over financial reporting includes those policies and procedures that (1) pertain to the maintenance of records that, in reasonable detail, accurately and fairly reflect the transactions and dispositions of the assets of the company; (2) provide reasonable assurance that transactions are recorded as necessary to permit preparation of financial statements in accordance with generally accepted accounting principles and that receipts and expenditures of the company are being made only in accordance with authorizations of management and directors of the company; and (3) provide reasonable assurance regarding prevention or timely detection of unauthorized acquisition, use, or disposition of the company's assets that could have a material effect on the financial statements.
Because of the inherent limitations of internal control over financial reporting, including the possibility of collusion or improper management override of controls, material misstatements due to error or fraud may not be prevented or detected on a timely basis. Also, projections of any evaluation of the effectiveness of the internal control over financial reporting to future periods are subject to the risk that the controls may become inadequate because of changes in conditions, or that the degree of compliance with the policies or procedures may deteriorate.
In our opinion, the consolidated financial statements referred to above present fairly, in all material respects, the financial position of the Company and subsidiaries as of December 31, 20102013 and 2009,2012, and the results of their operations and their cash flows for each of the three years in the period ended December 31, 2010,2013, in conformity with accounting principles generally accepted in the United States of America. Also, in our opinion, such financial statement schedule, when considered in relation to the basic consolidated financial statements taken as a whole, presents fairly, in all material respects, the information set forth therein. Also, in our opinion, the Company maintained, in all material respects, effective internal control over financial reporting as of December 31, 2010,2013, based on the criteria established in Internal Control - Integrated Framework (1992)issued by the Committee of Sponsoring Organizations of the Treadway Commission.Commission.
|
|
| /s/ Deloitte & Touche LLP |
| |
| San Francisco, California |
| |
March 15, 20113, 2014 |
CORE-MARK HOLDING COMPANY, INC. AND SUBSIDIARIES
CONSOLIDATED BALANCE SHEETS
(In millions, except share data)
| | | | December 31, | | December 31, | December 31, | | December 31, |
| | 2010 | | 2009 | 2013 | | 2012 |
| Assets | | | | | | |
| Current assets: | | | | | | |
| Cash and cash equivalents | $ | 16.1 | | | $ | 17.7 | | $ | 11.0 |
| | $ | 19.1 |
|
| Restricted cash | 12.8 | | | 12.4 | | 12.1 |
| | 10.9 |
|
| Accounts receivable, net of allowance for doubtful accounts of $8.7 and $9.1, | | | | |
| respectively (Note 4) | 179.3 | | | 161.1 | | |
| Accounts receivable, net of allowance for doubtful accounts of $9.4 and $10.9 | | | | |
| at December 31, 2013 and December 31, 2012, respectively (Note 4) | | 235.4 |
| | 228.1 |
|
| Other receivables, net (Note 4) | 43.5 | | | 39.6 | | 59.0 |
| | 53.8 |
|
| Inventories, net (Note 5) | 290.7 | | | 275.5 | | 389.2 |
| | 366.4 |
|
| Deposits and prepayments (Note 4) | 42.2 | | | 42.2 | | 53.0 |
| | 40.3 |
|
| Deferred income taxes (Note 9) | 3.6 | | | 3.6 | | |
| Deferred income taxes (Note 10) | | 5.4 |
| | 8.2 |
|
| Total current assets | 588.2 | | | 552.1 | | 765.1 |
| | 726.8 |
|
| Property and equipment, net (Note 6) | 84.7 | | | 83.8 | | 114.9 |
| | 114.7 |
|
| Deferred income taxes (Note 9) | — | | | 5.3 | | |
| Goodwill | 4.6 | | | 3.7 | | |
| Goodwill (Note 7) | | 22.9 |
| | 22.8 |
|
| Other intangible assets, net (Note 7) | | 20.8 |
| | 21.4 |
|
| Other non-current assets, net (Note 4) | 31.3 | | | 33.0 | | 33.1 |
| | 33.5 |
|
| Total assets | $ | 708.8 | | | $ | 677.9 | | $ | 956.8 |
| | $ | 919.2 |
|
| Liabilities and Stockholders’ Equity | | | | | | |
| Current liabilities: | | | | | | |
| Accounts payable | $ | 57.3 | | | $ | 63.2 | | $ | 109.3 |
| | $ | 94.4 |
|
| Book overdrafts | 6.5 | | | 19.4 | | |
| Book overdrafts (Note 2) | | 22.9 |
| | 24.7 |
|
| Cigarette and tobacco taxes payable | 166.8 | | | 132.3 | | 182.5 |
| | 165.6 |
|
| Accrued liabilities (Note 4) | 66.8 | | | 59.6 | | 88.1 |
| | 79.5 |
|
| Deferred income taxes (Note 9) | 0.3 | | | 0.6 | | |
| Deferred income taxes (Note 10) | | 3.1 |
| | 3.4 |
|
| Total current liabilities | 297.7 | | | 275.1 | | 405.9 |
| | 367.6 |
|
| Long-term debt (Note 7) | 0.8 | | | 20.0 | | |
| Long-term debt (Note 8) | | 57.6 |
| | 84.7 |
|
| Deferred income taxes (Note 10) | | 13.4 |
| | 11.7 |
|
| Other long-term liabilities | 4.7 | | | 4.3 | | 12.5 |
| | 12.1 |
|
| Claims liabilities, net (Note 2) | 30.6 | | | 32.6 | | 28.2 |
| | 28.1 |
|
| Pension liabilities | 12.3 | | | 15.7 | | |
| Pension liabilities (Note 11) | | 5.2 |
| | 14.8 |
|
| Total liabilities | 346.1 | | | 347.7 | | 522.8 |
| | 519.0 |
|
| Commitments and contingencies (Note 8) | | | | |
| Commitments and contingencies (Note 9) | |
| |
|
| Stockholders’ equity: | | | | | | |
| Common stock; $0.01 par value (50,000,000 shares authorized, 11,613,525 and | | | | |
| 11,001,632 shares issued; 11,118,163 and 10,506,270 shares outstanding at | | | | |
| December 31, 2010 and 2009, respectively) | 0.1 | | | 0.1 | | |
| Common stock, $0.01 par value (50,000,000 shares authorized, 12,807,015 and | | | | |
| 12,602,806 shares issued; 11,518,311 and 11,446,229 shares outstanding at | | | | |
| December 31, 2013 and December 31, 2012, respectively) | | 0.1 |
| | 0.1 |
|
| Additional paid-in capital | 229.6 | | | 216.2 | | 254.7 |
| | 249.2 |
|
| Treasury stock at cost (495,362 shares of common stock at December 31, 2010 and 2009) | (13.2 | ) | | (13.2 | ) | |
| Treasury stock at cost (1,288,704 and 1,156,577 shares of common stock at | | | | |
| December 31, 2013 and December 31, 2012, respectively) | | (44.6 | ) | | (37.4 | ) |
| Retained earnings | 147.3 | | | 129.6 | | 229.5 |
| | 194.9 |
|
| Accumulated other comprehensive loss | (1.1 | ) | | (2.5 | ) | (5.7 | ) | | (6.6 | ) |
| Total stockholders’ equity | 362.7 | | | 330.2 | | 434.0 |
| | 400.2 |
|
| Total liabilities and stockholders’ equity | $ | 708.8 | | | $ | 677.9 | | $ | 956.8 |
| | $ | 919.2 |
|
The accompanying notes are an integralintegral part of these consolidated financial statements.
CORE-MARK HOLDING COMPANY, INC. AND SUBSIDIARIES
CONSOLIDATED STATEMENTS OF OPERATIONS
(In millions, except per share data)
| | | | Year Ended December 31, | Year Ended December 31, |
| | 2010 | | 2009 | | 2008 | 2013 | | 2012 | | 2011 |
| Net sales | $ | 7,266.8 | | | $ | 6,531.6 | | | $ | 6,044.9 | | $ | 9,767.6 |
| | $ | 8,892.4 |
| | $ | 8,114.9 |
|
| Cost of goods sold | 6,881.5 | | | 6,130.0 | | | 5,685.8 | | 9,230.5 |
| | 8,415.6 |
| | 7,680.8 |
|
| Gross profit | 385.3 | | | 401.6 | | | 359.1 | | 537.1 |
| | 476.8 |
| | 434.1 |
|
| Warehousing and distribution expenses | 211.8 | | | 197.3 | | | 197.6 | | 297.1 |
| | 262.7 |
| | 234.6 |
|
| Selling, general and administrative expenses | 142.5 | | | 137.3 | | | 129.4 | | 168.3 |
| | 153.7 |
| | 150.8 |
|
| Amortization of intangible assets | 2.1 | | | 2.0 | | | 2.0 | | 2.7 |
| | 3.0 |
| | 3.0 |
|
| Total operating expenses | 356.4 | | | 336.6 | | | 329.0 | | 468.1 |
| | 419.4 |
| | 388.4 |
|
| Income from operations | 28.9 | | | 65.0 | | | 30.1 | | 69.0 |
| | 57.4 |
| | 45.7 |
|
| Interest expense | (2.6 | ) | | (1.7 | ) | | (2.2 | ) | (2.7 | ) | | (2.2 | ) | | (2.4 | ) |
| Interest income | 0.4 | | | 0.3 | | | 1.0 | | 0.5 |
| | 0.4 |
| | 0.4 |
|
| Foreign currency transaction gains (losses), net | 0.5 | | | 2.2 | | | (6.3 | ) | |
| Foreign currency transaction losses, net | | (0.8 | ) | | (0.2 | ) | | (0.5 | ) |
| Income before income taxes | 27.2 | | | 65.8 | | | 22.6 | | 66.0 |
| | 55.4 |
| | 43.2 |
|
| Provision for income taxes (Note 9) | (9.5 | ) | | (18.5 | ) | | (4.7 | ) | |
| Provision for income taxes (Note 10) | | (24.4 | ) | | (21.5 | ) | | (17.0 | ) |
| Net income | $ | 17.7 | | | $ | 47.3 | | | $ | 17.9 | | $ | 41.6 |
| | $ | 33.9 |
| | $ | 26.2 |
|
| | | | | | | | | | | |
| Basic net income per common share (Note 10) | $ | 1.64 | | | $ | 4.53 | | | $ | 1.71 | | |
| Diluted net income per common share (Note 10) | $ | 1.55 | | | $ | 4.35 | | | $ | 1.64 | | |
| Basic net income per common share (Note 12) | | $ | 3.62 |
| | $ | 2.96 |
| | $ | 2.30 |
|
| Diluted net income per common share (Note 12) | | $ | 3.58 |
| | $ | 2.91 |
| | $ | 2.23 |
|
| | | | | | | | | | | |
| Basic weighted-average shares (Note 10) | 10.8 | | | 10.5 | | | 10.5 | | |
| Diluted weighted-average shares (Note 10) | 11.4 | | | 10.9 | | | 10.9 | | |
| Basic weighted-average shares (Note 12) | | 11.5 |
| | 11.5 |
| | 11.4 |
|
| Diluted weighted-average shares (Note 12) | | 11.6 |
| | 11.6 |
| | 11.7 |
|
| | | | | | | |
| Dividends declared and paid per common share | | $ | 0.61 |
| | $ | 0.89 |
| | $ | 0.17 |
|
The accompanying notes are an integral part of these consolidated financial statements.
CORE-MARK HOLDING COMPANY, INC. AND SUBSIDIARIES
CONSOLIDATED STATEMENTS OF STOCKHOLDERS' EQUITY
AND COMPREHENSIVE INCOME
| | | | | | | | | | | | | | | | | | | | | | | | | | | | | | |
| | | | | | Additional | | | | | | Accumulated Other | | Total | | Total |
| | Common Stock | | Paid-In | | Treasury | | Retained | | Comprehensive | | Stockholders' | | Comprehensive |
| | Shares | | Amount | | Capital | | Stock | | Earnings | | Income (Loss) | | Equity | | Income (Loss) |
| Balance, December 31, 2007 | 10.4 | | | $ | 0.1 | | | $ | 202.6 | | | $ | — | | | $ | 64.4 | | | $ | (0.6 | ) | | $ | 266.5 | | | |
| Net income | — | | | — | | | — | | | — | | | 17.9 | | | — | | | 17.9 | | | $ | 17.9 | |
| Amortization of stock-based compensation | — | | | — | | | 3.9 | | | — | | | — | | | — | | | 3.9 | | | — | |
| Cash proceeds from exercise of common | | | | | | | | | | | | | | | |
| stock options | — | | | — | | | 2.5 | | | — | | | — | | | — | | | 2.5 | | | — | |
| Minimum pension liability adjustment, net | | | | | | | | | | | | | | | |
| of taxes of $3.8 | — | | | — | | | — | | | — | | | — | | | (5.9 | ) | | (5.9 | ) | | (5.9 | ) |
| Excess tax deductions associated with | | | | | | | | | | | | | | | |
| stock-based compensation | — | | | — | | | 0.3 | | | — | | | — | | | — | | | 0.3 | | | — | |
| Issuance of stock based instruments | 0.7 | | | — | | | — | | | — | | | — | | | — | | | — | | | — | |
| Repurchases of common stock | (0.4 | ) | | — | | | — | | | (11.0 | ) | | — | | | — | | | (11.0 | ) | | — | |
| Foreign currency translation adjustment | — | | | — | | | — | | | — | | | — | | | (0.6 | ) | | (0.6 | ) | | (0.6 | ) |
| Total comprehensive income | | | | | | | | | | | | | | | $ | 11.4 | |
| Balance, December 31, 2008 | 10.7 | | | 0.1 | | | 209.3 | | | (11.0 | ) | | 82.3 | | | (7.1 | ) | | 273.6 | | | |
| Net income | — | | | — | | | — | | | — | | | 47.3 | | | — | | | 47.3 | | | $ | 47.3 | |
| Amortization of stock-based compensation | — | | | — | | | 5.1 | | | — | | | — | | | — | | | 5.1 | | | — | |
| Cash proceeds from exercise of common | | | | | | | | | | | | | | | |
| stock options and warrants | — | | | — | | | 2.2 | | | — | | | — | | | — | | | 2.2 | | | — | |
| Minimum pension liability adjustment, net | | | | | | | | | | | | | | | |
| of taxes of $(1.5) | — | | | — | | | — | | | — | | | — | | | 2.4 | | | 2.4 | | | 2.4 | |
| Excess tax deductions associated with | | | | | | | | | | | | | | | |
| stock-based compensation | — | | | — | | | 0.1 | | | — | | | — | | | — | | | 0.1 | | | — | |
| Issuance of stock based instruments, net of | | | | | | | | | | | | | | | |
| shares withheld for employee taxes | 0.4 | | | — | | | (0.5 | ) | | — | | | — | | | — | | | (0.5 | ) | | — | |
| Repurchases of common stock | (0.1 | ) | | — | | | — | | | (2.2 | ) | | — | | | — | | | (2.2 | ) | | — | |
| Foreign currency translation adjustment | — | | | — | | | — | | | — | | | — | | | 2.2 | | | 2.2 | | | 2.2 | |
| Total comprehensive income | | | | | | | | | | | | | | | $ | 51.9 | |
| Balance, December 31, 2009 | 11.0 | | | 0.1 | | | 216.2 | | | (13.2 | ) | | 129.6 | | | (2.5 | ) | | 330.2 | | | |
| Net income | — | | | — | | | — | | | — | | | 17.7 | | | — | | | 17.7 | | | $ | 17.7 | |
| Amortization of stock-based compensation | — | | | — | | | 4.8 | | | — | | | — | | | — | | | 4.8 | | | — | |
| Cash proceeds from exercise of common | | | | | | | | | | | | | | | |
| stock options and warrants | 0.5 | | | — | | | 8.3 | | | — | | | — | | | — | | | 8.3 | | | — | |
| Minimum pension liability adjustment, net | | | | | | | | | | | | | | | |
| of taxes of $(0.1) | — | | | — | | | — | | | — | | | — | | | 0.2 | | | 0.2 | | | 0.2 | |
| Excess tax deductions associated with | | | | | | | | | | | | | | | |
| stock-based compensation | — | | | — | | | 2.0 | | | — | | | — | | | — | | | 2.0 | | | — | |
| Issuance of stock based instruments, net of | | | | | | | | | | | | | | | |
| shares withheld for employee taxes | 0.1 | | | — | | | (1.7 | ) | | — | | | — | | | — | | | (1.7 | ) | | — | |
| Foreign currency translation adjustment | — | | | — | | | — | | | — | | | — | | | 1.2 | | | 1.2 | | | 1.2 | |
| Total comprehensive income | | | | | | | | | | | | | | | $ | 19.1 | |
| Balance, December 31, 2010 | 11.6 | | | $ | 0.1 | | | $ | 229.6 | | | $ | (13.2 | ) | | $ | 147.3 | | | $ | (1.1 | ) | | $ | 362.7 | | | |
The accompanying notes are an integral part of these consolidated financial statements.
CORE-MARK HOLDING COMPANY, INC. AND SUBSIDIARIES
CONSOLIDATED STATEMENTS OF CASH FLOWSCOMPREHENSIVE INCOME
(In millions)
| | | | | | | | | | | |
| | Year Ended December 31, |
| | 2010 | | 2009 | | 2008 |
| Cash flows from operating activities: | | | | | |
| Net income | $ | 17.7 | | | $ | 47.3 | | | $ | 17.9 | |
| Adjustments to reconcile net income to net cash provided by operating activities: | | | | | |
| LIFO and inventory provisions | 16.5 | | | 7.1 | | | 11.0 | |
| Amortization of debt issuance costs | 0.5 | | | 0.5 | | | 0.5 | |
| Amortization of stock-based compensation | 4.8 | | | 5.1 | | | 3.9 | |
| Bad debt expense, net | 1.4 | | | 1.8 | | | 1.6 | |
| Loss on disposals | 0.7 | | | — | | | — | |
| Depreciation and amortization | 19.7 | | | 18.7 | | | 17.4 | |
| Foreign currency transaction (gains) losses, net | (0.5 | ) | | (2.2 | ) | | 6.3 | |
| Deferred income taxes | 5.2 | | | 14.5 | | | (4.9 | ) |
| Changes in operating assets and liabilities: | | | | | |
| Accounts receivable | 2.5 | | | (13.8 | ) | | (2.9 | ) |
| Other receivables | (3.5 | ) | | (4.3 | ) | | (4.2 | ) |
| Inventories | (18.8 | ) | | (36.7 | ) | | (31.9 | ) |
| Deposits, prepayments and other non-current assets | 2.3 | | | (16.7 | ) | | 4.4 | |
| Accounts payable | (6.4 | ) | | (4.4 | ) | | 13.8 | |
| Cigarette and tobacco taxes payable | 32.1 | | | 22.8 | | | 16.2 | |
| Pension, claims and other accrued liabilities | 0.6 | | | (6.6 | ) | | 6.2 | |
| Income taxes payable | 0.1 | | | — | | | 0.3 | |
| Net cash provided by operating activities | 74.9 | | | 33.1 | | | 55.6 | |
| Cash flows from investing activities: | | | | | |
| Acquisition of business, net of cash acquired | (35.9 | ) | | — | | | (26.4 | ) |
| Restricted cash | 0.2 | | | 0.7 | | | (2.2 | ) |
| Additions to property and equipment, net | (13.9 | ) | | (21.1 | ) | | (19.9 | ) |
| Capitalization of software | (1.0 | ) | | (0.3 | ) | | (0.7 | ) |
| Proceeds from sale of fixed assets | 0.1 | | | 0.1 | | | 0.1 | |
| Net cash used in investing activities | (50.5 | ) | | (20.6 | ) | | (49.1 | ) |
| Cash flows from financing activities: | | | | | |
| (Repayments) borrowings under revolving credit facility, net | (19.2 | ) | | (10.7 | ) | | 0.1 | |
| Payments of financing costs | (1.8 | ) | | — | | | — | |
| Repurchases of common stock (treasury stock) | — | | | (2.2 | ) | | (11.0 | ) |
| Proceeds from exercise of common stock options and warrants | 8.3 | | | 2.2 | | | 2.5 | |
| Tax withholdings related to net share settlements of restricted stock units | (1.7 | ) | | (0.5 | ) | | — | |
| Excess tax deductions associated with stock-based compensation | 2.0 | | | 0.4 | | | 0.6 | |
| (Decrease) increase in book overdrafts | (12.9 | ) | | 1.6 | | | (3.2 | ) |
| Net cash used in financing activities | (25.3 | ) | | (9.2 | ) | | (11.0 | ) |
| Effects of changes in foreign exchange rates | (0.7 | ) | | (1.3 | ) | | (1.1 | ) |
| (Decrease) increase in cash and cash equivalents | (1.6 | ) | | 2.0 | | | (5.6 | ) |
| Cash and cash equivalents, beginning of period | 17.7 | | | 15.7 | | | 21.3 | |
| Cash and cash equivalents, end of period | $ | 16.1 | | | $ | 17.7 | | | $ | 15.7 | |
| Supplemental disclosures: | | | | | |
| Cash paid during the period for: | | | | | |
| Income taxes, net of refunds | $ | 10.6 | | | $ | 11.7 | | | $ | 7.5 | |
| Interest | 1.7 | | | 1.0 | | | 1.7 | |
| Non-cash investing activities: | | | | | |
| Contingent consideration related to acquisition of business | $ | 1.0 | | | $ | — | | | $ | — | |
|
| | | | | | | | | | | |
| | Year Ended December 31, |
| | 2013 | | 2012 | | 2011 |
| Net income | $ | 41.6 |
| | $ | 33.9 |
| | $ | 26.2 |
|
| Other comprehensive income (loss), net of tax: | | | | | |
| Defined benefit plans adjustments (Note 15) | 2.4 |
| | (2.9 | ) | | (2.7 | ) |
| Foreign currency translation adjustment (loss) gain | (1.5 | ) | | 0.4 |
| | (0.3 | ) |
| Other comprehensive (loss) income, net of tax | 0.9 |
| | (2.5 | ) | | (3.0 | ) |
| Comprehensive income | $ | 42.5 |
| | $ | 31.4 |
| | $ | 23.2 |
|
The accompanying notes are an integral part of these consolidated financial statements.
CORE-MARK HOLDING COMPANY, INC. AND SUBSIDIARIES
CONSOLIDATED STATEMENTS OF STOCKHOLDERS' EQUITY
|
| | | | | | | | | | | | | | | | | | | | | | | | | | | | | |
| | Common Stock | | Additional | | | | | | | | Accumulated Other | | Total |
| | Issued | | Paid-In | | Treasury Stock | | Retained | | Comprehensive | | Stockholders' |
| | Shares | | Amount | | Capital | | Shares | | Amount | | Earnings | | Income (Loss) | | Equity |
| Balance, December 31, 2010 | 11.6 |
| | $ | 0.1 |
| | $ | 229.6 |
| | (0.5 | ) | | $ | (13.2 | ) | | $ | 147.3 |
| | $ | (1.1 | ) | | $ | 362.7 |
|
| Net income | — |
| | — |
| | — |
| | — |
| | — |
| | 26.2 |
| | — |
| | 26.2 |
|
| Other comprehensive income, net of tax | — |
| | — |
| | — |
| | — |
| | — |
| | — |
| | (3.0 | ) | | (3.0 | ) |
| Dividends declared | — |
| | — |
| | — |
| | — |
| | — |
| | (1.9 | ) | | — |
| | (1.9 | ) |
| Stock-based compensation expense | — |
| | — |
| | 5.1 |
| | — |
| | — |
| | — |
| | — |
| | 5.1 |
|
| Cash proceeds from exercise of | | | | | | | | | | | | | | | |
| common stock options and warrants | 0.7 |
| | — |
| | 5.4 |
| | — |
| | — |
| | — |
| | — |
| | 5.4 |
|
| Excess tax deductions associated with | | | | | | | | | | | | | | | |
| stock-based compensation | — |
| | — |
| | 1.7 |
| | — |
| | — |
| | — |
| | — |
| | 1.7 |
|
| Issuance of stock based instruments, net | | | | | | | | | | | | | | | |
| of shares withheld for employee taxes | 0.1 |
| | — |
| | (1.7 | ) | | — |
| | — |
| | — |
| | — |
| | (1.7 | ) |
| Repurchase of common stock | — |
| | — |
| | — |
| | (0.5 | ) | | (19.0 | ) | | — |
| | — |
| | (19.0 | ) |
| Balance, December 31, 2011 | 12.4 |
| | 0.1 |
| | 240.1 |
| | (1.0 | ) | | (32.2 | ) | | 171.6 |
| | (4.1 | ) | | 375.5 |
|
| Net income | — |
| | — |
| | — |
| | — |
| | — |
| | 33.9 |
| | — |
| | 33.9 |
|
| Other comprehensive income, net of tax | — |
| | — |
| | — |
| | — |
| | — |
| | — |
| | (2.5 | ) | | (2.5 | ) |
| Dividends declared | — |
| | — |
| | — |
| | — |
| | — |
| | (10.6 | ) | | — |
| | (10.6 | ) |
| Stock-based compensation expense | — |
| | — |
| | 6.2 |
| | — |
| | — |
| | — |
| | — |
| | 6.2 |
|
| Cash proceeds from exercise of | | | | | | | | | | | | | | | |
| common stock options | 0.1 |
| | — |
| | 3.8 |
| | — |
| | — |
| | — |
| | — |
| | 3.8 |
|
| Excess tax deductions associated with | | | | | | | | | | | | | | | |
| stock-based compensation | — |
| | — |
| | 1.1 |
| | — |
| | — |
| | — |
| | — |
| | 1.1 |
|
| Issuance of stock based instruments, net | | | | | | | | | | | | | | | |
| of shares withheld for employee taxes | 0.1 |
| | — |
| | (2.0 | ) | | — |
| | — |
| | — |
| | — |
| | (2.0 | ) |
| Repurchase of common stock | | | — |
| | — |
| | (0.1 | ) | | (5.2 | ) | | — |
| | — |
| | (5.2 | ) |
| Balance, December 31, 2012 | 12.6 |
| | 0.1 |
| | 249.2 |
| | (1.1 | ) | | (37.4 | ) | | 194.9 |
| | (6.6 | ) | | 400.2 |
|
| Net income | — |
| | — |
| | — |
| | — |
| | — |
| | 41.6 |
| | — |
| | 41.6 |
|
| Other comprehensive income, net of tax | — |
| | — |
| | — |
| | — |
| | — |
| | — |
| | 0.9 |
| | 0.9 |
|
| Dividends declared | — |
| | — |
| | — |
| | — |
| | — |
| | (7.0 | ) | | — |
| | (7.0 | ) |
| Stock-based compensation expense | — |
| | — |
| | 4.6 |
| | — |
| | — |
| | — |
| | — |
| | 4.6 |
|
| Cash proceeds from exercise of | | | | | | | | | | | | | | |
|
| common stock options | 0.1 |
| | — |
| | 2.4 |
| | — |
| | — |
| | — |
| | — |
| | 2.4 |
|
| Excess tax deductions associated with | | | | | | | | | | | | | | |
|
| stock-based compensation | — |
| | — |
| | 2.1 |
| | — |
| | — |
| | — |
| | — |
| | 2.1 |
|
| Issuance of stock based instruments, net | | | | | | | | | | | | | | |
|
| of shares withheld for employee taxes | 0.1 |
| | — |
| | (3.6 | ) | | — |
| | — |
| | — |
| | — |
| | (3.6 | ) |
| Repurchase of common stock | | | — |
| | — |
| | (0.2 | ) | | (7.2 | ) | | — |
| | — |
| | (7.2 | ) |
| Balance, December 31, 2013 | 12.8 |
| | $ | 0.1 |
| | $ | 254.7 |
| | (1.3 | ) | | $ | (44.6 | ) | | $ | 229.5 |
| | $ | (5.7 | ) | | $ | 434.0 |
|
| |
| (1) | Amounts have been rounded for presentation purposes and might differ from unrounded results. |
The accompanying notes are an integral part of these consolidated financial statements.
CORE-MARK HOLDING COMPANY, INC. AND SUBSIDIARIES
CONSOLIDATED STATEMENTS OF CASH FLOWS
(In millions)
|
| | | | | | | | | | | |
| | Year Ended December 31, |
| | 2013 | | 2012 | | 2011 |
| Cash flows from operating activities: | | | | | |
| Net income | $ | 41.6 |
| | $ | 33.9 |
| | $ | 26.2 |
|
| Adjustments to reconcile net income to net cash provided by operating activities: | | | | | |
| LIFO and inventory provisions | 8.7 |
| | 12.1 |
| | 18.2 |
|
| Amortization of debt issuance costs | 0.4 |
| | 0.4 |
| | 0.5 |
|
| Stock-based compensation expense | 4.6 |
| | 5.8 |
| | 5.5 |
|
| Bad debt expense, net | 1.1 |
| | 2.0 |
| | 2.0 |
|
| Depreciation and amortization | 27.2 |
| | 25.3 |
| | 22.4 |
|
| Foreign currency transaction losses, net | 0.8 |
| | 0.2 |
| | 0.5 |
|
| Deferred income taxes | 5.0 |
| | 0.9 |
| | (2.0 | ) |
| Curtailment gain | (0.9 | ) | | — |
| | — |
|
| Changes in operating assets and liabilities: | | | | | |
| Accounts receivable, net | (9.6 | ) | | 7.1 |
| | (20.0 | ) |
| Other receivables, net | (5.6 | ) | | (10.6 | ) | | 1.9 |
|
| Inventories, net | (35.4 | ) | | 5.3 |
| | (78.0 | ) |
| Deposits, prepayments and other non-current assets | (18.6 | ) | | 3.9 |
| | (12.4 | ) |
| Accounts payable | 16.0 |
| | 0.6 |
| | 30.0 |
|
| Cigarette and tobacco taxes payable | 19.9 |
| | (10.3 | ) | | 7.5 |
|
| Pension, claims, accrued and other long-term liabilities | 3.9 |
| | (5.4 | ) | | 9.0 |
|
| Net cash provided by operating activities | 59.1 |
| | 71.2 |
| | 11.3 |
|
| Cash flows from investing activities: | | | | | |
| Acquisition of business, net of cash acquired | (3.6 | ) | | (34.0 | ) | | (50.8 | ) |
| Change in restricted cash | (2.0 | ) | | 2.0 |
| | (0.1 | ) |
| Additions to property and equipment, net | (18.0 | ) | | (28.4 | ) | | (24.0 | ) |
| Capitalization of software | (0.4 | ) | | (0.2 | ) | | (0.2 | ) |
| Net cash used in investing activities | (24.0 | ) | | (60.6 | ) | | (75.1 | ) |
| Cash flows from financing activities: | | | | | |
| Borrowings (repayments) under revolving credit facility, net | (27.0 | ) | | 11.3 |
| | 62.0 |
|
| Dividends paid | (7.1 | ) | | (10.3 | ) | | (1.9 | ) |
| Payments of capital leases | (1.0 | ) | | — |
| | — |
|
| Payments of financing costs | (0.3 | ) | | — |
| | (0.7 | ) |
| Repurchases of common stock | (7.2 | ) | | (5.2 | ) | | (19.0 | ) |
| Proceeds from exercise of common stock options and warrants | 2.4 |
| | 3.8 |
| | 5.4 |
|
| Tax withholdings related to net share settlements of restricted stock units | (3.6 | ) | | (2.0 | ) | | (1.7 | ) |
| Excess tax deductions associated with stock-based compensation | 2.1 |
| | 1.1 |
| | 1.7 |
|
| (Decrease) increase in book overdrafts | (1.8 | ) | | (4.8 | ) | | 17.1 |
|
| Net cash provided by (used in) financing activities | (43.5 | ) | | (6.1 | ) | | 62.9 |
|
| Effects of changes in foreign exchange rates | 0.3 |
| | (0.6 | ) | | — |
|
| Increase (decrease) in cash and cash equivalents | (8.1 | ) | | 3.9 |
| | (0.9 | ) |
| Cash and cash equivalents, beginning of period | 19.1 |
| | 15.2 |
| | 16.1 |
|
| Cash and cash equivalents, end of period | $ | 11.0 |
| | $ | 19.1 |
| | $ | 15.2 |
|
| Supplemental disclosures: | | | | | |
| Cash paid during the period for: | | | | | |
| Income taxes paid, net of refunds | $ | 19.5 |
| | $ | 11.7 |
| | $ | 11.8 |
|
| Interest paid | 1.5 |
| | 1.6 |
| | 2.0 |
|
| Unpaid property and equipment purchases included in accrued liabilities | $ | 1.9 |
| | $ | — |
| | $ | — |
|
| Non-cash capital lease obligations incurred | $ | 1.2 |
| | $ | 11.4 |
| | $ | 0.4 |
|
| Non-cash indemnification holdback | $ | — |
| | $ | 4.0 |
| | $ | — |
|
| Contingent consideration related to acquisition of business | $ | — |
| | $ | 0.6 |
| | $ | — |
|
The accompanying notes are an integral part of these consolidated financial statements.
CORE-MARK HOLDING COMPANY, INC. AND SUBSIDIARIES
NOTES TO CONSOLIDATED FINANCIAL STATEMENTS
| |
| 1. | Summary of Company Information |
1.BusinesSummary of Company Informations
Business
Core-Mark Holding Company, Inc. and subsidiaries (referred to herein as “we,” “us,” “our,” “the Company” or “Core-Mark”) is one of the largest marketers of fresh and broad-line supply solutions to the convenience retail industry in North America. We offer a full range of products, marketing programs and technology solutions to approximatelyover 26,00030,000 customer locations in the United States (“U.S.”) and Canada. Our customers include traditional convenience stores, grocery stores, drug stores, liquor stores and other specialty and small format stores that carry convenience products. Our product offering includes cigarettes, other tobacco products, candy, snacks, fast food, groceries, fresh products, dairy, non-alcoholicbread, beverages, general merchandise and health and beauty care products. We operate a network of 2428 distribution centers in the U.S. and Canada (excluding two distribution facilities we operate as a third party logistics provider) in the U.S. and Canada..
| |
| 2. | Summary of Significant Accounting Policies |
2.Summary of Significant Accounting Policies
Basis of ConsolidationPresentation and PresentationPrinciples of Consolidation
The consolidated financial statements include Core-Mark and its wholly-owned subsidiaries. All intercompany balances and transactions have been eliminated in the consolidated financial statements. Certain prior year amounts in the consolidated financial statements have been reclassified to conform to the current year’s presentation.
Use of Estimates
These financial statements have been prepared on the accrual basis of accounting in accordance with accounting principles generally accepted in the U.S. This requires management to make certain estimates and assumptions that affect the reported amounts of assets and liabilities and the disclosure of contingent assets and liabilities at the date of the financial statements and the reported amounts of revenues and expenses during the reporting period. We considerThe Company considers the allowance for doubtful accounts, inventory reserves, LIFO valuation, recoverabilityvaluation of goodwill and other long-lived assets, stock-based compensation expense, the realizability of deferred income taxes, uncertain tax positions, pension benefitsassets and obligations and self-insurance reserves to be those estimates which involve a higher degree of judgment and complexity. Actual results could differ from those estimates.
Revenue Recognition
We recognizeThe Company recognizes revenue at the point at which the product is delivered and title passes to the customer. Revenues are reported net of customer incentives, discounts and returns, including an allowance for estimated returns. The allowance for sales returns is calculated based on ourthe Company's returns experience, which has historically not been significant. WeThe Company also earnearns management service fee revenue from operating third party distribution centers belonging to certain customers. These revenues represented less than 1% of ourthe Company’s total revenuesnet sales for each of those years.2013, 2012 and 2011. Service fee revenue is recognized as earned on a monthly basis in accordance with the terms of the management service fee contracts and is included in net sales on the accompanying consolidated statements of operations.
Vendor and Sales Incentives
Vendors' Discounts,Business Combinations
The Company accounts for all business combinations using the acquisition method of accounting. Under this method of accounting, the Company allocates the fair value of the purchase consideration to the tangible and intangible assets acquired and liabilities assumed based on their estimated fair values. The excess of the purchase consideration over the fair values of these identifiable assets and liabilities is recorded as goodwill. When determining the fair values of assets acquired and liabilities assumed, management makes significant estimates and assumptions. Management may further adjust the acquisition date fair values for a period of up to one year from the date of acquisition. Acquisition related expenses and transaction costs associated with business combinations are expensed as incurred.
Vendor Rebates and Promotional Allowances --
Periodic payments from vendors in various forms including rebates, promotional allowances and volume or other purchase discounts are reflected in the carrying value of the related inventory when earned and as cost of goods sold as the related merchandise is sold. Up-front consideration received from vendors linked to purchase or other commitments is initially deferred and amortized ratably to cost of goods sold or as the performance of the activities specified by the vendor to earn the fee is completed. Cooperative marketing incentives from suppliers are recorded as reductions to cost of goods sold to the extent the vendor considerations exceed the costs relating to the programs. These amounts are recorded in the period the related promotional or merchandising programs were
are provided. Some of theCertain vendor incentive promotions require that wethe Company to make assumptions and judgments regarding, for example, the likelihood of achieving market share levels or attaining specified levels of purchases. Vendor incentives are at the discretion of ourthe Company’s vendors and can fluctuate due to changes in vendor strategies and market requirements. Vendor rebates and promotional allowances earned totaled $149.8 million, $128.0 million and $108.3 million in 2013, 2012 and 2011, respectively.
Customers' Sales Incentives -- We
The Company also provideprovides sales rebatesallowances or discounts to ourits customers on a regular basis. These customers' sales incentives are recorded as a reduction to net sales revenue as the sales incentive is earned by the customer. Additionally, wethe Company may provide racking allowances for the customer's commitment to continue using usCore-Mark as the supplier of their products. These allowances may be paid at the inception of the contract or on a periodic basis. Allowances paid at the inception of the contract are capitalized and amortized over the period of the distribution agreement as a reduction to sales.
Excise Taxes
ExciseThe Company is responsible for collecting and remitting state, local and provincial excise taxes on cigarettescigarette and other tobacco productsproducts. As such, these excise taxes are a significant component of ourthe Company's net sales and our cost of sales. In 20102013, 20092012 and 20082011, approximately 24%21%, 23%22% and 24% of ourthe Company's net sales, and approximately 26%22%, 25%24% and 26%25% of ourits cost of goods sold, respectively, represented excise taxes. ExciseFederal excise taxes are includedlevied on product manufacturers who, in our net sales and costturn, pass the tax on to the Company as part of sales as wethe product cost. As a result, federal excise taxes are responsible for collecting and remitting such state, local and provincial taxes onnot a component of the applicable sales.Company’s excise taxes.
Foreign Currency Translation
The operating assets and liabilities of ourthe Company’s Canadian operations, whose functional currency is the Canadian dollar, are translated to U.S. dollars at exchange rates in effect at period-end. Adjustments resulting from such translation are presented as foreign currency translation adjustments, net of applicable income taxes, and are included in other comprehensive income. The statements of operations, including income and expenses, of ourthe Company’s Canadian operations are translated to U.S. dollars at average exchange rates for the period for financial reporting purposes. WeThe Company also recognize the gainrecognizes gains or losslosses on foreign currency exchange transactions between ourits Canadian and U.S. operations, net of applicable income taxes, in the consolidated statements of operations.
Cash, Cash Equivalents, and Restricted Cash and Book Overdrafts
Cash and cash equivalents include cash, money market funds and all highly liquid investments with original maturities of three months or less. Restricted cash represents funds collected and set aside in trust as required by one of the Canadian provincial taxing authorities. As of December 31, 2010, we.The Company had cash book overdrafts of $6.5$22.9 million million compared to $and 19.4$24.7 million million as of at December 31, 20132009 and 2012, reflecting issuedrespectively. Book overdrafts consist primarily of outstanding checks that have not cleared through our banking systemin excess of cash on hand in the ordinary coursecorresponding bank accounts at the end of business for accounts payable. Ourthe period. The Company’s policy has been to fund these outstanding checks as they clear with cash held on deposit with other financial institutions or with borrowings under ourthe Company's line of credit.
Fair Value Measurements
The carrying amount for our cash,of cash equivalents, restricted cash, trade accounts receivable, other receivables, trade accounts payable, cigarette and tobacco taxes payable and other accrued liabilities approximates fair value because of the short maturity of these financial instruments. The carrying amount of ourthe Company’s variable rate debt approximates fair value.
We calculateThe Company calculates the fair value of ourits pension plan assets based on assumptions that market participants would use in pricing the assets or liabilities. We useassets. The Company uses a fair value hierarchy that prioritizes the inputs to valuation techniques used to measure fair value and give precedence to observable inputs in determining fair value. An instrument's level within the hierarchy is based on the lowest level of any significant input to the fair value measurement. The following levels were established for each input:
Level 1 - Quoted prices in active markets for identical assets or liabilities.
Level 2 - Inputs other than quoted prices included within Level 1 that are observable for the asset or liability, either directly or indirectly.indirectly, such as quoted prices for similar assets or liabilities; quoted prices in markets that are not active; or other inputs that are observable or can be corroborated by observable market data.
Level 3 - Unobservable inputs for the asset or liability, which reflect the Company's own assumptions about what market participants would assume when pricing the asset or liability.
(See Note 12 --11 - Employee Benefit Plans.)
Risks and Concentrations
Financial instruments, which potentially subject usthe Company to concentrations of credit risk, consist principally of cash investments, accounts receivable and other receivables. We place ourThe Company places its cash and cash equivalents in short-term instruments with high quality financial institutions and limitlimits the amount of credit exposure in any one financial instrument. We pursueThe Company pursues amounts and incentives due from vendors in the normal course of business and are often allowed to deduct these amounts and incentives from payments made to our vendors.
A credit review is completed for new customers and ongoing credit evaluations of each customer's financial condition are performed and prepayment or other guarantees are required whenever deemed necessary.periodically, with reserves maintained for potential credit losses. Credit limits given to customers are based on a risk assessment of their ability to pay and other factors. We doAccounts receivable are typically not have individual customers that accountcollateralized, but the Company may require prepayments or other guarantees whenever deemed necessary.
Alimentation Couche-Tard, Inc. (“Couche-Tard”), the Company’s largest customer, accounted for more than 10% of our total sales or for more than 10%14.7% and 13.7% of total accounts receivable. However, some of our distribution centers are dependent on relationships with anet sales in 2013 and 2012, respectively. No single customer accounted for 10% or a few large customers.more of total net sales in 2011. In addition, no single customer accounted for 10% or more of accounts receivables at December 31, 2013 and 2012.
We have The Company has two significant suppliers: Philip Morris USA, Inc. and R.J. Reynolds Tobacco Company. Product purchases from Philip Morris USA, Inc. represented approximately 28% of our total product purchases for each of the years 2010 and 2009 and 27% for 2008R.J. Reynolds Tobacco Company. Product purchases from Philip Morris USA, Inc. accounted for approximately 28% , 27% and 27% and of total product purchases in 2013, 2012 and 2011 respectively. Product purchases from R.J. Reynolds Tobacco Company were approximately 13% for 201014% and 14% forof total product purchases in each of the years 20092013, 2012 and 20082011.
Cigarette sales represented approximately 70.5%68.0%, 70.3%69.0% and 68.2%70.4% of our revenuesnet sales in 2013, 2012 and 2011, respectively, and contributed approximately 31.0%30.0%,
35.4% 31.7% and 29.0%31.7% of our gross profit in 20102013, 20092012 and 2008,2011, respectively. The increase inAlthough cigarettes represent a significant portion of the percentageCompany’s total net sales, the majority of our revenues andits gross profit attributable to cigarettes beginning in 2009 was due primarily to manufacturer price increases in response to the enactment of the State Children's Health Insurance Program (“SCHIP”), which increased the federal cigarette excise taxis generated from 39¢ to $1.01 per pack. U.S. cigarette consumption has declined since 1980. If cigarette consumption continues to decline and we do not make up for lost cigarette carton sales through cigarette price increases or by increasing our food/non-food sales, our results of operations could be materially and adversely affected.products.
Accounts Receivable and Allowance for Doubtful Accounts
Accounts receivable consists of trade receivables from customers. We evaluateThe Company evaluates the collectability of accounts receivable and determinedetermines the appropriate allowance for doubtful accounts based on historical experience and a review of specific customer accounts. Account balances are charged off against the allowance when collection efforts have been exhausted and the receivable is deemed worthless (see Note 4 --- Other Consolidated Balance Sheet Accounts Detail).
Other Receivables
Other receivables consist primarily of amounts due from vendors for promotional and other incentives, which are accrued as earned. We evaluateThe Company evaluates the collectability of amounts due from vendors and determinedetermines the appropriate allowance for doubtful accounts due from vendors based on historical experience and on a review of specific amounts outstanding. While we believe that such allowances are adequate, these estimates could change in the future depending upon our ability to collect these vendor receivables.
Inventories
Inventories consist of finished goods, including cigarettes and other tobacco products, food and other products and related consumable products held for re-sale, and are valued at the lower of cost or market. In the U.S., cost is determined primarily determined on a last-in, first-out (“LIFO”) basis using producer price indices as determined by the Department of Labor, adjusted based on more current information, if necessary. When we arethe Company is aware of material price increases or decreases from manufacturers, we will estimatethe Company estimates the producer price index for the respective period in order to more accurately reflect inflation rates. Under the LIFO method, current costs of goods sold are matched against current sales. Inventories in Canada are valued on a first-in, first-out ("FIFO"(“FIFO”) basis, as LIFO is not a permitted inventory valuation method in Canada. Approximately 81%86% and 82%87% of our FIFOthe Company's inventory was valued on a LIFO basis at December 31, 20102013 and 20092012, respectively.
During periods of rising prices, the LIFO method of costing inventories generally results in higher current costscost of sales being charged against income while lower costs are retained in inventories. Conversely, during periods of decreasing prices, the LIFO method of costing inventories generally results in lower current costs being charged against income and higher stated inventories. Liquidations of inventory may also result in the sale of low-cost inventory and a decrease of cost of goods sold. We reduceThe Company reduces inventory value for spoiled, aged and unrecoverable inventory based on amounts on-hand and historical experience. We had a decrement in our LIFO layer of $3.7 million in 2010 and $5.1 million in 2009.
Property and Equipment
Property and equipment are recorded at cost, net of accumulated depreciation and amortization. Depreciation and amortization on new purchases are computed using the straight-line method over the assets' estimated useful lives. Leasehold improvements are amortized using the straight-line method over the shorter of the estimated useful life of the property or the term of the lease including available renewal option terms if it is reasonably assured that those termsoptions will be exercised. Upon retirement or sale,
the cost and related accumulated depreciation of the assets are removed and any related gain or loss is reflected in the consolidated statements of operations. Maintenance and repairs are charged to operationsexpense as incurred.
We have determinedThe Company uses the following usefuldepreciable lives for our fixed assets:its property and equipment:
|
| |
| | Useful Life in Years |
| Office furniture and equipment | 3 to 10 |
| Delivery equipment | 4 to 10 |
| Warehouse equipment | 35 to 15 |
| Leasehold improvements | 3 to 25 |
| Buildings | 15 to 25 |
Impairment of Long-lived and Other Intangible Assets
We review ourThe Company reviews its intangible and other long-lived assets for potential impairment at least annually.quarterly. Long-lived and other intangible assets may also be included intested for impairment testing when events and circumstances exist that indicate the carrying amounts of those assets may not be recoverable. Long-lived assets consist primarily of land, buildings, furniture, fixtures and equipment, leasehold improvements and other intangible assets. An impairment of long-lived assets exists when the carrying amount of a long livedlong-lived asset, or asset group, exceeds its fair value. Impairmentvalue, and impairment losses are only recorded when the carrying amount of the impaired asset is not recoverable. Recoverability is determined by comparing the carrying amount of the asset (or asset group) to the undiscounted cash flows which are expected to be generated from its use. An asset's carrying value can exceed its fair value, thus being impaired; however an impairment loss is not required to be recorded if the carrying value is recoverable from expected future cash flows from its use. Assets to be disposed of are reported at the lower of carrying amount or fair value less the cost to sell such assets. During 2010, 20092013, 2012 and 2008, we2011, the Company did not haverecord impairment lossescharges related to long-lived and other intangible assets or assets identified for abandonment as a result of facility closures or facility relocation.
Goodwill
Goodwill represents the excess of the purchase consideration of an acquired business over the fair value of the identifiable tangible and Intangible Assets
We reviewintangible assets acquired and liabilities assumed in a business combination. Goodwill is not subject to amortization but must be evaluated for impairment. The Company tests goodwill for impairment on an annual basisannually or whenever significant events or changes occur in our business.circumstances indicate that it is more likely than not that the fair value of a reporting unit is below its carrying amount. Each quarter, or whenever events or circumstances change, the Company assesses the related qualitative factors to determine whether it is necessary to perform the two-step quantitative goodwill impairment test. The reviewstests to evaluate goodwill for impairment are performed at the operating division level, which comprise our reporting units. Thelevel. In the first step of the quantitative impairment test, the Company compares the fair value of the operating division to its carrying value. If the fair value of the operating division is less than its carrying value, the Company performs a second step to determine the implied fair value of goodwill associated with the reporting unit's goodwill must be determined and compared to the carrying value of the goodwill.division. If the carrying value of a reporting unit's goodwill exceeds itsthe implied fair value of goodwill, such excess represents the amount of goodwill impairment for which an impairment loss equal to the difference willwould be recorded. BasedDetermining the fair value of a reporting unit involves the use of significant estimates and assumptions. The estimated fair value of each operating division is based on the discounted cash flow method, which is based on historical and forecasted amounts specific to each reporting unit and considers sales, gross profit, operating profit and cash flows and general economic and market conditions, as well as the impact of planned business and operational strategies and other estimates and assumptions for future growth rates, working capital and capital expenditures. The Company bases its fair value estimates on assumptions it believes to be reasonable at the time, but such assumptions are subject to inherent uncertainty. Measuring the fair value of reporting units would constitute a Level 3 measurement under the fair value hierarchy (see Note 7 - Goodwill and Other Intangible Assets).
The Company has historically performed its annual impairment tests performedtesting of goodwill on November 30 of each year. In 2013, the Company changed the annual impairment testing date from November 30to October 1. The Company believes this change, which represents a change in the method of applying an accounting principle, is preferable in the circumstances as it provides additional time for the Company to quantify the fair value of its operating divisions and meet reporting requirements. The change in the annual goodwill impairment testing date is not intended to nor does it delay, accelerate, or avoid an impairment charge. The Company determined that it was impracticable to objectively determine projected cash flows and related valuation estimates that would have been used as of each October 1 for periods prior to October 1, 2013 without the use of hindsight. As such, the Company has prospectively applied the change in the annual impairment testing date from October 1, 2013. The Company did not record any impairment charges related to goodwill during the years ended December 31, 20102013, 2012 and December 31, 2009, there was no impairment of goodwill in 2010 or 2009. There can be no assurance that future goodwill tests will not result in a charge to earnings. We do not amortize those intangible assets that have been determined to have indefinite useful lives (seeNote 4 -- Other Consolidated Balance Sheet Accounts Detail)2011.
Computer Software Developed or Obtained for Internal Use
We accountThe Company accounts for proprietary computer software systems, namely ourits Distribution Center Management System (“DCMS”), and software purchased from third-party vendors, using certain criteria under which costs associated with this software
are either expensed or capitalized and amortized over periods from three to eight years. During 2010, 20092013 and 20082012, we the Company capitalized approximately $1.02.0 million million, $and 0.3$0.2 million million and $0.7 million, respectively, primarilyof costs related to software developed or obtained for enhancements to DCMS and other non-proprietary systems.internal use.
Debt Issuance Costs
Debt issuance costs have beenare deferred and are being amortized as interest expense over the term of the related debt agreement on a straight-line basis.basis, which approximates the effective interest method. Debt issuance costs, net of current portion, are included in other non-current assets net, on the accompanying consolidated balance sheets. UnamortizedTotal unamortized debt issuance costs were $1.7$1.4 million and $1.5 million as of at December 31, 20102013 and $0.42012 million as of December 31, 2009., respectively.
Claims Liabilities and Insurance Recoverables
We maintainThe Company maintains reserves related to health and welfare, workers' compensation, auto and general liability programs that are principally self-insured. WeThe Company currently havehas a per-claim ceilingdeductible of $500,000$500,000 for ourits workers' compensation, general and auto liability self-insurance programs and a per-claim limitper person annual claim deductible of $200,000$200,000 for ourits health and welfare program. We purchaseThe Company purchases insurance to cover the claims that exceed the ceilingdeductible up to policy limits. Self-insured reserves are for pending or future claims that fall outside the policy and reserves include an estimate of expected settlements on pending claims and a provision for claims incurred but not reported. Estimates for workers' compensation, auto and general liability insurance are based on ourthe Company’s assessment of potential liability using an annual actuarial analysis of available information with respect to pending claims, historical experience and current cost trends. Reserves for claims under these programs are included in accrued liabilities (current portion) and claims liabilities, net of current portion.
Claims liabilities and the related recoverables from insurance carriers for estimated claims in excess of the deductible amounts and other insured events are presented in their gross amounts on the accompanying consolidated balance sheets because there is no right of offset. The carrying values of claims liabilities and insurance recoverables are not discounted. Insurance recoverables are included in other receivables, net and other non-current assets, net. WeThe Company had gross liabilities for health and welfare, workers' compensation, auto and general liability related to both Core-Markself-insurance obligations in the amounts of $28.2 million long-term and Fleming (former owner of Core-Mark, related to emergence from bankruptcy in 2004) self-insurance obligations$12.9 million short-term at December 31, 20102013, and 2009$28.1 million in the amounts of $30.6 million long-term and $8.7$8.5 million short-term and $32.6 million long-term and $8.4 million short-term, respectively. Ourat December 31, 2012. The Company’s liabilities net of insurance recoverables were $11.0 million long-term and $7.6 million short-term at December 31, 20102013, and 2009 were $11.1$10.5 million long-term and $6.2$6.4 million short-term and $11.6 million long-term and $5.7 million short-term, respectivelyat December 31, 2012.
Pension Costs and Other Post-retirement Benefit Costs
Pension costs and other post-retirement benefit costs charged to operations are estimated on the basis of annual valuations by an independent actuary. Adjustments arising from plan amendments, changes in assumptions and experience gains and losses
are amortized over the expected average remaining service life of the employee group. We recognizePlan changes that materially reducethe expected years of future services of current employees or eliminates for a significant number of employees the accrual of defined benefits for some or all of their future services, result in curtailment gains. A curtailment gain first reduces any net loss previously included in accumulated other comprehensive income (AOCI), and to the extent that such a gain exceeds any net loss included in AOCI, it is recorded as a curtailment gain in our consolidated balance sheetsstatement of operations.
The Company recognizes an asset for a plan's overfunded status or a liability for a plan's underfunded status on its consolidated balance sheet as of the end of each fiscal year. We determineThe Company determines the plan's funded status by measuring its assets and its obligations and we recognizerecognizes changes in the funded status of ourits defined benefit post-retirement plan in the year in which the change occurred (see Note 12 --11 - Employee Benefit Plans).
Income Taxes
Income taxes are accounted for using the asset and liability method. Deferred tax assets and liabilities are recognized for the estimated future tax consequences attributable to differences between the financial statement carrying amounts of existing assets and liabilities and their respective tax bases and operating loss and tax credit carry-forwards. The effect on deferred tax assets and liabilities of a change in tax rates is recognized in income in the period that includes the enactment date. Deferred tax assets are reduced by a valuation allowance when we dothe Company does not consider it more likely than not that some portion or all of the deferred tax assets will be realized.
A tax benefit from an uncertain tax position may be recognized when it is more likely than not that the position will be sustained upon examination, including resolutions of any related appeals or litigation processes, based on the technical merits. We haveThe Company has established an estimated liability for income tax exposures that arise and meet the criteria for accrual. We prepareThe Company prepares and filefiles tax returns based on ourits interpretation of tax laws and regulations and recordrecords estimates based on these judgments and interpretations. In the normal course of business, ourthe Company's tax returns are subject to examination by various taxing authorities. Such examinations may result in future tax and interest assessments by these taxing authorities. Inherent uncertainties exist in estimates of tax contingencies due to changes in tax law resulting from legislation, regulation and/or as
concluded through the various jurisdictions' tax court systems. We classifyThe Company classifies interest and penalties related to income taxes as income tax expense (see Note 9 --10 - Income Taxes).
Stock-Based Compensation
We accountThe Company accounts for stock-based compensation expense for restricted stock unit awards, performance shares and stock options by estimating the fair values of awards at their grant dates and amortizingrecognizes these amounts as expense using a straight-line method for awards with vesting based on service and ratably for awards based on performance conditions. Currently, we useThe fair value of restricted stock unit awards and performance shares earned is based upon the Company’s stock price on the grant date.
For stock option awards, the Company uses the Black-Scholes option valuation model to valuedetermine the stock awardsfair value (see Note 11 --13 - Stock-Based Compensation Plans).
Determining the appropriate fair value model and calculating the fair value of stock-basedstock option awards at the grant date requires considerable judgment, including estimating stock price volatility, expected life of share awards and forfeiture rates. We develop ourThe Company develops its estimates based on historical data and market information, which can change significantly over time.
Total Comprehensive Income
Total comprehensive income consists of two components: net income and other comprehensive income. Other comprehensive income refers to revenues, expenses, gainstransactions and lossesadjustments that under generally accepted accounting principles are recorded directly as an element of stockholders' equity, but are excluded from net income. Other comprehensive income is comprised of minimum pension liabilitydefined benefit plan adjustments and foreign currency translation adjustments relatingrelated to ourthe Company’s foreign operations in Canada, whose functional currency is not the U.S. dollar (see Consolidated Statements of Stockholders' Equity andNote 15 - Other Comprehensive Income)Income/Loss).
Segment Information
We report ourThe Company reports its segment information using established standards for reporting by public enterprises on information about product lines, geographical areas and major customers. The method of determining what information to report is based on the way we arethe Company is organized for operational decisions and assessment of the aggregate financial performance. From the perspective of ourthe Company’s chief operating decision makers, we aremaker, the Company is engaged primarily in the business of distributing packaged consumer products to convenience retail stores in the U.S. and Canada.Canada (collectively "North America"). Therefore, we havethe Company has determined that we have twoit has one reportable segments based onsegment and operates its business in two geographical areaareas -- U.S. and Canada. We present ourThe Company presents its segment reporting information based on business operations and by major product category for each of the two geographic segmentsareas in which it operates and also by major product category (see Note 15 --16 - Segment and Geographic Information).
Earnings Per Share
Basic earnings per share is calculated by dividing net income by the weighted-average number of common shares outstanding during each period, excluding unvested restricted stock.stock units and performance shares. Diluted earnings per share assumes the exercise of stock options and common stock warrants, and the impact of restricted stock units and performance shares, when dilutive, using the treasury stock method (see Note 10 --12 - Earnings Per Share).
Recent Accounting Pronouncements
On July 18, 2013, the Financial Accounting Standards Board issued Accounting Standards Update (ASU) No. 2013-11, Presentation of an Unrecognized Tax Benefit When a Net Operating Loss Carryforward, a Similar Tax Loss, or a Tax Credit Carryforward Exists, which requires an entity to present an unrecognized tax benefit as a reduction of a deferred tax asset for a net operating loss (NOL) carryforward, or similar tax loss or tax credit carryforward, rather than as a liability when (1) the uncertain tax position would reduce the NOL or other carryforward under the tax law of the applicable jurisdiction and (2) the entity intends to use the deferred tax asset for that purpose. This accounting standard update will be effective for the Company beginning in the first quarter of 2014 and applied prospectively with early adoption permitted. The Company does not believe that its adoption of this accounting standard will have a material impact on its consolidated financial statements.
3. Acquisitions
Acquisition of J.T. Davenport & Sons, Inc.
On December 17, 2012, the Company acquired J.T. Davenport & Sons, Inc. (“Davenport”), a convenience wholesaler based in North Carolina, which is now a subsidiary of Core-Mark. Davenport services customers in the eight states of North Carolina, South Carolina, Georgia, Maryland, Ohio, Kentucky, West Virginia and Virginia. This acquisition increased the Company’s market presence primarily in the Southeastern U.S. and further enhanced the Company's ability to cost effectively service national and regional retailers.
Recent Accounting Pronouncements
In January 2010, the Financial Accounting Standards Board issuedTotal purchase consideration to acquire Accounting Standards Update (“ASU”) No. 2010-06,Improving Disclosures about Fair Value Measurements.Davenport ASU 2010-06 requires additional disclosures about fair value measurements, including transferswas approximately $41.2 million, of which $34.3 million was paid at closing. The total purchase consideration increased by $2.3 million in 2013 resulting from certain post-closing purchase price adjustments. The acquisition was funded with a combination of cash on hand and out ofborrowings under a revolving credit facility and was accounted for as a business combination.
The following table presents the fair value hierarchy Levels 1 and 2 and a higher level of disaggregation based on nature and risk for the different types of financial instruments. For the reconciliation of Level 3 fair value measurements, information about purchases, sales, issuances and settlements should be presented separately. This ASU is effective for annual and interim reporting periods beginning after December 15, 2009 for most of the new disclosures and for periods beginning after December 15, 2010 for the new Level 3 disclosures. Comparative disclosures are not required in the first year the disclosures are required. We have incorporated ASU 2010-06 into the disclosures that accompany our consolidated financial statements.
3. Acquisitions
On August 2, 2010, we acquired substantially all of the assets of Finkle Distributors, Inc. (“FDI”), a regional convenience
wholesaler servicing customers in New York, Pennsylvania and the surrounding states, for cash consideration of approximately $36.0 million. The FDI operations were integrated into two of our existing distribution centers and are providing us opportunities to expand our market share.
The purchase price allocation of the acquired assets and liabilities assumed, based on their estimated fair values at the acquisition date, was as follows (in millions):
| | | | |
| Cash | | $ | 0.1 | |
| Accounts receivable | | 21.1 | |
| Inventory | | 9.9 | |
| Prepaid expenses | | 0.3 | |
| Property, plant and equipment | | 2.4 | |
| Intangible assets | | 3.6 | |
| Liabilities | | (1.4 | ) |
| Cash paid at closing | | $ | 36.0 | |
| Contingent payments | | 1.0 | |
| Total consideration | | $ | 37.0 | |
We do not expect any future changes in the fair value analysis of the assets to be material.
Intangible assets include $2.0 million for customer relationships which will be amortized over ten years, $0.9 million of non-amortizing goodwill and $0.7 million for the non-competition agreement which will be amortized over five years. Goodwill is measured as the difference between the purchase price and the fair value of assets acquired and liabilities assumed.assumed and purchase consideration as of the acquisition date (in millions).
|
| | | |
| | December 17, 2012 |
|
| Cash | $ | 0.3 |
|
| Accounts receivable | 21.2 |
|
| Other receivables | 3.9 |
|
| Inventory | 20.3 |
|
| Prepaid expenses / other assets | 2.6 |
|
| Property, plant and equipment | 5.3 |
|
| Intangible assets | 2.6 |
|
| Goodwill | 6.7 |
|
| Net deferred tax liabilities | (1.0 | ) |
| Capital lease liability | (10.9 | ) |
| Other liabilities | (9.8 | ) |
| Total consideration | $ | 41.2 |
|
The total purchase consideration includes (i) a $4.0 million indemnity holdback for any post-closing liabilities to be released, less any indemnity claims, to the former owners of Davenport in equal installments over four years on the anniversary date of the closing of the acquisition; and (ii) $0.6 million of contingent payments related to future employment services. As of December 31, 2013, the Company had $3.0 million and $0.3 million of future payment obligations remaining under the indemnity holdback and employment service provisions, respectively. The intangible assets including goodwill, are comprised of (i) $1.9 million of customer relationships, which is being amortized over 10 years; and (ii) $0.7 million of non-competition agreements, the majority of which is being amortized over five years. The estimated fair value of the purchased intangible assets was determined using the income approach, which discounts expected future cash flows attributable to be deductible forthe specific assets to their present value. The purchase price allocation also includes $1.0 million of net deferred tax purposes. The contingent payments relateliabilities related primarily to a non-competition agreement with a former ownerthe difference between the book and were recorded at the present value of contractual payments. Results of operations of FDI have been included in Core-Mark’s consolidated statement of operations since the date of acquisition to December 31, 2010.
Pro forma results of the acquired business have not been presented as the results were not material to our consolidated financial statements for all periods presented and would not have been material had the acquisition occurred at the beginning of
the year.
On June 23, 2008, we acquired substantially alltax bases of the assets acquired.
The acquisition resulted in $6.7 millionof Auburn Merchandise Distributors, Inc. (“AMD”), located in Whitinsville, Massachusetts, a wholly-owned subsidiary of Warren Equities, Inc., for approximately $28.7 million. The assets purchased include primarily accounts receivable, inventory, fixed assets and other intangibles, with no significant liabilities. AMD conducts business primarily innon-amortizing goodwill, which represents the Northeastern regionexcess of the U.S. The purchase price exceededcash paid over the estimated fair value of net assets acquired by approximately $0.9 million,and liabilities assumed, net of deferred tax liabilities. The goodwill arising from the acquisition, which has been recorded as goodwill. AMD conducts operations asis not deductible for tax purpose, reflects synergies the “New England” divisionCompany expects to realize.
Simultaneous with the closing of the acquisition, the Company entered into a capital lease arrangement for a warehouse facility in Sanford, North Carolina with certain of the former owners of Davenport, who are now employees of Core-Mark. The term of the lease is for 10 years, excluding renewal options, and the related capital lease obligation was $10.4 million at December 31, 2013.
Results of operations of AMD areDavenport have been included in Core-Mark's consolidatedthe Company’s statements of operations and comprehensive income since the date of acquisition. The Company incurred costs of approximately $1.6 million and $1.3 million related primarily to the acquisition and integration of Davenport’s operations in 2013 and 2012, respectively. These costs are included in selling, general and administrative expenses on the consolidated statements of operations for the years ended December 31, 2013 and 2012.
The Company did not consider the Davenport acquisition to be a material business combination and therefore has not disclosed pro-forma results of operations for the acquired business.
Acquisition of Forrest City Grocery Company
On May 2, 2011, the Company acquired Forrest City Grocery Company (“FCGC”), located in Forrest City, Arkansas, and thereafter FCGC became a subsidiary of Core-Mark. FCGC was a regional wholesale distributor servicing customers in Arkansas, Mississippi, Tennessee and the surrounding states. The acquisition of FCGC provided the Company additional distribution infrastructure and increased its market share in the Southeastern U.S.
The total consideration to acquire FCGC was approximately $54.0 million, which was funded with a combination of cash on hand and borrowings under the Company's revolving credit facility. The acquisition was accounted for as a business combination.
The following table summarizes the allocation of the consideration paid for the acquisition and the estimated fair values of assets acquired and liabilities assumed as of the acquisition date (in millions):
|
| | | |
| | May 2, 2011 |
| Cash | $ | 3.5 |
|
| Accounts receivable | 18.4 |
|
| Other receivables | 0.4 |
|
| Inventory | 13.0 |
|
| Prepaid expenses / other assets | 2.0 |
|
| Property, plant and equipment | 6.0 |
|
| Intangible assets | 18.4 |
|
| Goodwill | 11.6 |
|
| Net deferred tax liabilities | (7.0 | ) |
| Other liabilities | (12.3 | ) |
| Total consideration | $ | 54.0 |
|
4.The total purchase consideration included an escrow reserve of approximately $Other Consolidated Balance Sheet Accounts Detail17.0 million for indemnifiable claims in connection with the acquisition. The amount of the escrow reserve decreased to $13.5 million as of December 31, 2013 due primarily to scheduled payments to the seller under the escrow agreement and reimbursements to the Company for pre-acquisition tax liabilities settled during the year. The remaining escrow reserve, subject to adjustment, is available for claims through May 2015.
The acquired intangible assets include $16.4 million of customer relationships, which is being amortized over 15 years; and $2.0 million of non-competition agreements, the majority of which is being amortized over 5 years. The estimated fair value of the intangible assets was determined using the income approach, which discounts expected future cash flows to present value. The purchase price allocation also includes $7.0 million of net deferred tax liabilities related primarily to the difference between the book and tax bases of the intangible assets. The acquisition resulted in $11.6 million of non-amortizing goodwill, which is not deductible for tax purposes.
Results of operations of FCGC have been included in the Company’s consolidated statements of operations and comprehensive income since the date of acquisition. The Company did not consider the FCGC acquisition to be a material business combination, and therefore has not disclosed pro-forma results of operations for the acquired business.
| |
| 4. | Other Consolidated Balance Sheet Accounts Detail |
Allowance for Doubtful Accounts, Accounts Receivable
The changes in the allowance for doubtful accounts due from customers consist of the following (in millions):
| | | 2010 | | 2009 | | | | | | | |
| Balance, beginning of period | $ | 9.1 | | | $ | 8.8 | | |
| | | 2013 | | 2012 | | 2011 |
| Balance, beginning of year | | $ | 10.9 |
| | $ | 9.6 |
| | $ | 8.7 |
|
| Net additions charged to operations | 1.4 | | | 1.8 | | 1.1 |
| | 2.0 |
| | 2.0 |
|
| Less: Write-offs and adjustments | (1.8 | ) | | (1.5 | ) | (2.6 | ) | | (0.7 | ) | | (1.1 | ) |
| Balance, end of period | $ | 8.7 | | | $ | 9.1 | | |
| Balance, end of year | | $ | 9.4 |
| | $ | 10.9 |
| | $ | 9.6 |
|
The net additions to the allowance for doubtful accounts waswere recognized in ourthe consolidated statements of operations as a component of the Company’s selling, general and administrative expenses which is included in our operating expenses. We continually assess our collection risks and make appropriate adjustments, as deemed necessary, to the allowance for doubtful accounts to ensure that reserves for accounts receivable are adequate.
Other Receivables, Net
Other receivables, net consist of the following (in millions):
| | | | | | | |
| | December 31, 2010 | | December 31, 2009 |
| Vendor receivables, net | $ | 31.1 | | | $ | 30.4 | |
| Insurance recoverables, current | 2.5 | | | 2.7 | |
| Other | 9.9 | | | 6.5 | |
| Total | $ | 43.5 | | | $ | 39.6 | |
The allowance for doubtful accounts due from vendors was $0.1 million as of December 31, 2010 and 2009, respectively. |
| | | | | | | |
| | December 31, 2013 | | December 31, 2012 |
| Vendor receivables, net | $ | 46.0 |
| | $ | 41.2 |
|
| Insurance recoverables, current | 5.3 |
| | 2.2 |
|
| Other | 7.7 |
| | 10.4 |
|
| Total other receivables, net | $ | 59.0 |
| | $ | 53.8 |
|
Deposits and Prepayments
Deposits and prepayments consist of the following (in millions):
| | | | | | | |
| | December 31, 2010 | | December 31, 2009 |
| Deposits | $ | 4.4 | | | $ | 3.3 | |
| Prepayments | 37.8 | | | 38.9 | |
| Total | $ | 42.2 | | | $ | 42.2 | |
|
| | | | | | | |
| | December 31, 2013 | | December 31, 2012 |
| Deposits | $ | 4.9 |
| | $ | 4.8 |
|
| Prepaid income taxes | 4.3 |
| | 3.7 |
|
| Vendor prepayments | 26.4 |
| | 18.8 |
|
| Racking allowances, current | 7.9 |
| | 5.0 |
|
| Other prepayments | 9.5 |
| | 8.0 |
|
| Total deposits and prepayments | $ | 53.0 |
| | $ | 40.3 |
|
Our depositsDeposits include amounts related primarily to cigarette stamps and workers' compensation claims. Other prepayments include deposits related to workers' compensation claims, prepayments relating primarily to product purchases, as well as insurance policies, income taxes, prepaid rent, cigarette stamps and rental deposits and up-front consideration to customers.software licenses.
Other Non-Current Assets, Net
Other non-current assets, net of current portion, consist of the following (in millions):
| | | | | | | |
| | December 31, 2010 | | December 31, 2009 |
| Internally developed and other purchased software, net | $ | 2.6 | | | $ | 3.3 | |
| Insurance recoverables, net of current portion | 19.5 | | | 21.0 | |
| Debt issuance costs, net of current portion | 1.2 | | | 0.3 | |
| Insurance deposits, net of current portion | 2.7 | | | 4.5 | |
| Other amortizable intangibles | 4.5 | | | 2.2 | |
| Other assets | 0.8 | | | 1.7 | |
| Total | $ | 31.3 | | | $ | 33.0 | |
|
| | | | | | | |
| | December 31, 2013 | | December 31, 2012 |
| Insurance recoverables | $ | 17.2 |
| | $ | 17.6 |
|
| Debt issuance costs | 1.1 |
| | 1.0 |
|
| Insurance deposits | 3.7 |
| | 3.6 |
|
| Racking allowances, net | 4.9 |
| | 4.4 |
|
| Other assets | 6.2 |
| | 6.9 |
|
| Total other non-current assets, net | $ | 33.1 |
| | $ | 33.5 |
|
The amortization of intangible assets, inclusive of non-compete agreements and customers' lists, recorded in the consolidated statement of operations was $2.1 million for 2010 and $2.0 million for both 2009 and 2008.
Accrued Liabilities
Accrued liabilities consist of the following (in millions):
| | | | December 31, 2010 | | December 31, 2009 | December 31, 2013 | | December 31, 2012 |
| Accrued payroll, retirement and other benefits | $ | 22.2 | | | $ | 21.1 | | $ | 25.8 |
| | $ | 27.7 |
|
| Claims liabilities, current | 8.7 | | | 8.4 | | 12.9 |
| | 8.5 |
|
| Accrued customer incentives payable | | 18.5 |
| | 14.9 |
|
| Indirect taxes | | 5.9 |
| | 5.2 |
|
| Vendor advances | | 5.3 |
| | 5.5 |
|
| Other accrued expenses | 24.8 | | | 20.4 | | 19.7 |
| | 17.7 |
|
| Accrued customer incentives payable | 11.1 | | | 9.7 | | |
| Total | $ | 66.8 | | | $ | 59.6 | | |
| Total accrued liabilities | | $ | 88.1 |
| | $ | 79.5 |
|
OurThe Company’s accrued payroll, retirement and other benefits include accruals for vacation, bonus,bonuses, wages, 401(k) benefit matching and the current portion of pension and post-retirement benefit obligations. OurThe Company’s other accrued expenses include accruals for goods and services, taxes, legal expenses, interest and other miscellaneous accruals.
5.Inventories
Inventories consist of the following (in millions):
| | | | December 31, 2010 | | December 31, 2009 | December 31, 2013 | | December 31, 2012 |
| Inventories at FIFO, net of reserves | $ | 350.4 | | | $ | 318.5 | | $ | 488.2 |
| | $ | 456.7 |
|
| Less: LIFO reserve | (59.7 | ) | | (43.0 | ) | (99.0 | ) | | (90.3 | ) |
| Total inventories at LIFO, net of reserves | $ | 290.7 | | | $ | 275.5 | | $ | 389.2 |
| | $ | 366.4 |
|
Cost of goods sold reflects the application of the last-in, first-out (“LIFO”) method of valuing inventories in the U.S. based upon estimated annual producer price indices. Inventories in Canada are valued on a first-in, first-out (“FIFO”) basis, as LIFO is not a permitted inventory valuation method in Canada. If the FIFO method had been used for valuing inventories in the U.S., inventories would have been approximately $99.0 million and $90.3 million higher at December 31, 2013 and 2012, respectively. The Company had a decrement in certain of its LIFO inventory layers of $11.8 million, $23.2 million and $2.4 million in 2013, 2012 and 2011, respectively, which had the effect of reducing its LIFO expense by $2.2 million in 2013, $1.6 million in 2012 and $0.6 million in 2011. The Company recorded LIFO expense of $8.7 million, $12.3 million and $18.3 million for the years ended December 31,2013, 2012 and 2011, respectively. The decrement in the Company’s LIFO inventory layers in 2013 was due primarily to lower inventory levels resulting from higher than expected sales in December 2013. Approximately $20.0 million of the $23.2 million decrement in 2012 was the result of a reduction in LIFO layers created in 2011, due to a temporary increase in inventory to support new business and holiday timing at the end of 2011.
6. Property and Equipment
Property and equipment consist of the following (in millions):
| | | December 31, 2010 | | December 31, 2009 | | | | | |
| Delivery, warehouse and office equipment | $ | 118.5 | | | $ | 109.0 | | |
| Equipment under capital leases | 1.2 | | | 1.0 | | |
| | | December 31, 2013 | | December 31, 2012 |
Delivery, warehouse and office equipment (1) | | $ | 169.0 |
| | $ | 156.2 |
|
| Leasehold improvements | 20.4 | | | 17.4 | | 36.1 |
| | 32.3 |
|
Land and buildings | 12.8 | | | 12.7 | | 26.9 |
| | 24.9 |
|
| Construction in progress | | 1.1 |
| | 1.4 |
|
| | 152.9 | | | 140.1 | | 233.1 |
| | 214.8 |
|
| Less: Accumulated depreciation and amortization | (68.2 | ) | | (56.3 | ) | (118.2 | ) | | (100.1 | ) |
| Total | $ | 84.7 | | | $ | 83.8 | | |
| Total property and equipment, net | | $ | 114.9 |
| | $ | 114.7 |
|
For 2010, 2009(1) Includes equipment capital leases of $3.3 million for 2013 and 2008$2.1 million, depreciation for 2012.
(2) In both 2013 and 2012 includes $4.8 million for a capital lease related to a warehouse facility.
Depreciation and amortization expenses related to property and equipment were $15.0$20.0 million $14.2, $18.5 million and $12.8$16.2 million for 2013, 2012 and 2011, respectively. Property and equipment includes accruals for construction in progress of $0.5$1.9 million in 20102013 and $0.7$0.2 million in 20092012.
7. Goodwill and Other Intangible Assets
Goodwill
The changes in the carrying amount of goodwill during 2013 and 2012 are as follows (in millions): |
| | | | | | | |
| | 2013 | | 2012 |
| Goodwill, beginning of year | $ | 22.8 |
| | $ | 16.2 |
|
| Davenport acquisition | 0.1 |
| | 6.6 |
|
| Goodwill, end of year | $ | 22.9 |
| | $ | 22.8 |
|
The Company tests goodwill for impairment annually or whenever events or circumstances indicate that it is more likely than not that the fair value of a reporting unit is below its carrying amount. The Company did not record any impairment charges related to goodwill during the years ended December 31, 2013, 2012 and 2011.
Other Intangible Assets
The carrying amount and accumulated amortization of other intangible assets as of December 31, 2013 and 2012 are as follows (in millions): |
| | | | | | | | | | | | | | | | | | | | | | | |
| | December 31, 2013 | | December 31, 2012 |
| | Gross | | | | Net | | Gross | | | | Net |
| | Carrying | | Accumulated | | Carrying | | Carrying | | Accumulated | | Carrying |
| | Amount | | Amortization | | Amount | | Amount | | Amortization | | Amount |
| Customer relationships | $ | 21.1 |
| | $ | (4.1 | ) | | $ | 17.0 |
| | $ | 21.6 |
| | $ | (3.0 | ) | | $ | 18.6 |
|
| Non-competition agreements | 3.2 |
| | (1.8 | ) | | 1.4 |
| | 3.2 |
| | (1.0 | ) | | 2.2 |
|
| Internally developed and other purchased software | 11.9 |
| | (9.5 | ) | | 2.4 |
| | 9.9 |
| | (9.3 | ) | | 0.6 |
|
| Total other intangible assets | $ | 36.2 |
| | $ | (15.4 | ) | | $ | 20.8 |
| | $ | 34.7 |
| | $ | (13.3 | ) | | $ | 21.4 |
|
The amortization of intangible assets, inclusive of non-compete agreements, customer lists and internally developed and other purchased software, recorded in the consolidated statements of operations was $2.7 million in 2013 and $3.0 million in both 2012 and 2011.
Intangible assets and software with definite useful lives are amortized over the following useful lives: |
| |
| Useful Life in Years |
| Customer relationships | 10-15 |
| Non-competition agreements | 1-5 |
| Software | 3-8 |
Estimated future amortization expense for intangible assets is as follows (in millions): |
| | | |
| Year ending December 31, | |
| 2014 | $ | 2.5 |
|
| 2015 | 2.4 |
|
| 2016 | 2.1 |
|
| 2017 | 1.9 |
|
| 2018 | 1.8 |
|
8. Long-term Debt
Total long-term debt consists of the following (in millions):
| | | | | | | |
| | December 31, 2010 | | December 31, 2009 |
| Amounts borrowed (Credit Facility) | $ | — | | | $ | 19.2 | |
| Obligations under capital leases | 0.8 | | | 0.8 | |
| Total | $ | 0.8 | | | $ | 20.0 | |
|
| | | | | | | |
| | December 31, | | December 31, |
| | 2013 | | 2012 |
| Amounts borrowed (Credit Facility) | $ | 46.3 |
| | $ | 73.3 |
|
| Obligations under capital leases (Note 9) | 11.3 |
| | 11.4 |
|
| Total long-term debt | $ | 57.6 |
| | $ | 84.7 |
|
In October 2005, we entered intoThe Company has a five-year revolving credit facility (“Credit Facility”) with a capacity of $250$200 million and an expiration date of October 2010. In February 2010, we entered into a third amendment to our Credit Facility (the “Third Amendment”), which extended our credit facility for four years, to February 2014, and decreased the lenders' revolving loan commitments by $50 million to $200 million, at our request. The Third Amendment also provides forcan be increased up to an additional $100$100 million of lenders' revolving commitments (formerly $75 million), subject to certain provisions contained therein. Pricing under the new facility increased as a result of generally higher prices in the bank loan market. The basis points added to LIBOR increased to a range of 275 to 350 basis points, up from a range of 100 to 175 basis points, tied to achieving certain operating results as defined in the Credit Facility. Additionally, unused facility fees and letter of credit participation fees increased. The Third Amendment also increased our basket for permitted acquisitions following the date of the Third Amendment to $125 million and re-established our basket for permitted stock repurchases at $30 million. At the date of signing the Amendment, we incurred fees of approximately $1.8 million, which are being amortized over the term of the amendment.
provisions. All obligations under the Credit Facility are secured by first priority liens uponon substantially all of ourthe Company’s present and future assets. The terms of the Credit Facility permit prepayment without penalty at any time (subject to customary breakage costs with respect to LIBOR-LIBOR or CDOR-basedCDOR based loans prepaid prior to the end of an interest period).
On May 30, 2013, the Company entered into a fifth amendment to the Credit Facility (the "Fifth Amendment"), which extended the term of the Credit Facility from May 2016 to May 2018 and reduced the margin added to the LIBOR or CDOR rate and reduced the unused facility fees. The margin added to the LIBOR or CDOR rate is currently a range of 125 to 175 basis points, down from a range of 175 to 225 basis points. In addition, the Fifth Amendment provides for stock repurchases of up to an aggregate of $50 million, not to exceed $15 million in any year and re-established a $75 million ceiling for dividends allowable over the term of the Credit Facility. The Company incurred fees of approximately $0.3 million in connection with the Fifth Amendment, which are being amortized over the term of the amendment.
The Credit Facility contains restrictive covenants, including among others, limitations on dividends and other restricted payments, other indebtedness, liens, investments and acquisitions and certain asset sales. As of December 31, 20102013, we werethe Company was in compliance with all of the covenants under the Credit Facility.
Amounts borrowed, outstanding letters of credit and amounts available to borrow, net of certain reserves required under the Credit Facility, were as follows (in millions):
| | | | | | | | | | December 31, | | December 31, |
| | December 31, 2010 | | December 31, 2009 | 2013 | | 2012 |
| Amounts borrowed | $ | — | | | $ | 19.2 | | $ | 46.3 |
| | $ | 73.3 |
|
| Outstanding letters of credit | $ | 26.2 | | | $ | 26.1 | | 21.8 |
| | 19.8 |
|
| Amounts available to borrow | $ | 161.4 | | | $ | 196.9 | | |
Amounts available to borrow (1) | | 122.7 |
| | 97.7 |
|
| |
| (1) | Excluding $100 million expansion feature. |
Average borrowings during the yearyears ended December 31, 20132010 and 2012 were $3.1$35.3 million and $26.3 million, respectively, with amounts borrowed at any one time during the years then ended ranging from zero to a high of $34.8 million. For the same period in 2009, average borrowings were $8.2$112.0 million million, with amounts borrowed ranging from and zero to a high of $61.1 million.$91.5 million, respectively.
OurThe weighted-average interest rate on the revolving credit facility for the years ended December 31, 2013 and 2012was1.8% and 2.1%, respectively. The weighted-average interest rate is calculated based on ourthe daily cost of borrowing, which was computed onreflecting a blend of prime and LIBOR rates. The weighted-average interest rate on our revolvingCompany paid fees for unused credit facility for the years ended December 31, 2010 and 2009 was 2.9% and 2.0%, respectively. We paid total unused facility fees and letter of credit participation, fees, which are included in interest expense, of $1.80.8 million, $0.9 million, and $1.3 million million for 2010 compared to $0.82013, 2012 and 2011, respectively. The Company recorded charges related to amortization of debt issuance costs, which are included in interest expense, of $0.4 million, $0.4 million, and $0.5 million for 2009.the years ended December 31, 2013, 2012 and 2011, respectively. Unamortized debt issuance costs were $1.71.4 million and $1.5 million as of December 31, 20102013 and $0.42012 million as of December 31, 2009., respectively.
8.Commitments and Contingencies
| |
| 9. | Commitments and Contingencies |
Purchase Commitments
We enterThe Company enters into purchase commitments in the ordinary course of businessbusiness. At December 31, 2013, the Company had $4.8 million in purchase obligations related primarily to transportationdelivery equipment and computer software. At December 31, 2012, the Company had $1.2 million in purchase obligations related primarily to delivery equipment.
Operating Leases
We lease nearly allThe Company leases most of ourits sales and warehouse facilities as well as tractors,and a significant number of trucks, vans and certain equipment under operating lease agreements expiring at various dates through 2022,2027, excluding renewal options. Rent expense is recorded on a straight-line basis over the term of the lease, including available renewal option terms, if it is reasonably assured that the renewal options will be exercised. The operating leases generally require usthe Company to pay taxes, maintenance and insurance. In most instances, we expectthe Company expects the operating leases that expire will be renewed or replaced in the normal course of business.
Future minimum rental payments under non-cancelable operating leases (with initial or remaining lease terms in excess of one year and excluding contracted vehicle maintenance costs) were as follows as of December 31, 20102013 (in millions):
| | | |
Year Ending December 31, | |
| 2011 | $ | 29.3 | |
| 2012 | 25.7 | |
| 2013 | 20.5 | |
| 2014 | 15.8 | |
| 2015 | 13.5 | |
| 2016 and Thereafter | 68.4 | |
| | $ | 173.2 | |
|
| | | |
| Year ending December 31, | |
| 2014 | $ | 33.8 |
|
| 2015 | 31.1 |
|
| 2016 | 28.9 |
|
| 2017 | 26.2 |
|
| 2018 | 21.7 |
|
| 2019 and Thereafter | 72.0 |
|
| Total | $ | 213.7 |
|
For 20102013, 20092012 and 20082011, rental expenses for operating and month-to-month leases, including contracted vehicle maintenance costs, were $35.8$45.7 million $34.7, $41.8 million and $33.8$38.7 million, respectively.
Capital Leases
As of December 31, 2013 and 2012, the Company had approximately $12.5 million and $12.3 million, respectively, in capital lease obligations, related to a warehouse facility, refrigeration and other office and warehouse equipment with lease agreements expiring at various dates through 2032, excluding renewal options.
Future minimum lease payments under non-cancelable capital leases were as follows as of December 31, 2013 (in millions):
|
| | | |
| Year ending December 31, | |
| 2014 | $ | 1.7 |
|
| 2015 | 1.7 |
|
| 2016 | 1.6 |
|
| 2017 | 1.2 |
|
| 2018 | 1.2 |
|
| 2019 and thereafter | 9.2 |
|
| Total | 16.6 |
|
| Less: Interest | (4.1 | ) |
| Present value of future minimum lease payments | 12.5 |
|
| Less: current portion | (1.2 | ) |
| Non-current portion | $ | 11.3 |
|
Contingencies
Off-Balance Sheet Arrangements
Letter of Credit Commitments.As of December 31, 20102013, the Company's standby letters of credit issued under the Company's Credit Facility were $21.8 million related primarily to casualty insurance and 2009, we hadtax obligations. The majority of the standby letters of credit mature in one year. However, in the ordinary course of business, the Company will continue to renew or modify the terms of the letters of credit to support business requirements. The letters of credit are contingent liabilities, supported by the Company’s line of credit, and are not reflected on the consolidated balance sheets.
Operating Leases. The majority of the Company’s sales offices, warehouse facilities and trucks are subject to lease agreements, which expire at various dates through 2032, excluding renewal options. These leases generally require the Company
to maintain, insure and pay any related taxes. In most instances, the Company expects the leases that expire will be renewed or replaced in the normal course of its business.
Third Party Distribution Centers. The Company currently manages two regional distribution centers for third party convenience store operators who engage in self-distribution. Under the agreement relating to one of these facilities, the third party has a “put” right under which it may require the Company to acquire the facility. If the put right is exercised, the Company will be required to (1) purchase the inventory in the facilities at cost, (2) purchase the physical assets of the facilities at fully depreciated cost and (3) assume the obligations of the third party as lessees under the leases related to those facilities. While the Company believes the likelihood that this put option will be exercised is remote, if it were exercised, the Company would be required to make aggregate capital expenditures of approximately $1.0$2.0 million based on current estimates. The amount of capital expenditures would vary depending on the timing of any exercise of such put right and $0.8 million, respectively,does not include an estimate of refrigerationthe cost to purchase inventory because such purchases would simply replace other planned inventory purchases and other equipment leased under capital leases, including current maturities.
Contingencieswould not represent an incremental cost. In the event the third party terminates self-distribution, they are required to enter into a five year distribution agreement with the Company to supply their stores.
Litigation
We areThe Company is a plaintiff in a lawsuit against Sonitrol Corporation. The case arose from the December 21, 2002 arson fire at the Denver warehouse in which Sonitrol failed to detect and respond to a four-hour burglary and subsequent arson. In 2010, a jury found in favor of the Company and its insurers. Sonitrol appealed the judgment to the Colorado Appellate Court and on July 19, 2012, the Appellate Court upheld the trial court's ruling on two of the three issues being appealed but set aside the judgment and remanded the case back to the District Court for trial on the sole issue of damages. The Appellate Court's ruling was appealed by Sonitrol to the Colorado Supreme Court on September 21, 2012. On April 29, 2013, the Colorado Supreme Court denied Sonitrol's appeal and the case was returned to the District Court to resolve the sole issue of damages. A trial date has been set for April 7, 2014. The Company is unable to predict when this litigation will be finally resolved and the ultimate outcome. Any monetary recovery from the lawsuit would be recognized only if and when it is finally paid to the Company.
The Company is subject to certain legal proceedings, claims, investigations and administrative proceedings in the ordinary course of ourits business. We makeThe Company records a provision for a liability when it is both probable that the liability has been incurred and the amount of the liability can be reasonably estimated. These provisions, if any, are reviewed at least quarterly and adjusted to reflect the impacts of negotiations, settlements, rulings, advice of legal counsel and other information and events pertaining to a particular case. At December 31, 2010, we were not involved in any material litigation.
9.10. Income Taxes
OurThe Company's income tax provision consists of the following (in millions):
| | | | Year Ended December 31, | Year Ended December 31, |
| | 2010 | | 2009 | | 2008 | 2013 | | 2012 | | 2011 |
| Current: | | | | | | | | | | |
| Federal | $ | 3.8 | | | $ | 7.6 | | | $ | 6.8 | | $ | 18.7 |
| | $ | 16.2 |
| | $ | 13.7 |
|
| State | 0.5 | | | (1.9 | ) | | 0.6 | | 2.4 |
| | 2.5 |
| | 3.6 |
|
| Foreign | — | | | — | | | (0.1 | ) | — |
| | — |
| | — |
|
| Total current tax provision | $ | 4.3 | | | $ | 5.7 | | | $ | 7.3 | | $ | 21.1 |
| | $ | 18.7 |
| | $ | 17.3 |
|
| | | | | | | | | | | |
| Deferred: | | | | | | | | |
| | |
|
| Federal | 5.1 | | | 11.6 | | | (1.6 | ) | $ | 2.8 |
| | $ | 2.5 |
| | $ | 0.3 |
|
| State | 0.9 | | | 2.3 | | | (1.0 | ) | 0.8 |
| | 0.5 |
| | (0.5 | ) |
| Foreign | (0.8 | ) | | (1.1 | ) | | — | | (0.3 | ) | | (0.2 | ) | | (0.1 | ) |
| Total deferred tax (benefit) provision | $ | 5.2 | | | $ | 12.8 | | | $ | (2.6 | ) | $ | 3.3 |
| | $ | 2.8 |
| | $ | (0.3 | ) |
| | | | | | | | | | | |
| Total income tax provision | $ | 9.5 | | | $ | 18.5 | | | $ | 4.7 | | $ | 24.4 |
| | $ | 21.5 |
| | $ | 17.0 |
|
A reconciliation of the statutory federal income tax rate to ourthe Company's effective income tax rate and income tax provision is as follows (in millions):
| | | | Year Ended December 31, | Year Ended December 31, |
| | 2010 | | 2009 | | 2008 | 2013 | | 2012 | | 2011 |
| Federal income tax provision at the statutory rate | $ | 9.5 | | | 35.0 | % | | $ | 23.0 | | | 35.0 | % | | $ | 7.9 | | | 35.0 | % | $ | 23.1 |
| | 35.0 | % | | $ | 19.4 |
| | 35.0 | % | | $ | 15.1 |
| | 35.0 | % |
| Increase (decrease) resulting from: | | | | | | | | | | | | | | | | | | | | | | | | |
| State income taxes, net of federal benefit | 1.2 | | | 4.4 | | | 2.9 | | | 4.4 | | | 1.0 | | | 4.4 | | 2.5 |
| | 3.9 |
| | 2.3 |
| | 4.2 |
| | 2.1 |
| | 4.9 |
|
| Decrease in unrecognized tax benefits (inclusive of | | | | | | | | | | | | | | | | | | | | | | |
| related interest and penalty) | (0.5 | ) | | (1.8 | ) | | (6.0 | ) | | (9.1 | ) | | (2.5 | ) | | (11.1 | ) | (0.4 | ) | | (0.6 | ) | | (0.2 | ) | | (0.4 | ) | | (0.3 | ) | | (0.7 | ) |
| Effect of foreign operations | (0.8 | ) | | (2.9 | ) | | (1.1 | ) | | (1.7 | ) | | (0.1 | ) | | (0.4 | ) | (0.3 | ) | | (0.5 | ) | | (0.2 | ) | | (0.4 | ) | | (0.1 | ) | | (0.2 | ) |
| Change in valuation allowances | — | | | — | | | — | | | — | | | (1.6 | ) | | (7.1 | ) | |
| Other, net | 0.1 | | | 0.2 | | | (0.3 | ) | | (0.5 | ) | | — | | | — | | |
| Non-deductible acquisition costs | | — |
| | — |
| | 0.2 |
| | 0.4 |
| | 0.3 |
| | 0.7 |
|
| Tax credits and other, net | | (0.5 | ) | | (0.8 | ) | | — |
| | — |
| | (0.1 | ) | | (0.3 | ) |
| Income tax provision | $ | 9.5 | | | 34.9 | % | | $ | 18.5 | | | 28.1 | % | | $ | 4.7 | | | 20.8 | % | $ | 24.4 |
| | 37.0 | % | | $ | 21.5 |
| | 38.8 | % | | $ | 17.0 |
| | 39.4 | % |
The Company’s effective tax rate was 37.0% for 2013 compared to 38.8% for 2012. The decrease in effective tax rate for 2013 was due primarily to a higher proportion of earnings from states with lower tax rates, tax credits and adjustments of prior year’s estimates and the impact of non-deductible acquisition-related costs recognized in 2012.
The provision for income taxes included a net benefit of $0.9 million and $0.5 million for 2013 and 2012, respectively, related primarily to the expiration of the statute of limitations for uncertain tax positions and adjustments of prior year's estimates.
Deferred tax assets and liabilities are measured using enacted tax rates expected to apply to taxable income in the years in which those temporary differences are expected to be recovered or settled. The tax effects of significant temporary differences which comprise deferred tax assets and liabilities are as follows (in millions):
| | | | December 31, 2010 | | December 31, 2009 | December 31, 2013 | | December 31, 2012 |
| Deferred tax assets: | | | | | | |
| Employee benefits, including post-retirement benefits | $ | 15.5 | | | $ | 16.8 | | $ | 11.3 |
| | $ | 15.3 |
|
| Trade and other receivables | 3.4 | | | 3.6 | | 3.6 |
| | 4.3 |
|
| Goodwill and intangibles | 1.7 | | | 1.3 | | 2.8 |
| | 2.7 |
|
| Self-insurance reserves | 0.6 | | | 0.6 | | 1.0 |
| | 0.9 |
|
| Minimum tax credits | 2.1 | | | — | | |
| Other | 2.9 | | | 2.2 | | 3.6 |
| | 3.4 |
|
| Subtotal | 26.2 | | | 24.5 | | 22.3 |
| | 26.6 |
|
| Less: valuation allowance | (0.1 | ) | | (0.1 | ) | (0.1 | ) | | (0.1 | ) |
| Net deferred tax assets | $ | 26.1 | | | $ | 24.4 | | $ | 22.2 |
| | $ | 26.5 |
|
| Deferred tax liabilities: | | | | | | |
|
| Inventories | $ | 7.1 | | | $ | 5.1 | | $ | 5.4 |
| | $ | 4.0 |
|
| Property and equipment | 14.8 | | | 10.0 | | 19.1 |
| | 19.5 |
|
| Prepaid and deposits | 0.5 | | | 0.5 | | 0.5 |
| | 0.5 |
|
| Deferred income | 0.3 | | | 0.6 | | 0.2 |
| | 0.2 |
|
| Goodwill and intangibles | | 7.1 |
| | 7.9 |
|
| Other | 2.3 | | | 1.7 | | 1.0 |
| | 1.3 |
|
| Total deferred tax liabilities | $ | 25.0 | | | $ | 17.9 | | $ | 33.3 |
| | $ | 33.4 |
|
| | | | | | | |
| Total net deferred tax assets | $ | 1.1 | | | $ | 6.5 | | |
| Total net deferred tax liabilities | | $ | (11.1 | ) | | $ | (6.9 | ) |
| Net current deferred tax assets | 3.3 | | | 3.0 | | 2.3 |
| | 4.8 |
|
| Net non-current deferred tax (liabilities) assets | $ | (2.2 | ) | | $ | 3.5 | | |
| Net non-current deferred tax liabilities | | $ | (13.4 | ) | | $ | (11.7 | ) |
At each balance sheet date, a valuation allowance was established against the deferred tax assets based on management'smanagement’s assessment of whether it is more likely than not that these deferred tax assets would not be realized. WeThe Company had a valuation
allowance of $0.1$0.1 million at December 31, 20102013 and 20092012 related to foreign tax credits, which will expire at various times between 2014 andto 2016.
At December 31, 2010, theThe total gross amount of unrecognized tax benefits which was included in other tax liabilities related to federal, state and foreign taxes was approximately $1.2$0.6 million and $1.6 million at December 31, 2013 and 2012, respectively, all of which would impact the Company's effective tax rate, if recognized. The expiration of the statute of limitations for certain tax positions in future years and expected settlement of certain tax audit issues could impact the total gross amount of unrecognized tax benefits by
in future years, including $0.2$0.2 million through the year ended December 31, 2011.2014. A reconciliation of the beginning and ending amounts of unrecognized tax benefits for 20102013, 20092012 and 20082011 is as follows (in millions):
| | | | 2010 | | 2009 | | 2008 | 2013 | | 2012 | | 2011 |
| Balance at beginning of year | $ | 1.5 | | | $ | 6.1 | | | $ | 10.2 | | $ | 1.6 |
| | $ | 1.8 |
| | $ | 1.2 |
|
| Increase in unrecognized tax benefits related to acquisition | | 0.2 |
| | — |
| | 0.9 |
|
| Lapse of statute of limitations | (0.4 | ) | | (4.7 | ) | | (3.4 | ) | (0.2 | ) | | (0.2 | ) | | (0.2 | ) |
Settlement(1) | | (1.0 | ) | | — |
| | — |
|
| Other | 0.1 | | | 0.1 | | | (0.7 | ) | — |
| | — |
| | (0.1 | ) |
| Balance at end of year | $ | 1.2 | | | $ | 1.5 | | | $ | 6.1 | | $ | 0.6 |
| | $ | 1.6 |
| | $ | 1.8 |
|
| |
| (1) | Relates to the settlement in 2013 of certain pre-acquisition tax liabilities which were reimbursed by the former owners. |
We fileThe Company files U.S. federal, state and foreign income tax returns in jurisdictions with varying statutes of limitations. In 2011, the IRS initiated an examination of the Company’s federal tax returns for 2009 and 2010. The 2007examination was finalized in the first quarter of 2013 and resulted in no adjustments. The 2010 to
2010 2013 tax years remain subject to examination by federal and state tax authorities. The 2006As of December 31, 2013, the 2009 tax year iswas still open for certain state tax authorities. The 20032006 to 20102013 tax years remain subject to examination by the tax authorities in certain foreign jurisdictions.Canada.
We recognizeThe Company recognizes interest and penalties on income taxes in income tax expense. AtFor the years ended December 31, 20102013, we have2012 and 2011 the Company recognized a net benefit in its provision for income taxes of $0.1 million related primarily to the recovery of interest associated with the expiration of statute of limitations for certain unrecognized tax positions. As of December 31, 2013, the Company had a liability of $0.7$0.5 million for estimated interest and penalties related to unrecognized tax benefits, consisting of $0.4$0.2 million for interest and $0.3$0.3 million of penalties.
10.Earnings Per Share
The following table sets forth the computation of basic and diluted net earnings per share (in millions, except per share amounts):
| | | | | | | | | | | | | | | | | | | | | | | | | | | | | | | | |
| | Year Ended December 31, |
| | 2010 | | 2009 | | 2008 |
| | Net Income | | Weighted-Average Shares Outstanding | | Net Income Per Common Share | | Net Income | | Weighted-Average Shares Outstanding | | Net Income Per Common Share | | Net Income | | Weighted-Average Shares Outstanding | | Net Income Per Common Share |
| Basic EPS | $ | 17.7 | | | 10.8 | | | $ | 1.64 | | | $ | 47.3 | | | 10.5 | | | $ | 4.53 | | | $ | 17.9 | | | 10.5 | | | $ | 1.71 | |
| Effect of dilutive | | | | | | | | | | | | | | | | | |
| common share | | | | | | | | | | | | | | | | | |
| equivalents: | | | | | | | | | | | | | | | | | |
| Unvested restricted | | | | | | | | | | | | | | | | | |
| stock units | | | 0.1 | | | (0.01 | ) | | | | — | | | (0.02 | ) | | | | — | | | — | |
| Stock options | | | 0.2 | | | (0.03 | ) | | | | 0.2 | | | (0.07 | ) | | | | 0.2 | | | (0.03 | ) |
| Warrants | | | 0.3 | | | (0.05 | ) | | | | 0.2 | | | (0.08 | ) | | | | 0.2 | | | (0.04 | ) |
| Performance shares | | | — | | | — | | | | | — | | | (0.01 | ) | | | | — | | | — | |
| Diluted EPS | $ | 17.7 | | | 11.4 | | | $ | 1.55 | | | $ | 47.3 | | | 10.9 | | | $ | 4.35 | | | $ | 17.9 | | | 10.9 | | | $ | 1.64 | |
Note: Basic and diluted earnings per share are calculated based on unrounded actual amounts.
Certain options and warrants to purchase common stock were outstanding but were not included in the computation of diluted earnings per share because the effect would be anti-dilutive. For 2010, 2009 andfor penalties, compared to a liability of 20080.7 million there were 104,020, 259,777 and 249,453 anti-dilutive options, respectively. There were no anti-dilutive warrants inas of 2010, 2009 or 2008December 31, 2012.
In 2004, we issued an aggregate of 9,800,000 shares of our common stock and warrants to purchase an aggregate of 990,616 shares of our common stock to the Class 6(B) creditors of Fleming (our former parent company) pursuant to its plan of reorganization. We refer to the warrants we issued to the Class 6(B) creditors as the Class 6(B) warrants. We received no cash consideration at the time we issued the Class 6(B) warrants. The Class 6(B) warrants have an exercise price of $20.93 per share. The shares of common stock and the Class 6(B) warrants were issued pursuant to an exemption from registration under Section 1145(a) of the Bankruptcy Code. We also issued warrants to purchase an aggregate of 247,654 shares of our common stock to the holders of our Tranche B Notes, which we refer to as Tranche B warrants. The Tranche B warrants have an exercise price of $15.50 per share. Both the Class 6(B) and Tranche B warrants may be exercised at the election of the holder at any time prior to August 23, 2011, at which time any outstanding warrants will be net issued.
The number of Class 6(B) warrants outstanding was 705,894 at the end of 2010, 952,806 at the end of 2009 and 968,628 at the end of 2008. The number of Tranche B warrants outstanding was 126,716 at the end of 2010, 2009 and 2008. The Class 6(B) warrants and the Tranche B warrants have been classified as permanent equity. We use the treasury stock method to determine the shares of common stock due to conversion of outstanding warrants as of December 31, 2010.
11.Stock-Based Compensation Plans
Total stock-based compensation cost recognized in the consolidated statements of operations for 2010, 2009 and 2008 was $4.8 million, $5.1 million and $3.9 million, respectively. Total unrecognized compensation cost related to non-vested share-based compensation arrangements was $4.2 million at December 31, 2010. This balance is expected to be recognized over a weighted-average period of 1.7 years.
Employee stock-based compensation expense recognized in 2010 was calculated based on awards ultimately expected to vest and has been reduced for estimated forfeitures. Our forfeiture experience since inception of our plans has been approximately 4% of the total grants. The historical rate of forfeiture is a component of the basis for predicting the future rate of forfeitures, which are also dependent on the remaining service period related to grants and on the limited number of approximately 82 plan participants that have been awarded grants since the inception of our plans. We issue new shares to satisfy stock option exercises.
Historically, we have maintained five stock-based compensation plans: the 2004 Long-Term Incentive Plan, the 2004 Directors' Equity Incentive Plan, the 2005 Long-Term Incentive Plan, the 2005 Directors' Equity Incentive Plan and the 2007 Long-Term Incentive Plan. During 2010, the 2010 Long-Term Incentive Plan was established.All shares available for issuance under our historical five plans have been transferred to the 2010 Long-Term Incentive Plan, from which all future awards will be made.
| | | | | | | | | |
| | Number of securities to be issued upon exercise of outstanding options, warrants and rights | | Weighted-average exercise price of outstanding options, warrants and rights | | Number of securities remaining available for future issuance under equity compensation plans (excluding securities reflected in column 1) |
| 2004 Long-Term Incentive Plan | | | | | |
| -Restricted stock units and options | 219,476 | | | $ | 20.32 | | | — | |
| 2005 Long-Term Incentive Plan | | | | | |
| -Restricted stock units | 15,772 | | | $ | 0.01 | | | — | |
| 2004 Directors' Equity Incentive Plan | 30,000 | | | $ | 15.50 | | | — | |
| 2005 Directors' Equity Incentive Plan | 15,000 | | | $ | 27.03 | | | — | |
2007 Long-Term Incentive Plan(1) | 559,186 | | | $ | 13.96 | | | — | |
2010 Long-Term Incentive Plan (1) | — | | | $ | — | | | 660,952 | |
(1) Includes non-qualified stock options, restricted stock units and performance shares.
2004 Long-Term Incentive Plan
The 2004 Long-Term Incentive Plan (“2004 LTIP”) provides for issuance of up to 1,314,444 shares of non-qualified stock options and restricted stock units to officers and key employees. For option grants, the exercise price equals the fair value of the Company's common stock on the date of grant. For restricted stock grants, the exercise price is fixed at $0.01. Options and restricted stock units vest over a three-year period; one-third of the options and restricted stock units cliff-vest on the first anniversary of the vesting commencement date and the remaining options and restricted stock units vest in equal monthly and quarterly installments, respectively, over the two-year period following the first anniversary of the vesting commencement date. Stock options expire seven years after the date of grant. Restricted stock units do not have an expiration date. Stock-based compensation is being recognized ratably over the three-year vesting period of the stock options or restricted stock units using the straight-line method. No further grants will be made under the 2004 LTIP.
2004 Directors' Equity Incentive Plan
The 2004 Directors' Equity Incentive Plan (“2004 Directors' Plan”) consists of 30,000 non-qualified stock options that have been granted to non-employee Directors of the Company. This plan has terms and vesting requirements similar to those of the 2004 LTIP, except options vest quarterly after the first anniversary of the vesting commencement date. No stock options are
available for future issuance.
2005 Long-Term Incentive Plan
The 2005 Long-Term Incentive Plan (“2005 LTIP”) provides for the granting of restricted stock units to officers and key employees. The majority of restricted stock units issued under the 2005 LTIP generally vest over three years: one-third of the restricted stock units cliff vest on the first anniversary of the vesting commencement date and the remaining restricted stock units vest in equal quarterly installments over the two-year period following the first anniversary of the vesting commencement date. Restricted stock units do not have an expiration date. No further grants will be made under the 2005 LTIP.
2005 Directors' Equity Incentive Plan
The 2005 Directors' Equity Incentive Plan (“2005 Directors' Plan”) consists of 15,000 non-qualified stock options that have been granted to non-employee Directors of the Company. The terms of the 2005 Directors' Plan are similar to the 2004 Directors' Plan. No stock options are available for future issuance.
2007 Long-Term Incentive Plan
The 2007 Long-Term Incentive Plan (“2007 LTIP”) provides for the granting of stock options, restricted stock units and performance share awards of up to 1,202,350 shares of our common stock (including treasury shares) to officers, employees and non-employee directors. The majority of awards issued under the 2007 LTIP generally vest over three years: one-third of the restricted stock units cliff vest on the first anniversary of the vesting commencement date and the remaining restricted stock units vest in equal quarterly installments over the two-year period following the first anniversary of the vesting commencement date. Stock options expire seven years after the date of grant. Restricted stock units do not have an expiration date. No further grants will be made under the 2007 LTIP.
2010 Long-Term Incentive Plan
The 2010 Long-Term Incentive Plan (“2010 LTIP”) provides for the granting of awards of up to 1,115,952 shares of our common stock to officers, employees and non-employee directors. The 2010 LTIP became effective on April 1, 2010. Awards may be made under the 2010 LTIP through March 31, 2020, which is 10 years from the effective date of the 2010 LTIP. The available awards under the 2010 LTIP include: stock options, stock appreciation rights, restricted stock units, other stock-based awards and performance shares. The annual award limits of the 2010 LTIP provide for awards which are limited in any one plan year to 100,000 shares to any one participant. There were no issuances from the 2010 LTIP as of December 31, 2010.
Assumptions Used for Fair Value
We use the Black-Scholes option-pricing model to determine the grant date fair value for each stock option. Option-pricing models require the input of assumptions that are estimated at the date of grant.
The following table presents the assumptions used in the Black-Scholes option-pricing model to value the stock options granted during 2008 and 2009. There were no stock options granted in 2010. Restricted stock units and performance shares were valued at the fair market value of our stock at date of grant.
| | | | | | | | | | | |
| | Year Ended December 31, |
| | 2010 | | 2009 | | 2008 |
| Expected life (years) | — | | | 4.0 | | | 4.0 | |
| Risk-free interest rate | — | | | 1.12 | % | | 2.55 | % |
| Volatility | — | | | 44 | % | | 35 | % |
| Dividend yield | — | | | — | | | — | |
| Weighted-average fair value per share of grants: | | | | | | | |
| Stock options | $ | — | | | $ | 7.14 | | | $ | 8.45 | |
| Restricted stock units | $ | 31.57 | | | $ | 19.18 | | | $ | 25.80 | |
| Performance shares | $ | — | | | $ | 19.18 | | | $ | 25.80 | |
The expected volatility of our stock is based on the implied volatilities of publicly traded options to buy our stock. The risk-free rate for periods within the contractual life of the option is based on the U.S. Treasury yield curve in effect at the time of grant. The expected term of options granted represents the period of time we estimate that options granted are expected to be outstanding.
The following table summarizes the activity for all stock options, restricted stock units and performance shares under all of the plans for the year ended December 31, 2010:
| | | | | | | | | | | | | | | | | | | | | | | | | | | | | | | | | | | | | | | | | | | | |
| | | | | December 31, 2009 | | Activity during 2010 | | December 31, 2010 |
| | | | | Outstanding | | Granted | | Exercised | | Canceled/Reclass | | Outstanding | | Exercisable |
| Plans | | Securities | | Number | | Price | | Number | | Price | | Number | | Price | | Number | | Price | | Number | | Price | | Number | | Price |
| 2004 LTIP | | RSUs | | 11,929 | | | $ | 0.01 | | | — | | | $ | — | | | (10,708 | ) | | $ | 0.01 | | | — | | | $ | — | | | 1,221 | | | $ | 0.01 | | | 1,221 | | | $ | 0.01 | |
| | | Options | | 480,267 | | | 17.81 | | | — | | | — | | | (261,012 | ) | | 15.54 | | | (1,000 | ) | | 36.03 | | | 218,255 | | | 20.44 | | | 217,404 | | | 20.44 | |
| 2004 Directors’ Plan | | Options | | 30,000 | | | 15.50 | | | — | | | — | | | — | | | — | | | — | | | — | | | 30,000 | | | 15.50 | | | 30,000 | | | 15.50 | |
| 2005 LTIP | | RSUs | | 22,111 | | | 0.01 | | | — | | | — | | | (6,339 | ) | | 0.01 | | | — | | | — | | | 15,772 | | | 0.01 | | | 15,727 | | | 0.01 | |
| 2005 Directors’ Plan | | Options | | 15,000 | | | 27.03 | | | — | | | — | | | — | | | — | | | — | | | — | | | 15,000 | | | 27.03 | | | 15,000 | | | 27.03 | |
2007 LTIP (1) | | RSUs | | 192,164 | | | 0.01 | | | 148,586 | | | 0.01 | | | (119,965 | ) | | 0.01 | | | (2,836 | ) | | 0.01 | | | 217,949 | | | 0.01 | | | 30,421 | | | 0.01 | |
| | | Options | | 332,905 | | | 25.01 | | | — | | | — | | | (21,057 | ) | | 21.30 | | | (3,065 | ) | | 24.10 | | | 308,783 | | | 25.28 | | | 266,113 | | | 26.25 | |
| | | Perf. shares | | 80,665 | | | 0.01 | | | — | | | — | | | (48,211 | ) | | 0.01 | | | — | | | — | | | 32,454 | | | 0.01 | | | 8,456 | | | 0.01 | |
| Total | | | | 1,165,041 | | | | | 148,586 | | | | | (467,292 | ) | | | | (6,901 | ) | | | | 839,434 | | | | | 584,342 | | | |
Note: Price is weighted-average price per share.
| |
(1) 11. | The 2007 LTIP is for officers, employees and non-employee directors.Employee Benefit Plans |
The aggregate intrinsic value of stock options exercised in 2010, 2009 and 2008 was approximately $4.7 million, $1.4 million and $2.1 million, respectively. The aggregate intrinsic value of restricted stock units exercised in 2010, 2009 and 2008 was approximately $4.2 million, $2.9 million and $3.1 million, respectively. The aggregate intrinsic value of performance shares exercised in 2010, 2009 and 2008 was approximately $1.5 million, $0.4 million and less than $0.1 million, respectively.
The following table summarizes stock options, restricted stock units and performance shares that have vested and are expected to vest as of December 31, 2010:
| | | | | | | | | | | | | | | | | | | | | | |
| | | | | December 31, 2010 |
| | | | | Outstanding | | Weighted-Average Remaining Contractual Term (years) | | Aggregate Intrinsic Value(1) (in thousands) |
| Plans | | Securities | | Vested | | Expected to vest(2) | | Vested | | Expected to vest(2) | | Vested | | Expected to vest(2) |
| 2004 LTIP | | RSUs | | 1,221 | | | — | | | — | | | — | | | $ | 43 | | | $ | — | |
| | | Options | | 217,404 | | | 820 | | | 1.3 | | | 5.1 | | | 3,315 | | | 13 | |
| 2004 Directors’ Plan | | Options | | 30,000 | | | — | | | 0.6 | | | — | | | 603 | | | — | |
| 2005 LTIP | | RSUs | | 15,727 | | | 43 | | | — | | | — | | | 560 | | | 2 | |
| 2005 Directors’ Plan | | Options | | 15,000 | | | — | | | 1.6 | | | — | | | 128 | | | — | |
| 2007 LTIP | | RSUs | | 30,421 | | | 180,702 | | | — | | | — | | | 1,082 | | | 6,429 | |
| | | Options | | 266,113 | | | 41,117 | | | 4.3 | | | 5.1 | | | 2,569 | | | 674 | |
| | | Perf. shares | | 8,456 | | | 23,124 | | | — | | | — | | | 301 | | | 823 | |
| Total | | | | 584,342 | | | 245,806 | | | | | | | $ | 8,601 | | | $ | 7,941 | |
(1) Aggregate intrinsic value is calculated based upon the difference between the exercise prices of options or restricted stock units and our closing common stock price on December 31, 2010 of $35.59, multiplied by the number of instruments that are vested or expected to vest. Options and restricted stock units having exercise prices greater than the closing stock price noted above are excluded from this calculation.
(2) Options and restricted stock units that are expected to vest are net of estimated future forfeitures.
The aggregate fair value of options vested in 2010, 2009 and 2008 was approximately $5.5 million, $4.3 million and $1.6 million, respectively. The aggregate fair value of restricted stock units vested in 2010, 2009 and 2008 was approximately $4.7 million, $3.6 million and $1.4 million, respectively. The aggregate fair value of performance shares vested in 2010, 2009 and 2008 was approximately $2.0 million, $0.6 million and $0.1 million, respectively.
12.Employee Benefit Plans
Pension Plans
WeThe Company sponsored a qualified defined-benefit pension plan and a post-retirement benefit consisting of a Core-Mark pension plan, (collectively, "the Pension Plans") for employees hired beforewhich was frozen on September 30, 1986. In addition, the Company inherited three plans from Fleming, the Company’s former parent company. The Fleming plans were frozen on or prior to August 20, 1998. These plans are collectively referred as the “Pension Plans”. There have been no new entrants to the Pension Plans after those benefit plans were frozen on September 30, 1989.frozen.
OurThe Company’s defined-benefit pension plan is subject to the Employee Retirement Income Security Act of 1974 (“ERISA”). Under ERISA, the Pension Benefit Guaranty Corporation (“PBGC”) has the authority to terminate an underfunded pension plan under
limited circumstances. In the event ourthe Company’s pension plan is terminated for any reason while it is underfunded, we willthe Company would incur a liability to the PBGC that may be equal to the entire amount of the underfunding. OurThe Company’s post-retirement benefit plan is not subject to ERISA. As a result, the post-retirement benefit plan is not required to be pre-funded, and, accordingly, has no plan assets.
Pension costs and other post-retirement benefit costs charged to operations are estimated on the basis of annual valuations with the assistance of an independent actuary. Adjustments arising from plan amendments, changes in assumptions and experience gains and losses, are amortized over the average future life expectancy of inactive participants for the defined-benefit plan, and expectedthe average remaining future service life of active participantsemployees expected to receive benefits for the post-retirement benefit plan.
The following tables provide a reconciliation of the changes in the Pension Plans' benefit obligation and fair value of assets, over the two-year period endingfunded status of the plans and the amounts recognized in the balance sheets and accumulated other comprehensive loss as of December 31, 2010 and a statement of the funded status for the year ended December 31, 20102013 and 20092012 (in millions):
| | | | | | | | | | | | | | | | |
| | Pension Benefits | | | Other Post-retirement Benefits |
| | December 31, 2010 | | December 31, 2009 | | | December 31, 2010 | | December 31, 2009 |
| Change in Benefit Obligation: | | | | | | | | |
| Obligation at beginning of period | $ | 35.2 | | | $ | 34.9 | | | | $ | 4.4 | | | $ | 6.6 | |
| Interest cost | 1.9 | | | 2.0 | | | | 0.2 | | | 0.5 | |
| Actuarial loss (gain) | 0.3 | | | 1.5 | | | | (0.2 | ) | | 1.2 | |
| Benefit payments | (2.3 | ) | | (3.2 | ) | | | (0.3 | ) | | (0.1 | ) |
| Change in plan provision | 0.3 | | | — | | | | — | | | (0.4 | ) |
| Curtailment gain | — | | | — | | | | — | | | (3.4 | ) |
| Benefit obligation at end of period | $ | 35.4 | | | $ | 35.2 | | | | $ | 4.1 | | | $ | 4.4 | |
| | | | | | | | | |
| Change in Pension Plan Assets: | | | | | | | | |
| Fair value of pension plan assets at beginning of period | $ | 23.6 | | | $ | 22.1 | | | | $ | — | | | $ | — | |
| Actual return on plan assets | 2.2 | | | 4.5 | | | | — | | | — | |
| Employer contributions | 3.4 | | | 0.2 | | | | 0.3 | | | 0.1 | |
| Benefit payments | (2.3 | ) | | (3.2 | ) | | | (0.3 | ) | | (0.1 | ) |
| Fair value of pension plan assets at end of period | $ | 26.9 | | | $ | 23.6 | | | | $ | — | | | $ | — | |
| | | | | | | | | |
| Funded Status: | | | | | | | | |
| Funded status | $ | (8.5 | ) | | $ | (11.6 | ) | | | $ | (4.1 | ) | | $ | (4.4 | ) |
|
| | | | | | | | | | | | | | | | |
| | Pension Benefits | | | Other Post-retirement Benefits |
| | December 31, 2013 | | December 31, 2012 | | | December 31, 2013 | | December 31, 2012 |
| Change in Benefit Obligation: | | | | | | | | |
| Obligation at beginning of year | $ | 43.0 |
| | $ | 38.0 |
| | | $ | 5.1 |
| | $ | 4.6 |
|
| Interest cost | 1.6 |
| | 1.8 |
| | | 0.2 |
| | 0.2 |
|
| Actuarial (gain) loss | (1.7 | ) | | 5.6 |
| | | (0.8 | ) | | 0.4 |
|
| Benefit payments | (2.8 | ) | | (2.4 | ) | | | (0.2 | ) | | (0.1 | ) |
| Curtailment gain | — |
| | — |
| | | (0.9 | ) | | — |
|
| Benefit obligation at end of year | $ | 40.1 |
| | $ | 43.0 |
| | | $ | 3.4 |
| | $ | 5.1 |
|
| | | | |
| | | | | |
|
| Change in Plan Assets: | | | |
| | | | | |
|
| Fair value of plan assets at beginning of year | $ | 33.0 |
| | $ | 28.7 |
| | | $ | — |
| | $ | — |
|
| Actual return on plan assets | 3.3 |
| | 3.0 |
| | | — |
| | — |
|
| Employer contributions | 4.5 |
| | 3.7 |
| | | 0.2 |
| | 0.1 |
|
| Benefit payments | (2.8 | ) | | (2.4 | ) | | | (0.2 | ) | | (0.1 | ) |
| Fair value of plan assets at end of year | $ | 38.0 |
| | $ | 33.0 |
| | | $ | — |
| | $ | — |
|
| | | | |
| | | | | |
|
| | | | |
| | | | | |
|
| Funded status at end of year | $ | (2.1 | ) | | $ | (10.0 | ) | | | $ | (3.4 | ) | | $ | (5.1 | ) |
| | | | | | | | | |
| Amounts recognized in the balance sheet consist of: | | | | | | | | |
| Current liabilities | $ | — |
| | $ | — |
| | | $ | (0.3 | ) | | $ | (0.3 | ) |
| Non-current liabilities | (2.1 | ) | | (10.0 | ) | | | (3.1 | ) | | (4.8 | ) |
| Total liability | $ | (2.1 | ) | | $ | (10.0 | ) | | | $ | (3.4 | ) | | $ | (5.1 | ) |
| | | | | | | | | |
| Amounts recognized in accumulated other comprehensive loss consist of: | | | | | | | | |
| Prior service credit | $ | — |
| | $ | — |
| | | $ | — |
| | $ | (0.1 | ) |
| Net actuarial loss (gain) | 13.1 |
| | 16.5 |
| | | (0.1 | ) | | 0.7 |
|
| Total | $ | 13.1 |
| | $ | 16.5 |
| | | $ | (0.1 | ) | | $ | 0.6 |
|
| | | | | | | | | |
| Additional Information: | | | | | | | | |
| Accumulated benefit obligation | $ | 40.1 |
| | $ | 43.0 |
| | | | | |
During 20102013, the Company made contributions of $3.4 million to the defined-benefit pension plan, which was the primary reason for the decrease in the underfunded status of the defined-benefit pension plan from 2009decreased$7.9 million to 2010. In addition, the actual return on our pension plan assets was $2.2$2.1 million in 2010, which exceeded the $1.7 million expected return. In 2009, the expected return on pension plan assets was a gain of $1.5 million compared to a realized gain of $4.5 million due primarily to an improvementactuarial gain of $1.7 million in 2013 attributable primarily to an increase indiscount rates, $4.5 million of Company contributions, and higher than expected returns on the financial markets following the economic recession in 2008.Company's pension plan assets.
In addition, during 20092013, the Company implemented changes to medical benefits in the post-retirement benefit plan. The most significant change to the plan was the removal of the Company'sCompany’s subsidy of medical premiums for future retirees, which curtailed future benefits for those participants. As a result of this change, the future obligations related to the plan were reduced by $3.4 million and weThe Company recorded a net curtailment gain of $0.8$0.9 million in 2009.
The following table provides information for Pension Plans with an accumulated benefit obligation2013 due to the reduction in excess offuture obligations under the plan assets (in millions):resulting from the change in benefits.
| | | | | | | |
| | December 31, 2010 | | December 31, 2009 |
| Projected benefit obligation | $ | 35.4 | | | $ | 35.2 | |
| Accumulated benefit obligation | 35.4 | | | 35.2 | |
| Fair value of pension plan assets | 26.9 | | | 23.6 | |
The following table provides components of the net periodic pensionbenefit cost and other changes in plan assets and benefit obligations recognized in other comprehensive income (in millions):
| | | | | | | | | | | |
| | 2010 | | 2009 | | 2008 |
| Interest cost | $ | 1.9 | | | $ | 2.0 | | | $ | 2.2 | |
| Expected return on plan assets | (1.7 | ) | | (1.5 | ) | | (2.3 | ) |
| Amortization of net actuarial loss | 0.2 | | | 0.3 | | | — | |
| Net periodic benefit cost | $ | 0.4 | | | $ | 0.8 | | | $ | (0.1 | ) |
|
| | | | | | | | | | | | | | | | | | | | | | | | |
| | Pension Benefits | | | Other Post-retirement Benefits |
| | 2013 | | 2012 | | 2011 | | | 2013 | | 2012 | | 2011 |
| Net Periodic Benefit Cost: | | | | | | | | | | | | |
| Interest cost | $ | 1.6 |
| | $ | 1.8 |
| | $ | 1.8 |
| | | $ | 0.2 |
| | $ | 0.2 |
| | $ | 0.2 |
|
| Expected return on plan assets | (2.3 | ) | | (2.1 | ) | | (1.9 | ) | | | — |
| | — |
| | — |
|
| Amortization of prior service credit | — |
| | — |
| | — |
| | | (0.1 | ) | | (0.1 | ) | | (0.1 | ) |
| Amortization of net actuarial loss | 0.6 |
| | 0.4 |
| | 0.3 |
| | | — |
| | — |
| | — |
|
| Curtailment gain | — |
| | — |
| | — |
| | | (0.9 | ) | | — |
| | — |
|
| Net periodic benefit (income) cost | $ | (0.1 | ) | | $ | 0.1 |
| | $ | 0.2 |
| | | $ | (0.8 | ) | | $ | 0.1 |
| | $ | 0.1 |
|
| | | | | | | | | | | | | |
| Other Changes in Plan Assets and Benefit Obligations Recognized in Other Comprehensive Income: | | | | | | | | | | | | |
| Net actuarial (gain)/loss | $ | (2.8 | ) | | $ | 4.7 |
| | $ | 4.1 |
| | | $ | (0.8 | ) | | $ | 0.4 |
| | $ | 0.5 |
|
| Amortization of prior service cost | — |
| | — |
| | — |
| | | 0.1 |
| | 0.1 |
| | 0.1 |
|
| Amortization of actuarial gain | (0.6 | ) | | (0.4 | ) | | (0.3 | ) | | | — |
| | — |
| | — |
|
| Total recognized in other comprehensive | | | | | | | | | | | | |
| income | $ | (3.4 | ) | | $ | 4.3 |
| | $ | 3.8 |
| | | $ | (0.7 | ) | | $ | 0.5 |
| | $ | 0.6 |
|
| | | | | | | | | | | | | |
| Total recognized in net periodic benefit cost and | | | | | | | | | | | | |
| other comprehensive income | $ | (3.5 | ) | | $ | 4.4 |
| | $ | 4.0 |
| | | $ | (1.5 | ) | | $ | 0.6 |
| | $ | 0.7 |
|
The following table provides components ofFor both the net periodicpension and other benefitpost-retirement benefits plans, prior service cost (in millions):
| | | | | | | | | | | |
| | 2010 | | 2009 | | 2008 |
| Interest cost | $ | 0.2 | | | $ | 0.5 | | | $ | 0.4 | |
| Amortization of net actuarial loss | — | | | 0.3 | | | 0.1 | |
| Amortization of prior service cost | (0.1 | ) | | — | | | — | |
| Curtailment gain, net | — | | | (0.8 | ) | | — | |
| Net periodic other benefit cost | $ | 0.1 | | | $ | — | | | $ | 0.5 | |
The prior-service costs, which include interest, are amortized on a straight-line basis over the average remaining future life expectancyservice of inactive participants. Gainsactive employees expected to receive benefits under the plan. For the pension benefits plan, gains and losses in excess of 10% of the greater of the benefit obligation and market-related value of assets are amortized over the average future life expectancy of inactive participants. OurFor the post-retirement benefit plan, gains and losses in excess of 10% of the greater of the benefit obligation and market-related value of assets are amortized over the average remaining future service of active employees expected to receive benefits under the plan. The Company uses its fiscal year-end date as the measurement date was on December 31, 2010. Wefor the plans. The Company estimated that average future life expectancy is 23.322.1 years for the pension benefitbenefits plan and remaining service life of active participants is 6.06.8 years for the post-retirement benefitbenefits plan.
Assumptions Used:
The following table shows the weighted-average assumptions used in the measurement of:
| | | | | | | | | | | | | | Pension Benefits | | | Other Post-retirement Benefits |
| | Pension Benefits | | | Other Post-retirement Benefits | December 31, | | | December 31, |
| | December 31, 2010 | | December 31, 2009 | | | December 31, 2010 | | December 31, 2009 | 2013 | | 2012 | | 2011 | | | 2013 | | 2012 | | 2011 |
| Benefit Obligations: | | | | | | | | | | | | | | | | | | | | |
| Discount rate | 5.04 | % | | 5.58 | % | | | 5.08 | % | | 5.88 | % | 4.60 | % | | 3.80 | % | | 4.72 | % | | | 4.60 | % | | 3.85 | % | | 4.74 | % |
| Expected return on assets | | 6.55 | % | | 7.00 | % | | 7.25 | % | | | N/A |
| | N/A |
| | N/A |
|
| | | | | | | | | | | | | | | | | | | | | |
| Net Periodic Benefit Costs: | | | | | | | | | | | | | | | | | | | | |
| Discount rate | 5.73 | % | | 6.26 | % | | | 5.88 | % | | 6.07 | % | 3.80 | % | | 4.72 | % | | 5.04 | % | | | 3.85 | % | | 4.74 | % | | 5.08 | % |
| Expected return on assets | 7.35 | % | | 7.35 | % | | | — | % | | — | % | 7.00 | % | | 7.25 | % | | 7.35 | % | | | N/A |
| | N/A |
| | N/A |
|
The weighted-average discount rates used to determine the Pension Plan'sPlans' obligations and expenses are based on a yield curve methodology which matches the expected benefits at each duration to the available high quality yields at that duration and calculating an equivalent yield. At December 31, 2010, ourThe increase in discount rates were 5.04% and 5.08% relatedrate in 2013 compared to our pension and post-retirement plan benefit obligations, respectively, compared with 5.58% and 5.88%, respectively, at December 31, 2009.2012 was due to higher bond yields. The decrease in the discount rate for 2010expected long-term return on assets assumption in 2013 compared to 2012 was due primarily to lower bond yields.a change in the investment
composition of the plan assets to a higher percentage of bonds versus equity investments, in order to reduce risk. The Company uses a building block approach in determining the overall expected long-termlong term return on assets. Under this approach, a weighted-average expected rate of return is developed based on historical and expected future returns for each major asset class and the proportion of assets of the class held by the Pension Plans. WeThe Company then reviewreviews the results and may make adjustments in subsequent years to reflect expectations of future rates ofthe expected additional return that may differ from those experienced in the past.gained through active investment management.
Assumed health care cost trend rates have an effect on the amounts reported for the post-retirement health care plans. The health care cost trend rates assumed for the end of year benefit obligation for the post-retirement benefit plans are as follows:
| | | | | |
| | December 31, 2010 | | December 31, 2009 |
| Assumed current trend rate for next year | 6.50 | % | | 7.00 | % |
| Ultimate year trend rate | 5.00 | % | | 5.00 | % |
| Year that ultimate trend rate is reached | 2014 | | | 2011 | |
|
| | | |
| | December 31, 2013 | | December 31, 2012 |
| Assumed current trend rate for next year for participants under 65 | 7.50% | | 7.00% |
| Assumed current trend rate for next year for participants 65 and over | 7.00% | | 6.00% |
| Ultimate year trend rate | 5.00% | | 5.00% |
| Year that ultimate trend rate is reached for participants under 65 | 2024 | | 2017 |
| Year that ultimate trend rate is reached for participants 65 and over | 2022 | | 2017 |
A 1%one percent point change in assumed health care cost trend rates would have the following effects (in millions):
|
| | | | | | | |
| | 1% Increase | | 1% Decrease |
| Effect on total of service and interest cost components of net periodic post-retirement | | | |
| health care benefit cost | $ | — |
| | $ | — |
|
| Effect on the health care component of the accumulated post-retirement benefit | | | |
| obligation | $ | 0.4 |
| | $ | (0.3 | ) |
Plan Assets:
The Company's overallCompany has adopted a dynamic investment strategy is to produce a totalreduce the pension plan's investment risk as the funded status improves. The strategy will reduce the allocation to return which will satisfy future annual cash benefit paymentsseeking assets (primarily equities) and increase the allocation to participants, while minimizing future contributions fromliability hedging assets (primarily fixed income) over time with the Company. Additionally, our asset allocation strategy is intended to diversify plan assets to minimize non-systematic riskintention of reducing the volatility of the funded status and provide reasonable assurance that no single security or class of security will have a disproportionate impactpension costs. Based on the Pension Plans.
Our investment guidelines allocation rangesplan's funded status, the Company's current target allocations are: 0-20%0-5% cash, 50-70% 28-34% equity and 30-50% 66-72% fixed income. OurThe Company’s investment guidelinestarget also setsets forth the requirement for diversification within asset class, types and classes for investments prohibited and permitted, specific indices to be used for benchmark in investment decisions and criteria for individual security.securities.
The fair value measurements of the Pension Plans' assets by asset category at December 31, 20102013 are as follows (in millions):
| | | | | | | | | | | | | | | |
| Asset Category | Total | | Quoted Prices in Active Markets for Identical Assets (Level 1) | | Significant Observable Inputs (Level 2) | | Significant Unobservable Inputs (Level 3) |
| Cash | $ | 3.1 | | | $ | 3.1 | | | $ | — | | | $ | — | |
| Equity securities | | | | | | | |
| Mutual funds | 6.5 | | | 6.5 | | | — | | | — | |
| Other equity securities, primarily U.S. companies | 8.5 | | | 8.5 | | | — | | | — | |
| Government securities | 2.4 | | | 2.4 | | | — | | | — | |
| Corporate and muni bonds | | | | | | | |
| Other bonds | 2.5 | | | 2.5 | | | — | | | — | |
| Mutual funds | 0.5 | | | 0.5 | | | — | | | — | |
| Group annuity contract | 3.4 | | | — | | | 3.4 | | | — | |
| Total | $ | 26.9 | | | $ | 23.5 | | | $ | 3.4 | | | $ | — | |
|
| | | | | | | | | | | | | | | |
| Asset Category | Total | | Quoted Prices in Active Markets for Identical Assets (Level 1) | | Significant Observable Inputs (Level 2) | | Significant Unobservable Inputs (Level 3) |
| Cash and cash equivalents | $ | 2.5 |
| | $ | 2.5 |
| | $ | — |
| | $ | — |
|
| Group trust | 31.8 |
| | — |
| | 31.8 |
| | — |
|
| Group annuity contract | 3.7 |
| | — |
| | 3.7 |
| | — |
|
| Total | $ | 38.0 |
| | $ | 2.5 |
| | $ | 35.5 |
| | $ | — |
|
DebtDuring 2013, the Company reinvested the majority of the plan assets in an investment instrument (“Group Trust”), comprised of a diversified portfolio of investments across various asset classes, including U.S. and equity securities are recordedforeign equities and U.S. high yield and investment grade corporate bonds. The Group Trust is valued at their fair marketthe net asset value each year-end as determinedprovided by quoted closing market pricesthe administrator of the fund. The net asset value is based on national securities exchanges or other markets, as applicable. the value of the underlying assets owned by the fund, minus its liabilities, divided by the number of units outstanding.
The group annuity consists primarily of investment grade fixed income securities. The participating annuity contract is valued based on discounted cash flows of current yields of similar securities with comparable duration based on the underlying fixed income investments.
We expect to contribute at least $1.2 million and $0.3 million to our pension plan and post-retirements benefits plan, respectively, in 2011.
The fair value measurements of the Pension Plans' assets by asset category at December 31, 2012 are as follows (in millions):
|
| | | | | | | | | | | | | | | |
| Asset Category | Total | | Quoted Prices in Active Markets for Identical Assets (Level 1) | | Significant Observable Inputs (Level 2) | | Significant Unobservable Inputs (Level 3) |
| Cash and cash equivalents | $ | 1.1 |
| | $ | 0.4 |
| | $ | 0.7 |
| | $ | — |
|
| Equity securities: | | | | | | | |
| Mutual funds | 8.1 |
| | 8.1 |
| | — |
| | — |
|
| Other equity securities, primarily U.S. companies | 10.1 |
| | 10.1 |
| | — |
| | — |
|
| Government securities | 3.7 |
| | 2.1 |
| | 1.6 |
| | — |
|
| Corporate and muni bonds: | | | | | | | |
| Other bonds | 5.9 |
| | — |
| | 5.9 |
| | — |
|
| Muni bonds | 0.3 |
| | — |
| | 0.3 |
| | — |
|
| Group annuity contract | 3.8 |
| | — |
| | 3.8 |
| | — |
|
| Total | $ | 33.0 |
| | $ | 20.7 |
| | $ | 12.3 |
| | $ | — |
|
Estimated Future Contributions and Benefit Payments
The Company expects to contribute a minimum of $1.3 million and $0.3 million its pension benefits plan and other post-retirements benefits plan, respectively, in 2014.
Estimated future benefit payments reflecting future service are as follows (in millions):
| | | | | | | |
Year ended December 31, | Pension | | Other Post-retirement |
| 2011 | $ | 2.6 | | | $ | 0.3 | |
| 2012 | 2.8 | | | 0.3 | |
| 2013 | 2.6 | | | 0.3 | |
| 2014 | 2.8 | | | 0.3 | |
| 2015 | 2.6 | | | 0.3 | |
| 2016 through 2020 | 14.1 | | | 1.5 | |
Amounts recognized in the consolidated statements of stockholders' equity and comprehensive income (in millions):
| | | | | | | | |
| | Pension After Tax | | | Other Post-retirement Benefits After Tax |
| Net (loss) during 2008 | $ | (5.6 | ) | | | $ | (0.2 | ) |
| Net gain during 2009 | 1.1 | | | | 1.3 | |
| Net gain during 2010 | 0.2 | | | | — | |
Amounts recognized in the consolidated balance sheets (in millions):
| | | | | | | | |
Year ended December 31, 2009 | Pension | | | Other Post-retirement |
| Current liabilities | $ | — | | | | $ | (0.3 | ) |
| Non-current liabilities | (11.6 | ) | | | (4.1 | ) |
| Total | $ | (11.6 | ) | | | $ | (4.4 | ) |
| | | | | | | | |
| Year ended December 31, 2010 | Pension | | | Other Post-retirement |
| Current liabilities | $ | — | | | | $ | (0.3 | ) |
| Non-current liabilities | (8.5 | ) | | | (3.8 | ) |
| Total | $ | (8.5 | ) | | | $ | (4.1 | ) |
|
| | | | | | | |
Year ending December 31, | Pension Benefits | | Other Post-retirement Benefits |
| 2014 | $ | 3.3 |
| | $ | 0.3 |
|
| 2015 | 2.7 |
| | 0.3 |
|
| 2016 | 2.9 |
| | 0.2 |
|
| 2017 | 2.9 |
| | 0.2 |
|
| 2018 | 3.3 |
| | 0.2 |
|
| 2019 through 2023 | 13.8 |
| | 1.1 |
|
Expected amortizations from accumulated other comprehensive income into net periodic benefit cost for the year ending December 31, 20112014 (in millions):
| | | | | | | | |
| | Pension | | | Other Post-retirement |
| Expected amortization of net loss | $ | 0.2 | | | | $ | — | |
| Expected amortization of prior service cost (credit) | — | | | | (0.1 | ) |
| Total expected amortizations for the year ending December 31, 2011 | $ | 0.2 | | | | $ | (0.1 | ) |
|
| | | | | | | |
| | Pension Benefits | | Other Post-retirement Benefits |
| Expected amortization of net actuarial loss | $ | 0.4 |
| | $ | — |
|
| Expected amortization of prior service credit | — |
| | — |
|
| Total expected amortizations for the year ending December 31, 2014 | $ | 0.4 |
| | $ | — |
|
Multi-employer Defined Benefit Plan
The Company contributed $0.3 million in each of the years ended December 31, 2013 and 2012 to multi-employer defined benefit plans under the terms of a collective-bargaining agreement that covers its union represented employees.
Savings Plans
We maintainThe Company maintains defined-contribution plans in the U.S., subject to Section 401(k) of the Internal Revenue Code, and in Canada, subject to the Income Tax Act. For the fiscal year ended December 31, 20102013, eligible U.S. employees could elect to contribute, on a tax-deferred basis, from 1% to 75% of their compensation to a maximum of $16,500.$17,500. Eligible U.S. employees over 50 years of age could also contribute an additional $5,500$5,500 on a tax-deferred basis. In Canada, employees couldcan elect to contribute up to a maximum of $22,000$23,820 Canadian dollars. Under the 401(k) plan, we match the Company matches 100% of U.S. employee contributions up to 2% of base salary and match matches 25% of employee contributions from 2% to 6% of base salary. For Canadian employees, the Company matches we match 50% of employee contributions up to 3% of base salary. For the yearyears ended December 31, 20102013, we2012 and 2011, the Company made matching payments of approximately $2.3 million.$2.8 million, $2.3 million and $2.5 million, respectively.
The following table sets forth the computation of basic and diluted net earnings per share (dollars and shares in millions, except per share amounts): |
| | | | | | | | | | | | | | | | | | | | | | | | | | | | | | | | |
| | Year Ended December 31, |
| | 2013 | | 2012 | | 2011 |
| | Net Income | | Weighted-Average Shares Outstanding | | Net Income Per Common Share | | Net Income | | Weighted-Average Shares Outstanding | | Net Income Per Common Share | | Net Income | | Weighted-Average Shares Outstanding | | Net Income Per Common Share |
| Basic EPS | $ | 41.6 |
| | 11.5 |
| | $ | 3.62 |
| | $ | 33.9 |
| | 11.5 |
| | $ | 2.96 |
| | $ | 26.2 |
| | 11.4 |
| | $ | 2.30 |
|
| Effect of dilutive | | | | | | | | | | | | | | | | | |
| common share | | | | | | | | | | | | | | | | | |
| equivalents: | | | | | | | | | | | | | | | | | |
| Restricted | | | | | | | | | | | | | | | | | |
| stock units | — |
| | — |
| | (0.01 | ) | | — |
| | 0.1 |
| | (0.02 | ) | | — |
| | — |
| | (0.01 | ) |
| Stock options | — |
| | 0.1 |
| | (0.02 | ) | | — |
| | — |
| | (0.02 | ) | | — |
| | 0.1 |
| | (0.02 | ) |
| Performance shares | — |
| | — |
| | (0.01 | ) | | — |
| | — |
| | (0.01 | ) | | — |
| | — |
| | — |
|
| Warrants | — |
| | — |
| | — |
| | — |
| | — |
| | — |
| | — |
| | 0.2 |
| | (0.04 | ) |
| Diluted EPS | $ | 41.6 |
| | 11.6 |
| | $ | 3.58 |
| | $ | 33.9 |
| | 11.6 |
| | $ | 2.91 |
| | $ | 26.2 |
| | 11.7 |
| | $ | 2.23 |
|
Note: Basic and diluted earnings per share are calculated based on unrounded actual amounts.
Stock options and warrants to purchase common stock are not included in the computation of diluted earnings per share if their effect would be anti-dilutive. There were no anti-dilutive stock options or warrants excluded in the computation of diluted earnings per share for 2013 and 2012, and 91,770 anti-dilutive stock options were excluded in the computation of diluted earnings per share for 2011.
The following table summarizes the number of securities to be issued and remaining available for future issuance under all of the Company’s stock incentive plans as of December 31, 2013:
|
| | | | | | | | | |
| | Number of securities to be issued upon exercise of outstanding options and vesting of RSUs | | Weighted-average exercise price of outstanding options and vesting of RSUs | | Number of securities remaining available for future issuance under equity compensation plans (excluding securities reflected in column 1) |
| 2004 Long-Term Incentive Plan | | | | | |
| -Options | 4,376 |
| | $ | 31.70 |
| | — |
|
| 2005 Long-Term Incentive Plan | | | | | |
| -Restricted stock units | 3,053 |
| | $ | 0.01 |
| | — |
|
2007 Long-Term Incentive Plan(1) | 96,958 |
| | $ | 24.63 |
| | — |
|
2010 Long-Term Incentive Plan(1) | 131,533 |
| | $ | 1.88 |
| | 259,949 |
|
| |
| (1) | Includes non-qualified stock options, restricted stock units and performance shares. |
2004 Long-Term Incentive Plan
The 2004 Long-Term Incentive Plan (“2004 LTIP”) provided for issuance of shares of non-qualified stock options and restricted stock units to officers and key employees. For option grants, the exercise price equals the fair value of the Company's common stock on the date of grant. Options vested over a three-year period: one-third of the options cliff-vest on the first anniversary of the vesting commencement date and the remaining options vest in equal monthly installments over the two-year period following the first anniversary of the vesting commencement date. Stock options expire seven years after the date of grant. No further grants will be made under the 2004 LTIP.
2005 Long-Term Incentive Plan
The 2005 Long-Term Incentive Plan (“2005 LTIP”) provided for the granting of restricted stock units to officers and key employees. The majority of restricted stock units issued under the 2005 LTIP generally vest over three years: one-third of the restricted stock units cliff vest on the first anniversary of the vesting commencement date and the remaining restricted stock units vest in equal quarterly installments over the two-year period following the first anniversary of the vesting commencement date. Restricted stock units do not have an expiration date. No further grants will be made under the 2005 LTIP.
2005 Directors' Equity Incentive Plan
The 2005 Directors' Equity Incentive Plan (“2005 Directors' Plan”) consists of 15,000 non-qualified stock options that have been granted to non-employee Directors of the Company. The terms and vesting requirements of the 2005 Directors' Plan are similar to those of the 2004 LTIP, except options vest quarterly after the first anniversary of the vesting commencement date. No stock options are available for future issuance.
2007 Long-Term Incentive Plan
The 2007 Long-Term Incentive Plan (“2007 LTIP”) provided for the granting of stock options, restricted stock units and performance share awards of the Company's common stock to officers, employees and non-employee directors. The majority of awards issued under the 2007 LTIP generally vest over three years: one-third of the awards cliff vest on the first anniversary of the vesting commencement date and the remaining awards vest in equal quarterly installments over the two-year period following the first anniversary of the vesting commencement date. Stock options expire seven years after the date of grant. Restricted stock units do not have an expiration date. No further grants will be made under the 2007 LTIP.
2010 Long-Term Incentive Plan
The 2010 Long-Term Incentive Plan (“2010 LTIP”) provides for the granting of awards of up to 1,115,952 shares of the Company's common stock to officers, employees and non-employee directors. The 2010 LTIP became effective on April 1, 2010 and awards may be made under the plan through March 31, 2020. The available awards under the 2010 LTIP include: stock options, stock appreciation rights, restricted stock units, other stock-based awards and performance shares. The 2010 LTIP limits awards to 100,000 shares to any one participant in any one year. The majority of awards issued under the 2010 LTIP through December 31, 2013, have been restricted stock units, which generally vest over three years.
13.The following table summarizes the activity for all stock options, restricted stock units and performance shares under all of the Long-Term Incentive Plans ("LTIPs") for the year ended December 31, 2013:
|
| | | | | | | | | | | | | | | | | | | | | | | | | | | | | | | | | | | | | | | | | | | | |
| | | | | December 31, 2012 | | Activity during 2013 | | December 31, 2013 |
| | | | | Outstanding | | Granted | | Exercised | | Canceled | | Outstanding | | Exercisable |
| Plans | | Securities | | Number | | Price | | Number | | Price | | Number | | Price | | Number | | Price | | Number | | Price | | Number | | Price |
| 2004 LTIP | | Options | | 17,376 |
| | $ | 34.94 |
| | — |
| | $ | — |
| | (13,000 | ) | | $ | 36.03 |
| | — |
| | $ | — |
| | 4,376 |
| | $ | 31.70 |
| | 4,376 |
| | $ | 31.70 |
|
| 2005 LTIP | | RSUs | | 3,053 |
| | 0.01 |
| | — |
| | — |
| | — |
| | — |
| | — |
| | — |
| | 3,053 |
| | 0.01 |
| | 3,053 |
| | 0.01 |
|
| 2007 LTIP (1) | | RSUs | | 24,920 |
| | 0.01 |
| | — |
| | — |
| | (24,514 | ) | | 0.01 |
| | — |
| | — |
| | 406 |
| | 0.01 |
| | 406 |
| | 0.01 |
|
| | | Options | | 169,107 |
| | 25.62 |
| | — |
| | — |
| | (72,555 | ) | | 26.85 |
| | — |
| | — |
| | 96,552 |
| | 24.74 |
| | 96,552 |
| | 24.74 |
|
| | | Performanceshares | | 8,453 |
| | 0.01 |
| | — |
| | — |
| | (8,453 | ) | | 0.01 |
| | — |
| | — |
| | — |
| | — |
| | — |
| | — |
|
| 2010 LTIP (1) | | RSUs | | 120,126 |
| | 0.01 |
| | 87,268 |
| (2) | 0.01 |
| | (98,511 | ) | | 0.01 |
| | (1,167 | ) | | 0.01 |
| | 107,716 |
| | 0.01 |
| | — |
| | — |
|
| | | Options | | 7,500 |
| | 32.78 |
| | — |
| | — |
| | — |
| | — |
| | — |
| | — |
| | 7,500 |
| | 32.78 |
| | 5,000 |
| | 32.78 |
|
| | | Performance shares | | 77,047 |
| | 0.01 |
| | 90,500 |
| (3) | 0.01 |
| | (46,655 | ) | | 0.01 |
| | (104,575 | ) | | 0.01 |
| | 16,317 |
| | 0.01 |
| | — |
| | — |
|
| Total | | | | 427,582 |
| | | | 177,768 |
| | | | (263,688 | ) | | | | (105,742 | ) | | | | 235,920 |
| | | | 109,387 |
| | |
Note: Price is weighted-average price per share.
| |
| (1) | The 2007 and 2010 LTIPs are for officers, employees and non-employee directors. |
| |
| (2) | Consists of non-performance RSUs. |
| |
| (3) | In February 2013, the Company awarded a maximum of 90,500 performance-based RSUs to certain of its employees at a weighted-average grant date fair value of $49.13. The shares were ultimately cancelled as the Company did not achieve the related performance targets for fiscal 2013. |
The aggregate intrinsic value of stock options exercised in 2013, 2012 and 2011 was $2.3 million, $2.2 million and $4.3 million, respectively. The aggregate intrinsic value of restricted stock units exercised in 2013, 2012 and 2011 was $7.6 million, $6.4 million and $5.3 million, respectively. The aggregate intrinsic value of performance shares exercised in 2013, 2012 and 2011 was $2.6 million, $1.1 million and $0.7 million, respectively.
The following table summarizes stock options, restricted stock units and performance shares that have vested and are expected to vest as of December 31, 2013:
|
| | | | | | | | | | | | | | | | | | | | | |
| | | | December 31, 2013 |
| | | | Outstanding | | Weighted-Average Remaining Contractual Term (years) | | Aggregate Intrinsic Value(1) (dollars in thousands) |
| Plans | Securities | | Vested | | Expected to vest(2) | | Vested | | Expected to vest(2) | | Vested | | Expected to vest(2) |
| 2004 LTIP | Options | | 4,376 |
| | — |
| | 0.7 |
| | — |
| | $ | 194 |
| | $ | — |
|
| 2005 LTIP | RSUs | | 3,053 |
| | — |
| | — |
| | — |
| | 231 |
| | — |
|
| 2007 LTIP | RSUs | | 406 |
| | — |
| | — |
| | — |
| | 31 |
| | — |
|
| | Options | | 96,552 |
| | — |
| | 1.5 |
| | — |
| | 4,943 |
| | — |
|
| 2010 LTIP | RSUs | | — |
| | 112,175 |
| | — |
| | — |
| | — |
| | 8,517 |
|
| | Performance shares | | — |
| | 11,858 |
| | — |
| | — |
| | — |
| | 900 |
|
| | Options | | 5,000 |
| | 2,500 |
| | 4.8 |
| | 4.8 |
| | 216 |
| | 108 |
|
| Total | | | 109,387 |
| | 126,533 |
| | | | | | $ | 5,615 |
| | $ | 9,525 |
|
| |
(1) | Aggregate intrinsic value is calculated based upon the difference between the exercise prices of options or restricted stock units and our closing common stock price on December 31, 2013 of $75.93, multiplied by the number of instruments that are vested or expected to vest. Options and restricted stock units having exercise prices greater than the closing stock price noted above are excluded from this calculation. |
| |
| (2) | Options, restricted stock units and performance shares that are expected to vest are net of estimated future forfeitures. |
The aggregate fair value of options vested in 2013, 2012 and 2011 was $0.2 million, $0.1 million and $1.7 million, respectively. The aggregate fair value of restricted stock units vested in 2013, 2012 and 2011 was $8.5 million, $6.4 million and $6.1 million, respectively. The aggregate fair value of performance shares vested in 2013, 2012 and 2011 was $0.9 million, $1.1 million and $0.8 million, respectively.
Assumptions Used for Fair Value
The fair values for restricted stock units and performance shares, which are based on the fair market value of the Company's stock at date of grant, are included below for shares granted during 2013, 2012 and 2011. For stock options, the Company uses the Black-Scholes option-pricing model to determine the grant date fair value. Option-pricing models require the input of assumptions that are estimated at the date of grant. The following table presents the assumptions used in the Black-Scholes option-pricing model to value the stock options granted during 2011. The Company did not grant stock options in 2013 and 2012.
|
| | | | | | | | | | | |
| | Year Ended December 31, |
| | 2013 | | 2012 | | 2011 |
| Weighted-average fair value per share of grants: | | | | | |
| Restricted stock units | $ | 49.39 |
| | $ | 39.98 |
| | $ | 34.12 |
|
| Performance shares | N/A |
| | $ | 39.59 |
| | $ | 34.12 |
|
| Stock options | N/A |
| | N/A |
| | 9.88 |
|
| Expected life (years) | N/A |
| | N/A |
| | 5.3 |
|
| Risk-free interest rate | N/A |
| | N/A |
| | 0.48 | % |
| Volatility | N/A |
| | N/A |
| | 41 | % |
| Dividend yield | N/A |
| | N/A |
| | 2 | % |
The expected volatility is based on the historical implied volatility of Core-Mark’s stock price. The risk-free rate for periods within the contractual life of the option is based on the U.S. Treasury yield curve in effect at the time of grant. The expected term of options granted represents the period of time the Company estimates that options granted are expected to be outstanding.
Stock-based Compensation Expense
The Company recognized stock-based compensation expense of $4.6 million, $5.8 million and $5.5 million for the years ended December 31, 2013, 2012 and 2011, respectively. Stock-based compensation expense is included in selling, general and administrative expenses on the consolidated statements of operations. Stock-based compensation expense recognized for 2013 was calculated based on awards ultimately expected to vest and has been reduced for estimated forfeitures. The Company’s forfeiture experience since inception of its plans has been approximately 4% of the total grants. The historical rate of forfeiture is a component of the basis for predicting the future rate of forfeitures, which are also dependent on the remaining service period related to grants and on the limited number of approximately 85 plan participants that have been awarded grants since the inception of the Company's plans.
As of December 31, 2013, total unrecognized compensation cost related to non-vested share-based compensation arrangements was $3.7 million, which is expected to be recognized over a weighted-average period of 1.7 years.
Dividends
On October 19, 2011, the Company announced the commencement of a quarterly dividend program. In 2013, the Board of Directors declared quarterly cash dividends of $0.19 per common share on May 2, 2013 and August 1, 2013 and $0.22 per common share on November 1, 2013. In lieu of the first quarter 2013 dividend, the Board of Directors declared an accelerated cash dividend of $2.2 million, or $0.19 per common share on December 20, 2012, which was paid on December 31, 2012. The Company paid total dividends of $7.1 million and $10.3 million in 2013 and 2012, respectively. The Credit Facility places certain limits on the Company’s ability to pay cash dividends on its common stock. The Company's intentions are to continue increasing its dividends per share over time; however, the payment of any future dividends will be determined by the Company’s Board of Directors in light of then existing conditions, including the Company’s earnings, financial condition and capital requirements, strategic alternatives, restrictions in financing agreements, business conditions and other factors.
Repurchase of Common Stock
In March 2008, ourMay 2013, the Company's Board of Directors authorized a share$30 million increase to its stock repurchase programplan. At the time of up to $30increase, the Company had $2.3 million to remaining under its stock repurchase shares of our common stockplan that was then in the open market or in privately negotiated transactions subject to market conditions. The number of shares to be repurchased and the timing of the purchases will be based on market conditions, our cash and liquidity requirements, relevant securities laws and other factors.place. The share repurchase program may be discontinued or amended at any time. We funded repurchases underThe program has no expiration date and expires when the program and plan to fund any future repurchases, from available cash.amount authorized has been expended or the Board withdraws its authorization. As of December 31, 20132010 and 2012, there was $16.8the Company had $28.7 million and $5.8 million, respectively, available for future share repurchases under the program. Upon execution of the Third Amendment to our Credit Facility in February 2010, our limit for future share repurchases was re-established at $30 million.
During the year ended December 31, 2010, no shares of common stock were repurchased. During the year ended December 31, 2009, we repurchased 98,646 shares of common stock under the share repurchase program at an average price of $22.77 per share for a total cost of $2.2 million. During the year ended December 31, 2008, we repurchased 396,716 shares of common stock under the share repurchase program at an average price of $27.66 per share for a total cost of $11.0 million.
14.Quarterly Financial Data (Unaudited)
The tables below provide our unaudited consolidated results of operations for each of the four quarters in 2010 and 2009:
| | | | | | | | | | | | | | | | |
| | Three Months Ended |
| | (unaudited) |
| | (in millions, except per share data) |
| | December 31, | | September 30, | | June 30, | | March 31, | |
| | 2010 | | 2010 | | 2010 | | 2010 | |
Net sales — Cigarettes (1) | $ | 1,321.5 | | | $ | 1,400.9 | | | $ | 1,283.5 | | | $ | 1,113.8 | | |
Net sales — Food/non-food (1) | 535.3 | | | 592.7 | | | 550.8 | | | 468.3 | | |
Net sales (1) | 1,856.8 | | | 1,993.6 | | | 1,834.3 | | | 1,582.1 | | |
| Cost of goods sold | 1,762.5 | | | 1,887.5 | | | 1,737.2 | | | 1,494.3 | | |
| Gross profit | 94.3 | | | 106.1 | | (2) | 97.1 | | | 87.8 | | (3) |
Warehousing and distribution expenses (4) | 54.8 | | | 55.8 | | | 52.1 | | | 49.1 | | |
Selling, general and administrative expenses (5) | 38.7 | | (5) | 36.2 | | (5) | 32.2 | | (5) | 35.4 | | |
| Amortization of intangible assets | 0.6 | | | 0.5 | | | 0.5 | | | 0.5 | | |
| Total operating expenses | 94.1 | | | 92.5 | | | 84.8 | | | 85.0 | | |
| Income from operations | 0.2 | | | 13.6 | | | 12.3 | | | 2.8 | | |
Interest expense (6) | (0.7 | ) | | (0.8 | ) | | (0.5 | ) | | (0.6 | ) | |
| Interest income | 0.1 | | | 0.2 | | | 0.1 | | | — | | |
| Foreign currency gains (losses), net | 0.7 | | | 0.4 | | | (0.8 | ) | | 0.2 | | |
| Income before income taxes | 0.3 | | | 13.4 | | | 11.1 | | | 2.4 | | |
| Income tax (provision) benefit | 0.6 | | | (4.7 | ) | | (4.4 | ) | | (1.0 | ) | |
| Net income | 0.9 | | | 8.7 | | | 6.7 | | | 1.4 | | |
Basic net income per share (7) | $ | 0.08 | | | $ | 0.81 | | | $ | 0.62 | | | $ | 0.13 | | |
Diluted net income per share (7) | $ | 0.08 | | | $ | 0.78 | | | $ | 0.59 | | | $ | 0.12 | | |
| Shares used to compute basic net income | | | | | | | | |
| per share | 11.0 | | | 10.8 | | | 10.8 | | | 10.7 | | |
| Shares used to compute diluted net income | | | | | | | | |
| per share | 11.7 | | | 11.3 | | | 11.3 | | | 11.4 | | |
| | | | | | | | | |
Excise taxes (1) | $ | 464.8 | | | $ | 492.7 | | | $ | 429.4 | | | $ | 369.6 | | |
Cigarette inventory holding profits (8) | 3.1 | | | — | | | 2.4 | | | 0.6 | | |
| LIFO expense | 8.8 | | | 2.9 | | | 3.6 | | | 1.3 | | |
| Depreciation and amortization | 5.3 | | | 4.9 | | | 4.8 | | | 4.7 | | |
| Stock-based compensation | 1.1 | | | 1.1 | | | 1.2 | | | 1.4 | | |
| Capital expenditures | 4.6 | | | 3.8 | | | 2.5 | | | 3.0 | | |
(1) Excise taxes are included as a component of net sales.
(2) Includes an out of period adjustment of $1.1 million related to the recognition of deferred vendor income, of which $0.7 million related to prior years. The adjustment is immaterial to any prior period.
(3) Includes a $0.6 million OTP tax gain resulting from a state tax method change which was recorded as a reduction of cost of goods sold during the first quarter of 2010.
(4) Warehousing and distribution expenses are not included as a component of the Company's cost of goods sold which presentation may differ from that of other registrants.
(5) SG&A expenses include integration costs related to the acquisition of FDI, consisting of $1.5 million in Q4, $1.2 million in Q3 and $0.1 million in Q2. SG&A expenses also include costs related to the settlement of Fleming legacy insurance claims of $0.6 million in Q4 and $1.0 million in Q2, as well as $0.3 million and $0.8 million of expenses for advisory and due diligence activities necessary to analyze multiple offers from potential acquirers in Q3 and Q4, respectively.
(6) Includes amortization of debt issuance costs, of approximately $0.1 million for each quarter in 2010.
(7) Totals may not agree with full year amounts due to rounding and separate calculations for each quarter.
(8) Cigarette inventory holding profits relate to increases in manufacturer prices.
The following table summarizes the Company's stock repurchase activities for the years ended December 31, 2013 and 2012 (in millions, except share data):
| | | | | | | | | | | | | | | | |
| | Three Months Ended |
| | (unaudited) |
| | (in millions, except per share data) |
| | December 31, | | September 30, | | June 30, | | March 31, | |
| | 2009 | | 2009 | | 2009 | | 2009 | |
Net sales — Cigarettes (1) | $ | 1,173.7 | | | $ | 1,250.1 | | | $ | 1,209.1 | | | $ | 956.2 | | |
Net sales — Food/non-food (1) | 478.2 | | | 526.0 | | | 502.7 | | | 435.6 | | |
Net sales (1) | 1,651.9 | | | 1,776.1 | | | 1,711.8 | | | 1,391.8 | | |
| Cost of goods sold | 1,557.8 | | | 1,674.2 | | | 1,624.3 | | | 1,273.7 | | |
| Gross profit | 94.1 | | | 101.9 | | (2) | 87.5 | | (3) | 118.1 | | |
Warehousing and distribution expenses (4) | 51.0 | | | 51.1 | | | 50.2 | | | 45.0 | | |
Selling, general and administrative expenses (5) | 34.0 | | | 34.2 | | | 32.1 | | (5) | 37.0 | | (5) |
| Amortization of intangible assets | 0.4 | | | 0.5 | | | 0.5 | | | 0.6 | | |
| Total operating expenses | 85.4 | | | 85.8 | | | 82.8 | | | 82.6 | | |
| Income from operations | 8.7 | | | 16.1 | | | 4.7 | | | 35.5 | | |
Interest expense (6) | (0.4 | ) | | (0.4 | ) | | (0.4 | ) | | (0.5 | ) | |
| Interest income | 0.1 | | | — | | | 0.1 | | | 0.1 | | |
| Foreign currency gains (losses), net | 0.2 | | | 0.4 | | | 2.4 | | | (0.8 | ) | |
| Income before income taxes | 8.6 | | | 16.1 | | | 6.8 | | | 34.3 | | |
| Income tax provision | (0.1 | ) | | (4.8 | ) | | (2.6 | ) | | (11.0 | ) | |
| Net income | 8.5 | | | 11.3 | | | 4.2 | | (3) | 23.3 | | (7) |
Basic net income per share (8) | $ | 0.82 | | | $ | 1.08 | | | $ | 0.40 | | (3) | $ | 2.22 | | (7) |
Diluted net income per share (8) | $ | 0.76 | | | $ | 1.02 | | | $ | 0.39 | | (3) | $ | 2.20 | | (7) |
| Shares used to compute basic net income | | | | | | | | |
| per share | 10.5 | | | 10.5 | | | 10.5 | | | 10.5 | | |
| Shares used to compute diluted net income | | | | | | | | |
| per share | 11.1 | | | 11.0 | | | 10.8 | | | 10.6 | | |
| | | | | | | | | |
Excise taxes (1) | $ | 390.2 | | | $ | 412.1 | | | $ | 385.8 | | | $ | 327.9 | | |
Cigarette inventory holding profits (losses) (9) | 1.5 | | | (0.1 | ) | | 0.4 | | | 34.9 | | (7) |
| LIFO expense | 1.4 | | | 0.2 | | | 2.1 | | | 3.0 | | |
| Depreciation and amortization | 5.1 | | | 4.5 | | | 4.6 | | | 4.5 | | |
| Stock-based compensation | 1.2 | | | 1.4 | | | 1.3 | | | 1.2 | | |
| Capital expenditures | 7.6 | | | 5.2 | | | 3.5 | | | 4.8 | | |
|
| | | | | | | |
| | 2013 | | 2012 |
| Number of shares repurchased | 126,872 |
| | 118,800 |
|
| Average price per share | $ | 56.60 |
| | $ | 43.34 |
|
| Total repurchase costs | $ | 7.2 |
| | $ | 5.2 |
|
| |
| 15. | Other Comprehensive Income (Loss) |
(1) Excise taxes are included as a component of net sales.
(2) Includes a $0.6 million OTP net tax refund which was recorded as a reduction of cost of goods sold during the third quarter of 2009.
(3) Gross profit for the second quarter ended June 30, 2009 was negatively impacted by $11.5 million of federal excise floor tax net of manufacturer reimbursements related to SCHIP.
(4) Warehousing and distribution expenses are not included as a component of the Company's cost of goods sold which presentation may differ from thatThe components of other registrants.comprehensive income ("OCI") and the related tax effects were as follows (in millions):
(5) SG&A expenses include $0.8 million |
| | | | | | | | | | | | | | | | | | | | | | | | | | | | | | | | | | | |
| | Year Ended December 31, |
| | 2013 | | 2012 | | 2011 |
| | | | | | Net | | | | | | Net | | | | | | Net |
| | Before | | Tax | | of | | Before | | Tax | | of | | Before | | Tax | | of |
| | Tax | | Effect | | Tax | | Tax | | Effect | | Tax | | Tax | | Effect | | Tax |
| Defined benefit plan adjustments: | | | | | | | | | | | | | | | | | |
| Net actuarial gain/(loss) during the year | $ | 3.6 |
| | $ | (1.5 | ) | | $ | 2.1 |
| | $ | (5.1 | ) | | $ | 2.0 |
| | $ | (3.1 | ) | | $ | (4.6 | ) | | $ | 1.8 |
| | $ | (2.8 | ) |
| Amortization of prior service cost | | | | | | | | | | | | | | | | | |
| included in net income | (0.1 | ) | | — |
| | (0.1 | ) | | (0.1 | ) | | — |
| | (0.1 | ) | | (0.1 | ) | | — |
| | (0.1 | ) |
| Amortization of net actuarial gain/(loss) | | | | | | | | | | | | | | | | | |
| included in net income | 0.6 |
| | (0.2 | ) | | 0.4 |
| | 0.4 |
| | (0.1 | ) | | 0.3 |
| | 0.3 |
| | (0.1 | ) | | 0.2 |
|
| Net (loss)/gain during the year | 4.1 |
| | (1.7 | ) | | 2.4 |
| | (4.8 | ) | | 1.9 |
| | (2.9 | ) | | (4.4 | ) | | 1.7 |
| | (2.7 | ) |
| Foreign currency translation adjustment | | | | | | | | | | | | | | | | | |
| gain/(loss) | (1.5 | ) | | — |
| | (1.5 | ) | | 0.4 |
| | — |
| | 0.4 |
| | (0.3 | ) | | — |
| | (0.3 | ) |
| Other comprehensive income/(loss) | $ | 2.6 |
| | $ | (1.7 | ) | | $ | 0.9 |
| | $ | (4.4 | ) | | $ | 1.9 |
| | $ | (2.5 | ) | | $ | (4.7 | ) | | $ | 1.7 |
| | $ | (3.0 | ) |
During the years ended December 31, 2013 and $0.1 million2012, reclassifications out of costs related to the integration of our New England division onto our information systems platform in Q1 and Q2, respectively.accumulated other comprehensive loss were immaterial.
(6) Includes amortization of debt issuance costs, of approximately $0.1 million for each quarter in 2009.
(7) We realized significant cigarette holding profits in the first quarter ended March 31, 2009, due primarily to increases in cigarette prices by manufacturers in response to the anticipated increase in federal tax mandated by the SCHIP legislation.
(8) Totals may not agree with full year amounts due to rounding and separate calculations for each quarter.
(9) Cigarette inventory holding profits relate to increases in manufacturer prices and excise taxes.
15.16. Segment and Geographic Information
We areCore-Mark is one of the largest marketers of fresh and broad-line supply solutions to the convenience retail industry in North America. We offerThe Company offers a full range of products, marketing programs and technology solutions to approximatelyover 26,00030,000 customer locations in the U.S. and Canada. OurThe Company’s customers include traditional convenience stores, grocery stores, drug stores, liquor stores and other specialty and small format stores that carry convenience products. OurThe Company’s product offering includes cigarettes, other tobacco products, candy, snacks, fast food, groceries, fresh products, dairy, non-alcoholicbread, beverages, general merchandise and health and beauty care products.
As of December 31, 20102013, wethe Company operated a network of 2428 distribution centers in the U.S. and Canada (excluding two distribution facilities we operateit operates as a third party logistics provider), which support ourthe Company’s wholesale distribution business. TwentyTwenty-four of ourthe Company’s distribution centers are located in the U.S. and four are located in Canada. Two of the facilities we operate in the U.S. are consolidating warehouses which buy products from our suppliers in bulk quantities and then distribute the products to our other distribution centers.
All of ourThe Company’s distribution centers (operating divisions), which produce almost all of its revenues have similar historical economic characteristics and are expected to have similar economic characteristics inbeen aggregated into one reporting segment. Couche-Tard, the future. The principal measuresCompany’s largest customer, accounted for approximately 14.7% and factors we considered in determining whether the economic characteristics are similar are sales,13.7%% of total net sales income (which is comparable to our reported gross profit adjusted for LIFO expense)2013 and 2012, operating expenses and pre-taxrespectively. No single customer accounted for more than 10% of total net profit. In addition, each operating division carries similar products, which they sell to similar customers by using similar operating procedures. Therefore,sales in our judgment, our 24 operating divisions aggregate into one reportable segment.
Corporate adjustments and eliminations include the net results after intercompany eliminations for our consolidating warehouses, service fee revenue, LIFO and reclassifying adjustments, corporate allocations and elimination of intercompany interest charges.2011. Accounting policies for measuring segment assets and earnings before income taxes are substantially consistent with those described in Note 2 --- Summary of Significant Accounting Policies. Inter-segment revenues are not significant and no single customer accounted for 10% or more of our total revenues.
Information about ourthe Company's business operations based on the two geographic reporting segmentsareas is as follows (in millions):
| | | | Year Ended December 31, | Year Ended December 31, |
| | 2010 | | 2009 | | 2008 | 2013 | | 2012 | | 2011 |
| Net sales: | | | | | | | | | | |
United States (1) | $ | 6,086.3 | | | $ | 5,519.2 | | | $ | 5,082.3 | | |
| United States | | $ | 8,618.3 |
| | $ | 7,716.3 |
| | $ | 6,865.5 |
|
| Canada | 1,158.0 | | | 992.9 | | | 935.8 | | 1,114.3 |
| | 1,148.6 |
| | 1,220.5 |
|
| Corporate adjustments and eliminations | 22.5 | | | 19.5 | | | 26.8 | | |
Corporate (1) | | 35.0 |
| | 27.5 |
| | 28.9 |
|
| Total | $ | 7,266.8 | | | $ | 6,531.6 | | | $ | 6,044.9 | | $ | 9,767.6 |
| | $ | 8,892.4 |
| | $ | 8,114.9 |
|
| | | | | | | | | | | |
| Income (loss) before income taxes: | | | | | | | | | | |
United States (2) | $ | 35.6 | | | $ | 70.0 | | | $ | 34.9 | | |
| United States | | $ | 57.3 |
| | $ | 48.6 |
| | $ | 50.4 |
|
| Canada | (4.7 | ) | | (3.2 | ) | | (5.6 | ) | 0.9 |
| | 2.3 |
| | (1.4 | ) |
| Corporate adjustments and eliminations | (3.7 | ) | | (1.0 | ) | | (6.7 | ) | |
Corporate (2) | | 7.8 |
| | 4.5 |
| | (5.8 | ) |
| Total | $ | 27.2 | | | $ | 65.8 | | | $ | 22.6 | | $ | 66.0 |
| | $ | 55.4 |
| | $ | 43.2 |
|
| | | | | | | | | | | |
| Interest expense: | | | | | | | | | | |
| United States | $ | 24.3 | | | $ | 20.9 | | | $ | 20.6 | | $ | 30.2 |
| | $ | 27.4 |
| | $ | 23.5 |
|
| Canada | 0.9 | | | 0.8 | | | 0.9 | | 0.6 |
| | 0.7 |
| | 0.9 |
|
| Corporate adjustments and eliminations | (22.6 | ) | | (20.0 | ) | | (19.3 | ) | |
| Total | $ | 2.6 | | | $ | 1.7 | | | $ | 2.2 | | |
| | | | | | | |
| Interest income: | | | | | | |
| United States | $ | 0.1 | | | $ | 0.1 | | | $ | 0.1 | | |
| Canada | 0.1 | | | 0.1 | | | 0.1 | | |
| Corporate adjustments and eliminations | 0.2 | | | 0.1 | | | 0.8 | | |
Corporate (2) | | (28.1 | ) | | (25.9 | ) | | (22.0 | ) |
| Total | $ | 0.4 | | | $ | 0.3 | | | $ | 1.0 | | $ | 2.7 |
| | $ | 2.2 |
| | $ | 2.4 |
|
| | | | | | | | | | | |
| Depreciation and amortization: | | | | | | | | | | |
| United States | $ | 13.9 | | | $ | 13.3 | | | $ | 12.4 | | $ | 20.2 |
| | $ | 17.7 |
| | $ | 15.4 |
|
| Canada | 2.7 | | | 2.4 | | | 2.0 | | 2.7 |
| | 2.9 |
| | 3.0 |
|
| Corporate adjustments and eliminations | 3.1 | | | 3.0 | | | 3.0 | | |
Corporate (2) | | 4.3 |
| | 4.7 |
| | 4.0 |
|
| Total | $ | 19.7 | | | $ | 18.7 | | | $ | 17.4 | | $ | 27.2 |
| | $ | 25.3 |
| | $ | 22.4 |
|
(1) Net cigaretteConsists primarily of external sales made by the Company’s consolidating warehouses, management service fee revenue, an allowance for 2010 include approximately $105.9 millionsales returns and certain other sales adjustments.
(2) Consists primarily of increased sales resulting from manufacturers' cigarette price increases in response to SCHIP legislation, comparednet expenses and other income that is not allocated to the same period in 2009. Net cigarette salesU.S. or Canada, intercompany eliminations for 2009 include approximately $534.0 millioninterest and allocations of increased sales related to SCHIP legislation, compared to the same period in 2008.
(2) Includes $25.2 million of income for 2009, consisting of $36.7 million of cigarette holding profits due primarily to
manufacturers' price increases in response to the SCHIP legislation, less $11.5 million of federal excise floor taxes.
overhead, and LIFO expense.
Identifiable assets by geographic reporting segmentsarea are as follows (in millions):
| | | | | | | | | | December 31, | | December 31, |
| | December 31, 2010 | | December 31, 2009 | 2013 | | 2012 |
| Identifiable assets: | | | | | | |
| United States | $ | 590.2 | | | $ | 575.8 | | $ | 844.8 |
| | $ | 821.7 |
|
| Canada | 118.6 | | | 102.1 | | 112.0 |
| | 97.5 |
|
| Total | $ | 708.8 | | | $ | 677.9 | | $ | 956.8 |
| | $ | 919.2 |
|
The net sales mix for our primarythe Company’s product categories isare as follows (in millions): |
| | | | | | | | | | | |
| |
|
| | Year Ended December 31, |
| | 2013 | | 2012 | | 2011 |
| Product Category | Net Sales | | Net Sales | | Net Sales |
| Cigarettes | $ | 6,642.0 |
| | $ | 6,139.4 |
| | $ | 5,710.6 |
|
| Food | 1,342.3 |
| | 1,178.6 |
| | 995.7 |
|
| Candy | 527.2 |
| | 489.5 |
| | 459.8 |
|
| Other tobacco products | 787.8 |
| | 687.8 |
| | 607.9 |
|
| Health, beauty & general | 327.3 |
| | 269.2 |
| | 237.5 |
|
| Beverages | 139.1 |
| | 125.6 |
| | 100.9 |
|
| Equipment/other | 1.9 |
| | 2.3 |
| | 2.5 |
|
| Total food/non-food products | $ | 3,125.6 |
| | $ | 2,753.0 |
| | $ | 2,404.3 |
|
| Total net sales | $ | 9,767.6 |
| | $ | 8,892.4 |
| | $ | 8,114.9 |
|
| |
| 17. | Quarterly Financial Data (Unaudited) |
The tables below provide the Company's unaudited consolidated results of operations for each of the four quarters in 2013 and 2012:
| | | | | | | | | | | |
| | Year Ended December 31, |
| | 2010 | | 2009 | | 2008 |
| Product Category | Net Sales | | Net Sales | | Net Sales |
Cigarettes (1) | $ | 5,119.7 | | | $ | 4,589.1 | | | $ | 4,124.8 | |
| Food | 840.9 | | | 738.0 | | | 710.1 | |
| Candy | 426.0 | | | 405.0 | | | 401.3 | |
| Other tobacco products | 503.6 | | | 434.0 | | | 402.7 | |
| Health, beauty & general | 220.6 | | | 209.5 | | | 220.1 | |
| Non-alcoholic beverages | 152.0 | | | 151.7 | | | 180.9 | |
| Equipment/other | 4.0 | | | 4.3 | | | 5.0 | |
| Total food/non-food products | 2,147.1 | | | 1,942.5 | | | 1,920.1 | |
| Total net sales | $ | 7,266.8 | | | $ | 6,531.6 | | | $ | 6,044.9 | |
|
| | | | | | | | | | | | | | | | |
| | Three Months Ended |
| | (in millions, except per share data) |
| | December 31, | | September 30, | | June 30, | | March 31, | |
| | 2013 | | 2013 | | 2013 | | 2013 | |
Net sales — Cigarettes (1) | $ | 1,692.0 |
| | $ | 1,783.7 |
| | $ | 1,702.9 |
| | $ | 1,463.4 |
| |
Net sales — Food/non-food (1) | 799.3 |
| | 837.0 |
| | 807.0 |
| | 682.3 |
| |
Net sales (1) | 2,491.3 |
| | 2,620.7 |
| | 2,509.9 |
| | 2,145.7 |
| |
| Cost of goods sold | 2,348.0 |
| | 2,479.9 |
| | 2,372.9 |
| | 2,029.7 |
| |
| Gross profit | 143.3 |
| | 140.8 |
| | 137.0 |
| | 116.0 |
| |
Warehousing and distribution expenses (2) | 77.2 |
| | 79.4 |
| | 72.8 |
| | 67.7 |
| |
Selling, general and administrative expenses (3) | 41.6 |
| | 41.3 |
| | 42.9 |
| | 42.5 |
| |
| Amortization of intangible assets | 0.7 |
| | 0.6 |
| | 0.7 |
| | 0.7 |
| |
| Total operating expenses | 119.5 |
| | 121.3 |
| | 116.4 |
| | 110.9 |
| |
| Income from operations | 23.8 |
| | 19.5 |
| | 20.6 |
| | 5.1 |
| |
| Interest expense | (0.6 | ) | | (0.6 | ) | | (0.8 | ) | | (0.7 | ) | |
| Interest income | 0.1 |
| | 0.1 |
| | 0.1 |
| | 0.1 |
| |
| Foreign currency losses, net | (0.1 | ) | | (0.1 | ) | | (0.1 | ) | | (0.4 | ) | |
| Income before income taxes | 23.2 |
| | 18.9 |
| | 19.8 |
| | 4.1 |
| |
| Income tax provision | (8.2 | ) | | (6.6 | ) | | (8.1 | ) | | (1.5 | ) | |
| Net income | 15.0 |
| | 12.3 |
| | 11.7 |
| | 2.6 |
| |
Basic net income per common share (4) | $ | 1.30 |
| | $ | 1.07 |
| | $ | 1.02 |
| | $ | 0.22 |
| |
Diluted net income per common share (4) | $ | 1.29 |
| | $ | 1.06 |
| | $ | 1.01 |
| | $ | 0.22 |
| |
| Shares used to compute basic net income | | | | | | | | |
| per common share | 11.5 |
| | 11.5 |
| | 11.5 |
| | 11.5 |
| |
| Shares used to compute diluted net income | | | | | | | | |
| per common share | 11.6 |
| | 11.6 |
| | 11.6 |
| | 11.6 |
| |
| | | | | | | | | |
Excise taxes (1) | $ | 526.7 |
| | $ | 554.9 |
| | $ | 523.6 |
| | $ | 445.6 |
| |
Cigarette inventory holding gains (5) | 4.1 |
| | 0.2 |
| | 3.9 |
| | 0.8 |
| |
| LIFO expense | (0.1 | ) | | 2.2 |
| | 3.7 |
| | 2.9 |
| |
| Depreciation and amortization | 7.0 |
| | 6.8 |
| | 6.8 |
| | 6.6 |
| |
| Stock-based compensation | 0.6 |
| | 1.3 |
| | 1.4 |
| | 1.3 |
| |
| Capital expenditures | 5.0 |
| | 4.6 |
| | 6.7 |
| | 1.7 |
| |
Adjusted EBITDA(6) | 31.3 |
| | 29.8 |
| | 32.5 |
| | 15.9 |
| |
| |
| (1) | Excise taxes are included as a component of net sales. |
| |
| (2) | Warehousing and distribution expenses are not included as a component of the Company's cost of goods sold, which presentation may differ from that of other registrants. |
| |
| (3) | SG&A expenses includes acquisition and integration expenses of $2.8 million related primarily to Davenport and the addition of new customers, consisting of $1.2 million in Q4, $0.5 million in Q3, $0.6 million in Q2, and $0.2 million in Q1. |
| |
| (4) | Totals may not agree with full year amounts due to rounding and separate calculations for each quarter. |
| |
| (5) | Cigarette inventory holding gains relate to income earned on cigarette quantities on hand at the time cigarette manufacturers increase their prices. |
| |
| (6) | Adjusted EBITDA is a non-GAAP measure and should be considered as a supplement to, and not as a substitute for, or superior to, financial measures calculated in accordance with GAAP. Adjusted EBITDA is equal to net income adding back net interest expense, provision for income taxes, depreciation and amortization, LIFO expense, stock-based compensation expense and net foreign currency transaction losses. |
(1) Net cigarette sales for 2010 include approximately $105.9 million77
resulting from manufacturers' cigarette price increases in March |
| | | | | | | | | | | | | | | | |
| | Three Months Ended |
| | (in millions, except per share data) |
| | December 31, | | September 30, | | June 30, | | March 31, | |
| | 2012 | | 2012 | | 2012 | | 2012 | |
Net sales — Cigarettes (1) | $ | 1,513.2 |
| | $ | 1,596.5 |
| | $ | 1,577.3 |
| | $ | 1,452.4 |
| |
Net sales — Food/non-food (1) | 676.3 |
| | 718.4 |
| | 710.0 |
| | 648.3 |
| |
Net sales (1) | 2,189.5 |
| | 2,314.9 |
| | 2,287.3 |
| | 2,100.7 |
| |
| Cost of goods sold | 2,067.6 |
| | 2,192.7 |
| | 2,164.7 |
| | 1,990.6 |
| |
| Gross profit | 121.9 |
| | 122.2 |
| | 122.6 |
| | 110.1 |
| |
Warehousing and distribution expenses (2) | 64.7 |
| | 68.4 |
| | 66.2 |
| | 63.4 |
| |
Selling, general and administrative expenses (3) | 40.3 |
| (3) | 35.9 |
| (3) | 37.8 |
| (3) | 39.7 |
| |
| Amortization of intangible assets | 0.6 |
| | 0.7 |
| | 0.8 |
| | 0.9 |
| |
| Total operating expenses | 105.6 |
| | 105.0 |
| | 104.8 |
| | 104.0 |
| |
| Income from operations | 16.3 |
| | 17.2 |
| | 17.8 |
| | 6.1 |
| |
| Interest expense | (0.6 | ) | | (0.4 | ) | | (0.6 | ) | | (0.6 | ) | |
| Interest income | 0.1 |
| | 0.1 |
| | 0.1 |
| | 0.1 |
| |
| Foreign currency gains (losses), net | (0.1 | ) | | — |
| | (0.2 | ) | | 0.1 |
| |
| Income before income taxes | 15.7 |
| | 16.9 |
| | 17.1 |
| | 5.7 |
| |
| Income tax provision | (6.0 | ) | | (6.4 | ) | | (7.0 | ) | | (2.1 | ) | |
| Net income | 9.7 |
| | 10.5 |
| | 10.1 |
| | 3.6 |
| |
Basic net income per common share (4) | $ | 0.84 |
| | $ | 0.92 |
| | $ | 0.89 |
| | $ | 0.31 |
| |
Diluted net income per common share (4) | $ | 0.83 |
| | $ | 0.90 |
| | $ | 0.87 |
| | $ | 0.31 |
| |
| Shares used to compute basic net income | | | | | | | | |
| per common share | 11.5 |
| | 11.5 |
| | 11.4 |
| | 11.4 |
| |
| Shares used to compute diluted net income | | | | | | | | |
| per common share | 11.7 |
| | 11.7 |
| | 11.6 |
| | 11.6 |
| |
| | | | | | | | | |
Excise taxes (1) | $ | 482.2 |
| | $ | 519.1 |
| | $ | 511.5 |
| | $ | 474.2 |
| |
Cigarette inventory holding gains (5) | 3.3 |
| | 0.2 |
| | 3.2 |
| | 1.1 |
| |
| LIFO expense | 1.3 |
| | 3.8 |
| | 4.3 |
| | 2.9 |
| |
| Depreciation and amortization | 6.3 |
| | 6.3 |
| | 6.4 |
| | 6.3 |
| |
| Stock-based compensation | 1.7 |
| | 1.4 |
| | 1.3 |
| | 1.4 |
| |
| Capital expenditures | 8.3 |
| | 7.1 |
| | 7.7 |
| | 5.5 |
| |
Adjusted EBITDA(6) | 25.6 |
| | 28.7 |
| | 29.8 |
| | 16.7 |
| |
| |
| (1) | Excise taxes are included as a component of net sales. |
| |
| (2) | Warehousing and distribution expenses are not included as a component of the Company's cost of goods sold, which presentation may differ from that of other registrants. |
| |
| (3) | SG&A expenses include acquisition costs related to Davenport consisting of $1.3 million in the fourth quarter. SG&A expenses also include a reduction in expenses resulting from the favorable resolution of legacy workers' compensation and insurance claims of $1.4 million in the third quarter and $0.4 million in the second quarter. |
| |
| (4) | Totals may not agree with full year amounts due to rounding and separate calculations for each quarter. |
| |
| (5) | Cigarette inventory holding gains relate to income earned on cigarette quantities on hand at the time cigarette manufacturers increase their prices. |
| |
| (6) | Adjusted EBITDA is a non-GAAP measure and should be considered as a supplement to, and not as a substitute for, or superior to, financial measures calculated in accordance with GAAP. Adjusted EBITDA is equal to net income adding back net interest expense, provision for income taxes, depreciation and amortization, LIFO expense, stock-based compensation expense and net foreign currency transaction losses. |
ITEM 9.CHANGES IN AND DISAGREEMENTS WITH ACCOUNTANTS ON ACCOUNTING AND
| |
| ITEM 9. | CHANGES IN AND DISAGREEMENTS WITH ACCOUNTANTS ON ACCOUNTING AND |
FINANCIAL DISCLOSURE
None.
ITEM 9. A. CONTROLS AND PROCEDURES
Evaluation of Disclosure Controls and Procedures
We conducted, under the supervision and with the participation of our management, including the chief executive officer and chief financial officer, an evaluation of the effectiveness of the design and operation of our disclosure controls and procedures (as defined in Rules 13a-15(e) and 15d-15(e) under the Securities Exchange Act of 1934, as amended). Based on our evaluation, the chief executive officer and chief financial officer concluded that, as of December 31, 2010,2013, our disclosure controls and procedures were effective.
Management's Report on Internal Control over Financial Reporting
Our management is responsible for establishing and maintaining adequate internal control over financial reporting as defined in Rule 13a-15(f) of the Securities Exchange Act of 1934. We assessed the effectiveness of our internal control over financial reporting as of December 31, 2010.2013. In making this assessment, we used the criteria set forth by the Committee of Sponsoring Organizations of the Treadway Commission (“COSO”)(COSO) in Internal Control-Integrated Framework (1992), issued by the Committee of Sponsoring Organizations of the Treadway Commission.
Based on this assessment, we concluded that our internal control over financial reporting was effective as of December 31, 2010.2013.
Our internal control over financial reporting as of December 31, 20102013 has been audited by Deloitte & Touche LLP, our independent registered public accounting firm, as stated in their report which appears herein.
Changes in Internal Control over Financial Reporting
There were no changes in our internal control over financial reporting that occurred during the fourth quarter of the year ended December 31, 20102013 that have materially affected, or are reasonably likely to materially affect, the internal control over financial reporting.
ITEM 9. B. OTHER INFORMATION
None.
PART III
| |
| ITEM 10. | DIRECTORS, EXECUTIVE OFFICERS AND CORPORATE GOVERNANCE |
ITEM 10.DIRECTORS, EXECUTIVE OFFICERS AND CORPORATE GOVERNANCE
The information required by this item is included in our Proxy Statement for the 20112014 Annual Meeting of Stockholders under the following captions and is incorporated herein by reference thereto: “Nominees for Director,” “Board of Directors,” “Our Executive Officers,” and “Ownership of Core-Mark Common Stock-Section 16(a) Beneficial Ownership Reporting Compliance.”
ITEM 11. EXECUTIVE COMPENSATION
The information required by this item is included in our Proxy Statement for the 20112014 Annual Meeting of Stockholders under the following captions and is incorporated herein by reference thereto: “Board of Directors-Director Compensation,” “Board of Directors-Compensation Committee Interlocks and Insider Participation,” “Compensation Discussion and Analysis,” “Compensation Committee Report,” and “Compensation of Named Executives.”
ITEM 12. SECURITY OWNERSHIP OF CERTAIN BENEFICIAL OWNERS AND MANAGEMENT AND
RELATED STOCKHOLDER MATTERS
The information required by this item is included (i) in our Proxy Statement for the 20112014 Annual Meeting of Stockholders under the caption “Ownership of Core-Mark Common Stock” and is incorporated herein by reference thereto and (ii) in Item 5 of this Annual Report on Form 10-K and is incorporated herein by reference thereto.
ITEM 13. CERTAIN RELATIONSHIPS AND RELATED TRANSACTIONS, AND DIRECTOR
INDEPENDENCE
The information required by this item is included in our Proxy Statement for the 20112014 Annual Meeting of Stockholders under the following caption and is incorporated by reference herein by reference thereto: “Board of Directors-Certain Relationships and Related Transactions,” “Board of Directors-Committees of the Board of Directors” and “Board of Directors-Corporate Governance.”
ITEM 14. PRINCIPAL ACCOUNTING FEES AND SERVICES
The information required by this item is included in our Proxy Statement for the 20112014 Annual Meeting of Stockholders under the caption “Independent“Ratification of Selection of Independent Registered Public Accountants”Accounting Firm-Auditor Fees” and is incorporated herein by reference thereto.
PART IV
ITEM 15. EXHIBITS, FINANCIAL STATEMENT SCHEDULES
The following exhibits are filed as part of this Annual Report on Form 10-K:
EXHIBIT INDEX
|
| |
Exhibit No. | Description |
| 2.1 | Third Amended and Revised Joint Plan of Reorganization of Fleming Companies, Inc. and its Subsidiaries Under Chapter 11 of the Bankruptcy Code, dated May 25, 2004 (incorporated by reference to Exhibit 2.1 of the Company's Registration Statement on Form 10 filed on September 6, 2005). |
| | |
| 3.1 | Certificate of Incorporation of Core-Mark Holding Company, Inc. (incorporated by reference to Exhibit 3.1 of the Company's Registration Statement on Form 10 filed on September 6, 2005). |
| | |
| 3.2 | Second Amended and Restated Bylaws of Core-Mark Holding Company, Inc. (incorporated by reference to Exhibit 3.2 of the Company's Current Report on Form 8-K filed on August 18, 2008). |
| | |
4.1 | Form of Class 6(B) Warrant (incorporated by reference to Exhibit 4.1 of the Company's Registration Statement on Form 10 filed on September 6, 2005). |
| |
| 10.1 | 2004 Long-Term Incentive Plan (incorporated by reference to Exhibit 10.1 of the Company's Registration Statement on Form 10 filed on September 6, 2005). |
| | |
| 10.2 | 2004 Directors Equity Incentive Plan (incorporated by reference to Exhibit 10.2 of the Company's Registration Statement on Form 10 filed on September 6, 2005). |
| |
10.3 | 2005 Long-Term Incentive Plan (incorporated by reference to Exhibit 10.3 of the Company's Registration Statement on Form 10 filed on September 6, 2005). |
| | |
10.4 | 2005 Directors Equity Incentive Plan (incorporated by reference to Exhibit 10.4 of the Company's Registration Statement on Form 10 filed on September 6, 2005). |
| |
10.510.3 | 2007 Long-Term Incentive Plan (incorporated by reference to Annex A of the Company's Proxy Statement on Schedule 14A filed on April 23, 2007). |
| | |
10.610.4 | Statement of Policy Regarding 2007 Long-Term Incentive Plan (incorporated by reference to Exhibit 99.1 of the Company's Current Report on Form 8-K filed on May 9, 2007). |
| | |
10.710.5 | 2010 Long-Term Incentive Plan (incorporated by reference to Annex A of the Company's Proxy Statement on Schedule 14A filed on April 13, 2010). |
| | |
10.810.6 | Form of Management Option Award Agreement for Awards under the Core-Mark Holding Company, Inc. 2004 Long-Term Incentive Plan (incorporated by reference to Exhibit 10.7 of the Company's Annual Report on Form 10-K filed on March 12, 2009). |
| | |
10.9 | Form of Management Option Award Agreement for Awards under the Core-Mark Holding Company, Inc.
2007 Long-Term Incentive Plan (incorporated by reference to Exhibit 10.3 of the Company's Current
Report on Form 8-K filed on July 6, 2007).
|
| |
10.1010.7 | Form of Management OptionNon-Employee Director RSU Award Agreement for January 2009 Awards under the Core-Mark Holding Company, Inc. 2007 Long-Term Incentive Plan (incorporated by reference to Exhibit 10.1 of the Company's Quarterly Report on Form 10-Q filed on May 8, 2009). |
| |
10.11 | Form of Management Performance Share Award Agreement for January 2009 Awards under the Core-Mark Holding Company, Inc. 2007 Long-Term Incentive Plan (incorporated by reference to Exhibit 10.3 of the Company's Quarterly Report on Form 10-Q filed on May 8, 2009). |
| |
10.12 | Form of Management Restricted Stock Unit Award Agreement for January 2009 and 2010 Awards under the Core-Mark Holding Company, Inc. 2007 Long-Term Incentive Plan (incorporated by reference to Exhibit 10.2 of the Company's Quarterly Report on Form 10-Q filed on May 8, 2009). |
| |
| |
Exhibit
No.
| Description
|
10.13 | Form of Management Option Award Agreement for Awards under the Core-Mark Holding Company, Inc. 2010 Long-Term Incentive Plan (incorporated by reference to Exhibit 10.4 of the Company's Current Report on Form 8-K filed on January 25, 2011).Plan. |
| | |
10.1410.8 | Form of Management Performance ShareRSU Award Agreement for Awards under the Core-Mark Holding Company, Inc. 2010 Long-Term Incentive Plan (incorporated by reference to Exhibit 10.3 of the Company's Current Report on Form 8-K filed on January 25, 2011).Plan. |
| | |
10.1510.9 | Form of Management Restricted Stock UnitPerformance RSU Award Agreement for Awards under the Core-MarkCore- Mark Holding Company, Inc. 2010 Long-Term Incentive Plan (incorporated by reference to Exhibit 10.2 of the Company's Current Report on Form 8-K filed on January 25, 2011).Plan. |
| | |
10.1610.10 | Form of Indemnification Agreement for Officers and Directors (incorporated by reference to Exhibit 10.5 of the Company's Registration Statement on Form 10 filed on September 6, 2005). |
| |
10.17 | Form of Common Stock Purchase Warrant (incorporated by reference to Exhibit 10.12 of the Company's Registration Statement on Form 10 filed on September 6, 2005). |
| |
10.1810.11 | Registration Rights Agreement, dated August 20, 2004, among Core-Mark Holding Company, Inc. and the parties listed on Schedule I attached thereto (incorporated by reference to Exhibit 10.10 of the Company's Registration Statement on Form 10 filed on September 6, 2005). |
| | |
10.1910.12 | Credit Agreement, dated October 12, 2005, among Core-Mark Holding Company, Inc., Core-Mark International, Inc., Core-Mark Holdings I, Inc., Core-Mark Holdings II, Inc., Core-Mark Holdings III, Inc., Core-Mark Midcontinent, Inc., Core-Mark Interrelated Companies, Inc., Head Distributing Company and Minter-Weisman Co., as Borrowers, the Lenders Signatory Thereto as Lenders, JPMorgan Chase Bank, N.A., as Administrative Agent, General Electric Capital Corporation and Wachovia Capital Finance Corporation (Western), as Co-Syndication Agents and Bank of America, N.A. and Wells Fargo Foothill, LLC, as Co-Documentation Agents (incorporated by reference to Exhibit 10.13 of the Company's Registration Statement on Form 10 filed on October 21, 2005). |
| |
10.20 | |
Exhibit No. | Description |
| 10.13 | First Amendment to Credit Agreement, dated December 4, 2007, among Core-Mark Holding Company, Inc., Core-Mark International, Inc., Core-Mark Holdings I, Inc., Core-Mark Holdings II, Inc., Core-Mark Holdings III, Inc., Core-Mark Midcontinent, Inc., Core-Mark Interrelated Companies, Inc., Head Distributing Company and Minter-Weisman Co., as Borrowers, the Lenders Signatory Thereto as Lenders and JPMorgan Chase Bank, N.A., as Administrative Agent (incorporated by reference to Exhibit 10.19 of the Company's Annual Report on Form 10-K filed on March 12, 2009). |
| | |
10.2110.14 | Second Amendment to Credit Agreement, dated March 12, 2008, among Core-Mark Holding Company, Inc., Core-Mark International, Inc., Core-Mark Holdings I, Inc., Core-Mark Holdings II, Inc., Core-Mark Holdings III, Inc., Core-Mark Midcontinent, Inc., Core-Mark Interrelated Companies, Inc., Head Distributing Company and Minter-Weisman Co., as Borrowers, the Lenders Signatory Thereto as Lenders and JPMorgan Chase Bank, N.A., as Administrative Agent (incorporated by reference to Exhibit 10.1 of the Company's Current Report on Form 8-K filed on March 18, 2008). |
| | |
10.2210.15 | Third Amendment to Credit Agreement, dated February 2, 2010, among Core-Mark Holding Company, Inc., Core-Mark International, Inc., Core-Mark Holdings I, Inc., Core-Mark Holdings II, Inc., Core-Mark Holdings III, Inc., Core-Mark Midcontinent, Inc., Core-Mark Interrelated Companies, Inc., Head Distributing Company and Minter-Weisman Co., as Borrowers, the Lenders Signatory Thereto as Lenders and JPMorgan Chase Bank, N.A., as Administrative Agent (incorporated by reference to Exhibit 10.1 of the Company's Current Report on Form 8-K filed on February 5, 2010). |
| | |
10.2310.16 | Fourth Amendment to Credit Agreement, dated May 5, 2011, among Core-Mark Holding Company, Inc., Core-Mark International, Inc., Core-Mark Holdings I, Inc., Core-Mark Holdings II, Inc., Core-Mark Holdings III, Inc., Core-Mark Midcontinent, Inc., Core-Mark Interrelated Companies, Inc., Head Distributing Company and Minter-Weisman Co., as Borrowers, the Lenders Signatory Thereto as Lenders and JPMorgan Chase Bank, N.A., as Administrative Agent (incorporated by reference to Exhibit 10.1 of the Company's Quarterly Report on Form 10-Q filed on May 9, 2011). |
| |
| 10.17 | Pledge and Security Agreement, dated October 12, 2005, among Core-Mark Holding Company, Inc., Core-Mark Holdings I, Inc., Core-Mark Holdings II, Inc., Core-Mark Holdings III, Inc., Core-Mark International, Inc., Core-Mark Midcontinent, Inc., Core-Mark Interrelated Companies, Inc., Head Distributing Company, Inc. and Minter-Weisman Co., Inc., as Grantors and JPMorgan Chase Bank, N.A., as Administrative Agent (incorporated by reference to Exhibit 10.13 of the Company's Registration Statement on Form 10 filed on October 21, 2005). |
| |
10.24 | Waiver Letter, dated March 29, 2006 (incorporated by reference to Exhibit 10.1 of the Company's Current Report on Form 8-K filed on April 3, 2006). |
| |
| 11.1 | Statement of Computation of Earnings Per Share (required information contained within this Annual Report on Form 10-K). |
| |
Exhibit
No.
18.1 | Description |
14.1 | Core-Mark Code of Ethics (incorporated by reference to Exhibit 14.1 of the Company'sDeloitte & Touche LLP Preferability Letter on Change in Annual Report on Form 10-K filed on April 14, 2006).Date for Goodwill Impairment Test. |
| | |
| 21.1 | List of Subsidiaries of Core-Mark Holding Company, Inc. |
| | |
| 23.1 | Consent of Deloitte & Touche LLP.LLP, Independent Registered Public Accounting Firm |
| | |
| 31.1 | Certification of Chief Executive Officer Pursuant to Section 302 of the Sarbanes-Oxley Act of 2002. |
| | |
| 31.2 | Certification of Chief Financial Officer Pursuant to Section 302 of the Sarbanes-Oxley Act of 2002. |
| | |
| 32.1 | Certification of Chief Executive Officer Pursuant to 18 U.S.C. Section 1350. |
| | |
| 32.2 | Certification of Chief Financial Officer Pursuant to 18 U.S.C. Section 1350. |
| |
| 101.INS | XBRL Instance Document |
| |
| 101.SCH | XBRL Taxonomy Extension Schema Document |
| |
| 101.CAL | XBRL Taxonomy Extension Calculation Linkbase Document |
| |
| 101.DEF | XBRL Taxonomy Extension Definition Linkbase Document |
| |
| 101.LAB | XBRL Taxonomy Extension Label Linkbase Document |
| |
| 101.PRE | XBRL Taxonomy Extension Presentation Linkbase Document |
SIGNATURES
Pursuant to the requirements of Section 13 or 15(d) of the Securities Exchange Act of 1934, the registrant has duly caused this report to be signed on its behalf by the undersigned, thereunto duly authorized.
| |
| | | |
| | | | | | |
| | | | | CORE-MARK HOLDING COMPANY, INC. |
| | | | | | |
Date: March 15, 2011 | | 3, 2014 | | By: | /s/ J. MICHAEL WALSHTHOMAS B. PERKINS |
| | | | | | J. Michael Walsh
Thomas B. Perkins |
| | | | | President, Chief Executive Officer and Director |
Pursuant to the requirements of the Securities Exchange Act of 1934, this report has been signed below by the following persons on behalf of the registrant and in the capacities and on the dates indicated.
|
| | | | |
SIGNATURE | | TITLE | | DATE |
| | | | | |
/S/ J. MICHAEL WALSHTHOMAS B. PERKINS | | President, Chief Executive Officer and | | March 15, 20113, 2014 |
J. Michael WalshThomas B. Perkins
| | Director (Principal Executive Officer) | | |
| | | | | |
/S/ STACY LORETZ-CONGDON | | Senior Vice President and Chief Financial Officer (Principal | | March 15, 20113, 2014 |
| Stacy Loretz-Congdon | | Officer (Principal Financial Officer) | | |
| | | | | |
/S/ CHRISTOPHER MILLER | | Vice President, Chief Accounting Officer | | March 15, 20113, 2014 |
| Christopher Miller | | (Principal Accounting Officer) | | |
| | | | | |
/S/ RANDOLPH I. THORNTON | | Chairman of the Board of Directors | | March 15, 20113, 2014 |
| Randolph I. Thornton | | | | |
| | | | | |
/S/ ROBERT A. ALLEN | | Director | | March 15, 20113, 2014 |
| Robert A. Allen | | | | |
| | | | | |
/S/ STUART W. BOOTH | | Director | | March 15, 20113, 2014 |
| Stuart W. Booth | | | | |
| | | | | |
/S/ GARY F. COLTER | | Director | | March 15, 20113, 2014 |
| Gary F. Colter | | | | |
| | | | |
/S/ ROBERT G. GROSS | | Director | | March 3, 2014 |
| Robert G. Gross | | | | |
| | | | | |
/S/ L. WILLIAM KRAUSE | | Director | | March 15, 20113, 2014 |
| L. William Krause | | | | |
| | | | | |
/S/ HARVEY L. TEPNER | | Director | | March 15, 20113, 2014 |
| Harvey L. Tepner | | | | |
| | | | |
/S/ J. MICHAEL WALSH | | Director | | March 3, 2014 |
| J. Michael Walsh | | | | |
| | | | |
CORE-MARK HOLDING COMPANY, INC. AND SUBSIDIARIES
SCHEDULE II-VALUATION AND QUALIFYING ACCOUNTS
(in thousands)
| | | | Balance at Beginning of Period | | Charged (Credited) to Costs and Expenses | | Deductions | | Charged to Other Accounts | | Balance at End of Period | | | | | | | | | | | |
| Year Ended December 31, 2008 | | | | | | | | | | | |
| | | Balance at Beginning of Period | | Charged to Costs and Expenses | | Deductions | | Charged to Other Accounts | | Balance at End of Period |
| Year Ended December 31, 2013 | | | | | | | | | | |
| Allowances for: | | | | | | | | | | | | | | | | | | | |
| Trade receivables | | $ | 9,292 | | | $ | 1,641 | | | $ | (2,313 | ) | | $ | 197 | | | $ | 8,817 | | $ | 10,866 |
| | $ | 1,079 |
| | $ | (2,569 | ) | | $ | (12 | ) | | $ | 9,364 |
|
| Inventory reserves | | 757 | | | 9,731 | | | (9,859 | ) | | — | | | 629 | | 870 |
| | 12,723 |
| | (12,753 | ) | | — |
| | 840 |
|
| | | $ | 10,049 | | | $ | 11,372 | | | $ | (12,172 | ) | | $ | 197 | | | $ | 9,446 | | $ | 11,736 |
| | $ | 13,802 |
| | $ | (15,322 | ) | | $ | (12 | ) | | $ | 10,204 |
|
| | | | | | | | | | | | | | | | | | | | |
| Year Ended December 31, 2009 | | | | | | | | | | | |
| Year Ended December 31, 2012 | | | | | | | | | | |
| Allowances for: | | | | | | | | | | | | | | | | | | | |
| Trade receivables | | $ | 8,817 | | | $ | 1,751 | | | $ | (1,508 | ) | | $ | 34 | | | $ | 9,094 | | $ | 9,578 |
| | $ | 1,975 |
| | $ | (899 | ) | | $ | 212 |
| | $ | 10,866 |
|
| Inventory reserves | | 629 | | | 10,158 | | | (9,628 | ) | | — | | | 1,159 | | 1,029 |
| | 11,517 |
| | (11,676 | ) | | — |
| | 870 |
|
| | | $ | 9,446 | | | $ | 11,909 | | | $ | (11,136 | ) | | $ | 34 | | | $ | 10,253 | | $ | 10,607 |
| | $ | 13,492 |
| | $ | (12,575 | ) | | $ | 212 |
| | $ | 11,736 |
|
| | | | | | | | | | | | | | | | | | | | |
| Year Ended December 31, 2010 | | | | | | | | | | | |
| Year Ended December 31, 2011 | | | | | | | | | | |
| Allowances for: | | | | | | | | | | | | | | | | | | | |
| Trade receivables | | $ | 9,094 | | | $ | 1,371 | | | $ | (2,420 | ) | | $ | 615 | | | $ | 8,660 | | $ | 8,660 |
| | $ | 1,970 |
| | $ | (1,470 | ) | | $ | 418 |
| | $ | 9,578 |
|
| Inventory reserves | | 1,159 | | | 9,893 | | | (9,940 | ) | | 32 | | | 1,144 | | 1,144 |
| | 10,461 |
| | (10,576 | ) | | — |
| | 1,029 |
|
| | | $ | 10,253 | | | $ | 11,264 | | | $ | (12,360 | ) | | $ | 647 | | | $ | 9,804 | | $ | 9,804 |
| | $ | 12,431 |
| | $ | (12,046 | ) | | $ | 418 |
| | $ | 10,607 |
|

