UNITED STATES
SECURITIES AND EXCHANGE COMMISSION
Washington, D.C. 20549
FORM 10-K
(Mark One)
x☑ ANNUAL REPORT PURSUANT TO SECTION 13 OR 15(d) OF THE SECURITIES EXCHANGE ACT OF 1934
For the fiscal year ended December 31, 20172023
ORor
¨☐ TRANSITION REPORT PURSUANT TO SECTION 13 OR 15(d) OF THE SECURITIES EXCHANGE ACT OF 1934
For the transition period from _____ to _____
Commission file number 000-54691
PHILLIPS EDISON & COMPANY, INC.
(Exact Namename of Registrantregistrant as Specifiedspecified in Its Charter)
| | | | | | | | | | | |
| Maryland | | 27-1106076 |
| |
Maryland | 27-1106076 |
(State or Other Jurisdictionother jurisdiction of Incorporation
incorporation or Organization)
organization) | | | (I.R.S. Employer
Identification No.)
|
| | | |
11501 Northlake Drive, Cincinnati, Ohio | | 45249 |
(Address of Principal Executive Offices)principal executive offices) | | (Zip Code) |
(513) 554-1110
(Registrant’s Telephone Number, Including Area Code)telephone number, including area code)
Securities registered pursuant to Section 12(b) of the Act:
| | | | | | | | | | | | | | |
| Title of each class | | Trading Symbol(s) | | Name of each exchange on which registered |
| Common stock, par value $0.01 per share | | PECO | |
Title of Each Class | | Name of Each Exchange on Which Registered |
None | | NoneNasdaq Global Select Market |
Securities registered pursuant to Section 12(g) of the Act:
Common Stock, $0.01 par value per share
Indicate by check mark if the Registrantregistrant is a well-known seasoned issuer, as defined in Rule 405 of the Securities Act.
Yes ¨☑ No þ☐
Indicate by check mark if the Registrantregistrant is not required to file reports pursuant to Section 13 or Section 15(d) of the Act.
Yes ¨☐ No þ☑
Indicate by check mark whether the Registrantregistrant (1) has filed all reports required to be filed by Section 13 or 15(d) of the Securities Exchange Act of 1934 during the preceding 12 months (or for such shorter period that the Registrantregistrant was required to file such reports) and (2) has been subject to such filing requirements for the past 90 days. Yes þ☑ No ¨☐
Indicate by check mark whether the Registrantregistrant has submitted electronically and posted on its corporate website, if any, every Interactive Data File required to be submitted and posted pursuant to Rule 405 of Regulation S-T (Section(§ 232.405 of this chapter) during the preceding 12 months (or for such shorter period that the Registrantregistrant was required to submit and post such files). Yes þ☑ No ¨
Indicate by check mark if disclosure of delinquent filers pursuant to Item 405 of Regulation S-K is not contained herein, and will not be contained, to the best of Registrant’s knowledge, in definitive proxy or information statements incorporated by reference in Part III of the Form 10-K or any amendment of this Form 10-K. ¨☐
Indicate by check mark whether the Registrantregistrant is a large accelerated filer, an accelerated filer, a non-accelerated filer, a smaller reporting company, or an emerging growth company. See the definitions of “large accelerated filer,” “accelerated filer,” “smaller reporting company,” and “emerging growth company” in Rule 12b-2 of the Securities Exchange Act of 1934, as amended (the “Exchange Act”). (Check one):Act.
| | | | | | | | | | | |
| Large accelerated filer | ☑
| Accelerated filer | ☐
|
| | | |
Large Accelerated FilerNon-accelerated filer | ¨
☐ | Accelerated Filer | ¨
|
| | | |
Non-Accelerated Filer | þ (Do not check if a smaller reporting company)
| Smaller reporting company | ¨
☐
|
| | | |
| | Emerging growth company | ¨
| | ☐ |
If an emerging growth company, indicate by check mark if the Registrantregistrant has elected not to use the extended transition period for complying with any new or revised financial accounting standards provided pursuant to Section 13(a) of the Exchange Act. o☐
Indicate by check mark whether the Registrantregistrant has filed a report on and attestation to its management’s assessment of the effectiveness of its internal control over financial reporting under Section 404(b) of the Sarbanes-Oxley Act (15 U.S.C. 7262(b)) by the registered public accounting firm that prepared or issued its audit report. ☑
If securities are registered pursuant to Section 12(b) of the Act, indicate by check mark whether the financial statements of the registrant included in the filing reflect the correction of an error to previously issued financial statements. ☐
Indicate by check mark whether any of those error corrections are restatements that required a recovery analysis of incentive-based compensation received by any of the registrant’s executive officers during the relevant recovery period pursuant to §240.10D-1(b). ☐
Indicate by check mark whether the registrant is a shell company (as defined in rule 12b-2 of the Securities Exchange Act). Yes ¨☐ No þ☑
There is no established public market for the Registrant’s shares of common stock. On November 8, 2017, the board of directors of the Registrant approved an estimated value per share of the Registrant’s common stock of $11.00 based substantially on the estimated market value of its portfolio of real estate properties as of October 5, 2017. Prior to November 8, 2017, the estimated value per share was $10.20. For a full description of the methodologies used to establish the estimated value per share, see Part II, Item 5. Market for Registrant’s Common Equity, Related Stockholder Matters, and Issuer Purchases of Equity Securities - Market Information, of this Form 10-K. As of June 30, 2017,2023, the last business dayaggregate market value of the Registrant’s most recently completed second fiscal quarter, there were approximately 182.7 million shares ofregistrant’s common stock held by non-affiliates.non-affiliates of the registrant was $4.0 billion, based on a closing price of $34.08 as reported on the Nasdaq Global Select Market.
As of March 15, 2018,February 5, 2024, there were approximately 186.2122.2 million outstanding shares of common stock of the Registrant.registrant.
Documents Incorporated by Reference: None
Certain required information will be included in our definitive proxy statement to be filed with the SEC within 120 days after December 31, 2023 in connection with the Company's 2024 Annual Meeting of Stockholders, and is hereby incorporated by reference into Part III of this Form 10-K.
PHILLIPS EDISON & COMPANY, INC.
FORM 10-K
TABLE OF CONTENTS
| | | | | | | | | | | |
| TABLE OF CONTENTS |
| | | |
| | | |
| | | |
| | | |
| | | | |
| | |
| | | |
| | | | |
| | | | |
| | | |
| | | |
| | | |
| | | |
| | | |
| | | |
| | [RESERVED] | |
| | | |
| | | |
| | | |
| | | |
| | | |
| | | |
| | |
| | |
| | | |
| | | |
| | | |
| | | |
| | | |
| | | |
| | | |
| | | |
| | | |
| | | |
| | | |
| | | |
| | | |
| | | |
| | | | |
| |
| | | | | | | | | | | |
PHILLIPS EDISON & COMPANY DECEMBER 31, 2023 FORM 10-K | | | 1 |
Cautionary Note Regarding Forward-Looking Statements
Certain statements contained in this Annual Report on Form 10-K of Phillips Edison & Company, Inc. (“we,” the “Company,” “our,” or “us”), formerly known as Phillips Edison Grocery Center REIT I, Inc., other than historical facts may be considered forward-looking statements within the meaning of Section 27A of the Securities Act of 1933, as amended (the “Securities Act”), and Section 21E of the Securities Exchange Act of 1934, as amended (the “Exchange Act”), and the Private Securities Litigation Reform Act of 1995 (collectively with the Securities Act and the Exchange Act, the “Acts”). These forward-looking statements are based on current expectations, estimates, and projections about the industry and markets in which we operate, and beliefs of, and assumptions made by, management of our company and involve uncertainties that could significantly affect our financial results. We intend for all such forward-looking statements to be covered by the applicable safe harbor provisions for forward-looking statements contained in those acts.the Acts. Such forward-looking statements generally can be identified by the use of forward-looking terminology such as “may,” “will,” “can,” “expect,” “intend,” “anticipate,” “estimate,” “believe,” “continue,” “possible,” “initiatives,” “focus,” “seek,” “objective,” “goal,” “strategy,” “plan,” “potential,” “potentially,” “preparing,” “projected,” “future,” “long-term,” “once,” “should,” “could,” “would,” “might,” “uncertainty,” or other similar words. Readers are cautioned not to place undue reliance on these forward-looking statements, which speak only as of the date this report is filed with the U.S. Securities and Exchange Commission (“SEC”). Such statements include, in particular,but are not limited to: (a) statements about our plans, strategies, initiatives, and prospectsprospects; (b) statements about our underwritten incremental yields; and (c) statements about our future results of operations, capital expenditures, and liquidity. Such statements are subject to certain risks and uncertainties, including known and unknown risks and uncertainties, which could cause actual results to differ materially from those projected or anticipated. These risks include,anticipated, including, without limitation,limitation: (i) changes in national, regional, or local economic climates; (ii) local market conditions, including an oversupply of space in, or a reduction in demand for, properties similar to those in our portfolio; (iii) vacancies, changes in market rental rates, and the need to periodically repair, renovate, and re-let space; (iv) changes in interest rates and the availability of permanent mortgage financing; (v) competition from other available propertiesshopping centers and the attractiveness of properties in our portfolio to our tenants; (vi)(v) the financial stability of our tenants, including, thewithout limitation, their ability of tenants to pay rent; (vi) our ability to pay down, refinance, restructure, or extend our indebtedness as it becomes due; (vii) increases in our borrowing costs as a result of changes in interest rates and other factors; (viii) potential liability for environmental matters; (ix) damage to our properties from catastrophic weather and other natural events, and the physical effects of climate change; (x) our ability and willingness to maintain our qualification as a real estate investment trust (“REIT”) in light of economic, market, legal, tax, and other considerations; (xi) changes in tax, real estate, environmental, and zoning laws; (viii)(xii) information technology security breaches; (xiii) our corporate responsibility initiatives; (xiv) loss of key executives; (xv) the concentration of our portfolio in a limited number of industries, geographies, or investments; (xvi) the economic, political, and (ix)social impact of, and uncertainty relating to, pandemics or other health crises; (xvii) our ability to re-lease our properties on the same or better terms, or at all, in the event of non-renewal or in the event we exercise our right to replace an existing tenant; (xviii) the loss or bankruptcy of our tenants; (xix) to the extent we are seeking to dispose of properties, our ability to do so at attractive prices or at all; (xx) the impact of inflation on us and on our tenants; and (xxi) any of the other risks included in this Annual Report on Form 10-K, including those set forth in Part“Part I, Item 1A. Risk Factors.Factors”. Therefore, such statements are not intended to be a guarantee of our performance in future periods.
Such forward-looking statements can generally be identified by our use of forward-looking terminology such as “may,” “will,” “expect,” “intend,” “anticipate,” “estimate,” “believe,” “continue,” or other similar words. Readers are cautioned not to place undue reliance on these forward-looking statements, which speak only as of the date this report is filed with the U.S. Securities and Exchange Commission (“SEC”). We make no representations or warranties (expressed or implied) about the accuracy of any such forward-looking statements contained in this Annual Report on Form 10-K, and we do not intend to publicly update or revise any forward-looking statements, whether as a result of new information, future events, or otherwise.
Any such forward-looking statements are subject to risks, uncertainties, and other factors and are based on a number of assumptions involving judgments with respect to, among other things, future economic, competitive, and market conditions, all of which are difficult or impossible to predict accurately. To the extent that our assumptions differ from actual conditions, our ability to accurately anticipate results expressed in such forward-looking statements, including our ability to generate positive cash flows from operations, make distributions to stockholders, and maintain the value of our real estate properties, may be significantly hindered. See Item 1A. Risk Factors, herein, for a discussion of some of the risks and uncertainties, although not all of the risks and uncertainties, that could cause actual results to differ materially from those presented in our forward-looking statements. Except as required by law, we do not undertake any obligation to update or revise any forward-looking statements contained in this Form 10-K. Important factors that could cause actual results to differ materially from the forward-looking statements are disclosed in Item 1A. Risk Factors, Itemstatement, whether as a result of new information, future events, or otherwise.
| | | | | | | | | | | |
PHILLIPS EDISON & COMPANY DECEMBER 31, 2023 FORM 10-K | | | 2 |
ITEM 1. Business, and Item 7. Management’s Discussion and Analysis of Financial Condition and Results of Operations.BUSINESS
All references to “Notes” throughout this documentAnnual Report on Form 10-K refer to the footnotes to the consolidated financial statements in Part“Part II, Item 8. Financial Statements and Supplementary Data.Data”.
ITEM 1. BUSINESS
Overview
OVERVIEW—Phillips Edison & Company, Inc. (“we,” the “Company,” “PECO,” “our,” or “us”), formerly known as Phillips Edison Grocery Center REIT I, Inc., is an internally-manageda real estate investment trust (“REIT”) andfounded in 1991, is one of the nation’s largest owners and operators of omni-channel grocery-anchored shopping centers. The majority of our revenues are lease revenues derived from our owned real estate investments. Additionally, we operate a third-party investment management business providing property management and advisory services to $2.1 billiontwo unconsolidated institutional joint ventures, in which we have partial ownership interests, and one private fund (collectively, the “Managed Funds”). The majority of assets under management.
Weour revenues are lease revenues derived from our real estate investments. Our portfolio primarily own and manage well-occupied, grocery-anchoredconsists of neighborhood and community shopping centers havinganchored by the #1 or #2 grocer tenants by sales within their respective formats by trade area. As of December 31, 2023, our portfolio was 97.4% leased. Our tenants, who we refer to as “Neighbors,” are a mix of creditworthy national, regional, and regionallocal retailers sellingthat primarily provide necessity-based goods and servicesservices. We believe our locations are in fundamentally strong demographic markets throughout the United States. As of December 31, 2017, we managed a diversified portfolio of over 340 shopping centers; we directly owned 236 centers comprising approximately 26.3 million square feet located in 32 states.Our brick and mortar assets positively contribute to our Neighbors’ omni-channel strategies and act as the last mile delivery solution.
We were formed as a Maryland corporation in October 2009 and have elected to be taxed as a REIT for U.S. federal income tax purposes. Substantially all of our business is conducted through Phillips Edison Grocery Center Operating Partnership I, L.P. (“Operating(the “Operating Partnership”), a Delaware limited partnership formed in December 2009. We are a limited partner of the Operating Partnership, and our wholly ownedwholly-owned subsidiary, Phillips Edison Grocery Center OP GP I LLC, is the sole general partner of the Operating Partnership.
On October 4, 2017,As of December 31, 2023, we completedwholly-owned 281 shopping centers. Additionally, we owned a transaction to acquire certain real estate assets,14% interest in Grocery Retail Partners I LLC (“GRP I”), a joint venture with Northwestern Mutual Life Insurance Company, which owned 20 shopping centers. We also owned a 20% equity interest in Necessity Retail Partners (“NRP”), a joint venture with an affiliate of TPG Real Estate. In May 2022, we sold the third-party investment management business,final property in our NRP joint venture. In total, our managed portfolio of wholly-owned shopping centers and the captive insurance company of Phillips Edison Limited Partnership (“PELP”)those owned through our unconsolidated joint venture comprised approximately 34.4 million square feet located in exchange for stock and cash (“PELP transaction”). Prior to that date, our advisor was Phillips Edison NTR LLC (“PE-NTR”), which was directly or indirectly owned by PELP. Under the terms of the advisory agreement between PE-NTR and us (“PE-NTR Agreement”), PE-NTR was responsible for the management of our day-to-day activities and the implementation of our investment strategy. Our relationship with PE-NTR was acquired as part of the PELP transaction.31 states.
Business Objectives and Strategies
Owned Real Estate
BUSINESS OBJECTIVES AND STRATEGIES—Our business objective is to own, operate, and operatemanage well-occupied grocery-anchored shopping centers that generatein order to deliver long-term growth and value creation to all stakeholders while acting as a responsible corporate citizen. We seek to achieve this objective by generating cash flows, income growth, and capital appreciation for our stockholders through our differentiated and focused strategy, responsible balance sheet management, and integrated operating platform. Our goal is to create great grocery-anchored shopping experiences and improve our communities, one center at a time.
Differentiated and Focused Strategy—We believe our differentiated strategy drives strong financial and operational performance and future growth, including showing resiliency during economic down cycles.
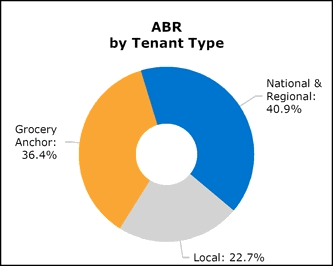
•Omni-Channel Grocery-Anchored Neighborhood Shopping Centers—We focus on investing in omni-channel shopping centers anchored by the #1 or #2 grocer by sales within their respective trade area. As of December 31, 2023, for our wholly-owned shopping centers, 85% of our annualized base rent (“ABR”) was generated from shopping centers anchored by such grocers. Grocery-anchored shopping centers generally have strong foot traffic leading to high demand for leasing Neighbor spaces, which enhances our ability to increase lease revenue. These centers provide an attractive last-mile solution to residents of our communities by providing “Buy Online, Pick-Up in Store”, curbside pick-up, and grocery delivery options. We target investments with attractive going-in yields and growth potential in markets with demographic profiles that support distributionsnecessity-based retail concepts.
•Neighbor-Base—As of December 31, 2023, approximately 70% of our ABR, including the pro rata portion attributable to properties owned through our shareholdersunconsolidated joint venture, is generated from Neighbors providing necessity-based goods and services. We believe our focus on necessity-based goods and services retailers limits our exposure to distressed retailers and allows us to demonstrate resiliency during times of real estate and economic down cycles.
•Targeted Portfolio—We focus on owning centers in trade areas with favorable demographics that align with those of leading grocers. Further, we seek to invest in small format centers where leasing activity is concentrated in smaller tenant spaces and limits exposure to high-risk retailers. We believe that smaller centers provide higher growth potential because they enjoy a positive leasing dynamic as: (i) we believe retailer demand is strongest for inline space, which contains less than 10,000 square feet of gross leasable area; (ii) there is less exposure to big box retailers, which we believe have higher risk because they require larger capital expenditures and have fewer leasing opportunities; and (iii) smaller centers typically have lower capital expenditures. We intend to grow our portfolio through targeted acquisitions that align with our differentiated and focused strategy.
•Macroeconomic Trends—We continually monitor the macroeconomic environment to identify trends that are positive for the growth potential of our shopping centers. We believe recent trends such as: (i) population shifts to the Sun Belt and from urban to suburban communities in certain geographic locations; (ii) the continued presence of hybrid work initiatives; (iii) the importance of last mile delivery; (iv) low supply and lack of new construction coupled with high occupancy; and (v) continued consumer resilience will create additional leasing demand and growth opportunities for our shopping centers.
Balance Sheet Management Positioned for External Growth—Our strategy is to grow our portfolio by pursuing acquisitions in a disciplined manner, while maintaining an attractive leverage profile and flexible balance sheet to preserve our
| | | | | | | | | | | |
PHILLIPS EDISON & COMPANY DECEMBER 31, 2023 FORM 10-K | | | 3 |
investment grade rating. We believe this is a critical part of maintaining access to multiple forms of capital, including common stock, unsecured debt, bank debt, and mortgage debt, to maximize availability and minimize our overall cost of capital.
•Funding External Growth—We have identified a target market of approximately 5,800 centers across the United States and believe we have a long runway for external growth. We believe our effective shelf registration statement and At-the-Market offering (“ATM”) program allow us to access equity and debt capital, further enhancing our financial flexibility and external growth potential. We believe our investment grade balance sheet and our available liquidity of $606.6 million under our senior unsecured revolving credit facility provide us with the potentialfinancial capacity to pursue external growth initiatives in an accretive and prudently capitalized manner. Additionally, our investment management platform enables us to source and manage incremental sources of capital through unconsolidated joint ventures, which provide us incremental fee revenue opportunities.
•Debt Maturity Profile—We believe we have maintained an appropriately staggered debt maturity profile with no meaningful maturities in 2024, which will position us for capital appreciation.long-term growth. Our outstanding debt obligations are composed primarily of (i) unsecured debt, including term loans, senior notes, and a revolving credit facility, and (ii) secured mortgage debt.
•Investment Grade Ratings—Our current investment grade ratings are Baa3 (Outlook: Stable) with Moody’s Investors Services and BBB- (Outlook: Positive) with S&P Global Ratings.
Internal Growth Through Our Integrated Operating Platform—We typically invest inbelieve our internally-staffed, vertically-integrated operating platform to lease and manage omni-channel grocery-anchored neighborhood shopping centers (generally containing less than 125,000 leasable square feet) locatedwill continue to provide stability and generate growth in attractive demographic markets throughout the United States where our management believesexisting portfolio, optimizing returns for our fully integrated operating platform can add value through the following strategies:stockholders.
Acquisitions—Our acquisitions team takes a disciplined, targeted approach to acquisitions as it reviews thousands of properties each year. After a thorough financial review, comprehensive underwriting analysis, and exhaustive due diligence process, only the most financially attractive grocery-anchored properties are ultimately added to our portfolio.
Leasing—•Leasing—Our national footprint of experienced and Locally Smart™ leasing professionals is dedicated to increasing rentalnet operating income by capitalizing on our portfolio’s below-market leases and increasing the occupancy(“NOI”) at our centers throughby: (i) maximizing rental rates while improving the lease-upcredit profile of property vacanciesour rental revenue; (ii) attracting high-quality retailers while improving the merchandising mix; (iii) capitalizing on below-market rent opportunities by leveraging nationalincreasing rents as leases expire; (iv) executing leases with contractual rent increases; and regional tenant relationships.
(v) increasing occupancy.Portfolio Management—Our portfolio management team seeks to•Property Management Services—We believe we add value by overseeing all aspects of operations at our properties, as well as optimizing the centers’ merchandising mix, and identifying opportunities for redevelopment or repositioning.
Property Management—properties. Our national footprint ofLocally Smart™ property managers strives to develop and maintaineffectively manage costs while maintaining a pleasant, clean, and safe environment where retailers can be successful and customers can enjoy theira great shopping experience. Property managementFurther, we provide our Neighbors with responsive customer service and marketing tools, as well as other sophisticated solutions, such as a centralized accounting, billing, and tax review platform to facilitate our daily operations.
•Development and Redevelopment—Our team of seasoned professionals identify opportunities to unlock additional value at our properties through investments in our outparcel and redevelopment program. Our strategies include outparcel development, footprint reconfiguration, anchor repositioning, and anchor expansion, among others. These projects create opportunities to increase the overall yield and value of our properties, which we believe will allow us to deliver long-term growth and value creation to all stakeholders while creating great grocery-anchored shopping center experiences.
COMPETITION—Our business is committedinherently competitive. We believe that the competition is highly fragmented. We are subject to considerable competition in both seeking shopping centers to acquire and attracting and retaining Neighbors in our existing shopping centers. We compete with institutional investors and other REITs, as well as local, regional, and national owner-operators for property acquisitions. We compete with other properties including malls, lifestyle centers, power centers, community centers, neighborhood centers, free-standing retail, and main street retail in attracting new Neighbors and retaining existing Neighbors when their leases expire. The competition for Neighbors varies depending on the characteristics of each property.
We believe that the principal competitive factors in attracting and retaining Neighbors are the quality of the grocery anchor, location, trade area demographics, tenant mix, physical condition of the shopping center, and occupancy cost. These factors combine to determine the level of occupancy and rental rates that we are able to achieve at our properties. We believe that the quality of our omni-channel grocery-anchored shopping centers enables us to compete effectively managing operatingfor Neighbors. We believe that we maintain a competitive position in the acquisition market due to our track record and positive reputation.
SEGMENT DATA—Our principal business is the ownership and operation of community and neighborhood shopping centers. We do not distinguish our principal business or group our operations by geography or size for purposes of measuring performance. Accordingly, we have presented our results as a single reportable segment.
COMPLIANCE WITH GOVERNMENT REGULATION—Compliance with various governmental regulations has an impact on our business, including our capital expenditures, earnings, and competitive position. The impact of these governmental regulations can be material to our business. We incur costs atto monitor and take action to comply with governmental regulations that are applicable to our business, which include, among others: federal securities laws and regulations; REIT and other tax laws and regulations; environmental and health and safety laws and regulations; local zoning, usage, and other regulations relating to real property; and the property level in orderAmericans with Disabilities Act of 1990, as amended (“ADA”). See “Item 1A. Risk Factors” below for a discussion of material risks to maximize cash flows and improve profitability.
Capital Markets—Our capital markets team is dedicated to maintaining a conservative balance sheet with an appropriately staggered debt maturity profile that is well positioned for long-term growth.
Legal, Finance, Accounting, Tax, Marketing, Risk Management, IT, Human Resources, etc.—Our other in-house teams add value by utilizing technology and broad processes to create efficiencies through scale, creating a better experience for our tenants while reducing costs. Our associates are dedicatedus (including those, to the company’s long-term commitmentextent material to our competitive position, relating to governmental regulations) and see “Part II, Item 7. Management’s Discussion and Analysis of beingFinancial Condition and Results of Operations” of this filing on Form 10-K, together with our consolidated financial statements and accompanying footnotes, for a discussion of material information relevant to an assessment of our financial condition and results of operations (including, to the leading ownerextent material, the effects that compliance with governmental regulations may have upon our capital expenditures and operator of grocery-anchored shopping centers.
Third-Party Investment Management Business
In addition to managing our shopping centers, our third-party investment management business provides comprehensive real estate and asset management services to five non-traded, publicly registered REITS and private funds with assets under management of approximately $2.1 billion as of December 31, 2017.
For each of these programs, we raise equity capital through either public or private offerings, invest those funds, and manage their assets in return for fee revenue as specified in our advisory agreements with them.
Strategic Alternatives
We are continuously evaluating strategic alternatives to create liquidity for our investors. In conjunction with the PELP transaction, we brought on an experienced management team that allows us to fully consider all alternatives. We are focused on maximizing the value for our shareholders while seeking to provide liquidity for our shareholders.
Segment Dataearnings).
As of December 31, 2017, we operated through two business segments: Owned Real Estate and Investment Management. Prior to the completion of the PELP transaction on October 4, 2017, we were externally-managed and our only reportable segment was the aggregated operating results of our owned real estate. Therefore, we did not report any segment disclosures for the years ended December 31, 2016 and 2015. For a more detailed discussion regarding these segments, including operating data for the year ended December 31, 2017, see Note 18.
Tax Status
As a result of the PELP transaction, we hold, and plan to continue to hold, our non-qualifying REIT assets and conduct certain of our non-qualifying REIT income activities in or through a taxable REIT subsidiary (“TRS”). A TRS is a corporation other than a REIT in which a REIT directly or indirectly holds stock, and that has made a joint election with such REIT to be treated as a TRS. A TRS also includes any corporation other than a REIT with respect to which a TRS owns securities possessing more than 35% of the total voting power or value of the outstanding securities of such corporation. A TRS is subject to income tax as a C-corporation.
The net income of our TRS is not required to be distributed to us and income that is not distributed to us will generally not be subject to the REIT income distribution requirement. However, our TRS may pay dividends. Such dividend income should qualify under the 95%, but not the 75%, gross income test. We will monitor the amount of dividend and other income from our TRS and will take actions that are intended to keep this income, and any other non-qualifying income, within the limitations of the REIT income tests. While we expect these actions will prevent a violation of the REIT income tests, we cannot guarantee that such actions will, in all cases, prevent such a violation.
Competition
We are subject to significant competition in seeking real estate investments and tenants. We compete with many third parties engaged in real estate investment activities including other REITs, specialty finance companies, savings and loan associations, banks, mortgage bankers, insurance companies, mutual funds, institutional investors, investment banking firms, lenders, hedge funds, governmental bodies, and other entities. Some of these competitors, including larger REITs, have substantially greater financial resources than we do and generally enjoy significant competitive advantages that result from, among other things, increased access to capital, lower cost of capital, and enhanced operating efficiencies.
Employees
As of December 31, 2017, we had 304 employees. Prior to the completion of the PELP transaction, we did not have any employees. However, PELP’s employees and executive officers were compensated, in part, for their services rendered to us.
Environmental Matters
As an owner of real estate,2023, we are subject to variousnot aware of any environmental lawsconditions or material costs of federal, state, and local governments. Compliancecomplying with federal, state, and local environmental laws has not hador other government regulations that would have a material adverse effect on our overall business. However, it
| | | | | | | | | | | |
PHILLIPS EDISON & COMPANY DECEMBER 31, 2023 FORM 10-K | | | 4 |
is possible that we are not aware of, or may become subject to potential environmental liabilities or material costs of complying with government regulations due to changes in requirements or otherwise that could be material to our business.
CORPORATE RESPONSIBILITY AND SUSTAINABILITY—Our corporate responsibility and sustainability program (“CRSP”), which we also refer to as our “PECO-ECO Promise™”, is designed to align with our corporate mission and strategic initiatives. With a mission of “creating great omni-channel grocery-anchored shopping center experiences and improving our communities, one shopping center at a time”, we strive to have a positive impact on all our stakeholders. Our CRSP is overseen by our full Board of Directors (the “Board”) reflecting our comprehensive approach to strong governance. In addition, we have a dedicated director liaison, Ms. Silfen, providing oversight to our PECO-ECO Team members based on her significant experience in energy innovation and sustainability. Our PECO-ECO Team is led by our General Counsel, who provides regular updates to the full Board on our CRSP.
Our PECO-ECO Promise™ is based on four pillars that are guided by our mission and our goal of driving long-term value creation for our stakeholders: our People and Culture, Environmental Stewardship, Community, and Oversight and Ethics:
PEOPLE AND CULTURE—At PECO, our associates are our greatest asset. We believe in fostering a work environment where every team member feels valued, respected, and empowered. To achieve this, our key areas of focus include:
•Engagement and Satisfaction: We empower our associates through personalized coaching and annual stock awards, intended to foster a resilient culture that has earned PECO the title of a Top Place to Work for seven consecutive years by Cincinnati Enquirer. By granting 100% of eligible associates service-based restricted stock units in PECO, we empower and encourage our associates to think and operate like owners, which we believe drives better decision making and strengthens our culture.
•Learning and Development: We are committed to continuous learning and the professional development of our associates. Established in 2007, PECO University is a hub for learning and development of our associates, encompassing our online learning platform, PECO U online, leadership development, mentoring programs, and more. PECO’s commitment to continuous learning includes an annual talent management process, workshops on development goal plans, and the PECO Mentor Match program, an internal mentoring program.
•Health and Well-Being: We strive to create a workplace that prioritizes the well-being of our associates. Our “Beyond Benefits” wellness program is integral to our Company’s culture and is designed to address our associates’ emotional, physical, and financial well-being. The program includes sponsoring wellness activities and challenges designed to improve the overall health of our associates.
•Inclusion and Belonging: At PECO, fostering connection and inclusivity is a core commitment of our culture. We established three associate-led resource groups, PECO Multicultural Opportunities, Resources & Education (“PECO MORE”), PECO Networking Opportunities for Women (“PECO NOW”), and PECO Connect to help further diversity, inclusion, collaboration, and communication throughout the Company.
As of December 31, 2023, we had approximately 290 associates located in 20 states across the country, with concentrations in our corporate offices in Cincinnati, Ohio; Park City, Utah; and Atlanta, Georgia. Approximately 51% of our workforce is female and 49% is male. Our senior leadership team is 18% female and 82% male, while manager roles and above are approximately 39% female and 61% male. For the year ended December 31, 2023, our overall turnover rate was 8%, with 6% voluntary turnover, compared to our previous three year overall turnover average of 13%, with 10% voluntary turnover.
ENVIRONMENTAL STEWARDSHIP—Environmental stewardship is an important component of our commitment to sustainability, encapsulated in our PECO-ECO Promise™. We recognize that sustainable practices are not only beneficial for the environment but also important for our business assets, resultssuccess and contributing to the well-being of operations, financial condition,the communities we operate in. A key component of our sustainable practices is focused on improving operational efficiencies and abilityresource reductions within our portfolio. Our initiatives include calculating our Scope 1 and Scope 2 GHG emissions, participating in the Global Real Estate Sustainability Benchmark ("GRESB") Real Estate Assessment, pursuing energy efficiency, developing on-site solar projects, and installing electric vehicle (“EV”) charging stations. We are also focused on attaining sustainable property certifications, implementing water conservation measures, and managing waste effectively.
We are proud to pay distributions,highlight the milestones below, as of December 31, 2023, in our ongoing sustainability journey:
•Exterior Lighting: Completed the retrofit of 98.1% of our wholly-owned portfolio to LED parking lot lighting, moving closer to our goal of retrofitting 100% of our portfolio by 2025.
•Renewable Energy: Installed 14 solar array systems to date.
•Water Conservation: Conserved over 62 million gallons of water in 2023 (through September) through the implementation of xeriscaping and our “Smart Water Control Program”, generating cost savings of over $200,000.
•EV Charging Stations: Installed EV chargers at 17.7% of our eligible properties to date.
•Waste Management: Achieved a waste diversion rate of approximately 26.0% at properties with a landlord-controlled waste program.
•Building Certifications: Secured WELL Health-Safety recertification for our company headquarters in Cincinnati, Ohio and Institute of Real Estate Management Certified Sustainable Property Certifications at 163 properties in 2023, bringing the total number of properties with certifications to 172.
COMMUNITY—Through our mission of “creating great omni-channel grocery-anchored shopping center experiences and improving our communities, one shopping center at a time”, we strive to actively engage with our Neighbors and the local communities that we serve. Our focus is on being Locally Smart™ and understanding the unique needs of each community. This commitment to our communities extends to its physical spaces, with initiatives like Front Row to Go® providing convenient curbside pickup for our local shoppers, and a retailer mix that offers storefront windows and drive-through stores for additional convenience for local shoppers.
| | | | | | | | | | | |
PHILLIPS EDISON & COMPANY DECEMBER 31, 2023 FORM 10-K | | | 5 |
Our community commitment is also evident in our initiatives like our PECO Community Partnership, an award-winning, associate-led program that encourages community involvement and connects our associates to causes they care about. In 2023, PECO Community Partnership sponsored 15 community service events and contributed over 440 service hours, including a volunteer day in partnership with Keep Cincinnati Beautiful at Green Man Park where 69 associates participated in a park cleanup and revitalization project.
PECO's partnership with communities also extends to disaster relief efforts, exemplified by our Incident Response Team. This team provides support to Neighbors and communities impacted by disasters, such as Hurricane Idalia in August 2023, as part of PECO's commitment to being there for its Neighbors and communities during challenging times.
OVERSIGHT AND ETHICS—Our governance framework guides our decision-making and accountability. Supported by an experienced executive management team, we maintain a robust system of corporate governance policies, designed to foster an ethical culture committed to the PECO-ECO Promise™ and to driving our goal of creating long-term value.
We believe our corporate governance structure closely aligns our interests with those of our stockholders. Notable features include: (i) each of our directors is subject to election annually, and our charter prevents us from classifying our Board unless we receive prior stockholder approval; (ii) we have opted out of the business combination and control share acquisition statutes in the Maryland General Corporation Law; (iii) we do not believehave a stockholder rights plan; (iv) we have a Stock Ownership Policy that requires each non-associate director, our CEO, and each other named executive officer to own a certain amount of our equity; and (v) our bylaws provide that our existing portfolio will require usstockholders may alter or replace our bylaws upon the affirmative vote of a majority of the votes entitled to incur material expenditures to complybe cast.
We operate under the oversight of our Board, which is comprised of nine directors, seven of whom meet the independence criteria set forth by the Nasdaq Global Select Market (“Nasdaq”) and U.S. Securities and Exchange Commission (“SEC”) rules. Our Audit, Nominating and Governance (“N&G”), and Compensation Committees are comprised solely of independent directors who complete annual self-assessments. Our Board has adopted Corporate Governance Guidelines that, among other things, establish criteria and expectations for our directors, and our N&G Committee has responsibility for annually evaluating our Board and each of its committees. We are cognizant of “overboarding” and none of our directors serve on more than two other public company boards. We are compliant with these lawsNasdaq’s Board Diversity Rule and regulations.have three female directors and two directors who are members of underrepresented racial or ethnic minorities.
Access to Company InformationMore information about our CRSP is available on our website and in our Corporate Responsibility Report, which are not incorporated by reference and should not be considered part of this Annual Report on Form 10-K.
INFORMATION ABOUT OUR EXECUTIVE OFFICERS—The following table details information for our executive officers as of December 31, 2023:
| | | | | | | | | | | |
| Name | Age | Title | Joined PECO |
| Jeffrey S. Edison | 63 | Chairman & Chief Executive Officer | Co-Founder |
Devin I. Murphy(1) | 63 | President | 2013 |
Robert F. Myers(1) | 51 | Chief Operating Officer & Executive Vice President | 2003 |
| John P. Caulfield | 43 | Chief Financial Officer, Executive Vice President & Treasurer | 2014 |
| Tanya E. Brady | 56 | General Counsel, Executive Vice President & Secretary | 2013 |
(1)Devin Murphy stepped down as President effective December 31, 2023 and became Managing Director of Investment Management effective January 1, 2024 through his retirement date of June 30, 2024. Effective January 1, 2024, Robert Myers became President.
CORPORATE HEADQUARTERS—Our corporate headquarters, located at 11501 Northlake Drive, Cincinnati, Ohio 45249, is where we conduct a majority of our management, leasing, construction, and investment activities, as well as administrative functions such as accounting and finance. Additionally, we maintain two regional offices located in Atlanta, Georgia and Park City, Utah.
ACCESS TO COMPANY INFORMATION—We electronically file our Annual Report on Form 10-K, Quarterly Reports on Form 10-Q, Current Reports on Form 8-K, Proxy and Information statements, and all amendments to those reports with the Securities and Exchange Commission (“SEC”). The public may read and copy any of the reports that are filed with the SEC at the SEC’s Public Reference Room at 100 F Street, NE, Washington, D.C. 20549, on official business days during the hours of 10:00 AM to 3:00 PM. The public may obtain information on the operation of the Public Reference Room by calling the SEC at (800) SEC-0330.SEC. The SEC maintains an Internetinternet site at www.sec.gov that contains the reports, proxy and information statements, and other information regarding issuers, including ours that are filed electronically. The contents of our website are not incorporated by reference.
We make available, free of charge, by responding to requests addressed to our investor relations group, the Annual Report on Form 10-K, Quarterly Reports on Form 10-Q, Current Reports on Form 8-K, and all amendments to those reports on our website, www.phillipsedison.com.www.phillipsedison.com. These reports are available as soon as reasonably practicable after such material is electronically filed with or furnished to the SEC. Also available on our website are (i) our Corporate Governance Guidelines, (ii) our Code of Business Conduct and Ethics, and (iii) our Whistleblower Policy. In the event of any changes to these documents, revised copies will be made available on our website. We intend to disclose on our website under “Investors - Governance - Governance Overview” any amendment to, or waiver of, any provisions of our Code of Business Conduct and Ethics applicable to the directors and/or officers of the Company that would otherwise be required to be disclosed under the rules of the SEC or Nasdaq. We also disclose, and intend to disclose, on our website under “Investors” material nonpublic information to comply with our disclosure obligations under Regulation FD. The contents of our website are not incorporated by reference.
| | | | | | | | | | | |
PHILLIPS EDISON & COMPANY DECEMBER 31, 2023 FORM 10-K | | | 6 |
ITEM 1A. RISK FACTORS
You should specifically consider the following material risks in addition to the other information contained in this Annual Report on Form 10-K. The occurrence of any of the following risks might have a material adverse effect on our business, operating results, financial condition, and financial condition. Thecash flows. Additional risks and uncertainties discussed below are not the only ones we face, but do represent those risks and uncertaintiespresently known to us or that we believe are most significant tocurrently deem immaterial also may impair our business, operating results, financial condition, prospects and forward-looking statements.cash flows.
Summary of Risk Factors
An investment in our common stock involves risks. You should carefully consider the risks summarized here and described more fully below.
Risks Related to Our StructureBusiness and an Investment in UsOperations
Because no public trading market for•Our revenues and cash flows will be affected by the success and economic viability of our shares currently exists, itanchor Neighbors.
•A significant percentage of our revenues is difficult forderived from non-anchor Neighbors, and our net income and ability to make distributions to stockholders may be adversely affected if these Neighbors are not successful.
•We may be unable to sell their shares and, if our stockholders are able to sell their shares, it may beshopping centers when desired, at a discount to the public offering price.
There is no public market for our shares. Until our shares are listed, if ever, stockholders may not sell their shares unless the buyer meets the applicable suitability and minimum purchase standards. Under the share repurchase program (“SRP”), we repurchase shares at aan attractive price, in place at the time of the repurchase and not based on the price at which you initially purchased your shares. It is likely we will repurchase fewer shares than have been requested to be repurchased due to lack of readily available funds under the SRP. While we have a limited SRP, in its sole discretion, our board of directors (“Board”) could amend, suspend or terminate our SRP upon 30 days’ notice. Further, the SRP includes numerous restrictions that would limit a stockholder’s ability to sell his or her shares to us. These restrictions have limited us from repurchasing shares submitted to us under the SRP in the past and may do so again in the future.
Therefore, it is difficult for our stockholders to sell their shares promptly or at all. If a stockholder is able to sell his or her shares, it may be at a discount to the public offering price of such shares. It is also likely that our shares would not be accepted as the primary collateral for a loan.
Because of the illiquid nature of our shares, investors should purchase our shares only as a long-term investmentall, and be prepared to hold them for an indefinite period of time.
Our stockholders may not be able to sell their shares under our SRP and, if they are able to sell their shares under the program, they may not be able to recover the amount of their investment in our shares.
Our SRP includes numerous restrictions that limit our stockholders’ ability to sell their shares. During any calendar year, we may repurchase no more than 5% of the weighted-average number of shares outstanding during the prior calendar year. Our stockholders must hold their shares for at least one year in order to participate in the SRP, except for repurchases sought upon a stockholder’s death or “qualifying disability”. The cash available for redemption on any particular date is generally limited to the proceeds from the dividend reinvestment plan (“DRIP”) during the period consisting of the preceding four fiscal quarters, less any cash already used for redemptions since the start of the same period; however, subject to the limitations described above, we may use other sources of cash at the discretion of our Board. These limitations do not, however, apply to repurchases sought upon a stockholder’s death or “qualifying disability.” Only those stockholders who purchased their shares from us or received their shares from us (directly or indirectly) through one or more non-cash transactions may be able to participate in the SRP. In other words, once our shares are transferred for value by a stockholder, the transferee and all subsequent holders of the shares are not eligible to participate in the SRP. These limits may prevent us from accommodating all repurchase requests made in any year. For example, in 2017 repurchase requests exceeded the funding limits provided under the SRP, and we were unable to repurchase all of the shares submitted to us. These restrictions would severely limit our stockholders’ ability to sell their shares should they require liquidity and would limit their ability to recover the value they invested. Our board is free to amend, suspend or terminate the SRP upon 30 days’ notice.
In addition, the repurchase price per share for all stockholders under the SRP is equal to the estimated value per share as determined periodically by our Board. The actual value per share as of the date on which an investor makes a repurchase request may be significantly different than the repurchase price such investor receives.
We use an estimated value of our shares that is based on a number of assumptions that may not be accurate or complete and is also subject to a number of limitations.
To assist members of the Financial Industry Regulatory Authority (“FINRA”) and their associated persons that participated in our initial public offering, pursuant to applicable FINRA and National Association Security Dealers (“NASD”) conduct rules, we disclose in each annual report distributed to stockholders a per share estimated value of our shares, the method by which it was developed, and the date of the data used to develop the estimated value. For this purpose, we initially estimated the value of our common shares as $10.00 per share based on the offering price of our shares of common stock in our initial public offering of $10.00 per share (ignoring purchase price discounts for certain categories of purchasers). Effective November 1, 2017, our Board approved an estimated value per share of our common stock of $11.00 based on the estimated fair value range of our real estate portfolio as indicated in a third-party valuation report plus the value of our cash and cash equivalents less the value of our mortgages and loans payable as of October 5, 2017.
Our estimated value per share is based upon a number of estimates and assumptions that may not be accurate or complete. Different parties with different assumptions and estimates could derive a different estimated value per share, and this difference could be significant. The estimated value per share is not audited and does not represent a determination of the fair value of our assets or liabilities based on U.S. generally accepted accounting principles (“GAAP”), nor does it represent a liquidation value of our assets and liabilities or the amount at which our shares of common stock would trade if they were listed on a national securities exchange. Accordingly, with respect to the estimated value per share, there can be no assurance that:
a stockholder would be able to resell his or her shares at the estimated value per share;
a stockholder would ultimately realize distributions per share equal to our estimated value per share upon liquidation of our assets and settlement of our liabilities or a sale of our company;
our shares of common stock would trade at the estimated value per share on a national securities exchange;
a third party would offer the estimated value per share in an arm’s-length transaction to purchase all or substantially all of our shares of common stock;
an independent third-party appraiser or third-party valuation firm would agree with our estimated value per share; or
the methodology used to calculate our estimated value per share would be acceptable to FINRA or for compliance with Employee Retirement Income Security Act of 1974 (“ERISA”) reporting requirements.
Furthermore, we have not made any adjustments to the valuation of our estimated value per share for the impact of other transactions occurring subsequent to October 5, 2017, including, but not limited to, (1) the issuance of common stock under the DRIP, (2) net operating income earned and dividends declared, (3) the repurchase of shares and (4) changes in leases, tenancy or other business or operational changes. The value of our shares will fluctuate over time in response to developments related to individual real estate assets, the management of those assets and changes in the real estate and finance markets. Because of, among other factors, the high concentration of our total assets in real estate and the number of shares of our common stock outstanding, changes in the value of individual real estate assets or changes in valuation assumptions could have a very significant impact on the value of our shares. In addition, the estimated value per share reflects a real estate portfolio premium as opposed to the sum of the individual property values. The estimated value per share also does not take into account any disposition costs or fees for real estate properties, debt prepayment penalties that could apply upon the prepayment of certain of our debt obligations or the impact of restrictions on the assumption of debt. Accordingly, the estimated value per share of our common stock may or may not be an accurate reflection of the fair market value of our stockholders’ investments and will not likely represent the amount of net proceeds that would result from an immediate sale of our assets.
If a Liquidity Event, as defined in our Charter, does not occur by the fifth anniversary of the termination of our initial primary public offering, we may be required to adopt a plan of liquidation of our properties and assets.
Our charter provides that we must effect a Liquidity Event which includes a sale of all or substantially all of our assets, a sale or merger of our company, a listing of our common stock on a national securities exchange, or other similar transaction, on or before the fifth anniversary of the termination of the initial primary public offering. If we do not begin the process of achieving a Liquidity Event by that date, our charter requires that we seek approval from our stockholders to amend the charter to extend the deadline. If we sought and failed to obtain stockholder approval of a charter amendment extending the deadline, our charter requires us to submit a plan of liquidation for the approval of our stockholders. If we sought and failed to obtain stockholder approval of both the charter amendment and our liquidation, we would continue our business. If we sought and obtained stockholder approval of our liquidation, we would begin an orderly sale of our properties and other assets.
The precise timing of any such sales would consider the prevailing real estate and financial markets, the economic conditions in the submarkets where our properties are located and the U.S. federal income tax consequences to our stockholders. The actual amount that we would distribute to stockholders in the liquidation would depend upon the actual amount of our liabilities, the actual proceeds from the sale of our properties,a property could cause significant tax payments.
•We face competition and other risks in pursuing acquisition opportunities that could increase the actual fees and expenses incurred in connection with the salecost of our properties, the actual expenses incurred in the administration of our properties prior to disposition, our actual general and administrative expenses,such acquisitions and/or limit our ability to continue to meet the requirements necessary to retain our status as a REIT throughout the liquidation process, our ability to avoid U.S. federal incomegrow, and excise taxes throughout the period of the liquidation process and other factors. If our liabilities (including, without limitation, tax liabilities and compliance costs) are greater than we currently expect or if the sales prices of our assets are less than we expect, stockholders will receive less in total liquidating distribution. Additionally, our Board will have discretion as to the timing of distributions of net sales proceeds.
If we are unable to find buyers for our assets on a timely basis or at our expected sales prices, our liquidating distributions may be delayed or reduced.
If we pay distributions from sources other than our cash flows from operations, we may not be able to sustaingenerate expected returns or successfully integrate completed acquisitions into our distribution rate,existing operations.
•We share ownership of our unconsolidated joint ventures and do not have exclusive decision-making power, and as such, we are unable to ensure that our objectives will be pursued.
•Our real estate assets may decline in value and be subject to significant impairment losses, which may reduce our net income.
•We actively reinvest in our portfolio in the form of development and redevelopment projects, which have inherent risks that could adversely affect our financial condition, cash flows, and results of operations.
•The continued shift in retail sales towards e-commerce may adversely affect our financial condition, cash flows, and results of operations.
•Actual incremental unlevered yields for our development and redevelopment projects may vary from our underwritten incremental unlevered yield range.
•Pandemics, epidemics, or other health crises may have fewer funds available for investment in properties and other assets,a negative effect on our and our stockholders’ overall returns may be reduced.
Our organizational documents permit us to pay distributions from any source without limit. To the extent we fund distributions from borrowings or the net proceeds from the issuanceNeighbors’ businesses, financial condition, results of securities, as we have done, we will have fewer funds available for investment in real estate properties and other real estate-related assets, and our stockholders’ overall returns may be reduced.
At times, we may be forced to borrow funds to pay distributions during unfavorable market conditions or during periods when funds from operations, are needed to make capital expenditures and pay other expenses, which could increase our operating costs. Furthermore, if we cannot cover our distributions with cash flows, from operations, we may be unableand liquidity.
Risks Related to sustain our distribution rate. For the year ended December 31, 2017, we paid gross distributions to our common stockholders of $123.3 million, including distributions reinvested through the DRIP of $49.1 million. For the year ended December 31, 2017, our net cash provided by operating activities was $108.9 million, which represents a shortfall of $14.4 million, or 11.7%, of our distributions paid, while our funds from operations (“FFO”) Attributable to StockholdersOur Indebtedness and Convertible Noncontrolling Interests were $84.2 million, which represents a shortfall of $39.1 million, or 31.7%, of the distributions paid. The shortfall was funded by proceeds from borrowings. For the year ended December 31, 2016, we paid distributions of $123.1 million, including distributions reinvested through the DRIP of $58.9 million. For the year ended December 31, 2016, our net cash provided by operating activities was $103.1 million, which represents a shortfall of $20.0 million, or 16.3%, of our distributions paid, while our FFO was $110.4 million, which represents a shortfall of $14.3 million, or 11.6% of our distributions paid. The shortfall was funded by proceeds from borrowings.Liquidity
The actual value of shares that we repurchase under our SRP may be less than what we pay.
•We repurchase shares under our SRP at the estimated value per share of our common stock. This value is likely to differ from the price at which a stockholder could resell his or her shares. Thus, when we repurchase shares of our common stock, the repurchase may be dilutive to our remaining stockholders.
We recently transitioned to a self-managed real estate investment trust and have limited operating experience being self-managed.
Effective October 4, 2017, we transitioned to a self-managed real estate investment trust following the closing of the PELP transaction. While we no longer bear the costs of the various fees and expense reimbursements previously paid to our former external advisor and its affiliates, our expenses now include the compensation and benefits of our officers, employees and consultants, as well as overhead previously paid by our former external advisor or their affiliates. Our employees now provide us services historically provided by our former external advisor and its affiliates. We are also now subject to potential liabilities that are commonly faced by employers, such as workers' disability and compensation claims, potential labor disputes, and other employee-related liabilities and grievances, and we bear the costs of the establishment and maintenance of any employee compensation plans. In addition, we have limited experience operating as a self-managed REITsubstantial indebtedness, and we may encounter unforeseen costs, expenses, and difficulties associated with providing those services on a self-advised basis. If weneed to incur unexpected expenses as a result of our self-management, our results of operations could be lower than they otherwise would have been. Furthermore, our results of operations following our transition to self-management may not be comparable to our results prior to the transition.
The loss of or the inability to obtain key real estate professionals could delay or hinder implementation of our investment strategies, which could limit our ability to make distributions and decrease the value of our stockholders’ investments.
Our success depends to a significant degree upon the contributions of Jeffrey S. Edison, Chief Executive Officer and the Chairman of our Board; R. Mark Addy, Executive Vice President; Robert Myers, Chief Operating Officer; and Devin I. Murphy, Chief Financial Officer. We do not have employment agreements with these individuals, and they may not remain associated with us. If any of these persons were to cease their association with us, our operating results could suffer. We do not intend to maintain key person life insurance on any person. We believe that our future success depends, in large part, upon our ability to hire and retain highly skilled managerial, operational and marketing professionals. The market for such professionals is competitive, and we may be unsuccessful in attracting and retaining such skilled individuals. Further, we intend to establish strategic relationships with firms, as needed, which have special expertise in certain services or detailed knowledge regarding real properties in certain geographic regions. Maintaining such relationships will be important for us to effectively compete with other investors for properties and tenants in such regions. We may be unsuccessful in establishing and retaining such relationships. If we lose or are unable to obtain the services of highly skilled professionals or do not establish or maintain appropriate strategic relationships, our ability to implement our investment strategies could be delayed or hindered, and the value of our stockholders’ investments may decline.
We have agreed to nominate Mr. Edison to our Board for each of the next ten succeeding annual meetings and for Mr. Edison to continue serving as Chairman of the Board until the third anniversary of the closing of the PELP transaction.
As part of the PELP transaction, we have agreed to nominate Jeffrey S. Edison, our Chief Executive Officer and the Chairman of our Board, to the Board for each of the ten succeeding annual meetings, subject to certain terminating events. As a result, it is possible that Mr. Edison may continue to be nominated as a director in circumstances when the independent directors would not otherwise have done so.
Our bylaws provide that Mr. Edison will continue to serve as Chairman of the Board until the third anniversary of the closing of the PELP transaction, subject to certain terminating events,additional indebtedness, including the listing of our common stock on a national securities exchange. As a result, Mr. Edison may continue to serve as Chairman of the Board in circumstances when the independent directors would not otherwise have selected him.
We are subject to conflicts of interest relating to the management of multiple REITs by our officers.
We and our management team serve as the sponsor and advisor of Phillips Edison Grocery Center REIT II, Inc. (“REIT II”), and Phillips Edison Grocery Center REIT III, Inc. (“REIT III”). We and REIT II and REIT III have overlapping investment objectives and investment strategies. As a result, we may be seeking to acquire properties and real estate-related investments at the same time as REIT II and/or REIT III. We have implemented certain procedures to help manage any perceived or actual conflicts among us and the REIT II and REIT III, including adopting an allocation policy to allocate property acquisitions among the three companies.
If we determine that an investment opportunity may be equally appropriate for more than one entity, then the entity that has had the longest period of time elapse since it was allocated an investment opportunity will be allocated such investment opportunity, subject to an expected right of first offer to be provided to REIT III. There can be no assurance that these policies will be adequate to address all of the conflicts that may arise or will address such conflicts in a manner that is favorable to us. Further, under our advisory agreements with REIT II and REIT III, we receive fees for various services, including, but not limited to, the day-to-day management of the Phillips Edison-sponsored REITs and transaction-related services. The terms of these advisory agreements were not the result of arm’s-length negotiations between independent parties and, as a result, the terms of these agreements may not be as favorable to us as they would have been if we had negotiated these agreements with unaffiliated third parties.
The Operating Partnership’s limited partnership agreement grants certain rights and protections to the limited partners, which may prevent or delay a change of control transaction that might involve a premium price for our shares of common stock.
In connection with the PELP transaction, we amended and restated the Operating Partnership’s limited partnership agreement to, among other things, grant certain rights and protections to the limited partners, including granting limited partners the right to consent to a change of control transaction. Furthermore, Mr. Edison currently has voting control over approximately 9.6% of the Operating Partnership’s operating partnership units (inclusive of those owned by us) and therefore could have a significant influence over votes on change of control transactions.
Our future results will suffer if we do not effectively manage our expanded portfolio and operations.
With the closing of the PELP transaction, we have an expanded portfolio and operations, and likely will continue to expand our operations through additional acquisitions and other strategic transactions, some of which may involve complex challenges. Our future success will depend, in part, upon our ability to manage expansion opportunities, integrate new operations into our existing business in an efficient and timely manner, successfully monitor our operations, costs, regulatory compliance and service quality and maintain other necessary internal controls.
There can be no assurance, however, regarding when or to what extent we will be able to realize the benefits of the PELP transaction, which may be difficult, unpredictable and subject to delays. We will be required to devote significant management attention and resources to integrating our business practices and operations with the newly acquired companies. It is possible that the integration process could resultrecourse debt, in the distraction of our management, the disruption of our ongoing business or inconsistencies in our operations, services, standards, controls, procedures and policies, any offuture, which could adversely affect our business, financial condition, and ability to maintain relationships with operators, vendorsmake distributions to our stockholders.
Risks Related to Our Corporate Structure and employees or to fully achieveOrganization
•We and our consolidated subsidiary, the anticipated benefits of the PELP transaction. There may also be potential unknown or unforeseen liabilities, increased expenses, or delays associated with integrating the companies we acquired in the PELP transaction.
There can be no assurance that our expansion or acquisition opportunities will be successful, or that it will realize our expected operating efficiencies, cost savings, revenue enhancements, synergies or other benefits.
We cannot assure stockholders that we will be able to continue paying distributions at the rate currently paid.
We expect to continue our current distribution practices following the closing of the PELP transaction. Stockholders however may not receive distributions following the closing of the PELP transaction equivalent to those previously paid by us for various reasons, including the following:
as a result of the PELP transaction and the issuance of OP Units in connection with the PELP transaction, the total amount of cash required for us to pay distributions at our current rate has increased;
we may not have enough cash to pay such distributions due to changes in our cash requirements, indebtedness, capital spending plans, cash flows or financial position or as a result of unknown or unforeseen liabilities incurred in connection with the PELP transaction;
decisions on whether, when and in what amounts to make any future distributions will remain at all times entirely at the discretion of the Board, which reserves the right to change our distribution practices at any time and for any reason; and
our Board may elect to retain cash to maintain or improve our credit ratings and financial position.
Existing and future stockholders have no contractual or other legal right to distributions that have not been declared.
We may be liable for potentially large, unanticipated costs arising from our acquisition of companies contributed in the PELP transaction.
Prior to completing the PELP transaction, we performed certain due diligence reviews of the business of PELP. Our due diligence review may not have adequately uncovered all of the contingent or undisclosed liabilities we may incur as a consequence of the PELP transaction. Any such liabilities could cause us to experience potentially significant losses, which could materially adversely affect our business, results of operations and financial condition.
In addition, we have agreed to honor and fulfill, following the closing, the rights to indemnification and exculpation from liabilities for acts or omissions occurring at or prior to the closing now existing in favor of a manager, director, officer, trustee, agent or fiduciary of any company contributed under the PELP transaction or subsidiary contained in (i) the organizational documents of such company or subsidiary and (ii) all existing indemnification agreements of such companies and their subsidiaries. For six years after the closing, we may not amend, modify or repeal the organizational documents of companies contributed under the PELP transaction and their subsidiaries in any way that would adversely affect such rights. We may incur substantial costs to address such claims and are limited in our ability to modify such indemnification obligations.
TheOperating Partnership, entered into tax protection agreement, during its term, couldagreements with certain protected partners, which may limit the Operating Partnership’s ability to sell or otherwise dispose of certain propertiesshopping centers and may require the Operating Partnership to maintain certain debt levels that otherwise would not be required to operate its business.
WeRisks Related to Our REIT Status and Other Tax Risks
•Failure to qualify as a REIT would cause us to be taxed as a regular C corporation, which would substantially reduce funds available for distributions to stockholders.
•If the Operating Partnership entered intofails to qualify as a tax protection agreement at closing of the PELP transaction, pursuant to which if the Operating Partnership (i) sells, exchanges, transfers, conveys or otherwise disposes of certain properties in a taxable transactionpartnership for a period of ten years commencing on the closing, or (ii) fails, prior to the expiration of such period, to maintain minimum levels of indebtedness that would be allocable to each protected partner forU.S. federal income tax purposes, or, alternatively, failswe would fail to offer such protected partners the opportunity to guarantee specific types of the Operating Partnership s indebtedness in order to enable such partners to continue to defer certain tax liabilities, the Operating Partnership will indemnify each affected protected partner against certain resulting tax liabilities. Therefore, although itqualify as a REIT and would suffer adverse consequences.
•Complying with REIT requirements may be in the stockholders’ best interest forcause us to cause the Operating Partnership to sell, exchange, transfer, conveyforgo otherwise attractive opportunities or liquidate otherwise dispose of one of these properties, it may be economically prohibitive for us to do so during the 10-year protection period because of these indemnity obligations. Moreover, these obligations may require us to cause the Operating Partnership to maintain more or different indebtedness than we would otherwise require for our business. As a result, the tax protection agreement will, during its term, restrict our ability to take actions or make decisions that otherwise would be in our best interests.attractive investments.
General Risks Related to InvestmentsBusiness Continuity
•We and our Neighbors face risks relating to cybersecurity attacks, which could cause loss of confidential information and other disruptions to business operations, and compliance with new laws and regulations regarding cybersecurity and privacy may result in Real Estate
Economicsubstantial costs and regulatory changes that impact the real estate market generally may decrease the valuecash available for distributions.
Risks Related to Our Common Stock
•The market price and trading volume of shares of our investmentscommon stock may be volatile.
•The number of shares of our common stock available for future issuance or sale could adversely affect the market price of our common stock.
| | | | | | | | | | | |
PHILLIPS EDISON & COMPANY DECEMBER 31, 2023 FORM 10-K | | | 7 |
Risks Related to Our Business and weaken our operating results.Operations
Our propertiesrevenues and their performance are subject to the risks typically associated with real estate, including:
downturns in national, regional, and local economic conditions;
increased competition for real estate assets targeted by our investment strategy;
adverse local conditions, such as oversupply or reduction in demand for similar properties in an area and changes in real estate zoning laws that may reduce the desirability of real estate in an area;
vacancies, changes in market rental rates and the need to periodically repair, renovate and re-let space;
changes in interest rates and the availability of permanent mortgage financing, which may render the sale of a property or loan difficult or unattractive;
changes in tax, real estate, environmental, and zoning laws;
periods of high interest rates and tight money supply; and
the illiquidity of real estate investments generally.
Any of the above factors, or a combination thereof, could result in a decrease in the value of our investments, which would have an adverse effect on our operations, on our ability to pay distributions to our stockholders and on the value of our stockholders’ investments.
We depend on our tenants for revenue, and, accordingly, our revenue and our ability to make distributions to our stockholders is dependent upon the success and economic viability of our tenants.
We depend upon tenants for revenue. Rising vacancies across commercial real estate result in increased pressure on real estate investors and their property managers to find new tenants and keep existing tenants. A property may incur vacancies either by the expiration of a tenant lease, the continued default of a tenant under its lease or the early termination of a lease by a tenant. If vacancies continue for a long period of time, we may suffer reduced revenues resulting in less cash available to distribute to stockholders. In order to maintain tenants, we may have to offer inducements, such as free rent and tenant improvements, to compete for attractive tenants. In addition, if we are unable to attract additional or replacement tenants, the resale value of the property could be diminished, even below our cost to acquire the property, because the market value of a particular property depends principally upon the value of the cash flow generated by the leases associated with that property. Such a reduction on the resale value of a property could also reduce the value of our stockholders’ investments.
Our revenueflows will be affected by the success and economic viability of our anchor retail tenants. Our reliance on singleNeighbors.
Anchor Neighbors (a Neighbor occupying 10,000 or significant tenantsmore square feet) occupy large stores in certain buildings may decrease our ability to lease vacated space and adversely affect the returns on our stockholders’ investments.
In the retail sector,shopping centers, pay a tenant occupying all or a largesignificant portion of the gross leasable areatotal rent at a property, and contribute to the success of other Neighbors by attracting shoppers to the property. Our revenues and cash flows may be adversely affected by the loss of revenues and additional costs in the event a retail center, commonly referred to as ansignificant anchor tenant, may become insolvent, may sufferNeighbor: (i) becomes bankrupt or insolvent; (ii) experiences a downturn in business, may decideits business; (iii) defaults on its lease; (iv) decides not to renew its lease as it expires; (v) renews its lease at lower rental rates and/or may decide to ceaserequires tenant improvements; or (vi) renews its operations at the retail centerlease but continue to pay rent. Any of these events could resultreduces its store size, which results in a reduction or cessation in rental paymentsdown-time and additional tenant improvement costs to us and could adversely affect our financial condition. A lease termination or cessation of operations by an anchor tenant could result in lease terminations or reductions in rent by other tenants whose leases may permit cancellation or rent reduction if another tenant terminates its lease or ceases its operations at that shopping center. In such event, we may be unable to re-lease the vacated space. Similarly,Some anchors have the leases of someright to vacate their space and may prevent us from re-tenanting by continuing to comply and pay rent in accordance with their lease agreement. Vacated anchor tenants may permitspace, including space owned by the anchor, tenant to transfer its lease to another retailer. The transfer to a new anchor tenant could cause customer traffic in the retail center to decrease and therebycan reduce the incomerental revenues generated by that retail center. A lease transfer to a new anchor tenant could also allowthe shopping center in other tenants to make reduced rental payments or to terminate their leases.spaces because of the loss of the departed anchor's customer drawing power. In the event that we are unable to re-lease the vacated space to a new anchor tenant,Neighbor in such situations, we may incur additional expenses in order to re-model the space to be able to re-lease the space to more than one tenant.Neighbor.
E-commerce canIf a significant Neighbor vacates a property, co-tenancy clauses in select lease contracts may allow other Neighbors to modify or terminate their rent or lease obligations. Co-tenancy clauses have several variants: (i) they may allow a negative impact on our business.Neighbor to postpone a store opening if certain other Neighbors fail to open their stores; (ii) they may allow a Neighbor to close its store prior to lease expiration if another Neighbor closes its store prior to lease expiration; or (iii) they may allow a Neighbor to pay reduced levels of rent until a certain number of Neighbors open their stores within the same shopping center.
The useleases of some anchor Neighbors may permit the internet by consumers continuesanchor Neighbor to gain popularity and the migration towards e-commerce is expectedtransfer its lease to continue. This increase in internet salesanother retailer. The transfer to a new anchor Neighbor could result in a downturncause customer traffic in the businessshopping center to decrease and thereby reduce the potential income generated by that shopping center. A lease transfer to a new anchor Neighbor could also allow other Neighbors to make reduced rental payments or to terminate their leases.
A significant percentage of our current tenantsrevenues is derived from non-anchor Neighbors, and our net income and ability to make distributions to stockholders may be adversely affected if these Neighbors are not successful.
A significant percentage of our revenues is derived from non-anchor Neighbors, some of which may be more vulnerable to negative economic conditions as they typically have more limited resources than anchor Neighbors. Significant Neighbor distress across our portfolio could adversely affect our financial condition, results of operations, and cash flows, and our ability to service our debt and make distributions to our stockholders. A property may incur vacancies either by the expiration of a Neighbor lease, the continued default of a Neighbor under its lease, or the early termination of a lease by a Neighbor. In order to maintain occupancy, we may have to offer inducements, such as free rent and tenant improvements, to compete for the right type or mix of non-anchor Neighbors in their “brick and mortar” locations and could affect the way future tenants lease space. While we devote considerable effort and resources to analyze and respond to tenant trends, preferences and consumer spending patterns, we cannot predict with certainty what future tenants will want, what future retail spaces will look like and how much revenue will be generated at traditional “brick and mortar” locations. Ifour shopping centers. In addition, if we are unable to anticipate and respond promptly to trendsattract additional or replacement Neighbors, the resale value of the property could be diminished, even below our acquisition costs, because the market value of a particular property depends principally upon the value of the cash flows generated by the leases associated with that property.
We face considerable competition in the leasing market our occupancy levels and rental amounts may decline.
Ifbe unable to renew leases or re-lease space as leases expire. Consequently, we enter into long-term leases with retail tenants, those leases may not result in fair value over time.
Long-term leases do not typically allow forbe required to make rent or other concessions and/or incur significant changes in rental paymentscapital expenditures to retain and do not expire in the near term. If we do not accurately judge the potential for increases in market rental rates when negotiating these long-term leases, significant increases in future property operating costsattract Neighbors, which could result in receiving less than fair value from these leases. Such circumstances would adversely affect our revenuesfinancial condition, cash flows, and funds available for distribution.results of operations.
The bankruptcy or insolvency of a major tenantThere are numerous shopping venues, including other shopping centers and e-commerce, that compete with our portfolio in attracting and retaining retailers. This competition may adversely impact our operations andhinder our ability to pay distributionsattract and retain Neighbors, leading to stockholders.increased vacancy rates, reduced rents, and/or increased capital investments. For leases that renew, rental rates upon renewal may be lower than current rates. For those leases that do not renew, we may not be able to promptly re-lease the space on favorable terms or with reasonable capital investments, or at all. In these situations, our financial condition, cash flows, and results of operations could be adversely affected.
We may be unable to collect balances due from Neighbors in bankruptcy.
The bankruptcy or insolvency of a significant tenantNeighbor or a number of smaller tenantsNeighbors may have an adverse impact onadversely affect our financial condition, cash flows and results of operations, and our ability to pay distributions to our stockholders. Generally, under bankruptcy law, a debtor tenantNeighbor has 120 daysthe legal right to exercise the optionreject any or all of assuming or rejecting the obligations under any unexpired lease for nonresidential real property, which period may be extended once by the bankruptcy court.their leases and close related stores. If the tenant assumes its lease, the tenant must cure all defaults under the lease and may be required to provide adequate assurance of its future performance under the lease. If the tenantNeighbor rejects the lease, we will have a claim against the tenant’sNeighbor’s bankruptcy estate. Although rent owing for the period between filing for bankruptcy and rejection of the lease may be afforded administrative expense priority and paid in full, pre- bankruptcypre-bankruptcy arrears and amounts owing under the remaining term of the lease will be afforded general unsecured claim status (absent collateral securing the claim). Moreover, amounts owing under the remaining term of the lease will be capped. Other than equity and subordinated claims, generalGeneral unsecured claims are the last claims paid in a bankruptcy, and, therefore, funds may not be available to pay such claims in full. See Item 2. Properties, for information relatedMoreover, amounts owing under the remaining term of the lease will be capped. As a result, it is likely that we would recover substantially less than the full value of any unsecured claims we hold. Additionally, we may incur significant expense to concentrationrecover our claim and to re-lease the vacated space. In the event that a Neighbor with a significant number of leases in our tenants.
shopping centers files bankruptcy and rejects its leases, we may experience a significant reduction in our revenues and may not be able to collect all pre-petition amounts owed by the bankrupt Neighbor.
We may be restricted from re-leasingleasing space atto certain retailers.
Some of our retail properties.
Leases with retail tenants mayleases contain provisions giving the particular tenantthat give a specific retailer the exclusive right to sell particular types of merchandisegoods or provide specific types of services within the particular retailthat shopping center. These provisions may limit the number and types of prospective tenants interested in leasingretailers to which we are able to lease space in a particular retail property.shopping center, which may result in increased costs to find a permissible retailer and decreased revenues if one or more spaces sit vacant or we have to accept lower rental rates or a less qualified retailer to fill the space.
Competition with third parties | | | | | | | | | | | |
PHILLIPS EDISON & COMPANY DECEMBER 31, 2023 FORM 10-K | | | 8 |
We may be unable to sell shopping centers when desired, at an attractive price, or at all, and the sale of a property could cause significant tax payments.
Our shopping centers, including related tangible and intangible assets, represent the majority of our total consolidated assets, and they may not be readily convertible to cash. As a result, our ability to sell one or more of our shopping centers, including shopping centers held in acquiring propertiesunconsolidated joint ventures, in response to changes in economic, industry, or other conditions, may be limited. The real estate market is affected by many factors that are beyond our control, including, but not limited to general economic conditions, availability and terms of financing, interest rates, supply and demand for space, and other investments may reduce our profitability and the return on our stockholders’ investments.
We face competition from various entities for investment opportunities in retail properties, including other REITs, pension funds, insurance companies, investment funds and companies, partnerships, and developers. Many of these entities have substantially greater financial resources than we do andfactors. There may be ableless demand for lower quality shopping centers that we have identified for ultimate disposition in markets with uncertain economic or retail environments, and where buyers are more reliant on the availability of third-party mortgage financing. If we want to accept more risk thansell a property, we can prudently manage, including risks with respect to the creditworthiness of a tenant or the geographic location of its investments. Competition from these entities may reduce the number of suitable investment opportunities offered to us or increase the bargaining power of property owners seeking to sell.
In our due diligence review of potential investments, we may rely on third-party consultants and advisors and representations made by sellers of potential portfolio properties, and we may not identify all relevant facts that may be necessary or helpful in evaluating potential investments.
Before making investments, we will typically conduct due diligence that we deem reasonable and appropriate based on the facts and circumstances applicable to each investment. Due diligence may entail evaluation of important and complex business, financial, tax, accounting, environmental and legal issues. Outside consultants, legal advisors, accountants, investment banks and other third parties may be involved in the due diligence process to varying degrees depending on the type of investment, the costs of which will be borne by us. Such involvement of third-party advisors or consultants may present a number of risks primarily relating to our reduced control of the functions that are outsourced. In addition, if we are unable to timely engage third-party providers, the ability to evaluate and acquire more complex targets could be adversely affected. When conducting due diligence and making an assessment regarding a potential investment, we will rely on the resources available to us, including information provided by the target of the investment and, in some circumstances, third-party investigations. The due diligence investigation that the we carry out with respect to any investment opportunity may not reveal or highlight all relevant facts that may be necessary or helpful in evaluating such investment opportunity. Moreover, such an investigation will not necessarily result in the investment being successful. There can be no assurance that attempts to provide downside protection with respect to investments, including pursuant to risk management procedures described in this Annual Report on Form 10-K, will achieve their desired effect and potential investors should regard an investment in us as being speculative and having a high degree of risk.
There can be no assurance that we will be able to detectdispose of it in the desired time period or prevent irregular accounting, employee misconduct or other fraudulent practices during the due diligence phase or during our efforts to monitor the investment on an ongoing basisat all, or that any risk management procedures implemented by usthe sale price of a property will be adequate.attractive at the relevant time or even exceed the carrying value of our investment. Moreover, if a property is mortgaged, we may not be able to obtain a release of the lien on that property without the payment of a substantial prepayment penalty, which may restrict our ability to dispose of the property, even though the sale might otherwise be desirable.
Some of our shopping centers have a low tax basis, which may result in a taxable gain on sale. We intend to utilize tax-deferred exchanges under Section 1031 of the Internal Revenue Code of 1986, as amended (the “IRC”), to mitigate taxable income (“Section 1031 Exchanges”); however, there can be no assurance that we will identify exchange shopping centers that meet our investment objectives for acquisitions. In the event of fraud by the seller of any portfolio property,that we do not utilize Section 1031 Exchanges, we may be required to distribute the gain proceeds to stockholders or pay income tax, which may reduce our cash flows available to fund our commitments and distributions to stockholders. Moreover, it is possible that future legislation could be enacted that could modify or repeal the laws with respect to Section 1031 Exchanges, which could make it more difficult or impossible for us to dispose of shopping centers on a tax-deferred basis.
We face competition and other risks in pursuing acquisition opportunities that could increase the cost of such acquisitions and/or limit our ability to grow, and we may not be able to generate expected returns or successfully integrate completed acquisitions into our existing operations.
We continue to evaluate the market for acquisition opportunities, and we may acquire shopping centers when we believe strategic opportunities exist. Our ability to acquire shopping centers on favorable terms and successfully integrate, operate, reposition, or redevelop them is subject to several risks. We may be unable to acquire a desired property because of competition from other real estate investors, including from other well-capitalized REITs and institutional investment funds. Even if we are able to acquire a desired property, competition from such investors may significantly increase the purchase price. We may also abandon acquisition activities after expending resources to pursue such opportunities. Once we acquire new shopping centers, these shopping centers may not yield expected returns for several reasons, including: (i) failure to achieve expected occupancy and/or rent levels within the projected time frame, if at all; (ii) inability to successfully integrate new shopping centers into existing operations; and (iii) exposure to fluctuations in the general economy, including due to the time lag between signing definitive documentation to acquire a new property and the closing of the acquisition. If any of these events occur, the cost of the acquisition may exceed initial estimates or the expected returns may not achieve those originally contemplated, which could adversely affect our financial condition, cash flows, and results of operations.
We share ownership of our unconsolidated joint ventures and do not have exclusive decision-making power, and as such, we are unable to ensure that our objectives will be pursued.
We have invested capital, and may invest additional capital, in unconsolidated joint ventures (instead of directly acquiring wholly-owned assets), for which we do not have exclusive decision-making power over the development, financing, leasing, management, and other aspects of these investments. As a result, the institutional joint venture partners might have interests or goals that are inconsistent with ours, take action contrary to our interests, or otherwise impede our objectives. Conflicts arising between us and our partners may be difficult to manage and/or resolve and it could be difficult to manage or otherwise monitor the existing business arrangements.
In addition, unconsolidated joint venture arrangements may decrease our ability to manage risk and implicate additional risks, such as: (i) potentially inferior financial capacity, diverging business goals and strategies and the need for our venture partners’ continued cooperation; (ii) the joint venture partners might become bankrupt, suffer a partialdeterioration in their creditworthiness, or total lossfail to fund their share of required capital investedcontributions; (iii) our inability to take actions with respect to the unconsolidated joint ventures’ activities that we believe are favorable to us if our institutional joint venture partners do not agree; (iv) our inability to control the legal entities that have title to the real estate associated with the joint ventures; (v) our lenders may not be easily able to sell our joint venture assets and investments or may view them less favorably as collateral, which could negatively affect our liquidity and capital resources; (vi) our institutional joint venture partners can take actions that we may not be able to anticipate or prevent, which could result in that property. An additional concern is the possibility of material misrepresentationnegative impacts on our debt and equity; and (vii) our institutional joint venture partners’ business decisions or omission on the part of the seller. Such inaccuracyother actions or incompletenessomissions may result in harm to our reputation or adversely affect the value of our investmentsinvestments.
Our real estate assets may decline in value and be subject to significant impairment losses, which may reduce our net income.
Our real estate properties are carried at cost less depreciation unless circumstances indicate that the carrying value of these assets may not be recoverable. We routinely evaluate whether there are any impairment indicators, including property operating performance, property occupancy trends, and actual marketing or listing price of properties being targeted for disposition, such portfolio property.that the value of the real estate properties (including any related tangible or intangible assets or liabilities) may not be recoverable. If, through our evaluation, we determine that a given asset exhibits one or more such indicators, we then compare the current carrying value of the asset to the estimated undiscounted cash flows that are directly associated with the use and ultimate disposition of the asset. Our estimated cash flows are based on several key assumptions, including rental rates, costs of Neighbor improvements, leasing commissions, anticipated holding periods, and assumptions regarding the residual value upon disposition, including the estimated exit capitalization rate. These key assumptions are subjective in nature and may differ materially from actual results. Changes in our disposition strategy or changes in the marketplace may
| | | | | | | | | | | |
PHILLIPS EDISON & COMPANY DECEMBER 31, 2023 FORM 10-K | | | 9 |
alter the holding period of an asset or asset group, which may result in an impairment loss and such loss may be material to our financial condition or operating performance. To the extent that the carrying value of the asset exceeds the estimated undiscounted cash flows, an impairment loss is recognized equal to the excess of carrying value over fair value.
The fair value of real estate assets is subjective and is determined through the use of comparable sales information and other market data if available. These subjective assessments have a direct effect on our net income because recording an impairment charge results in an immediate negative adjustment to net income, which may be material. During the year ended December 31, 2023, we incurred no impairment charges. We will rely uponcontinue to evaluate the accuracyrisk profile of each asset and completeness of representations made by sellers of portfolio propertiesmay potentially recognize impairments in future quarters. Accordingly, there can be no assurance that we will not record impairment charges in the due diligencefuture related to our assets.
We actively reinvest in our portfolio in the form of development and redevelopment projects, which have inherent risks that could adversely affect our financial condition, cash flows, and results of operations.
We actively pursue opportunities for outparcel development and existing property redevelopment. Development and redevelopment activities require various government and other approvals for entitlements and any delay in or failure to receive such approvals may significantly delay this process or prevent us from recovering our investment. We are subject to other risks associated with these activities, including the extent reasonable when we make our investments, but cannot guarantee such accuracy or completeness.following:
We•we may be unable to successfully integratelease developments and operate acquired properties, which may haveredevelopments to full occupancy on a material adverse effect on our businesstimely basis;
•the occupancy rates and operating results.
Even if we are able to make acquisitions on favorable terms, werents of a completed project may not be ablesufficient to successfully integratemake the project profitable;
•actual costs of a project may exceed original estimates, possibly making the project unprofitable;
•delays in the development or construction process may increase our costs;
•construction cost increases may reduce investment returns on development and operate them. Weredevelopment opportunities;
•we may abandon redevelopment opportunities and lose our investment due to adverse market conditions;
•the size of our development and redevelopment pipeline may strain our labor or capital capacity to complete projects within targeted timelines and may reduce our investment returns;
•a reduction in the demand for new retail space may reduce our future development and redevelopment activities, which in turn may reduce our net operating income; and/or
•changes in the level of future development activity may adversely impact our results from operations by reducing the amount of internal general overhead costs that may be required to invest significant capitalcapitalized.
Inflationary pressures, rising interest rates, supply chain disruptions, and resources after an acquisition to maintain or grow the properties that we acquire. In addition, welabor shortages may need to adapt our management, administrative, accounting, and operational systems, or hire and retain sufficient operational staff, to integrate and manage successfully any future acquisitionsexacerbate certain of additional assets. These and other integration efforts may disrupt our operations, divert management’s attention away from day-to-day operations and cause us to incur unanticipated costs. The difficulties of integration may be increased by the necessity of coordinating operations in geographically dispersed locations. Our failure to integrate successfully any acquisitions into our portfolio could have a material adverse effect on our business and operating results. Further, acquired properties may have liabilities or adverse operating issues thatthese risks. If we fail to discover through due diligence priorreinvest in our portfolio or maintain its attractiveness to the acquisition. The failure to discover such issues prior to such acquisitionretailers and consumers, if our capital improvements are not successful, or if retailers or consumers perceive that shopping at other venues (including e-commerce) is more convenient, cost-effective, or otherwise more compelling, our financial condition, cash flows, and results of operations could have a material adverse effect onbe adversely affected.
Adverse economic, regulatory, market, and real estate conditions may adversely affect our businessfinancial condition, cash flows, and results of operations.
Our properties may be subject to impairment charges.
We routinely evaluateportfolio is predominantly comprised of omni-channel neighborhood grocery-anchored shopping centers, and during the year ended December 31, 2023, our real estate investmentsholdings in Florida and California accounted for impairment indicators. The judgment regarding the existence of impairment indicators is based on factors such as market conditions, tenant performance12.2% and lease structure. For example, the early termination of, or default under, a lease by a tenant may lead to an impairment charge. Since our investment focus is on properties net leased to a single tenant, the financial failure of, or other default by, a single tenant under its lease may result in a significant impairment loss. If we determine that an impairment has occurred, we would be required to make a downward adjustment to the net carrying value of the property, which could have a material adverse effect on our results of operations in the period in which the impairment charge is recorded. Negative developments in the real estate market may cause us to reevaluate the business and macro-economic assumptions used in its impairment analysis. Changes in our assumptions based on actual results may have a material impact on our financial statements.
We may obtain only limited warranties when we purchase a property and would have only limited recourse in the event our due diligence did not identify any issues that lower the value10.9%, respectively, of our property.
The seller of a property often sells the property in its “as is” condition on a “where is” basis and “with all faults,” without any warranties of merchantability or fitness for a particular use or purpose. In addition, purchase agreements may contain only limited warranties, representations and indemnifications that will only survive for a limited period after the closing. The
purchase of properties with limited warranties increases the risk that we may lose some or all ofABR (including our invested capital in the property,wholly-owned portfolio as well as the lossprorated portion of rental incomeshopping centers owned through our joint ventures). Therefore, our performance is subject to risks associated with owning and operating neighborhood omni-channel grocery-anchored shopping centers, and may be further subject to additional risk as a result of the geographic concentration noted above. Such risks include, but are not limited to: (i) changes in national, regional, and local economic climates or demographics; (ii) competition from that property.
Changesother available shopping centers and e-commerce, and the attractiveness of our shopping centers to our Neighbors; (iii) increased competition for real estate assets targeted by our investment strategies; (iv) adverse local conditions, such as oversupply or reduction in supply of or demand for similar shopping centers in an area and changes in real properties in a particular areaestate zoning laws that may increasereduce the pricedesirability of real properties we seekestate in an area; (v) vacancies, changes in market rental rates, and the need to purchaseperiodically repair, renovate, and decreasere-lease space; (vi) ongoing disruption and/or consolidation in the price of real properties when we seekretail sector; (vii) increases in operating costs, due to sell them.
Theinflation or otherwise, including common area expenses, utilities, insurance, and real estate industry is subjecttaxes, which are relatively inflexible and generally do not decrease if revenue or occupancy decreases; (viii) increases in the costs to market forces. We are unable to predict certain market changes, includingrepair, renovate, and re-lease space; (ix) changes in supply of, or demand for, similar real properties in a particular area. Any potential purchase of an overpriced asset could decrease our rate of return on these investmentsinterest rates and result in lower operating results and overall returns to our stockholders.
Our portfolio may be concentrated in a limited number of industries, geographies or investments.
Our portfolio may be heavily concentrated at any time in only a limited number of industries, geographies or investments, and, as a consequence, our aggregate return may be substantially affected by the unfavorable performance of even a single investment. As of December 31, 2017, approximately 14.8% and 10.2% of our properties were located in Florida and Georgia, respectively. To the extent we concentrate our investments in a particular type of asset or geography, our portfolio may become more susceptible to fluctuations in value resulting from adverse economic or business conditions affecting that particular type of asset or geography. For investments that we plan to finance (directly or by selling assets), there is a risk that such financing may not be completed, which could result in us holding a larger percentage of our assets in a single investment and asset type than desired. Investors have no assurance as to the degree of diversification in our investments, either by geographic region or asset type.
We may be unable to adjust our portfolio in response to changes in economic or other conditions or sell a property if or when we decide to do so, limiting our ability to pay cash distributions to our stockholders.
Many factors that are beyond our control affect the real estate market and could affect our ability to sell properties on the terms that we desire. These factors include general economic conditions, the availability of financing, interest rateswhich may render the sale or refinance of a property or loan difficult or unattractive; (x) earthquakes, tornadoes, hurricanes, droughts, wildfires, or other weather and climate-related events and natural disasters, civil unrest, terrorist acts, or acts of war, which may result in uninsured or underinsured losses; (xi) epidemics, pandemics, or other widespread outbreaks or resulting public fear that disrupt the businesses of our Neighbors causing them to fail to pay rent on time or at all; and (xii) changes in laws and governmental regulations, including those governing usage, zoning, the environment, and taxes. Such risks also include, but are not limited to, those that could impact the financial stability of our Neighbors, including their ability to pay rent and expense reimbursements, such as supply chain disruptions and constraints, inflationary pressures throughout the supply chain, labor shortages and inflationary pressures on wages, increases in retail theft, and other factors, including supplyrisks and demand. Because real estate investments are relatively illiquid, we have a limited ability to vary our portfoliouncertainties described elsewhere in response to changes in economic orthis "Risk Factors" section. These and other conditions. Further, before we can sell a property on the terms we want, it may be necessary to expend funds to correct defects or to make improvements. However, we can give no assurance that we will have the funds available to correct such defects or to make such improvements. We may be unable to sell our properties at a profit. Our inability to sell properties on the terms we want could reduce our cash flow and limit our ability to make distributions to our stockholders and could reduce the value of our stockholders’ investments. Moreover, in acquiring a property, we may agree to restrictions that prohibit the sale of that property for a period of time or impose other restrictions, such as a limitation on the amount of debt that can be placed or repaid on that property. We cannot predict the length of time needed to find a willing purchaser and to close the sale of a property. Our inability to sell a property when we desire to do so may cause us to reduce our selling price for the property. Any delay in our receipt of proceeds, or diminishment of proceeds, from the sale of a propertyfactors could adversely affect our ability to pay distributions tofinancial condition, cash flows, and results of operations.
| | | | | | | | | | | |
PHILLIPS EDISON & COMPANY DECEMBER 31, 2023 FORM 10-K | | | 10 |
The continued shift in retail sales towards e-commerce may adversely affect our stockholders.financial condition, cash flows, and results of operations.
We have acquired,Retailers are increasingly affected by e-commerce and may continue to acquire or finance, properties with lock-out provisions,changes in customer buying habits, which may prohibit us from selling a property, or may require us to maintain specified debt levels for a period of years on some properties.
A lock-out provision is a provision that prohibits the prepayment of a loan during a specified period of time. Lock-out provisions may include terms that provide strong financial disincentives for borrowers to prepay their outstanding loan balance and exist in order to protect the yield expectations of lenders. We currently own properties, and may acquire additional properties in the future, that are subject to lock-out provisions. Lock-out provisions could materially restrict us from selling or otherwise disposing of or refinancing properties when we may desire to do so. Lock-out provisions may prohibit us from reducing the outstanding indebtedness with respect to any properties, refinancing such indebtedness on a non-recourse basis at maturity, or increasing the amount of indebtedness with respect to such properties. Lock-out provisions could impair our ability to take other actions during the lock-out period that could be in the best interests of our stockholders and, therefore, may have an adverse impact on the value of our shares relative to the value that would result if the lock-out provisions did not exist. In particular, lock-out provisions could preclude us from participating in major transactions that could result in a disposition of our assets or a change in control even though that disposition or change in control might be in the best interests of our stockholders.
If we set aside insufficient capital reserves, we may be required to defer necessary capital improvements.
If we do not have enough reserves for capital to supply needed funds for capital improvements throughout the life of the investment in a property and there is insufficient cash available from our operations, we may be required to defer necessary improvements to a property, which may cause that property to suffer from a greater risk of obsolescence or a decline in value, or a greater risk of decreased cash flowwere further accelerated as a result of fewer potential tenants being attractedthe COVID-19 pandemic, including the delivery or curbside pick-up of items ordered online. Retailers are considering these e-commerce trends when making decisions regarding their brick and mortar stores and how they will compete and innovate in a rapidly changing e-commerce environment. Many retailers in our shopping centers provide services or sell goods that are unable to be performed online (such as haircuts, massages, and fitness centers) or that have historically been less likely to be purchased online (such as grocery stores, restaurants, and coffee shops); however, the property.continuing increase in e-commerce sales (including online orders for immediate delivery or pickup in store) may cause retailers to adjust the size or number of retail locations in the future or close stores. Our grocer Neighbors are incorporating e-commerce concepts through home delivery or curbside pickup, which could reduce foot traffic at our centers and adversely affect our occupancy and rental rates. Changes in shopping trends as a result of the growth in e-commerce may also affect the profitability of retailers that do not adapt to changes in market conditions. While we devote considerable effort and resources to analyze and respond to Neighbor trends, Neighbor and consumer preferences, and consumer spending patterns, we cannot predict with certainty what future Neighbors will want, what future retail spaces will look like, or how much revenue will be generated at traditional brick and mortar locations. If this happens, we may not be ableare unable to maintain projectedanticipate and respond promptly to trends in the market (such as space for a drive through or curbside pickup), our occupancy levels and rental rates for affected properties,may decline, and our financial condition, cash flows, and results of operations may be negativelyadversely impacted.
If we are unable to obtain fundingActual incremental unlevered yields for future capital needs, cash distributions to our stockholdersdevelopment and the value ofredevelopment projects may vary from our investments could decline.underwritten incremental unlevered yield range.
When tenants do not renew their leases or otherwise vacate their space, we will often need to expend substantial funds for improvements to the vacated space in order to attract replacement tenants. Even when tenants do renew their leases, we may agree to make improvements to their space asAs part of our negotiation. Ifstandard development and redevelopment underwriting process, we need additional capitalanalyze the yield for each project and establish a range of target yields (“underwritten incremental unlevered yields”). Underwritten incremental unlevered yields reflect the yield we target to generate from each project upon expected stabilization and are calculated as the estimated incremental NOI for a project at stabilization divided by its estimated net project investment. The estimated incremental NOI is the difference between the estimated annualized NOI we target to generate from a project upon stabilization and the estimated annualized NOI without the planned improvements. Underwritten incremental unlevered yield does not include peripheral impacts, such as lease rollover risk or the impact on the long term value of the property upon sale or disposition.
Underwritten incremental unlevered yields are based solely on our estimates, using data available to us in our development and redevelopment underwriting processes. The actual total cost to complete a development or redevelopment project may differ substantially from our estimates due to various factors, including unanticipated expenses, delays in the futureestimated start and/or completion date of planned development projects, and other contingencies. In addition, the actual incremental NOI from our planned development and redevelopment activities may differ substantially from our estimates based on numerous other factors, including delays and/or difficulties in leasing and stabilizing a development or redevelopment project, failure to improveobtain estimated occupancy and rental rates, inability to collect anticipated rental revenues, Neighbor bankruptcies, and unanticipated expenses that we cannot pass on to our Neighbors. Actual incremental unlevered yields may vary from our underwritten incremental unlevered yield range based on the actual total cost to complete a project and its incremental NOI at stabilization.
Pandemics, epidemics, or maintain our properties or for any other reason, wehealth crises may have to obtain financing from sources, beyonda negative effect on our funds fromand our Neighbors’ businesses, financial condition, results of operations, such as borrowings or future equity offerings. These sources of funding may not be available on attractive terms or at all. If we cannot procure additional funding for capital improvements, our investments may generate lower cash flows, and liquidity.
Our business, and the businesses of our Neighbors, could be materially and adversely affected by the risks, or declinethe public perception of the risks, related to a pandemic, epidemic, or other health crisis, like the COVID-19 pandemic, especially if there is a negative impact to customers’ willingness or ability to frequent our Neighbors’ businesses.
As was experienced during the COVID-19 pandemic, such crises could cause significant disruptions to the United States and global economy and contribute to significant volatility and negative pressure in value,financial markets. Government responses, including quarantines, restrictions on travel, mandatory closures of businesses, or both,other restrictions, as well as changes in consumer behavior, could negatively impact our tenants and their ability to operate their businesses, which would limitcould impact our ability to make distributionscollect on current or past due rent payments or fully recover amounts due under the terms of a lease agreement in the event of a default by a Neighbor.
The unpredictable nature of pandemics, epidemics, and other health crises precludes any prediction as to one’s ultimate adverse impact. A worsening of the economic, political, and social environment as a result presents material risks and uncertainties with respect to our stockholders and could reduce the value of your investment.
Our operating expenses may increase in the future, and, to the extent such increases cannot be passed on to tenants, our cash flow and our operatingNeighbors’ business, financial condition, results of operations, cash flows, liquidity, and ability to satisfy debt service obligations.
An increased focus on metrics and reporting related to ESG factors may impose additional costs and expose us to new risks.
Investors and other stakeholders have become more focused on understanding how companies address a variety of ESG factors. When evaluating investment decisions, many investors and shareholders look not only at company ESG disclosures, but also to ESG rating systems that have been developed by third-party groups to allow comparisons between companies. Although we participate in a number of these ratings systems, and generally score relatively well in those in which we do participate, we do not participate in, and would decrease.
Operating expenses, suchnot necessarily score as expenses for fuel, utilities, laborwell in, all of the available rating systems. Further, the criteria used in these ratings systems may change frequently, and insurance, are not fixed and may increase in the future. There is nowe cannot guarantee that we will be able to pass such increases on toscore well as criteria change. We supplement our tenants. To the extent such increases cannot be passed on to tenants, any such increase would causeparticipation in ratings systems with corporate disclosure of our cash flow and our operating results to decrease.
Our real properties are subject to propertyESG activities, but many investors and other taxesstakeholders may look for disclosures that we do not provide. In addition, the SEC is currently evaluating rulemaking that is likely to impose additional ESG disclosure and other requirements on us. Failure to participate in certain of the third-party ratings systems, failure to score well in those ratings systems, failure to provide certain ESG disclosures, or unfavorable comparisons in these areas to other companies, could result in reputational harm when investors or others compare us against similar companies in our industry, could result in investor engagement on our ESG initiatives and
| | | | | | | | | | | |
PHILLIPS EDISON & COMPANY DECEMBER 31, 2023 FORM 10-K | | | 11 |
disclosures or increased costs relating to ESG initiatives, and could cause certain investors to be unwilling to invest in our stock, which could adversely impact our ability to raise capital.
Risks Related to Our Indebtedness and Liquidity
We have substantial indebtedness, and we may increaseneed to incur additional indebtedness, including recourse debt, in the future, which could adversely affect our cash flow.
Our real properties are subject to propertybusiness, financial condition, and other taxes that may increase as tax rates change and as the real properties are assessed or reassessed by taxing authorities. We anticipate that certain of our leases will generally provide that the property taxes, or increases therein, are charged to the lessees as an expense related to the real properties that they occupy, while other leases will generally provide that we are responsible for such taxes. In any case, as the owner of the properties, we are ultimately responsible for payment of the taxes to the applicable government authorities. If real property taxes increase, our tenants may be unable to make the required tax payments, ultimately requiring us to pay the taxes even if otherwise stated under the terms of the lease. If we fail to pay any such taxes, the applicable taxing authority may place a lien on the real property and the real property may be subject to a tax sale. In addition, we are generally responsible for real property taxes related to any vacant space.
Uninsured losses relating to real property or excessively expensive premiums for insurance coverage could reduce our cash flows and the return on our stockholders’ investments.
We will attempt to adequately insure all of our real properties against casualty losses. There are types of losses, generally catastrophic in nature, such as losses due to wars, acts of terrorism, earthquakes, floods, hurricanes, pollution or environmental matters, that are uninsurable or not economically insurable, or may be insured subject to limitations, such as large deductibles or co-payments. Insurance risks associated with potential acts of terrorism could sharply increase the premiums we pay for coverage against property and casualty claims. Additionally, mortgage lenders in some cases have begun to insist that commercial property owners purchase coverage against terrorism as a condition for providing mortgage loans. Such insurance policies may not be available at reasonable costs, if at all, which could inhibit our ability to finance or refinance our properties. In such instances, we may be required to provide other financial support, either through financial assurances or self-insurance, to cover potential losses. We may not have adequate, or any, coverage for such losses. Changes in the cost or availability of insurance could expose us to uninsured casualty losses. If any of our properties incur a casualty loss that is not fully insured, the value of our assets will be reduced by any such uninsured loss, which may reduce the value of our stockholders’ investments. In addition, other than any working capital reserve or other reserves we may establish, we have no source of funding to repair or reconstruct any uninsured property. Also, to the extent we must pay unexpectedly large amounts for insurance, we could suffer reduced earnings that would result in lower distributions to stockholders. The Terrorism Risk Insurance Act of 2002 is designed for a sharing of terrorism losses between insurance companies and the federal government.
Costs of complying with governmental laws and regulations related to environmental protection and human health and safety may reduce our net income and the cash available formake distributions to our stockholders.
Real property and the operations conducted on real property are subject to federal, state and local laws and regulations relating to protection of the environment and human health. We could be subject to liability in the form of fines, penalties or damages for noncompliance with these laws and regulations. These laws and regulations generally govern wastewater discharges, air emissions, the operation and removal of underground and above-ground storage tanks, the use, storage, treatment, transportation and disposal of solid and hazardous materials, the remediation of contamination associated with the release or disposal of solid and hazardous materials, the presence of toxic building materials, and other health and safety- related concerns.
Some of these laws and regulations may impose joint and several liability on the tenants, owners or operators of real property for the costs to investigate or remediate contaminated properties, regardless of fault, whether the contamination occurred prior to purchase, or whether the acts causing the contamination were legal. Our tenants’ operations, the condition of properties at the time we buy them, operations in the vicinity of our properties, such as the presence of underground storage tanks, or activities of unrelated third parties may affect our properties.
The presence of hazardous substances, or the failure to properly manage or remediate these substances, may hinder our ability to sell, rent or pledge such property as collateral for future borrowings. Environmental laws also may impose liens on property or restrictions on the manner in which property may be used or businesses may be operated, and these restrictions may require substantial expenditures or prevent us from entering into leases with prospective tenants that may be impacted by such laws. Some of these laws and regulations have been amended so as to require compliance with new or more stringent standards as of future dates. Compliance with new or more stringent laws or regulations or stricter interpretation of existing laws may require us to incur material expenditures. Future laws, ordinances or regulations may impose material environmental liability. Any material expenditures, fines, penalties, or damages we must pay will reduce our ability to make distributions and may reduce the value of our stockholders’ investments.
The costs of defending against claims of environmental or personal injury liability, or of paying such claims could reduce the amounts available for distribution to our stockholders.
Environmental laws provide for sanctions for noncompliance and may be enforced by governmental agencies or, in certain circumstances, by private parties. Certain environmental laws and common law principles could be used to impose liability for the release of and exposure to hazardous substances, including asbestos-containing materials and lead-based paint. Third parties may seek recovery from real property owners or operators for personal injury or property damage associated with exposure to released hazardous substances. The costs of defending against claims of environmental or personal injury liability or of paying such claims could reduce the amounts available for distribution to our stockholders. Generally, we expect that the real estate properties that we acquire will have been subject to Phase I environmental assessments at the time they were
acquired. A Phase I environmental assessment or site assessment is an initial environmental investigation to identify potential environmental liabilities associated with the current and past uses of a given property.
We could become subject to liability for environmental violations, regardless of whether we caused such violations.
We could become subject to liability in the form of fines or damages for noncompliance with environmental laws and regulations. These laws and regulations generally govern wastewater discharges, air emissions, the operation and removal of underground and above-ground storage tanks, the use, storage, treatment, transportation and disposal of solid hazardous materials, the remediation of contaminated property associated with the disposal of solid and hazardous materials and other health and safety-related concerns. Some of these laws and regulations may impose joint and several liability on tenants, owners or managers for the costs of investigation or remediation of contaminated properties, regardless of fault or the legality of the original disposal. Under various federal, state and local environmental laws, ordinances, and regulations, a current or former owner or manager of real property may be liable for the cost to remove or remediate hazardous or toxic substances, wastes, or petroleum products on, under, from, or in such property. These costs could be substantial and liability under these laws may attach whether or not the owner or manager knew of, or was responsible for, the presence of such contamination.
Even if more than one person may have been responsible for the contamination, each liable party may be held entirely responsible for all of the clean-up costs incurred.
In addition, third parties may sue the owner or manager of a property for damages based on personal injury, natural resources, or property damage and/or for other costs, including investigation and clean-up costs, resulting from the environmental contamination. The presence of contamination on one of our properties, or the failure to properly remediate a contaminated property, could give rise to a lien in favor of the government for costs it may incur to address the contamination, or otherwise adversely affect our ability to sell or lease the property or borrow using the property as collateral. In addition, if contamination is discovered on our properties, environmental laws may impose restrictions on the manner in which the property may be used or businesses may be operated, and these restrictions may require substantial expenditures or prevent us from entering into leases with prospective tenants. There can be no assurance that future laws, ordinances or regulations will not impose any material environmental liability, or that the environmental condition of our properties will not be affected by the operations of the tenants, by the existing condition of the land, by operations in the vicinity of the properties. There can be no assurance that these laws, or changes in these laws, will not have a material adverse effect on our business, results of operations or financial condition.
Compliance or failure to comply with the Americans with Disabilities Act could result in substantial costs and may decrease cash available for distributions.
Our properties are, or may become subject to, the Americans with Disabilities Act of 1990, as amended (the “Disabilities Act”). Under the Disabilities Act, all places of public accommodation are required to comply with federal requirements related to access and use by disabled persons. The Disabilities Act has separate compliance requirements for “public accommodations” and “commercial facilities” that generally require that buildings and services be made accessible and available to people with disabilities. We may be required to make substantial capital expenditures to make upgrades at our properties or otherwise comply with Disabilities Act requirements. We are currently, and may be in the future, subject to third party and/or class action litigation with respect to Disabilities Act requirements, which could result in the imposition of injunctive relief, monetary penalties, or, in some cases, an award of damages. While we attempt to acquire properties that are already in compliance with the Disabilities Act or place the burden of compliance on the seller or other third party, such as a tenant, we cannot assure you that we will be able to acquire properties or allocate responsibilities in this manner. Any of our funds used for Disabilities Act compliance will reduce our net income and the amount of cash available for distributions to our stockholders.
Our business and operations would suffer in the event of system failures.
Despite system redundancy, the implementation of security measures and the existence of a disaster recovery plan for our internal information technology systems, our systems are vulnerable to damages from any number of sources, including computer viruses, unauthorized access, energy blackouts, natural disasters, terrorism, war, and telecommunication failures. Any system failure that causes interruptions in our operations could result in a material disruption to our business. We may also incur additional costs to remedy damages caused by such disruptions.
The occurrence of cyber incidents, or a deficiency in our cybersecurity, could negatively impact our business by causing a disruption to our operations, a compromise or corruption of our confidential information, and/or damage to our business relationships, all of which could negatively impact our financial results.
A cyber incident is considered to be any adverse event that threatens the confidentiality, integrity, or availability of our information resources. More specifically, a cyber incident is an intentional attack or an unintentional event that can include gaining unauthorized access to systems to disrupt operations, corrupt data, or steal confidential information. As our reliance on technology has increased, so have the risks posed to our systems, both internal and those we have outsourced. Our three primary risks that could directly result from the occurrence of a cyber incident include operational interruption, damage to our relationship with our tenants, and private data exposure. We have implemented processes, procedures and controls to help mitigate these risks, but these measures, as well as our increased awareness of a risk of a cyber incident, do not guarantee that our financial results will not be negatively impacted by such an incident.
Risks Associated with Debt Financing
We have incurred mortgage indebtedness, and we are likely to incur other indebtedness, which increases our business risks, could hinder our ability to pay distributions, and could decrease the value of your investment.
We have obtained, and are likely tomay continue to obtain, lines of credit, and other long-term financing that are secured by our propertiesshopping centers and other assets. Our charter does not limit the amountOn December 31, 2023, we had indebtedness of funds that$2.0 billion comprised of $1.5 billion in unsecured debt, $0.4 billion in outstanding secured loan facilities, and $0.1 billion in mortgage loans and finance lease obligations. In connection with executing our business strategies, we expect to evaluate additional acquisitions and strategic investments, and we may borrow. In some instances, we may acquire real propertieselect to finance these endeavors by financing a portion of the price of the properties and mortgaging or pledging some or all of the properties purchased as security for that debt. incurring additional indebtedness. We may also incur mortgage debt on propertiesshopping centers that we already own in order to obtain funds to acquire additional properties.shopping centers or make other capital investments. In addition, we may borrow as necessary or advisable to ensure that we maintain our qualification as a REIT for U.S. federal income tax purposes, including borrowings to satisfy the REIT requirement that we distribute at least 90% of our annual REIT taxable income to our stockholders (computed without regard to the dividends-paid deduction and excluding net capital gain). We, however, can give our stockholders no assuranceHowever, we cannot guarantee that we will be able to obtain any such borrowings on satisfactory terms.
High Additionally, if we have insufficient income to service any recourse debt levels will causeobligations, our lenders could institute proceedings against us to incur higher interest charges, which would result in higher debt service payments and could be accompanied by restrictive covenants. foreclose upon our assets.
If we do mortgage a property and there is a shortfall between the cash flowflows from that property and the cash flowflows needed to service mortgage debt on that property, then the amount of cash available for distributions to stockholders may be reduced. In addition, incurring mortgage debt increases the risk of loss of a property sincebecause defaults on indebtedness secured by a property may result in lenders initiating foreclosure actions. In that case,If any mortgages contain cross-collateralization or cross-default provisions, a default on a single property could affect multiple shopping centers. Additionally, we could lose the property securing the loan that is in default, reducing the value of our stockholders’ investments. For tax purposes, a foreclosure of any of our properties would be treated as a sale of the property for a purchase price equal to the outstanding balance of the debt secured by the mortgage. If the outstanding balance of the debt secured by the mortgage exceeds our tax basis in the property, we would recognize taxable income on foreclosure even though we would not necessarily receive any cash proceeds. We may give full or partial guarantiesguarantees to lenders of mortgage debt on behalf of the entities that own our properties.shopping centers. When we give a guaranty on behalf of an entity that owns one of our properties,shopping centers, we will be responsible to the lender for satisfaction of the debt if it is not paid by such entity. If any mortgages contain cross- collateralization or cross-default provisions,Currently, we are a defaultlimited guarantor on a single property could affect multiple properties.mortgage loan for our unconsolidated joint venture. Our guarantee is limited to being the non-recourse carveout guarantor and the environmental indemnitor.
We may also obtain recourseHigh debt to finance our acquisitions and meet our REIT distribution requirements. If welevels could have insufficient income to service our recourse debt obligations, our lenders could institute proceedings against us to foreclose upon our assets. If a lender successfully forecloses upon any of our assets,material adverse consequences for the Company, including hindering our ability to payadjust to changing market, industry, or economic conditions; limiting our ability to access the capital markets to refinance maturing debt or to fund acquisitions or emerging businesses; requiring the use of a substantial portion of our cash distributions toflows for the payment of principal and interest on our stockholders will be limited, and our stockholders could lose all or part of their investment.
Increases in interest rates could increasedebt, thereby limiting the amount of our loan payments and adversely affect our ability to pay distributions to our stockholders.
Interest we pay on our loan obligations will reducefree cash flow available for distributions. If we obtain variablefuture operations, acquisitions, distributions, stock repurchases, or other uses; making us more vulnerable to economic or industry downturns, including interest rate loans, increases in interest rates would increase our interest costs, which would reduce our cash flowsincreases; and our abilityplacing us at a competitive disadvantage compared to pay distributions to stockholders. In addition, if we need to repay existing loans during periods of rising interest rates, we could be required to liquidate one or more of our investments in properties at times which may not permit realization of the maximum return on such investments.
If mortgage debt is unavailable at reasonable rates, we may not be able to finance the purchase of properties. If we place mortgage debt on properties, we run the risk of being unable to refinance the properties when the debt becomes due or of being unable to refinance on favorable terms. If interest rates are higher when we refinance the properties, our income could be reduced. We may be unable to refinance properties. If any of these events occurs, our cash flow would be reduced. This, in turn, would reduce cash available for distribution to our stockholders and may hinder our ability to raise capital by issuing more stock or borrowing more money.less leveraged competitors.
We may not be able to access financing on favorable terms, or refinancing sources on attractive terms, which could adversely affect our ability to execute our business plan.at all.
We may finance our assets over the long-term through a variety of means, including repurchase agreements,unsecured bonds, credit facilities, secured pools, issuance of commercial mortgage-backed securities, collateralized debt obligations and other structured financings. Our ability to execute this strategy will depend on various market conditions in the markets for financing in this manner that are beyond our control, including lack of liquiditycapital availability and greater credit spreads. We cannot be certain that these markets will remain an efficient source of long-term financing for our assets. If our strategy is not viable, we will have to find alternative forms of long-term financing for our assets, as secured revolving credit facilities and repurchase facilities may not accommodate long-term financing.assets. This could subject us to more recourse indebtedness and the risk that debt service on less efficient forms of financing would require a larger portion of our cash flows, thereby reducing cash available for distribution to our stockholders and funds available for operations as well as for future business opportunities.
LendersCovenants in our loan agreements may require us to enter into restrictive covenants relating torestrict our operations which could limitand adversely affect our financial condition and ability to make distributions to our stockholders.
When providing financing, a lender may impose restrictions on us that affect our distribution and operating policies and our ability to incur additional debt. LoanOur loan agreements into which we enter may contain covenants that limit our ability to further mortgage a property or discontinue insurance coverage or replace PE-NTR.coverage. In addition, loan documentsagreements may limit our ability to replace a property’s property managerenter into or terminate certain operating or lease agreements related to a property. Mortgage debt and other property-level debt that we may incur may also limit our ability to transfer properties from one subsidiary to another. These or other limitations would decrease our operating flexibility and our ability to achieve our operating objectives, which may adversely affect our financial condition and ability to make distributions to our stockholders.
Covenants in certain of our loan agreements specify that certain named individuals must remain a member of management and/or the Board or require certain level of management or Board continuity in connection with a fundamental transaction.
Our derivative financial instrumentsCertain of our loan agreements contain covenants that require certain named individuals, including Mr. Edison, to continue serving as a member of management and/or the Board or require certain levels of senior management and/or Board continuity following a change of control or other fundamental transaction. If such individuals were to depart from the Company within a specified time prior to such transaction or within such specified time after such a transaction, we usemay be required to hedge against interest rate fluctuationsnegotiate waivers of such covenants or obtain replacement financing, which we may not be successfulable to do on satisfactory terms or at all.
Higher market capitalization rates and lower NOI for our shopping centers may adversely impact our ability to sell shopping centers and fund developments and acquisitions, and may dilute earnings.
As part of our capital recycling strategy, we sell shopping centers that no longer meet our growth and investment objectives due to stabilization or perceived future risk. Sales proceeds are then used to fund the construction of developments, redevelopments, expansions, and acquisitions, and to repay debt. An increase in mitigatingmarket capitalization rates or a decline in NOI may cause a reduction in the value of shopping centers identified for sale, which would have an adverse effect on the
| | | | | | | | | | | |
PHILLIPS EDISON & COMPANY DECEMBER 31, 2023 FORM 10-K | | | 12 |
amount of cash generated. Additionally, the sale of shopping centers resulting in significant tax gains may require higher distributions to our risks associated withstockholders in order to maintain our REIT status or payment of additional income taxes. We intend to utilize Section 1031 Exchanges to mitigate taxable income. However, there can be no assurance that we will identify exchange shopping centers that meet our investment objectives for acquisitions.
Increases in interest rates could increase the amount of our interest payments and could reduceadversely affect our ability to pay distributions to our stockholders.
Although a significant amount of our outstanding debt has fixed interest rates, we borrow funds at variable interest rates under our credit facilities and term loans. As of December 31, 2023, 22.4% of our outstanding debt was variable rate debt. Increases in interest rates would increase our interest expense on any variable rate debt to the overall returns onextent we have not hedged our stockholders’ investment.
We use derivative financial instrumentsexposure to hedge exposureschanges in interest rates. In addition, increases in interest rates will affect the terms under which we refinance our existing debt as it matures, to the extent we have not hedged our exposure to changes in interest rates, on loans secured by our assets, but no hedging strategy can protect us completely. We cannot assure our stockholders that our hedging strategyresulting in higher interest rates and the derivatives that we use will adequately offset the riskincreased interest expense. Either of interest rate volatility or that our hedging transactions will not result in losses. In addition, the use of such instruments may reduce the overall return on our investments. These instruments may also generate income that may not be treated as qualifying REIT income for purposes of the 75% or 95% REIT income test.
Interest-only indebtedness may increase our risk of default and ultimately maythese events would reduce our funds available for distribution to our stockholders.
We have financed certain of our property acquisitions using interest-only mortgage indebtedness. During the interest-only period, the amount of each scheduled payment is less than that of a traditional amortizing mortgage loan. The principal balance of the mortgage loan will not be reduced (except in the case of prepayments) because there are no scheduled monthly payments of principal during this period. After the interest-only period, we will be required either to make scheduled payments of amortized principalfuture earnings and interest or to make a lump-sum or balloon payment at maturity. These required principal or balloon payments will increase the amount of our scheduled payments and may increase our risk of default under the related mortgage loan. If the mortgage loan has an adjustable interest rate, the amount of our scheduled payments also may increase at a time of rising interest rates. Increased payments and substantial principal or balloon maturity payments will reduce the funds available for distribution to our stockholders because cash otherwise available for distribution will be required to pay principal and interest associated with these mortgage loans.
If we enter into financing arrangements involving balloon payment obligations, itflows, which may adversely affect our ability to make distributionsservice our debt and meet our other obligations and also may reduce the amount we are able to ourdistribute to stockholders.
SomeHedging activity may expose us to risks, including the risks that a counterparty will not perform and that the hedge will not yield the economic benefits we anticipate, which may adversely affect our financial condition, cash flows, and results of operations.
From time to time, we manage our exposure to interest rate volatility by using interest rate hedging arrangements that involve risk, including but not limited to, the risk that counterparties may fail to honor their obligations under these arrangements, that these arrangements may not be effective in reducing our exposure to interest rate changes, and that we may be required to pay the counterparty if interest rates decrease in the future below the hedged amount. There can be no assurance that our hedging arrangements will qualify for hedge accounting or that our hedging activities will have the desired beneficial impact on our results of operations. Should we desire to terminate a hedging agreement, there may be significant costs and cash requirements involved to fulfill our obligations under the hedging agreement. Failure to hedge effectively against interest rate changes may adversely affect our financial condition, cash flows, and results of operations.
Risks Related to Our Corporate Structure and Organization
The Operating Partnership’s limited partnership agreement grants certain rights and protections to the limited partners, which allows them to vote in connection with a change of control transaction that might involve a premium price for shares of our financing arrangementscommon stock.
The Operating Partnership’s limited partnership agreement grants certain rights and protections to the limited partners, including granting them the right to vote in connection with a change of control transaction. Any such change of control transaction is required to be approved by holders of ownership units of the Operating Partnership (“OP units”) (including our Company and its subsidiaries) at the same level of approval as required for approval by holders of shares of our common stock. For purposes of any such vote, we will be deemed to vote the OP units held by us and our subsidiaries in proportion to the manner in which all of our outstanding shares of common stock were voted at a stockholders meeting relating to such transaction. As of December 31, 2023, we would have directly or indirectly controlled approximately 89.3% of the OP units. Furthermore, as of December 31, 2023, Mr. Edison had voting control over approximately 6.9% of the OP units (considering OP units owned by us), and therefore could have influence over votes on change of control transactions.
We and our consolidated subsidiary, the Operating Partnership, entered into tax protection agreements with certain protected partners, which may limit the Operating Partnership’s ability to sell or otherwise dispose of certain shopping centers and may require the Operating Partnership to maintain certain debt levels that otherwise would not be required to operate its business.
We and the Operating Partnership entered into a tax protection agreement on October 4, 2017 (the “2017 TPA”) with, among others, Mr. Edison, and certain entities controlled by him at the closing of a transaction in May 2017 pursuant to which we internalized our management structure through the acquisition of certain real estate assets and the third-party investment management business of Phillips Edison Limited Partnership (“PELP”) in exchange for OP units and cash. Pursuant to the 2017 TPA, if the Operating Partnership: (i) sells, exchanges, transfers, or otherwise disposes of certain shopping centers in a taxable transaction, or undertakes any taxable merger, combination, consolidation or similar transaction (including a transfer of all or substantially all assets), for a period of ten years commencing on October 4, 2017; or (ii) fails, prior to the expiration of such period, to maintain certain minimum levels of indebtedness that would be allocable to each protected partner for tax purposes or, under certain circumstances, fails to offer such protected partners the opportunity to guarantee certain types of the Operating Partnership’s indebtedness, then the Operating Partnership will indemnify each affected protected partner, including Mr. Edison, against certain resulting tax liabilities. Our tax indemnification obligations include a tax gross-up. As of December 31, 2023, 28 of our 281 wholly-owned shopping centers, four outparcels, and the land under which one of our properties is located, comprising approximately 10.5% of our ABR, are subject to the protection described in clause (i) above, and the potential “make-whole amount” on the estimated aggregate amount of built-in gain subject to such protection is approximately $122.7 million.
| | | | | | | | | | | |
PHILLIPS EDISON & COMPANY DECEMBER 31, 2023 FORM 10-K | | | 13 |
We and the Operating Partnership entered into an additional tax protection agreement (the “2021 TPA”) on July 19, 2021 with Mr. Edison, Mr. Murphy, and Mr. Myers, which will become effective upon the expiration of the 2017 TPA. The 2021 TPA generally has the following terms: (i) the 2021 TPA will severally provide to Mr. Edison, Mr. Murphy, and Mr. Myers the same protection provided under the 2017 TPA until 2031, so long as (a) Mr. Edison, Mr. Murphy, or Mr. Myers (or their permitted transferees), as applicable, individually owns at least 65% of the OP units owned by him as of the date of the execution of the 2021 TPA and (b) in the case of Mr. Murphy or Mr. Myers, Mr. Edison individually owns at least 65% of the OP units owned by him as of the date of the execution of the 2021 TPA; and (ii) the 2021 TPA will provide that following the expiration of the four-year tax protection period under the 2021 TPA, for so long as Mr. Edison holds at least $5.0 million in value of OP units, (a) Mr. Edison will have the opportunity to guarantee debt of the Operating Partnership or enter into a “deficit restoration” obligation, and (b) the Operating Partnership will provide reasonable notice to Mr. Edison before effecting a significant transaction reasonably likely to result in the recognition of more than one-third of the built-in gain allocated to Mr. Edison that is protected under the 2017 TPA as of the date that the 2021 TPA is executed, and will consider in good faith any proposal made by Mr. Edison relating to structuring such transaction in a manner to avoid or mitigate adverse tax consequences to him.
Therefore, although it may be in our stockholders’ best interest for us to cause the Operating Partnership to sell, exchange, transfer or otherwise dispose of one or more of these shopping centers, it may be economically prohibitive for us to do so until the expiration of the applicable protection period because of these indemnity obligations. Moreover, these obligations may require us to makecause the Operating Partnership to maintain more or different indebtedness than we would otherwise require for our business. As a lump-sum or “balloon” payment at maturity. Our ability to make a balloon payment at maturity is uncertain and may depend uponresult, the tax protection agreements could, during their term, restrict our ability to obtain additional financingtake actions or make decisions that otherwise would be in our ability to sell the property. At the time the balloon payment is due, we may or may not be able to refinance the balloon payment on terms as favorable as the original loan or sell the property at a price sufficient to make the balloon payment. The effect of a refinancing or sale could affect the rate of return to stockholders and the projected time of disposition of our assets. In addition, payments of principal and interest made to service our debts may leave us with insufficient cash to pay the distributions that we are required to pay to maintain our qualification as a REIT. Any of these results would have a significant, negative impact on our stockholders’ investments.
Risks Related to our Organization and Qualification as a REITbest interests.
Our stockholders have limited control over changes in our policies and operations, which increases the uncertainty and risks our stockholders face.
Our Board determines our major policies, including our policies regarding financing, growth, debt capitalization, REIT qualification, and distributions. Our Board may amend or revise these and other policies without athe vote of theour stockholders. Under the Maryland General Corporation Law, as amended (“MGCL”) and our charter, our stockholders have a right to vote only on limited matters. Our board’sBoard’s broad discretion in setting policies and our stockholders’ inability to exert control over those policies increases the uncertainty and risks our stockholders face.
We may change our targeted investments without stockholder consent.
Our portfolio is primarily invested in well-occupied, grocery-anchored neighborhood and community shopping centers leased to a mix of national, creditworthy retailers selling necessity-based goods and services in strong demographic markets throughout the United States. Though this is our current target portfolio, we may make adjustments to our target portfolio based on real estate market conditions and investment opportunities, and we may change our targeted investments and investment guidelines at any time without the consent of our stockholders, which could result in our making investments that are different from, and possibly riskier than, our current targeted investments. A change in our targeted investments or investment guidelines may increase our exposure to interest rate risk, default risk and real estate market fluctuations, all of which could adversely affect the value of our common stock and our ability to make distributions to our stockholders.
Our stockholders’ interests in us will be diluted if we issue additional shares, which could reduce the overall value of our stockholders’ investment.
Our common stockholders do not have preemptive rights to any shares we issue in the future. Our charter, authorizes us to issue 1.01 billion shares of capital stock, of which 1 billion shares are designated as common stockbylaws, and 0.01 billion shares are designated as preferred stock. Our Board may amend our charter to increase or decrease the number of authorized shares of capital stock or the number of shares of stock of any class or series that we have authority to issue without stockholder approval. Additionally, our board may elect to (1) sell additional shares in the DRIP and future public offerings, (2) issue equity interests in private offerings, (3) issue share-based awards to our independent directors or to our officers or employees, or (4) issue shares of our common stock to sellers of properties or assets we acquire in connection with an exchange of limited partnership interests of the Operating Partnership. To the extent we issue additional equity interests, our stockholders’ ownership interest in us will be diluted. In addition, depending upon the terms and pricing of any additional offerings and the value of our real estate investments, our investors may also experience dilution in the book value and fair value of their shares.
Although we are not currently afforded the protection of the Maryland General Corporation Law relating to deterring or defending hostile takeovers, our Board could opt into these provisions of Maryland law in the future, which may discourage others from trying to acquire control of us and may prevent our stockholders from receiving a premium price for their stock in connection with a business combination.
Under Maryland law, “business combinations” between a Maryland corporation and certain interested stockholders or affiliates of interested stockholders are prohibited for five years after the most recent date on which the interested stockholder becomes an interested stockholder. These business combinations include a merger, consolidation, share exchange, or, in circumstances specified in the statute, an asset transfer or issuance or reclassification of equity securities. Also under Maryland law, control shares of a Maryland corporation acquired in a control share acquisition have no voting rights except to the extent approved by stockholders by a vote of two-thirds of the votes entitled to be cast on the matter. Should our board opt into these provisions of Maryland law, it may discourage others from trying to acquire control of us and increase the difficulty of consummating any offer. Similarly, provisions of Title 3, Subtitle 8 of the Maryland General Corporation Law could provide similar anti-takeover protection.
Our charter limits the number of shares a person may own, whichcontain terms that may discourage a takeoverthird party from acquiring us in a manner that could otherwise result in a premium price to our stockholders.
Our charter, bylaws, and Maryland law contain provisions that may delay, defer, or prevent a transaction or a change of control that might involve a premium price for our common stock or that our stockholders otherwise believe to be in their best interest. Our charter authorizes our Board to, without stockholder approval, amend our charter to increase or decrease the aggregate number of authorized shares of stock, to authorize us to issue additional shares of our common stock or preferred stock, and to classify or reclassify unissued shares of our common stock or preferred stock and thereafter to authorize us to issue such classified or reclassified shares of stock. We believe these charter provisions will provide us with increased flexibility in structuring possible future financings and acquisitions and in meeting other needs that might arise. The additional classes or series, as well as the additional authorized shares of our common stock, will be available for issuance without further action by our stockholders, unless such action is required by applicable law or the rules of any stock exchange or automated quotation system on which our securities may be listed or traded, and our Board could authorize the issuance of preferred stock with priority as to distributions and amounts payable upon liquidation over the rights of the holders of our common stock.
Our charter, with certain exceptions, authorizes our directorsBoard to take such actions as are necessary and desirable to preserve our qualification as a REIT. To help us comply with the REIT ownership requirements ofunder the Code,IRC, among other purposes, our charter prohibits aany person from directly or constructively owning more than 9.8% in value of our aggregate outstanding stock or more than 9.8% in value or number of shares, whichever is more restrictive, of our aggregate outstanding common stock, unless exempted by our Board. This restriction may have
In addition, the effect of delaying, deferring or preventing a change in control of us, including an extraordinary transaction (such as a merger, tender offer or sale of all or substantially all of our assets) that might provide a premium price for holders of our common stock.
Our charterMGCL permits our Board to issue stock with terms that may subordinate the rightsimplement certain takeover defenses without stockholder approval.
These and other provisions of our common stockholders or discourage a third party from acquiring us in a manner thatcharter, bylaws, and Maryland law could result in a premium price to our stockholders.
Our Board may classify or reclassify any unissued common stock or preferred stock and establish the preferences, conversion or other rights, voting powers, restrictions, limitations as to distributions, qualifications, and terms or conditions of redemption of any such stock. Thus, our Board could authorize the issuance of preferred stock with priority as to distributions and amounts payable upon liquidation over the rights of the holders of our common stock. Such preferred stock could also have the effect of delaying, deferring, or preventing a change in control, including an extraordinary transaction (such as a merger, tender offer, or sale of all or substantially all of our assets) that might provide a premium price to holders of our common stock.
Because Maryland law permits our board to adopt certain anti-takeover measures without stockholder approval, investors may be less likely to receive a “control premium” for their shares.
In 1999, the State of Maryland enacted legislation that enhances the power of Maryland corporations to protect themselves from unsolicited takeovers. Among other things, the legislation permits our board, without stockholder approval, to amend our charter to:
stagger our Board into three classes;
require a two-thirds stockholder vote for removal of directors;
provide that only the board can fix the size of the board; and
require that special stockholder meetings may only be called by holders of a majority of the voting shares entitled to be cast at the meeting.
Under Maryland law, a corporation can opt to be governed by some or all of these provisions if it has a class of equity securities registered under the Exchange Act, and has at least three independent directors. Our charter does not prohibit our Board from opting into any of the above provisions permitted under Maryland law. Becoming governed by any of these provisions could discourage an extraordinary transaction (such as a merger, tender offer or sale of all or substantially all of our assets) that might provide a premium price for holders of our securities.
Our rights and the rights of our stockholders to recover claims against our officers and directors are limited, which could reduce our stockholders'stockholders’ and our recovery against them if they cause us to incur losses.
Maryland law provides that a director has no liability in that capacity if he or she performs his or her duties in good faith, in a manner he or she reasonably believes to be in the corporation'scorporation’s best interests and with the care that an ordinarily prudent person in a like position would use under similar circumstances. Our charter, in the case of our directors officers, employees and agents,officers, requires us to indemnify our directors and officers employees and agents for actions takento the maximum extent permitted by them in good faith and without negligence or misconduct.Maryland law. Additionally, our charter limits the liability of our directors and officers for monetary damages to the maximum extent permitted under Maryland law. As a result, we and our stockholders may have more limited rights against our directors, officers, employeesassociates, and agents than might otherwise exist under common law, which could reduce our stockholders'stockholders’ and our recovery against them. In addition, we may be obligated to fund the defense costs incurred by our directors, officers, employeesassociates, and agents in some cases, which would decrease the cash otherwise available for distribution to stockholders.
Risks Related to Our REIT Status and Other Tax Risks
Failure to qualify as a REIT would cause us to be taxed as a regular C corporation, which would substantially reduce funds available for distributions to stockholders.
We elected to be taxed as a REIT for U.S. federal income tax purposes commencing with our taxable year ended December 31, 2010. We believe that our organization and method of operation has enabled and will continue to enable us to meet the
| | | | | | | | | | | |
PHILLIPS EDISON & COMPANY DECEMBER 31, 2023 FORM 10-K | | | 14 |
requirements for qualification and taxation as a REIT for U.S. federal income tax purposes. However, we cannot assure you that we will qualify as such. This is because qualification as a REIT involves the application of highly technical and complex provisions of the IRC as to which there are only limited judicial and administrative interpretations and involves the determination of facts and circumstances not entirely within our control. Future legislation, new regulations, administrative interpretations, or court decisions may significantly change the tax laws or the application of the tax laws with respect to qualification as a REIT for federal income tax purposes or the federal income tax consequences of such qualification.
If we fail to qualify as a REIT in any taxable year, and are unable to obtain relief under certain statutory provisions, we will face serious tax consequences that will substantially reduce the funds available for distributions to our stockholders because:
•we would not be allowed a deduction for dividends paid to stockholders in computing our taxable income and would be subject to federal and state income tax at regular corporate rates; and
•we could not elect to be taxed as a REIT for four taxable years following the year during which we were disqualified.
As a result of all these factors, our failure to qualify as a REIT could impair our ability to expand our business and raise capital, and it could adversely affect the value of our common stock. If we fail to qualify as a REIT, we would no longer be required to make distributions to our stockholders.
Even if we qualify as a REIT, we may face other tax liabilities that reduce our cash flows.
Even if we qualify as a REIT for U.S. federal income tax purposes, we may be subject to certain U.S. federal, state, and local taxes on our income and assets, including taxes on any undistributed income, tax on income from some activities conducted as a result of a foreclosure, and state or local income, property, and transfer taxes. Any of these taxes would decrease cash available for distributions to stockholders.
If the Operating Partnership fails to qualify as a partnership for U.S. federal income tax purposes, we would fail to qualify as a REIT and would suffer other adverse consequences.
We believe that the Operating Partnership is organized and will be operated in a manner so as to be treated as a partnership, and not an association or publicly traded partnership taxable as a corporation for U.S. federal income tax purposes. As a partnership, the Operating Partnership will not be subject to U.S. federal income tax on its income. Instead, each of its partners, including us, will be allocated that partner’s share of the Operating Partnership’s income. No assurance can be
provided, however, that the Internal Revenue Service (the “IRS”) will not challenge the Operating Partnership’s status as a partnership for U.S. federal income tax purposes, or that a court would not sustain such a challenge. If the Internal Revenue ServiceIRS were successful in treating the Operating Partnership as an association or publicly traded partnership taxable as a corporation for U.S. federal income tax purposes, we would fail to meet the gross income tests and certain of the asset tests applicable to REITs and, accordingly, would cease to qualify as a REIT. Also, the failure of the Operating Partnership to qualify as a partnership would cause it to become subject to U.S. federal corporate income tax, which would reduce significantly the amount of its cash available for debt service and for distribution to its partners, including us.
The Operating Partnership has a carryover tax basis on certain of its assets as a result of theour acquisition of PELP, transaction,and our merger with Phillips Edison Grocery Center REIT II, Inc. (“REIT II”), and the amount that we have to distribute to stockholders therefore may be higher.
As a result of each of the acquisition of PELP transaction,and our merger with REIT II, certain of the Operating Partnership’s propertiesshopping centers have carryover tax bases that are lower than the fair market values of these propertiesshopping centers at the time of the acquisition. As a result of this lower aggregate tax basis, the Operating Partnership will recognize higher taxable gain upon the sale of these assets, and the Operating Partnership will be entitled to lower depreciation deductions on these assets than if it had purchased these propertiesshopping centers in taxable transactions at the time of the acquisition. Such lower depreciation deductions and increased gains on sales allocated to us generally will increase the amount of our required distribution under the REIT rules, and will decrease the portion of any distribution that otherwise would have been treated as a “return of capital” distribution.
Our property taxes could increase due to property tax rate changes or reassessment, which could impact our cash flow.
Even if we qualify as a REIT for U.S. federal income tax purposes, we are required to pay state and local property taxes on our shopping centers. The property taxes on our shopping centers may increase as property tax rates change or as our shopping centers are assessed or reassessed by taxing authorities. Therefore, the amount of property taxes we pay in the future may increase substantially from what we have paid in the past and such increases may not be covered by Neighbors pursuant to our lease agreements. If the property taxes we pay increase, our financial condition, results of operations, cash flow, per share trading price of our common stock, and ability to satisfy our principal and interest obligations and to make distributions to our stockholders could be adversely affected.
We intend to use TRSs,taxable REIT subsidiaries, which may cause us to fail to qualify as a REIT.
To qualify as a REIT for U.S. federal income tax purposes, we hold, and plan to continue to hold, substantially all of our non-qualifying REIT assets and conduct certain of our non-qualifying REIT income activities in or through one or more TRSs.taxable REIT subsidiary (“TRS”) entities. A TRS is a corporation other than a REIT in which a REIT directly or indirectly holds stock, and that has made a joint election with such REIT to be treated as a TRS. A TRS also includes any corporation other than a REIT with respect to which a TRS owns securities possessing more than 35% of the total voting power or value of the outstanding securities of such corporation. Other than some activities relating to lodging and health care facilities, a TRS may generally engage in any business, including the provision of customary or non- customarynon-customary services to tenants of its parent REIT. A TRS is subject to U.S. federal income tax as a regular C-corporation.C-corporation at a current rate of 21%.
The net income of our TRSsTRS entities is not required to be distributed to us, and income that is not distributed to us will generally not be subject to the REIT income distribution requirement. However, our TRS entities may pay dividends. Such dividend income should qualify under the 95%, but not the 75%, gross income test. We will monitor the amount of the
| | | | | | | | | | | |
PHILLIPS EDISON & COMPANY DECEMBER 31, 2023 FORM 10-K | | | 15 |
dividend and other income from our TRS entities and will take actions intended to keep this income, and any other non-qualifying income, within the limitations of the REIT income tests. While we expect these actions will prevent a violation of the REIT income tests, we cannot guarantee that such actions will in all cases prevent such a violation.
Our ownership of TRSs will beTRS entities is subject to limitations that could prevent us from growing our management business, and our transactions with our TRSsTRS entities could cause us to be subject to a 100% penalty tax on certain income or deductions if those transactions are not conducted on an arm’s-length basis.
Overall, (i) for taxable years beginning prior to January 1, 2018, no more than 25% of the value of a REIT’s gross assets, and (ii) for taxable years beginning after December 31, 2017, noNo more than 20% of the value of a REIT’s gross assets may consist of interests in TRSs; complianceTRS entities. Compliance with this limitation could limit our ability to grow our management business. In addition, the Internal Revenue Code limits the deductibility of interest paid or accrued by a TRS to its parent REIT to assure that the TRS is subject to an appropriate level of corporate taxation. The Internal Revenue CodeIRC also imposes a 100% excise tax on certain transactions between a TRS and its parent REIT that are not conducted on an arm’s-length basis. We will monitor the value of investments in our TRSsTRS entities in order to ensure compliance with TRS ownership limitations and will structure our transactions with our TRSsTRS entities on terms that we believe are arm’s-length to avoid incurring the 100% excise tax described above. There can be no assurance, however, that we will be able to comply with the TRS ownership limitation or be able to avoid application of the 100% excise tax.
Our failureREIT distribution requirements could adversely affect our ability to continue to qualify as a REIT would subject us to federal income tax and reduce cash available for distribution toexecute our stockholders.
We elected tobusiness plans, including because we may be taxed as a REIT under the Code commencing with our taxable year ended December 31, 2010. We intend to continue to operate in a manner so as to continue to qualify as a REIT for federal income tax purposes. Qualification as a REIT involves the application of highly technical and complex Code provisions for which only a limited number of judicial and administrative interpretations exist. Even an inadvertent or technical mistake could jeopardize our REIT status. Our continued qualification as a REIT will depend on our satisfaction of certain asset, income, organizational, distribution, stockholder ownership and other requirements on a continuing basis. Moreover, new tax legislation, administrative guidance or court decisions, in each instance potentially with retroactive effect, could make it more difficult or impossible for us to continue to qualify as a REIT. If we fail to continue to qualify as a REIT in any taxable year, we would be subject to federal and applicable state and local income tax on our taxable income at corporate rates, in which case we might be required to borrow or liquidate some investments in order to pay the applicable tax. Losing our REIT status would reduce our net income available for investment or distribution to you because of the additional tax liability. In addition, distributions to our stockholders would no longer qualify for the dividends-paid deduction and we would no longer be required to make distributions. Furthermore, if we fail to qualify as a REIT in any taxable year for which we have elected to be taxed as a REIT, we would generally be unable to elect REIT status for the four taxable years following the year in which our REIT status is lost.
Complying with REIT requirements may force us to borrow funds to make distributions to youstockholders or otherwise depend on external sources of capital to fund such distributions.
To continue to qualify as a REIT, we are required toWe generally must distribute annually at least 90% of our REIT taxable income subject(which is determined without regard to certain adjustments,the dividends paid deduction or net capital gain for this purpose) in order to our stockholders.continue to qualify as a REIT. To the extent that we satisfy the distribution requirement but distribute less than 100% of our taxable income, we will be subject to federal corporate income tax on our undistributed taxable income. In addition, we may elect to retain and pay income tax on our net long-term capital gain. In that case, if we so elect, a stockholder would be taxed on its proportionate share of our undistributed long-term gain and would receive a credit or refund for its proportionate
share of the tax we paid. A stockholder, including a tax-exempt or foreign stockholder, would have to file a U.S. federal income tax return to claim that credit or refund. Furthermore, we will be subject to a 4% nondeductible excise tax if the actual amount that we distribute to our stockholders in a calendar year is less than a minimum amount specified under federal tax laws.
From time-to-time, we may generate taxableWe intend to make distributions to our stockholders to comply with the REIT requirements of the IRC and to avoid corporate income greater than our net income (loss) for GAAP. In addition, our taxable incometax and the 4% excise tax. We may be greater thanrequired to make distributions to our stockholders at times when it would be more advantageous to reinvest cash flowin the business or when we do not have funds readily available for distributiondistribution. Thus, compliance with the REIT requirements may hinder our ability to you as a resultoperate solely on the basis of among other things, investments in assets that generate taxable income in advance of the corresponding cash flow from the assets (for instance, if a borrower defers the payment of interest in cash pursuant to a contractual right or otherwise).maximizing profits.
If we do not have other funds available, in the situations described in the preceding paragraphs, we could be required to borrow funds on unfavorable terms, sell investments at disadvantageous prices, distribute amounts that would otherwise be invested in future acquisitions or capital expenditures or used for the repayment of debt, pay dividends in the form of "taxable stock dividends,” or find another alternative source of funds to make distributions sufficient to enable us to distribute enough of our taxable income to satisfy the REIT distribution requirement and to avoid corporate income tax and the 4% excise tax in a particular year. These alternatives could increase our costs or reduce our equity.
Because of the distribution requirement, it is unlikely that we will be able to fund all future capital needs, including capital needs in connection with investments, from cash retained from operations. As a result, to fund future capital needs, we likely will have to rely on third-party sources of capital, including both debt and equity financing, which may or may not be available on favorable terms or at all. Our access to third-party sources of capital will depend upon a number of factors, including our current and potential future earnings and cash distributions.
Despite our qualification for taxation as a REIT for federal income tax purposes, we may be subject to other tax liabilities that reduce our cash flow and our ability to make distributions to our stockholders.
Despite our qualification for taxation as a REIT for federal income tax purposes, we may be subject to certain federal, state and local taxes on our income and assets, including taxes on any undistributed income or property. Any of these taxes would decrease cash available for distribution to our stockholders. For instance:
In order to continue to qualify as a REIT, we must distribute annually at least 90% of our REIT taxable income (which is determined without regard to the dividends paid deduction or net capital gain for this purpose) to our stockholders.
To the extent that we satisfy the distribution requirement but distribute less than 100% of our REIT taxable income, we will be subject to federal corporate income tax on the undistributed income.
We will be subject to a 4% nondeductible excise tax on the amount, if any, by which distributions we pay in any calendar year are less than the sum of 85% of our ordinary income, 95% of our capital gain net income and 100% of our undistributed income from prior years.
If we have net income from the sale of foreclosure property that we hold primarily for sale to customers in the ordinary course of business or other non-qualifying income from foreclosure property, we must pay a tax on that income at the highest corporate income tax rate.
If we sell an asset, other than foreclosure property, that we hold primarily for sale to customers in the ordinary course of business and do not qualify for a safe harbor in the Code, our gain would be subject to the 100% “prohibited transaction” tax.
Any domestic taxable REIT subsidiary, or TRS, of ours will be subject to federal corporate income tax on its income, and on any non-arm’s-length transactions between us and any TRS, for instance, excessive rents charged to a TRS could be subject to a 100% tax.
We may be subject to tax on income from certain activities conducted as a result of taking title to collateral.
We may be subject to state or local income, property and transfer taxes, such as mortgage recording taxes.
Complying with REIT requirements may cause us to foregoforgo otherwise attractive opportunities or liquidate otherwise attractive investments.
To continue to qualify as a REIT for U.S. federal income tax purposes, we must continually satisfy tests concerning, among other things, the sources of our income, the nature and diversification of our assets, the amounts we distribute to stockholders, and the ownership of our stock. As discussed above, we may be required to make distributions to youshareholders at disadvantageous times or when we do not have funds readily available for distribution. Additionally, we may be unable to pursue investments that would be otherwise attractive to us in order to satisfy the requirements for qualifying as a REIT.
We must also ensure that at the end of each calendar quarter, at least 75% of the value of our assets consists of cash, cash items, U.S. government securities, and qualified real estate assets, including certain mortgage loans and mortgage-backed securities. The remainder of our investment in securities (other than U.S. government securities and qualified real estate assets) generally cannot include more than 10% of the outstanding voting securities of any one issuer or more than 10% of the total value of the outstanding securities of any one issuer. In addition, in general, no more than 5% of the value of our assets can consist of the securities of any one issuer (other than U.S. government securities and qualified real estate assets) and no more than 25%20% of the value of our gross assets (20% for tax years after 2017) may be represented by securities of one or more TRSs.TRS entities. Finally, for the taxable years after 2015, no more than 25% of our assets may consist of debt investments that are issued by “publicly offered REITs” and would not otherwise be treated as qualifying real estate assets. If we fail to comply with these requirements at the end of any calendar quarter, we must correct such failure within 30 days after the end of the calendar quarter to avoid losing our REIT status and sufferingbeing subject to adverse tax consequences, unless certain relief provisions apply. As a result, compliance with the REIT requirements may hinder our ability to operate solely on the basis of profit maximization and may require us to liquidate investments from our portfolio, or refrain from making otherwise attractive investments. These actions could have the effect of reducing our income and amounts available for distribution to stockholders.
Complying with REIT requirements may limit our ability to hedge effectively.
The REIT provisions of the Code may limit our ability to hedge our operations effectively. Our aggregate gross income from non-qualifying hedges, fees and certain other non-qualifying sources cannot exceed 5% of our annual gross income. As a result, we might have to limit our use of advantageous hedging techniques or implement those hedges through a TRS. Any hedging income earned by a TRS would be subject to federal, state and local income tax at regular corporate rates. This could increase the cost of our hedging activities or expose us to greater risks associated with interest rate or other changes than we would otherwise incur.
Liquidation of assets may jeopardize our REIT qualification.
To continue to qualify as a REIT, we must comply with requirements regarding our assets and our sources of income. If we are compelled to liquidate our investments to satisfy our obligations to our lenders, we may be unable to comply with these requirements, ultimately jeopardizing our qualification as a REIT, or we may be subject to a 100% prohibited transaction tax on any resulting gain if we sell assets that are treated as dealer property or inventory.
The prohibited transactions tax may limit our ability to engage in transactions, including disposition of assets, and certain methods of securitizing loans, which would be treated as sales for U.S. federal income tax purposes.
A REIT’s net income from prohibited transactions is subject to a 100% tax. In general, prohibited transactions are sales or other dispositions of dealer property, other than foreclosure property, but including loans held primarily for sale to customers in the ordinary course of business.property. We might be subject to the prohibited transaction tax if we were to dispose of or securitize loans in a manner that is treated as a sale of the loans, for federal income tax purposes. In order to avoid the prohibited transactions tax, we may choose not to engage in certain sales of loans and may limit the structures we use for any securitization financing transactions, even though such sales or structures might otherwise be beneficial to us. Additionally, we may be subject to the prohibited transaction tax upon a disposition of real property. Although a safe-harbor exception to prohibited transaction treatment is available, we cannot assure you that we can comply with such safe harbor or that we will avoid owning property that may be characterized as held primarily for sale to customers in the ordinary course of our trade or business. Consequently, we may choose not to engage in certain sales of real property or may conduct such sales through a TRS.
It may be possible to reduce the impact of the prohibited transaction tax by conducting certain activities through a TRS. However, to the extent that we engage in such activities through a TRS, the income associated with such activities will be
| | | | | | | | | | | |
PHILLIPS EDISON & COMPANY DECEMBER 31, 2023 FORM 10-K | | | 16 |
subject to a corporate income tax. In addition, the IRS may attempt to ignore or otherwise recast such activities in order to impose a prohibited transaction tax on us, and there can be no assurance that such recast will not be successful.
We also may not be able to use secured financing structures that would create taxable mortgage pools, other than in a TRS or through a subsidiary REIT.
We may recognize substantial amounts of REIT taxable income, which we would be required to distribute to our stockholders, in a year in which we are not profitable under GAAPaccounting principles generally accepted in the United States (“GAAP”) or other economic measures.
We may recognize substantial amounts of REIT taxable income in years in which we are not profitable under GAAP or other economic measures as a result of the differences between GAAP and tax accounting methods. For instance, certain of our assets will be marked-to-market for GAAP purposes but not for tax purposes, which could result in losses for GAAP purposes that are not recognized in computing our REIT taxable income. Additionally, we may deduct our capital losses only to the extent of our capital gains in computing our REIT taxable income for a given taxable year. Consequently, we could recognize substantial amounts of REIT taxable income and would be required to distribute such income to you,shareholders in a year in which we are not profitable under GAAP or other economic measures.
REIT distribution requirements could adversely affect our ability to execute our business plan.
We generally must distribute annually at least 90% of our REIT taxable income (which is determined without regard to the dividends paid deduction or net capital gain for this purpose) in order to continue to qualify as a REIT. We intend to make distributions to our stockholders to comply with the REIT requirements of the Code and to avoid corporate income tax and the 4% excise tax. We may be required to make distributions to stockholders at times when it would be more advantageous to reinvest cash in our business or when we do not have funds readily available for distribution. Thus, compliance with the REIT requirements may hinder our ability to operate solely on the basis of maximizing profits.
Our qualification as a REIT could be jeopardized as a result of an interest in joint ventures or investment funds.
We may hold certain limited partner or non-managing member interests in partnerships or limited liability companies that are joint ventures or investment funds. If a partnership or limited liability company in which we own an interest takes or expects to take actions that could jeopardize our qualification as a REIT or require us to pay tax, we may be forced to dispose of our interest in such entity. In addition, it is possible that a partnership or limited liability company could take an action which could cause us to fail a REIT gross income or asset test, and that we would not become aware of such action in time to dispose of our interest in the partnership or limited liability company or take other corrective action on a timely basis. In that case, we could fail to continue to qualify as a REIT unless we are able to qualify for a statutory REIT “savings” provision, which may require us to pay a significant penalty tax to maintain our REIT qualification.
Distributions paid by REITs do not qualify for the reduced tax rates that apply to other corporate distributions.
The maximum tax rate for “qualified dividends” paid by corporations to non-corporate stockholders generally is currently 20%. Distributions paid by REITs however,to non-corporate stockholders generally are taxed at rates lower than ordinary income rates, (subject to a maximum rate of 39.6% for non-corporate stockholders), ratherbut those rates are higher than the 20% tax rate on qualified dividend income paid by corporations. Although this does not adversely affect the taxation of REITs or dividends payable by REITs, to the extent that the preferential rate applicablerates continue to apply to regular corporate qualified dividends.dividends, the more favorable rates for corporate dividends may cause non-corporate investors to perceive that an investment in a REIT is less attractive than an investment in a non-REIT entity that pays dividends, thereby reducing the demand and market price of shares of our common stock.
Legislative or regulatory tax changes could adversely affect us or our stockholders.
At any time, the U.S. federal income tax laws or regulations governing REITs or the administrative interpretations of those laws or regulations may be amended. We cannot predict when or if any new U.S. federal income tax law, regulation or administrative
interpretation, or any amendment to any existing U.S. federal income tax law, regulation or administrative interpretation, will be adopted, promulgated, or become effective and any such law, regulation, or interpretation may take effect retroactively. Any such change could result in an increase in our, or our stockholders’, tax liability or require changes in the manner in which we operate in order to minimize increases in our tax liability. A shortfall in tax revenues for states and municipalities in which we operate may lead to an increase in the frequency and size of such changes. If such changes occur, we may be required to pay additional taxes on our assets or income or be subject to additional restrictions. These increased tax costs could, among other things, adversely affect our financial condition, the results of operations, and the amount of cash available for the payment of dividends. We and our stockholders could be adversely affected by any such change in, or any new, U.S. federal income tax law, regulation, or administrative interpretation.
On December 22, 2017, President Trump signed into law H.R. 1, known as the “Tax Cuts and Jobs Act” (the “TCJA”). The TCJA is the most far-reaching tax legislation to be passed in over 30 years. The provisions of the TCJA generally apply to taxable years beginning after December 31, 2017. Significant provisions of the TCJA that investors should be aware of include provisions that: (i) lower the corporate income tax rate to 21%, (ii) provide noncorporate taxpayers with a deduction of up to 20% of certain income earned through partnerships and REITs, (iii) limits the net operating loss deduction to 80% of taxable income, where taxable income is determined without regard to the net operating loss deduction itself, generally eliminates net operating loss carrybacks and allows unused net operating losses to be carried forward indefinitely, (iv) expand the ability of businesses to deduct the cost of certain property investments in the year in which the property is purchased, and (v) generally lower tax rates for individuals and other noncorporate taxpayers, while limiting deductions such as miscellaneous itemized deductions and state and local tax deductions. In addition, the TCJA limits the deduction for net interest expense incurred by a business to 30% of the “adjusted taxable income” of the taxpayer. However, the limitation on the interest expense deduction does not apply to certain small-business taxpayers or electing real property trades or businesses, such as any real property development, redevelopment, construction, reconstruction, acquisition, conversion, rental, operation, management, leasing, or brokerage trade or business. Making the election to be treated as a real property trade or business requires the electing real property trade or business to depreciate non-residential real property, residential rental property, and qualified improvement property over a longer period using the alternative depreciation system. We generally will decide whether to make any available election to treat as a real property trade or business any direct or indirect investment made through an entity that we control.
Stockholders are urged to consult with their own tax advisors with respect to the impact that the TCJA and other legislation may have on their investment and the status of legislative, regulatory or administrative developments and proposals and their potential effect on their investment in our shares.
If the fiduciary of an employee benefit plan subject to ERISA (such as a profit sharing, Section 401(k) or pension plan) or an owner of a retirement arrangement subject to Section 4975 of the Code (such as an IRA) fails to meet the fiduciary and other standards under ERISA or the Code as a result of an investment in our stock, the fiduciary could be subject to penalties and other sanctions.
There are special considerations that apply to employee benefit plans subject to ERISA (such as profit sharing, Section 401(k) or pension plans) and other retirement plans or accounts subject to Section 4975 of the Code (such as an IRA) that are investing in our shares. Fiduciaries and IRA owners investing the assets of such a plan or account in our common stock should satisfy themselves that:
the investment is consistent with their fiduciary and other obligations under ERISA and the Code;
the investment is made in accordance with the documents and instruments governing the plan or IRA, including the plan’s or account’s investment policy;
the investment satisfies the prudence and diversification requirements of Sections 404(a)(1)(B) and 404(a)(1)(C) of ERISA and other applicable provisions of ERISA and the Code;
the investment in our shares, for which no public market currently exists, is consistent with the liquidity needs of the plan or IRA;
the investment will not produce an unacceptable amount of “unrelated business taxable income” for the plan or IRA;
our stockholders will be able to comply with the requirements under ERISA and the Code to value the assets of the plan or IRA annually; and
the investment will not constitute a prohibited transaction under Section 406 of ERISA or Section 4975 of the Code.
Failure to satisfy the fiduciary standards of conduct and other applicable requirements of ERISA and the Code may result in the imposition of civil and criminal penalties and could subject the fiduciary to claims for damages or for equitable remedies, including liability for investment losses. In addition, if an investment in our shares constitutes a prohibited transaction under ERISA or the Code, the fiduciary or IRA owner who authorized or directed the investment may be subject to the imposition of excise taxes with respect to the amount invested. In addition, the investment transaction must be undone. In the case of a prohibited transaction involving an IRA owner, the IRA may be disqualified as a tax-exempt account and all of the assets of the IRA may be deemed distributed and subjected to tax. ERISA plan fiduciaries and IRA owners should consult with counsel before making an investment in our common stock.
If our assets are deemed to be plan assets, we may be exposed to liabilities under Title I of ERISAthe Employee Retirement Income Security Act of 1974 (“ERISA”) and the Code.IRC.
In some circumstances where an ERISA plan holds an interest in an entity, the assets of the entity are deemed to be ERISA plan assets unless an exception applies. This is known as the “look-through rule.” Under those circumstances, the obligations and other responsibilities of plan sponsors, plan fiduciaries and plan administrators, and of parties in interest and disqualified persons, under Title I of ERISA or Section 4975 of the Code,IRC, may be applicable, and there may be liability under these and other provisions of ERISA and the Code.IRC. We believe that our assets should not be treated as plan assets because the shares of our common stock should qualify as “publicly-offered securities” that are exempt from the look-through rules under applicable Treasury Regulations. We note, however, that because certain limitations are imposed upon the transferability of shares of our common stock so that we may qualify as a REIT, and perhaps for other reasons, it is possible that this exemption may not apply. If that is the case, and if we are exposed to liability under ERISA or the Code,IRC, our performance and results of operations could be adversely affected.
Risks Related to Business Continuity
Uninsured losses relating to real property or excessively expensive premiums for insurance coverage could adversely affect our cash flows and stockholder returns.
If stockholders invested inWe maintain insurance coverage with third-party carriers who provide a portion of the coverage of potential losses, including commercial general liability, fire, flood, extended coverage, and rental loss insurance on all of our sharesshopping centers. We currently self-insure a portion of our commercial insurance deductible risk through an IRA or other retirement plan, theyour captive insurance company. To the extent that our captive insurance company is unable to bear that risk, we may be limitedrequired to fund additional capital to our captive insurance company or we may be required to bear that loss. As a result, our operating results may be adversely affected.
There are some types of losses, generally catastrophic in nature, such as losses due to wars, acts of terrorism, earthquakes, floods, hurricanes, pollution, or environmental matters, that are uninsurable or not economically insurable, or may be insured subject to limitations, such as large deductibles or sublimits. Terrorist activities or violence occurring at our properties also
| | | | | | | | | | | |
PHILLIPS EDISON & COMPANY DECEMBER 31, 2023 FORM 10-K | | | 17 |
may directly affect their value through damage, destruction, or loss. Insurance for such acts may be unavailable or cost more, which could result in an increase to our operating expenses and adversely affect our results of operations. To the extent that our Neighbors are affected by such attacks or threats of attacks, their businesses may be adversely affected, including their ability to withdraw required minimum distributions.
continue to meet obligations under their existing leases. If stockholders established an IRAany of our shopping centers incur a casualty or other retirement planloss that is not fully or adequately insured, the value of our assets will be reduced by any such uninsured loss, which may reduce the value of our stockholders’ investment. In addition, other than any working capital reserve or other reserves we may establish, we have no source of funding to repair or reconstruct any uninsured property. Also, to the extent we must pay unexpectedly large amounts for insurance, such payments could adversely impact our cash flows and ability to make distributions to our stockholders.
Climate change may adversely affect our business, financial condition, cash flows, and results of operations.
Climate change, including the impact of global warming, creates physical and financial risks. Physical risks from climate change include an increase in sea level and changes in weather conditions, such as an increase in storm intensity and severity of weather (e.g. floods, droughts, tornadoes, or hurricanes) and extreme temperatures. The occurrence of sea level rise or one or more natural disasters, such as floods, droughts, tornados, hurricanes, tropical storms, wildfires, and earthquakes (whether or not caused by climate change), could cause considerable damage to our shopping centers, disrupt our operations, and negatively affect our financial performance. To the extent any of these events results in significant damage to or closure of one or more of our shopping centers, our operations and financial performance could be adversely affected through whichlost Neighbors and an inability to lease or re‑lease the space. In addition, these events could result in significant expenses to restore or remediate a property, increases in fuel or other energy costs or a fuel shortage, and increases in the costs of (or making unavailable) insurance on favorable terms if they investedresult in significant loss of property or other insurable damage. In addition, transition risks associated with new or more stringent laws or regulations or stricter interpretations of existing laws may require material expenditures by us. Among other things, “green” building codes may seek to reduce emissions through the imposition of standards for design, construction materials, water and energy usage and efficiency, and waste management. Such codes could require us to make improvements to our existing shopping centers, increase the costs of maintaining or improving our existing shopping centers or developing new shopping centers, or increase taxes and fees assessed on us or our shopping centers.
As an owner and/or operator of real estate, we could become subject to liability for environmental violations, regardless of whether we caused such violations, and our efforts to identify environmental liabilities may not be successful.
We could become subject to liability in the form of fines or damages for noncompliance with environmental laws and regulations. U.S. federal, state, and local laws and regulations relating to the protection of the environment may require us, as a current or previous owner or operator of real property, to investigate and clean up hazardous or toxic substances or petroleum product releases at, on, under, from, or in a property or at impacted neighboring properties, which in our shares,case most typically arise from current or former dry cleaners, gas stations, asbestos usage and historic land use practices. These costs could be substantial and liability under these laws may attach whether or not the owner or manager knew of, or was responsible for, the presence of such contamination. Even if more than one person may have been responsible for the contamination, each liable party may be held entirely responsible for all of the clean-up costs incurred. We may be subject to regulatory action and may also be held liable to third parties for personal injury or property damage incurred by such parties in connection with exposure to or offsite contamination caused by hazardous or toxic substances. The costs of investigation, removal or remediation of hazardous or toxic substances, and related liabilities, may be substantial and could materially and adversely affect us. The presence of hazardous or toxic substances, or the failure to remediate the related contamination, may also adversely affect our ability to sell, lease, or redevelop a property or to borrow money using a property as collateral.
Although we believe that our portfolio is in substantial compliance with U.S. federal, law may require themstate, and local environmental laws and regulations regarding hazardous or toxic substances, and that there is no material contamination that we would be responsible for addressing, this belief is based on limited evaluation and testing. Nearly all of our shopping centers have been subjected to withdraw required minimum distributions (“RMDs”) from such plan inPhase I or similar environmental audits. These environmental audits (which do not include subsurface testing) have not revealed, nor are we aware of, any environmental liability that we believe is reasonably likely to have a material adverse effect on us. However, we cannot assure you that: (i) previous environmental studies with respect to the future. Our SRP limits the amount of repurchases (other than those repurchases as a resultportfolio revealed all potential environmental liabilities; (ii) any previous owner, occupant, or Neighbor of a stockholder’s death or disability) that can be made in a given year. Additionally, our stockholdersproperty did not create any material environmental condition not known to us; (iii) the current environmental condition of the portfolio will not be eligibleaffected by Neighbors and occupants, by the condition of nearby properties, or by other unrelated third parties; or (iv) future uses or conditions (including, without limitation, changes in applicable environmental laws and regulations or the interpretation thereof) will not result in environmental liabilities.
We and our Neighbors face risks relating to cybersecurity attacks, which could cause loss of confidential information and other disruptions to business operations, and compliance with new laws and regulations regarding cybersecurity and privacy may result in substantial costs and may decrease cash available for distributions.
Cybersecurity attacks include attempts to gain unauthorized access to our data and/or computer systems to disrupt operations, corrupt data, or steal confidential information. We may face such cybersecurity attacks through malware, computer viruses, attachments to e-mails, persons inside our organization or persons with access to systems inside our organization, and other significant disruptions of our information technology (“IT”) systems. The risk of a cybersecurity attack, including by computer hackers (individual or hacking organizations), foreign governments, and cyber terrorists, has generally increased as the number, intensity, and sophistication of attempted attacks and intrusions from around the world have increased. The techniques and sophistication used to conduct cyber attacks and breaches of IT systems, as well as the sources and targets of these attacks, change frequently and are often not recognized until such attacks are launched or have been in place for a period of time.
Our IT networks and related systems are essential to the operation of our business and our ability to perform day-to-day operations and, in some cases, may be critical to the operations of certain of our Neighbors. In addition to our own IT
| | | | | | | | | | | |
PHILLIPS EDISON & COMPANY DECEMBER 31, 2023 FORM 10-K | | | 18 |
systems, we also depend on third parties to provide IT services relating to several key business functions, such as administration, accounting, communications, document management and storage, human resources, payroll, tax, investor relations, and certain finance functions. Our IT systems and those provided by third parties may contain personal, financial, or other information that is entrusted to us by our Neighbors and associates, as well as proprietary PECO information and other confidential information related to our business. We and such third parties employ a number of measures to prevent, detect, and mitigate these threats, including password protection, firewalls, backup servers, malware detection, intrusion sensors, threat monitoring, user training, and periodic penetration testing; however, there is no guarantee that such cybersecurity risk management programs and processes, including our and their shares repurchased until theypolicies, controls, and procedures, will be fully implemented, complied with or effective in protecting our and their systems and information.
As have heldmany companies, we and our third party vendors have been impacted by security incidents in the past, and will likely continue to experience security incidents of varying degrees. While we do not believe these incidents have had a material impact to date, as our reliance on technology has increased, so have the risks posed to our systems, both internal and those we have outsourced. The primary risks that could directly result from the occurrence of a cyber incident include operational interruption, damage to our relationship with our Neighbors, and private data exposure. Our financial results and business operations may be negatively affected by such an incident or the resulting negative media attention. A cybersecurity attack could: (i) disrupt the proper functioning of our networks and systems and therefore our operations and/or those of certain of our Neighbors; (ii) compromise the confidential or proprietary information of our Neighbors, associates, and vendors, which others could use to compete against us or for disruptive, destructive, or otherwise harmful purposes and outcomes; (iii) result in our inability to maintain the building systems relied upon by our Neighbors for the efficient use of their sharesleased space; (iv) require significant management attention and resources to remedy the damages that result; (v) result in misstated financial reports, violations of loan covenants, and/or missed reporting deadlines; (vi) result in our inability to properly monitor our compliance with the rules and regulations regarding our qualification as a REIT; (vii) subject us to claims for breach of contract, damages, credits, penalties, or termination of leases or other agreements or relationships; (viii) cause reputational damage that adversely affects Neighbor, investor, and associate confidence in us, which could negatively affect our ability to attract and retain Neighbors, investors, and associates; (ix) result in significant remediation costs, some or all of which may not be recoverable from our insurance carriers; and (x) result in increases in the cost of obtaining insurance on favorable terms, or at least one year. Asall, if the attack results in significant insured losses. Such security breaches also could result in a violation of applicable federal and state privacy and other laws, and subject us to private consumer, business partner, or securities litigation and governmental investigations and proceedings, any of which could result theyin our exposure to material civil or criminal liability, and we may not be able to recover these expenses from our service providers, responsible parties, or insurance carriers. Similarly, our Neighbors rely extensively on IT systems to process transactions and manage their businesses and thus are also at risk from and may be adversely affected by cybersecurity attacks. An interruption in the business operations of our Neighbors or a deterioration in their reputation resulting from a cybersecurity attack, including unauthorized access to customers’ credit card data and other confidential information, could indirectly negatively affect our business and cause lost revenues.
Regulatory and Legal Risks
Compliance or failure to comply with the ADA, and fire, safety, and other regulations could result in substantial costs and may decrease cash available for stockholder distributions.
Our shopping centers are or may become subject to the ADA which generally requires that all places of public accommodation comply with federal requirements related to access and use by disabled persons. Compliance with the ADA’s requirements could require the removal of access barriers and noncompliance may result in the imposition of injunctive relief, monetary penalties, or in some cases, an award of damages. While we attempt to acquire shopping centers that are already in compliance with the ADA or place the burden of compliance on the seller or other third party, such as a Neighbor, we cannot assure stockholders that we will be able to acquire shopping centers or allocate responsibilities in this manner. In addition, we are required to operate the shopping centers in compliance with fire and safety regulations, building codes, and other land use regulations, as they may be adopted by governmental entities and become applicable to the shopping centers. We may be required to make substantial capital expenditures to comply with these requirements, and these expenditures may reduce our net income and may have a material adverse effect on our ability to meet our financial obligations and make distributions to our stockholders.
We could be subject to legal or regulatory proceedings that may adversely affect our cash flows and results of operations.
As an owner and operator of public shopping centers, from time to time, we are party to legal and regulatory proceedings that arise in the ordinary course of business. Due to the inherent uncertainties of litigation and regulatory proceedings, we cannot accurately predict the ultimate outcome of any such litigation or proceedings. We could experience an adverse effect to our cash flows, financial condition, and results of operations due to an unfavorable outcome.
Risks Related to Our Common Stock
The market price and trading volume of shares of our common stock may be volatile.
The U.S. stock markets, including Nasdaq, on which our common stock trades, have experienced significant price and volume fluctuations. As a result, the market price of shares of our common stock may be similarly volatile, and investors in shares of our common stock may experience a decrease in the value of their shares, repurchased atincluding decreases unrelated to our operating performance or prospects. We cannot assure you that the market price of shares of our common stock will not fluctuate or decline significantly in the future.
In addition to the risks listed in this “Risk Factors” section, a timenumber of factors could negatively affect the share price of our common stock or result in which they need liquidity to satisfyfluctuations in the RMD requirements under their IRAprice or other retirement plan. Even if they are able to have theirtrading volume of shares repurchased,of our share repurchase price is basedcommon stock, including:
•the annual yield from distributions on the estimated value per shareshares of our common stock as determinedcompared to yields on other financial instruments;
| | | | | | | | | | | |
PHILLIPS EDISON & COMPANY DECEMBER 31, 2023 FORM 10-K | | | 19 |
•equity issuances by us, or future sales of substantial amounts of shares of our common stock by our existing or future stockholders, or the perception that such issuances or future sales may occur;
•increases in market interest rates or a decrease in our distributions to stockholders that lead purchasers of shares of our common stock to demand a higher yield;
•changes in market valuations of similar companies;
•fluctuations in stock market prices and volumes;
•additions or departures of key management personnel;
•our operating performance and the performance of other similar companies;
•actual or anticipated differences in our quarterly operating results;
•changes in expectations of future financial performance or changes in estimates of securities analysts;
•publication of research reports about us or our industry by securities analysts;
•failure to qualify as a REIT;
•adverse market reaction to any indebtedness we incur in the future;
•strategic decisions by us or our competitors, such as acquisitions, divestments, spin offs, joint ventures, strategic investments, or changes in business strategy;
•the passage of legislation or other regulatory developments that adversely affect us or our industry;
•speculation in the press or investment community;
•changes in our earnings;
•failure to satisfy the listing requirements of Nasdaq;
•failure to comply with the requirements of the Sarbanes-Oxley Act;
•actions by institutional stockholders;
•changes in accounting principles; and
•general market conditions, including factors unrelated to our performance.
In the past, securities class action litigation has often been instituted against companies following periods of volatility in the price of their common stock. This type of litigation could result in substantial costs and divert our management’s attention and resources, which could have a material adverse effect on our cash flows, our ability to execute our business strategy, and our ability to make distributions to our stockholders.
The number of shares of our common stock available for future issuance or sale could adversely affect the market price of our common stock.
We cannot predict whether future issuances or sales of shares of our common stock or the availability of shares of our common stock for resale in the open market will decrease the market price of our common stock. The issuance of a substantial number of shares of our common stock in the public market, or upon exchange of common units of limited partnership interest in our OP units, or the perception that such issuances might occur, could adversely affect the market price of our common stock.
The exchange of OP units for common stock, including OP units granted to certain directors, executive officers, and other employees under our equity incentive plan, or the issuance of our common stock or OP units in connection with future property, portfolio, or business acquisitions could have an adverse effect on the market price of our common stock. In addition, the existence of OP units and shares of our common stock reserved for issuance under our equity incentive plan may adversely affect the terms upon which we may be able to obtain additional capital through the sale of equity securities. Future issuances of shares of our common stock may also be dilutive to existing stockholders.
Future offerings of debt securities, which would be senior to our common stock upon liquidation, and/or preferred equity securities, which may be senior to our common stock for purposes of dividend distributions or upon liquidation, may adversely affect the market price of our common stock.
In October 2021, we issued $350 million aggregate principal amount of 2.625% senior notes, and in the future, we may attempt to increase our capital resources by offering additional debt or equity securities (or causing our operating partnership to issue debt or equity securities), including medium term notes, senior or subordinated notes, and additional classes of preferred or common stock. Holders of debt securities or shares of preferred stock, as well as lenders with respect to other borrowings, will generally be entitled to receive interest payments or distributions, both current and in connection with any liquidation or sale, prior to the holders of our common stock. Additionally, any convertible or exchangeable securities that we issue in the future may have rights, preferences, and privileges more favorable than those of our common stock and may result in dilution to owners of our common stock. We are not required to offer any such additional debt or equity securities to existing common stockholders on a preemptive basis. Therefore, offerings of common stock or other equity securities may dilute the holdings of our existing stockholders. Future offerings of debt or equity securities, or the perception that such offerings may occur, may reduce the market price of our common stock and/or the distributions that we pay with respect to our common stock. Because we may generally issue any such debt or equity securities in the future without obtaining the consent of our stockholders, you will bear the risk of our future offerings reducing the market price of our common stock and diluting your proportionate ownership.
| | | | | | | | | | | |
PHILLIPS EDISON & COMPANY DECEMBER 31, 2023 FORM 10-K | | | 20 |
If we pay distributions from sources other than our cash flows from operations, we may not be able to sustain our distribution rate, we may have fewer funds available for investment in shopping centers and other assets, and our stockholders’ overall returns may be reduced.
Our organizational documents permit us to pay distributions from any source without limit (other than those limits set forth under Maryland law). To the extent we fund distributions from borrowings, we will have fewer funds available for investment in real estate shopping centers and other real estate-related assets, and our stockholders’ overall returns may be reduced. At times, we may need to borrow funds to pay distributions, which could increase the costs to operate our business. Furthermore, if we cannot cover our distributions with cash flows from operations, we may be unable to sustain our distribution rate.
Our distributions to stockholders may change, which could adversely affect the market price of shares of our common stock.
All distributions will be at the sole discretion of our Board and this valuewill depend on our actual and projected financial condition, results of operations, cash flows, liquidity, maintenance of our REIT qualification, and such other matters as our Board may deem relevant from time to time. We intend to evaluate distributions throughout 2024, and it is expectedpossible that stockholders may not receive distributions equivalent to fluctuate over time. Asthose previously paid by us for various reasons, including: (i) we may not have enough cash to pay such a repurchasedistributions due to changes in our cash requirements, indebtedness, capital spending plans, operating cash flows, or financial position; (ii) decisions on whether, when, and in what amounts to make any future distributions will remain at all times entirely at the discretion of the Board, which reserves the right to change our distribution practices at any time and for any reason; (iii) our Board may be at a price that is less than the price at which the shares were initially purchased. If stockholders failelect to withdraw RMDs from their IRAretain cash for investment purposes, working capital reserves, or other retirement plan, theypurposes, or to maintain or improve our credit ratings; and (iv) the amount of distributions that our subsidiaries may distribute to us may be subject to certain tax penalties.restrictions imposed by state law, state regulators, and/or the terms of any current or future indebtedness that these subsidiaries may incur.
Stockholders have no contractual or other legal right to distributions that have not been authorized by the Board and declared by the Company. We may not be able to make distributions in the future or may need to fund such distributions from external sources, as to which no assurances can be given. In addition, as noted above, we may choose to retain operating cash flow, and those retained funds, although increasing the value of our underlying assets, may not correspondingly increase the market price of shares of our common stock. Our failure to meet the market's expectations with regard to future cash distributions likely would adversely affect the market price of shares of our common stock.
Increases in market interest rates may result in a decrease in the value of shares of our common stock. One of the factors that may influence the price of shares of our common stock is the dividend distribution rate on our common stock (as a percentage of the price of shares of our common stock) relative to market interest rates. If market interest rates rise, as has recently been experienced, prospective purchasers of shares of our common stock may expect a higher distribution rate. Higher interest rates would not, however, result in more funds being available for distribution and, in fact, would likely increase our borrowing costs and might decrease our funds available for distribution. We therefore may not be able, or we may not choose, to provide a higher distribution rate. As a result, prospective purchasers may decide to purchase other securities rather than shares of our common stock, which would reduce the demand for, and result in a decline in the market price of, shares of our common stock.
If we fail to maintain an effective system of internal control over financial reporting and disclosure controls, we may not be able to accurately and timely report our financial results.
Effective internal control over financial reporting and disclosure controls are necessary for us to provide reliable financial reports, effectively prevent fraud, and to operate successfully as a public company. If we cannot provide reliable financial reports or prevent fraud, our reputation and operating results would be harmed. We are required to perform system and process evaluation and testing of our internal control over financial reporting to allow management to report on the effectiveness of our internal control over financial reporting, and are required to have our independent registered public accounting firm attest to the same, as required by Section 404 of the Sarbanes-Oxley Act of 2002. If a material weakness or significant deficiency was to be identified in our internal control over financial reporting, we may also identify deficiencies in some of our disclosure controls and procedures that we believe require remediation. If we or our independent registered public accounting firm discover weaknesses, we will make efforts to improve our internal control over financial reporting and disclosure controls. However, there is no assurance that we will be successful. Any failure to maintain effective controls or timely effect any necessary improvement of our internal control over financial reporting and disclosure controls could harm operating results or cause us to fail to meet our reporting obligations, which could affect the listing of our common stock on Nasdaq. Ineffective internal control over financial reporting and disclosure controls could also cause investors to lose confidence in our reported financial information, which would likely have a negative effect on the per share trading price of our common stock.
ITEM 1B. UNRESOLVED STAFF COMMENTS
Not applicable.
| | | | | | | | | | | |
PHILLIPS EDISON & COMPANY DECEMBER 31, 2023 FORM 10-K | | | 21 |
ITEM 1C. CYBERSECURITY
PECO’s cybersecurity program is generally based on the National Institute of Standards and Technology cybersecurity framework (“NIST CSF”) with the intention of preventing, identifying, detecting, and mitigating cybersecurity risks. This does not imply that we meet or comply with any particular technical standards, specifications, frameworks, or requirements including the NIST CSF, only that we use the NIST CSF as a guide. Our program focuses on people, processes, and technologies and includes training of associates, periodic workforce testing, and the deployment and monitoring of technical security solutions and controls.
Our cybersecurity risk management program is integrated into our overall enterprise risk management program and shares common methodologies, reporting channels, and governance processes that apply across the enterprise risk management program to other legal, compliance, strategic, operational, and financial risk areas.
Our management team, including the Chief Information Officer (“CIO”), is responsible for identifying and managing our material risks from cybersecurity threats. The CIO has primary responsibility for leading our overall cybersecurity risk management program and supervises both the PECO cybersecurity team and our retained external cybersecurity consultants. The management team, led by the CIO and cybersecurity team, stay informed about cybersecurity risk including prevention, detection, mitigation, and remediation of cybersecurity risks and incidents through various means, which may include briefings from internal security personnel; threat intelligence and other information obtained from governmental, public, or private sources, including external consultants engaged by us; and alerts and reports produced by security tools deployed in the PECO environment. The CIO works closely with members of PECO's cybersecurity team, who have years of experience working in cybersecurity, possessing industry certifications such as Certified Information Systems Security Professional (“CISSP”) and Security+, and pursuing advanced degrees and studies in the field. Cybersecurity team members participate in recurring cybersecurity team meetings with the CIO and provide monthly executive leadership updates. The Board oversees our cybersecurity program and is periodically briefed by management, including the CIO, on cybersecurity risks and initiatives. In addition, management updates the Board as necessary regarding any significant cybersecurity incidents.
The cybersecurity team delivers cybersecurity training to associates, including security videos and informational tips, new hire training, out-of-band cybersecurity alerts, and simulated phishing campaigns with teachable moments and focused training, all designed to provide security specific knowledge to our associates. Positive reinforcement is utilized and encourages associates’ participation, in addition to required periodic training. The PECO cybersecurity team participates in cybersecurity training, activities, and events to stay current with the evolution of security threats, security solutions, best practices, and the risks facing PECO.
At PECO, we are committed to protecting the confidentiality and integrity of our data and systems. Among other things, our key contracts contain requirements that counterparties maintain standards of data security and privacy compliance.
PECO maintains, internally publishes, and annually reviews its cybersecurity policies and procedures, which includes an incident response plan. Additionally, PECO engages with external cybersecurity experts to conduct annual penetration testing, provide monitoring of the environment, conduct tabletop exercises, and for dedicated incident response and advanced forensics capabilities. In addition to internal audits and external reviews, assessments have included the NIST CSF, cybersecurity maturity assessment, and Center for Internet Security Benchmarks to identify opportunities for enhancement.
We have not identified risks from known cybersecurity threats, including as a result of any prior cybersecurity incidents, that have materially affected us, including our operations, business strategy, results of operations, or financial condition. We face certain ongoing risks from cybersecurity threats that, if realized, are reasonably likely to materially affect us, including our financial results and business operations. See “Item 1A. Risk Factors – Risks Related to Business Continuity”.
| | | | | | | | | | | |
PHILLIPS EDISON & COMPANY DECEMBER 31, 2023 FORM 10-K | | | 22 |
ITEM 2. PROPERTIES
Real Estate Investments
AsREAL ESTATE INVESTMENTS—The following table details information for our wholly-owned properties and those owned through our unconsolidated joint venture as of December 31, 2017, we owned 236 properties throughout2023, which is the United States. basis for determining the prorated information included in the subsequent tables (dollars and square feet in thousands):
| | | | | | | | | | | | | | | | | | | | | | | | | | |
| | Ownership Percentage | | Number of Properties | | ABR | | GLA |
| Wholly-owned properties | | 100% | | 281 | | | $ | 470,819 | | | 32,153 | |
| GRP I | | 14% | | 20 | | | 31,908 | | | 2,213 | |
The following table presents information regarding the geographicalgeographic location of our properties, including wholly-owned and the prorated portion of those owned through our unconsolidated joint venture, by annualized base rent (“ABR”)ABR as of December 31, 2017 (dollars and square feet in thousands).2023. For additional portfolio information, refer to Schedule“Schedule III - Real Estate Assets and Accumulated Depreciation, herein.Depreciation” (dollars and square feet in thousands): | | | | | | | | | | | | | | | | | | | | | | | | | | | | | | | | | | | | | | | | | | | | |
| State | | ABR(1) | | % ABR | | ABR/Leased Square Foot | | GLA(2) | | % GLA | | % Leased | | Number of Properties |
| Florida | | $ | 58,036 | | | 12.2 | % | | $ | 14.57 | | | 4,088 | | | 12.6 | % | | 97.4 | % | | 51 | |
| California | | 51,936 | | | 10.9 | % | | 21.52 | | | 2,504 | | | 7.7 | % | | 96.4 | % | | 26 | |
| Texas | | 43,072 | | | 9.1 | % | | 18.21 | | | 2,474 | | | 7.6 | % | | 95.6 | % | | 20 | |
| Georgia | | 40,979 | | | 8.6 | % | | 13.75 | | | 3,028 | | | 9.3 | % | | 98.4 | % | | 31 | |
| Illinois | | 28,540 | | | 6.0 | % | | 16.71 | | | 1,804 | | | 5.6 | % | | 94.6 | % | | 16 | |
| Ohio | | 25,316 | | | 5.3 | % | | 11.04 | | | 2,336 | | | 7.2 | % | | 98.2 | % | | 19 | |
| Colorado | | 24,850 | | | 5.2 | % | | 18.41 | | | 1,408 | | | 4.3 | % | | 95.9 | % | | 12 | |
| Virginia | | 22,724 | | | 4.8 | % | | 17.15 | | | 1,359 | | | 4.2 | % | | 97.5 | % | | 13 | |
| Minnesota | | 19,688 | | | 4.1 | % | | 15.55 | | | 1,325 | | | 4.1 | % | | 95.5 | % | | 13 | |
| Massachusetts | | 16,944 | | | 3.6 | % | | 15.22 | | | 1,146 | | | 3.5 | % | | 97.1 | % | | 9 | |
| Nevada | | 14,824 | | | 3.1 | % | | 24.30 | | | 623 | | | 1.9 | % | | 97.9 | % | | 5 | |
| Pennsylvania | | 12,264 | | | 2.6 | % | | 12.45 | | | 1,001 | | | 3.1 | % | | 98.4 | % | | 6 | |
| Wisconsin | | 11,990 | | | 2.5 | % | | 11.47 | | | 1,057 | | | 3.3 | % | | 98.9 | % | | 9 | |
| Arizona | | 10,741 | | | 2.3 | % | | 14.81 | | | 735 | | | 2.3 | % | | 98.6 | % | | 6 | |
| South Carolina | | 10,086 | | | 2.1 | % | | 11.81 | | | 863 | | | 2.7 | % | | 99.0 | % | | 8 | |
| Maryland | | 9,568 | | | 2.0 | % | | 21.01 | | | 463 | | | 1.4 | % | | 98.4 | % | | 4 | |
| North Carolina | | 8,409 | | | 1.8 | % | | 12.91 | | | 658 | | | 2.0 | % | | 99.0 | % | | 10 | |
| Tennessee | | 8,132 | | | 1.7 | % | | 10.20 | | | 802 | | | 2.5 | % | | 99.4 | % | | 5 | |
| Indiana | | 7,261 | | | 1.5 | % | | 8.85 | | | 832 | | | 2.6 | % | | 98.6 | % | | 5 | |
| Kentucky | | 6,849 | | | 1.5 | % | | 11.18 | | | 616 | | | 1.9 | % | | 99.5 | % | | 4 | |
| Michigan | | 6,772 | | | 1.4 | % | | 9.59 | | | 724 | | | 2.2 | % | | 97.6 | % | | 5 | |
| New Mexico | | 6,044 | | | 1.3 | % | | 15.02 | | | 404 | | | 1.2 | % | | 99.6 | % | | 3 | |
| Connecticut | | 5,982 | | | 1.3 | % | | 14.35 | | | 421 | | | 1.3 | % | | 99.0 | % | | 4 | |
| Oregon | | 4,765 | | | 1.0 | % | | 16.14 | | | 316 | | | 1.0 | % | | 93.4 | % | | 4 | |
| Kansas | | 4,684 | | | 1.0 | % | | 12.53 | | | 374 | | | 1.2 | % | | 100.0 | % | | 3 | |
| New Jersey | | 4,245 | | | 0.9 | % | | 25.05 | | | 169 | | | 0.5 | % | | 100.0 | % | | 1 | |
| Washington | | 2,886 | | | 0.6 | % | | 16.69 | | | 173 | | | 0.5 | % | | 100.0 | % | | 2 | |
| Iowa | | 2,822 | | | 0.6 | % | | 8.00 | | | 360 | | | 1.1 | % | | 98.1 | % | | 3 | |
| Missouri | | 2,589 | | | 0.5 | % | | 11.89 | | | 222 | | | 0.7 | % | | 98.2 | % | | 2 | |
| New York | | 1,823 | | | 0.4 | % | | 11.58 | | | 163 | | | 0.5 | % | | 96.3 | % | | 1 | |
| Utah | | 461 | | | 0.1 | % | | 31.70 | | | 15 | | | — | % | | 100.0 | % | | 1 | |
| Total | | $ | 475,282 | | | 100.0 | % | | $ | 15.03 | | | 32,463 | | | 100.0 | % | | 97.4 | % | | 301 | |
(1)We calculate ABR as monthly contractual base rent as of December 31, 2023 multiplied by twelve months.
(2)Gross leasable area (“GLA”) is defined as the total occupied and unoccupied square footage of a building that is available for Neighbors tolease.
|
| | | | | | | | | | | | | | | | | | | | | | | |
| State | | ABR(1) | | % ABR | | ABR/Leased Square Foot | | GLA(2) | | % GLA | | % Leased | | Number of Properties |
| Florida | | $ | 35,769 |
| | 12.8 | % | | $ | 12.66 |
| | 3,069 |
| | 11.7 | % | | 92.0 | % | | 35 |
|
| Georgia | | 24,369 |
| | 8.7 | % | | 11.19 |
| | 2,266 |
| | 8.6 | % | | 96.1 | % | | 24 |
|
| Ohio | | 24,361 |
| | 8.7 | % | | 9.49 |
| | 2,679 |
| | 10.2 | % | | 95.8 | % | | 22 |
|
| California | | 20,497 |
| | 7.3 | % | | 17.70 |
| | 1,233 |
| | 4.7 | % | | 93.9 | % | | 12 |
|
| Texas | | 20,235 |
| | 7.2 | % | | 13.77 |
| | 1,560 |
| | 5.9 | % | | 94.2 | % | | 10 |
|
| Illinois | | 14,833 |
| | 5.3 | % | | 12.15 |
| | 1,334 |
| | 5.1 | % | | 91.5 | % | | 9 |
|
| Virginia | | 14,015 |
| | 5.0 | % | | 12.16 |
| | 1,281 |
| | 4.9 | % | | 90.0 | % | | 12 |
|
| North Carolina | | 11,735 |
| | 4.2 | % | | 9.72 |
| | 1,240 |
| | 4.7 | % | | 97.3 | % | | 13 |
|
| South Carolina | | 10,741 |
| | 3.8 | % | | 9.40 |
| | 1,271 |
| | 4.8 | % | | 89.9 | % | | 13 |
|
| Pennsylvania | | 9,903 |
| | 3.5 | % | | 10.40 |
| | 1,025 |
| | 3.9 | % | | 92.9 | % | | 6 |
|
| Massachusetts | | 9,651 |
| | 3.5 | % | | 12.87 |
| | 767 |
| | 2.9 | % | | 97.8 | % | | 6 |
|
| Indiana | | 8,847 |
| | 3.2 | % | | 7.68 |
| | 1,244 |
| | 4.7 | % | | 92.6 | % | | 8 |
|
| Tennessee | | 7,993 |
| | 2.9 | % | | 7.79 |
| | 1,038 |
| | 4.0 | % | | 98.8 | % | | 7 |
|
| Arizona | | 7,594 |
| | 2.7 | % | | 11.13 |
| | 797 |
| | 3.0 | % | | 85.6 | % | | 7 |
|
| Maryland | | 6,360 |
| | 2.3 | % | | 18.82 |
| | 347 |
| | 1.3 | % | | 97.4 | % | | 3 |
|
| Colorado | | 6,266 |
| | 2.2 | % | | 12.87 |
| | 504 |
| | 1.9 | % | | 96.6 | % | | 5 |
|
| Oregon | | 6,221 |
| | 2.2 | % | | 13.64 |
| | 472 |
| | 1.8 | % | | 96.6 | % | | 6 |
|
| Minnesota | | 5,691 |
| | 2.0 | % | | 11.73 |
| | 493 |
| | 1.9 | % | | 98.4 | % | | 6 |
|
| New Mexico | | 5,484 |
| | 2.0 | % | | 13.25 |
| | 471 |
| | 1.8 | % | | 87.9 | % | | 5 |
|
| Michigan | | 5,252 |
| | 1.9 | % | | 7.87 |
| | 701 |
| | 2.7 | % | | 95.1 | % | | 4 |
|
| Kentucky | | 4,868 |
| | 1.8 | % | | 8.57 |
| | 598 |
| | 2.3 | % | | 95.0 | % | | 4 |
|
| Wisconsin | | 4,618 |
| | 1.7 | % | | 11.46 |
| | 423 |
| | 1.6 | % | | 95.3 | % | | 5 |
|
| Iowa | | 2,888 |
| | 1.0 | % | | 8.32 |
| | 360 |
| | 1.4 | % | | 96.4 | % | | 3 |
|
| Washington | | 2,419 |
| | 0.9 | % | | 14.93 |
| | 171 |
| | 0.6 | % | | 94.7 | % | | 2 |
|
| Nevada | | 2,307 |
| | 0.8 | % | | 18.60 |
| | 128 |
| | 0.5 | % | | 96.9 | % | | 1 |
|
| Connecticut | | 1,806 |
| | 0.6 | % | | 15.18 |
| | 124 |
| | 0.5 | % | | 96.0 | % | | 1 |
|
| Kansas | | 1,392 |
| | 0.5 | % | | 10.01 |
| | 153 |
| | 0.6 | % | | 90.8 | % | | 2 |
|
| Alabama | | 1,018 |
| | 0.4 | % | | 6.88 |
| | 174 |
| | 0.7 | % | | 85.1 | % | | 1 |
|
| Missouri | | 861 |
| | 0.3 | % | | 7.69 |
| | 112 |
| | 0.4 | % | | 100.0 | % | | 1 |
|
| New Jersey | | 838 |
| | 0.3 | % | | 8.06 |
| | 111 |
| | 0.4 | % | | 93.7 | % | | 1 |
|
| Mississippi | | 628 |
| | 0.2 | % | | 5.66 |
| | 112 |
| | 0.4 | % | | 99.1 | % | | 1 |
|
| Utah | | 237 |
| | 0.1 | % | | 16.93 |
| | 14 |
| | 0.1 | % | | 100.0 | % | | 1 |
|
| Total | | $ | 279,697 |
| | 100.0 | % | | $ | 11.33 |
| | 26,272 |
| | 100.0 | % | | 93.9 | % | | 236 |
|
| | | | | | | | | | | |
(1)PHILLIPS EDISON & COMPANY
DECEMBER 31, 2023 FORM 10-K | | We calculate ABR as monthly contractual rent as of December 31, 2017, multiplied by 12 months.
| 23 |
| |
(2)
| Gross leasable area (“GLA”) is defined as the portion of the total square feet of a building that is available for tenant leasing. |
TOP TEN CITIES—The following table presents the top ten city markets by ABR of our wholly-owned properties as of December 31, 2023 (dollars in thousands):
| | | | | | | | | | | | | | |
| City | | ABR(1) | | % ABR |
| Atlanta | | $ | 33,644 | | | 7.1 | % |
| Chicago | | 26,067 | | | 5.5 | % |
| Dallas | | 24,709 | | | 5.2 | % |
| Sacramento | | 20,986 | | | 4.5 | % |
| Minneapolis | | 18,439 | | | 3.9 | % |
| Denver | | 17,731 | | | 3.8 | % |
| Washington, D.C. | | 14,915 | | | 3.2 | % |
| Las Vegas | | 14,824 | | | 3.1 | % |
| Houston | | 14,609 | | | 3.1 | % |
| Tampa | | 13,791 | | | 2.9 | % |
| Total | | $ | 199,715 | | | 42.3 | % |
(1)We calculate ABR as monthly contractual base rent as of December 31, 2023 multiplied by twelve months.
Lease Expirations
LEASE EXPIRATIONS—The following chart shows on anthe aggregate basis, all of the scheduled lease expirations for our over 3,000 Neighbors, excluding our Neighbors who are occupying space on a temporary basis, after December 31, 2017,2023 for each of the next ten years and thereafter for our 236 shopping centers. The chart showswholly-owned properties and the leasedprorated portion of those owned through our unconsolidated joint venture:
Our ability to create rental rate growth generally depends on our leverage during new and renewal lease negotiations with prospective and existing Neighbors, which typically occurs when occupancy at our centers is high or during periods of economic growth and recovery. Conversely, we may experience rental rate decline when occupancy at our centers is low or during periods of economic recession, as the leverage during new and renewal lease negotiations may shift to prospective and existing Neighbors.
| | | | | | | | | | | |
PHILLIPS EDISON & COMPANY DECEMBER 31, 2023 FORM 10-K | | | 24 |
For our wholly-owned properties and those owned through our unconsolidated joint venture, during the 2024 fiscal year, we have a total of 670 leases expiring, representing 2.8 million square feet
and ABR represented byof GLA. For our wholly-owned properties, during the
applicable lease expiration2024 fiscal year,
(dollars andwe have 635 leases expiring, representing 2.8 million square feet
in thousands):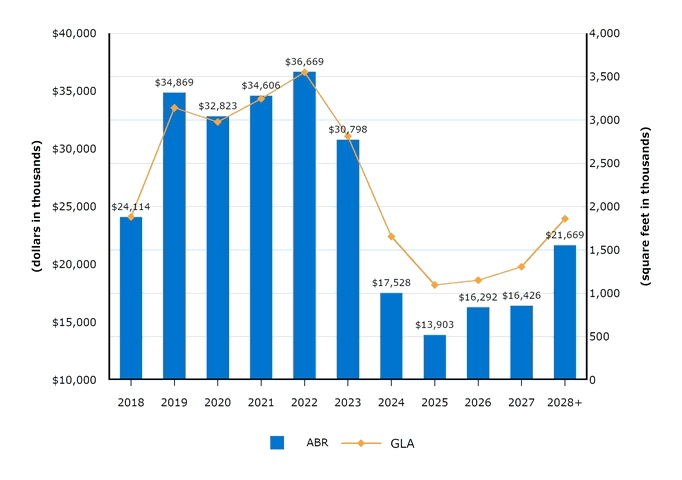
Subsequent to December 31, 2017, we renewed approximately 455,000 total square feet and $6.2 million of totalGLA. For our wholly-owned properties, the expiring leases have an ABR of $15.07 per square foot. While we cannot predict what rental rates we will achieve in 2024 as we renew or replace these expiring leases, the comparable rent spread of new leases expiring.
Duringsigned during 2023 was 25.2%, and the comparable rent spread for lease renewals executed in 2023 was 16.2%. Further, during the fiscal year 2023, our occupancy remained high, ending the year ended December 31, 2017, rent per square footat 97.4%, indicating continued demand for renewed leases increased 8.5% when compared to rent per square foot prior to renewal. leasing spaces at our centers.
See “Part II, Item 7. Management’s Discussion and Analysis of Financial Condition and Results of Operations - Results of OperationsOverview - Leasing Activity,Activity” of this filing on Form 10-K for further discussion of leasing activity. Based on current market base rental rates, we believe we will achieve an overall positive increase in our average ABR for expiring leases. However, changes in base rental income associated with individual signed leases on comparable spaces may be positive or negative, and we can provide no assurance that the base rents on new leases will continue to increase from current levels.
Portfolio Tenancy
Prior to the acquisition of a property, we assess the suitability of the grocery-anchor tenant and other tenants in light of our investment objectives, namely, preserving capital and providing stable cash flows for distributions. Generally, we assess the strength of the tenant by consideration of company factors, such as its financial strength and market share in the geographic area of the shopping center, as well as location-specific factors, such as the store’s sales, local competition, and demographics. When assessing the tenancy of the non-anchor space at the shopping center, we consider the tenant mix at each shopping center in light of our portfolio, the proportion of national and national-franchise tenants, the creditworthiness of specific tenants, and the timing of lease expirations. When evaluating non-national tenancy, we attempt to obtain credit enhancements to leases, which typically come in the form of deposits and/or guarantees from one or more individuals.
PORTFOLIO TENANCY—We define national tenantsNeighbors as those tenantsNeighbors that operate in at least three states. Regional tenantsNeighbors are defined as those tenantsNeighbors that have at least three locations.locations in fewer than three states. The following charts present the composition of our portfolio, including our wholly-owned properties and the prorated portion of those owned through our unconsolidated joint venture, by tenantNeighbor type as of December 31, 2017:2023:
The following charts present the composition of our portfolio by tenantNeighbor industry as of December 31, 2017:2023:
| | | | | | | | | | | |
PHILLIPS EDISON & COMPANY DECEMBER 31, 2023 FORM 10-K | | | 25 |
NECESSITY-BASED GOODS AND SERVICES—We define “necessity-based goods and services” as goods and services that are indispensable, necessary, or common for day-to-day living, or that tend to be inelastic (i.e., those for which the demand does not change based on a consumer’s income level). We estimate that approximately 70% of our ABR, including the pro rata portion attributable to properties owned through our unconsolidated joint venture, is generated from Neighbors providing necessity-based goods and services.
TOP TWENTY NEIGHBORS—The following table presents our top ten tenants, grouped according to parent company,20 Neighbors by ABR, including our wholly-owned properties and the prorated portion of those owned through our unconsolidated joint venture, as of December 31, 20172023 (dollars and square feet in thousands): |
| | | | | | | | | | | | | | | | |
| Tenant | | ABR | | % of ABR | | Leased Square Feet | | % of Leased Square Feet | | Number of Locations(1) |
| Kroger | | $ | 25,820 |
| | 9.2 | % | | 3,138 |
| | 12.7 | % | | 55 |
|
| Publix | | 17,016 |
| | 6.1 | % | | 1,672 |
| | 6.8 | % | | 36 |
|
| Ahold Delhaize | | 10,233 |
| | 3.7 | % | | 854 |
| | 3.5 | % | | 19 |
|
| Albertsons-Safeway | | 9,461 |
| | 3.4 | % | | 924 |
| | 3.7 | % | | 17 |
|
| Giant Eagle | | 6,797 |
| | 2.4 | % | | 700 |
| | 2.8 | % | | 9 |
|
| Walmart | | 5,562 |
| | 2.0 | % | | 1,213 |
| | 4.9 | % | | 11 |
|
| Dollar Tree | | 3,505 |
| | 1.3 | % | | 399 |
| | 1.6 | % | | 40 |
|
| Raley's | | 3,422 |
| | 1.2 | % | | 193 |
| | 0.8 | % | | 3 |
|
| Lowe's | | 3,020 |
| | 1.1 | % | | 474 |
| | 1.9 | % | | 4 |
|
| SUPERVALU | | 2,844 |
| | 1.0 | % | | 371 |
| | 1.5 | % | | 9 |
|
| | | $ | 87,680 |
| | 31.4 | % | | 9,938 |
| | 40.2 | % | | 203 |
|
| |
(1)
| Number of locations excludes auxiliary leases with grocery anchors such as fuel stations, pharmacies, and liquor stores. |
| | | | | | | | | | | | | | | | | | | | | | | | | | | | | | | | |
Neighbor(1) | | ABR | | % of ABR | | Leased
Square Feet | | % of Leased Square Feet | | Number of Locations(2) |
| Kroger | | $ | 28,459 | | | 6.0 | % | | 3,474 | | | 11.0 | % | | 63 | |
| Publix | | 26,570 | | | 5.6 | % | | 2,519 | | | 8.0 | % | | 61 | |
| Albertsons | | 19,361 | | | 4.1 | % | | 1,777 | | | 5.6 | % | | 32 | |
| Ahold Delhaize | | 17,829 | | | 3.8 | % | | 1,249 | | | 3.9 | % | | 23 | |
| Walmart | | 8,971 | | | 1.9 | % | | 1,770 | | | 5.6 | % | | 13 | |
| Giant Eagle | | 7,384 | | | 1.6 | % | | 759 | | | 2.4 | % | | 10 | |
| Sprouts Farmers Market | | 6,663 | | | 1.4 | % | | 421 | | | 1.3 | % | | 14 | |
| TJX Companies | | 6,262 | | | 1.3 | % | | 516 | | | 1.6 | % | | 18 | |
| Raley's | | 4,599 | | | 1.0 | % | | 288 | | | 0.9 | % | | 5 | |
| Dollar Tree | | 3,859 | | | 0.7 | % | | 369 | | | 1.2 | % | | 37 | |
| UNFI (SuperValu) | | 3,476 | | | 0.7 | % | | 336 | | | 1.1 | % | | 5 | |
| Starbucks Corporation | | 2,983 | | | 0.5 | % | | 64 | | | 0.2 | % | | 35 | |
| Trader Joe's | | 2,727 | | | 0.5 | % | | 122 | | | 0.4 | % | | 9 | |
| H-E-B | | 2,492 | | | 0.5 | % | | 164 | | | 0.5 | % | | 2 | |
| Lowe's | | 2,469 | | | 0.5 | % | | 369 | | | 1.2 | % | | 4 | |
| Subway Group | | 2,448 | | | 0.5 | % | | 88 | | | 0.3 | % | | 61 | |
| Anytime Fitness, Inc. | | 2,430 | | | 0.5 | % | | 140 | | | 0.4 | % | | 29 | |
| Food 4 Less (PAQ) | | 2,305 | | | 0.5 | % | | 118 | | | 0.4 | % | | 2 | |
| United Parcel Service | | 2,304 | | | 0.5 | % | | 82 | | | 0.3 | % | | 65 | |
| H&R Block, Inc. | | 2,284 | | | 0.5 | % | | 97 | | | 0.3 | % | | 56 | |
| Total | | $ | 155,875 | | | 32.6 | % | | 14,722 | | | 46.6 | % | | 544 | |
(1)Neighbors are grouped by parent company and may represent multiple subsidiaries and banners. (2)Number of locations excludes auxiliary leases with grocery anchors such as fuel stations, pharmacies, and liquor stores. Additionally, if a parent company has multiple subsidiaries or banners in a single shopping center, those subsidiaries are included as one location.
ITEM 3. LEGAL PROCEEDINGS
From time to time, we are party to legal proceedings, which arise in the ordinary course of our business. We are not currently involved in any legal proceedings offor which we are not covered by our liability insurance or the outcome is reasonably likely to have a material impact on our results of operations or financial condition, nor are we aware of any such legal proceedings contemplated by governmental authorities.
ITEM 4. MINE SAFETY DISCLOSURES
Not applicable.
|
| | | | | | | | | | |
wPART IIPHILLIPS EDISON & COMPANY
DECEMBER 31, 2023 FORM 10-K | | | 26 |
ITEM 5. MARKET FOR REGISTRANT’S COMMON EQUITY, RELATED STOCKHOLDER MATTERS, AND ISSUER PURCHASES OF EQUITY SECURITIES
MARKET INFORMATION—Pursuant to our underwritten initial public offering (“underwritten IPO”) on July 19, 2021, our common stock is traded on the Nasdaq Global Select Market Information
(“Nasdaq”) under the ticker symbol “PECO.” As of March 15, 2018,February 5, 2024, we had approximately 186.2122.2 million shares of common stock outstanding, held by a total of 40,019approximately 8,000 stockholders of record. TheThis figure does not represent the actual number of stockholders is based onbeneficial owners of the recordsCompany’s common shares because common shares are frequently held in “street name” by securities dealers and others for the beneficial owners who may vote the shares.
DISTRIBUTIONS—We elected to be taxed as a real estate investment trust (“REIT”) for federal income tax purposes commencing with our taxable year ended December 31, 2010. As a REIT, we have made, and intend to continue to make, distributions each taxable year equal to at least 90% of our registrartaxable income (excluding capital gains and transfer agent. Our common stock is not currently traded on any exchange, and there is no established trading market for our common stock. Therefore, there is a risk that a stockholder may not be able to sell our stock at a time or price acceptablecomputed without regard to the stockholder,dividends paid deduction).
In 2023, we declared and paid monthly distributions of $0.0933 per share, or at all.$1.12 annualized, for each month beginning January 2023 through August 2023. On September 1, 2023, our Board of Directors (the “Board”) authorized a 4.5% increase of our monthly distribution rate to $0.0975 per common share. We declared and paid monthly distributions of $0.0975 per share, or $1.17 annualized, for each month beginning September 2023 through December 2023.
Valuation Overview
On November 8, 2017, the independent directorsThe December 2023 and January 2024 distributions of the board$0.0975 per share were paid on January 2, 2024 and February 1, 2024, respectively. Holders of directors (“Independent Directors”)ownership units of Phillips Edison & Company, Inc. (“we,” the “Company,” “our,” or “us”), formerly known as Phillips Edison Grocery Center Operating Partnership I, L.P. (the "Operating Partnership") ("OP units") will receive distributions at the same rate as common stockholders, subject to any applicable withholding. The timing and amount of distributions are determined by our Board and is influenced in part by our intention to comply with REIT I, Inc.requirements of the Internal Revenue Code of 1986, as amended (the “IRC”).
In 2022, we declared and paid monthly distributions of $0.09 per share, or $1.08 annualized, for each month beginning January 2022 through August 2022. We declared and paid monthly distributions of $0.0933 per share, or $1.12 annualized, an increase of 3.7%, establishedfor each month beginning September 2022 through December 2022.
The tax characterization of our distributions declared for the years ended December 31, 2023 and 2022 was as follows:
| | | | | | | | | | | |
| 2023 | | 2022 |
| Common stock: | | | |
| Ordinary dividends | 75.9 | % | | 77.4 | % |
| Non-dividend distributions | 24.0 | % | | 22.6 | % |
Capital gain distributions(1) | 0.1 | % | | — | % |
| Total distributions per share of common stock | 100.0 | % | | 100.0 | % |
(1)Pursuant to U.S. Treasury Regulation §1.1061-6(c) and §1061 of the IRC, the One Year Amounts and Three Year Amounts disclosures are both zero with respect to direct and indirect holders of “applicable partnership interests” for us and our subsidiary REIT, Phillips Edison Institutional REIT, LLC for all years presented.
UNREGISTERED SALE OF SECURITIES—During the year ended December 31, 2023, we issued an aggregate of approximately 517,000 shares of common stock in redemption of approximately 517,000 OP units. These shares of common stock were issued in reliance on an exemption from registration under Section 4(a)(2) of the Securities Act of 1933, as amended. We relied on the exemption under Section 4(a)(2) based upon factual representations received from the limited partners who received the shares of common stock.
SHARE REPURCHASE PROGRAM—On August 3, 2022, our Board approved a new share repurchase program of up to $250 million of common stock. The program may be suspended or discontinued at any time, and does not obligate us to repurchase any dollar amount or particular number of shares. No share repurchases have been made to date under this program.
| | | | | | | | | | | |
PHILLIPS EDISON & COMPANY DECEMBER 31, 2023 FORM 10-K | | | 27 |
The table below summarizes repurchases of our common stock made during the three months ended December 31, 2023:
| | | | | | | | | | | | | | | | | | | | | | | |
| Period | Total Number of Shares Purchased | | Average Price Paid per Share | | Total Number of Shares Purchased as Part of a Publicly Announced Plan or Program | | Approximate Dollar Value of Shares That May Yet Be Purchased Under the Plan or Program (in thousands) |
| October 1, 2023 - October 31, 2023 | — | | $— | | — | | $250,000 |
| November 1, 2023 - November 30, 2023 | — | | — | | — | | 250,000 |
December 1, 2023 to December 31, 2023(1) | 21,649 | | 36.48 | | — | | 250,000 |
(1)Represents common shares surrendered to us to satisfy statutory minimum tax withholding obligations associated with the vesting of restricted stock awards under our equity-based compensation plan.
PERFORMANCE GRAPH—The following graph is a comparison of the cumulative total return of shares of our common stock, the Standard and Poor’s 500 Composite Index (“S&P 500”), the FTSE Nareit All Equity REITs index (“FNER”), and the FTSE Nareit Equity Shopping Centers index (“FNSC”). The graph assumes that $100 was invested on July 15, 2021 and assumes the reinvestment of any dividends. The shareholder return shown on the graph below is not indicative of future performance. The information in this paragraph and the following performance graph are deemed “furnished”, not “filed”, with the U.S. Securities and Exchange Commission (“SEC”) and is not to be incorporated by reference into any of our filings, whether made before or after the date hereof and irrespective of any general incorporation language contained in such filing, except as shall be expressly set forth by specific reference in such filing.

| | | | | | | | | | | | | | | | | | | | | | | | | | | | | | | | | | | |
| Ticker / Index | 7/15/2021 | | 12/31/2021 | | 6/30/2022 | | 12/31/2022 | | 6/30/2023 | | 12/31/2023 |
| PECO | $ | 100 | | | $ | 120 | | | $ | 124 | | | $ | 120 | | | $ | 131 | | | $ | 142 | |
| S&P 500 | 100 | | | 110 | | | 88 | | | 90 | | | 105 | | | 114 | |
| FTSE Nareit All Equity REITs | 100 | | | 113 | | | 90 | | | 85 | | | 90 | | | 97 | |
FTSE Nareit Equity Shopping
Centers | 100 | | | 114 | | | 93 | | | 100 | | | 101 | | | 112 | |
ITEM 6.
Reserved.
| | | | | | | | | | | |
PHILLIPS EDISON & COMPANY DECEMBER 31, 2023 FORM 10-K | | | 28 |
ITEM 7. MANAGEMENT’S DISCUSSION AND ANALYSIS OF FINANCIAL CONDITION AND RESULTS OF OPERATIONS
The following discussion and analysis should be read in conjunction with our accompanying consolidated financial statements and notes thereto. See also “Cautionary Note Regarding Forward-Looking Statements” preceding Part I.
| | |
| KEY PERFORMANCE INDICATORS AND DEFINED TERMS |
We use certain key performance indicators (“KPIs”), which include both financial and nonfinancial metrics, to measure the performance of our operations. We believe these KPIs, as well as the core concepts and terms defined below, allow our Board, management, and investors to analyze trends around our business strategy, financial condition, and results of operations in a manner that is focused on items unique to the retail real estate industry.
We do not consider our non-GAAP measures to be alternatives to measures required in accordance with accounting principles generally accepted in the United States (“GAAP”). Certain non-GAAP measures should not be viewed as an alternative measure of our financial performance as they may not reflect the operations of our entire portfolio, and they may not reflect the impact of general and administrative expenses, depreciation and amortization, interest expense, other income (expense), or the level of capital expenditures and leasing costs necessary to maintain the operating performance of our shopping centers that could materially impact our results from operations. Additionally, certain non-GAAP measures should not be considered as an indication of our liquidity, nor as an indication of funds available to cover our cash needs, including our ability to fund distributions, and may not be a useful measure of the impact of long-term operating performance on value if we do not continue to operate our business in the manner currently contemplated. Accordingly, non-GAAP measures should be reviewed in connection with other GAAP measurements and should not be viewed as more prominent measures of performance than net income (loss) or cash flows from operations prepared in accordance with GAAP. Other REITs may use different methodologies for calculating similar non-GAAP measures, and accordingly, our non-GAAP measures may not be comparable to other REITs.
Our KPIs and terminology can be grouped into three key areas:
PORTFOLIO—Portfolio metrics help management to gauge the health of our centers overall and individually.
•Anchor space—We define an anchor space as a space greater than or equal to 10,000 square feet of gross leasable area (“GLA”).
•Annualized Base Rent (“ABR”)—We use ABR to refer to the monthly contractual base rent at the end of the period multiplied by twelve months.
•ABR Per Square Foot (“PSF”)—This metric is calculated by dividing ABR by leased GLA. Increases in ABR PSF can be an indication of our ability to create rental rate growth in our centers, as well as an indication of demand for our spaces, which generally provides us with greater leverage during lease negotiations.
•GLA—We use GLA to refer to the total occupied and unoccupied square footage of a building that is available for tenants (whom we refer to as a “Neighbor” or our “Neighbors”) or other retailers to lease.
•Inline space—We define an inline space as a space containing less than 10,000 square feet of GLA.
•Leased Occupancy—This metric is calculated as the percentage of total GLA for which a lease has been signed regardless of whether the lease has commenced or the Neighbor has taken possession. High occupancy is an indicator of demand for our spaces, which generally provides us with greater leverage during lease negotiations.
•Underwritten incremental unlevered yield—This reflects the yield we target to generate from a project upon expected stabilization and is calculated as the estimated incremental net operating income (“NOI”) for a project at stabilization divided by its estimated net project investment. The estimated incremental NOI is the difference between the estimated annualized NOI we target to generate by a project upon stabilization and the estimated annualized NOI without the planned improvements. Underwritten incremental unlevered yield does not include peripheral impacts, such as lease rollover risk or the impact on the long term value perof the property upon sale or disposition. Actual incremental unlevered yields may vary from our underwritten incremental unlevered yield range based on the actual total cost to complete a project and its actual incremental NOI at stabilization.
LEASING—Leasing is a key driver of growth for our company.
•Comparable lease—We use this term to refer to a lease with consistent terms that is executed for substantially the same space that has been vacant less than twelve months.
•Comparable rent spread—This metric is calculated as the percentage increase or decrease in first-year ABR (excluding any free rent or escalations) on new or renewal leases (excluding options) where the lease was considered a comparable lease. This metric provides an indication of our ability to generate revenue growth through leasing activity.
•Cost of executing new leases—We use this term to refer to certain costs associated with new leasing, namely, leasing commissions, tenant improvement costs, and tenant concessions.
•Portfolio retention rate—This metric is calculated by dividing (i) the total square feet of retained Neighbors with current period lease expirations by (ii) the total square feet of leases expiring during the period. The portfolio retention rate provides insight into our ability to retain Neighbors at our shopping centers as their leases approach expiration. Generally, the costs to retain an existing Neighbor are lower than costs to replace with a new Neighbor.
| | | | | | | | | | | |
PHILLIPS EDISON & COMPANY DECEMBER 31, 2023 FORM 10-K | | | 29 |
•Recovery rate—This metric is calculated by dividing (i) total recovery income by (ii) total recoverable expenses during the period. A high recovery rate is an indicator of our ability to recover certain property operating expenses and capital costs from our Neighbors.
FINANCIAL PERFORMANCE—In addition to financial metrics calculated in accordance with GAAP, such as net income or cash flows from operations, we utilize non-GAAP metrics to measure our operational and financial performance. See “Non-GAAP Measures” below for further discussion on the following metrics.
•Adjusted Earnings Before Interest, Taxes, Depreciation, and Amortization for Real Estate (“Adjusted EBITDAre”)—To arrive at Adjusted EBITDAre, we adjust EBITDAre, as defined below, to exclude certain recurring and non-recurring items including, but not limited to: (i) changes in the fair value of the earn-out liability; (ii) other impairment charges; (iii) amortization of basis differences in our investments in our unconsolidated joint ventures; (iv) transaction and acquisition expenses; and (v) realized performance income. We use EBITDAre and Adjusted EBITDAre as additional measures of operating performance which allow us to compare earnings independent of capital structure and evaluate debt leverage and fixed cost coverage.
•Core Funds From Operations Attributable to Stockholders and OP Unit Holders (“Core FFO”)—To arrive at Core FFO, we adjust Nareit FFO, as defined below, to exclude certain recurring and non-recurring items including, but not limited to: (i) depreciation and amortization of corporate assets; (ii) changes in the fair value of the earn-out liability; (iii) amortization of unconsolidated joint venture basis differences; (iv) gains or losses on the extinguishment or modification of debt and other; (v) other impairment charges; (vi) transaction and acquisition expenses; and (vii) realized performance income. We believe Nareit FFO provides insight into our operating performance as it excludes certain items that are not indicative of such performance. Core FFO provides further insight into the sustainability of our operating performance and provides an additional measure to compare our performance across reporting periods on a consistent basis by excluding items that may cause short-term fluctuations in net income (loss).
•EBITDAre—The National Association of Real Estate Investment Trusts (“Nareit”) defines EBITDAre as net income (loss) computed in accordance with GAAP before: (i) interest expense; (ii) income tax expense; (iii) depreciation and amortization; (iv) gains or losses from disposition of depreciable property; and (v) impairment write-downs of depreciable property. Adjustments for unconsolidated partnerships and joint ventures are calculated to reflect EBITDAre on the same basis.
•Equity Market Capitalization—We calculate equity market capitalization as the total dollar value of all outstanding shares using the closing price for the applicable date.
•Nareit FFO Attributable to Stockholders and OP Unit Holders (“Nareit FFO”)—Nareit defines Funds From Operations (“FFO”) as net income (loss) computed in accordance with GAAP, excluding: (i) gains (or losses) from sales of property and gains (or losses) from change in control; (ii) depreciation and amortization related to real estate; (iii) impairment losses on real estate and impairments of in-substance real estate investments in investees that are driven by measurable decreases in the fair value of the depreciable real estate held by the unconsolidated partnerships and joint ventures; and (iv) adjustments for unconsolidated partnerships and joint ventures, calculated to reflect FFO on the same basis. We calculate Nareit FFO in a manner consistent with the Nareit definition.
•Net Debt—We calculate net debt as total debt, excluding discounts, market adjustments, and deferred financing expenses, less cash and cash equivalents.
•Net Debt to Adjusted EBITDAre—This ratio is calculated by dividing net debt by Adjusted EBITDAre (included on an annualized basis within the calculation). It provides insight into our leverage rate based on earnings and is not impacted by fluctuations in our equity price.
•Net Debt to Total Enterprise Value—This ratio is calculated by dividing net debt by total enterprise value, as defined below. It provides insight into our capital structure and usage of debt.
•NOI—We calculate NOI as total operating revenues, adjusted to exclude non-cash revenue items, less property operating expenses and real estate taxes. NOI provides insight about our financial and operating performance because it provides a performance measure of the revenues and expenses directly involved in owning and operating real estate assets and provides a perspective not immediately apparent from net income (loss).
•Same-Center—We use this term to refer to a property, or portfolio of properties, that have been owned and operational for the entirety of the last two reporting periods (i.e., since January 1, 2022).
•Total Enterprise Value—We calculate total enterprise value as our net debt plus our equity market capitalization on a fully diluted basis.
We are a REIT and one of the nation’s largest owners and operators of omni-channel grocery-anchored shopping centers. Our portfolio primarily consists of neighborhood centers anchored by the #1 or #2 grocer tenants by sales within their respective formats by trade area. Our Neighbors are a mix of national, regional, and local retailers that primarily provide necessity-based goods and services.
As of December 31, 2023, we owned equity interests in 301 shopping centers, including 281 wholly-owned shopping centers and 20 shopping centers owned through one unconsolidated joint venture, which comprised approximately 34.4 million square feet in 31 states. In addition to managing our shopping centers, our third-party investment management business provides comprehensive real estate management services to our unconsolidated joint ventures and one private fund (collectively, the “Managed Funds”).
| | | | | | | | | | | |
PHILLIPS EDISON & COMPANY DECEMBER 31, 2023 FORM 10-K | | | 30 |
BASIS OF PRESENTATION—The basis of presentation of our shares of common stock is described as follows:
•Reverse Stock Split—On July 2, 2021, our Board approved an amendment to our charter to effect a one-for-three reverse stock split. Concurrent with the reverse split, the Operating Partnership enacted a one-for-three reverse split of its outstanding OP units. Unless otherwise indicated, the information in this Form 10-K gives effect to the reverse stock and OP unit splits (see Note 12).
•Recapitalization—On June 18, 2021, our stockholders approved an amendment to our charter (the “Articles of Amendment”) that effected a change of each share of our common stock outstanding at the time the amendment became effective into one share of $11.00.a newly created class of Class B common stock (the “Recapitalization”). The valuation was based substantiallyArticles of Amendment became effective upon filing with, and acceptance by, the State Department of Assessments and Taxation of Maryland on July 2, 2021. Unless otherwise indicated, all information in this Form 10-K gives effect to the estimated market valueRecapitalization and references to “shares” and per share metrics refer to our common stock and Class B common stock, collectively. Our Class B common stock automatically converted into our publicly traded common stock on January 18, 2022 (see Note 12). Prior to the conversion, we have presented common stock and Class B common stock as separate classes within our consolidated balance sheets and consolidated statements of equity. On May 5, 2022, we filed Articles Supplementary to our charter with the Maryland State Department of Assessments and Taxation in order to reclassify and designate all of the 350 million authorized shares of our portfolio of real estate properties in various geographic locations in the United States (“Portfolio”) and our recently acquired third-party asset management business as of October 5, 2017. On October 4, 2017, we completed a transaction to acquire certain real estate assets, the third-party investment management business, and the captive insurance company of Phillips Edison Limited Partnership (“PELP”) in aClass B common stock, and cash transaction (“PELP transaction”).
We provided the estimated$0.01 par value per share, to assist broker-dealers that participated in our public offering in meeting their customer account statement reporting obligations under National Associationall of Securities Dealers Conduct Rule 2340which were unissued at such time, as required by the Financial Industry Regulatory Authority (“FINRA”). This valuation was performed in accordance with the provisions of Practice Guideline 2013-01, Valuations of Publicly Registered Non-Listed REITs, issued by the Investment Program Association (“IPA”) in April 2013 (“IPA Valuation Guidelines”).
We engaged Duff & Phelps, LLC (“Duff & Phelps”), an independent valuation expert which has expertise in appraising commercial real estate assets to provide a calculation of the range in estimated value per share of our common stock as of October 5, 2017, the date immediately following the PELP transaction. Duff & Phelps prepared a valuation report (“Valuation Report”) that provided this range based substantially on its estimate of the “as is” market values of the Portfolio and the
estimated value of in-place contracts of the third-party asset management business. Duff & Phelps made adjustments to the aggregate estimated value of our Portfolio to reflect pro forma balance sheet assets and liabilities provided by our management as of October 5, 2017, before calculating a range of estimated values based on the number of outstanding shares of our common stock, as of October 5, 2017. These calculations produced an estimated$0.01 par value per share inshare. We no longer have Class B common stock authorized for issue.
AT-THE-MARKET OFFERING (“ATM”)—On February 10, 2022, we and the rangeOperating Partnership entered into a sales agreement relating to the potential sale of $10.34shares of common stock pursuant to $11.70 asa continuous offering program. In accordance with the terms of October 5, 2017. The Independent Directors ultimately approved $11.00 as the estimated value per sharesales agreement, we may offer and sell shares of our common stock on November 8, 2017. We previously establishedhaving an estimated value per shareaggregate offering price of $10.20up to $250 million from time to time through our sales agents, or, if applicable, as of Julyforward sellers. During the three months ended December 31, 2015, which was reaffirmed as of April 14, 2016 and March 31, 2017. We expect to review the estimated value per share as of March 31, 2018, and thereafter, at least annually.
The following table summarizes the material components of the estimated value per share2023, we issued 2.2 million shares of our common stock at a gross weighted average price of $35.92 per share under the ATM program for net proceeds of $77.5 million, after approximately $0.8 million in commissions. During the year ended December 31, 2023, we issued 4.2 million shares of our common stock at a gross weighted average price of $35.76 per share under the ATM program for net proceeds of $147.6 million, after approximately $1.5 million in commissions. During the three months ended December 31, 2022, no shares were issued under the ATM program. During the year ended December 31, 2022, we issued 2.6 million shares of our common stock at a gross weighted average price of $34.23 per share under the ATM program for net proceeds of $89.2 million, after approximately $0.9 million in commissions. As of December 31, 2023, approximately $10.8 million of common stock remained available for issuance under the ATM program.
Subsequent to December 31, 2023, we issued approximately 46,000 additional shares of our common stock at a gross weighted average price of $37.05 per share under the ATM program for net proceeds of $1.7 million, after approximately $17,000 in commissions.
PORTFOLIO AND LEASING STATISTICS—Below are statistical highlights of our wholly-owned portfolio as of October 5, 2017December 31, 2023 and 2022 (dollars and square feet in thousands):
| | | | | | | | | | | |
| 2023 | | 2022 |
| Number of properties | 281 | | | 271 | |
| Number of states | 31 | | | 31 | |
| Total square feet | 32,153 | | | 31,093 | |
| ABR | $ | 470,819 | | | $ | 435,712 | |
| % ABR from omni-channel grocery-anchored shopping centers | 97.2 | % | | 97.2 | % |
| Leased occupancy %: | | | |
| Total portfolio spaces | 97.4 | % | | 97.4 | % |
| Anchor spaces | 98.9 | % | | 99.3 | % |
| Inline spaces | 94.7 | % | | 93.8 | % |
Average remaining lease term (in years)(1) | 4.4 | | | 4.5 | |
(1)The average remaining lease term in years excludes future options to extend the term of the lease.
FINANCIAL HIGHLIGHTS—Owning, operating, and managing well-occupied omni-channel grocery-anchored real estate is a core part of our business strategy, and as of December 31, 2023, 97.2% of our ABR was derived from omni-channel grocery-anchored shopping centers. As of December 31, 2023, total leased occupancy remained high at 97.4% and inline occupancy improved 0.9% to 94.7%, when compared to December 31, 2022. Our financial performance highlights during 2023 are as follows:
•Net income of $63.8 million, an increase of $9.2 million from a year ago, primarily due to strong operating performance attributable to our Same-Center portfolio and the net impact of our 2023 acquisition and disposition activity.
•Core FFO per diluted share improved by $0.07 to $2.34, primarily due to our strong operating performance.
•Same-Center NOI improved 4.2% to $396.6 million.
•Acquired $278.5 million and disposed of $6.3 million of assets, executing our external growth strategy while improving portfolio quality with our dispositions.
| | | | | | | | | | | |
PHILLIPS EDISON & COMPANY DECEMBER 31, 2023 FORM 10-K | | | 31 |
•Declared and paid monthly distributions of $0.0933 per share, or $1.12 annualized, for each month beginning January 2023 through August 2023, and increased monthly distributions to $0.0975 per share, or $1.17 annualized, for the remainder of 2023.
EXECUTING OUR STRATEGY—Our performance for the year is linked to our key initiatives: differentiated and focused strategy, integrated operating platform, and responsible balance sheet management. We believe these initiatives will result in long-term growth and value creation to all of our stakeholders.
Differentiated and Focused Strategy—We actively monitor the commercial real estate sector for shopping centers that meet our investment objectives. Our effective shelf registration statement and ATM program allow us to access equity and debt capital that we intend to use, in part, to grow our portfolio of assets. Highlights of our asset composition and acquisitions are as follows:
•97.2% of our ABR was derived from omni-channel grocery-anchored shopping centers as of December 31, 2023.
•Our grocer health ratio, or occupancy cost, remains strong at 2.3% at December 31, 2023, which is favorable compared to the national grocer average occupancy cost.
•In 2023, our grocer sales increased 6% year-over-year to $681 per square foot. Grocer sales per square foot have increased approximately 30% since 2019.
•70.4% of our ABR was derived from Neighbors providing necessity-based goods and services.
•The average PECO space, excluding anchors, is approximately 2,300 square feet. This size is attractive to many retailers, whereas large box format retailers are fewer and demand is thinner.
•Acquired eleven properties and three outparcels for a net cash outlay of $270.3 million, adding 1.1 million of GLA to our portfolio.
Internal Growth Through Our Integrated Operating Platform—We have focused on improving our occupancy through leasing vacant spaces, increasing lease revenue through rent growth, and executing development and redevelopment opportunities. Highlights of our wholly-owned operational activity as of and for the year ended December 31, 2023 are as follows:
•Leased occupancy for our wholly-owned portfolio remained high at 97.4% as of December 31, 2023, and inline occupancy improved 0.9% to 94.7%, when compared to December 31, 2022.
•Total ABR PSF for executed new leases improved 12.6% to $21.75, and inline ABR PSF for executed new leases improved 6.8% to $25.98 during the year ended December 31, 2023.
•For the year ended December 31, 2023, we completed 13 development and redevelopment projects encompassing a total of 0.2 million square feet with a total investment of $34.1 million.
•As of December 31, 2023, we have nine development and redevelopment projects in process, which we estimate will have a total investment of $33.7 million.
•Created $2.7 million of incremental ABR in 2023 as a result of development and redevelopment projects completed in 2022.
Balance Sheet Management Positioned for External Growth—Our balance sheet has a leverage profile that well-positions us to maintain and improve our investment grade rating, fund distributions to our stockholders, and invest in our targeted acquisitions. As of December 31, 2023,we had $615.4 million of total liquidity, comprised of $8.9 million of cash, cash equivalents, and restricted cash, plus $606.6 million of borrowing capacity available on our $800 million revolving credit facility. Our balance sheet management highlights as of and for the year ended December 31, 2023 are as follows:
•We issued 4.2 million shares of our common stock under the ATM program for net proceeds of $147.6 million.
•We amended three senior unsecured term loans with a total notional amount of $475 million scheduled to mature during 2024. The three senior unsecured term loans, as amended, have a total notional amount of $484.8 million and are scheduled to mature between 2026 (extendable with two one-year options to 2028) and 2027.
•Our current investment grade ratings are Baa3 (Outlook: Stable) with Moody’s Investors Services and BBB- (Outlook: Positive) with S&P Global Ratings.
•As of December 31, 2023, our wholly-owned properties were approximately 84% unencumbered.
•Our ratio of net debt to Adjusted EBITDAre was 5.1x as of December 31, 2023, as compared to 5.3x as of December 31, 2022 (see “Liquidity and Capital Resources - Financial Leverage Ratios” below for a discussion and calculation).
| | | | | | | | | | | |
PHILLIPS EDISON & COMPANY DECEMBER 31, 2023 FORM 10-K | | | 32 |
•As of December 31, 2023, our outstanding debt had a weighted-average maturity of 3.9 years excluding all extension options. As of December 31, 2023, our debt maturity profile with the respective principal payment obligations is as follows (including the impact of derivatives on weighted-average interest rates and excluding all extension options)(1):
(1)As of December 31, 2023, our outstanding debt had a weighted-average maturity of 4.1 years including all extension options. Our related debt maturities at December 31, 2023 including extension options were as follows: 2024 - $28.1 million; 2025 - $277.6 million; 2026 - $241.9 million; 2027 - $704.6 million; 2028 - $179.1 million; 2029 - $0.8 million; 2030 - $200.8 million; and 2031 - $353.4 million.
| | | | | | | | | | | |
PHILLIPS EDISON & COMPANY DECEMBER 31, 2023 FORM 10-K | | | 33 |
LEASING ACTIVITY—Below is a summary of leasing activity for our wholly-owned properties for the years ended December 31, 2023 and 2022(1):
| | | | | | | | | | | | | | | | | | | | | | | | | | |
| | Total Deals | | Inline Deals |
| | 2023 | | 2022 | | 2023 | | 2022 |
| New leases: | | | | | | | | |
| Number of leases | | 348 | | | 390 | | | 334 | | | 375 | |
| Square footage (in thousands) | | 1,077 | | | 1,230 | | | 763 | | | 819 | |
| ABR (in thousands) | | $ | 23,416 | | | $ | 23,750 | | | $ | 19,813 | | | $ | 19,919 | |
| ABR PSF | | $ | 21.75 | | | $ | 19.31 | | | $ | 25.98 | | | $ | 24.33 | |
| Cost PSF of executing new leases | | $ | 33.04 | | | $ | 36.25 | | | $ | 37.22 | | | $ | 39.56 | |
| Number of comparable leases | | 137 | | | 145 | | | 135 | | | 143 | |
| Comparable rent spread | | 25.2 | % | | 32.2 | % | | 24.8 | % | | 26.5 | % |
| Weighted average lease term (in years) | | 8.6 | | | 8.1 | | | 7.2 | | | 7.4 | |
| Renewals and options: | | | | | | | | |
| Number of leases | | 648 | | | 611 | | | 590 | | | 551 | |
| Square footage (in thousands) | | 3,642 | | | 3,554 | | | 1,360 | | | 1,213 | |
| ABR (in thousands) | | $ | 58,529 | | | $ | 49,625 | | | $ | 35,311 | | | $ | 29,172 | |
| ABR PSF | | $ | 16.07 | | | $ | 13.96 | | | $ | 25.96 | | | $ | 24.04 | |
| ABR PSF prior to renewals | | $ | 14.50 | | | $ | 12.77 | | | $ | 22.44 | | | $ | 21.18 | |
| Percentage increase in ABR PSF | | 10.8 | % | | 9.3 | % | | 15.7 | % | | 13.4 | % |
| Cost PSF of executing renewals and options | | $ | 0.52 | | | $ | 1.89 | | | $ | 0.91 | | | $ | 1.10 | |
Number of comparable leases(2) | | 485 | | | 472 | | | 470 | | | 459 | |
Comparable rent spread(2) | | 16.2 | % | | 14.6 | % | | 17.7 | % | | 15.2 | % |
| Weighted average lease term (in years) | | 5.0 | | | 4.9 | | | 4.3 | | | 4.2 | |
| Portfolio retention rate | | 93.9 | % | | 90.7 | % | | 84.9 | % | | 77.5 | % |
(1)PSF amounts may not recalculate exactly based on other amounts presented within the table due to rounding.
(2)Excludes exercise of options.
KNOWN TRENDS AND UNCERTAINTIES—The economy continues to face inflation risk, which may negatively impact some of our Neighbors and increase our operating and construction costs. Substantially all of our leases contain provisions designed to mitigate the adverse effect of inflation, including requirements for Neighbors to pay their allocable share of operating expenses that includes common area maintenance, utilities, real estate taxes, insurance, and certain capital expenditures. Additionally, many of our leases are for terms of less than ten years, which allows us to target increased rents to current market rates upon renewal.
In addition to inflation, macroeconomic and geopolitical risks may create challenges that could negatively impact market conditions in the United States. Additionally, the policies implemented to address these risks, including raising interest rates, could result in adverse impacts on the United States economy, including a slowing of growth or potentially a recession.
| | | | | | | | | | | |
PHILLIPS EDISON & COMPANY DECEMBER 31, 2023 FORM 10-K | | | 34 |
SUMMARY OF OPERATING ACTIVITIES FOR THE YEARS ENDED DECEMBER 31, 2023 AND 2022
| | | | | | | | | | | | | | | | | | | | | | | | | | |
| | | | | | Favorable (Unfavorable) Change |
| (Dollars in thousands) | | 2023 | | 2022 | | $ | | %(1) |
| Revenues: | | | | | | | | |
| Rental income | | $ | 597,501 | | | $ | 560,538 | | | $ | 36,963 | | | 6.6 | % |
| Fees and management income | | 9,646 | | | 11,541 | | | (1,895) | | | (16.4) | % |
| Other property income | | 2,977 | | | 3,293 | | | (316) | | | (9.6) | % |
| Total revenues | | 610,124 | | | 575,372 | | | 34,752 | | | 6.0 | % |
| Operating Expenses: | | | | | | | | |
| Property operating | | 102,303 | | | 95,359 | | | (6,944) | | | (7.3) | % |
| Real estate taxes | | 72,816 | | | 67,864 | | | (4,952) | | | (7.3) | % |
| General and administrative | | 44,366 | | | 45,235 | | | 869 | | | 1.9 | % |
| Depreciation and amortization | | 236,443 | | | 236,224 | | | (219) | | | (0.1) | % |
| Impairment of real estate assets | | — | | | 322 | | | 322 | | | NM |
| Total operating expenses | | 455,928 | | | 445,004 | | | (10,924) | | | (2.5) | % |
| Other: | | | | | | | | |
| Interest expense, net | | (84,232) | | | (71,196) | | | (13,036) | | | (18.3) | % |
| Gain on disposal of property, net | | 1,110 | | | 7,517 | | | (6,407) | | | (85.2) | % |
| Other expense, net | | (7,312) | | | (12,160) | | | 4,848 | | | 39.9 | % |
| Net income | | 63,762 | | | 54,529 | | | 9,233 | | | 16.9 | % |
| Net income attributable to noncontrolling interests | | (6,914) | | | (6,206) | | | (708) | | | (11.4) | % |
| Net income attributable to stockholders | | $ | 56,848 | | | $ | 48,323 | | | $ | 8,525 | | | 17.6 | % |
(1)Line items that result in a percent change that exceed certain limitations are considered not meaningful (“NM”) and indicated as such.
Our basis for analyzing significant fluctuations in our results of operations generally includes review of the results of our same-center portfolio, non-same-center portfolio, and revenues and expenses from our management activities. We define our same-center portfolio as the 262 properties that were owned and operational prior to January 1, 2022. We define our non-same-center portfolio as those properties that were not fully owned and operational in both periods owing primarily to real estate asset activity occurring after December 31, 2021, which includes five properties disposed of and 18 properties acquired. Below are explanations of the significant fluctuations in the results of operations for the years ended December 31, 2023 and 2022:
Rental Income increased $37.0 million as follows:
•$19.3 million increase related to our same-center portfolio primarily as follows:
▪$16.6 million increase primarily due to a $0.41 increase in average minimum rent PSF and a 1.1% improvement in average occupancy; and
▪$7.3 million increase primarily due to an increase in recoverable income attributed to an increase in real estate taxes, common area maintenance spending, and insurance costs as well as a 1.1% improvement in average occupancy; partially offset by
▪$2.2 million decrease primarily due to collections in 2022 of amounts previously reserved; and
▪$1.3 million decrease primarily due to lower lease buyout income.
•$17.7 million increase primarily related to our acquisition activity, net of dispositions.
Fees and Management Income:
•The $1.9 million decrease in fees and management income was primarily due to $0.1 million realized performance income in 2023 compared to $2.7 million in 2022 for the achievement of certain performance targets related to our Necessity Retail Partners (“NRP”) joint venture.
Property Operating Expenses increased $6.9 million primarily as follows:
•$4.3 million increase from our same-center portfolio and corporate operating activities primarily due to increases in recoverable expenses attributable to higher common area maintenance spending, along with higher insurance and compensation costs; and
•$2.6 million increase primarily due to our acquisition activity, net of dispositions.
Real Estate Tax Expenses:
•The $5.0 million increase in real estate tax expenses is primarily due to our acquisition activity, net of dispositions, and less appeal settlement income in 2023 compared to 2022.
| | | | | | | | | | | |
PHILLIPS EDISON & COMPANY DECEMBER 31, 2023 FORM 10-K | | | 35 |
General and Administrative Expenses:
•The $0.9 million decrease in general and administrative expenses is primarily due to a decrease in directors and officers insurance.
Interest Expense, Net:
•The $13.0 million increase during the year ended December 31, 2023 as compared to the same period in 2022 was primarily due to higher interest rates in 2023 partially offset by lower loss on extinguishment or modification of debt. Interest Expense, Net was comprised of the following (dollars in thousands):
| | | | | | | | | | | |
| Year Ended December 31, |
| 2023 | | 2022 |
| Interest on unsecured term loans and senior notes, net | $ | 48,803 | | $ | 40,975 |
| Interest on secured debt | 18,614 | | 20,768 |
| Interest on revolving credit facility, net | 8,785 | | 2,069 |
| Non-cash amortization and other | 7,662 | | 6,359 |
Loss on extinguishment or modification of debt and other, net(1) | 368 | | 1,025 |
| Interest expense, net | $ | 84,232 | | $ | 71,196 |
| | | |
| Weighted-average interest rate as of end of year | 4.2 | % | | 3.6 | % |
| Weighted-average term (in years) as of end of year | 3.9 | | 4.4 |
(1)Includes defeasance fees related to early repayments of debt.
Gain on Disposal of Property, Net:
•The $6.4 million decrease was primarily related to the sale of land acquired by local authorities, as well as the sale of one property and two outparcels with a net gain of $1.1 million during the year ended December 31, 2023, as compared to the sale of four properties and four outparcels with a net gain of $7.5 million during the year ended December 31, 2022 (see Note 4).
Other Expense, Net:
•Other Expense, Net was comprised of the following (in thousands):
| | | | | | | | | | | |
| Year Ended December 31, |
| 2023 | | 2022 |
| Transaction and acquisition expenses | $ | (5,675) | | | $ | (10,551) | |
| Impairment of investment in third parties (see Note 15) | (3,000) | | | — | |
| Federal, state, and local income tax expense | (438) | | | (806) | |
| Equity in net income of unconsolidated investments | 372 | | | 1,280 | |
| Change in fair value of earn-out liability (see Note 16) | — | | | (1,809) | |
| Other | 1,429 | | | (274) | |
| Other expense, net | $ | (7,312) | | | $ | (12,160) | |
SUMMARY OF OPERATING ACTIVITIES FOR THE YEARS ENDED DECEMBER 31, 2022 AND 2021
See “Key Performance Indicators and Defined Terms”above for additional information related to the following non-GAAP measures.
SAME-CENTER NOI—Same-Center NOI is presented as a supplemental measure of our performance, as it highlights operating trends such as occupancy levels, rental rates, and operating costs for our same-center portfolio. Other REITs may use different methodologies for calculating Same-Center NOI, and accordingly, our Same-Center NOI may not be comparable to other REITs. For the years ended December 31, 2023 and 2022, Same-Center NOI represents the NOI for the 262 properties that were wholly-owned and operational for the entire portion of all comparable reporting periods.
| | | | | | | | | | | |
PHILLIPS EDISON & COMPANY DECEMBER 31, 2023 FORM 10-K | | | 36 |
Same-Center NOI should not be viewed as an alternative measure of our financial performance as it does not reflect the operations of our entire portfolio, nor does it reflect the impact of general and administrative expenses, depreciation and amortization, interest expense, other income (expense), or the level of capital expenditures and leasing costs necessary to maintain the operating performance of our properties that could materially impact our results from operations.
The table below compares Same-Center NOI for the years ended December 31, 2023 and 2022 (dollars in thousands):
| | | | | | | | | | | | | | | | | | | | | | | | | | |
| | | | Favorable (Unfavorable) |
| | 2023 | | 2022 | | $ Change | | % Change |
| Revenues: | | | | | | | | |
Rental income(1) | | $ | 415,152 | | | $ | 398,507 | | | $ | 16,645 | | | |
| Tenant recovery income | | 134,860 | | | 127,776 | | | 7,084 | | | |
Reserves for uncollectibility(2) | | (3,409) | | | (1,918) | | | (1,491) | | | |
| Other property income | | 2,717 | | | 2,967 | | | (250) | | | |
| Total revenues | | 549,320 | | | 527,332 | | | 21,988 | | | 4.2 | % |
| Operating expenses: | | | | | | | | |
| Property operating expenses | | 83,669 | | | 80,683 | | | (2,986) | | | |
| Real estate taxes | | 69,035 | | | 66,184 | | | (2,851) | | | |
| Total operating expenses | | 152,704 | | | 146,867 | | | (5,837) | | | (4.0) | % |
| Total Same-Center NOI | | $ | 396,616 | | | $ | 380,465 | | | $ | 16,151 | | | 4.2 | % |
(1)Excludes straight-line rental income, net amortization of above- and below-market leases, and lease buyout income.
(2)Includes billings that will not be recognized as revenue until cash is collected or the Neighbor resumes regular payments and/or we deem it appropriate to resume recording revenue on an accrual basis, rather than on a cash basis.
Same-Center NOI Reconciliation—Below is a reconciliation of Net Income to NOI and Same-Center NOI for the years ended December 31, 2023 and 2022 (in thousands):
| | | | | | | | | | | |
| 2023 | | 2022 |
| Net income | $ | 63,762 | | | $ | 54,529 | |
| Adjusted to exclude: | | | |
| Fees and management income | (9,646) | | | (11,541) | |
Straight-line rental income(1) | (10,185) | | | (12,265) | |
| Net amortization of above- and below-market leases | (5,178) | | | (4,324) | |
| Lease buyout income | (1,222) | | | (2,414) | |
| General and administrative expenses | 44,366 | | | 45,235 | |
| Depreciation and amortization | 236,443 | | | 236,224 | |
| Impairment of real estate assets | — | | | 322 | |
| Interest expense, net | 84,232 | | | 71,196 | |
| Gain on disposal of property, net | (1,110) | | | (7,517) | |
| Other expense, net | 7,312 | | | 12,160 | |
| Property operating expenses related to fees and management income | 2,059 | | | 3,046 | |
| NOI for real estate investments | 410,833 | | | 384,651 | |
Less: Non-same-center NOI(2) | (14,217) | | | (4,186) | |
| Total Same-Center NOI | $ | 396,616 | | | $ | 380,465 | |
(1)Includes straight-line rent adjustments for Neighbors for whom revenue is being recorded on a cash basis.
(2)Includes operating revenues and expenses from non-same-center properties which includes properties acquired or sold and corporate activities.
NAREIT FFO AND CORE FFO—Nareit FFO is a non-GAAP financial performance measure that is widely recognized as a measure of REIT operating performance. Core FFO is an additional financial performance measure used by us as Nareit FFO includes certain non-comparable items that affect our performance over time. We believe that Core FFO is helpful in assisting management and investors with assessing the sustainability of our operating performance in future periods.
| | | | | | | | | | | |
PHILLIPS EDISON & COMPANY DECEMBER 31, 2023 FORM 10-K | | | 37 |
Nareit FFO and Core FFO should not be considered alternatives to net income (loss) under GAAP, as an indication of our liquidity, nor as an indication of funds available to cover our cash needs, including our ability to fund distributions. Core FFO may not be a useful measure of the impact of long-term operating performance on value if we do not continue to operate our business plan in the manner currently contemplated.
Accordingly, Nareit FFO and Core FFO should be reviewed in connection with other GAAP measurements, and should not be viewed as more prominent measures of performance than net income (loss) or cash flows from operations prepared in accordance with GAAP. Our Nareit FFO and Core FFO, as presented, may not be comparable to amounts calculated by other REITs.
The following table presents our calculation of Nareit FFO and Core FFO for the years ended December 31, 2023, 2022, and 2021 (in thousands, except per share amounts):
| | | | | | | | | | | | | | | | | |
| | 2023 | | 2022 | | 2021 |
| Calculation of Nareit FFO Attributable to Stockholders and OP Unit Holders | | | | | |
| Net income | $ | 63,762 | | | $ | 54,529 | | | $ | 17,233 | |
| Adjustments: | | | | | |
| Depreciation and amortization of real estate assets | 234,260 | | | 232,571 | | | 217,564 | |
| Impairment of real estate assets | — | | | 322 | | | 6,754 | |
| Gain on disposal of property, net | (1,110) | | | (7,517) | | | (30,421) | |
| Adjustments related to unconsolidated joint ventures | 2,636 | | | 842 | | | 72 | |
| Nareit FFO attributable to stockholders and OP unit holders | $ | 299,548 | | | $ | 280,747 | | | $ | 211,202 | |
| Calculation of Core FFO Attributable to Stockholders and OP Unit Holders | | | | | |
| Nareit FFO attributable to stockholders and OP unit holders | $ | 299,548 | | | $ | 280,747 | | | $ | 211,202 | |
| Adjustments: | | | | | |
| Depreciation and amortization of corporate assets | 2,183 | | | 3,653 | | | 3,869 | |
| Change in fair value of earn-out liability | — | | | 1,809 | | | 30,436 | |
| Impairment of investment in third parties | 3,000 | | | — | | | — | |
| Transaction and acquisition expenses | 5,675 | | | 10,551 | | | 5,363 | |
| Loss on extinguishment or modification of debt and other, net | 368 | | | 1,025 | | | 3,592 | |
| Amortization of unconsolidated joint venture basis differences | 17 | | | 220 | | | 1,167 | |
Realized performance income(1) | (75) | | | (2,742) | | | (675) | |
| Core FFO attributable to stockholders and OP unit holders | $ | 310,716 | | | $ | 295,263 | | | $ | 254,954 | |
| | | | | |
| Nareit FFO/Core FFO Attributable to Stockholders and OP Unit Holders per diluted share | | | | | |
| Weighted-average shares of common stock outstanding - diluted | 132,970 | | | 130,332 | | | 116,672 | |
| Nareit FFO attributable to stockholders and OP unit holders per share - diluted | $ | 2.25 | | | $ | 2.15 | | | $ | 1.81 | |
| Core FFO attributable to stockholders and OP unit holders per share - diluted | $ | 2.34 | | | $ | 2.27 | | | $ | 2.19 | |
(1)Realized performance income includes fees received related to the achievement of certain performance targets in our NRP joint venture.
|
| | | | | | | |
| | Low | | High |
| Investment in Real Estate Assets: | | | |
| Phillips Edison real estate valuation | $ | 3,972,120 |
| | $ | 4,284,420 |
|
| Management company | 90,202 |
| | 90,202 |
|
| Total market value | 4,062,322 |
| | 4,374,622 |
|
| | | | |
| Other Assets: | | | |
| Cash and cash equivalents | 13,068 |
| | 13,068 |
|
| Restricted cash | 16,480 |
| | 16,480 |
|
| Accounts receivable | 45,360 |
| | 45,360 |
|
| Prepaid expenses and other assets | 26,701 |
| | 26,701 |
|
| Total other assets | 101,609 |
| | 101,609 |
|
| | | | |
| Liabilities: | | | |
| Notes payable and credit facility | 1,776,636 |
| | 1,776,636 |
|
| Mark to market of debt | 9,014 |
| | 9,014 |
|
| Accounts payable and accrued expenses | 1,866 |
| | 1,866 |
|
| Security deposits | 7,740 |
| | 7,740 |
|
| Total liabilities | 1,795,256 |
| | 1,795,256 |
|
| | | | |
| Net Asset Value | $ | 2,368,675 |
| | $ | 2,680,975 |
|
| | | | |
| Common stock and OP units outstanding | 229,077 |
| | 229,077 |
|
| | | | |
| Net Asset Value Per Share | $ | 10.34 |
| | $ | 11.70 |
|
Our goal isEBITDAre and ADJUSTED EBITDAre—We use EBITDAre and Adjusted EBITDAre as additional measures of operating performance which allow us to provide an estimatecompare earnings independent of the market valuecapital structure, determine debt service and fixed cost coverage, and measure enterprise value. Additionally, we believe they are a useful indicator of our shares. However, the majorityability to support our debt obligations.
EBITDAre and Adjusted EBITDAre should not be considered as alternatives to net income (loss), as an indication of our assets will consistliquidity, nor as an indication of commercial real estatefunds available to cover our cash needs, including our ability to fund distributions. Accordingly, EBITDAre and Adjusted EBITDAre should be reviewed in connection with other GAAP measurements, and should not be viewed as more prominent measures of performance than net income (loss) or cash flows from operations prepared in accordance with any valuation methodology, the methodologies used were based upon a number of assumptionsGAAP. Our EBITDAre and estimates thatAdjusted EBITDAre, as presented, may not have been accurate or complete. Different parties with different assumptionsbe comparable to amounts calculated by other REITs.
| | | | | | | | | | | |
PHILLIPS EDISON & COMPANY DECEMBER 31, 2023 FORM 10-K | | | 38 |
The following table presents our calculation of EBITDAre and estimates could have derivedAdjusted EBITDAre for the years ended December 31, 2023, 2022, and 2021 (in thousands):
| | | | | | | | | | | | | | | | | |
| | 2023 | | 2022 | | 2021 |
Calculation of EBITDAre | | | | | |
| Net income | $ | 63,762 | | | $ | 54,529 | | | $ | 17,233 | |
| Adjustments: | | | | | |
| Depreciation and amortization | 236,443 | | | 236,224 | | | 221,433 | |
| Interest expense, net | 84,232 | | | 71,196 | | | 76,371 | |
| Gain on disposal of property, net | (1,110) | | | (7,517) | | | (30,421) | |
| Impairment of real estate assets | — | | | 322 | | | 6,754 | |
| Federal, state, and local tax expense | 438 | | | 806 | | | 327 | |
| Adjustments related to unconsolidated joint ventures | 3,721 | | | 1,987 | | | 1,431 | |
EBITDAre | $ | 387,486 | | | $ | 357,547 | | | $ | 293,128 | |
Calculation of Adjusted EBITDAre | | | | | |
EBITDAre | $ | 387,486 | | | $ | 357,547 | | | $ | 293,128 | |
| Adjustments: | | | | | |
| Impairment of investment in third parties | 3,000 | | | — | | | — | |
| Change in fair value of earn-out liability | — | | | 1,809 | | | 30,436 | |
| Transaction and acquisition expenses | 5,675 | | | 10,551 | | | 5,363 | |
| Amortization of unconsolidated joint venture basis differences | 17 | | | 220 | | | 1,167 | |
Realized performance income(1) | (75) | | | (2,742) | | | (675) | |
Adjusted EBITDAre | $ | 396,103 | | | $ | 367,385 | | | $ | 329,419 | |
(1)Realized performance income includes fees received related to the achievement of certain performance targets in our NRP joint venture.
| | |
| LIQUIDITY AND CAPITAL RESOURCES |
GENERAL—Aside from standard operating expenses, we expect our principal cash demands to be for:
•investments in real estate;
•cash distributions to stockholders;
•redevelopment and repositioning projects;
•capital expenditures and leasing costs; and
•principal and interest payments on our outstanding indebtedness.
We expect our primary sources of liquidity to be:
•operating cash flows;
•borrowings from our unsecured revolving credit facility and proceeds from debt financings;
•proceeds from any ATM offering activities;
•proceeds received from the disposition of properties; and
•available, unrestricted cash and cash equivalents.
At this time, we believe our current sources of liquidity are sufficient to meet our short- and long-term cash demands.
IMPACT OF THE UNDERWRITTEN IPO—On July 19, 2021, we closed our underwritten IPO, through which we issued 19.6 million shares, including the underwriters’ overallotment election, of a different estimatednew class of common stock, $0.01 par value per share, and those differences could have been significant. These limitations are discussed further under “Limitations of Estimated Value per Share” below.
Valuation Methodologies—Our goal in calculatingat an estimated value per share was to arrive at a value that was reasonable and based off of what we deemed to be appropriate valuation and appraisal methodologies and assumptions and a process that was in accordance with the IPA Valuation Guidelines. The following is a summary of the valuation methodologies and components used to calculate the estimated value per share.
Independent Valuation Firm—Duff & Phelps was retained by us on September 25, 2017, as authorized by the Conflicts Committee of the Board of Directors, to provide independent valuation services. The Conflicts Committee was composed of all of our Independent Directors. Duff & Phelps is a leading global valuation advisor with expertise in complex valuation work that is not affiliated with us. Duff & Phelps had previously provided services to us pertaining the allocation of acquisition purchase prices for financial reporting purposes in connection with the Portfolio for which it received usual and customary compensation. Duff & Phelps may be engaged to provide professional services to us in the future. The Duff & Phelps personnel who prepared the valuation had no present or prospective interest in the Portfolio and no personal interest with us.
Duff & Phelps’ engagement for its valuation services was not contingent upon developing or reporting predetermined results.
In addition, Duff & Phelps’ compensation for completing the valuation services was not contingent upon the development or reporting of a predetermined value or direction in value that favors the cause of us, the amount of the value opinion, the attainment of a stipulated result, or the occurrence of a subsequent event directly relatedinitial price to the intended usepublic of its Valuation Report. We agreed to indemnify Duff & Phelps against certain liabilities arising out of this engagement.
Duff & Phelps’ analyses, opinions, or conclusions were developed, and the Valuation Report was prepared, in conformity with
the Uniform Standards of Professional Appraisal Practice. The Valuation Report was reviewed, approved and signed by individuals with the professional designation of MAI (“Member of the Appraisal Institute”). The use of the Valuation Report is subject to the requirements of the Appraisal Institute relating to review by its duly authorized representatives. Duff & Phelps did not inspect the properties that formed the Portfolio.
In preparing the Valuation Report, Duff & Phelps relied on information provided by us regarding the Portfolio. For example, we provided information regarding building size, year of construction, land size and other physical, financial, and economic characteristics. We also provided lease information, such as current rent amounts, rent commencement and expiration dates, and rent increase amounts and dates.
Duff & Phelps did not investigate the legal description or legal matters relating to the Portfolio, including title or encumbrances, and title to the properties was assumed to be good and marketable. The Portfolio was also assumed to be free and clear of liens, easements, encroachments and other encumbrances, and to be in full compliance with zoning, use, occupancy, environmental and similar laws unless otherwise stated by us. The Valuation Report contains other assumptions, qualifications and limitations that qualify the analysis, opinions and conclusions set forth therein. Furthermore, the prices at which our real estate properties may actually be sold could differ from their appraised values.
The foregoing is$28.00 per share. As a summary of the standard assumptions, qualifications and limitations that generally apply to the Valuation Report.
Real Estate Portfolio Valuation—Duff & Phelps estimated the “as is” market values of the Portfolio as of October 5, 2017, using various methodologies. Generally accepted valuation practice suggests assets may be valued using a range of methodologies. Duff & Phelps utilized the income capitalization approach with support from the sales comparison approach for each property. The income approach was the primary indicator of value, with secondary consideration given to the sales approach. Duff & Phelps performed a study of each market to measure current market conditions, supply and demand factors, growth patterns, and their effect on each of the subject properties.
The income capitalization approach simulates the reasoning of an investor who views the cash flows that would result from the anticipated revenue and expense on a property throughout its lifetime. Under the income capitalization approach, Duff & Phelps used an estimated net operating income (“NOI”) for each property, and then converted it to a value indication using a discounted cash flow analysis. The discounted cash flow analysis focuses on the operating cash flows expected from a property and the anticipated proceeds of a hypothetical sale at the end of an assumed holding period, with these amounts then being discounted to their present value. The discounted cash flow method is appropriate for the analysis of investment properties with multiple leases, particularly leases with cancellation clauses or renewal options, and especially in volatile markets.
The sales comparison approach estimates value based on what other purchasers and sellers in the market have agreed to as a price for comparable improved properties. This approach is based upon the principle of substitution, which states that the limits of prices, rents and rates tend to be set by the prevailing prices, rents and rates of equally desirable substitutes. Duff & Phelps gathered comparable sales data throughout various markets as secondary support for its valuation estimate.
The following summarizes the range of capitalization rates that were used to arrive at the estimated market values of our Portfolio: |
| |
| Range in Values |
Overall Capitalization Rate | 6.23 - 6.72% |
Terminal Capitalization Rate | 6.96 - 7.46% |
Discount Rate | 7.55 - 8.05% |
Management Company Valuation—Duff & Phelps estimated the aggregate market value associated with our third-party asset management business using various methodologies. Duff & Phelps considered various applications of the income approach, market approach, and underlying assets approach, with the income approach determined to be the most reliable method for purposes of the analysis. The income approach analysis considered the projected fee income earned for services provided pursuant to various management and advisory agreements over the expected duration of that contract, assuming normal and customary renewal provisions. Such services include property management services performed for the properties in the Portfolio, as well as property and asset management services for certain unaffiliated real estate investment portfolios. In performing this analysis, solely fee income related to properties owned as of October 5, 2017 was considered. The income approach also considered a reasonable level of expenses to support such activities, as well as other adjustments, and a discount rate that accounted for the time value of money and the risk of achieving the projected cash flows. The result of the income approach analysis wasunderwritten IPO, we received gross proceeds of $547.4 million. The underwritten IPO allowed us access to forms of capital not previously available to us, as follows:
•In October 2021, the Operating Partnership completed the registered offering of $350 million aggregate market valueprincipal amount of 2.625% senior notes (“2021 Bond Offering”) priced at 98.692% of the third-party asset management business,principal amount and maturing in November 2031. The 2021 Bond Offering resulted in gross proceeds of $345.4 million. The notes are fully and unconditionally guaranteed by us.
•In February 2022, we filed an automatically effective shelf registration statement on Form S-3 providing for the public offering and sale, from which an estimated market valuetime to time, by us of net tangible assets (liabilities) was subtracted (added), to result inour preferred stock, common stock, debt securities, depository shares, warrants, rights, units, and guarantees of debt securities and by the aggregate intangible value of the management company.
Sensitivity Analysis—While we believe that Duff & Phelps’ assumptions and inputs were reasonable, a change in these assumptions would have impacted the calculations of the estimated value of the Portfolio, the estimated valueOperating Partnership of its recently acquired third-party asset management business, and our estimated value per share. The table below illustrates the impact on Duff & Phelps’ rangedebt securities, in estimated value per share if the terminal capitalization rates or discount rates were adjusted by 25 basis points and assumes all other factors remain unchanged. Additionally, the table illustrates the impact of a 5% changeeach case in these rates in accordance with the IPA Valuation Guidelines. The table illustrates hypothetical results if only one change in assumptions was made, with all other factors held constant. Further, each of these assumptions could change by more than 25 basis points or 5%.unlimited amounts.
|
| | | | | | | |
| Resulting Range in Estimated Value Per Share |
| Increase of 25 basis points ($) | | Decrease of 25 basis points ($) | | Increase of 5% ($) | | Decrease of 5% ($) |
Terminal Capitalization Rate | 10.03 - 11.33 | | 10.67 - 12.10 | | 9.91 - 11.22 | | 10.82 - 12.23 |
Discount Rate | 10.01 - 11.34 | | 10.66 - 12.05 | | 9.83 - 11.18 | | 10.84 - 12.22 |
Other Assets and Other Liabilities—Duff & Phelps made adjustments to the aggregate estimated values of our investments to reflect our other assets and other liabilities based on pro forma balance sheet information provided by us and the Advisor as of October 5, 2017.
Role of the Independent Directors—The Independent Directors received a copy of the Valuation Report and discussed the report with representatives of Duff & Phelps. The Independent Directors also discussed the Valuation Report, the Portfolio, the third-party asset management business, our other assets and liabilities and other matters with management. Management recommended to the Independent Directors that $11.00 per share be approved as the estimated value per share of our common stock. The Independent Directors discussed the rationale for this value with management.
Following the Independent Directors’ receipt and review of the Valuation Report, the recommendation of management, and in light of other factors considered by the Independent Directors, the Independent Directors concluded that the range in estimated value per share of $10.34 and $11.70 was appropriate. Management then recommended to our Independent Directors that it select $11.00 as the estimated value per share of our common stock. Our Independent Directors agreed to accept the recommendation of management and approved $11.00 as the estimated value per share of our common stock as of October 5, 2017, which determination was ultimately and solely the responsibility of the Independent Directors.
Limitations of Estimated Value per Share—We provided this estimated value per share to assist broker-dealers that participated in our public offering in meeting our customer account statement reporting obligations. This valuation was performed in accordance with the provisions of the IPA Valuation Guidelines. As with any valuation methodology, the methodologies used were based upon a number of estimates and assumptions that may not have been accurate or complete. Different parties with different assumptions and estimates could have derived a different estimated value per share, and this difference could have been significant. The estimated value per share is not audited and does not represent a determination of the fair value of our assets or liabilities based on U.S. generally accepted accounting principles (“GAAP”), nor does it represent a liquidation value of our assets and liabilities or the amount at which our shares of common stock would trade on a national securities exchange.
Accordingly, with respect to the estimated value per share, we can give no assurance that:
a stockholder would be able to resell his or her shares at the estimated value per share;
a stockholder would ultimately realize distributions per share equal to our estimated value per share upon liquidation of our assets and settlement of our liabilities or a sale of us;
our shares of common stock would trade at the estimated value per share on a national securities exchange;
a third party would offer the estimated value per share in an arm’s-length transaction to purchase all or substantially all of our shares of common stock;
another independent third-party appraiser or third-party valuation firm would agree•In connection with our estimated value per share; or
February 2022 Form S-3 filing, we commenced the methodologies used to calculate our estimated value per share would be acceptable to FINRA or for compliance with ERISA reporting requirements.
We did not make any adjustments to the valuation for the impact of other transactions occurring subsequent to October 5, 2017, including, but not limited to, (1) the issuance of common stock under the distribution reinvestment plan, (2) net operating income earnedATM program through which we may offer and dividends declared, (3) the repurchase of shares, (4) asset acquisitions, and (5) changes in leases, tenancy or other business or operational changes. The value of our shares will fluctuate over time in response to developments related to individual assets in the Portfolio, the management of those assets and changes in the real estate and finance markets. Because of, among other factors, the high concentration of our total assets in real estate and the number ofsell shares of our common stock outstanding, changes inhaving an aggregate offering price of up to $250 million. During the value of individual assets in the Portfolio or changes in valuation assumptions could have a very significant impact on the value of our shares. The estimated value per share does not reflect a portfolio premium or the fact thatthree months ended December 31, 2023, we are internally-managed. The estimated value per share also does not take into account any disposition costs or fees for real estate properties, debt prepayment penalties that could apply upon the prepayment of certain of our debt obligations or the impact of restrictions on the assumption of debt.
Amended and Restated Dividend Reinvestment Plan
We have adopted the dividend reinvestment program (“DRIP”), through which stockholders may elect to reinvest an amount equal to the dividends declared on their shares of common stock intoissued 2.2 million shares of our common stock in lieu of receiving cash dividends. In accordance with the DRIP, participants in the DRIP acquire shares of common stock at a gross weighted average
| | | | | | | | | | | |
PHILLIPS EDISON & COMPANY DECEMBER 31, 2023 FORM 10-K | | | 39 |
price equal toof $35.92 per share under the estimated value per share. ParticipantsATM program for net proceeds of $77.5 million, after approximately $0.8 million in the DRIP may purchase fractional shares so that 100% of the dividends may be used to acquire additional shares of our common stock. Forcommissions. During the year ended December 31, 2017, 4.82023, we issued 4.2 million shares of our common stock at a gross weighted average price of $35.76 per share under the ATM program for net proceeds of $147.6 million, after approximately $1.5 million in commissions. During the three months ended December 31, 2022, no shares were issued throughunder the DRIP, resulting in proceeds of approximately $49.1 million. ForATM program. During the year ended December 31, 2016, 5.82022, we issued 2.6 million shares were issued throughof our common stock at a gross weighted average price of $34.23 per share under the DRIP, resulting inATM program for net proceeds of $89.2 million, after approximately $58.9$0.9 million in commissions. As of December 31, 2023, approximately $10.8 million of common stock remained available for issuance under the ATM program.
DEBT—The following table summarizes information about our debt as of December 31, 2023 and 2022 (dollars in thousands):
| | | | | | | | | | | |
| | 2023 | | 2022 |
| Total debt obligations, gross | $ | 1,986,735 | | | $ | 1,912,784 | |
| Weighted-average interest rate | 4.2 | % | | 3.6 | % |
| Weighted-average term (in years) | 3.9 | | | 4.4 | |
| | | |
Revolving credit facility capacity(1) | $ | 800,000 | | | $ | 800,000 | |
Revolving credit facility availability(2) | 606,550 | | | 709,385 | |
(1)The revolving credit facility matures in January 2026, extendable at our option to January 2027. In addition, the revolving credit facility also includes an accordion feature that permits us to increase our aggregate borrowing capacity thereunder to up to $1 billion, subject to the satisfaction of certain conditions.
(2)Net of any outstanding balance and letters of credit.
Debt Activity—During the years ended December 31, 2023 and 2022, we took steps to appropriately ladder our debt maturities and increase debt amounts available to us for future investment activity. Our debt activity during the year ended December 31, 2023 was as follows:
•On July 31, 2023, we amended three senior unsecured term loans with a total notional amount of $475 million scheduled to mature during 2024. The three senior unsecured term loans, as amended, have a total notional amount of $484.8 million. The $161.8 million unsecured term loan is priced based on a leverage grid, which is currently at the Secured Overnight Financing Rate (“SOFR”) plus 1.35% and is scheduled to mature on January 31, 2026 extendable with two one-year options to 2028. The $158 million and $165 million unsecured term loans are priced based on a leverage grid, which is currently at SOFR plus 1.35% and mature on January 31, 2027.
•During the year ended December 31, 2023, we repaid $47.3 million in mortgage debt.
Our debt activity during the year ended December 31, 2022 was as follows:
•In May 2022, we amended our credit facility agreement to, among other things, increase the total amount available under our unsecured revolving credit facility from $500 million to $800 million. The unsecured revolving credit facility also includes an accordion feature that permits us to increase our aggregate borrowing capacity thereunder to up to $1 billion, subject to the satisfaction of certain conditions. The unsecured revolving credit facility is scheduled to mature in January 2026, extendable at our option to January 2027.
•During 2022, we repaid $80.1 million in mortgage debt.
Future Debt Obligations—As of December 31, 2023, including the impact of our swap agreements, our future contractual debt obligations were $115.7 million of debt principal and interest payments during 2024, and $2.2 billion of debt principal and interest payments thereafter (see Note 8). The average annual maturities of our outstanding debt over the next four years as of December 31, 2023 was approximately $313 million including all extension options and approximately $354 million excluding all extension options.
Debt Obligation Guarantees—The 2.625% senior notes issued by the Operating Partnership pursuant to an effective registration statement in October 2021 were, and debt securities of the Operating Partnership registered under our automatically effective shelf registration statement on Form S-3 filed in February 2022 will be, fully and unconditionally guaranteed by us. At December 31, 2023, the Operating Partnership had issued and outstanding its 2.625% senior notes. The obligations of the Operating Partnership to pay principal, premiums, if any, and interest on the 2.625% senior notes are fully and unconditionally guaranteed by us on a senior basis. As a result of the amendments to SEC Rule 3-10 of Regulation S-X, subsidiary issuers of obligations guaranteed by the parent are not required to provide separate financial statements, provided that: (i) the subsidiary obligor is consolidated into the parent company’s consolidated financial statements; (ii) the parent guarantee is “full and unconditional”; and (iii) subject to certain exceptions as set forth below, the alternative disclosure required by Rule 13-01 of Regulation S-X is provided, which includes narrative disclosure and summarized financial information. We meet the conditions of this requirement and thus, are not presenting separate financial statements. Furthermore, as permitted under Rule 13-01(a)(4)(vi) of Regulation S-X, we have excluded the summarized financial information for the Operating Partnership because the assets, liabilities, and results of operations of the Operating Partnership are not materially different than the corresponding in our consolidated financial statements, and management believes such summarized financial information would be repetitive and would not provide incremental value to investors.
Covenants—Credit agreements for our unsecured revolving credit facility and unsecured term loans contain customary financial covenants, including a leverage ratio of 60% or less, with a surge to 65% or less following a material acquisition, and require the fixed-charge ratio to be 1.5:1 or greater. Our unsecured senior notes due 2031 are also subject to customary financial covenants, including a leverage ratio of 65% or less, and require the fixed-charge ratio to be 150% or greater. As of December 31, 2023, we were in compliance with the restrictive covenants of our outstanding debt obligations and we expect to continue to meet the requirements of these covenants over the next twelve months.
| | | | | | | | | | | |
PHILLIPS EDISON & COMPANY DECEMBER 31, 2023 FORM 10-K | | | 40 |
OTHER CONTRACTUAL COMMITMENTS AND CONTINGENCIES AND OFF BALANCE SHEET ARRANGEMENTS—We enter into leases as a lessee as part of our real estate operations in the form of ground leases of land for certain properties, and as part of our corporate operations in the form of office space and office equipment leases. Currently, neither our operating leases nor our finance leases have residual value guarantees or other restrictions or covenants. We expect to fund these obligations through existing financing or cash flows from operations. As of December 31, 2023, our future contractual obligations as a lessee included operating lease obligations of $0.7 million during 2024, and $7.3 million thereafter. As of December 31, 2023, our future contractual finance lease obligations included $0.3 million during 2024.
We have an off-balance sheet arrangement that includes being the limited guarantor of a $175 million mortgage loan secured by Grocery Retail Partners I LLC (“GRP I”) properties. Our guaranty for the GRP I debt is limited to being the non-recourse carveout guarantor and the environmental indemnitor. Further, we are also party to an agreement with our institutional joint venture partner in which any potential liability under such guarantee will be apportioned between us and our joint venture partner based on our respective ownership percentage in the joint venture. As of December 31, 2023, GRP I had an outstanding debt balance of $174.0 million.
DistributionsAdditionally, our off-balance sheet arrangements include the notional amount of our interest rate swaps which we use to hedge a portion of our exposure to interest rate fluctuations. Currently, all of our interest rate swaps fix the variable rate interest on our term loan debt. We intend to fund our interest rate swap payments utilizing cash flows from operations. As of December 31, 2023, the notional amount of our interest rate swaps was $0.7 billion. As of December 31, 2023, our future interest rate swap recoverables are $15.8 million during 2024 and $11.3 million thereafter.
FINANCIAL LEVERAGE RATIOS—We believe our net debt to Adjusted EBITDAre, net debt to total enterprise value, and debt covenant compliance as of December 31, 2023 allow us access to future borrowings as needed in the near term. The following table presents our calculation of net debt and total enterprise value, inclusive of our prorated portion of net debt and cash and cash equivalents owned through our unconsolidated joint ventures, as of December 31, 2023 and 2022 (in thousands):
| | | | | | | | | | | |
| 2023 | | 2022 |
| Net debt: | | | |
| Total debt, excluding discounts, market adjustments, and deferred financing expenses | $ | 2,011,093 | | | $ | 1,937,142 | |
| Less: Cash and cash equivalents | 5,074 | | | 5,740 | |
| Total net debt | $ | 2,006,019 | | | $ | 1,931,402 | |
| | | |
| Enterprise value: | | | |
| Net debt | $ | 2,006,019 | | | $ | 1,931,402 | |
Total equity market capitalization(1)(2) | 4,955,480 | | | 4,178,204 | |
| Total enterprise value | $ | 6,961,499 | | | $ | 6,109,606 | |
(1)Total equity market capitalization is calculated as diluted shares multiplied by the closing market price per share, which includes 135.8 million and 131.2 million diluted shares as of December 31, 2023 and 2022, respectively, and the closing market price per share of $36.48 and $31.84 as of December 31, 2023 and 2022, respectively.
(2)Fully diluted shares include common stock and OP units.
The following table presents our calculation of net debt to Adjusted EBITDAre and net debt to total enterprise value as of December 31, 2023 and 2022 (dollars in thousands):
| | | | | | | | | | | |
| 2023 | | 2022 |
Net debt to Adjusted EBITDAre - annualized: | | | |
| Net debt | $ | 2,006,019 | | $ | 1,931,402 |
Adjusted EBITDAre - annualized(1) | 396,103 | | 367,385 |
Net debt to Adjusted EBITDAre - annualized | 5.1x | | 5.3x |
| | | |
| Net debt to total enterprise value: | | | |
| Net debt | $ | 2,006,019 | | $ | 1,931,402 |
| Total enterprise value | 6,961,499 | | 6,109,606 |
| Net debt to total enterprise value | 28.8% | | 31.6% |
(1)Adjusted EBITDAre is based on a trailing twelve month period. See “Non-GAAP Measures - EBITDAre and Adjusted EBITDAre” abovefor a reconciliation to Net Income.
CAPITAL EXPENDITURES AND REDEVELOPMENT ACTIVITY—We make capital expenditures during the course of normal operations, including maintenance capital expenditures and tenant improvements, as well as value-enhancing anchor space repositioning and redevelopment, ground-up outparcel development, and other accretive projects.
During the years ended December 31, 2023 and 2022, we had gross capital spend of $95.3 million and $104.5 million, respectively. Below is a summary of our capital spending activity, excluding leasing commissions, on a cash basis for the years ended December 31, 2023 and 2022 (in thousands):
| | | | | | | | | | | |
PHILLIPS EDISON & COMPANY DECEMBER 31, 2023 FORM 10-K | | | 41 |
| | | | | | | | | | | |
| 2023 | | 2022 |
| Capital expenditures for real estate: | | | |
| Capital improvements | $ | 22,766 | | | $ | 17,828 | |
| Tenant improvements | 26,663 | | | 24,194 | |
| Redevelopment and development | 38,206 | | | 53,671 | |
| Total capital expenditures for real estate | 87,635 | | | 95,693 | |
| Corporate asset capital expenditures | 963 | | | 3,292 | |
Capitalized indirect costs(1) | 4,103 | | | 3,430 | |
Total capital spending activity(2) | $ | 92,701 | | | $ | 102,415 | |
(1)Amount includes internal salaries and related benefits of personnel who work directly on capital projects as well as capitalized interest expense.
(2)Amounts reported are net of insurance proceeds of $2.6 million and $2.1 million for property damage claims for the years ended December 31, 2023 and 2022, respectively.
We expect our capital expenditures to reach $100 million - $110 million in 2024, which includes $40 million - $50 million related to development and redevelopment projects. We anticipate that obligations related to capital improvements, as well as redevelopment and development, in 2024 can be met with cash flows from operations, cash flows from dispositions, or borrowings on our unsecured revolving credit facility.
Generally, we expect our development and redevelopment projects to stabilize within 24 months. Our underwritten incremental unlevered yields on development and redevelopment projects are expected to average between 9%-12%. Our current in process projects represent an estimated total investment of $33.7 million. Actual incremental unlevered yields may vary from our underwritten incremental unlevered yield range based on the actual total cost to complete a project and its actual incremental annual NOI at stabilization. See “Key Performance Indicators and Defined Terms” above for further information.
REAL ESTATE ACQUISITION ACTIVITY—We actively monitor the commercial real estate market for properties that have future growth potential, are located in attractive demographic markets, and support our business objectives. We are currently targeting acquisitions of $200 million - $300 million annually. The following table highlights our property acquisitions during the years ended December 31, 2023 and 2022 (dollars in thousands):
| | | | | | | | | | | |
| 2023 | | 2022 |
| Number of properties acquired | 11 | | | 7 | |
Number of outparcels acquired(1) | 3 | | | 4 | |
| Contract price | $ | 278,480 | | | $ | 280,515 | |
Total price of acquisitions(2) | 270,262 | | | 282,000 | |
(1)Outparcels acquired are adjacent to shopping centers that we own.
(2)Total price of acquisitions includes closing costs less credits and assumed debt obligations.
REAL ESTATE DISPOSITION ACTIVITY—We continually evaluate our portfolio of assets for opportunities to make strategic dispositions of assets that no longer meet our growth and investment objectives or assets that have stabilized in order to capture their value. The following table highlights our property dispositions during the years ended December 31, 2023 and 2022 (dollars in thousands):
| | | | | | | | | | | | | | |
| | 2023 | | 2022 |
| Number of properties sold | | 1 | | | 4 | |
| Number of outparcels sold | | 2 | | | 4 | |
| Contract price | | $ | 6,250 | | | $ | 53,987 | |
Proceeds from sale of real estate, net(1)(2) | | 7,208 | | | 52,019 | |
Gain on disposal of property, net(2) | | 1,110 | | | 7,517 | |
(1)Total proceeds from sale of real estate, net includes closing costs less credits.
(2)Activity for the year ended December 31, 2023 includes land acquired from us by local authorities.
DISTRIBUTIONS—We elected to be taxed as a REIT for federal income tax purposes commencing with our taxable year ended December 31, 2010. As a REIT, we have made, and intend to continue to make, distributions each taxable year equal to at least 90% of our taxable income (excluding capital gains and computingcomputed without regard to the dividends paid deduction). One of our primary goals is to pay regular
In 2023, we declared and paid monthly distributions to our stockholders. During the years ended December 31, 2017 and 2016, our Board of Directors (“Board”) authorized distributions equal to a daily amount of $0.00183562 and
$0.00183060, respectively,$0.0933 per share, or $1.12 annualized, for each month beginning January 2023 through August 2023. On September 1, 2023, the Board authorized a 4.5% increase of common stock outstanding based on daily record dates. Beginning January 1, 2018, we pay distributions to stockholders based on monthly record dates. The 2018our monthly distribution rate is currentlyto $0.0975 per common share. We declared and paid monthly distributions of $0.0975 per share, or $1.17 annualized, for each month beginning September 2023 through December 2023.
| | | | | | | | | | | |
PHILLIPS EDISON & COMPANY DECEMBER 31, 2023 FORM 10-K | | | 42 |
The December 2023 and January 2024 distributions of $0.0975 per share were paid on January 2, 2024 and February 1, 2024, respectively. OP unit holders will receive distributions at the same annual distribution rate as 2017.
The total gross distributions declared to stockholders for the years ended December 31, 2017 and 2016, were as follows (in thousands): |
| | | | | | | |
| | 2017 | | 2016 |
| Distributions declared | $ | 123,363 |
| | $ | 123,141 |
|
All distributions declared during the years ended December 31, 2017 and 2016, have been funded by a combination of cash generated through operations and borrowings.
Distributions declared to common stockholders, subsequent to December 31, 2017, were as follows (in thousands): |
| | | | | | | | | | | | | | | | | |
Month(1) | Date of Record | Distribution Rate | Date Distributions Paid | | Gross Amount of Distributions Paid | | Distributions Reinvested through the DRIP | | Net Cash Distributions |
| December | 12/1/2017 - 12/31/2017 | $ | 0.00183562 |
| 1/2/2018 | | $ | 10,544 |
| | $ | 4,354 |
| | $ | 6,190 |
|
| January | 1/16/2018 | 0.05583344 |
| 2/1/2018 | | 10,363 |
| | 4,228 |
| | 6,135 |
|
| February | 2/15/2018 | 0.05583344 |
| 3/1/2018 | | 10,381 |
| | 4,186 |
| | 6,195 |
|
| |
(1)
| The distribution for March, payable to shareholders of record as of March 15, 2018, will be paid on April 2, 2018. |
Unregistered Sales of Equity Securities
During 2017, we did not sell any equity securities that were not registered under the Securities Act.
Share Repurchases
Our Share Repurchase Program (“SRP”) may provide a limited opportunity for stockholders to have shares of common stock repurchased, subject to certain restrictions and limitations that are discussed below:
During any calendar year, we may repurchase no more than 5% of the weighted-average number of shares outstanding during the prior calendar year.
We have no obligation to repurchase shares if the repurchase would violate the restrictions on distributions under Maryland law, which prohibits distributions that would cause a corporation to fail to meet statutory tests of solvency.
The cash available for repurchases on any particular date will generally be limited to the proceeds from the DRIP during the preceding four fiscal quarters, less any cash already used for repurchases since the beginning of the same period; however, subject to the limitations described above, we may use other sources of cash at the discretion of the Board. The limitations described above do not apply to shares repurchased due to a stockholder’s death, “qualifying disability,” or “determination of incompetence.”
Only those stockholders who purchased their shares from us or received their shares from us (directly or indirectly) through one or more non-cash transactions may be able to participate in the SRP. In other words, once our shares are transferred for value by a stockholder, the transferee and all subsequent holders of the shares are not eligible to participate in the SRP.
The Board reserves the right, in its sole discretion, at any time and from time to time, to reject any request for repurchase.
The repurchase price per share for all stockholders is equal to the estimated value per share. Repurchases of shares of common stock will be made monthly upon written notice received by us at least five days prior to the end of the applicable month, assuming no limitations, as noted above, exist. Stockholders may withdraw their repurchase request at any time up to five business days prior to the repurchase date. Unfulfilled repurchase requests are treated as requests for repurchase during future months until satisfied or withdrawn.
Our Board may amend, suspend, or terminate the program upon 30 days’ notice. We may provide notice by including such information (a) in a current report on Form 8-K or in our annual or quarterly reports, all publicly filed with the SEC, or (b) in a separate mailing to the stockholders. In connection with the May 2017 announcement of the PELP transaction (see Note 3), the SRP was suspended in May 2017 and resumed in June 2017.
The following table presents all share repurchases for the years ended December 31, 2017 and 2016 (in thousands, except per share amounts): |
| | | | | | | | |
| | | 2017 | | 2016 |
| Shares repurchased | | 4,617 |
| | 2,019 |
|
| Cost of repurchases | | $ | 47,157 |
| | $ | 20,301 |
|
| Average repurchase price | | $ | 10.21 |
| | $ | 10.05 |
|
During the quarter ended December 31, 2017, we repurchased shares as follows (shares in thousands): |
| | | | | | | | | | | | |
| Period | | Total Number of Shares Redeemed | | Average Price Paid per Share (1) | | Total Number of Shares Purchased as Part of a Publicly Announced Plan or Program(2) | | Approximate Dollar Value of Shares Available That May Yet Be Redeemed Under the Program |
| October 2017 | | 68 |
| | $ | 10.20 |
| | 68 |
| | (3) |
| November 2017 | | 22 |
| | 10.98 |
| | 22 |
| | (3) |
| December 2017 | | 56 |
| | 11.00 |
| | 56 |
| | (3) |
| |
(1)
| On November 8, 2017, our Board increased the estimated value per share of our common stock to $11.00 based substantially on the estimated market value of our portfolio of real estate properties and our recently acquired third-party investment management business as of October 5, 2017, the first full business day after the closing of the PELP transaction. Prior to November 8, 2017, the estimated value per share was $10.20 (see Note 13). The repurchase price per share for all stockholders is equal to the estimated value per share on the date of the repurchase.
|
| |
(2)
| We announced the commencement of the SRP on August 12, 2010, and it was subsequently amended on September 29, 2011, and on April 14, 2016. |
| |
(3)
| We currently limit the dollar value and number of shares that may yet be repurchased under the SRP as described above. |
In 2017 and 2016, repurchase requests surpassed the funding limits under the SRP. Due to the program’s funding limits, no funds were available for repurchases during the fourth quarter of 2017 and no funds will be available for the the first quarter of 2018. Additionally, repurchases during the remainder of 2018 are expected to be limited. When we are unable to fulfill all repurchase requests in any month, we will honor requests on a pro rata basis to the extent possible. As of December 31, 2017, we had 10.8 million shares of unfulfilled repurchase requests. We will continue to fulfill repurchases sought upon a stockholder’s death, “qualifying disability,” or “determination of incompetence” in accordance with the terms of the SRP.
ITEM 6. SELECTED FINANCIAL DATA |
| | | | | | | | | | | | | | | | | | | | | |
| As of and for the years ended December 31, |
| (in thousands, except per share amounts) | 2017(1) |
| 2016 |
| 2015 |
| 2014 |
| 2013 |
Balance Sheet Data:(2) | |
| |
| |
| |
|
|
| Investment in real estate assets at cost | $ | 3,751,927 |
| | $ | 2,584,005 |
| | $ | 2,350,033 |
| | $ | 2,201,235 |
| | $ | 1,136,074 |
|
| Cash and cash equivalents | 5,716 |
|
| 8,224 |
|
| 40,680 |
|
| 15,649 |
|
| 460,250 |
|
| Total assets | 3,526,082 |
| | 2,380,188 |
| | 2,226,248 |
| | 2,141,196 |
| | 1,716,256 |
|
| Debt obligations, net | 1,806,998 |
|
| 1,056,156 |
|
| 845,515 |
|
| 640,889 |
|
| 195,601 |
|
| Operating Data: | |
| |
| |
| |
|
|
| Total revenues | $ | 311,543 |
|
| $ | 257,730 |
|
| $ | 242,099 |
|
| $ | 188,215 |
|
| $ | 73,165 |
|
| Property operating expenses | (53,824 | ) |
| (41,890 | ) |
| (38,399 | ) |
| (32,919 | ) |
| (11,896 | ) |
| Real estate tax expenses | (43,456 | ) |
| (36,627 | ) |
| (35,285 | ) |
| (25,262 | ) |
| (9,658 | ) |
| General and administrative expenses | (36,348 | ) |
| (31,804 | ) |
| (15,829 | ) |
| (8,632 | ) |
| (4,346 | ) |
| Interest expense, net | (45,661 | ) |
| (32,458 | ) |
| (32,390 | ) |
| (20,360 | ) |
| (10,511 | ) |
| Net (loss) income | (41,718 | ) | | 9,043 |
| | 13,561 |
|
| (22,635 | ) | | (12,350 | ) |
| Net (loss) income attributable to stockholders | (38,391 | ) | | 8,932 |
| | 13,360 |
|
| (22,635 | ) | | (12,404 | ) |
Other Operational Data:(3)(4) | | | | | | | | | |
| Owned Real Estate NOI | $ | 204,519 |
| | $ | 173,910 |
| | $ | 163,017 |
| | $ | 125,816 |
| | $ | 50,152 |
|
Funds from operations (“FFO”) attributable to stock- holders and convertible noncontrolling interests | 84,150 |
| | 110,406 |
| | 115,040 |
| | 56,513 |
| | 12,769 |
|
| Modified funds from operations (“MFFO”) | 125,183 |
| | 107,862 |
| | 114,344 |
| | 94,552 |
| | 28,982 |
|
| Cash Flow Data: | |
| |
| |
| |
|
|
| Cash flows provided by operating activities | $ | 108,861 |
|
| $ | 103,076 |
|
| $ | 106,073 |
|
| $ | 75,671 |
|
| $ | 18,540 |
|
| Cash flows used in investing activities | (620,749 | ) |
| (226,217 | ) |
| (110,774 | ) |
| (715,772 | ) |
| (776,219 | ) |
| Cash flows provided by financing activities | 509,380 |
|
| 90,685 |
|
| 29,732 |
|
| 195,500 |
|
| 1,210,275 |
|
| Per Share Data: | |
| |
| |
| |
|
|
| Net (loss) income per share—basic and diluted | $ | (0.21 | ) |
| $ | 0.05 |
|
| $ | 0.07 |
|
| $ | (0.13 | ) |
| $ | (0.18 | ) |
| Common stock distributions declared | $ | 0.67 |
|
| $ | 0.67 |
|
| $ | 0.67 |
|
| $ | 0.67 |
|
| $ | 0.67 |
|
| Weighted-average shares outstanding—basic | 183,784 |
|
| 183,876 |
|
| 183,678 |
|
| 179,280 |
|
| 70,227 |
|
| Weighted-average shares outstanding—diluted | 183,784 |
| | 186,665 |
| | 186,394 |
| | 179,280 |
| | 70,227 |
|
| |
(1)
| Includes the impact of the PELP transaction (see Note 3).
|
| |
(2)
| Certain prior period balance sheet amounts have been restated to conform with our adoption in 2016 of Accounting Standards Update (“ASU”) 2015-03, Simplifying the Presentation of Debt Issuance Costs.
|
| |
(3)
| See Item 7. Management's Discussion and Analysis of Financial Condition and Results of Operations - Non-GAAP Measures, for further discussion and for a reconciliation of the non-GAAP financial measures to Net (Loss) Income. |
| |
(4)
| Certain prior period amounts have been restated to conform with current year presentation. |
The selected financial data should be read in conjunction with the consolidated financial statements and notes appearing in this Annual Report on Form 10-K.
ITEM 7. MANAGEMENT’S DISCUSSION AND ANALYSIS OF FINANCIAL CONDITION AND RESULTS OF OPERATIONS
The following discussion and analysis should be read in conjunction with our accompanying consolidated financial statements and notes thereto. See also “Cautionary Note Regarding Forward-Looking Statements” preceding Part I.
Overview
We were formed as a Maryland corporation in 2009, and elected to be taxed as a real estate investment trust (“REIT”) commencing with the taxable year ended December 31, 2010. We are one of the nation’s largest owners and operators of market-leading, grocery-anchored shopping centers. The majority of our revenues are lease revenues derived from our owned real estate investments. Additionally, we operate a third-party investment management business providing property management and advisory services to $2.0 billion of assets under management. This business provides comprehensive real estate and asset management services to certain non-traded, publicly registered REITS and private funds (“Managed Funds”).
Below are statistical highlights of our portfolio: |
| | | | | |
| | Total Portfolio as of December 31, 2017 | | Property Acquisitions During the Year Ended December 31, 2017(1) |
Number of properties(2) | 236 |
| | 84 |
|
| Number of states | 32 |
| | 25 |
|
| Total square feet (in thousands) | 26,272 |
| | 9,595 |
|
| Leased % of rentable square feet | 93.9 | % | | 89.6 | % |
Average remaining lease term (in years)(3) | 5.0 |
| | 4.6 |
|
| |
(1)
| Property acquisitions include the 76 properties acquired as part of the PELP transaction. |
| |
(2)
| The number of properties does not include additional real estate purchased adjacent to previously acquired centers. |
| |
(3)
| The average remaining lease term in years excludes future options to extend the term of the lease. |
Market Outlook—Real Estate and Real Estate Finance Markets
Management reviews a number of economic forecasts and market commentaries in order to evaluate general economic conditions and to formulate a view of the current environment’s effect on the real estate markets in which we operate.
According to the Bureau of Economic Analysis, the U.S. economy’s real gross domestic product (“GDP”) increased 2.3% in 2017 compared to 1.5% in 2016, according to preliminary estimates. The increase in real GDP in 2017 reflected positive contributions from personal consumption expenditures (“PCE”), nonresidential fixed investment, and exports. These upturns were partially offset by decelerations in residential fixed investment and in state and local government spending. Imports, which are a subtraction in the calculation of GDP, increased.
According to J.P. Morgan’s Global Economic Outlook Summary and 2018 REIT Outlook, real GDP is expected to grow approximately 2.5% in 2018.The U.S. retail real estate market displayed positive but decelerating fundamentals in 2017, with vacancy rates rising and increased emphasis on redevelopment pipelines.
Overall, retail real estate fundamentals remain strong but are expected to decelerate relative to previous years. Short-term interest rates are expected to increase in 2018 more than long-term interest rates. There is less occupancy to be gained in portfolios, new supply levels are below historical averages, and job growth is expected to be 1% monthly in 2018. Reductions to the corporate tax rate will add to economic growth, although commercial real estate is expected to benefit to a lesser extent than other sectors. Tax reform passed by Congress in 2017 is expected to have a minimal to slightly negative impact on REITs, although retailers should benefit from increased consumer spending. Stronger retailers should be better for shopping center owners as tenants can invest more to grow and improve their credit quality, reducing turnover.
Critical Accounting Policies and Estimates
Below is a discussion of our critical accounting policies and estimates. Our accounting policies have been established to conform with GAAP. We consider these policies critical because they involve significant management judgments and assumptions, require estimates about matters that are inherently uncertain, and are important for understanding and evaluating our reported financial results. These judgments affect the reported amounts of assets and liabilities and our disclosure of contingent assets and liabilities at the dates of the consolidated financial statements, as well as the reported amounts of revenue and expenses during the reporting periods. With different estimates or assumptions, materially different amounts could be reported in our consolidated financial statements. Additionally, other companies may utilize different estimates that may impact the comparability of our results of operations to those of companies in similar businesses.
Real Estate Acquisition Accounting—In January 2017, the Financial Accounting Standards Board (“FASB”) issued ASU 2017-01, Business Combinations (Topic 805): Clarifying the Definition of a Business. This update amended existing guidance in order to clarify when an integrated set of assets and activities is considered a business. We adopted ASU 2017-01 on January 1, 2017, and applied it prospectively. Under this new guidance, most of our real estate acquisition activity is no longer considered a business combination and instead is classified as an asset acquisition. As a result, most acquisition-related costs that would have been recorded on our consolidated statements of operations prior to adoption have been capitalized and will be amortized over the life of the related assets. However, the PELP transaction is considered a business combination, and
therefore the associated transaction expenses were expensed as incurred. The treatment of acquisition-related costs and the recognition of goodwill are the primary differences between how we account for business combinations and asset acquisitions. Regardless of whether an acquisition is considered a business combination or an asset acquisition, we record the costs of the business or assets acquired as tangible and intangible assets and liabilities based upon their estimated fair values as of the acquisition date.
We assess the acquisition-date fair values of all tangible assets, identifiable intangibles, and assumed liabilities using methods similar to those used by independent appraisers (e.g., discounted cash flow analysis and replacement cost) and that utilize appropriate discount and/or capitalization rates and available market information. Estimates of future cash flows are based on a number of factors including historical operating results, known and anticipated trends, and market and economic conditions. The fair value of tangible assets of an acquired property considers the value of the property as if it were vacant.
We generally determine the value of construction in progress based upon the replacement cost. However, for certain acquired properties that are part of a new development, we determine fair value by using the same valuation approach as for all other properties and deducting the estimated cost to complete the development. During the remaining construction period, we capitalize interest expense until the development has reached substantial completion. Construction in progress, including capitalized interest, is not depreciated until the development has reached substantial completion.
We record above-market and below-market lease values for acquired properties based on the present value (using an discount rate that reflects the risks associated with the leases acquired) of the difference between (i) the contractual amounts to be paid pursuant to the in-place leases and (ii) management’s estimate of market lease rates for the corresponding in-place leases, measured over a period equal to the remaining non-cancelable term of the lease. We amortize any recorded above-market or below-market lease values as a reduction or increase, respectively, to rental income over the remaining non-cancelable terms of the respective lease. We also include fixed-rate renewal options in our calculation of the fair value of below-market leases and the periods over which such leases are amortized. If a tenant has a unilateral option to renew a below-market lease, we include such an option in the calculation of the fair value of such lease and the period over which the lease is amortized if we determine that the tenant has a financial incentive and wherewithal to exercise such option.
Intangible assets also include the value of in-place leases, which represents the estimated value of the net cash flows of the in-place leases to be realized, as compared to the net cash flows that would have occurred had the property been vacant at the time of acquisition and subject to lease-up. Acquired in-place lease value is amortized to depreciation and amortization expense over the average remaining non-cancelable terms of the respective in-place leases.
We estimate the value of tenant origination and absorption costs by considering the estimated carrying costs during hypothetical expected lease-up periods, considering current market conditions. In estimating carrying costs, management includes real estate taxes, insurance and other operating expenses, and estimates of lost rentals at market rates during the expected lease-up periods.
Estimates of the fair values of the tangible assets, identifiable intangibles, and assumed liabilities require us to estimate market lease rates, property operating expenses, carrying costs during lease-up periods, discount rates, market absorption periods, and the number of years the property will be held for investment. The use of inappropriate estimates would result in an incorrect valuation of our acquired tangible assets, identifiable intangibles and assumed liabilities, which would impact the amount of our net income.
We calculate the fair value of assumed long-term debt by discounting the remaining contractual cash flows on each instrument at the current market rate for those borrowings, which we approximate based on the rate at which we would expect to incur a replacement instrument on the date of acquisition, and recognize any fair value adjustments related to long-term debt as effective yield adjustments over the remaining term of the instrument.
Impairment of Real Estate, Goodwill, and Intangible Assets—We monitor events and changes in circumstances that could indicate that the carrying amounts of our real estate or intangible assets may be impaired. When indicators of potential impairment suggest that the carrying value of real estate or intangible assets may be greater than fair value, we will assess the recoverability, considering recent operating results, expected net operating cash flow, and plans for future operations. If, based on this analysis of undiscounted cash flows, we do not believe that we will be able to recover the carrying value of the real estate and related intangible assets, we would record an impairment loss to the extent that the carrying value exceeds the estimated fair value of the real estate or intangible assets as defined by ASC 360, Property, Plant, and Equipment. Particular examples of events and changes in circumstances that could indicate potential impairments are significant decreases in occupancy, rental income, operating income, and market values, or changes in our property or asset management agreements.
We adopted ASU 2017-04, Intangibles - Goodwill and Other (Topic 350): Simplifying the Test for Goodwill Impairment, prospectively on January 1, 2018. Therefore, when we perform a quantitative test of goodwill for impairment we will compare the carrying value of net assets to the fair value of the reporting unit. If the fair value of the reporting unit exceeds its carrying amount, we would not consider goodwill to be impaired and no further analysis would be required. If the fair value is determined to be less than its carrying value, the amount of goodwill impairment would be the amount by which the reporting unit’s carrying value exceeds its fair value, not to exceed the carrying amount of goodwill.
Estimates of fair value used in our evaluation of real estate, goodwill, and intangible assets are based upon discounted future cash flow projections, relevant competitor multiples, or other acceptable valuation techniques. These techniques are based, in turn, upon all available evidence including level three inputs, such as revenue and expense growth rates, estimates of future cash flows, capitalization rates, discount rates, general economic conditions and trends, or other available market data. Our ability to accurately predict future operating results and cash flows and to estimate and determine fair values impacts the timing and recognition of impairments. While we believe our assumptions are reasonable, changes in these assumptions may have a material impact on our financial results.
Revenue Recognition—We recognize minimum rent, including rental abatements and contractual fixed increases attributable to operating leases, on a straight-line basis over the terms of the related leases, and we include amounts expected to be received in later years in deferred rents receivable. Our policy for percentage rental income is to defer recognition of contingent rental income until the specified target (i.e., breakpoint) that triggers the contingent rental income is achieved.
We record property operating expense reimbursements due from tenants for common area maintenance, real estate taxes, and other recoverable costs in the period the related expenses are incurred. We make certain assumptions and judgments in estimating the reimbursements at the end of each reporting period. We do not expect the actual results to differ materially from the estimated reimbursement.
We make estimates of the collectability of our tenant receivables related to base rents, expense reimbursements, and other revenue or income. We specifically analyze accounts receivable and historical bad debts, customer creditworthiness, current economic trends, and changes in customer payment terms when evaluating the adequacy of the allowance for doubtful accounts. In addition, with respect to tenants in bankruptcy, we will make estimates of the expected recovery of pre-petition and post-petition claims in assessing the estimated collectability of the related receivable. In some cases, the ultimate resolution of these claims can exceed one year. These estimates have a direct impact on our net income because a higher bad debt reserve results in less net income.
We record lease termination income if there is a signed termination letter agreement, all of the conditions of the agreement have been met, collectability is reasonably assured, and the tenant is no longer occupying the property. Upon early lease termination, we provide for losses related to unrecovered intangibles and other assets.
We recognize gains on sales of real estate pursuant to the provisions of ASC 605-976, Accounting for Sales of Real Estate. The specific timing of a sale will be measured against various criteria in ASC 605-976 related to the terms of the transaction and any continuing involvement associated with the property. If the criteria for profit recognition under the full-accrual method are not met, we will defer gain recognition and account for the continued operations of the property by applying the percentage-of-completion, reduced profit, deposit, installment, or cost recovery methods, as appropriate, until the appropriate criteria are met.
Revenues from management, leasing, and other fees charged in accordance with the various management agreements executed, are recognized in the period in which the services have been provided, the earnings process is complete, and collectability is reasonably assured.
On January 1, 2018, we adopted ASU 2014-09, Revenue from Contracts with Customers (Topic 606). Our revenue-producing contracts are primarily leases that are not within the scope of this standard. As a result, we do not expect the adoption of this standard to have a material impact on our rental revenue. However, the standard will apply to a majority of our fees and management income. We have evaluated the impact of this standard to fees and management income and do not expect a material impact on our revenue recognition, but we do expect to provide additional disclosures around fees and management revenue in our future filings. We are adopting this guidance on a modified retrospective basis.
Impact of Recently Issued Accounting Pronouncements—Refer to Note 2 for discussion of the impact of recently issued accounting pronouncements.
Results of Operations
Included in the PELP transaction was the acquisition of PELP’s third-party investment management business. Prior to the completion of the transaction, we were externally-managed, and our only reportable segment was related to the aggregated operating results of our owned real estate. Therefore, there is no data available prior to 2017 for the Investment Management segment for comparative purposes. For more detail regarding our segments, see Note 18.
Segment Profit, which is a non-GAAP financial measure, represents revenues less property operating, real estate tax, and general and administrative expenses that are attributable to our reportable segments. We use Segment Profit to evaluate the results of our segments and believe that this measure provides a useful comparison of our revenues based on the source of those revenues and the expenses that are directly related to them. However, Segment Profit should not be viewed as an alternative to results prepared in accordance with GAAP.
Summary of Operating Activities for the Years Ended December 31, 2017 and 2016 |
| | | | | | | | | | | | | | | |
| | | | | | | Favorable (Unfavorable) Change |
| (in thousands, except per share amounts) | | 2017 | | 2016 | | $ | | % |
| Segment Profit: | | | | | | | | |
| Owned Real Estate | | $ | 206,432 |
| | $ | 175,802 |
| | $ | 30,630 |
| | 17.4 | % |
| Investment Management | | 1,553 |
| | — |
| | 1,553 |
| | NM |
|
| Total segment profit | | 207,985 |
|
| 175,802 |
| | 32,183 |
| | 18.3 | % |
| Corporate general and administrative expenses | | (30,070 | ) | | (28,393 | ) | | (1,677 | ) | | (5.9 | )% |
| Vesting of Class B units | | (24,037 | ) | | — |
| | (24,037 | ) | | NM |
|
| Termination of affiliate arrangements | | (5,454 | ) | | — |
| | (5,454 | ) | | NM |
|
| Depreciation and amortization | | (130,671 | ) | | (106,095 | ) | | (24,576 | ) | | (23.2 | )% |
| Interest expense, net | | (45,661 | ) | | (32,458 | ) | | (13,203 | ) | | (40.7 | )% |
| Transaction and acquisition expenses | | (16,243 | ) | | (5,803 | ) | | (10,440 | ) | | (179.9 | )% |
| Other income, net | | 2,433 |
| | 5,990 |
| | (3,557 | ) | | (59.4 | )% |
| Net (loss) income | | (41,718 | ) |
| 9,043 |
| | (50,761 | ) | | NM |
|
| Net loss (income) attributable to noncontrolling interests | | 3,327 |
| | (111 | ) | | 3,438 |
| | NM |
|
| Net (loss) income attributable to stockholders | | $ | (38,391 | ) | | $ | 8,932 |
| | $ | (47,323 | ) | | NM |
|
Owned Real Estate - Segment Profit |
| | | | | | | | | | | | | | | |
| | | | | | | Favorable (Unfavorable) Change |
| (in thousands, except per share amounts) | | 2017 | | 2016 | | $ | | % |
| Total revenues | | $ | 303,410 |
| | $ | 257,730 |
| | $ | 45,680 |
| | 17.7 | % |
| Property operating expenses | | (50,328 | ) | | (41,890 | ) | | (8,438 | ) | | (20.1 | )% |
| Real estate tax expenses | | (43,247 | ) | | (36,627 | ) | | (6,620 | ) | | (18.1 | )% |
| General and administrative expenses | | (3,403 | ) | | (3,411 | ) | | 8 |
| | 0.2 | % |
| Segment profit | | $ | 206,432 |
|
| $ | 175,802 |
| | $ | 30,630 |
| | 17.4 | % |
Total revenues increased as follows:
| |
– | $21.1 million was related to the 76 properties acquired in the PELP transaction.
|
| |
– | $21.4 million was related to 15 properties acquired after December 31, 2015, exclusive of the PELP transaction, net of two properties disposed of during each reporting period.
|
| |
– | The remaining $3.2 million increase was related to the properties acquired before January 1, 2016, outside of the PELP transaction (“same-center portfolio”). The increase was driven by a $0.23 increase in minimum rent per square foot and a 0.9% increase in occupancy.
|
Property operating expenses, which include (i) operating and maintenance expense, which consists of property-related costs including repairs and maintenance costs, landscaping, snow removal, utilities, property insurance costs, security, and various other property-related expenses; (ii) bad debt expense; and (iii) allocated property management costs prior to the PELP transaction, increased as follows:
| |
– | $4.5 million was the impact of the PELP transaction, including additional costs related to the 76 properties acquired and the effect of internalizing our management structure. |
| |
– | $3.7 million was related to properties acquired or disposed of after December 31, 2015, excluding properties acquired in the PELP transaction. |
| |
– | Property operating costs increased by $0.3 million on our same-center portfolio. |
Real estate tax expenses increased as follows:
| |
– | $2.2 million was related to the 76 properties acquired in the PELP transaction. |
| |
– | $4.2 million was related to properties acquired or disposed of after December 31, 2015, excluding properties acquired in the PELP transaction. |
General and administrative expenses were primarily attributed to costs to manage the administrative activities and implement the investment strategies of our Owned Real Estate.
Investment Management - Segment Profit |
| | | | |
| (in thousands, except per share amounts) | | 2017 |
| Total revenues | | $ | 8,133 |
|
| Property operating expenses | | (3,496 | ) |
| Corporate real estate tax expenses | | (209 | ) |
| General and administrative expenses | | (2,875 | ) |
| Segment profit | | $ | 1,553 |
|
Total revenues were primarily compromised of the following:
| |
– | $4.0 million was attributed to advisory agreements, including acquisition, disposition, and asset management fees, between us and the Managed Funds. |
| |
– | $3.8 million was attributed to property management agreements, including property management fees, leasing commissions, and construction management fees, between us and the Managed Funds. |
| |
– | For additional detail regarding our fees and management income, see Note 14.
|
The $3.5 million in property operating expenses was primarily related to employee compensation costs to manage the daily property operations of the Managed Funds, as well as insurance costs related to our captive insurance company.
General and administrative expenses were primarily attributed to employee compensation costs for managing the day-to-day affairs of the Managed Funds, identifying and making acquisitions and investments on their behalf, and recommending to the respective boards of directors an approach for providing investors of the Managed Funds with liquidity.
Corporate General and Administrative Expenses
The $1.7 million increase in corporate general and administrative expenses was related to additional expenses that were not directly attributable to the revenues generated by either of our segments, including adding personnel costs and other corporate expenses in the PELP transaction, offset by the elimination of the asset management fee.
Vesting of Class B Units
The $24.0 million expense resulted from the PELP transaction and was a combination of the vesting of 2.8 million Class B units as well as the reclassification of previous distributions on those Class B units to noncontrolling interests. The vesting of the Class B units was a noncash expense of $27.6 million for asset management services rendered between December 2014 and September 2017. Distributions paid on these units totaled $3.6 million over this time period and have been reclassified from the 2017 consolidated statement of operations and reflected as distributions from equity instead.
Termination of Affiliate Arrangements
The $5.5 million expense was related to the redemption of unvested Class B units at the estimated value per share on the date of termination, that had been earned by our former advisor for historical asset management services (see Note 11).
Depreciation and Amortization
The $24.6 million increase in depreciation and amortization included a $16.1 million increase related to the 76 properties and the management contracts acquired in the PELP transaction.
The increase included a $12.1 million increase related to properties acquired after December 31, 2015, excluding properties acquired in the PELP transaction, as well as properties classified as redevelopment.
The increase was offset by a $1.7 million decrease due to the disposition of two properties in December 2016 and October 2017.
The increase was also offset by a $1.8 million decrease attributed to certain intangible lease assets becoming fully amortized on our same-center portfolio.
Interest Expense, Net
The $13.2 million increase in interest expense was primarily due to additional borrowings on our revolving credit facility and new secured and unsecured term loan facilities entered into in 2017, including $485 million in loans that were entered into in order to extinguish the corporate debt assumed from PELP in the PELP transaction.
The increase was partially offset by a decrease in interest expense from refinancing certain mortgages and improving the associated interest rate.
Transaction and Acquisition Expenses
The transaction expenses incurred resulted from costs related to the PELP transaction (see Note 3), primarily third-party professional fees, such as financial advisor, consulting, accounting, legal, and tax fees, as well as fees associated with obtaining debt consents necessary to complete the transaction.
The transaction expenses incurred were partially offset by a decrease in acquisition expenses directly related to asset acquisitions that was attributed to the implementation of ASU 2017-01 on January 1, 2017, resulting in the capitalization of most acquisition-related costs. For a more detailed discussion of this adoption, see Note 2.
Other Income, Net
The $3.6 million decrease in other income was primarily due to a 2016 gain on real estate sold exceeding 2017 gains on sales of properties and land. It also decreased due to a 2016 gain related to hedging ineffectiveness that is no longer realized due to our adoption of ASU 2017-12 (see Note 8).
Summary of Operating Activities for the Years Ended December 31, 2016 and 2015 |
| | | | | | | | | | | | | | |
| | | | | | Favorable (Unfavorable) Change |
| (in thousands, except per share amounts) | 2016 | | 2015 | | $ | | % |
| Operating Data: | | | | | | | |
| Total revenues | $ | 257,730 |
| | $ | 242,099 |
| | $ | 15,631 |
| | 6.5 | % |
| Property operating expenses | (41,890 | ) | | (38,399 | ) | | (3,491 | ) | | (9.1 | )% |
| Real estate tax expenses | (36,627 | ) | | (35,285 | ) | | (1,342 | ) | | (3.8 | )% |
| General and administrative expenses | (31,804 | ) | | (15,829 | ) | | (15,975 | ) | | (100.9 | )% |
| Acquisition expenses | (5,803 | ) | | (5,404 | ) | | (399 | ) | | (7.4 | )% |
| Depreciation and amortization | (106,095 | ) | | (101,479 | ) | | (4,616 | ) | | (4.5 | )% |
| Interest expense, net | (32,458 | ) | | (32,390 | ) | | (68 | ) | | (0.2 | )% |
| Other income, net | 5,990 |
| | 248 |
| | 5,742 |
| | NM |
|
| Net income | 9,043 |
|
| 13,561 |
|
| (4,518 | ) |
| (33.3 | )% |
| Net income attributable to noncontrolling interests | (111 | ) | | (201 | ) | | 90 |
| | 44.8 | % |
| Net income attributable to stockholders | $ | 8,932 |
| | $ | 13,360 |
| | $ | (4,428 | ) | | (33.1 | )% |
| | | | | | | |
|
| Net income per share—basic and diluted | $ | 0.05 |
| | $ | 0.07 |
| | $ | (0.02 | ) | | (28.6 | )% |
Below are explanations of the significant fluctuations in our results of operations for the years ended December 31, 2016 and 2015.
Total revenues— Of the $15.6 million increase in total revenues, $5.6 million was from same-center properties, which were the 132 properties that were owned and operational for the entire portion of both comparable reporting periods, except for those properties classified as redevelopment as of December 31, 2016. The remaining $10.0 million was attributable to non-same-center properties, including the 16 properties that were acquired since the beginning of 2015. The increase in same-center revenue was due to a $3.5 million increase in rental income and a $2.4 million increase in tenant recovery income. The increase in same-center rental income was driven by a $0.20 increase in minimum rent per square foot and a 0.2% increase in occupancy since December 31, 2015. The increase in same-center tenant recovery income stemmed from a 2.3% increase in our overall recovery rate.
Property operating expenses—Of the $3.5 million increase in property operating expenses, $1.8 million was due to the acquisition of 16 properties in 2015 and 2016. The remaining $1.7 million was primarily a result of an increase in recoverable property maintenance expenses due to an increase in additional maintenance projects during 2016, as well as a $0.7 million increase in property management fees due to higher cash receipts from the increase in revenues.
General and administrative expenses—General and administrative expenses increased $16.0 million, which was primarily related to a $14.6 million increase in cash asset management fees as a result of the change to our advisory fee structure in October 2015. Prior to that date, the asset management fee had been deferred via the issuance of Class B units of our Operating Partnership, which did not result in the recognition of expense in accordance with GAAP. After that date, the asset management fee remained at 1% of the cost of our assets; however, 80% was paid in cash and therefore recognized on a current basis as expense under GAAP, with the remaining 20% paid in Class B units. The remaining $1.4 million increase resulted from both a $1.0 million increase in distributions paid on unvested Class B units as a result of an increase in outstanding Class B units, as well as additional administrative costs associated with managing a larger portfolio.
Acquisition expenses—Acquisition expenses increased $0.4 million due to an increase in the purchase price paid for the seven properties acquired in 2016 compared to the nine properties acquired in 2015.
Other income, net—The $5.7 million increase in other income primarily resulted from a gain of $4.7 million on the disposal of a property in December 2016, as well as an increase of $1.3 million stemming from gains recognized on a portion of our derivatives.
Leasing Activity—The average rent per square foot and cost of executing leases fluctuates based on the tenant mix, size of the space, and lease term. Leases with national and regional tenants generally require a higher cost per square foot than those with local tenants. However, such tenants will also pay for a longer term. As we continue to attract more of these national and regional tenants, our costs to lease may increase.
Below is a summary of leasing activity for the years ended December 31, 2017 and 2016: |
| | | | | | | | | | | | | | | | |
| | | Total Deals | | Inline Deals(1) |
| | | 2017 | | 2016 | | 2017 | | 2016 |
| New leases: | | | | | | | | |
| Number of leases | | 185 |
| | 163 |
| | 179 |
| | 156 |
|
| Square footage (in thousands) | | 547 |
| | 690 |
| | 382 |
| | 379 |
|
| First-year base rental revenue (in thousands) | | $ | 8,108 |
| | $ | 8,469 |
| | $ | 6,762 |
| | $ | 6,337 |
|
| Average rent per square foot (“PSF”) | | $ | 14.81 |
| | $ | 12.27 |
| | $ | 17.69 |
| | $ | 16.70 |
|
Average cost PSF of executing new leases(2)(3) | | $ | 27.03 |
| | $ | 22.53 |
| | $ | 28.11 |
| | $ | 33.09 |
|
| Weighted average lease term (in years) | | 7.9 |
| | 9.8 |
| | 7.0 |
| | 7.3 |
|
| Renewals and options: | | | | | | | | |
| Number of leases | | 369 |
| | 321 |
| | 334 |
| | 301 |
|
| Square footage (in thousands) | | 1,977 |
| | 1,639 |
| | 676 |
| | 593 |
|
| First-year base rental revenue (in thousands) | | $ | 25,196 |
| | $ | 19,581 |
| | $ | 14,664 |
| | $ | 12,686 |
|
| Average rent PSF | | $ | 12.75 |
| | $ | 11.95 |
| | $ | 21.68 |
| | $ | 21.39 |
|
| Average rent PSF prior to renewals | | $ | 11.74 |
| | $ | 10.87 |
| | $ | 19.42 |
| | $ | 18.94 |
|
| Percentage increase in average rent PSF | | 8.5 | % | | 9.9 | % | | 11.6 | % | | 12.9 | % |
Average cost PSF of executing renewals and options(2)(3) | | $ | 3.12 |
| | $ | 2.67 |
| | $ | 4.80 |
| | $ | 4.70 |
|
| Weighted average lease term (in years) | | 5.2 |
| | 5.3 |
| | 5.1 |
| | 5.2 |
|
Portfolio retention rate(4) | | 93.8 | % | | 86.7 | % | | 85.9 | % | | 78.7 | % |
| |
(1)
| We consider an inline deal to be a lease for less than 10,000 square feet of gross leasable area (“GLA”). |
| |
(2)
| The cost of executing new leases, renewals, and options includes leasing commissions, tenant improvement costs, and tenant concessions. |
| |
(3)
| The costs associated with landlord improvements are excluded for repositioning and redevelopment projects. |
| |
(4)
| The portfolio retention rate is calculated by dividing (a) total square feet of retained tenants with current period lease expirations by (b) the square feet of leases expiring during the period. |
Non-GAAP Measures
Pro Forma Same-Center Net Operating Income—Same-Center NOI represents the NOI for the properties that were owned and operational for the entire portion of both comparable reporting periods, except for the properties we currently classify as redevelopment. Redevelopment properties are being repositioned in the market and such repositioning is expected to have a significant impact on property operating income. As such, these properties have been classified as redevelopment and have been excluded from our same-center pool. For purposes of evaluating Same-Center NOI on a comparative basis, and in light of the PELP transaction, we are presenting Pro Forma Same-Center NOI, which is Same-Center NOI on a pro forma basis as if the transaction had occurred on January 1, 2016. This perspective allows us to evaluate Same-Center NOI growth over a comparable period. Pro Forma Same-Center NOI is not necessarily indicative of what actual Same-Center NOI and growth would have been if the PELP transaction had occurred on January 1, 2016, nor does it purport to represent Same-Center NOI and growth for future periods.
Pro Forma Same-Center NOI highlights operating trends such as occupancy rates, rental rates, and operating costs on properties that were operational for both comparable periods. Other REITs may use different methodologies for calculating Same-Center NOI, and accordingly, our Pro Forma Same-Center NOI may not be comparable to other REITs.
Pro Forma Same-Center NOI should not be viewed as an alternative measure of our financial performance since it does not reflect the operations of our entire portfolio, nor does it reflect the impact of general and administrative expenses, acquisition expenses, depreciation and amortization, interest expense, other income, or the level of capital expenditures and leasing costs necessary to maintain the operating performance of our properties that could materially impact our results from operations.
The table below compares Pro Forma Same-Center NOI for the years ended December 31, 2017 and 2016 (in thousands): |
| | | | | | | | | | | | | | |
| | 2017 | | 2016 | | $ Change | | % Change |
Revenues(1): | | | | | | | |
Rental income(2) | $ | 220,081 |
| | $ | 215,398 |
| | $ | 4,683 |
| |
|
|
| Tenant recovery income | 69,965 |
| | 69,066 |
| | 899 |
| |
|
|
| Other property income | 1,565 |
| | 1,048 |
| | 517 |
| |
|
|
| Total revenues | 291,611 |
| | 285,512 |
|
| 6,099 |
|
| 2.1 | % |
Operating expenses(1): | | | | | | | |
| Property operating expenses | 46,504 |
| | 47,987 |
| | (1,483 | ) | |
|
|
| Real estate taxes | 40,275 |
| | 39,569 |
| | 706 |
| |
|
|
| Total operating expenses | 86,779 |
|
| 87,556 |
|
| (777 | ) |
| (0.9 | )% |
| Total Pro Forma Same-Center NOI | $ | 204,832 |
|
| $ | 197,956 |
|
| $ | 6,876 |
|
| 3.5 | % |
| |
(1)
| Adjusted for PELP same-center operating results prior to the transaction for these periods. For additional information and details about PELP operating results included herein, refer to the PELP Same-Center NOI table below. |
| |
(2)
| Excludes straight-line rental income, net amortization of above- and below-market leases, and lease buyout income. |
Below is a reconciliation of Net (Loss) Income to Owned Real Estate NOI and Pro Forma Same-Center NOI for the years ended December 31, 2017 and 2016 (in thousands): |
| | | | | | | |
| | 2017 | | 2016 |
| Net (loss) income | $ | (41,718 | ) | | $ | 9,043 |
|
| Adjusted to exclude: | | | |
| Fees and management income | (8,156 | ) | | — |
|
| Straight-line rental income | (3,766 | ) | | (3,512 | ) |
| Net amortization of above- and below-market leases | (1,984 | ) | | (1,208 | ) |
| Lease buyout income | (1,321 | ) | | (583 | ) |
| General and administrative expenses | 36,348 |
| | 31,804 |
|
| Transaction expenses | 15,713 |
| | — |
|
| Vesting of Class B units | 24,037 |
| | — |
|
| Termination of affiliate arrangements | 5,454 |
| | — |
|
| Acquisition expenses | 530 |
| | 5,803 |
|
| Depreciation and amortization | 130,671 |
| | 106,095 |
|
| Interest expense, net | 45,661 |
| | 32,458 |
|
| Other | (2,336 | ) | | (5,990 | ) |
Property management allocations to third-party assets under management(1) | 5,386 |
| | — |
|
Owned Real Estate NOI(2) | 204,519 |
|
| 173,910 |
|
| Less: NOI from centers excluded from same-center | (34,443 | ) | | (20,015 | ) |
NOI prior to October 4, 2017, from same-center properties acquired in the PELP transaction | 34,756 |
| | 44,061 |
|
| Total Pro Forma Same-Center NOI | $ | 204,832 |
|
| $ | 197,956 |
|
| |
(1)
| This represents property management expenses allocated to third-party owned properties based on the property management fee that is provided for in the individual management agreements under which our investment management business provides services. |
| |
(2)
| Segment Profit, presented in Results of Operations, differs from NOI primarily because of revenue exclusions made, including straight-line rental income, net amortization of above- and below market leases, and lease buyout income, when calculating NOI. |
Below is a breakdown of our property count: |
| | |
| 2017 |
Same-center properties(1)
| 200 |
|
Non-same-center properties | 19 |
|
Redevelopment properties(2)
| 17 |
|
Total properties | 236 |
|
| |
(1)
| Property count includes 64 same-center properties acquired in the PELP transaction. |
| |
(2)
| Property count includes eight redevelopment properties acquired in the PELP transaction. |
NOI from the PELP properties acquired prior to the PELP transaction was obtained from the accounting records of PELP without adjustment. The accounting records were subject to internal review by us. The table below provides Same-Center NOI detail for the non-ownership periods of PELP, which were the periods ended October 3, 2017, and the year ended December 31, 2016. |
| | | | | | | |
| | 2017 | | 2016 |
| Revenues: | | | |
Rental income(1) | $ | 37,860 |
| | $ | 49,046 |
|
| Tenant recovery income | 10,537 |
| | 13,781 |
|
| Other property income | 520 |
| | 259 |
|
| Total revenues | 48,917 |
| | 63,086 |
|
| Operating expenses: | | | |
| Property operating expenses | 8,214 |
| | 11,529 |
|
| Real estate taxes | 5,947 |
| | 7,496 |
|
| Total operating expenses | 14,161 |
| | 19,025 |
|
| Total Same-Center NOI | $ | 34,756 |
| | $ | 44,061 |
|
| |
(1)
| Excludes straight-line rental income, net amortization of above- and below-market leases, and lease buyout income. |
Funds from Operations and Modified Funds from Operations—FFO is a non-GAAP performance financial measure that is widely recognized as a measure of REIT operating performance. The National Association of Real Estate Investment Trusts (“NAREIT”) defines FFO as net income (loss) attributable to common shareholders computed in accordance with GAAP, excluding gains (or losses) from sales of property, plus depreciation and amortization, and after adjustments for impairment losses on depreciable real estate and impairments of in-substance real estate investments in investees that are driven by measurable decreases in the fair value of the depreciable real estate held by the unconsolidated partnerships and joint ventures. Adjustments for unconsolidated partnerships and joint ventures are calculated to reflect funds from operations on the same basis. We calculate FFO Attributable to Stockholders and Convertible Noncontrolling Interests in a manner consistent with the NAREIT definition, with an additional adjustment made for noncontrolling interests that are not convertible into common stock.
MFFO is an additional performance financial measure used by us as FFO includes certain non-comparable items that affect our performance over time. MFFO excludes the following items:
acquisition and transaction expenses;
straight-line rent amounts, both income and expense;
amortization of above- or below-market intangible lease assets and liabilities;
amortization of discounts and premiums on debt investments;
gains or losses from the early extinguishment of debt;
gains or losses on the extinguishment of derivatives, except where the trading of such instruments is a fundamental attribute of our operations;
gains or losses related to fair value adjustments for derivatives not qualifying for hedge accounting;
expenses related to the vesting of Class B units issued to our former advisors in connection with asset management services provided and the reclassification of distributions on those units to equity;
termination of affiliate arrangements; and
adjustments related to the above items for joint ventures and noncontrolling interests and unconsolidated entities in the application of equity accounting.
We believe that MFFO is helpful in assisting management and investors with the assessment of the sustainability of operating performance in future periods. We believe it is more reflective of our core operating performance and provides an additional measure to compare our performance across reporting periods on a consistent basis by excluding items that may cause short-term fluctuations in net income (loss) but have no impact on cash flows.
FFO, FFO Attributable to Stockholders and Convertible Noncontrolling Interests, and MFFO should not be considered alternatives to net income (loss) or income (loss) from continuing operations under GAAP, as an indication of our liquidity, nor as an indication of funds available to cover our cash needs, including our ability to fund distributions. MFFO may not be a useful measure of the impact of long-term operating performance on value if we do not continue to operate our business plan in the manner currently contemplated.
Accordingly, FFO, FFO Attributable to Stockholders and Convertible Noncontrolling Interests, and MFFO should be reviewed in connection with other GAAP measurements, and should not be viewed as more prominent measures of performance than net income (loss) or cash flows from operations prepared in accordance with GAAP. Our FFO, FFO Attributable to Stockholders and Convertible Noncontrolling Interests, and MFFO, as presented, may not be comparable to amounts calculated by other REITs.
The following table presents our calculation of FFO, FFO Attributable to Stockholders and Convertible Noncontrolling Interests, and MFFO and provides additional information related to our operations (in thousands): |
| | | | | | | | | | | |
| | 2017 | | 2016(1) | | 2015(1) |
Calculation of FFO Attributable to Stockholders and Convertible Noncontrolling Interests | | | | | |
| Net (loss) income | $ | (41,718 | ) |
| $ | 9,043 |
| | $ | 13,561 |
|
| Adjustments: |
|
|
| | |
| Depreciation and amortization of real estate assets | 127,771 |
|
| 106,095 |
| | 101,479 |
|
| Gain on sale of property | (1,760 | ) |
| (4,732 | ) | | — |
|
| FFO attributable to the Company | 84,293 |
|
| 110,406 |
|
| 115,040 |
|
Adjustments attributable to noncontrolling interests not convertible into
common stock | (143 | ) |
| — |
| | — |
|
| FFO attributable to stockholders and convertible noncontrolling interests | $ | 84,150 |
|
| $ | 110,406 |
|
| $ | 115,040 |
|
| Calculation of MFFO | | | | | |
| FFO attributable to stockholders and convertible noncontrolling interests | $ | 84,150 |
|
| $ | 110,406 |
| | $ | 115,040 |
|
| Adjustments: | | | | | |
| Transaction and acquisition expenses | 16,243 |
|
| 5,803 |
| | 5,404 |
|
| Net amortization of above- and below-market leases | (1,984 | ) |
| (1,208 | ) | | (821 | ) |
| Amortization of intangible corporate assets | 2,900 |
| | — |
| | — |
|
| (Gain) loss on extinguishment of debt, net | (572 | ) |
| (63 | ) | | 2,095 |
|
| Straight-line rent | (3,729 | ) |
| (3,512 | ) | | (4,571 | ) |
| Amortization of market debt adjustment | (1,115 | ) |
| (2,054 | ) | | (2,685 | ) |
| Change in fair value of derivatives | (201 | ) |
| (1,510 | ) | | (118 | ) |
| Noncash vesting of Class B units | 24,037 |
|
| — |
| | — |
|
| Termination of affiliate arrangements | 5,454 |
|
| — |
| | — |
|
| MFFO | $ | 125,183 |
| | $ | 107,862 |
| | $ | 114,344 |
|
| | | | | | |
FFO Attributable to Stockholders and Convertible Noncontrolling Interests/MFFO per share | | | | | |
Weighted-average common shares outstanding - diluted(2) | 196,506 |
| | 186,665 |
| | 186,394 |
|
FFO Attributable to Stockholders and Convertible Noncontrolling Interests per share - diluted | $ | 0.43 |
|
| $ | 0.59 |
|
| $ | 0.62 |
|
| MFFO per share - diluted | $ | 0.64 |
|
| $ | 0.58 |
|
| $ | 0.61 |
|
| |
(1)
| Certain prior period amounts have been restated to conform with current year presentation. |
| |
(2)
| OP units and restricted stock awards were dilutive to FFO Attributable to Stockholders and Convertible Noncontrolling Interests and MFFO for the years ended December 31, 2017, 2016, and 2015, and, accordingly, were included in the weighted-average common shares used to calculate diluted FFO Attributable to Stockholders and Convertible Noncontrolling Interests/MFFO per share. |
Liquidity and Capital Resources
General—Our principal cash demands, aside from standard operating expenses, are for investments in real estate, capital expenditures, repurchases of common stock, distributions to stockholders, and principal and interest on our outstanding indebtedness. We intend to use our cash on hand, operating cash flows, and proceeds from debt financings, including borrowings under our unsecured credit facility, as our primary sources of immediate and long-term liquidity. On October 4, 2017, we completed the PELP transaction. Under the terms of the agreement, we issued 39.4 million OP units valued at approximately $401.6 million, assumed $504.7 million of debt, and paid approximately $30.4 million in cash (see Note 3).
As of December 31, 2017, we had cash and cash equivalents of $5.7 million, a net cash decrease of $2.5 million during the year ended December 31, 2017.
Operating Activities—Our net cash provided by operating activities consists primarily of cash inflows from rental income, tenant recovery payments, and fee and management income, offset by cash outflows for property operating expenses, real estate taxes, general and administrative expenses, and interest payments.
Our cash flows from operating activities were $108.9 million for the year ended December 31, 2017, compared to $103.1 million for the same period in 2016. The increase was primarily due to favorable changes that resulted from having a larger portfolio, earning fee and management income, and improvements in same-center operating results. The increase was offset by increased expenses related to the PELP transaction and the redemption of unvested Class B units that had been earned by our former advisor for historical asset management services at the estimated value per share on the date of redemption (see Note 11).
Investing Activities—Net cash flows from investing activities are affected by business combinations and the nature, timing, and extent of improvements to, as well as acquisitions and dispositions of, real estate and real estate-related assets, as we continue to evaluate the market for available properties and may acquire properties when we believe strategic opportunities exist.
Our net cash used in investing activities was $620.7 million for the year ended December 31, 2017, compared to $226.2 million for the same period in 2016. The increase in cash used primarily resulted from repaying PELP’s corporate debt that was assumed in the PELP transaction, as well as net cash paid to PELP as part of the transaction.
During the year ended December 31, 2017, we acquired 84 shopping centers, including 76 shopping centers through the PELP transaction (see Note 3 for more detail). The net cash impact of the PELP transaction was a $456.7 million outlay. For the eight grocery-anchored shopping centers purchased outside of the PELP transaction, we had a total cash outlay of $159.7 million. During the same period in 2016, we acquired seven grocery-anchored shopping centers and additional real estate adjacent to previously acquired centers for a total cash outlay of $201.1 million.
Financing Activities—Net cash flows from financing activities are affected by payments of distributions, share repurchases, principal and other payments associated with our outstanding debt, and borrowings during the period. As our debt obligations mature, we intend to refinance the remaining balance, if possible, or pay off the balances at maturity using proceeds from operations and/or corporate-level debt. Our net cash provided by financing activities was $509.4 million for the year ended December 31, 2017, compared to net cash flow provided by financing activities of $90.7 million for the same period in 2016.
In conjunction with the PELP transaction, we entered into two new term loan agreements. The first term loan was for $375 million, $310 million of which was drawn in October 2017 with the remaining $65 million drawn in January 2018, and matures in April 2022. The second term loan was for $175 million and matures in October 2024. To increase the availability on our revolving credit facility, which had neared capacity due to acquisitions and other liquidity needs, we also executed two new secured loan facilities with principal balances of $175 million and $195 million that mature in November 2026 and November 2027, respectively. For more information regarding our term loans and secured loan facilities, see Note 7.
The $476.1 million increase in our net borrowings was partially offset by increased share repurchases in January 2017 (see Note 11), increased cash distributions as a result of all distributions being paid in cash in May due to the suspension of the DRIP as well as fewer investors participating in the DRIP, and the redemption of OP units that had been earned by our former advisor for historical asset management services.
As of December 31, 2017, our debt to total enterprise value was 41.8%. Debt to total enterprise value is calculated as net debt (total debt of $1.8 billion, excluding below-market debt adjustments of $5.3 million and adding back deferred financing costs of $16.0 million, less cash and cash equivalents of $5.7 million) as a percentage of enterprise value (equity value, calculated as 229.7 million shares of common stock and OP units outstanding multiplied by the estimated value per share of $11.00 as of December 31, 2017, plus net debt).
Our debt is subject to certain covenants. As of December 31, 2017, we were in compliance with the restrictive covenants of our outstanding debt obligations. We expect to continue to meet the requirements of our debt covenants over the short- and long-term. Our debt to total enterprise value and debt covenant compliance as of December 31, 2017, allow us access to future borrowings as needed.
Our revolving credit facility has a capacity of $500 million and a current interest rate of LIBOR plus 1.4%. As of December 31, 2017, $438.4 million was available for borrowing under the revolving credit facility. In October 2017, the maturity date of the revolving credit facility was extended to October 2021, with additional options to extend the maturity to October 2022.
Activity related to distributions to our common stockholders and OP unit holders for the years ended December 31, 2017 and 2016, is as follows (in thousands): |
| | | | | | | |
| | 2017 | | 2016 |
| Gross distributions paid to common stockholders | $ | 123,324 |
| | $ | 123,141 |
|
| Distributions reinvested through DRIP | (49,126 | ) | | (58,872 | ) |
| Net cash distributions paid to common stockholders | 74,198 |
| | 64,269 |
|
| Cash distributions paid to OP unit holders | 7,025 |
| | 1,866 |
|
| Net cash distributions | $ | 81,223 |
| | $ | 66,135 |
|
| Net (loss) income attributable to stockholders | $ | (38,391 | ) | | $ | 8,932 |
|
| Net cash provided by operating activities | $ | 108,861 |
| | $ | 103,076 |
|
FFO attributable to stockholders and convertible noncontrolling interests(1) | $ | 84,150 |
| | $ | 110,406 |
|
| |
(1)
| See Item 7. Management’s Discussion and Analysis of Financial Condition and Results of Operations - Non-GAAP Measures - Funds from Operations and Modified Funds from Operations, for the definition of FFO, information regarding why we present FFO Attributable to Stockholders and Convertible Noncontrolling Interests, as well as for a reconciliation of this non-GAAP financial measure to net (loss) income on the consolidated statements of operations. |
We paid distributions monthly and expect to continue paying distributions monthly unless our results of operations, our general financial condition, general economic conditions, or other factors, as determined by our Board, make it imprudent to do so.withholding. The timing and amount of distributions isare determined by our Board and is influenced in part by our intention to comply with REIT requirements of the Internal Revenue Code. IRC.
In 2022, we declared and paid monthly distributions of $0.09 per share, or $1.08 annualized, for each month beginning January 2022 through August 2022. We declared and paid monthly distributions of $0.0933 per share, or $1.12 annualized, an increase of 3.7%, for each month beginning September 2022 through December 2022.
To maintain our qualification as a REIT, we must make aggregate annual distributions to our stockholders of at least 90% of our REIT taxable income (which is computed without regard to the dividends paid deduction or net capital gain, and which does not necessarily equal net income (loss)or loss as calculated in accordance with GAAP). We generally will not be subject to U.S.
federal income tax on the income that we distribute to our stockholders each year due to meeting the REIT qualification requirements. However, we may be subject to certain state and local taxes on our income, property, or net worth and to federal income and excise taxes on our undistributed income.
We have not established a minimum distribution level, and our charter does not require that we make distributions to our stockholders.
SHARE REPURCHASE PROGRAM—On August 3, 2022, our Board approved a new share repurchase program of up to $250 million of common stock. The program may be suspended or discontinued at any time, and does not obligate us to repurchase any dollar amount or particular number of shares. No share repurchases have been made to date under this program.
CASH FLOW ACTIVITIES—As of December 31, 2023, we had cash and cash equivalents and restricted cash of $8.9 million, a net cash decrease of $8.5 million during the year ended December 31, 2023. Contractual CommitmentsBelow is a summary of our cash flow activity for the years ended December 31, 2023 and Contingencies2022 (dollars in thousands):
| | | | | | | | | | | | | | | | | | | | | | | |
| | 2023 | | 2022 | | $ Change | | % Change(1) |
| Net cash provided by operating activities | $ | 290,968 | | | $ | 290,890 | | | $ | 78 | | | — | % |
| Net cash used in investing activities | (353,386) | | | (331,245) | | | (22,141) | | | (6.7) | % |
| Net cash provided by (used in) financing activities | 53,947 | | | (57,825) | | | 111,772 | | | NM |
(1)Line items that result in a percent change that exceed certain limitations are considered not meaningful (“NM”) and indicated as such.
OPERATING ACTIVITIES—Our contractual obligationsnet cash provided by operating activities was primarily impacted by the following:
•Property operations and working capital—Most of our operating cash comes from rental and tenant recovery income and is offset by property operating expenses, real estate taxes, and general and administrative costs. The increase in property operations was primarily due to a $16.2 million, or 4.2%, improvement in Same-Center NOI as compared to 2022, and the execution of our acquisition strategy. During the year ended December 31, 2023, we had a net cash outlay of $9.4 million from changes in working capital as compared to a net cash outlay of $0.2 million during the same period in 2022. This change was primarily driven by an increase in real estate tax payments.
•Cash paid for interest—During the year ended December 31, 2023, we paid $76.5 million for interest, an increase of $11.4 million over the same period in 2022, largely due to higher interest rates in 2023.
•Fees and management income—We also generate operating cash from our third-party investment management business, pursuant to various management and advisory agreements between us and the Managed Funds. Our fee and management income was $9.6 million for the year ended December 31, 2023, a decrease of $1.9 million as compared to the same period in 2022. The decrease in fees and management income was primarily due to our joint venture with NRP from which we recognized income related to NRP’s achievement of certain performance targets of $0.1 million for the year ended December 31, 2023, compared to income of $2.7 million in 2022.
INVESTING ACTIVITIES—Our net cash used in investing activities was primarily impacted by the following:
•Real estate acquisitions—During the year ended December 31, 2023, our acquisitions resulted in a total cash outlay of $270.3 million, as compared to a total cash outlay of $282.0 million during the same period in 2022.
•Capital expenditures—We invest capital into leasing our properties and maintaining or improving the condition of our properties. During the year ended December 31, 2023, we paid $95.3 million for capital expenditures, a decrease of $9.2 million over the same period in 2022.
•Real estate dispositions—During the year ended December 31, 2023, our dispositions resulted in a net cash inflow of $7.2 million, as compared to a net cash inflow of $52.0 million during the same period in 2022.
FINANCING ACTIVITIES—Our net cash provided by (used in) financing activities was primarily impacted by the following:
•Debt borrowings and payments—During the year ended December 31, 2023, we had $64.2 million in net borrowings as compared to $1.3 million in net repayment of debt during the same period a year ago. See “Debt Activity” above for more details.
•Issuance of common stock—During the year ended December 31, 2023, we issued 4.2 million shares of our common stock under the ATM program for net proceeds of $147.6 million. During the year ended December 31, 2022, we issued 2.6 million shares of our common stock under the ATM program for net proceeds of $89.2 million.
•Distributions to stockholders and OP unit holders—Cash used for distributions to common stockholders and OP unit holders increased by $7.8 million during the year ended December 31, 2023 as compared to the same period in
| | | | | | | | | | | |
PHILLIPS EDISON & COMPANY DECEMBER 31, 2023 FORM 10-K | | | 43 |
2022, primarily due to an increase in shares of common stock outstanding as a result of issuances under the ATM program and our distribution increases in both 2022 and 2023.
| | |
| CRITICAL ACCOUNTING ESTIMATES |
Below is a discussion of our critical accounting estimates. Our accounting policies have been established to conform with GAAP. We consider these policies critical because they involve significant management judgments and assumptions, require estimates about matters that are inherently uncertain, and are important for understanding and evaluating our reported financial results. These judgments affect the reported amounts of assets at the dates of the consolidated financial statements, as well as the reported amounts of revenue during the reporting periods. With different estimates or assumptions, materially different amounts could be reported in our consolidated financial statements. Additionally, other companies may utilize different estimates that may impact the comparability of our results of operations to those of companies in similar businesses.
Real Estate Valuation—We assess the fair value of acquired real estate and allocate the purchase price of real estate assets and liabilities acquired based upon their estimated fair values as of the acquisition date. The allocation requires the use of market based estimates and assumptions including estimated market lease rates and comparable acquisitions, historical operating results, carrying costs during lease-up periods, discount and capitalization rates, market absorption periods, and the number of years the property will be held for investment.
Quarterly, we review our owned real estate properties, including those classified as real estate held for sale, for evidence of impairment, which requires us, at times, to estimate the fair value of our real estate assets. Valuing our investment in real estate assets requires us to utilize a significant amount of judgment in the inputs that we select for impairment testing and other analyses. We select these inputs based on all available evidence and using techniques that are commonly employed by other real estate companies. Examples of these inputs include projected revenue and expense growth rates, estimates of future cash flows, anticipated holding periods, capitalization rates, general economic conditions and trends, and other available market data.
We believe that our real estate valuation estimates are based on reasonable assumptions. However, the use of inappropriate estimates could result in an incorrect valuation of our real estate properties, at acquisition or during our ownership period, which could result in material impairment losses in the future.
Rental Income—The majority of our revenue is lease revenue derived from our real estate assets, for which we are the lessor. Lease receivables are reviewed continually to determine whether or not it is probable that we will realize substantially all remaining lease payments for each of our Neighbors (i.e., whether a Neighbor is deemed to be a credit risk). If we determine it is not probable that we will collect substantially all of the remaining lease payments from a Neighbor, revenue for that Neighbor is recorded on a cash basis (“cash-basis Neighbor”), including no longer recognizing straight-line rent receivables and/or receivables for recoverable expenses. We will resume recording lease income on an accrual basis for cash-basis Neighbors once we believe the collection of rent for the remaining lease term is probable, which will generally be after a period of regular payments and no remaining unpaid rent for a certain timeframe. Neighbors who represent approximately 2% of our ABR are on our watchlist for review for collectibility as of December 31, 2017, were as follows (in thousands):2023. However, not all of our watchlist Neighbors have an open receivable balance with us at December 31, 2023. |
| | | | | | | | | | | | | | | | | | | | | | | | | | | |
| | Payments due by period |
| | Total | | 2018 | | 2019 | | 2020 | | 2021 | | 2022 | | Thereafter |
Long-term debt obligations - principal payments(1) | $ | 1,817,786 |
| | $ | 8,142 |
| | $ | 109,192 |
| | $ | 182,323 |
| | $ | 254,570 |
| | $ | 341,169 |
| | $ | 922,390 |
|
Long-term debt obligations - interest payments(2) | 344,396 |
| | 61,441 |
| | 58,656 |
| | 53,959 |
| | 47,650 |
| | 36,614 |
| | 86,076 |
|
| Operating lease obligations | 2,945 |
| | 1,101 |
| | 773 |
| | 310 |
| | 188 |
| | 185 |
| | 388 |
|
| Total | $ | 2,165,127 |
| | $ | 70,684 |
| | $ | 168,621 |
| | $ | 236,592 |
| | $ | 302,408 |
| | $ | 377,968 |
| | $ | 1,008,854 |
|
| |
(1)
| The revolving credit facility, which matures in October 2021, has options to extend the maturity to October 2022. Portions of our term loan facilities with maturities in 2019 and 2020 have options to extend their maturities to 2021. We will consider options for refinancing the $100 million term loan maturing in February 2019 or exercising the option upon maturity. As of December 31, 2017, the availability on our revolving credit facility exceeded the balance on the loan maturing in 2019. The term loan maturing in 2020 also has options to extend its maturity to 2021.
|
| |
(2)
| Future variable-rate interest payments are based on interest rates as of December 31, 2017, including the impact of our swap agreements.
|
Our portfolio debt instrumentsAdditionally, we record a general reserve based on our review of operating lease receivables at a company level to ensure they are properly valued based on analysis of historical uncollectible tenant receivables, outstanding balances, and the unsecured revolving credit facility contain certain covenantscurrent economic climate.
The aforementioned adjustments, as well as any reserve for disputed charges, are recorded as a reduction of Rental Income on the consolidated statements of operations and restrictions. The followingcomprehensive income (“consolidated statements of operations”).
Our revenue collectibility estimates are made based on historical experience, the current economic climate, and other Neighbor-specific factors. While we do not believe there is a listreasonable likelihood of certain restrictive covenants specific to the unsecured revolving credit facility that were deemed significant:
limits the ratio of debt to total asset value, as defined, to 60% or less with a surge to 65% following a material acquisition;change in the estimates or assumptions that we use to recognize revenue, if actual payment levels were to vary significantly from estimates, we may be exposed to decreases in rental income that could be material or increases of non-cash straight-line income when a cash-basis Neighbor moves back to accrual accounting in accordance with GAAP.
requires the fixed-charge ratio, as defined, to be 1.5 to 1.0 or greater or 1.4 to 1.0 following a material acquisition;
limits the ratio of cash dividend payments to FFO, as defined, to be less than 95%.
As of December 31, 2017, we were in compliance with the restrictive covenants of our outstanding debt obligations. We expect to continue to meet the requirements of our debt covenants over the short and long term.
ITEM 7A. QUANTITATIVE AND QUALITATIVE DISCLOSURES ABOUT MARKET RISK
INTEREST RATE RISK—We utilize interest rate swaps in order to hedge a portion of our exposure to interest rate fluctuations. We do not intend to enter into derivative or interest rate transactions for speculative purposes. Our hedging decisions are determined based upon the facts and circumstances existing at the time of the hedge and may differ from our currently anticipated hedging strategy. Because we use derivative financial instruments to hedge against interest rate fluctuations, we may be exposed to both credit risk and market risk. Credit risk is the failure of the counterparty to perform under the terms of the derivative contract. If the fair value of a derivative contract is positive, the counterparty will owe us, which creates credit risk for us. If the fair value of a derivative contract is negative, we will owe the counterparty and, therefore, do not have credit risk. We seek to minimize the credit risk in derivative instruments by entering into transactions with high-quality counterparties. Market risk is the adverse effect on the value of a financial instrument that results from a change in interest rates. The market risk associated with interest-rate contracts is managed by establishing and monitoring parameters that limit the types and degree of market risk that may be undertaken.
| | | | | | | | | | | |
PHILLIPS EDISON & COMPANY DECEMBER 31, 2023 FORM 10-K | | | 44 |
As of December 31, 2017,2023, we had sixfour interest rate swaps that fixed the LIBORSOFR on $992$700 million of our unsecured term loan facilities, andfacilities.
In January 2024, we were party toentered into an interest rate swap thatwhich has a notional amount of $150 million and swaps SOFR for a fixed the variable interest rate on $10.7 million of one of our secured mortgage notes.approximately 3.45% effective September 2024 and maturing December 2025.
As of December 31, 2017,2023, we had not fixed the interest rate on $209.6$445.8 million of our unsecured debt through derivative financial instruments, and as a result, we are subject to the potential impact of rising interest rates, which could negatively impact our profitability and cash flows. The impact on our results of operations ofWe estimate that a one-percentageone percentage point increase in interest rates on the outstanding balance of our variable-rate debt at December 31, 2017,2023 would result in approximately $2.1$4.5 million of additional interest expense annually. The additional interest expense was determined based on the impact of hypothetical interest rates on our borrowing cost and assumes no changes in our capital structure. For further discussion of certain quantitative details related to our interest rate swaps, see Note 9.
The information presented above does not consider all exposures or positions that could arise in the future. Hence, the information represented herein has limited predictive value. As a result, the ultimate realized gain or loss with respect to interest rate fluctuations will depend on the exposures that arise during the period, the hedging strategies at the time, and the related interest rates.
See further discussion on interest amounts on our variable rate debt in Note 8 and discussion on the swap rate for our interest rate swaps in Note 9.
FOREIGN CURRENCY EXCHANGE RISK—We do not have any foreign operations, and thus, we are not exposed to foreign currency fluctuations.
ITEM 8. FINANCIAL STATEMENTS AND SUPPLEMENTARY DATA
See the Index to Consolidated Financial Statements on page F-1 of this report.
ITEM 9. CHANGES IN AND DISAGREEMENTS WITH ACCOUNTANTS ON ACCOUNTING AND FINANCIAL DISCLOSURE
None.Not applicable.
ITEM 9A. CONTROLS AND PROCEDURES
Evaluation of Disclosure Controls and Procedures
OurAs required by Rule 13a-15(b) and Rule 15d-15(b) under the Securities Exchange Act of 1934, as amended (the “Exchange Act”), our management, with the participation of our Principal Executive Officer and Principal Financial Officer, has evaluated the effectiveness of our disclosure controls and procedures (as defined in Rule 13a-15(e) and Rule 15d-15(e) under the Exchange Act) as of December 31, 2017.2023. Based on that evaluation, our Principal Executive Officer and Principal Financial Officer concluded that our disclosure controls and procedures (as defined in Rule 13a-15(e) and Rule 15d-15(e) under the Exchange Act) were effective as of December 31, 2017.2023, at a reasonable assurance level.
Management’s Annual Report on Internal Control Over Financial Reporting
Our management is responsible for establishing and maintaining adequate internal control over financial reporting, as defined in Exchange Act Rule 13a-15(f) and Rule 15d-15(f). Our system of internal control over financial reporting is designed to provide reasonable assurance regarding the preparation and fair presentation of the consolidated financial statements for external purposes in accordance with GAAP. All internal control systems, no matter how well designed, have inherent limitations. Therefore, even those systems determined to be effective can only provide reasonable assurance with respect to financial statement preparation and presentation. Also, because of changes in conditions, the effectiveness of an internal control system may vary over time.
Under the supervision and with the participation of our management, including our Principal Executive Officer and Principal Financial Officer, we conducted an evaluation of the effectiveness of our internal control over financial reporting based on the framework in Internal Control - Integrated Framework (2013) issued by the Committee of Sponsoring Organizations of the Treadway Commission (“COSO”). Based on our evaluation under the framework in Internal Control - Integrated Framework (2013) issued by the COSO, our management concluded that our internal control over financial reporting was effective as of December 31, 2017.2023.
Deloitte & Touche LLP, an independent registered public accounting firm that audited our financial statements, which are included in Item 8 of this Annual Report on Form 10-K, has issued an attestation report on management’s internal control over financial reporting, which is included in this Item 9A under the caption "Report of Independent Registered Public Accounting Firm”.
| | | | | | | | | | | |
PHILLIPS EDISON & COMPANY DECEMBER 31, 2023 FORM 10-K | | | 45 |
Changes in Internal Control over Financial Reporting
As a result ofDuring the acquisition of PELP on October 4, 2017, we have implemented internal controls over financial reporting to consider PELP, including its captive insurance company and third-party investment management business. The acquisition of PELP represents a material change in internal control over financial reporting subsequent to management’s last assessment of our internal control over financial reporting, which was completed as ofquarter ended December 31, 2016.
There have been2023, there were no other changes in our internal control over financial reporting during(as defined in Rule 13a-15(f) and Rule 15d-15(f) under the most recently completed fiscal quarterExchange Act) that have materially affected, or are reasonably likely to materially affect, our internal control over financial reporting.
| | | | | | | | | | | |
PHILLIPS EDISON & COMPANY DECEMBER 31, 2023 FORM 10-K | | | 46 |
REPORT OF INDEPENDENT REGISTERED PUBLIC ACCOUNTING FIRM
To the Stockholders and the Board of Directors of Phillips Edison & Company, Inc.
Opinion on Internal Control over Financial Reporting
We have audited the internal control over financial reporting of Phillips Edison & Company, Inc. and subsidiaries (the “Company”) as of December 31, 2023, based on criteria established in Internal Control — Integrated Framework (2013) issued by the Committee of Sponsoring Organizations of the Treadway Commission (COSO). In our opinion, the Company maintained, in all material respects, effective internal control over financial reporting as of December 31, 2023, based on criteria established in Internal Control — Integrated Framework (2013) issued by COSO.
We have also audited, in accordance with the standards of the Public Company Accounting Oversight Board (United States) (PCAOB), the consolidated financial statements as of and for the year ended December 31, 2023, of the Company and our report dated February 12, 2024, expressed an unqualified opinion on those financial statements.
Basis for Opinion
The Company’s management is responsible for maintaining effective internal control over financial reporting and for its assessment of the effectiveness of internal control over financial reporting, included in the accompanying Management’s Annual Report on Internal Control Over Financial Reporting. Our responsibility is to express an opinion on the Company’s internal control over financial reporting based on our audit. We are a public accounting firm registered with the PCAOB and are required to be independent with respect to the Company in accordance with the U.S. federal securities laws and the applicable rules and regulations of the Securities and Exchange Commission and the PCAOB.
We conducted our audit in accordance with the standards of the PCAOB. Those standards require that we plan and perform the audit to obtain reasonable assurance about whether effective internal control over financial reporting was maintained in all material respects. Our audit included obtaining an understanding of internal control over financial reporting, assessing the risk that a material weakness exists, testing and evaluating the design and operating effectiveness of internal control based on the assessed risk, and performing such other procedures as we considered necessary in the circumstances. We believe that our audit provides a reasonable basis for our opinion.
Definition and Limitations of Internal Control over Financial Reporting
A company’s internal control over financial reporting is a process designed to provide reasonable assurance regarding the reliability of financial reporting and the preparation of financial statements for external purposes in accordance with generally accepted accounting principles. A company’s internal control over financial reporting includes those policies and procedures that (1) pertain to the maintenance of records that, in reasonable detail, accurately and fairly reflect the transactions and dispositions of the assets of the company; (2) provide reasonable assurance that transactions are recorded as necessary to permit preparation of financial statements in accordance with generally accepted accounting principles, and that receipts and expenditures of the company are being made only in accordance with authorizations of management and directors of the company; and (3) provide reasonable assurance regarding prevention or timely detection of unauthorized acquisition, use, or disposition of the company’s assets that could have a material effect on the financial statements.
Because of its inherent limitations, internal control over financial reporting may not prevent or detect misstatements. Also, projections of any evaluation of effectiveness to future periods are subject to the risk that controls may become inadequate because of changes in conditions, or that the degree of compliance with the policies or procedures may deteriorate.
/s/ Deloitte & Touche LLP
Cincinnati, Ohio
February 12, 2024
| | | | | | | | | | | |
PHILLIPS EDISON & COMPANY DECEMBER 31, 2023 FORM 10-K | | | 47 |
ITEM 9B. OTHER INFORMATION
On March 26, 2018, the Company, in its capacity as the sole member of the sole general partner of the Operating Partnership, entered into a Fourth Amended and Restated Agreement of Limited Partnership (the “Amended and Restated Partnership Agreement”) of the Operating Partnership. The Amended and Restated Partnership Agreement amends and restates the Operating Partnership’s Third Amended and Restated Agreement of Limited Partnership in its entirety to provide for, among other things, the designation of Class C units as a new class of partnership units and setting forth the terms and conditions of the Class C units, as well as further clarification of the terms and conditions of the Class B units. Both Class B units and Class C units are limited partner interests designed to qualify as “profits interests” for federal income tax purposes. As a general matter, the profits interests characteristics of Class B units and Class C units mean that initially they will not have full parity with common OP Units with respect to liquidating distributions. If and when events specified by applicable tax regulations happen, the Class B units and Class C units can over time increase in value up to the point where they can achieve full parity with the common OP units with respect to liquidating distributions. After Class B units and Class C units are fully earned and vested, as applicable, and if the special tax rules applicable to profits interests have allowed them to become equivalent in value to common OP units, the Class B units and Class C units may be converted on a one-for-one basis into common OP units.Not applicable.
The foregoing summary of the Amended and Restated Partnership Agreement is not complete and is qualified in its entirety by reference to the full text of the Amended and Restated Partnership Agreement, which is filed as Exhibit 4.4 to this Annual Report on Form 10-K and is incorporated herein by reference.
ITEM 9C. DISCLOSURE REGARDING FOREIGN JURISDICTIONS THAT PREVENT INSPECTIONS
Not applicable.
ITEM 10. DIRECTORS, EXECUTIVE OFFICERS, AND CORPORATE GOVERNANCE
Directors and Executive Officers
We have provided below certainThe information required by this Item is included under the caption “Information about our executive officersExecutive Officers” in Part I hereof or will be included in our definitive proxy statement to be filed with the U.S. Securities and directors. |
| | | | | | |
| Name | | Position(s) | | Age* | | Year First Became a Director |
| Jeffrey S. Edison | | Chairman of the Board of Directors (“Board”) and Chief Executive Officer | | 57 | | 2009 |
| Leslie T. Chao | | Independent Director | | 61 | | 2010 |
| Paul J. Massey, Jr. | | Independent Director | | 58 | | 2010 |
| Stephen R. Quazzo | | Independent Director | | 58 | | 2013 |
| Gregory S. Wood | | Independent Director | | 59 | | 2016 |
| Devin I. Murphy | | Chief Financial Officer, Treasurer and Secretary | | 57 | | N/A |
| Robert F. Myers | | Chief Operating Officer | | 45 | | N/A |
| R. Mark Addy | | Executive Vice President | | 55 | | N/A |
* As of the date of this filing
Directors
Jeffrey S. Edison (Chairman of our Board and Chief Executive Officer). Mr. Edison has served as chairman or co-chairman of the Phillips Edison & Company, IncExchange Commission (“PECO”SEC”) Board and our chief executive officer sincewithin 120 days after December 2009. Mr. Edison has served as chairman of the Board and chief executive officer of REIT II since August 2013 and as the chairman of the Board and the chief executive officer of REIT III since April 2016. Mr. Edison co-founded Phillips Edison Limited Partnership (“PELP”) and has served as a principal of Phillips Edison since 1995. Before founding Phillips Edison, Mr. Edison was a senior vice president from 1993 until 1995 and was a vice president from 1991 until 1993 at Nations Bank’s South Charles Realty Corporation. From 1987 until 1990, Mr. Edison was employed by Morgan Stanley Realty Incorporated and was employed by The Taubman Company from 1984 to 1987. Mr. Edison holds a master’s degree in business administration from Harvard Business School and a bachelor’s degree in mathematics and economics from Colgate University.
Among the most important factors that led to our Boards’ recommendation that Mr. Edison serve as our director are Mr. Edison’s leadership skills, integrity, judgment, knowledge of our company, his experience as a director and chief executive officer of PECO, REIT II and III, and his commercial real estate expertise.
Leslie T. Chao (Independent Director). Mr. Chao has been a director of PECO since July 2010, and has served as lead independent director since November 2017. Mr. Chao co-founded and, since February 2012, has served as chairman and chief executive officer of Value Retail (Suzhou) Co., Ltd., a developer of outlet centers in China. Mr. Chao retired as chief executive officer of Chelsea Property Group (“Chelsea”), a subsidiary of Simon Property Group, Inc. (“Simon”) (NYSE: SPG), in 2008. Previously he served in various senior capacities at Chelsea, including president and chief financial officer, from 1987 through its initial public offering in 1993 (NYSE: CPG) and acquisition by Simon in 2004. Chelsea was the world’s largest developer, owner and manager of premium outlet centers, with operations in the United States, Japan, Korea and Mexico. Prior to Chelsea, Mr. Chao was a vice president in the treasury group of Manufacturers Hanover Corporation, a New York bank holding company now part of JPMorgan Chase & Co., where he was employed from 1978 to 1987. Since January 2009, he has served as a non-executive director of Value Retail PLC, a leading developer of outlet centers in Europe, and from 2005 to October 2008 he served as an independent director of The Link REIT, the first and largest public REIT in Hong Kong. He received an AB from Dartmouth College in 1978 and an MBA from Columbia Business School in 1986.
Among the most important factors that led to the Boards’ recommendation that Mr. Chao serve as our director are Mr. Chao’s integrity, judgment, leadership skills, extensive domestic and international commercial real estate expertise, accounting and financial management expertise, public company director experience, and independence from management and our sponsor and its affiliates.
Paul J. Massey, Jr. (Independent Director). Mr. Massey has been a director of PECO since July 2010. Mr. Massey has also served as a director of REIT II since July 2014. Mr. Massey began his career in 1983 at Coldwell Banker Commercial Real Estate Services in Midtown Manhattan, first as the head of the market research department, and next as an investment sales broker. Together with partner Robert A. Knakal, whom he met at Coldwell Banker, he then founded Massey Knakal Realty Services, which became New York City’s largest investment property sales brokerage firm, of which Mr. Massey served as chief executive officer, until 2014, when Massey Knakal was sold to global commercial real estate firm Cushman & Wakefield, Inc., for which Mr. Massey has served as president - New York investment sales. In 2007, Mr. Massey was the recipient of the Real Estate Board of New York’s (“REBNY”) Louis B. Smadbeck Broker Recognition Award. Mr. Massey also serves as chairman for REBNY’s Ethics and Business Practice Subcommittee, is a director on the Commercial Board of REBNY, is an active member of the Board of Trustees for the Lower East Side Tenement Museum and serves as a chair or member of numerous other committees. Mr. Massey graduated from Colgate University with a Bachelor of Arts degree in economics.
Among the most important factors that led to the Boards’ recommendation that Mr. Massey serve as our director are Mr. Massey’s integrity, judgment, leadership skills, extensive commercial real estate expertise, familiarity with our company and independence from management and our sponsor and its affiliates.
Stephen R. Quazzo (Independent Director). Mr. Quazzo has been one of our directors since November 2013. Mr. Quazzo is co-founder and chief executive officer of Pearlmark Real Estate, L.L.C. From 1991 to 1996, Mr. Quazzo served as president of Equity Institutional Investors, Inc., a subsidiary of investor Sam Zell’s private holding company, Equity Group Investments, Inc. Mr. Quazzo was responsible for raising equity capital and performing various portfolio management services31, 2023 in connection with the firm’s real estate investments, including institutional opportunity funds and public REITs. Prior to joining the Zell organization, Mr. Quazzo was in the Real Estate DepartmentCompany's 2024 Annual Meeting of Goldman, Sachs & Co., where he was a vice president responsible for the firm’s real estate investment banking activities in the Midwest. Mr. Quazzo holds undergraduate and MBA degrees from Harvard University, where he is a member of the Board of Dean’s Advisors for the business school. He is a trustee of the Urban Land Institute, chairman of the ULI Foundation, a member of the Pension Real Estate Association,Stockholders, and is a licensed real estate broker in Illinois. In addition, Mr. Quazzo serves as a director of ILG, Inc. (NASDAQ: ILG), a trustee of Rush University Medical Center, and an investment committee member of the Chicago Symphony Orchestra endowment and pension plans. Mr. Quazzo serves as a trustee of Deerfield Academy, and since 1994 has been a Chicago Advisory Board member of City Year, a national service organization.hereby incorporated by reference into this Form 10-K.
Among the most important factors that led to the Boards’ recommendation that Mr. Quazzo serve as our director are Mr. Quazzo’s integrity, judgment, leadership skills, commercial real estate expertise, investment management expertise, public company director experience, and independence from management and our sponsor and its affiliates.
Gregory S. Wood (Independent Director). Mr. Wood has been a director of PECO since April 2016. Mr. Wood has been executive vice president & chief financial officer of EnergySolutions, Inc., a leading services provider to the nuclear industry, since June 2012. Prior to that, Mr. Wood held the role of chief financial officer at numerous public and private companies, including Actian Corporation, Silicon Graphics (filed for Chapter 11 bankruptcy protection in 2009 in order to effect the sale of its business to Rackable Systems), Liberate Technologies and InterTrust Technologies. Mr. Wood was a director of Steinway Musical Instruments, Inc. from October 2011 to October 2013, where he also served as chairman of the Audit Committee. Mr. Wood, a certified public accountant (inactive), received his bachelor of business administration in accounting degree from the University of San Diego and his law degree from the University of San Francisco School of Law.
Among the most important factors that led to the Boards’ recommendation that Mr. Wood serve as our director are Mr. Wood’s integrity, judgment, leadership skills, accounting and financial management expertise, public company director experience, and independence from management and our sponsor and its affiliates.
Lead Independent Director—Mr. Chao is an independent director and has served as our lead independent director since November 2017.
The responsibilities of our lead independent director include, but are not limited to, the following:
meeting at least once every quarter with the chairman of our Board (if the chairman of our Board is a management director) and the chief executive officer;
presiding at all meetings of our Board at which the chairman of our Board, if different from the lead independent director, is not present, including executive sessions of the independent directors;
serving as liaison between the chairman of our Board, if different from the lead independent director, and the independent directors;
reviewing all information sent to our Board;
reviewing all meeting agendas for our Board; and
overseeing meeting schedules to assure that there is sufficient time for discussion of all agenda items.
Our lead independent director also has the authority to call meetings of the independent directors. If the chairman of our Board is an independent director, he or she will serve as the lead independent director. Otherwise, the lead independent director is to be selected by the independent directors at the meeting of our Board scheduled on the day of each annual meeting of our stockholders (or, if no such meeting is held, on the first subsequent regularly scheduled meeting of our Board).
Executive Officers
Devin I. Murphy. Mr. Murphy has served as our chief financial officer, treasurer and secretary since August 2013. He also serves as the chief financial officer, treasurer and secretary of REIT III since April 2016, and of as a principal and chief financial officer of PECO since June 2013. From November 2009 to June 2013, he served as vice chairman of investment banking at Morgan Stanley. He began his real estate career in 1986 when he joined the real estate group at Morgan Stanley as an associate. Prior to rejoining Morgan Stanley in June 2009, Mr. Murphy was a managing partner of Coventry Real Estate Advisors (“Coventry”), a real estate private equity firm founded in 1998 which sponsors a series of institutional investment funds that acquire and develop retail properties. Prior to joining Coventry in March 2008, from February 2004 until November 2007, Mr. Murphy served as global head of real estate investment banking for Deutsche Bank Securities, Inc. (“Deutsche Bank”). At Deutsche Bank, Mr. Murphy ran a team of over 100 professionals located in eight offices in the United States, Europe and Asia. Prior to joining Deutsche Bank, Mr. Murphy was with Morgan Stanley for 15 years. He held a number of senior positions at Morgan Stanley including co-head of United States real estate investment banking and head of the private capital markets group. Mr. Murphy served on the investment committee of the Morgan Stanley Real Estate Funds from 1994 until his departure in 2004. Mr. Murphy has served as an advisory director for Hawkeye Partners, a real estate private equity firm headquartered in Austin, Texas, since March 2005 and for Trigate Capital, a real estate private equity firm headquartered in Dallas, Texas, since September 2007. Mr. Murphy received a master’s of business administration degree from the University of Michigan and a bachelor of arts degree with honors from the College of William and Mary. He is a member of the Urban Land Institute, the Pension Real Estate Association and the National Association of Real Estate Investment Trusts.
Robert F. Myers. Mr. Myers was appointed chief operating officer of PECO in September 2017. Mr. Myers joined Phillips Edison in 2003 as a senior leasing manager, was promoted to regional leasing manager in 2005 and became vice president of Leasing in 2006. He was named senior vice president of leasing and operations in 2009, and chief operating officer in 2010. Before joining Phillips Edison, Mr. Myers spent six years with Equity Investment Group, where he started as a property
manager in 1997. He served as director of operations from 1998 to 2000 and as director of lease renegotiations/leasing agent from 2000 to 2003. He received his bachelor’s degree in business administration from Huntington College in 1995.
R. Mark Addy. Mr. Addy has served as the executive vice president of PECO since 2017. In addition, he is the president and chief operating officer of REIT II and REIT III, positions he has held since 2013 and 2017, respectively. Mr. Addy previously served as chief operating officer for Phillips Edison from 2004 to October 2010. He served as senior vice president of Phillips Edison from 2002 until 2004. Prior to joining Phillips Edison, Mr. Addy practiced law with Santen & Hughes in the areas of commercial real estate, financing and leasing, mergers and acquisitions, and general corporate law from 1987 until 2002. Mr. Addy was the youngest law partner in the 50 year history of Santen & Hughes, and served as president of Santen & Hughes from 1996 through 2002. While at Santen & Hughes, he represented Phillips Edison from its inception in 1991 to 2002. Mr. Addy received his bachelor’s degree in environmental science and chemistry from Bowling Green State University, where he received the President’s Award for academic achievement and was a member of the Order of the Omega leadership honor society. Mr. Addy received his law degree from the University of Toledo, where he was a member of the Order of the Barristers.
Section 16(a) Beneficial Ownership Reporting Compliance
Under U.S. securities laws, directors, executive officers and any persons beneficially owning more than 10% of our common stock are required to report their initial ownership of the common stock and most changes in that ownership to the SEC. The SEC has designated specific due dates for these reports, and we are required to identify in this proxy statement those persons who did not file these reports when due. Based solely on our review of copies of the reports filed with the SEC and written representations of our directors and executive officers, we believe all persons subject to these reporting requirements filed the reports on a timely basis in 2017, except one Form 3 was filed late for Mr. Myers and one Form 4 (one transaction) was filed late for each of Ms. Robison, our Chief Accounting Officer, and Messrs. Chao, Massey, Quazzo and Wood, one Form 4 (six transactions) for Messrs. Edison, Murphy and Myers, and one Form 4 (seven transactions) for Mr. Addy.
Code of Ethics
We have adopted a Code of Ethics that applies to all of our executive officers and directors, including but not limited to, our Principal Executive Officer and Principal Financial Officer. Our Code of Ethics may be found on our website at http://www.phillipsedison.com/investors/governance.
Audit Committee
The Audit Committee’s primary function is to assist our Board in fulfilling its responsibilities by overseeing our independent auditors and reviewing the financial information to be provided to our stockholders and others, overseeing the system of internal control over financial reporting that our management has established, and overseeing our audit and financial reporting process. The Audit Committee also is responsible for overseeing our compliance with applicable laws and regulations and for establishing procedures for the ethical conduct of our business. The Audit Committee fulfills these responsibilities primarily by carrying out the activities enumerated in the Audit Committee Charter adopted by our Board in 2010. The Audit Committee Charter is available on our website at http://www.phillipsedison.com/investors/governance.
The members of the Audit Committee are Leslie T. Chao (Chair), Paul J. Massey, Jr., Gregory S. Wood, and Stephen R. Quazzo. The Board has determined that Mr. Chao, who is an independent director, qualifies as the Audit Committee “financial expert” within the meaning of SEC rules.
ITEM 11. EXECUTIVE COMPENSATION
Messrs. Edison, Addy, Murphy, and Myers areThe information required by this Item will be included in our named executive officers.
Compensation of Directors
The following table sets forth information concerningdefinitive proxy statement to be filed with the compensation of our independent directors for the year endedSEC within 120 days after December 31, 2017: |
| | | | | | | | |
| Name | Fees Earned or Paid in Cash ($) | | Stock Awards ($)(1) | | Total ($) |
| Leslie T. Chao | 73,532 |
| | 25,000 |
| | 98,532 |
|
| Paul J. Massey, Jr. | 53,532 |
| | 25,000 |
| | 78,532 |
|
| Stephen R. Quazzo | 53,532 |
| | 25,000 |
| | 78,532 |
|
| Gregory S. Wood | 52,532 |
| | 25,000 |
| | 77,532 |
|
| |
(1)
| Represents the aggregate grant date fair value of restricted stock awards made to our directors in 2017, calculated in accordance with Financial Accounting Standards Board (“FASB”) Accounting Standards Codification (“ASC”) Topic 718, Compensation—Stock Compensation. Such aggregate grant date fair values do not take into account any estimated forfeitures related to service-vesting conditions. The amounts reported in this column reflect the accounting cost for these restricted stock awards, and do not correspond to the actual economic value that may be received by the director upon vesting of the awards. Assumptions used in the calculation of these amounts are included in Note 12.
|
As of December 31, 2017, the non-employee members of our Board, mentioned above, each held 4,289 shares of restricted stock.
Director Compensation Policy—During 2017, we did not provide any compensation to Mr. Edison, our Chief Executive Officer, for his service as a member of our Board. Mr. Edison’s compensation as an executive officer is set forth below under “Executive Compensation-2017 Summary Compensation Table.”
Non-employee director compensation is set by our Board at the recommendation of our Compensation Committee. In 2017, our non-employee directors received the following compensation for their service on the Board and committees of the Board: |
| | | | | |
| | Annual Cash Retainer ($) | | Annual Equity Retainer ($) |
| Board of Directors | 30,000 |
| | 25,000 |
|
| Audit Committee Chair | 20,000 |
| | — |
|
| Conflicts Committee Chair | 3,000 |
| | — |
|
In addition, the non-employee members of the Board received $1,000 per each Board and committee meeting attended and received reimbursement of reasonable out-of-pocket expenses incurred2023 in connection with attendancethe Company's 2024 Annual Meeting of meetings of the Board and committees of the Board.
We retained FPL Associates L.P. (“FPL”) to assist in assessing our non-employee director compensation program and provide recommendations for changes to the program, if any. Based upon input from FPL and the recommendation of the Compensation Committee, the Board approved the following compensation for the Board for 2018: |
| |
| Annual Cash Retainer ($) |
Board of Directors | 52,500 |
Lead Independent Director | 10,000 |
Audit Committee Chair | 10,000 |
Compensation Committee Chair | 10,000 |
In addition, each non-employee member of the Board will receive an equity retainer in the form of restricted stock with a grant date fair value of $52,500. The equity retainer will vest in full on the first anniversary of the date of grant. This program is intended to provide a total compensation package that enables us to attract and retain qualified and experienced individuals to serve as our directors and to align our directors’ interests with those of our stockholders.
Equity Compensation Plan Information
The following table provides information as of December 31, 2017, regarding shares of common stock that may be issued under our equity compensation plans, consisting of our Amended and Restated 2010 Long-Term Incentive Plan (the “2010 Plan”) and our Amended and Restated 2010 Independent Director Stock Plan (the “Director Plan”): |
| | | | | | | | |
| Plan Category | Number of Securities To Be Issued Upon Exercise of Outstanding Options, Warrants, and, Rights | | Weighted-Average Exercise Price of Outstanding Options, Warrants, and, Rights | | Number of Securities Remaining Available for Future Issuance Under Equity Compensation Plans(1)(2) |
| Equity compensation plans approved by security holders | 17,157 |
| | — |
| | 9,182,843 |
|
| Equity compensation plans not approved by security holders | — |
| | — |
| | — |
|
| Total / Weighted Average | 17,157 |
| | — |
| | 9,182,843 |
|
| |
(1)
| Excludes number of securities to be issued upon exercise of outstanding options, warrants, and rights. |
| |
(2)
| As of December 31, 2017, there were 9,000,000 shares available for grants under the 2010 Plan and 200,000 shares available for grants under the Director Plan. |
Compensation Discussion and Analysis
Overview—This Compensation Discussion and Analysis describes the Company’s executive compensation program as it relates to the following “named executive officers.���
Jeffrey S. Edison, our Chairman of the Board and Chief Executive Officer;
R. Mark Addy, our Executive Vice President;
Devin I. Murphy, our Chief Financial Officer, Treasurer and Secretary; and
Robert F. Myers, our Chief Operating Officer.
The following discussion should be read together with the compensation tables and related disclosures set forth below.
Executive Summary—In October 2017, upon the closing of the PELP Transaction, we acquired certain real estate assets, the third-party asset management business and certain other assets of PELP, our former sponsor and external advisor. As a result of the PELP Transaction, we are now an internally-managed, non-traded grocery-anchored shopping center REIT with a total enterprise value of approximately $4.3 billion. As of December 31, 2017, we owned a high-quality, nationally diversified portfolio of 236 grocery-anchored shopping centers comprising approximately 26.3 million square feet in 32 states. Following the PELP Transaction, we are well positioned to drive sustained growth and create enhanced value for our stockholders. In addition, in 2017, we:
Exceeded our 2017 budget and peer companies on key financial metrics, including Same-Center net operating income (“NOI”), modified funds from operations (“MFFO”) and adjusted funds from operations (“AFFO”);
Increased net asset value per share by 8% to $11.00 from $10.20; and
Achieved dividend to MFFO per share coverage of 101% in the fourth quarter of 2017.
The compensation paid to and earned by our named executive officers for 2017 was primarily paid by and with respect to their services to PELP. Because of our change from an externally managed REIT to an internally managed REIT, the Compensation Discussion and Analysis will also discuss the compensation decisions relating to our named executives officers initiated in 2017 and 2018 intended to maintain management continuity and establish appropriate incentives to build value over time as we transition to an internally managed REIT.
Executive Compensation Objectives and Philosophy—As we move forward as an internally managed, non-traded REIT, the key objectives of our executive compensation program are (1) to attract, motivate, reward and retain superior executive officers with the skills necessary to successfully lead and manage our business; (2) to achieve accountability for performance by linking annual cash incentive compensation to the achievement of measurable performance objectives; and (3) to incentivize our executive officers to build value and achieve financial objectives designed to increase the value of our business through short-term and long-term incentive compensation programs. For our executive officers, these short-term and long-term incentives are designed to accomplish these objectives by providing a significant correlation between our financial results and their actual total compensation.
We expect to continue to provide our executive officers with a significant portion of their compensation through cash incentive compensation contingent upon the achievement of financial and individual performance metrics as well as through equity compensation. These two elements of executive compensation are aligned with the interests of our stockholders because the amount of compensation ultimately received will vary with our financial performance. Equity compensation derives its value from the appreciation of shares of our common stock.
Historically, our executive officers have generally received equity incentive awards in the form of restricted management units (“RMUs”) in PELP. In connection with the PELP Transaction, the RMUs granted to our named executive officers were canceled and exchanged for phantom units in PECO that will be settled in cash. In March 2018, the named executive officers were granted equity incentive awards in the form of restricted stock units (“RSUs”) of PECO or LTIP Units of the Operating Partnership (“LTIP Units”), which are described in more detail under the heading “Equity Compensation” below.
We seek to apply a consistent philosophy to compensation for all executive officers.
Setting Executive Compensation—Our Compensation Committee is responsible for approving the compensation of the Chief Executive Officer and other named executive officers.
When setting executive compensation, our Compensation Committee considers our overall company performance, including our achievement of financial goals, and individual performance. They also consider compensation paid by similarly situated REITs. In addition, our Compensation Committee continues to consider performance, the changing roles and responsibilities of our executive officers and the expected future contributions of our executive officers. Our Compensation Committee believes that understanding competitive market data is an important part of its decision-making process and while this exercise does not perfectly capture all the unique aspects of our business, typically it provides a solid foundation upon which to base executive compensation decisions.
Role of the Compensation Committee—Our Compensation Committee, which is comprised entirely of independent directors, reviews the compensation packages for our named executive officers, including an analysis of all elements of compensation separately and in the aggregate. Our Compensation Committee operates under a written charter adopted by our Board of Directors, which provides that the Compensation Committee has overall responsibility for:
periodically reviewing and assessing our processes and procedures for the consideration and determination of executive compensation;
reviewing and approving grants and awards under incentive-based compensation plans and equity-based plans; and
determining the equity awards and bonus amounts for our executive officers.
In reviewing and approving these matters, our Compensation Committee considers such matters as it deems appropriate, including our financial and operating performance, the alignment of the interests of our executive officers and our stockholders and our ability to attract and retain qualified and committed individuals. In determining appropriate compensation levels for our Chief Executive Officer, the Compensation Committee meets outside the presence of all our executive officers. With respect to the compensation levels of all other executive officers, the Compensation Committee meets outside the presence of all executive officers except our Chief Executive Officer. Our Chief Executive Officer annually reviews the performance of each of the other named executive officers with the Compensation Committee.
Role of Compensation Consultant—In 2017, our Compensation Committee engaged FPL to provide guidance regarding our executive compensation program for 2018.
Our Compensation Committee performs an annual assessment of the compensation consultants’ independence to determine whether the consultants are independent. During 2017, FPL did not provide services to our Company other than the services to our Compensation Committee. Our Compensation Committee has determined that FPL is independent and that its work has not raised any conflicts of interest.
Competitive Positioning and Peer Company Comparisons—In 2017, FPL compared the compensation of our named executive officers to data in the National Association of Real Estate Investment Trusts (“NAREIT”) survey to assess compensation levels.
The NAREIT survey includes 143 REITs and provides a broad market reference of REITs, including retail REITs, many of which compete with the Company for executive talent. FPL furnished the Compensation Committee with a report that compared the Company’s compensation of certain of our named executive to the survey data. This report was considered by the Compensation Committee in setting total compensation for 2018.
Although comparisons of compensation paid to our senior management relative to compensation paid to similarly situated executives in the survey assists the Compensation Committee in determining compensation, the Committee principally evaluates compensation based on corporate objectives and individual performance.
Compensation Best Practices |
| | | | | | |
WHAT WE DO | | WHAT WE DON’T DO |
| | A significant portion of our executive officers’ total compensation opportunity is based on performance (i.e., not guaranteed). | | × | | We do not provide “single-trigger” change in control cash severance payments. |
| | We established a formulaic short-term incentive bonus program based on rigorous goals for management. | | × | | We do not guarantee annual salary increases or minimum cash bonuses. |
| | We align the interests of our executive officers with our long-term investors by awarding a significant percentage of their equity compensation in the form of multi-year, performance-based equity awards. | | × | | We do not provide tax gross-up payments to any of our executive officers on for tax amounts they might pay pursuant to Section 4999 or Section 409A of the Code. |
| | We enhance executive officer retention with time-based, multi-year vesting equity incentive awards. | | × | | We do not allow for repricing or buyouts of stock options without prior stockholder approval. |
| | We engage an independent compensation consultant to advise the Compensation Committee, which is comprised solely of independent directors. | | | | |
Elements of Executive Compensation—The primary elements of our compensation program are:
base salary;
performance-based cash incentives;
long-term equity incentives; and
severance and change in control payments and benefits.
Base salary, performance-based cash incentives and long-term equity incentives are the most significant elements of our executive compensation program and, on an aggregate basis, they are intended to substantially satisfy our program’s overall objectives. Typically the Compensation Committee has, and will seek to, set each of these elements of compensation at the same time to enable it to simultaneously consider all of the significant elements and their impact on compensation as a whole. Taking this comprehensive view of all compensation components allows the Compensation Committee to also make compensation determinations that reflect the principles of our compensation philosophy. We strive to achieve an appropriate mix between the various elements of our compensation program to meet our compensation objectives and philosophy; however, our Compensation Committee does not apply any rigid allocation formula in setting our executive compensation, and may make adjustments to this approach for various positions after giving due consideration to prevailing circumstances, internal pay equity, the individuals involved, and their responsibilities, experience and performance.
Base Salary—We provide base salary to our named executive officers to compensate them for services rendered on a day-to-day basis. Base salary also provides guaranteed cash compensation to secure the services of our executive talent. The base salaries of our named executive officers are primarily established based on the scope of their responsibilities, experience, performance, and contributions, and internal pay equity considerations, taking into account comparable company data provided by our compensation consultant and based upon our Compensation Committee’s understanding of compensation paid to similarly situated executives, adjusted as necessary to recruit or retain specific individuals. Our Compensation Committee intends to review the base salaries of our named executive officers annually and may also increase the base salary of a named executive officer at other times if a change in the scope of his responsibilities, such as a promotion, justifies such consideration.
We believe that providing a competitive base salary relative to the companies with which we compete for executive talent is a necessary element of a compensation program that is designed to attract and retain talented and experienced executives. We also believe that attractive base salaries can motivate and reward our executive officers for their overall performance. Accordingly, the compensation philosophy and approach of our Compensation Committee is to generally provide base salaries for each of our executive officers at or near the 50th percentile base salary amount of similarly situated executives at companies in the NAREIT survey. However, the Compensation Committee also considers other factors in setting base salaries, such as the responsibilities of the named executive officer and internal pay equity.
2017 Base Salaries—The annual base salaries for our named executive officers for the year ended December 31, 2017 were as follows. |
| |
Name | 2017 Base Salary ($)(1)
|
Jeffrey S. Edison | 412,000 |
R. Mark Addy | 225,000 |
Devin I. Murphy | 412,000 |
Robert F. Myers | 463,500 |
| |
(1)
| These amounts were paid by PELP prior to the closing of the PELP Transaction and by PECO following the closing of the PELP Transaction. |
2018 Base Salaries—Base salaries for our named executive officers for 2018 are set forth in the table below. As discussed above, 2018 base salaries were set based upon the Compensation Committee’s review of compensation data for similarly situated executives set forth in the NAREIT survey, the scope of the executive officer’s responsibilities and internal pay equity considerations. Messrs. Addy and Myers’ base salaries were each increased by 3% from 2017 levels. Mr. Edison received an increase in his base salary from $412,000 in 2017 to $800,000 in 2018 in order to align his base salary with approximately the 50th percentile of peer group companies in the NAREIT survey, and to compensate Mr. Edison for his greater day-to-day responsibilities as chief executive officer of an internally-managed REIT following the closing of the PELP transaction in October 2017. Mr. Murphy’s base salary was increased from $412,000 to $477,500 in order to incentivize Mr. Murphy’s day-to-day performance and to address considerations regarding internal pay equity. |
| |
Name | 2018 Base Salary ($) |
Jeffrey S. Edison | 800,000 |
R. Mark Addy | 231,750 |
Devin I. Murphy | 477,405 |
Robert F. Myers | 477,405 |
Performance-Based Cash Incentives
2017 Annual Incentives—Our Compensation Committee seeks to establish an appropriate mix of cash payments and equity awards to meet our short-term and long-term goals and objectives. Cash bonuses for 2017 performance were approved by the Compensation Committee in the first quarter of 2018 and the amounts of the cash bonuses reflect the Compensation Committee’s qualitative assessment of Company and individual performance for 2017. In addition, the Compensation Committee took into account the recommendations of the Chief Executive Officer for the other named executive officers. In determining the cash bonuses payable to the named executive officers for 2017, the Compensation Committee considered the following:
The successful completion of the PELP transaction in October and the significant efforts of the named executive officers in that transaction;
We exceeded budget and peer companies on key financial metrics for 2017, including Same-Center NOI, MFFO/share and AFFO/share;
We increased net asset value per share by 8% to $11.00 from $10.20; and
We achieved dividend to MFFO/share per share coverage of 101% in the fourth quarter of 2017.
The cash bonuses paid the named executive officers for 2017 performance are set forth in the “Bonus” column of the “2017 Summary Compensation Table” below.
2018 Annual Incentive Program—For 2018, the Compensation Committee, in consultation with FPL, approved the 2018 annual incentive program. For each of the named executive officers other than Mr. Addy, 80% of the 2018 annual cash incentive will be based upon achievement of a specified AFFO/share target and 20% of the annual cash incentive award will be based upon individual performance metrics. For Mr. Addy, 90% of his annual cash incentive will be based upon individual performance metrics and 10% will be based upon the specified AFFO/share target. The following table shows the target performance-based incentive award opportunity for each named executive officer for 2018: |
| |
Name | 2018
Target Award
Opportunity ($)
|
Jeffrey S. Edison | 1,000,000 |
R. Mark Addy | 800,000 |
Devin I. Murphy | 477,405 |
Robert F. Myers | 477,405 |
For the portion of the 2018 annual incentive award tied to AFFO/share, the named executive officers could receive from 0% up to 150% of the target award. If the AFFO/share target is achieved at the threshold level, the named executive officers will receive 50% of target for the portion of the award tied to AFFO/share, if the AFFO/share target is achieved at the target level, the named executive officers will receive 100% of the target award tied to AFFO/share and, if the AFFO/share target is achieved at the maximum level, the named executive officers will receive 150% of the target award tied to AFFO/share, with linear interpolation for AFFO/share between threshold and target and target and maximum levels. The named executive officers may not receive more than 150% of their target annual incentive bonus.
Equity Compensation—The Compensation Committee believes that a substantial portion of each named executive officer’s annual compensation should be in the form of long-term equity incentive awards. Long-term equity incentive awards encourage management to create stockholder value over the long term, because the value of the equity awards is directly attributable to changes in the price of our common stock over time. In addition, long-term equity incentive awards are an effective tool for management retention because full vesting of the awards generally requires continued employment for multiple years. Historically, long-term equity incentive awards were generally granted in the form of RMUs of PELP. Going forward, long-term equity awards will be in the form of RSUs or LTIP Units and will be comprised of 50% performance-based awards and 50% time-based awards as further described below under the heading “2018 Equity Awards.”
2017 PELP Equity Awards—For 2017, the named executive officers were awarded RMUs of PELP, which were canceled and converted into phantom units of PECO on a three-for-one basis upon the closing of the PELP Transaction. The phantom units
are tied to the value of PECO shares but are settled in cash upon vesting. The outstanding phantom units held by the named executive officers as of December 31, 2017 are set forth in the “Outstanding Equity Awards at 2017 Fiscal Year End Table” below.
2018 Equity Awards—In February 2018, the Compensation Committee approved the Long-Term Incentive Program (the “LTIP Program”), a multi-year long-term incentive program. The purpose of the LTIP Program is to further align the interests of our stockholders with that of management by encouraging our named executive officers to remain employed by us for the long term and to create stockholder value in a “pay for performance” structure. Pursuant to the LTIP Program, the named executive officers will be granted equity incentive awards in the form of RSUs or LTIP Units, 50% of which vest in equal annual installments over a four-year period, subject to the named executive officer’s continued employment through the relevant vesting date, and 50% (at target levels) of which vest based on the achievement of specified performance metrics over a three-year period.
New Long-Term Incentive Plan |
| | | |
Year 1 | Year 2 | Year 3 | Year 4 |
Performance Period | Vesting |
Time-Based Vesting |
Because 2018 represents a transition year for us as we evolve from our pre-PELP Transaction compensation structure to our post-PELP Transaction compensation structure, equity awards granted to our named executive officers in 2018 are comprised of awards subject to time-based vesting over four years, which represent the final grants made under our prior long-term incentive program and relate to performance in 2017, and the first tranche of performance-based awards under the LTIP Program. As previously discussed, for future years, we intend to grant our named executive officers equity incentive awards pursuant to the terms of the LTIP Program as described above. In March 2018, the named executive officers were granted equity awards with the grant date fair values set forth below.
|
| | | |
| Name | Grant Date Fair Value of Time-Based Equity Awards ($) | | Grant Date Fair Value of Performance-Based Equity Awards ($) |
| Jeffrey S. Edison | 3,029,690 | | 1,950,690 |
| R. Mark Addy | 200,000 | | 206,000 |
| Devin I. Murphy | 937,300 | | 875,243 |
| Robert F. Myers | 849,750 | | 875,243 |
For the performance-based equity awards, there are two separate, equally-weighted metrics: (1) three-year average Same-Center NOI growth measured against a peer group of nine public retail REITs and (2) three-year core funds from operations (“Core FFO”) per share growth measured against the same peer group of public retail REITs. At the end of the three-year performance period, 50% of the award earned based on achievement of the performance metrics vests and the remaining 50% of the earned award vests on the one-year anniversary of such date. The threshold, target and maximum levels for the performance-based equity awards are as follows: |
| | | | | |
Metric | Threshold
(0.25x Payout)
| | Target
(0.5x Payout)
| | Maximum
(1.0x Payout)
|
Three-Year Average Same-Center NOI Growth | 25th Percentile
of Peer Group
| | 50th Percentile
of Peer Group
| | 75th Percentile
of Peer Group
|
Three-Year Core FFO per Share Growth | 25th Percentile
of Peer Group
| | 50th Percentile
of Peer Group
| | 75th Percentile
of Peer Group
|
The number of performance-based RSUs and LTIP Units granted, and the corresponding grant date fair value set forth above, is based on the maximum number of performance-based RSUs and LTIP Units that may be earned and an assumed rate of dividends or distributions in respect of the RSUs and LTIP Units. In no event may the named executive officers earn more than 100% of the RSUs or LTIP Units granted. In addition, a net asset value (“NAV”) modifier shall be applied to the LTIP Awards if the growth in the Company’s NAV per share for the performance period is negative. Specifically, to the extent above target performance is achieved at the end of the performance period because our three-year average Same-Center NOI growth and/or three-year average Core FFO growth for the performance period exceeds the 50th percentile of our peer group, yet the Company’s NAV per share growth for that same performance period is negative, the amount of earned awards shall be capped at the target amount. The remaining amount of awards (the difference between those that would have otherwise been earned based on actual performance and the capped amount at target level) may become earned and thereafter vested if the Company’s NAV per share growth becomes positive at any point of time measured from the beginning of the performance period through up to five years following the completion of the performance period; otherwise, such shares shall be forfeited.
Employee Benefits—We believe that establishing competitive benefit packages for our employees is an important factor in attracting and retaining highly qualified personnel. Our executive officers are eligible to participate in all of our employee benefit plans, in each case on the same basis as other employees. We also provide contribution under our 401(k) savings plan to employees generally, including our named executive officers, up to the IRS limitations for contribution.
Perquisites and Other Personal Benefits—Our executive officers are eligible to participate in our excess liability insurance plan, an umbrella policy available to employees at the senior vice president level and above and in 2017 received a tax-gross up on the amount the Company paid for premiums for the excess benefit plan. In addition, certain of our named executive officers are eligible for tax and accounting services from our internal tax department.
Severance and Change in Control Arrangements—We have adopted an Executive Change in Control Severance Plan (the “Severance Plan”) that provides for specified payments and benefits in connection with a termination of employment by us not for Cause or Disability or a resignation by the named executive officer for Good Reason (as each such term is defined in the Severance Plan). Our goal in providing these severance and change in control payments and benefits is to offer sufficient cash continuity protection such that our named executive officers will focus their full time and attention on the requirements of the business rather than the potential implications for their respective positions. We prefer to have certainty regarding the potential severance amounts payable to the named executive officers, rather than negotiating severance at the time that a named executive officer’s employment terminates. We have also determined that accelerated vesting provisions with respect to outstanding equity awards in connection with a qualifying termination of employment are appropriate because they encourage our named executive officers to stay focused on the business in those circumstances rather than focusing on the potential implications for them personally. In order to receive the severance payments and benefits under the Severance Plan, the named executive officers must execute a general release of claims and comply with non-competition and non-solicitation provisions that apply for 24 months following termination of employment and confidentiality provisions that apply during and following termination of employment.
For a description of the Severance Plan see “Employment Arrangements” and “Potential Payments upon Termination or Change in Control” below.
Tax and Accounting Considerations—We have not provided or agreed to provide any of our executive officers or directors with a gross-up or other reimbursement for tax amounts they might pay pursuant to Section 4999 or Section 409A of the Code. Sections 280G and 4999 of the Code provide that executive officers, directors who hold significant stockholder interests and certain other service providers could be subject to significant additional taxes if they receive payments or benefits in connection with a change in control of our Company that exceed certain limits, and that we or our successor could lose a deduction on the amounts subject to the additional tax. Section 409A also imposes additional significant taxes on the individual in the event that an employee, director or service provider receives “deferred compensation” that does not meet the requirements of Section 409A.
The financial reporting and income tax consequences to the Company of the compensation components for executive officers are considered by the Compensation Committee in analyzing the level and mix of compensation. Section 162(m) of the Code prohibits publicly traded companies from taking a tax deduction for compensation in excess of $1 million paid to the chief executive officer or certain of its other most highly compensated executive officers who are “covered employees” under Section 162(m). In 2017, certain “performance-based compensation” was eligible for an exception to this $1 million cap. Beginning in 2018, recently-enacted tax legislation (1) expands the scope of Section 162(m) such that all named executive officers are “covered employees” and anyone who was a named executive officer in any year after 2016 will remain a covered employees for as long as he or she (or his or her beneficiaries) receive compensation from the Company and (2) eliminated the exception to the deduction limit for performance-based compensation. The Compensation Committee believes that stockholder interests are best served if the Compensation Committee retains maximum flexibility in designing executive compensation programs that meet stated business objectives. Accordingly, the Compensation Committee continues to evaluate the deductibility of executive compensation, while retaining the discretion it deems necessary to compensate the Company’s executive officers as it determines appropriate. However, because of our status as a REIT, the tax law changes under Section 162(m) may be of limited impact to the Company.
Compensation Committee Report
The Compensation Committee has reviewed and discussed with management the Compensation Discussion and Analysis required by Item 402(b) of Regulation S-K, and, based on such review and discussions, the Compensation Committee recommended to our Board of Directors that our Compensation Discussion and Analysis be included in this Proxy Statement.
Submitted by the Compensation Committee
Paul J. Massey, Jr. (Chair)
Leslie T. Chao
Stephen R. Quazzo
Gregory S. Wood
2017 Summary Compensation Table
The following table provides information regarding the compensation paid, earned, and received with respect to services to PECO by each of our named executive officers in 201 |
| | | | | | | | | |
| Name and Principal Position | Year | | Salary ($)(1) | | Bonus ($)(2) | | All Other Compensation ($) | | Total ($) |
| Jeffrey S. Edison | 2017 | | 412,000 | | 309,000 | | 37,254 (3) | | 758,254 |
| Chairman of the Board and Chief Executive Officer | | | | |
| R. Mark Addy | 2017 | | 225,000 | | 999,862 | | 170,695 (4) | | 1,395,557 |
| Executive Vice President | | | | |
| Devin I. Murphy | 2017 | | 412,000 | | 520,150 | | 12,660 (5) | | 944,810 |
| Chief Financial Officer | | | | |
| Robert F. Myers | 2017 | | 463,500 | | 556,200 | | 11,501 (6) | | 1,031,201 |
| Chief Operating Officer | | | | |
| |
(1)
| These amounts were paid by PELP prior to the closing of the PELP Transaction and by PECO following the closing of the PELP Transaction. |
| |
(2)
| The amounts reported in this column represent discretionary bonuses for performance in 2017 and were paid throughout 2017 and in the first quarter of 2018. |
| |
(3)
| The amount reported represents a Company contribution to the 401(k) plan of $8,100, tax and accounting services provided by our internal tax and accounting departments in the amount of $24,730, and Company paid premiums for excess liability insurance of $3,343 under an umbrella policy available to employees at the senior vice president level and above and a related tax gross-up of $1,081. |
| |
(4)
| The amount reported represents a Company contribution to the 401(k) plan of $8,100, distributions on Class B Units of PECO’s operating partnership in the amount of $160,916, and Company paid premiums for excess liability insurance of $1,283 under an umbrella policy available to employees at the senior vice president level and above and a related tax gross-up of $396. |
| |
(5)
| The amount reported represents a Company contribution to the 401(k) plan of $8,100, tax and accounting services provided by our internal tax and accounting departments in the amount of $1,000, and Company paid premiums for excess liability insurance of $2,599 under an umbrella policy available to employees at the senior vice president level and above and a related tax gross-up of $961. |
| |
(6)
| The amount reported represents a Company contribution to the 401(k) plan of $8,100 and Company paid premiums for excess liability insurance of $2,599 under an umbrella policy available to employees at the senior vice president level and above and a related tax gross-up of $802. |
2017 Grants of Plan-Based Awards Table
We did not make any grants of plan-based awards to our named executive officers for their services to PECO in 2017.
Outstanding Equity Awards at 2017 Fiscal Year End Table
The following table sets forth certain information regarding outstanding equity awards granted to our named executive officers that remain outstanding as of December 31, 2017. Except as otherwise noted in the footnotes to the table, the awards reported in the table below were granted as RMUs in PELP and were exchanged to phantom units in PECO upon the closing of the PELP Transaction as described above under the heading “Compensation Discussion & Analysis - Equity Compensation.”
|
| | | | | |
| | | | Stock Awards |
| Name | Grant Date (1) | | Number of Shares or Units of Stock That Have Not Vested (#) | | Market Value of Shares or Units of Stock That Have Not Vested ($) (2) |
| Jeffrey S. Edison | 1/1/2017 | | 297,000 | | 3,267,000 |
| | 1/1/2016 | | 224,550 | | 2,470,050 |
| R. Mark Addy | 1/1/2017 | | 5,454 | | 59,994 |
| | 1/1/2016 | | 4,500 | | 49,500 |
| | 2/27/2015 | | 6,384 (3) | | 70,224 |
| | 4/14/2014 | | 6,384 (4) | | 70,224 |
| | 1/1/2013 | | 6,384 (5) | | 70,224 |
| Devin I. Murphy | 1/1/2017 | | 109,200 | | 1,201,200 |
| | 1/1/2016 | | 85,500 | | 940,500 |
| | 2/27/2015 | | 121,278 (3) | | 1,334,058 |
| | 4/14/2014 | | 121,278 (4) | | 1,334,058 |
| Robert F. Myers | 12/31/2016 | | 81,675 | | 898,425 |
| | 12/31/2015 | | 62,430 | | 686,730 |
| | 2/27/2015 | | 101,682 (6) | | 1,118,502 |
| | 2/27/2015 | | 16,947 (7) | | 186,417 |
| | 4/14/2014 | | 101,682 (7) | | 1,118,502 |
| |
(1)
| Represents the date on which the original grant of RMUs of PELP was approved. Except as otherwise noted, all phantom units vest over four years from the grant date, with 25% of the phantom units vesting on each of the first four anniversaries of the grant date. The phantom units are settled in cash upon vesting. |
| |
(2)
| Based on a price per share of our common stock of $11.00 as of December 31, 2017. |
| |
(3)
| This award vests in full on January 1, 2020. |
| |
(4)
| This award vests in full on January 1, 2019. |
| |
(5)
| This award vests in full on January 1, 2018. |
| |
(6)
| This award vests in full on December 31, 2019. |
| |
(7)
| This award vests in full on December 31, 2018. |
2017 Option Exercises and Stock Vested Table
None of our named executive officers held or exercised any stock options during the year ended December 31, 2017. The following table shows the number of phantom units that vested and the value realized on vesting by each of our named executive officers during the year ended December 31, 2017. |
| | | |
| | Stock Awards |
| Name | Number of Units Acquired on Vesting (#) | | Value Realized on Vesting ($)(1) |
| Jeffrey S. Edison | 74,850 | | 686,125 |
| R. Mark Addy | 8,022 | | 73,535 |
| Devin I. Murphy | 28,500 | | 261,250 |
| Robert F. Myers | 155,421 | | 1,709,631 |
| |
(1)
| The value realized upon the vesting of phantom units is determined by multiplying the number of units that vested by the closing price of our common stock on the date of vesting. |
Pension Benefits
None of our named executive officers participates in or has account balances in qualified or non-qualified defined benefit plans sponsored by us.
Non-Qualified Deferred Compensation
None of our named executive officers participates in or has account balances in non-qualified defined contribution plans or other deferred compensation plans maintained by us.
Employment Arrangements with our Named Executive Officers
Executive Change in Control Severance Plan—In October 2017, we adopted the Severance Plan. Pursuant to the terms of the Severance Plan, in the event that a named executive officer’s employment is terminated by the Company or its affiliates not for Cause or Disability (each as defined in the Severance Plan) or the named executive officer resigns for Good Reason (as defined in the Severance Plan), then the named executive officer will be entitled to (1) a lump sum payment equal to the product of (i) 1.5 (or two in the case of Mr. Edison) and (ii) the sum of (A) the named executive officer’s base salary and (B) the named executive officer’s average annual cash performance bonus for the most recent three fiscal years (or such shorter period that the named executive officer was eligible to receive an annual cash performance bonus), (2) if the named executive officer elects to receive group health insurance under COBRA following the termination date, the Company will provide such coverage for 18 months (or 24 months in the case of Mr. Edison) following termination, provided that the named executive officer continues to pay the same amount of the monthly premium as in effect for the Company’s other executives and; provided, further, that if the named executive officer becomes employed by another employer during such periodStockholders, and is eligible to receive group health insurance under such other employer’s plans, the Company’s obligations will be reduced to the extent that comparable coverage is actually provided to the named executive officer and his covered dependents, and (3) (i) the named executive officer’s unvested time-base equity awards that would have otherwise vested during the 18 months (or 24 months in the case of Mr. Edison) following termination will vest on the termination date and be paid in full within 70 days of the date of termination and (ii) the named executive officer will remain eligible to vest and be paid on a pro-rata portion of performance-based equity awards based on actual performance at the end of the performance period, with pro-ration based on the period of time elapsed between the beginning of the performance period and the termination date as a percentage of the full performance period.hereby incorporated by reference into this Form 10-K.
In lieu of the benefits described in the preceding paragraph, in the event that a named executive officer’s employment is terminated by the Company or its affiliates not for Cause or Disability or the named executive officer resigns for Good Reason, in either case within two years following a Change in Control (as defined in the Severance Plan), then the named executive officer will be entitled to (1) a lump sum payment equal to the product of (i) two (or 2.5 in the case of Mr. Edison) and (ii) the sum of (A) the named executive officer’s base salary and (B) the named executive officer’s average annual cash performance bonus for the most recent three fiscal years (or such shorter period that the named executive officer was eligible to receive an annual cash performance bonus) and (2) if the named executive officer elects to receive group health insurance under COBRA following the termination date, the Company will provide such coverage for 24 months following termination (or 30 months following termination in the case of Mr. Edison), provided that the named executive officer continues to pay the same amount of the monthly premium as in effect for the Company’s other executives and; provided, further, that if the named executive officer becomes employed by another employer during such period and is eligible to receive group health insurance under such other employer’s plans, the Company’s obligations will be reduced to the extent that comparable coverage is actually provided to the named executive officer and his covered dependents. Upon the closing of the Change in Control, the Compensation Committee will determine the number of performance-based equity awards held by the named executive officer that will be considered earned under such awards based upon the Company’s performance by pro-rating the performance targets for the shortened performance period and then measuring such pro-rated targets against actual Company performance through the closing of the Change in Control. Any such earned awards will then be converted into time-based awards that will vest and be paid based on continued service through the end of the performance period that was applicable to such award prior to the Change in Control. The named executive officer’s unvested equity awards (including unvested time-based awards and earned but unvested performance-based awards) will vest as of the date of termination and be paid in full within 70 days of the date of termination.
If the named executive officer dies or if the Company and its affiliates terminate a named executive officer’s employment due to Disability, the named executive officer or his legal heirs will be entitled to (1) a pro-rated portion of his annual cash performance bonus for the year of termination if the Committee determines that performance is achieved, (2) accelerated vesting of unvested time-based equity awards that would have otherwise vested during the 18 months (or 24 months in the
case of Mr. Edison) following termination, and (3) the named executive officer will remain eligible to vest and be paid on a pro-rated portion of performance-based equity awards based on actual performance at the end of the performance period with pro-ration based on the period of time elapsed between the beginning of the performance period and the termination date as a percentage of the full performance period.
Receipt of the severance payments and benefits under the Severance Plan is subject to the execution and non-revocation of a release agreement by the named executive officer and compliance with non-competition and non-solicitation provisions that apply or 24 months following termination of employment and confidentiality provisions that apply during and following termination of employment.
Vesting Agreement with Devin Murphy—Also in October 2017, we entered into an agreement with Mr. Murphy regarding the vesting of his equity incentive awards (the “Vesting Agreement”). Pursuant to the Vesting Agreement, all time-based equity awards granted to Mr. Murphy will vest upon the earlier of the vesting date set forth in the applicable equity award agreement and the date Mr. Murphy reaches both (1) age 58 and (2) a combined age and continuous years of service with Phillips Edison & Company Ltd. (and any successor thereto) of 65 years (such date, the “Retirement Eligibility Date”). The Vesting Agreement further provides that, if Mr. Murphy’s employment terminates on or following the Retirement Eligibility Date, he will remain eligible to vest in any performance-based equity awards granted by the Company as follows: (1) if his retirement occurs before 50% of the performance period has elapsed, then he will vest in a pro-rated portion of any performance-based equity awards actually earned based on performance at the end of the performance period, with the pro-ration calculated based on the ratio of the number of days Mr. Murphy was employed during the performance period to the total number of days in the performance period and (2) if his retirement occurs after 50% or more performance period has elapsed, then Mr. Murphy will vest in any performance-based awards that are actually earned at the end of the performance period.
Estimated Payment and Benefits Upon Termination or Change of Control
The following table sets forth aggregate estimated payment obligations to each of the named executive officers assuming a termination of employment occurred on December 31, 2017: |
| | | | | | | |
| Name | Benefit | Termination not for Cause or Disability or Resignation for Good Reason ($) | | Termination not for Cause or Disability or Resignation for Good Reason within Two Years following a Change in Control ($) | | Termination Due to Death or Disability ($) | |
| Jeffrey S. Edison | Severance Pay | 1,432,334 | | 1,790,418 | | 309,000 | |
| | Health Care Benefits | 16,039 | | 20,048 | | 0 | |
| | Equity Award Acceleration | 3,280,200 | (1) | 5,737,050 | (1) | 3,280,200 | (1) |
| | Total | 4,728,573 | | 7,547,516 | | 3,589,200 | |
| R. Mark Addy | Severance Pay | 1,869,415 | | 2,492,553 | | 999,862 | |
| | Health Care Benefits | 19,696 | | 26,261 | | 0 | |
| | Equity Award Acceleration | 203,412 | (1) | 320,166 | (1) | 203,412 | (1) |
| | Total | 2,092,523 | | 2,838,980 | | 1,203,274 | |
| Devin I. Murphy | Severance Pay | 1,074,251 | | 1,432,334 | | 520,150 | |
| | Health Care Benefits | 19,696 | | 26,261 | | 0 | |
| | Equity Award Acceleration | 2,561,658 | (1) | 4,809,816 | (1) | 2,561,658 | (1) |
| | Total | 3,655,605 | | 6,268,411 | | 3,081,808 | |
| Robert F. Myers | Severance Pay | 1,276,500 | | 1,702,000 | | 556,200 | |
| | Health Care Benefits | 19,696 | | 26,261 | | 0 | |
| | Equity Award Acceleration | 1,947,726 | (1) | 4,008,543 | (1) | 1,947,726 | (1) |
| | Total | 3,243,922 | | 5,736,804 | | 2,503,926 | |
| |
(1)
| The amount represents the price of our common stock on the last business day of 2017 and the exercise price multiplied by the number of shares or units that would accelerate. |
CEO Pay Ratio
Pursuant to a mandate of the Dodd-Frank Act, the SEC adopted a rule requiring annual disclosure of the ratio of the median employee’s total annual compensation to the total annual compensation of the principal executive officer (“PEO”). The PEO of our Company is Jeffrey S. Edison.
We believe that our compensation philosophy must be consistent and internally equitable to motivate our employees to create shareholder value. The purpose of the new required disclosure is to provide a measure of pay equity within the organization. We are committed to internal pay equity, and our Compensation Committee monitors the relationship between the pay our PEO receives and the pay our non-executive employees receive.
As illustrated in the table below, our 2017 PEO to median employee pay ratio was approximately 9.1:1. |
| |
Jeffrey S. Edison (“PEO”) 2017 Compensation | $758,254 |
Median Employee 2017 Compensation | $83,122 |
Ratio of PEO to Median Employee Compensation | 9.1:1 |
We identified the median employee of all individuals who were employed by us on December 31, 2017, the last day of our fiscal year (whether employed on a full-time, part-time or seasonal basis). Employees on leave of absence were excluded from the list and reportable wages were annualized for those employees who were not employed for the full calendar year.
The pay ratio reported above is a reasonable estimate calculated in a manner consistent with SEC rules, based on our internal records and the methodology described above. The SEC rules for identifying the median compensated employee allow companies to adopt a variety of methodologies, to apply certain exclusions and to make reasonable estimates and assumptions that reflect their employee populations and compensation practices. Accordingly, the pay ratio reported by other companies may not be comparable to the pay ratio reported above, as other companies have different employee populations and compensation practices and may use different methodologies, exclusions, estimates and assumptions in calculating their own pay ratios.
Compensation Committee Interlocks and Insider Participation
During 2017, Messrs. Chao, Quazzo and Wood served as members of our Compensation Committee and Mr. Massey served as the Chair of our Compensation Committee. None of our executive officers serve as a member of a board of directors or compensation committee, or other committee serving an equivalent function, of any other entity that has one or more of its executive officers serving as a member of our Board of Directors or Compensation Committee.
ITEM 12. SECURITY OWNERSHIP OF CERTAIN BENEFICIAL OWNERS AND MANAGEMENT AND RELATED STOCKHOLDER MATTERS
The following table shows, as of March 15, 2018, the amount ofinformation required by this Item will be included in our common stock beneficially owned (unless otherwise indicated) by (1) any person who is known by usdefinitive proxy statement to be filed with the beneficial ownerSEC within 120 days after December 31, 2023 in connection with the Company's 2024 Annual Meeting of more than 5% of the outstanding shares of common stock, (2) our directorsStockholders, and director nominees, (3) our executive officers, and (4) all of our directors, director nominees, and executive officers as a group.is hereby incorporated by reference into this Form 10-K. |
| | | | | | | | | | |
Name and Address of Beneficial Owner (1) | Amount of Common Stock Beneficial Ownership(2) | | Amount of OP Unit Beneficial Ownership | | Total Beneficial Ownership | | Percentage |
| Jeffrey S. Edison | 343,175 |
| (3) | 21,896,687 |
| (4) | 22,239,862 |
| | * |
| Leslie T. Chao | 28,391 |
| | — |
| | 28,391 |
| | * |
| Paul J. Massey, Jr. | 6,193 |
| | — |
| | 6,193 |
| | * |
| Stephen R. Quazzo | 65,455 |
| | — |
| | 65,455 |
| | * |
| Gregory S. Wood | 613 |
| | — |
| | 613 |
| | * |
| R. Mark Addy | 15,822 |
| | 264,665 |
| (4) | 280,487 |
| | * |
| Devin I. Murphy | 31,331 |
| | 1,173,831 |
| (4) | 1,205,162 |
| | * |
| Robert F. Myers | 1,442 |
| | 79,144 |
| (4) | 80,586 |
| | * |
| All officers, directors, and director nominees as a group | 492,422 |
| | 23,414,327 |
| | 23,906,749 |
| | * |
| *Less than 1.0% | | | | | | | |
| |
(1)
| Address of each named beneficial owner is c/o Phillips Edison and Company, 11501 Northlake Drive, Cincinnati, Ohio 45249. |
| |
(2)
| None of the shares are pledged as security. |
| |
(3)
| PELP owns 176,509 shares of our common stock that were previously owned by Phillips Edison NTR LLC (“PE-NTR”), as well as an additional 55,556 shares of our common stock. Mr. Edison is the manager of the general partner of PELP, and therefore has voting and dispositive control of the shares held by it. |
| |
(4)
| Amount of beneficial ownership in OP units represents direct and indirect ownership held by these individuals or their affiliates. |
ITEM 13. CERTAIN RELATIONSHIPS AND RELATED TRANSACTIONS, AND DIRECTOR INDEPENDENCE
Director Independence
AlthoughThe information required by this Item will be included in our shares are not listed for trading on any national securities exchange, a majority of our directors, and all ofdefinitive proxy statement to be filed with the members of the Audit Committee and Conflicts Committee are “independent” under listing standards defined by the New York Stock Exchange (the “NYSE”). The NYSE standards provide that to qualify as an independent director, in addition to satisfying certain bright-line criteria, the Board must affirmatively determine that a director has no material relationship with us (either directly or as a partner, stockholder, or officer of an organization that has a relationship with us). The Board has determined that each of Leslie T. Chao, Paul J. Massey, Jr., Stephen R. Quazzo, and Gregory S. Wood is “independent” under listing standards defined by the NYSE.
Transactions with Related Persons
Our Corporate Governance Guidelines require our Conflicts Committee to review and approve all transactions involving our affiliates and us. Prior to entering into a transaction with an affiliate that is not covered by the terms of the agreements described below, a majority of the Conflicts Committee must conclude that the transaction is fair and reasonable to us and on terms and conditions not less favorable to us than those available from unaffiliated third parties. In addition, our Code of Ethics lists examples of types of transactions with affiliates that would create prohibited conflicts of interest. Under the Code of Ethics, our officers and directors are required to bring potential conflicts of interest to the attention of the Chairman of our Audit Committee promptly. There are currently no proposed material transactions with related persons other than those covered by the terms of the agreements described below.
Fee and Management Income from Advisory Agreements—Upon closing of the PELP transaction on October 4, 2017, we entered into advisory agreements under which we earn revenue for managing day-to-day activities and implementing the investment strategy for certain non-traded, publicly registered REITS and private funds (“Managed Funds”). Advisory agreements have a duration of one year and are renewed annually at the discretion of the respective boards of directors.
We earn an acquisition fee related to services provided to the Managed FundsSEC within 120 days after December 31, 2023 in connection with the selection and purchase or originationCompany's 2024 Annual Meeting of real estate and real estate-related investments. The acquisition fee earned from REIT II and REIT III is equal to 0.85% and 2.0%, respectively, of the cost of investments acquired or originated by us, including acquisition or origination expenses and any debt attributable to such investments. We earned acquisition fee income of $0.7 million for the year ended December 31, 2017.
In addition to acquisition fees, we are reimbursed by the Managed Funds for customary acquisition expenses, whether or not they ultimately acquire an asset. For the year ended December 31, 2017, we were reimbursed for acquisition expenses of $214,000.
Under the terms of our Advisory Agreements, we receive a monthly asset management and subordinated participation fee from the Managed Funds. The asset management and subordinated participation fee earned from REIT II is 0.85%Stockholders, and is paid 80% in cash and 20% in restricted operating partnership units designated as Class B Units of REIT II’s Operating Partnership. The asset management fee paidhereby incorporated by REIT III and other related parties is between 0.5% and 1.0% and is paid in cash. We earned asset management fees of $3.1 million for the year ended December 31, 2017.reference into this Form 10-K.
Fee and Management Income from Master Property Management and Master Services Agreements (“Management Agreements”)—Under our Management Agreements, we earn revenues for managing day-to-day activities at the properties of the Managed Funds. As property manager, we are to provide services including accounting, finance, and operations for which we receive a distinct fee based on a set percentage of gross cash receipts each month. Under the Management Agreements, we also serve as a leasing agent to the Managed Funds. For each new lease, lease renewal, and expansion, we receive a leasing commission. Leasing commissions are recognized as lease deals occur and are dependent on the terms of the lease. We assist in overseeing the construction of various improvements for Managed Funds, for which we receive a distinct fee based on a set percentage of total project cost calculated upon completion of construction. Because both parties in these contracts can cancel upon 30 days’ notice without penalties, their term is considered month-to-month.
Under the terms of our Management Agreements, we earned a monthly property management fee equal to 4% of the monthly cash receipts of the properties we managed for the Managed Funds. We may have hired, directed, or established policies for employees who had direct responsibility for the operations of each real property we managed, which may have included on-site managers and building and maintenance personnel. For the year ended December 31, 2017, we earned property management fees of $1.8 million.
We also earned leasing commissions and construction management fees from the Managed Funds in an amount that is usual and customary for comparable services rendered to properties in a similar geographic market. We earned leasing commissions in connection with a tenant’s exercise of an option to extend an existing lease. For the year ended December 31, 2017, we earned leasing commissions of $1.0 million and construction management fees of $0.4 million.
We were also reimbursed for costs and expenses incurred by us, including legal, travel, and other out-of-pocket expenses, that were directly related to the management of specific properties of the Managed Funds. For the year ended December 31, 2017, we received other fees and reimbursements of $0.6 million.
PE-NTR Fees and Expenditure Reimbursements—We entered into the PE-NTR Agreement in December 2014. Certain of our officers, Messrs. Edison, Addy, Murphy, and Myers served as officers of PE-NTR. Our former property manager, Phillips Edison & Company, Ltd., was wholly owned by Phillips Edison Limited Partnership, and Messrs. Edison, Murphy, and Myers held key positions at our property manager. On October 4, 2017, we completed a transaction to acquire certain real estate assets, the third-party investment management business, and the captive insurance company of PELP in a stock and cash transaction (“PELP transaction”). Upon closing of the transaction, the PE-NTR Agreement was terminated. As a result, we will no longer pay the fees listed below and had no outstanding unpaid amounts related to those fees as of December 31, 2017.
Pursuant to the PE-NTR Agreement, PE-NTR was entitled to specified fees for certain services, including managing our day-to-day activities and implementing our investment strategy. Reimbursable expenses under the Advisory Agreement were also reimbursed to PE-NTR.
We paid PE-NTR under the PE-NTR Agreement an acquisition fee related to services provided in connection with the selection and purchase or origination of real estate and real estate-related investments. The acquisition fee was up to 1% of the cost of investments acquired or originated by us, including acquisition or origination expenses and any debt attributable to such investments. We incurred acquisition fees, which were paid to PE-NTR and its affiliates, of approximately $1.3 million for the year ended December 31, 2017.
In addition to acquisition fees, we reimbursed PE-NTR under the PE-NTR Agreement for customary acquisition expenses, whether or not we ultimately acquired an asset. For the year ended December 31, 2017, we incurred acquisition expenses reimbursable to PE-NTR of approximately $0.6 million.
Pursuant to the second amended and restated agreement of limited partnership agreement of our operating partnership, as amended (the “Amended Partnership Agreement”), our operating partnership issued performance-based restricted units designated as “Class B units” to PE-NTR as partial compensation for asset management services. Our operating partnership issued approximately 291,000 Class B units to PE-NTR for the asset management services performed during 2017. In connection with the PELP transaction, Class B units were no longer issued for asset management services subsequent to September 2017. Upon closing of the transaction, all outstanding Class B units vested and were converted to OP units.
We incurred cash asset management fees, which were paid to PE-NTR, of approximately $12.6 million for the year ended December 31, 2017.
Property Manager Fees and Expenditure Reimbursements—All of our real properties were managed and leased by a property manager. The property manager also managed real properties acquired by REIT II, REIT III, and other related parties. Upon closing of the PELP transaction on October 4, 2017, our relationship with the property manager was acquired. As a result, we will no longer pay the fees listed below and had no outstanding unpaid amounts related to those fees as of December 31, 2017.
We paid the property manager monthly property management fees equal to 4% of the annualized gross revenues of the properties it managed. In addition to the property management fee, if the property manager provided leasing services with respect to a property, we paid the property manager leasing fees in an amount equal to the usual and customary leasing fees charged by unaffiliated persons rendering comparable services based on national market rates. We paid a leasing fee to the property manager in connection with a tenant’s exercise of an option to extend an existing lease, and the leasing fees payable to the property manager may have been increased by up to 50% in the event that the property manager engaged a co-broker to lease a particular vacancy. We reimbursed the costs and expenses incurred by the property manager on our behalf, including legal, travel, and other out-of-pocket expenses that were directly related to the management of specific properties, as well as fees and expenses of third-party accountants.
If we engaged the property manager to provide construction management services with respect to a particular property, we paid a construction management fee in an amount that is usual and customary for comparable services rendered to similar projects in the geographic market of the property.
Our property manager hired, directed, and established policies for employees who had direct responsibility for the operations of each real property it managed, which may have included, but was not limited to, on-site managers and building and maintenance personnel. Certain employees of the property manager may have been employed on a part-time basis and may also have been employed by PE-NTR or certain of its affiliates. The property manager also directed the purchase of equipment and supplies and supervised all maintenance activity.
For the year ended December 31, 2017, we incurred property management fees of approximately $8.4 million, leasing fees of approximately $6.7 million, and construction management fees of approximately $1.4 million due to the property manager. Additionally, the property manager incurred approximately $6.2 million of costs and expenses on our behalf for which the property manager was entitled to reimbursement during the year ended December 31, 2017. Of these costs and expenses, $0.4 million was attributable to travel-related expenses for business purposes on aircraft owned by a company in which Mr. Edison has a 50% ownership interest. The aircraft was utilized to provide timely and cost-effective travel alternatives in connection with company-related business activities at market rates.
ITEM 14. PRINCIPAL ACCOUNTANT FEES AND SERVICES
Independent Auditors
DuringThe information required by this Item will be included in our definitive proxy statement to be filed with the year endedSEC within 120 days after December 31, 2017, Deloitte & Touche LLP served as our independent auditor and provided certain domestic tax and other services. Deloitte & Touche LLP has served as our independent auditor since our formation in 2009. The Audit Committee intends to engage Deloitte & Touche LLP as our independent auditor to audit our consolidated financial statements for the year ending December 31, 2018. The Audit Committee may, however, select new auditors at any time in the future in its discretion if it deems such decision to be in our best interest. Any decision to select new auditors would be disclosed to our stockholders in accordance with applicable securities laws.
Preapproval Policies
The Audit Committee charter imposes a duty on the Audit Committee to preapprove all auditing services performed for us by our independent auditors, as well as all permitted nonaudit services (including the fees and terms thereof) in order to ensure that the provision of such services does not impair the auditors’ independence. Unless a type of service to be provided by the independent auditors has received “general” preapproval, it will require “specific” preapproval by the Audit Committee. Additionally, any proposed services exceeding “general” preapproved cost levels will require specific preapproval by the Audit Committee.
All requests or applications for services to be provided by the independent auditor that do not require specific preapproval by the Audit Committee will be submitted to management and must include a detailed description of the services to be rendered. Management will determine whether such services are included within the list of services that have received the general preapproval of the Audit Committee. The Audit Committee will be informed on a timely basis of any such services rendered by the independent auditors.
Requests or applications to provide services that require specific preapproval by the Audit Committee will be submitted to the Audit Committee by both the independent auditors and the chief financial officer, and must include a joint statement as to whether, in their view, the request or application is consistent with the SEC’s rules on auditor independence. The Chair of the Audit Committee has been delegated the authority to specifically preapprove all services not covered by the general preapproval guidelines. Amounts requiring preapproval in excess of the amount require specific preapproval by all members of the Audit Committee prior to engagement of our independent auditors. All amounts specifically preapproved by the Chair of
the Audit Committee in accordance with this policy are to be disclosed to the full Audit Committee at the next regularly scheduled meeting. All services rendered by Deloitte & Touche LLP for the year ended December 31, 2017 were preapproved in accordance with the policies and procedures described above.
Principal Auditor Fees
The aggregate fees billed to us for professional accounting services, including the audit of our annual consolidated financial statements by our principal auditor for the year ended December 31, 2017 and 2016, are set forth in the table below.
|
| | | | | | | | |
| | | 2017 | | 2016 |
| Audit fees | | $ | 1,024,740 |
| | $ | 613,800 |
|
| Audit-related fees | | 225,382 |
| | 19,000 |
|
| Tax fees | | 10,000 |
| | 3,895 |
|
| All other fees | | — |
| | — |
|
| Total fees | | $ | 1,260,122 |
| | $ | 636,695 |
|
For purposes of the preceding table, the principal auditor’s professional fees are classified as follows:
Audit fees—These are fees for professional services performed for the audit of our annual consolidated financial statements and the required review of quarterly consolidated financial statements and other procedures performed by the principal auditor in order for them to be able to form an opinion on our consolidated financial statements. These fees also cover services that are normally provided by independent auditors2023 in connection with statutorythe Company's 2024 Annual Meeting of Stockholders, and regulatory filings or engagements, including reviews of our consolidated financial statements included in the registration statements, as amended, related to our public offerings of common stock. Audit fees are presented for the period to which the audit work relates, regardless of whether the fees are actually billed during the period.
Audit-related fees—These are fees for assurance and related services that traditionally are performedis hereby incorporated by independent auditors that are reasonably related to the performance of the audit or review of the consolidated financial statements, such as due diligence related to acquisitions and dispositions, attestation services that are not required by statute or regulation, internal control reviews, and consultation concerning financial accounting and reporting standards.
Tax fees—These are fees for all professional services performed by professional staff in our independent auditor’s tax division, except those services related to the audit of our consolidated financial statements. These include fees for tax compliance, tax planning and tax advice, including federal, state, and local issues. Services also may include assistance with tax audits and appeals before the Internal Revenue Service and similar state and local agencies, as well as federal, state, and local tax issues related to due diligence. Tax fees are presented for the period in which the services were provided.
All other fees—These are fees for any services not included in the above-described categories.
reference into this Form 10-K. |
| | | | | | | | | | |
PHILLIPS EDISON & COMPANY DECEMBER 31, 2023 FORM 10-K | | | 48 |
ITEM 15. EXHIBITS AND FINANCIAL STATEMENT SCHEDULES
(a) Financial Statement Schedules
See the Index to Consolidated Financial Statements on page F-1 of this report.
| | | | | | | | |
| Ex. | Description | Reference |
| |
Ex. | Description |
| Contribution Agreement |
| | Form 8-K, filed May 23, 2017)2017, Exhibit 2.1 |
| 2.2 | Articles | Form 10-K, filed March 13, 2019, Exhibit 2.2 |
| | Form 10-Q, filed May 5, 2022, Exhibit 3.1 to the Company’s Current Report on |
| 3.2 | | Form 8-K, filed July 15, 2014)19, 2021, Exhibit 3.1 |
| 4.1 | |
| |
| Bylaws |
| |
|
| |
| |
| Restrictions on Transferability of Common Stock |
| | Form S-11, (No. 333-164313) filed March 1, 2010)2010, Exhibit 4.2 |
| Dividend Reinvestment Plan |
| | Form S-3, (No. 333-209506) filed February 12, 2016)October 31, 2019, Exhibit 4.7 |
| Share Repurchase Program |
| | Form 8-K, filed April 15, 2016)January 14, 2021, Exhibit 99.1 |
| Agreement of Limited Partnership of Operating Partnership |
| | Form 10-K, filed March 30, 2018, Exhibit 4.4 |
| 4.5 | Advisor Agreements | Form 10-K, filed March 12, 2021, Exhibit 4.5 |
| 4.6 | Letter Agreement withIndenture, dated as of October 6, 2021, by and among Phillips Edison NTR LLC dated September 20, 2017 (incorporated by reference toGrocery Center Operating Partnership I, L.P., as issuer, Phillips Edison & Company, Inc., as guarantor, and U.S. Bank National Association, as trustee | Form 8-K, filed October 6, 2021, Exhibit 10.2 to the Company’s Quarterly Report on Form 10-Q filed November 9, 2017)4.1 |
| 4.7 | Tax Protection AgreementFirst Supplemental Indenture, dated as of October 6, 2021, by and among Phillips Edison Grocery Center Operating Partnership I, L.P., as issuer, Phillips Edison & Company, Inc., as guarantor, and U.S. Bank National Association, as trustee | Form 8-K, filed October 6, 2021, Exhibit 4.2 |
| 10.1 | | Form 8-K, filed October 11, 2017)2017, Exhibit 10.2 |
| 10.2 | Equityholder | Form 8-K, filed July 19, 2021, Exhibit 10.1 |
| | Form 8-K, filed October 11, 2017)2017, Exhibit 10.3 |
| Property Management, Leasing and Construction Management Agreement |
| |
| Debt Agreements |
| Credit Agreement among Phillips Edison Grocery Center Operating Partnership I, L.P., the Company, the Lenders party thereto, PNC Bank, National Association as Administrative Agent, and Capital One National Association, Fifth Third Bank, and Regions Bank as Co-Syndication Agents dated September 16, 2016 (incorporated by reference to Exhibit 10.1 to the Company’s Quarterly Report on Form 10-Q filed November 3, 2016) |
| |
| |
| Credit Agreement among Phillips Edison Grocery Center Operating Partnership I, L.P., Phillips Edison Grocery Center REIT I,& Company, Inc., the Guarantors, the Lenderslenders party thereto, and KeyBankPNC Bank, National Association as Administrative Agent,administrative agent, dated October 4, 2017 (incorporated by reference toJuly 2, 2021 | Form 8-K, filed July 2, 2021, Exhibit 10.710.1 |
| 10.5 | |
| Credit Agreement among Phillips Edison Grocery Center Operating Partnership I, L.P., Phillips Edison Grocery Center REIT I,& Company, Inc., the Guarantors, the Lenders and Wells Fargo Bank, National Association, as Administrative Agent, dated October 4, 2017 (incorporated by reference to Exhibit 10.8 to the Company’s Quarterly Report on Form 10-Q filed November 9, 2017) |
| | Form 8-K, filed May 20, 2022, Exhibit 10.9 to the Company’s Quarterly Report on Form 10-Q filed November 9, 2017)10.1 |
| 10.6 | | Form 10-Q, filed November 9, 2017)2017, Exhibit 10.10 |
| | | | | | | | | | | |
PHILLIPS EDISON & COMPANY DECEMBER 31, 2023 FORM 10-K | | | 49 |
| | | | | | | | |
| Ex. | Description | Reference |
| 10.7 | | Form 10-Q, filed November 9, 2017)2017, Exhibit 10.11 |
| 10.8 | | Schedule 14A, filed April 7, 2020, Appendix A |
| 10.9 | | Schedule 14A, filed April 9, 2021, Appendix A |
| 10.10 | | Form S-11 (No. 333-164313)S-11/A, filed August 11, 2010)**2010, Exhibit 10.3 |
| 10.11 | |
| | Form 10-Q, filed November 9, 2017)** |
| 2017, Exhibit 10.14 |
| |
| 10.12 | |
| | Form S-11/A, filed July 7, 2021, Exhibit 10.13 to the Company’s Quarterly Report on Form 10-Q filed November 9, 2017)**10.19 |
| 10.13 | | Form 10-Q, filed November 9, 2017)**2017, Exhibit 10.15 |
| 10.14 | | Form 10-Q, filed November 9, 2017)**2017, Exhibit 10.16 |
| 10.15 | | Form 10-Q, filed November 9, 2017)**2017, Exhibit 10.17 |
| 10.16 | | Form 10-Q, filed November 9, 2017)**2017, Exhibit 10.18 |
| 10.17 | | Form 10-K, filed March 13, 2019, Exhibit 10.19 to the Company’s Quarterly Report on 10.23 |
| 10.18 | | Form 10-Q, filed November 9, 2017)**August 12, 2019, Exhibit 10.1 |
| 10.19 | | Form 10-K, filed March 13, 2019, Exhibit 10.26 |
| 10.20 | | Form 10-K, filed March 12, 2020, Exhibit 10.22 |
| 10.21 | | Form 10-K, filed March 13, 2019, Exhibit 10.27 |
| 10.22 | | Form 10-K, filed March 12, 2020, Exhibit 10.24 |
| 10.23 | | Form S-11/A, filed July 7, 2021, Exhibit 10.32 |
| 10.24 | | Form S-11/A, filed July 7, 2021, Exhibit 10.33 |
| 10.25 | | Form S-11/A, filed July 7, 2021, Exhibit 10.34 |
| 10.26 | | Form S-11/A, filed July 7, 2021, Exhibit 10.35 |
| 10.27 | | Form 8-K, filed March 4, 2022, Exhibit 10.1 |
| 10.28 | | Form 8-K, filed March 4, 2022, Exhibit 10.2 |
| 10.29 | | Form 8-K, filed March 4, 2022, Exhibit 10.3 |
| 10.30 |
| Form 8-K, filed March 4, 2022, Exhibit 10.4 |
| 10.31 | Second Amended and Restated Credit Agreement, dated as of July 31, 2023, among Phillips Edison Grocery Center Operating Partnership I, L.P., Phillips Edison & Company, Inc., the lenders party thereto, and Bank of America, N.A., as administrative agent
| Form 10-Q, filed August 2, 2023, Exhibit 10.1 |
| 10.32 | | Form 10-Q, filed August 2, 2023, Exhibit 10.2 |
| 10.33 | | Form 10-Q, filed August 2, 2023, Exhibit 10.3 |
| 21.1 | | |
| 22.1 | | |
| 23.1 | | |
| | |
| | | | | | | | | | | |
PHILLIPS EDISON & COMPANY DECEMBER 31, 2023 FORM 10-K | | | 50 |
| | | | | | | | |
| Ex. | Description | Reference |
| | |
| | |
| | |
| 97 | | |
| 101.1 | The following information from the Company’s annual report on Form 10-K for the year ended December 31, 2017,2023, formatted in XBRL (eXtensible Business Reporting Language): (i) Consolidated Balance Sheets; (ii) Consolidated Statements of Operations and Comprehensive Income (Loss);Income; (iii) Consolidated Statements of Equity; and (iv) Consolidated Statements of Cash Flows*Flows | |
| 101.INS | Inline XBRL Instance Document | |
| 101.SCH | Inline XBRL Taxonomy Extension Schema Document | |
| 101.CAL | Inline XBRL Taxonomy Extension Calculation Linkbase Document | |
| 101.DEF | Inline XBRL Taxonomy Extension Definition Linkbase Document | |
| 101.LAB | Inline XBRL Taxonomy Extension Label Linkbase Document | |
| 101.PRE | Inline XBRL Taxonomy Extension Presentation Linkbase Document | |
| 104 | Cover Page Interactive Data File (formatted as Inline XBRL and contained in Exhibit 101) | |
*Filed herewith. Management Contract or Compensatory Plan
**Compensation Plan or Benefit. Filed herewith
*** Furnished herewith
ITEM 16. FORM 10-K SUMMARY
Not applicable.
| | | | | | | | | | | |
PHILLIPS EDISON & COMPANY DECEMBER 31, 2023 FORM 10-K | | | 51 |
INDEX TO CONSOLIDATED FINANCIAL STATEMENTS
| | | | | | | | |
| Financial Statements | | Page |
| | |
Financial Statements | | Page |
| | |
| | |
| | |
| | |
| | |
| | |
| | |
| | |
| | |
| | |
| | |
| | |
| | |
| | |
*All schedules other than the one listed in the index have been omitted as the required information is either not applicable or the information is already presented in the consolidated financial statements or the related notes.
| | | | | | | | | | | |
*PHILLIPS EDISON & COMPANY DECEMBER 31, 2023 FORM 10-K | | All schedules other than the one listed in the index have been omitted as the required information is either not applicable or the information is already presented in the consolidated financial statements or the related notes. | F-1 |
REPORT OF INDEPENDENT REGISTERED PUBLIC ACCOUNTING FIRM
To the Stockholders and the Board of Directors and Stockholders of Phillips Edison & Company, Inc.
Opinion on the Financial Statements
We have audited the accompanying consolidated balance sheets of Phillips Edison & Company, Inc., (formerly known as Phillips Edison Grocery Center REIT I, Inc.), and subsidiaries (the "Company"“Company”) as of December 31, 20172023 and 2016,2022, the related consolidated statements of operations and comprehensive loss,income, equity, and cash flows, for each of the three years in the period ended December 31, 2017,2023, and the related notes and the consolidated financial statement schedule listed in the Index at Item 15 (collectively referred to as the "consolidated financial“financial statements”). In our opinion, the consolidated financial statements present fairly, in all material respects, the financial position of the Company as of December 31, 20172023 and 2016,2022, and the results of its operations and its cash flows for each of the three years in the period ended December 31, 2017,2023, in conformity with accounting principles generally accepted in the United States of America.
We have also audited, in accordance with the standards of the Public Company Accounting Oversight Board (United States) (PCAOB), the Company's internal control over financial reporting as of December 31, 2023, based on criteria established in Internal Control — Integrated Framework (2013) issued by the Committee of Sponsoring Organizations of the Treadway Commission and our report dated February 12, 2024, expressed an unqualified opinion on the Company's internal control over financial reporting.
Basis for Opinion
These consolidated financial statements are the responsibility of the Company's management. Our responsibility is to express an opinion on the Company's consolidated financial statements based on our audits. We are a public accounting firm registered with the Public Company Accounting Oversight Board (United States) (“PCAOB”)PCAOB and are required to be independent with respect to the Company in accordance with the U.S. federal securities laws and the applicable rules and regulations of the Securities and Exchange Commission and the PCAOB.
We conducted our audits in accordance with the standards of the PCAOB. Those standards require that we plan and perform the audit to obtain reasonable assurance about whether the consolidated financial statements are free of material misstatement, whether due to error or fraud. The Company is not required to have, nor were we engaged to perform, an audit of its internal control over financial reporting. As part of our audits, we are required to obtain an understanding of internal control over financial reporting but not for the purpose of expressing an opinion on the effectiveness of the Company’s internal control over financial reporting. Accordingly, we express no such opinion.
Our audits included performing procedures to assess the risks of material misstatement of the consolidated financial statements, whether due to error or fraud, and performing procedures that respond to those risks. Such procedures included examining, on a test basis, evidence regarding the amounts and disclosures in the consolidated financial statements. Our audits also included evaluating the accounting principles used and significant estimates made by management, as well as evaluating the overall presentation of the consolidated financial statements. We believe that our audits provide a reasonable basis for our opinion.
Critical Audit Matter
The critical audit matter communicated below is a matter arising from the current-period audit of the financial statements that was communicated or required to be communicated to the audit committee and that (1) relates to accounts or disclosures that are material to the financial statements and (2) involved our especially challenging, subjective, or complex judgments. The communication of critical audit matters does not alter in any way our opinion on the financial statements, taken as a whole, and we are not, by communicating the critical audit matter below, providing a separate opinion on the critical audit matter or on the accounts or disclosures to which it relates.
Allocation of Purchase Price for Investment in Real Estate Assets — Refer to Notes 2 and 4 to the financial statements
Critical Audit Matter Description
During the year ended December 31, 2023, the Company acquired eleven properties and three outparcels for an aggregate purchase price of $278 million. The Company accounted for the acquisitions as asset acquisitions. Accordingly, the purchase price paid for assets acquired and liabilities assumed was allocated, based on their relative fair values, to building and building improvements, land and land improvements, furniture, fixtures, and equipment, in-place leases, and other intangible assets and assumed liabilities. Estimates of fair values were based upon assumptions that the Company believes are similar to those used by independent appraisers. Valuation assumptions utilized include comparable sales transactions, costs to replace certain assets, market rents, discount rates, and terminal capitalization rates.
We identified the acquisitions as a critical audit matter because of the significant estimates management makes to determine the fair values of assets acquired and liabilities assumed. This required a high degree of auditor judgment and an increased extent of effort, including the need to involve our fair value specialists, when performing audit procedures to evaluate the reasonableness of management’s assumptions.
How the Critical Audit Matter Was Addressed in the Audit
Our audit procedures related to allocation of purchase price for investment in real estate assets included the following, among others:
•We tested the effectiveness of controls over the purchase price allocation, including management’s controls over the identification of real estate assets, and the valuation methodology for estimating the fair value of assets acquired and liabilities assumed.
•For each acquisition:
◦We obtained and evaluated the third-party purchase price allocation report, along with relevant supporting documentation, such as the executed purchase and sale agreement, property condition assessment, executed closing statement, and recorded journal entry in order to corroborate our understanding of the substance of the acquisition obtained through inquiry with the Company’s management, as well as assess the completeness of the assets acquired and liabilities assumed as part of the acquisition.
| | | | | | | | | | | |
| PHILLIPS EDISON & COMPANY DECEMBER 31, 2023 FORM 10-K | | | F-2 |
◦We tested the fair value estimates allocated to the assets acquired and liabilities assumed by comparing the estimates to average historical allocations determined by the Company to identify outliers for further investigation.
•With the assistance of our fair value specialists, for those acquisitions that we deemed to possess characteristics of additional audit interest, we:
◦Evaluated the reasonableness of the valuation and allocation methodology and related inputs, including comparable sales transactions, costs to replace certain assets, market rents, discount rates, and terminal capitalization rates.
◦Tested the mathematical accuracy of the calculations and compared the key inputs used in the projections to external market sources.
/s/ Deloitte & Touche LLP
Cincinnati, Ohio
March 29, 2018February 12, 2024
We have served as the Company's auditor since 2009.
| | | | | | | | | | | |
| PHILLIPS EDISON & COMPANY DECEMBER 31, 2023 FORM 10-K | | | F-3 |
PHILLIPS EDISON & COMPANY, INC.
CONSOLIDATED BALANCE SHEETS
AS OF DECEMBER 31, 20172023 AND 20162022
(In thousands, except per share amounts)
| | | | | | | | | | | |
| | 2023 | | 2022 |
| ASSETS | | | |
| Investment in real estate: | | | |
| Land and improvements | $ | 1,768,487 | | | $ | 1,674,133 | |
| Building and improvements | 3,818,184 | | | 3,572,146 | |
| In-place lease assets | 495,525 | | | 471,507 | |
| Above-market lease assets | 74,446 | | | 71,954 | |
| Total investment in real estate assets | 6,156,642 | | | 5,789,740 | |
| Accumulated depreciation and amortization | (1,540,551) | | | (1,316,743) | |
| Net investment in real estate assets | 4,616,091 | | | 4,472,997 | |
| Investment in unconsolidated joint ventures | 25,220 | | | 27,201 | |
| Total investment in real estate assets, net | 4,641,311 | | | 4,500,198 | |
| Cash and cash equivalents | 4,872 | | | 5,478 | |
| Restricted cash | 4,006 | | | 11,871 | |
| Goodwill | 29,066 | | | 29,066 | |
| Other assets, net | 186,411 | | | 188,879 | |
| Total assets | $ | 4,865,666 | | | $ | 4,735,492 | |
| LIABILITIES AND EQUITY | | | |
| Liabilities: | | | |
| Debt obligations, net | $ | 1,969,272 | | | $ | 1,896,594 | |
| Below-market lease liabilities, net | 108,223 | | | 109,799 | |
| Accounts payable and other liabilities | 116,461 | | | 113,185 | |
| Deferred income | 18,359 | | | 18,481 | |
| Total liabilities | 2,212,315 | | | 2,138,059 | |
| Commitments and contingencies (see Note 11) | — | | | — | |
| Equity: | | | |
| Preferred stock, $0.01 par value per share, 10,000 shares authorized, zero shares issued and outstanding at December 31, 2023 and 2022 | — | | | — | |
| Common stock, $0.01 par value per share, 1,000,000 shares authorized, 122,024 and 117,126 shares issued and outstanding at December 31, 2023 and 2022, respectively | 1,220 | | | 1,171 | |
| Additional paid-in capital (“APIC”) | 3,546,838 | | | 3,383,978 | |
| Accumulated other comprehensive income (“AOCI”) | 10,523 | | | 21,003 | |
| Accumulated deficit | (1,248,273) | | | (1,169,665) | |
| Total stockholders’ equity | 2,310,308 | | | 2,236,487 | |
| Noncontrolling interests | 343,043 | | | 360,946 | |
| Total equity | 2,653,351 | | | 2,597,433 | |
| Total liabilities and equity | $ | 4,865,666 | | | $ | 4,735,492 | |
|
| | | | | | | |
| | 2017 | | 2016 |
| ASSETS | | | |
| Investment in real estate: | | | |
| Land and improvements | $ | 1,121,590 |
| | $ | 796,192 |
|
| Building and improvements | 2,263,381 |
| | 1,532,888 |
|
| Acquired in-place lease assets | 313,432 |
| | 212,916 |
|
| Acquired above-market lease assets | 53,524 |
| | 42,009 |
|
| Total investment in real estate assets | 3,751,927 |
| | 2,584,005 |
|
| Accumulated depreciation and amortization | (462,025 | ) | | (334,348 | ) |
| Total investment in real estate assets, net | 3,289,902 |
| | 2,249,657 |
|
| Cash and cash equivalents | 5,716 |
| | 8,224 |
|
| Restricted cash | 21,729 |
| | 41,722 |
|
| Accounts receivable – affiliates | 6,102 |
| | — |
|
| Corporate intangible assets, net | 55,100 |
| | — |
|
| Goodwill | 29,085 |
| | — |
|
| Other assets, net | 118,448 |
| | 80,585 |
|
| Total assets | $ | 3,526,082 |
| | $ | 2,380,188 |
|
| LIABILITIES AND EQUITY | |
| | |
|
| Liabilities: | |
| | |
|
| Debt obligations, net | $ | 1,806,998 |
| | $ | 1,056,156 |
|
| Acquired below-market lease intangibles, net | 90,624 |
| | 43,032 |
|
| Accounts payable – affiliates | 1,359 |
| | 4,571 |
|
| Accounts payable and other liabilities | 148,419 |
| | 51,642 |
|
| Total liabilities | 2,047,400 |
| | 1,155,401 |
|
| Commitments and contingencies (Note 10) | — |
| | — |
|
| Equity: | |
| | |
|
| Preferred stock, $0.01 par value per share, 10,000 shares authorized, zero shares issued and | | | |
| outstanding at December 31, 2017 and 2016 | — |
| | — |
|
| Common stock, $0.01 par value per share, 1,000,000 shares authorized, 185,233 and 185,062 shares | | | |
| issued and outstanding at December 31, 2017 and 2016, respectively | 1,852 |
| | 1,851 |
|
| Additional paid-in capital | 1,629,130 |
| | 1,627,098 |
|
| Accumulated other comprehensive income | 16,496 |
| | 10,587 |
|
| Accumulated deficit | (601,238 | ) | | (438,155 | ) |
| Total stockholders’ equity | 1,046,240 |
| | 1,201,381 |
|
| Noncontrolling interests | 432,442 |
| | 23,406 |
|
| Total equity | 1,478,682 |
| | 1,224,787 |
|
| Total liabilities and equity | $ | 3,526,082 |
| | $ | 2,380,188 |
|
See notes to consolidated financial statements.
| | | | | | | | | | | |
| PHILLIPS EDISON & COMPANY DECEMBER 31, 2023 FORM 10-K | | | F-4 |
PHILLIPS EDISON & COMPANY, INC.
CONSOLIDATED STATEMENTS OF OPERATIONS AND COMPREHENSIVE (LOSS) INCOME
FOR THE YEARS ENDED DECEMBER 31, 2017, 2016,2023, 2022, AND 20152021
(In thousands, except per share amounts)
| | | | | | | | | | | | | | | | | |
| | 2023 | | 2022 | | 2021 |
| Revenues: | | | | | |
| Rental income | $ | 597,501 | | | $ | 560,538 | | | $ | 519,495 | |
| Fees and management income | 9,646 | | | 11,541 | | | 10,335 | |
| Other property income | 2,977 | | | 3,293 | | | 3,016 | |
| Total revenues | 610,124 | | | 575,372 | | | 532,846 | |
| Operating Expenses: | | | | | |
| Property operating | 102,303 | | | 95,359 | | | 92,914 | |
| Real estate taxes | 72,816 | | | 67,864 | | | 65,381 | |
| General and administrative | 44,366 | | | 45,235 | | | 48,820 | |
| Depreciation and amortization | 236,443 | | | 236,224 | | | 221,433 | |
| Impairment of real estate assets | — | | | 322 | | | 6,754 | |
| Total operating expenses | 455,928 | | | 445,004 | | | 435,302 | |
| Other: | | | | | |
| Interest expense, net | (84,232) | | | (71,196) | | | (76,371) | |
| Gain on disposal of property, net | 1,110 | | | 7,517 | | | 30,421 | |
| Other expense, net | (7,312) | | | (12,160) | | | (34,361) | |
| Net income | 63,762 | | | 54,529 | | | 17,233 | |
| Net income attributable to noncontrolling interests | (6,914) | | | (6,206) | | | (2,112) | |
| Net income attributable to stockholders | $ | 56,848 | | | $ | 48,323 | | | $ | 15,121 | |
| Earnings per share of common stock: | | | | | |
| Net income per share attributable to stockholders - basic and diluted (see Note 14) | $ | 0.48 | | | $ | 0.42 | | | $ | 0.15 | |
| | | | | |
| Comprehensive income: | | | | | |
| Net income | $ | 63,762 | | | $ | 54,529 | | | $ | 17,233 | |
| Other comprehensive (loss) income: | | | | | |
| Change in unrealized value on interest rate swaps | (11,816) | | | 51,285 | | | 32,000 | |
| Comprehensive income | 51,946 | | | 105,814 | | | 49,233 | |
| Net income attributable to noncontrolling interests | (6,914) | | | (6,206) | | | (2,112) | |
| Change in unrealized value on interest rate swaps attributable to noncontrolling interests | 1,265 | | | (5,736) | | | (4,500) | |
| Reallocation of comprehensive income (loss) upon conversion of noncontrolling interests | 71 | | | 273 | | | (13) | |
| Comprehensive income attributable to stockholders | $ | 46,368 | | | $ | 94,145 | | | $ | 42,608 | |
|
| | | | | | | | | | | |
| | 2017 | | 2016 | | 2015 |
| Revenues: | | | | | |
| Rental income | $ | 228,201 |
| | $ | 193,561 |
| | $ | 182,064 |
|
| Tenant recovery income | 73,700 |
| | 63,131 |
| | 58,675 |
|
| Other property income | 1,486 |
| | 1,038 |
| | 1,360 |
|
| Fees and management income | 8,156 |
| | — |
| | — |
|
| Total revenues | 311,543 |
| | 257,730 |
| | 242,099 |
|
| Expenses: | |
| | |
| | |
|
| Property operating | 53,824 |
| | 41,890 |
| | 38,399 |
|
| Real estate taxes | 43,456 |
| | 36,627 |
| | 35,285 |
|
| General and administrative | 36,348 |
| | 31,804 |
| | 15,829 |
|
| Vesting of Class B units | 24,037 |
| | — |
| | — |
|
| Termination of affiliate arrangements | 5,454 |
| | — |
| | — |
|
| Acquisition expenses | 530 |
| | 5,803 |
| | 5,404 |
|
| Depreciation and amortization | 130,671 |
| | 106,095 |
| | 101,479 |
|
| Total expenses | 294,320 |
| | 222,219 |
| | 196,396 |
|
| Other: | |
| | |
| | |
|
| Interest expense, net | (45,661 | ) | | (32,458 | ) | | (32,390 | ) |
| Transaction expenses | (15,713 | ) | | — |
| | — |
|
| Other income, net | 2,433 |
| | 5,990 |
| | 248 |
|
| Net (loss) income | (41,718 | ) |
| 9,043 |
|
| 13,561 |
|
| Net loss (income) attributable to noncontrolling interests | 3,327 |
| | (111 | ) | | (201 | ) |
| Net (loss) income attributable to stockholders | $ | (38,391 | ) | | $ | 8,932 |
| | $ | 13,360 |
|
| Earnings per common share: | |
| | | | |
| Net (loss) income per share attributable to stockholders - basic and diluted | $ | (0.21 | ) | | $ | 0.05 |
| | $ | 0.07 |
|
| Weighted-average common shares outstanding: | | | | | |
| Basic | 183,784 |
| | 183,876 |
| | 183,678 |
|
| Diluted | 196,497 |
| | 186,665 |
| | 186,394 |
|
| | | | | | |
| Comprehensive (loss) income: | | | | | |
| Net (loss) income | $ | (41,718 | ) | | $ | 9,043 |
| | $ | 13,561 |
|
| Other comprehensive (loss) income: | | | | | |
| Change in unrealized gain on interest rate swaps | 4,580 |
| | 10,565 |
| | 22 |
|
| Comprehensive (loss) income | (37,138 | ) | | 19,608 |
| | 13,583 |
|
| Comprehensive loss (income) attributable to noncontrolling interests | 3,327 |
| | (111 | ) | | (201 | ) |
| Comprehensive (loss) income attributable to stockholders | $ | (33,811 | ) | | $ | 19,497 |
| | $ | 13,382 |
|
See notes to consolidated financial statements.
| | | | | | | | | | | |
| PHILLIPS EDISON & COMPANY DECEMBER 31, 2023 FORM 10-K | | | F-5 |
PHILLIPS EDISON & COMPANY, INC.
CONSOLIDATED STATEMENTS OF EQUITY
FOR THE YEARS ENDED DECEMBER 31, 2017, 2016,2023, 2022, AND 20152021
(In thousands, except per share amounts)
|
| | | | | | | | | | | | | | | | | | | | | | | | | | | | | | |
| | Common Stock | | Additional Paid-In Capital | | Accumulated Other Comprehensive Income | | Accumulated Deficit | | Total Stockholders’ Equity | | Non-controlling Interest | | Total Equity |
| | Shares | | Amount | | | | | | |
| Balance at January 1, 2015 | 182,131 |
| | $ | 1,820 |
| | $ | 1,567,653 |
| | $ | — |
| | $ | (213,975 | ) | | $ | 1,355,498 |
| | $ | 22,764 |
| | $ | 1,378,262 |
|
| Share repurchases | (7,386 | ) | | (73 | ) | | (72,727 | ) | | — |
| | — |
| | (72,800 | ) | | — |
| | (72,800 | ) |
| Change in redeemable common stock | — |
| | — |
| | 29,878 |
| | — |
| | — |
| | 29,878 |
| | — |
| | 29,878 |
|
| Dividend reinvestment plan (“DRIP”) | 6,563 |
| | 66 |
| | 63,737 |
| | — |
| | — |
| | 63,803 |
| | — |
| | 63,803 |
|
Change in unrealized gain on interest
rate swaps | — |
| | — |
| | — |
| | 22 |
| | — |
| | 22 |
| | — |
| | 22 |
|
Common distributions declared, $0.67 per share | — |
| | — |
| | — |
| | — |
| | (123,146 | ) | | (123,146 | ) | | — |
| | (123,146 | ) |
Issuance of partnership units for asset management services | — |
| | — |
| | — |
| | — |
| | — |
| | — |
| | 4,047 |
| | 4,047 |
|
| Distributions to noncontrolling interests | — |
| | — |
| | — |
| | — |
| | — |
| | — |
| | (1,835 | ) | | (1,835 | ) |
| Net income | — |
| | — |
| | — |
| | — |
| | 13,360 |
| | 13,360 |
| | 201 |
| | 13,561 |
|
| Balance at December 31, 2015 | 181,308 |
| | 1,813 |
| | 1,588,541 |
| | 22 |
| | (323,761 | ) | | 1,266,615 |
| | 25,177 |
| | 1,291,792 |
|
| Share repurchases | (2,019 | ) | | (20 | ) | | (20,281 | ) | | — |
| | — |
| | (20,301 | ) | | — |
| | (20,301 | ) |
| DRIP | 5,773 |
| | 58 |
| | 58,814 |
| | — |
| | — |
| | 58,872 |
| | — |
| | 58,872 |
|
Change in unrealized gain on interest rate swaps | — |
| | — |
| | — |
| | 10,565 |
| | — |
| | 10,565 |
| | — |
| | 10,565 |
|
Common distributions declared, $0.67
per share | — |
| | — |
| | — |
| | — |
| | (123,326 | ) | | (123,326 | ) | | — |
| | (123,326 | ) |
| Distributions to noncontrolling interests | — |
| | — |
| | — |
| | — |
| | — |
| | — |
| | (1,882 | ) | | (1,882 | ) |
| Share-based compensation | — |
| | — |
| | 24 |
| | — |
| | — |
| | 24 |
| | — |
| | 24 |
|
| Net income | — |
| | — |
| | — |
| | — |
| | 8,932 |
| | 8,932 |
| | 111 |
| | 9,043 |
|
| Balance at December 31, 2016 | 185,062 |
| | 1,851 |
| | 1,627,098 |
| | 10,587 |
| | (438,155 | ) | | 1,201,381 |
| | 23,406 |
| | 1,224,787 |
|
Adoption of new accounting pronouncement (see Note 8) | — |
| | — |
| | — |
| | 1,329 |
| | (1,329 | ) | | — |
| | — |
| | — |
|
| Balance at January 1, 2017, as adjusted | 185,062 |
|
| 1,851 |
|
| 1,627,098 |
|
| 11,916 |
|
| (439,484 | ) | | 1,201,381 |
| | 23,406 |
| | 1,224,787 |
|
| Share repurchases | (4,617 | ) | | (46 | ) | | (47,111 | ) | | — |
| | — |
| | (47,157 | ) | | — |
| | (47,157 | ) |
| DRIP | 4,785 |
| | 47 |
| | 49,079 |
| | — |
| | — |
| | 49,126 |
| | — |
| | 49,126 |
|
Change in unrealized gain on interest
rate swaps | — |
| | — |
| | — |
| | 4,580 |
| | — |
| | 4,580 |
| | — |
| | 4,580 |
|
Common distributions declared, $0.67 per share | — |
| | — |
| | — |
| | — |
| | (123,363 | ) | | (123,363 | ) | | — |
| | (123,363 | ) |
| Distributions to noncontrolling interests | — |
| | — |
| | — |
| | — |
| | — |
| | — |
| | (9,125 | ) | | (9,125 | ) |
| Reclassification of affiliate distributions | — |
| | — |
| | — |
| | — |
| | — |
| | — |
| | (3,610 | ) | | (3,610 | ) |
| Share-based compensation | 3 |
| | — |
| | 64 |
| | — |
| | — |
| | 64 |
| | — |
| | 64 |
|
| Redemption of noncontrolling interest | — |
| | — |
| | — |
| | — |
| | — |
| | — |
| | (4,179 | ) | | (4,179 | ) |
Issuance of partnership units for asset management services | — |
| | — |
| | — |
| | — |
| | — |
| | — |
| | 27,647 |
| | 27,647 |
|
Issuance of partnership units in the PELP transaction | — |
| | — |
| | — |
| | — |
| | — |
| | — |
| | 401,630 |
| | 401,630 |
|
| Net loss | — |
| | — |
| | — |
| | — |
| | (38,391 | ) | | (38,391 | ) | | (3,327 | ) | | (41,718 | ) |
| Balance at December 31, 2017 | 185,233 |
| | $ | 1,852 |
| | $ | 1,629,130 |
| | $ | 16,496 |
| | $ | (601,238 | ) | | $ | 1,046,240 |
| | $ | 432,442 |
| | $ | 1,478,682 |
|
| | | | | | | | | | | | | | | | | | | | | | | | | | | | | | | | | | | | | | | | | | | | | | | | | | | | | | | | | | | |
| | Common Stock | | Class B Common Stock | | APIC | | AOCI | | Accumulated Deficit | | Total Stockholders’ Equity | | Noncontrolling Interests | | Total Equity |
| | Shares | | Amount | | Shares | | Amount | | | | | | |
| Balance at January 1, 2021 | — | | | $ | — | | | 93,279 | | | $ | 2,798 | | | $ | 2,739,358 | | | $ | (52,306) | | | $ | (999,491) | | | $ | 1,690,359 | | | $ | 325,570 | | | $ | 2,015,929 | |
| Issuance of common stock | 19,550 | | | 196 | | | — | | | — | | | 547,205 | | | — | | | — | | | 547,401 | | | — | | | 547,401 | |
| Offering costs, discounts, and commissions | — | | | — | | | — | | | — | | | (39,048) | | | — | | | — | | | (39,048) | | | — | | | (39,048) | |
| Dividend reinvestment plan (“DRIP”) | — | | | — | | | 280 | | | 8 | | | 7,360 | | | — | | | — | | | 7,368 | | | — | | | 7,368 | |
| Share repurchases | — | | | — | | | (24) | | | — | | | (123) | | | — | | | — | | | (123) | | | — | | | (123) | |
| Change in unrealized value on interest rate swaps | — | | | — | | | — | | | — | | | — | | | 27,500 | | | — | | | 27,500 | | | 4,500 | | | 32,000 | |
| Common distributions declared, $1.035 per share | — | | | — | | | — | | | — | | | — | | | — | | | (106,467) | | | (106,467) | | | — | | | (106,467) | |
| Distributions to noncontrolling interests | — | | | — | | | — | | | — | | | — | | | — | | | — | | | — | | | (14,332) | | | (14,332) | |
| Share-based compensation | — | | | — | | | 102 | | | 1 | | | 6,753 | | | — | | | — | | | 6,754 | | | 9,640 | | | 16,394 | |
| Conversion of noncontrolling interests | — | | | — | | | 28 | | | — | | | 691 | | | (13) | | | — | | | 678 | | | (678) | | | — | |
| Impact of reverse stock split | — | | | — | | | — | | | (1,871) | | | 1,871 | | | — | | | — | | | — | | | — | | | — | |
| Other | — | | | — | | | — | | | — | | | (29) | | | — | | | — | | | (29) | | | — | | | (29) | |
| Net income | — | | | — | | | — | | | — | | | — | | | — | | | 15,121 | | | 15,121 | | | 2,112 | | | 17,233 | |
| Balance at December 31, 2021 | 19,550 | | | 196 | | | 93,665 | | | 936 | | | 3,264,038 | | | (24,819) | | | (1,090,837) | | | 2,149,514 | | | 326,812 | | | 2,476,326 | |
| Conversion of Class B common stock | 93,665 | | | 936 | | | (93,665) | | | (936) | | | — | | | — | | | — | | | — | | | — | | | — | |
| Issuance of common stock | 2,633 | | | 26 | | | — | | | — | | | 90,098 | | | — | | | — | | | 90,124 | | | — | | | 90,124 | |
| Offering costs, discounts, and commissions | — | | | — | | | — | | | — | | | (1,090) | | | — | | | — | | | (1,090) | | | — | | | (1,090) | |
| Change in unrealized value on interest rate swaps | — | | | — | | | — | | | — | | | — | | | 45,549 | | | — | | | 45,549 | | | 5,736 | | | 51,285 | |
Common distributions declared, $1.0932 per share | — | | | — | | | — | | | — | | | — | | | — | | | (127,151) | | | (127,151) | | | — | | | (127,151) | |
| Distributions to noncontrolling interests | — | | | — | | | — | | | — | | | — | | | — | | | — | | | — | | | (16,241) | | | (16,241) | |
| Share-based compensation | 109 | | | 1 | | | — | | | — | | | 5,528 | | | — | | | — | | | 5,529 | | | 9,877 | | | 15,406 | |
| Conversion of noncontrolling interests | 1,169 | | | 12 | | | — | | | — | | | 25,404 | | | 273 | | | — | | | 25,689 | | | (25,689) | | | — | |
| Settlement of earn-out liability | — | | | — | | | — | | | — | | | — | | | — | | | — | | | — | | | 54,245 | | | 54,245 | |
| Net income | — | | | — | | | — | | | — | | | — | | | — | | | 48,323 | | | 48,323 | | | 6,206 | | | 54,529 | |
| Balance at December 31, 2022 | 117,126 | | | 1,171 | | | — | | | — | | | 3,383,978 | | | 21,003 | | | (1,169,665) | | | 2,236,487 | | | 360,946 | | | 2,597,433 | |
| Issuance of common stock | 4,170 | | | 42 | | | — | | | — | | | 150,793 | | | — | | | — | | | 150,835 | | | — | | | 150,835 | |
| Offering costs, discounts, and commissions | — | | | — | | | — | | | — | | | (1,939) | | | — | | | — | | | (1,939) | | | — | | | (1,939) | |
| Change in unrealized value on interest rate swaps | — | | | — | | | — | | | — | | | — | | | (10,551) | | | — | | | (10,551) | | | (1,265) | | | (11,816) | |
| Common distributions declared, $1.1364 per share | — | | | — | | | — | | | — | | | — | | | — | | | (135,456) | | | (135,456) | | | — | | | (135,456) | |
| Distributions to noncontrolling interests | — | | | — | | | — | | | — | | | — | | | — | | | — | | | — | | | (16,334) | | | (16,334) | |
| Share-based compensation | 211 | | | 2 | | | — | | | — | | | 1,164 | | | — | | | — | | | 1,166 | | | 5,700 | | | 6,866 | |
| Conversion of noncontrolling interests | 517 | | | 5 | | | — | | | — | | | 12,842 | | | 71 | | | — | | | 12,918 | | | (12,918) | | | — | |
| Net income | — | | | — | | | — | | | — | | | — | | | — | | | 56,848 | | | 56,848 | | | 6,914 | | | 63,762 | |
| Balance at December 31, 2023 | 122,024 | | | $ | 1,220 | | | — | | | $ | — | | | $ | 3,546,838 | | | $ | 10,523 | | | $ | (1,248,273) | | | $ | 2,310,308 | | | $ | 343,043 | | | $ | 2,653,351 | |
See notes to consolidated financial statements.
| | | | | | | | | | | |
| PHILLIPS EDISON & COMPANY DECEMBER 31, 2023 FORM 10-K | | | F-6 |
PHILLIPS EDISON & COMPANY, INC.
CONSOLIDATED STATEMENTS OF CASH FLOWS
FOR THE YEARS ENDED DECEMBER 31, 2017, 20162023, 2022, AND 20152021
(In thousands)
| | | | | | | | | | | | | | | | | |
| | 2023 | | 2022 | | 2021 |
| CASH FLOWS FROM OPERATING ACTIVITIES: | | | | | |
| Net income | $ | 63,762 | | | $ | 54,529 | | | $ | 17,233 | |
| Adjustments to reconcile net income to net cash provided by operating activities: | | | | | |
| Depreciation and amortization of real estate assets | 234,260 | | | 232,571 | | | 217,564 | |
| Impairment of real estate assets | — | | | 322 | | | 6,754 | |
| Depreciation and amortization of corporate assets | 2,183 | | | 3,653 | | | 3,869 | |
| Net amortization of above- and below-market leases | (5,178) | | | (4,324) | | | (3,581) | |
| Amortization of deferred financing expenses | 4,237 | | | 3,410 | | | 4,416 | |
| Amortization of debt and derivative adjustments | 2,884 | | | 2,473 | | | 1,846 | |
| Loss (gain) on extinguishment or modification of debt, net | 368 | | | (95) | | | 1,996 | |
| Gain on disposal of property, net | (1,110) | | | (7,517) | | | (30,421) | |
| Impairment of investment in third parties | 3,000 | | | — | | | — | |
| Change in fair value of earn-out liability | — | | | 1,809 | | | 30,436 | |
| Straight-line rent | (10,145) | | | (12,301) | | | (9,427) | |
| Share-based compensation | 6,866 | | | 15,406 | | | 16,394 | |
| Return on investment in unconsolidated joint ventures | 271 | | | 1,253 | | | 2,696 | |
| Other | (1,018) | | | (107) | | | (883) | |
| Changes in operating assets and liabilities: | | | | | |
| Other assets, net | (11,524) | | | (10,147) | | | (4,498) | |
| Accounts payable and other liabilities | 2,112 | | | 9,955 | | | 8,508 | |
| Net cash provided by operating activities | 290,968 | | | 290,890 | | | 262,902 | |
| CASH FLOWS FROM INVESTING ACTIVITIES: | | | | | |
| Real estate acquisitions | (270,262) | | | (282,000) | | | (308,358) | |
| Capital expenditures | (95,262) | | | (104,495) | | | (75,035) | |
| Proceeds from sale of real estate, net | 7,208 | | | 52,019 | | | 206,377 | |
| Investment in third parties | — | | | — | | | (3,000) | |
| Return of investment in unconsolidated joint ventures | 1,969 | | | 4,151 | | | 5,039 | |
| Investment in marketable securities | — | | | (3,000) | | | (5,514) | |
| Proceeds from sale of marketable securities | 400 | | | — | | | — | |
| Insurance proceeds for property damage claims | 2,561 | | | 2,080 | | | — | |
| Net cash used in investing activities | (353,386) | | | (331,245) | | | (180,491) | |
| CASH FLOWS FROM FINANCING ACTIVITIES: | | | | | |
| Proceeds from the issuance of common stock | 149,135 | | | 90,124 | | | 547,401 | |
| Payment of offering costs | (1,939) | | | (1,090) | | | (39,048) | |
| Repurchases of Class B common stock | — | | | — | | | (77,765) | |
| Proceeds from revolving credit facility | 503,000 | | | 376,000 | | | 9,000 | |
| Payments on revolving credit facility | (401,000) | | | (297,000) | | | (9,000) | |
| Proceeds from notes and loans payable | 58,000 | | | — | | | 822,018 | |
| Payments on mortgages and loans payable | (101,504) | | | (81,920) | | | (1,229,715) | |
| Distributions paid, net of DRIP | (135,749) | | | (127,083) | | | (106,699) | |
| Distributions to noncontrolling interests | (15,996) | | | (16,856) | | | (14,982) | |
| Other | — | | | — | | | (29) | |
| Net cash provided by (used in) financing activities | 53,947 | | | (57,825) | | | (98,819) | |
| NET DECREASE IN CASH, CASH EQUIVALENTS, AND RESTRICTED CASH | (8,471) | | | (98,180) | | | (16,408) | |
| CASH, CASH EQUIVALENTS, AND RESTRICTED CASH: | | | | | |
| Beginning of year | 17,349 | | | 115,529 | | | 131,937 | |
| End of year | $ | 8,878 | | | $ | 17,349 | | | $ | 115,529 | |
| | | | | |
| RECONCILIATION TO CONSOLIDATED BALANCE SHEETS | | | | | |
| Cash and cash equivalents | $ | 4,872 | | | $ | 5,478 | | | $ | 92,585 | |
| Restricted cash | 4,006 | | | 11,871 | | | 22,944 | |
| Cash, cash equivalents, and restricted cash at end of year | $ | 8,878 | | | $ | 17,349 | | | $ | 115,529 | |
|
| | | | | | | | | | | |
| | 2017 | | 2016 | | 2015 |
| CASH FLOWS FROM OPERATING ACTIVITIES: | | | | | |
| Net (loss) income | $ | (41,718 | ) | | $ | 9,043 |
| | $ | 13,561 |
|
| Adjustments to reconcile net (loss) income to net cash provided by operating activities: | |
| | |
| | |
|
| Depreciation and amortization | 126,043 |
| | 103,282 |
| | 98,367 |
|
| Net amortization of above- and below-market leases | (1,984 | ) | | (1,208 | ) | | (821 | ) |
| Amortization of deferred financing expense | 5,162 |
| | 4,936 |
| | 5,084 |
|
| Vesting of Class B units | 24,037 |
| | — |
| | — |
|
| Amortization of corporate intangible assets | 2,900 |
| | — |
| | — |
|
| Gain on sale of properties and disposal of real estate assets | (2,502 | ) | | (4,356 | ) | | (190 | ) |
| Net (gain) loss on write-off of unamortized capitalized leasing commissions, | | | | | |
| market debt adjustments, and deferred financing expense | (237 | ) | | 317 |
| | 2,260 |
|
| Straight-line rent | (3,729 | ) | | (3,512 | ) | | (4,571 | ) |
| Other | (137 | ) | | (1,485 | ) | | (118 | ) |
| Changes in operating assets and liabilities: | |
| | |
| | |
|
| Accounts receivable – affiliates | 3,592 |
| | — |
| | — |
|
| Other assets | (7,992 | ) | | (9,916 | ) | | (13,473 | ) |
| Accounts payable - affiliates | (4,350 | ) | | (865 | ) | | 4,145 |
|
| Accounts payable and other liabilities | 9,776 |
| | 6,840 |
| | 1,829 |
|
| Net cash provided by operating activities | 108,861 |
| | 103,076 |
| | 106,073 |
|
| CASH FLOWS FROM INVESTING ACTIVITIES: | |
| | |
| | |
|
| Real estate acquisitions | (159,698 | ) | | (201,111 | ) | | (91,142 | ) |
| Acquisition of PELP, net of cash acquired | (456,704 | ) | | — |
| | — |
|
| Capital expenditures | (42,146 | ) | | (26,117 | ) | | (21,870 | ) |
| Proceeds from sale of real estate | 36,912 |
| | — |
| | 2,268 |
|
| Change in restricted cash | 887 |
| | 1,011 |
| | (30 | ) |
| Net cash used in investing activities | (620,749 | ) | | (226,217 | ) | | (110,774 | ) |
| CASH FLOWS FROM FINANCING ACTIVITIES: | |
| | |
| | |
|
| Net change in credit facility | (115,400 | ) | | 35,969 |
| | (150,700 | ) |
| Proceeds from mortgages and loans payable | 855,000 |
| | 255,000 |
| | 400,000 |
|
| Payments on mortgages and loans payable | (83,387 | ) | | (110,875 | ) | | (77,324 | ) |
| Payments of deferred financing expenses | (14,892 | ) | | (3,115 | ) | | (6,711 | ) |
| Distributions paid, net of DRIP | (74,198 | ) | | (64,269 | ) | | (59,387 | ) |
| Distributions to noncontrolling interests | (7,025 | ) | | (1,724 | ) | | (1,677 | ) |
| Repurchases of common stock | (46,539 | ) | | (20,301 | ) | | (74,469 | ) |
| Redemption of noncontrolling interests | (4,179 | ) | | — |
| | — |
|
| Net cash provided by financing activities | 509,380 |
|
| 90,685 |
|
| 29,732 |
|
| Net (decrease) increase in cash and cash equivalents | (2,508 | ) | | (32,456 | ) | | 25,031 |
|
| CASH AND CASH EQUIVALENTS: | |
| | |
| | |
|
| Beginning of period | 8,224 |
| | 40,680 |
| | 15,649 |
|
| End of period | $ | 5,716 |
| | $ | 8,224 |
| | $ | 40,680 |
|
| | | | | | |
| SUPPLEMENTAL CASH FLOW DISCLOSURE, INCLUDING NON-CASH INVESTING AND FINANCING ACTIVITIES: |
| Cash paid for interest | $ | 39,487 |
| | $ | 29,709 |
| | $ | 27,583 |
|
| Fair value of assumed debt from real estate acquisitions | 30,831 |
| | 33,326 |
| | 34,341 |
|
| Fair value of assumed debt from the PELP transaction | 504,740 |
| | — |
| | — |
|
| Accrued capital expenditures | 2,496 |
| | 3,256 |
| | 2,340 |
|
| Change in offering costs payable to sponsor(s) | — |
| | — |
| | (75 | ) |
| Change in distributions payable | 39 |
| | 185 |
| | (44 | ) |
| Change in distributions payable - noncontrolling interests | 2,100 |
| | 158 |
| | 158 |
|
| Change in accrued share repurchase obligation | 618 |
| | — |
| | (1,669 | ) |
| Distributions reinvested | 49,126 |
| | 58,872 |
| | 63,803 |
|
| Like-kind exchange of real estate: | | | | | |
| Proceeds from restricted cash due to sale of real estate | $ | (35,900 | ) | | $ | 35,900 |
| | $ | — |
|
| Utilization of proceeds from restricted cash due to sale of real estate | 6,339 |
| | — |
| | — |
|
| Net restricted cash activity | $ | (29,561 | ) | | $ | 35,900 |
| | $ | — |
|
| | | | | | | | | | | |
| PHILLIPS EDISON & COMPANY DECEMBER 31, 2023 FORM 10-K | | | F-7 |
PHILLIPS EDISON & COMPANY, INC.
CONSOLIDATED STATEMENTS OF CASH FLOWS (Continued)
FOR THE YEARS ENDED DECEMBER 31, 2023, 2022, AND 2021
(In thousands)
| | | | | | | | | | | | | | | | | |
| | 2023 | | 2022 | | 2021 |
| SUPPLEMENTAL DISCLOSURE OF CASH FLOW INFORMATION: |
| Cash paid for interest | $ | 76,479 | | | $ | 65,096 | | | $ | 68,092 | |
| Cash paid for income taxes, net | 689 | | | 194 | | | 559 | |
| SUPPLEMENTAL SCHEDULE OF NON-CASH ACTIVITIES: |
| Settlement of earn-out liability | — | | | 54,245 | | | — | |
| Right-of-use (“ROU”) assets obtained in exchange for new lease liabilities | 887 | | | 36 | | | 902 | |
| Accrued capital expenditures | 9,892 | | | 9,834 | | | 6,443 | |
| Receivable from issuance of common stock | 1,700 | | | — | | | — | |
| Investment in third party | — | | | 6,800 | | | — | |
| Contribution of corporate assets | — | | | (4,304) | | | — | |
| Assumed debt obligations, net | 9,614 | | | — | | | — | |
| Assumed below-market debt | 444 | | | — | | | — | |
| Above-market contract | — | | | (2,496) | | | — | |
| Change in distributions payable | (293) | | | 68 | | | (7,600) | |
| Change in distributions payable - noncontrolling interests | 338 | | | (615) | | | (650) | |
| Distributions reinvested | — | | | — | | | 7,368 | |
See notes to consolidated financial statements.
| | | | | | | | | | | |
| PHILLIPS EDISON & COMPANY DECEMBER 31, 2023 FORM 10-K | | | F-8 |
Phillips Edison & Company, Inc.
Notes to Consolidated Financial Statements
Phillips Edison & Company, Inc. (“we,” the “Company,” “PECO,” “our,” or “us”), formerly known as Phillips Edison Grocery Center REIT I, Inc., was formed as a Maryland corporation in October 2009. Substantially all of our business is conducted through Phillips Edison Grocery Center Operating Partnership I, L.P., (the “Operating Partnership”), a Delaware limited partnership formed in December 2009. We are a limited partner of the Operating Partnership, and our wholly ownedwholly-owned subsidiary, Phillips Edison Grocery Center OP GP I LLC, is the sole general partner of the Operating Partnership.
We investare a real estate investment trust (“REIT”) that invests primarily in well-occupied,omni-channel grocery-anchored neighborhood and community shopping centers that have a mix of creditworthy national, regional, and regionallocal retailers that sell necessity-based goods and services in strong demographic markets throughout the United States. In addition to managing our own shopping centers, our third-party investment management business provides comprehensive real estate and asset management services to certain non-traded, publicly registered REITStwo unconsolidated institutional joint ventures, in which we have partial ownership interests, and one private funds (“Managedfund (collectively, the “Managed Funds”).
Our advisor was Phillips Edison NTR LLC (“PE-NTR”), which was directly or indirectly owned by Phillips Edison Limited Partnership (“Phillips Edison sponsor” or “PELP”). Under the terms of the advisory agreement between PE-NTR and us, PE-NTR was responsible for the management of our day-to-day activities and the implementation of our investment strategy. On October 4, 2017, we completed a transaction to acquire certain real estate assets, the third-party investment management business, and the captive insurance company of PELP in a stock and cash transaction (“PELP transaction”). Upon completion of the PELP transaction, our relationship with PE-NTR was acquired. For a more detailed discussion, see Notes 3 and 15.
As of December 31, 2017,2023, we wholly-owned 281 real estate properties. Additionally, we owned fee simple interestsa 14% interest in 236 real estateGrocery Retail Partners I LLC (“GRP I”), which owned 20 properties.
On July 19, 2021, we closed our underwritten initial public offering (“underwritten IPO”), through which we issued 19.6 million shares, including the underwriters’ overallotment election, of a new class of common stock, $0.01 par value per share, at an initial price to the public of $28.00 per share. As a result of the underwritten IPO, we received gross proceeds of $547.4 million.
The basis of presentation of our shares of common stock is described as follows: •Reverse Stock Split—On July 2, 2021, our board of directors (the “Board”) approved an amendment to our charter to effect a one-for-three reverse stock split. Concurrent with the reverse split, the Operating Partnership enacted a one-for-three reverse split of its outstanding Operating Partnership units (“OP units”). Unless otherwise indicated, the information in this Form 10-K gives effect to the reverse stock and OP unit splits (see Note 12).
•Recapitalization—On June 18, 2021, our stockholders approved an amendment to our charter (the “Articles of Amendment”) that effected a change of each share of our common stock outstanding at the time the amendment became effective into one share of a newly created class of Class B common stock (the “Recapitalization”). The Articles of Amendment became effective upon filing with, and acceptance by, the State Department of Assessments and Taxation of Maryland on July 2, 2021. Unless otherwise indicated, all information in this Form 10-K gives effect to the Recapitalization and references to “shares” and per share metrics refer to our common stock and Class B common stock, collectively. Our Class B common stock automatically converted into our publicly traded common stock on January 18, 2022 (see Note 12). Prior to the conversion, we have presented common stock and Class B common stock as separate classes within our consolidated balance sheets and consolidated statements of equity. On May 5, 2022, we filed Articles Supplementary to our charter with the Maryland State Department of Assessments and Taxation in order to reclassify and designate all of the 350 million authorized shares of our Class B common stock, $0.01 par value per share, all of which were unissued at such time, as shares of our common stock, $0.01 par value per share. We no longer have Class B common stock authorized for issue.
•In October 2021, the Operating Partnership completed the registered offering of $350 million aggregate principal amount of 2.625% senior notes (“2021 Bond Offering”) priced at 98.692% of the principal amount and maturing in November 2031. The 2021 Bond Offering resulted in gross proceeds of $345.4 million. The notes are fully and unconditionally guaranteed by us.
| | |
|
| 2. SUMMARY OF SIGNIFICANT ACCOUNTING POLICIES |
Set forth below is a summary of the significant accounting estimates and policies that management believes are important to the preparation of our consolidated financial statements. Certain of our accounting estimates are particularly important for an understanding of our financial position and results of operations and require the application of significant judgment by management. For example, significant estimates and assumptions have been made with respect to the useful lives of assets, remaining hold periods of assets, recoverable amounts of receivables, and other fair value measurement assessments required for the preparation of the consolidated financial statements. As a result, these estimates are subject to a degree of uncertainty.
Basis of Presentation and Principles of Consolidation—The accompanying consolidated financial statements include our accounts and the accounts of the Operating Partnership and its wholly-owned subsidiaries (over which we exercise financial and operating control). The financial statements of the Operating Partnership are prepared using accounting policies consistent with our accounting policies. All intercompany balances and transactions are eliminated upon consolidation.
Use of Estimates—The preparation of the consolidated financial statements in conformity with U.S.accounting principles generally accepted accounting principlesin the United States (“GAAP”) requires management to make estimates and assumptions that affect the reported amounts of assets and liabilities and the disclosure of contingent assets and liabilities at the date of the consolidated financial statements and the reported amounts of revenues and expenses during the reporting periods. For example, significant estimates and assumptions have been made with respect to the useful lives of assets; remaining hold periods of assets; recoverable amounts of receivables; initial valuations of tangible and intangible assets and liabilities, including goodwill, and
| | | | | | | | | | | |
| PHILLIPS EDISON & COMPANY DECEMBER 31, 2023 FORM 10-K | | | F-9 |
related amortization periods of deferred costs and intangibles, particularly with respect to property acquisitions; the valuation and nature of derivatives and their effectiveness as hedges; valuations of contingent consideration; and other fair value measurement assessments required for the preparation of the consolidated financial statements. Actual results could differ from those estimates.
Stock Issuance Costs—Stock issuance costs are offset against stock issuance proceeds and capitalized as a component of APIC on the consolidated balance sheets. We had stock issuance costs of approximately $1.9 million, $1.1 million, and $39.0 million for the years ended December 31, 2023, 2022, and 2021, respectively.
Other costs and expenses indirectly related to stock issuance activities are not capitalized and are included as expense on our consolidated statements of operations and comprehensive income (“consolidated statements of operations”). For the year ended December 31, 2021, we incurred other indirect costs and expenses related to our underwritten IPO of $4.3 million, which included grants of restricted stock units (“RSUs”), that were expensed and included as transaction costs in Other Expense, Net on our consolidated statements of operations.
Partially-Owned Entities—If we determine that we are an owner in a variable-interest entity (“VIE”), and we hold a controlling financial interest, then we will consolidate the entity as the primary beneficiary. For a partially-owned entity determined not to be a VIE, we analyze rights held by each partner to determine which would be the consolidating party. We will generally consolidate entities (in the absence of other factors when determining control) when we have over a 50% ownership interest in the entity. We will assess our interests in VIEs on an ongoing basis to determine whether or not we are the primary beneficiary. However, we will also evaluate who controls the entity even in circumstances in which we have greater than a 50% ownership interest. If we do not control the entity due to the lack of decision-making abilities, we will not consolidate the entity. We have determined that the Operating Partnership is considered a VIE. We are the primary beneficiary of the VIE, and our partnership interest is considered a majority voting interest. As such, we have consolidated the Operating Partnership and its wholly-owned subsidiaries. Further, as we hold a majority voting interest in the Operating Partnership, we qualify for the exemption from providing certain of the disclosure requirements associated with variable interest entities.
Additionally, a Section 1031 like-kind exchange (“Section 1031 exchange”Exchange”) pursuant to the Internal Revenue Code of 1986, as amended (the “IRC”), entails selling one property and reinvesting the proceeds in one or more properties that are similar in nature, character, or class within 180 days. A reverse Section 1031 exchangeExchange occurs when one or more properties is purchased prior to selling one property to be matched in the like-kind exchange, during which time legal title to the purchased property is held by an intermediary. Because we retain essentially all of the legal and economic benefits and obligations related to the acquisition, we consider the purchased property in a reverse Section 1031 Exchange to be a VIE, and therefore, we will consolidate the entity as the primary beneficiary. As of December 31, 2017, we had one active 1031 exchange (see Note 4). As of December 31, 2016, we had one active reverse 1031 exchange.beneficiary in these instances.
Noncontrolling Interests—Noncontrolling interests represent the portion of equity that we do not own in the entities we consolidate. We classify noncontrolling interests within permanent equity on our consolidated balance sheets. The amounts of consolidated net earnings attributable to us and to the noncontrolling interests are presented separately on our consolidated statements of operations. For additional information regarding noncontrolling interests, refer to Note 11.12.
Cash and Cash Equivalents—We consider all highly liquid investments purchased with an original maturity of three months or less to be cash equivalents. Cash equivalents may include cash and short-term investments. Short-term investments are stated at cost, which approximates fair value and may consist of investments in money market accounts and money market funds. TheFrom time to time, the cash and cash equivalent balances at one or more of our financial institutions exceedsmay exceed the Federal Depository Insurance Corporation (“FDIC”) coverage.
Restricted Cash—Restricted cash primarily consists of cash restricted for the purpose of facilitating a Section 1031 exchange,Exchange, escrowed tenant improvement funds, real estate taxes, capital improvement funds, insurance premiums, and other amounts required to be escrowed pursuant to loan agreements. During 2023, we did not sell any properties as part of facilitating a Section 1031 Exchange that remained open at the end of the year. During 2022, we sold two properties as part of facilitating a Section 1031 Exchange that remained open at the end of the year. The net proceeds of these sales were held as restricted cash with a qualified intermediary totaling $1.7 million.
Investment in Property and Lease Intangibles—In January 2017, the FinancialWe apply Accounting Standards BoardCodification (“FASB”ASC”) issued Accounting Standards Update (“ASU”) 2017-01, Topic 805: Business Combinations (Topic 805): Clarifying the Definition(“ASC 805”)when evaluating any purchases of a Business. This update amended existing guidance in order to clarify when an integrated set of assets and activities is considered a business. We adopted ASU 2017-01 on January 1, 2017, and applied it prospectively.real estate. Under this new guidance, most of our real estate acquisition activity is no longernot generally considered a business combination and is instead classified as an asset acquisition. As a result, most acquisition-related costs that would have been recorded on our consolidated statements of operations prior to adoption are now capitalized and will be amortized over the life of the related assets, and there is no recognition of goodwill. Costs incurred related to properties that were not ultimately acquired were recorded as Acquisition Expenses on our consolidated statements of operations. None of our real estate acquisitions in 2017 outside of the PELP transaction2023 and 2022 met the definition of a business; therefore, we accounted for all as asset acquisitions.
Real estate assets are stated at cost less accumulated depreciation. The majority of acquisition-related costs are capitalized and allocated to the various classes of assets acquired. These costs are then amortizeddepreciated over the estimated useful lives associated with the assets acquired. Depreciation is computed using the straight-line method. The estimated useful lives for computing depreciation are generally not to exceed 5-7 years for furniture, fixtures, and equipment, 15 years for land improvements, and 30 years for buildings and building improvements. Tenant improvements are amortized over the shorter of the respective lease term or the expected useful life of the asset. Major replacements that extend the useful lives of the assets are capitalized, and maintenance and repair costs are expensed as incurred.
Real estate assets are reviewed for impairment whenever events or changes in circumstances indicate that the carrying amount of the individual property may not be recoverable. In such an event, a comparison will be made of the projected operating cash flows of each property on an undiscounted basis to the carrying amount of such property. If deemed unrecoverable on an undiscounted basis, such carrying amount would be adjusted, if necessary, to estimated fair values to reflect impairment in the value of the asset. We recorded no impairments for the years ended December 31, 2017, 2016, and 2015.
We assess the acquisition-date fair values of all tangible assets, identifiable intangibles, and assumed liabilities using methods similar to those used by independent appraisers (e.g., discounted cash flow analysis, sales comparison approach, and replacement cost) andcost approach) that utilize appropriate discount and/or capitalization rates and available market information. Estimates of future cash flows are based on a number of factors including historical operating results, known and anticipated trends, and market and economic conditions. The fair value of tangible assets of an acquired property considers the value of the property as if it were vacant.
The fair values of buildings and improvements are determined on an as-if-vacant basis. The estimated fair value of acquired in-place leases is the cost we would have incurred to lease the properties to the occupancy level of the properties at the date
| | | | | | | | | | | |
| PHILLIPS EDISON & COMPANY DECEMBER 31, 2023 FORM 10-K | | | F-10 |
of acquisition. Such estimates include leasing commissions, legal costs, and other direct costs that would be incurred to lease the properties to such occupancy levels. Additionally, we evaluate the time period over which such occupancy levels would be achieved. Such evaluation includes an estimate of the net market-based rental revenues and net operating costs (primarily consisting of real estate taxes, insurance, and utilities) that would be incurred during the lease-up period. Acquired in-place leases as of the date of acquisition are amortized over the weighted-average remaining lease terms.
Acquired above- and below-market lease values are recorded based on the present value (using discount rates that reflect the risks associated with the leases acquired) of the difference between the contractual amounts to be paid pursuant to the in-place leases and management’s estimate of the market lease rates for the corresponding in-place leases. The capitalized above- and below-market lease values are amortized as adjustments to rental income over the remaining terms of the respective leases. We also consider fixed-rate renewal options in our calculation of the fair value of below-market leases and the periods over which such leases are amortized. If a tenant has a unilateral option to renew a below-market lease and we determine that the tenant has a financial incentive to exercise such option, we include such an option in the calculation of the fair value of such lease and the period over which the lease is amortized.
We estimate the value of tenant origination and absorption costs by considering the estimated carrying costs during hypothetical expected lease-up periods, considering current market conditions. In estimating carrying costs, management includes real estate taxes, insurance and other operating expenses, and estimates of lost rentals at market rates during the expected lease-up periods.
We estimate the fair value of assumed mortgage notesloans payable based upon indications of then-current market pricing for similar types of debt with similar maturities. Assumed mortgage notesloans payable are initially recorded at their estimated fair value as of the assumption date, and the difference between such estimated fair value and the note’sloan’s outstanding principal balance is amortized over the life of the mortgage note payableloan as an adjustment to interest expense. Our accumulated amortization of above- and below-market debt was $1.8 million and $0.3 million as of December 31, 2023 and 2022, respectively.
Real estate assets are reviewed for impairment whenever events or changes in circumstances indicate that the carrying amount of the individual property may not be recoverable. In such an event, a comparison will be made of the projected operating cash flows of each property on an undiscounted basis to the carrying amount of such property. If deemed unrecoverable on an undiscounted basis, such carrying amount would be adjusted, if necessary, to estimated fair values to reflect impairment in the value of the asset. For additional information regarding real estate asset impairments, refer to our fair value measurement accounting policy below.
Goodwill and Other Intangibles—In the case of an acquisition of a business, combination, after identifying all tangible and intangible assets and liabilities, the excess consideration paid over the fair value of the assets and liabilities acquired represents goodwill. We allocate goodwill to the respective reporting units in which such goodwill arises. We evaluate goodwill for impairment when an event occurs or circumstances change that indicate the carrying value may not be recoverable, or at least annually. Our annual testing date is during the fourth quarter and, due to the timing of the PELP transaction, annual testing will begin in 2018. November 30.
The goodwill impairment evaluation may beis completed throughusing either a qualitative or quantitative approach. Under a qualitative approach, the impairment review for goodwill consists of an assessment of whether it is more-likely-than-not that the reporting unit’s fair value is less than its carrying value.value, including goodwill. If a qualitative approach indicates it is more likely-than-not that the estimated carrying value of thea reporting unit (including goodwill) exceeds its fair value, or if we choose to bypass the qualitative approach for any reporting unit, we will perform the quantitative approach described below.
We are electing to adopt ASU 2017-04, Intangibles - Goodwill and Other (Topic 350): Simplifying the Test for Goodwill Impairment, as of January 1, 2018, as discussed in the table below. Therefore, whenWhen we perform a quantitative test of goodwill for impairment, we will compare the carrying value of net assets toa reporting unit with its fair value. If the fair value of the reporting unit. If the fair
value of the reporting unit exceeds its carrying amount, we woulddo not consider goodwill to be impaired and no further analysis would be required. If the fair value is determined to be less than its carrying value, the amount of goodwill impairment would beequals the amount by which the reporting unit’s carrying value exceeds its fair value, not to exceed the carrying amount of goodwill.
If impairment indicators arise with respect to non-real estate intangible assets with finite useful lives, we evaluate impairment by comparing the carrying amount of the asset to the estimated future undiscounted cash flows expected to be generated by the asset. If estimated future undiscounted cash flows are less than the carrying amount of the asset, then we estimate the fair value of the asset and compare the estimated fair value to the intangible asset’s carrying value. We recognize anythe shortfall from carrying value as an impairment loss in the current period.
Estimates of fair value used in our evaluation of goodwill and intangible assets are based upon discounted future cash flow projections, relevant competitor multiples, or other acceptable valuation techniques. These techniques are based, in turn, upon all available evidence including level three inputs (see fair value measurement policy below), such as revenue and expense growth rates, estimates of future cash flows, capitalization rates, discount rates, general economic conditions and trends, or other available market data. Our ability to accurately predict future operating results and cash flows and to estimate and determine fair values impacts the timing and recognition of impairments. While we believe our assumptions are reasonable, changes in these assumptions may have a material impact on our financial results. Based on the results of our analysis, we concluded that goodwill was not impaired for the years ended December 31, 2023 and 2022.
Held for Sale EntitiesAssets—We consider assets to be held for sale when management believes that a sale is probable within a year. This generally occurs when a sales contract is executed with no substantive contingencies, and the prospective buyer has significant funds at risk. Assets that are classified as held for sale are recorded at the lower of their carrying amount or fair value less cost to sell. ThereAs of December 31, 2023 and 2022, there were no assetsproperties classified as held for sale as of December 31, 2017 and 2016.sale.
Deferred Financing Expenses—Deferred financing expenses are capitalized and amortized on a straight-line basis over the term of the related financing arrangement, which approximates the effective interest method. Deferred financing costsexpenses related to our term loan facilities and mortgages are in Debt Obligations, Net, while deferred financing costsexpenses related to our revolving credit facility are in Other Assets, Net, on our consolidated balance sheets. The accumulated amortization of deferred financing expenses in Debt Obligations, Net was $15.9 million and $14.7 million as of December 31, 2023 and 2022, respectively.
| | | | | | | | | | | |
| PHILLIPS EDISON & COMPANY DECEMBER 31, 2023 FORM 10-K | | | F-11 |
Fair Value Measurement—Accounting Standard Codification (“ASC”)ASC Topic 820, Fair Value Measurement(“ASC 820”) defines fair value, establishes a framework for measuring fair value in accordance with GAAP, and expands disclosures about fair value measurements. ASC 820 emphasizes that fair value is intended to be a market-based measurement, as opposed to a transaction-specific measurement. Fair value is defined by ASC 820 as the price that would be received to sellat sale for an asset or paid to transfer a liability in an orderly transaction between market participants at the measurement date. Depending on the nature of the asset or liability, various techniques and assumptions can be used to estimate the fair value. Assets and liabilities are measured using inputs from three levels of the fair value hierarchy, as follows:
Level 1—Inputs are quoted prices (unadjusted) in active markets for identical assets or liabilities that we have the ability to access at the measurement date. An active market is defined as a market in which transactions for the assets or liabilities occur with sufficient frequency and volume to provide pricing information on an ongoing basis.
Level 2—Inputs include quoted prices for similar assets and liabilities in active markets, quoted prices for identical or similar assets or liabilities in markets that are not active (markets with few transactions), inputs other than quoted prices that are observable for the asset or liability (i.e., interest rates, yield curves, etc.), and inputs that are derived principally from or corroborated by observable market data correlation or other means (market corroborated inputs).
Level 3—Unobservable inputs, only used to the extent that observable inputs are not available, reflect our assumptions about the pricing of an asset or liability.
Considerable judgment is necessary to develop estimated fair values of financial and non-financial assets and liabilities. Accordingly, the estimates presented herein are not necessarily indicative of the amounts we did or could actually realize upon disposition of the financial assets and liabilities previously sold or currently held.
Gain on SaleOn a quarterly basis, we employ a multi-step approach to assess our real estate assets for possible impairment and record any impairment charges identified. The first step is the identification of Assets—We recognize salespotential triggering events, such as significant decreases in occupancy or the presence of assets only uponlarge dark or vacant spaces. If we observe any of these indicators for a shopping center, we then perform an additional screen test consisting of a years-to-recover analysis to determine if we will recover the closingnet book value of the transactionproperty over its remaining economic life based upon net operating income (“NOI”) as forecasted for the current year. In the event that the results of this first step indicate a triggering event for a center, we proceed to the second step, utilizing an undiscounted cash flow model for the center to identify potential impairment. If the undiscounted cash flows are less than the net book value of the center as of the balance sheet date, we record an impairment charge based on the fair value determined in the third step. In performing the third step, we utilize market data such as capitalization rates and sales price per square foot on comparable recent real estate transactions to estimate the fair value of the real estate assets. We also utilize expected net sales proceeds to estimate the fair value of any centers that are actively being marketed for sale.
In addition to these procedures, we also review undeveloped or unimproved land parcels that we own for evidence of impairment and record any impairment charges as necessary. Primary impairment triggers for these land parcels are changes to our plans or intentions with regards to such properties, or planned dispositions at prices that are less than the current carrying values.
Investments in Unconsolidated Joint Ventures—We account for our investments in unconsolidated joint ventures using the equity method of accounting as we exercise significant influence over, but do not control, these entities. These investments were initially recorded at cost and are subsequently adjusted for contributions made to and distributions received from the joint ventures. Earnings or losses from our investments are recognized in accordance with the purchaser. terms of the applicable joint venture agreements, generally through a pro rata allocation. Under a pro rata allocation, net income or loss is allocated between the partners in the joint ventures based on their respective stated ownership percentages.
We recognize gainsutilize the cumulative-earnings approach for purposes of determining whether distributions should be classified as either a return on investment, which would be included in operating activities, or a return of investment, which would be included in investing activities on the consolidated statements of cash flows. Under this approach, distributions are presumed to be returns on investment unless cumulative returns on investment exceed our cumulative equity in earnings. When such an excess occurs, the current-period distribution up to this excess is considered a return of investment and classified as cash flows from investing activities.
On a periodic basis, management assesses whether there are indicators, including the operating performance of the underlying real estate and general market conditions, that the value of our investments in our unconsolidated joint ventures may be impaired. An investment’s value is impaired only if management’s estimate of the fair value of the investment is less than its carrying value and such difference is deemed to be other-than-temporary. To the extent impairment has occurred, the loss is measured as the excess of the carrying amount of the investment over its estimated fair value.
Management’s estimates of fair value are based upon a discounted cash flow model for each specific investment that includes all estimated cash inflows and outflows over a specified holding period. Where applicable, any estimated debt premiums, capitalization rates, discount rates, and credit spreads used in these models are based upon rates we believe to be within a reasonable range of current market rates.
For additional information regarding our unconsolidated joint ventures, refer to Note 6.
Leases—We are party to a number of lease agreements, both as a lessor as well as a lessee of various types of assets.
Lessor—The majority of our revenue is lease revenue derived from our real estate assets, sold upon closing which is accounted for under ASC Topic 842, Leases (“ASC 842”). We record lease and lease-related revenue as Rental Income on the consolidated statements of operations, in accordance with ASC 842.
We enter into leases primarily as a lessor as part of our real estate operations, and leases represent the majority of our revenue. We lease space in our properties generally in the form of operating leases. Our leases typically provide for reimbursements from tenants for common area maintenance, insurance, and real estate tax expenses. Common area maintenance reimbursements can be fixed, with revenue earned on a straight-line basis over the term of the lease, or variable, with revenue recognized as services are performed for which we will be reimbursed.
| | | | | | | | | | | |
| PHILLIPS EDISON & COMPANY DECEMBER 31, 2023 FORM 10-K | | | F-12 |
The lease agreements frequently contain fixed-price renewal options to extend the terms of leases and other terms and conditions as negotiated. In calculating the term of our leases, we consider whether these options are reasonably certain to be exercised. Our determination involves a combination of contract-, asset-, entity-, and market-based factors and involves considerable judgment. We retain substantially all of the risks and benefits of ownership of the real estate assets leased to tenants. Currently, our tenants have no options to purchase at the end of the lease term, although in a small number of leases, a tenant, usually the anchor tenant, may have the right of first refusal to purchase one of our properties if we elect to sell the center.
We evaluate whether a lease is an operating, sales-type, or direct financing lease using the criteria established in ASC 842. Leases will be considered either sales-type or direct financing leases if any of the following criteria are met:
•if the collectibilitylease transfers ownership of the sales priceunderlying asset to the lessee by the end of the term;
•if the lease grants the lessee an option to purchase the underlying asset that is reasonably assured,certain to be exercised;
•if the lease term is for the major part of the remaining economic life of the underlying asset; or
•if the present value of the sum of the lease payments and any residual value guaranteed by the lessee equals or exceeds substantially all of the fair value of the underlying asset.
We utilize substantial judgment in determining the fair value of the leased asset, the economic life of the leased asset, and the relevant borrowing rate in performing our lease classification analysis. If none of the criteria listed above are met, the lease is classified as an operating lease. Currently, all of our leases are classified as operating leases, and we are not obligated to perform any significant activities after the sale to earn the profit, we have received adequate initial investment from the purchaser, and other profit recognition criteria have been satisfied. We may defer recognition of gains in whole or in part until: (i) the profit is determinable, meaningexpect that the collectibilitymajority, if not all, of the sales price is reasonably assured or the amount thatour leases will notcontinue to be collectible can be estimated; and (ii) the earnings process is virtually complete, meaning that we are not obliged to perform any significant activities after the sale to earn the profit. Further, we may defer a tax gain through an Internal Revenue Code (“IRC”) Section 1031 like-kind exchange by purchasing another property within a specified time period.classified as operating leases based upon our typical lease terms.
Revenue Recognition—We commence revenue recognition on our leases based on a number of factors. In most cases, revenue recognition under a lease begins when the lessee takes possession of or controls the physical use of the leased asset. The determination of when revenue recognition under a lease begins, as well as the nature of the leased asset, is dependent upon our assessment of who is the owner, for accounting purposes, of theany related tenant improvements determines the nature of the leased asset and when revenue recognition under a lease begins.improvements. If we are the owner, for accounting purposes, of the tenant improvements, then the leased asset is the finished space, and revenue recognition begins when the lessee takes possession of the finished space, typically when the improvements are substantially complete.
If we conclude that we are not the owner, for accounting purposes, of the tenant improvements (the(i.e., the lessee is the owner), then the leased asset is the unimproved space and any tenant allowances funded under the lease are treated as lease incentives, which reduce revenue recognized over the term of the lease. In these circumstances, we begin revenue recognition when the lessee takes possession of the unimproved space to construct their own improvements. We consider a number of different factors in evaluating whether we or the lessee isor we are the owner of the tenant improvements for accounting purposes. These factors include:
•whether the lease stipulates how and on what a tenant improvement allowance may be spent;
•whether the tenant or landlord retains legal title to the improvements;
•the uniqueness of the improvements;
•the expected economic life of the tenant improvements relative to the length of the lease; and
•who constructs or directs the construction of the improvements.
WeThe majority of our leases provide for fixed rental escalations, and we recognize rental income on a straight-line basis over the term of each lease.lease in such instances. The difference between rental income earned on a straight-line basis and the cash rent due under the provisions of the lease agreements is recorded as deferred rent receivable and is included as a component of Other Assets, Net. Due to the impact of the straight-line adjustments, rental income generally will be greater than the cash collected in the early years and will be less than the cash collected in the later years of a lease. Our policy for percentage rental income is to defer recognition of contingent rental income until the specified target (i.e. breakpoint) that triggers the contingent rental income is achieved.
Reimbursements from tenants for recoverable real estate taxtaxes and operating expenses that are fixed per the terms of the applicable lease agreements are recorded on a straight-line basis, as described above. The majority of our lease agreements with tenants, however, provide for tenant reimbursements that are variable depending upon the applicable expenses incurred. These reimbursements are accrued as revenue in the period in which the applicable expenses are incurred. We make certain assumptions and judgments in estimating the reimbursements at the end of each reporting period. We do not expect the actual results to materially differ from the estimated reimbursements. Both fixed and variable tenant reimbursements are recorded as Rental Income in the consolidated statements of operations. In certain cases, the lease agreement may stipulate that a tenant make a direct payment for real estate taxes to the relevant taxing authorities. In these cases, we do not record any revenue or expense related to these tenant expenditures. Although we expect such cases to be rare, in the event that a direct-paying tenant failed to make their required payment to the taxing authorities, we would potentially be liable for such amounts, although they are not recorded as a liability in our consolidated balance sheets per the requirements of ASC 842. We have made a policy election to exclude amounts collected from customers for all sales tax and other similar taxes from the transaction price in our recognition of lease revenue. We record such taxes on a net basis in our consolidated statements of operations.
We periodically reviewAdditionally, we record an immaterial amount of variable revenue in the collectabilityform of outstanding receivables. Allowancespercentage rental income. Our policy for percentage rental income is to defer recognition of contingent rental income until the specified target (i.e., breakpoint) that triggers the contingent rental income is achieved.
In some instances, as part of our negotiations, we may offer lease incentives to our tenants. These incentives usually take the form of payments made to or on behalf of the tenant, and such incentives will be taken for those balances that we deem to be uncollectible, including any amounts relating todeducted from the lease payment and recorded on a straight-line rent receivables and/or receivables for recoverable expenses. Asbasis over the term of December 31, 2017 and 2016, the bad debt reserve for uncollectible amounts was $3.3 million and $1.7 million, respectively.new lease.
We record lease termination income if there is a signed termination agreement, all of the conditions of the agreement have been met, collectabilitycollectibility is reasonably assured, and the tenant is no longer occupying the property. Upon early lease termination, we provide for losses related to unrecovered tenant-specific intangibles and other assets. We record lease termination income as Rental Income in the consolidated statements of operations.
| | | | | | | | | | | |
| PHILLIPS EDISON & COMPANY DECEMBER 31, 2023 FORM 10-K | | | F-13 |
Lease receivables are reviewed continually to determine whether or not it is probable that we will realize substantially all remaining lease payments for each of our tenants (i.e., whether a tenant is deemed to be a credit risk). Additionally, we record a general reserve based on our review of operating lease receivables at a company level to ensure they are properly valued based on analysis of historical bad debt, outstanding balances, and the current economic climate. If we determine it is not probable that we will collect substantially all of the remaining lease payments from a tenant, revenue for that tenant is recorded on a cash basis (“cash-basis tenant”), including any amounts relating to straight-line rent receivables and/or receivables for recoverable expenses. We will resume recording lease income on an accrual basis for cash-basis tenants once we believe the collection of rent for the remaining lease term is probable, which will generally be after a period of regular payments. Under ASC 842, the aforementioned adjustments as well as any reserve for disputed charges are recorded as a reduction of Rental Income on the consolidated statements of operations. As of December 31, 2023 and 2022, the reserve in accounts receivable for uncollectible amounts was $1.9 million and $3.0 million, respectively. Receivables on our consolidated balance sheets exclude amounts removed related to tenants considered to be non-creditworthy, which were $10.7 million and $10.4 million as of December 31, 2023 and 2022, respectively.
Lessee—We enter into leases as a lessee as part of our real estate operations in the form of ground leases of land for certain properties, and as part of our corporate operations in the form of office space and office equipment leases. Ground leases typically contain one or more options to renew for additional terms and may include options that grant us, as the lessee, the right to terminate the lease, without penalty, in advance of the full lease term. Our office space leases generally have no renewal options. Office equipment leases typically have options to extend the term for a year or less, but contain minimal termination rights. In calculating the term of our leases, we consider whether we are reasonably certain to exercise renewal and/or termination options. Our determination involves a combination of contract-, asset-, entity-, and market-based factors and involves considerable judgment.
Currently, neither our operating leases nor our finance leases have residual value guarantees or other restrictions or covenants, but a small number may contain non-lease components which have been deemed not material and are not separated from the leasing component. We evaluate whether a lease is a finance or operating lease using the criteria established in ASC 842. The criteria we use to determine whether a lease is a finance lease are the same as those we use to determine whether a lease is sales-type lease as a lessor. If none of the finance lease criteria is met, we classify the lease as an operating lease.
We record ROU assets and liabilities in the consolidated balance sheets based upon the terms and conditions of the applicable lease agreement. We use discount rates to calculate the present value of lease payments when determining lease classification and measuring our lease liability. We use the rate implicit in the lease as our discount rate unless that rate cannot be readily determined, in which case we consider various factors, including our incremental secured borrowing rate, in selecting an appropriate discount rate. This requires the application of judgment, and we consider the length of the lease as well as the length and securitization of our outstanding debt agreements in selecting an appropriate rate. Refer to Note 3 for further detail.
Revenue Recognition—In addition to our lease-related revenue, we also earn fee revenues by providing services to the Managed Funds. These fees are accounted for within the scope of ASC Topic 606, Revenue from Contracts with Customers (“ASC 606”), and are recorded as Fees and Management Income on the consolidated statements of operations. We provide services to the Managed Funds, all of which are considered related parties. These services primarily include asset acquisition and disposition services, asset management, operating and leasing of properties, construction management, and other general and administrative responsibilities. These services are currently provided under various combinations of advisory agreements, property management agreements, and other service agreements (the “Management Agreements”). The wide variety of duties within the Management Agreements makes determining the performance obligations within the contracts a matter of judgment. We have concluded that each of the separately disclosed fee types in the below table represents a separate performance obligation within the Management Agreements.
| | | | | | | | | | | | | | | | | | | | |
| Fee | | Performance Obligation Satisfied | | Form and Timing of Payment | | Description |
| Asset Management | | Over time | | In cash, monthly | | Because each increment of service is distinct, although substantially the same, revenue is recognized at the end of each reporting period based upon invested equity and the applicable rate. |
| Property Management | | Over time | | In cash, monthly | | Because each increment of service is distinct, although substantially the same, revenue is recognized at the end of each month based on a percentage of the properties’ cash receipts. |
| Leasing Commissions | | Point in time (upon close of a transaction) | | In cash, upon completion | | Revenue is recognized in an amount equal to the fees charged by unaffiliated persons rendering comparable services in the same geographic location. |
| Construction Management | | Point in time (upon close of a project) | | In cash, upon completion | | Revenue is recognized in an amount equal to the fees charged by unaffiliated persons rendering comparable services in the same geographic location. |
Due to the nature of the services being provided under our Management Agreements, each performance obligation has a variable component. Therefore, when we determine the transaction price for the contracts, we are required to constrain our estimate to an amount that is not probable of significant revenue reversal. For most of these fee types, such as leasing commissions, compensation only occurs if a transaction takes place and the amount of compensation is dependent upon the terms of the transaction. For our property and asset management fees, due to the large number and broad range of possible consideration amounts, we calculate the amount earned at the end of each month.
Sales or transfers to non-customers of non-financial assets or in substance non-financial assets that do not meet the definition of a business are accounted for within the scope of ASC Topic 610-20, Other Income—Gains and Losses from the Derecognition of Nonfinancial Assets (“ASC 610-20”). Generally, our sales of real estate would be considered a sale of a non-
| | | | | | | | | | | |
| PHILLIPS EDISON & COMPANY DECEMBER 31, 2023 FORM 10-K | | | F-14 |
financial asset as defined by ASC 610-20. Under ASC 610-20, if we determine we do not have a controlling financial interest in the entity that holds the asset and the arrangement meets the criteria to be accounted for as a contract, we would derecognize the asset and recognize a gain or loss on the sale of the real estate when control of the underlying asset transfers to the buyer. Further, we may defer a tax gain through a Section 1031 Exchange by purchasing another property within a specified time period. For additional information regarding gain on sale of assets, refer to Note 4.
Share-Based Compensation—We account for equity awards in accordance with the various management agreements executed, areASC Topic 718, Compensation—Stock Compensation, which requires that all share-based payments to employees and non-employee directors be recognized in the consolidated statements of operations over the requisite service period in whichbased on their fair value. Prior to our underwritten IPO, fair value was based on the services have been provided, the earnings processestimated value per share (“EVPS”) of our stock. Subsequent to our underwritten IPO, fair value for certain of our equity awards is complete, and collectability is reasonably assured.
Repurchase of Common Stock—We offer a share repurchase program (“SRP”) which may allow stockholders who participate to have their shares repurchased subject to approval and certain limitations and restrictions (see Note 11). Underbased on our SRP, the maximum amount of commonNasdaq closing stock that we may redeem,price at the shareholder’s election, during any calendar year is limited, among other things, to 5%date of the weighted-average number of shares outstanding duringgrant. Beginning in 2022, fair value for our performance-based awards is calculated using the prior calendar year. The maximum amountMonte Carlo method, which is reduced each reporting period byintended to estimate the current year share redemptions to date. In addition, the cash available for repurchases on any particular date is generally limited to the proceeds from the DRIP during the preceding four fiscal quarters, less amounts already used for repurchases since the startfair value of the same time period. The boardawards using dividend yields, expected volatilities that are primarily based on available implied data and peer group companies’ historical data, and post-vesting restriction periods.
Share-based compensation expense for all awards is included in General and Administrative and Property Operating in our consolidated statements of directors (“Board”) reservesoperations, excluding the right at any timeexpense related to reject any request for repurchase.RSUs awarded in connection with our underwritten IPO, which is included in Other Expense, Net. For more information about our stock-based compensation program, see Note 13.
Share Repurchase Programs—Shares repurchased pursuant to our SRPa share repurchase program are immediately retired upon purchase. Repurchased common stock is reflected as a reduction of stockholders’ equity. Our accounting policy related to share repurchases is to reduce common stock based on the par value of the shares and to reduce capital surplus for the excess of the repurchase price over the par value. Since the inception of the SRPStarting in August 2010, we offered a share repurchase program which allowed stockholders who participated to have their shares repurchased subject to approval and certain limitations and restrictions. Prior to its termination in August 2021, we had an accumulated deficit balance; therefore, the excess over the par value has historically been applied to additional paid-in capital. Once
On August 3, 2022, our Board approved a new share repurchase program of up to $250 million of common stock. The program may be suspended or discontinued at any time, and does not obligate us to repurchase any dollar amount or particular number of shares. No share repurchases have been made to date under this program.
Segments—Our principal business is the ownership and operation of community and neighborhood shopping centers. We do not distinguish our principal business, or group our operations, by geography or size for purposes of measuring performance. Accordingly, we have retained earnings, the excess will be charged entirely to retained earnings.presented our results as a single reportable segment.
Income Taxes—We have elected to be taxed as a REIT under the IRC. To qualify as a REIT, we must meet a number of organizationorganizational and operational requirements, including a requirement to annually distribute to our shareholdersstockholders at least 90% of our REIT taxable income, determined without regard to the dividends paid deduction and excluding net capital gains. We intend to continue to adhere to these requirements and to maintain our REIT status. As a REIT, we are entitled to a deduction for some or all of the distributions we pay to our shareholders.stockholders. Accordingly, we are generally subject to U.S. federal income taxes on any taxable income that is not currently distributed to our shareholders.stockholders. If we fail to qualify as a REIT in any taxable year, we will be subject to U.S. federal income taxes and may not be able to qualify as a REIT until the fifth subsequent taxable year.
Notwithstanding our qualification as a REIT, we may be subject to certain state and local taxes on our income or properties. In addition, our consolidated financial statements include the operations of one wholly owned subsidiarywholly-owned subsidiaries that hashave jointly elected to be treated as a Taxabletaxable REIT Subsidiarysubsidiary (“TRS”) entities and isare subject to U.S. federal, state, and local income taxes at regular corporate tax rates. We did not record any tax expense in prior years as 2017 was the first year of existence for the TRS. As a REIT, we may also be subject to certain U.S. federal excise taxes if we engage in certain types of transactions. We recognized an insignificant amount of federal, state, and local income tax expense for the years ended December 31, 2023, 2022, and 2021, and we retain a full valuation allowance for our net deferred tax asset. All income tax amounts are included in Other Expense, Net on our consolidated statements of operations. For more information regarding our income taxes, see Note 9.10.
Newly Adopted and Recently Issued Accounting Pronouncements—In November 2023, the Financial Accounting Standards Board (“FASB”) issued Accounting Standards Update ("ASU") 2023-07, Segment Reporting (Topic 280): Improvements to Reportable Segment Disclosures (“ASU 2023-07”). ASU 2023-07 requires, among other updates, enhanced disclosures about significant segment expenses that are regularly provided to the chief operating decision maker. The following table providesASU also clarifies that entities with a brief descriptionsingle reportable segment are subject to both new and existing reporting requirements under Topic 280. This guidance is effective for fiscal years beginning after December 15, 2023, and interim periods within fiscal years beginning after December 15, 2024, and requires retrospective adoption. Early adoption is permitted. We are evaluating the impact of recently issued accounting pronouncements that could have a material effectthis guidance on our consolidated financial statements:statements and related disclosures.
In December 2023, the FASB issued ASU 2023-09, Income Taxes (Topic 740): Improvements to Income Tax Disclosures (“ASU 2023-09”). ASU 2023-09 updates income tax disclosures related to the rate reconciliation and requires disclosure of income taxes paid by jurisdiction. The ASU also makes several other changes to income tax disclosure requirements. The guidance is effective for fiscal years beginning after December 15, 2024. The guidance should be applied prospectively; however, retrospective application is permitted. Early adoption is permitted. We are evaluating the impact of this guidance on our consolidated financial statements and related disclosures.
| | | | | | | | | | | |
| PHILLIPS EDISON & COMPANY DECEMBER 31, 2023 FORM 10-K | | | | | | |
Standard | | Description | | Date of Adoption | | Effect on the Financial Statements or Other Significant Matters |
ASU 2017-09, Compensation - Stock Compensation (Topic 718): Scope of Modification Accounting | | This update clarifies guidance about which changes to the terms or conditions of a share-based payment award require an entity to apply modification accounting. | | January 1, 2018 | | We do not expect the adoption of this standard to have a material impact to our financial statements. We will apply the guidance to any future modifications of share-based compensation awards.
|
ASU 2017-05, Other Income - Gains and Losses from the Derecognition of Nonfinancial Assets (Subtopic 610-20) | | This update amends existing guidance in order to provide consistency in accounting for the derecognition of a business or nonprofit activity. It is effective for annual reporting periods beginning after December 15, 2017, but early adoption is permitted. | | January 1, 2018 | | We adopted this standard concurrently with ASU 2014-09, listed below. There are currently no transactions subject to this ASU. Although expected to be infrequent, potential transactions affected by this ASU could include a partial sale of real estate or contribution of a nonfinancial asset to form a joint venture.
|
ASU 2017-04, Intangibles - Goodwill and Other: Simplifying the Test for Goodwill Impairment (Topic 350) | | This update amends existing guidance in order to simplify impairment testing for goodwill. It is effective for annual reporting periods beginning after January 1, 2021, but early adoption is permitted. | | January 1, 2018 | | We are electing to adopt this standard as of January 1, 2018. The adoption of this standard will not have a material impact on our consolidated financial statements. |
ASU 2016-18, Statement of Cash Flows (Topic 230) | | This update amends existing guidance in order to clarify the classification and presentation of restricted cash on the statement of cash flows. It is effective for annual reporting periods beginning after December 15, 2017, but early adoption is permitted. | | January 1, 2018 | | Upon adoption, we will include amounts generally described as restricted cash within the beginning-of-period and end-of-period total amounts on the statement of cash flows. This change will not have a material impact on our consolidated financial statements. |
ASU 2016-15, Statement of Cash Flows (Topic 230) | | This update addresses the presentation of eight specific cash receipts and cash payments on the statement of cash flows. It is effective for annual reporting periods beginning after December 15, 2017, but early adoption is permitted. | | January 1, 2018 | | We have evaluated the impact the adoption of this standard will have on our consolidated financial statements. Of the eight specific cash receipts and cash payments listed within this guidance, we believe four would be applicable to our business as it stands currently: debt prepayment or debt extinguishment costs, contingent consideration payments made after a business combination, proceeds from settlement of insurance claims, and distributions received from equity method investees. This update will not have a material impact on our consolidated financial statements. We will apply the guidance for all of the eight cash flow types to any future transactions when applicable. |
ASU 2016-02, Leases (Topic 842) | | This update amends existing guidance by recognizing lease assets and lease liabilities on the balance sheet and disclosing key information about leasing arrangements. This update is effective for annual reporting periods beginning after December 15, 2018, but early adoption is permitted. | | January 1, 2019 | | We are currently evaluating the impact the adoption of this standard will have on our consolidated financial statements. We have identified areas within our accounting policies we believe could be impacted by the new standard. This standard impacts the lessor’s ability to capitalize certain costs related to leasing, which will result in a reduction in the amount of execution costs currently being capitalized in connection with leasing activities. In January 2018, the FASB issued a proposed ASU related to ASC 842. The update would allow lessors to use a practical expedient to account for non-lease components and related lease components as a single lease component instead of accounting for them separately, if certain conditions are met. This proposal is currently under consideration by regulators. We also expect to recognize right of use assets on our consolidated balance sheets related to certain ground leases, office space, and office equipment leases where we are the lessee. We will continue to evaluate the effect the adoption of ASU 2016-02 will have on our consolidated financial statements. However, we currently believe that the adoption of ASU 2016-02 will not have a material impact on our consolidated financial statements.F-15 |
| | |
| | | | | | |
ASU 2014-09, Revenue from Contracts with Customers (Topic 606) | | This update outlines a comprehensive model for entities to use in accounting for revenue arising from contracts with customers. ASU 2014-09 states that “an entity recognizes revenue to depict the transfer of promised goods or services to customers in an amount that reflects the consideration to which the entity expects to be entitled in exchange for those goods or services.” While ASU 2014-09 specifically references contracts with customers, it also applies to certain other transactions such as the sale of real estate or equipment. Expanded quantitative and qualitative disclosures are also required for contracts subject to ASU 2014-09. In 2015, the FASB provided for a one-year deferral of the effective date for ASU 2014-09, making it effective for annual reporting periods beginning after December 15, 2017. | | January 1, 2018 | | Our revenue-producing contracts are primarily leases that are not within the scope of this standard. As a result, we do not expect the adoption of this standard to have a material impact on our rental or reimbursement revenue. However, the standard will apply to a majority of our fees and management income. We have evaluated the impact of this standard to fees and management income and do not expect a material impact on our revenue recognition, but we do expect to provide additional disclosures around fees and management revenue. We are adopting this guidance on a modified retrospective basis.3. LEASES |
Lessor—The following table provides a brief description of newly adopted accounting pronouncements and their effect on our financial statements: |
| | | | | | |
Standard | | Description | | Date of Adoption | | Effect on the Financial Statements or Other Significant Matters |
ASU 2017-12, Derivatives and Hedging (Topic 815) | | This update amended existing guidance in order to better align a company’s financial reporting for hedging activities with the economic objectives of those activities. | | September 2017 | | Upon adoption, we included a disclosure related to the effect of our hedging activities on our consolidated statements of operations. This disclosure also eliminated the periodic measurement and recognition of hedging ineffectiveness. We adopted this guidance on a modified retrospective basis and applied an adjustment to Accumulated Other Comprehensive Income with a corresponding adjustment to the opening balance of Accumulated Deficit as of the beginning of 2017. For a more detailed discussion of this adoption, see Note 8. |
ASU 2017-01, Business Combinations
(Topic 805) | | This update amended existing guidance in order to clarify when an integrated set of assets and activities is considered a business. | | January 1, 2017 | | For a more detailed discussion of the effect of this adoption on our consolidated financial statements, refer to the Investment in Property and Lease Intangibles section above. |
On October 4, 2017, we completed the PELP transaction. The PELP transaction was approved by the independent special committeemajority of our Board, which had retained independent financialleases are largely similar in that the leased asset is retail space within our properties, and legal advisors. It was also approved by our shareholders, as well as PELP’s partners. Under the terms of this transaction, the following consideration was given in exchange for the contribution of PELP’s ownership interests in 76 shopping centers, its third-party investment management business,lease agreements generally contain similar provisions and its captive insurance company (in thousands): |
| | | |
| | Amount |
| Fair value of Operating Partnership units (“OP units”) issued | $ | 401,630 |
|
| Debt assumed: | |
| Corporate debt | 432,091 |
|
| Mortgages and notes payable | 72,649 |
|
| Cash payments | 30,420 |
|
| Fair value of earn-out | 38,000 |
|
| Total consideration | 974,790 |
|
| PELP debt repaid by the Company on the transaction date | (432,091 | ) |
| Net consideration | $ | 542,699 |
|
We issued 39.4 million OP units with an estimated fair value per unit of $10.20 at the time of the transaction. Certainfeatures, without substantial variations. All of our executive officers who received OP unitsleases are currently classified as part of the PELP transaction entered into an agreement which provides that they will not transfer their OP Units for either two or three years following the closing. The remaining holders of the OP units are subject to the terms of exchange for shares of common stock outlined in the Third Amended and Restated Agreement of Limited Partnership, which is further described in Note 11.
The terms of the transaction also include an earn-out structure with an opportunity for up to an additional 12.5 million OP units to be issued if certain milestones are achieved. The milestones areoperating leases. Lease income related to a liquidity event for our shareholders and fundraising targets in REIT III, of which PELPoperating leases was a co-sponsor. The estimated fair value of this earn-out has been recorded as $38 million as of the transaction date and is presented in Accounts Payable and Other Liabilities on the consolidated balance sheets. We will estimate the fair value of this earn-out liability at each reporting date during the contingency period and record any changes to our consolidated statement of operations.
As part of the transaction, we entered into a tax protection agreement with certain recipients of OP Units. Under the agreement, we will provide certain protections with respect to tax matters for a period of ten years commencing at the closing date. These protections include indemnification for certain tax liabilities incurred in connection with certain taxable transfers of contributed properties, failure to comply with certain obligations related to nonrecourse liability allocations and debt guarantee opportunities, and certain fundamental transactions. These fundamental transactions mean with respect to any contributed entity, a merger, combination, consolidation, or similar transaction (including a transfer of all or substantially all of the assets of such entity).
Immediately following the closing of the PELP transaction, our shareholders owned approximately 80.6% and former PELP shareholders owned approximately 19.4% of the combined company.
Assets Acquired and Liabilities Assumed—The PELP transaction has been accounted for using the acquisition method of accounting under ASC 805, Business Combinations, which requires, among other things, the assets acquired and liabilities assumed to be recognized at their fair values as of the acquisition date. The preliminary fair market value of the assets acquired and liabilities assumed is based on a valuation report prepared by a third-party valuation specialist. The following table summarizes the purchase price allocation based on that report (in thousands): |
| | | |
| | Amount |
| Assets: | |
| Land and improvements | $ | 269,140 |
|
| Building and improvements | 574,154 |
|
| Intangible lease assets | 93,506 |
|
| Cash | 5,930 |
|
| Accounts receivable and other assets | 42,426 |
|
| Management contracts | 58,000 |
|
| Goodwill | 29,085 |
|
| Total assets acquired | 1,072,241 |
|
| Liabilities: | |
| Accounts payable and other liabilities | 48,342 |
|
| Acquired below-market leases | 49,109 |
|
| Total liabilities acquired | 97,451 |
|
| Net assets acquired | $ | 974,790 |
|
The allocation of the purchase price is based on management’s assessment, which may change in the future as more information becomes available and could have an impact on the unaudited pro forma financial information presented below. Subsequent adjustments made to the purchase price allocation upon the completion of our fair value assessment process will not exceed one year from the acquisition date. The allocation of the purchase price above requires a significant amount of judgment and represents management’s best estimate of the fair value as of the acquisition date.
Intangible Assets and Liabilities—The fair value and weighted-average amortization periods for the intangible assets and liabilities acquired in the PELP transaction are as follows (dollars in thousands, useful life in years): |
| | | | |
| | Fair Value | Weighted-Average Useful Life |
| Management contracts | $ | 58,000 |
| 5 |
| Acquired in-place leases | 83,305 |
| 9 |
| Acquired above-market leases | 10,201 |
| 7 |
| Acquired below-market leases | (49,109 | ) | 13 |
Goodwill—In connection with the PELP transaction, we recorded goodwill of $29.1 million as a result of the consideration exceeding the fair value of the net assets acquired. Goodwill represents the estimated future benefits arising from other assets acquired that could not be individually identified and separately recognized. We do not expect that the goodwill will be deductible for tax purposes. The goodwill recorded represents our management structure and its ability to generate additional opportunities for revenue and raise additional funds, and therefore the full amount of goodwill was allocated to the Investment Management segment, which comprises one reporting unit.
Results of Operations—The consolidated net assets and results of operations of PELP’s contributions are included in the consolidated financial statements from October 4, 2017, going forward and resulted in the following impact to Total Revenues and Net Loss (in thousands): |
| | | |
| | 2017 |
| Revenues | $ | 21,202 |
|
| Net income | 1,297 |
|
Acquisition Costs—We incurred $15.7 million of costs related to the PELP transaction during 2017, which are recorded in Transaction Expenses on the consolidated statements of operations. We also incurred $1.3 million of costs related to the PELP transaction during 2016, which are recorded in Acquisition Expenses on the consolidated statements of operations.
Pro Forma Results (Unaudited)—The following unaudited pro forma information summarizes selected financial information from our combined results of operations, as if the PELP transaction had occurred on January 1, 2016. These results contain certain, nonrecurring adjustments, such as the elimination of transaction expenses incurred related to the PELP transaction and the elimination of intercompany activity related to creating an internalized management structure. This pro forma information is presented for informational purposes only, and may not be indicative of what actual results of operations would have been had the PELP transaction occurred at the beginning of the period, nor does it purport to represent the results of future operations. |
| | | | | | | |
| | For the Year Ended December 31, |
| (in thousands) | 2017 | | 2016 |
| Pro forma revenues | $ | 402,898 |
| | $ | 400,089 |
|
| Pro forma net income (loss) attributable to stockholders | 1,982 |
| | (3,956 | ) |
|
|
4. REAL ESTATE ACQUISITIONS AND DISPOSITIONS |
During the year ended December 31, 2017, we acquired 84 shopping centers, including 76 shopping centers through the PELP transaction (see Note 3 for more detail) and eight grocery-anchored shopping centers outside of the PELP transaction. Our first quarter acquisition closed out the IRC reverse Section 1031 like-kind exchange outstanding as of December 31, 2016. For the year ended December 31, 2016, we acquired seven grocery-anchored shopping centers and additional real estate adjacent to previously acquired centers.
For the years ended December 31, 20172023, 2022, and 2016,2021 (in thousands):
| | | | | | | | | | | | | | | | | |
| 2023 | | 2022 | | 2021 |
Rental income related to fixed lease payments(1) | $ | 446,576 | | | $ | 416,865 | | | $ | 382,667 | |
Rental income related to variable lease payments(1)(2) | 138,691 | | | 127,316 | | | 119,077 | |
Straight-line rent amortization(3) | 9,539 | | | 11,668 | | | 9,005 | |
| Amortization of lease assets | 5,126 | | | 4,266 | | | 3,539 | |
| Lease buyout income | 1,222 | | | 2,414 | | | 3,485 | |
Adjustments for collectibility(4) | (3,653) | | | (1,991) | | | 1,722 | |
| Total rental income | $ | 597,501 | | | $ | 560,538 | | | $ | 519,495 | |
(1)Includes rental income related to lease payments before assessing for collectibility.
(2)Variable payments are primarily related to tenant recovery income.
(3)Includes revenue adjustments to straight-line rent for tenants considered non-creditworthy.
(4)Includes general reserves as well as adjustments for tenants considered non-creditworthy for which we allocatedare recording revenue on a cash basis, per ASC 842.
Approximate future fixed contractual lease payments to be received under non-cancelable operating leases in effect as of December 31, 2023, assuming no new or renegotiated leases or option extensions on lease agreements, and including the purchaseimpact of rent abatements and tenants who have been moved to the cash basis of accounting for revenue recognition purposes, are as follows (in thousands):
| | | | | |
| Year | Amount |
| 2024 | $ | 458,756 | |
| 2025 | 410,401 | |
| 2026 | 344,405 | |
| 2027 | 277,629 | |
| 2028 | 206,567 | |
| Thereafter | 534,910 | |
| Total | $ | 2,232,668 | |
No single tenant comprised 10% or more of our aggregate annualized base rent (“ABR”) as of December 31, 2023. As of December 31, 2023, our wholly-owned real estate investments in Florida and California represented 12.0% and 11.0% of our ABR, respectively. As a result, the geographic concentration of our portfolio makes it particularly susceptible to adverse weather or economic events in the Florida (see “Hurricane Ian” in Note 4) and California real estate markets.
Lessee—Lease assets and liabilities, grouped by balance sheet line where they are recorded, consisted of the following as of December 31, 2023 and 2022 (in thousands):
| | | | | | | | | | | | | | |
| Balance Sheet Information | Balance Sheet Location | 2023 | | 2022 |
| ROU assets, net - operating leases | Investment in Real Estate | $ | 3,734 | | | $ | 3,832 | |
| ROU assets, net - operating and finance leases | Other Assets, Net | 1,323 | | | 1,022 | |
| Operating lease liability | Accounts Payable and Other Liabilities | 5,094 | | | 4,705 | |
| Finance lease liability | Debt Obligations, Net | 308 | | | 585 | |
As of December 31, 2023, the weighted-average remaining lease term was approximately 1.2 years for finance leases and 20.5 years for operating leases. The weighted-average discount rate was 3.6% for finance leases and 4.7% for operating leases.
| | | | | | | | | | | |
| PHILLIPS EDISON & COMPANY DECEMBER 31, 2023 FORM 10-K | | | F-16 |
Future undiscounted payments for fixed lease charges by lease type, inclusive of options reasonably certain to be exercised, are as follows as of December 31, 2023 (in thousands):
| | | | | | | | | | | |
| Undiscounted |
| Year | Operating | | Finance |
| 2024 | $ | 650 | | | $ | 295 | |
| 2025 | 423 | | | 16 | |
| 2026 | 363 | | | 9 | |
| 2027 | 366 | | | — | |
| 2028 | 377 | | | — | |
| Thereafter | 5,772 | | | — | |
| Total undiscounted cash flows from leases | 7,951 | | | 320 | |
| Total lease liabilities recorded at present value | 5,094 | | | 308 | |
| Difference between undiscounted cash flows and present value of lease liabilities | $ | 2,857 | | | $ | 12 | |
Acquisitions—The following table summarizes our real estate acquisition activity for the years ended December 31, 2023, 2022, and 2021 (dollars in thousands):
| | | | | | | | | | | | | | | | | |
| 2023 | | 2022 | | 2021 |
| Number of properties acquired | 11 | | | 7 | | | 9 | |
Number of outparcels acquired(1) | 3 | | | 4 | | | 5 | |
| Contract price | $ | 278,480 | | | $ | 280,515 | | | $ | 307,551 | |
Total price of acquisitions(2) | 270,262 | | | 282,000 | | | 308,358 | |
(1)Outparcels acquired are adjacent to shopping centers that we own.
(2)Total price of acquisitions unrelated to the PELP transaction, including acquisitionincludes closing costs for 2017, to the fair valueless credits and assumed debt obligations.
The aggregate purchase price of the assets acquired during the years ended December 31, 2023 and liabilities assumed2022 were allocated as follows (in thousands):
| | | | | | | | | | | |
| 2023 | | 2022 |
| ASSETS | | | |
| Land and improvements | $ | 80,701 | | | $ | 87,762 | |
| Building and improvements | 180,155 | | | 180,365 | |
| In-place lease assets | 26,690 | | | 24,408 | |
| Above-market lease assets | 2,688 | | | 3,903 | |
| Below-market debt | 444 | | | — | |
| Total assets | 290,678 | | | 296,438 | |
| | | |
| LIABILITIES | | | |
| Debt obligations, net | 9,614 | | | — | |
| Below-market lease liabilities | 10,802 | | | 14,438 | |
| Total liabilities | 20,416 | | | 14,438 | |
| | | |
| Net assets acquired | $ | 270,262 | | | $ | 282,000 | |
|
| | | | | | | |
| | 2017 | | 2016 |
| Land and improvements | $ | 47,556 |
| | $ | 78,908 |
|
| Building and improvements | 130,482 |
| | 140,145 |
|
| Acquired in-place leases | 17,740 |
| | 21,506 |
|
| Acquired above-market leases | 1,314 |
| | 3,559 |
|
| Acquired below-market leases | (5,736 | ) | | (10,198 | ) |
| Total assets and lease liabilities acquired | 191,356 |
| | 233,920 |
|
| Less: Fair value of assumed debt at acquisition | 30,831 |
| | 33,326 |
|
| Net assets acquired | $ | 160,525 |
| | $ | 200,594 |
|
| | | | | | | | | | | |
| PHILLIPS EDISON & COMPANY DECEMBER 31, 2023 FORM 10-K | | | F-17 |
The weighted-average amortization periods for in-place, above-market, and below-market lease intangibles
and below-market debt acquired during the years ended December 31,
20172023 and
2016,2022 are as follows (in years):
| | | | 2017 | | 2016 |
| 2023 | | | 2023 | | 2022 |
| Acquired in-place leases | 13 | | 11 | Acquired in-place leases | 12 | | 12 |
| Acquired above-market leases | 6 | | 6 | Acquired above-market leases | 9 | | 8 |
| Acquired below-market leases | 18 | | 19 | Acquired below-market leases | 18 | | 21 |
| Assumed below-market debt | | Assumed below-market debt | 2 | | — |
Property Dispositions—In October 2017, we soldThe following table summarizes our real estate disposition activity for the years ended December 31, 2023, 2022, and 2021 (dollars in thousands):
| | | | | | | | | | | | | | | | | |
| 2023 | | 2022 | | 2021 |
Number of properties sold(1) | 1 | | | 4 | | | 24 | |
Number of outparcels sold(2)(3) | 2 | | | 4 | | | 4 | |
| Contract price | $ | 6,250 | | | $ | 53,987 | | | $ | 216,052 | |
Proceeds from sale of real estate, net(4)(5) | 7,208 | | | 52,019 | | | 206,377 | |
Gain on sale of property, net(5)(6) | 1,110 | | | 7,517 | | | 34,309 | |
(1)We retained one outparcel related to a property sale during the year ended December 31, 2021 and therefore the sale did not result in a reduction in our total property count.
(2)During the year ended December 31, 2021, our outparcel sales included: (i) the only remaining portion of one of our properties, which resulted in a reduction in our total property count; and (ii) an undeveloped parcel of land, as well as two outparcels adjacent to two of our centers, none of which resulted in a reduction in our total property count.
(3)In addition to the four outparcels sold during the year ended December 31, 2021, a tenant at one of our properties exercised a bargain purchase option to acquire a parcel of land that we previously owned. This generated minimal proceeds for $6.5 million and recognized a gainus.
(4)Total proceeds from sale of $1.8 million. For tax-purposes, we deferredreal estate, net includes closing costs less credits.
(5)Activity for the gain through an IRC Section 1031 like-kind exchange, which was completed with our subsequent acquisitionyear ended December 31, 2023 includes land acquired from us by local authorities.
(6)During the year ended December 31, 2021, Gain on Disposal of Shoppes of Lake Village in February 2018 (see Note 20). We also sold a property in December 2016 and recognized a gain of $4.7 million. Gains on property dispositions are recorded in Other Income,Property, Net on the consolidated statements of operations.operations includes miscellaneous write-off activity, which is not included in gain on sale of property, net, presented above.
Hurricane Ian - On September 28, 2022, Hurricane Ian struck the southeast United States and caused various amounts of damage to our properties located in the region. During 2022, we recorded gross cumulative accelerated depreciation of $2.7 million for damages sustained to the properties, which was reduced by insurance recoveries $1.0 million (net of deductibles and self-insurance of $1.7 million) collected in 2023. As of December 31, 2022, we had a receivable balance of $1.0 million, which was recorded in Other Assets, Net on our consolidated balance sheets.
| | |
|
5. INTANGIBLE ASSETS AND LIABILITIES AND GOODWILL |
AcquiredGoodwill—During the years ended December 31, 2023, 2022, and 2021, we recorded no impairments to goodwill.
Other Intangible Assets and Liabilities—AcquiredOther intangible assets and liabilities consisted of the following as of December 31, 20172023 and 20162022 (in thousands): |
| | | | | | | | | | | | | | | |
| | 2017 | | 2016 |
| | Gross Amount | | Accumulated Amortization | | Gross Amount | | Accumulated Amortization |
| Management contracts | $ | 58,000 |
| | $ | (2,900 | ) | | $ | — |
| | $ | — |
|
| Acquired in-place leases | 313,432 |
| | (123,314 | ) | | 212,916 |
| | (92,347 | ) |
| Acquired above-market leases | 53,524 |
| | (24,631 | ) | | 42,009 |
| | (19,443 | ) |
| Below-market lease liabilities | (118,012 | ) | | 27,388 |
| | (63,287 | ) | | 20,255 |
|
| | | | | | | | | | | | | | | | | | | | | | | |
| | 2023 | | 2022 |
| Gross Amount | | Accumulated Amortization | | Gross Amount | | Accumulated Amortization |
| Corporate intangible assets | $ | 6,686 | | | $ | (5,994) | | | $ | 6,692 | | | $ | (5,636) | |
| In-place leases | 495,525 | | | (295,957) | | | 471,507 | | | (262,650) | |
| Above-market leases | 74,446 | | | (57,964) | | | 71,954 | | | (52,230) | |
| Below-market lease liabilities | (182,689) | | | 74,466 | | | (173,878) | | | 64,079 | |
Above-market contract(1) | (2,496) | | | 499 | | | (2,496) | | | — | |
(1)Recorded in Accounts Payable and Other Liabilities on our consolidated balance sheets.
Summarized below is the amortization recorded on theother intangible assets and liabilities for the years ended December 31, 2017, 2016,2023, 2022, and 20152021 (in thousands):
|
| | | | | | | | | | | |
| | 2017 | | 2016 | | 2015 |
| Management contracts | $ | 2,900 |
| | $ | — |
| | $ | — |
|
| Acquired in-place leases | 30,966 |
| | 28,812 |
| | 29,970 |
|
| Acquired above-market leases | 5,188 |
| | 5,228 |
| | 5,819 |
|
| Acquired below-market leases | (7,133 | ) | | (6,436 | ) | | (6,640 | ) |
| Total | $ | 31,921 |
| | $ | 27,604 |
| | $ | 29,149 |
|
| | | | | | | | | | | |
| PHILLIPS EDISON & COMPANY DECEMBER 31, 2023 FORM 10-K | | | F-18 |
| | | | | | | | | | | | | | | | | |
| 2023 | | 2022 | | 2021 |
| Corporate intangible assets | $ | 361 | | | $ | 364 | | | $ | 372 | |
| In-place leases | 34,380 | | | 36,851 | | | 34,221 | |
| Above-market leases | 5,865 | | | 6,485 | | | 6,319 | |
| Below-market lease liabilities | (11,044) | | | (10,809) | | | (9,900) | |
| Above-market contract | (499) | | | — | | | — | |
Estimated future amortization of the respective acquiredother intangible assets and liabilities as of December 31, 2017,2023, excluding estimated amounts related to properties classified as held for sale, for each of the next five years is as followfollows (in thousands):
| | | | | | | | | | | | | | | | | | | | | | | | | | | | | |
| Corporate Intangible Assets | | In-Place Leases | | Above-Market Leases | | Below-Market Lease Liabilities | | Above-Market Contract |
| 2024 | $ | 360 | | | $ | 32,970 | | | $ | 4,928 | | | $ | (10,689) | | | $ | (499) | |
| 2025 | 325 | | | 28,281 | | | 3,561 | | | (9,873) | | | (499) | |
| 2026 | 5 | | | 23,959 | | | 2,418 | | | (9,122) | | | (499) | |
| 2027 | 1 | | | 20,805 | | | 1,691 | | | (8,699) | | | (499) | |
| 2028 | — | | | 17,473 | | | 1,160 | | | (8,227) | | | — | |
| | |
| 6. INVESTMENTS IN UNCONSOLIDATED JOINT VENTURES |
|
| | | | | | | | | | | | | | | |
| | Management Contracts | | In-Place Leases | | Above-Market Leases | | Below-Market Leases |
| 2018 | $ | 11,600 |
| | $ | 35,572 |
| | $ | 5,883 |
| | $ | (9,801 | ) |
| 2019 | 11,600 |
| | 30,270 |
| | 5,145 |
| | (8,959 | ) |
| 2020 | 11,600 |
| | 24,794 |
| | 4,583 |
| | (8,389 | ) |
| 2021 | 11,600 |
| | 20,086 |
| | 3,715 |
| | (7,644 | ) |
| 2022 | 8,700 |
| | 16,778 |
| | 2,761 |
| | (6,925 | ) |
Goodwill—In connection with a 2019 merger, we assumed a 10% equity interest in Grocery Retail Partners II LLC (“GRP II”) with a fair value of $5.4 million at acquisition. GRP II was initially formed in November 2018 pursuant to the PELPterms of a joint venture agreement and is set to expire ten years after the date of the joint venture contribution agreement unless otherwise extended by the members.
In October 2020, GRP I acquired GRP II. As a part of the transaction, the carrying amount of our investment in GRP II was contributed to GRP I as consideration for an additional interest in GRP I. Our ownership interest in GRP I upon consummation of the transaction was adjusted to approximately 14% as a result of the acquisition.
Necessity Retail Partners—As of December 31, 2023, we recorded goodwillowned a 20% equity interest in Necessity Retail Partners (“NRP”). NRP was initially formed in March 2016 pursuant to the terms of approximately $29.1a joint venture agreement, as amended, between Phillips Edison Grocery Center REIT II, Inc. and an affiliate of TPG Real Estate and is set to expire in 2024 unless otherwise extended by the members. In May 2022, we sold the final property in the joint venture. With the monetization of the joint venture, we exceeded the targeted return and as such were paid compensation of $0.1 million, which was allocated to our Investment Management segment. During$2.7 million, and $0.7 million for the yearyears ended December 31, 2017, we did not record any impairments2023, 2022, and 2021, respectively, which is recorded in Fees and Management Income on our consolidated statements of operations.
The following table summarizes balances on the consolidated balance sheets related to goodwill. For more information regarding goodwill from the PELP transaction, see Note 3.our unconsolidated joint ventures as of December 31, 2023 and 2022 (dollars in thousands):
| | | | | | | | | | | | | | | | | | | | | | | | | | | | | | | | | | | |
| 2023 | | 2022 |
| Joint Venture | Ownership Percentage | | Number of Shopping Centers | | Investment Balance | | Ownership Percentage | | Number of Shopping Centers | | Investment Balance |
| GRP I | 14 | % | | 20 | | $ | 24,701 | | | 14 | % | | 20 | | $ | 26,576 | |
| NRP | 20 | % | | — | | | 519 | | | 20 | % | | — | | | 625 | |
| | | | | | | | | | | |
| PHILLIPS EDISON & COMPANY DECEMBER 31, 2023 FORM 10-K | | | F-19 |
The following table summarizes the activity on the consolidated statements of operations related to our unconsolidated joint ventures as of December 31, 2023, 2022, and 2021 (in thousands):
| | | | | | | | | | | | | | | | | |
| 2023 | | 2022 | | 2021 |
| Distributions to PECO After Formation or Assumption | | | | | |
| GRP I | $ | 2,156 | | | $ | 2,295 | | | $ | 2,598 | |
| NRP | 84 | | | 3,109 | | | 5,137 | |
| | | | | |
Gain (Loss) from Unconsolidated Joint Ventures(1) | | | | | |
| GRP I | $ | 281 | | | $ | 246 | | | $ | 162 | |
| NRP | (21) | | | 1,253 | | | 2,695 | |
| | | | | |
Amortization and Write-Off of Basis Differences(1) | | | | | |
| NRP | $ | — | | | $ | 219 | | | $ | 1,162 | |
(1)Recorded in Other Expense, Net in the consolidated statements of operations.
The following is a summary of Other Assets, Net outstanding as of December 31, 20172023 and 20162022 (in thousands): |
| | | | | | | |
| | 2017 | | 2016 |
| Deferred leasing commissions and costs | $ | 29,055 |
| | $ | 21,092 |
|
| Deferred financing costs | 13,971 |
| | 8,940 |
|
| Office equipment and other | 10,308 |
| | 331 |
|
| Total depreciable and amortizable assets | 53,334 |
| | 30,363 |
|
| Accumulated depreciation and amortization | (17,121 | ) | | (11,286 | ) |
| Net depreciable and amortizable assets | 36,213 |
| | 19,077 |
|
| Accounts receivable, net | 41,211 |
| | 31,029 |
|
| Deferred rent receivable, net | 18,201 |
| | 14,483 |
|
| Derivative asset | 16,496 |
| | 11,916 |
|
| Prepaid expenses | 4,232 |
| | 2,986 |
|
| Investment in affiliates | 902 |
| | — |
|
| Other | 1,193 |
| | 1,094 |
|
| Other assets, net | $ | 118,448 |
|
| $ | 80,585 |
|
| | | | | | | | | | | |
| 2023 | | 2022 |
| Other assets, net: | | | |
| Deferred leasing commissions and costs | $ | 53,379 | | | $ | 49,687 | |
Deferred financing expenses(1) | 8,984 | | | 8,984 | |
| Office equipment, including capital lease assets, and other | 24,073 | | | 23,051 | |
| Corporate intangible assets | 6,686 | | | 6,692 | |
| Total depreciable and amortizable assets | 93,122 | | | 88,414 | |
| Accumulated depreciation and amortization | (53,205) | | | (47,483) | |
| Net depreciable and amortizable assets | 39,917 | | | 40,931 | |
Accounts receivable, net(2) | 44,548 | | | 37,274 | |
| Accounts receivable - affiliates | 803 | | | 513 | |
Deferred rent receivable, net(3) | 62,288 | | | 52,141 | |
| Derivative assets | 12,669 | | | 25,853 | |
| Prepaid expenses and other | 10,745 | | | 14,575 | |
Investment in third parties(4) | 6,875 | | | 9,800 | |
| Investment in marketable securities | 8,566 | | | 7,792 | |
| Total other assets, net | $ | 186,411 | | | $ | 188,879 | |
(1)Deferred financing expenses per the above table are related to our revolving credit facility, and as such we have elected to classify them as an asset rather than as a contra-liability.
(2)Net of $1.9 million and $3.0 million of general reserves for uncollectible amounts as of December 31, 2023 and 2022, respectively. Receivables that were removed for tenants considered to be non-creditworthy were $6.0 million and $6.2 million as of December 31, 2023 and 2022, respectively. (3)Net of $4.6 million and $4.2 million of receivables removed as of December 31, 2023 and 2022, respectively, related to straight-line rent for tenants previously or currently considered to be non-creditworthy.
(4)We recorded an impairment of our investment in a third-party company of $3.0 million in Other Expense, Net on our consolidated statement of operations for the year ended December 31, 2023 (see Note 15).
| | | | | | | | | | | |
| PHILLIPS EDISON & COMPANY DECEMBER 31, 2023 FORM 10-K |
| 7. DEBT OBLIGATIONS | F-20 |
The following is a summary of the outstanding principal balances and interest rates, which
includeincludes the effect of derivative financial instruments,
onfor our debt obligations as of December 31,
20172023 and
2016 (in2022 (dollars in thousands):
|
| | | | | | | | | |
| | Interest Rate | | 2017 | | 2016 |
Revolving credit facility(1) | 2.89% | | $ | 61,569 |
| | $ | 176,969 |
|
Term loans(2)(3) | 2.46%-3.93% | | 1,140,000 |
| | 655,000 |
|
| Secured loan facility due 2026 | 3.55% | | 175,000 |
| | — |
|
| Secured loan facility due 2027 | 3.52% | | 195,000 |
| | — |
|
| Mortgages and notes payable | 3.75%-7.91% | | 246,217 |
| | 228,721 |
|
Assumed market debt adjustments, net(4) | | | 5,254 |
| | 4,490 |
|
Deferred financing costs(5) | | | (16,042 | ) | | (9,024 | ) |
| Total | | | $ | 1,806,998 |
| | $ | 1,056,156 |
|
| | | | | | | | | | | | | | | | | |
| | Interest Rate(1) | | 2023 | | 2022 |
| Revolving credit facility | SOFR + 1.1% | | $ | 181,000 | | | $ | 79,000 | |
Term loans(2) | 3.3% - 6.7% | | 964,750 | | | 955,000 | |
| Senior unsecured notes due 2031 | 2.6% | | 350,000 | | | 350,000 | |
| Secured loan facilities | 3.4% - 3.5% | | 395,000 | | | 395,000 | |
| Mortgages | 3.5% - 6.4% | | 95,677 | | | 133,199 | |
| Finance lease liability | | | 308 | | | 585 | |
| Discount on notes payable | | | (6,302) | | | (7,001) | |
| Assumed market debt adjustments, net | | | (858) | | | (1,226) | |
| Deferred financing expenses, net | | | (10,303) | | | (7,963) | |
| Total | | | $ | 1,969,272 | | | $ | 1,896,594 | |
| | | | | |
Weighted-average interest rate(3) | | | 4.2 | % | | 3.6 | % |
| |
(1)(1)Interest rates are as of December 31, 2023. (2)Our term loans carry an interest rate of the Secured Overnight Financing Rate (“SOFR”) plus a spread. While most of the rates are fixed through the use of swaps, a portion of these loans are not subject to a swap, and thus are still indexed to SOFR. (3)Includes the effects of derivative financial instruments (see Notes 9 and 16). 2023 Debt Activity—On July 31, 2023, we amended three senior unsecured term loans with a total notional amount of $475 million scheduled to mature during 2024. The three senior unsecured term loans, as amended, have a total notional amount of $484.8 million. The $161.8 million unsecured term loan is priced based on a leverage grid, which is currently at SOFR plus 1.35% and is scheduled to mature on January 31, 2026 extendable with two one-year options to 2028. The $158 million and $165 million unsecured term loans are priced based on a leverage grid, which is currently at SOFR plus 1.35% and mature on January 31, 2027. During the year ended December 31, 2023, we repaid $47.3 million in mortgage debt. 2022 Debt Activity—In May 2022, we amended our credit facility agreement (the “Amendment”) to, among other things, increase the total amount available under our unsecured revolving credit facility from $500 million to $800 million. The unsecured revolving credit facility also includes an accordion feature that permits us to increase our aggregate borrowing capacity thereunder to up to $1 billion, subject to the satisfaction of certain conditions. The unsecured revolving credit facility is scheduled to mature in January 2026, extendable at our option to January 2027. In addition to expanding the borrowing capacity, the Amendment replaced the London Interbank Offered Rate (“LIBOR”) with SOFR as the benchmark interest rate for the unsecured revolving credit facility and the two $240 million senior unsecured term loan tranches, maturing in November 2025 and July 2026. In August 2022, we amended two of our interest rate swaps with a total notional amount of $430 million to replace LIBOR with SOFR as the benchmark interest rate in conjunction with the Amendment (see Note 9). In November 2022, we amended our three remaining LIBOR term loans with a notional amount of $475 million to replace LIBOR with SOFR as the benchmark interest rate. In December 2022, our two remaining LIBOR swaps with a total notional amount of $325 million were amended to transition from LIBOR to SOFR as the benchmark interest rate (see Note 9). During the year ended December 31, 2022, we repaid $80.1 million in mortgage debt. Revolving Credit Facility—We have an $800 million senior unsecured revolving credit facility with availability of $606.6 million, which is net of current letters of credit, as of December 31, 2023. The maturity date is January 2026, and we pay a facility fee of 0.25% on the total amount under the facility. Term Loans—We have five unsecured term loans with maturities ranging from 2025 to 2027. Our term loans have interest rates of SOFR plus interest rate spreads based on our investment grade rating. We have utilized interest rate swaps to fix the rates on the majority of our term loans, with $264.8 million in term loans not fixed through such swaps. | The gross borrowings under our revolving credit facility were $437.0 million, $590.8 million, and $297.8 million during the years ended December 31, 2017, 2016, and 2015, respectively. The gross payments on our revolving credit facility were $552.4 million, $554.8 million, and $448.5 million during the years ended December 31, 2017, 2016, and 2015, respectively. The revolving credit facility had a capacity of $500 million as of December 31, 2017 and 2016. In October 2017, the maturity date of the revolving credit facility was extended to October 2021, with additional options to extend the maturity to October 2022.
|
| |
(2)
| We have six term loans with maturities ranging from 2019 to 2024. The $100 million term loan maturing in February 2019 has options to extend the maturity to 2021. We will consider options for refinancing the loan or exercising the option upon maturity. As of December 31, 2017, the availability on our revolving credit facility exceeded the balance on the loan maturing in 2019. The term loan maturing in 2020 also has options to extend its maturity to 2021.
|
| |
(3)
| One of our term loans that matures in 2022 had an outstanding balance of $310.0 million at December 31, 2017, with a capacity of $375.0 million. In January 2018 an additional $65.0 million was drawn on this term loan.
|
| |
(4)
| Net of accumulated amortization of $3.7 million and $6.1 million as of December 31, 2017 and 2016, respectively. The decrease in accumulated amortization is a result of a reduction in market debt adjustments due to the extinguishment of higher-rate mortgage debt during the year ended December 31, 2017.
|
| |
(5)
| Net of accumulated amortization of $5.4 million and $3.9 million as of December 31, 2017 and 2016, respectively.
|
As of December 31, 20172023 and 2016,2022, the weighted-average interest rate, for allincluding the impact of swaps, on our mortgagesterm loans was 4.7% and loans payable was 3.4% and 3.0%3.8%, respectively.
Secured Debt—Our secured debt includes two facilities secured by certain properties in our portfolio, mortgage loans secured by individual properties, and finance leases. The interest rates on our secured debt are fixed. As of December 31, 2023 and 2022, our weighted average interest rate for our secured debt was 3.7% and 3.8%, respectively.
| | | | | | | | | | | |
| PHILLIPS EDISON & COMPANY DECEMBER 31, 2023 FORM 10-K | | | F-21 |
Debt Allocation—The allocation of total debt between fixed-fixed-rate and variable-rate as well as between secured and unsecured, excluding market debt adjustments, discount on senior notes, and deferred financing costs,expenses, net, and including the effects of derivative financial instruments as of December 31, 20172023 and 2016,2022, is summarized below (in thousands): | | | | | | | | 2023 | | 2022 |
| | 2017 | | 2016 |
As to interest rate:(1) | | | |
| Fixed-rate debt | $ | 1,608,217 |
| | $ | 615,721 |
|
| As to interest rate: | |
Fixed-rate debt(1) | |
Fixed-rate debt(1) | |
Fixed-rate debt(1) | |
| Variable-rate debt | 209,569 |
| | 444,969 |
|
| Total | $ | 1,817,786 |
| | $ | 1,060,690 |
|
| As to collateralization: | | | |
| Unsecured debt | $ | 1,202,476 |
| | $ | 831,969 |
|
| Unsecured debt | |
| Unsecured debt | |
| Secured debt | 615,310 |
| | 228,721 |
|
| Total | $ | 1,817,786 |
| | $ | 1,060,690 |
|
| |
(1)
| Includes the effects of derivative financial instruments (see Notes 8 and 17).
|
(1)Fixed-rate debt includes, and variable-rate debt excludes, the portion of such debt that has been hedged by interest rate derivatives. As of December 31, 2023, $700 million in variable rate debt is hedged to a fixed rate for a weighted-average period of 1.5 years (see Notes 9 and 16).
Maturity Schedule—Below is our maturity schedule with the respective principal payment obligations, excluding finance lease liabilities, market debt adjustments, discount on senior notes, and deferred financing costsexpenses, net (in thousands):
| | | | | | | | | | | | | | | | | | | | | | | | | | | | | | | | | | | | | | | | | |
| | 2024 | | 2025 | | 2026 | | 2027 | | 2028 | | Thereafter | | Total |
| | | | | | | | | | | | | |
Unsecured debt(1) | $ | — | | | $ | 240,000 | | | $ | 582,750 | | | $ | 323,000 | | | $ | — | | | $ | 350,000 | | | $ | 1,495,750 | |
| Secured debt | 28,123 | | | 37,636 | | | 1,908 | | | 200,595 | | | 17,367 | | | 205,048 | | | 490,677 | |
| Total | $ | 28,123 | | | $ | 277,636 | | | $ | 584,658 | | | $ | 523,595 | | | $ | 17,367 | | | $ | 555,048 | | | $ | 1,986,427 | |
|
| | | | | | | | | | | | | | | | | | | | | | | | | | | |
| | 2018 | | 2019 | | 2020 | | 2021 | | 2022 | | Thereafter | | Total |
| Revolving credit facility | $ | — |
| | $ | — |
| | $ | — |
| | $ | 61,569 |
| | $ | — |
| | $ | — |
| | $ | 61,569 |
|
| Term loans | — |
| | 100,000 |
| | 175,000 |
| | 125,000 |
| | 310,000 |
| | 430,000 |
| | 1,140,000 |
|
| Loan facility due 2026 | — |
| | — |
| | — |
| | — |
| | — |
| | 175,000 |
| | 175,000 |
|
| Loan facility due 2027 | — |
| | — |
| | — |
| | — |
| | — |
| | 195,000 |
| | 195,000 |
|
| Mortgages and notes payable | 8,142 |
| | 9,192 |
| | 7,323 |
| | 68,001 |
| | 31,169 |
| | 122,390 |
| | 246,217 |
|
| Total maturing debt | $ | 8,142 |
|
| $ | 109,192 |
|
| $ | 182,323 |
|
| $ | 254,570 |
|
| $ | 341,169 |
|
| $ | 922,390 |
|
| $ | 1,817,786 |
|
| | |
|
8.9. DERIVATIVES AND HEDGING ACTIVITIES |
In September 2017, we adopted ASU 2017-12, Derivatives and Hedging (Topic 815): Targeted Improvements to Accounting for Hedging Activities. This update amended existing guidance in order to better align a company’s financial reporting for hedging activities with the economic objectives of those activities. It requires us to disclose the effect of our hedging activities on our consolidated statements of operations and eliminates the periodic measurement and recognition of hedging ineffectiveness.
In accordance with the modified retrospective transition method required by ASU 2017-12, we recognized the cumulative effect of the change, representing the reversal of the $1.3 million cumulative ineffectiveness gain as of December 31, 2016, in the opening balance of Accumulated Other Comprehensive Income (“AOCI”) with a corresponding adjustment to the opening balance of Accumulated Deficit as of the beginning of 2017.
Risk Management Objective of Using Derivatives—We are exposed to certain risks arising from both our business operations and economic conditions. We principally manage our exposure to a wide variety of business and operational risks through management of our core business activities. We manage economic risks, including interest rate, liquidity, and credit risk, primarily by managing the amount, sources, and duration of our debt funding, and through the use of derivative financial instruments. Specifically, we enter into interest rate swaps to manage exposures that arise from business activities that result in the receipt or payment of future known and uncertain cash amounts, the value of which are determined by interest rates. Our derivative financial instruments are used to manage differences in the amount, timing, and duration of our known or expected cash receipts and our known or expected cash payments principally related to our investments and borrowings.
Cash Flow Hedges of Interest Rate Risk—Interest rate swaps designated as cash flow hedges involve the receipt of variable amounts from a counterparty in exchange for our making fixed-rate payments over the life of the agreements without exchange of the underlying notional amount.
The changes in the fair value of derivatives designated, and that qualify, as cash flow hedges are recorded in AOCI and are subsequently reclassified into earnings in the period that the hedged forecasted transaction affects earnings. During the years ended December 31, 20172023 and 2016,2022, such derivatives were used to hedge the variable cash flows associated with certain variable-rate debt. The ineffectiveness previously reported in earnings for the quarters ended March 31, 2017 and June 30, 2017, was adjusted to reflect application of the provisions of this ASU as of the beginning of 2017 (as discussed above). This adjustment was not material.
Amounts reported in AOCI related to these derivatives will be reclassified to Interest Expense, Net as interest payments are made on the variable-rate debt. During the next twelve months, we estimate that an additional $1.5$11.5 million will be reclassified from Other Comprehensive (Loss) IncomeAOCI as a decrease to Interest Expense, Net.
In May 2022, we replaced LIBOR with SOFR as the benchmark interest rate for the two $240 million senior unsecured term loan tranches, maturing in November 2025 and July 2026. In November 2022, we replaced LIBOR with SOFR as the benchmark interest rate for our three remaining LIBOR term loans, which had a notional amount of $475 million. In accordance with ASC Topic 848, Reference Rate Reform (“ASC 848”), we elected not to dedesignate our LIBOR denominated interest rate swaps related to this hedged debt. As a result of these changes in the benchmark rate of the LIBOR term loans, we amended all of our interest rate swaps with a total notional amount of $755 million to change the benchmark interest rate from LIBOR to SOFR. As a result of these amendments, we elected to apply practical expedients in accordance with ASC 848 related to contract modifications, changes in critical terms, and updates to the designated hedged risks as qualifying changes have been made to applicable debt and derivative contracts.
In March 2023, we entered into an interest rate swap which has a notional amount of $200 million and swaps SOFR for a fixed rate of approximately 3.36% which became effective in September 2023 and matures in September 2026.
In January 2024, we entered into an interest rate swap which has a notional amount of $150 million and swaps SOFR for a fixed rate of approximately 3.45% effective September 2024 and maturing December 2025.
| | | | | | | | | | | |
| PHILLIPS EDISON & COMPANY DECEMBER 31, 2023 FORM 10-K | | | F-22 |
The following is a summary of our interest rate swaps that were designated as cash flow hedges of interest rate risk as of December 31,
20172023 and
20162022 (notional amounts in thousands):
| | | | 2017 | | 2016(1) |
| 2023 | | | 2023 | | 2022 |
| Count | 6 |
| | 4 |
|
| Notional amount | $ | 992,000 |
| | $ | 642,000 |
|
| Fixed LIBOR | 1.2% - 2.2% |
| | 1.2% - 1.5% |
|
| Fixed SOFR | | Fixed SOFR | 2.1% - 3.4% | | 1.2% - 2.8% |
| Maturity date | 2019-2024 |
| | 2019 - 2023 |
| Maturity date | 2024 - 2026 | | 2023 - 2025 |
| Weighted-average term (in years) | | Weighted-average term (in years) | 1.5 | | 1.6 |
(1) One interest rate swap that we entered into in October 2016 with a notional amount of $255 million was not effective until July 2017.
The table below details the locationnature of the gain orand loss recognized on interest rate derivatives designated as cash flow hedges in the consolidated statements of operations and comprehensive (loss) income for the years ended December 31, 2017, 2016,2023, 2022, and 20152021 (in thousands): |
| | | | | | | | | | | |
| | 2017 | | 2016 | | 2015 |
| Amount of gain (loss) recognized in OCI on derivatives | $ | 2,770 |
| | $ | 6,979 |
| | $ | (3,128 | ) |
| Amount of loss reclassified from AOCI into interest expense | 1,810 |
| | 3,586 |
| | 3,150 |
|
| | | | | | | | | | | | | | | | | |
| | 2023 | | 2022 | | 2021 |
| Amount of gain recognized in Other Comprehensive (Loss) Income | $ | 8,586 | | | $ | 46,839 | | | $ | 12,501 | |
| Amount of (gain) loss reclassified from AOCI into Interest Expense, Net | (20,402) | | | 4,446 | | | 19,499 | |
Credit-risk-related Contingent Features—We have agreements with our derivative counterparties that contain provisions where, if we either default, or are capable of being declared in default, on any of our indebtedness, we could also be declared to be in default on our derivative obligations. As of December 31, 2017, the2023, there were no derivatives with a fair value of our derivatives in a net liability position, which includedwould include accrued interest but excludedexclude any adjustment for nonperformance risk related to these agreements, was approximately $0.1 million. As of December 31, 2017, we had not posted any collateral related to these agreements and were not in breach of any agreement provisions. If we had breached any of these provisions, we could have been required to settle our obligations under the agreements at their termination value of $0.1 million.agreements.
General—We have elected to be taxed as a REIT under the IRC. To qualify as a REIT, we must meet a number of organizationorganizational and operational requirements, including a requirement to annually distribute to our shareholdersstockholders at least 90% of our REIT taxable income, determined without regard to the dividends paid deduction and excluding net capital gains. We intend to continue to adhere to these requirements and to maintain our REIT status. As a REIT, we are entitled to a deduction for some or all of the distributions we pay to our shareholders.stockholders. Accordingly, we are generally subject to U.S. federal income taxes on any taxable income that is not currently distributed to our shareholders.stockholders. If we fail to qualify as a REIT in any taxable year, we will be subject to U.S. federal income taxes and may not be able to qualify as a REIT until the fifth subsequent taxable year.year following the year of disqualification.
Notwithstanding our qualification as a REIT, we may be subject to certain state and local taxes on our income or properties. In addition, our consolidated financial statements include the operations of one wholly owned subsidiarycertain wholly-owned entities that hashave jointly elected to be treated as a TRS entities and isare subject to U.S. federal, state, and local incomes taxes at regular corporate tax rates. We did not record any tax expense in prior years as 2017 was the first year of existence for the TRS. As a REIT, we may also be subject to certain U.S. federal excise taxes if we engage in certain types of transactions.
Income tax benefits from uncertain tax positions are recognized in the consolidated financial statements only if we believe it is more likely than not that the uncertain tax position will be sustained based solely on the technical merits of the tax position and consideration of the relevant taxing authority's widely understood administrative practices and precedents. We do not believe that we have any uncertain tax positions at December 31, 2023 and 2022.
The statute of limitations for the federal income tax returns remain open for the 2020 through 2022 tax years. The statute of limitations for state income tax returns remain open in accordance with each state's statute.
Our accounting policy is to classify interest and penalties as a component of income tax expense. We accrued an insignificant amount of interest and penalties as of December 31, 2023. We accrued an insignificant amount of interest and no penalties as of December 31, 2022.
Deferred Tax Assets and Liabilities—Deferred income taxes are accounted for under the asset and liability method. Deferred tax assets and liabilities are recognized for the estimated future tax consequences attributable to differences between the financial statement carrying amounts of existing assets and liabilities and their respective tax basis.bases. Deferred tax assets and liabilities are measured using enacted income tax rates in effect for the year in which these temporary differences are expected to reverse. Deferred tax assets are recognized only to the extent that it is more likely than not that they will be realized based on consideration of available evidence, including future reversal of existing taxable temporary differences, the magnitude and timing of future projected taxable income, and tax planning strategies. We believe, thatbased on available evidence, it is not more likely than not that our net deferred tax asset will be realized in future periods and, therefore, have recorded a valuation allowance forequal to the entirenet deferred tax asset balance.
We have not identified items for which the income tax effects of the 2017 Tax Cuts and Jobs Act (“2017 Tax Act”) have not been completed and a reasonable estimate could not be determined as of December 31, 2017. Our analysis of the 2017 Tax Act may be impacted by new legislation, the Congressional Joint Committee Staff, Treasury, or other guidance. We are continuing to evaluate the impact of the 2017 Tax Act on the organization as a whole, but we do not expect there to be a material impact on our consolidated financial statements. | | | | | | | | | | | |
| PHILLIPS EDISON & COMPANY DECEMBER 31, 2023 FORM 10-K | | | F-23 |
The following is a summary of our deferred tax assets and liabilities whichas of December 31, 2023 and 2022 (in thousands):
| | | | | | | | | | | |
| | 2023 | | 2022 |
| Deferred tax assets: | | | |
| Equity compensation | $ | 1,934 | | | $ | 2,749 | |
| Accrued compensation | 1,706 | | | 1,531 | |
| Net operating loss (“NOL”) carryforward | 1,031 | | | 1,669 | |
| Reserves | 300 | | | 300 | |
| Other | 94 | | | 362 | |
| Gross deferred tax asset | 5,065 | | | 6,611 | |
| Less: valuation allowance | (1,143) | | | (2,879) | |
| Total deferred tax asset | 3,922 | | | 3,732 | |
| Deferred tax liabilities: | | | |
| Real estate and capitalized salaries | (3,150) | | | (3,239) | |
| Investment in third parties | (563) | | | (443) | |
| Other | (209) | | | (50) | |
| Total deferred tax liabilities | (3,922) | | | (3,732) | |
| Net deferred tax asset | $ | — | | | $ | — | |
Our deferred tax assets and liabilities result from the activities of
theour TRS
asentities. The TRS entities have a federal NOL carryforward of approximately $4.0 million. The federal NOL carryforward can be carried forward indefinitely. As of December 31,
2017 (in thousands):2023, the TRS entities have state NOL carryforwards of approximately $4.1 million, which will expire as determined under each state's statute.
|
| | | |
| | 2017 |
| Deferred tax assets: | |
| Accrued expenses | $ | 4,276 |
|
Net operating loss (“NOL”) carryforward(1) | 667 |
|
| Other | 106 |
|
| Gross deferred tax assets | 5,049 |
|
| Valuation allowance | (3,277 | ) |
| Total deferred tax asset | 1,772 |
|
| Deferred tax liabilities: | |
| Depreciation and amortization | (1,638 | ) |
| Prepaid expenses | (134 | ) |
| Total deferred tax liabilities | (1,772 | ) |
| Net deferred tax asset | $ | — |
|
| |
(1)
| If not utilized, the NOL carryforward will begin to expire in 2037. Losses incurred after 2017 are carried forward indefinitely. |
Differences between the net income fromor loss presented on the consolidated statements of operations and other comprehensivetaxable income and our taxable incomeare primarily related to the timing of the recognition of salesgain on the sale of investment properties for financial reporting purposes and tax reporting, the timingrecognition of impairment expense for financial reporting purposes which is not deductible for tax reporting purposes, and differences in the recognition of rental income and depreciation and amortization expense for both revenuefinancial reporting and expense recognition.tax reporting.
Distributions—The following table reconciles Net (Loss) Income Attributable to Stockholders to REIT taxable income before the dividends paid deduction for the years ended December 31, 2017, 2016,2023, 2022, and 20152021 (in thousands): |
| | | | | | | | | | | |
| | 2017 | | 2016 | | 2015 |
| Net (loss) income attributable to stockholders | $ | (38,391 | ) | | $ | 8,932 |
| | $ | 13,360 |
|
| Net loss (income) from subsidiaries | 31,395 |
| | (17,785 | ) | | (23,725 | ) |
| Net loss attributable to REIT operations | (6,996 | ) | | (8,853 | ) | | (10,365 | ) |
| Book/tax differences | 45,677 |
| | 42,556 |
| | 45,280 |
|
| REIT taxable income subject to 90% dividend requirement | $ | 38,681 |
| | $ | 33,703 |
| | $ | 34,915 |
|
| | | | | | | | | | | | | | | | | |
| | 2023 | | 2022 | | 2021 |
| Net income attributable to stockholders | $ | 56,848 | | | $ | 48,323 | | | $ | 15,121 | |
| Net (income) loss from TRS entities | (9,768) | | | 968 | | | (533) | |
| Net income attributable to REIT operations | 47,080 | | | 49,291 | | | 14,588 | |
| Book/tax differences | 54,311 | | | 47,730 | | | 69,943 | |
| REIT taxable income | 101,391 | | | 97,021 | | | 84,531 | |
| Less: Capital gains | (96) | | | — | | | (19,765) | |
| REIT taxable income subject to 90% dividend requirement | $ | 101,295 | | | $ | 97,021 | | | $ | 64,766 | |
The following is a summaryTotal gross distributions to our stockholders exceeded 100% of our dividends paid deductionREIT taxable income for the years ended December 31, 2017, 2016,2023, 2022, and 2015 (in thousands):2021. |
| | | | | | | | | | | |
| | 2017 | | 2016 | | 2015 |
| Distributions paid to common stockholders | $ | 123,100 |
| | $ | 123,004 |
| | $ | 123,119 |
|
| Non-dividend distributions | (84,419 | ) | | (89,301 | ) | | (88,204 | ) |
| Total dividends paid deduction attributable to earnings and profits | $ | 38,681 |
| | $ | 33,703 |
| | $ | 34,915 |
|
The tax compositioncharacterization of our distributions declared for the years ended December 31, 20172023, 2022, and 2016,2021 was as follows: |
| | | | | |
| | 2017 | | 2016 |
| Ordinary income | 28.6 | % | | 28.2 | % |
| Return of capital | 70.9 | % | | 71.8 | % |
| Capital gain distributions | 0.5 | % | | — | % |
| Total | 100.0 | % | | 100.0 | % |
| | | | | | | | | | | | | | | | | |
| 2023 | | 2022 | | 2021 |
| Common stock: | | | | | |
| Ordinary dividends | 75.9 | % | | 77.4 | % | | 62.8 | % |
| Non-dividend distributions | 24.0 | % | | 22.6 | % | | 18.1 | % |
Capital gain distributions(1) | 0.1 | % | | — | % | | 19.1 | % |
| Total distributions per share of common stock | 100.0 | % | | 100.0 | % | | 100.0 | % |
We record a benefit(1)Pursuant to U.S. Treasury Regulation §1.1061-6(c) and §1061 of the IRC, the One Year Amounts and Three Year Amounts disclosures are both zero with respect to direct and indirect holders of “applicable partnership interests” for uncertain income tax positions if the result of a tax position meets a "more likely than not" recognition threshold. No liabilities have been recorded as of December 31, 2017 or 2016 as a result of this provision. We expect no significant increases or decreases in unrecognized tax benefits due to changes in tax positions within one year of December 31, 2017. Returnsus and our subsidiary REIT, Phillips Edison Institutional REIT, LLC for the calendarall years 2014 through 2016 remain subject to examination by federal and various state tax jurisdictions.presented.
| | | | | | | | | | | |
| PHILLIPS EDISON & COMPANY DECEMBER 31, 2023 FORM 10-K | | | F-24 |
| | |
10.11. COMMITMENTS AND CONTINGENCIES |
Leases—Upon completion of the PELP transaction (see Note 3), we assumed certain lease obligations originally entered into by PELP before the transaction. The leases are primarily related to short- and long-term operating leases for office space and equipment. We have no capital leases. Total rental expense for long-term operating leases was approximately $370,000 for the year ended December 31, 2017. Minimum rental commitments under noncancelable operating leases as of December 31, 2017, were as follows: |
| | | |
| Year | Amount |
| 2018 | $ | 1,101 |
|
| 2019 | 773 |
|
| 2020 | 310 |
|
| 2021 | 188 |
|
| 2022 | 185 |
|
| Thereafter | 388 |
|
| Total | $ | 2,945 |
|
Litigation—We are involved in various claims and litigation matters arising in the ordinary course of business, some of which involve claims for damages. Many of these matters are covered by insurance, although they may nevertheless be subject to deductibles or retentions. Although the ultimate liability for these matters cannot be determined, based upon information currently available, we believe the resolution of such claims and litigation will not have a material adverse effect on our consolidated financial statements.
Environmental Matters—In connection with the ownership and operation of real estate, we may potentially be liable for costs and damages related to environmental matters. In addition, we may own or acquire certain properties that are subject to environmental remediation. Generally,Depending on the nature of the environmental matter, the seller of the property, thea tenant of the property, and/or another third party ismay be responsible for environmental remediation costs related to a property. Additionally, in connection with the purchase of certain properties, the respective sellers and/or tenants may agree to indemnify us against future remediation costs. We also carry environmental liability insurance on our properties that provides limited coverage for any remediation liability and/or pollution liability for third-party bodily injury and/or property damage claims for which we may be liable. We are not currently aware of any environmental matters whichthat we believe are reasonably likely to have a material effect on our consolidated financial statements.
Captive Insurance—As part of the PELP transaction, we acquired aOur captive insurance company, Silver Rock Insurance, Inc. (“Silver Rock”), from PELP, which provides general liability insurance, wind, reinsurance, and other coverage to us REIT II, REIT III, PELP, and Necessity Retail Partners (“NRP”).our GRP I joint venture. We capitalize Silver Rock in accordance with applicable regulatory requirements.
Silver Rock establishedestablishes annual premiums based on the past loss experience of the insured properties. An independent third party was engaged to perform an actuarial estimate of projected future claims, related deductibles, and projected future expenses necessary to fund associated risk management programs. Premiums paid to Silver Rock may be adjusted based on this estimate. Premiums paid to Silver Rock may be reimbursed by tenants pursuant to specific lease terms.
As of December 31, 2017,2023, we had two cash collateralizedfour letters of credit outstanding totaling approximately $5.7$12.5 million to provide security for our obligations under ourSilver Rock’s insurance and reinsurance contracts. These letters of credit expire in 2018 with additional options to extend their maturities.
The following is a summary of the activity in the liability for unpaid losses, which is recorded in Accounts Payable and Other Liabilities on our consolidated balance sheet,sheets, for the yearyears ended December 31, 20172023 and 2022 (in thousands): | | | | 2017 |
| Balance upon acquisition on October 4, 2017 | $ | 4,339 |
|
| 2023 | | | 2023 | | 2022 |
| Beginning balances | |
| Incurred related to: | |
| Current year | |
| Current year | |
| Current year | 452 |
|
| Prior years | 898 |
|
| Total incurred | 1,350 |
|
| Paid related to: | |
| Current year | 81 |
|
| Current year | |
| Current year | |
| Prior years | 725 |
|
| Total paid | 806 |
|
| Unpaid loss liability as of December 31, 2017 | $ | 4,883 |
|
| Liabilities for unpaid losses as of December 31 | |
| | | | | | | | | | | |
| PHILLIPS EDISON & COMPANY DECEMBER 31, 2023 FORM 10-K |
| 11. EQUITY | F-25 |
General—The holders of common stock are entitled to one vote per share on all matters voted on by stockholders, including one vote per nominee in the election of the Board. Our charter does not provide for cumulative voting in the election of directors.
At-the-Market Offering (“ATM”)—On November 8, 2017, our Board increasedFebruary 10, 2022, we and the estimated value per shareOperating Partnership entered into a sales agreement relating to the potential sale of ourshares of common stock pursuant to $11.00 based substantially ona continuous offering program. In accordance with the estimated market value of our portfolio of real estate properties and our recently acquired third-party asset management business as of October 5, 2017, the first full business day after the closingterms of the PELP transaction. We engaged a third-party valuation firm to provide a calculation of the range in estimated value per share of our common stock as of October 5, 2017, which reflected certain pro forma balance sheet assetssales agreement, we may offer and liabilities as of that date. Prior to November 8, 2017, the estimated value per share was $10.20.
Dividend Reinvestment Plan—We have adopted a DRIP that allows stockholders to invest distributions in additionalsell shares of our common stock subjecthaving an aggregate offering price of up to certain limits. Stockholders who elect$250 million from time to participate intime through our sales agents, or, if applicable, as forward sellers. During the DRIP may choose to invest all or a portion of their cash distributions inthree months ended December 31, 2023, we issued 2.2 million shares of our common stock at a gross weighted average price equal to our most recent estimated valueof $35.92 per share. In connection withshare under the announcementATM program for net proceeds of $77.5 million, after approximately $0.8 million in commissions. During the PELP transaction (see Note 3), the DRIP was suspended during May 2017; therefore, all DRIP participants received their May distribution, which was payable in June, in cash rather than in stock. The DRIP plan resumed in June 2017, with distributions payable in July 2017.
Stockholders who elect to participate in the DRIP, and who are subject to U.S. federal income taxation laws, will incur a tax liability on an amount equal to the fair value on the relevant distribution date of theyear ended December 31, 2023, we issued 4.2 million shares of our common stock purchasedat a gross weighted average price of $35.76 per share under the ATM program for net proceeds of $147.6 million, after approximately $1.5 million in commissions. During the three months ended December 31, 2022, no shares were issued under the ATM program. During the year ended December 31, 2022, we issued 2.6 million shares of our common stock at a gross weighted average price of $34.23 per share under the ATM program for net proceeds of $89.2 million, after approximately $0.9 million in commissions. As of December 31, 2023, approximately $10.8 million of common stock remained available for issuance under the ATM program.
Subsequent to December 31, 2023, we issued approximately 46,000 additional shares of our common stock at a gross weighted average price of $37.05 per share under the ATM program for net proceeds of $1.7 million, after approximately $17,000 in commissions.
Class B Common Stock—On June 18, 2021, our stockholders approved the Articles of Amendment that effected the Recapitalization, wherein each share of our common stock outstanding at the time the amendment became effective was converted into one share of a newly created class of Class B common stock.
Our Class B common stock was identical to our common stock, except that it was not listed on a national securities exchange. Per the terms of the Recapitalization, on January 18, 2022, each share of our Class B common stock automatically converted into one share of our listed common stock.
On May 5, 2022, we filed Articles Supplementary to our charter with reinvested distributions, even thoughthe Maryland State Department of Assessments and Taxation in order to reclassify and designate all of the 350 million authorized shares of our Class B common stock, $0.01 par value per share, all of which were unissued at such stockholderstime, as shares of our common stock, $0.01 par value per share. We no longer have elected notClass B common stock authorized for issue.
Reverse Stock Split—On July 2, 2021, we effected a one-for-three reverse stock split. Concurrent with the reverse split, the Operating Partnership enacted a one-for-three reverse split of its outstanding OP units. Neither the number of authorized shares nor the par value of the common stock were impacted. As a result of the reverse split, every three shares of our common stock or OP units were automatically combined and converted into one issued and outstanding share of common stock or OP unit rounded to receive the distributions in cash.nearest 1/100th share. The reverse stock split impacted all common stock and OP units proportionately and had no impact on any stockholder’s percentage ownership of common stock.
Share Repurchase Program—Our SRP provides an opportunity for stockholders to haveIn connection with the reverse stock split, the number of shares of common stock repurchased, subjectand OP units underlying the outstanding share-based awards was also proportionately reduced. All references to certain restrictionsshares of common stock, number of OP units, and limitations,per share data for all periods presented in our consolidated financial statements and notes have been adjusted to reflect the reverse split on a retroactive basis.
Underwritten IPO—On July 19, 2021, we completed our underwritten IPO and issued 17.0 million shares of common stock at aan offering price equal to our most recent estimated valuethe public of $28.00 per share. In connection with the announcementWe used a portion of the PELP transaction,net proceeds to reduce our leverage and used the SRP was suspended during May 2017remaining amount to fund external growth with property acquisitions and resumedfor other general corporate uses. As part of the underwritten IPO, underwriters were granted an option exercisable within 30 days from July 14, 2021 to purchase up to an additional 2.6 million shares of common stock at the underwritten IPO price, less underwriting discounts and commissions. On July 29, 2021, the underwriters exercised their option. The underwritten IPO, including the underwriters’ overallotment election, resulted in June 2017.gross proceeds of $547.4 million.
Distributions—In 20172023, we declared and 2016, repurchase requests surpassedpaid monthly distributions of $0.0933 per share and OP unit, or $1.12 annualized, for each month beginning January 2023 through August 2023. On September 1, 2023, the funding limits under the SRP. DueBoard authorized a 4.5% increase of our monthly distribution rate to the program’s funding limits, no funds$0.0975 per common share and OP unit. We declared and paid monthly distributions of $0.0975 per share and OP unit, or $1.17 annualized, for each month beginning September 2023 through December 2023. Distributions paid to stockholders and OP unit holders of record subsequent to December 31, 2023 were available for repurchases during the fourth quarter of 2017 and no funds will be available for the the first quarter of 2018. Additionally, repurchases during the remainder of 2018 are expected to be limited. When we are unable to fulfill all repurchase requestsas follows (dollars in any month, we will honor requests on a pro rata basis to the extent possible. thousands, excluding per share amounts):
| | | | | | | | | | | | | | | | | |
| Month | Date of Record | Date Distribution Paid | Monthly Distribution Rate | | Cash Distribution |
| December | 12/15/2023 | 1/2/2024 | $ | 0.0975 | | | $ | 13,154 | |
| January | 1/16/2024 | 2/1/2024 | 0.0975 | | | 13,223 | |
Convertible Noncontrolling Interests—As of December 31, 2017,2023 and 2022, we had 10.8approximately 13.8 million shares of unfulfilled repurchase requests. We will continue to fulfill repurchases sought upon a stockholder’s death, “qualifying disability,” or “determination of incompetence” in accordance with the terms of the SRP.
Convertible Noncontrolling Interests—As part of the PELP transaction, we issued 39.4and 14.1 million outstanding non-voting OP units, thatrespectively. Additionally, certain of our outstanding restricted share and performance share awards will result in the issuance of OP units upon vesting in future periods. These are classified as noncontrolling interests. Prior toincluded in the PELP transaction, the Operating Partnership also issued limited partnership units that were designated as Class B units for asset management services provided by PE-NTR. In connection with the PELP transaction, Class B units were no longer issued for asset management services subsequent to September 2017. Upon closing of the transaction, upon termination of the advisory agreement, we determined the economic hurdle required for vesting had been met, and all outstanding Class B units vested and were converted to OP units. As such, we recorded a $24.0 million expense on our consolidated statements of operations as Vesting of Class B Units, which included the $27.6 million vesting of Class B units previously issued for asset management services, and the reclassification of historical distributions on those units to Noncontrolling Interests.unvested award totals disclosed in Note 13.
Under the terms of the ThirdFourth Amended and Restated Agreement of Limited Partnership, OP unit holders may elect to exchangecause the Operating Partnership to redeem their OP units. The Operating Partnership controls the form of the redemption, and may
| | | | | | | | | | | |
| PHILLIPS EDISON & COMPANY DECEMBER 31, 2023 FORM 10-K | | | F-26 |
elect to exchangeredeem OP units for shares of our common stock, provided that the OP units have been outstanding for at least one year.year, or for cash. As the form of redemption for OP units is within our control, the OP units outstanding as of December 31, 20172023 and 2016,2022 are classified as Noncontrolling Interests within permanent equity on our consolidated balance sheets.
On January 18, 2022, we issued approximately 1.6 million OP units in full settlement of the earn-out liability (see note 16).
The $9.1 milliontable below is a summary of cumulative distributions that have been paidour OP unit activity for the years ended December 31, 2023 and 2022 (dollars and shares in thousands):
| | | | | | | | | | | |
| 2023 | | 2022 |
OP units converted into shares of common stock(1) | 517 | | | 1,169 | |
Distributions declared on OP units(2) | $ | 16,334 | | | $ | 16,241 | |
(1)Prior to the Recapitalization, OP units were converted to shares of common stock at a 1:1 ratio. From the Recapitalization through January 18, 2022, OP units were converted into shares of our Class B common stock at a 1:1 ratio. On January 18, 2022, each share of our Class B common stock automatically converted into one share of our listed common stock, and going forward, OP units will be converted into shares of our common stock at a 1:1 ratio.
(2)Distributions declared on OP units are included in Distributions to Noncontrolling Interests on the consolidated statements of equity.
In September 2017, we entered into an agreement with American Realty Capital II Advisors, LLC (“ARC”) to terminate all remaining contractualDividend Reinvestment Plan and economic relationships between us and ARC. In exchange forShare Repurchase Programs—On August 4, 2021, as a paymentresult of $9.6 million, ARC sold their OP units, unvested Class B Units, and their special limited partnership interests back to us, terminating all fee-sharing arrangements between ARC and PE-NTR. The 417,801 OP unit repurchase was recorded at a value of $4.2 million onour underwritten IPO, our Board approved the consolidated statements of equity. The $5.4 million valuetermination of the unvested Class B units, special limited partnership interests,DRIP and valuethe original share repurchase program.
On August 3, 2022, our Board approved a new share repurchase program of fee-sharing arrangements is recorded on the consolidated statementup to $250 million of operations.
Below is a summary of ourcommon stock. The program may be suspended or discontinued at any time, and does not obligate us to repurchase any dollar amount or particular number of outstanding OP units and unvested Class B units as of December 31, 2017 and 2016 (in thousands):shares. No share repurchases have been made to date under this program. |
| | | | | |
| | 2017 | | 2016 |
| OP units | 44,454 |
| | 2,785 |
|
Class B units(1) | — |
| | 2,610 |
|
| |
(1)
| Upon closing of the PELP transaction, all outstanding Class B units were converted to OP units. |
Nonconvertible Noncontrolling Interests—In addition to partnership units of the Operating Partnership, Noncontrolling Interests also includes a 25% ownership share of one of our subsidiaries who provides advisory services, which was not significant to our results.
Stock-Based Compensation—Employee Long Term Incentive Plan—We account for our stock-based compensation plan by recognizing compensation expense less estimated forfeitures. Our restricted stock and phantomissue stock awards that vest based upon the completion of a service period (“service-based grants”awards”).
In August 2016, the Board approved restricted stock awards pursuant under our 2020 Omnibus Incentive Plan (“2020 Incentive Plan”), which became effective in June 2020. Awards to our Amended and Restated 2010 Independent Director Stock Plan. The awardsemployees are typically granted to our independent directors and vest based uponduring the completionfirst quarter of a service period. Holders of restricted stock are entitled to dividend and distribution rights. All regular cash dividends on the awarded shares will be paid directly to the director on the dividend payment date. Theseeach year. Service-based awards typically follow a four-year graded vesting schedule over approximately four years. Expenseand will vest in the form of common stock or OP units.
We recognize expense for awards with graded vesting is recognized under the accelerated recognition method, whereby each vesting is treated as a separate award with expense for each vesting recognized ratably over the requisite service period, and isperiod. We account for forfeitures as they occur. Expense amounts are recorded in Additional Paid-in CapitalGeneral and Administrative or Property Operating on our consolidated balance sheets. Thestatements of operations. Prior to our underwritten IPO, the awards arewere valued according to the determined value per shareEVPS for our common stock at the date of grant.
As part of their compensation plan, employees received phantom Subsequent to our underwritten IPO, awards are valued according to the Nasdaq closing stock units under our Amended and Restated 2010 Long Term Incentive Plan. The valueprice at the date of the awards change in direct relation to the change in estimated value per sharegrant. Holders of our common stock, but the value is only paid in cash rather than in common stock. The phantom stock holdersunvested service-based awards are entitled to receive distributions, which are recorded as expense when declared,dividend and distribution rights, but are not entitled to voting rights.
All phantom stockAdditionally, we issue performance-based awards were grantedthat are earned based on the achievement of specified performance metrics measured at the end of the three-year performance period. The maximum number of performance-based awards earned cannot exceed two times the target number. Half of the earned performance-based awards vest when earned at the end of the three-year performance period and the second half of the earned performance-based awards vest one year later, subject to continued employment.
Beginning in 2022, our Compensation Committee approved a change to our employees, who were former PELP employees, priorperformance-based long-term incentive program such that the performance-based component of awards under the program will be based on a single metric, total shareholder return relative to the PELP transactionFTSE Nareit Equity Shopping Center Index. Prior to 2022, our performance-based equity grants were based on two separate, equally-weighted performance metrics: (i) three-year average Same-Center NOI growth measured against a peer group of public retail REITs; and a liability was assumed for these(ii) three-year Core Funds From Operations (“FFO”) per share growth measured against the same peer group. Same-Center NOI and Core FFO are both non-GAAP measures.
| | | | | | | | | | | |
| PHILLIPS EDISON & COMPANY DECEMBER 31, 2023 FORM 10-K | | | F-27 |
The fair value of the 2023 and 2022 performance-based awards on the date of grant was $6.0 million and $5.4 million, respectively, using a Monte Carlo simulation to estimate the transaction infair value through a risk-neutral premise. The following is a summary of the significant assumptions used to value the performance-based awards granted during the years ended December 31, 2023 and 2022:
| | | | | | | | | | | |
| 2023 | | 2022 |
| Expected volatility | 38.0 | % | | 54.0 | % |
| Dividend yield | 3.20 | % | | 3.25 | % |
| Risk-free interest rate | 4.63 | % | | 1.52 | % |
In addition to the applicable performance metrics, a net asset value (“NAV”) modifier will be applied to the calculation of earned performance-based awards if the NAV per share at the end of the performance period is less than the value at issuance. Subsequent to our underwritten IPO, the NAV per share is measured by the Nasdaq closing stock price at the end of the performance period. Specifically, to the extent performance above the target level is achieved at the end of the performance period, yet our NAV per share at the end of the performance period is less than the value at issuance, the amount of $14.3 millionearned awards will be capped at the target amount. The remaining amount of awards (the difference between those that would have otherwise been earned based on actual performance and the target level) may become earned, and thereafter vested, if our NAV per share exceeds the NAV per share at the beginning of the performance period for 20 consecutive trading days up to five years following the completion of the performance period, assuming continued employment on such date.
The performance period for the performance-based awards granted in Accounts Payable2018 and Other Liabilities2019 ended on December 31, 2020 and 2021, respectively. Based on our performance through December 31, 2020 and 2021, these awards would have been earned at maximum, but because our NAV per share growth for that same performance period was negative, the amount of earned awards was capped at the target amount. Based on the combined balance sheets. Substantially all awards granted by PELPperformance of common stock closing prices throughout the fourth quarter of 2021, we believed it was more than probable that we would achieve positive NAV per share growth for 20 consecutive trading days prior to 2016 contained a five-year cliff vesting provision. Beginning in 2016, substantially all phantom stock awards contain a four-year graded vesting provision,December 31, 2025 and 2026. As such, we recognized approximately $4.2 million of expense associated with expense being recognized usingachieving the straight-line method over the requisite service period. Expensemaximum award for both of these awards is recorded in General and Administrative on our consolidated statements of operations.
The following table summarizes our stock-based award activitygrants during the year ended December 31, 20172021, of which $3.2 million was recorded in General and Administrative and $1.0 million was recorded in Property Operating on our consolidated statements of operations. During the year ended December 31, 2022, the unearned portion in excess of target and up to the maximum vested as our NAV per share growth became positive.
Underwritten IPO Grants—In connection with our underwritten IPO, we issued a total of 0.5 million RSUs, inclusive of 0.3 million OP units, and restricted stock awards in the form of time-based stock compensation awards with expenses included within Other Expense, Net on our consolidated statements of operations. Included in the restricted stock awards were 24,000 RSUs granted to our independent directors. The shares have a grant price of $28.00 per share and, with the exception of one individual whose award is subject to accelerated vesting provisions, 50% of the shares vested after 18 months and the remaining 50% will vest after 36 months.
Independent Director Stock Plan—The Board approves restricted stock awards pursuant to our Amended and Restated 2010 Independent Director Stock Plan. The awards are granted to our independent directors as service-based awards. As of December 31, 2023 and 2022, there were approximately 27,000 and 24,000 outstanding unvested awards granted to independent directors, respectively, in connection with the 2010 Independent Director Stock Plan.
| | | | | | | | | | | |
| PHILLIPS EDISON & COMPANY DECEMBER 31, 2023 FORM 10-K | | | F-28 |
Share-Based Compensation Award Activity—As of December 31, 2023, the fair value for certain of our equity awards is based on our Nasdaq closing stock price at the date of the grant and the fair value for our 2023 and 2022 performance-based awards is calculated using the Monte Carlo method, as described above. All share-based compensation awards, regardless of the form of payout upon vesting, are presented in the following table, which summarizes our stock-based award activity (number of units in thousands): | | | | Number of Restricted Stock Awards | | Number of Phantom Stock Units | | Weighted-Average Grant-Date Fair Value |
| Nonvested at December 31, 2016 | 10 |
| | — |
| | $ | 10.20 |
|
| Restricted Stock Awards(1) | | | Restricted Stock Awards(1) | | Performance Stock Awards(1) | | Weighted-Average Grant-Date Fair Value |
| Nonvested at January 1, 2021 | |
| Granted | 10 |
| | — |
| | 10.20 |
|
| Vested | (2 | ) | | — |
| | 10.20 |
|
| Assumed | — |
| | 2,450 |
| | 10.20 |
|
| Forfeited | — |
| | (4 | ) | | 10.20 |
|
| Nonvested at December 31, 2017 | 18 |
| | 2,446 |
| | $ | 10.20 |
|
| Nonvested at December 31, 2021 | |
| Granted | |
| Vested | |
| Forfeited | |
| Nonvested at December 31, 2022 | |
| Granted | |
| Vested | |
| Forfeited | |
| Nonvested at December 31, 2023 | |
(1)The liability for the phantom stockmaximum number of award units that could be issued under all outstanding grants was 1.8 million as of December 31, 2017,2023. The number of award units expected to vest was $19.5 million. 1.1 million as of December 31, 2023.
The expense for all stock-based awards during the yearyears ended December 31, 2017,2023, 2022, and 2021 was $3.4$9.4 million, which included $1.3$14.9 million, of expense recorded as a result of the change in our estimated value per share from $10.20 to $11.00. The expense during the year ended December 31, 2016, was immaterial.and $16.8 million, respectively. We had $8.9$11.5 million of unrecognized compensation costs related to these awards that we expect to recognize over a weighted average period of approximately two years.
Subsequent to The fair value at the vesting date for stock-based awards that vested during the year ended December 31, 2017, approximately 0.8 million restricted shares were granted. In addition, there were approximately 0.4 million performance-based restricted shares granted. The total number of performance-based restricted shares that will vest in March 2021 depends on whether certain financial metrics are met during the vesting period.2023 was $19.5 million.
401(k) Plan—We sponsor a 401(k) plan whichthat provides benefits for qualified employees. Our match of the employee contributions is discretionary and has a five-year vesting schedule. The cash contributioncontributions to the plan for the yearyears ended December 31, 2017, was2023, 2022, and 2021 were approximately $154,000.$1.1 million, $1.0 million, and $1.0 million, respectively. All employees who have attained the age of 21 are eligible to participate starting the first day of the month following their date of hire. Employees are vested immediately with respect to employee contributions.
| | |
|
13.14. EARNINGS PER SHARE |
We use the two-class method of computingBasic earnings per share (“EPS”), which is an earnings allocation formula that determines EPS for common stock and any participating securities according to dividends declared (whether paid or unpaid). Under the two-class method, basic EPS is computed by dividing the income availableNet Income Attributable to common stockholdersStockholders by the weighted-average number of shares of common stock shares outstanding for the period. Diluted EPS reflects the potential dilution that could occur from share equivalent activity.
OP units held by limited partners other than us, as well as previously held Class B units prior to the completion of the PELP transaction, are considered to be participating securities because they contain non-forfeitable rights to dividends or dividend equivalents, and have the potential to be exchanged for an equal number of shares of our common stock in accordance with the terms of the Partnership Agreement. Phantom stock units are not considered participating securities, as they are not convertible into common stock. The impact of these Class B and OP units on basic and diluted EPS has been calculated using the two-class method whereby earnings are allocated to the Class B and OP units based on dividends declared and the units’ participation rights in undistributed earnings. The effects of the two-class method on basic and diluted EPS were immaterial to the consolidated financial statements as of December 31, 2017, 2016, and 2015.
Since the OP units are convertible, they were treated as potentially dilutive in the diluted earnings per share computations for the years ended December 31, 2017, 2016, and 2015. There were 2.6 million and 2.1 million unvested Class B units outstanding as of December 31, 2016 and 2015, respectively. As these units were unvested, they were not included in the diluted earnings per share calculation.
The following table provides a reconciliation of the numerator and denominator of the earnings per share calculations for the years ended December 31, 2017, 2016,2023, 2022, and 20152021 (in thousands, except per share amounts): |
| | | | | | | | | | | |
| | 2017 | | 2016 | | 2015 |
| Numerator: | | | | | |
| Net (loss) income attributable to stockholders - basic | $ | (38,391 | ) | | $ | 8,932 |
| | $ | 13,360 |
|
Net (loss) income attributable to convertible OP units(1) | (3,470 | ) | | 111 |
| | 201 |
|
| Net (loss) income - diluted | $ | (41,861 | ) | | $ | 9,043 |
| | $ | 13,561 |
|
| Denominator: | | | | | |
| Weighted-average shares - basic | 183,784 |
| | 183,876 |
| | 183,678 |
|
Conversion of OP units(1) | 12,713 |
|
| 2,785 |
|
| 2,716 |
|
| Effect of dilutive restricted stock awards | — |
| | 4 |
| | — |
|
| Adjusted weighted-average shares - diluted | 196,497 |
| | 186,665 |
| | 186,394 |
|
| Earnings per common share: | | | | | |
| Basic and diluted | $ | (0.21 | ) | | $ | 0.05 |
| | $ | 0.07 |
|
| | | | | | | | | | | | | | | | | |
| 2023 | | 2022 | | 2021 |
| Numerator: | | | | | |
| Net income attributable to stockholders - basic | $ | 56,848 | | | $ | 48,323 | | | $ | 15,121 | |
Net income attributable to convertible OP units(1) | 6,914 | | | 6,206 | | | 2,112 | |
| Net income - diluted | $ | 63,762 | | | $ | 54,529 | | | $ | 17,233 | |
| Denominator: | | | | | |
Weighted-average shares - basic(2) | 118,278 | | | 115,403 | | | 102,403 | |
OP units(1)(3) | 14,096 | | | 14,355 | | | 14,071 | |
| Dilutive restricted stock awards | 596 | | | 574 | | | 198 | |
| Adjusted weighted-average shares - diluted | 132,970 | | | 130,332 | | | 116,672 | |
| Earnings per common share: | | | | | |
| Basic and diluted income per share | $ | 0.48 | | | $ | 0.42 | | | $ | 0.15 | |
| | | | | |
(1)OP units include units previously issued for asset management services provided under our former advisory agreement (see Note 15), as well as units issued as part of the PELP transaction (see Note 3), all of whichthat are convertible into common shares.stock or cash, at the Operating Partnership’s option. The Operating Partnership income or loss attributable to these OP units, which is included as a component of Net Loss (Income)Income Attributable to Noncontrolling Interests on the consolidated statements of operations, has been added back in the numerator becauseas these OP units were included in the denominator for all years presented.
As of December 31, 2017, 17,200 restricted stock awards were outstanding. These securities were anti-dilutive and, as a result, were excluded from the weighted-average common shares used to calculate diluted EPS.
| | | | | | | | | | | |
| PHILLIPS EDISON & COMPANY DECEMBER 31, 2023 FORM 10-K |
| 14. RELATED PARTY REVENUE | F-29 |
Fee revenues from our Investment Management segment
all years presented. OP units are earned fromallocated income on a consistent basis with the Managed Funds. We provide services to the Managed Funds, including asset acquisitioncommon stockholder and disposition decisions, asset management, operating and leasing of properties, construction management, and other general and administrative responsibilities. Services are currently provided under either advisory agreements or master property management and master services agreements (“Management Agreements”). Advisory agreements have a duration of one year and are renewed annually at the discretion of the respective boards of directors. Management Agreementstherefore have no defined term, but can be canceled by either party upon 30 days’ notice. dilutive impact to earnings per share of common stock.
(2)Includes 4.4 million and 93.6 million weighted-average shares of Class B common stock and 111.0 million and 8.8 million weighted-average shares of common stock during the years ended December 31, 2022 and 2021, respectively.
Summarized below are the fees earned by and the expenses reimbursable to us from the related party Managed Funds during(3)For the year ended December 31, 2017, all of which were earned following the PELP transaction (in thousands): |
| | | | | | | | | | | | | | | | | | | |
| | REIT II | | REIT III | | NRP | | Other Parties | | Total |
| Advisory Agreements Revenue: | | | | | | | | | |
| Acquisition fees | $ | 218 |
| | $ | 519 |
| | $ | — |
| | $ | — |
| | $ | 737 |
|
| Asset management fees | 2,878 |
| | 59 |
| | 105 |
| | 49 |
| | 3,091 |
|
| Due diligence reimbursements | 142 |
| | 72 |
| | — |
| | — |
| | 214 |
|
| Total advisory revenue | $ | 3,238 |
| | $ | 650 |
| | $ | 105 |
| | $ | 49 |
| | $ | 4,042 |
|
| | | | | | | | | |
|
| Management Agreements Revenue: | | | | | | | | |
|
| Property management fees | $ | 1,518 |
| | $ | 15 |
| | $ | 230 |
| | $ | 27 |
| | $ | 1,790 |
|
| Leasing commissions | 782 |
| | 15 |
| | 196 |
| | 16 |
| | 1,009 |
|
| Construction management fees | 365 |
| | 4 |
| | 36 |
| | 7 |
| | 412 |
|
Other property management fees and reimbursements | 339 |
| | 69 |
| | 65 |
| | 77 |
| | 550 |
|
| Total property management revenue | $ | 3,004 |
| | $ | 103 |
| | $ | 527 |
| | $ | 127 |
| | $ | 3,761 |
|
| | | | | | | | | |
|
| Other Revenue: | | | | | | | | |
|
| Insurance premiums | $ | 206 |
| | $ | — |
| | $ | — |
| | $ | — |
| | $ | 206 |
|
Advisory Agreements—Under our advisory agreements, we earn revenue for managing day-to-day activities and implementing the investment strategy for the Managed Funds. The following tables summarize our fee structure for each of the related party Managed Funds.
|
| | | | | | |
Fund | | Rate | | Payable | | Description |
REIT II | | 0.85% | | In cash upon completion | | Rate is based on contract purchase price, including acquisition expenses and any debt. |
REIT III | | 2.0% | | In cash upon completion | | Rate is based on contract purchase price, including acquisition expenses and any debt. |
During the public offering period for REIT III, we will receive an additional contingent advisor payment of 2.15% of the contract purchase price of each property or other real estate investment they acquire.
|
| | | | | | |
Fund | | Rate | | Payable | | Description |
REIT II | | 1.7%, or up to 3.0% | | In cash upon completion | | Rate is lesser of 1.7% of contract sales price or one-half of the total commissions paid if a non-affiliated broker is also involved in the sale, not to exceed a competitive rate or 6%. |
REIT III | | 2.0% or up to 3.0% | | In cash upon completion | | Rate is lesser of 2% of contract sales price or one-half of the total commissions paid if a non-affiliated broker is also involved in the sale, not to exceed a competitive rate or 6%. |
Asset Management Fee and Subordinated Participation |
| | | | | | |
Fund | | Rate | | Payable | | Description |
REIT II | | 0.85% | | 80% in cash and 20% in Class B units, paid monthly | | One-twelfth of the rate is paid out monthly in cash based on asset cost as of the last day of the preceding month. One-quarter of the rate is paid out quarterly in Class B units based on the lower of the cost of assets or the applicable quarterly NAV, divided by the per share NAV. |
REIT III | | 1.0% | | Monthly in cash, partnership units, or common stock at our election | | One-twelfth of the rate is paid out monthly based on asset cost as of the last day of the preceding month. |
NRP | | 0.5%, or up to 1.0% | | Monthly | | An amount of one-twelfth of 0.5% of the aggregate capital contributions as of the first day of the quarterly period. Once an aggregate amount of the asset management fees received reaches $918K, the monthly amount is equal to one-twelfth of 1.0% of the invested equity. |
Management Agreements—Under our Management Agreements, we earn revenues for managing day-to-day activities at the properties of the Managed Funds. As property manager, we are to provide services including accounting, finance, and operations for which we receive a distinct fee based on a set percentage of gross cash receipts each month. Under the Management Agreements, we also serve as a leasing agent to the Managed Funds. For each new lease, lease renewal, and expansion, we receive a leasing commission. Leasing commissions are recognized as lease deals occur and are dependent on the terms of the lease. We assist in overseeing the construction of various improvements for Managed Funds, for which we receive a distinct fee based on a set percentage of total project cost calculated upon completion of construction. Because both parties in these contracts can cancel upon 30 days’ notice without penalties, their term is considered month-to-month.
The Management Agreements have terms as follows: |
| | | | | | |
Fee | | Rate | | Payable | | Description |
Property Management | | 4.0% | | In cash, monthly | | Rate is applied to monthly cash receipts at a given property. |
Leasing Commissions | | various | | In cash upon completion | | An amount equal to the leasing fees charged by unaffiliated persons rendering comparable services in the same geographic location. |
Construction Management | | various | | In cash upon completion | | An amount equal to the fees charged by unaffiliated persons rendering comparable services in the same geographic location. |
Investment in Affiliates—As part of the PELP transaction we acquired interests in REIT II and REIT III. We account for our investment in REIT II as an available-for-sale security, and we account for our investment in REIT III under the equity method. As of December 31, 2017, our investment in affiliates totaled approximately $202,000 and $700,000 in REIT II and REIT III, respectively.
Related Party Receivables—Summarized below is the detail of our outstanding receivable balance from related parties as of December 31, 2017 (in thousands): |
| | | |
| | 2017 |
| REIT II and other related parties | $ | 1,551 |
|
| REIT III | 4,551 |
|
| Total | $ | 6,102 |
|
Organizational and Offering Costs—Under the terms of the advisory agreement, we have incurred organizational and offering costs related to REIT III, all of which is recorded in Accounts Receivable - Affiliates on the consolidated balance sheets. Since REIT III’s initial public offering has not commenced, we have only charged REIT III organizational and offering costs related to its private placement, which was approximately $2.02021, diluted weighted-average shares include 0.7 million as of December 31, 2017. The receivable amount of $4.6 million includes $3.9 million incurred by PELP, which was included as an assumed receivable in the net assets acquired as part of the PELP transaction.
|
|
15. RELATED PARTY EXPENSE |
Economic Dependency—Prior to the completion of the PELP transaction, we were dependent on PE-NTR, Phillips Edison & Company Ltd. (the “Property Manager”), and their respective affiliates for certain services that were essential to us, including asset acquisition and disposition decisions, asset management, operating and leasing of our properties, and other general and administrative responsibilities. Upon closing of the transaction on October 4, 2017, we now have an internalized management structure and our relationship with PE-NTR and the Property Manager was acquired.
Advisory Agreement—PE-NTR and ARC were entitled to specified fees and expenditure reimbursements for certain services, including managing our day-to-day activities and implementing our investment strategy under advisory agreements. On September 1, 2017, in connection with the termination of ARC’s and PE-NTR’s fee-sharing arrangements (see Note 11), we entered into an amended advisory agreement (the “PE-NTR Agreement”). Under the PE-NTR Agreement, all fees payable to PE-NTR were decreased by 15%. Other than the foregoing, there were no material changes in the PE-NTR Agreement. Upon closing of the PELP transaction on October 4, 2017, the PE-NTR Agreement was terminated. As a result, we will no longer pay the fees listed below and had no outstanding unpaid amounts related to those fees as of December 31, 2017.
Asset Management Fee and Subordinated Participation |
| | | |
Date | Rate | Payable | Description |
January 1, 2015 through September 30, 2015 | 1.00% | 80% in Class B units; 20% in cash | One-twelfth of the rate was paid out monthly in cash based on asset cost as of the last day of the preceding month. One-quarter of the rate was paid out quarterly in Class B units based on the lower of the cost of assets or the applicable quarterly NAV, divided by the per share NAV. |
October 1, 2015 through August 31, 2017 | 1.00% | 80% in cash; 20% in Class B units | One-twelfth of the rate was paid out monthly in cash based on asset cost as of the last day of the preceding month. One-quarter of the rate was paid out quarterly in Class B units based on the lower of the cost of assets or the applicable quarterly NAV, divided by the per share NAV. |
September 1, 2017 through September 19, 2017 | 0.85% | 80% in cash; 20% in Class B units | One-twelfth of the rate was paid out monthly in cash based on asset cost as of the last day of the preceding month. One-quarter of the rate was paid out quarterly in Class B units based on the lower of the cost of assets or the applicable quarterly NAV, divided by the per share NAV. |
September 20, 2017 through October 4, 2017 | 0.85% | 100% in cash | One-twelfth of the rate was paid out monthly in cash based on asset cost as of the last day of the preceding month. |
The Class B units we issued for asset management services (and OP units converted from previously issued and vested Class B units) are entitled to receive distributions at the same rate as is paid to common stockholders. On September 1, 2017, pursuant to the PE-NTR Agreement, we redeemed all outstanding Class B units and OP units owned by ARC.
Upon closing of the PELP transaction on October 4, 2017, the 2.7 million outstanding Class B units vestedawarded as a result of meeting the required economic hurdle, and were converted to OP units. As such, asfull settlement of December 31, 2017, we had no Class B units outstanding. As of December 31, 2016, we had 2.6 million Class B units outstanding that had been issued for asset management services.the earn-out in January 2022 (see Note 16).
Other Advisory Fees and Reimbursements Paid in Cash
| | |
| | | |
Fee Type | Date | Rate | Description |
Acquisition fee | January 1, 2015 through August 31, 2017 | 1.00% | Equal to the product of (x) the rate by (y) the cost of investments we acquired or originated, including any debt attributable to such investments. |
September 1, 2017 through October 4, 2017 | 0.85% |
Acquisition expenses | January 1, 2015 through October 4, 2017 | N/A | Reimbursements for direct expenses incurred related to selecting, evaluating, and acquiring assets on our behalf, including certain personnel costs. |
Disposition Fee | January 1, 2015 through August 31, 2017 | 2.00% | Fee paid for substantial assistance, as determined by the conflicts committee of our Board, in connection with the sale of properties or other investments. |
September 1, 2017 through October 4, 2017 | 1.70% |
Financing Fee | January 1, 2015 through August 31, 2015 | 0.75% | Fee paid on all amounts made available under any loan or line of credit.15. RELATED PARTY TRANSACTIONS |
General and Administrative ExpensesRevenue—As of December 31, 2016, we owed PE-NTR approximately $43,000 for generalWe have entered into agreements with the Managed Funds related to certain advisory, management, and administrative expenses paid on our behalf.
services we provide to their real estate assets in exchange for fees and reimbursement of certain expenses. Summarized below are amounts included in Fees and Management Income. The revenue includes the fees and reimbursements earned by us from the Managed Funds and other revenues that are not in the expenses reimbursable to PE-NTR and ARCscope of ASC 606 but are included in this table for the purpose of disclosing all related party revenues during the years ended December 31, 2017, 2016,2023, 2022, and 2015. This table includes any related amounts unpaid as of December 31, 2016, except for unpaid general and administrative expenses, which we disclose above2021 (in thousands): |
| | | | | | | | | | | | | | | |
| | For the Year Ended December 31, | | Unpaid as of December 31, |
| | 2017 | | 2016 | | 2015 | | 2016 |
Acquisition fees(1) | $ | 1,344 |
| | $ | 2,342 |
| | $ | 1,247 |
| | $ | — |
|
Acquisition expenses(1) | 583 |
| | 464 |
| | 208 |
| | 29 |
|
Asset management fees(2) | 15,573 |
| | 19,239 |
| | 4,601 |
| | 1,687 |
|
OP units distribution(3) | 1,373 |
| | 1,866 |
| | 1,820 |
| | 158 |
|
Class B unit distribution(4) | 1,409 |
| | 1,576 |
| | 625 |
| | 148 |
|
| Financing fees | — |
| | — |
| | 3,228 |
| | — |
|
Disposition fees(5) | 19 |
| | 745 |
| | 47 |
| | — |
|
| Total | $ | 20,301 |
| | $ | 26,232 |
| | $ | 11,776 |
| | $ | 2,022 |
|
| | | | | | | | | | | | | | | | | |
| 2023 | | 2022 | | 2021 |
Recurring fees(1) | $ | 3,894 | | | $ | 3,962 | | | $ | 4,345 | |
Realized performance income(2) | 75 | | | 2,742 | | | 675 | |
Transactional revenue and reimbursements(3) | 2,249 | | | 1,605 | | | 2,166 | |
Insurance premiums(4) | 3,428 | | | 3,232 | | | 3,149 | |
| Total fees and management income | $ | 9,646 | | | $ | 11,541 | | | $ | 10,335 | |
| |
(1)
| Prior to January 1, 2017, acquisition and due diligence fees were recorded on our consolidated statements of operations. The majority of these costs are now capitalized and allocated to the(1)Recurring fees include asset management fees and property management fees. (2)Realized performance income includes fees received related investment in real estate assets on the consolidated balance sheets based on the acquisition-date fair values of the respective assets and liabilities acquired. |
| |
(2)
| Asset management fees are presented in General and Administrative on the consolidated statements of operations. |
| |
(3)
| The distributions paid to OP unit holders represent amounts paid prior to the PELP transaction. Subsequent to that date, our relationship with PE-NTR was acquired. Distributions are presented as Distributions to Noncontrolling Interests on the consolidated statements of equity. |
| |
(4)
| The distributions paid to holders of unvested Class B units are presented in General and Administrative on the consolidated statements of operations and exclude the reclassification of prior distributions to Noncontrolling Interests on our consolidated statements of operations. |
| |
(5)
| Disposition fees are presented as Other Income, Net on the consolidated statements of operations. |
Property Management Agreement—Prior to the completionachievement of the PELP transaction, all ofcertain performance targets in our real properties were managedNRP joint venture.
(3)Transactional revenue includes items such as leasing commissions and leased by the Property Manager, which was wholly-owned by PELP. The Property Manager also managed real properties owned by Phillips Edison affiliates and otherconstruction management fees.
(4)Insurance premium income includes amounts for reinsurance from third parties. Upon closing of the transactionparties not affiliated with us.
Tax Protection Agreement—Through our Operating Partnership, we are currently party to a tax protection agreement (the “2017 TPA”) with certain partners that contributed property to our Operating Partnership on October 4, 2017, among them certain of our agreement withexecutive officers, including Jeffrey S. Edison, our Chairman and Chief Executive Officer, under which the Property Manager was terminated. As a result, we will no longer pay the fees listed below and had no outstanding unpaid amountsOperating Partnership agreed to indemnify such partners for tax liabilities that could accrue to them personally related to those fees asour potential disposition of certain properties within our portfolio. The 2017 TPA will expire on October 4, 2027. On July 19, 2021, we entered into an additional tax protection agreement (the “2021 TPA”) with certain of our executive officers, including Mr. Edison. The 2021 TPA carries a term of four years and will become effective upon the expiration of the 2017 TPA. As of December 31, 2017.
Property Manager Fees and Reimbursements Paid in Cash |
| | |
Fee Type | Rate | Description |
Property Management | 4.00% | Equal to the product of (x) the monthly gross cash receipts from the properties managed by (y) the rate. |
Leasing Commissions | Market Rate | Paid for leasing services rendered with respect to a particular property, primarily if a tenant exercised an option to extend an existing lease. |
Construction Management | Market Rate | Paid for construction management services rendered with respect to a particular property. |
Other Expenses and Reimbursements | N/A | Costs and expenses incurred by the Property Manager on our behalf, including employee compensation, legal, travel, and other out-of-pocket expenses that were directly related to the management of specific properties and corporate matters, as well as fees and expenses of third-party accountants. |
Summarized below are2023, the fees earned by andpotential “make-whole amount” on the expenses reimbursableestimated aggregate amount of built-in gain subject to protection under the Property Manager for the years ended December 31, 2017, 2016, and 2015, and any related amounts unpaid as of December 31, 2017 and 2016 (in thousands): |
| | | | | | | | | | | | | | | |
| | For the Year Ended December 31, | | Unpaid as of December 31, |
| | 2017 | | 2016 | | 2015 | | 2016 |
Property management fees(1) | $ | 8,360 |
| | $ | 9,929 |
| | $ | 9,108 |
| | $ | 840 |
|
Leasing commissions(2) | 6,670 |
| | 7,701 |
| | 7,316 |
| | 705 |
|
Construction management fees(2) | 1,367 |
| | 1,127 |
| | 1,117 |
| | 165 |
|
Other fees and reimbursements(3) | 6,234 |
| | 5,627 |
| | 5,533 |
| | 796 |
|
| Total | $ | 22,631 |
| | $ | 24,384 |
| | $ | 23,074 |
| | $ | 2,506 |
|
| |
(1)
| The property management fees are included in Property Operating on the consolidated statements of operations. |
| |
(2)
| Leasing commissions paid for leases with terms less than one year are expensed immediately and included in Depreciation and Amortization on the consolidated statements of operations. Leasing commissions paid for leases with terms greater than one year, and construction management fees, are capitalized and amortized over the life of the related leases or assets. |
| |
(3)
| Other fees and reimbursements are included in Property Operating, General and Administrative, and Transaction Expenses on the consolidated statements of operations based on the nature of the expense. |
Other Related Party Matters—Underagreements is approximately $122.7 million. The protection provided under the terms of the advisory agreement, we2021 TPA will expire in 2031. We have incurred organizational and offering costsnot recorded any liability related to REIT III. A portionthe 2017 TPA or the 2021 TPA on our consolidated balance sheets for any periods presented, nor recognized any expense since the inception of those costs were incurredthe 2017 TPA, owing to the fact that any potential liability under the agreements is controlled by Griffin Capital Corporation (“Griffin sponsor”), a co-sponsor of REIT III. The Griffin sponsor owns a 25% interestus and we believe we will either (i) continue to own and operate the protected properties or (ii) be able to successfully complete Section 1031 Exchanges (unless there is a 75% interestchange in applicable law) or complete other tax-efficient transactions to avoid any liability under the REIT III Advisor. agreements.
Other Related Party Matters—As such, $1.4 million of the receivableDecember 31, 2023, we have from REIT III is reimbursable to the Griffin sponsor and is recorded in Accounts Payable - Affiliates on the consolidated balance sheets.
Upon completion of the PELP transaction, we assumed PELP’s obligation aswere the limited guarantor of a $175 million mortgage loan secured by GRP I properties. Our guaranty for up to $200 million, capped at $50 million in most instances, of NRP’s debt. Our guaranteethe GRP I debt is limited to being the non-recourse carveout guarantor and the environmental indemnitor.
The terms Further, we are also party to an agreement with GRP I in which any potential liability under such guarantee will be apportioned between us and expirations ofGRP I based on our operating leases withrespective ownership percentages in the joint venture. We have no liability recorded on our tenants vary. The lease agreements frequently contain options to extendconsolidated balance sheets for the terms of leases and other terms and conditions as negotiated. We retain substantially all of the risks and benefits of ownership of the real estate assets leased to tenants.
Approximate future rental income to be received under noncancelable operating leases in effectguaranty as of December 31, 2017, assuming no new or renegotiated2023 and 2022.
In December 2022, we contributed certain assets to a third-party company in exchange for a warrant representing a 15% equity interest in the company, subject to certain conditions. This non-cash investment had a fair market value of $6.8 million, was accounted for as an equity method investment, and was recorded in Other Assets, Net. In connection with the transaction, we entered into a services contract for the use of these assets with the third-party company for a term of five years, with a required minimum annual payment by us of $1.2 million. For the year ended December 31, 2023, we paid service fees of $1.9 million and recorded equity income of $0.1 million.
During 2021, we made a cash investment of $3.0 million into a third-party company in exchange for preferred shares of their stock. As part of the investment agreement, the third-party company entered into leases
or option extensions on lease agreements, is as follows (in thousands): |
| | | |
| Year | Amount |
| 2018 | $ | 270,880 |
|
| 2019 | 242,613 |
|
| 2020 | 212,708 |
|
| 2021 | 178,096 |
|
| 2022 | 145,745 |
|
| 2023 and thereafter | 429,545 |
|
| Total | $ | 1,479,587 |
|
No single tenant comprised 10% or moreat two of our aggregate annualized base rentproperties. During 2023, we determined that the investment in the third-party company was fully impaired due to the value of the investment being significantly reduced, which is not deemed to be temporary, indicated by the company’s inability to pay rent. As a result, we recorded impairment expense of $3.0 million in Other Expense, Net on our consolidated statement of operations for the year ended December 31, 2023 and reserved tenant receivables of $0.2 million as of December 31, 2017. As2023 as the company is considered to be non-creditworthy.
PECO Air L.L.C. (“PECO Air”), an entity in which Mr. Edison, our Chairman and Chief Executive Officer, owns a 50% interest, owns an airplane that we use for business purposes in the course of our operations. We paid approximately $0.9 million, $0.9 million, and $0.8 million to PECO Air for use of its airplane per the terms of our contractual agreements for the years ended December 31, 2017, our real estate investments in Florida represented 12.8% of our ABR. As a result, the geographic concentration of our portfolio makes it particularly susceptible to adverse economic or weather developments in the Florida real estate market.2023, 2022, and 2021, respectively.
| | | | | | | | | | | |
| PHILLIPS EDISON & COMPANY DECEMBER 31, 2023 FORM 10-K | | | F-30 |
| | |
17.16. FAIR VALUE MEASUREMENTS |
The following describes the methods we use to estimate the fair value of our financial and nonfinancial assets and liabilities:
Cash and Cash Equivalents, Restricted Cash, Accounts Receivable, and Accounts Payable—We consider the carrying values of these financial instruments to approximate fair value because of the short period of time between origination of the instruments and their expected realization.
Real Estate Investments—The purchase prices of the investment properties, including related lease intangible assets and liabilities, wereare allocated at estimated fair value based on Level 3 inputs, such as discount rates, capitalization rates, comparable sales, replacement costs, income and expense growth rates, and current market rents and allowances as determined by management.
Mortgages and Loans PayableDebt Obligations—We estimate the fair value of our debtrevolving credit facility, term loans, secured portfolio of loans, and mortgages by discounting the future cash flows of each instrument at rates currently offered for similar debt instruments of comparable maturities by our lenders using Level 3 inputs. The discount rates used approximate current lending rates for loans or groups of loans with similar maturities and credit quality, assuming the debt is outstanding through maturity and considering the debt’s collateral (if applicable). We have utilized market information, as available, or present value techniques to estimate the amounts required to be disclosed. We estimate the fair value of our senior unsecured notes by using quoted prices in active markets, which are considered Level 1 inputs.
The following is a summary of borrowings as of December 31, 20172023 and 20162022 (in thousands): |
| | | | | | | | |
|
| 2017 |
| 2016 |
| Fair value |
| $ | 1,765,151 |
|
| $ | 1,056,990 |
|
Recorded value(1) |
| 1,823,040 |
|
| 1,065,180 |
|
| |
(1)
| Recorded value does not include net deferred financing costs of $16.0 million and $9.0 million as of December 31, 2017 and 2016, respectively. |
| | | | | | | | | | | | | | | | | | | | | | | | | | |
| | 2023 | | 2022 |
| | Recorded Principal Balance(1) | | Fair Value | | Recorded Principal Balance(1) | | Fair Value |
| Revolving credit facility | | $ | 181,000 | | | $ | 181,714 | | | $ | 79,000 | | | $ | 79,299 | |
| Term loans | | 956,132 | | | 970,238 | | | 948,429 | | | 959,319 | |
| Senior unsecured notes due 2031 | | 343,698 | | | 284,865 | | | 342,999 | | | 257,446 | |
| Secured portfolio loan facilities | | 392,575 | | | 351,339 | | | 392,093 | | | 343,921 | |
Mortgages(2) | | 95,867 | | | 94,966 | | | 134,073 | | | 132,563 | |
| Total | | $ | 1,969,272 | | | $ | 1,883,122 | | | $ | 1,896,594 | | | $ | 1,772,548 | |
(1)As of December 31, 2023 and 2022, respectively, recorded principal balances include: (i) net deferred financing fees of $10.3 million and $8.0 million; (ii) assumed market debt adjustments of $0.9 million and $1.2 million; and (iii) notes payable discounts of $6.3 million and $7.0 million.
(2)Our finance lease liability is included in the mortgages line item, as presented.
Recurring and Nonrecurring Fair Value Measurements
—Our marketable securities, earn-out liability, and interest rate swaps are measured and recognized at fair value on a recurring basis. The fair value measurements of thosebasis, while certain real estate assets and liabilities are measured and recognized at fair value as needed. Fair value measurements that occurred as of and during the years ended December 31, 20172023 and 2016,2022 were as follows (in thousands): |
| | | | | | | | | | | | | | | | | | | |
| | 2017 | | 2016 |
| | Level 1 | Level 2 | Level 3 | | Level 1 | Level 2 | Level 3 |
Interest rate swaps-term loans(1) | $ | — |
| $ | 16,496 |
| $ | — |
| | $ | — |
| $ | 11,916 |
| $ | — |
|
Interest rate swap-mortgage note(1) | — |
| (61 | ) | — |
| | — |
| (262 | ) | — |
|
| Earn-out liability | — |
| — |
| (38,000 | ) | | — |
| — |
| — |
|
| | | | | | | | | | | | | | | | | | | | | | | |
| 2023 | | 2022 |
| Level 1 | Level 2 | Level 3 | | Level 1 | Level 2 | Level 3 |
| Recurring | | | | | | | |
Marketable securities(1) | $ | 8,566 | | $ | — | | $ | — | | | $ | 7,792 | | $ | — | | $ | — | |
Derivative assets(1)(2) | — | | 12,669 | | — | | | — | | 25,853 | | — | |
| Nonrecurring | | | | | | | |
Impaired real estate assets, net(3) | $ | — | | $ | — | | $ | — | | | $ | — | | $ | 5,225 | | $ | — | |
| |
(1)
| We record derivative assets in Other Assets, Net and derivative liabilities in Accounts Payable and Other Liabilities on our consolidated balance sheets. |
Earn-out—(1)We record marketable securities and derivative assets in Other Assets, Net on our consolidated balance sheets.
(2)The termsfair values of the PELP transaction include an earn-out structure with an opportunity for upderivative assets exclude associated accrued interest receivable of $1.7 million and $1.4 million as of December 31, 2023 and 2022, respectively.
(3)The carrying value of impaired real estate assets may have subsequently increased or decreased after the measurement date due to an additional 12.5 million OP units to be issued to PELP as additional consideration if certain milestones are achieved. The milestones are related to a liquidity event for our shareholders and fundraising targets in REIT III, of which PELP was a co-sponsor.capital improvements, depreciation, or sale.
Marketable Securities—We estimate the fair value of this liabilitymarketable securities using weighted-average probabilities of likely outcomes. These estimates require us to make various assumptions about future shareLevel 1 inputs. We utilize unadjusted quoted prices timing of liquidity events, equity raise projections, and other itemsfor identical assets in active markets that are unobservable and are considered Level 3 inputs in the fair value hierarchy. In calculating the fair value of this liability, we have determined that the range of potential outcomes still includes a possibility of no additional OP units issued as well as the maximum 12.5 million units being issued. As of December 31, 2017, the fair value of this liability was estimatedability to be $38 million.access.
Derivative Instruments—As of December 31, 20172023 and 2016,2022, we had interest rate swaps that fixed LIBORSOFR on portions of our unsecured term loan facilities. For a more detailed discussion of these cash flow hedges, see Note 8. As of December 31, 2017 and 2016, we were also party to an interest rate swap that fixed the variable interest rate on $10.7 million and $11.0 million, respectively, of one of our mortgage notes. The change in fair value of this instrument is recorded in Other Income, Net on the consolidated statements of operations and was not material for the years ended December 31, 2017 and 2016.
All interest rate swap agreements are measured at fair value on a recurring basis. The valuation of these instruments is determined using widely accepted valuation techniques, including discounted cash flow analysis on the expected cash flows of each derivative. This analysis reflects the contractual terms of the derivatives, including the period to maturity, and uses observable market-based inputs, including interest rate curves and implied volatilities. The fair values of interest rate swaps are determined using the market standard methodology of netting the discounted future fixed cash receipts (or payments) and the discounted expected variable cash payments (or receipts). The variable cash payments (or receipts) are based on an expectation of future interest rates (forward curves) derived from observable market interest rate curves.
| | | | | | | | | | | |
| PHILLIPS EDISON & COMPANY DECEMBER 31, 2023 FORM 10-K | | | F-31 |
To comply with the provisions of ASC 820,Fair Value Measurement, we incorporate credit valuation adjustments to appropriately reflect both our own nonperformance risk and the respective counterparty’s nonperformance risk in the fair value measurements. In adjusting the fair value of our derivative contracts for the effect of nonperformance risk, we have considered the impact of netting and any applicable credit enhancements, such as collateral postings, thresholds, mutual puts, and guarantees.
Although we determined that the significant inputs used to value our derivatives fell within Level 2 of the fair value hierarchy, the credit valuation adjustments associated with our counterparties and our own credit risk utilize Level 3 inputs, such as estimates of current credit spreads, to evaluate the likelihood of default by us and our counterparties. However, as of December 31, 20172023 and 2016,2022, we have assessed the significance of the impact of the credit valuation adjustments on the overall valuation of our derivative positions and have determined that the credit valuation adjustments are not significant to the overall valuation of our derivatives. As a result, we have determined that our derivative valuations in their entirety are classified in Level 2 of the fair value hierarchy.
Earn-out—As part of our acquisition of Phillips Edison Limited Partnership (“PELP”) in 2017, an earn-out structure was established which gave PELP the opportunity to earn additional OP units based upon the potential achievement of certain performance targets subsequent to the acquisition. On January 11, 2022, we finalized the fair value of the earn-out liability based on our share price and issued approximately 1.6 million OP units in full settlement of the liability with a value of $54.2 million. Changes in the fair value of the earn-out liability were recorded to Other Expense, Net in the consolidated statements of operations. We recorded no expense during the year ended December 31, 2017, we operated through two business segments: Owned Real Estate2023. We recorded expense of $1.8 million and Investment Management. Prior to the completion of the PELP transaction on October 4, 2017, we only operated through the Owned Real Estate segment. As a result, we did not report any segment disclosures$30.4 million for the years ended December 31, 20162022 and 2015.2021, respectively.
Real Estate Asset Impairment—Our real estate assets are measured and recognized at fair value, less costs to sell held-for-sale properties, on a nonrecurring basis dependent upon when we determine an impairment has occurred. We generate revenues and segment profit from our segments as follows:
Owned Real Estate: Our business objectiveimpair assets that are under contract at a disposition price that is to own and operate well-occupied grocery-anchored shopping centers that generate cash flows to support distributions to our shareholders with the potential for capital appreciation. We typically invest in neighborhood shopping centers (generally containing less than 125,000 leasable square feet) located in attractive demographic markets throughoutcarrying value, or that have other operational impairment indicators. The valuation technique used for the United States where our management believes our fully integrated operating platform can add value. Through this segment,fair value of all impaired real estate assets was the expected net sales proceeds, which we ownconsider to be a diversified portfolio of shopping centers subject to long-term net leases with creditworthy tenantsLevel 2 input in the grocery, retail, restaurant, and service industries. Asfair value hierarchy.
We recorded the following expense upon impairment of December 31, 2017, we owned 236 properties.
Investment Management: Through this segment, we are responsible for managing the day-to-day affairs of the Managed Funds, identifying and making acquisitions and investments on their behalf, maintaining and operating their real properties, and recommending to the respective boards of directors an approach for providing investors of the Managed Funds with liquidity. We generate revenues by providing asset management and property management services, in addition to revenues from leasing, acquisition, construction, and disposition services (see Note 14).
Our chief operating decision makers rely primarily on segment profit and similar measures to make decisions regarding allocating resources and assessing segment performance. We allocate certain operating expenses, such as employee related costs and benefits, to our segments. Items not directly attributable to our Owned Real Estate or Investment Management segments are allocated to corporate general and administrative expenses, which is a reconciling item. The table below compares segment profit for each of our operating segments and reconciles total segment profit to Net Loss for the year ended December 31, 2017 (in thousands): |
| | | | | | | | | | | |
| | 2017 |
| | Owned Real Estate | | Investment Management | | Total |
| Total revenues | $ | 303,410 |
| | $ | 8,133 |
| | $ | 311,543 |
|
| Property operating expenses | (50,328 | ) | | (3,496 | ) | | (53,824 | ) |
| Real estate tax expenses | (43,247 | ) | | (209 | ) | | (43,456 | ) |
| General and administrative expenses | (3,403 | ) | | (2,875 | ) | | (6,278 | ) |
| Segment profit | $ | 206,432 |
| | $ | 1,553 |
| | 207,985 |
|
| Corporate general and administrative expenses | | | | | (30,070 | ) |
| Vesting of Class B units for asset management services | | | | | (24,037 | ) |
| Termination of affiliate arrangements | | | | | (5,454 | ) |
| Depreciation and amortization | | | | | (130,671 | ) |
| Interest expense, net | | | | | (45,661 | ) |
| Acquisition expenses | | | | | (530 | ) |
| Transaction expenses | | | | | (15,713 | ) |
| Other income, net | | | | | 2,433 |
|
| Net loss | | | | | $ | (41,718 | ) |
The table below summarizes the totalestate assets and capital expenditures for each of our operating segments as of December 31, 2017 (in thousands): |
| | | |
| | 2017 |
| Assets: | |
| Owned Real Estate | $ | 3,388,080 |
|
| Investment Management | 90,236 |
|
| Total segment assets | 3,478,316 |
|
| Reconciling items: | |
| Cash and cash equivalents | 5,716 |
|
| Restricted cash | 21,729 |
|
| Corporate headquarters and other assets | 20,321 |
|
| Total assets | $ | 3,526,082 |
|
| | |
| Capital Expenditures: | |
| Owned Real Estate | $ | 41,009 |
|
| Investment Management | 1,137 |
|
| Total capital expenditures | $ | 42,146 |
|
|
|
19. QUARTERLY FINANCIAL DATA (UNAUDITED) |
The following is a summary of the unaudited quarterly financial information for the years ended December 31, 20172023, 2022, and 2016. We believe2021 (in thousands):
| | | | | | | | | | | | | | | | | |
| 2023 | | 2022 | | 2021 |
| Impairment of real estate assets | $ | — | | | $ | 322 | | | $ | 6,754 | |
In preparing the audited consolidated financial statements, we have evaluated subsequent events through the date of filing of this report on Form 10-K for recognition and/or disclosure purposes. Based on this evaluation, we have determined that
all necessary adjustments, consisting only of normal recurring adjustments,there were no events that have occurred that require recognition or disclosure, other than certain events and transactions that have been
includeddisclosed elsewhere in
the amounts stated below to present fairly, and in accordance with GAAP, the selected quarterly information.these consolidated financial statements. |
| | | | | | | | | | | | | | | |
| | 2017 |
| (in thousands, except per share amounts) | First Quarter | | Second Quarter | | Third Quarter(1) | | Fourth Quarter(2) |
| Total revenue | $ | 68,303 |
| | $ | 69,851 |
| | $ | 70,624 |
| | $ | 102,765 |
|
| Net income (loss) attributable to stockholders | 1,106 |
| | (1,193 | ) | | (8,232 | ) | | (30,072 | ) |
| Net income (loss) per share - basic and diluted | 0.01 |
| | (0.01 | ) | | (0.04 | ) | | (0.17 | ) |
| |
(1)
| The net loss in the third quarter was primarily due to expenses related to the PELP transaction and the termination of our relationship with ARC. |
| |
(2)
| The increases in revenue and net loss in the fourth quarter were primarily associated with the PELP transaction. |
|
| | | | | | | | | | | | | | | |
| | 2016 |
| (in thousands, except per share amounts) | First Quarter | | Second Quarter | | Third Quarter | | Fourth Quarter |
| Total revenue | $ | 63,082 |
| | $ | 63,053 |
| | $ | 65,270 |
| | $ | 66,325 |
|
| Net income attributable to stockholders | 2,219 |
| | 560 |
| | 2,464 |
| | 3,689 |
|
| Net income per share - basic and diluted | 0.01 |
| | 0.00 |
| | 0.01 |
| | 0.02 |
|
| | | | | | | | | | | |
| PHILLIPS EDISON & COMPANY DECEMBER 31, 2023 FORM 10-K |
| 20. SUBSEQUENT EVENTS | F-32 |
Distributions—Distributions paid to stockholders and OP unit holders of record subsequent to December 31, 2017, were as follows (in thousands):
| | | | | | | | | | | | | | | | | | | | | | | | | | | | | | | | | | | | | | |
| SCHEDULE III—REAL ESTATE ASSETS AND ACCUMULATED DEPRECIATION |
| December 31, 2023 |
| (in thousands) |
| | | Initial Cost | Costs Capitalized Subsequent to Acquisition(2) | | Gross Amount Carried at End of Period(3) | | | |
| Property Name | City, State | Encumbrances(1) | Land and Improvements | Buildings and Improvements | | Land and Improvements | Buildings and Improvements | Total | Accumulated Depreciation | Date Constructed/ Renovated | Date Acquired |
| Snow View Plaza | Parma, OH | $— | $4,104 | $6,432 | $1,449 | | $4,490 | $7,495 | $11,985 | $4,490 | 1981 | 12/15/2010 |
| Lakeside Plaza | Salem, VA | — | 3,344 | 5,247 | 1,066 | | 3,591 | 6,066 | 9,657 | 3,539 | 1988 | 11/23/2011 |
| St. Charles Plaza | Davenport, FL | — | 4,090 | 4,399 | 829 | | 4,437 | 4,881 | 9,318 | 3,622 | 2007 | 11/23/2011 |
| Burwood Village Center | Glen Burnie, MD | — | 5,448 | 10,167 | 714 | | 5,809 | 10,520 | 16,329 | 6,336 | 1971 | 11/23/2011 |
| Centerpoint | Easley, SC | — | 2,750 | 4,361 | 1,627 | | 3,441 | 5,297 | 8,738 | 3,162 | 2002 | 11/23/2011 |
| Southampton Village | Tyrone, GA | — | 3,046 | 5,788 | 1,559 | | 3,439 | 6,954 | 10,393 | 3,496 | 2003 | 11/23/2011 |
| Cureton Town Center | Waxhaw, NC | — | 6,569 | 6,197 | 2,726 | | 5,954 | 9,538 | 15,492 | 5,640 | 2006/2018 | 12/29/2011 |
| Tramway Crossing | Sanford, NC | — | 2,016 | 3,071 | 1,081 | | 2,650 | 3,518 | 6,168 | 2,555 | 1996 | 2/23/2012 |
| Village At Glynn Place | Brunswick, GA | — | 5,812 | 7,368 | 1,878 | | 6,078 | 8,980 | 15,058 | 5,123 | 1992/2009 | 4/27/2012 |
| Meadowthorpe Manor Shoppes | Lexington, KY | — | 4,093 | 4,185 | 2,209 | | 4,636 | 5,851 | 10,487 | 2,953 | 1989/2022 | 5/9/2012 |
| Brentwood Commons | Bensenville, IL | — | 6,105 | 8,024 | 2,525 | | 6,350 | 10,304 | 16,654 | 5,376 | 1981/2015 | 7/5/2012 |
| Sidney Towne Center | Sidney, OH | — | 1,429 | 3,802 | 1,748 | | 2,209 | 4,770 | 6,979 | 3,382 | 1981/2007 | 8/2/2012 |
| Broadway Plaza | Tucson, AZ | — | 4,979 | 7,169 | 2,992 | | 6,187 | 8,953 | 15,140 | 5,196 | 1982/2003 | 8/13/2012 |
| Baker Hill | Glen Ellyn, IL | — | 7,068 | 13,738 | 10,185 | | 7,731 | 23,260 | 30,991 | 11,588 | 1998/2018 | 9/6/2012 |
| New Prague Commons | New Prague, MN | — | 3,248 | 6,604 | 3,149 | | 3,447 | 9,554 | 13,001 | 5,576 | 2008/2019 | 10/12/2012 |
| Heron Creek Towne Center | North Port, FL | — | 4,062 | 4,082 | 966 | | 4,359 | 4,751 | 9,110 | 2,719 | 2001 | 12/17/2012 |
| Quartz Hill Towne Centre | Lancaster, CA | 11,740 | 6,689 | 13,529 | 1,285 | | 7,317 | 14,186 | 21,503 | 6,850 | 1991/2012 | 12/27/2012 |
| Village One Plaza | Modesto, CA | 17,700 | 5,166 | 18,752 | 980 | | 5,533 | 19,365 | 24,898 | 8,736 | 2007 | 12/28/2012 |
| Hilfiker Shopping Center | Salem, OR | — | 2,879 | 4,750 | 166 | | 3,004 | 4,791 | 7,795 | 2,311 | 1984/2011 | 12/28/2012 |
| Butler Creek | Acworth, GA | — | 3,925 | 6,129 | 3,745 | | 4,377 | 9,422 | 13,799 | 4,251 | 1989 | 1/15/2013 |
| Fairview Oaks | Ellenwood, GA | 6,430 | 3,563 | 5,266 | 1,408 | | 3,931 | 6,306 | 10,237 | 3,245 | 1996 | 1/15/2013 |
| Grassland Crossing | Alpharetta, GA | — | 3,680 | 5,791 | 1,305 | | 3,864 | 6,912 | 10,776 | 3,477 | 1996 | 1/15/2013 |
| Hamilton Ridge | Buford, GA | — | 4,772 | 7,168 | 2,868 | | 5,122 | 9,686 | 14,808 | 4,498 | 2002 | 1/15/2013 |
| Mableton Crossing | Mableton, GA | — | 4,426 | 6,413 | 1,481 | | 4,913 | 7,407 | 12,320 | 4,039 | 1997 | 1/15/2013 |
| Shops at Westridge | McDonough, GA | — | 2,788 | 3,901 | 2,123 | | 2,973 | 5,839 | 8,812 | 2,903 | 2006/2020 | 1/15/2013 |
| Fairlawn Town Centre | Fairlawn, OH | 20,000 | 10,398 | 29,005 | 5,155 | | 11,658 | 32,900 | 44,558 | 16,684 | 1962/2012 | 1/30/2013 |
| Macland Pointe | Marietta, GA | — | 3,493 | 5,364 | 1,470 | | 3,975 | 6,352 | 10,327 | 3,691 | 1992 | 2/13/2013 |
| Kleinwood Center | Spring, TX | — | 11,478 | 18,954 | 1,341 | | 11,797 | 19,976 | 31,773 | 10,386 | 2003 | 3/21/2013 |
| Murray Landing | Columbia, SC | 6,750 | 3,221 | 6,856 | 2,335 | | 3,804 | 8,608 | 12,412 | 4,095 | 2003/2016 | 3/21/2013 |
| Vineyard Shopping Center | Tallahassee, FL | — | 2,761 | 4,221 | 642 | | 3,062 | 4,562 | 7,624 | 2,618 | 2002 | 3/21/2013 |
| Lutz Lake Crossing | Lutz, FL | — | 2,636 | 6,600 | 1,066 | | 3,031 | 7,271 | 10,302 | 3,358 | 2002 | 4/4/2013 |
| Publix at Seven Hills | Spring Hill, FL | — | 2,171 | 5,642 | 1,378 | | 2,518 | 6,673 | 9,191 | 3,110 | 1991/2006 | 4/4/2013 |
| Hartville Centre | Hartville, OH | — | 2,069 | 3,691 | 1,963 | | 2,493 | 5,230 | 7,723 | 2,770 | 1988/2008 | 4/23/2013 |
| Sunset Shopping Center | Corvallis, OR | 15,410 | 7,933 | 14,939 | 3,128 | | 8,246 | 17,754 | 26,000 | 7,583 | 1998/2023 | 5/31/2013 |
| Savage Town Square | Savage, MN | 9,000 | 4,106 | 9,409 | 481 | | 4,422 | 9,574 | 13,996 | 4,910 | 2003 | 6/19/2013 |
| Glenwood Crossings | Kenosha, WI | — | 1,872 | 9,914 | 1,289 | | 2,418 | 10,657 | 13,075 | 4,734 | 1992/2018 | 6/27/2013 |
|
| | | | | | | | | | | | | | | |
| Month | Date of Record | Distribution Rate | Date Distribution Paid | | Gross Amount of Distribution Paid | | Distribution Reinvested through the DRIP | | Net Cash Distribution |
| December | 12/1/2017 - 12/31/2017 | $0.00183562 | 1/2/2018 | | $ | 13,017 |
| | $ | 4,354 |
| | $ | 8,663 |
|
| January | 1/16/2018 | $0.05583344 | 2/1/2018 | | 12,789 |
| | 4,228 |
| | 8,561 |
|
| February | 2/15/2018 | $0.05583344 | 3/1/2018 | | 12,807 |
| | 4,186 |
| | 8,621 |
|
In February 2018 our Board authorized distributions for March, April, and May 2018 to the stockholders of record at the close of business on March 15, 2018, April 16, 2018, and May 15, 2018, respectively, equal to a monthly amount of $0.05583344 per share of common stock. OP unit holders will receive distributions at the same rate as common stockholders. | | | | | | | | | | | |
| PHILLIPS EDISON & COMPANY DECEMBER 31, 2023 FORM 10-K | | | F-33 |
Beginning January 1, 2018, we pay distributions to stockholders and OP unit holders based on monthly record dates. We expect to pay these distributions on the first business day after the end of each month. The 2018 monthly distribution rate is currently at the same annual distribution rate as 2017. | | | | | | | | | | | | | | | | | | | | | | | | | | | | | | | | | | | | | | |
| SCHEDULE III—REAL ESTATE ASSETS AND ACCUMULATED DEPRECIATION |
| December 31, 2023 |
| (in thousands) |
| | | Initial Cost | Costs Capitalized Subsequent to Acquisition(2) | | Gross Amount Carried at End of Period(3) | | | |
| Property Name | City, State | Encumbrances(1) | Land and Improvements | Buildings and Improvements | | Land and Improvements | Buildings and Improvements | Total | Accumulated Depreciation | Date Constructed/ Renovated | Date Acquired |
| Shiloh Square Shopping Center | Kennesaw, GA | — | 4,685 | 8,729 | 2,474 | | 4,864 | 11,024 | 15,888 | 4,835 | 1996/2003 | 6/27/2013 |
| Pavilions at San Mateo | Albuquerque, NM | — | 6,470 | 18,726 | 2,486 | | 7,024 | 20,658 | 27,682 | 9,264 | 1997/2012 | 6/27/2013 |
| Boronda Plaza | Salinas, CA | 14,750 | 9,027 | 11,870 | 728 | | 9,374 | 12,251 | 21,625 | 5,744 | 2003/2021 | 7/3/2013 |
| Westwoods Shopping Center | Arvada, CO | — | 3,706 | 11,115 | 1,340 | | 4,594 | 11,567 | 16,161 | 5,530 | 2003/2011 | 8/8/2013 |
| Paradise Crossing | Lithia Springs, GA | — | 2,204 | 6,064 | 1,044 | | 2,535 | 6,777 | 9,312 | 3,178 | 2000 | 8/13/2013 |
| Contra Loma Plaza | Antioch, CA | — | 3,018 | 3,926 | 2,036 | | 3,758 | 5,222 | 8,980 | 2,269 | 1989/2022 | 8/19/2013 |
| South Oaks Plaza | St. Louis, MO | — | 1,938 | 6,634 | 2,680 | | 2,186 | 9,066 | 11,252 | 3,483 | 1969/2021 | 8/21/2013 |
| Yorktown Centre | Millcreek Township, PA | — | 3,736 | 15,396 | 2,995 | | 4,590 | 17,537 | 22,127 | 8,851 | 1989/2020 | 8/30/2013 |
| Dyer Town Center | Dyer, IN | 8,071 | 6,017 | 10,214 | 912 | | 6,499 | 10,644 | 17,143 | 5,354 | 2004/2005 | 9/4/2013 |
| East Burnside Plaza | Portland, OR | — | 2,484 | 5,422 | 186 | | 2,601 | 5,491 | 8,092 | 2,068 | 1955/1999 | 9/12/2013 |
| Red Maple Village | Tracy, CA | 20,584 | 9,250 | 19,466 | 783 | | 9,656 | 19,843 | 29,499 | 7,876 | 2009 | 9/18/2013 |
| Crystal Beach Plaza | Palm Harbor, FL | 6,360 | 2,334 | 7,918 | 794 | | 2,488 | 8,558 | 11,046 | 3,945 | 2010 | 9/25/2013 |
| CitiCentre Plaza | Carroll, IA | — | 770 | 2,530 | 605 | | 1,071 | 2,834 | 3,905 | 1,343 | 1991/2018 | 10/2/2013 |
| Duck Creek Plaza | Bettendorf, IA | — | 4,612 | 13,007 | 1,866 | | 5,239 | 14,246 | 19,485 | 5,860 | 2005/2022 | 10/8/2013 |
| Cahill Plaza | Inver Grove Heights, MN | — | 2,587 | 5,114 | 979 | | 2,990 | 5,690 | 8,680 | 2,824 | 1995/2020 | 10/9/2013 |
| College Plaza | Normal, IL | — | 4,460 | 17,772 | 6,054 | | 5,151 | 23,135 | 28,286 | 8,049 | 1983/2018 | 10/22/2013 |
| Courthouse Marketplace | Virginia Beach, VA | 11,650 | 6,130 | 8,061 | 1,746 | | 6,403 | 9,534 | 15,937 | 4,368 | 2005 | 10/25/2013 |
| Hastings Marketplace | Hastings, MN | — | 3,980 | 10,045 | 1,220 | | 4,532 | 10,713 | 15,245 | 5,026 | 2002 | 11/6/2013 |
| Coquina Plaza | Southwest Ranches, FL | — | 9,458 | 11,770 | 1,359 | | 9,798 | 12,789 | 22,587 | 5,363 | 1998 | 11/7/2013 |
| Shoppes of Paradise Lakes | Miami, FL | — | 5,811 | 6,020 | 1,103 | | 6,156 | 6,778 | 12,934 | 3,182 | 1999 | 11/7/2013 |
| Collington Plaza | Bowie, MD | — | 12,207 | 15,142 | 2,162 | | 12,605 | 16,906 | 29,511 | 7,123 | 1996 | 11/21/2013 |
| Golden Town Center | Golden, CO | 14,711 | 7,065 | 10,166 | 2,016 | | 7,721 | 11,526 | 19,247 | 5,630 | 1993/2003 | 11/22/2013 |
| Northstar Marketplace | Ramsey, MN | — | 2,810 | 9,204 | 3,662 | | 3,023 | 12,653 | 15,676 | 4,487 | 2004/2023 | 11/27/2013 |
| Bear Creek Plaza | Petoskey, MI | — | 5,677 | 17,611 | 1,737 | | 5,894 | 19,131 | 25,025 | 8,770 | 1998/2018 | 12/18/2013 |
| East Side Square | Springfield, OH | — | 394 | 963 | 187 | | 412 | 1,132 | 1,544 | 540 | 2007 | 12/18/2013 |
| Flag City Station | Findlay, OH | — | 4,685 | 9,630 | 3,699 | | 4,993 | 13,021 | 18,014 | 5,240 | 1992/2020 | 12/18/2013 |
| Town & Country Shopping Center | Noblesville, IN | 13,480 | 7,361 | 16,269 | 505 | | 7,456 | 16,679 | 24,135 | 7,746 | 1998/2023 | 12/18/2013 |
| Sulphur Grove | Huber Heights, OH | — | 553 | 2,142 | 789 | | 611 | 2,873 | 3,484 | 1,145 | 2004 | 12/18/2013 |
| Southgate Shopping Center | Des Moines, IA | — | 2,434 | 8,358 | 1,795 | | 2,977 | 9,610 | 12,587 | $4,604 | 1972/2014 | 12/20/2013 |
| Sterling Pointe Center | Lincoln, CA | 24,073 | 7,039 | 20,822 | 2,196 | | 7,733 | 22,324 | 30,057 | 8,784 | 2004/2017 | 12/20/2013 |
| Arcadia Plaza | Phoenix, AZ | — | 5,774 | 6,904 | 3,274 | | 6,118 | 9,834 | 15,952 | 4,312 | 1980/2018 | 12/30/2013 |
| Stop & Shop Plaza | Enfield, CT | — | 8,892 | 15,028 | 1,448 | | 9,401 | 15,967 | 25,368 | 7,373 | 1988/1998 | 12/30/2013 |
Acquisitions—Subsequent to December 31, 2017, we executed the following asset acquisition (dollars in thousands): |
| | | | | | | | | | | | |
| Property Name | | Location | | Anchor Tenant | | Acquisition Date | | Purchase Price | | Square Footage | | Leased % of Rentable Square Feet at Acquisition |
| Shoppes of Lake Village | | Leesburg, FL | | Publix | | 2/26/2018 | | $8,400 | | 135,437 | | 71.3% |
Grocer Bankruptcy—On March 21, 2018, Southeastern Grocers, the parent company of Winn Dixie and Bi-Lo, filed for bankruptcy. We have eight grocery stores operated by subsidiaries of Southeastern Grocers in our portfolio. We | | | | | | | | | | | |
| PHILLIPS EDISON & COMPANY DECEMBER 31, 2023 FORM 10-K | | | F-34 |
| | | | | | | | | | | | | | | | | | | | | | | | | | | | | | | | | | | | | | |
| SCHEDULE III—REAL ESTATE ASSETS AND ACCUMULATED DEPRECIATION |
| December 31, 2023 |
| (in thousands) |
| | | Initial Cost | Costs Capitalized Subsequent to Acquisition(2) | | Gross Amount Carried at End of Period(3) | | | |
| Property Name | City, State | Encumbrances(1) | Land and Improvements | Buildings and Improvements | | Land and Improvements | Buildings and Improvements | Total | Accumulated Depreciation | Date Constructed/ Renovated | Date Acquired |
| Fairacres Shopping Center | Oshkosh, WI | — | 3,543 | 5,189 | 1,315 | | 4,057 | 5,990 | 10,047 | 3,126 | 1992/2016 | 1/21/2014 |
| Savoy Plaza | Savoy, IL | — | 4,304 | 10,895 | 946 | | 4,789 | 11,356 | 16,145 | 5,742 | 1999/2015 | 1/31/2014 |
| The Shops of Uptown | Park Ridge, IL | — | 7,744 | 16,884 | 2,135 | | 8,182 | 18,581 | 26,763 | 6,919 | 2006 | 2/25/2014 |
| Chapel Hill North Center | Chapel Hill, NC | 5,746 | 4,776 | 10,189 | 1,897 | | 5,173 | 11,689 | 16,862 | 5,537 | 1998 | 2/28/2014 |
| Coppell Market Center | Coppell, TX | — | 4,870 | 12,236 | 511 | | 5,142 | 12,475 | 17,617 | 5,301 | 2008 | 3/5/2014 |
| Winchester Gateway | Winchester, VA | — | 9,342 | 23,468 | 2,436 | | 9,658 | 25,588 | 35,246 | 10,856 | 2006 | 3/5/2014 |
| Stonewall Plaza | Winchester, VA | — | 7,929 | 16,642 | 1,164 | | 8,137 | 17,598 | 25,735 | 7,675 | 2007 | 3/5/2014 |
| Town Fair Center | Louisville, KY | — | 8,108 | 14,411 | 5,576 | | 8,957 | 19,138 | 28,095 | 8,703 | 1988/2019 | 3/12/2014 |
| Villages at Eagles Landing | Stockbridge, GA | — | 2,824 | 5,515 | 1,240 | | 3,365 | 6,214 | 9,579 | 3,368 | 1995 | 3/13/2014 |
| ChampionsGate Village | Davenport, FL | — | 1,814 | 6,060 | 1,107 | | 2,075 | 6,906 | 8,981 | 2,995 | 2001 | 3/14/2014 |
| Towne Centre at Wesley Chapel | Wesley Chapel, FL | — | 2,466 | 5,553 | 1,012 | | 2,776 | 6,255 | 9,031 | 2,623 | 2000 | 3/14/2014 |
| Statler Square | Staunton, VA | — | 4,108 | 9,072 | 1,288 | | 4,695 | 9,773 | 14,468 | 4,566 | 1989/1997 | 3/21/2014 |
| Burbank Plaza | Burbank, IL | — | 2,972 | 4,546 | 3,965 | | 3,705 | 7,778 | 11,483 | 3,644 | 1972/2018 | 3/25/2014 |
| Hamilton Village | Chattanooga, TN | — | 12,682 | 19,103 | 5,816 | | 13,293 | 24,308 | 37,601 | 10,968 | 1989/2021 | 4/3/2014 |
| Waynesboro Plaza | Waynesboro, VA | — | 5,597 | 8,334 | 332 | | 5,814 | 8,449 | 14,263 | 4,243 | 2005 | 4/30/2014 |
| Southwest Marketplace | Las Vegas, NV | — | 16,018 | 11,270 | 3,251 | | 16,337 | 14,202 | 30,539 | 6,660 | 2008/2017 | 5/5/2014 |
| Hampton Village | Taylors, SC | — | 5,456 | 7,254 | 4,432 | | 6,081 | 11,061 | 17,142 | 5,521 | 1959/2019 | 5/21/2014 |
| Central Station | Louisville, KY | 12,095 | 6,143 | 6,932 | 3,077 | | 6,723 | 9,429 | 16,152 | 4,282 | 2005/2018 | 5/23/2014 |
| Kirkwood Market Place | Houston, TX | — | 5,786 | 9,697 | 1,760 | | 6,054 | 11,189 | 17,243 | 4,569 | 1979/2012 | 5/23/2014 |
| Fairview Plaza | New Cumberland, PA | — | 2,786 | 8,500 | 638 | | 3,174 | 8,750 | 11,924 | 3,380 | 1992/1999 | 5/27/2014 |
| Broadway Promenade | Sarasota, FL | — | 3,831 | 6,795 | 1,092 | | 4,239 | 7,479 | 11,718 | 2,853 | 2007 | 5/28/2014 |
| Townfair Center | Indiana, PA | — | 7,007 | 13,233 | 1,432 | | 7,357 | 14,315 | 21,672 | 7,026 | 1995/2016 | 5/29/2014 |
| Heath Brook Commons | Ocala, FL | 6,930 | 3,470 | 8,352 | 1,140 | | 3,759 | 9,203 | 12,962 | 3,836 | 2002 | 5/30/2014 |
| The Orchards | Yakima, WA | — | 5,425 | 8,743 | 647 | | 5,819 | 8,996 | 14,815 | 4,111 | 2002 | 6/3/2014 |
| Shaw's Plaza Hanover | Hanover, MA | — | 2,826 | 5,314 | 10 | | 2,826 | 5,324 | 8,150 | 2,200 | 1994/2000 | 6/23/2014 |
| Shaw's Plaza Easton | Easton, MA | — | 5,520 | 7,173 | 967 | | 5,897 | 7,763 | 13,660 | 3,481 | 1984/2004 | 6/23/2014 |
| Lynnwood Place | Jackson, TN | — | 3,341 | 4,826 | 1,150 | | 3,814 | 5,503 | 9,317 | 2,751 | 1986/2013 | 7/28/2014 |
| Thompson Valley Towne Center | Loveland, CO | — | 5,758 | 17,387 | 2,870 | | 6,432 | 19,583 | 26,015 | 7,826 | 1999 | 8/1/2014 |
| Lumina Commons | Wilmington, NC | 5,812 | 2,008 | 11,249 | 1,647 | | 2,131 | 12,773 | 14,904 | 4,561 | 1974/2007 | 8/4/2014 |
| Driftwood Village | Ontario, CA | — | 6,811 | 12,993 | 1,794 | | 7,617 | 13,981 | 21,598 | 5,632 | 1985 | 8/7/2014 |
| French Golden Gate | Bartow, FL | — | 2,599 | 12,877 | 2,479 | | 2,923 | 15,032 | 17,955 | 5,209 | 1960/2011 | 8/28/2014 |
| Orchard Square | Washington Township, MI | — | 1,361 | 11,550 | 895 | | 1,638 | 12,168 | 13,806 | 4,748 | 1999/2011 | 9/8/2014 |
| Trader Joe's Center | Dublin, OH | 6,745 | 2,338 | 7,922 | 3,558 | | 2,941 | 10,877 | 13,818 | 4,214 | 1986 | 9/11/2014 |
| Palmetto Pavilion | North Charleston, SC | — | 2,509 | 8,526 | 1,421 | | 3,583 | 8,873 | 12,456 | 3,546 | 2003 | 9/11/2014 |
| | | | | | | | | | | |
| PHILLIPS EDISON & COMPANY DECEMBER 31, 2023 FORM 10-K | | | F-35 |
| | | | | | | | | | | | | | | | | | | | | | | | | | | | | | | | | | | | | | |
| SCHEDULE III—REAL ESTATE ASSETS AND ACCUMULATED DEPRECIATION |
| December 31, 2023 |
| (in thousands) |
| | | Initial Cost | Costs Capitalized Subsequent to Acquisition(2) | | Gross Amount Carried at End of Period(3) | | | |
| Property Name | City, State | Encumbrances(1) | Land and Improvements | Buildings and Improvements | | Land and Improvements | Buildings and Improvements | Total | Accumulated Depreciation | Date Constructed/ Renovated | Date Acquired |
| Five Town Plaza | Springfield, MA | — | 8,912 | 19,635 | 7,580 | | 10,497 | 25,630 | 36,127 | 12,429 | 1970/2019 | 9/24/2014 |
| Fairfield Crossing | Beavercreek, OH | — | 3,572 | 10,026 | 283 | | 3,722 | 10,159 | 13,881 | 4,290 | 1994 | 10/24/2014 |
| Beavercreek Towne Center | Beavercreek, OH | — | 14,055 | 30,799 | 4,853 | | 15,335 | 34,372 | 49,707 | 15,283 | 1994/2019 | 10/24/2014 |
| Grayson Village | Loganville, GA | — | 3,952 | 5,620 | 2,482 | | 4,290 | 7,764 | 12,054 | 4,129 | 2002/2019 | 10/24/2014 |
| The Fresh Market Commons | Pawleys Island, SC | — | 2,442 | 4,941 | 228 | | 2,535 | 5,076 | 7,611 | 2,268 | 2011/2014 | 10/28/2014 |
| Claremont Village | Everett, WA | — | 5,635 | 10,544 | 1,776 | | 6,344 | 11,611 | 17,955 | 4,815 | 1994/2012 | 11/6/2014 |
| Cherry Hill Marketplace | Westland, MI | — | 4,641 | 10,137 | 3,068 | | 5,321 | 12,525 | 17,846 | 6,122 | 1992/2017 | 12/17/2014 |
| Nor'Wood Shopping Center | Colorado Springs, CO | — | 5,358 | 6,684 | 950 | | 5,607 | 7,385 | 12,992 | 3,857 | 2003/2007 | 1/8/2015 |
| Sunburst Plaza | Glendale, AZ | — | 3,435 | 6,041 | 3,095 | | 4,380 | 8,191 | 12,571 | 3,701 | 1970/2022 | 2/11/2015 |
| Rivermont Station | Johns Creek, GA | — | 6,876 | 8,916 | 5,098 | | 7,270 | 13,620 | 20,890 | 6,446 | 1996/2022 | 2/27/2015 |
| Breakfast Point Marketplace | Panama City Beach, FL | — | 5,578 | 12,052 | 902 | | 6,112 | 12,420 | 18,532 | 5,369 | 2009/2010 | 3/13/2015 |
| Falcon Valley | Lenexa, KS | — | 3,131 | 6,873 | 418 | | 3,495 | 6,927 | 10,422 | 3,287 | 2008/2009 | 3/13/2015 |
| Kohl's Onalaska | Onalaska, WI | — | 2,670 | 5,648 | 300 | | 2,670 | 5,948 | 8,618 | 2,760 | 1992/2021 | 3/13/2015 |
| Coronado Center | Santa Fe, NM | 11,560 | 4,396 | 16,460 | 5,230 | | 4,885 | 21,201 | 26,086 | 7,254 | 1964/2019 | 5/1/2015 |
| West Creek Plaza | Coconut Creek, FL | — | 3,459 | 6,131 | 807 | | 3,654 | 6,743 | 10,397 | 2,469 | 2006/2013 | 7/10/2015 |
| Northwoods Crossing | Taunton, MA | — | 10,092 | 14,437 | 394 | | 10,194 | 14,729 | 24,923 | 8,735 | 2003/2022 | 5/24/2016 |
| Murphy Marketplace | Murphy, TX | — | 28,651 | 33,122 | 5,083 | | 29,449 | 37,407 | 66,856 | 12,284 | 2008/2021 | 6/24/2016 |
| Harbour Village | Jacksonville, FL | — | 5,630 | 16,727 | 4,117 | | 6,146 | 20,328 | 26,474 | 6,548 | 2006/2021 | 9/22/2016 |
| Oak Mill Plaza | Niles, IL | — | 6,843 | 13,692 | 6,843 | | 7,617 | 19,761 | 27,378 | 7,344 | 1977/2023 | 10/3/2016 |
| Southern Palms | Tempe, AZ | 21,760 | 10,025 | 24,346 | 4,812 | | 10,495 | 28,688 | 39,183 | 11,201 | 1982/2018 | 10/26/2016 |
| Golden Eagle Village | Clermont, FL | 6,678 | 3,746 | 7,735 | 911 | | 3,988 | 8,404 | 12,392 | 3,059 | 2011 | 10/27/2016 |
Atwater Marketplace(4) | Atwater, CA | — | 6,116 | 7,597 | (11,465) | | 417 | 1,831 | 2,248 | 132 | 2023 | 2/10/2017 |
| Rocky Ridge Town Center | Roseville, CA | 19,098 | 5,449 | 29,207 | 1,105 | | 5,686 | 30,075 | 35,761 | 7,991 | 1996/2015 | 4/18/2017 |
| Greentree Centre | Racine, WI | — | 2,955 | 8,718 | 510 | | 3,076 | 9,107 | 12,183 | 2,998 | 1989/2018 | 5/5/2017 |
| Sierra Del Oro Towne Centre | Corona, CA | — | 9,011 | 17,989 | 2,365 | | 9,481 | 19,884 | 29,365 | 6,165 | 1991/2017 | 6/20/2017 |
| Birdneck Shopping Center | Virginia Beach, VA | — | 1,900 | 3,253 | 1,023 | | 2,091 | 4,085 | 6,176 | 1,878 | 1987/2017 | 10/4/2017 |
| Crossroads Plaza | Asheboro, NC | — | 1,722 | 2,720 | 815 | | 2,216 | 3,041 | 5,257 | 1,590 | 1984/2016 | 10/4/2017 |
| Dunlop Village | Colonial Heights, VA | — | 2,420 | 4,892 | 2,386 | | 2,735 | 6,963 | 9,698 | 2,273 | 1987/2012 | 10/4/2017 |
| Edgecombe Square | Tarboro, NC | — | 1,412 | 2,258 | 515 | | 1,493 | 2,692 | 4,185 | 1,811 | 1990/2013 | 10/4/2017 |
| Forest Park Square | Cincinnati, OH | — | 4,007 | 5,877 | 1,288 | | 4,501 | 6,671 | 11,172 | 3,066 | 1988/2018 | 10/4/2017 |
| Goshen Station | Goshen, OH | 3,605 | 1,555 | 4,621 | 181 | | 1,800 | 4,557 | 6,357 | 2,426 | 1973/2003 | 10/4/2017 |
| The Village Shopping Center | Mooresville, IN | — | 2,059 | 8,325 | 944 | | 2,323 | 9,005 | 11,328 | 3,099 | 1965/2019 | 10/4/2017 |
| Hickory Plaza | Nashville, TN | — | 2,927 | 5,099 | 2,455 | | 3,008 | 7,473 | 10,481 | 2,208 | 1974/2020 | 10/4/2017 |
| | | | | | | | | | | |
| PHILLIPS EDISON & COMPANY DECEMBER 31, 2023 FORM 10-K | | | F-36 |
| | | | | | | | | | | | | | | | | | | | | | | | | | | | | | | | | | | | | | |
| SCHEDULE III—REAL ESTATE ASSETS AND ACCUMULATED DEPRECIATION |
| December 31, 2023 |
| (in thousands) |
| | | Initial Cost | Costs Capitalized Subsequent to Acquisition(2) | | Gross Amount Carried at End of Period(3) | | | |
| Property Name | City, State | Encumbrances(1) | Land and Improvements | Buildings and Improvements | | Land and Improvements | Buildings and Improvements | Total | Accumulated Depreciation | Date Constructed/ Renovated | Date Acquired |
| Highland Fair | Gresham, OR | — | 3,263 | 7,979 | 693 | | 3,411 | 8,524 | 11,935 | 2,563 | 1984/2013 | 10/4/2017 |
| Mayfair Village | Hurst, TX | 16,398 | 15,343 | 16,522 | 4,103 | | 15,874 | 20,094 | 35,968 | 7,081 | 1981/2022 | 10/4/2017 |
| LaPlata Plaza | La Plata, MD | 17,860 | 8,434 | 22,855 | 2,397 | | 8,749 | 24,937 | 33,686 | 6,975 | 2003/2019 | 10/4/2017 |
| Lafayette Square | Lafayette, IN | — | 5,387 | 5,636 | 1,162 | | 5,422 | 6,763 | 12,185 | 4,896 | 1963/2022 | 10/4/2017 |
| Commerce Square | Brownwood, TX | — | 6,027 | 8,341 | 745 | | 5,844 | 9,269 | 15,113 | 1,926 | 1969/2022 | 10/4/2017 |
| Monfort Heights | Cincinnati, OH | 4,216 | 2,357 | 3,545 | 9 | | 2,357 | 3,554 | 5,911 | 1,481 | 1987/2015 | 10/4/2017 |
| Mountain Park Plaza | Roswell, GA | — | 6,118 | 6,652 | 945 | | 6,230 | 7,485 | 13,715 | 2,458 | 1988/2003 | 10/4/2017 |
| Nordan Shopping Center | Danville, VA | — | 1,911 | 6,751 | 975 | | 2,063 | 7,574 | 9,637 | 2,782 | 1961/2015 | 10/4/2017 |
| Northside Plaza | Clinton, NC | — | 1,406 | 5,471 | 789 | | 1,541 | 6,125 | 7,666 | 2,386 | 1982/2015 | 10/4/2017 |
| Park Place Plaza | Port Orange, FL | — | 2,347 | 8,458 | (2,201) | | 1,956 | 6,648 | 8,604 | 1,699 | 1984/2012 | 10/4/2017 |
| Parsons Village | Seffner, FL | — | 3,465 | 10,864 | (3,964) | | 2,481 | 7,884 | 10,365 | 2,141 | 1983/1994 | 10/4/2017 |
| Hillside - West | Hillside, UT | — | 691 | 1,739 | 3,870 | | 4,561 | 1,739 | 6,300 | 832 | 2006 | 10/4/2017 |
| South Oaks Shopping Center | Live Oak, FL | — | 1,742 | 5,119 | 1,864 | | 1,943 | 6,782 | 8,725 | 3,067 | 1976/2022 | 10/4/2017 |
| Summerville Galleria | Summerville, SC | — | 4,104 | 8,668 | 1,473 | | 4,651 | 9,594 | 14,245 | 3,302 | 1989/2014 | 10/4/2017 |
| The Oaks | Hudson, FL | — | 3,876 | 6,668 | 11,966 | | 4,726 | 17,784 | 22,510 | 3,106 | 1981/2022 | 10/4/2017 |
| Riverplace Centre | Noblesville, IN | 5,175 | 3,890 | 4,044 | 1,025 | | 4,008 | 4,951 | 8,959 | 2,609 | 1992/2020 | 10/4/2017 |
| Towne Crossing Shopping Center | Mesquite, TX | — | 5,358 | 15,584 | 2,595 | | 5,507 | 18,030 | 23,537 | 5,717 | 1984/2016 | 10/4/2017 |
| Village at Waterford | Midlothian, VA | — | 2,702 | 5,194 | 992 | | 3,019 | 5,869 | 8,888 | 2,119 | 1991/2016 | 10/4/2017 |
| Windsor Center | Dallas, NC | — | 2,488 | 5,186 | 639 | | 2,643 | 5,670 | 8,313 | 2,566 | 1974/2015 | 10/4/2017 |
| 12 West Marketplace | Litchfield, MN | — | 835 | 3,538 | 186 | | 1,007 | 3,552 | 4,559 | 1,931 | 1989/2010 | 10/4/2017 |
| Willowbrook Commons | Nashville, TN | — | 5,384 | 6,002 | 824 | | 5,767 | 6,443 | 12,210 | 2,450 | 2005 | 10/4/2017 |
| Edgewood Towne Center | Edgewood, PA | — | 10,029 | 22,535 | 3,359 | | 10,852 | 25,071 | 35,923 | 9,683 | 1990/2021 | 10/4/2017 |
| Everson Pointe | Snellville, GA | 7,734 | 4,222 | 8,421 | 537 | | 4,377 | 8,803 | 13,180 | 3,058 | 1999 | 10/4/2017 |
| Village Square of Delafield | Delafield, WI | 8,257 | 6,206 | 6,869 | 498 | | 6,526 | 7,047 | 13,573 | 2,941 | 2007/2017 | 10/4/2017 |
| Shoppes of Lake Village | Leesburg, FL | — | 7,193 | 3,795 | 7,108 | | 7,581 | 10,515 | 18,096 | 3,682 | 1987/2021 | 2/26/2018 |
| Sierra Vista Plaza | Murrieta, CA | — | 9,824 | 11,669 | 2,572 | | 10,472 | 13,593 | 24,065 | 3,665 | 1991/2021 | 9/28/2018 |
| Wheat Ridge Marketplace | Wheat Ridge, CO | — | 7,926 | 8,393 | 1,410 | | 8,490 | 9,239 | 17,729 | 3,024 | 1996/2019 | 10/3/2018 |
| Atlantic Plaza | North Reading, MA | — | 12,341 | 12,699 | 2,276 | | 12,667 | 14,649 | 27,316 | 4,674 | 1959/2014 | 11/9/2018 |
| Staunton Plaza | Staunton, VA | — | 4,818 | 14,380 | 102 | | 4,883 | 14,417 | 19,300 | 3,245 | 2006 | 11/16/2018 |
| Bethany Village | Alpharetta, GA | — | 6,138 | 8,355 | 837 | | 6,246 | 9,084 | 15,330 | 2,430 | 2001 | 11/16/2018 |
| Northpark Village | Lubbock, TX | — | 3,087 | 6,047 | 388 | | 3,242 | 6,280 | 9,522 | 1,540 | 1990 | 11/16/2018 |
| Kings Crossing | Sun City Center, FL | 10,467 | 5,654 | 11,225 | 571 | | 5,887 | 11,563 | 17,450 | 2,889 | 2000/2018 | 11/16/2018 |
| Lake Washington Crossing | Melbourne, FL | — | 4,222 | 13,553 | 3,192 | | 4,369 | 16,598 | 20,967 | 3,499 | 1987/2023 | 11/16/2018 |
| Kipling Marketplace | Littleton, CO | — | 4,020 | 10,405 | 622 | | 4,201 | 10,846 | 15,047 | 3,155 | 1983/2009 | 11/16/2018 |
| | | | | | | | | | | |
| PHILLIPS EDISON & COMPANY DECEMBER 31, 2023 FORM 10-K | | | F-37 |
| | | | | | | | | | | | | | | | | | | | | | | | | | | | | | | | | | | | | | |
| SCHEDULE III—REAL ESTATE ASSETS AND ACCUMULATED DEPRECIATION |
| December 31, 2023 |
| (in thousands) |
| | | Initial Cost | Costs Capitalized Subsequent to Acquisition(2) | | Gross Amount Carried at End of Period(3) | | | |
| Property Name | City, State | Encumbrances(1) | Land and Improvements | Buildings and Improvements | | Land and Improvements | Buildings and Improvements | Total | Accumulated Depreciation | Date Constructed/ Renovated | Date Acquired |
| MetroWest Village | Orlando, FL | — | 6,841 | 15,333 | 1,539 | | 7,164 | 16,549 | 23,713 | 4,087 | 1990 | 11/16/2018 |
| Spring Cypress Village | Houston, TX | — | 9,579 | 14,567 | 1,939 | | 9,792 | 16,293 | 26,085 | 3,972 | 1982/2012 | 11/16/2018 |
| Commonwealth Square | Folsom, CA | — | 9,955 | 12,586 | 1,432 | | 10,129 | 13,844 | 23,973 | 4,862 | 1987 | 11/16/2018 |
| Point Loomis | Milwaukee, WI | — | 4,171 | 4,901 | 2,183 | | 4,171 | 7,084 | 11,255 | 2,812 | 1965/2022 | 11/16/2018 |
| Shasta Crossroads | Redding, CA | — | 9,598 | 18,643 | (2,455) | | 8,462 | 17,324 | 25,786 | 3,498 | 1989/2016 | 11/16/2018 |
| Milan Plaza | Milan, MI | — | 925 | 1,974 | 329 | | 1,064 | 2,164 | 3,228 | 1,396 | 1960/2018 | 11/16/2018 |
| Hilander Village | Roscoe, IL | — | 2,571 | 7,461 | 2,329 | | 2,667 | 9,694 | 12,361 | 3,284 | 1994/2022 | 11/16/2018 |
| Laguna 99 Plaza | Elk Grove, CA | — | 5,422 | 16,952 | 247 | | 5,444 | 17,177 | 22,621 | 4,000 | 1992/2015 | 11/16/2018 |
| Southfield Center | St. Louis, MO | — | 5,612 | 13,643 | 1,929 | | 6,535 | 14,649 | 21,184 | 4,074 | 1987/2021 | 11/16/2018 |
| Waterford Park Plaza | Plymouth, MN | — | 4,935 | 19,543 | 417 | | 5,149 | 19,746 | 24,895 | 5,032 | 1989/2023 | 11/16/2018 |
| Colonial Promenade | Winter Haven, FL | — | 12,403 | 22,097 | 893 | | 12,464 | 22,929 | 35,393 | 6,858 | 1986/2008 | 11/16/2018 |
| Willimantic Plaza | Willimantic, CT | — | 3,596 | 8,859 | 388 | | 3,792 | 9,051 | 12,843 | 3,432 | 1968/2024 | 11/16/2018 |
| Quivira Crossings | Overland Park, KS | — | 7,512 | 10,729 | 1,684 | | 8,251 | 11,674 | 19,925 | 3,870 | 1996/2015 | 11/16/2018 |
| Spivey Junction | Stockbridge, GA | — | 4,083 | 10,414 | 238 | | 4,204 | 10,531 | 14,735 | 2,768 | 1998 | 11/16/2018 |
| Plaza Farmington | Farmington, NM | — | 6,322 | 9,619 | 485 | | 6,711 | 9,715 | 16,426 | 2,874 | 2004 | 11/16/2018 |
| Harvest Plaza | Akron, OH | — | 2,693 | 6,083 | 282 | | 2,865 | 6,193 | 9,058 | 1,803 | 1974/2015 | 11/16/2018 |
| Oakhurst Plaza | Seminole, FL | — | 2,782 | 4,506 | 540 | | 2,974 | 4,854 | 7,828 | 1,569 | 1974/2001 | 11/16/2018 |
| Old Alabama Square | Johns Creek, GA | — | 10,782 | 17,359 | 1,446 | | 10,885 | 18,702 | 29,587 | 4,503 | 2000 | 11/16/2018 |
| North Point Landing | Modesto, CA | 20,061 | 8,040 | 28,422 | 1,186 | | 8,230 | 29,418 | 37,648 | 6,453 | 1964/2008 | 11/16/2018 |
| Glenwood Crossing | Cincinnati, OH | — | 4,581 | 3,922 | 178 | | 4,607 | 4,074 | 8,681 | 1,803 | 1999/2015 | 11/16/2018 |
| Rosewick Crossing | La Plata, MD | — | 8,252 | 23,507 | 1,006 | | 8,360 | 24,405 | 32,765 | 5,742 | 2008 | 11/16/2018 |
| Vineyard Center | Templeton, CA | 4,943 | 1,753 | 6,406 | 202 | | 1,796 | 6,565 | 8,361 | 1,473 | 2007 | 11/16/2018 |
| Ocean Breeze Plaza | Ocean Breeze, FL | — | 6,416 | 9,986 | 951 | | 6,513 | 10,840 | 17,353 | 2,941 | 1993/2010 | 11/16/2018 |
| Central Valley Marketplace | Ceres, CA | 15,526 | 6,163 | 17,535 | 83 | | 6,180 | 17,601 | 23,781 | 4,019 | 2005 | 11/16/2018 |
| 51st & Olive Square | Glendale, AZ | — | 2,236 | 9,038 | 480 | | 2,593 | 9,161 | 11,754 | 2,448 | 1975/2007 | 11/16/2018 |
| West Acres Shopping Center | Fresno, CA | — | 4,866 | 5,627 | 635 | | 5,091 | 6,037 | 11,128 | 2,556 | 1990/2015 | 11/16/2018 |
| Meadows on the Parkway | Boulder, CO | — | 23,953 | 32,744 | 1,800 | | 24,340 | 34,157 | 58,497 | 7,840 | 1989 | 11/16/2018 |
| Wyandotte Plaza | Kansas City, KS | — | 5,204 | 17,566 | 774 | | 5,343 | 18,201 | 23,544 | 4,394 | 1961/2015 | 11/16/2018 |
| Broadlands Marketplace | Broomfield, CO | — | 7,434 | 9,459 | 1,125 | | 8,002 | 10,016 | 18,018 | 2,921 | 2002 | 11/16/2018 |
| Village Center | Racine, WI | — | 6,051 | 26,473 | 1,211 | | 6,253 | 27,482 | 33,735 | 7,205 | 2002/2021 | 11/16/2018 |
| Shoregate Town Center | Willowick, OH | — | 7,152 | 16,282 | 6,979 | | 7,386 | 23,027 | 30,413 | 7,508 | 1958/2022 | 11/16/2018 |
| Plano Market Street | Plano, TX | — | 14,837 | 33,178 | 1,973 | | 15,166 | 34,822 | 49,988 | 7,640 | 2009 | 11/16/2018 |
| Island Walk Shopping Center | Fernandina Beach, FL | — | 8,190 | 19,992 | 1,301 | | 8,297 | 21,186 | 29,483 | 5,758 | 1987/2012 | 11/16/2018 |
| Normandale Village | Bloomington, MN | 10,777 | 8,390 | 11,407 | 2,113 | | 8,977 | 12,933 | 21,910 | 4,996 | 1973/2017 | 11/16/2018 |
| | | | | | | | | | | |
| PHILLIPS EDISON & COMPANY DECEMBER 31, 2023 FORM 10-K | | | F-38 |
| | | | | | | | | | | | | | | | | | | | | | | | | | | | | | | | | | | | | | |
| SCHEDULE III—REAL ESTATE ASSETS AND ACCUMULATED DEPRECIATION |
| December 31, 2023 |
| (in thousands) |
| | | Initial Cost | Costs Capitalized Subsequent to Acquisition(2) | | Gross Amount Carried at End of Period(3) | | | |
| Property Name | City, State | Encumbrances(1) | Land and Improvements | Buildings and Improvements | | Land and Improvements | Buildings and Improvements | Total | Accumulated Depreciation | Date Constructed/ Renovated | Date Acquired |
| North Pointe Plaza | North Charleston, SC | — | 10,232 | 26,348 | 1,393 | | 10,817 | 27,156 | 37,973 | 8,129 | 1989/2022 | 11/16/2018 |
| Palmer Town Center | Easton, PA | — | 7,331 | 23,525 | 1,768 | | 7,390 | 25,234 | 32,624 | 6,113 | 2005 | 11/16/2018 |
| Alico Commons | Fort Myers, FL | — | 4,670 | 16,557 | 638 | | 4,965 | 16,900 | 21,865 | 4,008 | 2009/2020 | 11/16/2018 |
| Windover Square | Melbourne, FL | 11,048 | 4,115 | 13,309 | 472 | | 4,225 | 13,671 | 17,896 | 3,207 | 1984/2010 | 11/16/2018 |
| Rockledge Square | Rockledge, FL | — | 3,477 | 4,469 | 4,208 | | 3,761 | 8,393 | 12,154 | 1,651 | 1985/2022 | 11/16/2018 |
| Fairfield Commons | Lakewood, CO | — | 8,802 | 29,946 | 2,085 | | 8,924 | 31,909 | 40,833 | 6,878 | 1985/2014 | 11/16/2018 |
| Cocoa Commons | Cocoa, FL | — | 4,838 | 8,247 | 1,454 | | 4,915 | 9,624 | 14,539 | 3,177 | 1986/2000 | 11/16/2018 |
| Hamilton Mill Village | Dacula, GA | — | 7,059 | 9,734 | 550 | | 7,193 | 10,150 | 17,343 | 2,918 | 1996/2016 | 11/16/2018 |
| Sheffield Crossing | Sheffield Village, OH | — | 8,841 | 10,232 | 360 | | 9,051 | 10,382 | 19,433 | 3,469 | 1989/2013 | 11/16/2018 |
| The Shoppes at Windmill Place | Batavia, IL | — | 8,186 | 16,005 | 885 | | 8,344 | 16,732 | 25,076 | 4,317 | 1991/1997 | 11/16/2018 |
| Stone Gate Plaza | Crowley, TX | — | 5,261 | 7,007 | 1,260 | | 5,423 | 8,105 | 13,528 | 2,231 | 2003 | 11/16/2018 |
| Everybody's Plaza | Cheshire, CT | — | 2,520 | 10,096 | 683 | | 2,568 | 10,731 | 13,299 | 2,377 | 1960/2014 | 11/16/2018 |
| Lakewood City Center | Lakewood, OH | — | 1,593 | 10,308 | 406 | | 1,685 | 10,622 | 12,307 | 2,331 | 1991/2011 | 11/16/2018 |
| Carriagetown Marketplace | Amesbury, MA | — | 7,084 | 15,492 | 1,107 | | 7,171 | 16,512 | 23,683 | 4,499 | 2000 | 11/16/2018 |
| Crossroads of Shakopee | Shakopee, MN | — | 8,869 | 20,320 | 1,212 | | 9,062 | 21,339 | 30,401 | 6,252 | 1998 | 11/16/2018 |
| Broadway Pavilion | Santa Maria, CA | — | 8,512 | 20,427 | 788 | | 8,591 | 21,136 | 29,727 | 5,311 | 1987 | 11/16/2018 |
| Sanibel Beach Place | Fort Myers, FL | — | 3,918 | 7,043 | 2,441 | | 4,434 | 8,968 | 13,402 | 2,195 | 2003/2022 | 11/16/2018 |
| Shoppes at Glen Lakes | Weeki Wachee, FL | — | 4,662 | 7,473 | 618 | | 4,780 | 7,973 | 12,753 | 2,230 | 2008 | 11/16/2018 |
| Bartow Marketplace | Cartersville, GA | 19,305 | 11,944 | 24,610 | 841 | | 12,080 | 25,315 | 37,395 | 8,851 | 1995 | 11/16/2018 |
| Bloomingdale Hills | Riverview, FL | — | 4,384 | 5,179 | 429 | | 4,479 | 5,513 | 9,992 | 2,212 | 2002/2012 | 11/16/2018 |
| University Plaza | Amherst, NY | — | 6,402 | 9,800 | 1,056 | | 6,452 | 10,806 | 17,258 | 4,128 | 1980/2020 | 11/16/2018 |
| McKinney Market Street | McKinney, TX | 244 | 10,941 | 16,061 | 1,714 | | 11,085 | 17,631 | 28,716 | 5,044 | 2003/2017 | 11/16/2018 |
| Montville Commons | Montville, CT | — | 12,417 | 11,091 | 609 | | 12,549 | 11,568 | 24,117 | 4,183 | 2007 | 11/16/2018 |
| Shaw's Plaza Raynham | Raynham, MA | — | 8,378 | 26,829 | 1,103 | | 8,428 | 27,882 | 36,310 | 7,391 | 1965/2022 | 11/16/2018 |
| Suntree Square | Southlake, TX | — | 6,335 | 15,642 | 671 | | 6,424 | 16,224 | 22,648 | 3,667 | 2000 | 11/16/2018 |
| Green Valley Plaza | Henderson, NV | — | 7,284 | 16,879 | 605 | | 7,358 | 17,410 | 24,768 | 4,292 | 1978/1982 | 11/16/2018 |
| Crosscreek Village | St. Cloud, FL | — | 3,821 | 9,604 | 598 | | 3,984 | 10,039 | 14,023 | 2,731 | 2008 | 11/16/2018 |
| Market Walk | Savannah, GA | — | 20,678 | 31,836 | 3,827 | | 20,919 | 35,422 | 56,341 | 8,675 | 2014/2022 | 11/16/2018 |
| Livonia Plaza | Livonia, MI | — | 4,118 | 17,037 | 870 | | 4,288 | 17,737 | 22,025 | 4,570 | 1988/2014 | 11/16/2018 |
| Franklin Centre | Franklin, WI | — | 6,353 | 5,482 | 615 | | 6,480 | 5,970 | 12,450 | 3,517 | 1994/2018 | 11/16/2018 |
| Plaza 23 | Pompton Plains, NJ | — | 11,412 | 40,145 | 5,648 | | 11,907 | 45,298 | 57,205 | 9,386 | 1963/2021 | 11/16/2018 |
| Shorewood Crossing | Shorewood, IL | — | 9,468 | 20,993 | 2,882 | | 9,651 | 23,692 | 33,343 | 6,388 | 2001/2020 | 11/16/2018 |
| Herndon Place | Fresno, CA | — | 7,148 | 10,071 | (611) | | 6,881 | 9,727 | 16,608 | 2,729 | 2005 | 11/16/2018 |
| Windmill Marketplace | Clovis, CA | — | 2,775 | 7,299 | (170) | | 2,827 | 7,077 | 9,904 | 1,345 | 2001 | 11/16/2018 |
| Riverlakes Village | Bakersfield, CA | — | 8,567 | 15,242 | 2,897 | | 8,950 | 17,756 | 26,706 | 3,964 | 1997/2022 | 11/16/2018 |
| | | | | | | | | | | |
| PHILLIPS EDISON & COMPANY DECEMBER 31, 2023 FORM 10-K | | | F-39 |
| | | | | | | | | | | | | | | | | | | | | | | | | | | | | | | | | | | | | | |
| SCHEDULE III—REAL ESTATE ASSETS AND ACCUMULATED DEPRECIATION |
| December 31, 2023 |
| (in thousands) |
| | | Initial Cost | Costs Capitalized Subsequent to Acquisition(2) | | Gross Amount Carried at End of Period(3) | | | |
| Property Name | City, State | Encumbrances(1) | Land and Improvements | Buildings and Improvements | | Land and Improvements | Buildings and Improvements | Total | Accumulated Depreciation | Date Constructed/ Renovated | Date Acquired |
| Evans Towne Centre | Evans, GA | — | 4,018 | 7,013 | 389 | | 4,145 | 7,275 | 11,420 | 2,134 | 1995/2017 | 11/16/2018 |
| Mansfield Market Center | Mansfield, TX | — | 4,672 | 13,154 | 498 | | 4,851 | 13,473 | 18,324 | 3,074 | 2015 | 11/16/2018 |
| Ormond Beach Mall | Ormond Beach, FL | — | 4,954 | 7,006 | 1,054 | | 5,088 | 7,926 | 13,014 | 2,555 | 1967/2018 | 11/16/2018 |
| Heritage Plaza | Carol Stream, IL | — | 6,205 | 16,507 | 939 | | 6,320 | 17,331 | 23,651 | 4,320 | 1988/2018 | 11/16/2018 |
| Mountain Crossing | Dacula, GA | 2,794 | 6,602 | 6,835 | 37 | | 6,303 | 7,171 | 13,474 | 2,081 | 1997 | 11/16/2018 |
| Seville Commons | Arlington, TX | — | 4,689 | 12,602 | 1,025 | | 4,859 | 13,457 | 18,316 | 3,327 | 1987/2022 | 11/16/2018 |
| Cinco Ranch at Market Center | Katy, TX | — | 5,553 | 14,063 | 645 | | 5,711 | 14,550 | 20,261 | 3,299 | 2007/2023 | 12/12/2018 |
| Naperville Crossings | Naperville, IL | 25,380 | 15,765 | 30,881 | 4,474 | | 16,612 | 34,508 | 51,120 | 8,545 | 2007/2021 | 4/26/2019 |
| Orange Grove Shopping Center | North Fort Myers, FL | — | 2,637 | 7,340 | 571 | | 3,124 | 7,424 | 10,548 | 1,798 | 1999 | 10/31/2019 |
| Sudbury Crossing | Sudbury, MA | — | 6,483 | 12,933 | 5,931 | | 6,516 | 18,831 | 25,347 | 2,752 | 1984/2021 | 10/31/2019 |
| Ashburn Farm Market Center | Ashburn, VA | — | 14,035 | 16,648 | 555 | | 14,090 | 17,148 | 31,238 | 3,394 | 2000 | 10/31/2019 |
| Alameda Crossing | Avondale, AZ | — | 7,785 | 19,875 | 4,903 | | 8,074 | 24,489 | 32,563 | 6,155 | 2005/2021 | 11/16/2019 |
| Del Paso Marketplace | Sacramento, CA | — | 5,722 | 12,242 | 1,345 | | 6,102 | 13,207 | 19,309 | 2,562 | 2006/2016 | 12/12/2019 |
| Hickory Flat Commons | Canton, GA | — | 6,976 | 11,786 | 1,030 | | 7,389 | 12,403 | 19,792 | 2,677 | 2008/2020 | 8/17/2020 |
| Roxborough Marketplace | Littleton, CO | — | 4,105 | 12,668 | 2,193 | | 4,753 | 14,213 | 18,966 | 2,270 | 2005/2021 | 10/5/2020 |
| Cinco Ranch Station II | Katy, TX | — | 1,045 | — | 2,742 | | 1,051 | 2,736 | 3,787 | 109 | 2023 | 1/26/2021 |
| West Village Center | Chanhassen, MN | — | 10,860 | 11,281 | 1,552 | | 11,268 | 12,425 | 23,693 | 2,071 | 1994/2021 | 2/4/2021 |
| Hickory Creek Plaza | Denton, TX | — | 5,370 | 2,710 | 324 | | 5,542 | 2,862 | 8,404 | 561 | 2007 | 2/25/2021 |
| Foxridge Plaza | Centennial, CO | — | 3,740 | 11,636 | 1,664 | | 4,465 | 12,575 | 17,040 | 1,381 | 1983/2022 | 8/20/2021 |
| Valrico Commons | Valrico, FL | — | 7,522 | 26,480 | 896 | | 8,113 | 26,785 | 34,898 | 2,560 | 1986/2021 | 8/25/2021 |
| Market Place at Pabst Farms | Oconomowoc, WI | — | 6,204 | 17,199 | 421 | | 6,519 | 17,305 | 23,824 | 1,972 | 2005/2020 | 10/13/2021 |
| Arapahoe Marketplace | Greenwood Village, CO | — | 13,779 | 49,330 | 1,756 | | 14,870 | 49,995 | 64,865 | 4,428 | 1977/2022 | 10/19/2021 |
| Loganville Town Center | Loganville, GA | — | 5,309 | 7,920 | 2,170 | | 5,447 | 9,952 | 15,399 | 2,447 | 1997/2023 | 11/5/2021 |
| Town & Country Village | Sacramento, CA | — | 21,894 | 35,793 | 2,106 | | 22,199 | 37,594 | 59,793 | 3,468 | 1950/2022 | 11/12/2021 |
| Sprouts Plaza | Las Vegas, NV | — | 5,104 | 22,622 | 1,396 | | 5,472 | 23,650 | 29,122 | 1,951 | 1995/2022 | 12/3/2021 |
| Rainbow Plaza | Las Vegas, NV | — | 7,158 | 30,171 | 1,209 | | 7,897 | 30,641 | 38,538 | 2,574 | 1989/2022 | 12/3/2021 |
| Cascades Overlook | Sterling, VA | — | 16,241 | 41,449 | 1,930 | | 16,442 | 43,178 | 59,620 | 2,838 | 2016 | 1/14/2022 |
| Oak Meadows Marketplace | Georgetown, TX | — | 4,847 | 15,848 | 440 | | 5,047 | 16,088 | 21,135 | 1,038 | 2018 | 2/1/2022 |
| Shoppes at Avalon | Spring Hill, FL | — | 9,184 | 7,740 | 1,061 | | 9,805 | 8,180 | 17,985 | 810 | 2009/2022 | 2/14/2022 |
| Centennial Lakes Plaza | Edina, MN | — | 13,582 | 51,052 | 1,860 | | 13,943 | 52,551 | 66,494 | 2,934 | 1989/2022 | 5/13/2022 |
| Crossroads Towne Center | North Las Vegas, NV | — | 25,226 | 27,638 | 723 | | 25,665 | 27,922 | 53,587 | 3,130 | 2007/2021 | 8/15/2022 |
| Chinoe Center | Lexington, KY | — | 3,841 | 14,001 | 957 | | 4,111 | 14,688 | 18,799 | 1,026 | 1984/2023 | 11/21/2022 |
| | | | | | | | | | | |
| PHILLIPS EDISON & COMPANY DECEMBER 31, 2023 FORM 10-K | | | F-40 |
| | | | | | | | | | | | | | | | | | | | | | | | | | | | | | | | | | | | | | |
| SCHEDULE III—REAL ESTATE ASSETS AND ACCUMULATED DEPRECIATION |
| December 31, 2023 |
| (in thousands) |
| | | Initial Cost | Costs Capitalized Subsequent to Acquisition(2) | | Gross Amount Carried at End of Period(3) | | | |
| Property Name | City, State | Encumbrances(1) | Land and Improvements | Buildings and Improvements | | Land and Improvements | Buildings and Improvements | Total | Accumulated Depreciation | Date Constructed/ Renovated | Date Acquired |
| Sunridge Plaza | Rancho Cordova, CA | — | 12,004 | 21,375 | 365 | | 12,261 | 21,483 | 33,744 | 1,080 | 2017 | 12/20/2022 |
| Providence Commons | Mt. Juliet, TN | — | 7,425 | 18,665 | 979 | | 7,652 | 19,417 | 27,069 | 822 | 2009 | 1/19/2023 |
| Village Shoppes at Windermere | Suwanee, GA | 9,754 | 5,747 | 12,698 | 355 | | 5,948 | 12,852 | 18,800 | 497 | 2008 | 3/16/2023 |
| Town Center at Jensen Beach | Jensen Beach, FL | — | 6,042 | 10,731 | 960 | | 6,372 | 11,361 | 17,733 | 636 | 2000 | 3/27/2023 |
| Shops at Sunset Lakes | Miramar, FL | — | 5,872 | 7,775 | 284 | | 6,056 | 7,875 | 13,931 | 467 | 1999 | 3/27/2023 |
| Lake Pointe Market | Rowlett, TX | — | 3,490 | 9,410 | 424 | | 3,764 | 9,560 | 13,324 | 180 | 2002 | 8/16/2023 |
| Contra Loma Station OP L.P. | Antioch, CA | — | 224 | — | 63 | | 224 | 63 | 287 | 21 | - | 8/29/2023 |
| Mansell Village | Roswell, GA | — | 4,470 | 11,624 | — | | 4,470 | 11,624 | 16,094 | 138 | 2003/2013 | 10/30/2023 |
| Riverpark Shopping Center | Sugar Land, TX | — | 24,270 | 49,449 | 5 | | 24,270 | 49,454 | 73,724 | 442 | 2003 | 11/13/2023 |
| Apache Shoppes | Rochester, MN | — | 1,807 | 3,709 | — | | 1,807 | 3,709 | 5,516 | 37 | 2005 | 12/4/2023 |
| Maple View | Grayslake, IL | — | 5,256 | 9,767 | — | | 5,256 | 9,767 | 15,023 | 55 | 1999 | 12/4/2023 |
| Maple View | Grayslake, IL | — | 1,621 | 3,307 | — | | 1,621 | 3,307 | 4,928 | 14 | 1999 | 12/4/2023 |
| Quail Pointe | Fair Oaks, CA | — | 7,492 | 33,594 | — | | 7,492 | 33,594 | 41,086 | 103 | 1987 | 12/5/2023 |
| Glenbrook Marketplace | Glenview, IL | — | 3,152 | 8,807 | — | | 3,152 | 8,807 | 11,959 | 34 | 1992/2014 | 12/11/2023 |
Northlake Station LLC(5) | Cincinnati, OH | — | 2,327 | 11,806 | 1,663 | | 2,763 | 13,033 | 15,796 | 3,264 | 1985 | 10/6/2006 |
Corporate Adjustments(6) | | — | 6 | 2,734 | (5,301) | | (3,580) | 1,019 | (2,561) | 1,143 | | |
| Totals | | $490,677 | $1,685,276 | $3,458,965 | $442,430 | | $1,768,487 | $3,818,184 | $5,586,671 | $1,186,630 | | |
(1)Encumbrances do not expect this bankruptcyinclude our finance leases.
(2)Reductions to have a material impact on our consolidated financial statements.
|
| | | | | | | | | | | | | | | | | | | | | | | | | | | | | | | | | |
| SCHEDULE III—REAL ESTATE ASSETS AND ACCUMULATED DEPRECIATION |
| As of December 31, 2017 |
| (in thousands) |
| | | |
| | Initial Cost(1) | | Cost Capitalized Subsequent to Acquisition | | Gross Amount Carried at End of Period(2)(3) | | | | | | |
| Property Name | City, State | Encumbrances | | Land and Improvements | Buildings and Improvements | | | Land and Improvements | Buildings and Improvements | Total | | Accumulated Depreciation | | Date Constructed/ Renovated | | Date Acquired |
| Lakeside Plaza | Salem, VA | $ | — |
| | $ | 3,344 |
| $ | 5,247 |
| | $ | 254 |
| | $ | 3,398 |
| $ | 5,447 |
| $ | 8,845 |
| | $ | 2,079 |
| | 1988 | | 12/10/2010 |
| Snow View Plaza | Parma, OH | — |
| | 4,104 |
| 6,432 |
| | 467 |
| | 4,293 |
| 6,710 |
| 11,003 |
| | 2,923 |
| | 1981/2008 | | 12/15/2010 |
| St. Charles Plaza | Haines City, FL | — |
| | 4,090 |
| 4,399 |
| | 212 |
| | 4,105 |
| 4,596 |
| 8,701 |
| | 2,093 |
| | 2007 | | 6/10/2011 |
| Centerpoint | Easley, SC | — |
| | 2,404 |
| 4,361 |
| | 960 |
| | 2,749 |
| 4,976 |
| 7,725 |
| | 1,680 |
| | 2002 | | 10/14/2011 |
| Southampton Village | Tyrone, GA | — |
| | 2,670 |
| 5,176 |
| | 901 |
| | 2,826 |
| 5,921 |
| 8,747 |
| | 1,917 |
| | 2003 | | 10/14/2011 |
| Burwood Village Center | Glen Burnie, MD | — |
| | 5,447 |
| 10,167 |
| | 356 |
| | 5,584 |
| 10,386 |
| 15,970 |
| | 3,623 |
| | 1971 | | 11/9/2011 |
| Cureton Town Center | Waxhaw, NC | — |
| | 5,896 |
| 6,197 |
| | 974 |
| | 5,655 |
| 7,412 |
| 13,067 |
| | 2,729 |
| | 2006 | | 12/29/2011 |
| Tramway Crossing | Sanford, NC | — |
| | 2,016 |
| 3,070 |
| | 639 |
| | 2,314 |
| 3,411 |
| 5,725 |
| | 1,373 |
| | 1996/2000 | | 2/23/2012 |
| Westin Centre | Fayetteville, NC | — |
| | 2,190 |
| 3,499 |
| | 555 |
| | 2,438 |
| 3,806 |
| 6,244 |
| | 1,463 |
| | 1996/1999 | | 2/23/2012 |
| The Village at Glynn Place | Brunswick, GA | — |
| | 5,202 |
| 6,095 |
| | 388 |
| | 5,268 |
| 6,417 |
| 11,685 |
| | 2,994 |
| | 1996 | | 4/27/2012 |
| Meadowthorpe Shopping Center | Lexington, KY | — |
| | 4,093 |
| 4,185 |
| | 492 |
| | 4,380 |
| 4,390 |
| 8,770 |
| | 1,692 |
| | 1989/2008 | | 5/9/2012 |
| New Windsor Marketplace | Windsor, CO | — |
| | 3,867 |
| 1,329 |
| | 443 |
| | 4,038 |
| 1,601 |
| 5,639 |
| | 837 |
| | 2003 | | 5/9/2012 |
| Vine Street Square | Kissimmee, FL | — |
| | 7,049 |
| 5,618 |
| | 368 |
| | 7,076 |
| 5,959 |
| 13,035 |
| | 2,355 |
| | 1996/2011 | | 6/4/2012 |
| Northtowne Square | Gibsonia, PA | — |
| | 2,844 |
| 7,210 |
| | 598 |
| | 3,330 |
| 7,322 |
| 10,652 |
| | 3,047 |
| | 1993 | | 6/19/2012 |
| Brentwood Commons | Bensenville, IL | — |
| | 6,106 |
| 8,025 |
| | 886 |
| | 6,145 |
| 8,872 |
| 15,017 |
| | 2,693 |
| | 1981/2001 | | 7/5/2012 |
| Sidney Towne Center | Sidney, OH | — |
| | 1,430 |
| 3,802 |
| | 1,193 |
| | 1,953 |
| 4,472 |
| 6,425 |
| | 1,752 |
| | 1981/2007 | | 8/2/2012 |
| Broadway Plaza | Tucson, AZ | 6,198 |
| | 4,979 |
| 7,169 |
| | 1,008 |
| | 5,433 |
| 7,723 |
| 13,156 |
| | 2,660 |
| | 1982-1995 | | 8/13/2012 |
| Richmond Plaza | Augusta, GA | — |
| | 7,157 |
| 11,244 |
| | 1,357 |
| | 7,433 |
| 12,325 |
| 19,758 |
| | 4,010 |
| | 1980/2009 | | 8/30/2012 |
| Publix at Northridge | Sarasota, FL | — |
| | 5,671 |
| 5,632 |
| | 350 |
| | 5,753 |
| 5,900 |
| 11,653 |
| | 1,845 |
| | 2003 | | 8/30/2012 |
| Baker Hill Center | Glen Ellyn, IL | — |
| | 7,068 |
| 13,737 |
| | 1,240 |
| | 7,229 |
| 14,816 |
| 22,045 |
| | 3,957 |
| | 1998 | | 9/6/2012 |
| New Prague Commons | New Prague, MN | — |
| | 3,248 |
| 6,605 |
| | 146 |
| | 3,360 |
| 6,639 |
| 9,999 |
| | 1,858 |
| | 2008 | | 10/12/2012 |
| Brook Park Plaza | Brook Park, OH | 947 |
| | 2,545 |
| 7,594 |
| | 548 |
| | 2,737 |
| 7,950 |
| 10,687 |
| | 2,389 |
| | 2001 | | 10/23/2012 |
| Heron Creek Towne Center | North Port, FL | — |
| | 4,062 |
| 4,082 |
| | 168 |
| | 4,102 |
| 4,210 |
| 8,312 |
| | 1,388 |
| | 2001 | | 12/17/2012 |
| Quartz Hill Towne Centre | Lancaster, CA | — |
| | 6,352 |
| 13,529 |
| | 301 |
| | 6,482 |
| 13,700 |
| 20,182 |
| | 3,385 |
| | 1991/2012 | | 12/26/2012 |
| Hilfiker Square | Salem, OR | — |
| | 2,455 |
| 4,750 |
| | 50 |
| | 2,498 |
| 4,757 |
| 7,255 |
| | 1,089 |
| | 1984/2011 | | 12/28/2012 |
| Village One Plaza | Modesto, CA | — |
| | 5,166 |
| 18,752 |
| | 486 |
| | 5,223 |
| 19,181 |
| 24,404 |
| | 3,896 |
| | 2007 | | 12/28/2012 |
| Butler Creek | Acworth, GA | — |
| | 3,925 |
| 6,129 |
| | 929 |
| | 4,251 |
| 6,732 |
| 10,983 |
| | 1,889 |
| | 1989 | | 1/15/2013 |
| Fairview Oaks | Ellenwood, GA | — |
| | 3,563 |
| 5,266 |
| | 274 |
| | 3,714 |
| 5,389 |
| 9,103 |
| | 1,503 |
| | 1996 | | 1/15/2013 |
| Grassland Crossing | Alpharetta, GA | — |
| | 3,680 |
| 5,791 |
| | 687 |
| | 3,790 |
| 6,368 |
| 10,158 |
| | 1,794 |
| | 1996 | | 1/15/2013 |
| Hamilton Ridge | Buford, GA | — |
| | 4,054 |
| 7,168 |
| | 534 |
| | 4,163 |
| 7,593 |
| 11,756 |
| | 2,047 |
| | 2002 | | 1/15/2013 |
| Mableton Crossing | Mableton, GA | — |
| | 4,426 |
| 6,413 |
| | 932 |
| | 4,591 |
| 7,180 |
| 11,771 |
| | 1,927 |
| | 1997 | | 1/15/2013 |
| The Shops at Westridge | McDonough, GA | — |
| | 2,788 |
| 3,901 |
| | 461 |
| | 2,807 |
| 4,343 |
| 7,150 |
| | 1,239 |
| | 2006 | | 1/15/2013 |
| Fairlawn Town Centre | Fairlawn, OH | — |
| | 10,397 |
| 29,005 |
| | 2,042 |
| | 10,928 |
| 30,516 |
| 41,444 |
| | 8,232 |
| | 1962/1996 | | 1/30/2013 |
| Macland Pointe | Marietta, GA | — |
| | 3,450 |
| 5,364 |
| | 825 |
| | 3,720 |
| 5,919 |
| 9,639 |
| | 1,712 |
| | 1992 | | 2/13/2013 |
| Murray Landing | Irmo, SC | — |
| | 2,927 |
| 6,856 |
| | 1,339 |
| | 3,160 |
| 7,962 |
| 11,122 |
| | 1,730 |
| | 2003 | | 3/21/2013 |
|
| | | | | | | | | | | | | | | | | | | | | | | | | | | | | | | | | |
| SCHEDULE III—REAL ESTATE ASSETS AND ACCUMULATED DEPRECIATION |
| As of December 31, 2017 |
| (in thousands) |
| | | |
| | Initial Cost(1) | | Cost Capitalized Subsequent to Acquisition | | Gross Amount Carried at End of Period(2)(3) | | | | | | |
| Property Name | City, State | Encumbrances | | Land and Improvements | Buildings and Improvements | | | Land and Improvements | Buildings and Improvements | Total | | Accumulated Depreciation | | Date Constructed/ Renovated | | Date Acquired |
| Vineyard Center | Tallahassee, FL | — |
| | 2,761 |
| 4,221 |
| | 276 |
| | 2,817 |
| 4,441 |
| 7,258 |
| | 1,126 |
| | 2002 | | 3/21/2013 |
| Kleinwood Center | Spring, TX | — |
| | 11,477 |
| 18,954 |
| | 848 |
| | 11,593 |
| 19,686 |
| 31,279 |
| | 4,763 |
| | 2003 | | 3/21/2013 |
| Lutz Lake Crossing | Lutz, FL | — |
| | 2,636 |
| 6,601 |
| | 314 |
| | 2,719 |
| 6,832 |
| 9,551 |
| | 1,483 |
| | 2002 | | 4/4/2013 |
| Publix at Seven Hills | Spring Hill, FL | — |
| | 2,171 |
| 5,642 |
| | 560 |
| | 2,407 |
| 5,966 |
| 8,373 |
| | 1,360 |
| | 1991/2006 | | 4/4/2013 |
| Hartville Centre | Hartville, OH | — |
| | 2,069 |
| 3,692 |
| | 1,335 |
| | 2,383 |
| 4,713 |
| 7,096 |
| | 1,167 |
| | 1988/2008 | | 4/23/2013 |
| Sunset Center | Corvallis, OR | — |
| | 7,933 |
| 14,939 |
| | 647 |
| | 7,998 |
| 15,521 |
| 23,519 |
| | 3,357 |
| | 1998/2000 | | 5/31/2013 |
| Savage Town Square | Savage, MN | — |
| | 4,106 |
| 9,409 |
| | 227 |
| | 4,230 |
| 9,512 |
| 13,742 |
| | 2,144 |
| | 2003 | | 6/19/2013 |
| Northcross | Austin, TX | — |
| | 30,725 |
| 25,627 |
| | 900 |
| | 30,913 |
| 26,339 |
| 57,252 |
| | 5,691 |
| | 1975/2006/2010 | | 6/24/2013 |
| Glenwood Crossing | Kenosha, WI | — |
| | 1,872 |
| 9,914 |
| | 419 |
| | 1,938 |
| 10,267 |
| 12,205 |
| | 1,906 |
| | 1992 | | 6/27/2013 |
| Pavilions at San Mateo | Albuquerque, NM | — |
| | 6,471 |
| 18,725 |
| | 754 |
| | 6,649 |
| 19,301 |
| 25,950 |
| | 3,886 |
| | 1997 | | 6/27/2013 |
| Shiloh Square | Kennesaw, GA | — |
| | 4,685 |
| 8,728 |
| | 1,094 |
| | 4,804 |
| 9,703 |
| 14,507 |
| | 2,025 |
| | 1996/2003 | | 6/27/2013 |
| Boronda Plaza | Salinas, CA | — |
| | 9,027 |
| 11,870 |
| | 424 |
| | 9,128 |
| 12,193 |
| 21,321 |
| | 2,430 |
| | 2003/2006 | | 7/3/2013 |
| Westwoods Shopping Center | Arvada, CO | — |
| | 3,706 |
| 11,115 |
| | 379 |
| | 3,946 |
| 11,254 |
| 15,200 |
| | 2,287 |
| | 2003 | | 8/8/2013 |
| Paradise Crossing | Lithia Springs, GA | — |
| | 2,204 |
| 6,064 |
| | 574 |
| | 2,360 |
| 6,482 |
| 8,842 |
| | 1,341 |
| | 2000 | | 8/13/2013 |
| Contra Loma Plaza | Antioch, CA | — |
| | 2,846 |
| 3,926 |
| | 1,483 |
| | 3,430 |
| 4,825 |
| 8,255 |
| | 881 |
| | 1989 | | 8/19/2013 |
| South Oaks Plaza | St. Louis, MO | — |
| | 1,938 |
| 6,634 |
| | 363 |
| | 2,020 |
| 6,915 |
| 8,935 |
| | 1,338 |
| | 1969/1987 | | 8/21/2013 |
| Yorktown Centre | Erie, PA | — |
| | 3,736 |
| 15,395 |
| | 1,136 |
| | 3,988 |
| 16,279 |
| 20,267 |
| | 3,788 |
| | 1989/2013 | | 8/30/2013 |
| Stockbridge Commons | Fort Mill, SC | — |
| | 4,818 |
| 9,281 |
| | 427 |
| | 4,910 |
| 9,616 |
| 14,526 |
| | 2,015 |
| | 2003/2012 | | 9/3/2013 |
| Dyer Crossing | Dyer, IN | 9,810 |
| | 6,017 |
| 10,214 |
| | 359 |
| | 6,148 |
| 10,442 |
| 16,590 |
| | 2,178 |
| | 2004/2005 | | 9/4/2013 |
| East Burnside Plaza | Portland, OR | — |
| | 2,484 |
| 5,422 |
| | 83 |
| | 2,554 |
| 5,435 |
| 7,989 |
| | 884 |
| | 1955/1999 | | 9/12/2013 |
| Red Maple Village | Tracy, CA | — |
| | 9,250 |
| 19,466 |
| | 288 |
| | 9,384 |
| 19,620 |
| 29,004 |
| | 3,256 |
| | 2009 | | 9/18/2013 |
| Crystal Beach Plaza | Palm Harbor, FL | — |
| | 2,335 |
| 7,918 |
| | 423 |
| | 2,400 |
| 8,276 |
| 10,676 |
| | 1,553 |
| | 2010 | | 9/25/2013 |
| CitiCentre Plaza | Carroll, IA | — |
| | 770 |
| 2,530 |
| | 251 |
| | 982 |
| 2,569 |
| 3,551 |
| | 605 |
| | 1991/1995 | | 10/2/2013 |
| Duck Creek Plaza | Bettendorf, IA | — |
| | 4,611 |
| 13,007 |
| | 991 |
| | 5,102 |
| 13,507 |
| 18,609 |
| | 2,613 |
| | 2005/2006 | | 10/8/2013 |
| Cahill Plaza | Inver Grove Heights, MN | — |
| | 2,587 |
| 5,113 |
| | 560 |
| | 2,876 |
| 5,384 |
| 8,260 |
| | 1,110 |
| | 1995 | | 10/9/2013 |
| Pioneer Plaza | Springfield, OR | — |
| | 4,948 |
| 5,680 |
| | 456 |
| | 5,117 |
| 5,967 |
| 11,084 |
| | 1,275 |
| | 1989/2008 | | 10/18/2013 |
| Fresh Market | Normal, IL | — |
| | 4,459 |
| 17,773 |
| | 443 |
| | 4,746 |
| 17,929 |
| 22,675 |
| | 2,106 |
| | 2002 | | 10/22/2013 |
| Courthouse Marketplace | Virginia Beach, VA | — |
| | 6,131 |
| 8,061 |
| | 846 |
| | 6,388 |
| 8,650 |
| 15,038 |
| | 1,671 |
| | 2005 | | 10/25/2013 |
| Hastings Marketplace | Hastings, MN | — |
| | 3,980 |
| 10,044 |
| | 273 |
| | 4,118 |
| 10,179 |
| 14,297 |
| | 2,012 |
| | 2002 | | 11/6/2013 |
| Shoppes of Paradise Lakes | Miami, FL | 5,484 |
| | 5,811 |
| 6,019 |
| | 411 |
| | 6,037 |
| 6,204 |
| 12,241 |
| | 1,409 |
| | 1999 | | 11/7/2013 |
| Coquina Plaza | Davie, FL | 6,715 |
| | 9,458 |
| 11,770 |
| | 406 |
| | 9,512 |
| 12,122 |
| 21,634 |
| | 2,262 |
| | 1998 | | 11/7/2013 |
| Butler’s Crossing | Watkinsville, GA | — |
| | 1,338 |
| 6,682 |
| | 783 |
| | 1,395 |
| 7,408 |
| 8,803 |
| | 1,422 |
| | 1997 | | 11/7/2013 |
| Lakewood Plaza | Spring Hill, FL | — |
| | 4,495 |
| 10,028 |
| | 655 |
| | 4,534 |
| 10,644 |
| 15,178 |
| | 2,306 |
| | 1993/1997 | | 11/7/2013 |
|
| | | | | | | | | | | | | | | | | | | | | | | | | | | | | | | | | |
| SCHEDULE III—REAL ESTATE ASSETS AND ACCUMULATED DEPRECIATION |
| As of December 31, 2017 |
| (in thousands) |
| | | |
| | Initial Cost(1) | | Cost Capitalized Subsequent to Acquisition | | Gross Amount Carried at End of Period(2)(3) | | | | | | |
| Property Name | City, State | Encumbrances | | Land and Improvements | Buildings and Improvements | | | Land and Improvements | Buildings and Improvements | Total | | Accumulated Depreciation | | Date Constructed/ Renovated | | Date Acquired |
| Collington Plaza | Bowie, MD | — |
| | 12,207 |
| 15,142 |
| | 540 |
| | 12,379 |
| 15,510 |
| 27,889 |
| | 2,744 |
| | 1996 | | 11/21/2013 |
| Golden Town Center | Golden, CO | — |
| | 7,066 |
| 10,166 |
| | 1,265 |
| | 7,305 |
| 11,192 |
| 18,497 |
| | 2,239 |
| | 1993/2003 | | 11/22/2013 |
| Northstar Marketplace | Ramsey, MN | — |
| | 2,810 |
| 9,204 |
| | 482 |
| | 2,848 |
| 9,648 |
| 12,496 |
| | 1,921 |
| | 2004 | | 11/27/2013 |
| Bear Creek Plaza | Petoskey, MI | — |
| | 5,677 |
| 17,611 |
| | 115 |
| | 5,737 |
| 17,666 |
| 23,403 |
| | 3,398 |
| | 1998/2009 | | 12/19/2013 |
| Flag City Station | Findlay, OH | — |
| | 4,685 |
| 9,630 |
| | 411 |
| | 4,775 |
| 9,951 |
| 14,726 |
| | 2,119 |
| | 1992 | | 12/19/2013 |
| Southern Hills Crossing | Moraine, OH | — |
| | 778 |
| 1,481 |
| | 53 |
| | 801 |
| 1,511 |
| 2,312 |
| | 357 |
| | 2002 | | 12/19/2013 |
| Sulphur Grove | Huber Heights, OH | — |
| | 553 |
| 2,142 |
| | 129 |
| | 605 |
| 2,219 |
| 2,824 |
| | 399 |
| | 2004 | | 12/19/2013 |
| East Side Square | Springfield, OH | — |
| | 394 |
| 963 |
| | 64 |
| | 407 |
| 1,014 |
| 1,421 |
| | 236 |
| | 2007 | | 12/19/2013 |
| Hoke Crossing | Clayton, OH | — |
| | 481 |
| 1,059 |
| | 220 |
| | 509 |
| 1,251 |
| 1,760 |
| | 239 |
| | 2006 | | 12/19/2013 |
| Town & Country Shopping Center | Noblesville, IN | — |
| | 7,360 |
| 16,269 |
| | 266 |
| | 7,371 |
| 16,524 |
| 23,895 |
| | 3,474 |
| | 1998 | | 12/19/2013 |
| Sterling Pointe Center | Lincoln, CA | — |
| | 7,038 |
| 20,822 |
| | 1,101 |
| | 7,255 |
| 21,706 |
| 28,961 |
| | 3,373 |
| | 2004 | | 12/20/2013 |
| Southgate Shopping Center | Des Moines, IA | — |
| | 2,434 |
| 8,357 |
| | 623 |
| | 2,760 |
| 8,654 |
| 11,414 |
| | 1,729 |
| | 1972/2013 | | 12/20/2013 |
| Arcadia Plaza | Phoenix, AZ | — |
| | 5,774 |
| 6,904 |
| | 494 |
| | 5,901 |
| 7,271 |
| 13,172 |
| | 1,400 |
| | 1980 | | 12/30/2013 |
| Stop & Shop Plaza | Enfield, CT | 12,385 |
| | 8,892 |
| 15,028 |
| | 793 |
| | 9,202 |
| 15,511 |
| 24,713 |
| | 2,939 |
| | 1988 | | 12/30/2013 |
| Fairacres Shopping Center | Oshkosh, WI | — |
| | 3,542 |
| 5,190 |
| | 395 |
| | 3,776 |
| 5,351 |
| 9,127 |
| | 1,303 |
| | 1992/2013 | | 1/21/2014 |
| Savoy Plaza | Savoy, IL | — |
| | 4,304 |
| 10,895 |
| | 448 |
| | 4,373 |
| 11,274 |
| 15,647 |
| | 2,264 |
| | 1999/2007 | | 1/31/2014 |
| The Shops of Uptown | Park Ridge, IL | — |
| | 7,744 |
| 16,884 |
| | 537 |
| | 7,857 |
| 17,308 |
| 25,165 |
| | 2,700 |
| | 2006 | | 2/25/2014 |
| Chapel Hill North | Chapel Hill, NC | 7,196 |
| | 4,776 |
| 10,190 |
| | 783 |
| | 5,009 |
| 10,740 |
| 15,749 |
| | 2,034 |
| | 1998 | | 2/28/2014 |
| Winchester Gateway | Winchester, VA | — |
| | 9,342 |
| 23,468 |
| | 1,659 |
| | 9,548 |
| 24,921 |
| 34,469 |
| | 4,037 |
| | 2006 | | 3/5/2014 |
| Stonewall Plaza | Winchester, VA | — |
| | 7,929 |
| 16,642 |
| | 605 |
| | 7,954 |
| 17,222 |
| 25,176 |
| | 2,911 |
| | 2007 | | 3/5/2014 |
| Coppell Market Center | Coppell, TX | 12,359 |
| | 4,869 |
| 12,237 |
| | 89 |
| | 4,917 |
| 12,278 |
| 17,195 |
| | 2,038 |
| | 2008 | | 3/5/2014 |
| Harrison Pointe | Cary, NC | — |
| | 10,006 |
| 11,208 |
| | 422 |
| | 10,155 |
| 11,481 |
| 21,636 |
| | 2,718 |
| | 2002 | | 3/11/2014 |
| Town Fair Center | Louisville, KY | — |
| | 8,108 |
| 14,411 |
| | 2,712 |
| | 8,339 |
| 16,892 |
| 25,231 |
| | 3,162 |
| | 1988/1994 | | 3/12/2014 |
| Villages at Eagles Landing | Stockbridge, GA | 2,096 |
| | 2,824 |
| 5,515 |
| | 538 |
| | 2,940 |
| 5,937 |
| 8,877 |
| | 1,311 |
| | 1995 | | 3/13/2014 |
| Towne Centre at Wesley Chapel | Wesley Chapel, FL | — |
| | 2,465 |
| 5,554 |
| | 201 |
| | 2,574 |
| 5,646 |
| 8,220 |
| | 1,063 |
| | 2000 | | 3/14/2014 |
| Dean Taylor Crossing | Suwanee, GA | — |
| | 3,903 |
| 8,192 |
| | 181 |
| | 3,995 |
| 8,281 |
| 12,276 |
| | 1,707 |
| | 2000 | | 3/14/2014 |
| Champions Gate Village | Davenport, FL | — |
| | 1,813 |
| 6,060 |
| | 211 |
| | 1,880 |
| 6,204 |
| 8,084 |
| | 1,225 |
| | 2001 | | 3/14/2014 |
| Goolsby Pointe | Riverview, FL | — |
| | 4,131 |
| 5,341 |
| | 284 |
| | 4,169 |
| 5,587 |
| 9,756 |
| | 1,183 |
| | 2000 | | 3/14/2014 |
| Statler Square | Staunton, VA | 7,636 |
| | 4,108 |
| 9,072 |
| | 743 |
| | 4,523 |
| 9,400 |
| 13,923 |
| | 1,827 |
| | 1989 | | 3/21/2014 |
| Burbank Plaza | Burbank, IL | — |
| | 2,971 |
| 4,546 |
| | 3,110 |
| | 3,477 |
| 7,150 |
| 10,627 |
| | 1,153 |
| | 1972/1995 | | 3/25/2014 |
| Hamilton Village | Chattanooga, TN | — |
| | 11,691 |
| 18,968 |
| | 1,508 |
| | 12,234 |
| 19,933 |
| 32,167 |
| | 3,956 |
| | 1989 | | 4/3/2014 |
| Waynesboro Plaza | Waynesboro, VA | — |
| | 5,597 |
| 8,334 |
| | 102 |
| | 5,642 |
| 8,391 |
| 14,033 |
| | 1,593 |
| | 2005 | | 4/30/2014 |
| Southwest Marketplace | Las Vegas, NV | — |
| | 16,019 |
| 11,270 |
| | 2,064 |
| | 16,080 |
| 13,273 |
| 29,353 |
| | 2,336 |
| | 2008 | | 5/5/2014 |
|
| | | | | | | | | | | | | | | | | | | | | | | | | | | | | | | | | |
| SCHEDULE III—REAL ESTATE ASSETS AND ACCUMULATED DEPRECIATION |
| As of December 31, 2017 |
| (in thousands) |
| | | |
| | Initial Cost(1) | | Cost Capitalized Subsequent to Acquisition | | Gross Amount Carried at End of Period(2)(3) | | | | | | |
| Property Name | City, State | Encumbrances | | Land and Improvements | Buildings and Improvements | | | Land and Improvements | Buildings and Improvements | Total | | Accumulated Depreciation | | Date Constructed/ Renovated | | Date Acquired |
| Hampton Village | Taylors, SC | — |
| | 5,456 |
| 7,254 |
| | 2,580 |
| | 5,741 |
| 9,549 |
| 15,290 |
| | 1,776 |
| | 1959/1998 | | 5/21/2014 |
| Central Station | Louisville, KY | — |
| | 6,144 |
| 6,931 |
| | 1,451 |
| | 6,380 |
| 8,146 |
| 14,526 |
| | 1,446 |
| | 2005/2007 | | 5/23/2014 |
| Kirkwood Market Place | Houston, TX | — |
| | 5,786 |
| 9,697 |
| | 392 |
| | 5,897 |
| 9,978 |
| 15,875 |
| | 1,607 |
| | 1979/2008 | | 5/23/2014 |
| Fairview Plaza | New Cumberland, PA | — |
| | 2,787 |
| 8,500 |
| | 186 |
| | 2,879 |
| 8,594 |
| 11,473 |
| | 1,343 |
| | 1992/1999 | | 5/27/2014 |
| Broadway Promenade | Sarasota, FL | — |
| | 3,832 |
| 6,795 |
| | 176 |
| | 3,863 |
| 6,940 |
| 10,803 |
| | 1,067 |
| | 2007 | | 5/28/2014 |
| Townfair Shopping Center | Indiana, PA | 14,142 |
| | 7,007 |
| 13,233 |
| | 1,049 |
| | 7,190 |
| 14,099 |
| 21,289 |
| | 2,421 |
| | 1995/2010 | | 5/29/2014 |
| Deerwood Lake Commons | Jacksonville, FL | — |
| | 2,198 |
| 8,878 |
| | 431 |
| | 2,290 |
| 9,217 |
| 11,507 |
| | 1,400 |
| | 2003 | | 5/30/2014 |
| Heath Brook Commons | Ocala, FL | — |
| | 3,470 |
| 8,353 |
| | 340 |
| | 3,528 |
| 8,635 |
| 12,163 |
| | 1,399 |
| | 2002 | | 5/30/2014 |
| Park View Square | Miramar, FL | — |
| | 5,701 |
| 9,303 |
| | 415 |
| | 5,737 |
| 9,682 |
| 15,419 |
| | 1,547 |
| | 2003 | | 5/30/2014 |
| St. Johns Commons | Jacksonville, FL | — |
| | 1,599 |
| 10,387 |
| | 553 |
| | 1,731 |
| 10,808 |
| 12,539 |
| | 1,620 |
| | 2003 | | 5/30/2014 |
| West Creek Commons | Coconut Creek, FL | 6,079 |
| | 7,404 |
| 12,710 |
| | 590 |
| | 7,526 |
| 13,178 |
| 20,704 |
| | 1,821 |
| | 2003 | | 5/30/2014 |
| Lovejoy Village | Jonesboro, GA | — |
| | 1,296 |
| 7,029 |
| | 550 |
| | 1,352 |
| 7,523 |
| 8,875 |
| | 1,118 |
| | 2001 | | 6/3/2014 |
| The Orchards | Yakima, WA | — |
| | 5,425 |
| 8,743 |
| | 269 |
| | 5,596 |
| 8,841 |
| 14,437 |
| | 1,480 |
| | 2002 | | 6/3/2014 |
| Hannaford Plaza | Waltham, MA | — |
| | 4,614 |
| 7,903 |
| | 228 |
| | 4,715 |
| 8,030 |
| 12,745 |
| | 1,139 |
| | 1950/1993 | | 6/23/2014 |
| Shaw’s Plaza Easton | Easton, MA | — |
| | 5,520 |
| 7,173 |
| | 412 |
| | 5,727 |
| 7,378 |
| 13,105 |
| | 1,323 |
| | 1984/2004 | | 6/23/2014 |
| Shaw’s Plaza Hanover | Hanover, MA | — |
| | 2,826 |
| 5,314 |
| | 10 |
| | 2,826 |
| 5,324 |
| 8,150 |
| | 855 |
| | 1994 | | 6/23/2014 |
| Cushing Plaza | Cohasset, MA | — |
| | 5,752 |
| 14,796 |
| | 345 |
| | 6,029 |
| 14,864 |
| 20,893 |
| | 2,071 |
| | 1997 | | 6/23/2014 |
| Lynnwood Place | Jackson, TN | — |
| | 3,341 |
| 4,826 |
| | 1,190 |
| | 3,523 |
| 5,834 |
| 9,357 |
| | 1,154 |
| | 1986/2013 | | 7/28/2014 |
| Battle Ridge Pavilion | Marietta, GA | — |
| | 3,124 |
| 9,866 |
| | 296 |
| | 3,220 |
| 10,066 |
| 13,286 |
| | 1,584 |
| | 1999 | | 8/1/2014 |
| Thompson Valley Towne Center | Loveland, CO | 5,912 |
| | 5,759 |
| 17,387 |
| | 913 |
| | 5,961 |
| 18,098 |
| 24,059 |
| | 2,718 |
| | 1999 | | 8/1/2014 |
| Lumina Commons | Wilmington, NC | 8,296 |
| | 2,006 |
| 11,250 |
| | 469 |
| | 2,046 |
| 11,679 |
| 13,725 |
| | 1,552 |
| | 1974/2007 | | 8/4/2014 |
| Driftwood Village | Ontario, CA | — |
| | 6,811 |
| 12,993 |
| | 924 |
| | 7,176 |
| 13,552 |
| 20,728 |
| | 2,059 |
| | 1985 | | 8/7/2014 |
| French Golden Gate | Bartow, FL | — |
| | 2,599 |
| 12,877 |
| | 1,278 |
| | 2,671 |
| 14,083 |
| 16,754 |
| | 1,901 |
| | 1960/2011 | | 8/28/2014 |
| Orchard Square | Washington Township, MI | 6,539 |
| | 1,361 |
| 11,550 |
| | 198 |
| | 1,427 |
| 11,682 |
| 13,109 |
| | 1,727 |
| | 1999 | | 9/8/2014 |
| Trader Joe’s Center | Dublin, OH | — |
| | 2,338 |
| 7,922 |
| | 664 |
| | 2,520 |
| 8,404 |
| 10,924 |
| | 1,314 |
| | 1986 | | 9/11/2014 |
| Palmetto Pavilion | North Charleston, SC | — |
| | 2,509 |
| 8,526 |
| | 494 |
| | 2,946 |
| 8,583 |
| 11,529 |
| | 1,236 |
| | 2003 | | 9/11/2014 |
| Five Town Plaza | Springfield, MA | — |
| | 8,912 |
| 19,635 |
| | 4,719 |
| | 9,901 |
| 23,365 |
| 33,266 |
| | 3,960 |
| | 1970/2013 | | 9/24/2014 |
| Beavercreek Towne Center | Beavercreek, OH | — |
| | 14,055 |
| 30,799 |
| | 413 |
| | 14,367 |
| 30,900 |
| 45,267 |
| | 5,017 |
| | 1994 | | 10/24/2014 |
| Fairfield Crossing | Beavercreek, OH | — |
| | 3,571 |
| 10,026 |
| | 69 |
| | 3,605 |
| 10,061 |
| 13,666 |
| | 1,484 |
| | 1994 | | 10/24/2014 |
| Grayson Village | Loganville, GA | — |
| | 3,952 |
| 5,620 |
| | 404 |
| | 4,006 |
| 5,970 |
| 9,976 |
| | 1,351 |
| | 2002 | | 10/24/2014 |
| The Fresh Market Commons | Pawleys Island, SC | — |
| | 2,442 |
| 4,941 |
| | 76 |
| | 2,442 |
| 5,017 |
| 7,459 |
| | 774 |
| | 2011 | | 10/28/2014 |
| Claremont Village | Everett, WA | — |
| | 5,511 |
| 10,544 |
| | 880 |
| | 5,741 |
| 11,194 |
| 16,935 |
| | 1,633 |
| | 1994/2012 | | 11/6/2014 |
|
| | | | | | | | | | | | | | | | | | | | | | | | | | | | | | | | | |
| SCHEDULE III—REAL ESTATE ASSETS AND ACCUMULATED DEPRECIATION |
| As of December 31, 2017 |
| (in thousands) |
| | | |
| | Initial Cost(1) | | Cost Capitalized Subsequent to Acquisition | | Gross Amount Carried at End of Period(2)(3) | | | | | | |
| Property Name | City, State | Encumbrances | | Land and Improvements | Buildings and Improvements | | | Land and Improvements | Buildings and Improvements | Total | | Accumulated Depreciation | | Date Constructed/ Renovated | | Date Acquired |
| Juan Tabo Plaza | Albuquerque, NM | — |
| | 2,466 |
| 4,568 |
| | 573 |
| | 2,592 |
| 5,015 |
| 7,607 |
| | 989 |
| | 1975/1989 | | 11/12/2014 |
| Cherry Hill Marketplace | Westland, MI | — |
| | 4,641 |
| 10,137 |
| | 1,934 |
| | 4,858 |
| 11,854 |
| 16,712 |
| | 1,710 |
| | 1992/2000 | | 12/17/2014 |
| Shoppes at Ardrey Kell | Charlotte, NC | — |
| | 6,724 |
| 8,150 |
| | 648 |
| | 6,850 |
| 8,672 |
| 15,522 |
| | 1,459 |
| | 2008 | | 12/17/2014 |
| Nor'Wood Shopping Center | Colorado Springs, CO | — |
| | 5,358 |
| 6,684 |
| | 453 |
| | 5,429 |
| 7,066 |
| 12,495 |
| | 1,216 |
| | 2003 | | 1/8/2015 |
| Sunburst Plaza | Glendale, AZ | — |
| | 3,435 |
| 6,041 |
| | 519 |
| | 3,527 |
| 6,468 |
| 9,995 |
| | 1,204 |
| | 1970 | | 2/11/2015 |
| Rivermont Station | Alpharetta, GA | 2,191 |
| | 6,876 |
| 8,917 |
| | 714 |
| | 7,098 |
| 9,409 |
| 16,507 |
| | 1,923 |
| | 1996/2003 | | 2/27/2015 |
| Breakfast Point Marketplace | Panama City Beach, FL | — |
| | 5,579 |
| 12,051 |
| | 467 |
| | 5,769 |
| 12,328 |
| 18,097 |
| | 1,661 |
| | 2009/2010 | | 3/13/2015 |
| Falcon Valley | Lenexa, KS | — |
| | 3,131 |
| 6,874 |
| | 215 |
| | 3,312 |
| 6,908 |
| 10,220 |
| | 1,024 |
| | 2008/2009 | | 3/13/2015 |
| Lake Wales | Lake Wales, FL | — |
| | 1,273 |
| 2,164 |
| | — |
| | 1,273 |
| 2,164 |
| 3,437 |
| | 323 |
| | 1998 | | 3/13/2015 |
| Lakeshore Crossing | Gainesville, GA | — |
| | 3,857 |
| 5,937 |
| | 32 |
| | 3,857 |
| 5,969 |
| 9,826 |
| | 1,140 |
| | 1993/1994 | | 3/13/2015 |
| Onalaska | Onalaska, WI | — |
| | 2,669 |
| 5,648 |
| | 1 |
| | 2,670 |
| 5,648 |
| 8,318 |
| | 938 |
| | 1992/1993 | | 3/13/2015 |
| Coronado Center | Santa Fe, NM | — |
| | 4,395 |
| 16,461 |
| | 1,573 |
| | 4,464 |
| 17,965 |
| 22,429 |
| | 1,870 |
| | 1964 | | 5/1/2015 |
| Northwoods Crossing | Taunton, MA | — |
| | 10,092 |
| 14,437 |
| | 195 |
| | 10,230 |
| 14,494 |
| 24,724 |
| | 1,826 |
| | 2003/2010 | | 5/24/2016 |
| Murphy Marketplace | Murphy, TX | — |
| | 28,652 |
| 33,122 |
| | 452 |
| | 28,828 |
| 33,398 |
| 62,226 |
| | 2,393 |
| | 2008/2015 | | 6/24/2016 |
| Harbour Village | Jacksonville, FL | — |
| | 5,630 |
| 16,727 |
| | 473 |
| | 5,910 |
| 16,920 |
| 22,830 |
| | 1,005 |
| | 2006 | | 9/22/2016 |
| Oak Mill Plaza | Niles, IL | 1,242 |
| | 6,843 |
| 13,692 |
| | 689 |
| | 7,288 |
| 13,936 |
| 21,224 |
| | 1,179 |
| | 1977 | | 10/3/2016 |
| Southern Palms | Tempe, AZ | 24,350 |
| | 10,026 |
| 24,346 |
| | 416 |
| | 10,279 |
| 24,509 |
| 34,788 |
| | 1,659 |
| | 1982 | | 10/26/2016 |
| Golden Eagle Village | Clermont, FL | 7,455 |
| | 3,068 |
| 7,735 |
| | 230 |
| | 3,098 |
| 7,935 |
| 11,033 |
| | 471 |
| | 2011 | | 10/27/2016 |
| Georgesville Square | Columbus, OH | — |
| | 11,137 |
| 19,663 |
| | 593 |
| | 11,415 |
| 19,978 |
| 31,393 |
| | 1,313 |
| | 1996 | | 12/15/2016 |
| Atwater Marketplace | Atwater, CA | — |
| | 6,116 |
| 7,597 |
| | 357 |
| | 6,280 |
| 7,790 |
| 14,070 |
| | 437 |
| | 2008 | | 2/10/2017 |
| Rocky Ridge Station | Roseville, CA | 22,049 |
| | 5,449 |
| 29,207 |
| | 215 |
| | 5,571 |
| 29,300 |
| 34,871 |
| | 762 |
| | 1996 | | 4/18/2017 |
| Greentree Station | Racine, WI | — |
| | 2,955 |
| 8,718 |
| | 461 |
| | 3,244 |
| 8,890 |
| 12,134 |
| | 289 |
| | 1989/1994 | | 5/5/2017 |
| Titusville Station | Titusville, FL | — |
| | 3,632 |
| 9,133 |
| | 487 |
| | 3,828 |
| 9,424 |
| 13,252 |
| | 305 |
| | 1985/2011 | | 6/15/2017 |
| Sierra Station | Corona, CA | 7,603 |
| | 9,011 |
| 17,989 |
| | 701 |
| | 9,174 |
| 18,527 |
| 27,701 |
| | 429 |
| | 1991 | | 6/20/2017 |
| Hoffman Station | Hoffman Estates, IL | — |
| | 8,941 |
| 22,871 |
| | 310 |
| | 9,160 |
| 22,962 |
| 32,122 |
| | 357 |
| | 1987 | | 9/5/2017 |
| Winter Springs Town Center | Winter Springs, FL | — |
| | 4,871 |
| 18,892 |
| | 86 |
| | 4,943 |
| 18,906 |
| 23,849 |
| | 140 |
| | 2002 | | 10/20/2017 |
| Flynn Crossing Center | Alpharetta, GA | — |
| | 6,581 |
| 16,075 |
| | 1 |
| | 6,582 |
| 16,075 |
| 22,657 |
| | 126 |
| | 2004 | | 10/26/2017 |
| Vaughn's at East North | Greenville, SC | — |
| | 1,704 |
| 3,077 |
| | 101 |
| | 1,704 |
| 3,178 |
| 4,882 |
| | 78 |
| | 1979 | | 10/4/2017 |
| Ashland Junction | Ashland, VA | — |
| | 4,987 |
| 6,043 |
| | 107 |
| | 5,058 |
| 6,079 |
| 11,137 |
| | 144 |
| | 1989 | | 10/4/2017 |
| Barclay Place Shopping Center | Lakeland, FL | — |
| | 1,984 |
| 7,061 |
| | 237 |
| | 2,012 |
| 7,270 |
| 9,282 |
| | 122 |
| | 1989 | | 10/4/2017 |
| Barnwell Plaza | Barnwell, SC | — |
| | 1,190 |
| 1,883 |
| | — |
| | 1,190 |
| 1,883 |
| 3,073 |
| | 69 |
| | 1985 | | 10/4/2017 |
| Birdneck Shopping Center | Virginia Beach, VA | — |
| | 1,900 |
| 3,249 |
| | 147 |
| | 1,925 |
| 3,371 |
| 5,296 |
| | 63 |
| | 1987 | | 10/4/2017 |
| Cactus Village | Phoenix, AZ | — |
| | 4,313 |
| 5,854 |
| | 199 |
| | 4,313 |
| 6,053 |
| 10,366 |
| | 86 |
| | 1986 | | 10/4/2017 |
|
| | | | | | | | | | | | | | | | | | | | | | | | | | | | | | | | | |
| SCHEDULE III—REAL ESTATE ASSETS AND ACCUMULATED DEPRECIATION |
| As of December 31, 2017 |
| (in thousands) |
| | | |
| | Initial Cost(1) | | Cost Capitalized Subsequent to Acquisition | | Gross Amount Carried at End of Period(2)(3) | | | | | | |
| Property Name | City, State | Encumbrances | | Land and Improvements | Buildings and Improvements | | | Land and Improvements | Buildings and Improvements | Total | | Accumulated Depreciation | | Date Constructed/ Renovated | | Date Acquired |
| Centre Stage Shopping Center | Springfield, TN | — |
| | 4,746 |
| 9,519 |
| | 55 |
| | 4,792 |
| 9,528 |
| 14,320 |
| | 160 |
| | 1989 | | 10/4/2017 |
| Civic Center | Cincinnati, OH | — |
| | 2,448 |
| 1,961 |
| | (19 | ) | | 2,448 |
| 1,942 |
| 4,390 |
| | 109 |
| | 1986 | | 10/4/2017 |
| Countryside Shopping Center | Port Orange, FL | — |
| | 2,923 |
| 12,288 |
| | 186 |
| | 2,949 |
| 12,448 |
| 15,397 |
| | 169 |
| | 1983 | | 10/4/2017 |
| Crossroads Plaza | Asheboro, NC | — |
| | 1,722 |
| 2,718 |
| | 69 |
| | 1,760 |
| 2,749 |
| 4,509 |
| | 63 |
| | 1984 | | 10/4/2017 |
| Dunlop Village | Colonial Heights, VA | — |
| | 2,420 |
| 4,892 |
| | 235 |
| | 2,420 |
| 5,127 |
| 7,547 |
| | 78 |
| | 1987 | | 10/4/2017 |
| Edgecombe Square | Tarboro, NC | — |
| | 1,412 |
| 2,258 |
| | 221 |
| | 1,412 |
| 2,479 |
| 3,891 |
| | 82 |
| | 1990 | | 10/4/2017 |
| Emporia West Plaza | Emporia, KS | — |
| | 872 |
| 3,380 |
| | 108 |
| | 872 |
| 3,488 |
| 4,360 |
| | 65 |
| | 1980/2000 | | 10/4/2017 |
| Fairview Park Plaza | Centralia, IL | — |
| | 3,913 |
| 12,225 |
| | 127 |
| | 3,913 |
| 12,352 |
| 16,265 |
| | 353 |
| | 1969/1998 | | 10/4/2017 |
| Forest Park Square | Cincinnati, OH | — |
| | 4,007 |
| 5,789 |
| | 105 |
| | 4,007 |
| 5,894 |
| 9,901 |
| | 121 |
| | 1988 | | 10/4/2017 |
| Gateway Plaza | Sumter, SC | — |
| | 2,330 |
| 8,092 |
| | 13 |
| | 2,330 |
| 8,105 |
| 10,435 |
| | 98 |
| | 1989 | | 10/4/2017 |
| Geist Centre | Indianapolis, IN | — |
| | 3,873 |
| 6,760 |
| | 27 |
| | 3,873 |
| 6,787 |
| 10,660 |
| | 99 |
| | 1989 | | 10/4/2017 |
| Goshen Station | Goshen, OH | — |
| | 1,555 |
| 4,616 |
| | 11 |
| | 1,561 |
| 4,621 |
| 6,182 |
| | 98 |
| | 1973/2003 | | 10/4/2017 |
| Governors Square | Montgomery, AL | — |
| | 6,460 |
| 9,772 |
| | 249 |
| | 6,460 |
| 10,021 |
| 16,481 |
| | 185 |
| | 1960/2000 | | 10/4/2017 |
| Greenwood West Shopping Center | Greenwood, MS | — |
| | 1,224 |
| 5,674 |
| | 105 |
| | 1,223 |
| 5,780 |
| 7,003 |
| | 125 |
| | 1989 | | 10/4/2017 |
| Guadalupe Plaza | Albuquerque, NM | — |
| | 2,920 |
| 7,885 |
| | 47 |
| | 2,920 |
| 7,932 |
| 10,852 |
| | 98 |
| | 1985 | | 10/4/2017 |
| The Village Shopping Center | Mooresville, IN | — |
| | 2,363 |
| 8,145 |
| | 678 |
| | 2,363 |
| 8,823 |
| 11,186 |
| | 133 |
| | 1965/1997 | | 10/4/2017 |
| Heritage Oaks | Gridley, CA | 5,190 |
| | 2,390 |
| 7,404 |
| | 13 |
| | 2,390 |
| 7,417 |
| 9,807 |
| | 144 |
| | 1979 | | 10/4/2017 |
| Hickory Plaza | Nashville, TN | 5,136 |
| | 2,927 |
| 5,099 |
| | 4 |
| | 2,927 |
| 5,103 |
| 8,030 |
| | 82 |
| | 1974/1986 | | 10/4/2017 |
| Highland Fair | Gresham, OR | 7,332 |
| | 3,263 |
| 7,912 |
| | 172 |
| | 3,264 |
| 8,083 |
| 11,347 |
| | 98 |
| | 1984/1999 | | 10/4/2017 |
| High Point Village | Bellefontaine, OH | — |
| | 3,386 |
| 7,433 |
| | 95 |
| | 3,386 |
| 7,528 |
| 10,914 |
| | 172 |
| | 1988 | | 10/4/2017 |
| Jackson Village | Jackson, KY | — |
| | 1,606 |
| 6,952 |
| | 243 |
| | 1,612 |
| 7,189 |
| 8,801 |
| | 149 |
| | 1985/1996 | | 10/4/2017 |
| Mayfair Village | Hurst, TX | — |
| | 15,343 |
| 16,439 |
| | 151 |
| | 15,343 |
| 16,590 |
| 31,933 |
| | 246 |
| | 1981/2004 | | 10/4/2017 |
| LaPlata Plaza | La Plata, MD | — |
| | 8,434 |
| 22,838 |
| | 50 |
| | 8,456 |
| 22,866 |
| 31,322 |
| | 261 |
| | 2003 | | 10/4/2017 |
| Lafayette Square | Lafayette, IN | 7,703 |
| | 5,387 |
| 5,636 |
| | 40 |
| | 5,387 |
| 5,676 |
| 11,063 |
| | 239 |
| | 1963/2001 | | 10/4/2017 |
| Landen Square | Maineville, OH | — |
| | 2,081 |
| 3,462 |
| | 80 |
| | 2,081 |
| 3,542 |
| 5,623 |
| | 78 |
| | 1981/2003 | | 10/4/2017 |
| Marion City Square | Marion, NC | — |
| | 2,811 |
| 6,103 |
| | 267 |
| | 2,846 |
| 6,335 |
| 9,181 |
| | 164 |
| | 1987 | | 10/4/2017 |
| Melbourne Village Plaza | Melbourne, FL | — |
| | 5,418 |
| 7,218 |
| | 551 |
| | 5,508 |
| 7,679 |
| 13,187 |
| | 191 |
| | 1987 | | 10/4/2017 |
| Commerce Square | Brownwood, TX | — |
| | 6,027 |
| 8,267 |
| | 218 |
| | 6,027 |
| 8,485 |
| 14,512 |
| | 161 |
| | 1969/2007 | | 10/4/2017 |
| Upper Deerfield Plaza | Bridgeton, NJ | — |
| | 5,073 |
| 5,770 |
| | 437 |
| | 5,073 |
| 6,207 |
| 11,280 |
| | 197 |
| | 1977/1994 | | 10/4/2017 |
| Monfort Heights | Cincinnati, OH | — |
| | 2,357 |
| 3,545 |
| | 9 |
| | 2,357 |
| 3,554 |
| 5,911 |
| | 59 |
| | 1987 | | 10/4/2017 |
| Mountain Park Plaza | Roswell, GA | 6,814 |
| | 6,118 |
| 6,637 |
| | 31 |
| | 6,118 |
| 6,668 |
| 12,786 |
| | 92 |
| | 1988/2003 | | 10/4/2017 |
| Nordan Shopping Center | Danville, VA | — |
| | 1,911 |
| 6,691 |
| | 125 |
| | 1,911 |
| 6,816 |
| 8,727 |
| | 111 |
| | 1961/2002 | | 10/4/2017 |
| Northside Plaza | Clinton, NC | — |
| | 1,406 |
| 5,122 |
| | 467 |
| | 1,416 |
| 5,579 |
| 6,995 |
| | 98 |
| | 1982 | | 10/4/2017 |
|
| | | | | | | | | | | | | | | | | | | | | | | | | | | | | | | | | |
| SCHEDULE III—REAL ESTATE ASSETS AND ACCUMULATED DEPRECIATION |
| As of December 31, 2017 |
| (in thousands) |
| | | |
| | Initial Cost(1) | | Cost Capitalized Subsequent to Acquisition | | Gross Amount Carried at End of Period(2)(3) | | | | | | |
| Property Name | City, State | Encumbrances | | Land and Improvements | Buildings and Improvements | | | Land and Improvements | Buildings and Improvements | Total | | Accumulated Depreciation | | Date Constructed/ Renovated | | Date Acquired |
| Page Plaza | Page, AZ | — |
| | 2,553 |
| 4,277 |
| | 139 |
| | 2,559 |
| 4,410 |
| 6,969 |
| | 100 |
| | 1982/1990 | | 10/4/2017 |
| Palmetto Plaza | Sumter, SC | — |
| | 2,732 |
| 7,193 |
| | 202 |
| | 2,739 |
| 7,388 |
| 10,127 |
| | 105 |
| | 1964/2002 | | 10/4/2017 |
| Park Place Plaza | Port Orange, FL | — |
| | 2,347 |
| 8,303 |
| | 183 |
| | 2,370 |
| 8,463 |
| 10,833 |
| | 125 |
| | 1984 | | 10/4/2017 |
| Parkway Station | Warner Robins, GA | — |
| | 3,416 |
| 5,170 |
| | 318 |
| | 3,416 |
| 5,488 |
| 8,904 |
| | 110 |
| | 1982 | | 10/4/2017 |
| Parsons Village | Seffner, FL | 5,048 |
| | 3,465 |
| 10,747 |
| | 128 |
| | 3,471 |
| 10,869 |
| 14,340 |
| | 158 |
| | 1983/1994 | | 10/4/2017 |
| Portland Village | Portland, TN | — |
| | 1,408 |
| 5,214 |
| | 44 |
| | 1,408 |
| 5,258 |
| 6,666 |
| | 83 |
| | 1984 | | 10/4/2017 |
| Promenade Shopping Center | Jacksonville, FL | — |
| | 6,513 |
| 6,037 |
| | 288 |
| | 6,513 |
| 6,325 |
| 12,838 |
| | 209 |
| | 1990 | | 10/4/2017 |
| Quail Valley Shopping Center | Missouri City, TX | — |
| | 2,452 |
| 11,396 |
| | 351 |
| | 2,452 |
| 11,747 |
| 14,199 |
| | 163 |
| | 1983 | | 10/4/2017 |
| Hillside Salt Lake WAG | Hillside, UT | 2,044 |
| | 691 |
| 1,739 |
| | — |
| | 691 |
| 1,739 |
| 2,430 |
| | 18 |
| | 2006 | | 10/4/2017 |
| Rolling Hills Shopping Center | Tucson, AZ | 8,941 |
| | 5,398 |
| 11,762 |
| | 66 |
| | 5,398 |
| 11,828 |
| 17,226 |
| | 166 |
| | 1980/1997 | | 10/4/2017 |
| South Oaks Shopping Center | Live Oak, FL | 3,418 |
| | 1,742 |
| 5,093 |
| | 22 |
| | 1,742 |
| 5,115 |
| 6,857 |
| | 140 |
| | 1976/2000 | | 10/4/2017 |
| East Pointe Plaza | Columbia, SC | — |
| | 7,496 |
| 11,293 |
| | 565 |
| | 7,505 |
| 11,849 |
| 19,354 |
| | 272 |
| | 1990 | | 10/4/2017 |
| Southgate Center | Heath, OH | — |
| | 4,246 |
| 22,672 |
| | 102 |
| | 4,251 |
| 22,769 |
| 27,020 |
| | 308 |
| | 1960/1997 | | 10/4/2017 |
| Country Club Center | Rio Rancho, NM | — |
| | 3,000 |
| 5,430 |
| | 139 |
| | 3,000 |
| 5,569 |
| 8,569 |
| | 93 |
| | 1977 | | 10/4/2017 |
| Summerville Galleria | Summerville, SC | — |
| | 4,104 |
| 8,552 |
| | 246 |
| | 4,235 |
| 8,667 |
| 12,902 |
| | 131 |
| | 1989/2003 | | 10/4/2017 |
| The Oaks | Hudson, FL | — |
| | 3,876 |
| 6,668 |
| | 71 |
| | 3,931 |
| 6,684 |
| 10,615 |
| | 154 |
| | 1981 | | 10/4/2017 |
| Riverplace Centre | Noblesville, IN | — |
| | 3,890 |
| 3,661 |
| | 490 |
| | 3,890 |
| 4,151 |
| 8,041 |
| | 103 |
| | 1992 | | 10/4/2017 |
| Timberlake Station | Lynchburg, VA | — |
| | 2,427 |
| 1,979 |
| | 20 |
| | 2,426 |
| 2,000 |
| 4,426 |
| | 62 |
| | 1950/1996 | | 10/4/2017 |
| Town & Country Center | Hamilton, OH | 2,200 |
| | 2,268 |
| 4,372 |
| | 16 |
| | 2,279 |
| 4,377 |
| 6,656 |
| | 79 |
| | 1950 | | 10/4/2017 |
| Powell Villa | Portland, OR | — |
| | 3,364 |
| 7,016 |
| | 398 |
| | 3,364 |
| 7,414 |
| 10,778 |
| | 75 |
| | 1959/1991 | | 10/4/2017 |
| Towne Crossing Shopping Center | Mesquite, TX | — |
| | 5,358 |
| 15,389 |
| | 341 |
| | 5,358 |
| 15,730 |
| 21,088 |
| | 212 |
| | 1984 | | 10/4/2017 |
| Village at Waterford | Midlothian, VA | 4,474 |
| | 2,702 |
| 5,021 |
| | 178 |
| | 2,702 |
| 5,199 |
| 7,901 |
| | 77 |
| | 1991 | | 10/4/2017 |
| Buckingham Square | Richardson, TX | — |
| | 2,087 |
| 6,392 |
| | 384 |
| | 2,087 |
| 6,776 |
| 8,863 |
| | 89 |
| | 1978 | | 10/4/2017 |
| Western Square Shopping Center | Laurens, SC | — |
| | 1,013 |
| 3,302 |
| | 102 |
| | 1,013 |
| 3,404 |
| 4,417 |
| | 103 |
| | 1978/1991 | | 10/4/2017 |
| White Oaks Plaza | Spindale, NC | — |
| | 3,140 |
| 4,476 |
| | 454 |
| | 3,149 |
| 4,921 |
| 8,070 |
| | 207 |
| | 1988 | | 10/4/2017 |
| Windsor Center | Dallas, NC | — |
| | 2,488 |
| 5,186 |
| | — |
| | 2,488 |
| 5,186 |
| 7,674 |
| | 106 |
| | 1974/1996 | | 10/4/2017 |
| Winery Square | Fairfield, CA | — |
| | 4,288 |
| 13,975 |
| | 408 |
| | 4,347 |
| 14,324 |
| 18,671 |
| | 182 |
| | 1987 | | 10/4/2017 |
| 12 West Marketplace | Litchfield, MN | — |
| | 835 |
| 3,538 |
| | — |
| | 835 |
| 3,538 |
| 4,373 |
| | 95 |
| | 1989 | | 10/4/2017 |
| Orchard Plaza | Altoona, PA | 1,658 |
| | 2,537 |
| 5,260 |
| | 106 |
| | 2,537 |
| 5,366 |
| 7,903 |
| | 105 |
| | 1987 | | 10/4/2017 |
| Willowbrook Commons | Nashville, TN | — |
| | 5,384 |
| 5,983 |
| | 41 |
| | 5,384 |
| 6,024 |
| 11,408 |
| | 98 |
| | 2005 | | 10/4/2017 |
| Edgewood Towne Center | Edgewood, PA | — |
| | 10,029 |
| 22,357 |
| | 278 |
| | 10,029 |
| 22,635 |
| 32,664 |
| | 356 |
| | 1990 | | 10/4/2017 |
| Everson Pointe | Snellville, GA | — |
| | 4,222 |
| 8,421 |
| | 17 |
| | 4,222 |
| 8,438 |
| 12,660 |
| | 133 |
| | 1999 | | 10/4/2017 |
|
| | | | | | | | | | | | | | | | | | | | | | | | | | | | | | | | | |
| SCHEDULE III—REAL ESTATE ASSETS AND ACCUMULATED DEPRECIATION |
| As of December 31, 2017 |
| (in thousands) |
| | | |
| | Initial Cost(1) | | Cost Capitalized Subsequent to Acquisition | | Gross Amount Carried at End of Period(2)(3) | | | | | | |
| Property Name | City, State | Encumbrances | | Land and Improvements | Buildings and Improvements | | | Land and Improvements | Buildings and Improvements | Total | | Accumulated Depreciation | | Date Constructed/ Renovated | | Date Acquired |
| Gleneagles Court | Memphis, TN | — |
| | 3,892 |
| 8,149 |
| | 8 |
| | 3,892 |
| 8,157 |
| 12,049 |
| | 113 |
| | 1988 | | 10/4/2017 |
| Village Square of Delafield | Delafield, WI | — |
| | 6,206 |
| 6,582 |
| | 300 |
| | 6,219 |
| 6,869 |
| 13,088 |
| | 116 |
| | 2007 | | 10/4/2017 |
| Jasper Manor | Jasper, IN | — |
| | 2,684 |
| 6,535 |
| | 27 |
| | 2,684 |
| 6,562 |
| 9,246 |
| | 220 |
| | 1990 | | 10/4/2017 |
| Eastland Shoppes | Evansville, IN | — |
| | 3,463 |
| 10,746 |
| | — |
| | 3,463 |
| 10,746 |
| 14,209 |
| | 172 |
| | 1990 | | 10/4/2017 |
| Pipestone Plaza | Benton Harbor, MI | — |
| | 1,894 |
| 10,765 |
| | — |
| | 1,894 |
| 10,765 |
| 12,659 |
| | 187 |
| | 1978 | | 10/4/2017 |
Northlake(4) | Cincinnati, OH | 8,668 |
| | 2,327 |
| 11,776 |
| | 130 |
| | 2,367 |
| 11,866 |
| 14,233 |
| | 132 |
| | 1985 | | 10/4/2017 |
Corporate adjustments(5) | Various | — |
| | — |
| — |
| | (389 | ) | | (164 | ) | (225 | ) | (389 | ) | | — |
| | | | |
| Totals | | $ | 245,310 |
| | $ | 1,094,468 |
| $ | 2,176,711 |
| | $ | 113,792 |
| | $ | 1,121,590 |
| $ | 2,263,381 |
| $ | 3,384,971 |
| | $ | 314,080 |
| | | | |
(1) The initial cost to us represents the original purchase price of the property, including amounts incurredcosts capitalized subsequent to acquisition which were contemplated at the time the property was acquired.are generally attributable to parcels/outparcels sold, impairments, and assets held-for-sale.
(2) (3)The aggregate cost of real estate owned at December 31, 2017.
(3) The aggregate costbasis of properties for Federalfederal income tax purposes is approximately $3.4$5.5 billion at December 31, 2017.2023.
(4)The main shopping center at this location was sold and we currently only own an outparcel.
(5)Amounts consist of corporate building and land.
(5)(6)Amounts consist of elimination of intercompany construction management fees charged by the Investment Management segmentproperty manager to the Owned Real Estate segment properties.real estate assets.
| | | | | | | | | | | |
| PHILLIPS EDISON & COMPANY DECEMBER 31, 2023 FORM 10-K | | | F-41 |
Reconciliation of real estate owned:assets at cost:
| | | | 2017 | | 2016 | | 2023 | | 2022 |
| Balance at January 1 | $ | 2,329,080 |
| | $ | 2,116,480 |
|
| Additions during the year: | | | |
| Real estate acquisitions | 1,021,204 |
| | 219,053 |
|
| Real estate acquisitions | |
| Real estate acquisitions | |
| Net additions to/improvements of real estate | 40,192 |
| | 26,369 |
|
| Deductions during the year: | | | |
| Real estate dispositions | (5,505 | ) | | (32,822 | ) |
| Real estate dispositions | |
| Real estate dispositions | |
| Impairment of real estate | |
| Balance at December 31 | $ | 3,384,971 |
| | $ | 2,329,080 |
|
Reconciliation of accumulated depreciation:
| | | | 2017 | | 2016 | | 2023 | | 2022 |
| Balance at January 1 | $ | 222,557 |
| | $ | 152,433 |
|
| Additions during the year: | | | |
| Depreciation expense | 92,156 |
| | 73,703 |
|
| Depreciation expense | |
| Depreciation expense | |
| Deductions during the year: | | | |
| Accumulated depreciation of real estate dispositions | (633 | ) | | (3,579 | ) |
| Accumulated depreciation of real estate dispositions | |
| Accumulated depreciation of real estate dispositions | |
| Impairment of real estate | |
| Balance at December 31 | $ | 314,080 |
| | $ | 222,557 |
|
* * * * *
| | | | | | | | | | | |
| PHILLIPS EDISON & COMPANY DECEMBER 31, 2023 FORM 10-K | | | F-42 |
SIGNATURES
Pursuant to the requirements of Section 13 or 15(d) of the Securities Exchange Act of 1934, the registrant has duly caused this report to be signed on its behalf by the undersigned, thereunto duly authorized this 29th12th day of March 2018.
| | | | | | | | |
| | |
| PHILLIPS EDISON & COMPANY, INC. |
| |
| By: | /s/ JEFFREY S. EDISON |
| Jeffrey S. Edison |
| Chairman of the Board and Chief Executive Officer |
Pursuant to the requirements of the Securities Exchange Act of 1934, this report has been signed by the following persons on behalf of the registrant and in the capacities and on the dates indicated.
| | | | | | | | | | | | | | |
| Signature | | Title | | Date |
| | | | | |
Signature | | Title | | Date |
| | | | |
/s/S/ JEFFREY S. EDISON | | Chairman of the Board and Chief Executive Officer (Principal Executive Officer) | | March 29, 2018February 12, 2024 |
| Jeffrey S. Edison | | | | | |
| | | | |
/s/ DEVIN I. MURPHYS/ JOHN P. CAULFIELD | | Executive Vice President, Chief Financial Officer, and Treasurer (Principal Financial Officer) | | March 29, 2018February 12, 2024 |
Devin I. MurphyJohn P. Caulfield | | | | | |
| | | | |
/s/S/ JENNIFER L. ROBISON | | Senior Vice President and Chief Accounting Officer (Principal Accounting Officer) | | March 29, 2018February 12, 2024 |
| Jennifer L. Robison | | | | |
| | | | |
/s/S/ LESLIE T. CHAO | | Director | | Director | March 29, 2018February 12, 2024 |
| Leslie T. Chao | | | | | |
| | | | |
| /S/ ELIZABETH FISCHER | | Director | | | February 12, 2024 |
/s/ PAUL J. MASSEY, JR.Elizabeth Fischer | | | Director | | March 29, 2018
| Paul J. Massey, Jr. | | | |
| | | | |
/s/S/ STEPHEN R. QUAZZO | | Director | | Director | March 29, 2018February 12, 2024 |
| Stephen R. Quazzo | | | | |
| | | | |
| /S/ JANE SILFEN | | Director | | February 12, 2024 |
| Jane Silfen | | | | |
| | | | |
| /S/ JOHN A. STRONG | | Director | | February 12, 2024 |
| John A. Strong | | | | |
| | | | |
/s/S/ ANTHONY TERRY | | Director | | February 12, 2024 |
| Anthony Terry | | | | |
| | | | |
| /S/ PARILEE EDISON WANG | | Director | | February 12, 2024 |
| Parilee Edison Wang | | | | |
| | | | |
| /S/ GREGORY S. WOOD | | Director | | Director | March 29, 2018February 12, 2024 |
| Gregory S. Wood | | | | |
| | | | |