UNITED STATES
SECURITIES AND EXCHANGE COMMISSION
Washington, D.C. 20549
(Mark One)
☑ ANNUAL REPORT PURSUANT TO SECTION 13 OR 15(d) OF THE SECURITIES EXCHANGE ACT OF 1934
For the fiscal year ended December 31, 20202023
or
☐ TRANSITION REPORT PURSUANT TO SECTION 13 OR 15(d) OF THE SECURITIES EXCHANGE ACT OF 1934
For the transition period from _____ to _____
Commission file number 000-54691
PHILLIPS EDISON & COMPANY, INC.
(Exact name of registrant as specified in its charter)
| | | | | | | | | | | |
| Maryland | | 27-1106076 |
(State or other jurisdiction of
incorporation or organization) | | (I.R.S. Employer
Identification No.) |
| | | | |
| 11501 Northlake Drive, Cincinnati, Ohio | | 45249 |
| (Address of principal executive offices) | | (Zip Code) |
(513) 554-1110
(Registrant’s telephone number, including area code)
Securities registered pursuant to Section 12(b) of the Act:
| | | | | | | | | | | | | | |
| Title of each class | | Trading Symbol(s) | | Name of each exchange on which registered |
NoneCommon stock, par value $0.01 per share | | NonePECO | | NoneNasdaq Global Select Market |
Securities registered pursuant to Section 12(g) of the Act:
Common Stock, $0.01 par value per shareNone
Indicate by check mark if the registrant is a well-known seasoned issuer, as defined in Rule 405 of the Securities Act.
Yes ☐☑ No ☑☐
Indicate by check mark if the registrant is not required to file reports pursuant to Section 13 or Section 15(d) of the Act.
Yes ☐ No ☑
Indicate by check mark whether the registrant (1) has filed all reports required to be filed by Section 13 or 15(d) of the Securities Exchange Act of 1934 during the preceding 12 months (or for such shorter period that the registrant was required to file such reports) and (2) has been subject to such filing requirements for the past 90 days. Yes ☑ No ☐
Indicate by check mark whether the registrant has submitted electronically every Interactive Data File required to be submitted pursuant to Rule 405 of Regulation S-T (§ 232.405 of this chapter) during the preceding 12 months (or for such shorter period that the registrant was required to submit such files). Yes ☑ No ☐
Indicate by check mark whether the registrant is a large accelerated filer, an accelerated filer, a non-accelerated filer, a smaller reporting company, or an emerging growth company. See the definitions of “large accelerated filer,” “accelerated filer,” “smaller reporting company,” and “emerging growth company” in Rule 12b-2 of the Exchange Act.
| | | | | | | | | | | |
| Large accelerated filer | ☐☑
| Accelerated filer | ☐
|
| | | |
| Non-accelerated filer | ☑☐ | Smaller reporting company | ☐
|
| | | |
| | Emerging growth company | ☐ |
If an emerging growth company, indicate by check mark if the registrant has elected not to use the extended transition period for complying with any new or revised financial accounting standards provided pursuant to Section 13(a) of the Exchange Act. ☐
Indicate by check mark whether the registrant has filed a report on and attestation to its management’s assessment of the effectiveness of its internal control over financial reporting under Section 404(b) of the Sarbanes-Oxley Act (15 U.S.C. 7262(b)) by the registered public accounting firm that prepared or issued its audit report. ☑
If securities are registered pursuant to Section 12(b) of the Act, indicate by check mark whether the financial statements of the registrant included in the filing reflect the correction of an error to previously issued financial statements. ☐
Indicate by check mark whether any of those error corrections are restatements that required a recovery analysis of incentive-based compensation received by any of the registrant’s executive officers during the relevant recovery period pursuant to §240.10D-1(b). ☐
Indicate by check mark whether the registrant is a shell company (as defined in rule 12b-2 of the Act). Yes ☐ No ☑
There is no established publicAs of June 30, 2023, the aggregate market for the registrant’s shares of common stock. On May 6, 2020, the Board of Directors of the registrant approved an estimated value per share of the registrant’s common stock held by non-affiliates of $8.75the registrant was $4.0 billion, based substantiallyon a closing price of $34.08 as reported on the estimated market value of its portfolio of real estate properties as of March 31, 2020. Prior to May 6, 2020, the estimated value per share was $11.10. For a full description of the methodologies used to establish the estimated value per share, see “Part II, Item 5. Market for Registrant’s Common Equity, Related Stockholder Matters, and Issuer Purchases of Equity Securities - Market Information” of this filing on Form 10-K. Nasdaq Global Select Market.
As of June 30, 2020, the last business day of the Registrant’s most recently completed second fiscal quarter,February 5, 2024, there were approximately 289.8 million shares of common stock held by non-affiliates.
As of March 1, 2021, there were approximately 280.7122.2 million outstanding shares of common stock of the registrant.
Documents Incorporated by Reference: NoneCertain required information will be included in our definitive proxy statement to be filed with the SEC within 120 days after December 31, 2023 in connection with the Company's 2024 Annual Meeting of Stockholders, and is hereby incorporated by reference into Part III of this Form 10-K.
PHILLIPS EDISON & COMPANY, INC.
FORM 10-K
TABLE OF CONTENTS
| | | | | | | | | | | |
| TABLE OF CONTENTS |
| | PART I | |
| | | |
| | | |
| | | |
| | | |
| | | |
| | | |
| | | |
| | | |
| | | |
| | | | |
| | PART II | |
| | | |
| | | |
| | [RESERVED] | | |
| | | |
| | | |
| | | |
| | | |
| | | |
| | | |
| | | |
| | | | |
| | PART III | |
| | | |
| | | |
| | | |
| | | |
| | | |
| | | |
| | | | |
| | PART IV | |
| | | |
| | | |
| | | |
| | | | |
| |
| | | | | | | | | | | |
PHILLIPS EDISON & COMPANY DECEMBER 31, 2023 FORM 10-K | | | 1 |
Cautionary Note Regarding Forward-Looking Statements
Certain statements contained in this Annual Report on Form 10-K of Phillips Edison & Company, Inc. (“we,” the “Company,” “our,” or “us”) other than historical facts may be considered forward-looking statements within the meaning of Section 27A of the Securities Act of 1933, as amended (the “Securities Act”), Section 21E of the Securities Exchange Act of 1934, as amended (the “Exchange Act”), and the Private Securities Litigation Reform Act of 1995 (collectively with the Securities Act and the Exchange Act, the “Acts”). These forward-looking statements are based on current expectations, estimates, and projections about the industry and markets in which we operate, and beliefs of, and assumptions made by, management of our company and involve uncertainties that could significantly affect our financial results. We intend for all such forward-looking statements to be covered by the applicable safe harbor provisions for forward-looking statements contained in the Acts. Such forward-looking statements generally can be identified by the use of forward-looking terminology such as “may,” “will,” “can,” “expect,” “intend,” “anticipate,” “estimate,” “believe,” “continue,” “possible,” “initiatives,” “focus,” “seek,” “objective,” “goal,” “strategy,” “plan,” “potential,” “potentially,” “preparing,” “projected,” “future,” “long-term,” “once,” “should,” “could,” “would,” “might,” “uncertainty,” or other similar words. Readers are cautioned not to place undue reliance on these forward-looking statements, which speak only as of the date this report is filed with the U.S. Securities and Exchange Commission.Commission (“SEC”). Such statements include, but are not limited to,to: (a) statements about our focus, plans, strategies, initiatives, and prospects; (b) statements about the COVID-19 pandemic, including its durationour underwritten incremental yields; and potential or expected impact on our tenants, our business, and our estimated value per share; (c) statements about a reverse stock split, our distributions, share repurchase program, and dividend reinvestment program; and (d) statements about our future results of operations, capital expenditures, and liquidity. Such statements are subject to known and unknown risks and uncertainties, which could cause actual results to differ materially from those projected or anticipated, including, without limitation: (i) changes in national, regional, or local economic climates; (ii) local market conditions, including an oversupply of space in, or a reduction in demand for, properties similar to those in our portfolio; (iii) vacancies, changes in market rental rates, and the need to periodically repair, renovate, and re-let space; (iv) changes in interest rates and the availability of permanent mortgage financing; (v) competition from other available propertiesshopping centers and the attractiveness of properties in our portfolio to our tenants; (vi)(v) the financial stability of our tenants, including, the ability of tenants to pay rent; (vii) changes in tax, real estate, environmental, and zoning laws; (viii) the concentration of our portfolio in a limited number of industries, geographies, or investments; (ix) the effects of the COVID-19 pandemic, including on the demand for consumer goods and services and levels of consumer confidence in the safety of visiting shopping centers as a result of the COVID-19 pandemic; (x) the measures taken by federal, state, and local government agencies and tenants in response to the COVID-19 pandemic, including mandatory business shutdowns, “stay-at-home” orders and social distancing guidelines; (xi) the impact of the COVID-19 pandemic on our tenants andwithout limitation, their ability to pay rent on time or at all, or to renew their leases and, in the case of non-renewal, our ability to re-lease the space at the same or more favorable terms or at all; (xii) the length and severity of the COVID-19 pandemic in the United States; (xiii) the pace of recovery following the COVID-19 pandemic given the current severe economic contraction and increase in unemployment rates; (xiv) our ability to implement cost containment strategies; (xv) our and our tenants’ ability to obtain loans under government programs; (xvi)rent; (vi) our ability to pay down, refinance, restructure, or extend our indebtedness as it becomes due; (vii) increases in our borrowing costs as a result of changes in interest rates and other factors; (viii) potential liability for environmental matters; (ix) damage to our properties from catastrophic weather and other natural events, and the physical effects of climate change; (x) our ability and willingness to maintain our qualification as a real estate investment trust (“REIT”) in light of economic, market, legal, tax, and other considerations; (xi) changes in tax, real estate, environmental, and zoning laws; (xii) information technology security breaches; (xiii) our corporate responsibility initiatives; (xiv) loss of key executives; (xv) the concentration of our portfolio in a limited number of industries, geographies, or investments; (xvi) the economic, political, and social impact of, and uncertainty relating to, pandemics or other health crises; (xvii) our ability to re-lease our properties on the same or better terms, or at all, in the event of non-renewal or in the event we exercise our right to replace an existing tenant; (xviii) the loss or bankruptcy of our tenants; (xix) to the extent we wereare seeking to dispose of properties, in the near term, significantly greater uncertainty regarding our ability to do so at attractive prices or at all; (xviii)(xx) the impact of the COVID-19 pandemicinflation on us and on our business, results of operations, financial condition,tenants; and liquidity; (xix) supply chain disruptions due to the COVID-19 pandemic; and (xx)(xxi) any of the other risks included in this Annual Report on Form 10-K, including those set forth in Part“Part I, Item 1A. Risk Factors.Factors”. Therefore, such statements are not intended to be a guarantee of our performance in future periods.
Except as required by law, we do not undertake any obligation to update or revise any forward-looking statements contained in this Form 10-K.
| | | | | | | | | | | |
PHILLIPS EDISON & COMPANY DECEMBER 31, 2023 FORM 10-K | | | 2 |
ITEM 1. BUSINESS
All references to “Notes” throughout this Annual Report on Form 10-K refer to the footnotes to the consolidated financial statements in “Part II, Item 8. Financial Statements and Supplementary Data”.
Overview
OVERVIEW—Phillips Edison & Company, Inc. (“we,” the “Company,” “PECO,” “our,” or “us”) is an internally-managed, a real estate investment trust (“REIT”) thatfounded in 1991, is one of the nation’s largest owners and operators of omni-channel grocery-anchored shopping centers. Additionally, we operate ana third-party investment management business providing property management and advisory services to third-party owned grocery-anchoredtwo unconsolidated institutional joint ventures, in which we have partial ownership interests, and one private fund (collectively, the “Managed Funds”). The majority of our revenues are lease revenues derived from our real estate.estate investments. Our portfolio primarily consists of well-occupied, grocery-anchored neighborhood and community shopping centers havinganchored by the #1 or #2 grocer tenants by sales within their respective formats by trade area. As of December 31, 2023, our portfolio was 97.4% leased. Our tenants, who we refer to as “Neighbors,” are a mix of national, regional, and local retailers providingthat primarily provide necessity-based goods and services. OurWe believe our locations are in fundamentally strong demographic markets throughout the United States provideStates. Our brick and mortar assets positively contribute to our Neighbors’ omni-channel retailers with a solution forstrategies and act as the last mile of delivery.delivery solution.
We were formed as a Maryland corporation in October 2009 and have elected to be taxed as a REIT for U.S. federal income tax purposes. Substantially all of our business is conducted through Phillips Edison Grocery Center Operating Partnership I, L.P. (“Operating(the “Operating Partnership”), a Delaware limited partnership formed in December 2009. We are a limited partner of the Operating Partnership, and our wholly-owned subsidiary, Phillips Edison Grocery Center OP GP I LLC, is the sole general partner of the Operating Partnership. The majority
As of our revenues are lease revenues derived from ourDecember 31, 2023, we wholly-owned 281 shopping centers. Additionally, we owned real estate investments. In October 2017, we internalized our management structure through the acquisition of Phillips Edison Limited Partnership (“PELP”).
In November 2018, we completed a merger (the “Merger”) with Phillips Edison Grocery Center REIT II, Inc. (“REIT II”), a public non-traded REIT that was advised and managed by us (see Note 4). In the same month, we also contributed or sold 17 properties14% interest in the formation of Grocery Retail Partners I LLC (“GRP I”), a joint venture with Northwestern Mutual Life Insurance Company, (“Northwestern Mutual”); see Note 7 for more detail.
On October 31, 2019, we completed a merger with Phillips Edison Grocery Center REIT III, Inc. (“REIT III”), a public non-traded REIT that was advised and managed by us, in a transaction valued at approximately $71 million. This resulted in the acquisition of three properties, as well as a 10% equity interest in Grocery Retail Partners II LLC (“GRP II”), a joint venture with Northwestern Mutual that owns three properties. On October 1, 2020, GRP I acquired GRP II, and our ownership in the combined entity was adjusted to approximately 14%; see Notes 5 and 7 for more detail.
As of December 31, 2020, we wholly-owned 283 real estate properties. Additionally, wewhich owned 20 shopping centers. We also owned a 20% equity interest in Necessity Retail Partners (“NRP”), a joint venture with an affiliate of TPG Real Estate that owned five properties, and a 14% interestEstate. In May 2022, we sold the final property in GRP I, which owned 20 properties.our NRP joint venture. In total, our managed portfolio of wholly-owned propertiesshopping centers and those owned through our unconsolidated joint ventures comprisesventure comprised approximately 34.4 million square feet located in 31 states.
Business Objectives and Strategies
BUSINESS OBJECTIVES AND STRATEGIES—Our business objective is to own, operate, and manage well-occupied grocery-anchored shopping centers which generatein order to deliver long-term growth and value creation to all stakeholders while acting as a responsible corporate citizen. We seek to achieve this objective by generating cash flows, income growth, and capital appreciation to create value for and continue paying distributions to, our stockholders. We seek to achieve this objectivestockholders through our focus on core operations; strategic growthdifferentiated and portfolio management; andfocused strategy, responsible balance sheet management. Altogether, ourmanagement, and integrated operating platform. Our goal is to providecreate great grocery-anchored shopping experiences and improve our communities, one center at a time.
In response to the COVID-19 pandemicDifferentiated and the resultingFocused Strategy—We believe our differentiated strategy drives strong financial and operational performance and future growth, including showing resiliency during economic downturn, we implemented various initiatives to mitigate the negative impactdown cycles.
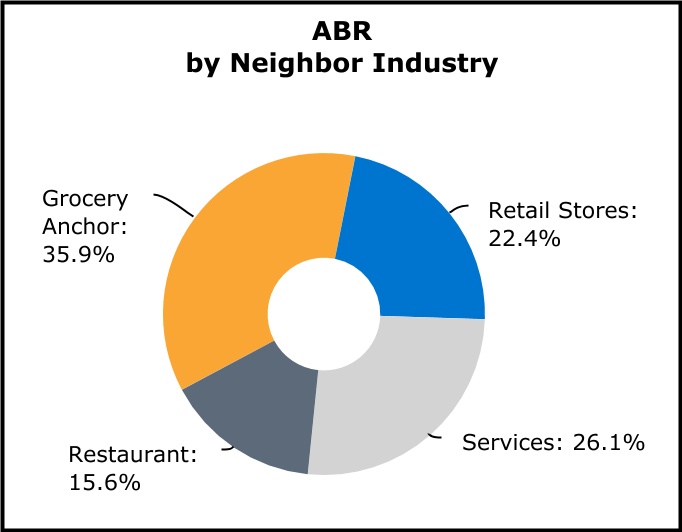
•Omni-Channel Grocery-Anchored Neighborhood Shopping Centers—We focus on our operations. Although we continue to address challenges brought aboutinvesting in omni-channel shopping centers anchored by the pandemic,#1 or #2 grocer by sales within their respective trade area. As of December 31, 2023, for our overall business objectiveswholly-owned shopping centers, 85% of our annualized base rent (“ABR”) was generated from shopping centers anchored by such grocers. Grocery-anchored shopping centers generally have strong foot traffic leading to high demand for leasing Neighbor spaces, which enhances our ability to increase lease revenue. These centers provide an attractive last-mile solution to residents of our communities by providing “Buy Online, Pick-Up in Store”, curbside pick-up, and strategies remain principally unchanged.grocery delivery options. We target investments with attractive going-in yields and growth potential in markets with demographic profiles that support necessity-based retail concepts.
Focus on Core Operations•Neighbor-Base—As of December 31, 2023, approximately 70% of our ABR, including the pro rata portion attributable to properties owned through our unconsolidated joint venture, is generated from Neighbors providing necessity-based goods and services. We believe our focus on necessity-based goods and services retailers limits our operating fundamentals will continueexposure to provide stabilitydistressed retailers and ultimately generate growth in our portfolioallows us to demonstrate resiliency during times of real estate and optimize returns for our stockholders.economic down cycles.
•Property Management Services—Targeted Portfolio—We add value by overseeing all aspectsfocus on owning centers in trade areas with favorable demographics that align with those of operations at our properties. Our property managers maintain a local presenceleading grocers. Further, we seek to invest in ordersmall format centers where leasing activity is concentrated in smaller tenant spaces and limits exposure to effectively manage costs while maintaining a pleasant, clean, and safe environment where retailers can be successful and customers canhigh-risk retailers. We believe that smaller centers provide higher growth potential because they enjoy a great shopping experience.positive leasing dynamic as: (i) we believe retailer demand is strongest for inline space, which contains less than 10,000 square feet of gross leasable area; (ii) there is less exposure to big box retailers, which we believe have higher risk because they require larger capital expenditures and have fewer leasing opportunities; and (iii) smaller centers typically have lower capital expenditures. We utilizeintend to grow our centralized accounting, billing,portfolio through targeted acquisitions that align with our differentiated and tax review platform to facilitate our daily operations.focused strategy.
•Leasing—Our national footprintMacroeconomic Trends—We continually monitor the macroeconomic environment to identify trends that are positive for the growth potential of experienced leasing professionals is dedicated toour shopping centers. We believe recent trends such as: (i) creating the optimal merchandising mix at our centers, (ii) increasing occupancy at our centers, (iii) maximizing rental income through capitalizing on below-market rent opportunities by means of increasing rents as leases expire, and (iv) executing leases with contractual rent increases. In responsepopulation shifts to the COVID-19 pandemic,Sun Belt and from urban to suburban communities in certain geographic locations; (ii) the continued presence of hybrid work initiatives; (iii) the importance of last mile delivery; (iv) low supply and lack of new construction coupled with high occupancy; and (v) continued consumer resilience will create additional leasing demand and growth opportunities for our capital expenditures were prioritized in part to support new leasing activity.shopping centers.
StrategicBalance Sheet Management Positioned for External Growth and Portfolio Management—Our goalstrategy is to identify growth opportunities withingrow our portfolio of properties as well through the use ofby pursuing acquisitions in a disciplined manner, while maintaining an attractive leverage profile and flexible balance sheet to preserve our existing management resources and knowledge.
•Development and Redevelopment—Our team of seasoned professionals identifies opportunities to unlock additional value at our properties through investments in our development and redevelopment program. Our strategies include outparcel development, footprint reconfiguration, anchor repositioning, and anchor expansion, among others. While our capital expenditures were prioritized in 2020 to support new leasing activity, we continue to look for development and redevelopment opportunities to increase the overall yield and value of our properties, which will allow us to generate higher returns for our stockholders while creating great grocery-anchored shopping center experiences.
| | | | | | | | | | | |
PHILLIPS EDISON & COMPANY DECEMBER 31, 2023 FORM 10-K | | | 3 |
•Investment Management—Our investment management business provides comprehensive real estate, asset management, and accounting and support services to third-party funds. Although the uncertainty surrounding the financial and real estate markets as a result of the COVID-19 pandemic has slowed the pace of joint venture and other growth opportunities, we believe that our investment management business will expand our platform and relationships while preserving our balance sheet and will afford us the opportunity to consider acquisitions in the future similar to what we have done historically.
Responsible Balance Sheet Management—Our strategy is to improve and monitor our leverage ratios and debt maturities and dispose of certain shopping centers in order to maximize our potential future valuation in the public equity markets.grade rating. We believe this is a critical part of maintaining access to multiple forms of capital, including common stock, unsecured debt, bank debt, and mortgage debt, to maximize availability and minimize our overall cost of capital.
•Disposition Program—Funding External Growth—We are actively evaluatinghave identified a target market of approximately 5,800 centers across the United States and believe we have a long runway for external growth. We believe our portfolio for opportunitieseffective shelf registration statement and At-the-Market offering (“ATM”) program allow us to disposeaccess equity and debt capital, further enhancing our financial flexibility and external growth potential. We believe our investment grade balance sheet and our available liquidity of assets that no longer meet$606.6 million under our growth and investment objectives due to stabilization or perceived future risk. These dispositionssenior unsecured revolving credit facility provide us with the financial capacity to pursue external growth initiatives in an accretive and prudently capitalized manner. Additionally, our investment management platform enables us to source and manage incremental sources of capital to fund acquisitions, fund redevelopment opportunities at owned properties, and reduce our leverage.through unconsolidated joint ventures, which provide us incremental fee revenue opportunities.
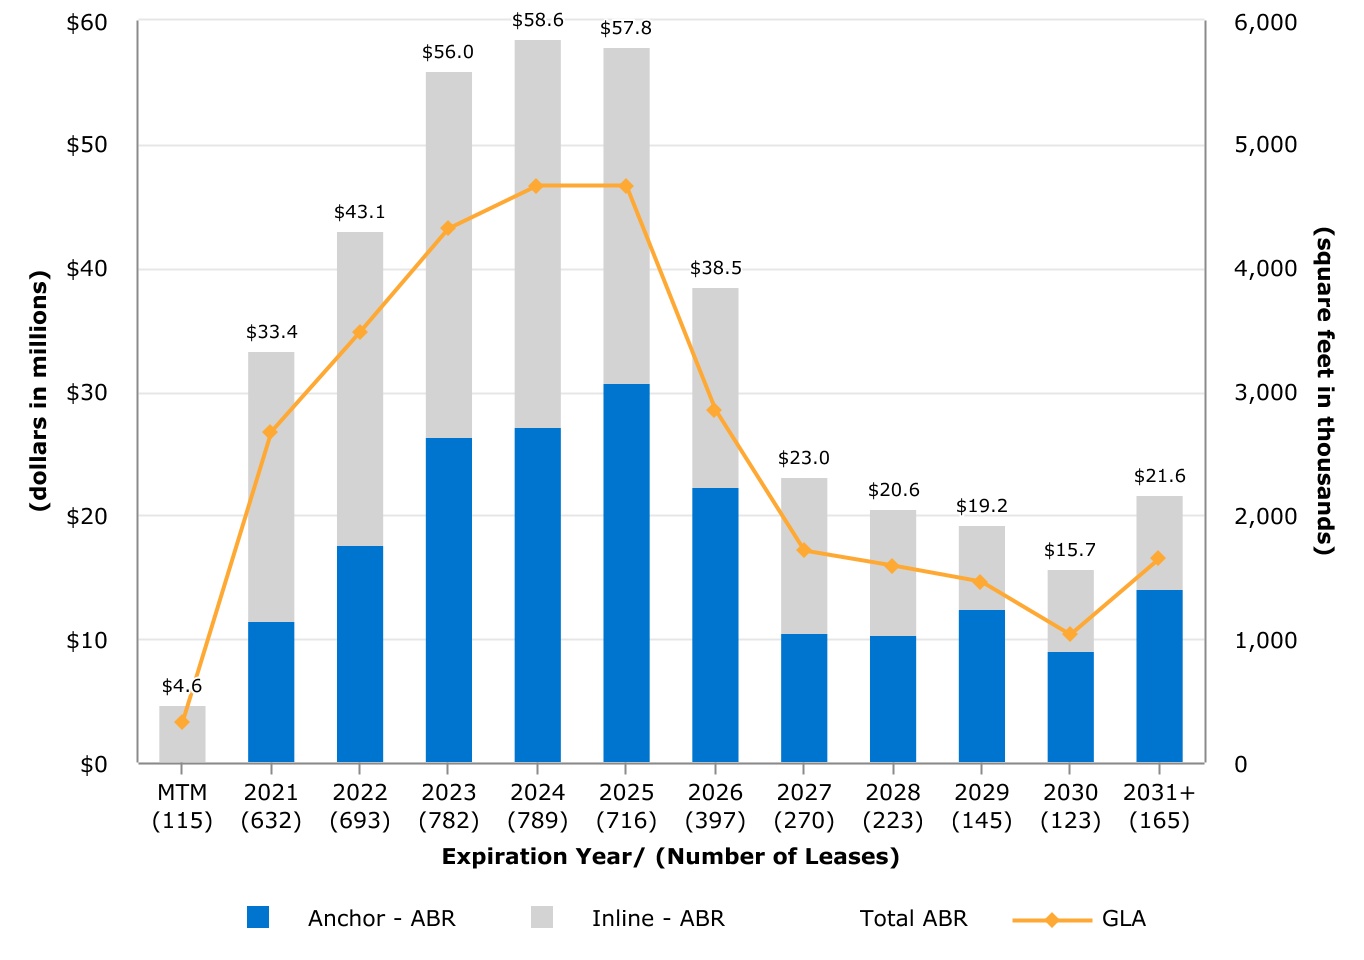
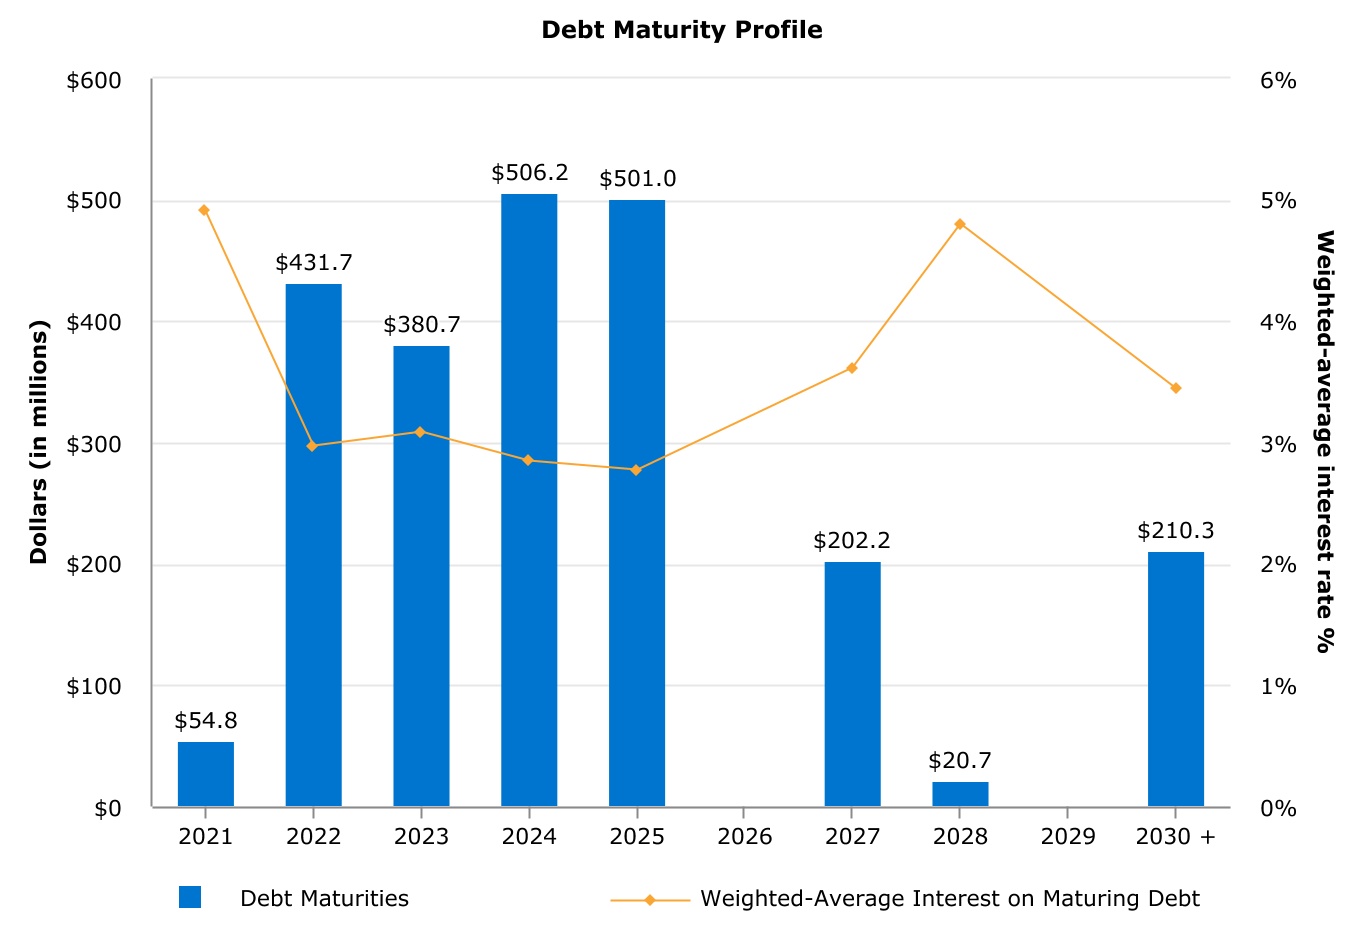
•Debt Maturity Profile—Profile—We believe we have prioritized maintainingmaintained an appropriately staggered debt maturity profile with no meaningful maturities in 2024, which will position us for long-term growth. Our outstanding debt obligations are composed primarily of (i) unsecured debt, including term loans, senior notes, and a revolving credit facility, and (ii) secured mortgage debt. Certain
•Investment Grade Ratings—Our current investment grade ratings are Baa3 (Outlook: Stable) with Moody’s Investors Services and BBB- (Outlook: Positive) with S&P Global Ratings.
Internal Growth Through Our Integrated Operating Platform—We believe our internally-staffed, vertically-integrated operating platform to lease and manage omni-channel grocery-anchored neighborhood shopping centers will continue to provide stability and generate growth in our existing portfolio, optimizing returns for our stockholders.
•Leasing—Our national footprint of experienced and Locally Smart™ leasing professionals is dedicated to increasing net operating income (“NOI”) at our centers by: (i) maximizing rental rates while improving the credit profile of our upcoming unsecured debt agreementsrental revenue; (ii) attracting high-quality retailers while improving the merchandising mix; (iii) capitalizing on below-market rent opportunities by increasing rents as leases expire; (iv) executing leases with contractual rent increases; and (v) increasing occupancy.
•Property Management Services—We believe we add value by overseeing all aspects of operations at our properties. Our Locally Smart™ property managers effectively manage costs while maintaining a pleasant, clean, and safe environment where retailers can be successful and customers can enjoy a great shopping experience. Further, we provide our Neighbors with responsive customer service and marketing tools, as well as other sophisticated solutions, such as a centralized accounting, billing, and tax review platform to facilitate our daily operations.
•Development and Redevelopment—Our team of seasoned professionals identify opportunities to unlock additional value at our properties through investments in our outparcel and redevelopment program. Our strategies include optionsoutparcel development, footprint reconfiguration, anchor repositioning, and anchor expansion, among others. These projects create opportunities to extend their maturities,increase the overall yield and value of our properties, which provide flexibility in managing refinancing through changing market conditions.we believe will allow us to deliver long-term growth and value creation to all stakeholders while creating great grocery-anchored shopping center experiences.
Competition
COMPETITION—Our business is inherently competitive. We believe that the competition is highly fragmented. We are subject to significantconsiderable competition in both seeking real estate investmentsshopping centers to acquire and tenants (whom we refer to as a “Neighbor” orattracting and retaining Neighbors in our “Neighbors”).existing shopping centers. We compete with many third parties engaged in real estate investment activities includinginstitutional investors and other REITs, specialty finance companies, savingsas well as local, regional, and loan associations, banks, insurance companies, mutual funds, institutional investors, investment banking firms, hedge funds,national owner-operators for property acquisitions. We compete with other properties including malls, lifestyle centers, power centers, community centers, neighborhood centers, free-standing retail, and other persons. Somemain street retail in attracting new Neighbors and retaining existing Neighbors when their leases expire. The competition for Neighbors varies depending on the characteristics of these competitors, including larger REITs, have greater financial resources than we doeach property.
We believe that the principal competitive factors in attracting and may potentially enjoy competitive advantages that primarily result from increased accessretaining Neighbors are the quality of the grocery anchor, location, trade area demographics, tenant mix, physical condition of the shopping center, and occupancy cost. These factors combine to capital, lower costdetermine the level of capital,occupancy and enhanced operating efficiencies. In addition to these entities, we also face competition from smaller landlords and companies at the local level in seeking Neighbors to occupy our shopping centers. This further increases the number of competitors we have and the type of competitionrental rates that we faceare able to achieve at our properties. We believe that the quality of our omni-channel grocery-anchored shopping centers enables us to compete effectively for Neighbors. We believe that we maintain a competitive position in seekingthe acquisition market due to execute on our business objectivestrack record and strategies.positive reputation.
Segment Data
SEGMENT DATA—Our principal business is the ownership and operation of community and neighborhood shopping centers. We do not distinguish our principal business or group our operations by geography or size for purposes of measuring performance. Accordingly, we have presented our results as a single reportable segment.
Government Regulation
COMPLIANCE WITH GOVERNMENT REGULATION—Compliance with various governmental regulations has an impact on our business, including our capital expenditures, earnings, and competitive position. The impact of these governmental regulations can be material to our business. We incur costs to monitor and take action to comply with governmental regulations that are applicable to our business, which include, among others: federal securities laws and regulations; REIT and other tax laws and regulations; environmental and health and safety laws and regulations; local zoning, usage, and other regulations relating to real property; and the Americans with Disabilities Act of 1990, as amended (“ADA”). See “Part I, Item“Item 1A. Risk Factors” of this filing on Form 10-Kbelow for a discussion of material risks to us (including those, to the extent material to our competitive position, relating to governmental regulations) and see “Part II, Item 7. Management’s Discussion and Analysis of Financial Condition and Results of Operations” of this filing on Form 10-K, together with our consolidated financial statements and accompanying footnotes, for a discussion of material information relevant to an assessment of our financial condition and results of operations (including, to the extent material, the effects that compliance with governmental regulations may have upon our capital expenditures and earnings).
Human Capital
As of December 31, 2020,2023, we are not aware of any environmental conditions or material costs of complying with environmental or other government regulations that would have a material adverse effect on our overall business. However, it
| | | | | | | | | | | |
PHILLIPS EDISON & COMPANY DECEMBER 31, 2023 FORM 10-K | | | 4 |
is possible that we are not aware of, or may become subject to potential environmental liabilities or material costs of complying with government regulations due to changes in requirements or otherwise that could be material to our business.
CORPORATE RESPONSIBILITY AND SUSTAINABILITY—Our corporate responsibility and sustainability program (“CRSP”), which we also refer to as our “PECO-ECO Promise™”, is designed to align with our corporate mission and strategic initiatives. With a mission of “creating great omni-channel grocery-anchored shopping center experiences and improving our communities, one shopping center at a time”, we strive to have a positive impact on all our stakeholders. Our CRSP is overseen by our full Board of Directors (the “Board”) reflecting our comprehensive approach to strong governance. In addition, we have a dedicated director liaison, Ms. Silfen, providing oversight to our PECO-ECO Team members based on her significant experience in energy innovation and sustainability. Our PECO-ECO Team is led by our General Counsel, who provides regular updates to the full Board on our CRSP.
Our PECO-ECO Promise™ is based on four pillars that are guided by our mission and our goal of driving long-term value creation for our stakeholders: our People and Culture, Environmental Stewardship, Community, and Oversight and Ethics:
PEOPLE AND CULTURE—At PECO, our associates are our greatest asset. We believe in fostering a work environment where every team member feels valued, respected, and empowered. To achieve this, our key areas of focus include:
•Engagement and Satisfaction: We empower our associates through personalized coaching and annual stock awards, intended to foster a resilient culture that has earned PECO the title of a Top Place to Work for seven consecutive years by Cincinnati Enquirer. By granting 100% of eligible associates service-based restricted stock units in PECO, we empower and encourage our associates to think and operate like owners, which we believe drives better decision making and strengthens our culture.
•Learning and Development: We are committed to continuous learning and the professional development of our associates. Established in 2007, PECO University is a hub for learning and development of our associates, encompassing our online learning platform, PECO U online, leadership development, mentoring programs, and more. PECO’s commitment to continuous learning includes an annual talent management process, workshops on development goal plans, and the PECO Mentor Match program, an internal mentoring program.
•Health and Well-Being: We strive to create a workplace that prioritizes the well-being of our associates. Our “Beyond Benefits” wellness program is integral to our Company’s culture and is designed to address our associates’ emotional, physical, and financial well-being. The program includes sponsoring wellness activities and challenges designed to improve the overall health of our associates.
•Inclusion and Belonging: At PECO, fostering connection and inclusivity is a core commitment of our culture. We established three associate-led resource groups, PECO Multicultural Opportunities, Resources & Education (“PECO MORE”), PECO Networking Opportunities for Women (“PECO NOW”), and PECO Connect to help further diversity, inclusion, collaboration, and communication throughout the Company.
As of December 31, 2023, we had approximately 300290 associates located in 20 states across the country, with concentrations in our corporate offices in Cincinnati, Ohio; Park City, Utah; and Atlanta, Georgia. Approximately 55%51% of our workforce is female and 45%49% is male. Our senior leadership team is 19%18% female and 81%82% male, while manager roles and above are approximately 40%39% female and 60%61% male. For the year ended December 31, 2020,2023, our overall turnover rate was 17%8%, with 6% voluntary turnover, beingcompared to our previous three year overall turnover average of 13%, with 10%. voluntary turnover.
Our human capital objectives include, as applicable, identifying, recruiting, retaining, developing, incentivizing, and integrating our existing and prospective employees. We provide associates with competitive salaries, bonuses, incentives, and opportunities for equity ownership. One unique aspectENVIRONMENTAL STEWARDSHIP—Environmental stewardship is an important component of our compensation philosophycommitment to sustainability, encapsulated in our PECO-ECO Promise™. We recognize that sustainable practices are not only beneficial for the environment but also important for our business success and contributing to the well-being of the communities we operate in. A key component of our sustainable practices is that each associatefocused on improving operational efficiencies and resource reductions within our portfolio. Our initiatives include calculating our Scope 1 and Scope 2 GHG emissions, participating in the organization, regardlessGlobal Real Estate Sustainability Benchmark ("GRESB") Real Estate Assessment, pursuing energy efficiency, developing on-site solar projects, and installing electric vehicle (“EV”) charging stations. We are also focused on attaining sustainable property certifications, implementing water conservation measures, and managing waste effectively.
We are proud to highlight the milestones below, as of level or tenure, has the opportunity for equity grants on an annual basis. During the year ended December 31, 2020,2023, in our ongoing sustainability journey:
•Exterior Lighting: Completed the retrofit of 98.1% of our wholly-owned portfolio to LED parking lot lighting, moving closer to our goal of retrofitting 100% of eligible associates received grantsour portfolio by 2025.
•Renewable Energy: Installed 14 solar array systems to date.
•Water Conservation: Conserved over 62 million gallons of service-based restricted stock unitswater in 2023 (through September) through the Company. Upon vesting, associates will receive actual sharesimplementation of common stock, which we believe encouragesxeriscaping and our employees to think like owners“Smart Water Control Program”, generating cost savings of the Company.over $200,000.
We recognize the importance of the health, safety, and environmental well-being•EV Charging Stations: Installed EV chargers at 17.7% of our employees,eligible properties to date.
•Waste Management: Achieved a waste diversion rate of approximately 26.0% at properties with a landlord-controlled waste program.
•Building Certifications: Secured WELL Health-Safety recertification for our company headquarters in Cincinnati, Ohio and are committedInstitute of Real Estate Management Certified Sustainable Property Certifications at 163 properties in 2023, bringing the total number of properties with certifications to providing172.
COMMUNITY—Through our mission of “creating great omni-channel grocery-anchored shopping center experiences and maintainingimproving our communities, one shopping center at a healthy work environment.time”, we strive to actively engage with our Neighbors and the local communities that we serve. Our 2020 all-associate engagement survey, which had an 89% participation rate, showed 84% overall engagement,focus is on being Locally Smart™ and 91%understanding the unique needs of associates reported they felt proud to tell people where they work, compared to an 80% global average as reported by Qualtrics XM, while 93% of associates felt they could be successful at the Company. In 2020, we were named a top place to work by the Cincinnati Enquirer for the fourth year in a row. We also won special recognition each of the past four years, including being recognized for “clued-in senior management” in 2020.
Our strong culture andcommunity. This commitment to inclusion is reinforced by two associate-led business resource groups: PECO MORE (Multicultural Opportunities, Resources & Education),our communities extends to its physical spaces, with initiatives like Front Row to Go® providing convenient curbside pickup for our local shoppers, and PECO NOW (Networking Opportunitiesa retailer mix that offers storefront windows and drive-through stores for Women). PECO MORE isadditional convenience for local shoppers.
| | | | | | | | | | | |
PHILLIPS EDISON & COMPANY DECEMBER 31, 2023 FORM 10-K | | | 5 |
dedicated
Our community commitment is also evident in our initiatives like our PECO Community Partnership, an award-winning, associate-led program that encourages community involvement and connects our associates to furthering diversitycauses they care about. In 2023, PECO Community Partnership sponsored 15 community service events and inclusion withincontributed over 440 service hours, including a volunteer day in partnership with Keep Cincinnati Beautiful at Green Man Park where 69 associates participated in a park cleanup and revitalization project.
PECO's partnership with communities also extends to disaster relief efforts, exemplified by our Incident Response Team. This team provides support to Neighbors and communities impacted by disasters, such as Hurricane Idalia in August 2023, as part of PECO's commitment to being there for its Neighbors and communities during challenging times.
OVERSIGHT AND ETHICS—Our governance framework guides our decision-making and accountability. Supported by an experienced executive management team, we maintain a robust system of corporate governance policies, designed to foster an ethical culture committed to the Company, the communities thatPECO-ECO Promise™ and to driving our goal of creating long-term value.
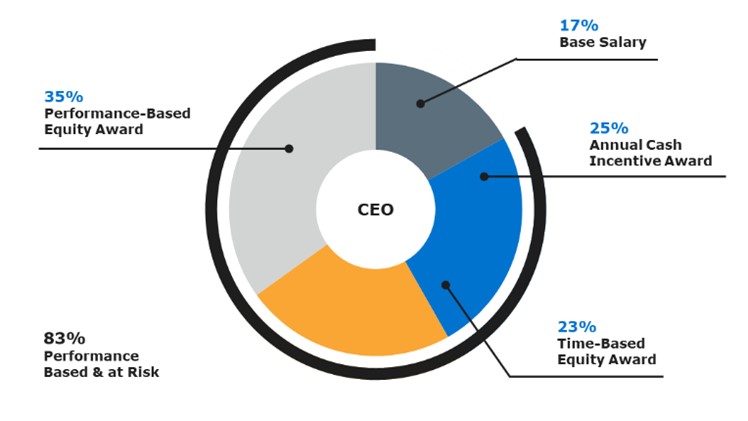
We believe our corporate governance structure closely aligns our interests with those of our stockholders. Notable features include: (i) each of our directors is subject to election annually, and our charter prevents us from classifying our Board unless we serve, and the commercial real estate industry. In June 2020, PECO MORE hosted “BEGIN” conversations, a series of 23 small group discussions, attended by approximately 50%receive prior stockholder approval; (ii) we have opted out of the workforce, designedbusiness combination and control share acquisition statutes in the Maryland General Corporation Law; (iii) we do not have a stockholder rights plan; (iv) we have a Stock Ownership Policy that requires each non-associate director, our CEO, and each other named executive officer to “begin” dialogue around diversity, inclusion,own a certain amount of our equity; and equity. PECO MORE’s programming has focused on providing education, raising awareness, and hosting events around Veterans Day,(v) our bylaws provide that our stockholders may alter or replace our bylaws upon the Chinese New Year, Black History Month, Pride Month, and Women’s History Month. PECO NOW’s missionaffirmative vote of a majority of the votes entitled to be cast.
We operate under the oversight of our Board, which is to provide leadership opportunities to women through advocacy, support, scholarship, and development. PECO NOW was recognized for excellencecomprised of nine directors, seven of whom meet the independence criteria set forth by the International CouncilNasdaq Global Select Market (“Nasdaq”) and U.S. Securities and Exchange Commission (“SEC”) rules. Our Audit, Nominating and Governance (“N&G”), and Compensation Committees are comprised solely of Shopping Centers in 2016.
“Always Keep Learning” is oneindependent directors who complete annual self-assessments. Our Board has adopted Corporate Governance Guidelines that, among other things, establish criteria and expectations for our directors, and our N&G Committee has responsibility for annually evaluating our Board and each of its committees. We are cognizant of “overboarding” and none of our core values. Each year, we sponsor an annual meeting that provides associatesdirectors serve on more than two other public company boards. We are compliant with the ability to hear directly from company leadershipNasdaq’s Board Diversity Rule and have three female directors and two directors who are members of underrepresented racial or ethnic minorities.
More information about our performance, goals, and strategy. We host external speakers to facilitate discussions on relevant industry topics, and educational roundtables are led by internal subject-matter experts. This annual learning event provides associates with the information needed to understand how their roles and responsibilities directly impact the Company’s performance and growth. Associates are also kept apprised of company information through town halls conducted throughout the year. While the COVID-19 pandemic impacted many planned learning opportunities in 2020, we focused on providing managers with skills-based training to coach their associates and navigate through tough conversations while addressing virtual team challenges. We look forward to returning to a regular learning cycle in 2021, adapted for the COVID-19 environment, with an inaugural virtual Core Values Week in February 2021.
Our “Beyond Benefits” wellness program focusesCRSP is available on our associates’ emotional, physical,website and financial well-being. Together with an external partner, we offer a full wellness platform providing Health Savings Account incentive contributionsin our Corporate Responsibility Report, which are not incorporated by reference and should not be considered part of this Annual Report on Form 10-K.
INFORMATION ABOUT OUR EXECUTIVE OFFICERS—The following table details information for biometric screening results, preventive care,our executive officers as of December 31, 2023:
| | | | | | | | | | | |
| Name | Age | Title | Joined PECO |
| Jeffrey S. Edison | 63 | Chairman & Chief Executive Officer | Co-Founder |
Devin I. Murphy(1) | 63 | President | 2013 |
Robert F. Myers(1) | 51 | Chief Operating Officer & Executive Vice President | 2003 |
| John P. Caulfield | 43 | Chief Financial Officer, Executive Vice President & Treasurer | 2014 |
| Tanya E. Brady | 56 | General Counsel, Executive Vice President & Secretary | 2013 |
(1)Devin Murphy stepped down as President effective December 31, 2023 and activity-based items such as step counts, nutrition tracking, and workout activity minutes. To keep remote associates engaged during 2020, we held six wellness challenges where individuals and teams could earn incentive dollars for winning competitions that tracked steps, workout activity, and water consumption. Such efforts have facilitated a continued dedication to wellness and preventive care among our associates, and as a result, we were recognized by Healthiest Employers LLC as onebecame Managing Director of the “Healthiest EmployersInvestment Management effective January 1, 2024 through his retirement date of Ohio” in 2020.June 30, 2024. Effective January 1, 2024, Robert Myers became President.
We are also committed to ensuring that the operations at all of our properties and corporate offices are conducted in a manner that safeguards the health and safety of employees, Neighbors, contractors, and members of the public who are either present at, or affected by, operations at these locations. This commitment increased in importance in 2020 due to the unique challenges posed by the COVID-19 pandemic, and we continue to work with all of our stakeholders to mitigate the pandemic’s impact.
In addition to the increased number of activity-based individual and team challenges, we maintained a proactive approach to all aspects of well-being during the COVID-19 pandemic, with a specific focus on mental health, including offering virtual Meditation and Mindfulness sessions throughout the spring and summer of 2020. We also maintained an intranet page with information related to COVID-19, work-from-home tips, and services available to associates, such as multiple free virtual fitness app memberships and a mental health, meditation and mindfulness app. Our communications team sent out regular company-wide emails to keep associates connected with helpful practical information, as well as fun topics such as healthy recipes and photos of our associates’ at-home office spaces and new “co-workers.”
Corporate Headquarters
CORPORATE HEADQUARTERS—Our corporate headquarters, located at 11501 Northlake Drive, Cincinnati, Ohio 45249, is where we conduct a majority of our management, leasing, construction, and investment activities, as well as administrative functions such as accounting and finance. Additionally, we maintain two regional offices located in Atlanta, Georgia and Park City, Utah.
Access to Company Information
ACCESS TO COMPANY INFORMATION—We electronically file our Annual Report on Form 10-K, Quarterly Reports on Form 10-Q, Current Reports on Form 8-K, Proxy and Information statements, and all amendments to those reports with the U.S. Securities and Exchange Commission (“SEC”).SEC. The SEC maintains an Internetinternet site at www.sec.gov that contains the reports, proxy and information statements, and other information regarding issuers, including ours that are filed electronically.
We make available, free of charge, the Annual Report on Form 10-K, Quarterly Reports on Form 10-Q, Current Reports on Form 8-K, and all amendments to those reports on our website, www.phillipsedison.com.www.phillipsedison.com. These reports are available as soon as reasonably practicable after such material is electronically filed with or furnished to the SEC. Also available on our website are (i) our Corporate Governance Guidelines, (ii) our Code of Business Conduct and Ethics, and (iii) our Whistleblower Policy. In the event of any changes to these documents, revised copies will be made available on our website. We intend to disclose on our website under “Investors - Governance - Governance Overview” any amendment to, or waiver of, any provisions of our Code of Business Conduct and Ethics applicable to the directors and/or officers of the Company that would otherwise be required to be disclosed under the rules of the SEC or Nasdaq. We also disclose, and intend to disclose, on our website under “Investors” material nonpublic information to comply with our disclosure obligations under Regulation FD. The contents of our website are not incorporated by reference.
| | | | | | | | | | | |
PHILLIPS EDISON & COMPANY DECEMBER 31, 2023 FORM 10-K | | | 6 |
ITEM 1A. RISK FACTORS
You should specifically consider the following material risks in addition to the other information contained in this Annual Report on Form 10-K. The occurrence of any of the following risks might have a material adverse effect on our business, operating results, financial condition, and cash flows. Additional risks and uncertainties not presently known to us or that we currently deem immaterial also may impair our business, operating results, financial condition, and cash flows.
Summary of Risk Factors
An investment in our common stock involves risks. You should carefully consider the risks summarized here and described more fully below.
Risks Related to Our StructureBusiness and an Investment in UsOperations
Because no public trading market for•Our revenues and cash flows will be affected by the success and economic viability of our shares currently existsanchor Neighbors.
•A significant percentage of our revenues is derived from non-anchor Neighbors, and our share repurchase program is limited, it is difficult for ournet income and ability to make distributions to stockholders may be adversely affected if these Neighbors are not successful.
•We may be unable to sell their shares and, if our stockholders are able to sell their shares, it may beshopping centers when desired, at a discount to the public offeringan attractive price, at which stockholders originally purchased the shares.
There is no public trading market for our shares of common stock. Until our shares of common stock are listed on a stock exchange, if ever, stockholders may not sell their shares unless the buyer meets the applicable suitability and minimum purchase standards.
Under the share repurchase program (“SRP”), any shares repurchased will be at the lesser of $5.75 per share or the most recent estimated value per share (“EVPS”) of our common stock. Currently, standard repurchases under the SRP are suspended and repurchases are limited to those upon a stockholder’s qualifying death, disability, or determination of incompetence. In addition, we may choose to repurchase fewer shares than have been requested in any particular month to be repurchased under the SRP, or none at all, in our discretion at any time. We may repurchase fewer shares than have been requested to be repurchased due to lack of readily available funds because of adverse market conditions beyond our control, the need to maintain liquidity for our operations, or because we have determined that paying off our debt or investing in real property or other investments or other items is a better use of our capital than repurchasing our shares. The Board of Directors (“Board”) may modify, suspend, or terminate the SRP at any time upon 30 days’ notice. In addition, because we are not required to authorize the recommencement of a suspension of the SRP, including the currently suspended standard repurchases, within any specified period of time, we may effectively terminate the SRP, or a portion of it, by suspending it indefinitely. As a result, your ability to have your shares repurchased by us may be limited, and at times, you may not be able to liquidate your investment.
Therefore, it is difficult for our stockholders to sell their shares promptly or at all. If a stockholder is able to sell his or her shares, it may be at a discount to the EVPS and to the public offering price at which the stockholder originally purchased the shares. It is also likely that our shares would not be accepted as the primary collateral for a loan. Because of the illiquid nature of our shares, investors should purchase our shares only as a long-term investment and be prepared to hold them for an indefinite period of time.
The EVPS of our common stock is based on a number of assumptions that may not be accurate or complete and the methodology used to calculate the EVPS is also subject to a number of limitations.
On May 6, 2020, our Board decreased the EVPS of our common stock to $8.75 based substantially on the estimated market value of our portfolio of real estate properties and our third-party investment management business as of March 31, 2020. The decrease was primarily driven by the negative impact of the COVID-19 pandemic on our non-grocery Neighbors resulting from social distancing and “stay-at-home” guidelines and the uncertainty of the duration and full effect on the overall economy. We engaged a third-party valuation firm to provide a calculation of the range in EVPS of our common stock as of March 31, 2020, which reflected certain balance sheet assets and liabilities as of that date. Previously, our EVPS was $11.10, based substantially on the estimated market value of our portfolio of real estate properties and our third-party investment management business as of March 31, 2019. Our EVPS is based upon a number of estimates and assumptions that may not be accurate or complete. Different parties with different assumptions and estimates could derive a different EVPS, and this difference could be significant. The EVPS is not audited and does not represent a determination of the fair value of our assets or liabilities based on accounting principles generally accepted in the United States (“GAAP”), nor does it represent a liquidation value of our assets and liabilities, the price a third party would pay to acquire us, the price at which our shares of common stock would trade in secondary markets, or the amount at which our shares of common stock would trade on a national securities exchange.
Accordingly, we can give no assurance that, (i) our shares would trade at or near the EVPS if listed on a national securities exchange; (ii) a stockholder would be able to resell his or her shares at the EVPS; (iii) a stockholder would ultimately realize distributions per share equal to the EVPS upon a liquidation of our assets and settlement of our liabilities; (iv) a stockholder would receive an amount per share equal to the EVPS upon a sale of the Company; (v) a third party would offer the EVPS in an arm’s-length transaction to purchase all or substantially all of our shares of common stock; (vi) another independent third-party appraiser or third-party valuation firm would agree with our EVPS; or (vii) the methodologies used to calculate our EVPS would be acceptable to the Financial Industry Regulatory Authority (“FINRA”) for use on customer account statements or that the EVPS will satisfy the applicable annual valuation requirements under the Employee Retirement Income Security Act of 1974 (“ERISA”).
Furthermore, we have not made any adjustments to the valuation of our EVPS for the impact of other transactions occurring subsequent to May 6, 2020, including, but not limited to, (i) acquisitions or dispositions of assets; (ii) the issuance of common stock under the DRIP; (iii) Net Operating Income (“NOI”) earned and dividends declared (see “Part II, Item 7. Management’s Discussion and Analysis of Financial Condition and Results of Operations - Non-GAAP Measures - Same-Center Net Operating Income” of this filing on Form 10-K for the calculation of NOI); (iv) the repurchase of shares; and (v) changes in leases, tenancy, or other business or operational changes. The value of our shares of common stock will fluctuate over time in response to developments related to individual real estate assets, the management of those assets, and changes in the real estate and finance markets. Because of, among other factors, the high concentration of our total assets in real estate and the number of shares of our common stock outstanding, changes in the value of individual real estate assets or changes in valuation assumptions could have a very significant impact on the value of our shares of common stock. The EVPS also does not take into account any disposition costs or fees for real estate properties, debt prepayment penalties that could apply upon the prepayment of certain of our debt obligations, or the impact of restrictions on the assumption of debt. Accordingly, the EVPS may or may not be an accurate reflection of the fair market value of our stockholders’ investments and will not likely represent the amount of net proceeds that would result from an immediate sale of our assets.
The actual value of shares that we repurchase under the SRP, or any future tender offer, may be substantially less than the price we are willing to pay under this program.
Under the SRP, we repurchase eligible shares at the lesser of $5.75 per share or the most recent EVPS. The price we pay is likely to differ from the price at which a stockholder could resell his or her shares or the price at which our shares would trade if listed on a national securities exchange. Thus, when we repurchase shares of our common stock, the repurchase may be dilutive to our remaining stockholders.
If we do not successfully implement a liquidity transaction, stockholders may have to hold their investment for an indefinite period.
There currently is no public trading market for shares of our common stock, and our charter does not contain a requirement to effect a liquidity event by a specific date. In the future, our Board may consider various forms of liquidity, each of which is referred to as a liquidity event, including, but not limited to, (i) the listing of shares of common stock on a national securities
exchange; (ii) the sale of all or substantially alla property could cause significant tax payments.
•We face competition and other risks in pursuing acquisition opportunities that could increase the cost of our assets; (iii) a sale or merger that would provide stockholders with cashsuch acquisitions and/or securities of a publicly traded company; or (iv) the dissolution of the Company. However, there can be no assurance that we will cause a liquidity eventlimit our ability to occur. If we do not pursue a liquidity transaction, shares of our common stock may continue to be illiquidgrow, and stockholders may, for an indefinite period of time, be unable to easily convert their investment to cash and could suffer losses on their investments.
If we pay distributions from sources other than our cash flows from operations, we may not be able to sustaingenerate expected returns or successfully integrate completed acquisitions into our distribution rate,existing operations.
•We share ownership of our unconsolidated joint ventures and do not have exclusive decision-making power, and as such, we are unable to ensure that our objectives will be pursued.
•Our real estate assets may decline in value and be subject to significant impairment losses, which may reduce our net income.
•We actively reinvest in our portfolio in the form of development and redevelopment projects, which have inherent risks that could adversely affect our financial condition, cash flows, and results of operations.
•The continued shift in retail sales towards e-commerce may adversely affect our financial condition, cash flows, and results of operations.
•Actual incremental unlevered yields for our development and redevelopment projects may vary from our underwritten incremental unlevered yield range.
•Pandemics, epidemics, or other health crises may have fewer funds available for investment in properties and other assets,a negative effect on our and our stockholders’ overall returns may be reduced.Neighbors’ businesses, financial condition, results of operations, cash flows, and liquidity.
Risks Related to Our organizational documents permit us to pay distributions from any source without limit (other than those limits set forth under Maryland law). To the extent we fund distributions from borrowings, we willIndebtedness and Liquidity
•We have fewer funds available for investment in real estate propertiessubstantial indebtedness, and other real estate-related assets, and our stockholders’ overall returns may be reduced. At times, we may need to borrow funds to pay distributions,incur additional indebtedness, including recourse debt, in the future, which could increase the costsadversely affect our business, financial condition, and ability to operatemake distributions to our business. Furthermore, if we cannot cover our distributions with cash flows from operations, we may be unablestockholders.
Risks Related to sustain our distribution rate.
We cannot assure stockholders that we will be able to continue paying distributions at the rate currently paid.
We intend to evaluate distributions on a monthly basis throughout 2021. It is possible that stockholders may not receive distributions equivalent to those previously paid by us for various reasons, including the following:Our Corporate Structure and Organization
•we may not have enough cash to pay such distributions due to changes inWe and our cash requirements, indebtedness, capital spending plans, operating cash flows, or financial position;
•decisions on whether, when, and in what amounts to make any future distributions will remain at all times entirely atconsolidated subsidiary, the discretion of the Board, which reserves the right to change our distribution practices at any time and for any reason;
•our Board may elect to retain cash to maintain or improve our credit ratings; and
•the amount of distributions that our subsidiaries may distribute to us may be subject to restrictions imposed by state law, state regulators, and/or the terms of any current or future indebtedness that these subsidiaries may incur.
Stockholders have no contractual or other legal right to distributions that have not been authorized by the Board and declared by the Company.
We have agreed to nominate Mr. Jeffrey S. Edison, Chairman of the Board and Chief Executive Officer, to our Board for each annual meeting through 2027.
As part of the transaction to acquireOperating Partnership, entered into tax protection agreements with certain real estate assets and the third party investment management business of PELP in exchange for stock and cash (the “PELP transaction”), we agreed to nominate Mr. Jeffrey S. Edison to the Board for each annual meeting through 2027, subject to certain terminating events. As a result, it is possible that Mr. Edison may continue to be nominated as a director in circumstances when the independent directors would not otherwise have nominated or elected him.
The Operating Partnership’s limited partnership agreement grants certain rights and protections to the limitedprotected partners, which may prevent or delay a change of control transaction that might involve a premium price for our shares of common stock.
The Operating Partnership’s limited partnership agreement grants certain rights and protections to the limited partners, including granting them the right to consent to a change of control transaction. Furthermore, Mr. Edison currently has voting control over approximately 57% of the Operating Partnership’s limited partnership units (exclusive of those owned by us) and therefore could have a significant influence over votes on change of control transactions.
The tax protection agreement, during its term, could limit the Operating Partnership’s ability to sell or otherwise dispose of certain propertiesshopping centers and may require the Operating Partnership to maintain certain debt levels that otherwise would not be required to operate its business.
WeRisks Related to Our REIT Status and Other Tax Risks
•Failure to qualify as a REIT would cause us to be taxed as a regular C corporation, which would substantially reduce funds available for distributions to stockholders.
•If the Operating Partnership entered intofails to qualify as a tax protection agreement at the closing of the PELP transaction, pursuant to which if the Operating Partnership: (i) sells, exchanges, transfers, conveys or otherwise disposes of certain properties in a taxable transactionpartnership for a period of ten years commencing on the closing; or (ii) fails, prior to the expiration of such period, to maintain minimum levels of indebtedness that would be allocable to each protected partner forU.S. federal income tax purposes, we would fail to qualify as a REIT and would suffer adverse consequences.
•Complying with REIT requirements may cause us to forgo otherwise attractive opportunities or alternatively, failsliquidate otherwise attractive investments.
Risks Related to offer such protected partners the opportunityBusiness Continuity
•We and our Neighbors face risks relating to guarantee specific typescybersecurity attacks, which could cause loss of the Operating Partnership’s indebtednessconfidential information and other disruptions to business operations, and compliance with new laws and regulations regarding cybersecurity and privacy may result in ordersubstantial costs and may decrease cash available for distributions.
Risks Related to enable such partners to continue to defer certain tax liabilities, the Operating Partnership will indemnify each affected protected partner against certain resulting tax liabilities. Therefore, although itOur Common Stock
•The market price and trading volume of shares of our common stock may be involatile.
•The number of shares of our common stock available for future issuance or sale could adversely affect the stockholders’ best interest for us to cause the Operating Partnership to sell, exchange, transfer, convey or otherwise disposemarket price of one of these properties, it may be economically prohibitive for us to do so during the ten year protection period because of these indemnity obligations. Moreover, these obligations may require us to cause the Operating Partnership to maintain more or different indebtedness than we would otherwise require for our business. As a result, the tax protection agreement will, during its term, restrict our ability to take actions or make decisions that otherwise would be in our best interests.common stock.
| | | | | | | | | | | |
PHILLIPS EDISON & COMPANY DECEMBER 31, 2023 FORM 10-K | | | 7 |
If the fiduciary of an employee benefit plan subject to ERISA (such as a profit sharing, Section 401(k) or pension plan) or an owner of a retirement arrangement subject to Section 4975 of the Internal Revenue Code (such as an individual retirement account) fails to meet the fiduciary and other standards under ERISA or the Internal Revenue Code (“IRC”) as a result of an investment in our stock, the fiduciary could be subject to penalties and other sanctions.
There are special considerations that apply to employee benefit plans subject to ERISA (such as profit sharing, Section 401(k) or pension plans) and other retirement plans or accounts subject to Section 4975 of the IRC (such as an individual retirement account or “IRA”) that are investing in shares of our common stock. Fiduciaries and IRA owners investing the assets of such a plan or account in our common stock should satisfy themselves that:
•
the investment is consistent with their fiduciary and other obligations under ERISA and the IRC;
•the investment is made in accordance with the documents and instruments governing the plan or IRA, including the plan’s or account’s investment policy;
•the investment satisfies the prudence and diversification requirements of Sections 404(a)(1)(B) and 404(a)(1)(C) of ERISA and other applicable provisions of ERISA and the IRC;
•the investment in our shares, for which no public market currently exists, is consistent with the liquidity needs of the plan or IRA;
•the investment will not produce an unacceptable amount of “unrelated business taxable income” for the plan or IRA;
•our stockholders will be able to comply with the requirements under ERISA and the IRC to value the assets of the plan or IRA annually; and
•the investment will not constitute a prohibited transaction under Section 406 of ERISA or Section 4975 of the IRC.
Failure to satisfy the fiduciary standards of conduct and other applicable requirements of ERISA and the IRC may result in the imposition of civil and criminal penalties and could subject the fiduciary to claims for damages or for equitable remedies, including liability for investment losses, and if an investment in our shares constitutes a prohibited transaction under ERISA or the IRC, the fiduciary or IRA owner who authorized or directed the investment may be subject to the imposition of excise taxes with respect to the amount invested. In addition, the investment transaction must be undone. In the case of a prohibited transaction involving an IRA owner, the IRA may be disqualified as a tax-exempt account, and all of the assets of the IRA may be deemed distributed and subjected to tax. ERISA plan fiduciaries and IRA owners should consult with counsel before making an investment in our common stock.
If stockholders invested in our shares through an IRA or other retirement plan, they may be limited in their ability to withdraw required minimum distributions.
If stockholders established an IRA or other retirement plan through which they invested in our shares, federal law may require them to withdraw required minimum distributions (“RMDs”) from such plan in the future as they may not be able to have their shares repurchased at a time in which they need liquidity to satisfy the RMD requirements under their IRA or other retirement plan. A repurchase, if available, may be at a price that is less than the price at which the shares were initially purchased or the current EVPS. If stockholders fail to withdraw RMDs from their IRA or other retirement plan, they may be subject to certain tax penalties.
Risks Related to the Retail Industry
The ongoing COVID-19 pandemic has had,Our Business and is expected to continue to have, a negative effect on our and our Neighbors’ businesses, financial condition, results of operations, cash flows, and liquidity.
In March 2020, the World Health Organization declared COVID-19 a global pandemic. The COVID-19 pandemic has caused, and is expected to continue to cause, significant disruptions to the United States and global economy and has contributed to significant volatility and negative pressure in financial markets. The global impact of the outbreak is continually evolving and, as additional cases of the virus are identified, many countries, including the United States, reacted by instituting quarantines, restrictions on travel, and/or mandatory closures of businesses. Certain states and cities, including where our properties are located, also reacted by instituting quarantines, restrictions on travel, “shelter-in-place” or “stay-at-home” rules, restrictions on types of businesses that may continue to operate, and/or restrictions on the types of construction projects that may continue. In May 2020, many state and local governments began lifting, in whole or in part, the “stay-at-home” mandates, effectively removing or lessening the limitations on travel and allowing many businesses to reopen in full or limited capacity.
The COVID-19 pandemic has impacted our business and financial performance, and we expect this impact to continue. Our retail and service-based Neighbors depend on in-person interactions with their customers to generate unit-level profitability, and the COVID-19 pandemic has decreased, and may continue to decrease, customers’ willingness to frequent, and mandated “shelter-in-place” or “stay-at-home” orders may prevent customers from frequenting our Neighbors’ businesses, which may result in their inability to maintain profitability and make timely rental payments to us under their leases or to otherwise seek lease modifications or to declare bankruptcy. At the peak of the pandemic-related closure activity, for our wholly-owned properties and those owned through our joint ventures, our temporary closures reached approximately 2,100 Neighbors, or 37% of all Neighbor spaces, totaling 27% of our annualized base rent (“ABR”) and 22% of our gross leasable area (“GLA”). As of March 8, 2021, 98% of our occupied Neighbor spaces, totaling 99% of our ABR and GLA, are open for business. Certain Neighbors remain temporarily closed, have since closed after reopening, are limiting the number of customers allowed in their stores, or have modified their operations in other ways that may impact their profitability, either as a result of government mandates or self-elected efforts to reduce the spread of COVID-19. These actions could result in increased permanent store closings and could reduce the demand for leasing space in our shopping centers and result in a decline in average rental rates on expiring leases.
While most of our Neighbors have reopened, we cannot presently determine how many of the Neighbors that remain closed will reopen, or whether a portion of those that have reopened will be required by government mandates to temporarily close again or will encounter financial difficulties that require them to close permanently. We believe substantially all Neighbors,
including those that were required to temporarily close under governmental mandates, are contractually obligated to continue with their rent payments as documented in our lease agreements with them. However, we believe it is best to begin negotiation of relief only once a Neighbor has reopened and made payments toward rent and recovery charges accrued. As of March 8, 2021, inclusive of our prorated share of properties owned through our joint ventures, we have executed payment plans with our Neighbors agreeing to defer approximately $8.7 million in rent and related charges, and we granted rent abatements totaling approximately $4.2 million. These payment plans and rent abatements represented approximately 2% and 1% of portfolio ABR, respectively. The weighted-average remaining term over which we expect to receive payment on executed payment plans is approximately twelve months. We are in negotiations with additional Neighbors, which we believe will lead to more Neighbors repaying their past due charges. As of March 8, 2021, we have collected approximately 93% of rent and recoveries billed during the second quarter of 2020, approximately 95% of rent and recoveries billed during the third quarter, and over 95% of rent and recoveries billed during the fourth quarter. Further, as of March 8, 2021, our collections for January and February 2021 were approximately 94% in total. In the event of any default by a Neighbor under its lease agreement or relief agreement, we may not be able to fully recover, and/or may experience delays in recovering and additional costs in enforcing our rights as landlord to recover, amounts due to us under the terms of the lease agreement and/or relief agreement. Additionally, certain Neighbors have declared bankruptcy as a result of the effects of the pandemic. As of December 31, 2020, we have several Neighbors currently in bankruptcy proceedings who continue to occupy space in our centers where we have not yet received notice that the lease has been assumed or rejected, representing an exposure of less than 1% of our total ABR.
Moreover, the ongoing COVID-19 pandemic, restrictions intended to prevent and mitigate its spread, resulting consumer behavior, and the economic slowdown or recession could have additional adverse effects on our business, including with regards to:
•the ability and willingness of our Neighbors to renew their leases upon expiration, our ability to re-lease the properties on the same or better terms in the event of nonrenewal or in the event we exercise our right to replace an existing Neighbor, and obligations we may incur in connection with the replacement of an existing Neighbor, particularly in light of the adverse impact to the financial health of many retailers and service providers that has occurred and continues to occur as a result of the COVID-19 pandemic and the significant uncertainty as to when and the conditions under which certain potential Neighbors will be able to operate physical retail locations in the future;
•a potential sustained or permanent increase in online shopping instead of shopping at physical retail properties, thereby reducing demand for space in our shopping centers and possible related reductions in rent or increased costs to lease space;
•the adverse impact of current economic conditions on the market value of our real estate portfolio and our third-party investment management business, and consequently on the estimated value per share of our common stock;
•the adverse impact of the current economic conditions on our ability to effect a liquidity event at an attractive price or at all in the near term and for a potentially lengthy period of time;
•the financial impact and continued economic uncertainty that could continue to negatively impact our ability to pay distributions to our stockholders and/or to repurchase shares;
•to the extent we were seeking to sell properties in the near term, significantly greater uncertainty regarding our ability to do so at attractive prices or at all;
•anticipated returns from development and redevelopment projects, which have been prioritized to support the reopening of our Neighbors and new leasing activity, or deferred if possible;
•the broader impact of the severe economic contraction due to the COVID-19 pandemic, the resulting increase in unemployment that has occurred in the short-term and its effect on consumer behavior, and negative consequences that will occur if these trends are not reversed in a timely way;
•state, local, or industry-initiated efforts, such as a rent freeze for Neighbors or a suspension of a landlord’s ability to enforce evictions, which may affect our ability to collect rent or enforce remedies for the failure to pay rent;
•severe disruption and instability in the global financial markets or deteriorations in credit and financing conditions, which could make it difficult for us to access debt and equity capital on attractive terms, or at all, and impact our ability to fund business operations and activities and repay liabilities on a timely basis;
•our ability to pay down, refinance, restructure, or extend our indebtedness as it becomes due, and our potential inability to comply with the financial covenants of our credit facility and other debt agreements, which could result in a default and potential acceleration of indebtedness and impact our ability to make additional borrowings under our credit facility or otherwise in the future; and
•the potential negative impact on the health of our personnel, particularly if a significant number of them and/or key personnel are impacted, and the potential impact of adaptations to our operations in order to protect our personnel, such as remote work arrangements, could introduce operational risk, including but not limited to cybersecurity risks, and could impair our ability to manage our business.
We temporarily suspended stockholder distributions beginning with the April 2020 distribution, and subsequently reinstated distributions beginning December 2020, in an effort to preserve cash due to current economic uncertainty, and we may choose to do the same in the future. Additionally, we may in the future choose to pay distributions in shares of our common stock rather than solely in cash, which may result in our stockholders having a tax liability with respect to such distributions that exceed the amount of cash received, if any.
While the rapid developments regarding the COVID-19 pandemic preclude any prediction as to its ultimate adverse impact, the current economic, political, and social environment presents material risks and uncertainties with respect to our and our Neighbors’ business, financial condition, results of operations, cash flows, liquidity, and ability to satisfy debt service obligations.
The continued shift in retail sales towards e-commerce may adversely affect our revenues and cash flows.
Retailers are increasingly affected by e-commerce and changes in customer buying habits, which have been further accelerated as a result of the COVID-19 pandemic, including the delivery or curbside pick-up of items ordered online. Retailers are considering these e-commerce trends when making decisions regarding their brick and mortar stores and how they will compete and innovate in a rapidly changing e-commerce environment. Many retailers in our shopping centers provide services or sell goods that are unable to be performed online (such as haircuts, massages, and fitness centers) or that have historically been less likely to be purchased online (such as grocery stores, restaurants, and coffee shops); however, the continuing increase in e-commerce sales in all retail categories (including online orders for immediate delivery or pickup in store) may cause retailers to adjust the size or number of retail locations in the future or close stores. Our grocer Neighbors are incorporating e-commerce concepts through home delivery or curbside pickup, which could reduce foot traffic at our centers. This shift may adversely affect our occupancy and rental rates, which would affect our revenues and cash flows. Changes in shopping trends as a result of the growth in e-commerce may also affect the profitability of retailers that do not adapt to changes in market conditions. These conditions may adversely impact our results of operations and cash flows if we are unable to meet the needs of our Neighbors or if our Neighbors encounter financial difficulties as a result of changing market conditions. While we devote considerable effort and resources to analyze and respond to Neighbor trends, Neighbor and consumer preferences, and consumer spending patterns, we cannot predict with certainty what future Neighbors will want, what future retail spaces will look like, or how much revenue will be generated at traditional brick and mortar locations. If we are unable to anticipate and respond promptly to trends in the market (such as space for a drive through or curbside pickup), our occupancy levels and rental rates may decline.
Risks Related to Real Estate Investments and Operations
Adverse economic, regulatory, market, and real estate conditions may adversely affect our financial condition, operating results, and cash flows.
Our portfolio is predominantly comprised of neighborhood grocery-anchored shopping centers, and during the year ended December 31, 2020, our holdings in Florida and California accounted for 12.5% and 10.4%, respectively, of our ABR (including our wholly-owned portfolio as well as the prorated portion of properties owned through our joint ventures). Therefore, our performance is subject to risks associated with owning and operating neighborhood grocery-anchored shopping centers, and may be further subject to additional risk as a result of the geographic concentration noted above. Such risks include, but are not limited to: (i) changes in national, regional, and local economic climates or demographics; (ii) competition from other available properties and e-commerce, and the attractiveness of our properties to our Neighbors; (iii) increased competition for real estate assets targeted by our investment strategies; (iv) adverse local conditions, such as oversupply or reduction in demand for similar properties in an area and changes in real estate zoning laws that may reduce the desirability of real estate in an area; (v) vacancies, changes in market rental rates, and the need to periodically repair, renovate, and re-lease space; (vi) ongoing disruption and/or consolidation in the retail sector, the financial stability of our Neighbors and the overall financial condition of our Neighbors, including their ability to pay rent and expense reimbursements; (vii) increases in operating costs, including common area expenses, utilities, insurance and real estate taxes, which are relatively inflexible and generally do not decrease if revenue or occupancy decreases; (viii) increases in the costs to repair, renovate, and re-lease space; (ix) changes in interest rates and the availability of financing, which may render the sale or refinance of a property or loan difficult or unattractive; (x) earthquakes, tornadoes, hurricanes, wildfires, or other natural disasters, civil unrest, terrorist acts, or acts of war, which may result in uninsured or underinsured losses; (xi) epidemics, pandemics, or other widespread outbreaks or resulting public fear that disrupt the businesses of our Neighbors causing them to fail to pay rent on time or at all; and (xii) changes in laws and governmental regulations, including those governing usage, zoning, the environment, and taxes. These and other factors could adversely affect our financial condition, operating results, and cash flows.
Our real estate assets may decline in value and be subject to significant impairment losses, which may reduce our net income.
Our real estate properties are carried at cost less depreciation unless circumstances indicate that the carrying value of these assets may not be recoverable. We routinely evaluate whether there are any impairment indicators, including property operating performance, property occupancy trends, and actual marketing or listing price of properties being targeted for disposition, such that the value of the real estate properties (including any related tangible or intangible assets or liabilities) may not be recoverable. If, through our evaluation, we determine that a given asset exhibits such indicator, we then compare the current carrying value of the asset to the estimated undiscounted cash flows that are directly associated with the use and ultimate disposition of the asset. Our estimated cash flows are based on several key assumptions, including rental rates, costs of Neighbor improvements, leasing commissions, anticipated holding periods, and assumptions regarding the residual value upon disposition, including the estimated exit capitalization rate. These key assumptions are subjective in nature and may differ materially from actual results. Changes in our disposition strategy or changes in the marketplace may alter the holding period of an asset or asset group, which may result in an impairment loss and such loss may be material to our financial condition or operating performance. To the extent that the carrying value of the asset exceeds the estimated undiscounted cash flows, an impairment loss is recognized equal to the excess of carrying value over fair value.
The fair value of real estate assets is subjective and is determined through the use of comparable sales information and other market data if available. These subjective assessments have a direct effect on our net income because recording an impairment charge results in an immediate negative adjustment to net income, which may be material. During the years ended December 31, 2020 and 2019, we incurred impairment charges of $2.4 million and $87.4 million, respectively, related to real estate assets currently under contract or actively marketed for sale at a disposition price that was less than the carrying value. We have recorded such impairment charges as we have been selling non-core assets to improve the quality of our portfolio. We continue to sell non-core assets and may potentially recognize impairments in future quarters. Accordingly, there can be no assurance that we will not record additional impairment charges in the future related to our assets.
Our revenues and cash flows will be affected by the success and economic viability of our anchor Neighbors.
Anchor Neighbors (a Neighbor occupying 10,000 or more square feet) occupy large stores in our shopping centers, pay a significant portion of the total rent at a property, and contribute to the success of other Neighbors by attracting shoppers to the property. Our revenues and cash flows may be adversely affected by the loss of revenues and additional costs in the event a significant anchor Neighbor: (i) becomes bankrupt or insolvent; (ii) experiences a downturn in its business; (iii) materially defaults on its lease; (iv) decides not to renew its lease as it expires; (v) renews its lease at lower rental rates and/or requires tenant improvements; or (vi) renews its lease but reduces its store size, which results in down-time and additional tenant improvement costs to us to re-lease the space. Some anchors have the right to vacate their space and may prevent us from re-tenanting by continuing to comply and pay rent in accordance with their lease agreement. Vacated anchor space, including space owned by the anchor, can reduce rental revenues generated by the shopping center in other spaces because of the loss of the departed anchor's customer drawing power. In the event that we are unable to re-lease the vacated space to a new anchor Neighbor in such situations, we may incur additional expenses in order to re-model the space to be able to re-lease the space to more than one Neighbor.
If a significant Neighbor vacates a property, co-tenancy clauses in select lease contracts may allow other Neighbors to modify or terminate their rent or lease obligations. Co-tenancy clauses have several variants: (i) they may allow a Neighbor to postpone a store opening if certain other Neighbors fail to open their stores; (ii) they may allow a Neighbor to close its store prior to lease expiration if another Neighbor closes its store prior to lease expiration; or (iii) they may allow a Neighbor to pay reduced levels of rent until a certain number of Neighbors open their stores within the same shopping center.
The leases of some anchor Neighbors may permit the anchor Neighbor to transfer its lease to another retailer. The transfer to a new anchor Neighbor could cause customer traffic in the retailshopping center to decrease and thereby reduce the potential income generated by that retailshopping center. A lease transfer to a new anchor Neighbor could also allow other Neighbors to make reduced rental payments or to terminate their leases.
A significant percentage of our revenues is derived from non-anchor Neighbors, and our net income and ability to make distributions to stockholders may be adversely affected if these Neighbors are not successful.
A significant percentage of our revenues is derived from non-anchor Neighbors. Such Neighbors, some of which may be more vulnerable to negative economic conditions as they typically have more limited resources than anchor Neighbors. Significant Neighbor distress across our portfolio could adversely affect our financial condition, operating results of operations, and cash flows.flows, and our ability to service our debt and make distributions to our stockholders. A property may incur vacancies either by the expiration of a Neighbor lease, the continued default of a Neighbor under its lease, or the early termination of a lease by a Neighbor. If vacancies continue for a long period of time, we may suffer reduced revenues resulting in less cash available to distribute to stockholders. In order to maintain Neighbors,occupancy, we may have to offer inducements, such as free rent and tenant improvements, to compete for attractive Neighbors. If we are unable to attract the right type or mix of non-anchor Neighbors intoin our shopping centers, our revenues and cash flows may be adversely affected.centers. In addition, if we are unable to attract additional or replacement Neighbors, the resale value of the property could be diminished, even below our cost to acquire the property,acquisition costs, because the market value of a particular property depends principally upon the value of the cash flowflows generated by the leases associated with that property. Such a reduction on the resale value of a property could also reduce the value of our stockholders’ investments.
We face considerable competition in the leasing market and may be unable to renew leases or re-lease space as leases expire. Consequently, we may be required to make rent or other concessions and/or incur significant capital expenditures to retain and attract Neighbors, which could adversely affect our financial condition, operatingcash flows, and results and cash flows.of operations.
There are numerous shopping venues, including other shopping centers and e-commerce, that compete with our portfolio in attracting and retaining retailers. This competition may hinder our ability to attract and retain Neighbors, leading to increased vacancy rates, reduced rents, and/or increased capital investments. For leases that renew, rental rates upon renewal may be lower than current rates. For those leases that do not renew, we may not be able to promptly re-lease the space on favorable terms or with reasonable capital investments.investments, or at all. In these situations, our financial condition, operatingcash flows, and results and cash flowsof operations could be adversely affected. See “Part I, Item 2. Properties” of this filing on Form 10-K for information regarding scheduled lease expirations and leases renewed subsequent to December 31, 2020 and the ABR of new leases signed during 2020.
We may be unable to sell properties when desired, at an attractive price, or at all, and the sale of a property could cause significant income tax payments.
Our properties, including related tangible and intangible assets, represent the majority of our total consolidated assets and they may not be readily convertible to cash. As a result, our ability to sell one or more of our properties, including properties held in joint ventures, in response to changes in economic, industry, or other conditions, may be limited. The real estate market is affected by many factors, such as general economic conditions, availability and terms of financing, interest rates and other factors, including supply and demand for space, that are beyond our control. There may be less demand for lower quality properties that we have identified for ultimate disposition in markets with uncertain economic or retail environments, and where buyers are more reliant on the availability of third party mortgage financing. If we want to sell a property, we can provide no assurance that we will be able to dispose of it in the desired time period or at all, or that the sales price of a property will be attractive at the relevant time or even exceed the carrying value of our investment. Moreover, if a property is mortgaged, we may not be able to obtain a release of the lien on that property without the payment of a substantial prepayment penalty, which may restrict our ability to dispose of the property, even though the sale might otherwise be desirable.
Some of our properties have a low tax basis, which may result in a taxable gain on sale. We intend to utilize tax-deferred exchanges under Section 1031 of the IRC to mitigate taxable income (“Section 1031 Exchanges”); however, there can be no assurance that we will identify exchange properties that meet our investment objectives for acquisitions. In the event that we do not utilize Section 1031 Exchanges, we may be required to distribute the gain proceeds to stockholders or pay income tax, which may reduce our cash flows available to fund our commitments and distributions to stockholders. Moreover, it is possible that future legislation could be enacted that could modify or repeal the laws with respect to Section 1031 Exchanges, which
could make it more difficult or impossible for us to dispose of properties on a tax-deferred basis. The current administration has also indicated its intention to modify the laws with respect to Section 1031 Exchanges in a manner that could make it more difficult or impossible for us to dispose of properties on a tax-deferred basis.
We may be unable to collect balances due from Neighbors in bankruptcy.
The bankruptcy or insolvency of a significant Neighbor or a number of smaller Neighbors may adversely affect our financial condition, cash flows and results of operations, and our ability to pay distributions to our stockholders. Generally, under bankruptcy law, a debtor Neighbor has the legal right to reject any or all of their leases and close related stores. If the Neighbor rejects the lease, we will have a claim against the Neighbor’s bankruptcy estate. Although rent owing for the period between filing for bankruptcy and rejection of the lease may be afforded administrative expense priority and paid in full, pre-bankruptcy arrears and amounts owing under the remaining term of the lease will be afforded general unsecured claim status (absent collateral securing the claim). General unsecured claims are the last claims paid in a bankruptcy, and, therefore, funds may not be available to pay such claims in full. Moreover, amounts owing under the remaining term of the lease will be capped. As a result, it is likely that we would recover substantially less than the full value of any unsecured claims we hold. Additionally, we may incur significant expense to recover our claim and to re-lease the vacated space. In the event that a Neighbor with a significant number of leases in our shopping centers files bankruptcy and rejects its leases, we may experience a significant reduction in our revenues and may not be able to collect all pre-petition amounts owed by the bankrupt Neighbor.
Long-term leases with our Neighbors may not result in fair value over time.
From time to time, we enter into long-term leases with our shopping center Neighbors. Long-term leases do not typically allow for significant changes in rental payments and do not expire in the near term. If we do not accurately judge the potential for increases in market rental rates when negotiating these long-term leases, significant increases in future property operating costs could result in receiving less than fair value from these leases, which would adversely affect our revenues and the funds available for distributions to stockholders.
We may be restricted from re-leasingleasing space to certain Neighbors at our particular shopping centers.retailers.
Some of our leases contain provisions that give a specific Neighborretailer the exclusive right to sell particular types of goods or services within that shopping center. These provisions may limit the number and types of prospective Neighborsretailers to which we are able to lease space in a particular shopping center, which may result in increased costs to find a permissible Neighborretailer and decreased revenues if one or more spaces sit vacant or we have to accept lower rental rates or a less qualified Neighborretailer to fill the space.
| | | | | | | | | | | |
PHILLIPS EDISON & COMPANY DECEMBER 31, 2023 FORM 10-K | | | 8 |
We may be unable to sell shopping centers when desired, at an attractive price, or at all, and the sale of a property could cause significant tax payments.
Our shopping centers, including related tangible and intangible assets, represent the majority of our total consolidated assets, and they may not be readily convertible to cash. As a result, our ability to sell one or more of our shopping centers, including shopping centers held in unconsolidated joint ventures, in response to changes in economic, industry, or other conditions, may be limited. The real estate market is affected by many factors that are beyond our control, including, but not limited to general economic conditions, availability and terms of financing, interest rates, supply and demand for space, and other factors. There may be less demand for lower quality shopping centers that we have identified for ultimate disposition in markets with uncertain economic or retail environments, and where buyers are more reliant on the availability of third-party mortgage financing. If we want to sell a property, we can provide no assurance that we will be able to dispose of it in the desired time period or at all, or that the sale price of a property will be attractive at the relevant time or even exceed the carrying value of our investment. Moreover, if a property is mortgaged, we may not be able to obtain a release of the lien on that property without the payment of a substantial prepayment penalty, which may restrict our ability to dispose of the property, even though the sale might otherwise be desirable.
Some of our shopping centers have a low tax basis, which may result in a taxable gain on sale. We intend to utilize tax-deferred exchanges under Section 1031 of the Internal Revenue Code of 1986, as amended (the “IRC”), to mitigate taxable income (“Section 1031 Exchanges”); however, there can be no assurance that we will identify exchange shopping centers that meet our investment objectives for acquisitions. In the event that we do not utilize Section 1031 Exchanges, we may be required to distribute the gain proceeds to stockholders or pay income tax, which may reduce our cash flows available to fund our commitments and distributions to stockholders. Moreover, it is possible that future legislation could be enacted that could modify or repeal the laws with respect to Section 1031 Exchanges, which could make it more difficult or impossible for us to dispose of shopping centers on a tax-deferred basis.
We face competition and other risks in pursuing acquisition opportunities that could increase the cost of such acquisitions and/or limit our ability to grow, and we may not be able to generate expected returns or successfully integrate completed acquisitions into our existing operations.
We continue to evaluate the market for acquisition opportunities, and we may acquire propertiesshopping centers when we believe strategic opportunities exist. Our ability to acquire propertiesshopping centers on favorable terms and successfully integrate, operate, reposition, or redevelop them is subject to several risks. We may be unable to acquire a desired property because of competition from other real estate investors, including from other well-capitalized REITs and institutional investment funds. Even if we are able to acquire a desired property, competition from such investors may significantly increase the purchase price. We may also abandon acquisition activities after expending significant resources to pursue such opportunities. Once we acquire new properties,shopping centers, these propertiesshopping centers may not yield expected returns for several reasons, including: (i) failure to achieve expected occupancy and/or rent levels within the projected time frame, if at all; (ii) inability to successfully integrate new propertiesshopping centers into existing operations; and (iii) exposure to fluctuations in the general economy, including due to the time lag between signing definitive documentation to acquire a new property and the closing of the acquisition. If any of these events occur, the cost of the acquisition may exceed initial estimates or the expected returns may not achieve those originally contemplated, which could adversely affect our financial condition, operatingcash flows, and results and cash flows.of operations.
We share ownership of our unconsolidated joint ventures and do not have exclusive decision-making power, and as such, we are unable to ensure that our objectives will be pursued.
We have invested capital, and may invest additional capital, in unconsolidated joint ventures instead(instead of owning directly. In these investments,directly acquiring wholly-owned assets), for which we do not have exclusive decision-making power over the development, financing, leasing, management, and other aspects of these investments. As a result, the institutional joint venture partners might have interests or goals that are inconsistent with ours, take action contrary to our interests, or otherwise impede our objectives. These activities are subject to the same risks as our investments in our wholly-owned properties. In addition, these investments and other future similar investments may involve risks that would not be present were a third party not involved, including the possibility that the joint venture partners might become bankrupt, suffer a deterioration in their creditworthiness, or fail to fund their share of required capital contributions. Conflicts arising between us and our partners may be difficult to manage and/or resolve and it could be difficult to manage or otherwise monitor the existing business arrangements.
In addition, unconsolidated joint venture arrangements may decrease our ability to manage risk and implicate additional risks, such as: (i) potentially inferior financial capacity, diverging business goals and strategies and the need for our venture partners’ continued cooperation; (ii) the joint venture partners might become bankrupt, suffer a deterioration in their creditworthiness, or fail to fund their share of required capital contributions; (iii) our inability to take actions with respect to the unconsolidated joint ventures’ activities that we believe are favorable to us if our institutional joint venture partners do not agree; (iii)(iv) our inability to control the legal entities that have title to the real estate associated with the joint ventures; (iv)(v) our lenders may not be easily able to sell our joint venture assets and investments or may view them less favorably as collateral, which could negatively affect our liquidity and capital resources; (v)(vi) our institutional joint venture partners can take actions that we may not be able to anticipate or prevent, which could result in negative impacts on our debt and equity; and (vi)(vii) our institutional joint venture partners’ business decisions or other actions or omissions may result in harm to our reputation or adversely affect the value of our investments.
Our real estate assets may decline in value and be subject to significant impairment losses, which may reduce our net income.
Our real estate properties are carried at cost less depreciation unless circumstances indicate that the carrying value of these assets may not be recoverable. We routinely evaluate whether there are any impairment indicators, including property operating performance, property occupancy trends, and actual marketing or listing price of properties being targeted for disposition, such that the value of the real estate properties (including any related tangible or intangible assets or liabilities) may not be recoverable. If, through our evaluation, we determine that a given asset exhibits one or more such indicators, we then compare the current carrying value of the asset to the estimated undiscounted cash flows that are directly associated with the use and ultimate disposition of the asset. Our estimated cash flows are based on several key assumptions, including rental rates, costs of Neighbor improvements, leasing commissions, anticipated holding periods, and assumptions regarding the residual value upon disposition, including the estimated exit capitalization rate. These key assumptions are subjective in nature and may differ materially from actual results. Changes in our disposition strategy or changes in the marketplace may
| | | | | | | | | | | |
PHILLIPS EDISON & COMPANY DECEMBER 31, 2023 FORM 10-K | | | 9 |
If we set aside insufficient capital reserves, wealter the holding period of an asset or asset group, which may result in an impairment loss and such loss may be requiredmaterial to defer necessary capital improvements.
If we do not have enough reserves for capital to supply needed funds for capital improvements throughoutour financial condition or operating performance. To the lifeextent that the carrying value of the investmentasset exceeds the estimated undiscounted cash flows, an impairment loss is recognized equal to the excess of carrying value over fair value.
The fair value of real estate assets is subjective and is determined through the use of comparable sales information and other market data if available. These subjective assessments have a direct effect on our net income because recording an impairment charge results in a property and there is insufficient cash available from our operations, wean immediate negative adjustment to net income, which may be requiredmaterial. During the year ended December 31, 2023, we incurred no impairment charges. We will continue to defer necessary improvementsevaluate the risk profile of each asset and may potentially recognize impairments in future quarters. Accordingly, there can be no assurance that we will not record impairment charges in the future related to a property, which may cause that property to suffer from a greater risk of obsolescence or a decline in value, or a greater risk of decreased cash flow as a result of fewer potential Neighbors being attracted to the property. If this happens, we may not be able to maintain projected rental rates for affected properties, and our results of operations may be negatively affected.assets.
We actively reinvest in our portfolio in the form of development and redevelopment projects, which have inherent risks that could adversely affect our financial condition, operatingcash flows, and results and cash flows.of operations.
We actively pursue opportunities for outparcel development and existing property redevelopment. Development and redevelopment activities require various government and other approvals for entitlements and any delay in or failure to receive such approvals may significantly delay this process or prevent us from recovering our investment. We may not recover our investment in development or redevelopment projects. We are subject to other risks associated with these activities, including the following risks:following:
•we may be unable to lease developments and redevelopments to full occupancy on a timely basis;
•the occupancy rates and rents of a completed project may not be sufficient to make the project profitable;
•actual costs of a project may exceed original estimates, possibly making the project unprofitable;
•delays in the development or construction process may increase our costs;
•construction cost increases may reduce investment returns on development and redevelopment opportunities;
•we may abandon redevelopment opportunities and lose our investment due to adverse market conditions;
•the size of our development and redevelopment pipeline may strain our labor or capital capacity to complete projects within targeted timelines and may reduce our investment returns;
•a reduction in the demand for new retail space may reduce our future development and redevelopment activities, which in turn may reduce our net operating income; and/or
•changes in the level of future development activity may adversely impact our results from operations by reducing the amount of internal general overhead costs that may be capitalized.
Inflationary pressures, rising interest rates, supply chain disruptions, and labor shortages may exacerbate certain of these risks. If we fail to reinvest in our portfolio or maintain its attractiveness to retailers and consumers, if our capital improvements are not successful, or if retailers or consumers perceive that shopping at other venues (including e-commerce) is more convenient, cost-effective, or otherwise more compelling, our financial condition, operatingcash flows, and results and cash flowsof operations could be adversely affected.
Uninsured losses relating toAdverse economic, regulatory, market, and real property or excessively expensive premiums for insurance coverage could reduce our cash flows and the return on our stockholders’ investments.
We maintain insurance coverage with third-party carriers who provide a portion of the coverage of potential losses, including commercial general liability, fire, flood, extended coverage and rental loss insurance on all of our properties. We currently self-insure a portion of our commercial insurance deductible risk through our captive insurance company. To the extent that our captive insurance company is unable to bear that risk, we may be required to fund additional capital to our captive insurance company or we may be required to bear that loss. As a result, our operating results may be adversely affected.
There are some types of losses, generally catastrophic in nature, such as losses due to wars, acts of terrorism, earthquakes, floods, hurricanes, pollution or environmental matters, that are uninsurable or not economically insurable, or may be insured subject to limitations, such as large deductibles or sublimits. Insurance risks associated with potential acts of terrorism could sharply increase the premiums that we pay for coverage against property and casualty claims. Additionally, mortgage lenders in some cases insist that commercial property owners purchase coverage against terrorism as a condition for providing mortgage loans. Such insurance policies may not be available at reasonable costs, if at all, which could inhibit our ability to finance or refinance our properties. In such instances, we may be required to provide other financial support, either through financial assurances or self-insurance, to cover potential losses. We may not have adequate, or any, coverage for such losses. Changes in the cost or availability of insurance could expose us to uninsured casualty losses. If any of our properties incur a casualty loss that is not fully insured, the value of our assets will be reduced by any such uninsured loss, which may reduce the value of stockholders’ investments. In addition, other than any working capital reserve or other reserves we may establish, we have no source of funding to repair or reconstruct any uninsured property. Also, to the extent we must pay unexpectedly large amounts for insurance, we could suffer reduced earnings that would result in lower distributions to stockholders.
Climate changeestate conditions may adversely affect our business, operating results, financial condition, and cash flows.
Climate change, including the impact of global warming, creates physical and financial risk. Physical risks from climate change include an increase in sea level and changes in weather conditions, such as an increase in storm intensity and severity of weather (e.g. floods, tornadoes, or hurricanes) and extreme temperatures. The occurrence of one or more natural disasters, such as hurricanes, tropical storms, tornadoes, wildfires, floods, and earthquakes (whether or not caused by climate change), could cause considerable damage to our properties, disrupt our operations and negatively affect our financial performance. To the extent any of these events result in significant damage to or closure of one or more of our shopping centers, our operations and financial performance could be adversely affected through lost Neighbors and an inability to lease or re‑lease the space. In addition, these events could result in significant expenses to restore or remediate a property, increases in fuel or other energy costs or a fuel shortage, and increases in the costs of (or making unavailable) insurance on favorable terms if they result in significant loss of property or other insurable damage. In addition, compliance with new or more stringent laws or regulations or stricter interpretations of existing laws may require material expenditures by us. For example, various federal, state, and regional laws and regulations have been implemented or are under consideration to mitigate the effects of climate change caused by greenhouse gas emissions. Among other things, “green” building codes may seek to reduce
emissions through the imposition of standards for design, construction materials, water and energy usage and efficiency, and waste management. Such codes could require us to make improvements to our existing properties, increase the costs of maintaining or improving our existing properties or developing new properties, or increase taxes and fees assessed on us or our properties.
As an owner and/or operator of real estate, we could become subject to liability for environmental violations, regardless of whether we caused such violations, and our efforts to identify environmental liabilities may not be successful.
We could become subject to liability in the form of fines or damages for noncompliance with environmental laws and regulations. These laws and regulations generally govern wastewater discharges; air emissions; the operation and removal of underground and above-ground storage tanks; the use, storage, treatment, transportation and disposal of solid hazardous materials; the remediation of contaminated property associated with the disposal of solid and hazardous materials; and other health and safety-related concerns. U.S. federal, state, and local laws and regulations relating to the protection of the environment may require us, as a current or previous owner or operator of real property, to investigate and clean up hazardous or toxic substances or petroleum product releases at a property or at impacted neighboring properties. Some of these laws and regulations may impose joint and several liability on tenants, owners, or operators for the costs of investigation or remediation of contaminated properties, regardless of fault or the legality of the original disposal. Under various federal, state, and local environmental laws, ordinances, and regulations, a current or former owner or operator of real property may be liable for the cost to remove or remediate hazardous or toxic substances, wastes, or petroleum products on, under, from, or in such property. These costs could be substantial and liability under these laws may attach whether or not the owner or manager knew of, or was responsible for, the presence of such contamination. Even if more than one person may have been responsible for the contamination, each liable party may be held entirely responsible for all of the clean-up costs incurred. We may be subject to regulatory action and may also be held liable to third parties for personal injury or property damage incurred by the parties in connection with any such laws and regulations or hazardous or toxic substances. The costs of investigation, removal or remediation of hazardous or toxic substances, and related liabilities, may be substantial and could materially and adversely affect us. The presence of hazardous or toxic substances, or the failure to remediate the related contamination, may also adversely affect our ability to sell, lease or redevelop a property or to borrow money using a property as collateral.
Although we believe that our portfolio is in substantial compliance with U.S. federal, state and local environmental laws and regulations regarding hazardous or toxic substances, this belief is based on limited testing. Nearly all of our properties have been subjected to Phase I or similar environmental audits. These environmental audits have not revealed, nor are we aware of, any environmental liability that we believe is reasonably likely to have a material adverse effect on us. However, we cannot assure you that: (i) previous environmental studies with respect to the portfolio revealed all potential environmental liabilities; (ii) any previous owner, occupant or tenant of a property did not create any material environmental condition not known to us; (iii) the current environmental condition of the portfolio will not be affected by tenants and occupants, by the condition of nearby properties, or by other unrelated third parties; or (iv) future uses or conditions (including, without limitation, changes in applicable environmental laws and regulations or the interpretation thereof) will not result in environmental liabilities.
Compliance or failure to comply with the Americans with Disabilities Act and fire, safety, and other regulations could result in substantial costs and may decrease cash available for stockholder distributions.
Our properties are or may become subject to the ADA which generally requires that all places of public accommodation comply with federal requirements related to access and use by disabled persons. Compliance with the ADA’s requirements could require the removal of access barriers and noncompliance may result in the imposition of injunctive relief, monetary penalties, or in some cases, an award of damages. While we attempt to acquire properties that are already in compliance with the ADA or place the burden of compliance on the seller or other third party, such as a tenant, we cannot assure stockholders that we will be able to acquire properties or allocate responsibilities in this manner. In addition, we are required to operate the properties in compliance with fire and safety regulations, building codes, and other land use regulations, as they may be adopted by governmental entities and become applicable to the properties. We may be required to make substantial capital expenditures to comply with these requirements, and these expenditures may reduce our net income and may have a material adverse effect on our ability to meet our financial obligations and make distributions to our stockholders.
We and our Neighbors face risks relating to cybersecurity attacks, which could cause loss of confidential information and other disruptions to business operations, and compliance with new laws and regulations regarding cybersecurity and privacy may result in substantial costs and may decrease cash available for distributions.
Our business is at risk from and may be adversely affected by cybersecurity attacks. These attacks could include attempts to gain unauthorized access to our data and/or computer systems to disrupt operations, corrupt data, or steal confidential information. Attacks can be both individual and highly organized attempts by very sophisticated hacking organizations. We may face such cybersecurity attacks through malware, computer viruses, attachments to e-mails, persons inside our organization or persons with access to systems inside our organization, and other significant disruptions of our information technology (IT) systems. The risk of a cybersecurity attack, including by computer hackers, foreign governments, and cyber terrorists, has generally increased as the number, intensity, and sophistication of attempted attacks and intrusions from around the world have increased. The techniques and sophistication used to conduct cyber attacks and breaches of IT systems, as well as the sources and targets of these attacks, change frequently and are often not recognized until such attacks are launched or have been in place for a period of time.
Our IT networks and related systems are essential to the operation of our business and our ability to perform day-to-day operations and, in some cases, may be critical to the operations of certain of our Neighbors. In addition to our own IT systems, we also depend on third parties to provide IT services relating to several key business functions, such as administration, accounting, communications, document management and storage, human resources, payroll, tax, investor relations, and certain finance functions. Our IT systems and those provided by third parties may contain personal, financial, or other information that is entrusted to us by our Neighbors and employees, as well as proprietary PECO information and other
confidential information related to our business. We and such third parties employ a number of measures to prevent, detect, and mitigate these threats, including password protection, firewalls, backup servers, malware detection, intrusion sensors, threat monitoring, user training, and periodic penetration testing; however, there is no guarantee that such efforts will be successful in preventing a cybersecurity attack.
As our reliance on technology has increased, so have the risks posed to our systems, both internal and those we have outsourced. The primary risks that could directly result from the occurrence of a cyber incident include operational interruption, damage to our relationship with our Neighbors, and private data exposure. Our financial results and business operations may be negatively affected by such an incident or the resulting negative media attention. A cybersecurity attack could: (i) disrupt the proper functioning of our networks and systems and therefore our operations and/or those of certain of our Neighbors; (ii) compromise the confidential or proprietary information of our Neighbors, employees, and vendors, which others could use to compete against us or for disruptive, destructive, or otherwise harmful purposes and outcomes; (iii) result in our inability to maintain the building systems relied upon by our Neighbors for the efficient use of their leased space; (iv) require significant management attention and resources to remedy and damages that result; (v) result in misstated financial reports, violations of loan covenants and/or missed reporting deadlines; (vi) result in our inability to properly monitor our compliance with the rules and regulations regarding our qualification as a REIT; (vii) subject us to claims for breach of contract, damages, credits, penalties, or termination of leases or other agreements or relationships; (viii) cause reputational damage that adversely affects Neighbor, investor, and employee confidence in us, which could negatively affect our ability to attract and retain Neighbors, investors, and employees; (ix) result in significant remediation costs, some or all of which may not be recoverable from our insurance carriers; and (x) result in increases in the cost of obtaining insurance on favorable terms, or at all, if the attack results in significant insured losses. Such security breaches also could result in a violation of applicable federal and state privacy and other laws, and subject us to private consumer, business partner, or securities litigation and governmental investigations and proceedings, any of which could result in our exposure to material civil or criminal liability, and we may not be able to recover these expenses from our service providers, responsible parties, or insurance carriers. Similarly, our Neighbors rely extensively on IT systems to process transactions and manage their businesses and thus are also at risk from and may be adversely affected by cybersecurity attacks. An interruption in the business operations of our Neighbors or a deterioration in their reputation resulting from a cybersecurity attack, including unauthorized access to customers’ credit card data and other confidential information, could indirectly negatively affect our business and cause lost revenues. As of December 31, 2020, we have not had any material incidents involving cybersecurity attacks.
We could be subject to legal or regulatory proceedings that may adversely affect our cash flows, and results of operations.
As an owner and operatorOur portfolio is predominantly comprised of publicomni-channel neighborhood grocery-anchored shopping centers, and during the year ended December 31, 2023, our holdings in Florida and California accounted for 12.2% and 10.9%, respectively, of our ABR (including our wholly-owned portfolio as well as the prorated portion of shopping centers owned through our joint ventures). Therefore, our performance is subject to risks associated with owning and operating neighborhood omni-channel grocery-anchored shopping centers, and may be further subject to additional risk as a result of the geographic concentration noted above. Such risks include, but are not limited to: (i) changes in national, regional, and local economic climates or demographics; (ii) competition from other available shopping centers and e-commerce, and the attractiveness of our shopping centers to our Neighbors; (iii) increased competition for real estate assets targeted by our investment strategies; (iv) adverse local conditions, such as oversupply or reduction in demand for similar shopping centers in an area and changes in real estate zoning laws that may reduce the desirability of real estate in an area; (v) vacancies, changes in market rental rates, and the need to periodically repair, renovate, and re-lease space; (vi) ongoing disruption and/or consolidation in the retail sector; (vii) increases in operating costs, due to inflation or otherwise, including common area expenses, utilities, insurance, and real estate taxes, which are relatively inflexible and generally do not decrease if revenue or occupancy decreases; (viii) increases in the costs to repair, renovate, and re-lease space; (ix) changes in interest rates and the availability of financing, which may render the sale or refinance of a property or loan difficult or unattractive; (x) earthquakes, tornadoes, hurricanes, droughts, wildfires, or other weather and climate-related events and natural disasters, civil unrest, terrorist acts, or acts of war, which may result in uninsured or underinsured losses; (xi) epidemics, pandemics, or other widespread outbreaks or resulting public fear that disrupt the businesses of our Neighbors causing them to fail to pay rent on time or at all; and (xii) changes in laws and governmental regulations, including those governing usage, zoning, the environment, and taxes. Such risks also include, but are not limited to, time,those that could impact the financial stability of our Neighbors, including their ability to pay rent and expense reimbursements, such as supply chain disruptions and constraints, inflationary pressures throughout the supply chain, labor shortages and inflationary pressures on wages, increases in retail theft, and other risks and uncertainties described elsewhere in this "Risk Factors" section. These and other factors could adversely affect our financial condition, cash flows, and results of operations.
| | | | | | | | | | | |
PHILLIPS EDISON & COMPANY DECEMBER 31, 2023 FORM 10-K | | | 10 |
The continued shift in retail sales towards e-commerce may adversely affect our financial condition, cash flows, and results of operations.
Retailers are increasingly affected by e-commerce and changes in customer buying habits, which were further accelerated as a result of the COVID-19 pandemic, including the delivery or curbside pick-up of items ordered online. Retailers are considering these e-commerce trends when making decisions regarding their brick and mortar stores and how they will compete and innovate in a rapidly changing e-commerce environment. Many retailers in our shopping centers provide services or sell goods that are unable to be performed online (such as haircuts, massages, and fitness centers) or that have historically been less likely to be purchased online (such as grocery stores, restaurants, and coffee shops); however, the continuing increase in e-commerce sales (including online orders for immediate delivery or pickup in store) may cause retailers to adjust the size or number of retail locations in the future or close stores. Our grocer Neighbors are incorporating e-commerce concepts through home delivery or curbside pickup, which could reduce foot traffic at our centers and adversely affect our occupancy and rental rates. Changes in shopping trends as a result of the growth in e-commerce may also affect the profitability of retailers that do not adapt to changes in market conditions. While we devote considerable effort and resources to analyze and respond to Neighbor trends, Neighbor and consumer preferences, and consumer spending patterns, we cannot predict with certainty what future Neighbors will want, what future retail spaces will look like, or how much revenue will be generated at traditional brick and mortar locations. If we are partyunable to legalanticipate and regulatory proceedings that ariserespond promptly to trends in the ordinary course of business. Due to the inherent uncertainties of litigationmarket (such as space for a drive through or curbside pickup), our occupancy levels and regulatory proceedings, we cannot accurately predict the ultimate outcome of any such litigation or proceedings. We could experience an adverse effect torental rates may decline, and our financial condition, cash flows, financial condition, and results of operations due to an unfavorable outcome.may be adversely impacted.
Risks Related to Capital Recycling StrategyActual incremental unlevered yields for our development and Capital Structure
Higher market capitalization rates and lower NOI atredevelopment projects may vary from our properties may adversely impact our ability to sell properties and fund developments and acquisitions, and may dilute earnings.underwritten incremental unlevered yield range.
As part of our capital recycling strategy,standard development and redevelopment underwriting process, we sell properties that no longer meetanalyze the yield for each project and establish a range of target yields (“underwritten incremental unlevered yields”). Underwritten incremental unlevered yields reflect the yield we target to generate from each project upon expected stabilization and are calculated as the estimated incremental NOI for a project at stabilization divided by its estimated net project investment. The estimated incremental NOI is the difference between the estimated annualized NOI we target to generate from a project upon stabilization and the estimated annualized NOI without the planned improvements. Underwritten incremental unlevered yield does not include peripheral impacts, such as lease rollover risk or the impact on the long term value of the property upon sale or disposition.
Underwritten incremental unlevered yields are based solely on our growthestimates, using data available to us in our development and investment objectivesredevelopment underwriting processes. The actual total cost to complete a development or redevelopment project may differ substantially from our estimates due to stabilization or perceived future risk. These sales proceeds are used to fund the construction of new outparcel developments, redevelopments, expansions, and acquisitions, and to repay debt. An increase in market capitalization rates or a decline in NOI may cause a reductionvarious factors, including unanticipated expenses, delays in the valueestimated start and/or completion date of properties identified for sale, which would have an adverse effectplanned development projects, and other contingencies. In addition, the actual incremental NOI from our planned development and redevelopment activities may differ substantially from our estimates based on numerous other factors, including delays and/or difficulties in leasing and stabilizing a development or redevelopment project, failure to obtain estimated occupancy and rental rates, inability to collect anticipated rental revenues, Neighbor bankruptcies, and unanticipated expenses that we cannot pass on to our Neighbors. Actual incremental unlevered yields may vary from our underwritten incremental unlevered yield range based on the amount of cash generated. In orderactual total cost to meet the cash requirements of our capital recycling program, we may be required to sell more properties than initially planned, whichcomplete a project and its incremental NOI at stabilization.
Pandemics, epidemics, or other health crises may have a negative effect on our earnings. Additionally,and our Neighbors’ businesses, financial condition, results of operations, cash flows, and liquidity.
Our business, and the salebusinesses of properties resultingour Neighbors, could be materially and adversely affected by the risks, or the public perception of the risks, related to a pandemic, epidemic, or other health crisis, like the COVID-19 pandemic, especially if there is a negative impact to customers’ willingness or ability to frequent our Neighbors’ businesses.
As was experienced during the COVID-19 pandemic, such crises could cause significant disruptions to the United States and global economy and contribute to significant volatility and negative pressure in significant tax gains may require higher distributionsfinancial markets. Government responses, including quarantines, restrictions on travel, mandatory closures of businesses, or other restrictions, as well as changes in consumer behavior, could negatively impact our tenants and their ability to operate their businesses, which could impact our ability to collect on current or past due rent payments or fully recover amounts due under the terms of a lease agreement in the event of a default by a Neighbor.
The unpredictable nature of pandemics, epidemics, and other health crises precludes any prediction as to one’s ultimate adverse impact. A worsening of the economic, political, and social environment as a result presents material risks and uncertainties with respect to our stockholders or paymentand our Neighbors’ business, financial condition, results of operations, cash flows, liquidity, and ability to satisfy debt service obligations.
An increased focus on metrics and reporting related to ESG factors may impose additional income taxescosts and expose us to new risks.
Investors and other stakeholders have become more focused on understanding how companies address a variety of ESG factors. When evaluating investment decisions, many investors and shareholders look not only at company ESG disclosures, but also to ESG rating systems that have been developed by third-party groups to allow comparisons between companies. Although we participate in order to maintain our REIT status. We intend to utilize Section 1031 Exchanges to mitigate taxable income, however there can be no assurancea number of these ratings systems, and generally score relatively well in those in which we do participate, we do not participate in, and would not necessarily score as well in, all of the available rating systems. Further, the criteria used in these ratings systems may change frequently, and we cannot guarantee that we will identify exchange propertiesbe able to score well as criteria change. We supplement our participation in ratings systems with corporate disclosure of our ESG activities, but many investors and other stakeholders may look for disclosures that meetwe do not provide. In addition, the SEC is currently evaluating rulemaking that is likely to impose additional ESG disclosure and other requirements on us. Failure to participate in certain of the third-party ratings systems, failure to score well in those ratings systems, failure to provide certain ESG disclosures, or unfavorable comparisons in these areas to other companies, could result in reputational harm when investors or others compare us against similar companies in our investment objectives for acquisitions.industry, could result in investor engagement on our ESG initiatives and
| | | | | | | | | | | |
PHILLIPS EDISON & COMPANY DECEMBER 31, 2023 FORM 10-K | | | 11 |
disclosures or increased costs relating to ESG initiatives, and could cause certain investors to be unwilling to invest in our stock, which could adversely impact our ability to raise capital.
Risks Related to Our Indebtedness and Liquidity
We have substantial indebtedness, and we may need to incur additional indebtedness, including recourse debt, in the future; our debt financingfuture, which could adversely affect our business, financial condition, and financial condition.ability to make distributions to our stockholders.
We have obtained, and are likely tomay continue to obtain, lines of credit, and other long-term financing that are secured by our propertiesshopping centers and other assets. On December 31, 2020,2023, we had indebtedness of $2.3$2.0 billion which comprises $1.6comprised of $1.5 billion in unsecured debt, $0.4 billion in outstanding secured loan facilities, and $0.3$0.1 billion in mortgage loans and finance lease obligations. In connection with executing our business strategies, we expect to evaluate the possibility of additional acquisitions and strategic investments, and we may elect to finance these endeavors by incurring additional indebtedness. We may also incur mortgage debt on propertiesshopping centers that we already own in order to obtain funds to acquire additional propertiesshopping centers or make other capital investments. In addition, we may borrow as necessary or advisable to ensure that we maintain our qualification as a REIT for U.S. federal income tax purposes, including borrowings to satisfy the REIT requirement that we distribute at least 90% of our annual REIT taxable income to our stockholders (computed without regard to the dividends-paid deduction and excluding net capital gain).In connection with executing our business strategies, we expect to evaluate the possibility of additional acquisitions and strategic investments, and we may elect to finance these endeavors by incurring additional indebtedness. However, we cannot guarantee that we will be able to obtain any such borrowings on satisfactory terms. Additionally, if we have insufficient income to service any recourse debt obligations, our lenders could institute proceedings against us to foreclose upon our assets.
If we mortgage a property and there is a shortfall between the cash flows from that property and the cash flows needed to service mortgage debt on that property, then the amount of cash available for distributions to stockholders may be reduced. In addition, incurring mortgage debt increases the risk of loss of a property because defaults on indebtedness secured by a property may result in lenders initiating foreclosure actions. If any mortgages contain cross-collateralization or cross-default provisions, a default on a single property could affect multiple shopping centers. Additionally, we may give full or partial guarantees to lenders of mortgage debt on behalf of the entities that own our shopping centers. When we give a guaranty on behalf of an entity that owns one of our shopping centers, we will be responsible to the lender for satisfaction of the debt if it is not paid by such entity. Currently, we are a limited guarantor on a mortgage loan for our unconsolidated joint venture. Our guarantee is limited to being the non-recourse carveout guarantor and the environmental indemnitor.
High debt levels could have material adverse consequences for the Company, including hindering our ability to adjust to changing market, industry, or economic conditions; limiting our ability to access the capital markets to refinance maturing debt or to fund acquisitions or emerging businesses; requiring the use of a substantial portion of our cash flow from operationsflows for the payment of principal and interest on our debt, thereby limiting the amount of free cash flow available for future operations, acquisitions, distributions, stock repurchases, or other uses; making us more vulnerable to economic or industry
downturns, including interest rate increases; and placing us at a competitive disadvantage compared to less leveraged competitors.
If we mortgage a property and there is a shortfall between the cash flows from that property and the cash flows needed to service mortgage debt on that property, then the amount of cash available for distributions to stockholders may be reduced. In addition, incurring mortgage debt increases the risk of loss of a property since defaults on indebtedness secured by a property may result in lenders initiating foreclosure actions. If any mortgages contain cross-collateralization or cross-default provisions, a default on a single property could affect multiple properties. Additionally, we may give full or partial guarantees to lenders of mortgage debt on behalf of the entities that own our properties. When we give a guaranty on behalf of an entity that owns one of our properties, we will be responsible to the lender for satisfaction of the debt if it is not paid by such entity. Currently, we are a limited guarantor on a mortgage loan for each of our NRP and GRP I joint ventures. In each case, our guarantee is limited to being the non-recourse carveout guarantor and the environmental indemnitor.
We may also obtain recourse debt to finance our acquisitions and meet our REIT distribution requirements. If we have insufficient income to service our recourse debt obligations, our lenders could institute proceedings against us to foreclose upon our assets.
We may not be able to access financing or refinancing sources on favorable terms, or at all.
We may finance our assets over the long-term through a variety of means, including repurchase agreements,unsecured bonds, credit facilities, secured pools, issuance of commercial mortgage-backed securities, collateralized debt obligations, and other structured financings. Our ability to execute this strategy will depend on various market conditions in the markets for financing in this manner that are beyond our control, including lack of liquiditycapital availability and greater credit spreads. We cannot be certain that these markets will remain an efficient source of long-term financing for our assets. If our strategy is not viable, we will have to find alternative forms of long-term financing for our assets, as secured revolving credit facilities and repurchase facilities may not accommodate long-term financing.assets. This could subject us to more recourse indebtedness and the risk that debt service on less efficient forms of financing would require a larger portion of our cash flows, thereby reducing cash available for distribution to our stockholders and funds available for operations as well as for future business opportunities.
Covenants in our loan agreements may restrict our operations and adversely affect our financial condition.condition and ability to make distributions to our stockholders.
When providing financing, a lender may impose restrictions on us that affect our distribution and operating policies and our ability to incur additional debt. LoanOur loan agreements into which we enter may contain covenants that limit our ability to further mortgage a property or discontinue insurance coverage. In addition, loan documentsagreements may limit our ability to replace a property’s property managerenter into or terminate certain operating or lease agreements related to a property. Mortgage debt and other property-level debt that we may incur may also limit our ability to transfer properties from one subsidiary to another. These or other limitations would decrease our operating flexibility and our ability to achieve our operating objectives, which may adversely affect our financial condition and ability to make distributions to our stockholders.
We have acquired,Covenants in certain of our loan agreements specify that certain named individuals must remain a member of management and/or the Board or require certain level of management or Board continuity in connection with a fundamental transaction.
Certain of our loan agreements contain covenants that require certain named individuals, including Mr. Edison, to continue serving as a member of management and/or the Board or require certain levels of senior management and/or Board continuity following a change of control or other fundamental transaction. If such individuals were to depart from the Company within a specified time prior to such transaction or within such specified time after such a transaction, we may be required to negotiate waivers of such covenants or obtain replacement financing, which we may not be able to do on satisfactory terms or at all.
Higher market capitalization rates and lower NOI for our shopping centers may adversely impact our ability to sell shopping centers and fund developments and acquisitions, and may continuedilute earnings.
As part of our capital recycling strategy, we sell shopping centers that no longer meet our growth and investment objectives due to acquirestabilization or finance, properties with lock-out provisions,perceived future risk. Sales proceeds are then used to fund the construction of developments, redevelopments, expansions, and acquisitions, and to repay debt. An increase in market capitalization rates or a decline in NOI may cause a reduction in the value of shopping centers identified for sale, which may prohibit us from selling a property orwould have an adverse effect on the
| | | | | | | | | | | |
PHILLIPS EDISON & COMPANY DECEMBER 31, 2023 FORM 10-K | | | 12 |
amount of cash generated. Additionally, the sale of shopping centers resulting in significant tax gains may require ushigher distributions to maintain specified debt levels for a period of years on some properties.
A lock-out provision is a provision that prohibits the prepayment of a loan during a specified period of time. Lock-out provisions may include terms that provide strong financial disincentives for borrowers to prepay their outstanding loan balance and existour stockholders in order to protect the yield expectationsmaintain our REIT status or payment of lenders.additional income taxes. We currently do not own any properties with loansintend to utilize Section 1031 Exchanges to mitigate taxable income. However, there can be no assurance that are subject to lock-out provisions prohibiting prepayment. We may acquire additional properties in the future subject to such provisions. Lock-out provisions could materially restrict us from selling or otherwise disposing of or refinancing properties when we may desire to do so. Lock-out provisions may prohibit us from reducing the outstanding indebtedness with respect to any properties, refinancing such indebtedness prior to or at maturity, or increasing the amount of indebtedness with respect to such properties. Lock-out provisions could impairwill identify exchange shopping centers that meet our ability to take other actions during the lock-out period that could be in the best interests of our stockholders and, therefore, may have an adverse impact on the value of our shares relative to the value that would result if the lock-out provisions did not exist. In particular, lock-out provisions could preclude us from participating in major transactions that could result in a disposition of our assets or a change in control even though that disposition or change in control might be in the best interests of our stockholders.
The phase-out, replacement, or unavailability of LIBOR could affect interest ratesinvestment objectives for a significant portion of our indebtedness, as well as our ability to obtain future debt financing on favorable terms.
As of December 31, 2020, we had approximately $1.6 billion of indebtedness tied to the London Interbank Offered Rate (“LIBOR”), $1.0 billion of which was fixed through the use of interest rate swaps. Additionally, we have a revolving credit facility tied to LIBOR with a capacity of $500 million, on which we had no outstanding balance (excluding letters of credit in an amount of $9.6 million) as of December 31, 2020. In July 2017, the Financial Conduct Authority (the regulatory authority over LIBOR) stated that it would phase out LIBOR as a benchmark. In November 2020, the Federal Reserve Board announced that banks must stop writing new U.S. dollar (“USD”) LIBOR contracts by the end of 2021 and that, no later than June 30, 2023, when USD LIBOR will no longer be published, market participants should amend legacy contracts to use the Secured Overnight Financing Rate (“SOFR”) or another alternative reference rate. If a published USD LIBOR rate is unavailable after 2021, the interest rates on our indebtedness that is indexed to LIBOR will be determined using alternative methods, any of which may result in interest obligations that are more than, or do not otherwise correlate over time with, the payments that would have been made on such debt if USD LIBOR was available in its current form. Additionally, the phase-out of USD LIBOR and the transition to SOFR or another alternative reference rate may be disruptive to financial markets. Such disruption could have a material adverse effect on our financing costs, and as a result, on our financial condition, operating results, and cash flows.
Increases in interest rates could increase the amount of our loaninterest payments and adversely affect our ability to pay distributions to our stockholders.
Although a significant amount of our outstanding debt has fixed interest rates, we do borrow funds at variable interest rates under our credit facilities and term loans. As of December 31, 2020, 25.2%2023, 22.4% of our outstanding debt was variable rate debt. Increases in interest rates would increase our interest expense on any variable rate debt to the extent we have not hedged
our exposure to changes in interest rates. In addition, increases in interest rates will affect the terms under which we refinance our existing debt as it matures, to the extent we have not hedged our exposure to changes in interest rates, resulting in higher interest rates and increased interest expense. Either of these events would reduce our future earnings and cash flows, which may adversely affect our ability to service our debt and meet our other obligations and also may reduce the amount we are able to distribute to stockholders.
Hedging activity may expose us to risks, including the risks that a counterparty will not perform and that the hedge will not yield the economic benefits we anticipate, which may adversely affect us.our financial condition, cash flows, and results of operations.
From time to time, we manage our exposure to interest rate volatility by using interest rate hedging arrangements that involve risk, such asincluding but not limited to, the risk that counterparties may fail to honor their obligations under these arrangements, that these arrangements may not be effective in reducing our exposure to interest rate changes, and that we may be required to pay the counterparty if interest rates decrease in the future below the hedged amount. There can be no assurance that our hedging arrangements will qualify for hedge accounting or that our hedging activities will have the desired beneficial impact on our results of operations. Should we desire to terminate a hedging agreement, there may be significant costs and cash requirements involved to fulfill our obligations under the hedging agreement. Failure to hedge effectively against interest rate changes may adversely affect our financial condition, cash flows, and results of operations.
Risks Related to Our Corporate OrganizationStructure and StructureOrganization
The Operating Partnership’s limited partnership agreement grants certain rights and protections to the limited partners, which allows them to vote in connection with a change of control transaction that might involve a premium price for shares of our common stock.
The Operating Partnership’s limited partnership agreement grants certain rights and protections to the limited partners, including granting them the right to vote in connection with a change of control transaction. Any such change of control transaction is required to be approved by holders of ownership units of the Operating Partnership (“OP units”) (including our Company and its subsidiaries) at the same level of approval as required for approval by holders of shares of our common stock. For purposes of any such vote, we will be deemed to vote the OP units held by us and our subsidiaries in proportion to the manner in which all of our outstanding shares of common stock were voted at a stockholders meeting relating to such transaction. As of December 31, 2023, we would have directly or indirectly controlled approximately 89.3% of the OP units. Furthermore, as of December 31, 2023, Mr. Edison had voting control over approximately 6.9% of the OP units (considering OP units owned by us), and therefore could have influence over votes on change of control transactions.
We and our consolidated subsidiary, the Operating Partnership, entered into tax protection agreements with certain protected partners, which may limit the Operating Partnership’s ability to sell or otherwise dispose of certain shopping centers and may require the Operating Partnership to maintain certain debt levels that otherwise would not be required to operate its business.
We and the Operating Partnership entered into a tax protection agreement on October 4, 2017 (the “2017 TPA”) with, among others, Mr. Edison, and certain entities controlled by him at the closing of a transaction in May 2017 pursuant to which we internalized our management structure through the acquisition of certain real estate assets and the third-party investment management business of Phillips Edison Limited Partnership (“PELP”) in exchange for OP units and cash. Pursuant to the 2017 TPA, if the Operating Partnership: (i) sells, exchanges, transfers, or otherwise disposes of certain shopping centers in a taxable transaction, or undertakes any taxable merger, combination, consolidation or similar transaction (including a transfer of all or substantially all assets), for a period of ten years commencing on October 4, 2017; or (ii) fails, prior to the expiration of such period, to maintain certain minimum levels of indebtedness that would be allocable to each protected partner for tax purposes or, under certain circumstances, fails to offer such protected partners the opportunity to guarantee certain types of the Operating Partnership’s indebtedness, then the Operating Partnership will indemnify each affected protected partner, including Mr. Edison, against certain resulting tax liabilities. Our tax indemnification obligations include a tax gross-up. As of December 31, 2023, 28 of our 281 wholly-owned shopping centers, four outparcels, and the land under which one of our properties is located, comprising approximately 10.5% of our ABR, are subject to the protection described in clause (i) above, and the potential “make-whole amount” on the estimated aggregate amount of built-in gain subject to such protection is approximately $122.7 million.
| | | | | | | | | | | |
PHILLIPS EDISON & COMPANY DECEMBER 31, 2023 FORM 10-K | | | 13 |
We and the Operating Partnership entered into an additional tax protection agreement (the “2021 TPA”) on July 19, 2021 with Mr. Edison, Mr. Murphy, and Mr. Myers, which will become effective upon the expiration of the 2017 TPA. The 2021 TPA generally has the following terms: (i) the 2021 TPA will severally provide to Mr. Edison, Mr. Murphy, and Mr. Myers the same protection provided under the 2017 TPA until 2031, so long as (a) Mr. Edison, Mr. Murphy, or Mr. Myers (or their permitted transferees), as applicable, individually owns at least 65% of the OP units owned by him as of the date of the execution of the 2021 TPA and (b) in the case of Mr. Murphy or Mr. Myers, Mr. Edison individually owns at least 65% of the OP units owned by him as of the date of the execution of the 2021 TPA; and (ii) the 2021 TPA will provide that following the expiration of the four-year tax protection period under the 2021 TPA, for so long as Mr. Edison holds at least $5.0 million in value of OP units, (a) Mr. Edison will have the opportunity to guarantee debt of the Operating Partnership or enter into a “deficit restoration” obligation, and (b) the Operating Partnership will provide reasonable notice to Mr. Edison before effecting a significant transaction reasonably likely to result in the recognition of more than one-third of the built-in gain allocated to Mr. Edison that is protected under the 2017 TPA as of the date that the 2021 TPA is executed, and will consider in good faith any proposal made by Mr. Edison relating to structuring such transaction in a manner to avoid or mitigate adverse tax consequences to him.
Therefore, although it may be in our stockholders’ best interest for us to cause the Operating Partnership to sell, exchange, transfer or otherwise dispose of one or more of these shopping centers, it may be economically prohibitive for us to do so until the expiration of the applicable protection period because of these indemnity obligations. Moreover, these obligations may require us to cause the Operating Partnership to maintain more or different indebtedness than we would otherwise require for our business. As a result, the tax protection agreements could, during their term, restrict our ability to take actions or make decisions that otherwise would be in our best interests.
Our stockholders have limited control over changes in our policies and operations, which increases the uncertainty and risks our stockholders face.
Our Board determines our major policies, including our policies regarding financing, growth, debt capitalization, REIT qualification, and distributions. Our Board may amend or revise these and other policies without athe vote of theour stockholders. Under the Maryland General Corporation Law, as amended (“MGCL”) and our charter, our stockholders have a right to vote only on limited matters. Our Board’s broad discretion in setting policies and our stockholders’ inability to exert control over those policies increases the uncertainty and risks our stockholders face.
Our charter, limits the number of shares a person may own, whichbylaws, and Maryland law contain terms that may discourage a takeoverthird party from acquiring us in a manner that could otherwise result in a premium price to our stockholders.
Our charter, bylaws, and Maryland law contain provisions that may delay, defer, or prevent a transaction or a change of control that might involve a premium price for our common stock or that our stockholders otherwise believe to be in their best interest. Our charter authorizes our Board to, without stockholder approval, amend our charter to increase or decrease the aggregate number of authorized shares of stock, to authorize us to issue additional shares of our common stock or preferred stock, and to classify or reclassify unissued shares of our common stock or preferred stock and thereafter to authorize us to issue such classified or reclassified shares of stock. We believe these charter provisions will provide us with increased flexibility in structuring possible future financings and acquisitions and in meeting other needs that might arise. The additional classes or series, as well as the additional authorized shares of our common stock, will be available for issuance without further action by our stockholders, unless such action is required by applicable law or the rules of any stock exchange or automated quotation system on which our securities may be listed or traded, and our Board could authorize the issuance of preferred stock with priority as to distributions and amounts payable upon liquidation over the rights of the holders of our common stock.
Our charter, with certain exceptions, authorizes our directorsBoard to take such actions as are necessary and desirable to preserve our qualification as a REIT. To help us comply with the REIT ownership requirements ofunder the IRC, among other purposes, our charter prohibits aany person from directly or constructively owning more than 9.8% in value of our aggregate outstanding stock or more than 9.8% in value or number of shares, whichever is more restrictive, of our aggregate outstanding common stock, unless exempted by our Board. This restriction may have the effect of delaying, deferring or preventing a change in control of us, including an extraordinary transaction (such as a merger, tender offer or sale of all or substantially all of our assets) that might provide a premium price for holders of our common stock.
Our charter, bylaws and Maryland law contain terms that may discourage a third party from acquiring us in a manner that could result in a premium price to our stockholders.
Our charter, bylaws, and the MGCL contain provisions that may delay, defer, or prevent a transaction or a change of control that might involve a premium price for our common stock or that our stockholders otherwise believe to be in their best interest. Our charter permits our Board to classify or reclassify any unissued common stock or preferred stock and establish the preferences, conversion or other rights, voting powers, restrictions, limitations as to distributions, qualifications, and terms or conditions of redemption of any such stock. Thus, our Board could authorize the issuance of preferred stock with priority as to distributions and amounts payable upon liquidation over the rights of the holders of our common stock. In addition, the MGCL permits our Board without stockholder approval and regardless of what is currently provided in our charter or bylaws, to implement certain takeover defenses including adopting a classified board or increasing the vote required to remove a director. without stockholder approval.
These and other provisions of our charter, bylaws, and Maryland law could have the effect of delaying, deferring, or preventing a change in control, including an extraordinary transaction (such as a merger, tender offer, or sale of all or substantially all of our assets) that might provide a premium price to holders of our common stock.
Our rights and the rights of our stockholders to recover claims against our officers and directors are limited, which could reduce our stockholders’ and our recovery against them if they cause us to incur losses.
Maryland law provides that a director has no liability in that capacity if he or she performs his or her duties in good faith, in a manner he or she reasonably believes to be in the corporation’s best interests and with the care that an ordinarily prudent person in a like position would use under similar circumstances. Our charter, in the case of our directors and officers, requires us to indemnify our directors and officers to the maximum extent permitted by Maryland law. Additionally, our charter limits the liability of our directors and officers for monetary damages to the maximum extent permitted under Maryland law. As a result, we and our stockholders may have more limited rights against our directors, officers, employeesassociates, and agents than might otherwise exist under common law, which could reduce our stockholders’ and our recovery against them. In addition, we may be obligated to fund the defense costs incurred by our directors, officers, employeesassociates, and agents in some cases, which would decrease the cash otherwise available for distribution to stockholders.
Risks Related to OrganizationOur REIT Status and QualificationOther Tax Risks
Failure to qualify as a REIT would cause us to be taxed as a regular C corporation, which would substantially reduce funds available for distributions to stockholders.
We elected to be taxed as a REIT for U.S. federal income tax purposes commencing with our taxable year ended December 31, 2010. We believe that our organization and method of operation has enabled and will continue to enable us to meet the
| | | | | | | | | | | |
PHILLIPS EDISON & COMPANY DECEMBER 31, 2023 FORM 10-K | | | 14 |
requirements for qualification and taxation as a REIT for U.S. federal income tax purposes. However, we cannot assure you that we will qualify as such. This is because qualification as a REIT involves the application of highly technical and complex provisions of the IRC as to which there are only limited judicial and administrative interpretations and involves the determination of facts and circumstances not entirely within our control. Future legislation, new regulations, administrative interpretations, or court decisions may significantly change the tax laws or the application of the tax laws with respect to qualification as a REIT for federal income tax purposes or the federal income tax consequences of such qualification.
If we fail to qualify as a REIT in any taxable year, and are unable to obtain relief under certain statutory provisions, we will face serious tax consequences that will substantially reduce the funds available for distributions to our stockholders because:
•we would not be allowed a deduction for dividends paid to stockholders in computing our taxable income and would be subject to federal and state income tax at regular corporate rates; and
•we could not elect to be taxed as a REIT for four taxable years following the year during which we were disqualified.
As a result of all these factors, our failure to qualify as a REIT could impair our ability to expand our business and raise capital, and it could adversely affect the value of our common stock. If we fail to qualify as a REIT, we would no longer be required to make distributions to our stockholders.
Even if we qualify as a REIT, we may face other tax liabilities that reduce our cash flows.
Even if we qualify as a REIT for U.S. federal income tax purposes, we may be subject to certain U.S. federal, state, and local taxes on our income and assets, including taxes on any undistributed income, tax on income from some activities conducted as a result of a foreclosure, and state or local income, property, and transfer taxes. Any of these taxes would decrease cash available for distributions to stockholders.
If the Operating Partnership fails to qualify as a partnership for U.S. federal income tax purposes, we would fail to qualify as a REIT and would suffer adverse consequences.
We believe that the Operating Partnership is organized and will be operated in a manner so as to be treated as a partnership, and not an association or publicly traded partnership taxable as a corporation for U.S. federal income tax purposes. As a partnership, the Operating Partnership will not be subject to U.S. federal income tax on its income. Instead, each of its partners, including us, will be allocated that partner’s share of the Operating Partnership’s income. No assurance can be provided, however, that the Internal Revenue Service (the “IRS”) will not challenge the Operating Partnership’s status as a partnership for U.S. federal income tax purposes, or that a court would not sustain such a challenge. If the Internal Revenue ServiceIRS were
successful in treating the Operating Partnership as an association or publicly traded partnership taxable as a corporation for U.S. federal income tax purposes, we would fail to meet the gross income tests and certain of the asset tests applicable to REITs and, accordingly, would cease to qualify as a REIT. Also, the failure of the Operating Partnership to qualify as a partnership would cause it to become subject to U.S. federal corporate income tax, which would reduce significantly the amount of its cash available for debt service and for distribution to its partners, including us.
The Operating Partnership has a carryover tax basis on certain of its assets as a result of theour acquisition of PELP, transaction and the Merger,our merger with Phillips Edison Grocery Center REIT II, Inc. (“REIT II”), and the amount that we have to distribute to stockholders therefore may be higher.
As a result of each of the acquisition of PELP transaction and the Merger,our merger with REIT II, certain of the Operating Partnership’s propertiesshopping centers have carryover tax bases that are lower than the fair market values of these propertiesshopping centers at the time of the acquisition. As a result of this lower aggregate tax basis, the Operating Partnership will recognize higher taxable gain upon the sale of these assets, and the Operating Partnership will be entitled to lower depreciation deductions on these assets than if it had purchased these propertiesshopping centers in taxable transactions at the time of the acquisition. Such lower depreciation deductions and increased gains on sales allocated to us generally will increase the amount of our required distribution under the REIT rules, and will decrease the portion of any distribution that otherwise would have been treated as a “return of capital” distribution.
Our property taxes could increase due to property tax rate changes or reassessment, which could impact our cash flow.
Even if we qualify as a REIT for U.S. federal income tax purposes, we are required to pay state and local property taxes on our shopping centers. The property taxes on our shopping centers may increase as property tax rates change or as our shopping centers are assessed or reassessed by taxing authorities. Therefore, the amount of property taxes we pay in the future may increase substantially from what we have paid in the past and such increases may not be covered by Neighbors pursuant to our lease agreements. If the property taxes we pay increase, our financial condition, results of operations, cash flow, per share trading price of our common stock, and ability to satisfy our principal and interest obligations and to make distributions to our stockholders could be adversely affected.
We use taxable REIT subsidiaries, which may cause us to fail to qualify as a REIT.
To qualify as a REIT for U.S. federal income tax purposes, we hold, and plan to continue to hold, substantially all of our non-qualifying REIT assets and conduct certain of our non-qualifying REIT income activities in or through one or more taxable REIT subsidiary (“TRS”) entities. A TRS is a corporation other than a REIT in which a REIT directly or indirectly holds stock, and that has made a joint election with such REIT to be treated as a TRS. A TRS also includes any corporation other than a REIT with respect to which a TRS owns securities possessing more than 35% of the total voting power or value of the outstanding securities of such corporation. Other than some activities relating to lodging and health care facilities, a TRS may generally engage in any business, including the provision of customary or non-customary services to tenants of its parent REIT. A TRS is subject to U.S. federal income tax as a regular C-corporation at a current federal rate of 21%.
The net income of our TRS entities is not required to be distributed to us, and income that is not distributed to us will generally not be subject to the REIT income distribution requirement. However, our TRS entities may pay dividends. Such dividend income should qualify under the 95%, but not the 75%, gross income test. We will monitor the amount of the
| | | | | | | | | | | |
PHILLIPS EDISON & COMPANY DECEMBER 31, 2023 FORM 10-K | | | 15 |
dividend and other income from our TRS entities and will take actions intended to keep this income, and any other non-qualifying income, within the limitations of the REIT income tests. While we expect these actions will prevent a violation of the REIT income tests, we cannot guarantee that such actions will in all cases prevent such a violation.
Our ownership of TRS entities is subject to limitations that could prevent us from growing our management business, and our transactions with our TRS entities could cause us to be subject to a 100% penalty tax on certain income or deductions if those transactions are not conducted on an arm’s-length basis.
No more than 20% of the value of a REIT’s gross assets may consist of interests in TRS entities. Compliance with this limitation could limit our ability to grow our management business. The IRC also imposes a 100% excise tax on certain transactions between a TRS and its parent REIT that are not conducted on an arm’s-length basis. We will monitor the value of investments in our TRS entities in order to ensure compliance with TRS ownership limitations and will structure our transactions with our TRS entities on terms that we believe are arm’s-length to avoid incurring the 100% excise tax described above. There can be no assurance, however, that we will be able to comply with the TRS ownership limitation or be able to avoid application of the 100% excise tax.
REIT distribution requirements could adversely affect our ability to execute our business plans, including because we may be required to borrow funds to make distributions to stockholders or otherwise depend on external sources of capital to fund such distributions.
We generally must distribute annually at least 90% of our REIT taxable income (which is determined without regard to the dividends paid deduction or net capital gain for this purpose) in order to continue to qualify as a REIT. To the extent that we satisfy the distribution requirement but distribute less than 100% of our taxable income, we will be subject to federal corporate income tax on our undistributed taxable income. In addition, we may elect to retain and pay income tax on our net long-term capital gain. In that case, if we so elect, a stockholder would be taxed on its proportionate share of our undistributed long-term gain and would receive a credit or refund for its proportionate share of the tax we paid. A stockholder, including a tax-exempt or foreign stockholder, would have to file a U.S. federal income tax return to claim that credit or refund. Furthermore, we will be subject to a 4% nondeductible excise tax if the actual amount that we distribute to our stockholders in a calendar year is less than a minimum amount specified under federal tax laws.
We intend to make distributions to our stockholders to comply with the REIT requirements of the IRC and to avoid corporate income tax and the 4% excise tax. We may be required to make distributions to our stockholders at times when it would be more advantageous to reinvest cash in itsthe business or when we do not have funds readily available for distribution. Thus, compliance with the REIT requirements may hinder our ability to operate solely on the basis of maximizing profits.
If we do not have other funds available, we could be required to borrow funds on unfavorable terms, sell investments at disadvantageous prices, distribute amounts that would otherwise be invested in future acquisitions or capital expenditures or used for the repayment of debt, pay dividends in the form of "taxable stock dividends,” or find another alternative source of funds to make distributions sufficient to enable us to distribute enough of our taxable income to satisfy the REIT distribution requirement and to avoid corporate income tax and the 4% excise tax in a particular year. These alternatives could increase our costs or reduce our equity.
Complying with REIT requirements may cause us to foregoforgo otherwise attractive opportunities or liquidate otherwise attractive investments.
To continue to qualify as a REIT for U.S. federal income tax purposes, we must continually satisfy tests concerning, among other things, the sources of our income, the nature and diversification of our assets, the amounts we distribute to stockholders, and the ownership of our stock. As discussed above, we may be required to make distributions to youshareholders at disadvantageous
times or when we do not have funds readily available for distribution. Additionally, we may be unable to pursue investments that would be otherwise attractive to us in order to satisfy the requirements for qualifying as a REIT.
We must also ensure that at the end of each calendar quarter, at least 75% of the value of our assets consists of cash, cash items, U.S. government securities, and qualified real estate assets, including certain mortgage loans and mortgage-backed securities. The remainder of our investment in securities (other than U.S. government securities and qualified real estate assets) generally cannot include more than 10% of the outstanding voting securities of any one issuer or more than 10% of the total value of the outstanding securities of any one issuer. In addition, in general, no more than 5% of the value of our assets can consist of the securities of any one issuer (other than U.S. government securities and qualified real estate assets) and no more than 20% of the value of our gross assets may be represented by securities of one or more TRS.TRS entities. Finally, no more than 25% of our assets may consist of debt investments that are issued by “publicly offered REITs” and would not otherwise be treated as qualifying real estate assets. If we fail to comply with these requirements at the end of any calendar quarter, we must correct such failure within 30 days after the end of the calendar quarter to avoid losing our REIT status and sufferingbeing subject to adverse tax consequences, unless certain relief provisions apply. As a result, compliance with the REIT requirements may hinder our ability to operate solely on the basis of profit maximization and may require us to liquidate investments from our portfolio, or refrain from making otherwise attractive investments. These actions could have the effect of reducing our income and amounts available for distribution to stockholders.
The prohibited transactions tax may limit our ability to engage in transactions, including disposition of assets, which would be treated as sales for U.S. federal income tax purposes.
A REIT’s net income from prohibited transactions is subject to a 100% tax. In general, prohibited transactions are sales or other dispositions of dealer property, other than foreclosure property. We may be subject to the prohibited transaction tax upon a disposition of real property. Although a safe-harbor exception to prohibited transaction treatment is available, we cannot assure you that we can comply with such safe harbor or that we will avoid owning property that may be characterized as held primarily for sale to customers in the ordinary course of our trade or business. Consequently, we may choose not to engage in certain sales of real property or may conduct such sales through a TRS.
It may be possible to reduce the impact of the prohibited transaction tax by conducting certain activities through a TRS. However, to the extent that we engage in such activities through a TRS, the income associated with such activities will be
| | | | | | | | | | | |
PHILLIPS EDISON & COMPANY DECEMBER 31, 2023 FORM 10-K | | | 16 |
subject to a corporate income tax. In addition, the IRS may attempt to ignore or otherwise recast such activities in order to impose a prohibited transaction tax on us, and there can be no assurance that such recast will not be successful.
We may recognize substantial amounts of REIT taxable income, which we would be required to distribute to our stockholders, in a year in which we are not profitable under GAAPaccounting principles generally accepted in the United States (“GAAP”) or other economic measures.
We may recognize substantial amounts of REIT taxable income in years in which we are not profitable under GAAP or other economic measures as a result of the differences between GAAP and tax accounting methods. For instance, certain of our assets will be marked-to-market for GAAP purposes but not for tax purposes, which could result in losses for GAAP purposes that are not recognized in computing our REIT taxable income. Additionally, we may deduct our capital losses only to the extent of our capital gains in computing our REIT taxable income for a given taxable year. Consequently, we could recognize substantial amounts of REIT taxable income and would be required to distribute such income to youshareholders in a year in which we are not profitable under GAAP or other economic measures.
Our qualification as a REIT could be jeopardized as a result of an interest in joint ventures or investment funds.
We may hold certain limited partner or non-managing member interests in partnerships or limited liability companies that are joint ventures or investment funds. If a partnership or limited liability company in which we own an interest takes or expects to take actions that could jeopardize our qualification as a REIT or require us to pay tax, we may be forced to dispose of our interest in such entity. In addition, it is possible that a partnership or limited liability company could take an action which could cause us to fail a REIT gross income or asset test, and that we would not become aware of such action in time to dispose of our interest in the partnership or limited liability company or take other corrective action on a timely basis. In that case, we could fail to continue to qualify as a REIT unless we are able to qualify for a statutory REIT “savings” provision, which may require us to pay a significant penalty tax to maintain our REIT qualification.
Distributions paid by REITs do not qualify for the reduced tax rates that apply to other corporate distributions.
The maximum tax rate for “qualified dividends” paid by corporations to non-corporate stockholders generally is currently 20%. Distributions paid by REITs to non-corporate stockholders generally are taxed at rates lower than ordinary income rates, but those rates are higher than the 20% tax rate on qualified dividend income paid by corporations. Although this does not adversely affect the taxation of REITs or dividends payable by REITs, to the extent that the preferential rates continue to apply to regular corporate qualified dividends, the more favorable rates for corporate dividends may cause non-corporate investors to perceive that an investment in a REIT is less attractive than an investment in a non-REIT entity that pays dividends, thereby reducing the demand and market price of shares of our common stock.
Legislative or regulatory tax changes could adversely affect us or our stockholders.
At any time, the U.S. federal income tax laws or regulations governing REITs or the administrative interpretations of those laws or regulations may be amended. We cannot predict when or if any new U.S. federal income tax law, regulation or administrative interpretation, or any amendment to any existing U.S. federal income tax law, regulation or administrative interpretation, will be adopted, promulgated, or become effective and any such law, regulation, or interpretation may take effect retroactively. Any such change could result in an increase in our, or our stockholders’, tax liability or require changes in the manner in which we operate in order to minimize increases in our tax liability. A shortfall in tax revenues for states and municipalities in which we operate may lead to an increase in the frequency and size of such changes. If such changes occur, we may be required to pay additional taxes on our assets or income or be subject to additional restrictions. These increased tax costs could, among other things, adversely affect our financial condition, the results of operations, and the amount of cash available for the payment of dividends. We and our stockholders could be adversely affected by any such change in, or any new, U.S. federal income tax law, regulation, or administrative interpretation.
In addition, the COVID-19 pandemic has left many state and local governments with reduced tax revenue, which may lead such governments to increase taxes or otherwise make significant changes to their state and local tax laws. If such changes occur, we may be required to pay additional taxes on our assets or income.
If our assets are deemed to be plan assets, we may be exposed to liabilities under Title I of ERISAthe Employee Retirement Income Security Act of 1974 (“ERISA”) and the IRC.
In some circumstances where an ERISA plan holds an interest in an entity, the assets of the entity are deemed to be ERISA plan assets unless an exception applies. This is known as the “look-through rule.” Under those circumstances, the obligations and other responsibilities of plan sponsors, plan fiduciaries and plan administrators, and of parties in interest and disqualified persons, under Title I of ERISA or Section 4975 of the IRC, may be applicable, and there may be liability under these and other provisions of ERISA and the IRC. We believe that our assets should not be treated as plan assets because the shares of our common stock should qualify as “publicly-offered securities” that are exempt from the look-through rules under applicable Treasury Regulations. We note, however, that because certain limitations are imposed upon the transferability of shares of our common stock so that we may qualify as a REIT, and perhaps for other reasons, it is possible that this exemption may not apply. If that is the case, and if we are exposed to liability under ERISA or the IRC, our performance and results of operations could be adversely affected.
Risks Related to Business Continuity
Uninsured losses relating to real property or excessively expensive premiums for insurance coverage could adversely affect our cash flows and stockholder returns.
We maintain insurance coverage with third-party carriers who provide a portion of the coverage of potential losses, including commercial general liability, fire, flood, extended coverage, and rental loss insurance on all of our shopping centers. We currently self-insure a portion of our commercial insurance deductible risk through our captive insurance company. To the extent that our captive insurance company is unable to bear that risk, we may be required to fund additional capital to our captive insurance company or we may be required to bear that loss. As a result, our operating results may be adversely affected.
There are some types of losses, generally catastrophic in nature, such as losses due to wars, acts of terrorism, earthquakes, floods, hurricanes, pollution, or environmental matters, that are uninsurable or not economically insurable, or may be insured subject to limitations, such as large deductibles or sublimits. Terrorist activities or violence occurring at our properties also
| | | | | | | | | | | |
PHILLIPS EDISON & COMPANY DECEMBER 31, 2023 FORM 10-K | | | 17 |
may directly affect their value through damage, destruction, or loss. Insurance for such acts may be unavailable or cost more, which could result in an increase to our operating expenses and adversely affect our results of operations. To the extent that our Neighbors are affected by such attacks or threats of attacks, their businesses may be adversely affected, including their ability to continue to meet obligations under their existing leases. If any of our shopping centers incur a casualty or other loss that is not fully or adequately insured, the value of our assets will be reduced by any such uninsured loss, which may reduce the value of our stockholders’ investment. In addition, other than any working capital reserve or other reserves we may establish, we have no source of funding to repair or reconstruct any uninsured property. Also, to the extent we must pay unexpectedly large amounts for insurance, such payments could adversely impact our cash flows and ability to make distributions to our stockholders.
Climate change may adversely affect our business, financial condition, cash flows, and results of operations.
Climate change, including the impact of global warming, creates physical and financial risks. Physical risks from climate change include an increase in sea level and changes in weather conditions, such as an increase in storm intensity and severity of weather (e.g. floods, droughts, tornadoes, or hurricanes) and extreme temperatures. The occurrence of sea level rise or one or more natural disasters, such as floods, droughts, tornados, hurricanes, tropical storms, wildfires, and earthquakes (whether or not caused by climate change), could cause considerable damage to our shopping centers, disrupt our operations, and negatively affect our financial performance. To the extent any of these events results in significant damage to or closure of one or more of our shopping centers, our operations and financial performance could be adversely affected through lost Neighbors and an inability to lease or re‑lease the space. In addition, these events could result in significant expenses to restore or remediate a property, increases in fuel or other energy costs or a fuel shortage, and increases in the costs of (or making unavailable) insurance on favorable terms if they result in significant loss of property or other insurable damage. In addition, transition risks associated with new or more stringent laws or regulations or stricter interpretations of existing laws may require material expenditures by us. Among other things, “green” building codes may seek to reduce emissions through the imposition of standards for design, construction materials, water and energy usage and efficiency, and waste management. Such codes could require us to make improvements to our existing shopping centers, increase the costs of maintaining or improving our existing shopping centers or developing new shopping centers, or increase taxes and fees assessed on us or our shopping centers.
As an owner and/or operator of real estate, we could become subject to liability for environmental violations, regardless of whether we caused such violations, and our efforts to identify environmental liabilities may not be successful.
We could become subject to liability in the form of fines or damages for noncompliance with environmental laws and regulations. U.S. federal, state, and local laws and regulations relating to the protection of the environment may require us, as a current or previous owner or operator of real property, to investigate and clean up hazardous or toxic substances or petroleum product releases at, on, under, from, or in a property or at impacted neighboring properties, which in our case most typically arise from current or former dry cleaners, gas stations, asbestos usage and historic land use practices. These costs could be substantial and liability under these laws may attach whether or not the owner or manager knew of, or was responsible for, the presence of such contamination. Even if more than one person may have been responsible for the contamination, each liable party may be held entirely responsible for all of the clean-up costs incurred. We may be subject to regulatory action and may also be held liable to third parties for personal injury or property damage incurred by such parties in connection with exposure to or offsite contamination caused by hazardous or toxic substances. The costs of investigation, removal or remediation of hazardous or toxic substances, and related liabilities, may be substantial and could materially and adversely affect us. The presence of hazardous or toxic substances, or the failure to remediate the related contamination, may also adversely affect our ability to sell, lease, or redevelop a property or to borrow money using a property as collateral.
Although we believe that our portfolio is in substantial compliance with U.S. federal, state, and local environmental laws and regulations regarding hazardous or toxic substances, and that there is no material contamination that we would be responsible for addressing, this belief is based on limited evaluation and testing. Nearly all of our shopping centers have been subjected to Phase I or similar environmental audits. These environmental audits (which do not include subsurface testing) have not revealed, nor are we aware of, any environmental liability that we believe is reasonably likely to have a material adverse effect on us. However, we cannot assure you that: (i) previous environmental studies with respect to the portfolio revealed all potential environmental liabilities; (ii) any previous owner, occupant, or Neighbor of a property did not create any material environmental condition not known to us; (iii) the current environmental condition of the portfolio will not be affected by Neighbors and occupants, by the condition of nearby properties, or by other unrelated third parties; or (iv) future uses or conditions (including, without limitation, changes in applicable environmental laws and regulations or the interpretation thereof) will not result in environmental liabilities.
We and our Neighbors face risks relating to cybersecurity attacks, which could cause loss of confidential information and other disruptions to business operations, and compliance with new laws and regulations regarding cybersecurity and privacy may result in substantial costs and may decrease cash available for distributions.
Cybersecurity attacks include attempts to gain unauthorized access to our data and/or computer systems to disrupt operations, corrupt data, or steal confidential information. We may face such cybersecurity attacks through malware, computer viruses, attachments to e-mails, persons inside our organization or persons with access to systems inside our organization, and other significant disruptions of our information technology (“IT”) systems. The risk of a cybersecurity attack, including by computer hackers (individual or hacking organizations), foreign governments, and cyber terrorists, has generally increased as the number, intensity, and sophistication of attempted attacks and intrusions from around the world have increased. The techniques and sophistication used to conduct cyber attacks and breaches of IT systems, as well as the sources and targets of these attacks, change frequently and are often not recognized until such attacks are launched or have been in place for a period of time.
Our IT networks and related systems are essential to the operation of our business and our ability to perform day-to-day operations and, in some cases, may be critical to the operations of certain of our Neighbors. In addition to our own IT
| | | | | | | | | | | |
PHILLIPS EDISON & COMPANY DECEMBER 31, 2023 FORM 10-K | | | 18 |
systems, we also depend on third parties to provide IT services relating to several key business functions, such as administration, accounting, communications, document management and storage, human resources, payroll, tax, investor relations, and certain finance functions. Our IT systems and those provided by third parties may contain personal, financial, or other information that is entrusted to us by our Neighbors and associates, as well as proprietary PECO information and other confidential information related to our business. We and such third parties employ a number of measures to prevent, detect, and mitigate these threats, including password protection, firewalls, backup servers, malware detection, intrusion sensors, threat monitoring, user training, and periodic penetration testing; however, there is no guarantee that such cybersecurity risk management programs and processes, including our and their policies, controls, and procedures, will be fully implemented, complied with or effective in protecting our and their systems and information.
As have many companies, we and our third party vendors have been impacted by security incidents in the past, and will likely continue to experience security incidents of varying degrees. While we do not believe these incidents have had a material impact to date, as our reliance on technology has increased, so have the risks posed to our systems, both internal and those we have outsourced. The primary risks that could directly result from the occurrence of a cyber incident include operational interruption, damage to our relationship with our Neighbors, and private data exposure. Our financial results and business operations may be negatively affected by such an incident or the resulting negative media attention. A cybersecurity attack could: (i) disrupt the proper functioning of our networks and systems and therefore our operations and/or those of certain of our Neighbors; (ii) compromise the confidential or proprietary information of our Neighbors, associates, and vendors, which others could use to compete against us or for disruptive, destructive, or otherwise harmful purposes and outcomes; (iii) result in our inability to maintain the building systems relied upon by our Neighbors for the efficient use of their leased space; (iv) require significant management attention and resources to remedy the damages that result; (v) result in misstated financial reports, violations of loan covenants, and/or missed reporting deadlines; (vi) result in our inability to properly monitor our compliance with the rules and regulations regarding our qualification as a REIT; (vii) subject us to claims for breach of contract, damages, credits, penalties, or termination of leases or other agreements or relationships; (viii) cause reputational damage that adversely affects Neighbor, investor, and associate confidence in us, which could negatively affect our ability to attract and retain Neighbors, investors, and associates; (ix) result in significant remediation costs, some or all of which may not be recoverable from our insurance carriers; and (x) result in increases in the cost of obtaining insurance on favorable terms, or at all, if the attack results in significant insured losses. Such security breaches also could result in a violation of applicable federal and state privacy and other laws, and subject us to private consumer, business partner, or securities litigation and governmental investigations and proceedings, any of which could result in our exposure to material civil or criminal liability, and we may not be able to recover these expenses from our service providers, responsible parties, or insurance carriers. Similarly, our Neighbors rely extensively on IT systems to process transactions and manage their businesses and thus are also at risk from and may be adversely affected by cybersecurity attacks. An interruption in the business operations of our Neighbors or a deterioration in their reputation resulting from a cybersecurity attack, including unauthorized access to customers’ credit card data and other confidential information, could indirectly negatively affect our business and cause lost revenues.
Regulatory and Legal Risks
Compliance or failure to comply with the ADA, and fire, safety, and other regulations could result in substantial costs and may decrease cash available for stockholder distributions.
Our shopping centers are or may become subject to the ADA which generally requires that all places of public accommodation comply with federal requirements related to access and use by disabled persons. Compliance with the ADA’s requirements could require the removal of access barriers and noncompliance may result in the imposition of injunctive relief, monetary penalties, or in some cases, an award of damages. While we attempt to acquire shopping centers that are already in compliance with the ADA or place the burden of compliance on the seller or other third party, such as a Neighbor, we cannot assure stockholders that we will be able to acquire shopping centers or allocate responsibilities in this manner. In addition, we are required to operate the shopping centers in compliance with fire and safety regulations, building codes, and other land use regulations, as they may be adopted by governmental entities and become applicable to the shopping centers. We may be required to make substantial capital expenditures to comply with these requirements, and these expenditures may reduce our net income and may have a material adverse effect on our ability to meet our financial obligations and make distributions to our stockholders.
We could be subject to legal or regulatory proceedings that may adversely affect our cash flows and results of operations.
As an owner and operator of public shopping centers, from time to time, we are party to legal and regulatory proceedings that arise in the ordinary course of business. Due to the inherent uncertainties of litigation and regulatory proceedings, we cannot accurately predict the ultimate outcome of any such litigation or proceedings. We could experience an adverse effect to our cash flows, financial condition, and results of operations due to an unfavorable outcome.
Risks Related to Our Common Stock
The market price and trading volume of shares of our common stock may be volatile.
The U.S. stock markets, including Nasdaq, on which our common stock trades, have experienced significant price and volume fluctuations. As a result, the market price of shares of our common stock may be similarly volatile, and investors in shares of our common stock may experience a decrease in the value of their shares, including decreases unrelated to our operating performance or prospects. We cannot assure you that the market price of shares of our common stock will not fluctuate or decline significantly in the future.
In addition to the risks listed in this “Risk Factors” section, a number of factors could negatively affect the share price of our common stock or result in fluctuations in the price or trading volume of shares of our common stock, including:
•the annual yield from distributions on shares of our common stock as compared to yields on other financial instruments;
| | | | | | | | | | | |
PHILLIPS EDISON & COMPANY DECEMBER 31, 2023 FORM 10-K | | | 19 |
•equity issuances by us, or future sales of substantial amounts of shares of our common stock by our existing or future stockholders, or the perception that such issuances or future sales may occur;
•increases in market interest rates or a decrease in our distributions to stockholders that lead purchasers of shares of our common stock to demand a higher yield;
•changes in market valuations of similar companies;
•fluctuations in stock market prices and volumes;
•additions or departures of key management personnel;
•our operating performance and the performance of other similar companies;
•actual or anticipated differences in our quarterly operating results;
•changes in expectations of future financial performance or changes in estimates of securities analysts;
•publication of research reports about us or our industry by securities analysts;
•failure to qualify as a REIT;
•adverse market reaction to any indebtedness we incur in the future;
•strategic decisions by us or our competitors, such as acquisitions, divestments, spin offs, joint ventures, strategic investments, or changes in business strategy;
•the passage of legislation or other regulatory developments that adversely affect us or our industry;
•speculation in the press or investment community;
•changes in our earnings;
•failure to satisfy the listing requirements of Nasdaq;
•failure to comply with the requirements of the Sarbanes-Oxley Act;
•actions by institutional stockholders;
•changes in accounting principles; and
•general market conditions, including factors unrelated to our performance.
In the past, securities class action litigation has often been instituted against companies following periods of volatility in the price of their common stock. This type of litigation could result in substantial costs and divert our management’s attention and resources, which could have a material adverse effect on our cash flows, our ability to execute our business strategy, and our ability to make distributions to our stockholders.
The number of shares of our common stock available for future issuance or sale could adversely affect the market price of our common stock.
We cannot predict whether future issuances or sales of shares of our common stock or the availability of shares of our common stock for resale in the open market will decrease the market price of our common stock. The issuance of a substantial number of shares of our common stock in the public market, or upon exchange of common units of limited partnership interest in our OP units, or the perception that such issuances might occur, could adversely affect the market price of our common stock.
The exchange of OP units for common stock, including OP units granted to certain directors, executive officers, and other employees under our equity incentive plan, or the issuance of our common stock or OP units in connection with future property, portfolio, or business acquisitions could have an adverse effect on the market price of our common stock. In addition, the existence of OP units and shares of our common stock reserved for issuance under our equity incentive plan may adversely affect the terms upon which we may be able to obtain additional capital through the sale of equity securities. Future issuances of shares of our common stock may also be dilutive to existing stockholders.
Future offerings of debt securities, which would be senior to our common stock upon liquidation, and/or preferred equity securities, which may be senior to our common stock for purposes of dividend distributions or upon liquidation, may adversely affect the market price of our common stock.
In October 2021, we issued $350 million aggregate principal amount of 2.625% senior notes, and in the future, we may attempt to increase our capital resources by offering additional debt or equity securities (or causing our operating partnership to issue debt or equity securities), including medium term notes, senior or subordinated notes, and additional classes of preferred or common stock. Holders of debt securities or shares of preferred stock, as well as lenders with respect to other borrowings, will generally be entitled to receive interest payments or distributions, both current and in connection with any liquidation or sale, prior to the holders of our common stock. Additionally, any convertible or exchangeable securities that we issue in the future may have rights, preferences, and privileges more favorable than those of our common stock and may result in dilution to owners of our common stock. We are not required to offer any such additional debt or equity securities to existing common stockholders on a preemptive basis. Therefore, offerings of common stock or other equity securities may dilute the holdings of our existing stockholders. Future offerings of debt or equity securities, or the perception that such offerings may occur, may reduce the market price of our common stock and/or the distributions that we pay with respect to our common stock. Because we may generally issue any such debt or equity securities in the future without obtaining the consent of our stockholders, you will bear the risk of our future offerings reducing the market price of our common stock and diluting your proportionate ownership.
| | | | | | | | | | | |
PHILLIPS EDISON & COMPANY DECEMBER 31, 2023 FORM 10-K | | | 20 |
If we pay distributions from sources other than our cash flows from operations, we may not be able to sustain our distribution rate, we may have fewer funds available for investment in shopping centers and other assets, and our stockholders’ overall returns may be reduced.
Our organizational documents permit us to pay distributions from any source without limit (other than those limits set forth under Maryland law). To the extent we fund distributions from borrowings, we will have fewer funds available for investment in real estate shopping centers and other real estate-related assets, and our stockholders’ overall returns may be reduced. At times, we may need to borrow funds to pay distributions, which could increase the costs to operate our business. Furthermore, if we cannot cover our distributions with cash flows from operations, we may be unable to sustain our distribution rate.
Our distributions to stockholders may change, which could adversely affect the market price of shares of our common stock.
All distributions will be at the sole discretion of our Board and will depend on our actual and projected financial condition, results of operations, cash flows, liquidity, maintenance of our REIT qualification, and such other matters as our Board may deem relevant from time to time. We intend to evaluate distributions throughout 2024, and it is possible that stockholders may not receive distributions equivalent to those previously paid by us for various reasons, including: (i) we may not have enough cash to pay such distributions due to changes in our cash requirements, indebtedness, capital spending plans, operating cash flows, or financial position; (ii) decisions on whether, when, and in what amounts to make any future distributions will remain at all times entirely at the discretion of the Board, which reserves the right to change our distribution practices at any time and for any reason; (iii) our Board may elect to retain cash for investment purposes, working capital reserves, or other purposes, or to maintain or improve our credit ratings; and (iv) the amount of distributions that our subsidiaries may distribute to us may be subject to restrictions imposed by state law, state regulators, and/or the terms of any current or future indebtedness that these subsidiaries may incur.
Stockholders have no contractual or other legal right to distributions that have not been authorized by the Board and declared by the Company. We may not be able to make distributions in the future or may need to fund such distributions from external sources, as to which no assurances can be given. In addition, as noted above, we may choose to retain operating cash flow, and those retained funds, although increasing the value of our underlying assets, may not correspondingly increase the market price of shares of our common stock. Our failure to meet the market's expectations with regard to future cash distributions likely would adversely affect the market price of shares of our common stock.
Increases in market interest rates may result in a decrease in the value of shares of our common stock.
One of the factors that may influence the price of shares of our common stock is the dividend distribution rate on our common stock (as a percentage of the price of shares of our common stock) relative to market interest rates. If market interest rates rise, as has recently been experienced, prospective purchasers of shares of our common stock may expect a higher distribution rate. Higher interest rates would not, however, result in more funds being available for distribution and, in fact, would likely increase our borrowing costs and might decrease our funds available for distribution. We therefore may not be able, or we may not choose, to provide a higher distribution rate. As a result, prospective purchasers may decide to purchase other securities rather than shares of our common stock, which would reduce the demand for, and result in a decline in the market price of, shares of our common stock.
If we fail to maintain an effective system of internal control over financial reporting and disclosure controls, we may not be able to accurately and timely report our financial results.
Effective internal control over financial reporting and disclosure controls are necessary for us to provide reliable financial reports, effectively prevent fraud, and to operate successfully as a public company. If we cannot provide reliable financial reports or prevent fraud, our reputation and operating results would be harmed. We are required to perform system and process evaluation and testing of our internal control over financial reporting to allow management to report on the effectiveness of our internal control over financial reporting, and are required to have our independent registered public accounting firm attest to the same, as required by Section 404 of the Sarbanes-Oxley Act of 2002. If a material weakness or significant deficiency was to be identified in our internal control over financial reporting, we may also identify deficiencies in some of our disclosure controls and procedures that we believe require remediation. If we or our independent registered public accounting firm discover weaknesses, we will make efforts to improve our internal control over financial reporting and disclosure controls. However, there is no assurance that we will be successful. Any failure to maintain effective controls or timely effect any necessary improvement of our internal control over financial reporting and disclosure controls could harm operating results or cause us to fail to meet our reporting obligations, which could affect the listing of our common stock on Nasdaq. Ineffective internal control over financial reporting and disclosure controls could also cause investors to lose confidence in our reported financial information, which would likely have a negative effect on the per share trading price of our common stock.
ITEM 1B. UNRESOLVED STAFF COMMENTS
Not applicable.
| | | | | | | | | | | |
PHILLIPS EDISON & COMPANY DECEMBER 31, 2023 FORM 10-K | | | 21 |
ITEM 1C. CYBERSECURITY
PECO’s cybersecurity program is generally based on the National Institute of Standards and Technology cybersecurity framework (“NIST CSF”) with the intention of preventing, identifying, detecting, and mitigating cybersecurity risks. This does not imply that we meet or comply with any particular technical standards, specifications, frameworks, or requirements including the NIST CSF, only that we use the NIST CSF as a guide. Our program focuses on people, processes, and technologies and includes training of associates, periodic workforce testing, and the deployment and monitoring of technical security solutions and controls.
Our cybersecurity risk management program is integrated into our overall enterprise risk management program and shares common methodologies, reporting channels, and governance processes that apply across the enterprise risk management program to other legal, compliance, strategic, operational, and financial risk areas.
Our management team, including the Chief Information Officer (“CIO”), is responsible for identifying and managing our material risks from cybersecurity threats. The CIO has primary responsibility for leading our overall cybersecurity risk management program and supervises both the PECO cybersecurity team and our retained external cybersecurity consultants. The management team, led by the CIO and cybersecurity team, stay informed about cybersecurity risk including prevention, detection, mitigation, and remediation of cybersecurity risks and incidents through various means, which may include briefings from internal security personnel; threat intelligence and other information obtained from governmental, public, or private sources, including external consultants engaged by us; and alerts and reports produced by security tools deployed in the PECO environment. The CIO works closely with members of PECO's cybersecurity team, who have years of experience working in cybersecurity, possessing industry certifications such as Certified Information Systems Security Professional (“CISSP”) and Security+, and pursuing advanced degrees and studies in the field. Cybersecurity team members participate in recurring cybersecurity team meetings with the CIO and provide monthly executive leadership updates. The Board oversees our cybersecurity program and is periodically briefed by management, including the CIO, on cybersecurity risks and initiatives. In addition, management updates the Board as necessary regarding any significant cybersecurity incidents.
The cybersecurity team delivers cybersecurity training to associates, including security videos and informational tips, new hire training, out-of-band cybersecurity alerts, and simulated phishing campaigns with teachable moments and focused training, all designed to provide security specific knowledge to our associates. Positive reinforcement is utilized and encourages associates’ participation, in addition to required periodic training. The PECO cybersecurity team participates in cybersecurity training, activities, and events to stay current with the evolution of security threats, security solutions, best practices, and the risks facing PECO.
At PECO, we are committed to protecting the confidentiality and integrity of our data and systems. Among other things, our key contracts contain requirements that counterparties maintain standards of data security and privacy compliance.
PECO maintains, internally publishes, and annually reviews its cybersecurity policies and procedures, which includes an incident response plan. Additionally, PECO engages with external cybersecurity experts to conduct annual penetration testing, provide monitoring of the environment, conduct tabletop exercises, and for dedicated incident response and advanced forensics capabilities. In addition to internal audits and external reviews, assessments have included the NIST CSF, cybersecurity maturity assessment, and Center for Internet Security Benchmarks to identify opportunities for enhancement.
We have not identified risks from known cybersecurity threats, including as a result of any prior cybersecurity incidents, that have materially affected us, including our operations, business strategy, results of operations, or financial condition. We face certain ongoing risks from cybersecurity threats that, if realized, are reasonably likely to materially affect us, including our financial results and business operations. See “Item 1A. Risk Factors – Risks Related to Business Continuity”.
| | | | | | | | | | | |
PHILLIPS EDISON & COMPANY DECEMBER 31, 2023 FORM 10-K | | | 22 |
ITEM 2. PROPERTIES
Real Estate InvestmentsREAL ESTATE INVESTMENTS—The following table details information for our wholly-owned properties and those owned through our unconsolidated joint venturesventure as of December 31, 2020,2023, which is the basis for determining the prorated information included in the subsequent tables (dollars and square feet in thousands):
| | | | | | | | | | | | | | | | | | | | | | | | | | |
| | Ownership Percentage | | Number of Properties | | ABR | | GLA |
| Wholly-owned properties | | 100% | | 283 | | | $ | 386,516 | | | 31,709 | |
| Necessity Retail Partners | | 20% | | 5 | | | $ | 7,879 | | | 507 | |
Grocery Retail Partners I(1) | | 14% | | 20 | | | 28,596 | | | 2,218 | |
| | | | | | | | | | | | | | | | | | | | | | | | | | |
| | Ownership Percentage | | Number of Properties | | ABR | | GLA |
| Wholly-owned properties | | 100% | | 281 | | | $ | 470,819 | | | 32,153 | |
| GRP I | | 14% | | 20 | | | 31,908 | | | 2,213 | |
(1)On October 1, 2020, GRP I acquired GRP II, an additional joint venture in which we owned an equity interest. Our ownership in the combined entity was adjusted upon consummation of the transaction.
The following table presents information regarding the geographic location of our properties, including wholly-owned and the prorated portion of those owned through our unconsolidated joint ventures,venture, by ABR as of December 31, 2020.2023. For additional portfolio information, refer to Schedule“Schedule III - Real Estate Assets and Accumulated DepreciationDepreciation” (dollars and square feet in thousands):
| | State | State | | ABR(1) | | % ABR | | ABR/Leased Square Foot | | GLA(2) | | % GLA | | % Leased | | Number of Properties | State | | ABR(1) | | % ABR | | ABR/Leased Square Foot | | GLA(2) | | % GLA | | % Leased | | Number of Properties |
| Florida | Florida | | $ | 49,082 | | | 12.5 | % | | $ | 12.78 | | | 4,116 | | | 12.8 | % | | 93.3 | % | | 53 | |
| California | California | | 40,612 | | | 10.4 | % | | 18.48 | | | 2,321 | | | 7.2 | % | | 94.7 | % | | 25 | |
| Texas | |
| Georgia | Georgia | | 34,863 | | | 8.9 | % | | 12.22 | | | 2,925 | | | 9.1 | % | | 97.6 | % | | 30 | |
| Texas | | 30,878 | | | 7.9 | % | | 15.56 | | | 2,167 | | | 6.7 | % | | 91.6 | % | | 18 | |
| Illinois | |
| Ohio | Ohio | | 28,324 | | | 7.2 | % | | 9.98 | | | 2,980 | | | 9.3 | % | | 95.3 | % | | 26 | |
| Illinois | | 22,810 | | | 5.8 | % | | 14.77 | | | 1,647 | | | 5.1 | % | | 93.8 | % | | 15 | |
| Colorado | |
| Virginia | Virginia | | 18,030 | | | 4.6 | % | | 13.84 | | | 1,351 | | | 4.2 | % | | 96.4 | % | | 13 | |
| Colorado | | 17,693 | | | 4.5 | % | | 15.79 | | | 1,162 | | | 3.6 | % | | 96.4 | % | | 10 | |
| Minnesota | |
| Massachusetts | Massachusetts | | 15,770 | | | 4.0 | % | | 14.07 | | | 1,170 | | | 3.6 | % | | 95.8 | % | | 10 | |
| Nevada | |
| Pennsylvania | Pennsylvania | | 11,676 | | | 3.0 | % | | 11.35 | | | 1,086 | | | 3.4 | % | | 94.7 | % | | 7 | |
| Minnesota | | 11,189 | | | 2.9 | % | | 12.51 | | | 924 | | | 2.9 | % | | 96.7 | % | | 10 | |
| Wisconsin | |
| Arizona | |
| South Carolina | South Carolina | | 10,458 | | | 2.7 | % | | 9.16 | | | 1,302 | | | 4.1 | % | | 87.7 | % | | 11 | |
| Arizona | | 9,824 | | | 2.5 | % | | 12.51 | | | 845 | | | 2.6 | % | | 92.9 | % | | 7 | |
| Wisconsin | | 9,324 | | | 2.4 | % | | 10.08 | | | 944 | | | 2.9 | % | | 98.0 | % | | 8 | |
| Maryland | |
| North Carolina | North Carolina | | 8,966 | | | 2.3 | % | | 11.86 | | | 810 | | | 2.5 | % | | 93.3 | % | | 13 | |
| Maryland | | 8,895 | | | 2.3 | % | | 19.81 | | | 464 | | | 1.4 | % | | 96.8 | % | | 4 | |
| Tennessee | |
| Indiana | Indiana | | 6,663 | | | 1.7 | % | | 8.14 | | | 832 | | | 2.6 | % | | 98.4 | % | | 5 | |
| Kentucky | |
| Michigan | Michigan | | 6,478 | | | 1.7 | % | | 9.26 | | | 724 | | | 2.3 | % | | 96.6 | % | | 5 | |
| Tennessee | | 6,118 | | | 1.6 | % | | 8.57 | | | 777 | | | 2.4 | % | | 91.9 | % | | 6 | |
| New Mexico | |
| Connecticut | Connecticut | | 5,411 | | | 1.4 | % | | 13.88 | | | 419 | | | 1.3 | % | | 93.1 | % | | 4 | |
| New Mexico | | 5,360 | | | 1.4 | % | | 13.70 | | | 404 | | | 1.3 | % | | 96.9 | % | | 3 | |
| Oregon | Oregon | | 5,195 | | | 1.3 | % | | 14.56 | | | 374 | | | 1.2 | % | | 95.5 | % | | 5 | |
| Kentucky | | 4,836 | | | 1.2 | % | | 9.84 | | | 502 | | | 1.6 | % | | 98.0 | % | | 3 | |
| Kansas | |
| New Jersey | New Jersey | | 4,659 | | | 1.2 | % | | 17.32 | | | 276 | | | 0.9 | % | | 97.3 | % | | 2 | |
| Kansas | | 4,554 | | | 1.2 | % | | 11.12 | | | 452 | | | 1.4 | % | | 90.6 | % | | 4 | |
| Nevada | | 4,317 | | | 1.1 | % | | 20.01 | | | 217 | | | 0.7 | % | | 99.4 | % | | 2 | |
| Washington | |
| Iowa | Iowa | | 2,726 | | | 0.7 | % | | 8.83 | | | 360 | | | 1.1 | % | | 85.9 | % | | 3 | |
| Washington | | 2,604 | | | 0.6 | % | | 15.47 | | | 170 | | | 0.5 | % | | 98.8 | % | | 2 | |
| Missouri | Missouri | | 2,528 | | | 0.5 | % | | 11.48 | | | 222 | | | 0.7 | % | | 99.4 | % | | 2 | |
| New York | New York | | 1,801 | | | 0.4 | % | | 11.26 | | | 163 | | | 0.5 | % | | 97.9 | % | | 1 | |
| Utah | Utah | | 451 | | | 0.1 | % | | 30.97 | | | 15 | | | 0.1 | % | | 100.0 | % | | 1 | |
| Total | Total | | $ | 392,095 | | | 100.0 | % | | $ | 12.89 | | | 32,121 | | | 100.0 | % | | 94.7 | % | | 308 | |
(1)We calculate ABR as monthly contractual base rent as of December 31, 2020,2023 multiplied by 12twelve months.
(2)GLAGross leasable area (“GLA”) is defined as the total occupied and unoccupied square footage of a building that is available for Neighbors to lease.
| | | | | | | | | | | |
PHILLIPS EDISON & COMPANY DECEMBER 31, 2023 FORM 10-K | | | 23 |
Lease ExpirationsTOP TEN CITIES—The following table presents the top ten city markets by ABR of our wholly-owned properties as of December 31, 2023 (dollars in thousands):
| | | | | | | | | | | | | | |
| City | | ABR(1) | | % ABR |
| Atlanta | | $ | 33,644 | | | 7.1 | % |
| Chicago | | 26,067 | | | 5.5 | % |
| Dallas | | 24,709 | | | 5.2 | % |
| Sacramento | | 20,986 | | | 4.5 | % |
| Minneapolis | | 18,439 | | | 3.9 | % |
| Denver | | 17,731 | | | 3.8 | % |
| Washington, D.C. | | 14,915 | | | 3.2 | % |
| Las Vegas | | 14,824 | | | 3.1 | % |
| Houston | | 14,609 | | | 3.1 | % |
| Tampa | | 13,791 | | | 2.9 | % |
| Total | | $ | 199,715 | | | 42.3 | % |
(1)We calculate ABR as monthly contractual base rent as of December 31, 2023 multiplied by twelve months.
LEASE EXPIRATIONS—The following chart shows the aggregate scheduled lease expirations for our over 3,000 Neighbors, excluding our Neighbors who are occupying space on a temporary basis, after December 31, 20202023 for each of the next ten years and thereafter for our wholly-owned properties and the prorated portion of those owned through our unconsolidated joint ventures:venture:
Our ability to create rental rate growth generally depends on our leverage during new and renewal lease negotiations with prospective and existing Neighbors, which typically occurs when occupancy at our centers is high or during periods of economic growth and recovery. Conversely, we may experience rental rate decline when occupancy at our centers is low or during periods of economic recession, as the leverage during new and renewal lease negotiations may shift to prospective and existing Neighbors.
| | | | | | | | | | | |
PHILLIPS EDISON & COMPANY DECEMBER 31, 2023 FORM 10-K | | | 24 |
Most of our grocery Neighbors have remained open throughout the COVID-19 pandemic, though their sales may have been impacted by social distancing and “stay-at-home” mandates. The number of our Neighbor spaces that temporarily closed as a result of the COVID-19 pandemic peaked in April 2020 and has significantly decreased as states began to lift in full or in part “stay-at-home” mandates in May 2020. Certain Neighbors remain temporarily closed, have since closed after reopening, are limiting the number of customers allowed in their stores, or have modified their operations in other ways that may impact their profitability, either as a result of government mandates or self-elected efforts to reduce the spread of COVID-19. These actions could result in increased permanent store closings and could reduce the demand for leasing space in our shopping centers and result in a decline in average rental rates on expiring leases.
For our wholly-owned properties and those owned through our average rental rates on new and renewal leases have exceeded the average rental rates on comparable expiring leases as of December 31, 2020; however, our occupancy declined 0.7% to 94.7% as compared to December 31, 2019, owing largely to the economic impact of COVID-19, and we anticipate our occupancy may decline further in early 2021. We will likely continue to experience pressure in new and renewal rental rates until the business environment becomes more stable, but new leasing volume in early 2021 remains strong.
For our wholly-owned portfolio,unconsolidated joint venture, during the 20212024 fiscal year, we have a total of 585670 leases expiring, representing 2.72.8 million square feet of GLA. TheseFor our wholly-owned properties, during the 2024 fiscal year, we have 635 leases expiring, representing 2.8 million square feet of GLA. For our wholly-owned properties, the expiring leases have an ABR of $12.43$15.07 per square foot. While we cannot predict what rental rates we will achieve in 20212024 as we renew or replace these expiring leases, the comparable rent spread of new leases signed during 20202023 was 8.2%25.2%, and the comparable rent spread for lease renewals and options executed in 20202023 was 6.7%16.2%. Subsequent to December 31, 2020, we renewed approximately 0.3 million total square feet and $5.5 million of total ABR of future expiring leases. This includes seven anchor lease renewals, five of which were pursuant toFurther, during the exercise of an option to extendfiscal year 2023, our occupancy remained high, ending the lease.year at 97.4%, indicating continued demand for leasing spaces at our centers.
See “Part II, Item 7. Management’s Discussion and Analysis of Financial Condition and Results of Operations - Overview - Leasing Activity” of this filing on Form 10-K for further discussion of leasing activity.
Portfolio TenancyPORTFOLIO TENANCY—We define national Neighbors as those Neighbors that operate in at least three states. Regional Neighbors are defined as those Neighbors that have at least three locations in fewer than three states. The following charts present the composition of our portfolio, including our wholly-owned properties and the prorated portion of those owned through our unconsolidated joint ventures,venture, by Neighbor type as of December 31, 2020:2023:
The following charts present the composition of our portfolio by neighborNeighbor industry as of December 31, 2020:2023:
| | | | | | | | | | | |
PHILLIPS EDISON & COMPANY DECEMBER 31, 2023 FORM 10-K | | | 25 |
NECESSITY-BASED GOODS AND SERVICES—We define “necessity-based goods and services” as goods and services that are indispensable, necessary, or common for day-to-day living, or that tend to be inelastic (i.e., those for which the demand does not change based on a consumer’s income level). We estimate that approximately 51%70% of our ABR, including the pro rata portion attributable to our properties owned through our unconsolidated joint ventures,venture, is generated from retailNeighbors providing necessity-based goods and service businesses generally deemed essential under most state and local mandates issued in response to the COVID-19 pandemic. The composition of our portfolio as a percentage of ABR is as follows:
| | | | | |
| services. | December 31, 2020 |
Essential Retail and Services: | |
Grocery | 35.9 | % |
Banks | 2.4 | % |
Dollar stores | 2.2 | % |
Pet supply | 2.1 | % |
Medical | 1.8 | % |
Hardware/automotive | 1.7 | % |
Wine, beer, and liquor | 1.4 | % |
Pharmacy | 1.0 | % |
Other essential | 2.8 | % |
Total essential retail and services(1)
| 51.3 | % |
Restaurants: | |
Quick service | 9.6 | % |
Full service | 6.0 | % |
Total restaurants | 15.6 | % |
Other Retail and Services: | |
Services | 16.3 | % |
Soft goods | 12.3 | % |
Fitness | 3.2 | % |
Entertainment | 1.3 | % |
Total other retail and services | 33.1 | % |
Total ABR | 100.0 | % |
(1)TOP TWENTY NEIGHBORSIncludes Neighbors that we believe are considered to be essential retail and service businesses but that may have temporarily closed due to decreases in foot traffic and customer patronage as a result of “stay-at-home” mandates and social distancing guidelines implemented in response to the COVID-19 pandemic.
—The following table presents our top twenty20 Neighbors by ABR, including our wholly-owned properties and the prorated portion of those owned through our unconsolidated joint ventures,venture, as of December 31, 20202023 (dollars and square feet in thousands):
| Neighbor(1) | Neighbor(1) | | ABR | | % of ABR | | Leased
Square Feet | | % of Leased Square Feet | | Number of Locations(2) | Neighbor(1) | | ABR | | % of ABR | | Leased
Square Feet | | % of Leased Square Feet | | Number of Locations(2) |
| Kroger | Kroger | | $ | 27,130 | | | 6.9 | % | | 3,447 | | | 11.3 | % | | 64 | |
| Publix | Publix | | 22,003 | | | 5.6 | % | | 2,240 | | | 7.4 | % | | 56 | |
| Albertsons | |
| Ahold Delhaize | Ahold Delhaize | | 17,514 | | | 4.5 | % | | 1,264 | | | 4.2 | % | | 24 | |
| Albertsons-Safeway | | 16,866 | | | 4.3 | % | | 1,637 | | | 5.4 | % | | 31 | |
| Walmart | Walmart | | 8,933 | | | 2.3 | % | | 1,770 | | | 5.8 | % | | 13 | |
| Giant Eagle | Giant Eagle | | 8,183 | | | 2.1 | % | | 822 | | | 2.7 | % | | 12 | |
| Sprouts Farmers Market | |
| TJX Companies | TJX Companies | | 4,984 | | | 1.3 | % | | 428 | | | 1.4 | % | | 15 | |
| Sprouts Farmers Market | | 4,885 | | | 1.2 | % | | 334 | | | 1.1 | % | | 11 | |
| Raley's | |
| Dollar Tree | Dollar Tree | | 4,048 | | | 1.0 | % | | 423 | | | 1.4 | % | | 44 | |
| Raley's | | 3,884 | | | 1.0 | % | | 253 | | | 0.8 | % | | 4 | |
| SUPERVALU | | 3,467 | | | 0.9 | % | | 376 | | | 1.2 | % | | 7 | |
| UNFI (SuperValu) | |
| Starbucks Corporation | |
| Trader Joe's | |
| H-E-B | |
| Lowe's | |
| Subway Group | Subway Group | | 3,048 | | | 0.8 | % | | 125 | | | 0.4 | % | | 90 | |
| Schnuck's | | 3,025 | | | 0.8 | % | | 329 | | | 1.1 | % | | 5 | |
| Anytime Fitness, Inc. | Anytime Fitness, Inc. | | 2,740 | | | 0.7 | % | | 180 | | | 0.6 | % | | 38 | |
| Southeastern Grocers | | 2,626 | | | 0.7 | % | | 291 | | | 1.0 | % | | 8 | |
| Save Mart | | 2,619 | | | 0.7 | % | | 309 | | | 1.0 | % | | 6 | |
| Lowe's | | 2,469 | | | 0.6 | % | | 369 | | | 1.2 | % | | 4 | |
| Kohl's Corporation | | 2,255 | | | 0.6 | % | | 365 | | | 1.2 | % | | 4 | |
| Food 4 Less (PAQ) | Food 4 Less (PAQ) | | 2,215 | | | 0.6 | % | | 118 | | | 0.4 | % | | 2 | |
| Petco Animal Supplies, Inc. | | 2,103 | | | 0.5 | % | | 127 | | | 0.4 | % | | 11 | |
| United Parcel Service | |
| H&R Block, Inc. | |
| Total | Total | | $ | 144,997 | | | 37.1 | % | | 15,207 | | | 50.0 | % | | 449 | |
(1)Neighbors are grouped by parent company and may represent multiple subsidiaries and banners.
(2)Number of locations excludes auxiliary leases with grocery anchors such as fuel stations, pharmacies, and liquor stores. Additionally, in the event thatif a parent company has multiple subsidiaries or banners serving as Neighbors in a single shopping center, those subsidiaries are included as one location.
ITEM 3. LEGAL PROCEEDINGS
From time to time, we are party to legal proceedings, which arise in the ordinary course of our business. We are not currently involved in any legal proceedings for which we are not covered by our liability insurance or the outcome is reasonably likely to have a material impact on our results of operations or financial condition, nor are we aware of any such legal proceedings contemplated by governmental authorities.
ITEM 4. MINE SAFETY DISCLOSURES
Not applicable.
| | | | | | | | | | | |
PHILLIPS EDISON & COMPANY DECEMBER 31, 2023 FORM 10-K | | | 26 |
ITEM 5. MARKET FOR REGISTRANT’S COMMON EQUITY, RELATED STOCKHOLDER MATTERS, AND ISSUER PURCHASES OF EQUITY SECURITIES
MARKET INFORMATION—Pursuant to our underwritten initial public offering (“underwritten IPO”) on July 19, 2021, our common stock is traded on the Nasdaq Global Select Market Information
(“Nasdaq”) under the ticker symbol “PECO.” As of March 1, 2021,February 5, 2024, we had approximately 280.7122.2 million shares of common stock outstanding, held by a total of 61,585approximately 8,000 stockholders of record. The number of stockholders is based on the records of our registrar and transfer agent. Our common stock is not currently traded on any exchange, and there is no established trading market for our common stock. Therefore, there is a risk that a stockholder may not be able to sell our stock at a time or price acceptable to the stockholder, or at all.
Valuation Overview
On May 6, 2020, the independent directors of our Board declared the estimated value per share (“EVPS”) of our common stock as $8.75. The valuation was based substantially on the estimated “as is” market value of our portfolio of real estate properties
in various geographic locations in the United States as well as our pro rata share of those properties owned through our joint ventures (collectively, our “Portfolio”) and the estimated value of in-place contracts of our third-party asset management business as of March 31, 2020.
We provided the EVPS to assist broker-dealers that participated in our public offering in meeting their customer account statement reporting obligations under Financial Industry Regulatory Authority (“FINRA”) Rule 2231. This valuation was performed in accordance with the provisions of Practice Guideline 2013-01, Valuations of Publicly Registered Non-Listed REITs, issued by the Institute for Portfolio Alternatives (“IPA”) in April 2013 (“IPA Valuation Guidelines”).
We engaged Duff & Phelps, LLC (“Duff & Phelps”), an independent valuation expert that has expertise in appraising commercial real estate assets, to provide a calculation of the range in EVPS of our common stock as of March 31, 2020. Duff & Phelps prepared a valuation report (“Valuation Report”) that provided this range based substantially on its estimate of the “as is” market value of the Portfolio and the estimated value of in-place contracts of the third-party asset management business. Duff & Phelps made adjustments to the aggregate estimated value of our Portfolio to reflect balance sheet assets and liabilities provided by our management as of March 31, 2020, before calculating a range of estimated values based on the number of outstanding shares of our common stock as of March 31, 2020. The COVID-19 pandemic has impacted the global financial markets. As of the valuation date, Duff & Phelps attached less weight to previous market evidence for comparison purposes to arrive at opinions of value. Due to a dearth of transaction activity that takes into account this impact, they were forced to infer conclusions from public market data (stock prices) and other data, which are very volatile. They surveyed market participants on a daily basis to try to ascertain market inputs, but due to the overall uncertainty of the broader markets, the data points are not widely consistent. The valuation is, therefore, reported on the basis of “material valuation uncertainty”. Consequently, less certainty, and a higher degree of caution, should be attached to the valuation than would normally be the case. These calculations produced an EVPS in the range of $8.45 to $9.68 as of March 31, 2020, and the independent directors, after discussions with management, approved $8.75 as the EVPS as of March 31, 2020. We previously established an EVPS on May 8, 2019 of $11.10 based substantially on the same methodology and process as of March 31, 2019, with the exception of the weighting adjustments described previously. We expect to review the EVPS at least annually.
The following table summarizes the material components of the EVPS of our common stock as of March 31, 2020 (in thousands, except per share amounts):
| | | | | | | | | | | |
| Low | | High |
| Investment in Real Estate Assets: | | | |
| Phillips Edison real estate valuation | $ | 5,135,800 | | | $ | 5,536,300 | |
| Management company | 23,000 | | | 23,000 | |
Joint venture properties(1) | 87,345 | | | 94,290 | |
| Total market value | 5,246,145 | | | 5,653,590 | |
| | | |
| Other Assets: | | | |
| Cash and cash equivalents | 35,437 | | | 35,437 | |
| Restricted cash | 47,866 | | | 47,866 | |
| Accounts receivable | 49,645 | | | 49,645 | |
| Derivative assets | 18 | | | 18 | |
| Prepaid expenses and other assets | 12,009 | | | 12,009 | |
| Total other assets | 144,975 | | | 144,975 | |
| | | |
| Liabilities: | | | |
| Notes payable and credit facility | 2,420,714 | | | 2,420,714 | |
| Mark to market - debt | 10,052 | | | 10,052 | |
| Derivative liability | 62,756 | | | 62,756 | |
| Accounts payable and accrued expenses | 82,138 | | | 82,138 | |
| Total liabilities | 2,575,660 | | | 2,575,660 | |
| | | |
| Net Asset Value | $ | 2,815,460 | | | $ | 3,222,905 | |
| | | |
| Common stock and Operating Partnership units (“OP units”) outstanding | 333,092 | | | 333,092 | |
| Net Asset Value Per Share | $ | 8.45 | | | $ | 9.68 | |
(1)Represents our pro rata share of the properties owned by our joint ventures.
Our goal is to provide an estimate of the market value of our shares. However, the majority of our assets consist of commercial real estate, and as with any valuation methodology, the methodologies used were based upon a number of assumptions and estimates that may not have been accurate or complete. Different parties with different assumptions and estimates could have derived a different EVPS, and those differences could have been significant. These limitations are discussed further under “Limitations of Estimated Value per Share” below.
Valuation Methodologies—Our goal in calculating an EVPS was to arrive at a value that was reasonable and based off of what we deemed to be appropriate valuation and appraisal methodologies and assumptions and a process that was in accordance with the IPA Valuation Guidelines. The following is a summary of the valuation methodologies and components used to calculate the EVPS.
Independent Valuation Firm—Duff & Phelps was retained by us on February 27, 2020, as authorized by the independent directors of the Board, to provide independent valuation services. Duff & Phelps, who is not affiliated with us, is a leading global valuation advisor with expertise in complex valuation work. Duff & Phelps had previously provided services to us pertaining to the allocation of acquisition purchase prices for financial reporting purposes in connection with the Portfolio, for which it received usual and customary compensation. Duff & Phelps may be engaged to provide professional services to us in the future. The Duff & Phelps personnel who prepared the valuation had no present or prospective interest in the Portfolio and no personal interest with us.
Duff & Phelps’ engagement for its valuation services was not contingent upon developing or reporting predetermined results. In addition, Duff & Phelps’ compensation for completing the valuation services was not contingent upon the development or reporting of a predetermined value or direction in value that favors the cause of us, the amount of the value opinion, the attainment of a stipulated result, or the occurrence of a subsequent event directly related to the intended use of its Valuation Report. We agreed to indemnify Duff & Phelps against certain liabilities arising out of this engagement.
Duff & Phelps’ analyses, opinions, or conclusions were developed, and the Valuation Report was prepared, in conformity with the Uniform Standards of Professional Appraisal Practice. The Valuation Report was reviewed, approved and signed by individuals with the professional designation of MAI (Member of the Appraisal Institute). The use of the Valuation Report is subject to the requirements of the Appraisal Institute relating to review by its duly authorized representatives. Duff & Phelps did not inspect the properties that formed the Portfolio.
In preparing the Valuation Report, Duff & Phelps relied on information provided by us regarding the Portfolio. For example, we provided information regarding building size, year of construction, land size and other physical, financial, and economic characteristics. We also provided lease information, such as current rent amounts, rent commencement and expiration dates, and rent increase amounts and dates. Property-level cash flow projections were negatively impacted for the estimated effects of the COVID-19 pandemic.
Duff & Phelps did not investigate the legal description or legal matters relating to the Portfolio, including title or encumbrances, and title to the properties was assumed to be good and marketable. The Portfolio was also assumed to be free and clear of liens, easements, encroachments and other encumbrances, and to be in full compliance with zoning, use, occupancy, environmental and similar laws unless otherwise stated by us. The Valuation Report contains other assumptions, qualifications and limitations that qualify the analysis, opinions and conclusions set forth therein. Furthermore, the prices at which our real estate properties may actually be sold could differ from their appraised values.
The foregoing is a summary of the standard assumptions, qualifications and limitations that generally apply to the Valuation Report.
Real Estate Portfolio Valuation—Duff & Phelps estimated the “as is” market values of the Portfolio as of March 31, 2020, using various methodologies. Generally accepted valuation practice suggests assets may be valued using a range of methodologies. Duff & Phelps utilized the income capitalization approach with support from the sales comparison approach for each property. The income approach was the primary indicator of value, with secondary consideration given to the sales approach. Duff & Phelps performed a study of each market to measure current market conditions, supply and demand factors, growth patterns, and their effect on each of the subject properties.
The income capitalization approach simulates the reasoning of an investor who views the cash flows that would result from the anticipated revenue and expense on a property throughout its lifetime. Under the income capitalization approach, Duff & Phelps used an estimated net operating income (“NOI”) for each property, and then converted it to a value indication using a discounted cash flow analysis. The discounted cash flow analysis focuses on the operating cash flows expected from a property and the anticipated proceeds of a hypothetical sale at the end of an assumed holding period, with these amounts then being discounted to their present value. The discounted cash flow method is appropriate for the analysis of investment properties with multiple leases, particularly leases with cancellation clauses or renewal options, and especially in volatile markets.
The sales comparison approach estimates value based on what other purchasers and sellers in the market have agreed to as a price for comparable improved properties. This approach is based upon the principle of substitution, which states that the limits of prices, rents and rates tend to be set by the prevailing prices, rents and rates of equally desirable substitutes. Duff & Phelps gathered comparable sales data throughout various markets as secondary support for its valuation estimate.
The following summarizes the upper and lower bounds of the average terminal capitalization rates and discount rates that were used to arrive at the estimated market values of our Portfolio:
| | | | | |
| Range in Values |
Terminal Capitalization Rate | 7.08% - 7.58% |
Discount Rate | 7.69% - 8.19% |
Management Company Valuation—Duff & Phelps estimated the aggregate market value associated with our third-party asset management business using various methodologies. Duff & Phelps considered various applications of the income approach, market approach, and underlying assets approach, with the income approach determined to be the most reliable method for purposes of the analysis. The income approach analysis considered the projected fee income earned for services provided pursuant to various management and advisory agreements over the expected duration of that contract, assuming normal and customary renewal provisions. Such services include property management services performed for the properties in the Portfolio, as well as property and asset management services for certain unaffiliated real estate investment portfolios. In performing this analysis, solely fee income related to properties owned as of March 31, 2020 was considered. The income
approach also considered a reasonable level of expenses to support such activities, as well as other adjustments, and a discount rate that accounted for the time value of money and the risk of achieving the projected cash flows. All other assets and liabilities acquired are short term in nature and therefore the carrying value is considered to approximate the fair value. The result of the income approach analysis was the aggregate market value of the third-party asset management business, from which an estimated market value of net tangible assets (liabilities) was subtracted (added), to result in the aggregate intangible value of the management company.
Sensitivity Analysis—While we believe that Duff & Phelps’ assumptions and inputs were reasonable, a change in these assumptions would have impacted the calculations of the estimated value of the Portfolio, the estimated value of our third-party asset management business, and our EVPS. The table below illustrates the impact on Duff & Phelps’ range in EVPS if the terminal capitalization rates or discount rates were adjusted by 25 basis points and assumes all other factors remain unchanged. Additionally, the table illustrates the impact if only one change in assumptions was made, with all other factors held constant. Further, each of these assumptions could change by more than 25 basis points or 5%.
| | | | | | | | | | | | | | | | | | | | | | | |
| Resulting Range in Estimated Value Per Share |
| Increase of 25 basis points | | Decrease of 25 basis points | | Increase of 5% | | Decrease of 5% |
Terminal Capitalization Rate | $8.25 - $9.42 | | $8.81 - $10.10 | | $8.13 - $9.31 | | $8.95 - $10.24 |
Discount Rate | $8.23 - $9.43 | | $8.81 - $10.07 | | $8.06 - $9.28 | | $8.99 - $10.24 |
Other Assets and Other Liabilities—Duff & Phelps made adjustments to the aggregate estimated values of our investments to reflect our other assets and other liabilities based on balance sheet information provided by us as of March 31, 2020.
Role of the Independent Directors—The independent directors discussed the valuation process and results with representatives of Duff & Phelps. The independent directors also discussed the results, the Portfolio, the third-party asset management business, our other assets and liabilities, and other matters with management. Management recommended to the independent directors that $8.75 per share be approved as the EVPS of our common stock. The independent directors discussed the rationale for this value with management.
Following the independent directors’ discussion with Duff & Phelps and the recommendation of management, and in light of other factors considered by the independent directors, the independent directors concluded that the range in EVPS of $8.45 to $9.68 was appropriate. The independent directors agreed to accept the recommendation of management and approved $8.75 as the EVPS of our common stock as of March 31, 2020, which determination was ultimately and solely the responsibility of the independent directors.
Limitations of Estimated Value per Share—We are providing this EVPS to assist broker-dealers that participated in our public offering in meeting our customer account statement reporting obligations. This valuation was performed in accordance with the provisions of the IPA Valuation Guidelines. As with any valuation methodology, the methodologies used were based upon a number of estimates and assumptions that may not have been accurate or complete. Different parties with different assumptions and estimates could have derived a different EVPS, and this difference could have been significant. The EVPS is not audited andfigure does not represent a determinationthe actual number of beneficial owners of the fair value of our assets or liabilities based on accounting principles generally acceptedCompany’s common shares because common shares are frequently held in “street name” by securities dealers and others for the United States (“GAAP”), nor does it represent a liquidation value of our assets and liabilities,beneficial owners who may vote the price a third party would pay to acquire us, the price at which our shares of common stock would trade in secondary markets, or the amount at which our shares of common stock would trade on a national securities exchange.
Accordingly, we can give no assurance that:
•our shares would trade at or near the EVPS if listed on a national securities exchange;shares.
•a stockholder would be able to resell his or her shares at the EVPS;
•a stockholder would ultimately realize distributions per share equal to the EVPS upon a liquidation of our assets and settlement of our liabilities;
•a stockholder would receive an amount per share equal to the EVPS upon a sale of the Company;
•a third party would offer the EVPS in an arm’s-length transaction to purchase all or substantially all of our shares of common stock;
•another independent third-party appraiser or third-party valuation firm would agree with our EVPS; or
•the methodologies used to calculate our EVPS would be acceptable to FINRA for use on customer account statements or that the EVPS will satisfy the applicable annual valuation requirements under ERISA.
Further, aside from estimates regarding the impact of the COVID-19 pandemic, we have not made any adjustments to the valuation of our EVPS for the impact of other transactions occurring subsequent to March 31, 2020, including, but not limited to, (1) acquisitions or dispositions of assets, (2) the issuance of common stock under the Dividend Reinvestment Plan (“DRIP”), (3) NOI and dividends declared (see “Part II, Item 7. Management’s Discussion and Analysis of Financial Condition and Results of Operations - Non-GAAP Measures - Same-Center Net Operating Income” of this filing on Form 10-K for the calculation of NOI), (4) the repurchase of shares, and (5) changes in leases, tenancy, or other business and operational changes. The value of our shares of common stock will fluctuate over time in response to developments related to individual real estate assets, the management of those assets, and changes in the real estate and finance markets. Because of, among other factors, the high concentration of our total assets in real estate and the number of shares of our common stock outstanding, changes in the value of individual real estate assets or changes in valuation assumptions could have a very significant impact on the value of our shares of common stock. The EVPS does not take into account any disposition costs or fees for real estate properties, debt prepayment penalties that may be incurred upon the prepayment of certain of our debt obligations, or the impact of restrictions on the assumption of debt. Accordingly, the EVPS of our common stock may or may not be an accurate reflection of the fair market value of our stockholders’ investments and will not likely represent the amount of net proceeds that would result from an immediate sale of our assets.
DistributionsDISTRIBUTIONS—We elected to be taxed as a real estate investment trust (“REIT”) for federal income tax purposes commencing with our taxable year ended December 31, 2010. As a REIT, we have made, and intend to continue to make, distributions each taxable year equal to at least 90% of our taxable income (excluding capital gains and computed without regard to the dividends paid deduction).
In 2023, we declared and paid monthly distributions of $0.0933 per share, or $1.12 annualized, for each month beginning January 2023 through August 2023. On March 27, 2020,September 1, 2023, our Board suspended stockholderof Directors (the “Board”) authorized a 4.5% increase of our monthly distribution rate to $0.0975 per common share. We declared and paid monthly distributions effective after the payment of the March 2020 distribution on April 1, 2020, as a result of the uncertainty surrounding the COVID-19 pandemic. On November 4, 2020, our Board authorized distributions for the month of December 2020, for stockholders of record at the close of business on December 28, 2020, equal to a monthly amount of $0.02833333$0.0975 per share, or $1.17 annualized, for each month beginning September 2023 through December 2023.
The December 2023 and January 2024 distributions of common stock, or $0.34 annualized. On December 14, 2020, our Board announced that the date$0.0975 per share were paid on January 2, 2024 and February 1, 2024, respectively. Holders of record for December distributions was moved to December 31, 2020. ownership units of Phillips Edison Grocery Center Operating Partnership I, L.P. (the "Operating Partnership") ("OP unit holders receivedunits") will receive distributions at the same rate as common stockholders.stockholders, subject to any applicable withholding. The timing and amount of distributions are determined by our Board and is influenced in part by our intention to comply with REIT requirements of the Internal Revenue Code of 1986, as amended (the “IRC”).
In 2022, we declared and paid monthly distributions of $0.09 per share, or $1.08 annualized, for each month beginning January 2022 through August 2022. We declared and paid this distribution on January 12, 2021.monthly distributions of $0.0933 per share, or $1.12 annualized, an increase of 3.7%, for each month beginning September 2022 through December 2022.
Amended and Restated DRIP—We have adopted the DRIP, through which stockholders may elect to reinvest an amount equal to theThe tax characterization of our distributions declared on their shares of common stock into additional shares of our common stock in lieu of receiving cash distributions. In accordance withfor the DRIP, participants acquire shares of common stock at a price equal to the estimated value per share. Participants in the DRIP may purchase fractional shares so that 100% of the distributions may be used to acquire additional shares of our common stock. For the yearyears ended December 31, 2020, 1.4 million shares were issued through2023 and 2022 was as follows:
| | | | | | | | | | | |
| 2023 | | 2022 |
| Common stock: | | | |
| Ordinary dividends | 75.9 | % | | 77.4 | % |
| Non-dividend distributions | 24.0 | % | | 22.6 | % |
Capital gain distributions(1) | 0.1 | % | | — | % |
| Total distributions per share of common stock | 100.0 | % | | 100.0 | % |
(1)Pursuant to U.S. Treasury Regulation §1.1061-6(c) and §1061 of the DRIP, resulting in proceedsIRC, the One Year Amounts and Three Year Amounts disclosures are both zero with respect to direct and indirect holders of approximately $15.9 million. For the year ended December 31, 2019, 6.1 million shares were issued through the DRIP, resulting in proceeds of approximately $67.4 million.“applicable partnership interests” for us and our subsidiary REIT, Phillips Edison Institutional REIT, LLC for all years presented.
On March 27, 2020, the DRIP was suspended, and the March 2020 distribution was paid in all cash on April 1, 2020. On November 4, 2020, our Board reinstated the DRIP, which became effective beginning with the December 2020 distribution paid in January 2021.
Unregistered Sales of Equity SecuritiesUNREGISTERED SALE OF SECURITIES—During the year ended December 31, 2020,2023, we issued an aggregate of 3.0 millionapproximately 517,000 shares of common stock in redemption of 3.0 millionapproximately 517,000 OP units. These shares of common stock were issued in reliance on an exemption from registration under Section 4(a)(2) of the Securities Act of 1933, as amended. We relied on the exemption under Section 4(a)(2) based upon factual representations received from the limited partnerpartners who received the shares of common stock.
Share RepurchasesSHARE REPURCHASE PROGRAM—On August 7, 2019, the Board suspended the Share Repurchase Program (“SRP”) with respect to standard repurchases. The SRP for death, qualifying disability, or determination of incompetence (“DDI”) was suspended effective March 27, 2020, in response to the uncertainty of COVID-19.
On January 8, 2021, the Board adopted the Fourth Amended and Restated Share Repurchase Program (“Fourth Amended SRP”), effective January 14, 2021. Under the Fourth Amended SRP, share repurchases for DDI have been reinstated at $5.75 per share, and as of March 1, 2021, we have repurchased 0.1 million shares for a total value of $0.4 million. The SRP with respect to standard repurchases remains suspended.
Our Board may amend, suspend, or terminate the program upon 30 days’ notice. We may provide notice by including such information (a) in a current report on Form 8-K or in our annual or quarterly reports, all publicly filed with the U.S. Securities and Exchange Commission (“SEC”), or (b) in a separate mailing to the stockholders.
On November 4, 2020,3, 2022, our Board approved a voluntary tender offer that commenced on November 10, 2020 (the “Tender Offer”) fornew share repurchase program of up to 4.5$250 million sharesof common stock. The program may be suspended or discontinued at any time, and does not obligate us to repurchase any dollar amount or particular number of shares. No share repurchases have been made to date under this program.
| | | | | | | | | | | |
PHILLIPS EDISON & COMPANY DECEMBER 31, 2023 FORM 10-K | | | 27 |
The table below summarizes repurchases of our outstanding common stock at a price of $5.75 per share, for a total value of approximately $26 million. On December 14, 2020,made during the Tender Offer was amended to extend the expiration date to December 29, 2020, and the offer to purchase shares was increased to approximately 17.4 million shares, for a total value of approximately $100 million. All of the other terms and conditions of the Tender Offer remained unchanged. In connection with the Tender Offer, we repurchased 13.5 million shares of common stock for a total value of $77.6 million, which includes the issuance of 2.8 million common shares in redemption of 2.8 million OP units converted at the time of repurchase.
The following table presents all non-employee share repurchases for the yearsthree months ended December 31, 2020 and 2019 (in thousands, except per share amounts):2023:
| | | | | | | | | | | | | | |
| | 2020(1) | | 2019 |
| Shares repurchased | | 13,746 | | | 3,311 | |
| Cost of repurchases | | $ | 80,398 | | | $ | 35,963 | |
| Average repurchase price | | $ | 5.85 | | | $ | 10.86 | |
| | | | | | | | | | | | | | | | | | | | | | | |
| Period | Total Number of Shares Purchased | | Average Price Paid per Share | | Total Number of Shares Purchased as Part of a Publicly Announced Plan or Program | | Approximate Dollar Value of Shares That May Yet Be Purchased Under the Plan or Program (in thousands) |
| October 1, 2023 - October 31, 2023 | — | | $— | | — | | $250,000 |
| November 1, 2023 - November 30, 2023 | — | | — | | — | | 250,000 |
December 1, 2023 to December 31, 2023(1) | 21,649 | | 36.48 | | — | | 250,000 |
(1)The average repurchase price is comprised of share repurchases in connection with the Tender Offer, and the SRP for DDI prior to its suspension effective March 27, 2020.
In addition, during the year ended December 31, 2020, we repurchased approximately 36,000 shares for an aggregate purchase price of $0.4 million (average price of $11.07 per share) in connection withRepresents common shares surrendered to us to
satisfy statutory minimum tax withholding obligations associated with the vesting of restricted stock awards under our equity-based compensation plan.
During the quarter ended December 31, 2020, we repurchased shares as follows (shares in thousands):
| | | | | | | | | | | | | | | | | | | | | | | | | | |
| Period | | Total Number of Shares
Repurchased | | Average Price Paid per Share(1)(2) | | Total Number of Shares Purchased as Part of a Publicly Announced Plan or Program(1) | | Approximate Dollar Value of Shares That May Yet Be Repurchased Under the Program |
| October 2020 | | — | | $ | — | | | — | | (2) |
| November 2020 | | — | | — | | | — | | (2) |
| December 2020 | | 13,452 | | 5.75 | | | 13,452 | | (2) |
(1)PERFORMANCE GRAPH—Share repurchases made duringThe following graph is a comparison of the three months ended December 31, 2020 were madecumulative total return of shares of our common stock, the Standard and Poor’s 500 Composite Index (“S&P 500”), the FTSE Nareit All Equity REITs index (“FNER”), and the FTSE Nareit Equity Shopping Centers index (“FNSC”). The graph assumes that $100 was invested on July 15, 2021 and assumes the reinvestment of any dividends. The shareholder return shown on the graph below is not indicative of future performance. The information in connectionthis paragraph and the following performance graph are deemed “furnished”, not “filed”, with the Tender Offer.U.S. Securities and Exchange Commission (“SEC”) and is not to be incorporated by reference into any of our filings, whether made before or after the date hereof and irrespective of any general incorporation language contained in such filing, except as shall be expressly set forth by specific reference in such filing.
(2)As the SRP remained suspended as of December 31, 2020, the dollar value and number of shares that may be repurchased were subject to the limitations of the Tender Offer. As of December 31, 2020 all share repurchases in connection with the Tender Offer had been executed.
| | | | | | | | | | | | | | | | | | | | | | | | | | | | | | | | | | | |
| Ticker / Index | 7/15/2021 | | 12/31/2021 | | 6/30/2022 | | 12/31/2022 | | 6/30/2023 | | 12/31/2023 |
| PECO | $ | 100 | | | $ | 120 | | | $ | 124 | | | $ | 120 | | | $ | 131 | | | $ | 142 | |
| S&P 500 | 100 | | | 110 | | | 88 | | | 90 | | | 105 | | | 114 | |
| FTSE Nareit All Equity REITs | 100 | | | 113 | | | 90 | | | 85 | | | 90 | | | 97 | |
FTSE Nareit Equity Shopping
Centers | 100 | | | 114 | | | 93 | | | 100 | | | 101 | | | 112 | |
ITEM 6. SELECTED FINANCIAL DATA
| | | | | | | | | | | | | | | | | | | | | | | | | | | | | | | | | | | |
| As of and for the Years Ended December 31, |
| (in thousands, except per share amounts) | 2020 | | 2019 | | 2018 | | 2017 | | 2016 |
| Balance Sheet Data: | | | | | | | | | |
| Total investment in real estate assets | $ | 5,295,137 | | | $ | 5,257,999 | | | $ | 5,380,344 | | | $ | 3,751,927 | | | $ | 2,584,005 | |
| Cash and cash equivalents | 104,296 | | | 17,820 | | | 16,791 | | | 5,716 | | | 8,224 | |
| Total assets | 4,678,563 | | | 4,828,195 | | | 5,163,477 | | | 3,526,082 | | | 2,380,188 | |
| Debt obligations, net | 2,292,605 | | | 2,354,099 | | | 2,438,826 | | | 1,806,998 | | | 1,056,156 | |
| Operating Data: | | | | | | | | | |
| Total revenues | $ | 498,017 | | | $ | 536,706 | | | $ | 430,392 | | | $ | 311,543 | | | $ | 257,730 | |
| Property operating expenses | 87,490 | | | 90,900 | | | 77,209 | | | 53,824 | | | 41,890 | |
| Real estate tax expenses | 67,016 | | | 70,164 | | | 55,335 | | | 43,456 | | | 36,627 | |
| General and administrative expenses | 41,383 | | | 48,525 | | | 50,412 | | | 36,348 | | | 31,804 | |
| Impairment of real estate assets | 2,423 | | | 87,393 | | | 40,782 | | | — | | | — | |
| Interest expense, net | 85,303 | | | 103,174 | | | 72,642 | | | 45,661 | | | 32,458 | |
| Net income (loss) | 5,462 | | | (72,826) | | | 46,975 | | | (41,718) | | | 9,043 | |
| Net income (loss) attributable to stockholders | 4,772 | | | (63,532) | | | 39,138 | | | (38,391) | | | 8,932 | |
Other Operational Data:(1) | | | | | | | | | |
| NOI for real estate investments | $ | 332,023 | | | $ | 355,796 | | | $ | 272,450 | | | $ | 204,407 | | | $ | 173,910 | |
Funds from operations (“FFO”) attributable to stock-
holders and convertible noncontrolling interests | 221,681 | | | 217,010 | | | 156,222 | | | 84,150 | | | 110,406 | |
| Core FFO | 220,407 | | | 230,866 | | | 176,126 | | | 132,011 | | | 114,636 | |
| Cash Flow Data: | | | | | | | | | |
| Cash flows provided by operating activities | $ | 210,576 | | | $ | 226,875 | | | $ | 153,291 | | | $ | 108,861 | | | $ | 103,076 | |
| Cash flows (used in) provided by investing activities | (44,092) | | | 64,183 | | | (258,867) | | | (640,742) | | | (191,328) | |
| Cash flows (used in) provided by financing activities | (129,655) | | | (280,254) | | | 162,435 | | | 509,380 | | | 90,685 | |
| Per Share Data: | | | | | | | | | |
| Net income (loss) per share - basic and diluted | $ | 0.02 | | | $ | (0.22) | | | $ | 0.20 | | | $ | (0.21) | | | $ | 0.05 | |
| Common stock distributions declared per share | $ | 0.19 | | | $ | 0.67 | | | $ | 0.67 | | | $ | 0.67 | | | $ | 0.67 | |
| Weighted-average shares outstanding - basic | 290,280 | | | 283,909 | | | 196,602 | | | 183,784 | | | 183,876 | |
| Weighted-average shares outstanding - diluted | 333,466 | | | 327,117 | | | 241,367 | | | 196,497 | | | 186,665 | |
(1)
See “Part II, Item 7. Management's Discussion and Analysis of Financial Condition and Results of Operations - Non-GAAP Measures” of this filing on Form 10-K for further discussion and for a reconciliation of the non-GAAP financial measures to Net Income (Loss).
The selected financial data should be read in conjunction with the consolidated financial statements and notes appearing in this Annual Report on Form 10-K.
| | | | | | | | | | | |
PHILLIPS EDISON & COMPANY DECEMBER 31, 2023 FORM 10-K | | | 28 |
ITEM 7. MANAGEMENT’S DISCUSSION AND ANALYSIS OF FINANCIAL CONDITION AND RESULTS OF OPERATIONS
The following discussion and analysis should be read in conjunction with our accompanying consolidated financial statements and notes thereto. See also “Cautionary Note Regarding Forward-Looking Statements” preceding Part I.
Key Performance Indicators and Defined Terms | | |
| KEY PERFORMANCE INDICATORS AND DEFINED TERMS |
We use certain key performance indicators (“KPIs”), which include both financial and nonfinancial metrics, to measure the performance of our operations. We believe these KPIs, as well as the core concepts and terms defined below, allow our Board, management, and investors to analyze trends around our business strategy, financial condition, and results of operations in a manner that is focused on items unique to the retail real estate industry.
We do not consider our non-GAAP measures included as KPIs to be alternatives to measures required in accordance with GAAP.accounting principles generally accepted in the United States (“GAAP”). Certain non-GAAP measures should not be viewed as an alternative measure of our financial performance as they may not reflect the operations of our entire portfolio, and they may not reflect the impact of general and administrative expenses, depreciation and amortization, interest expense, other income (expense), or the level of capital expenditures and leasing costs necessary to maintain the operating performance of our propertiesshopping centers that could materially impact our results from operations. Additionally, certain non-GAAP measures should not be considered as an indication of our liquidity, nor as an indication of funds available to cover our cash needs, including our ability to fund distributions, and may not be a useful measure of the impact of long-term operating performance on value if we do not continue to operate our business in the manner currently contemplated. Accordingly, non-GAAP measures should be reviewed in connection with other GAAP measurements and should not be viewed as more prominent measures of performance than net income (loss) or cash flows from operations prepared in accordance with GAAP. Other REITs may use different methodologies for calculating similar non-GAAP measures, and accordingly, our non-GAAP measures may not be comparable to other REITs.
Our KPIs and terminology can be grouped into three key areas:
PortfolioPORTFOLIO—Portfolio metrics help management to gauge the health of our centers overall and individually.
•Anchor space—We define an anchor space as a space greater than or equal to 10,000 square feet of gross leasable area (“GLA”).
•Annualized Base Rent (“ABR”)—We use ABR to refer to the monthly contractual base rent asat the end of December 31, 2020,the period multiplied by twelve months.
•ABR perPer Square Foot (“PSF”)—This metric is calculated by dividing ABR by leased GLA. Increases in ABR PSF can be an indication of our ability to create rental rate growth in our centers, as well as an indication of demand for our spaces, which generally provides us with greater leverage during lease negotiations.
•Inline space—We define an inline space as a space containing less than 10,000 square feet of GLA.
•GLA—We use GLA to refer to the total occupied and unoccupied square footage of a building that is available for tenants (whom we refer to as a “Neighbor” or our “Neighbors”) or other retailers to lease.
•Inline space—We define an inline space as a space containing less than 10,000 square feet of GLA.
•Leased Occupancy—This metric is calculated as the percentage of total GLA for which a lease has been signed regardless of whether the lease has commenced or the Neighbor has taken possession. High occupancy is an indicator of demand for our spaces, which generally provides us with greater leverage during lease negotiations.
Leasing•Underwritten incremental unlevered yield—This reflects the yield we target to generate from a project upon expected stabilization and is calculated as the estimated incremental net operating income (“NOI”) for a project at stabilization divided by its estimated net project investment. The estimated incremental NOI is the difference between the estimated annualized NOI we target to generate by a project upon stabilization and the estimated annualized NOI without the planned improvements. Underwritten incremental unlevered yield does not include peripheral impacts, such as lease rollover risk or the impact on the long term value of the property upon sale or disposition. Actual incremental unlevered yields may vary from our underwritten incremental unlevered yield range based on the actual total cost to complete a project and its actual incremental NOI at stabilization.
LEASING—Leasing is a key driver of growth for our company.
•Comparable lease—We use this term to refer to a lease with consistent terms that is executed for substantially the exact same space (location and square feet) in which a Neighbor was previously located 365 days from the earlier of legal possession or the day the prior Neighbor physically vacated the space.that has been vacant less than twelve months.
•Comparable rent spread—This metric is calculated as being the percentage increase or decrease in first-year ABR (excluding any free rent or escalations) on new or renewal leases (excluding options) as compared towhere the rent on an expiring lease with the same lease terms and for the same unit, if such unit was occupied within the past twelve months.considered a comparable lease. This metric provides an indication of our ability to generate revenue growth through leasing activity.
•Cost of executing new leases—We use this term to refer to certain costs associated with new leasing, namely, leasing commissions, tenant improvement costs, landlord work, and tenant concessions. The costs associated with landlord work are excluded for repositioning and redevelopment projects, if any.
•Portfolio retention rate—This metric is calculated by dividing (a)(i) the total square feet of retained Neighbors with current period lease expirations by (b)(ii) the total square feet of leases expiring during the period. The portfolio retention rate provides insight into our ability to retain Neighbors at our shopping centers as their leases approach expiration. Generally, the costs to retain an existing Neighbor are lower than costs to replace with a new neighbor.Neighbor.
| | | | | | | | | | | |
PHILLIPS EDISON & COMPANY DECEMBER 31, 2023 FORM 10-K | | | 29 |
•Recovery rate—This metric is calculated by dividing (a)(i) total recovery income by (b)(ii) total recoverable expenses during the period. A high recovery rate is an indicator of our ability to recover certain property operating expenses and capital costs from our Neighbors.
Financial PerformanceFINANCIAL PERFORMANCE—In addition to financial metrics calculated in accordance with GAAP, such as net income or cash flows from operations, we utilize non-GAAP metrics to measure our operational and financial performance. See the section within this Item 7 titled Management’s Discussion and Analysis of Financial Condition and Results of Operations - Non-GAAP Measures“Non-GAAP Measures” below for further discussion on the following metrics.
•Adjusted Earnings Before Interest, Taxes, Depreciation, and Amortization for Real Estate (“Adjusted EBITDAre”)—To arrive at Adjusted EBITDAre, we adjust EBITDAre, as defined below, to exclude certain recurring and non-recurring items including, but not limited to: (i) changes in the fair value of the earn-out liability; (ii) other impairment charges; (iii) amortization of basis differences in our investments in our unconsolidated joint ventures; and (iv) transaction and acquisition expenses.expenses; and (v) realized performance income. We use EBITDAre and Adjusted EBITDAre as additional measures of operating performance which allow us to compare earnings independent of capital structure and evaluate debt leverage and fixed cost coverage.
•Core FFO—Funds From Operations Attributable to Stockholders and OP Unit Holders (“Core FFO”)—To arrive at Core FFO, we adjust Nareit FFO, attributable to stockholders and convertible noncontrolling interests, as defined below, to exclude certain recurring and non-recurring items including, but not limited to: (i) depreciation and amortization of corporate assets; (ii) changes in the fair value of the earn-out liability; (iii) amortization of unconsolidated joint venture basis differences; (iv) gains or losses on the extinguishment or modification of debt and other; (v) other impairment charges; and (vi) transaction and acquisition expenses.expenses; and (vii) realized performance income. We believe Nareit FFO provides insight into our operating performance as it excludes certain items that are not indicative of such performance. Core FFO provides further insight into the sustainability of our operating performance and provides an additional measure to compare our performance across reporting periods on a consistent basis by excluding items that may cause short-term fluctuations in net income (loss).
•EBITDAre—The National Association of Real Estate Investment Trusts (“Nareit”) defines EBITDAre as net income (loss) computed in accordance with GAAP before: (i) interest expense; (ii) income tax expense; (iii) depreciation and amortization; (iv) gains or losses from disposition of depreciable property; and (v) impairment write-downs of depreciable property. Adjustments for unconsolidated partnerships and joint ventures are calculated to reflect EBITDAre on the same basis.
•FFO—Equity Market Capitalization—We calculate equity market capitalization as the total dollar value of all outstanding shares using the closing price for the applicable date.
•Nareit FFO Attributable to Stockholders and OP Unit Holders (“Nareit FFO”)—Nareit defines FFOFunds From Operations (“FFO”) as net income (loss) computed in accordance with GAAP, excluding: (i) gains (or losses) from sales of property and gains (or losses) from change in control; (ii) depreciation and amortization;amortization related to real estate; (iii) impairment losses on real estate and impairments of in-substance real estate investments in investees that are driven by measurable decreases in the fair value of the depreciable real estate held by the unconsolidated partnerships and joint ventures; and (iv) adjustments for unconsolidated partnerships and joint ventures, calculated to reflect FFO on the same basis. We calculate Nareit FFO in a manner consistent with the Nareit definition.
•Net Debt—We calculate net debt as total debt, excluding discounts, market adjustments, and deferred financing expenses, less cash and cash equivalents.
•Net Debt to Adjusted EBITDAre—This ratio is calculated by dividing net debt by Adjusted EBITDAre (included on an annualized basis within the calculation). It provides insight into our leverage rate based on earnings and is not impacted by fluctuations in our equity price.
•Net Debt to Total Enterprise Value—This ratio is calculated by dividing net debt by total enterprise value.value, as defined below. It provides insight into our capital structure and usage of debt.
•NOI—We calculate NOI as total operating revenues, adjusted to exclude non-cash revenue items, less property operating expenses and real estate taxes. NOI provides insight about our financial and operating performance because it provides a performance measure of the revenues and expenses directly involved in owning and operating real estate assets and provides a perspective not immediately apparent from net income (loss).
•Same-Center—We use this term to refer to a property, or portfolio of properties, that have been owned and operational for the entirety of eachthe last two reporting periodperiods (i.e., since January 1, 2019)2022).
•Total Enterprise Value—We calculate total enterprise value as our net debt plus our equity market capitalization on a fully diluted basis.
We are an internally-manageda REIT and one of the nation’s largest owners and operators of omni-channel grocery-anchored shopping centers. The majorityOur portfolio primarily consists of neighborhood centers anchored by the #1 or #2 grocer tenants by sales within their respective formats by trade area. Our Neighbors are a mix of national, regional, and local retailers that primarily provide necessity-based goods and services.
As of December 31, 2023, we owned equity interests in 301 shopping centers, including 281 wholly-owned shopping centers and 20 shopping centers owned through one unconsolidated joint venture, which comprised approximately 34.4 million square feet in 31 states. In addition to managing our revenue is lease revenue derived fromshopping centers, our real estate investments. Additionally, we operate anthird-party investment management business providing property management and advisory services to over $515 million of third-party assets. This business provides comprehensive real estate and asset management services to two institutionalour unconsolidated joint ventures in which we retain an ownership interest, and one private fund (collectively, the “Managed Funds”).
On October 1, 2020, Grocery Retail Partners I LLC (“GRP I”), a joint venture with Northwestern Mutual Life Insurance Company (“Northwestern Mutual”) in which we own an equity interest, acquired Grocery Retail Partners II LLC (“GRP II”), an additional joint venture with Northwestern Mutual in which we owned an equity interest. Our ownership in the combined entity was adjusted upon consummation of the transaction, and we own approximately a 14% interest in GRP I as a result of the acquisition.34
| | | | | | | | | | | |
PHILLIPS EDISON & COMPANY DECEMBER 31, 2023 FORM 10-K | | | 30 |
BASIS OF PRESENTATION—The basis of presentation of our shares of common stock is described as follows:
•Reverse Stock Split—On July 2, 2021, our Board approved an amendment to our charter to effect a one-for-three reverse stock split. Concurrent with the reverse split, the Operating Partnership enacted a one-for-three reverse split of its outstanding OP units. Unless otherwise indicated, the information in this Form 10-K gives effect to the reverse stock and OP unit splits (see Note 12).
•Recapitalization—On June 18, 2021, our stockholders approved an amendment to our charter (the “Articles of Amendment”) that effected a change of each share of our common stock outstanding at the time the amendment became effective into one share of a newly created class of Class B common stock (the “Recapitalization”). The Articles of Amendment became effective upon filing with, and acceptance by, the State Department of Assessments and Taxation of Maryland on July 2, 2021. Unless otherwise indicated, all information in this Form 10-K gives effect to the Recapitalization and references to “shares” and per share metrics refer to our common stock and Class B common stock, collectively. Our Class B common stock automatically converted into our publicly traded common stock on January 18, 2022 (see Note 12). Prior to the conversion, we have presented common stock and Class B common stock as separate classes within our consolidated balance sheets and consolidated statements of equity. On May 5, 2022, we filed Articles Supplementary to our charter with the Maryland State Department of Assessments and Taxation in order to reclassify and designate all of the 350 million authorized shares of our Class B common stock, $0.01 par value per share, all of which were unissued at such time, as shares of our common stock, $0.01 par value per share. We no longer have Class B common stock authorized for issue.
AT-THE-MARKET OFFERING (“ATM”)—On February 10, 2022, we and the Operating Partnership entered into a sales agreement relating to the potential sale of shares of common stock pursuant to a continuous offering program. In accordance with the terms of the sales agreement, we may offer and sell shares of our common stock having an aggregate offering price of up to $250 million from time to time through our sales agents, or, if applicable, as forward sellers. During the three months ended December 31, 2023, we issued 2.2 million shares of our common stock at a gross weighted average price of $35.92 per share under the ATM program for net proceeds of $77.5 million, after approximately $0.8 million in commissions. During the year ended December 31, 2023, we issued 4.2 million shares of our common stock at a gross weighted average price of $35.76 per share under the ATM program for net proceeds of $147.6 million, after approximately $1.5 million in commissions. During the three months ended December 31, 2022, no shares were issued under the ATM program. During the year ended December 31, 2022, we issued 2.6 million shares of our common stock at a gross weighted average price of $34.23 per share under the ATM program for net proceeds of $89.2 million, after approximately $0.9 million in commissions. As of December 31, 2023, approximately $10.8 million of common stock remained available for issuance under the ATM program.
Subsequent to December 31, 2023, we issued approximately 46,000 additional shares of our common stock at a gross weighted average price of $37.05 per share under the ATM program for net proceeds of $1.7 million, after approximately $17,000 in commissions.
PORTFOLIO AND LEASING STATISTICS—Below are statistical highlights of our wholly-owned portfolio:portfolio as of December 31, 2023 and 2022 (dollars and square feet in thousands):
| | December 31, 2020 | | December 31, 2019 |
| 2023 | | | 2023 | | 2022 |
| Number of properties | Number of properties | 283 | | | 287 | |
| Number of states | Number of states | 31 | | | 31 | |
| Total square feet (in thousands) | 31,709 | | | 32,130 | |
| Leased % of rentable square feet: | |
| Total square feet | |
| ABR | |
| % ABR from omni-channel grocery-anchored shopping centers | | % ABR from omni-channel grocery-anchored shopping centers | 97.2 | % | | 97.2 | % |
| Leased occupancy %: | |
| Total portfolio spaces | |
| Total portfolio spaces | |
| Total portfolio spaces | Total portfolio spaces | 94.7 | % | | 95.4 | % | 97.4 | % | | 97.4 | % |
| Anchor spaces | Anchor spaces | 97.6 | % | | 98.0 | % | Anchor spaces | 98.9 | % | | 99.3 | % |
| Inline spaces | Inline spaces | 88.9 | % | | 90.2 | % | Inline spaces | 94.7 | % | | 93.8 | % |
Average remaining lease term (in years)(1) | Average remaining lease term (in years)(1) | 4.5 | | | 4.7 | |
| % ABR from grocery-anchored properties | 97.3 | % | | 97.0 | % |
(1)The average remaining lease term in years excludes future options to extend the term of the lease.
COVID-19 StrategyFINANCIAL HIGHLIGHTS—During the first quarter of 2020, the COVID-19 pandemic began spreading globally, with the outbreak being classified as a pandemic by the World Health Organization on March 11, 2020. As a result of the pandemic, many state governments issued “stay-at-home” mandates that generally limited travelOwning, operating, and movement of the general public to essential activities only and required all non-essential businesses to close. In response to the pandemic, we implemented the following initiatives:
•We suspended stockholder distributions after the March 2020 distribution, and resumed distributions beginning with the December 2020 distribution paid in January 2021 (see Note 13 for more detail);
•We suspended the SRP for DDI, which was reinstated in January 2021;
•Our Compensation Committee approved temporary reductions to compensation which remained in place through December 2020, including: a 25% reduction to the base salary of our chief executive officer; a 10% reduction to the base salaries of our president, chief operating officer, chief financial officer, and general counsel; and a 10% reduction to board members’ base compensation for the 2020-2021 term;
•We have implemented expense reductions at the property and corporate levels which remained in place through December 2020, including reductions to our workforce and travel costs; and
•Our capital investments were prioritized to support the reopening of our Neighbors and new leasing activity, or deferred if possible.
In May 2020, many state governments began lifting, in whole or in part, the “stay-at-home” mandates, effectively removing or lessening the limitations on travel and allowing many businesses to reopen in full or limited capacity. The impact these measures and the resulting consumer behavior are having on our portfolio has evolved since May 2020, and we expect it to continue to do so. Our management team has determined the following are key indicators of recovery for our portfolio and is executing a strategy to guide our Neighbors through these phases (all statistics are approximate and include the prorated portion attributable to properties owned through our joint ventures):
•Assisting Neighbors in Reopening—Our wholly-owned properties and those owned through our joint ventures contained approximately 5,500 occupied Neighbor spaces as of March 8, 2021. At the peak of the pandemic-related closure activity in April 2020, temporary closures reached 37% of all Neighbor spaces, totaling 27% of our ABR and 22% of our GLA. As of March 8, 2021, 98% of our occupied Neighbor spaces, totaling 99% of our ABR and GLA, are open for business. Neighbors who remain temporarily closed generally retain this status as a result of government mandates, either through direct orders which prohibit reopening or because they have determined that operating restrictions as a result of such mandates make reopening unprofitable. In order to facilitate communication with our Neighbors, we launched PECO ConnectTM,a webpage designed to provide resources, information, and tools to assist our Neighbors in reopening as states lifted “stay-at-home” requirements and other restrictions.
•Returning to Monthly Payments—We continue to work with our Neighbors to resume normal monthly rent payments. Our efforts have included raising awareness of the benefits available through the Coronavirus Aid, Relief, and Economic Security Act, including the Paycheck Protection Program and Health Care Enhancement Act (collectively, the “CARES Act”) and other small business programs.
As our Neighbors have reopened, we have seen our collections continue to improve from the second quarter. The following table summarizes our collections by quarter, as they were originally reported as well as updated for payments received subsequent to the month billed:
| | | | | | | | | | | |
| Originally Reported | | Current(1) |
Q2 2020(2) | 86 | % | | 93 | % |
Q3 2020(3) | 94 | % | | 95 | % |
| Q4 2020 | N/A | | 95 | % |
(1)Including collections received through March 8, 2021.
(2)As reported in our Current Report on Form 8-K filed with the SEC on August 12, 2020.
(3)As reported in our Quarterly Report on Form 10-Q filed with the SEC on November 9, 2020.
Further, as of March 8, 2021, our collections for January and February 2021 were approximately 94% in total. Additionally, 57% of our Neighbors are paying their rent in full as of March 8, 2021.
•Recovering Missed Rent Charges—We believe substantially all Neighbors, including those that were required to temporarily close under governmental mandates, are contractually obligated to continue with their rent payments as documented in our lease agreements with them. Since April 2020, a portion of our Neighbors have missed making certain rent payments charged, and we are working with our Neighbors to collect such charges. We believe that it is best to begin negotiation of relief only once a Neighbor has reopened, and we have continued to see payments made toward rent and recovery charges owed. We have granted relief in the form of payment plans, and we may grant rent abatements or forgiveness to certain Neighbors based on an evaluation of characteristics such as their merchandising profile, role in the shopping center, and overall assessment of future financial health. For active Neighbors as of March 8, 2021, these payment plans and rent abatements represented approximately 2% and 1% of portfolio ABR, respectively. As of March 8, 2021, approximately 87% of payments are scheduled to be received through December 31, 2021 for all executed payment plans. The weighted-average remaining term over which we expect to receive payment on executed payment plans is approximately twelve months. As of March 8, 2021, 70% of our Neighbors with executed payment plans are current or have fully paid on their rent obligations.
COVID-19 Operational Update—While our management team has guided many of our Neighbors through the phases of reopening and resuming monthly payments, the COVID-19 pandemic has impacted our financial position and results from operations primarily as a result of reduced revenue, most notably from Neighbors that have been determined to be a credit risk, and from lower rent collections. During the COVID-19 pandemic, we have been closely monitoring the status of our Neighbors to identify those who potentially pose a credit risk in order to appropriately account for the impact to revenue and in order to quickly take action when a Neighbor was ultimately unable to remain in a space.
The current economic environment has increased the uncertainty of collecting rents from a number of our Neighbors. For Neighbors with a higher degree of uncertainty, we may not record revenue for amounts billed until the cash is received. Based on our analysis, no individual Neighbor category was deemed to be entirely non-creditworthy as of December 31, 2020; however, we continue to evaluate each Neighbor’s creditworthiness on an individual basis. For the year ended December 31, 2020, inclusive of the prorated portion attributable to properties owned through our joint ventures, we had $28.5 million in monthly revenue that will not be recognized until cash is collected or the Neighbor resumes payment and is considered creditworthy. As of December 31, 2020, our Neighbors deemed to be non-creditworthy represented approximately 12.8% of our total active Neighbors.
Additionally, certain of our Neighbors have entered into bankruptcy proceedings. While some of these cases have already been resolved, with the assumption or rejection of the lease already reflected in our results, other claims have yet to be resolved, and as such, the potential fallout is not yet reflected in our occupancy rate or ABR metrics. Neighbors in bankruptcy who continue to occupy space in our shopping centers represent an exposure of less than 1% of our total portfolio ABR as of December 31, 2020. We have included our assessment of the impact of these bankruptcies in our estimate of rent collectibility, which impacted recorded revenue, as noted previously.
We are in negotiations with additional Neighbors, which we believe will lead to more Neighbors repaying their past due charges. We will continue to work with Neighbors on establishing plans to repay past due amounts, and will monitor the impact of such payment plans on our results of operations in future quarters. We cannot guarantee that we will ultimately be able to collect past due amounts. For our entire portfolio, inclusive of our prorated share of properties owned through joint ventures, 56% of missed monthly charges in 2020 have been collected subsequent to the month billed and 9% have been waived, as of March 8, 2021.
Distributions and Equity Activity—On November 4, 2020, our Board reinstated monthly stockholder distributions beginning December 2020 to stockholders of record as of December 31, 2020, which was paid on January 12, 2021. Distributions were paid for January and February 2021. Additionally, our Board has approved distributions of $0.02833333 per share for March 2021.
Additionally, we executed the Tender Offer for 13.5 million shares of common stock at a price of $5.75 per share which resulted in a total value of $77.6 million. This included the issuance of 2.8 million common shares in redemption of 2.8 million OP units converted at the time of repurchase. This price was lower than the EVPS of $8.75, reflecting the Board’s acknowledgment that the share prices of our publicly-traded peers in the shopping center REIT sector had declined significantly below their respective estimated net asset values, primarily as a result of the ongoing market uncertainty caused by the COVID-19 pandemic. Accordingly, the Board believed that if our shares were listed on a national securities exchange, the price of our shares of common stock might similarly trade at a discount to our EVPS.
On January 8, 2021, the Board adopted the Fourth Amended SRP. Under the Fourth Amended SRP, share repurchases for DDI have been reinstated at $5.75 per share, and as of March 1, 2021, we have repurchased 0.1 million shares for a total value of $0.4 million (see Note 13 for more detail). The SRP with respect to standard repurchases remains suspended.
The previously announced one-for-four reverse stock split has been delayed subject to market conditions.
Financial Highlights—Investing inmanaging well-occupied omni-channel grocery-anchored real estate is a core part of our business strategy, and as of December 31, 2020, 97.3%2023, 97.2% of our ABR was derived from omni-channel grocery-anchored shopping centers. As of December 31, 2020,2023, total leased occupancy only declined 0.7% to 94.7%,remained high at 97.4% and inline occupancy decreased 1.3%improved 0.9% to 88.9%94.7%, when compared to December 31, 2019. We believe that our investment focus on grocery-anchored shopping centers that provide daily necessities, coupled with the execution of our capital recycling program in recent years, left our portfolio well-positioned to weather the economic downturn in 2020 resulting from the COVID-19 pandemic. In turn, this allowed us to mitigate the negative impact on our financial results. Despite the impact of COVID-19,2022. Our financial performance highlights during 20202023 are as follows:
•Net income of $5.5$63.8 million, as compared to a net lossan increase of $72.8$9.2 million from a year ago, largely owing to lower impairments in 2020primarily due to strong operating performance attributable to our Same-Center portfolio and the successful executionnet impact of our capital recycling program in recent years.2023 acquisition and disposition activity.
•Core FFO decreased by $10.5 million to $220.4 million, and declined by $0.04 to $0.66 per diluted share.share improved by $0.07 to $2.34, primarily due to our strong operating performance.
•Same-Center NOI decreased 4.1%improved 4.2% to $328.0$396.6 million.
•Our Board reinstated monthly stockholder distributions beginning December 2020.Acquired $278.5 million and disposed of $6.3 million of assets, executing our external growth strategy while improving portfolio quality with our dispositions.
| | | | | | | | | | | |
PHILLIPS EDISON & COMPANY DECEMBER 31, 2023 FORM 10-K | | | 31 |
•CompletedDeclared and paid monthly distributions of $0.0933 per share, or $1.12 annualized, for each month beginning January 2023 through August 2023, and increased monthly distributions to $0.0975 per share, or $1.17 annualized, for the Tender Offer which resulted in the repurchaseremainder of 13.5 million shares of common stock.2023.
•Net debt to Adjusted EBITDAre - annualized was 7.3x as compared to 7.2x during the same period a year ago.
Executing on our StrategyEXECUTING OUR STRATEGY—Our performance for the year is linked to our key initiatives: focus on core operations, strategic growthdifferentiated and portfolio management,focused strategy, integrated operating platform, and responsible balance sheet management. We believe these initiatives will improveresult in long-term growth and value creation to all of our position for a full-cycle liquidity event.stakeholders.
Focus on Core OperationsDifferentiated and Focused Strategy—The COVID-19 pandemic had a significant impact onWe actively monitor the commercial real estate sector for shopping centers that meet our operational focus during 2020 which requiredinvestment objectives. Our effective shelf registration statement and ATM program allow us to access equity and debt capital that we intend to use, in part, to grow our operations team to make a shift towards the recoveryportfolio of assets. Highlights of our portfolio, including assisting our Neighbors in reopeningasset composition and returning to monthly rent payments. Our leasing activity slowed compared to 2019, which was a record-setting leasing year for us. Despite this decline, our diversity of Neighbors and concentration of necessity-based and internet-resistant retail has allowed us to maintain our high level of occupancy in 2020 as compared to 2019. Our wholly-owned property leasing highlightsacquisitions are as follows:
•As of March 8, 2021, 98% of our occupied Neighbor spaces, totaling 99%97.2% of our ABR and GLA, are open for business.was derived from omni-channel grocery-anchored shopping centers as of December 31, 2023.
•As of March 8, 2021, we have collected 94% of our rent and recovery billings originally charged from April toOur grocer health ratio, or occupancy cost, remains strong at 2.3% at December 2020, with 56% of the missed charges being collected subsequent31, 2023, which is favorable compared to the month in which they were billed.national grocer average occupancy cost.
•We executed 861 leases (new, renewal, and options) totaling 4.7 millionIn 2023, our grocer sales increased 6% year-over-year to $681 per square feet during the year ended December 31, 2020, which was a decline from a record 1,026 leases totaling 4.6 millionfoot. Grocer sales per square feet executed during the year ended December 31,foot have increased approximately 30% since 2019. Demand for our well-located grocery-anchored retail space increased during the third and fourth quarters in 2020, approaching the 2019 leasing levels.
•Total70.4% of our ABR per leased square foot for new leases executed improved 8.0% to $16.14was derived from Neighbors providing necessity-based goods and inline ABR per leased square foot for new leases executed improved 5.7% to $18.11 during the year ended December 31, 2020.services.
Strategic•The average PECO space, excluding anchors, is approximately 2,300 square feet. This size is attractive to many retailers, whereas large box format retailers are fewer and demand is thinner.
•Acquired eleven properties and three outparcels for a net cash outlay of $270.3 million, adding 1.1 million of GLA to our portfolio.
Internal Growth and Portfolio ManagementThrough Our Integrated Operating Platform—Our currentWe have focused on improving our occupancy through leasing vacant spaces, increasing lease revenue through rent growth, and executing development and redevelopment projects focus on outparcel development, anchor repositioning, and other initiatives to increase growth and NOI at our centers, while our investment management business is identifying opportunities for joint ventures with third parties, both of which will create additional revenue opportunities. As a result of the COVID-19 pandemic, our capital investments during 2020 were prioritized to support the reopening of our Neighbors and new leasing activity, or deferred if possible. Expansion of our investment management business has been delayed and disrupted as investors were cautious of new retail investments during a pandemic. Highlights of our development and redevelopment projects, as well as our investment management businesswholly-owned operational activity as of and for the year ended December 31, 20202023 are as follows:
•AsLeased occupancy for our wholly-owned portfolio remained high at 97.4% as of December 31, 2023, and inline occupancy improved 0.9% to 94.7%, when compared to December 31, 2022.
•Total ABR PSF for executed new leases improved 12.6% to $21.75, and inline ABR PSF for executed new leases improved 6.8% to $25.98 during the year ended December 31, 2020,2023.
•For the year ended December 31, 2023, we had 35completed 13 development and redevelopment projects completed orencompassing a total of 0.2 million square feet with a total investment of $34.1 million.
•As of December 31, 2023, we have nine development and redevelopment projects in process, which we estimate will comprisehave a total investment of $87.0$33.7 million.
•Created an additional $2.9$2.7 million of incremental ABR in 20202023 as a result of development and redevelopment projects completed in 2019.2022.
•Recognized $5.7 million in fee and management income from GRP I and GRP II (prior to its acquisition by GRP I) and $1.6 million from NRP for the year ended December 31, 2020.
Responsible Balance Sheet Management Positioned for External Growth—Our management teambalance sheet has executed strategiesa leverage profile that well-positions us to create funds that will be usedmaintain and improve our investment grade rating, fund distributions to reinvest into acquisitions, for developmentour stockholders, and redevelopment projects,invest in our targeted acquisitions. As of December 31, 2023,we had $615.4 million of total liquidity, comprised of $8.9 million of cash, cash equivalents, and to repay outstanding debt. This includes identifying mature properties whererestricted cash, plus $606.6 million of borrowing capacity available on our growth potential has been maximized and properties at risk of future deterioration, and we are engaging in targeted dispositions of those properties. Additionally, we have reinstated our distributions at a lower rate as compared to previous years to preserve and retain cash flow. Due to the impact of COVID-19, our disposition activity was lower than anticipated during 2020 as the transaction market was sparse as a result of the COVID-19 pandemic.$800 million revolving credit facility. Our balance sheet management highlights as of and for the year ended December 31, 20202023 are as follows:
•We realized $57.9issued 4.2 million shares of cashour common stock under the ATM program for net proceeds from the sale of seven properties$147.6 million.
•We amended three senior unsecured term loans with a total notional amount of $475 million scheduled to mature during 2024. The three senior unsecured term loans, as amended, have a total notional amount of $484.8 million and one outparcel.are scheduled to mature between 2026 (extendable with two one-year options to 2028) and 2027.
•Our management team borrowed $200 million on our revolving line of credit in April 2020 to maximize our financial flexibility amid uncertainty related to the impact of the COVID-19 pandemic. We were able to repay the full amount of this borrowing in June 2020,current investment grade ratings are Baa3 (Outlook: Stable) with Moody’s Investors Services and did not borrow on our revolving line of credit for the remainder of 2020.BBB- (Outlook: Positive) with S&P Global Ratings.
•We utilized cash accumulated throughout the year to repurchase 13.5 million shares under the Tender Offer, benefiting shareholders seeking liquidity while providing value accretion toAs of December 31, 2023, our existing shareholders.wholly-owned properties were approximately 84% unencumbered.
•Our ratio of net debt to Adjusted EBITDAre was 7.3x5.1x as of December 31, 2020,2023, as compared to 7.2x5.3x as of December 31, 20192022 (see “Liquidity and Capital Resources - Debt”Financial Leverage Ratios” below for a discussion and calculation).
| | | | | | | | | | | |
PHILLIPS EDISON & COMPANY DECEMBER 31, 2023 FORM 10-K | | | 32 |
•We paid down $30.0 million in term loan debt maturing in 2021 as well as executed early repaymentsAs of $24.5 million in mortgage debt, reducingDecember 31, 2023, our net outstanding debt obligations by 2.6% fromhad a year ago.
•Following our activity this year,weighted-average maturity of 3.9 years excluding all extension options. As of December 31, 2023, our debt maturity profile as of December 31, 2020with the respective principal payment obligations is as follows (including the impact of derivatives on weighted-average interest rates)rates and excluding all extension options)(1):
| | | | | | | | | | | |
PHILLIPS EDISON & COMPANY DECEMBER 31, 2023 FORM 10-K | | | 33 |
Leasing ActivityLEASING ACTIVITY—Our decline in leasing activity as compared to 2019, a record leasing year, was primarily a result of the COVID-19 pandemic. While we saw leasing activity slow in the second quarter of 2020, it has since recovered to activity levels comparable to those in prior periods. The average rent per square foot and cost of executing leases fluctuates based on the Neighbor mix, size of the leased space, and lease term. Leases with national and regional Neighbors generally require a higher cost per square foot to execute than those with local Neighbors. However, generally such national and regional Neighbors will also pay higher rates for a longer term.
Below is a summary of leasing activity for our wholly-owned properties for the years ended December 31, 20202023 and 2019:2022(1):
| | Total Deals (1) | | Inline Deals(1) |
| 2020 | | 2019 | | 2020 | | 2019 |
| | Total Deals | | | | Total Deals | | Inline Deals |
| | 2023 | | | | 2023 | | 2022 | | 2023 | | 2022 |
| New leases: | New leases: | |
| Number of leases | |
| Number of leases | |
| Number of leases | Number of leases | | 383 | | | 429 | | | 363 | | | 411 | |
| Square footage (in thousands) | Square footage (in thousands) | | 1,290 | | | 1,475 | | | 957 | | | 1,050 | |
| ABR (in thousands) | ABR (in thousands) | | $ | 20,823 | | | $ | 22,050 | | | $ | 17,325 | | | $ | 17,998 | |
| ABR per square foot | | $ | 16.14 | | | $ | 14.95 | | | $ | 18.11 | | | $ | 17.14 | |
| Cost per square foot of executing new leases | | $ | 26.14 | | | $ | 24.00 | | | $ | 28.58 | | | $ | 26.63 | |
| ABR PSF | |
| Cost PSF of executing new leases | |
| Number of comparable leases | Number of comparable leases | | 127 | | | 140 | | | 125 | | | 135 | |
| Comparable rent spread | Comparable rent spread | | 8.2 | % | | 13.3 | % | | 10.9 | % | | 11.2 | % | Comparable rent spread | | 25.2 | % | | 32.2 | % | | 24.8 | % | | 26.5 | % |
| Weighted average lease term (in years) | Weighted average lease term (in years) | | 7.6 | | | 7.5 | | | 6.7 | | | 6.8 | |
| Renewals and options: | Renewals and options: | |
| Number of leases | Number of leases | | 478 | | | 597 | | | 422 | | | 542 | |
| Number of leases | |
| Number of leases | |
| Square footage (in thousands) | Square footage (in thousands) | | 3,420 | | | 3,171 | | | 986 | | | 1,186 | |
| ABR (in thousands) | ABR (in thousands) | | $ | 41,290 | | | $ | 38,969 | | | $ | 20,976 | | | $ | 24,675 | |
| ABR per square foot | | $ | 12.07 | | | $ | 12.29 | | | $ | 21.27 | | | $ | 20.80 | |
| ABR per square foot prior to renewals | | $ | 11.49 | | | $ | 11.49 | | | $ | 19.77 | | | $ | 18.87 | |
| Percentage increase in ABR per square foot | | 5.1 | % | | 7.0 | % | | 7.6 | % | | 10.2 | % |
| Cost per square foot of executing renewals and options | | $ | 2.65 | | | $ | 2.53 | | | $ | 4.18 | | | $ | 4.33 | |
| Number of comparable leases | | 365 | | | 460 | | | 349 | | | 441 | |
| Comparable rent spread | | 6.7 | % | | 8.5 | % | | 8.0 | % | | 11.4 | % |
| ABR PSF | |
| ABR PSF prior to renewals | |
| Percentage increase in ABR PSF | | Percentage increase in ABR PSF | | 10.8 | % | | 9.3 | % | | 15.7 | % | | 13.4 | % |
| Cost PSF of executing renewals and options | |
Number of comparable leases(2) | |
Comparable rent spread(2) | | Comparable rent spread(2) | | 16.2 | % | | 14.6 | % | | 17.7 | % | | 15.2 | % |
| Weighted average lease term (in years) | Weighted average lease term (in years) | | 5.1 | | | 4.7 | | | 3.9 | | | 4.4 | |
| Portfolio retention rate | Portfolio retention rate | | 85.2 | % | | 85.7 | % | | 72.8 | % | | 77.7 | % | Portfolio retention rate | | 93.9 | % | | 90.7 | % | | 84.9 | % | | 77.5 | % |
(1)Per square footPSF amounts may not recalculate exactly based on other amounts presented within the table due to rounding.
(2)Excludes exercise of options.
Known Trends and Uncertainties of the COVID-19 Pandemic
KNOWN TRENDS AND UNCERTAINTIES—The COVID-19 pandemic has impacted our results beginning with the second quarter largely in the form of reduced revenue, where our estimates around collectibility have created volatility in our earnings. We anticipate these trends will continue into 2021, and the totaleconomy continues to face inflation risk, which may negatively impact on revenue in the future cannot be determined at this time. The duration of the pandemic and mitigating measures, and the resulting economic impact, has caused some of our Neighbors and increase our operating and construction costs. Substantially all of our leases contain provisions designed to permanently vacatemitigate the adverse effect of inflation, including requirements for Neighbors to pay their spaces and/or not renew their leases. Under such circumstances, weallocable share of operating expenses that includes common area maintenance, utilities, real estate taxes, insurance, and certain capital expenditures. Additionally, many of our leases are for terms of less than ten years, which allows us to target increased rents to current market rates upon renewal.
In addition to inflation, macroeconomic and geopolitical risks may have difficulty leasingcreate challenges that could negatively impact market conditions in the United States. Additionally, the policies implemented to address these spacesrisks, including raising interest rates, could result in adverse impacts on the sameUnited States economy, including a slowing of growth or better terms or at all, and/or incur additional costs to lease vacant spaces, which may reduce our occupancy rates in the future and ultimately reduce our revenue. Extended periods of vacancy or reduced revenues may trigger impairments of our real estate assets. Additionally, these factors may impact disposition activity by decreasing demand and negatively impacting capitalization rates. Our disposition and acquisition activity has been reduced aspotentially a result of the pandemic during 2020.recession.
The ongoing impact of the COVID-19 pandemic and the resulting economic downturn will likely continue to be significant to our results of operations into 2021 and potentially beyond as a result of a number of factors outside of our control. These factors include, but are not limited to: overall economic conditions on both a macro and micro level, including consumer demand as well as retailer demand for space within our shopping centers; the impact of social distancing guidelines, recommendations from governmental authorities, and consumer shopping preferences; the nature and effectiveness of any economic stimulus or relief measures; the timing of availability and distribution of vaccines to the general public; and the impact of all of the factors above, including other potentially unknown factors, on our Neighbors’ ability to continue paying rent and related charges on time or at all and Neighbors’ willingness to renew their leases on the same terms or at all. These factors have impacted our results from operations, and may continue to do so into the future. The primary impact to our results has been reduced revenue from Neighbor concessions, increased collectibility reserves, and decreased recovery rates on expenses. Other unforeseen impacts may also arise in the course of operating during these circumstances. See “Part II. Item 7. Management’s Discussion and Analysis of Financial Condition and Results of Operations - Overview” of this filing on Form 10-K for our observation of Neighbor impacts through March 8, 2021.
| | | | | | | | | | | |
PHILLIPS EDISON & COMPANY DECEMBER 31, 2023 FORM 10-K | | | 34 |
In December 2020, the United States Food and Drug Administration issued emergency use authorizations for two vaccines for the prevention of COVID-19. The timeline for distribution of the vaccines to the public is determined at the state level, and consequently, the timeline for the removal of governmental mandates implemented to combat the spread of the virus may vary by state or locality. At this time, we are unable to ascertain the timing of any such events, and thus are unable to predict with certainty the impact that the vaccines and their effect in mitigating the spread of COVID-19 may have on our financial results.SUMMARY OF OPERATING ACTIVITIES FOR THE YEARS ENDED DECEMBER 31, 2023 AND 2022
Overall, we believe that our investment focus on grocery-anchored shopping centers that provide daily necessities has helped, and will continue to help, lessen the negative effect of the COVID-19 pandemic on our business compared to non-grocery anchored shopping centers. We are closely monitoring the occupancy, operating performance, and Neighbor sales results at our centers, including those Neighbors operating with reduced hours or under government-imposed restrictions. Further, we have taken action to maximize our financial flexibility by implementing expense reductions at the property and corporate level; prioritizing capital projects to support the reopening of our Neighbors and new leasing activity, or deferring if possible; temporarily suspending monthly distributions; and temporarily suspending share repurchases for DDI.
Summary of Operating Activities for the Years Ended December 31, 2020 and 2019
| | Favorable (Unfavorable) Change |
| (dollars in thousands, except per share amounts) | | 2020 | | 2019 | | $ | | %(1) |
| | | | | | Favorable (Unfavorable) Change | | | | | | | | Favorable (Unfavorable) Change |
| (Dollars in thousands) | | (Dollars in thousands) | | 2023 | | 2022 | | $ | | %(1) |
| Revenues: | Revenues: | |
| Rental income | Rental income | | $ | 485,483 | | | $ | 522,270 | | | $ | (36,787) | | | (7.0) | % |
| Fee and management income | | 9,820 | | | 11,680 | | | (1,860) | | | (15.9) | % |
| Rental income | |
| Rental income | | | $ | 597,501 | | | $ | 560,538 | | | $ | 36,963 | | | 6.6 | % |
| Fees and management income | | Fees and management income | | 9,646 | | | 11,541 | | | (1,895) | | | (16.4) | % |
| Other property income | Other property income | | 2,714 | | | 2,756 | | | (42) | | | (1.5) | % | Other property income | | 2,977 | | | 3,293 | | 3,293 | | | (316) | | (316) | | | (9.6) | | (9.6) | % |
| Total revenues | Total revenues | | 498,017 | | | 536,706 | | | (38,689) | | | (7.2) | % | Total revenues | | 610,124 | | | 575,372 | | 575,372 | | | 34,752 | | 34,752 | | | 6.0 | | 6.0 | % |
| Operating Expenses: | Operating Expenses: | |
| Property operating expenses | | 87,490 | | | 90,900 | | | 3,410 | | | 3.8 | % |
| Real estate tax expenses | | 67,016 | | | 70,164 | | | 3,148 | | | 4.5 | % |
| General and administrative expenses | | 41,383 | | | 48,525 | | | 7,142 | | | 14.7 | % |
| Property operating | |
| Property operating | |
| Property operating | | | 102,303 | | | 95,359 | | | (6,944) | | | (7.3) | % |
| Real estate taxes | | Real estate taxes | | 72,816 | | | 67,864 | | | (4,952) | | | (7.3) | % |
| General and administrative | | General and administrative | | 44,366 | | | 45,235 | | | 869 | | | 1.9 | % |
| Depreciation and amortization | Depreciation and amortization | | 224,679 | | | 236,870 | | | 12,191 | | | 5.1 | % | Depreciation and amortization | | 236,443 | | | 236,224 | | 236,224 | | | (219) | | (219) | | | (0.1) | | (0.1) | % |
| Impairment of real estate assets | Impairment of real estate assets | | 2,423 | | | 87,393 | | | 84,970 | | | 97.2 | % | Impairment of real estate assets | | — | | | 322 | | 322 | | | 322 | | 322 | | | NM | | NM |
| Total operating expenses | Total operating expenses | | 422,991 | | | 533,852 | | | 110,861 | | | 20.8 | % | Total operating expenses | | 455,928 | | | 445,004 | | 445,004 | | | (10,924) | | (10,924) | | | (2.5) | | (2.5) | % |
| Other: | Other: | |
| Interest expense, net | Interest expense, net | | (85,303) | | | (103,174) | | | 17,871 | | | 17.3 | % |
| Interest expense, net | |
| Interest expense, net | | | (84,232) | | | (71,196) | | | (13,036) | | | (18.3) | % |
| Gain on disposal of property, net | Gain on disposal of property, net | | 6,494 | | | 28,170 | | | (21,676) | | | (76.9) | % | Gain on disposal of property, net | | 1,110 | | | 7,517 | | 7,517 | | | (6,407) | | (6,407) | | | (85.2) | | (85.2) | % |
| Other income (expense), net | | 9,245 | | | (676) | | | 9,921 | | | NM |
| Net income (loss) | | 5,462 | | | (72,826) | | | 78,288 | | | 107.5 | % |
| Net (income) loss attributable to noncontrolling interests | | (690) | | | 9,294 | | | (9,984) | | | (107.4) | % |
| Net income (loss) attributable to stockholders | | $ | 4,772 | | | $ | (63,532) | | | $ | 68,304 | | | 107.5 | % |
| Other expense, net | | Other expense, net | | (7,312) | | | (12,160) | | | 4,848 | | | 39.9 | % |
| Net income | | Net income | | 63,762 | | | 54,529 | | | 9,233 | | | 16.9 | % |
| Net income attributable to noncontrolling interests | | Net income attributable to noncontrolling interests | | (6,914) | | | (6,206) | | | (708) | | | (11.4) | % |
| Net income attributable to stockholders | | Net income attributable to stockholders | | $ | 56,848 | | | $ | 48,323 | | | $ | 8,525 | | | 17.6 | % |
(1)Line items that result in a percent change that exceed certain limitations are considered not meaningful (“NM”) and indicated as such.
Our basis for analyzing significant fluctuations in our results of operations generally includes review of the results of our same-center portfolio, non-same-center portfolio, and revenues and expenses from our management activities. OurWe define our same-center portfolio as the 262 properties that were owned and operational prior to January 1, 2022. We define our non-same-center portfolio as those properties that were not fully owned and operational in both periods owing primarily to real estate asset activity occurring after December 31, 2021, which includes 28five properties disposed of and seven18 properties acquired after December 31, 2018.acquired. Below are explanations of the significant fluctuations in the results of operations for the years ended December 31, 20202023 and 2019:2022:
Rental Income decreased $36.8increased $37.0 million as follows:
•$20.719.3 million decreaseincrease related to our same-center portfolio primarily as follows:
▪$26.8 million decrease largely due to the COVID-19 pandemic and its economic impact. This includes an increased number of Neighbors we have identified as a credit risk which resulted in a decrease to rental income of $24.4 million, including a $3.1 million reduction in revenues due to reserves on straight-line rent adjustments for the related leases. Additionally, we saw a $2.4 million decrease due to rent abatement;
▪$2.8 million decrease primarily due to non-cash straight-line rent amortization;
▪$7.116.6 million increase primarily due to a $0.23$0.41 increase in average minimum rent per square footPSF and a 0.8%1.1% improvement in average occupancy; and
▪$2.07.3 million increase in recovery income primarily due to an increase in recoverable income attributed to an increase in real estate taxes, common area maintenance spending, and insurance costs as well as a $3.1 million increase owing largely to higher recoverable insurance expenses and higher same-center occupancy,1.1% improvement in average occupancy; partially offset by a $1.1
▪$2.2 million decrease primarily due to collections in recoverable utilities.2022 of amounts previously reserved; and
▪$1.3 million decrease primarily due to lower lease buyout income.
•$16.117.7 million decreaseincrease primarily related to our acquisition activity, net disposition of 21 properties.dispositions.
FeeFees and Management Income:
•The $1.9$1.9 milliondecrease in feefees and management income iswas primarily due to fees no longer received from REIT III following its acquisition by us$0.1 million realized performance income in October 2019; a decrease2023 compared to $2.7 million in fees received from NRP, primarily due2022 for the achievement of certain performance targets related to property dispositions; and lower rent and recovery collections for our unconsolidatedNecessity Retail Partners (“NRP”) joint ventures as a result of the COVID-19 pandemic, which resulted in lower management fees paid to us. This offsets improvements in fees received from GRP I and GRP II (prior its acquisition by GRP I).venture.
Property Operating Expenses decreased $3.4increased $6.9 million primarily as follows:
•$0.3 million decrease related to our same-center portfolio and corporate operating activities:
▪$1.4 million decrease primarily due to reduced performance compensation;
▪$1.2 million decrease primarily in connection with our expense reduction initiatives, including $0.8 million largely owing to lower maintenance and utility costs, and $0.4 million largely owing to lower travel expenses; and
▪$2.34.3 million increase in insurance expenses owing to a higher volume of claims and higher market rates.
•$3.1 million decrease related to our net disposition of 21 properties.
Real Estate Taxes decreased $3.1 million as follows:
•$1.1 million decrease related to our same-center portfolio primarily as a result of successful real estate tax appeals; and
•$2.0 million decrease related to our net disposition of 21 properties.
General and Administrative Expenses:
•The $7.1 million decrease in general and administrative expenses was primarily related to expense reductions taken to reduce the impact of the COVID-19 pandemic, with the majority of these decreases related to compensation.
Depreciation and Amortization decreased $12.2 million as follows:
•$7.6 million decrease related to our net disposition of 21 properties; and
•$4.6 million decrease related tofrom our same-center portfolio and corporate operating activities primarily due to intangible assets becoming fully amortized by December 31, 2019.increases in recoverable expenses attributable to higher common area maintenance spending, along with higher insurance and compensation costs; and
Impairment of Real Estate Assets:
•Our$2.6 million increase primarily due to our acquisition activity, net of dispositions.
Real Estate Tax Expenses:
•The $5.0 million increase in real estate tax expenses is primarily due to our acquisition activity, net of dispositions, and less appeal settlement income in 2023 compared to 2022.
| | | | | | | | | | | |
PHILLIPS EDISON & COMPANY DECEMBER 31, 2023 FORM 10-K | | | 35 |
General and Administrative Expenses:
•The $0.9 million decrease in impairment of real estate assets of $85.0 million wasgeneral and administrative expenses is primarily due to a lower volume of assets under contract or actively marketed for sale at a disposition price that was less than the carrying valuedecrease in 2020 as compared to 2019, the proceeds from which were used to fund tax-efficient acquisitions, to fund redevelopment opportunities in owned centers,directors and for general corporate purposes. We continue to sell non-core assets and may potentially recognize impairments in future quarters, but our anticipated disposition activity was reduced due to market conditions as a result of the COVID-19 pandemic.officers insurance.
Interest Expense, Net:
•The $17.9$13.0 million decreaseincrease during the year ended December 31, 20202023 as compared to the same period in 20192022 was largelyprimarily due to the decreasehigher interest rates in LIBOR and expiring interest rate swaps in 2020 as well as repricing activities that occurred in 2019.2023 partially offset by lower loss on extinguishment or modification of debt. Interest Expense, Net was comprised of the following (dollars in thousands):
| | Year Ended December 31, |
| 2020 | | 2019 |
| Year Ended December 31, | | | Year Ended December 31, |
| 2023 | | | 2023 | | 2022 |
| Interest on unsecured term loans and senior notes, net | | Interest on unsecured term loans and senior notes, net | $ | 48,803 | | $ | 40,975 |
| Interest on secured debt | | Interest on secured debt | 18,614 | | 20,768 |
| Interest on revolving credit facility, net | Interest on revolving credit facility, net | $ | 1,668 | | $ | 1,827 | Interest on revolving credit facility, net | 8,785 | | 2,069 |
| Interest on term loans, net | 46,798 | | 62,745 |
| Interest on secured debt | 29,001 | | 23,048 |
| Loss on extinguishment or modification of debt, net | 4 | | 2,238 |
| Non-cash amortization and other | Non-cash amortization and other | 7,832 | | 13,316 | Non-cash amortization and other | 7,662 | | 6,359 |
Loss on extinguishment or modification of debt and other, net(1) | | Loss on extinguishment or modification of debt and other, net(1) | 368 | | 1,025 |
| Interest expense, net | Interest expense, net | $ | 85,303 | | $ | 103,174 | Interest expense, net | $ | 84,232 | | $ | 71,196 |
| | Weighted-average interest rate as of end of year | Weighted-average interest rate as of end of year | 3.1 | % | | 3.4 | % |
| Weighted-average interest rate as of end of year | |
| Weighted-average interest rate as of end of year | | 4.2 | % | | 3.6 | % |
| Weighted-average term (in years) as of end of year | Weighted-average term (in years) as of end of year | 4.1 | | 5.0 | Weighted-average term (in years) as of end of year | 3.9 | | 4.4 |
(1)Includes defeasance fees related to early repayments of debt.
Gain on Disposal of Property, Net:
•The $21.7$6.4 million decrease was primarily related to the sale of seven properties (plus other miscellaneous disposalsland acquired by local authorities, as well as the sale of one property and write-offs)two outparcels with a net gain of $6.5$1.1 million during the year ended December 31, 2020,2023, as compared to the sale of 21four properties and four outparcels with a net gain of $28.2$7.5 million during the year ended December 31, 20192022 (see Note 5)4).
Other Income (Expense),Expense, Net:
•The $9.9 million change was largely due to other impairment charges of $9.7 million in connection with the REIT III public offering during the year ended December 31, 2019, which included $7.8 million of impairment charges related
to our corporate intangible asset and $1.9 million of impairment charges related to organization and offering costs. Other Income (Expense),Expense, Net was comprised of the following (dollars in(in thousands):
| | | | | | | | | | | |
| Year Ended December 31, |
| 2020 | | 2019 |
| Change in fair value of earn-out liability | $ | 10,000 | | | $ | 7,500 | |
| Equity in (loss) income of unconsolidated joint ventures | (31) | | | 1,069 | |
| Transaction and acquisition expenses | (539) | | | (598) | |
| Federal, state, and local income tax expense | (491) | | | (785) | |
| Other impairment charges | (359) | | | (9,661) | |
| Settlement of property acquisition-related liabilities | 510 | | | 1,360 | |
| Other | 155 | | | 439 | |
| Other income (expense), net | $ | 9,245 | | | $ | (676) | |
| | | | | | | | | | | |
| Year Ended December 31, |
| 2023 | | 2022 |
| Transaction and acquisition expenses | $ | (5,675) | | | $ | (10,551) | |
| Impairment of investment in third parties (see Note 15) | (3,000) | | | — | |
| Federal, state, and local income tax expense | (438) | | | (806) | |
| Equity in net income of unconsolidated investments | 372 | | | 1,280 | |
| Change in fair value of earn-out liability (see Note 16) | — | | | (1,809) | |
| Other | 1,429 | | | (274) | |
| Other expense, net | $ | (7,312) | | | $ | (12,160) | |
Summary of Operating Activities for the Years Ended DecemberSUMMARY OF OPERATING ACTIVITIES FOR THE YEARS ENDED DECEMBER 31, 2019 and 20182022 AND 2021
See “Key Performance Indicators and Defined Terms”above for additional information related to the following non-GAAP measures.
Same-Center Net Operating IncomeSAME-CENTER NOI—We present Same-Center NOI is presented as a supplemental measure of our performance. We define NOIperformance, as total operating revenues, adjusted to exclude non-cash revenue items, less property operating expenses and real estate taxes. For the three months and years ended December 31, 2020 and 2019, Same-Center NOI represents the NOI for the 275 properties that were wholly-owned and operational for the entire portion of both comparable reporting periods. We believe Same-Center NOI provides useful information to our investors about our financial and operating performance because it provides a performance measure of the revenues and expenses directly involved in owning and operating real estate assets and provides a perspective not immediately apparent from net income (loss). Because Same-Center NOI excludes the change in NOI from properties acquired or disposed of after December 31, 2018, it highlights operating trends such as occupancy levels, rental rates, and operating costs on properties that were operational for both comparable periods.our same-center portfolio. Other REITs may use different methodologies for calculating Same-Center NOI, and accordingly, our Same-Center NOI may not be comparable to other REITs. For the years ended December 31, 2023 and 2022, Same-Center NOI represents the NOI for the 262 properties that were wholly-owned and operational for the entire portion of all comparable reporting periods.
| | | | | | | | | | | |
PHILLIPS EDISON & COMPANY DECEMBER 31, 2023 FORM 10-K | | | 36 |
Same-Center NOI should not be viewed as an alternative measure of our financial performance as it does not reflect the operations of our entire portfolio, nor does it reflect the impact of general and administrative expenses, depreciation and amortization, interest expense, other income (expense), or the level of capital expenditures and leasing costs necessary to maintain the operating performance of our properties that could materially impact our results from operations.
The table below compares Same-Center NOI for the years ended December 31, 20202023 and 20192022 (dollars in thousands):
| | | | Favorable (Unfavorable) |
| 2020 | | 2019 | | $ Change | | % Change |
| | | | Favorable (Unfavorable) | | | | | | Favorable (Unfavorable) |
| | 2023 | | | | 2023 | | 2022 | | $ Change | | % Change |
| Revenues: | Revenues: | |
Rental income(1) | Rental income(1) | | $ | 364,998 | | | $ | 360,548 | | | $ | 4,450 | | |
Rental income(1) | |
Rental income(1) | |
| Tenant recovery income | |
| Tenant recovery income | |
| Tenant recovery income | Tenant recovery income | | 122,835 | | | 120,870 | | | 1,965 | | |
Reserves for uncollectibility(2) | Reserves for uncollectibility(2) | | (26,458) | | | (5,179) | | | (21,279) | | |
Reserves for uncollectibility(2) | |
Reserves for uncollectibility(2) | |
| Other property income | Other property income | | 2,609 | | | 2,552 | | | 57 | | |
| Other property income | |
| Other property income | |
| Total revenues | |
| Total revenues | |
| Total revenues | Total revenues | | 463,984 | | | 478,791 | | | (14,807) | | | (3.1) | % | | 549,320 | | | 527,332 | | 527,332 | | | 21,988 | | 21,988 | | | 4.2 | | 4.2 | % |
| Operating expenses: | Operating expenses: | |
| Property operating expenses | Property operating expenses | | 70,270 | | | 70,208 | | | (62) | | |
| Property operating expenses | |
| Property operating expenses | |
| Real estate taxes | |
| Real estate taxes | |
| Real estate taxes | Real estate taxes | | 65,727 | | | 66,461 | | | 734 | | |
| Total operating expenses | Total operating expenses | | 135,997 | | | 136,669 | | | 672 | | | 0.5 | % |
| Total operating expenses | |
| Total operating expenses | | | 152,704 | | | 146,867 | | | (5,837) | | | (4.0) | % |
| Total Same-Center NOI | Total Same-Center NOI | | $ | 327,987 | | | $ | 342,122 | | | $ | (14,135) | | | (4.1) | % | Total Same-Center NOI | | $ | 396,616 | | | $ | | $ | 380,465 | | | $ | | $ | 16,151 | | | 4.2 | | 4.2 | % |
(1)Excludes straight-line rental income, net amortization of above- and below-market leases, and lease buyout income.
(2)Includes billings that will not be recognized as revenue until cash is collected or the Neighbor resumes regular payments and/or is considered creditworthy.we deem it appropriate to resume recording revenue on an accrual basis, rather than on a cash basis.
Same-Center Net Operating IncomeNOI Reconciliation—Below is a reconciliation of Net Income (Loss)to NOI and Same-Center NOI for the years ended December 31, 20202023 and 20192022 (in thousands):
| | 2020 | | 2019 |
| Net income (loss) | $ | 5,462 | | | $ | (72,826) | |
| 2023 | | | 2023 | | 2022 |
| Net income | |
| Adjusted to exclude: | Adjusted to exclude: | |
| Fees and management income | Fees and management income | (9,820) | | | (11,680) | |
| Fees and management income | |
| Fees and management income | |
Straight-line rental income(1) | Straight-line rental income(1) | (3,356) | | | (9,079) | |
Net amortization of above- and below- market leases | (3,173) | | | (4,185) | |
| Net amortization of above- and below-market leases | |
| Lease buyout income | Lease buyout income | (1,237) | | | (1,166) | |
| General and administrative expenses | General and administrative expenses | 41,383 | | | 48,525 | |
| Depreciation and amortization | Depreciation and amortization | 224,679 | | | 236,870 | |
| Impairment of real estate assets | Impairment of real estate assets | 2,423 | | | 87,393 | |
| Interest expense, net | Interest expense, net | 85,303 | | | 103,174 | |
| Gain on disposal of property, net | Gain on disposal of property, net | (6,494) | | | (28,170) | |
| Other (income) expense, net | (9,245) | | | 676 | |
| Other expense, net | |
| Property operating expenses related to fees and management income | Property operating expenses related to fees and management income | 6,098 | | | 6,264 | |
| NOI for real estate investments | NOI for real estate investments | 332,023 | | | 355,796 | |
Less: Non-same-center NOI(2) | Less: Non-same-center NOI(2) | (4,036) | | | (13,674) | |
| Total Same-Center NOI | Total Same-Center NOI | $ | 327,987 | | | $ | 342,122 | |
(1)Includes straight-line rent adjustments for Neighbors deemed to be non-creditworthy.for whom revenue is being recorded on a cash basis.
(2)Includes operating revenues and expenses from non-same-center properties which includes properties acquired or sold and corporate activities.
Funds from Operations and Core Funds from OperationsNAREIT FFO AND CORE FFO—Nareit FFO is a non-GAAP financial performance financial measure that is widely recognized as a measure of REIT operating performance. The National Association of Real Estate Investment Trusts (“Nareit”) defines FFO as net income (loss) computed in accordance with GAAP, excluding gains (or losses) from sales of property and gains (or losses) from change in control, plus depreciation and amortization, and after adjustments for impairment losses on real estate and impairments of in-substance real estate investments in investees that are driven by measurable decreases in the fair value of the depreciable real estate held by the unconsolidated partnerships and joint ventures. Adjustments for unconsolidated partnerships and joint ventures are calculated to reflect FFO on the same basis. We calculate FFO Attributable to Stockholders and Convertible Noncontrolling Interests in a manner consistent with the Nareit definition, with an additional adjustment made for noncontrolling interests that are not convertible into common stock.
Core FFO is an additional financial performance financial measure used by us as Nareit FFO includes certain non-comparable items that affect our performance over time. We believe that Core FFO is helpful in assisting management and investors with the assessment ofassessing the sustainability of our operating performance in future periods. We believe it is more reflective of our core operating performance and provides an additional measure to compare our performance across reporting periods on a consistent basis by excluding items that may cause short-term fluctuations in net income (loss). To arrive at Core
| | | | | | | | | | | |
PHILLIPS EDISON & COMPANY DECEMBER 31, 2023 FORM 10-K | | | 37 |
Nareit FFO we adjust FFO attributable to stockholders and convertible noncontrolling interests to exclude certain recurring and non-recurring items including, but not limited to, depreciation and amortization of corporate assets, changes in the fair value of the earn-out liability, amortization of unconsolidated joint venture basis differences, gains or losses on the extinguishment or modification of debt, other impairment charges, and transaction and acquisition expenses.
FFO, FFO Attributable to Stockholders and Convertible Noncontrolling Interests, and Core FFO should not be considered alternatives to net income (loss) under GAAP, as an indication of our liquidity, nor as an indication of funds available to cover our cash needs, including our ability to fund distributions. Core FFO may not be a useful measure of the impact of long-term operating performance on value if we do not continue to operate our business plan in the manner currently contemplated.
Accordingly, Nareit FFO FFO Attributable to Stockholders and Convertible Noncontrolling Interests, and Core FFO should be reviewed in connection with other GAAP measurements, and should not be viewed as more prominent measures of performance than net income (loss) or cash flows from operations prepared in accordance with GAAP. Our Nareit FFO FFO Attributable to Stockholders and Convertible Noncontrolling Interests, and Core FFO, as presented, may not be comparable to amounts calculated by other REITs.
The following table presents our calculation of Nareit FFO FFO Attributable to Stockholders and Convertible Noncontrolling Interests, and Core FFO and provides additional information related to our operations for the years ended December 31, 2020, 2019,2023, 2022, and 20182021 (in thousands, except per share amounts):
| | | | | | | | | | | | | | | | | |
| | 2020 | | 2019 | | 2018 |
Calculation of FFO Attributable to Stockholders and
Convertible Noncontrolling Interests | | | | | |
| Net income (loss) | $ | 5,462 | | | $ | (72,826) | | | $ | 46,975 | |
| Adjustments: | | | | | |
| Depreciation and amortization of real estate assets | 218,738 | | | 231,023 | | | 177,504 | |
| Impairment of real estate assets | 2,423 | | | 87,393 | | | 40,782 | |
| Gain on the disposal of property, net | (6,494) | | | (28,170) | | | (109,300) | |
| Adjustments related to unconsolidated joint ventures | 1,552 | | | (128) | | | 560 | |
| FFO attributable to the Company | 221,681 | | | 217,292 | | | 156,521 | |
Adjustments attributable to noncontrolling interests
not convertible into common stock | — | | | (282) | | | (299) | |
FFO attributable to stockholders and convertible
noncontrolling interests | $ | 221,681 | | | $ | 217,010 | | | $ | 156,222 | |
| Calculation of Core FFO | | | | | |
FFO attributable to stockholders and convertible
noncontrolling interests | $ | 221,681 | | | $ | 217,010 | | | $ | 156,222 | |
| Adjustments: | | | | | |
| Depreciation and amortization of corporate assets | 5,941 | | | 5,847 | | | 13,779 | |
| Change in fair value of earn-out liability and derivatives | (10,000) | | | (7,500) | | | 2,393 | |
| Other impairment charges | 359 | | | 9,661 | | | — | |
Amortization of unconsolidated joint venture
basis differences | 1,883 | | | 2,854 | | | 167 | |
| Loss (gain) on extinguishment or modification of debt, net | 4 | | | 2,238 | | | (93) | |
| Transaction and acquisition expenses | 539 | | | 598 | | | 3,426 | |
| Other | — | | | 158 | | | 232 | |
| Core FFO | $ | 220,407 | | | $ | 230,866 | | | $ | 176,126 | |
| | | | | |
FFO Attributable to Stockholders and Convertible
Noncontrolling Interests/Core FFO per share | | | | | |
Weighted-average common shares outstanding - diluted(1) | 333,466 | | | 327,510 | | | 241,367 | |
FFO attributable to stockholders and convertible
noncontrolling interests per share - diluted | $ | 0.66 | | | $ | 0.66 | | | $ | 0.65 | |
| Core FFO per share - diluted | $ | 0.66 | | | $ | 0.70 | | | $ | 0.73 | |
| | | | | | | | | | | | | | | | | |
| | 2023 | | 2022 | | 2021 |
| Calculation of Nareit FFO Attributable to Stockholders and OP Unit Holders | | | | | |
| Net income | $ | 63,762 | | | $ | 54,529 | | | $ | 17,233 | |
| Adjustments: | | | | | |
| Depreciation and amortization of real estate assets | 234,260 | | | 232,571 | | | 217,564 | |
| Impairment of real estate assets | — | | | 322 | | | 6,754 | |
| Gain on disposal of property, net | (1,110) | | | (7,517) | | | (30,421) | |
| Adjustments related to unconsolidated joint ventures | 2,636 | | | 842 | | | 72 | |
| Nareit FFO attributable to stockholders and OP unit holders | $ | 299,548 | | | $ | 280,747 | | | $ | 211,202 | |
| Calculation of Core FFO Attributable to Stockholders and OP Unit Holders | | | | | |
| Nareit FFO attributable to stockholders and OP unit holders | $ | 299,548 | | | $ | 280,747 | | | $ | 211,202 | |
| Adjustments: | | | | | |
| Depreciation and amortization of corporate assets | 2,183 | | | 3,653 | | | 3,869 | |
| Change in fair value of earn-out liability | — | | | 1,809 | | | 30,436 | |
| Impairment of investment in third parties | 3,000 | | | — | | | — | |
| Transaction and acquisition expenses | 5,675 | | | 10,551 | | | 5,363 | |
| Loss on extinguishment or modification of debt and other, net | 368 | | | 1,025 | | | 3,592 | |
| Amortization of unconsolidated joint venture basis differences | 17 | | | 220 | | | 1,167 | |
Realized performance income(1) | (75) | | | (2,742) | | | (675) | |
| Core FFO attributable to stockholders and OP unit holders | $ | 310,716 | | | $ | 295,263 | | | $ | 254,954 | |
| | | | | |
| Nareit FFO/Core FFO Attributable to Stockholders and OP Unit Holders per diluted share | | | | | |
| Weighted-average shares of common stock outstanding - diluted | 132,970 | | | 130,332 | | | 116,672 | |
| Nareit FFO attributable to stockholders and OP unit holders per share - diluted | $ | 2.25 | | | $ | 2.15 | | | $ | 1.81 | |
| Core FFO attributable to stockholders and OP unit holders per share - diluted | $ | 2.34 | | | $ | 2.27 | | | $ | 2.19 | |
(1)Restricted stock awards were dilutive to FFO Attributable to Stockholders and Convertible Noncontrolling Interests per share and Core FFO per share for the years ended December 31, 2020, 2019, and 2018, and, accordingly, their impact was included in the weighted-average common shares used in their respective per share calculations. For the year ended December 31, 2019, restricted stock units had an anti-dilutive effect upon the calculation of earnings per share and thus were excluded. For detailsRealized performance income includes fees received related to the calculationachievement of earnings per share, see Note 15.certain performance targets in our NRP joint venture.
Earnings Before Interest, Taxes, Depreciation, and Amortization for Real Estate (“EBITDAre”) and Adjusted EBITDAre—Nareit defines EBITDAre as net income (loss) computed in accordance with GAAP before (i) interest expense, (ii) income tax expense, (iii) depreciation and amortization, (iv) gains or losses from disposition of depreciable property, and (v) impairment write-downs of depreciable property. Adjustments for unconsolidated partnerships and joint ventures are calculated to reflect EBITDAre on the same basis.
Adjusted EBITDAre is an additional performance measure used by us asand ADJUSTED EBITDAre includes certain non-comparable items that affect our performance over time. To arrive at Adjusted EBITDAre, we exclude certain recurring and non-recurring items from EBITDAre, including, but not limited to: (i) changes in the fair value of the earn-out liability; (ii) other impairment charges; (iii) amortization of basis differences in our investments in our unconsolidated joint ventures; and (iv) transaction and acquisition expenses.
We have included the calculation of EBITDAre to better align with publicly traded REITs. —We use EBITDAre and Adjusted EBITDAre as additional measures of operating performance which allow us to compare earnings independent of capital structure, determine debt service and fixed cost coverage, and measure enterprise value. Additionally, we believe they are a useful indicator of our ability to support our debt obligations.
EBITDAre and Adjusted EBITDAre should not be considered as alternatives to net income (loss), as an indication of our liquidity, nor as an indication of funds available to cover our cash needs, including our ability to fund distributions. Accordingly, EBITDAre and Adjusted EBITDAre should be reviewed in connection with other GAAP measurements, and should not be viewed as more prominent measures of performance than net
income (loss) or cash flows from operations prepared in accordance with GAAP. Our EBITDAre and Adjusted EBITDAre, as presented, may not be comparable to amounts calculated by other REITs.
| | | | | | | | | | | |
PHILLIPS EDISON & COMPANY DECEMBER 31, 2023 FORM 10-K | | | 38 |
The following table presents our calculation of EBITDAre and Adjusted EBITDAre for the years ended December 31, 2020, 2019,2023, 2022, and 20182021 (in thousands):
| | | | 2020 | | 2019 | | 2018 | | 2023 | | 2022 | | 2021 |
Calculation of EBITDAre | Calculation of EBITDAre | | | | |
| Net income (loss) | $ | 5,462 | | | $ | (72,826) | | | $ | 46,975 | |
| Net income | |
| Net income | |
| Net income | |
| Adjustments: | Adjustments: | |
| Depreciation and amortization | |
| Depreciation and amortization | |
| Depreciation and amortization | Depreciation and amortization | 224,679 | | | 236,870 | | | 191,283 | |
| Interest expense, net | Interest expense, net | 85,303 | | | 103,174 | | | 72,642 | |
| Gain on disposal of property, net | Gain on disposal of property, net | (6,494) | | | (28,170) | | | (109,300) | |
| Impairment of real estate assets | Impairment of real estate assets | 2,423 | | | 87,393 | | | 40,782 | |
| Federal, state, and local tax expense | Federal, state, and local tax expense | 491 | | | 785 | | | 232 | |
Adjustments related to unconsolidated
joint ventures | Adjustments related to unconsolidated
joint ventures | 3,355 | | | 2,571 | | | 446 | |
EBITDAre | EBITDAre | $ | 315,219 | | | $ | 329,797 | | | $ | 243,060 | |
Calculation of Adjusted EBITDAre | Calculation of Adjusted EBITDAre | | | | | |
EBITDAre | EBITDAre | $ | 315,219 | | | $ | 329,797 | | | $ | 243,060 | |
EBITDAre | |
EBITDAre | |
| Adjustments: | Adjustments: | | | | |
| Change in fair value of earn-out liability and derivatives | (10,000) | | | (7,500) | | | 2,393 | |
| Other impairment charges | 359 | | | 9,661 | | | — | |
| Impairment of investment in third parties | |
| Impairment of investment in third parties | |
| Impairment of investment in third parties | |
| Change in fair value of earn-out liability | |
| Transaction and acquisition expenses | |
Amortization of unconsolidated joint
venture basis differences | Amortization of unconsolidated joint
venture basis differences | 1,883 | | | 2,854 | | | 167 | |
| Transaction and acquisition expenses | 539 | | | 598 | | | 3,426 | |
Realized performance income(1) | |
Adjusted EBITDAre | Adjusted EBITDAre | $ | 308,000 | | | $ | 335,410 | | | $ | 249,046 | |
(1)Realized performance income includes fees received related to the achievement of certain performance targets in our NRP joint venture.
Liquidity and Capital Resources | | |
| LIQUIDITY AND CAPITAL RESOURCES |
GeneralGENERAL—Aside from standard operating expenses, we expect our principal cash demands to be for:
•cash distributions to stockholders;
•investments in real estate;
•capital expenditures and leasing costs;cash distributions to stockholders;
•redevelopment and repositioning projects;
•repurchases of common stock;capital expenditures and leasing costs; and
•principal and interest payments on our outstanding indebtedness.
We expect our primary sources of liquidity to be:
•operating cash flows;
•borrowings from our unsecured revolving credit facility and proceeds from debt financings;
•proceeds from any ATM offering activities;
•proceeds received from the disposition of properties;
•reinvested distributions;
•proceeds from debt financings, including borrowings under our unsecured revolving credit facility;
•distributions received from joint ventures; and
•available, unrestricted cash and cash equivalents.
Our cash from operations has been reduced, and we anticipate that it may continue to be negatively impacted, at least in the near term, as a result of the COVID-19 pandemic as we temporarily experience reduced or delayed cash payments and/or revenue from Neighbors. Additionally, our cash from financing activities has been impacted by actions taken to preserve liquidity, such as the suspension of our distributions and the DRIP beginning in April 2020 and continuing through November 2020, and the suspension of the SRP for DDI beginning in March 2020 and continuing through December 2020. The cash on hand resulting from these actions allowed us to execute the Tender Offer as well as reinstate distributions, including the DRIP, beginning in December 2020. Further, the SRP for DDI was reinstated effective January 2021.
We are monitoring events closely and managing our cash usage, which also includes prioritizing our capital spending and redevelopment to support the reopening of our Neighbors and new leasing activity, or deferring if possible, as well as reducing other property and corporate expenses. At this time, we believe our current sources of liquidity most significantly our operating cash flows and borrowing availability on our revolving credit facility, are sufficient to meet our short- and long-term cash demands.
IMPACT OF THE UNDERWRITTEN IPO—On July 19, 2021, we closed our underwritten IPO, through which we issued 19.6 million shares, including the underwriters’ overallotment election, of a new class of common stock, $0.01 par value per share, at an initial price to the public of $28.00 per share. As a result of the underwritten IPO, we received gross proceeds of $547.4 million. The underwritten IPO allowed us access to forms of capital not previously available to us, as follows:
•In October 2021, the Operating Partnership completed the registered offering of $350 million aggregate principal amount of 2.625% senior notes (“2021 Bond Offering”) priced at 98.692% of the principal amount and maturing in November 2031. The 2021 Bond Offering resulted in gross proceeds of $345.4 million. The notes are fully and unconditionally guaranteed by us.
•In February 2022, we filed an automatically effective shelf registration statement on Form S-3 providing for the public offering and sale, from time to time, by us of our preferred stock, common stock, debt securities, depository shares, warrants, rights, units, and guarantees of debt securities and by the Operating Partnership of its debt securities, in each case in unlimited amounts.
•In connection with our February 2022 Form S-3 filing, we commenced the ATM program through which we may offer and sell shares of our common stock having an aggregate offering price of up to $250 million. During the three months ended December 31, 2023, we issued 2.2 million shares of our common stock at a gross weighted average
| | | | | | | | | | | |
PHILLIPS EDISON & COMPANY DECEMBER 31, 2023 FORM 10-K | | | 39 |
price of $35.92 per share under the ATM program for net proceeds of $77.5 million, after approximately $0.8 million in commissions. During the year ended December 31, 2023, we issued 4.2 million shares of our common stock at a gross weighted average price of $35.76 per share under the ATM program for net proceeds of $147.6 million, after approximately $1.5 million in commissions. During the three months ended December 31, 2022, no shares were issued under the ATM program. During the year ended December 31, 2022, we issued 2.6 million shares of our common stock at a gross weighted average price of $34.23 per share under the ATM program for net proceeds of $89.2 million, after approximately $0.9 million in commissions. As of December 31, 2023, approximately $10.8 million of common stock remained available for issuance under the ATM program.
DebtDEBT—The following table summarizes information about our debt as of December 31, 20202023 and 20192022 (dollars in thousands):
| | | | 2020 | | 2019 | | 2023 | | 2022 |
| Total debt obligations, gross | Total debt obligations, gross | $ | 2,307,686 | | | $ | 2,372,521 | |
| Weighted-average interest rate | Weighted-average interest rate | 3.1 | % | | 3.4 | % | Weighted-average interest rate | 4.2 | % | | 3.6 | % |
| Weighted-average term (in years) | Weighted-average term (in years) | 4.1 | | | 5.0 | |
| | Revolving credit facility capacity | $ | 500,000 | | | $ | 500,000 | |
Revolving credit facility availability(1) | 490,404 | | | 489,805 | |
Revolving credit facility maturity(2) | October 2021 | | October 2021 |
Revolving credit facility capacity(1) | |
Revolving credit facility capacity(1) | |
Revolving credit facility capacity(1) | |
Revolving credit facility availability(2) | |
(1)The revolving credit facility matures in January 2026, extendable at our option to January 2027. In addition, the revolving credit facility also includes an accordion feature that permits us to increase our aggregate borrowing capacity thereunder to up to $1 billion, subject to the satisfaction of certain conditions.
(2)Net of any outstanding balance and letters of credit.
(2)Debt ActivityThe revolving credit facility matures in October 2021 and includes an option to extend the maturity to October 2022, with its execution being subject to compliance with certain terms included in the loan agreement, including the absence of any defaults and the payment of relevant fees. We intend to either exercise our option to extend the maturity or to negotiate under new terms.
—During the years ended December 31, 20202023 and 2019,2022, we took steps to reduce our leverage, lower our cost of debt, and appropriately ladder our debt maturities.maturities and increase debt amounts available to us for future investment activity. Our debt activity during the year ended December 31, 20202023 was as follows:
•In January 2020, we paid down $30 million of term loan debt maturing in 2021 using proceeds from property dispositions in 2019. Following this repayment, our next term loan maturity is in April 2022 and includes an option to extend the maturity to October 2022, with its execution being subject to compliance with certain terms included in the loan agreement, including the absence of any defaults and the payment of relevant fees. We intend to either exercise our option to extend the maturity or to negotiate under new terms.
•In April 2020,On July 31, 2023, we borrowed $200amended three senior unsecured term loans with a total notional amount of $475 million scheduled to mature during 2024. The three senior unsecured term loans, as amended, have a total notional amount of $484.8 million. The $161.8 million unsecured term loan is priced based on our revolving credit facilitya leverage grid, which is currently at the Secured Overnight Financing Rate (“SOFR”) plus 1.35% and is scheduled to meet our operating needs formature on January 31, 2026 extendable with two one-year options to 2028. The $158 million and $165 million unsecured term loans are priced based on a sustained period due to the COVID-19 pandemic.leverage grid, which is currently at SOFR plus 1.35% and mature on January 31, 2027.
•In June 2020,During the year ended December 31, 2023, we fully repaid the outstanding balance on our revolving credit facility as our rent and recovery collections during the second quarter, combined with our COVID-19 expense reduction initiatives, sufficiently funded our operating needs and provided enough stability to allow for this repayment. Further, we did not borrow on our revolving credit facility during the remainder of 2020.
•In the fourth quarter, we executed early repayments of $24.5$47.3 million in mortgage debt.
Our debt activity during the year ended December 31, 2019, which we expect will save approximately $1.9 million in interest annually,2022 was as follows:
•In September 2019,May 2022, we repriced a $200amended our credit facility agreement to, among other things, increase the total amount available under our unsecured revolving credit facility from $500 million term loan, loweringto $800 million. The unsecured revolving credit facility also includes an accordion feature that permits us to increase our aggregate borrowing capacity thereunder to up to $1 billion, subject to the interest rate spread from 1.75% over LIBORsatisfaction of certain conditions. The unsecured revolving credit facility is scheduled to 1.25% over LIBOR, while maintaining the current maturity of September 2024.mature in January 2026, extendable at our option to January 2027.
•In October 2019,During 2022, we repriced a $175repaid $80.1 million term loan from a spread of 1.75% over LIBOR to 1.25% over LIBOR, while maintaining the current maturity of October 2024.in mortgage debt.
•Future Debt ObligationsIn—As of December 2019, we executed a $200 million fixed-rate secured loan maturing in January 2030. The proceeds from this loan, along with proceeds from property dispositions,31, 2023, including the impact of our swap agreements, our future contractual debt obligations were used to pay down $265.9$115.7 million of term loan debt maturing in 2020principal and 2021.
Ourinterest payments during 2024, and $2.2 billion of debt is subject to certain covenants,principal and interest payments thereafter (see Note 8). The average annual maturities of our outstanding debt over the next four years as of December 31, 2020,2023 was approximately $313 million including all extension options and approximately $354 million excluding all extension options.
Debt Obligation Guarantees—The 2.625% senior notes issued by the Operating Partnership pursuant to an effective registration statement in October 2021 were, and debt securities of the Operating Partnership registered under our automatically effective shelf registration statement on Form S-3 filed in February 2022 will be, fully and unconditionally guaranteed by us. At December 31, 2023, the Operating Partnership had issued and outstanding its 2.625% senior notes. The obligations of the Operating Partnership to pay principal, premiums, if any, and interest on the 2.625% senior notes are fully and unconditionally guaranteed by us on a senior basis. As a result of the amendments to SEC Rule 3-10 of Regulation S-X, subsidiary issuers of obligations guaranteed by the parent are not required to provide separate financial statements, provided that: (i) the subsidiary obligor is consolidated into the parent company’s consolidated financial statements; (ii) the parent guarantee is “full and unconditional”; and (iii) subject to certain exceptions as set forth below, the alternative disclosure required by Rule 13-01 of Regulation S-X is provided, which includes narrative disclosure and summarized financial information. We meet the conditions of this requirement and thus, are not presenting separate financial statements. Furthermore, as permitted under Rule 13-01(a)(4)(vi) of Regulation S-X, we have excluded the summarized financial information for the Operating Partnership because the assets, liabilities, and results of operations of the Operating Partnership are not materially different than the corresponding in our consolidated financial statements, and management believes such summarized financial information would be repetitive and would not provide incremental value to investors.
Covenants—Credit agreements for our unsecured revolving credit facility and unsecured term loans contain customary financial covenants, including a leverage ratio of 60% or less, with a surge to 65% or less following a material acquisition, and require the fixed-charge ratio to be 1.5:1 or greater. Our unsecured senior notes due 2031 are also subject to customary financial covenants, including a leverage ratio of 65% or less, and require the fixed-charge ratio to be 150% or greater. As of December 31, 2023, we were in compliance with the restrictive covenants of our outstanding debt obligations. Weobligations and we expect to continue to meet the requirements of our debtthese covenants over the next twelve months.
| | | | | | | | | | | |
PHILLIPS EDISON & COMPANY DECEMBER 31, 2023 FORM 10-K | | | 40 |
Financial Leverage RatiosOTHER CONTRACTUAL COMMITMENTS AND CONTINGENCIES AND OFF BALANCE SHEET ARRANGEMENTS—We enter into leases as a lessee as part of our real estate operations in the form of ground leases of land for certain properties, and as part of our corporate operations in the form of office space and office equipment leases. Currently, neither our operating leases nor our finance leases have residual value guarantees or other restrictions or covenants. We expect to fund these obligations through existing financing or cash flows from operations. As of December 31, 2023, our future contractual obligations as a lessee included operating lease obligations of $0.7 million during 2024, and $7.3 million thereafter. As of December 31, 2023, our future contractual finance lease obligations included $0.3 million during 2024.
We have an off-balance sheet arrangement that includes being the limited guarantor of a $175 million mortgage loan secured by Grocery Retail Partners I LLC (“GRP I”) properties. Our guaranty for the GRP I debt is limited to being the non-recourse carveout guarantor and the environmental indemnitor. Further, we are also party to an agreement with our institutional joint venture partner in which any potential liability under such guarantee will be apportioned between us and our joint venture partner based on our respective ownership percentage in the joint venture. As of December 31, 2023, GRP I had an outstanding debt balance of $174.0 million.
Additionally, our off-balance sheet arrangements include the notional amount of our interest rate swaps which we use to hedge a portion of our exposure to interest rate fluctuations. Currently, all of our interest rate swaps fix the variable rate interest on our term loan debt. We intend to fund our interest rate swap payments utilizing cash flows from operations. As of December 31, 2023, the notional amount of our interest rate swaps was $0.7 billion. As of December 31, 2023, our future interest rate swap recoverables are $15.8 million during 2024 and $11.3 million thereafter.
FINANCIAL LEVERAGE RATIOS—We believe our net debt to Adjusted EBITDAre, net debt to total enterprise value, and debt covenant compliance as of December 31, 20202023 allow us access to future borrowings as needed in the near term. The following table presents our calculation of net debt and total enterprise value, inclusive of our prorated portion of net debt and cash and cash equivalents owned through our unconsolidated joint ventures, as of December 31, 20202023 and 2019 (dollars in2022 (in thousands):
| | 2020 | | 2019 |
| 2023 | | | 2023 | | 2022 |
| Net debt: | Net debt: | |
| Total debt, excluding market adjustments and deferred financing expenses | $ | 2,345,620 | | | $ | 2,421,520 | |
| Total debt, excluding discounts, market adjustments, and deferred financing expenses | |
| Total debt, excluding discounts, market adjustments, and deferred financing expenses | |
| Total debt, excluding discounts, market adjustments, and deferred financing expenses | |
| Less: Cash and cash equivalents | Less: Cash and cash equivalents | 104,952 | | | 18,376 | |
| Total net debt | Total net debt | $ | 2,240,668 | | | $ | 2,403,144 | |
| | Enterprise value: | Enterprise value: | |
| Total Net debt | $ | 2,240,668 | | | $ | 2,403,144 | |
Total equity value(1) | 2,797,234 | | | 3,682,161 | |
| Enterprise value: | |
| Enterprise value: | |
| Net debt | |
| Net debt | |
| Net debt | |
Total equity market capitalization(1)(2) | |
| Total enterprise value | Total enterprise value | $ | 5,037,902 | | | $ | 6,085,305 | |
(1)Total equity valuemarket capitalization is calculated as the number of commondiluted shares and OP units outstanding multiplied by the EVPS at the end of the period. There were 319.7closing market price per share, which includes 135.8 million and 131.2 million diluted shares outstanding with an EVPS of $8.75 as of December 31, 20202023 and 331.7 million diluted shares outstanding with an EVPS2022, respectively, and the closing market price per share of $11.10$36.48 and $31.84 as of December 31, 2019.2023 and 2022, respectively.
(2)Fully diluted shares include common stock and OP units.
The following table presents our calculation of net debt to Adjusted EBITDAre and net debt to total enterprise value as of December 31, 20202023 and 20192022 (dollars in thousands):
| | December 31, 2020 | | December 31, 2019 |
Net debt to Adjusted EBITDAre - annualized: | |
| 2023 | | | 2023 | | 2022 |
Net debt to Adjusted EBITDAre - annualized: | |
| Net debt | |
| Net debt | |
| Net debt | Net debt | $ | 2,240,668 | | $ | 2,403,144 | $ | 2,006,019 | | $ | 1,931,402 |
Adjusted EBITDAre - annualized(1) | Adjusted EBITDAre - annualized(1) | 308,000 | | 335,410 | Adjusted EBITDAre - annualized(1) | 396,103 | | 367,385 |
Net debt to Adjusted EBITDAre - annualized | Net debt to Adjusted EBITDAre - annualized | 7.3x | | 7.2x | Net debt to Adjusted EBITDAre - annualized | 5.1x | | 5.3x |
| | Net debt to total enterprise value | |
| Net debt to total enterprise value: | |
| Net debt to total enterprise value: | |
| Net debt to total enterprise value: | |
| Net debt | |
| Net debt | |
| Net debt | Net debt | $ | 2,240,668 | | $ | 2,403,144 | $ | 2,006,019 | | $ | 1,931,402 |
| Total enterprise value | Total enterprise value | 5,037,902 | | 6,085,305 | Total enterprise value | 6,961,499 | | 6,109,606 |
| Net debt to total enterprise value | Net debt to total enterprise value | 44.5% | | 39.5% | Net debt to total enterprise value | 28.8% | | 31.6% |
(1)Adjusted EBITDAre is based on a trailing twelve months.month period. See “Part II, Item 7. Management’s Discussion and Analysis of Financial Condition and Results of Operations - Non-GAAP“Non-GAAP Measures - EBITDAre and Adjusted EBITDAre” of this filing on Form 10-Kabove for a reconciliation to Net Income (Loss).Income.
Capital Expenditures and Redevelopment ActivityCAPITAL EXPENDITURES AND REDEVELOPMENT ACTIVITY—We make capital expenditures during the course of normal operations, including maintenance capital expenditures and tenant improvements, as well as value-enhancing anchor space repositioning and redevelopment, ground-up outparcel development, and other accretive projects. In response to the COVID-19 pandemic, our capital investments have been prioritized to support the reopening of our Neighbors and new leasing activity, or deferred if possible.
During the years ended December 31, 20202023 and 2019,2022, we had gross capital expendituresspend of $64.0$95.3 million and $75.5$104.5 million, respectively. We expect our capital expenditures to reach $85 million - $95 million in 2021, which includes $54.5 million related to development and redevelopment projects. As of December 31, 2020, our redevelopment projects in process include a demolition and rebuild of a Publix anchor at one of our centers for a total investment of approximately $7.6 million, with the remaining spend of $6.1 million expected to be completed in 2021. We expect our development and redevelopment projects to stabilize within 24 months. We anticipate that obligations related to capital improvements as well as redevelopment and development in 2020 can be met with cash flows from operations, cash flows from dispositions, or borrowings on our
unsecured revolving line of credit. Below is a summary of our capital spending activity, excluding leasing commissions, on a cash basis for the years ended December 31, 20202023 and 20192022 (in thousands):
| | | | | | | | | | | |
| 2020 | | 2019 |
| Capital expenditures for real estate: | | | |
| Maintenance capital and tenant improvements | $ | 27,747 | | | $ | 33,842 | |
| Redevelopment and development | 30,521 | | | 37,488 | |
| Total capital expenditures for real estate | 58,268 | | | 71,330 | |
| Corporate asset capital expenditures | 3,972 | | | 1,988 | |
Capitalized indirect costs(1) | 1,725 | | | 2,174 | |
| Total capital spending activity | $ | 63,965 | | | $ | 75,492 | |
| | | | | | | | | | | |
PHILLIPS EDISON & COMPANY DECEMBER 31, 2023 FORM 10-K | | | 41 |
| | | | | | | | | | | |
| 2023 | | 2022 |
| Capital expenditures for real estate: | | | |
| Capital improvements | $ | 22,766 | | | $ | 17,828 | |
| Tenant improvements | 26,663 | | | 24,194 | |
| Redevelopment and development | 38,206 | | | 53,671 | |
| Total capital expenditures for real estate | 87,635 | | | 95,693 | |
| Corporate asset capital expenditures | 963 | | | 3,292 | |
Capitalized indirect costs(1) | 4,103 | | | 3,430 | |
Total capital spending activity(2) | $ | 92,701 | | | $ | 102,415 | |
(1)Amount includes internal salaries and related benefits of personnel who work directly on capital projects as well as capitalized interest expense.
(2)Amounts reported are net of insurance proceeds of $2.6 million and $2.1 million for property damage claims for the years ended December 31, 2023 and 2022, respectively.
We target an average incremental yield of 8%expect our capital expenditures to 11% forreach $100 million - $110 million in 2024, which includes $40 million - $50 million related to development and redevelopment projects. Incremental yield reflects theWe anticipate that obligations related to capital improvements, as well as redevelopment and development, in 2024 can be met with cash flows from operations, cash flows from dispositions, or borrowings on our unsecured revolving credit facility.
Generally, we expect our development and redevelopment projects to stabilize within 24 months. Our underwritten incremental NOI generated by each project upon expected stabilizationunlevered yields on development and is calculated as incremental NOI divided by net project investment. Incremental NOI is the difference between the NOIredevelopment projects are expected to be generated byaverage between 9%-12%. Our current in process projects represent an estimated total investment of $33.7 million. Actual incremental unlevered yields may vary from our underwritten incremental unlevered yield range based on the stabilizedactual total cost to complete a project and the forecastedits actual incremental annual NOI without the planned improvements. Incremental yield does not include peripheral impacts, such as lease rollover risk or the impact on the long term value of the property upon sale or disposition.at stabilization. See “Key Performance Indicators and Defined Terms” above for further information.
Merger and Acquisition ActivityREAL ESTATE ACQUISITION ACTIVITY—We continuallyactively monitor the commercial real estate market for properties that have future growth potential, are located in attractive demographic markets, and support our business objectives. Due to the COVID-19 pandemic, as well as the resulting market conditions,We are currently targeting acquisitions of $200 million - $300 million annually. The following table highlights our acquisition activity was lower than anticipatedproperty acquisitions during 2020, and we anticipate that acquisition activity may remain low throughout 2021. Below is a summary of our merger and acquisition activity for the years ended December 31, 20202023 and 20192022 (dollars and square feet in thousands):
| | | | | | | | | | | | | | | | | | | | | | |
| | 2020 | | 2019 | | |
| | Third-Party Acquisitions | | REIT III Merger(1) | | Third-Party Acquisitions | | |
| Number of properties purchased | | 2 | | | 3 | | | 2 | | | |
Number of outparcels purchased(2) | | 2 | | | — | | | 2 | | | |
| Total square footage acquired | | 216 | | | 251 | | | 213 | | | |
| Total price of acquisitions | | $ | 41,482 | | | $ | 16,996 | | | $ | 71,722 | | | |
| | | | | | | | | | | |
| 2023 | | 2022 |
| Number of properties acquired | 11 | | | 7 | |
Number of outparcels acquired(1) | 3 | | | 4 | |
| Contract price | $ | 278,480 | | | $ | 280,515 | |
Total price of acquisitions(2) | 270,262 | | | 282,000 | |
(1)Number of properties and outparcels excludes those owned through our investment in GRP II, which weOutparcels acquired through the merger with REIT III in 2019. GRP II was subsequently acquired by GRP I in October 2020.
(2)Outparcels purchased in 2020 and 2019 are parcels of land adjacent to shopping centers that we own.
Disposition Activity(2)Total price of acquisitions includes closing costs less credits and assumed debt obligations.
REAL ESTATE DISPOSITION ACTIVITY—We are actively evaluatingcontinually evaluate our portfolio of assets for opportunities to make strategic dispositions of assets that no longer meet our growth and investment objectives or assets that have stabilized in order to capture their value. Seeding joint venture portfolios is another desirable growth strategy as we retain ownership interests in the seeded properties while simultaneously increasing our high-margin fee revenue earned through the provision of management services to those properties. We expect to continue to make strategic dispositions during 2021. The following table highlights our property dispositions during the years ended December 31, 20202023 and 20192022 (dollars and square feet in thousands):
| | | | | | | | | | | | | | |
| | 2020 | | 2019 |
Number of properties sold(1) | | 7 | | | 21 | |
| Number of outparcels sold | | 1 | | | 1 | |
| Total square footage sold | | 678 | | | 2,564 | |
| Proceeds from sale of real estate | | $ | 57,902 | | | $ | 223,083 | |
Gain on sale of properties, net(2) | | 10,117 | | | 30,039 | |
| | | | | | | | | | | | | | |
| | 2023 | | 2022 |
| Number of properties sold | | 1 | | | 4 | |
| Number of outparcels sold | | 2 | | | 4 | |
| Contract price | | $ | 6,250 | | | $ | 53,987 | |
Proceeds from sale of real estate, net(1)(2) | | 7,208 | | | 52,019 | |
Gain on disposal of property, net(2) | | 1,110 | | | 7,517 | |
(1)We retained certain outparcelsTotal proceeds from sale of land associated with one of our property dispositions duringreal estate, net includes closing costs less credits.
(2)Activity for the year ended December 31, 2020, and2023 includes land acquired from us by local authorities.
DISTRIBUTIONS—We elected to be taxed as a result, this property is still included inREIT for federal income tax purposes commencing with our total property count.
(2)The gain on saletaxable year ended December 31, 2010. As a REIT, we have made, and intend to continue to make, distributions each taxable year equal to at least 90% of property, net does not include miscellaneous write-off activity, which is also recorded in Gain on Sale or Contribution of Property, Net onour taxable income (excluding capital gains and computed without regard to the consolidated statements of operations and comprehensive income (loss)dividends paid deduction).
In 2023, we declared and paid monthly distributions of $0.0933 per share, or $1.12 annualized, for each month beginning January 2023 through August 2023. On September 1, 2023, the Board authorized a 4.5% increase of our monthly distribution rate to $0.0975 per common share. We declared and paid monthly distributions of $0.0975 per share, or $1.17 annualized, for each month beginning September 2023 through December 2023.
| | | | | | | | | | | |
PHILLIPS EDISON & COMPANY DECEMBER 31, 2023 FORM 10-K | | | 42 |
Distributions—Distributions to our common stockholdersThe December 2023 and January 2024 distributions of $0.0975 per share were paid on January 2, 2024 and February 1, 2024, respectively. OP unit holders including key financial metrics for comparison purposes, forwill receive distributions at the years ended December 31, 2020 and 2019, aresame rate as follows (in thousands):
| | | | | | | | | | | | | | |
| Cash distributions to OP unit holders | | | Net cash provided by operating activities |
| | | | |
| Cash distributions to common stockholders | | | Core FFO(1)
|
| | |
| Distributions reinvested through the DRIP | | | |
| | |
(1)See “Part II, Item 7. Management’s Discussion and Analysis of Financial Condition and Results of Operations - Non-GAAP Measures - Funds from Operations and Core Funds from Operations” of this filing on Form 10-K for the definition of Core FFO, or information regarding why we present Core FFO, and for a reconciliation of this non-GAAP financial measure to Net Income (Loss).
|
During 2020, we paid distributions of $0.05583344 per share, or $0.67 annualized, for the months of December 2019 and January, February, and March 2020 until the suspension of stockholder distributions by the Board. During the year ended December 31, 2019, we paid monthly distributions of $0.05583344 per share.common stockholders, subject to any applicable withholding. The timing and amount of distributions isare determined by our Board and is influenced in part by our intention to comply with REIT requirements of the Internal Revenue Code.IRC.
On March 27, 2020, as a resultIn 2022, we declared and paid monthly distributions of the uncertainty surrounding the COVID-19 pandemic, our Board suspended stockholder distributions, effective after the payment of the March 2020 distribution on April 1, 2020. The DRIP was also suspended, and the March 2020 distribution was paid in all cash on April 1, 2020. The suspension of stockholder distributions and the DRIP did not impact our qualification as a REIT.
On November 4, 2020, our Board reinstated monthly stockholder distributions beginning December 2020 equal to $0.02833333$0.09 per share, or $0.34 annualized. Additionally, the DRIP was reinstated with this distribution. OP unit holders received distributions at the same rate as common stockholders. The distribution$1.08 annualized, for each month beginning January 2022 through August 2022. We declared and DRIP for December 2020 became effective for stockholders of record at the close of business on December 31, 2020, and this distribution was paid on January 12, 2021. Distributions were paid for January and February 2021. Additionally, our Board has approvedmonthly distributions of $0.02833333$0.0933 per share, or $1.12 annualized, an increase of 3.7%, for March 2021.
Our Board intends to evaluate distributions on a monthly basis throughout 2021.each month beginning September 2022 through December 2022.
To maintain our qualification as a REIT, we must make aggregate annual distributions to our stockholders of at least 90% of our REIT taxable income (which is computed without regard to the dividends paid deduction or net capital gain, and which does not necessarily equal net income (loss)or loss as calculated in accordance with GAAP). We generally will not be subject to U.S. federal income tax on the income that we distribute to our stockholders each year due to meeting the REIT qualification requirements. However, we may be subject to certain state and local taxes on anyour income, property, or net worth and to federal income and excise taxes on our undistributed income.
We have not established a minimum distribution level, and our charter does not require that we make distributions to our stockholders.
Cash Flow ActivitiesSHARE REPURCHASE PROGRAM—On August 3, 2022, our Board approved a new share repurchase program of up to $250 million of common stock. The program may be suspended or discontinued at any time, and does not obligate us to repurchase any dollar amount or particular number of shares. No share repurchases have been made to date under this program.
CASH FLOW ACTIVITIES—As of December 31, 2020,2023, we had cash and cash equivalents and restricted cash of $131.9$8.9 million,, a net cash increasedecrease of $36.8$8.5 million duringduring the year ended December 31, 2020.2023.
Below is a summary of our cash flow activity for the years ended December 31, 20202023 and 20192022 (dollars in thousands):
| | | | | | | | | | | | | | | | | | | | | | | |
| | 2020 | | 2019 | | $ Change | | % Change |
| Net cash provided by operating activities | $ | 210,576 | | | $ | 226,875 | | | $ | (16,299) | | | (7.2) | % |
| Net cash (used in) provided by investing activities | (44,092) | | | 64,183 | | | (108,275) | | | NM |
| Net cash used in financing activities | (129,655) | | | (280,254) | | | 150,599 | | | 53.7 | % |
| | | | | | | | | | | | | | | | | | | | | | | |
| | 2023 | | 2022 | | $ Change | | % Change(1) |
| Net cash provided by operating activities | $ | 290,968 | | | $ | 290,890 | | | $ | 78 | | | — | % |
| Net cash used in investing activities | (353,386) | | | (331,245) | | | (22,141) | | | (6.7) | % |
| Net cash provided by (used in) financing activities | 53,947 | | | (57,825) | | | 111,772 | | | NM |
Operating Activities(1)Line items that result in a percent change that exceed certain limitations are considered not meaningful (“NM”) and indicated as such.
OPERATING ACTIVITIES—Our net cash provided by operating activities was primarily impacted by the following:
•Property operations and working capital—Most of our operating cash comes from rental and tenant recovery income and is offset by property operating expenses, real estate taxes, and general and administrative costs. Our changeThe increase in cash flows from property operations iswas primarily due to reduced revenuea $16.2 million, or 4.2%, improvement in Same-Center NOI as compared to 2022, and collectionsthe execution of our acquisition strategy. During the year ended December 31, 2023, we had a net cash outlay of $9.4 million from changes in working capital as compared to a resultnet cash outlay of $0.2 million during the COVID-19 pandemic, partially mitigatedsame period in 2022. This change was primarily driven by expense reduction measures at the property and corporate levels.an increase in real estate tax payments.
•FeeCash paid for interest—During the year ended December 31, 2023, we paid $76.5 million for interest, an increase of $11.4 million over the same period in 2022, largely due to higher interest rates in 2023.
•Fees and management income—We also generate operating cash from our third-party investment management business, pursuant to various management and advisory agreements between us and the Managed Funds. Our fee and management income was $9.8$9.6 million for the year ended December 31, 2020,2023, a decrease of $1.9 million as compared to the same period in 2019,2022. The decrease in fees and management income was primarily due to fee and managementour joint venture with NRP from which we recognized income no longer received from REIT III following its acquisition by us in October 2019; a decrease in fees received from NRP largely duerelated to property dispositions; and lower rent and recovery collectionsNRP’s achievement of certain performance targets of $0.1 million for our unconsolidated joint ventures, which resulted in lower management fees paid to us, as a result of the COVID-19 pandemic. This offsets improvements in fees received from GRP I and GRP II (prior its acquisition by GRP I).
•Cash paid for interest—During the year ended December 31, 2020, we paid $78.52023, compared to income of $2.7 million for interest, a decrease of $10.9 million over the same period in 2019, largely due to a decrease in LIBOR and expiring interest rate swaps in 2020, as well as repricing activities occurring in 2019.2022.
Investing ActivitiesINVESTING ACTIVITIES—Our net cash (used in) provided byused in investing activities was primarily impacted by the following:
•Real estate acquisitions—During the year ended December 31, 2020,2023, our third party acquisitions resulted in a total cash outlay of $41.5$270.3 million, as compared to a total cash outlay of $71.7$282.0 million during the same period in 2019. Additionally, our Merger with REIT III, which included a 10% equity interest in GRP II (prior to its acquisition by GRP I in October 2020), resulted in a total cash outlay of $17.0 million during the year ended December 31, 2019.
•Real estate dispositions—During the year ended December 31, 2020, our dispositions resulted in a net cash inflow of $57.9 million, as compared to a net cash inflow of $223.1 million during the same period in 2019.2022.
•Capital expenditures—We invest capital into leasing our properties and maintaining or improving the condition of our properties. During the year ended December 31, 2020,2023, we paid $64.0$95.3 million for capital expenditures, a decrease of $11.5$9.2 million over the same period in 2019. This decrease was primarily driven by reduced capital expenditures since the first quarter of 2020, as our capital investments were prioritized to support the reopening of our Neighbors and new leasing activity, or deferred if possible.2022.
Financing Activities•Real estate dispositions—During the year ended December 31, 2023, our dispositions resulted in a net cash inflow of $7.2 million, as compared to a net cash inflow of $52.0 million during the same period in 2022.
FINANCING ACTIVITIES—Our net cash used inprovided by (used in) financing activities was primarily impacted by the following:
•Debt borrowings and payments—Cash from financing activities is primarily affected by inflows from borrowings and outflows from payments on debt. During the year ended December 31, 2020,2023, we had $64.8$64.2 million in net borrowings as compared to $1.3 million in net repayment of debt primarily asduring the same period a resultyear ago. See “Debt Activity” above for more details.
•Issuance of early repayments of debtcommon stock— utilizing cash from the disposition of properties and cash on hand. During the year ended December 31, 2019,2023, we had $89.1issued 4.2 million inshares of our common stock under the ATM program for net repaymentproceeds of debt, primarily using cash received from$147.6 million. During the dispositionyear ended December 31, 2022, we issued 2.6 million shares of properties.our common stock under the ATM program for net proceeds of $89.2 million.
•Distributions to stockholders and OP unit holders—Cash used for distributions to common stockholders and OP unit holders decreasedincreased by $94.0$7.8 million during the year ended December 31, 20202023 as compared to the same period in 2019, primarily due to the temporary suspension of stockholder distributions.
•Share repurchases—Cash outflows for share repurchases decreased by $29.4 million for the year ended December 31, 2020 as compared to the year ended December 31, 2019, primarily due to the suspension of the SRP. In connection with the Tender Offer, $77.6 million due to shareholders who tendered their shares was not yet paid as of December 31, 2020, and is recorded as Accounts Payable and Other Liabilities on our consolidated balance sheets. The amount was subsequently paid on January 5, 2021 (see Note 13 for more detail).
Off-Balance Sheet Arrangements
We are the limited guarantor for up to $190 million, capped at $50 million in most instances, of NRP’s debt. Our guarantee is limited to being the non-recourse carveout guarantor and the environmental indemnitor. Additionally, we are the limited
| | | | | | | | | | | |
PHILLIPS EDISON & COMPANY DECEMBER 31, 2023 FORM 10-K | | | 43 |
guarantor2022, primarily due to an increase in shares of common stock outstanding as a $175 million mortgage loan secured by GRP I properties. Our guarantee is limited to beingresult of issuances under the non-recourse carveout guarantorATM program and the environmental indemnitor. We entered into a separate agreement with Northwestern Mutualour distribution increases in which we agreed to apportion any potential liability under this guaranty between usboth 2022 and them based on our ownership percentage.2023.
Contractual Commitments and Contingencies
We have debt obligations related to both our secured and unsecured debt. In addition, we have operating leases pertaining to office equipment for our business as well as ground leases at certain of our shopping centers. The table below excludes obligations related to tenant allowances and improvements because such amounts are not fixed or determinable. However, we believe we currently have sufficient financing in place to fund any such amounts as they arise through cash from operations or borrowings. The following table details our contractual obligations as of December 31, 2020 (in thousands):
| | | | | | | | | | | | | | | | | | | | | | | | | | | | | | | | | | | | | | | | | |
| | Payments Due by Period |
| | Total | | 2021 | | 2022 | | 2023 | | 2024 | | 2025 | | Thereafter |
Debt obligations - principal payments(1) | $ | 2,307,522 | | | $ | 62,589 | | | $ | 436,898 | | | $ | 379,569 | | | $ | 503,162 | | | $ | 500,381 | | | $ | 424,923 | |
Debt obligations - interest payments(2) | 285,788 | | | 68,710 | | | 58,768 | | | 50,785 | | | 38,767 | | | 25,457 | | | 43,301 | |
| Operating lease obligations | 8,896 | | | 831 | | | 805 | | | 654 | | | 528 | | | 297 | | | 5,781 | |
| Finance lease obligations | 171 | | | 102 | | | 29 | | | 24 | | | 16 | | | — | | | — | |
| Total | $ | 2,602,377 | | | $ | 132,232 | | | $ | 496,500 | | | $ | 431,032 | | | $ | 542,473 | | | $ | 526,135 | | | $ | 474,005 | |
(1)The revolving credit facility matures in October 2021 and includes an option to extend the maturity to October 2022, with its execution being subject to compliance with certain terms included in the loan agreement, including the absence of any defaults and the payment of relevant fees. We intend to either exercise our option to extend the maturity or to negotiate under new terms. As of December 31, 2020, we have no outstanding balance on our revolving credit facility.
(2)Future variable-rate interest payments are based on interest rates as of December 31, 2020, including the impact of our swap agreements.
Our portfolio debt instruments and the unsecured revolving credit facility contain certain covenants and restrictions. The following is a list of certain restrictive covenants specific to the unsecured revolving credit facility and unsecured term loans that were deemed significant:
•limits the ratio of total debt to total asset value, as defined, to 60% or less with a surge to 65% following a material acquisition;
•limits the ratio of secured debt to total asset value, as defined, to 40% or less with a surge to 45% following a material acquisition;
•requires the fixed-charge ratio, as defined, to be 1.5:1 or greater, or 1.4:1 following a material acquisition;
•limits the ratio of cash dividend payments to FFO, as defined, to 95%;
•requires the current tangible net worth to exceed the minimum tangible net worth, as defined;
•limits the ratio of unsecured debt to unencumbered total asset value, as defined, to 60% or less with a surge to 65% following a material acquisition; and
•requires the unencumbered NOI to interest expense ratio, as defined, to 1.75:1 or greater, or 1.7:1 following a material acquisition.
Inflation
Inflation has been low historically and has had minimal impact on the operating performance of our shopping centers; however, inflation can increase in the future. Certain of our leases contain provisions designed to mitigate the adverse effect of inflation, including rent escalations and requirements for Neighbors to pay their allocable share of operating expenses, including common area maintenance, utilities, real estate taxes, insurance, and certain capital expenditures. Additionally, many of our leases are for terms of less than ten years, which allows us to target increased rents to current market rates upon renewal.
Critical Accounting Policies and Estimates | | |
| CRITICAL ACCOUNTING ESTIMATES |
Below is a discussion of our critical accounting policies and estimates. Our accounting policies have been established to conform with GAAP. We consider these policies critical because they involve significant management judgments and assumptions, require estimates about matters that are inherently uncertain, and are important for understanding and evaluating our reported financial results. These judgments affect the reported amounts of assets and liabilities and our disclosure of contingent assets and liabilities at the dates of the consolidated financial statements, as well as the reported amounts of revenue and expenses during the reporting periods. With different estimates or assumptions, materially different amounts could be reported in our consolidated financial statements. Additionally, other companies may utilize different estimates that may impact the comparability of our results of operations to those of companies in similar businesses.
Because of the adverse economic conditions and uncertainty regarding the impacts of the COVID-19 pandemic, it is possible that the estimates and assumptions that have been utilized in the preparation of the consolidated financial statements could change or vary significantly from actual results. Please refer to Notes 2 and 17 for additional discussion on the potential impact that the COVID-19 pandemic could have on significant accounting estimates as employed per our critical accounting policies.
Real Estate Acquisition AccountingValuation—MostWe assess the fair value of ouracquired real estate acquisition activity does not meetand allocate the definitionpurchase price of a business combination and is instead classified as an asset acquisition. As a result, most acquisition-related costs are capitalized and amortized over the life of the relatedreal estate assets and there is no recognition of goodwill. Costs incurred related to properties that were not ultimatelyliabilities acquired were expensed and recorded in Other (Expense) Income on the consolidated statements of operations. Regardless of whether an acquisition is considered a business combination or an asset acquisition, we record the costs of the business or assets acquired as tangible and intangible assets and liabilities based upon their estimated fair values as of the acquisition date.
We assess The allocation requires the acquisition-date fair valuesuse of all tangible assets, identifiable intangibles,market based estimates and assumed liabilities using methods similar to those used by independent appraisers (e.g., discounted cash flow analysis and replacement cost) and that utilize appropriate discount and/or capitalization rates and available market information. Estimates of future cash flows are based on a number of factorsassumptions including historical operating results, known and anticipated trends, and market and economic conditions. The fair value of tangible assets of an acquired property considers the value of the property as if it were vacant.
We generally determine the value of construction in progress based upon the replacement cost. However, for certain acquired properties that are part of a new development, we determine fair value by using the same valuation approach as for all other properties and deducting the estimated cost to complete the development. During the remaining construction period, we capitalize interest expense until the development has reached substantial completion. Construction in progress, including capitalized interest, is not depreciated until the development has reached substantial completion.
We record above-market and below-market lease values for acquired properties based on the present value (using a discount rate that reflects the risks associated with the leases acquired) of the difference between (i) the contractual amounts to be paid pursuant to the in-place leases and (ii) management’s estimate of market lease rates for the corresponding in-place leases, measured over a period equal to the remaining non-cancelable term of the lease. We amortize any recorded above-market or below-market lease values as a reduction or increase, respectively, to rental income over the remaining non-cancelable terms of the respective lease. We also consider fixed-rate renewal options in our calculation of the fair value of below-market leases and the periods over which such leases are amortized. If a tenant has a unilateral option to renew a below-market lease, we include such an option in the calculation of the fair value of such lease and the period over which the lease is amortized if we determine that the Neighbor has a financial incentive and wherewithal to exercise such option.
Intangible assets also include the value of in-place leases, which represents the estimated value of the net cash flows of the in-place leases to be realized, as compared to the net cash flows that would have occurred had the property been vacant at the time of acquisition and subject to lease-up. Acquired in-place lease value is amortized to depreciation and amortization expense over the average remaining non-cancelable terms of the respective in-place leases.
We estimate the value of Neighbor origination and absorption costs by considering the estimated carrying costs during hypothetical expected lease-up periods, considering current market conditions. In estimating carrying costs, management includes real estate taxes, insurance and othercomparable acquisitions, historical operating expenses, and estimates of lost rentals at market rates during the expected lease-up periods.
Estimates of the fair values of the tangible assets, identifiable intangibles, and assumed liabilities require us to estimate market lease rates, property operating expenses,results, carrying costs during lease-up periods, discount and capitalization rates, market absorption periods, and the number of years the property will be held for investment. The use of inappropriate estimates would result in an incorrect valuation of our acquired tangible assets, identifiable intangibles and assumed liabilities, which would impact the amount of our net income.
We calculate the fair value of assumed long-term debt by discounting the remaining contractual cash flows on each instrument at the current market rate for those borrowings, whichQuarterly, we approximate based on the rate at which we would expect to incur a replacement instrument on the date of acquisition, and recognize any fair value adjustments related to long-term debt as effective yield adjustments over the remaining term of the instrument.
Valuation of Real Estate Assets—We review our owned real estate properties, for evidence of impairment quarterly. Particular examples of events and changes in circumstances that could indicate potential impairments are significant decreases in occupancy, operating income, and market values or planned dispositions in which a published or contract price is less than the current carrying value of the assets being targeted for disposition. When indicators of potential impairment suggest that the carrying value of our real estate may be greater than fair value, we will assess the recoverability, considering recent operating results, expected net operating cash flow, estimated sales price, and plans for future operations. If, based on this analysis of undiscounted cash flows, we do not believe that we will be able to recover the carrying value of these assets, we would record an impairment loss to the extent that the carrying value exceeds the estimated fair value of the real estate assets as defined by Accounting Standards Codification (“ASC”) Topic 360, Property, Plant, and Equipment. During the year ended December 31, 2020, we recorded $2.4 million in impairment of real estate assets.
Propertiesincluding those classified as real estate held for sale, represent properties that are under contract for sale and whereevidence of impairment, which requires us, at times, to estimate the applicable pre-sale due diligence period has expired prior to the end of the reporting period. When a property is identified as held-for-sale, we compare the contract sales price of the property, net of estimated selling costs, to the net book value of the property. If the estimated net sales price of the property is less than the net book value, an adjustment to the carrying value would be recorded to reflect the estimated fair value of the property.
In accounting forour real estate assets. Valuing our investment in real estate assets we haverequires us to employutilize a significant amount of judgment in the inputs that we select for impairment testing and other analyses. We select these inputs based on all available evidence and using techniques that are commonly employed by other real estate companies. Some examplesExamples of these inputs areinclude projected
revenue and expense growth rates, estimates of future cash flows, anticipated holding periods, capitalization rates, general economic conditions and trends, orand other available market data. Our ability to accurately predict future operating results and cash flows, as well as to estimate and determine fair values, impacts
We believe that our real estate valuation estimates are based on reasonable assumptions. However, the timing and recognitionuse of impairments. While we believeinappropriate estimates could result in an incorrect valuation of our assumptions are reasonable, changesreal estate properties, at acquisition or during our ownership period, which could result in these assumptions may have a material impact on our financial results.impairment losses in the future.
Rental Income—AThe majority of our revenue is lease revenue derived from our real estate assets, for which we are the lessor. On January, 1 2019, we adopted ASC Topic 842, Leases (“ASC 842”) using a modified-retrospective approach. As such, beginning January 1, 2019, we evaluate whether a lease is an operating, sales-type, or direct financing lease using the criteria established in ASC 842. Leases will be considered either sales-type or direct financing leases if any of the following criteria are met:
•if the lease transfers ownership of the underlying asset to the lessee by the end of the term;
•if the lease grants the lessee an option to purchase the underlying asset that is reasonably certain to be exercised;
•if the lease term is for the major part of the remaining economic life of the underlying asset; or
•if the present value of the sum of the lease payments and any residual value guaranteed by the lessee equals or exceeds substantially all of the fair value of the underlying asset.
We utilize substantial judgment in determining the fair value of the leased asset, the economic life of the leased asset, and the relevant borrowing rate in performing our lease classification analysis. If none of the criteria listed above are met, the lease is classified as an operating lease. Currently, all of our leases are classified as operating leases, and we expect that the majority, if not all, of our leases will continue to be classified as operating leases based upon our typical lease terms.
We record property operating expense reimbursements due from Neighbors for common area maintenance, real estate taxes, and other recoverable costs in the period the related expenses are incurred. A portion of our Neighbors reimburse operating costs on a fixed-rate basis, and in those circumstances, operating expense reimbursements due to us are recorded on a straight-line basis. We make certain assumptions and judgments in estimating the reimbursements at the end of each reporting period. We do not expect the actual results to differ materially from the estimated reimbursement.
We commence revenue recognition on our leases based on a number of factors. In most cases, revenue recognition under a lease begins when the lessee takes possession of or controls the physical use of the leased asset. The determination of when revenue recognition under a lease begins, as well as the nature of the leased asset, is dependent upon our assessment of who is the owner, for accounting purposes, of any related tenant improvements. If we are the owner, for accounting purposes, of the tenant improvements, then the leased asset is the finished space, and revenue recognition begins when the lessee takes possession of the finished space, typically when the improvements are substantially complete.
If we conclude that we are not the owner, for accounting purposes, of the tenant improvements (i.e., the lessee is the owner), then the leased asset is the unimproved space and any tenant allowances funded under the lease are treated as lease incentives, which reduce revenue recognized over the term of the lease. In these circumstances, we begin revenue recognition when the lessee takes possession of the unimproved space to construct their own improvements. We consider a number of different factors in evaluating whether the lessee or we are the owner of the tenant improvements for accounting purposes. These factors include:
•whether the lease stipulates how and on what a tenant improvement allowance may be spent;
•whether the tenant or landlord retains legal title to the improvements;
•the uniqueness of the improvements;
•the expected economic life of the tenant improvements relative to the length of the lease; and
•who constructs or directs the construction of the improvements.
Historically, we periodically reviewed the collectibility of outstanding receivables. Following the adoption of ASC 842, leaseLease receivables are reviewed continually to determine whether or not it is probable that we will realize substantially all remaining lease payments for each of our Neighbors (i.e., whether a Neighbor is deemed to be a credit risk). Additionally, we record a general reserve based on our review of operating lease receivables at a company level to ensure they are properly valued based on analysis of historical bad debt, outstanding balances, and the current economic climate. If we determine it is not probable that we will collect substantially all of the remaining lease payments from a Neighbor, revenue for that Neighbor is recorded on a cash basis (“cash-basis Neighbor”), including any amounts relating tono longer recognizing straight-line rent receivables and/or receivables for recoverable expenses. We will resume recording lease income on an accrual basis for cash-basis Neighbors once we believe the collection of rent for the remaining lease term is probable, which will generally be after a period of regular payments. payments and no remaining unpaid rent for a certain timeframe. Neighbors who represent approximately 2% of our ABR are on our watchlist for review for collectibility as of December 31, 2023. However, not all of our watchlist Neighbors have an open receivable balance with us at December 31, 2023.
Additionally, we record a general reserve based on our review of operating lease receivables at a company level to ensure they are properly valued based on analysis of historical uncollectible tenant receivables, outstanding balances, and the current economic climate.
The aforementioned adjustments, as well as any reserve for disputed charges, are recorded as a reduction of Rental Income rather than in Property Operating, where our reserves were previously recorded, on the consolidated statements of operations.
Impact of Recently Issued Accounting Pronouncements—In response to the COVID-19 pandemic, the Financial Accounting Standards Boardoperations and comprehensive income (“FASB”) issued interpretive guidance addressing the accounting treatment for lease concessions attributable to the pandemic. Under this guidance, entities may elect to account for such lease concessions consistent with how they would be accounted for under ASC 842 if the enforceable rights and obligations for the lease concessions already existed within the lease agreement, regardless of whether such enforceable rights and obligations are explicitly outlined within the lease. This accounting treatment may only be applied if (1) the lease concessions were granted as a direct result of the pandemic, and (2) the total cash flows under the modified lease are less than or substantially the same as the cash flows under the original lease agreement. As a result, entities that make this election will not have to analyze each lease to determine whether enforceable rights and obligations for concessions exist within the contract, and may elect not to account for these concessions as lease modifications within the scope of ASC 842.
Some concessions will provide a deferral of payments, which may affect the timing of cash receipts without substantively impacting the total consideration per the original lease agreement. The FASB has stated that there are multiple acceptable methods to account for deferrals under the interpretive guidance:
•Account for the concession as if no changes to the lease contract were made, increasing the lease receivable as payments accrue and continuing to recognize income; or
•Account for deferred lease payments as variable lease payments.
We have elected not to account for any qualifying lease concessions granted as a result of the COVID-19 pandemic as lease modifications and will account for any qualifying concessions granted as if no changes to the lease contract were made. This will result in an increase to the related lease receivable as payments accrue while we continue to recognize rental income. We will, however, assess the impact of any such concessions on estimated collectibility of the related lease payments and will reflect any adjustments as necessary as an offset to Rental Income on the consolidated statements of operations.operations”).
ReferOur revenue collectibility estimates are made based on historical experience, the current economic climate, and other Neighbor-specific factors. While we do not believe there is a reasonable likelihood of a material change in the estimates or assumptions that we use to Note 2 for discussionrecognize revenue, if actual payment levels were to vary significantly from estimates, we may be exposed to decreases in rental income that could be material or increases of the impact of other recently issuednon-cash straight-line income when a cash-basis Neighbor moves back to accrual accounting pronouncements.in accordance with GAAP.
ITEM 7A. QUANTITATIVE AND QUALITATIVE DISCLOSURES ABOUT MARKET RISK
INTEREST RATE RISK—We utilize interest rate swaps in order to hedge a portion of our exposure to interest rate fluctuations. We do not intend to enter into derivative or interest rate transactions for speculative purposes. Our hedging decisions are determined based upon the facts and circumstances existing at the time of the hedge and may differ from our currently anticipated hedging strategy. Because we use derivative financial instruments to hedge against interest rate fluctuations, we may be exposed to both credit risk and market risk. Credit risk is the failure of the counterparty to perform under the terms of the derivative contract. If the fair value of a derivative contract is positive, the counterparty will owe us, which creates credit risk for us. If the fair value of a derivative contract is negative, we will owe the counterparty and, therefore, do not have credit risk. We seek to minimize the credit risk in derivative instruments by entering into transactions with high-quality counterparties. Market risk is the adverse effect on the value of a financial instrument that results from a change in interest rates. The market risk associated with interest-rate contracts is managed by establishing and monitoring parameters that limit the types and degree of market risk that may be undertaken.
| | | | | | | | | | | |
PHILLIPS EDISON & COMPANY DECEMBER 31, 2023 FORM 10-K | | | 44 |
As of December 31, 2020,2023, we had sixfour interest rate swaps that fixed LIBORSOFR on $1.0 billion$700 million of our unsecured term loan facilities.
In January 2024, we entered into an interest rate swap which has a notional amount of $150 million and swaps SOFR for a fixed rate of approximately 3.45% effective September 2024 and maturing December 2025.
As of December 31, 2020,2023, we had not fixed the interest rate on $580.5$445.8 million of our unsecured debt through derivative financial instruments, and as a result, we are subject to the potential impact of rising interest rates, which could negatively impact our profitability and cash flows. We estimate that a one percentage point increase in interest rates on the outstanding balance of our variable-rate debt at December 31, 20202023 would result in approximately $5.8$4.5 million of additional interest expense annually. The additional interest expense was determined based on the impact of hypothetical interest rates on our borrowing cost and assumes no changes in our capital structure. For further discussion of certain quantitative details related to our interest rate swaps, see Note 10.9.
The information presented above does not consider all exposures or positions that could arise in the future. Hence, the information represented herein has limited predictive value. As a result, the ultimate realized gain or loss with respect to interest rate fluctuations will depend on the exposures that arise during the period, the hedging strategies at the time, and the related interest rates.
See further discussion on interest amounts on our variable rate debt in Note 8 and discussion on the swap rate for our interest rate swaps in Note 9.
FOREIGN CURRENCY EXCHANGE RISK—We do not have any foreign operations, and thus, we are not exposed to foreign currency fluctuations.
In July 2017, the Financial Conduct Authority (the regulatory authority over LIBOR) stated that it would phase out LIBOR as a benchmark. In November 2020, the Federal Reserve Board announced that banks must stop writing new U.S. dollar (“USD”) LIBOR contracts by the end of 2021 and that, no later than June 30, 2023, when USD LIBOR will no longer be published, market participants should amend legacy contracts to use the Secured Overnight Financing Rate or another alternative reference rate. We have contracts that are indexed to LIBOR and are monitoring and evaluating the related risks, which include interest amounts on our variable rate debt as discussed in Note 9 and the swap rate for our interest rate swaps, as discussed in Note 10. See “Part I, Item 1A. Risk Factors” of this filing on Form 10-K for further discussion on risks related to changes in LIBOR reporting practices, the method in which LIBOR is determined, or the use of alternative reference rates.
ITEM 8. FINANCIAL STATEMENTS AND SUPPLEMENTARY DATA
See the Index to Consolidated Financial Statements on page F-1 of this report.
ITEM 9. CHANGES IN AND DISAGREEMENTS WITH ACCOUNTANTS ON ACCOUNTING AND FINANCIAL DISCLOSURE
None.Not applicable.
ITEM 9A. CONTROLS AND PROCEDURES
Evaluation of Disclosure Controls and Procedures
OurAs required by Rule 13a-15(b) and Rule 15d-15(b) under the Securities Exchange Act of 1934, as amended (the “Exchange Act”), our management, with the participation of our Principal Executive Officer and Principal Financial Officer, has evaluated the effectiveness of our disclosure controls and procedures (as defined in Rule 13a-15(e) and Rule 15d-15(e) under the Exchange Act) as of December 31, 2020.2023. Based on that evaluation, our Principal Executive Officer and Principal Financial Officer concluded that our
disclosure controls and procedures (as defined in Rule 13a-15(e) and Rule 15d-15(e) under the Exchange Act) were effective as of December 31, 2020.2023, at a reasonable assurance level.
Management’s Annual Report on Internal Control Over Financial Reporting
Our management is responsible for establishing and maintaining adequate internal control over financial reporting, as defined in Exchange Act Rule 13a-15(f) and Rule 15d-15(f). Our system of internal control over financial reporting is designed to provide reasonable assurance regarding the preparation and fair presentation of the consolidated financial statements for external purposes in accordance with GAAP. All internal control systems, no matter how well designed, have inherent limitations. Therefore, even those systems determined to be effective can only provide reasonable assurance with respect to financial statement preparation and presentation. Also, because of changes in conditions, the effectiveness of an internal control system may vary over time.
Under the supervision and with the participation of our management, including our Principal Executive Officer and Principal Financial Officer, we conducted an evaluation of the effectiveness of our internal control over financial reporting based on the framework in Internal Control - Integrated Framework (2013) issued by the Committee of Sponsoring Organizations of the Treadway Commission (“COSO”). Based on our evaluation under the framework in Internal Control - Integrated Framework (2013) issued by the COSO, our management concluded that our internal control over financial reporting was effective as of December 31, 2020.2023.
Deloitte & Touche LLP, an independent registered public accounting firm that audited our financial statements, which are included in Item 8 of this Annual Report on Form 10-K, has issued an attestation report on management’s internal control over financial reporting, which is included in this Item 9A under the caption "Report of Independent Registered Public Accounting Firm”.
| | | | | | | | | | | |
PHILLIPS EDISON & COMPANY DECEMBER 31, 2023 FORM 10-K | | | 45 |
Changes in Internal Control over Financial Reporting
During the quarter ended December 31, 2020,2023, there were no changes in our internal control over financial reporting (as defined in Rule 13a-15(f) and Rule 15d-15(f) under the Exchange Act) that have materially affected, or are reasonably likely to materially affect, our internal control over financial reporting.
| | | | | | | | | | | |
PHILLIPS EDISON & COMPANY DECEMBER 31, 2023 FORM 10-K | | | 46 |
REPORT OF INDEPENDENT REGISTERED PUBLIC ACCOUNTING FIRM
To the Stockholders and the Board of Directors of Phillips Edison & Company, Inc.
Opinion on Internal Control over Financial Reporting
We have audited the internal control over financial reporting of Phillips Edison & Company, Inc. and subsidiaries (the “Company”) as of December 31, 2023, based on criteria established in Internal Control — Integrated Framework (2013) issued by the Committee of Sponsoring Organizations of the Treadway Commission (COSO). In our opinion, the Company maintained, in all material respects, effective internal control over financial reporting as of December 31, 2023, based on criteria established in Internal Control — Integrated Framework (2013) issued by COSO.
We have also audited, in accordance with the standards of the Public Company Accounting Oversight Board (United States) (PCAOB), the consolidated financial statements as of and for the year ended December 31, 2023, of the Company and our report dated February 12, 2024, expressed an unqualified opinion on those financial statements.
Basis for Opinion
The Company’s management is responsible for maintaining effective internal control over financial reporting and for its assessment of the effectiveness of internal control over financial reporting, included in the accompanying Management’s Annual Report on Internal Control Over Financial Reporting. Our responsibility is to express an opinion on the Company’s internal control over financial reporting based on our audit. We are a public accounting firm registered with the PCAOB and are required to be independent with respect to the Company in accordance with the U.S. federal securities laws and the applicable rules and regulations of the Securities and Exchange Commission and the PCAOB.
We conducted our audit in accordance with the standards of the PCAOB. Those standards require that we plan and perform the audit to obtain reasonable assurance about whether effective internal control over financial reporting was maintained in all material respects. Our audit included obtaining an understanding of internal control over financial reporting, assessing the risk that a material weakness exists, testing and evaluating the design and operating effectiveness of internal control based on the assessed risk, and performing such other procedures as we considered necessary in the circumstances. We believe that our audit provides a reasonable basis for our opinion.
Definition and Limitations of Internal Control over Financial Reporting
A company’s internal control over financial reporting is a process designed to provide reasonable assurance regarding the reliability of financial reporting and the preparation of financial statements for external purposes in accordance with generally accepted accounting principles. A company’s internal control over financial reporting includes those policies and procedures that (1) pertain to the maintenance of records that, in reasonable detail, accurately and fairly reflect the transactions and dispositions of the assets of the company; (2) provide reasonable assurance that transactions are recorded as necessary to permit preparation of financial statements in accordance with generally accepted accounting principles, and that receipts and expenditures of the company are being made only in accordance with authorizations of management and directors of the company; and (3) provide reasonable assurance regarding prevention or timely detection of unauthorized acquisition, use, or disposition of the company’s assets that could have a material effect on the financial statements.
Because of its inherent limitations, internal control over financial reporting may not prevent or detect misstatements. Also, projections of any evaluation of effectiveness to future periods are subject to the risk that controls may become inadequate because of changes in conditions, or that the degree of compliance with the policies or procedures may deteriorate.
/s/ Deloitte & Touche LLP
Cincinnati, Ohio
February 12, 2024
| | | | | | | | | | | |
PHILLIPS EDISON & COMPANY DECEMBER 31, 2023 FORM 10-K | | | 47 |
ITEM 9B. OTHER INFORMATION
None.Not applicable.
ITEM 9C. DISCLOSURE REGARDING FOREIGN JURISDICTIONS THAT PREVENT INSPECTIONS
Not applicable.
ITEM 10. DIRECTORS, EXECUTIVE OFFICERS, AND CORPORATE GOVERNANCE
Directors
BelowThe information required by this Item is certain informationincluded under the caption “Information about our current directors serving on the Board of Directors (“Board”) for Phillips Edison & Company, Inc. (“we,” the “Company,” “PECO,” “our,”Executive Officers” in Part I hereof or “us”) as of the date hereof:
| | | | | |
Jeffrey S. Edison
Chairman
Director Since 2009
Age 60
| Mr. Edison has served as PECO’s Chairman of the Board and Chief Executive Officer since December 2009 and also served as President from October 2017 to August 2019. Mr. Edison also served as Chairman of the Board and Chief Executive Officer of Phillips Edison Grocery Center REIT III, Inc. (“REIT III”) from April 2016 through the date it merged with PECO in October 2019, and served as Chairman of the Board and Chief Executive Officer of Phillips Edison Grocery Center REIT II, Inc. (“REIT II”) from 2013 through the date it merged with PECO in November 2018. Mr. Edison co-founded Phillips Edison Limited Partnership (“PELP”) and has served as a principal of it since 1995. Before founding Phillips Edison, Mr. Edison was a senior vice president from 1993 until 1995 and was a vice president from 1991 until 1993 at Nations Bank’s South Charles Realty Corporation. Mr. Edison was employed by Morgan Stanley Realty Incorporated from 1987 until 1990, and was employed by The Taubman Company from 1984 to 1987. Mr. Edison holds a Bachelor of Arts in mathematics and economics from Colgate University and a Master of Business Administration from Harvard University.
Among the most important factors that led to the Board’s recommendation that Mr. Edison serve as a director are his leadership skills, integrity, judgment, knowledge of PECO, his experience as a director and chief executive officer of PECO, REIT II, and REIT III, and his commercial real estate expertise.
|
Leslie T. Chao
Lead Independent Director
Director Since 2010
Age 64
| Mr. Chao has served as a director since July 2010 and as Lead Independent Director since November 2017. He retired in 2008 as Chief Executive Officer of Chelsea Property Group, Inc., a New York Stock Exchange (“NYSE”) listed shopping center real estate investment trust (“REIT”) with operations in the United States, Asia and Mexico (now part of Simon Property Group, NYSE: SPG), previously serving as President and Chief Financial Officer. He has been a board member of London-based Value Retail PLC since 2009; and a co-founder and chairman of entities comprising Value Retail China, a privately-held owner/developer of retail properties, since 2012. From 2005 to 2008 he was an inaugural member of the board of Link REIT, the first publicly-listed and largest REIT in Hong Kong. Earlier in his career, Mr. Chao was with Manufacturers Hanover Corporation (now part of JPMorgan Chase & Co.), ending in 1987 as a Vice President in the bank holding company treasury group. He received an MBA from Columbia University and an AB from Dartmouth College, where he is a member of the President’s Leadership Council and the advisory board of the Hopkins Center for the Arts. He is based in New York City.
Among the most important factors that led to the Board’s recommendation that Mr. Chao serve as a director are his extensive domestic and international commercial real estate expertise, accounting and
financial management expertise, public company director experience, integrity, judgment, leadership skills, and independence from management and our affiliates.
|
| | | | | |
Elizabeth Fischer
Director Since 2019
Age 61
| Ms. Fischer joined Goldman Sachs & Co. LLC in 1998 and most recently served as Managing Director of the Bank Debt Portfolio Group from 2010 until her retirement in May 2019, where she managed Leveraged Finance-led syndicated loans. She also served four years as co-head of Goldman Sachs’ firm-wide Women’s Network for the Americas. Prior to joining Goldman Sachs, she held various positions in the leveraged finance, syndications, and risk management group at the Canadian Imperial Bank of Commerce (CIBC). Ms. Fischer began her career at KPMG LLP. She holds a Bachelor of Arts from Colgate University and a Master of Business Administration from New York University.
Among the most important factors that led to the Board’s recommendation that Ms. Fischer serve as a director are her financial and investment expertise, leadership skills, integrity, judgment, and independence from management and our affiliates.
|
Paul J. Massey, Jr.
Director Since 2010
Age 61
| Mr. Massey began his career in 1983 at Coldwell Banker Commercial Real Estate Services, now CBRE, in Midtown Manhattan, first as the head of the market research department, and next as an investment sales broker. Together with partner Robert A. Knakal, he founded Massey Knakal Realty Services, which became New York City’s largest investment property sales brokerage firm, of which Mr. Massey served as Chief Executive Officer. With 250 sales professionals serving more than 200,000 property owners, Massey Knakal Realty Services was ranked as New York City’s #1 property sales company in transaction volume by the Costar Group, a national, independent real estate analytics provider. With more than $4.0 billion in annual sales, Massey Knakal was also ranked as one of the nation’s largest privately-owned real estate brokerage firms. On December 31, 2014, Massey Knakal was sold to global commercial real estate firm Cushman & Wakefield, Inc., for which Mr. Massey served as President - New York Investment Sales through April 2018. In July 2018, Mr. Massey founded B6 Real Estate Advisors, a real estate brokerage firm in New York City, and currently serves as its Chief Executive Officer. In 2007, Mr. Massey was the recipient of the Real Estate Board of New York’s (“REBNY’’) prestigious Louis B. Smadbeck Broker Recognition Award. Mr. Massey also serves as Chair for REBNY’s Ethics and Business Practice Subcommittee, was a director on the Commercial Board of Directors of REBNY, is Chairman of the Board of Trustees of the Roxbury Latin School, and serves as a chair or member of numerous other committees. He served as a director of REIT II from July 2014 to August 2017. Mr. Massey holds a Bachelor of Arts in economics from Colgate University.
Among the most important factors that led to the Board’s recommendation that Mr. Massey serve as a director are his integrity, judgment, leadership skills, extensive commercial real estate expertise, familiarity with our company, and independence from management and our affiliates.
|
Stephen R. Quazzo
Director Since 2013
Age 61
| Mr. Quazzo is co-founder and Chief Executive Officer of Pearlmark Real Estate, L.L.C. From 1991 to 1996, Mr. Quazzo served as President of Equity Institutional Investors, Inc., a subsidiary of investor Sam Zell’s private holding company, Equity Group Investments, Inc. Mr. Quazzo was responsible for raising equity capital and performing various portfolio management services in connection with the firm’s real estate investments, including institutional opportunity funds and public REITs. Prior to joining the Zell organization, Mr. Quazzo was in the Real Estate Department of Goldman, Sachs & Co., where he was a vice president responsible for the firm’s real estate investment banking activities in the Midwest. Mr. Quazzo holds a Bachelor of Arts and a Master of Business Administration from Harvard University, where he serves as a member of the Board of Dean’s Advisors for the business school. He is a Trustee of the Urban Land Institute (ULI), Trustee and immediate past Chair of the ULI Foundation, a member of the Pension Real Estate Association, and a licensed real estate broker in Illinois. In addition, Mr. Quazzo currently serves a director of Marriott Vacations Worldwide (NYSE: VAC) and previously served as a director of ILG, Inc. (Nasdaq: ILG) until September 2018 and Starwood Hotels & Resorts Worldwide, Inc. (NYSE: HOT) until September 2016. He also sits on a number of non-profit boards, including Rush University Medical Center, the Chicago Symphony Orchestra Endowment, the Chicago Parks Foundation, Deerfield Academy, and City Year Chicago.
Among the most important factors that led to the Board’s recommendation that Mr. Quazzo serve as a director are his commercial real estate expertise, investment management expertise, public company director experience, leadership skills, integrity, judgment, and independence from management and our affiliates.
|
Jane Silfen
Director Since 2019
Age 35
| Ms. Silfen is the founder and owner of Mayfair Advisors LLC, which was founded in 2019 to advise clients on sustainability and clean technology investment opportunities. Since 2015, she also has served as Vice President at Mayfair Management Co., Inc., a New York City-based family office, where she is responsible for overseeing and making public and private investments. In February of 2021, Ms. Silfen was named interim CFO of Genera Energy Inc., a sustainable packaging company. Ms. Silfen began her career in investment banking at Goldman Sachs and later served as Vice President at Encourage Capital, LLC. She holds a Bachelor of Arts from the University of Pennsylvania and a Master in Public Policy and Master of Business Administration from Harvard University.
Among the most important factors that led to the Board’s recommendation that Ms. Silfen serve as a director are her investment experience, clean technology and sustainability expertise, integrity, judgment, and independence from management and our affiliates.
|
| | | | | |
John A. Strong
Director Since 2018
Age 60
| Since July 2010, Dr. Strong has served as Chairman and Chief Executive Officer of Bankers Financial Corporation, a diversified financial services company for outsourcing solutions for claims, policy and flood products for insurers; insurance tracking for lenders; human resources solutions for small business; warranties for consumer electronics and new homes; insurance and maintenance services for properties, businesses and builders; and surety bonds for bail. From 2005 to 2010, he served as the President and Managing Partner of Greensboro Radiology. Since 2007, Dr. Strong has served as a board member of Bankers Financial Corporation. He previously served as a director of REIT II from May 2017 to November 2018 when it merged into PECO. Dr. Strong holds a Bachelor of Arts in mathematics from Duke University and a Doctor of Medicine degree from Michigan State University College of Human Medicine as well as his residency and fellowship in radiology from Duke University.
Among the most important factors that led to the Board’s recommendation that Dr. Strong serve as a director are his financial and management expertise, judgment, leadership skills, and independence from management and our affiliates.
|
Gregory S. Wood
Director Since 2016
Age 62
| Mr. Wood has been Executive Vice President and Chief Financial Officer of EnergySolutions, Inc., a leading services provider to the nuclear industry, since June 2012. Prior to that, Mr. Wood held the role of Chief Financial Officer at numerous public and private companies, including Actian Corporation, Silicon Graphics, Liberate Technologies, and InterTrust Technologies. Mr. Wood was a director of Steinway Musical Instruments, Inc. from October 2011 to October 2013, where he also served as Chairman of the Audit Committee. Mr. Wood, a certified public accountant (inactive), holds a Bachelor of Business Administration in accounting from the University of San Diego and a Juris Doctor from the University of San Francisco School of Law.
Among the most important factors that led to the Board’s recommendation that Mr. Wood serve as a director are Mr. Wood’s accounting and financial management expertise, public company director experience, integrity, judgment, and independence from management and our affiliates.
|
Board Leadership Structure
The Board believes that it should have the flexibilitywill be included in our definitive proxy statement to periodically (i) determine the leadership structure that is best for the Company and (ii) review such structure to determine whether it continues to serve the Company and its stockholders. The Board believes the current leadership structure, with Mr. Edison serving as both Chief Executive Officer and Chairman of the Board, provides a well-functioning and effective balance between strong management leadership and appropriate oversight by the Lead Independent Director. The Board believes this is the optimal structure to guide the Company and maintain the focus required to achieve the business goals and grow stockholder value. As Chairman of the Board, Mr. Edison presides over Board and stockholder meetings, oversees the setting of the agenda for those meetings and the dissemination of information about the Company to the Board, and represents the Company at public events.
Because the Chairman is an employee of the Company, the Board elects a Lead Independent Director from its independent directors. Mr. Chao has served as our Lead Independent Director since November 2017. The Chairman and Chief Executive Officer consults periodicallybe filed with the Lead Independent Director on Board matters, Board agendas, and on issues facing the Company. In addition, the Lead Independent Director: (i) serves as the principal liaison between the Chairman of the Board and the independent directors; (ii) presides at all meetings of the Board at which the Chairman is not present, including executive sessions of the independent directors; and (iii) performs such other duties as may be assigned by the Board. Our Lead Independent Director also has the authority to call meetings of the independent directors of the Board.
Board Committees
To assist the Board in undertaking its responsibilities, and to allow deeper engagement in certain areas of Company oversight, the Board has established two standing committees: Audit Committee and Compensation Committee. Both committees are comprised exclusively of independent directors, as determined under the NYSE listing standards. Each committee’s charter is available on our website at www.phillipsedison.com/investors/governance. The current chairs and members of each committee are set forth below:
| | | | | | | | |
| Audit Committee | Compensation Committee |
Leslie T. Chao | Chair | |
Elizabeth Fischer | Member | |
Paul J. Massey, Jr. | | Member |
Stephen R. Quazzo | Member | |
Jane Silfen | | Member |
John A. Strong | | Chair |
Gregory S. Wood | Member | |
Audit Committee—The Audit Committee’s primary function is to assist the Board in fulfilling its responsibilities by overseeing the Company’s independent registered public accounting firm, reviewing the financial information to be provided to our stockholders and others, overseeing the system of internal control over financial reporting that management has established, and overseeing our audit and financial reporting process. The Audit Committee also is responsible for overseeing our compliance with applicable laws and regulations and for establishing procedures for the ethical conduct of our business. The Board has determined that Mr. Chao qualifies as an “audit committee financial expert” as defined by applicable U.S. Securities
and Exchange Commission (“SEC”) regulations and that all members of the Audit Committee are “financially literate” within the meaning of the NYSE listing standards. During 2020, the Audit Committee held five meetings.
Compensation Committee—The Compensation Committee’s primary functions are to discharge the Board’s responsibility relating to compensation of our directors and executive officers by evaluating and approving director and executive officer compensation plans, policies and programs. The Compensation Committee also is responsible for (i) reviewing and discussing with management the Compensation Discussion and Analysis (‘‘CD&A’’) required to be included120 days after December 31, 2023 in this Annual Report on Form 10-K, (ii) recommending to the Board whether the CD&A should be included in such Annual Report, and (iii) providing a Compensation Committee Report that compliesconnection with the applicable federal securities laws and regulations for inclusion in this Annual Report on Form 10-K. During 2020, the Compensation Committee held five meetings.
Director Nomination Process
The Board is responsible for selecting its own nominees and recommending them for election by our stockholders. All director nominees then stand for election by our stockholders annually. The Board does not have a standing nominating committee or a charter that governs the director nomination process. The Board believes that the primary reason for creating a standing nominating committee is to ensure that candidates for independent director positions can be identified and their qualifications assessed under a process free from conflicts of interest with PECO. Because nominations for vacancies in independent director positions are handled exclusively by the independent directors, the Board has determined that the creation of a standing nominating committee is not necessary at this time.
Board Membership Criteria—The Board annually reviews the appropriate experience, skills, and characteristics required of directors in the context of the then-current membership of the Board. This assessment includes, in the context of the perceived needs of the Board at that time, issues of knowledge, experience, judgment, and skills such as an understanding of commercial real estate, capital markets, business leadership, accounting, financial management, and environmental, social, and corporate governance matters. No one person is likely to possess deep experience in all of these areas. Therefore, the Board has sought a diverse board of directors whose members collectively possess these skills and experiences. Other considerations include the candidate’s independence from PECO and our affiliates and the ability of the candidate to participate in Board meetings regularly and to devote an appropriate amount of time and effort in preparation for those meetings. It also is expected that independent directors nominated by the Board shall be individuals who possess a reputation and hold (or have held) positions or affiliations befitting a director of a large public company and are (or have been) actively engaged in their occupations or professions or are otherwise regularly involved in the business, professional, or academic community. As detailed in the director biographies above, the Board believes that the slate of directors recommended for election at theCompany's 2024 Annual Meeting possesses these diverse skillsof Stockholders, and experiences.
Stockholder Nominees—Stockholders may directly nominate potential directors (without the recommendation of the Board) by satisfying the procedural requirements for such nomination as provided in Section 2.12 of our Bylaws. In order for stockholder nominees to be considered for nomination by the Board, recommendations made by stockholders must be submitted within the timeframe required to request a proposal to be included in the proxy materials. In evaluating the persons recommended by stockholders as potential directors, the Board will consider each candidate without regard to the source of the recommendation and take into account those factors that the Board determines are relevant.
Corporate Governance Guidelines
The Board has adopted the Corporate Governance Guidelines, which are available on our website at www.phillipsedison.com/investors/governance. The contents of our website are notis hereby incorporated by reference into this Form 10-K.
Code of Ethics
The Board has adopted a Code of Ethics that applies to all of our directors, officers, and employees, including our principal executive, principal financial, and principal accounting officers. The Code of Ethics is available on our website at www.phillipsedison.com/investors/governance. In the event of any changes to the Code of Ethics, revised copies will be made available on our website. The contents of our website are not incorporated by reference into this Form 10-K.
Attendance
The Board held seven meetings in 2020. During 2020, each director attended at least 75% of the aggregate number of the meetings of the Board and each committee of the Board on which he or she then served. Each of the directors then serving on the Board attended the 2020 annual meeting of stockholders. Each director is expected to make reasonable efforts to attend all meetings of the Board and Committees on which the director serves, as well as the Company’s annual meeting.
Board’s Role in Risk Oversight
While day-to-day risk management is primarily the responsibility of PECO’s management team, the Board is responsible for strategic planning and overall supervision of our risk management activities. The Board, including through its Audit Committee, is actively involved in overseeing risk management for PECO through: (i) its oversight of our executive officers and our subsidiaries and affiliates; (ii) its review and approval of all transactions with related parties; (iii) its review and discussion of regular periodic reports to the Board and its committees, including management reports on property operating data, compliance with debt covenants, actual and projected financial results, compliance with requirements set forth in our charter and Corporate Governance Guidelines, and various other matters relating to our business; and (iv) its review and discussion of regular periodic reports from our independent registered public accounting firm to the Audit Committee regarding various areas of potential risk. The Board’s Compensation Committee also assesses executive compensation risk and balances it so that Company executives are not incentivized to take actions which create unnecessary risk for the Company.
Compensation Committee Interlocks and Insider Participation
No member of the Compensation Committee was an officer or employee of PECO during 2020, and no member of the Compensation Committee is a former officer of PECO or was a party to any related party transaction involving PECO required to be disclosed under Item 404 of Regulation S-K. During 2020, none of our executive officers served on the board of directors
or on the compensation committee of any other entity that has or had executive officers serving as a member of the Board or the Compensation Committee.
Stockholder Communications with the Board
We have established several means for our stockholders to communicate concerns to the Board. If the concern relates to our financial statements, accounting practices, or internal controls, then stockholders should submit the concern in writing directed to the Audit Committee Chair, c/o our Corporate Secretary at our executive offices. If the concern relates to our governance practices, business ethics, or corporate conduct, then stockholders should submit the concern in writing to the Lead Independent Director, c/o our Corporate Secretary at our executive offices. If uncertain as to which category a concern relates, then a stockholder should submit the concern in writing to the Independent Directors, c/o our Corporate Secretary at our executive offices.
Executive Officers
Below is certain information about our current executive officers as of the date hereof:
| | | | | |
Jeffrey S. Edison
Chairman & Chief Executive Officer
Age 60
| Mr. Edison has served as PECO’s Chairman of the Board and Chief Executive Officer since December 2009 and also served as President from October 2017 to August 2019. Mr. Edison also served as Chairman of the Board and Chief Executive Officer of REIT III from April 2016 through the date it merged with PECO in October 2019, and served as Chairman of the Board and Chief Executive Officer of REIT II from 2013 through the date it merged with PECO in November 2018. Mr. Edison co-founded PELP and has served as a principal of it since 1995. Before founding Phillips Edison, Mr. Edison was a senior vice president from 1993 until 1995 and was a vice president from 1991 until 1993 at Nations Bank’s South Charles Realty Corporation. Mr. Edison was employed by Morgan Stanley Realty Incorporated from 1987 until 1990, and was employed by The Taubman Company from 1984 to 1987. Mr. Edison holds a Bachelor of Arts in mathematics and economics from Colgate University and a Master of Business Administration from Harvard University. |
Devin I. Murphy
President
Age 61
| Mr. Murphy has served as our President since August 2019. Prior to that, he served as our Chief Financial Officer from June 2013, when he joined the Company, to August 2019. Before joining Phillips Edison in 2013, Mr. Murphy worked for 28 years as an investment banker and held senior leadership roles at Morgan Stanley and Deutsche Bank. He served as the Global Head of Real Estate Investment Banking at Deutsche Bank. His Deutsche Bank team executed over 500 transactions of all types for clients representing total transaction volume exceeding $400 billion and included initial public offerings, mergers and acquisitions, common stock offerings, secured and unsecured debt offerings, and private placements of both debt and equity. Mr. Murphy began his banking career at Morgan Stanley in 1986 and held a number of senior positions including Vice Chairman, co-head of US Real Estate Investment Banking, and Head of Real Estate Private Capital Markets. He also served on the Investment Committee of the Morgan Stanley Real Estate Funds, a series of global real estate funds with over $35 billion in assets under management. During his 20 years with Morgan Stanley, Mr. Murphy and his teams executed numerous capital markets and merger and acquisition transactions including a number of industry-defining transactions. Mr. Murphy served as a Director of the NYSE-listed real estate services firm Grubb and Ellis prior to its sale to BGC Partners and of the S&P 500 company Apartment Investment and Management (AIV) prior to its spin off transaction. Mr. Murphy currently serves as an independent director of Apartment Income REIT Corp (AIRC), a NYSE-listed apartment REIT, and serves on the Audit, Compensation, and Nominating Committees of AIRC. He is also an independent director of CoreCivic (CXW), a NYSE-listed corporation that provides diversified government solutions in corrections and detention management. He serves on the Audit and Risk Committees at CXW. Mr. Murphy received a Bachelor of Arts in English and History with Honors from the College of William and Mary and a Masters of Business Administration from the University of Michigan. |
Robert F. Myers
Chief Operating Officer & Executive Vice President
Age 48
| Mr. Myers has served as our Chief Operating Officer since October 2010. Mr. Myers joined PECO in 2003 as a Senior Leasing Manager, was promoted to Regional Leasing Manager in 2005 and became Vice President of Leasing in 2006. He was named Senior Vice President of Leasing and Operations in 2009, and Chief Operating Officer in 2010. Before joining PECO, Mr. Myers spent six years with Equity Investment Group, where he started as a property manager in 1997. He served as director of operations from 1998 to 2000 and as director of lease renegotiations/leasing agent from 2000 to 2003. He received his Bachelor’s degree in business administration from Huntington College in 1995. |
John P. Caulfield
Chief Financial Officer, Senior Vice President & Treasurer
Age 40
| Mr. Caulfield has served as our Chief Financial Officer, Senior Vice President, and Treasurer since August 2019. Prior to that, he served as our Senior Vice President of Finance from January 2016 to August 2019, with responsibility for financial planning and analysis, budgeting and forecasting, risk management, and investor relations. He served as chief financial officer, treasurer, and secretary of REIT III from August 2019 to October 2019 when it merged with PECO. He joined PECO in March 2014 as vice president of treasury and investor relations. Prior to joining PECO, Mr. Caulfield served as vice president of treasury and investor relations with CyrusOne Inc. (Nasdaq: CONE) from February 2012 to March 2014 where he played a key role in the company’s successful spinoff and IPO from Cincinnati Bell (NYSE: CBB); the establishment of its capital structure and treasury function; and creation, positioning, and strategy of messaging and communications with investors and research analysts. Prior to that, he spent seven years with Cincinnati Bell, holding various positions in treasury, finance, and accounting, including assistant treasurer and director of investor relations. Mr. Caulfield has a Bachelor’s degree in accounting and a Master of Business Administration from Xavier University and is a certified public accountant. |
| | | | | |
Tanya E. Brady
General Counsel, Senior Vice President & Secretary
Age 53
| Ms. Brady has served as our General Counsel and Senior Vice President since January 2015 and as Secretary since November 2018. She joined PECO in 2013 as Vice President and Assistant General Counsel. She has over 20 years of experience in commercial real estate and corporate transactions, including joint venture and fund formation matters, structuring and negotiating asset and entity-level acquisitions and dispositions and related financings, the sales and purchases of distressed loans, and general corporate matters. She also has extensive commercial leasing and sale leaseback experience. Prior to joining PECO, Ms. Brady was a partner at the law firm of Kirkland & Ellis LLP in Chicago, Illinois. Prior to that, she held associate positions at the law firms of Freeborn & Peters LLP (Chicago, Illinois), King & Spalding LLP (Atlanta, Georgia), and Scoggins & Goodman, P.C. (Atlanta, Georgia). Ms. Brady received a Bachelor of Civil Law degree with honors from the National University of Ireland College of Law in Dublin, Ireland, and a Juris Doctor from DePaul University College of Law in Chicago. She is licensed to practice in Illinois, Georgia, Ohio, and Utah. |
Delinquent Section 16(a) Reports
Section 16(a) of the Exchange Act requires directors, executive officers, the chief accounting officer, and any persons beneficially owning more than 10% of our common stock to report their initial ownership of the common stock and most changes in that ownership to the SEC. The SEC has designated specific due dates for these reports, and we are required to identify those persons who did not file these reports when due. Based solely on our review of copies of the reports filed with the SEC and written representations of our directors, executive officers and chief accounting officer, we believe all persons subject to these reporting requirements filed the reports on a timely basis in 2020.
ITEM 11. EXECUTIVE COMPENSATION
COMPENSATION DISCUSSION AND ANALYSIS
Overview
Named Executive Officers—This Compensation Discussion and Analysis describesThe information required by this Item will be included in our compensation program as it relatesdefinitive proxy statement to our named executive officers (“NEOs”). For 2020, our named executive officers were:
•Jeffrey S. Edison, Chairman ofbe filed with the Board and Chief Executive Officer;
•Devin I. Murphy, President;
•John P. Caulfield, Chief Financial Officer, Senior Vice President, and Treasurer;
•Robert F. Myers, Chief Operating Officer and Executive Vice President; and
•Tanya E. Brady, Senior Vice President, General Counsel, and Secretary.
Summary of Key Compensation Practices
| | | | | | | | | | | | | | | | | | | | |
WHAT WE DO | | WHAT WE DON’T DO |
| | | | | | |
√ | | A significant portion of our executive officers’ total compensation opportunity is based on performance and is not guaranteed. | | × | | We do not provide “single-trigger” change in control cash severance payments. |
√ | | We have a formulaic annual incentive bonus program based on goals for management. | | × | | We do not guarantee annual salary increases or minimum cash bonuses. |
√ | | We align the interests of our executive officers with our stockholders by awarding a significant percentage of their equity compensation in the form of multi-year, performance-based equity awards. | | × | | We do not provide tax gross-up payments to any of our executive officers for tax amounts they might pay pursuant to Section 4999 or Section 409A of the Internal Revenue Code (the “Code”). |
√ | | We enhance executive officer retention with time-based, multi-year vesting equity incentive awards. | | × | | We do not allow for repricing or buyouts of stock options without prior stockholder approval. |
√ | | The Compensation Committee, which is comprised solely of independent directors, engages an independent compensation consultant. | | | | |
COVID Impact—We recognized the uncertainty the COVID-19 pandemic was going to cause on our business operations. Early in 2020, as the COVID-19 pandemic’s impact developed, the Compensation Committee approved, at the recommendation of management, a temporary 25% reduction to the base salary of our chief executive officer, a temporary 10% reduction to the base salaries of each of our other NEOs, and a 10% reduction to the Board’s annual compensation. The reduction to base salaries was in effect until January 1, 2021. The Compensation Committee also considered adjusting performance metrics as a result of the COVID-19 pandemic. However, the Compensation Committee determined that as opposed to adjusting targets mid-year, the best approach would be to use its discretion in evaluating management’s performance for the year endedSEC within 120 days after December 31, 2020. In a time when many of our peers were withdrawing guidance on their results, the Compensation Committee did not believe it could provide earnings goals that would appropriately measure management’s performance. Accordingly, the Compensation Committee took into account the impact of the COVID-19 pandemic in early 2021 when it considered our performance against our 2020 performance goals and determined to primarily assess the Company’s performance for 2020 on a relative basis to our performance-based peers as a suitable means for evaluating performance. Notwithstanding performing among the very top of our peer group on Adjusted Funds from Operations (“AFFO”)/Funds from Operations (“FFO”)/Same-Center net operating income (“NOI”) and collections, the
Compensation Committee ultimately approved bonuses that were 75% of target as discussed under “2020 Annual Cash Incentive Program”.
2020 Financial Performance—As discussed in “Part II, Item 7. Management’s Discussion and Analysis of Financial Condition and Results of Operations” of this filing on Form 10-K, the following are the Company’s 2020 financial highlights:
•Net income of $5.5 million as compared to a net loss of $72.8 million a year ago, largely owing to lower impairments in 2020 due to the successful execution of our capital recycling program in recent years.
•Core FFO decreased by $10.5 million to $220.4 million, and declined by $0.04 to $0.66 per diluted share.
•Same-Center NOI decreased 4.1% to $328.0 million.
•General and administrative expenses decreased $7.1 million, or 14.7%, primarily due to expense reductions taken to reduce the impact of the COVID-19 pandemic, with the majority of these decreases related to compensation.
•We suspended stockholder distributions after the March 2020 distribution, and resumed monthly stockholder distributions beginning December 2020.
•Completed a tender offer which resulted in the repurchase of 13.5 million shares of common stock.
•Net debt to Adjusted Earnings Before Interest, Taxes, Depreciation, and Amortization for Real Estate (“Adjusted EBITDAre”) – annualized was 7.3x as compared to 7.2x during the same period a year ago.
•Leased portfolio occupancy totaled 94.7%, compared to 95.4% a year ago.
•Executed 861 leases (new, renewal, and options) totaling 4.7 million square feet with comparable new lease spreads of 8.2% and comparable renewal and option lease spreads of 6.7%.
•Realized $57.9 million of cash proceeds from the sale of 7 properties and 1 outparcel.
•Acquired 2 properties and 2 outparcels for a total cost of $41.5 million.
•Net debt to total enterprise value of 44.5% compared to 39.5% at December 31, 2019.
For a more detailed discussion of our 2020 results, including a reconciliation of how we calculate FFO, Core FFO, Same-Center NOI, and EBITDAre, please see “Part II, Item 7. Management’s Discussion and Analysis of Financial Condition and Results of Operations – Non-GAAP Measures” of this filing on Form 10-K. Management believes these Non-GAAP metrics are useful to investors and analysts.
Summary of Fixed and At Risk Pay Elements—The fixed and at risk pay elements of NEO compensation are reflected in the table and charts below:
| | | | | | | | | | | |
| Element | Form | Description |
Fixed Compensation | Base Salary | Cash | • Designed to compensate executive officers for services rendered on a day-to-day basis
• Provides guaranteed cash compensation to secure services of our executive talent
• Established based on scope of responsibilities, experience, performance, contributions, and internal pay equity considerations
• Compensation Committee reviews annually
|
Variable/
At-Risk
Compensation | Annual Incentive Plan | Cash Bonus | • Designed to encourage outstanding individual and Company performance by motivating executives to achieve short-term Company and individual goals by rewarding performance measured against key annual strategic objectives
• 2020 Company performance metrics were AFFO per share and Same-Center NOI growth, which metrics were not adjusted during the COVID-19 pandemic
|
Long-Term Incentive Plan | Time-Based Restricted Stock Units | • Compensation Committee believes a substantial portion of each executive’s compensation should be in the form of long-term equity incentives
• Designed to encourage management to create stockholder value over the long term; value of equity awards directly tied to changes in value of our common stock over time
• 2020 awards were 60% performance-based restricted stock units (or operating partnership units) and 40% time-based restricted stock units (or operating partnership units)
• Performance-based LTIP Units granted under the 2018 LTIP Program were deemed earned at maximum based on performance through December 31, 2020, but were capped at the target amount due to a decrease in Net Asset Value (“NAV”) per share from the beginning of the performance period
|
Performance-Based Restricted Stock Units |
The following charts illustrate each NEO’s base salary, target annual cash incentive award, and target long-term equity incentive award as a percentage of total target compensation for 2020 (excluding certain ”Special LTIP Awards” which were granted to both our CEO and our President and which we will describe later within this Item):
Executive Compensation Objectives and Philosophy
The key objectives of our executive compensation program are to: (1) attract, motivate, reward, and retain superior executive officers with the skills necessary to successfully lead and manage our business; (2) achieve accountability for performance by linking annual cash incentive compensation to the achievement of measurable performance objectives; and (3) incentivize our executive officers to build value and achieve financial objectives designed to increase the value of our business through short-term and long-term incentive compensation programs. For our executive officers, these short-term and long-term incentives are designed to accomplish these objectives by providing a significant correlation between our financial results and their actual total compensation.
We expect to continue to provide our executive officers with a significant portion of their compensation through cash incentive compensation contingent upon the achievement of financial and individual performance metrics as well as through equity compensation. These two elements of executive compensation are aligned with the interests of our stockholders because the amount of compensation ultimately received will vary with our financial performance. We seek to apply a consistent philosophy to compensation for all executive officers.
Setting Executive Compensation
The Compensation Committee is responsible for approving the compensation of the CEO and other executive officers. When setting executive compensation, the Compensation Committee considers our overall Company performance, including our achievement of financial goals, and individual performance. In addition, in a time of adversity, such as the COVID-19 pandemic, the Compensation Committee will evaluate the executives’ ability to respond to the challenges present and will consider the NEOs’ compensation in light of their performance and response. They also consider compensation paid by similarly-situated REITs for their executive roles. In addition, the Compensation Committee continues to consider the projected performance and strategic outlook for the Company, the changing roles and responsibilities of our executive officers, and the expected future contributions of our executive officers. The Compensation Committee believes that understanding competitive market data is an important part of its decision-making process; while this exercise does not perfectly capture all the unique aspects of our business, typically it provides a solid foundation upon which to base executive compensation decisions.
Role of the Compensation Committee—The Compensation Committee, which is comprised entirely of independent directors, reviews the compensation packages for our executive officers, including an analysis of all elements of compensation separately and in the aggregate. The Compensation Committee operates under a written charter adopted by our Board, which provides that the Compensation Committee has overall responsibility to:
•review and approve corporate goals and objectives relevant to CEO compensation, evaluate the CEO’s performance in light of those goals and objectives, and approve the CEO’s compensation levels based on such evaluation;
•review and approve the annual salary, bonus, and equity-based incentives and other benefits, direct and indirect, of the CEO and other executive officers;
•review and approve any employment agreements, severance arrangements, and change in control agreements or provisions, in each case as, when, and if appropriate; and
•administer the Company’s equity incentive plans, as well as any other stock option, stock purchase, incentive, or other benefit plans of the Company, fulfilling such duties and responsibilities as set forth in such plans.
In reviewing and approving these matters, the Compensation Committee considers such matters as it deems appropriate, including our financial and operating performance, the alignment of the interests of our executive officers and our stockholders, and our ability to attract and retain qualified and committed individuals. The Compensation Committee has the discretion to adjust performance goals used in our executive compensation programs to take into account extraordinary, unusual, or infrequently-occurring events and transactions not anticipated at the time the performance goals were set. In determining appropriate compensation levels for our CEO, the Compensation Committee meets outside the presence of management. With respect to the compensation levels of all other executives, the Compensation Committee meets outside the presence of all executive officers except our CEO. Our CEO annually reviews the performance of each of the other executives with the Compensation Committee.
Role of Compensation Consultant—The Compensation Committee engaged FPL Associates L.P. (“FPL”) to provide guidance regarding our executive compensation program for 2020. The Compensation Committee performs an annual assessment of the compensation consultant’s independence to determine whether the consultant is independent. During 2020, FPL did not provide services to the Company other than the services provided to the Compensation Committee. The Compensation Committee has determined that FPL is independent and that its work has not raised any conflicts of interest.
Benchmarking and Peer Group Comparisons—The Compensation Committee reviews competitive compensation data from a select group of peer companies and broader survey sources. Although comparisons of compensation paid to our NEOs relative to compensation paid to similarly situated executives in the survey and by our peers assist the Compensation Committee in determining compensation, the Compensation Committee principally evaluates executive compensation based on corporate objectives and individual performance.
For 2020, the following peer group, which is used to benchmark pay practices and with whom we compete for talent, was reviewed. Our management team proposed the peer group of companies, which was reviewed and approved by the Compensation Committee after it was independently verified by FPL:
| | | | | | | | |
Acadia Realty Trust | Kimco Realty Corporation | Retail Properties of America, Inc. |
Brixmor Property Group Inc. | Kite Realty Group Trust | SITE Centers Corp. (formerly DDR) |
Federal Realty Investment Trust | Regency Centers Corporation | Weingarten Realty Investors |
InvenTrust Properties Corp | Retail Opportunity Investments Corp. | |
FPL also furnished a report to the Compensation Committee that compared the compensation of our executive officers to data in the National Association of Real Estate Investment Trusts (“Nareit”) survey to assess compensation levels for 2020. The Nareit survey includes 123 REITs and provides a broad market reference of REITs, including retail REITs, many of which compete with the Company for executive talent.
Advisory Vote on Executive Compensation
Each year, the Compensation Committee considers the outcome of the stockholder advisory vote on executive compensation when making future decisions relating to the compensation of our named executive officers and our executive compensation program and policies. In 2020, stockholders showed support for our executive compensation programs, with approximately 85% of the votes cast for the approval of the “say-on-pay” proposal at our 2020 annual meeting of stockholders. The Compensation Committee believes that this support is attributable to its commitment to continuing the alignment of our NEOs’ compensation with the Company’s performance.
Elements of Executive Compensation
Annual base salary, annual cash incentive, and long-term equity incentives are the primary elements of our executive compensation program, and, on an aggregate basis, they are intended to substantially satisfy our program’s overall objectives. The Compensation Committee seeks to set each of these elements of compensation at the same time to enable it to simultaneously consider all of the significant elements and their impact on compensation as a whole. Taking this comprehensive view of all compensation components also allows the Compensation Committee to make compensation determinations that reflect the principles of our compensation philosophy. We strive to achieve an appropriate mix between the various elements of our compensation program to meet our compensation objectives and philosophy; however, the Compensation Committee does not apply any rigid allocation formula in setting our executive compensation, and may make adjustments to this approach for various positions after giving due consideration to prevailing circumstances, internal pay equity, and each individual’s responsibilities, experience, and performance. The Compensation Committee seeks to establish an appropriate mix of cash payments and equity awards to meet our short-term and long-term goals and objectives.
Base Salary—We provide base salaries to our NEOs to compensate them for services rendered on a day-to-day basis. Base salaries also provide guaranteed cash compensation to secure the services of our executive talent. The base salaries of our NEOs are primarily established based on the scope of their responsibilities, experience, performance, and contributions, and internal pay equity considerations, taking into account comparable company data provided by our compensation consultant and based upon the Compensation Committee’s understanding of compensation paid to similarly situated executives, adjusted as necessary to recruit or retain specific individuals. The Compensation Committee reviews the base salaries of our executive officers annually and may also increase the base salary of an executive at other times if a change in the scope of his or her responsibilities, such as a promotion, justifies such consideration.
We believe that providing a competitive base salary relative to the companies with which we compete for executive talent is a necessary element of a compensation program that is designed to attract and retain talented and experienced executives. We also believe that attractive base salaries can motivate and reward our executive officers for their overall performance. Accordingly, the compensation philosophy and approach of the Compensation Committee is to generally provide a base salary for each of our executive officers at or near the 50th percentile base salary amount of similarly situated executives at companies in the National Association of Real Estate Investment Trusts (“Nareit”) survey with adjustments made to take into account other factors such as the executive’s responsibilities and experience and internal pay equity. Based on such review, Mr. Caulfield received a 10.0% increase to his base salary and Ms. Brady received a 4.3% increase to her base salary in 2020. The following table presents the base salary earned by each of our NEOs for the years ended December 31, 2020 and 2019:
| | | | | | | | | | | |
| Executive | 2019 Base Salary | 2020 Base Salary | % Increase |
| Jeffrey S. Edison | $ | 850,000 | | $ | 850,000 | | — |
| Devin I. Murphy | 490,000 | | 490,000 | | — |
| Robert F. Myers | 490,000 | | 490,000 | | — |
| John P. Caulfield | 300,000 | | 330,000 | | 10.0% |
| Tanya E. Brady | 350,000 | | 365,000 | | 4.3% |
In addition, during the first quarter of 2020, in response to the COVID-19 pandemic, the Compensation Committee approved, at the recommendation of management, a temporary 25% reduction to the base salary of our chief executive officer and a temporary 10% reduction to the base salaries of each of our other NEOs. The reduction to the base salaries was in effect until January 1, 2021.
2020 Annual Cash Incentive Program
Highlights of 2020 Program
Program Design
In March 2020, the Compensation Committee, in consultation with FPL, approved the 2020 annual cash incentive program for our executive officers. The 2020 program used the same Company performance measures, AFFO and Same-Center NOI growth, as in 2019. Accordingly, under the 2020 annual cash incentive program, for all executive officers except Mr. Murphy, the weighting of Company and individual performance was as follows: AFFO per share target (50%), Same-Center NOI growth (20%), and individual performance (30%). Mr. Murphy’s award was based on AFFO per share (10%) and individual performance (90%). The Compensation Committee chose the relative weights of the performance measures based on its desire to emphasize financial results while maintaining a focus on non-financial initiatives.
Company Performance Goals
The Compensation Committee believes that AFFO is an appropriate and effective measure of annual Company-wide performance. FFO is a non-GAAP performance financial measure that is widely recognized as a measure of REIT operating performance. FFO is net income (loss) attributable to common stockholders computed in accordance with GAAP, excluding gains (or losses) from sales of property, plus real estate depreciation and amortization, and after adjustments for impairment losses on real estate. Adjustments for unconsolidated partnerships and joint ventures are calculated to reflect FFO on the same basis. FFO is calculated in a manner consistent with the Nareit definition, with an additional adjustment made for noncontrolling interests that are not convertible into common stock. AFFO adjusts FFO for depreciation and amortization of corporate assets and associated write-offs, changes in the fair value of the earn-out liability, amortization of unconsolidated joint venture basis differences, gains or losses on the extinguishment or modification of debt, other impairment charges, transaction and acquisition expenses, straight-line rents, amortization of in-place leases, deferred financing costs amortization and associated write-offs, amortization of market debt adjustments, equity compensation expense, tenant improvement capital expenditures, leasing costs, and maintenance capital expenditures. Adjustments for unconsolidated partnerships and joint ventures are calculated to reflect AFFO on the same basis.
The Compensation Committee believes that Same-Center NOI growth is an appropriate and effective measure of financial performance compared to the prior year. Same-Center NOI is a non-GAAP performance financial measure that is widely used to highlight operating trends such as occupancy rates, rental rates, and operating costs on properties that were operational for both comparable periods.
Short-Term Incentive Program Performance Against Pre-COVID-19 Performance Targets
The 2020 performance criteria for the Company performance metrics, and our actual performance, are set forth below:
| | | | | | | | | | | | | | | | | | | | |
| Performance Metric | Threshold
(0.5x Payout) | Target
(1.0x Payout) | Maximum
(1.5x Payout) | Actual | Weighting (NEOs other than Mr. Murphy)(1) | Weighting (Mr. Murphy) |
| AFFO per Share | $0.57 | $0.59 | $0.64 | $0.56 | 50% | 10% |
| Same-Center NOI Growth | 2.5% | 3.0% | 4.0% | (4.1)% | 20% | — |
(1)30% of the short-term incentive is based on individual performance metrics; this percentage is 90% in the case of Mr. Murphy.
In the latter half of 2020, we made strategic decisions to spend capital and accelerate certain expenses that will benefit the Company in the future, resulting in a lower AFFO. In the absence of these expenditures, the Company would have achieved a result between threshold and target for AFFO per share.
Due to the volume of retailers experiencing distress, the mandated closures, and the bankruptcies in the retail industry, the initial same-center NOI growth target was not able to be achieved. Our same-center NOI revenue declined 3.1% as a result of these circumstances.
Impact of COVID-19
As discussed above, the Compensation Committee determined that rather than adjusting targets mid-year, the best approach would be to use its discretion in evaluating management’s performance for the year ended December 31, 2020. Accordingly, in reviewing the performance of management for 2020, the Compensation Committee considered the initial goals and targets of the annual incentive program in light of the circumstances due to the COVID-19 pandemic. As performance against absolute targets set pre-COVID-19 was not an accurate reflection of how the NEOs performed in 2020, the Compensation Committee focused instead on relative performance to our peer group as a guide to making decisions regarding the appropriate level of payout under the short-term incentive program. In addition to Company performance relative to our peers, the Compensation Committee also considered the individual performance of each NEO, as evaluated by the Board, with respect to the CEO, and the CEO assisted with this decision with respect to our other NEOs.
Relative Performance Versus Peer Set
While the pandemic heavily impacted our ability to achieve pre-COVID-19 targets on AFFO and same-center NOI growth, management’s performance relative to the peer group described above in the industry was outstanding. The chart below reflects our performance relative to that of our peers, not only with respect to same-center NOI and AFFO per share growth, but also Core FFO per share growth and collections:
| | | | | | | | | | | | | | | | | |
| Performance Metric | Peer Range | Peer Mean | Peer Median | PECO | Rank |
| Same-Center NOI Growth | (11.6)% - (4.6)% | (8.2)% | (7.7)% | (4.1)% | 1st |
| Core FFO per Share Growth | (25.0)% - (4.5)% | (18.7)% | (20.1)% | (5.7)% | 2nd |
| AFFO per Share Growth | (25.6)% - 1.8% | (13.3)% | (18.1)% | (3.4)% | 3rd |
| Q4 Collections | 91% - 95% | 93% | 92% | 95% | 1st (tie) |
One measure that our Compensation Committee considered for 2020 was collections relative to our peers as a fair assessment of our executives’ performance and management of our business during the COVID-19 pandemic. In the pandemic, cash management, collection, and conservation was incredibly important as it required frequent communication with tenants (whom we refer to as our “Neighbors”) and coordination across various groups within PECO, including property management, leasing, accounting, legal, and others.
Short-Term Incentive Program Capped at Target
Given that we did not achieve our operational metrics for the year, the Compensation Committee determined that short-term incentive program payouts would be capped at no more than target for the NEOs, regardless of the level of relative performance achieved. We believe this is appropriate because only peak performance should result in a maximum award payout under the short-term incentive program. We considered the experiences of our stockholders and determined that a short-term incentive program payout at target, even considering the outstanding relative performance achieved, would also not be appropriate. While the Compensation Committee believes management’s performance reflected favorably when considering the circumstances, the Compensation Committee also considered that the short-term incentive program is designed to reward the NEOs for performance on an annual basis. Therefore, the Compensation Committee has made the determination to pay each NEO 75% of his/her target bonus for the year ended December 31, 2020. It should be noted this is the lowest funded short-term incentive program since we internalized the management company in 2017, and bonuses for each NEO were between 54% and 57% based on the bonuses received for 2019.
Individual Performance Goals
In determining to pay 75% of each NEO’s target incentive compensation for 2020, the Compensation Committee not only considered the Company’s performance relative to that of its peers, but it also reviewed the performance of each NEO against his or her individual goals. The individual goals, as originally set for each NEO at the beginning of March 2020, are described below.
Mr. Edison’s individual goals in 2020 included performance related to the achievement of financial performance targets of the Company, creating and advancing the Company’s strategic vision, interfacing with the board of directors to develop Company strategy to maximize long term value, interfacing with major institutional investors and partners, and evaluating liquidity options.
Mr. Murphy’s individual goals in 2020 included performance related to the achievement of financial performance targets of the Company, growing revenue from the investment management business, achieving performance and disposition plans for our joint ventures, monitoring and improving profitability of the investment management business, and evaluating liquidity options.
Mr. Myers’ individual goals in 2020 included performance related to the achievement of financial performance targets of the Company, launching accretive redevelopment projects, sourcing properties to meet capital growth objectives, completing quality improvement and opportunistic disposition plans, and maintaining effective cost controls.
Mr. Caulfield’s individual goals in 2020 included performance related to the achievement of financial performance targets of the Company, decreasing the Company’s leverage, refinancing the revolving loan facility, maintaining effective internal controls and cost controls, and evaluating liquidity options.
Ms. Brady’s individual goals in 2020 included performance related to the achievement of financial performance targets of the Company, overseeing the transactional activity of the Company from acquisitions and dispositions to Neighbor leases, facilitating future growth in our investment management business through advising on structuring and legal considerations, maintaining effective cost controls, and evaluating liquidity options.
2020 Cash Target Awards and Resulting Awards Earned
The following table shows the annual cash incentive target award and the actual amount earned by each NEO for 2020:
| | | | | | | | | | | |
| Executive | Target Award | Total Award Earned and Paid |
| Amount Earned | % of Target |
| Jeffrey S. Edison | $ | 1,250,000 | | $ | 937,500 | | 75% |
| Devin I. Murphy | 490,000 | | 367,500 | | 75% |
| Robert F. Myers | 490,000 | | 367,500 | | 75% |
| John P. Caulfield | 220,000 | | 165,000 | | 75% |
| Tanya E. Brady | 175,000 | | 131,250 | | 75% |
Long-Term Equity Incentive Program—The Compensation Committee believes that a substantial portion of each executive’s annual compensation should be in the form of long-term equity incentive awards. Long-term equity incentive awards encourage management to create stockholder value over the long term because the value of the equity awards is directly attributable to changes in the value of our common stock over time. In addition, long-term equity incentive awards are an effective tool for management retention because full vesting of the awards generally requires continued employment for multiple years. The purpose of the long-term incentive program is to further align the interests of our stockholders with that of management by encouraging our NEOs to remain employed by us for the long term and to create stockholder value in a “pay for performance” structure.
2020 Long-Term Incentive Program
In March 2020, the Compensation Committee approved the 2020 Long-Term Incentive Program for executive officers (the “2020 LTIP Program”), a multi-year long-term incentive program. Pursuant to the 2020 LTIP Program, we issued long-term equity awards (“LTIP Units”) in the form of restricted stock units (“RSUs”) in the Company or Class C limited partnership units (“Class C Units”) of Phillips Edison Grocery Center Operating Partnership I, L.P. (“PECO OP”), at the election of the executive. For 2020, Messrs. Edison, Myers and Caulfield and Ms. Brady elected to receive RSUs.
Under the 2020 LTIP Program, the Compensation Committee maintained the portion tied to future performance at 60% and the portion of the award that is time-based at 40%. The time-based LTIP Units, which are granted the year following the
target award approval, vest in equal annual installments over a four-year period from January 1 of the year of grant, subject to the executive’s continued employment through the relevant vesting dates. The performance-based LTIP Units are earned based on the achievement of specified performance metrics measured at the end of the three-year performance period. The maximum number of performance-based LTIP Units earned cannot exceed two times the target number. Half of the earned performance-based LTIP Units vest when earned at the end of the three-year performance period and half of the earned performance-based LTIP Units vest one year later, subject to continued employment. The Compensation Committee may, in its discretion, accelerate the vesting schedule. The below graphic summarizes the vesting schedule of our executives’ performance-based and time-based equity awards as granted under the 2020 LTIP Program:
| | | | | | | | | | | | | | | | | | | | | | | | | | | | | | | | | | | |
| | | | | | | | | | | |
| | | Year 1 | | Year 2 | | Year 3 | | Year 4 | | Year 5 |
| | | | | | | | | | | |
| | | | | | | | | | | |
60 | % | | | Performance-Based Equity Awards | | Vesting | | |
| | | | | | | | | | | |
| | | | | | | | | | | |
| | | | | | | | | | | |
40 | % | | | | | Time-Based Equity Awards |
| | | | | | | | | | | |
| | | | | | | | | | | |
In March 2020, the NEOs (other than Mr. Murphy, whose long-term incentives are tied to the Special LTIP Award he received in 2019, as described in the footnote to the table below) were granted LTIP Units with the grant date fair values set forth below, calculated in accordance with Accounting Standards Codification (“ASC”) Topic 718: Compensation—Stock Compensation (“ASC 718”). The time-based awards represent the grant at target levels of time-based awards that were part of the 2019 Long-Term Incentive Program (“2019 LTIP Program”). The value of the performance-based awards represents the target level of performance achievable under the 2020 LTIP Program, which is 50% of the maximum performance-based award that can be earned and paid. The below table summarizes the awards granted to our NEOs in March 2020:
| | | | | | | | | | | |
| Name | Time-Based LTIP Units | Performance-Based LTIP Units at Target | Total LTIP Units Granted in 2020 |
Jeffrey S. Edison(1) | $ | 1,169,996 | | $ | 1,754,999 | | $ | 2,924,995 | |
Devin I. Murphy(1) | — | | — | | — | |
| Robert F. Myers | 359,995 | | 540,004 | | 899,999 | |
| John P. Caulfield | 163,337 | | 198,002 | | 361,339 | |
| Tanya E. Brady | 59,996 | | 108,003 | | 167,999 | |
(1) In 2019, each of Mr. Edison and Mr. Murphy received one-time Special LTIP Awards of performance-based LTIP Units. The Special LTIP Award to Mr. Murphy is tied entirely to incremental revenue streams from the investment management business with the objective of focusing his efforts more on building recurring revenue than transaction-based fee income in order to create bespoke long-term incentives for each executive officer. Mr. Murphy’s Special LTIP Award was granted in lieu of any time-based or performance-based awards under the 2019 LTIP Program and future LTIP programs.
For the performance-based LTIP Units, there are two separate, equally-weighted performance metrics: (i) three-year average Same-Center NOI growth measured against a peer group of eight public retail REITs (listed below) and (ii) three-year Core FFO per share growth measured against the same peer group. At the end of the three-year performance period, 50% of the award earned based on achievement of the performance metrics vests and the remaining 50% of the earned award vests on the one-year anniversary of such date, subject to continued employment. The threshold, target, and maximum levels for the performance-based LTIP Units were as follows:
| | | | | | | | | | | | | | |
Metric | Weighting | Threshold
(25% Payout) | Target
(50% Payout) | Maximum
(100% Payout) |
Three-Year Average Same-Center NOI Growth | 50% | 25th Percentile
of Peer Group | 50th Percentile
of Peer Group | 75th Percentile
of Peer Group |
Three-Year Core FFO per Share Growth | 50% | 25th Percentile
of Peer Group | 50th Percentile
of Peer Group | 75th Percentile
of Peer Group |
For the 2020 LTIP Program, the eight public retail REITs against which we will measure these metrics are:
| | | | | | | | |
Brixmor Property Group | RPT Realty | Retail Properties of America, Inc. |
Kimco Realty Corporation | Regency Centers Corporation | Weingarten Realty Investors |
Kite Realty Group Trust | Retail Opportunity Investments Corp. | |
In addition, a NAV modifier will be applied if the growth in the Company’s NAV per share for the performance period is negative. Specifically, to the extent performance above the target level is achieved at the end of the performance period, yet the Company’s NAV per share growth for that same performance period is negative, the amount of earned awards will be capped at the target amount. The remaining amount of awards (the difference between those that would have otherwise been earned based on actual performance and the capped amount at target level) may become earned and thereafter vested if the Company’s NAV per share growth becomes positive at any point of time measured from the beginning of the performance period through up to five years following the completion of the performance period, assuming continued employment on such date; otherwise, the LTIP Units will be forfeited.
Summary of Long-Term Incentive Program Achievement
| | | | | | | | | | | | | | | | | | | | | | | | | | | | | |
| PERFORMANCE-BASED LONG-TERM INCENTIVES |
| Through December 31, 2020 |
| LTIP Performance Period and Metrics | Weighting | 2018 | 2019 | 2020 | 2021 | 2022 | Status | Result | Payout % |
2018-2020 Performance-Based LTIP Units | | | | | | | | | |
| Same-Center NOI Growth vs. Peers | 50% | 100% Completed | | | Maximum | 1st Place | 100% |
| Core FFO per Share Growth vs. Peers | 50% | 3-Year Measurement Period with 5 Year | | | Maximum | 1st Place | 100% |
| NAV per Share Growth Modifier | | Recoupment Period | | | Payout Capped at Target/Award Subject to Recoupment | -20.5% | Reduced to Target (50%) |
| | | | | | | | | |
2019-2021 Performance-Based LTIP
Units | | | | | | | | | |
| Same-Center NOI Growth vs. Peers | 50% | | 67% Completed | | Tracking at Maximum | Tracking at 1st Place | Tracking at 100% |
| Core FFO per Share Growth vs. Peers | 50% | | 3-Year Measurement Period with 5 Year | | Tracking at Maximum | Tracking at 1st Place | Tracking at 100% |
| NAV per Share Growth Modifier | | | Recoupment Period | | Tracking to be Capped at Target/Award Subject to Recoupment | Tracking at -20.8% | Tracking to be Reduced to Target |
| | | | | | | | | |
2020-2022 Performance-Based LTIP
Units | | | | | | | | | |
| Same-Center NOI Growth vs. Peers | 50% | | | 33% Completed | Tracking at Maximum | Tracking at 1st Place | Tracking at 100% |
| Core FFO per Share Growth vs. Peers | 50% | | | 3-Year Measurement Period with 5 Year | Tracking at Maximum | Tracking at 2nd Place | Tracking at 100% |
| NAV per Share Growth Modifier | | | | Recoupment Period | Tracking to be Capped at Target/Award Subject to Recoupment | Tracking at -21.2% | Tracking to be Reduced to Target |
| | | | | | | | | |
Payout under the 2018 Long-Term Incentive Program
The performance period for the performance-based LTIP Units granted under the 2018 LTIP Program ended on December 31, 2020. Based on our performance through December 31, 2020, these LTIP Units would have been earned at maximum, but because our NAV per share growth for that same performance period was negative, the amount of earned awards was capped at the target amount. The unearned portion in excess of target and up to the maximum will remain eligible to vest if our NAV per share becomes positive on or prior to December 31, 2025.
Employee Benefits
We believe that establishing competitive benefit packages for our employees is an important factor in attracting and retaining highly qualified personnel. Our NEOs are eligible to participate in all of our employee benefit plans, in each case on the same basis as other employees. We also provide a Company matching contribution under our 401(k) savings plan to employees generally, including our NEOs, up to the Internal Revenue Service limitations for matching contributions.
Other Benefits
Mr. Edison receives personal tax services provided by our internal tax department and has a time-share agreement with the Company for personal use of the corporate aircraft leased by the Company.
Employment, Severance, Change in Control, and Other Arrangements
We do not have employment agreements, severance or change in control agreements, or other arrangements with any of our NEOs other those described below.
Executive Change in Control Severance Plan—Our Amended and Restated Executive Change in Control Severance Plan for executive officers (the “Severance Plan”) provides for specified payments and benefits2023 in connection with a terminationthe Company's 2024 Annual Meeting of employment by the Company not for Cause or a resignation by the executive for Good Reason (as each such term is defined in the Severance Plan). Our goal in providing these severance and change in control payments and benefits is to offer sufficient cash continuity protection such that our NEOs will focus their full time and attention on the requirements of the business rather than the potential implications for their respective positions. We prefer to have certainty regarding the potential severance amounts payable to the NEOs, rather than negotiating severance at the time employment terminates. We also have determined that accelerated vesting provisions with respect to outstanding equity awards in connection with a qualifying termination of employment are appropriate because they encourage our NEOs to stay focused on the business in those circumstances rather than focusing on the potential implications for them personally. In order to receive the severance payments and benefits under the Severance Plan, the NEOs must execute a general release of claims and comply with non-competition and non-solicitation provisions that apply for 18 months (or 24 months in the case of Mr. Edison) following termination of employment and confidentiality provisions that apply during and following termination of employment.
Vesting Agreement with Devin Murphy—In October 2017, PECO entered into an agreement with Mr. Murphy regarding the vesting of his equity incentive awards (the “Murphy Vesting Agreement”). Pursuant to the Murphy Vesting Agreement, all time-based equity awards granted to Mr. Murphy vested upon the earlier of the vesting date set forth in the applicable equity award agreement and the date Mr. Murphy reached both (i) age 58 and (ii) a combined age and continuous years of service with the Company of 65 years (such date, the “Murphy Retirement Eligibility Date”). The Murphy Retirement Eligibility Date occurred in June 2019. The Murphy Vesting Agreement further provides that, if Mr. Murphy’s employment terminates on or
following the Murphy Retirement Eligibility Date, he will remain eligible to vest in any performance-based LTIP Units, excluding the Special LTIP Award, as follows: (a) if his retirement occurs before 50% of the performance period has elapsed, then he will vest in a prorated portion of any performance-based LTIP Units actually earned based on performance at the end of the performance period, with the proration calculated based on the ratio of the number of days Mr. Murphy was employed during the performance period to the total number of days in the performance period and (b) if his retirement occurs after 50% or more performance period has elapsed, then Mr. Murphy will vest in any performance-based LTIP Units that are actually earned at the end of the performance period. The provisions of the Murphy Vesting Agreement do not apply to Mr. Murphy’s Special LTIP Award.
Tax and Accounting Considerations
We have not provided or agreed to provide any of our executive officers or directors with a gross-up or other reimbursement for tax amounts they might pay pursuant to Section 4999 or Section 409A of the Code. Sections 280G and 4999 of the Code provide that executive officers, directors who hold significant stockholder interests, and certain other service providers could be subject to significant additional taxes if they receive payments or benefits in connection with a change in control of our Company that exceed certain limits, and that we or our successor could lose a deduction on the amounts subject to the additional taxes. Section 409A also imposes additional significant taxes on the individual in the event that an employee, director or service provider receives “deferred compensation” that does not meet the requirements of Section 409A.
Section 162(m) of the Code limits the annual compensation deduction available to publicly held corporations to $1.0 million for certain “covered employees,” which generally includes our NEOs. In December 2020, the IRS issued final regulations that, among other things, expanded the definition of compensation to include a publicly held corporate partner’s distributable share of a partnership’s deduction for compensation expense attributable to amounts paid by the partnership for services performed by “covered employees” of the publicly held corporation. We anticipate that our taxable income will increase on an annual basis beginning with the 2021 calendar year as a result of the application of Section 162(m). To maintain our status as a REIT, we are required to distribute at least 90% of our taxable income to our stockholders in the form of dividends. The increase in taxable income resulting from the application of the final regulations will be taken into account as the Board determines the amount of dividends to be paid to our stockholders for tax years ending on and after December 31, 2021. Although the Compensation Committee intends to consider the impact of Section 162(m) in structuring compensation programs, the Compensation Committee expects its primary focus to be on creating programs that address the needs and objectives of the Company regardless of the impact of Section 162(m). As a result, the Compensation Committee may make awards and structure programs that are not deductible under Section 162(m).
Hedging, Pledging, and Speculative Transactions
Our Insider Trading Policy prohibits all directors, officers, and other employees from engaging in any short-term speculative securities transactions such as short sales or buying or selling puts, calls, and other derivative securities, or engaging in any other hedging transaction with respect to the Company’s securities. The policy also prohibits all directors, officers, and other employees from pledging our securities as collateral for a loan or as collateral in a margin account.
Compensation Committee Report
The Compensation Committee has reviewed and discussed with management the Compensation Discussion and Analysis contained in this Annual Report on Form 10-K. Based on such review and discussions, the Compensation Committee recommended to the Board that the Compensation Discussion and Analysis be included in this Annual Report on Form 10-K.
Submitted by the Compensation Committee
John A. Strong (Chair)
Paul J. Massey, Jr.
Jane Silfen
EXECUTIVE COMPENSATION TABLES
Summary Compensation Table
The following table and footnotes provide information regarding the compensation of our NEOs for the years presented:
| | | | | | | | | | | | | | | | | | | | | | | |
| Name and Principal Position | Year | Salary ($) | Bonus ($)(1) | Stock Awards ($)(2)(3) | Non-Equity Incentive Plan Compensation ($)(4) | All Other Compensation ($)(5) | Total ($) |
Jeffrey S. Edison Chairman of the Board and Chief Executive Officer | 2020 | $ | 751,923 | | $ | 937,500 | | $ | 2,924,995 | | $ | — | | $ | 157,324 | | $ | 4,771,742 | |
| 2019 | 838,269 | | 352,500 | | 2,730,145 | | 1,312,500 | | 283,468 | | 5,516,882 | |
| 2018 | 725,385 | | 300,000 | | 4,005,035 | | 1,200,000 | | 393,168 | | 6,623,588 | |
Devin I. Murphy President | 2020 | 478,692 | | 367,500 | | — | | — | | 45,832 | | 892,024 | |
| 2019 | 487,045 | | 138,180 | | 437,624 | | 514,500 | | 178,296 | | 1,755,645 | |
| 2018 | 464,827 | | 143,222 | | 1,374,922 | | 572,886 | | 285,358 | | 2,841,215 | |
Robert F. Myers Chief Operating Officer and Executive Vice President | 2020 | 478,692 | | 367,500 | | 899,999 | | — | | 46,302 | | 1,792,493 | |
| 2019 | 487,045 | | 171,990 | | 1,517,622 | | 514,500 | | 166,883 | | 2,858,040 | |
| 2018 | 474,731 | | 143,222 | | 1,287,372 | | 572,886 | | 289,215 | | 2,767,426 | |
John P. Caulfield(6) Chief Financial Officer, Senior Vice President and Treasurer | 2020 | 316,615 | | 165,000 | | 361,339 | | — | | 23,104 | | 866,058 | |
| 2019 | 259,505 | | 53,580 | | 210,996 | | 199,500 | | 38,659 | | 762,240 | |
Tanya E. Brady(6) General Counsel, Senior Vice President, and Secretary | 2020 | 353,692 | | 131,250 | | 167,999 | | — | | 20,417 | | 673,358 | |
| 2019 | 345,192 | | 45,120 | | 275,625 | | 168,000 | | 36,642 | | 870,579 | |
(1)For 2018 and 2019, represents amounts paid under the Annual Cash Incentive Program for the portion attributable to individual performance for each of 2018 and 2019 and paid in the following calendar year. For 2020, represents the discretionary bonus the Compensation Committee determined to pay our named executive officers for their performance in 2020. See “Compensation Discussion & Analysis - 2020 Annual Cash Incentive Program” for additional information regarding the amount paid for 2020.
(2)Amounts reflect the grant date fair value of time-based and performance-based LTIP Units as computed in accordance with FASB ASC Topic 718. The time-based awards were awarded in 2019 under the 2019 LTIP Program and granted in March 2020. The performance-based LTIP Units were awarded and granted in March 2020 under the 2020 LTIP Program. See “Compensation Discussion & Analysis - Long-Term Equity Incentive Program” for additional information regarding these awards.
The grant date fair value of the performance-based awards in the stock awards column is computed based on the probable outcome of performance conditions as of the grant date. This amount is consistent with the estimate of aggregate compensation cost to be recognized by the Company over the three-year performance period of the award determined as of the grant date under FASB ASC Topic 718. The assumptions used in calculating the valuations are set forth in Note 14 to the consolidated financial statements in this Annual Report on Form 10-K.
Assuming the maximum level of performance is achieved, the aggregate grant date fair value of each of the 2020, 2019, and 2018 awards is as shown in the following table:
| | | | | | | | | | | |
| Name | Performance-Based Awards Assuming Maximum Performance (2020 Awards) | Performance-Based Awards Assuming Maximum Performance (2019 Awards) | Performance-Based Awards Assuming Maximum Performance (2018 Awards) |
| Jeffrey S. Edison | $ | 3,510,000 | | $ | 3,510,000 | | $ | 1,950,690 | |
| Devin I. Murphy | — | | — | | 875,243 | |
| Robert F. Myers | 1,080,000 | | 1,080,005 | | 875,243 | |
| John P. Caulfield | 396,000 | | 132,003 | | — | |
| Tanya E. Brady | 216,000 | | 180,005 | | — | |
(3)In 2019, in addition to the amounts reflected in the Stock Awards column and described in footnote 2 above, each of Messrs. Edison and Murphy received a Special LTIP Award. See “Compensation Discussion & Analysis - Special LTIP Awards” for additional information on these awards. The table below shows the grant date fair value as computed in accordance with FASB ASC Topic 718 based on the probable outcome of performance conditions as of the grant date. This amount is consistent with the estimate of aggregate compensation cost to be recognized by the Company over the applicable five- or seven-year performance period of the award determined as of the grant date under FASB ASC Topic 718, excluding the effect of estimated forfeitures. The assumptions used in calculating the valuations below are set forth in Note 14 to the consolidated financial statements in this Annual Report on Form 10-K:
| | | | | | | | |
| Name | Grant Date Fair Value of Special LTIP Award | Value Assuming Maximum Performance |
| Jeffrey S. Edison | $ | 7,500,005 | | $ | 15,000,010 | |
| Devin I. Murphy | 3,750,005 | | 7,500,010 | |
(4)Represents amounts paid under the Annual Cash Incentive Program for each of 2019 and 2018 for the portion attributable to Company performance for the applicable year. See “Compensation Discussion & Analysis - 2020 Annual Cash Incentive Program” for additional information regarding the incentive paid for the 2020 year.
(5)Amounts reported in the “All Other Compensation” column for 2020 include Company contributions to the 401(k) plan, distributions paid on unvested equity awards and phantom shares, the value of tax and accounting services provided by our internal tax and accounting departments, and personal use of the Company’s leased airplane. The following table identifies the value of each benefit:
| | | | | | | | | | | | | | | | | | | | | | | |
| Name | Retirement Plan Contributions | | Distributions Paid on Unvested Equity Awards(a) | | Perquisites(b) | | Total |
| Jeffrey S. Edison | $ | 8,550 | | | $ | 55,733 | | | $ | 93,041 | | | $ | 157,324 | |
| Devin I. Murphy | 8,550 | | | 37,282 | | | — | | | 45,832 | |
| Robert F. Myers | 8,550 | | | 37,752 | | | — | | | 46,302 | |
| John P. Caulfield | 8,550 | | | 14,554 | | | — | | | 23,104 | |
| Tanya E. Brady | 8,550 | | | 11,921 | | | — | | | 20,471 | |
(a)Includes distributions paid on unvested time-based LTIP Units, unearned performance-based Class C Units, and dividend equivalents paid on unvested phantom shares. Distributions are paid on approximately 10% of the maximum number of unearned performance-based Class C Units and will be netted against the distributions to be paid on the earned Class C Units upon vesting. Dividends are not paid on performance-based RSUs until the first vesting date.
(b)For Mr. Edison, this amount includes $75,000 for personal tax and accounting services provided by our tax and accounting departments and $18,041 for personal use of the Company’s leased airplane. See “Related Party Transactions - Airplane Leases” for more information on personal use of the airplane.
(6)Mr. Caulfield and Ms. Brady first became NEOs in 2019. Accordingly, pursuant to SEC rules, their prior year information is not included. Mr. Caulfield became Chief Financial Officer on August 15, 2019.
2020 Grants of Plan-Based Awards
The following table provides information about equity and non-equity incentive awards granted to the NEOs in 2020:
| | | | | | | | | | | | | | | | | | | | | | | | | | | | | | | | |
| | | Estimated Future Payouts Under Non-Equity Incentive Plan Awards(1) | Estimated Future Payouts Under Equity Incentive Plan Awards | All Other Stock Awards: Number of Shares of Stock or Units(2) | Grant Date Fair Value of Stock Awards |
| Name | Grant Date | | Threshold ($) | Target ($) | Maximum ($) | Threshold (#) | Target (#) | Maximum (#) |
| Jeffrey S. Edison | 3/11/20 | | $ | 625,000 | | $ | 1,250,000 | | $ | 1,875,000 | | — | | — | | — | | — | | $ | — | |
| 3/11/20 | (3) | — | | — | | — | | 79,054 | | 158,108 | | 316,216 | | — | | 1,754,999 | |
| 3/11/20 | | — | | — | | — | | — | | — | | — | | 105,405 | 1,169,996 | |
| Devin I. Murphy | 3/11/20 | | 245,000 | | 490,000 | | 735,000 | | — | | — | | — | | — | | — | |
| Robert F. Myers | 3/11/20 | | 245,000 | | 490,000 | | 735,000 | | — | | — | | — | | — | | — | |
| 3/11/20 | (3) | — | | — | | — | | 24,325 | | 48,649 | | 97,298 | | — | | 540,004 | |
| 3/11/20 | | — | | — | | — | | — | | — | | — | | 32,432 | | 359,995 | |
| John P. Caulfield | 3/11/20 | | 110,000 | | 220,000 | | 330,000 | | | | | — | | — | |
| 3/11/20 | (3) | — | | — | | — | | 8,919 | | 17,838 | | 35,676 | | — | | 198,002 | |
| 3/11/20 | | — | | — | | — | | — | | — | | — | | 14,715 | | 163,337 | |
| Tanya E. Brady | 3/11/20 | | 87,500 | | 175,000 | | 262,500 | | — | | — | | — | | — | | — | |
| 3/11/20 | (3) | — | | — | | — | | 4,865 | | 9,730 | | 19,460 | | — | | 108,003 | |
| 3/11/20 | | — | | — | | — | | — | | — | | — | | 5,405 | | 59,996 | |
(1)These amounts relate to the 2020 Annual Cash Incentive Program. The amounts actually paid in March 2020 are included in the Summary Compensation Table for 2020 in the “Bonus” column and described in footnote 1 to that table.
(2)Represents the number of time-based LTIP Units granted in 2020 pursuant to awards under the 2019 LTIP Program. These units vest in four equal annual installments beginning on the first anniversary of the grant date. The aggregate grant date fair value reported in the last column is calculated in accordance with ASC 718. The aggregate grant date fair value for these awards is included in the Summary Compensation Table for 2020 in the “Stock Awards” column and described in footnote 2 to that table.
(3)Represents performance-based LTIP Units awarded under the 2020 LTIP Program, which covers performance during the three-year period 2020 through 2022. The aggregate grant date fair value reported in the last column is based on the probable outcome of the performance conditions as of the grant date. This amount is consistent with the estimate of aggregate compensation cost to be recognized by the Company over the performance period of the award determined as of the grant date under ASC 718, excluding the effect of estimated forfeitures. The aggregate grant date fair value for these awards is included in the Summary Compensation Table for 2020 in the “Stock Awards” column and described in footnote 2 to that table.
2020 Outstanding Equity Awards at Fiscal Year End
The following table provides information about outstanding equity-based incentive compensation awards for the NEOs as of December 31, 2020. The market value of unvested stock or units and unearned performance units is based on the estimated value per share of $8.75 on December 31, 2020.
| | | | | | | | | | | | | | | | | | | | | | | |
| | Stock Awards | Equity Incentive Plan Awards |
| Name | Grant Date | Number of Shares or Units of Stock That Have Not Vested (#) | | Market Value of Shares or Units of Stock That Have Not Vested ($) | Number of Unearned Shares, Units or Other Rights That Have Not Vested (#) | | Market or Payout Value of Unearned Shares, Units or Other Rights That Have Not Vested ($) |
| Jeffrey S. Edison | 3/11/2020(1) | 105,405 | | | $ | 922,294 | | — | | | $ | — | |
| 3/11/2020(2) | — | | | — | | 158,108 | | | 1,383,445 | |
| 3/14/2019(3)(7) | 66,186 | | | 579,128 | | — | | | — | |
| 3/14/2019(4)(7) | — | | | — | | 158,824 | | | 1,389,710 | |
| 3/14/2019(5)(7) | — | | | — | | 407,240 | | | 3,563,350 | |
| 3/15/2018(6)(7) | 44,334 | | | 387,923 | | 88,668 | | | 775,845 | |
| 3/15/2018(7)(8) | 137,714 | | | 1,204,998 | | — | | | — | |
| Devin I. Murphy | 3/14/2019(5)(7) | — | | | — | | 203,620 | | | 1,781,675 | |
| Robert F. Myers | 3/11/2020(1) | 32,432 | | | 283,780 | | — | | | — | |
| 3/11/2020(2) | — | | | — | | 48,649 | | | 425,679 | |
| 3/14/2019(3)(7) | 29,703 | | | 259,901 | | — | | | — | |
| 3/14/2019(4)(7) | — | | | — | | 48,870 | | | 427,613 | |
| 3/15/2018(6)(7) | 19,892 | | | 174,055 | | 39,784 | | | 348,110 | |
| 3/15/2018(7)(8) | 38,626 | | | 337,978 | | — | | | — | |
| John P. Caulfield | 3/11/2020(1) | 14,715 | | | 128,756 | | — | | | — | |
| 3/11/2020(2) | — | | | — | | 17,838 | | | 156,083 | |
| 3/14/2019(3) | 5,362 | | | 46,918 | | — | | | — | |
| 3/14/2019(4) | — | | | — | | 3,318 | | | 29,033 | |
| 3/15/2018(6) | 1,197 | | | 10,474 | | 2,394 | | | 20,948 | |
| 3/15/2018(8) | 4,546 | | | 39,778 | | — | | | — | |
| 3/15/2018(9) | 25,000 | | | 218,750 | | — | | | — | |
| Tanya E. Brady | 3/11/2020(1) | 5,405 | | | 47,294 | | — | | | — | |
| 3/11/2020(2) | — | | | — | | 9,730 | | | 85,138 | |
| 3/14/2019(3) | 6,490 | | | 56,788 | | — | | | — | |
| 3/14/2019(4) | — | | | — | | 8,146 | | | 71,278 | |
| 3/15/2018(6) | 1,499 | | | 13,116 | | 2,898 | | | 25,378 | |
| 3/15/2018(8) | 5,000 | | | 43,750 | | — | | | — | |
| 3/15/2018(9) | 13,636 | | | 119,315 | | — | | | — | |
(1)Time-based RSUs granted in March 2020 that vest in equal amounts over four years, beginning on January 1, 2021.
(2)Performance-based LTIP Units granted under the 2020 LTIP Program that will be earned, to the extent performance conditions are achieved, as of December 31, 2022, the last day of the performance period. Half of the earned units will vest on December 31, 2022 and half will vest on December 31, 2023. Because the units earned are not currently determinable, in accordance with SEC rules, the number of units and the corresponding market value reflect actual performance through 2020, which was above the threshold levelStockholders, and is therefore reported at the target level.
(3)Remaining portion of time-based RSUs/LTIP Units granted in March 2019 that vest in equal amounts over four years, beginning on January 1, 2020.
(4)Performance-based LTIP Units granted under the 2019 LTIP Program that will be earned, to the extent performance conditions are achieved, as of December 31, 2021, the last day of the performance period. Half of the earned units will vest on December 31, 2021 and half will vest on December 31, 2022. Because the units earned are not currently determinable, in accordance with SEC rules, the number of units and the corresponding market value reflect actual performance through 2020, which was above the threshold level and is therefore reported at the target level.
(5)Special LTIP Award granted to Messrs. Edison and Murphy in 2019 that will be earned, to the extent performance conditions are achieved, as of the last day of the performance period on March 31, 2026 and March 31, 2024, respectively. See “Compensation Discussion & Analysis - Long Term Equity Incentive Program - Special LTIP Award” for information on the performance metrics and vesting terms. Because the units earned are not currently determinable, in accordance with SEC rules, the number of units and the corresponding market value reflect actual performance through 2019.
(6)Performance-based LTIP Units granted under the 2018 LTIP Program were deemed earned at maximum based on performance through December 31, 2020. However, because the Company’s NAV per share growth for that same performance period is negative, the amount of earned awards were capped at the target amount. Half of the earned units vested on December 31, 2020. The amount reported in the “Stock Awards” column represents the remaining half that will vest on December 31, 2021. The unearned portion in excess of target and up to the maximum will remain eligible to vest if the Company’s NAV per share becomes positive on or prior to December 31, 2025 (the “Contingent Portion”). The amount reported in the “Equity Incentive Plan Awards” column represents the Contingent Portion.
(7)At issuance, these Class C Units were subject to vesting, and did not have full parity with Operating Partnership units (“OP units”) with respect to liquidating distributions, but upon the occurrence of certain events described in PECO OP’s partnership agreement, could over time achieve full parity with the OP units for all purposes. Upon vesting and achieving full parity with OP units, the Class C Units would converthereby incorporated by reference into an equal number of OP units. Each OP unit acquired upon conversion of a Class C Unit may be presented for redemption at the election of the holder, for cash equal to the fair market value of a share of PECO common stock, except that PECO OP may, at its election, acquire each OP unit so presented for one share of PECO common stock. The Class C Units granted in 2018 have achieved parity; those granted in 2019 have not yet achieved parity.
(8)Remaining unvested portion of time-based LTIP Units granted in March 2018 that vest in equal amounts over four years, beginning on January 1, 2019.
(9)Special restricted stock award that vests in full on January 1, 2022
2020 Stock Vested
The following table shows the number of LTIP Units and phantom units that vested during 2020 and the value realized on vesting by each of our NEOs. The phantom units are based on the value of shares of our common stock but are paid out in cash upon vesting. The vested phantom units are phantom units that vested and were paid on December 31, 2020. The Compensation Committee accelerated vesting and payment to March 13, 2020 for Mr. Murphy, having determined such acceleration was in the best interests of the Company. The value realized upon the vesting is determined by multiplying the number of units that vested by the estimated value per share of our common stock on the date of vesting. The number of LTIP Units and phantom units that vested during 2020 and the value realized on vesting by each of our NEOs are as follows:
| | | | | | | | |
| | Stock Awards |
| Name | Number of OP Units/Shares Acquired on Vesting (#) | Value Realized
on Vesting ($) |
| Jeffrey S. Edison | 165,168 | | $ | 1,658,878 | |
| Devin I. Murphy | 58,503 | | 649,383 |
| Robert F. Myers | 56,438 | | 562,483 |
| John P. Caulfield | 6,106 | | 57,969 |
| Tanya E. Brady | 7,391 | | 75,631 |
Payments upon Termination or Change in Control
Amended and Restated Executive Change in Control Severance Plan—Each of our executive officers participates in the Severance Plan. Under the plan, in the event that an executive’s employment is terminated by the Company or its affiliates not for Cause (as defined in the Severance Plan) or the executive resigns for Good Reason (as defined in the Severance Plan), then the executive will be entitled to (1) a lump sum payment equal to the product of (i) 1.5 (or 2.0 in the case of Mr. Edison) and (ii) the sum of (A) the executive’s base salary and (B) the executive’s average annual cash performance bonus for the most recent three fiscal years (or such shorter period that the executive was eligible to receive an annual cash performance bonus), (2) if the executive elects to receive group health insurance under COBRA following the termination date, the Company will provide such coverage for 18 months (or 24 months in the case of Mr. Edison) following termination, provided that the executive continues to pay the same amount of the monthly premium as in effect for the Company’s other executives and; provided, further, that if the executive becomes employed by another employer during such period and is eligible to receive group health insurance under such other employer’s plans, the Company’s obligations will be reduced to the extent that comparable coverage is actually provided to the executive and his or her covered dependents, and (3) (i) the executive’s unvested time-base equity awards that would have otherwise vested during the 18 months (or 24 months in the case of Mr. Edison) following termination will vest on the termination date and be paid in full within 70 days of the date of termination and (ii) the executive will remain eligible to vest and be paid on a pro-rata portion of performance-based equity awards based on actual performance at the end of the performance period, with pro-ration based on the period of time elapsed between the beginning of the performance period and the termination date as a percentage of the full performance period.
In lieu of the benefits described in the immediately preceding paragraph, in the event that an executive’s employment is terminated by the Company or its affiliates not for Cause or the executive resigns for Good Reason, in either case within two years following a Change in Control (as defined in the Severance Plan), then the executive will be entitled to (1) a lump sum payment equal to the product of (i) 2.0 (or 2.5 in the case of Mr. Edison) and (ii) the sum of (A) the executive’s base salary and (B) the executive’s average annual cash performance bonus for the most recent three fiscal years (or such shorter period that the executive was eligible to receive an annual cash performance bonus) and (2) if the executive elects to receive group health insurance under COBRA following the termination date, the Company will provide such coverage for 24 months following termination (or 30 months following termination in the case of Mr. Edison), provided that the executive continues to pay the same amount of the monthly premium as in effect for the Company’s other executives and; provided, further, that if the executive becomes employed by another employer during such period and is eligible to receive group health insurance under such other employer’s plans, the Company’s obligations will be reduced to the extent that comparable coverage is actually provided to the executive and his or her covered dependents. The executive’s unvested time-based equity awards and earned but unvested performance-based equity awards will vest as of the date of termination and be paid in full within 70 days of the date of termination.
Upon the closing of any Change in Control, the Compensation Committee will determine the number of performance-based equity awards held by the executive that will be considered earned under such awards based upon the Company’s performance by pro-rating the performance targets for the shortened performance period and then measuring such pro-rated targets against actual Company performance through the closing of the Change in Control. Any such earned awards will then be converted into time-based awards that will vest and be paid based on continued service through the end of the performance period that was applicable to such award prior to the Change in Control, subject to acceleration as described in the last sentence of the prior paragraph.
If the executive dies or if the Company and its affiliates terminate an executive’s employment due to Disability, the executive or his or her legal heirs will be entitled to (1) a pro-rated portion of his annual cash performance bonus for the year of termination if the Compensation Committee determines that performance is achieved, (2) accelerated vesting of unvested time-based equity awards that would have otherwise vested during the 18 months (or 24 months in the case of Mr. Edison) following termination, and (3) remain eligible to vest and be paid on a pro-rated portion of performance-based equity awards based on actual performance at the end of the performance period with pro-ration based on the period of time elapsed between the beginning of the performance period and the termination date as a percentage of the full performance period.
Receipt of the severance payments and benefits under the Severance Plan is subject to the execution and non-revocation of a release agreement by the executive and compliance with non-competition and non-solicitation provisions that apply or 18 months (24 months in the case of Mr. Edison) following termination of employment and confidentiality provisions that apply during and following termination of employment.
Special LTIP Awards—Pursuant to the terms of each Special LTIP Award, the last day of the applicable performance period and the number of Class C Units earned under the Special LTIP Award (the “Earned LTIP Units”) will be measured as of the earliest of a specified date, a change of control, or the executive’s termination of employment (other than a termination for cause). In the case of a voluntary termination or a termination without cause, the number of Class C Units earned will further be prorated based upon the number of days that elapsed from the effective date of the award through the date of such termination, divided by the number of days in the performance period; provided that, in the case of death or disability, the proration will be based upon the sum of (i) the number of days that elapsed from the effective date of the award through the date of such termination and (ii) the number of days in the executive’s applicable severance period (24 months, in the case of Mr. Edison, and 18 months, in the case of Mr. Murphy), divided by the number of days in the performance period. The provisions of the Severance Plan do not apply to the Special LTIP Awards.
Murphy Vesting Agreement—Pursuant to the Murphy Vesting Agreement, if Mr. Murphy’s employment terminates on or following the Retirement Eligibility Date, he will remain eligible to vest in any performance-based equity awards granted by the Company as follows: (i) if his retirement occurs before 50% of the performance period has elapsed, then he will vest in a pro-rated portion of any performance-based equity awards actually earned based on performance at the end of the performance period, with the pro-ration calculated based on the ratio of the number of days he was employed during the performance period to the total number of days in the performance period and (ii) if his retirement occurs after 50% or more performance period has elapsed, then he will vest in any performance-based awards that are actually earned at the end of the performance period. The provisions of the Vesting Agreement do not apply to Mr. Murphy’s Special LTIP Award.
Quantification of Payments upon Termination or Change in Control
The following table provides information regarding certain potential payments that would have been made to the NEOs if the triggering event occurred on December 31, 2020, the last day of the fiscal year, based on the value of a share of our common stock on such date, where applicable. Amounts actually received upon the occurrence of a triggering event will vary based on factors such as the timing during the year of such event and the estimated value per share of our common stock. The only plan or agreement that provides for potential payments upon a termination or change in control is the Severance Plan. Accordingly, all amounts shown in the table below represent the applicable potential payments under the Severance Plan:
| | | | | | | | | | | | | | | | | | | | | | | |
| Name | Benefit | Retirement
($) | Termination for Cause or Resignation without Good Reason
($) | Termination without Cause or Resignation for Good Reason
($) | Death or Disability
($) | Change in Control without Termination
($) | Change in Control with Termination
($) |
| Jeffrey Edison | Severance Pay | $ | — | | $ | — | | $ | 4,435,000 | | $ | 937,500 | | $ | — | | $ | 5,543,750 | |
Health Care Benefits(1) | — | | — | | 27,779 | | — | | — | | 34,724 | |
| Time-Based Equity Acceleration | — | | — | | 2,654,733 | | 2,654,733 | | — | | 3,308,918 | |
| Performance-Based Equity Acceleration | 1,018,101 | | — | | 3,181,572 | | 2,036,202 | | 3,563,354 | | 7,112,354 | |
| Total | 1,018,101 | | — | | 10,299,084 | | 5,628,435 | | 3,563,354 | | 15,999,746 | |
| Devin Murphy | Severance Pay | — | | — | | 1,603,144 | | 367,500 | | — | | 2,137,525 | |
Health Care Benefits(1) | — | | — | | 33,336 | | — | | — | | 44,448 | |
| Time-Based Equity Acceleration | — | | — | | — | | — | | — | | — | |
| Performance-Based Equity Acceleration | 752,455 | | — | | 1,060,781 | | 1,286,958 | | 1,781,677 | | 2,129,787 | |
| Total | 752,455 | | — | | 2,697,261 | | 1,654,458 | | 1,781,677 | | 4,311,760 | |
| Robert Myers | Severance Pay | — | | — | | 1,643,858 | | 367,500 | | — | | 2,179,810 | |
Health Care Benefits(1) | — | | — | | 33,336 | | — | | — | | 44,448 | |
| Time-Based Equity Acceleration | — | | — | | 822,124 | | 822,124 | | — | | 1,050,648 | |
| Performance-Based Equity Acceleration | — | | — | | 755,079 | | 755,079 | | — | | 1,201,401 | |
| Total | — | | — | | 3,254,397 | | 1,944,703 | | — | | 4,476,307 | |
| John Caulfield | Severance Pay | — | | — | | 821,203 | | 165,000 | | — | | 1,094,937 | |
Health Care Benefits(1) | — | | — | | 31,023 | | — | | — | | 41,364 | |
| Time-Based Equity Acceleration | — | | — | | 354,191 | | 354,191 | | — | | 434,201 | |
| Performance-Based Equity Acceleration | — | | — | | 92,330 | | 92,330 | | — | | 206,063 | |
| Total | — | | — | | 1,298,747 | | 611,521 | | — | | 1,776,565 | |
| Tanya Brady | Severance Pay | — | | — | | 815,560 | | 131,250 | | — | | 1,087,413 | |
Health Care Benefits(1) | — | | — | | 10,414 | | — | | — | | 13,886 | |
| Time-Based Equity Acceleration | — | | — | | 224,578 | | 224,578 | | — | | 267,146 | |
| Performance-Based Equity Acceleration | — | | — | | 101,255 | | 101,255 | | — | | 181,773 | |
| Total | — | | — | | 1,151,807 | | 457,083 | | — | | 1,550,218 | |
(1)Represents the aggregate present value of continued participation in the Company’s group health insurance coverage based on the portion of the premiums payable by the Company during the eligible period. The eligible period for a termination without cause or resignation for good reason is 24 months for Mr. Edison and 18 months for the other NEOs. The eligible period for a change in control with termination is 30 months for Mr. Edison and 24 months for the other NEOs. The amounts reported may ultimately be lower if the NEO is no longer eligible to receive benefits, which could occur upon obtaining other employment and becoming eligible for group health insurance coverage through the new employer.
CEO Pay Ratio
As required by Section 953(b) of the Dodd-Frank Wall Street Reform and Consumer Protection Act, and Item 402(u) of Regulation S-K, we are providing the following information regarding the ratio of the annual total compensation of our Chairman and CEO, Mr. Edison, to the annual total compensation of our median employee.
As reported in the Summary Compensation Table, our CEO had annual total compensation for 2020 of $4,771,742. Using this Summary Compensation Table methodology, the annual total compensation of our median employee for 2020 was $95,787. As a result, we estimate that the ratio of our CEO’s annual total compensation to that of our median employee for fiscal 2020 was 49.8 to 1.
We believe that our compensation philosophy must be consistent and internally equitable to motivate our employees to create stockholder value. We are committed to internal pay equity, and our Compensation Committee monitors the relationship between the pay our CEO receives and the pay our non-executive employees receive.
We identified the median employee in 2020 based on the pool of individuals who were employed by us on December 31, 2020 (whether employed on a full-time, part-time, or seasonal basis). Employees on leave of absence were excluded from the list
and reportable wages were annualized for those employees who were not employed for the full calendar year. The compensation of this pool of employees was calculated using the Summary Compensation Table methodology.
The pay ratio reported above is a reasonable estimate calculated in a manner consistent with SEC rules, based on our internal records and the methodology described above. The SEC rules for identifying the median compensated employee allow companies to adopt a variety of methodologies, to apply certain exclusions and to make reasonable estimates and assumptions that reflect their employee populations and compensation practices. Accordingly, the pay ratio reported by other companies may not be comparable to the pay ratio reported above, as other companies have different employee populations and compensation practices and may use different methodologies, exclusions, estimates and assumptions in calculating their own pay ratios.
Director Compensation
Mr. Edison, our Chairman of the Board and Chief Executive Officer, does not receive compensation for his Board service. A description of the 2020 compensation for non-employee directors is as follows:
| | | | | | | | | | | | | | | | | | | | | | | |
| | Fees Earned or Paid in Cash
($) | | Stock Awards ($)(1)(2) | | All Other Compensation ($)(3) | | Total
($) |
| Leslie T. Chao | $ | 74,988 | | | $ | 51,529 | | | $ | 1,071 | | | $ | 127,588 | |
Elizabeth Fischer(4) | $ | 54,388 | | | $ | 77,289 | | | $ | 250 | | | $ | 131,927 | |
| Paul J. Massey, Jr. | $ | 54,388 | | | $ | 51,529 | | | $ | 1,071 | | | $ | 106,988 | |
| Stephen R. Quazzo | $ | 54,388 | | | $ | 51,529 | | | $ | 1,071 | | | $ | 106,988 | |
Jane Silfen(4) | $ | 54,388 | | | $ | 77,289 | | | $ | 250 | | | $ | 131,927 | |
| John A. Strong | $ | 54,388 | | | $ | 51,529 | | | $ | 745 | | | $ | 106,662 | |
| Gregory S. Wood | $ | 54,388 | | | $ | 51,529 | | | $ | 1,071 | | | $ | 106,988 | |
David W. Garrison(5) | $ | 31,363 | | | $ | — | | | $ | 579 | | | $ | 31,942 | |
(1)Represents the aggregate grant date fair value of restricted stock awards made to our directors in 2020, calculated in accordance with FASB ASC Topic 718, excluding any estimated forfeitures related to service-vesting conditions. The amounts reported in this column reflect the accounting cost for these restricted stock awards, and do not correspond to the actual economic value that may be received by the director upon vesting of the awards. Assumptions used in the calculation of these amounts are included in Note 14 to our audited consolidated financial statements in our Annual Report on Form 10-K.
(2)As of December 31, 2020, each of Messrs. Chao, Massey, Quazzo, and Wood held 6,502 shares of unvested restricted stock, Mr. Strong held 5,889 shares of unvested restricted stock, and Mses. Fischer and Silfen held 8,833 shares of unvested restricted stock.
(3)Represents distributions paid on unvested restricted stock.
(4)Mses. Fischer and Silfen began serving on the Board on November 1, 2019, after the 2019 director stock awards were issued to our directors. Thus, the Compensation Committee awarded an additional 2,944 shares of restricted stock to each of Mses. Fischer and Silfen in 2020 to compensate them for their prior partial year of service.
(5)Mr. Garrison retired from the Board effective June 17, 2020.
Our director compensation program is intended to provide a total compensation package that enables PECO to attract and retain qualified and experienced directors and to align our directors’ interests with those of our stockholders by including a substantial portion of their compensation in shares of PECO common stock. Non-employee director compensation is set by the Compensation Committee.
Effective May 5, 2020, based on input from its independent compensation consultant and to be in solidarity with the austerity measures adopted by the Company in response to the potential effects of COVID-19 on our business, the Compensation Committee approved the following non-employee director compensation program for 2020, which represents a 10% reduction from 2019: an annual cash retainer of $51,525 and an annual equity retainer of $51,525. The Compensation Committee also approved annual cash retainers for the Lead Independent Director, Audit Committee chair, and Compensation Committee chair of $10,300, which remained unchanged from 2019. In addition, the directors received reimbursement of reasonable out-of-pocket expenses incurred in connection with attending meetings in person. Annual equity retainers vest on the first anniversary of the grant date, subject to continued service through such date.
ITEM 12. SECURITY OWNERSHIP OF CERTAIN BENEFICIAL OWNERS AND MANAGEMENT AND RELATED STOCKHOLDER MATTERS
Beneficial Ownership of Common Stock
The shares ofinformation required by this Item will be included in our common stock and OP units, which are exchangeable on a one-for-one basis with shares of our common stock, beneficially owned as of February 26, 2021 by our directors, NEOs, our directors and executive officers as a group, and
any person who is known by usdefinitive proxy statement to be the beneficial owner of more than 5% of the outstanding shares of our common stock, are as follows:
| | | | | | | | | | | | | | | | | | | | | | | | | | |
| Common Stock | | Common Stock and OP Units |
| Name of Beneficial Owner | Number of Shares Beneficially Owned | | | Percentage of All Shares(1) | | Number of Shares and OP Units Beneficially Owned | | Percentage of All Shares and OP Units(2) |
| Non-Employee Directors | | | | | | | | |
| Leslie T. Chao | 49,069 | | (3) | * | | 49,069 | | * |
| Elizabeth Fischer | 8,833 | | (4) | * | | 8,833 | | * |
| Paul J. Massey, Jr. | 34,331 | | (5) | * | | 34,331 | | * |
| Stephen R. Quazzo | 85,567 | | (5) | * | | 85,567 | | * |
| Jane Silfen | 8,833 | | (4) | * | | 8,833 | | * |
| John A. Strong | 15,979 | | (6) | * | | 15,979 | | * |
| Gregory S. Wood | 20,724 | | (5) | * | | 20,724 | | * |
| NEOs | | | | | | | | |
Jeffrey S. Edison(7) | 566,861 | | (8) | * | | 23,309,254 | (9) | 7.27 | % |
Devin I. Murphy(7) | 40,727 | | | * | | 1,351,471 | (10) | * |
Robert F. Myers(7) | 18,033 | | | * | | 215,721 | (11) | * |
| John P. Caulfield | 11,056 | | | * | | 11,056 | | * |
| Tanya E. Brady | 9,787 | | | * | | 9,787 | | * |
All directors and executive officers
as a group (12 persons) | 869,800 | | | — | | | 25,120,625 | | 7.83 | % |
*Less than 1%.
(1)As of February 26, 2021, 280,518,352 shares of our common stock were outstanding, including unvested restricted stock, but excluding unvested performance-based equity awards granted to the Company’s directors, executive officers and employees pursuant to our equity compensation plans, which may or may not be earned in accordancefiled with the terms thereof and excludes shares of common stock that may be acquired by redeeming OP units.
(2)As of February 26, 2021, 40,190,143 OP units were outstanding, including unvested time-based LTIP unit awards, but excluding unvested performance-based equity awards granted to the Company’s directors, executive officers and employees pursuant to our equity compensation plans, which may or may not be earnedSEC within 120 days after December 31, 2023 in accordanceconnection with the terms thereof. Amounts assume that all outstanding OP units are exchanged for sharesCompany's 2024 Annual Meeting of our common stock, regardless of when such OP units are exchangeable. Pursuant to the limited partnership agreement of our operating partnership, after receiving a redemption notice from an OP unit holder, our operating partnership must redeem units for cash or, at our option, shares of common stock on a one-for-one basis, subject to certain conditions.
(3)Beneficial ownership includes 567 shares heldStockholders, and is hereby incorporated by Mr. Chao’s wife, as well as 6,502 shares of unvested restricted stock held by Mr. Chao.
(4)All 8,833 shares are unvested restricted stock.
(5)Includes 6,502 shares of unvested restricted stock.
(6)Includes 5,889 shares of unvested restricted stock.
(7)Amount of beneficial ownership in shares of common stock and/or OP units represents direct and indirect ownership held byreference into this individual and his affiliates.
(8)Beneficial ownership includes 51,167 shares of common stock held by a trust of which Mr. Edison’s wife is the trustee and a beneficiary. Beneficial ownership also includes 232,064 shares of our common stock held by PELP because Mr. Edison has voting and dispositive control of the shares it holds. Beneficial ownership also includes 36,267 shares of common stock held by Phillips Edison Properties LLC because Mr. Edison has shared voting and dispositive control of the shares it holds.
(9)Includes 112,981 unvested time-based LTIP units. Beneficial ownership also includes 755,075 OP units held by Old 97, Inc and 3,092,572 OP units held by Edison Properties LLC because Mr. Edison has shared voting and dispositive control of the OP units held by these entities. Beneficial ownership also includes (i) 6,112,821 OP units held by a trust of which Mr. Edison’s wife is the trustee and their descendants are beneficiaries and (ii) 1,175,808 OP units held by a trust of which Mr. Edison is a co-trustee and beneficiary.
(10)Includes 41,105 unvested time-based LTIP units.
(11)Includes 39,115 unvested time-based LTIP units.
Securities Authorized for Issuance under Equity Compensation Plans
Information related to the Company’s equity compensation plans, including the number of unvested awarded shares outstanding and the number of shares available for future issuance as of December 31, 2020 under such programs, is as follows:
| | | | | | | | | | | | | | | | | |
| Plan Category | (a) Number of Securities to be Issued Upon Exercise of Outstanding Options, Warrants, and Rights(1) | | (b) Weighted-Average Exercise Price of Outstanding Options, Warrants, and Rights | | (c) Number of Securities Remaining Available for Future Issuance Under Equity Compensation Plans (excluding securities reflected in column (a))(2) |
Equity compensation plans approved by security holders | $ | 4,400,000 | | | $ | — | | | $ | 3,500,000 | |
Equity compensation plans not approved by security holders | — | | | — | | | — | |
| Total | $ | 4,400,000 | | | $ | — | | | $ | 3,500,000 | |
(1)Includes 4.4 million performance stock units (“PSUs”) at maximum achievement level under the plan metrics that were issued under the Amended and Restated 2010 Long-Term Incentive Plan (“2010 Plan”). Based upon results to date, we currently expect a total of 2.3 million of such PSUs to vest.
(2)As of December 31, 2020, there were 3.5 million shares of our common stock available for grants under the 2020 Incentive Plan. There are no shares available under the 2010 Plan.Form 10-K.
ITEM 13. CERTAIN RELATIONSHIPS AND RELATED TRANSACTIONS, AND DIRECTOR INDEPENDENCE
Related Party Transactions Policy and Procedures
The Board has adopted the Related Party Transactions Policy requiring transactions with related personsinformation required by this Item will be included in our definitive proxy statement to be reviewed and approved or ratified by the Audit Committee. The policy applies to all transactions or series of transactions in which the aggregate amount involved will or may exceed $120,000 in any fiscal year, between the Company and a director, executive officer or beneficial owner of more than 5% of our common stock, in which such related person had, has, or will have a direct or indirect material interest. Prior to entering into a transaction covered by the policy, a majority of the members of the Audit Committee must conclude that the transaction is fair and reasonable to us and on terms and conditions not less favorable to us than those available from unaffiliated third parties.
The Audit Committee has preapproved certain transactions that involve: (i) employment of an executive officer if the related compensation is required to be reported in the Company’s proxy statement or Annual Report on Form 10-K under Item 402 of Regulation S-K; (ii) any compensation paid to a director if the related compensation is required to be reported in the Company’s proxy statement or Annual Report on Form 10-K under Item 402 of Regulation S-K; and (iii) any transaction with another company where the related person’s interest arises solely as an employee, a beneficial owner of less than 10% of that company’s equity, or in the case of limited partnerships, a limited partner, if the aggregate amount involved does not exceed the greater of $1,000,000 or 2% of that company’s total annual revenues.
Agreements with Related Persons
Advisory, Services, and Joint Venture Agreements—We have entered into certain advisory, services, and joint venture agreements under which we earn revenue for managing day-to-day activities and implementing the investment strategy for two institutional joint ventures in which we retain a partial ownership interest and one private fund (collectively the “Managed Funds”). Our services agreement with PELP has a five-year term through October 3, 2022. Our Necessity Retail Partners (“NRP”) joint venture agreement has a seven-year term through March 21, 2023. Our joint venture agreements with Northwestern Mutual Life Insurance Company (“Northwestern Mutual”), pursuant to which we formed Grocery Retail Partners I LLC (“GRP I”) and Grocery Retail Partners II LLC (“GRP II”), each have a 10-year term through November 8, 2028. GRP I acquired the assets of GRP II through a contribution transaction in September 2020 and GRP II was dissolved in December 2020.
Under the terms of our agreementsfiled with the Managed Funds, we receive certain monthly asset management fees from the Managed Funds. The asset management fees paid by the Managed Funds vary from a flat fee to fees based on percentages of the assets under management or equity invested and are paid in cash. We earned asset management fees of approximately $2.7 million for the year endedSEC within 120 days after December 31, 2020.
Guarantees—In2023 in connection with our NRP joint venture, we are the limited guarantor for up to $190 million, capped at $50 million in most instances,Company's 2024 Annual Meeting of NRP debt. As a part of the GRP I joint venture, GRP I assumed from us a $175 million mortgage loan for which we are the limited guarantor. Our GRP I guaranteeStockholders, and is limited to being the non-recourse carveout guarantor and the environmental indemnitor. We enteredhereby incorporated by reference into a separate agreement with Northwestern Mutual in which we agree to apportion any potential liability under this guarantee between us and them based on our respective ownership percentages in GRP I.
Property Management and Services Agreements—Under our property management and services agreements with the Managed Funds (collectively, “Management Agreements”), we earn revenues for managing day-to-day activities at the properties of the Managed Funds. As property manager, we are to provide various services (e.g., accounting, finance, and operations) for which we receive a distinct fee based on a set percentage of gross cash receipts each month. Under the Management Agreements, we also serve as a leasing agent to the Managed Funds. For each new lease, lease renewal or extension, and lease expansion, we receive a leasing commission. Leasing commissions are recognized as lease deals occur
and are dependent on the terms of the lease. We also assist in overseeing the construction of various improvements for Managed Funds, for which we receive a distinct fee based on a set percentage of total project cost calculated upon completion of construction. We may have hired, directed, or established policies for employees who had direct responsibility for the operations of each real property we managed, which may have included on-site managers and building and maintenance personnel. We consider our Management Agreements with PELP month-to-month contracts because they are generally terminable by either party upon satisfaction of certain notice requirements. Our Management Agreements with our joint ventures have terms commensurate with their respective joint venture agreements, which are terminable by the joint ventures for cause and by us upon satisfaction of certain notice requirements.
Under the terms of our Management Agreements, we generally earn a monthly property management fee equal to 4% of the monthly cash receipts of the properties we managed for the Managed Funds. For the year ended December 31, 2020, we earned property management fees of approximately $2.1 million.
We also earned leasing commissions and construction management fees from the Managed Funds in an amount that is usual and customary for comparable services rendered to properties in a similar geographic market. For the year ended December 31, 2020, we earned leasing commissions and construction management fees of approximately $1.9 million.
We were also reimbursed for costs and expenses incurred by us, including legal, tax, travel, and other out-of-pocket expenses, that were directly related to the management of specific properties of the Managed Funds. For the year ended December 31, 2020, we received other fees and reimbursements of approximately $0.8 million.
Airplane Leases—PECO Air L.L.C. (“PECO Air”), an entity in which Mr. Edison, our Chairman and Chief Executive Officer, owns a 50% interest, owns an airplane that the Company uses for business purposes in the course of its operations pursuant to two written lease agreements. Pursuant to the two lease agreements, we pay PECO Air aggregate annual fees of approximately $0.9 million for 135 hours of operation, plus $500 for each hour of operation as well as fuel and certain maintenance costs. During 2020, we made aggregate payments of approximately $1.0 million to PECO Air. In addition, we entered into an aircraft time sharing agreement with Mr. Edison for personal use of the aircraft leased to us by PECO Air. The FAA limits the costs that can be charged and reimbursed under a time share arrangement. Mr. Edison pays an hourly fee that is within the restraints of the FAA requirements. In 2020, the cost to us exceeded the amount reimbursed by approximately $26,500, which amount is included in the All Other Compensation column of the Summary Compensation Table.
Director Independence
Although shares of our common stock are not currently listed for trading on a national securities exchange, a majority of our directors and all of the members of the Audit Committee and the Compensation Committee are “independent” as defined by the rules of the NYSE. The NYSE independence standards provide that to qualify as an independent director, in addition to satisfying certain bright-line criteria, the Board must affirmatively determine that a director has no material relationship with the Company (either directly or as a partner, stockholder, or officer of an organization that has a relationship with the Company). The Board has determined that each of our non-employee directors is “independent” as defined by the NYSE.Form 10-K.
ITEM 14. PRINCIPAL ACCOUNTANT FEES AND SERVICES
Audit Fees
The aggregate fees billed for professional services providedinformation required by Deloitte & Touche LLP for the annual audit ofthis Item will be included in our financial statements, and for audit-related, tax, and other services performed in 2020 and 2019 are as follows:
| | | | | | | | | | | |
| 2020 | | 2019 |
Audit fees(1) | $ | 890,000 | | | $ | 940,000 | |
Audit-related fees(2) | 10,000 | | | 48,121 | |
Tax fees(3) | 93,573 | | | 46,055 | |
| All other fees | — | | | — | |
| Total fees | $ | 993,573 | | | $ | 1,034,176 | |
(1)Includes aggregate fees billed for annual audit and quarterly reviews of our consolidated financial statements, including services related to the Company’s adoption of certain new accounting pronouncements.
(2)Includes fees billed for services reasonably related to the performance of the audit and review of the consolidated financial statements, including review of other SEC filings.
(3)Includes aggregate fees billed for services related to tax advice and planning.
Preapproval Policies
The Audit Committee charter imposes a duty on the Audit Committee to preapprove all auditing services performed for us by our independent auditors, as well as all permitted nonaudit services (including the fees and terms thereof) in order to ensure that the provision of such services does not impair the auditors’ independence. Unless a type of servicedefinitive proxy statement to be providedfiled with the SEC within 120 days after December 31, 2023 in connection with the Company's 2024 Annual Meeting of Stockholders, and is hereby incorporated by the independent auditors has received “general” preapproval, it will require “specific” preapproval by the Audit Committee. Additionally, any proposed services exceeding “general” preapproved cost levels will require specific preapproval by the Audit Committee.
All requests or applications for services to be provided by the independent auditor that do not require specific preapproval by the Audit Committee will be submitted to management and must include a detailed description of the services to be rendered. Management will determine whether such services are included within the list of services that have received the generalreference into this Form 10-K.
preapproval of the Audit Committee. The Audit Committee will be informed on a timely basis of any such services rendered by the independent auditors.
Requests or applications to provide services that require specific preapproval by the Audit Committee will be submitted to the Audit Committee by both the independent auditors and the chief financial officer, and must include a joint statement as to whether, in their view, the request or application is consistent with the SEC’s rules on auditor independence. The Chair of the Audit Committee has been delegated the authority to specifically preapprove all services not covered by the general preapproval guidelines. Amounts requiring preapproval in excess of the “general” preapproved cost levels require specific preapproval by all members of the Audit Committee prior to engagement of our independent auditors. All amounts specifically preapproved by the Chair of the Audit Committee in accordance with this policy are to be disclosed to the full Audit Committee at the next regularly scheduled meeting. All services rendered by Deloitte & Touche LLP for the year ended December 31, 2020 were preapproved in accordance with the policies and procedures described above.
80
| | | | | | | | | | | |
PHILLIPS EDISON & COMPANY DECEMBER 31, 2023 FORM 10-K | | | 48 |
ITEM 15. EXHIBITS AND FINANCIAL STATEMENT SCHEDULES
(a) Financial Statement Schedules
See the Index to Consolidated Financial Statements on page F-1 of this report.
(b) Exhibits
| | | | | | | | |
| Ex. | Description |
| Contribution AgreementReference |
| 2.1 | | Form 8-K, filed May 23, 2017)2017, Exhibit 2.1 |
| 2.2 | | Form 10-K, filed March 23, 2019) |
| Charter13, 2019, Exhibit 2.2 |
| 3.1 | | Form 10-Q, filed May 5, 2022, Exhibit 3.1 to the Company’s Current Report on Form 8-K filed August 10, 2020) |
| Bylaws |
| 3.2 | | Form 8-K, filed October 11, 2017) |
3.3 | |
| Restrictions on Transferability of Common Stock3.1 |
| 4.1 | | Form S-11, (No. 333-164313) filed March 1, 2010) |
| Dividend Reinvestment Plan2010, Exhibit 4.2 |
| 4.2 | | Form S-3, filed October 31, 2019) |
| Share Repurchase Program2019, Exhibit 4.7 |
| 4.3 | | Form 8-K, filed January 14, 2021) |
| Agreement of Limited Partnership of Operating Partnership2021, Exhibit 99.1 |
| 4.4 | | Form 10-K, filed March 30, 2018) |
| Description of Securities Registered Pursuant to Section 122018, Exhibit 4.4 |
| 4.5 | | Form 10-K, filed March 12, 2021, Exhibit 4.5 |
| 4.6 | Indenture, dated as of October 6, 2021, by and among Phillips Edison Grocery Center Operating Partnership I, L.P., as issuer, Phillips Edison & Company, Inc., as guarantor, and U.S. Bank National Association, as trustee | Tax Protection AgreementForm 8-K, filed October 6, 2021, Exhibit 4.1 |
| 4.7 | First Supplemental Indenture, dated as of October 6, 2021, by and among Phillips Edison Grocery Center Operating Partnership I, L.P., as issuer, Phillips Edison & Company, Inc., as guarantor, and U.S. Bank National Association, as trustee | Form 8-K, filed October 6, 2021, Exhibit 4.2 |
| 10.1 | | Form 8-K, filed October 11, 2017) |
| Equityholder Agreement2017, Exhibit 10.2 |
| 10.2 | | Form 8-K, filed July 19, 2021, Exhibit 10.1 |
| 10.3 | | Form 8-K, filed October 11, 2017) |
| Property Management, Leasing and Construction Management Agreement |
10.3 | |
| Debt Agreements10.3 |
| 10.4 | | Form 8-K, filed November 19, 2018)July 2, 2021, Exhibit 10.1 |
| 10.5 | | Form 8-K, filed May 20, 2022, Exhibit 10.1 |
| 10.6 | | Form 10-Q, filed November 9, 2017, Exhibit 10.10 |
| | | | | | | | | | | |
PHILLIPS EDISON & COMPANY DECEMBER 31, 2023 FORM 10-K | | | 49 |
| | | | | | | | |
| Ex. | Description | Reference |
10.510.7 | | Form 10-Q, filed November 9, 2017, Exhibit 10.11 |
| 10.8 | | Schedule 14A, filed April 7, 2020, Appendix A |
| 10.9 | | Schedule 14A, filed April 9, 2021, Appendix A |
| 10.10 | | Form S-11/A, filed August 11, 2010, Exhibit 10.3 |
| 10.11 | | Form 10-Q, filed November 9, 2017, Exhibit 10.14 |
| 10.12 | | Form S-11/A, filed July 7, 2021, Exhibit 10.19 |
| 10.13 | | Form 10-Q, filed November 9, 2017, Exhibit 10.15 |
| 10.14 | | Form 10-Q, filed November 9, 2017, Exhibit 10.16 |
| 10.15 | | Form 10-Q, filed November 9, 2017, Exhibit 10.17 |
| 10.16 | | Form 10-Q, filed November 9, 2017, Exhibit 10.18 |
| 10.17 | | Form 10-K, filed March 13, 2019, Exhibit 10.23 |
| 10.18 | | Form 10-Q, filed August 12, 2019, Exhibit 10.1 |
| 10.19 | | Form 10-K, filed March 13, 2019, Exhibit 10.26 |
| 10.20 | | Form 10-K, filed March 12, 2020, Exhibit 10.22 |
| 10.21 | | Form 10-K, filed March 13, 2019, Exhibit 10.27 |
| 10.22 | | Form 10-K, filed March 12, 2020, Exhibit 10.24 |
| 10.23 | | Form S-11/A, filed July 7, 2021, Exhibit 10.32 |
| 10.24 | | Form S-11/A, filed July 7, 2021, Exhibit 10.33 |
| 10.25 | | Form S-11/A, filed July 7, 2021, Exhibit 10.34 |
| 10.26 | | Form S-11/A, filed July 7, 2021, Exhibit 10.35 |
| 10.27 | | Form 8-K, filed March 4, 2022, Exhibit 10.1 |
| 10.28 | | Form 8-K, filed March 4, 2022, Exhibit 10.2 |
| 10.29 | | Form 8-K, filed March 4, 2022, Exhibit 10.3 |
| 10.30 |
| Form 8-K, filed March 4, 2022, Exhibit 10.4 |
| 10.31 | Second Amended and Restated Credit Agreement, dated as of July 31, 2023, among Phillips Edison Grocery Center Operating Partnership I, L.P., Phillips Edison & Company, Inc., the lenders party thereto, and Bank of America, N.A., as administrative agent dated November 16, 2018 (incorporated by reference to Exhibit 10.1 to the Company’s Current Report on Form 8-K filed November 19, 2018)
|
10.6 | |
10.7 | |
| Compensatory Plans10.1 |
10.8 | |
10.910.32 | |
10.10 | |
10.11 | Credit Agreement, Regarding Phillips Edison Limited Partnership Restricted Management Units anddated as of July 31, 2023, among Phillips Edison Grocery Center Operating Partnership I, L.P. Phantom Units dated October 4, 2017 (incorporated by reference to Exhibit 10.12 to, Phillips Edison & Company, Inc., the Company’s Quarterly Report on Form 10-Q filed November 9, 2017)*lenders party thereto and Capital One, National Association, as administrative agent |
10.12 | |
10.13 | |
10.14 | |
10.15 | |
10.16 | |
10.17 | |
10.18 | |
10.1910.33 | 2019 Performance LTIP Unit AwardAmended and Restated Credit Agreement, for Jeffrey S.dated as of July 31, 2023, among Phillips Edison dated March 12, 2019 (incorporated by reference to Exhibit 10.26 on Form 10-K filed March 13, 2019)*Grocery Center Operating Partnership I, L.P., Phillips Edison & Company, Inc., the lenders party thereto and KeyBank National Association, as administrative agent |
10.20 | |
10.21 | |
10.22 | |
| 21.1 | | |
| 22.1 | | |
| 23.1 | |
| 23.2 |
| 31.1 | | |
| | | | | | | | | | | |
PHILLIPS EDISON & COMPANY DECEMBER 31, 2023 FORM 10-K | | | 50 |
| | | | | | | | |
| Ex. | Description | Reference |
| 31.2 | | |
| 32.1 | | |
| 32.2 | | |
| 97 | | |
| 101.1 | The following information from the Company’s annual report on Form 10-K for the year ended December 31, 2020,2023, formatted in XBRL (eXtensible Business Reporting Language): (i) Consolidated Balance Sheets; (ii) Consolidated Statements of Operations and Comprehensive (Loss) Income; (iii) Consolidated Statements of Equity; and (iv) Consolidated Statements of Cash Flows | |
| 101.INS | Inline XBRL Instance Document | |
| 101.SCH | Inline XBRL Taxonomy Extension Schema Document | |
| 101.CAL | Inline XBRL Taxonomy Extension Calculation Linkbase Document | |
| 101.DEF | Inline XBRL Taxonomy Extension Definition Linkbase Document | |
| 101.LAB | Inline XBRL Taxonomy Extension Label Linkbase Document | |
| 101.PRE | Inline XBRL Taxonomy Extension Presentation Linkbase Document | |
| 104 | Cover Page Interactive Data File (formatted as Inline XBRL and contained in Exhibit 101) | |
* Management Contract or Compensatory Plan
** Filed herewith
*** Furnished herewith
ITEM 16. FORM 10-K SUMMARY
Not applicable.
| | | | | | | | | | | |
PHILLIPS EDISON & COMPANY DECEMBER 31, 2023 FORM 10-K | | | 51 |
INDEX TO CONSOLIDATED FINANCIAL STATEMENTS
*All schedules other than the one listed in the index have been omitted as the required information is either not applicable or the information is already presented in the consolidated financial statements or the related notes.
| | | | | | | | | | | |
| PHILLIPS EDISON & COMPANY DECEMBER 31, 2023 FORM 10-K | | | F-1 |
REPORT OF INDEPENDENT REGISTERED PUBLIC ACCOUNTING FIRM
To the Stockholders and the Board of Directors of Phillips Edison & Company, Inc.
Opinion on the Financial Statements
We have audited the accompanying consolidated balance sheets of Phillips Edison & Company, Inc. and subsidiaries (the “Company”) as of December 31, 20202023 and 2019,2022, the related consolidated statements of operations and comprehensive (loss) income, equity, and cash flows, for each of the three years in the period ended December 31, 2020,2023, and the related notes and the schedule listed in the Index at Item 15 (collectively referred to as the “financial statements”). In our opinion, the financial statements present fairly, in all material respects, the financial position of the Company as of December 31, 20202023 and 2019,2022, and the results of its operations and its cash flows for each of the three years in the period ended December 31, 2020,2023, in conformity with accounting principles generally accepted in the United States of America.
We have also audited, in accordance with the standards of the Public Company Accounting Oversight Board (United States) (PCAOB), the Company's internal control over financial reporting as of December 31, 2023, based on criteria established in Internal Control — Integrated Framework (2013) issued by the Committee of Sponsoring Organizations of the Treadway Commission and our report dated February 12, 2024, expressed an unqualified opinion on the Company's internal control over financial reporting.
Basis for Opinion
These financial statements are the responsibility of the Company’sCompany's management. Our responsibility is to express an opinion on the Company’sCompany's financial statements based on our audits. We are a public accounting firm registered with the Public Company Accounting Oversight Board (United States) (PCAOB)PCAOB and are required to be independent with respect to the Company in accordance with the U.S. federal securities laws and the applicable rules and regulations of the Securities and Exchange Commission and the PCAOB.
We conducted our audits in accordance with the standards of the PCAOB. Those standards require that we plan and perform the audit to obtain reasonable assurance about whether the financial statements are free of material misstatement, whether due to error or fraud. The Company is not required to have, nor were we engaged to perform, an audit of its internal control over financial reporting. As part of our audits, we are required to obtain an understanding of internal control over financial reporting but not for the purpose of expressing an opinion on the effectiveness of the Company’s internal control over financial reporting. Accordingly, we express no such opinion.
Our audits included performing procedures to assess the risks of material misstatement of the financial statements, whether due to error or fraud, and performing procedures that respond to those risks. Such procedures included examining, on a test basis, evidence regarding the amounts and disclosures in the financial statements. Our audits also included evaluating the accounting principles used and significant estimates made by management, as well as evaluating the overall presentation of the financial statements. We believe that our audits provide a reasonable basis for our opinion.
Critical Audit Matter
The critical audit matter communicated below is a matter arising from the current-period audit of the financial statements that was communicated or required to be communicated to the audit committee and that (1) relates to accounts or disclosures that are material to the financial statements and (2) involved our especially challenging, subjective, or complex judgments. The communication of critical audit matters does not alter in any way our opinion on the financial statements, taken as a whole, and we are not, by communicating the critical audit matter below, providing a separate opinion on the critical audit matter or on the accounts or disclosures to which it relates.
Allocation of Purchase Price for Investment in Real Estate – Evaluation of Impairment –Assets — Refer to Notes 2 and 174 to the financial statements.
Critical Audit Matter Description
The Company’s evaluation for impairment of its investment in real estate involves an initial assessment of each real estate asset to determine whether events or changes in circumstances exist that may indicate that the carrying amount of a real estate asset is no longer recoverable. Possible indicators of impairment may include changes in market conditions; significant decreases in a real estate asset’s occupancy, rental income, operating income, or market value; declines in tenant performance; tenant bankruptcies; changes to lease structures; or a planned disposition in which a real estate asset’s fair value is less than its current carrying value, among others. When an indicator of potential impairment exists, the Company evaluates the real estate asset for impairment by comparing undiscounted future cash flows expected to be generated over the holding period of the real estate asset to its respective carrying amount. If the carrying amount of the real estate asset exceeds its undiscounted future cash flows, an analysis is performed to determine the fair value of the real estate asset for measurement of impairment.
The Company makes significant assumptions, the most critical of which involve assessments of market conditions, hold periods, and market values of its real estate assets, to identify those with potential impairment. Changes in these assumptions could have a significant impact on which real estate assets are identified for further analysis. For a real estate asset with an identified indicator of potential impairment, the Company makes significant estimates and assumptions to project the real estate asset’s undiscounted future cash flows expected to be generated over the Company’s remaining holding period. Estimates and assumptions made include those related to the real estate asset’s market rent growth and terminal capitalization rates, and assumptions related to tenant activity, such as future lease signings and renewals. In the event that a real estate asset is not recoverable based on the results of the undiscounted cash flow analysis, the Company will adjust the real estate asset to its fair value based upon discounted cash flow or direct capitalization models, third-party appraisals, or broker selling estimates or sale agreements, when available, and recognize an impairment loss for the carrying amount in excess of fair value.
Based on the Company’s impairment analysis, certain real estate assets were identified as possessing impairment indicators and were then subject to an undiscounted cash flow test. Based on the results of the undiscounted cash flow tests, certain real estate assets were determined to be unrecoverable by the Company. An impairment loss of approximately $2.4 million was recognized duringDuring the year ended December 31, 20202023, the Company acquired eleven properties and three outparcels for an aggregate purchase price of $278 million. The Company accounted for the acquisitions as asset acquisitions. Accordingly, the purchase price paid for assets acquired and liabilities assumed was allocated, based on their relative fair values, to building and building improvements, land and land improvements, furniture, fixtures, and equipment, in-place leases, and other intangible assets and assumed liabilities. Estimates of fair values were based upon assumptions that the Company believes are similar to those unrecoverable real estate assets.used by independent appraisers. Valuation assumptions utilized include comparable sales transactions, costs to replace certain assets, market rents, discount rates, and terminal capitalization rates.
We identified the identification and analysis of impairment indicators for real estate assets and the impairment of real estate assetsacquisitions as a critical audit matter because of (1) the significant assumptions management makes when identifying and analyzing
indicators to determine whether events or changes in circumstances have occurred indicating that the carrying amounts of real estate assets may not be recoverable and (2) for those real estate assets where indications of impairment have been identified, the significant estimates and assumptions management makes to estimate the undiscounted cash flows of real estate assets, and for those real estate assets that are not recoverable, the significant estimates and assumptions management makes to determine the fair valuevalues of the real estate assets. Aassets acquired and liabilities assumed. This required a high degree of auditor judgment was requiredand an increased extent of effort, including the need to involve our fair value specialists, when performing audit procedures to evaluate (1) whether management appropriately identified and analyzed impairment indicators, (2) the reasonableness of management’s undiscounted future cash flows analysis, and (3) the determination of fair value for unrecoverable real estate assets.assumptions.
How the Critical Audit Matter Was Addressed in the Audit
Our audit procedures related to the identification and analysisallocation of real estate assetspurchase price for possible indications of impairment, and our procedures related to the estimate of future undiscounted cash flows and the determination of fair value for unrecoverableinvestment in real estate assets included the following, among others:
•We evaluatedtested the Company’seffectiveness of controls over the purchase price allocation, including management’s controls over the identification of real estate assets, and analysisthe valuation methodology for estimating the fair value of impairment indicators by:assets acquired and liabilities assumed.
•For each acquisition:
◦SearchingWe obtained and evaluated the third-party purchase price allocation report, along with relevant supporting documentation, such as the executed purchase and sale agreement, property condition assessment, executed closing statement, and recorded journal entry in order to corroborate our understanding of the substance of the acquisition obtained through inquiry with the Company’s management, as well as assess the completeness of the assets acquired and liabilities assumed as part of the acquisition.
| | | | | | | | | | | |
| PHILLIPS EDISON & COMPANY DECEMBER 31, 2023 FORM 10-K | | | F-2 |
◦We tested the fair value estimates allocated to the assets acquired and liabilities assumed by comparing the estimates to average historical allocations determined by the Company to identify outliers for adverse asset-specific and market conditions through reviewfurther investigation.
•With the assistance of third-party industry reports, real estate industry news sources, and websites and financial reportsour fair value specialists, for those acquisitions that we deemed to possess characteristics of key anchor tenants across the portfolio, among other sources.additional audit interest, we:
◦Independently evaluating key impairment indicators, such as projected net operating incomeEvaluated the reasonableness of the valuation and changes in occupancy of each real estate asset,allocation methodology and comparing the results of our analysisrelated inputs, including comparable sales transactions, costs to the indicators identified by management.replace certain assets, market rents, discount rates, and terminal capitalization rates.
◦Reviewing management’s specific real estate asset disposition plansTested the mathematical accuracy of the calculations and assessing for impairment any real estate asset with potential sales prices belowcompared the recorded real estate asset value.
•We evaluated the Company’s estimate of undiscounted future cash flows and the determination of fair value for unrecoverable real estate assets by:
◦Comparingkey inputs used in the projections included in management’s estimate of future undiscounted cash flows to the Company’s historical results and external market sources.
◦Evaluating whether the impacts caused by the COVID-19 pandemic on a real estate asset’s cash flows were properly considered in the Company’s cash flow projections, including the projected hold period, impact of rent deferrals and concessions, probability of lease renewals and execution of new leases, and operational health of tenant businesses.
◦Assessing the market rent growth rate and terminal capitalization rate used to determine the residual value of the real estate asset upon future sale against third-party industry reports and recent comparable sales information.
◦Discussing with management the assumptions used in the Company’s valuation models and evaluating the consistency of the assumptions used with evidence obtained in other areas of the audit.
◦Evaluating the source information used by management when determining the fair value of a real estate asset based on broker selling estimates or sale agreements.
/s/ Deloitte & Touche LLP
Cincinnati, Ohio
MarchFebruary 12, 20212024
We have served as the Company's auditor since 2009.
| | | | | | | | | | | |
| PHILLIPS EDISON & COMPANY DECEMBER 31, 2023 FORM 10-K | | | F-3 |
PHILLIPS EDISON & COMPANY, INC.
CONSOLIDATED BALANCE SHEETS
AS OF DECEMBER 31, 20202023 AND 20192022
(In thousands, except per share amounts)
| | | | 2020 | | 2019 | | 2023 | | 2022 |
| ASSETS | ASSETS | | | | ASSETS | | | |
| Investment in real estate: | Investment in real estate: | | | | Investment in real estate: | | | |
| Land and improvements | Land and improvements | $ | 1,549,362 | | | $ | 1,552,562 | |
| Building and improvements | Building and improvements | 3,237,986 | | | 3,196,762 | |
| In-place lease assets | In-place lease assets | 441,683 | | | 442,729 | |
| Above-market lease assets | Above-market lease assets | 66,106 | | | 65,946 | |
| Total investment in real estate assets | Total investment in real estate assets | 5,295,137 | | | 5,257,999 | |
| Accumulated depreciation and amortization | Accumulated depreciation and amortization | (941,413) | | | (731,560) | |
| Net investment in real estate assets | Net investment in real estate assets | 4,353,724 | | | 4,526,439 | |
| Investment in unconsolidated joint ventures | Investment in unconsolidated joint ventures | 37,366 | | | 42,854 | |
| Total investment in real estate assets, net | Total investment in real estate assets, net | 4,391,090 | | | 4,569,293 | |
| Cash and cash equivalents | Cash and cash equivalents | 104,296 | | | 17,820 | |
| Restricted cash | Restricted cash | 27,641 | | | 77,288 | |
| Goodwill | Goodwill | 29,066 | | | 29,066 | |
| Other assets, net | Other assets, net | 126,470 | | | 128,690 | |
| Real estate investment and other assets held for sale | 0 | | | 6,038 | |
| Total assets | Total assets | $ | 4,678,563 | | | $ | 4,828,195 | |
| LIABILITIES AND EQUITY | LIABILITIES AND EQUITY | | | | LIABILITIES AND EQUITY | | | |
| Liabilities: | Liabilities: | | | | Liabilities: | | | |
| Debt obligations, net | Debt obligations, net | $ | 2,292,605 | | | $ | 2,354,099 | |
| Below-market lease liabilities, net | Below-market lease liabilities, net | 101,746 | | | 112,319 | |
| Earn-out liability | 22,000 | | | 32,000 | |
| Accounts payable and other liabilities | |
| Deferred income | Deferred income | 14,581 | | | 15,955 | |
| Derivative liability | 54,759 | | | 20,974 | |
| Accounts payable and other liabilities | 176,943 | | | 124,054 | |
| Total liabilities | Total liabilities | 2,662,634 | | | 2,659,401 | |
| Commitments and contingencies (Note 12) | 0 | | | 0 | |
| Commitments and contingencies (see Note 11) | |
| Equity: | Equity: | | | | Equity: | | | |
| Preferred stock, $0.01 par value per share, 10,000 shares authorized, 0 shares issued and | |
| outstanding at December 31, 2020 and 2019 | 0 | | | 0 | |
| Common stock, $0.01 par value per share, 1,000,000 shares authorized, 279,836 and 289,047 | | | |
| shares issued and outstanding at December 31, 2020 and 2019, respectively | 2,798 | | | 2,890 | |
| Preferred stock, $0.01 par value per share, 10,000 shares authorized, zero shares issued and outstanding at December 31, 2023 and 2022 | |
| Common stock, $0.01 par value per share, 1,000,000 shares authorized, 122,024 and 117,126 shares issued and outstanding at December 31, 2023 and 2022, respectively | |
| Additional paid-in capital (“APIC”) | Additional paid-in capital (“APIC”) | 2,739,358 | | | 2,779,130 | |
| Accumulated other comprehensive loss (“AOCI”) | (52,306) | | | (20,762) | |
| Accumulated other comprehensive income (“AOCI”) | |
| Accumulated deficit | Accumulated deficit | (999,491) | | | (947,252) | |
| Total stockholders’ equity | Total stockholders’ equity | 1,690,359 | | | 1,814,006 | |
| Noncontrolling interests | Noncontrolling interests | 325,570 | | | 354,788 | |
| Total equity | Total equity | 2,015,929 | | | 2,168,794 | |
| Total liabilities and equity | Total liabilities and equity | $ | 4,678,563 | | | $ | 4,828,195 | |
See notes to consolidated financial statements.
| | | | | | | | | | | |
| PHILLIPS EDISON & COMPANY DECEMBER 31, 2023 FORM 10-K | | | F-4 |
PHILLIPS EDISON & COMPANY, INC.
CONSOLIDATED STATEMENTS OF OPERATIONS AND COMPREHENSIVE (LOSS) INCOME
FOR THE YEARS ENDED DECEMBER 31, 2020, 2019,2023, 2022, AND 20182021
(In thousands, except per share amounts)
| | | | 2020 | | 2019 | | 2018 | | 2023 | | 2022 | | 2021 |
| Revenues: | Revenues: | | | | | | Revenues: | | | |
| Rental income | Rental income | $ | 485,483 | | | $ | 522,270 | | | $ | 395,790 | |
| Fees and management income | Fees and management income | 9,820 | | | 11,680 | | | 32,926 | |
| Other property income | Other property income | 2,714 | | | 2,756 | | | 1,676 | |
| Total revenues | Total revenues | 498,017 | | | 536,706 | | | 430,392 | |
| Operating Expenses: | Operating Expenses: | | | | | | Operating Expenses: | | | |
| Property operating | Property operating | 87,490 | | | 90,900 | | | 77,209 | |
| Real estate taxes | Real estate taxes | 67,016 | | | 70,164 | | | 55,335 | |
| General and administrative | General and administrative | 41,383 | | | 48,525 | | | 50,412 | |
| Depreciation and amortization | Depreciation and amortization | 224,679 | | | 236,870 | | | 191,283 | |
| Impairment of real estate assets | Impairment of real estate assets | 2,423 | | | 87,393 | | | 40,782 | |
| Total operating expenses | Total operating expenses | 422,991 | | | 533,852 | | | 415,021 | |
| Other: | Other: | | | | | | Other: | | | |
| Interest expense, net | Interest expense, net | (85,303) | | | (103,174) | | | (72,642) | |
| Gain on sale or contribution of property, net | 6,494 | | | 28,170 | | | 109,300 | |
| Transaction expenses | 0 | | | 0 | | | (3,331) | |
| Other income (expense), net | 9,245 | | | (676) | | | (1,723) | |
| Net income (loss) | 5,462 | | | (72,826) | | | 46,975 | |
| Net (income) loss attributable to noncontrolling interests | (690) | | | 9,294 | | | (7,837) | |
| Net income (loss) attributable to stockholders | $ | 4,772 | | | $ | (63,532) | | | $ | 39,138 | |
| Earnings per common share: | | | | | |
Net income (loss) per share attributable to stockholders - basic and diluted (See Note 15) | $ | 0.02 | | | $ | (0.22) | | | $ | 0.20 | |
| Gain on disposal of property, net | |
| Other expense, net | |
| Net income | |
| Net income attributable to noncontrolling interests | |
| Net income attributable to stockholders | |
| Earnings per share of common stock: | |
| Net income per share attributable to stockholders - basic and diluted (see Note 14) | |
| Net income per share attributable to stockholders - basic and diluted (see Note 14) | |
| Net income per share attributable to stockholders - basic and diluted (see Note 14) | |
| | Comprehensive (loss) income: | |
| Net income (loss) | $ | 5,462 | | | $ | (72,826) | | | $ | 46,975 | |
| Other comprehensive loss: | |
| Comprehensive income: | |
| Comprehensive income: | |
| Comprehensive income: | |
| Net income | |
| Net income | |
| Net income | |
| Other comprehensive (loss) income: | |
| Change in unrealized value on interest rate swaps | Change in unrealized value on interest rate swaps | (33,820) | | | (38,274) | | | (4,156) | |
| Comprehensive (loss) income | (28,358) | | | (111,100) | | | 42,819 | |
| Net (income) loss attributable to noncontrolling interests | (690) | | | 9,294 | | | (7,837) | |
| Change in unrealized value on interest rate swaps | |
| Change in unrealized value on interest rate swaps | |
| Comprehensive income | |
| Net income attributable to noncontrolling interests | |
| Change in unrealized value on interest rate swaps attributable to noncontrolling interests | Change in unrealized value on interest rate swaps attributable to noncontrolling interests | 4,351 | | | 5,150 | | | 22 | |
| Reallocation of comprehensive loss upon conversion of noncontrolling interests | (2,075) | | | 0 | | | 0 | |
| Comprehensive (loss) income attributable to stockholders | $ | (26,772) | | | $ | (96,656) | | | $ | 35,004 | |
| Reallocation of comprehensive income (loss) upon conversion of noncontrolling interests | |
| Comprehensive income attributable to stockholders | |
See notes to consolidated financial statements.
| | | | | | | | | | | |
| PHILLIPS EDISON & COMPANY DECEMBER 31, 2023 FORM 10-K | | | F-5 |
PHILLIPS EDISON & COMPANY, INC.
CONSOLIDATED STATEMENTS OF EQUITY
FOR THE YEARS ENDED DECEMBER 31, 2020, 2019,2023, 2022, AND 20182021
(In thousands, except per share amounts)
| | | | | | | | | | | | | | | | | | | | | | | | | | | | | | | | | | | | | | | | | | | | | | | |
| | Common Stock | | APIC | | AOCI | | Accumulated Deficit | | Total Stockholders’ Equity | | Non-Controlling Interests | | Total Equity |
| | Shares | | Amount | | | | | | |
| Balance at January 1, 2018 | 185,233 | | | $ | 1,852 | | | $ | 1,629,130 | | | $ | 16,496 | | | $ | (601,238) | | | $ | 1,046,240 | | | $ | 432,442 | | | $ | 1,478,682 | |
| Issuance of common stock for acquisition | 95,452 | | | 955 | | | 1,053,790 | | | — | | | — | | | 1,054,745 | | | — | | | 1,054,745 | |
| Dividend reinvestment plan (“DRIP”) | 3,997 | | | 40 | | | 44,031 | | | — | | | — | | | 44,071 | | | — | | | 44,071 | |
| Share repurchases | (4,884) | | | (49) | | | (53,709) | | | — | | | — | | | (53,758) | | | — | | | (53,758) | |
Change in unrealized value on interest
rate swaps | — | | | — | | | — | | | (4,134) | | | — | | | (4,134) | | | (22) | | | (4,156) | |
Common distributions declared, $0.67 per share | — | | | — | | | — | | | — | | | (129,945) | | | (129,945) | | | — | | | (129,945) | |
| Distributions to noncontrolling interests | — | | | — | | | — | | | — | | | — | | | — | | | (28,661) | | | (28,661) | |
| Share-based compensation | 5 | | | — | | | 1,783 | | | — | | | — | | | 1,783 | | | 3,315 | | | 5,098 | |
| Other | — | | | — | | | (154) | | | — | | | — | | | (154) | | | 0 | | | (154) | |
| Net income | — | | | — | | | — | | | — | | | 39,138 | | | 39,138 | | | 7,837 | | | 46,975 | |
| Balance at December 31, 2018 | 279,803 | | | 2,798 | | | 2,674,871 | | | 12,362 | | | (692,045) | | | 1,997,986 | | | 414,911 | | | 2,412,897 | |
Adoption of Accounting Standards Codification Topic 842, Leases | — | | | — | | | — | | | — | | | (528) | | | (528) | | | — | | | (528) | |
| Balance at January 1, 2019 as adjusted | 279,803 | | | 2,798 | | | 2,674,871 | | | 12,362 | | | (692,573) | | | 1,997,458 | | | 414,911 | | | 2,412,369 | |
| Issuance of common stock for acquisition, net | 4,516 | | | 45 | | | 49,891 | | | — | | | — | | | 49,936 | | | — | | | 49,936 | |
| DRIP | 6,086 | | | 60 | | | 67,367 | | | — | | | — | | | 67,427 | | | — | | | 67,427 | |
| Share repurchases | (3,311) | | | (33) | | | (35,930) | | | — | | | — | | | (35,963) | | | — | | | (35,963) | |
Change in unrealized value on interest
rate swaps | — | | | — | | | — | | | (33,124) | | | — | | | (33,124) | | | (5,150) | | | (38,274) | |
Common distributions declared, $0.67 per share | — | | | — | | | — | | | — | | | (191,147) | | | (191,147) | | | — | | | (191,147) | |
| Distributions to noncontrolling interests | — | | | — | | | — | | | — | | | — | | | — | | | (30,444) | | | (30,444) | |
| Share-based compensation | 65 | | | 1 | | | 2,051 | | | — | | | — | | | 2,052 | | | 5,664 | | | 7,716 | |
| Conversion of noncontrolling interests | 1,888 | | | 19 | | | 20,880 | | | — | | | — | | | 20,899 | | | (20,899) | | | — | |
| Net loss | — | | | — | | | — | | | — | | | (63,532) | | | (63,532) | | | (9,294) | | | (72,826) | |
| Balance at December 31, 2019 | 289,047 | | | 2,890 | | | 2,779,130 | | | (20,762) | | | (947,252) | | | 1,814,006 | | | 354,788 | | | 2,168,794 | |
| DRIP | 1,436 | | | 14 | | | 15,926 | | | — | | | — | | | 15,940 | | | — | | | 15,940 | |
| Share repurchases | (13,746) | | | (138) | | | (80,260) | | | — | | | — | | | (80,398) | | | — | | | (80,398) | |
Change in unrealized value on interest
rate swaps | — | | | — | | | — | | | (29,469) | | | — | | | (29,469) | | | (4,351) | | | (33,820) | |
Common distributions declared, $0.19 per share | — | | | — | | | — | | | — | | | (57,011) | | | (57,011) | | | — | | | (57,011) | |
| Distributions to noncontrolling interests | — | | | — | | | — | | | — | | | — | | | — | | | (8,255) | | | (8,255) | |
| Share-based compensation | 109 | | | 2 | | | 3,708 | | | — | | | — | | | 3,710 | | | 2,151 | | | 5,861 | |
| Conversion of noncontrolling interests | 2,990 | | | 30 | | | 18,056 | | | — | | | — | | | 18,086 | | | (18,086) | | | — | |
| Reallocation of operating partnership interests | — | | | — | | | 3,442 | | | (2,075) | | | — | | | 1,367 | | | (1,367) | | | — | |
| Other | — | | | — | | | (644) | | | — | | | — | | | (644) | | | 0 | | | (644) | |
| Net income | — | | | — | | | — | | | — | | | 4,772 | | | 4,772 | | | 690 | | | 5,462 | |
| Balance at December 31, 2020 | 279,836 | | | $ | 2,798 | | | $ | 2,739,358 | | | $ | (52,306) | | | $ | (999,491) | | | $ | 1,690,359 | | | $ | 325,570 | | | $ | 2,015,929 | |
| | | | | | | | | | | | | | | | | | | | | | | | | | | | | | | | | | | | | | | | | | | | | | | | | | | | | | | | | | | |
| | Common Stock | | Class B Common Stock | | APIC | | AOCI | | Accumulated Deficit | | Total Stockholders’ Equity | | Noncontrolling Interests | | Total Equity |
| | Shares | | Amount | | Shares | | Amount | | | | | | |
| Balance at January 1, 2021 | — | | | $ | — | | | 93,279 | | | $ | 2,798 | | | $ | 2,739,358 | | | $ | (52,306) | | | $ | (999,491) | | | $ | 1,690,359 | | | $ | 325,570 | | | $ | 2,015,929 | |
| Issuance of common stock | 19,550 | | | 196 | | | — | | | — | | | 547,205 | | | — | | | — | | | 547,401 | | | — | | | 547,401 | |
| Offering costs, discounts, and commissions | — | | | — | | | — | | | — | | | (39,048) | | | — | | | — | | | (39,048) | | | — | | | (39,048) | |
| Dividend reinvestment plan (“DRIP”) | — | | | — | | | 280 | | | 8 | | | 7,360 | | | — | | | — | | | 7,368 | | | — | | | 7,368 | |
| Share repurchases | — | | | — | | | (24) | | | — | | | (123) | | | — | | | — | | | (123) | | | — | | | (123) | |
| Change in unrealized value on interest rate swaps | — | | | — | | | — | | | — | | | — | | | 27,500 | | | — | | | 27,500 | | | 4,500 | | | 32,000 | |
| Common distributions declared, $1.035 per share | — | | | — | | | — | | | — | | | — | | | — | | | (106,467) | | | (106,467) | | | — | | | (106,467) | |
| Distributions to noncontrolling interests | — | | | — | | | — | | | — | | | — | | | — | | | — | | | — | | | (14,332) | | | (14,332) | |
| Share-based compensation | — | | | — | | | 102 | | | 1 | | | 6,753 | | | — | | | — | | | 6,754 | | | 9,640 | | | 16,394 | |
| Conversion of noncontrolling interests | — | | | — | | | 28 | | | — | | | 691 | | | (13) | | | — | | | 678 | | | (678) | | | — | |
| Impact of reverse stock split | — | | | — | | | — | | | (1,871) | | | 1,871 | | | — | | | — | | | — | | | — | | | — | |
| Other | — | | | — | | | — | | | — | | | (29) | | | — | | | — | | | (29) | | | — | | | (29) | |
| Net income | — | | | — | | | — | | | — | | | — | | | — | | | 15,121 | | | 15,121 | | | 2,112 | | | 17,233 | |
| Balance at December 31, 2021 | 19,550 | | | 196 | | | 93,665 | | | 936 | | | 3,264,038 | | | (24,819) | | | (1,090,837) | | | 2,149,514 | | | 326,812 | | | 2,476,326 | |
| Conversion of Class B common stock | 93,665 | | | 936 | | | (93,665) | | | (936) | | | — | | | — | | | — | | | — | | | — | | | — | |
| Issuance of common stock | 2,633 | | | 26 | | | — | | | — | | | 90,098 | | | — | | | — | | | 90,124 | | | — | | | 90,124 | |
| Offering costs, discounts, and commissions | — | | | — | | | — | | | — | | | (1,090) | | | — | | | — | | | (1,090) | | | — | | | (1,090) | |
| Change in unrealized value on interest rate swaps | — | | | — | | | — | | | — | | | — | | | 45,549 | | | — | | | 45,549 | | | 5,736 | | | 51,285 | |
Common distributions declared, $1.0932 per share | — | | | — | | | — | | | — | | | — | | | — | | | (127,151) | | | (127,151) | | | — | | | (127,151) | |
| Distributions to noncontrolling interests | — | | | — | | | — | | | — | | | — | | | — | | | — | | | — | | | (16,241) | | | (16,241) | |
| Share-based compensation | 109 | | | 1 | | | — | | | — | | | 5,528 | | | — | | | — | | | 5,529 | | | 9,877 | | | 15,406 | |
| Conversion of noncontrolling interests | 1,169 | | | 12 | | | — | | | — | | | 25,404 | | | 273 | | | — | | | 25,689 | | | (25,689) | | | — | |
| Settlement of earn-out liability | — | | | — | | | — | | | — | | | — | | | — | | | — | | | — | | | 54,245 | | | 54,245 | |
| Net income | — | | | — | | | — | | | — | | | — | | | — | | | 48,323 | | | 48,323 | | | 6,206 | | | 54,529 | |
| Balance at December 31, 2022 | 117,126 | | | 1,171 | | | — | | | — | | | 3,383,978 | | | 21,003 | | | (1,169,665) | | | 2,236,487 | | | 360,946 | | | 2,597,433 | |
| Issuance of common stock | 4,170 | | | 42 | | | — | | | — | | | 150,793 | | | — | | | — | | | 150,835 | | | — | | | 150,835 | |
| Offering costs, discounts, and commissions | — | | | — | | | — | | | — | | | (1,939) | | | — | | | — | | | (1,939) | | | — | | | (1,939) | |
| Change in unrealized value on interest rate swaps | — | | | — | | | — | | | — | | | — | | | (10,551) | | | — | | | (10,551) | | | (1,265) | | | (11,816) | |
| Common distributions declared, $1.1364 per share | — | | | — | | | — | | | — | | | — | | | — | | | (135,456) | | | (135,456) | | | — | | | (135,456) | |
| Distributions to noncontrolling interests | — | | | — | | | — | | | — | | | — | | | — | | | — | | | — | | | (16,334) | | | (16,334) | |
| Share-based compensation | 211 | | | 2 | | | — | | | — | | | 1,164 | | | — | | | — | | | 1,166 | | | 5,700 | | | 6,866 | |
| Conversion of noncontrolling interests | 517 | | | 5 | | | — | | | — | | | 12,842 | | | 71 | | | — | | | 12,918 | | | (12,918) | | | — | |
| Net income | — | | | — | | | — | | | — | | | — | | | — | | | 56,848 | | | 56,848 | | | 6,914 | | | 63,762 | |
| Balance at December 31, 2023 | 122,024 | | | $ | 1,220 | | | — | | | $ | — | | | $ | 3,546,838 | | | $ | 10,523 | | | $ | (1,248,273) | | | $ | 2,310,308 | | | $ | 343,043 | | | $ | 2,653,351 | |
See notes to consolidated financial statements.
| | | | | | | | | | | |
| PHILLIPS EDISON & COMPANY DECEMBER 31, 2023 FORM 10-K | | | F-6 |
PHILLIPS EDISON & COMPANY, INC.
CONSOLIDATED STATEMENTS OF CASH FLOWS
FOR THE YEARS ENDED DECEMBER 31, 2020, 20192023, 2022, AND 20182021
(In thousands)
| | | | 2020 | | 2019 | | 2018 | | 2023 | | 2022 | | 2021 |
| CASH FLOWS FROM OPERATING ACTIVITIES: | CASH FLOWS FROM OPERATING ACTIVITIES: | | | | | | CASH FLOWS FROM OPERATING ACTIVITIES: | | | |
| Net income (loss) | $ | 5,462 | | | $ | (72,826) | | | $ | 46,975 | |
| Adjustments to reconcile net income (loss) to net cash provided by operating activities: | | | | | |
| Net income | |
| Adjustments to reconcile net income to net cash provided by operating activities: | | Adjustments to reconcile net income to net cash provided by operating activities: | | | |
| Depreciation and amortization of real estate assets | Depreciation and amortization of real estate assets | 218,738 | | | 231,023 | | | 177,504 | |
| Impairment of real estate assets | Impairment of real estate assets | 2,423 | | | 87,393 | | | 40,782 | |
| Depreciation and amortization of corporate assets | Depreciation and amortization of corporate assets | 5,941 | | | 5,847 | | | 13,779 | |
| Net amortization of above- and below-market leases | Net amortization of above- and below-market leases | (3,173) | | | (4,185) | | | (3,949) | |
| Amortization of deferred financing expenses | Amortization of deferred financing expenses | 4,975 | | | 5,060 | | | 4,682 | |
| Amortization of debt and derivative adjustments | Amortization of debt and derivative adjustments | 2,444 | | | 7,514 | | | (625) | |
| Loss (gain) on extinguishment or modification of debt, net | Loss (gain) on extinguishment or modification of debt, net | 4 | | | 2,238 | | | (93) | |
| Gain on sale or contribution of property, net | (6,494) | | | (28,170) | | | (109,300) | |
| Change in fair value of earn-out liability and derivatives | (10,000) | | | (7,500) | | | 2,393 | |
| Gain on disposal of property, net | |
| Impairment of investment in third parties | |
| Change in fair value of earn-out liability | |
| Straight-line rent | Straight-line rent | (3,325) | | | (9,079) | | | (5,112) | |
| Share-based compensation | Share-based compensation | 5,861 | | | 7,716 | | | 5,098 | |
| Other impairment charges | 359 | | | 9,661 | | | 0 | |
| Return on investment in unconsolidated joint ventures | Return on investment in unconsolidated joint ventures | 1,962 | | | 3,922 | | | 0 | |
| Other | Other | 1,287 | | | 540 | | | 1,039 | |
| Changes in operating assets and liabilities: | Changes in operating assets and liabilities: | | | | | | Changes in operating assets and liabilities: | | | |
| Other assets, net | Other assets, net | (6,945) | | | 1,271 | | | (7,334) | |
| Accounts payable and other liabilities | Accounts payable and other liabilities | (8,943) | | | (13,550) | | | (12,548) | |
| Net cash provided by operating activities | Net cash provided by operating activities | 210,576 | | | 226,875 | | | 153,291 | |
| CASH FLOWS FROM INVESTING ACTIVITIES: | CASH FLOWS FROM INVESTING ACTIVITIES: | | | | | | CASH FLOWS FROM INVESTING ACTIVITIES: | | | |
| Real estate acquisitions | Real estate acquisitions | (41,482) | | | (71,722) | | | (87,068) | |
| Capital expenditures | Capital expenditures | (63,965) | | | (75,492) | | | (48,980) | |
| Proceeds from sale of real estate | 57,902 | | | 223,083 | | | 78,654 | |
| Distributions and proceeds from unconsolidated joint ventures | 3,453 | | | 5,310 | | | 162,046 | |
| Acquisition of REIT III, net of cash acquired | 0 | | | (16,996) | | | 0 | |
| Acquisition of REIT II, net of cash acquired | 0 | | | 0 | | | (363,519) | |
| Net cash (used in) provided by investing activities | (44,092) | | | 64,183 | | | (258,867) | |
| Proceeds from sale of real estate, net | |
| Investment in third parties | |
| Return of investment in unconsolidated joint ventures | |
| Investment in marketable securities | |
| Proceeds from sale of marketable securities | |
| Insurance proceeds for property damage claims | |
| Net cash used in investing activities | |
| CASH FLOWS FROM FINANCING ACTIVITIES: | CASH FLOWS FROM FINANCING ACTIVITIES: | | | | | | CASH FLOWS FROM FINANCING ACTIVITIES: | | | |
| Proceeds from the issuance of common stock | |
| Payment of offering costs | |
| Repurchases of Class B common stock | |
| Proceeds from revolving credit facility | Proceeds from revolving credit facility | 255,000 | | | 122,641 | | | 475,357 | |
| Payments on revolving credit facility | Payments on revolving credit facility | (255,000) | | | (196,000) | | | (463,567) | |
| Proceeds from mortgages and loans payable | 0 | | | 260,000 | | | 622,500 | |
| Proceeds from notes and loans payable | |
| Payments on mortgages and loans payable | Payments on mortgages and loans payable | (64,848) | | | (275,710) | | | (301,669) | |
| Payments on deferred financing expenses | (130) | | | (3,696) | | | (7,655) | |
| Distributions paid, net of DRIP | Distributions paid, net of DRIP | (49,331) | | | (123,135) | | | (80,728) | |
| Distributions to noncontrolling interests | Distributions to noncontrolling interests | (9,435) | | | (29,679) | | | (28,650) | |
| Repurchases of common stock | (5,267) | | | (34,675) | | | (53,153) | |
| Other | Other | (644) | | | 0 | | | 0 | |
| Net cash (used in) provided by financing activities | (129,655) | | | (280,254) | | | 162,435 | |
| NET INCREASE IN CASH, CASH EQUIVALENTS, AND RESTRICTED CASH | 36,829 | | | 10,804 | | | 56,859 | |
| Net cash provided by (used in) financing activities | |
| NET DECREASE IN CASH, CASH EQUIVALENTS, AND RESTRICTED CASH | |
| CASH, CASH EQUIVALENTS, AND RESTRICTED CASH: | CASH, CASH EQUIVALENTS, AND RESTRICTED CASH: | | | | | | CASH, CASH EQUIVALENTS, AND RESTRICTED CASH: | | | |
| Beginning of year | Beginning of year | 95,108 | | | 84,304 | | | 27,445 | |
| End of year | End of year | $ | 131,937 | | | $ | 95,108 | | | $ | 84,304 | |
| | RECONCILIATION TO CONSOLIDATED BALANCE SHEETS | RECONCILIATION TO CONSOLIDATED BALANCE SHEETS | |
| RECONCILIATION TO CONSOLIDATED BALANCE SHEETS | |
| RECONCILIATION TO CONSOLIDATED BALANCE SHEETS | |
| Cash and cash equivalents | |
| Cash and cash equivalents | |
| Cash and cash equivalents | Cash and cash equivalents | $ | 104,296 | | | $ | 17,820 | | | $ | 16,791 | |
| Restricted cash | Restricted cash | 27,641 | | | 77,288 | | | 67,513 | |
| Cash, cash equivalents, and restricted cash at end of year | Cash, cash equivalents, and restricted cash at end of year | $ | 131,937 | | | $ | 95,108 | | | $ | 84,304 | |
| | | | | | | | | | | |
| PHILLIPS EDISON & COMPANY DECEMBER 31, 2023 FORM 10-K | | | F-7 |
| | | | | | | | | | | | | | | | | |
| | 2020 | | 2019 | | 2018 |
| SUPPLEMENTAL CASH FLOW DISCLOSURE, INCLUDING NON-CASH INVESTING AND FINANCING ACTIVITIES: |
| Cash paid for interest | $ | 78,521 | | | $ | 89,373 | | | $ | 67,556 | |
| Cash paid (refund) for income taxes, net | 947 | | | 589 | | | (146) | |
| Obligation for shares tendered pursuant to a tender offer | 77,642 | | | 0 | | | 0 | |
Right-of-use (“ROU”) assets obtained in exchange for new
lease liabilities | 561 | | | 4,772 | | | 739 | |
| Accrued capital expenditures | 4,394 | | | 6,299 | | | 2,798 | |
| Change in distributions payable | (8,260) | | | 585 | | | 5,146 | |
| Change in distributions payable - noncontrolling interests | (1,180) | | | 765 | | | 11 | |
| Change in accrued share repurchase plan obligation | (2,511) | | | 1,288 | | | 605 | |
| Distributions reinvested | 15,940 | | | 67,427 | | | 44,071 | |
| Fair value of assumed debt from individual real estate acquisitions | 0 | | | 0 | | | 11,877 | |
| Debt contributed to joint venture | 0 | | | 0 | | | 175,000 | |
| Property contributed to joint venture, net | 0 | | | 0 | | | 273,790 | |
| Amounts related to the merger of GRP I and GRP II: | | | | | |
| Ownership interest in fair value of assets assumed | 5,062 | | | 0 | | | 0 | |
| Ownership interest in GRP II contributed to GRP I | (5,105) | | | 0 | | | 0 | |
| Amounts related to the acquisition of REIT III and REIT II: | | | | | |
| Fair value of assumed debt | 0 | | | 0 | | | 464,462 | |
| Fair value of equity issued | 0 | | | 49,936 | | | 1,054,745 | |
| Net settlement of related party receivables | 0 | | | 2,246 | | | 0 | |
Derecognition of management contracts intangible asset and
related party investment | 0 | | | 1,601 | | | 30,428 | |
FOR THE YEARS ENDED DECEMBER 31, 2023, 2022, AND 2021
(In thousands)
| | | | | | | | | | | | | | | | | |
| | 2023 | | 2022 | | 2021 |
| SUPPLEMENTAL DISCLOSURE OF CASH FLOW INFORMATION: |
| Cash paid for interest | $ | 76,479 | | | $ | 65,096 | | | $ | 68,092 | |
| Cash paid for income taxes, net | 689 | | | 194 | | | 559 | |
| SUPPLEMENTAL SCHEDULE OF NON-CASH ACTIVITIES: |
| Settlement of earn-out liability | — | | | 54,245 | | | — | |
| Right-of-use (“ROU”) assets obtained in exchange for new lease liabilities | 887 | | | 36 | | | 902 | |
| Accrued capital expenditures | 9,892 | | | 9,834 | | | 6,443 | |
| Receivable from issuance of common stock | 1,700 | | | — | | | — | |
| Investment in third party | — | | | 6,800 | | | — | |
| Contribution of corporate assets | — | | | (4,304) | | | — | |
| Assumed debt obligations, net | 9,614 | | | — | | | — | |
| Assumed below-market debt | 444 | | | — | | | — | |
| Above-market contract | — | | | (2,496) | | | — | |
| Change in distributions payable | (293) | | | 68 | | | (7,600) | |
| Change in distributions payable - noncontrolling interests | 338 | | | (615) | | | (650) | |
| Distributions reinvested | — | | | — | | | 7,368 | |
See notes to consolidated financial statements.
| | | | | | | | | | | |
| PHILLIPS EDISON & COMPANY DECEMBER 31, 2023 FORM 10-K | | | F-8 |
Phillips Edison & Company, Inc.
Notes to Consolidated Financial Statements
For the Years Ended December 31, 2020, 2019, and 2018
Phillips Edison & Company, Inc. (“we,” the “Company,” “PECO,” “our,” or “us”) was formed as a Maryland corporation in October 2009. Substantially all of our business is conducted through Phillips Edison Grocery Center Operating Partnership I, L.P., (the “Operating Partnership”), a Delaware limited partnership formed in December 2009. We are a limited partner of the Operating Partnership, and our wholly ownedwholly-owned subsidiary, Phillips Edison Grocery Center OP GP I LLC, is the sole general partner of the Operating Partnership.
We are a real estate investment trust (“REIT”) that invests primarily in well-occupied,omni-channel grocery-anchored neighborhood and community shopping centers that have a mix of creditworthy national, regional, and local retailers that sell necessity-based goods and services in strong demographic markets throughout the United States. In addition to managing our own shopping centers, our third-party investment management business provides comprehensive real estate and asset management services to two unconsolidated institutional joint ventures, in which we retain ahave partial ownership interest,interests, and one private fund (collectively, the “Managed Funds”).
On October 1, 2020,As of December 31, 2023, we wholly-owned 281 real estate properties. Additionally, we owned a 14% interest in Grocery Retail Partners I LLC (“GRP I”), a joint venture with Northwestern Mutual Life Insurance Companywhich owned 20 properties.
On July 19, 2021, we closed our underwritten initial public offering (“Northwestern Mutual”underwritten IPO”) in, through which we ownissued 19.6 million shares, including the underwriters’ overallotment election, of a new class of common stock, $0.01 par value per share, at an equity interest, acquired Grocery Retail Partners II LLC (“GRP II”), an additional joint venture with Northwestern Mutual in which we owned an equity interest. Our ownership ininitial price to the combined entity was adjusted upon consummationpublic of the transaction, and we own approximately a 14% interest in GRP I as$28.00 per share. As a result of the acquisition.underwritten IPO, we received gross proceeds of $547.4 million.
In November 2018, we completedThe basis of presentation of our shares of common stock is described as follows:
•Reverse Stock Split—On July 2, 2021, our board of directors (the “Board”) approved an amendment to our charter to effect a merger (the “Merger”)one-for-three reverse stock split. Concurrent with Phillips Edison Grocery Center REIT II, Inc.the reverse split, the Operating Partnership enacted a one-for-three reverse split of its outstanding Operating Partnership units (“REIT II”OP units”), a public non-traded REIT that was advised. Unless otherwise indicated, the information in this Form 10-K gives effect to the reverse stock and managed by usOP unit splits (see Note 4)12).
•Recapitalization—On June 18, 2021, our stockholders approved an amendment to our charter (the “Articles of Amendment”) that effected a change of each share of our common stock outstanding at the time the amendment became effective into one share of a newly created class of Class B common stock (the “Recapitalization”). The Articles of Amendment became effective upon filing with, and acceptance by, the State Department of Assessments and Taxation of Maryland on July 2, 2021. Unless otherwise indicated, all information in this Form 10-K gives effect to the Recapitalization and references to “shares” and per share metrics refer to our common stock and Class B common stock, collectively. Our Class B common stock automatically converted into our publicly traded common stock on January 18, 2022 (see Note 12). Prior to the conversion, we have presented common stock and Class B common stock as separate classes within our consolidated balance sheets and consolidated statements of equity. On May 5, 2022, we filed Articles Supplementary to our charter with the Maryland State Department of Assessments and Taxation in order to reclassify and designate all of the 350 million authorized shares of our Class B common stock, $0.01 par value per share, all of which were unissued at such time, as shares of our common stock, $0.01 par value per share. We no longer have Class B common stock authorized for issue.
•In October 2021, the same month, we also contributed or sold 17 propertiesOperating Partnership completed the registered offering of $350 million aggregate principal amount of 2.625% senior notes (“2021 Bond Offering”) priced at 98.692% of the principal amount and maturing in the formationNovember 2031. The 2021 Bond Offering resulted in gross proceeds of GRP I; see Note 7 for more detail.
As of December 31, 2020, we wholly-owned 283 real estate properties. Additionally, we owned a 20% equity interest in Necessity Retail Partners (“NRP”), a joint venture that owned 5 properties,$345.4 million. The notes are fully and a 14% interest in GRP I, which owned 20 properties.unconditionally guaranteed by us.
| | |
| 2. SUMMARY OF SIGNIFICANT ACCOUNTING POLICIES |
Set forth below is a summary of the significant accounting estimates and policies that management believes are important to the preparation of our consolidated financial statements. Certain of our accounting estimates are particularly important for an understanding of our financial position and results of operations and require the application of significant judgment by management. For example, significant estimates and assumptions have been made with respect to the useful lives of assets, remaining hold periods of assets, recoverable amounts of receivables, and other fair value measurement assessments required for the preparation of the consolidated financial statements. As a result, these estimates are subject to a degree of uncertainty.
During the first quarter of 2020, a novel coronavirus (“COVID-19”) began spreading globally, with the outbreak being classified as a pandemic by the World Health Organization on March 11, 2020. Because of the adverse economic conditions that exist as a result of the impacts of the COVID-19 pandemic, it is possible that the estimates and assumptions that have been utilized in the preparation of the consolidated financial statements could change significantly. Specifically, as it relates to our business, the current economic situation resulted in temporary tenant closures at our shopping centers, often as a result of “stay-at-home” government mandates which limited travel and movement of the general public to essential activities only and required all non-essential businesses to close.
Temporary closures of tenant spaces at our centers peaked in April 2020 and have significantly decreased as states reduced or removed restrictions on business operations and the travel and movement of the general public. Certain tenants remain temporarily closed, have since closed after reopening, are limiting the number of customers allowed in their stores, or have modified their operations in other ways that may impact their profitability, either as a result of government mandates or self-elected efforts to reduce the spread of COVID-19. These actions could result in increased permanent store closings and could reduce the demand for leasing space in our shopping centers and result in a decline in occupancy and rental revenues in our estate portfolio. All of this activity impacts our estimates around the collectibility of revenue and valuation of real estate assets, goodwill and other intangible assets, and certain liabilities, among others.
Basis of Presentation and Principles of Consolidation—The accompanying consolidated financial statements include our accounts and the accounts of the Operating Partnership and its wholly-owned subsidiaries (over which we exercise financial and operating control). The financial statements of the Operating Partnership are prepared using accounting policies consistent with our accounting policies. All intercompany balances and transactions are eliminated upon consolidation.
Use of Estimates—The preparation of the consolidated financial statements in conformity with U.S.accounting principles generally accepted accounting principlesin the United States (“GAAP”) requires management to make estimates and assumptions that affect the reported amounts of assets and liabilities and the disclosure of contingent assets and liabilities at the date of the consolidated financial statements and the reported amounts of revenues and expenses during the reporting periods. For example, significant estimates and assumptions have been made with respect to the useful lives of assets; remaining hold periods of assets; recoverable amounts of receivables; initial valuations of tangible and intangible assets and liabilities, including goodwill, and
| | | | | | | | | | | |
| PHILLIPS EDISON & COMPANY DECEMBER 31, 2023 FORM 10-K | | | F-9 |
related amortization periods of deferred costs and intangibles, particularly with respect to property acquisitions; the valuation and nature of
derivatives and their effectiveness as hedges; valuations of contingent consideration; and other fair value measurement assessments required for the preparation of the consolidated financial statements. Actual results could differ from those estimates.
Stock Issuance Costs—Stock issuance costs are offset against stock issuance proceeds and capitalized as a component of APIC on the consolidated balance sheets. We had stock issuance costs of approximately $1.9 million, $1.1 million, and $39.0 million for the years ended December 31, 2023, 2022, and 2021, respectively.
Other costs and expenses indirectly related to stock issuance activities are not capitalized and are included as expense on our consolidated statements of operations and comprehensive income (“consolidated statements of operations”). For the year ended December 31, 2021, we incurred other indirect costs and expenses related to our underwritten IPO of $4.3 million, which included grants of restricted stock units (“RSUs”), that were expensed and included as transaction costs in Other Expense, Net on our consolidated statements of operations.
Partially-Owned Entities—If we determine that we are an owner in a variable-interest entity (“VIE”), and we hold a controlling financial interest, then we will consolidate the entity as the primary beneficiary. For a partially-owned entity determined not to be a VIE, we analyze rights held by each partner to determine which would be the consolidating party. We will generally consolidate entities (in the absence of other factors when determining control) when we have over a 50% ownership interest in the entity. We will assess our interests in VIEs on an ongoing basis to determine whether or not we are the primary beneficiary. However, we will also evaluate who controls the entity even in circumstances in which we have greater than a 50% ownership interest. If we do not control the entity due to the lack of decision-making abilities, we will not consolidate the entity. We have determined that the Operating Partnership is considered a VIE. We are the primary beneficiary of the VIE, and our partnership interest is considered a majority voting interest. As such, we have consolidated the Operating Partnership and its wholly-owned subsidiaries. Further, as we hold a majority voting interest in the Operating Partnership, we qualify for the exemption from providing certain of the disclosure requirements associated with variable interest entities.
Additionally, an Internal Revenue Code (“IRC”)a Section 1031 like-kind exchange (“Section 1031 Exchange”) pursuant to the Internal Revenue Code of 1986, as amended (the “IRC”), entails selling one property and reinvesting the proceeds in one or more properties that are similar in nature, character, or class within 180 days. A reverse Section 1031 Exchange occurs when one or more properties is purchased prior to selling one property to be matched in the like-kind exchange, during which time legal title to the purchased property is held by an intermediary. Because we retain essentially all of the legal and economic benefits and obligations related to the acquisition, we consider the purchased property in a reverse Section 1031 Exchange to be a VIE, and therefore, we will consolidate the entity as the primary beneficiary in these instances.
Noncontrolling Interests—Noncontrolling interests represent the portion of equity that we do not own in the entities we consolidate. We classify noncontrolling interests within permanent equity on our consolidated balance sheets. The amounts of consolidated net earnings attributable to us and to the noncontrolling interests are presented separately on our consolidated statements of operations and comprehensive (loss) income, also referred to herein as our “consolidated statements of operations”.operations. For additional information regarding noncontrolling interests, refer to Note 13.12.
Cash and Cash Equivalents—We consider all highly liquid investments purchased with an original maturity of three months or less to be cash equivalents. Cash equivalents may include cash and short-term investments. Short-term investments are stated at cost, which approximates fair value and may consist of investments in money market accounts and money market funds. From time to time, the cash and cash equivalent balances at one or more of our financial institutions may exceed the Federal Depository Insurance Corporation coverage.
Restricted Cash—Restricted cash primarily consists of cash restricted for the purpose of facilitating a Section 1031 Exchange, escrowed tenant improvement funds, real estate taxes, capital improvement funds, insurance premiums, and other amounts required to be escrowed pursuant to loan agreements. AsDuring 2023, we did not sell any properties as part of December 31, 2020 and 2019,facilitating a Section 1031 Exchange that remained open at the end of the year. During 2022, we had 2 and 6sold two properties sold, respectively, as part of facilitating a Section 1031 Exchange that remained open at the end of the year. The net proceeds of these sales were held as restricted cash with a qualified intermediary totaled $10.3 million and $22.4 million, respectively. The $10.3 million held as restricted cash as of December 31, 2020 has since been released. As of December 31, 2019, we had $38.1 million of restricted cash associated with asset substitutions related to one of our secured debt facilities to facilitate the sale of one of our shopping centers. This cash was released in January 2020.totaling $1.7 million.
Investment in Property and Lease Intangibles—We apply Accounting Standards Codification (“ASC”) Topic 805: Business Combinations (“ASC 805”) when evaluating any purchases of real estate. Under this guidance, generally our real estate acquisition activity is not generally considered a business combination and is instead classified as an asset acquisition. As a result, most acquisition-related costs are capitalized and amortized over the life of the related assets, and there is no recognition of goodwill. None of our real estate acquisitions in 20202023 and 20192022 met the definition of a business; therefore, we accounted for all as asset acquisitions.
Real estate assets are stated at cost less accumulated depreciation. The majority of acquisition-related costs are capitalized and allocated to the various classes of assets acquired. These costs are then depreciated over the estimated useful lives associated with the assets acquired. Depreciation is computed using the straight-line method. The estimated useful lives for computing depreciation are generally not to exceed 5-7 years for furniture, fixtures, and equipment, 15 years for land improvements, and 30 years for buildings and building improvements. Tenant improvements are amortized over the shorter of the respective lease term or the expected useful life of the asset. Major replacements that extend the useful lives of the assets are capitalized, and maintenance and repair costs are expensed as incurred.
We assess the acquisition-date fair values of all tangible assets, identifiable intangibles, and assumed liabilities using methods similar to those used by independent appraisers (e.g., discounted cash flow analysis, sales comparison approach, and replacement cost approach) and that utilize appropriate discount and/or capitalization rates and available market information. Estimates of future cash flows are based on a number of factors including historical operating results, known and anticipated trends, and market and economic conditions. The fair value of tangible assets of an acquired property considers the value of the property as if it were vacant.
The fair values of buildings and improvements are determined on an as-if-vacant basis. The estimated fair value of acquired in-place leases is the cost we would have incurred to lease the properties to the occupancy level of the properties at the date
| | | | | | | | | | | |
| PHILLIPS EDISON & COMPANY DECEMBER 31, 2023 FORM 10-K | | | F-10 |
of acquisition. Such estimates include leasing commissions, legal costs, and other direct costs that would be incurred to lease the properties to such occupancy levels. Additionally, we evaluate the time period over which such occupancy levels would be achieved. Such evaluation includes an estimate of the net market-based rental revenues and net operating costs (primarily consisting of real estate taxes, insurance, and utilities) that would be incurred during the lease-up period. Acquired in-place leases as of the date of acquisition are amortized over the remaining lease terms.
Acquired above- and below-market lease values are recorded based on the present value (using discount rates that reflect the risks associated with the leases acquired) of the difference between the contractual amounts to be paid pursuant to the in-
placein-place leases and management’s estimate of the market lease rates for the corresponding in-place leases. The capitalized above- and below-market lease values are amortized as adjustments to rental income over the remaining terms of the respective leases. We also consider fixed-rate renewal options in our calculation of the fair value of below-market leases and the periods over which such leases are amortized. If a tenant has a unilateral option to renew a below-market lease and we determine that the tenant has a financial incentive to exercise such option, we include such option in the calculation of the fair value of such lease and the period over which the lease is amortized.
We estimate the value of tenant origination and absorption costs by considering the estimated carrying costs during hypothetical expected lease-up periods, considering current market conditions. In estimating carrying costs, management includes real estate taxes, insurance and other operating expenses, and estimates of lost rentals at market rates during the expected lease-up periods.
We estimate the fair value of assumed loans payable based upon indications of then-current market pricing for similar types of debt with similar maturities. Assumed loans payable are initially recorded at their estimated fair value as of the assumption date, and the difference between such estimated fair value and the loan’s outstanding principal balance is amortized over the life of the loan as an adjustment to interest expense. Our accumulated amortization of above- and below-market debt was $2.9$1.8 million and $4.3$0.3 million as of December 31, 20202023 and 2019,2022, respectively.
Real estate assets are reviewed for impairment whenever events or changes in circumstances indicate that the carrying amount of the individual property may not be recoverable. In such an event, a comparison will be made of the projected operating cash flows of each property on an undiscounted basis to the carrying amount of such property. If deemed unrecoverable on an undiscounted basis, such carrying amount would be adjusted, if necessary, to estimated fair values to reflect impairment in the value of the asset. For additional information regarding real estate asset impairments, refer to our fair value measurement accounting policy below.
Goodwill and Other Intangibles—In the case of an acquisition of a business, after identifying all tangible and intangible assets and liabilities, the excess consideration paid over the fair value of the assets and liabilities acquired represents goodwill. We allocate goodwill to the respective reporting units in which such goodwill arises. We evaluate goodwill for impairment when an event occurs or circumstances change that indicate the carrying value may not be recoverable, or at least annually. Our annual testing date is November 30.
The goodwill impairment evaluation is completed using either a qualitative or quantitative approach. Under a qualitative approach, the impairment review for goodwill consists of an assessment of whether it is more-likely-than-not that the reporting unit’s fair value is less than its carrying value, including goodwill. If a qualitative approach indicates it is more likely-than-not that the estimated carrying value of a reporting unit (including goodwill) exceeds its fair value, or if we choose to bypass the qualitative approach for any reporting unit, we perform the quantitative approach described below.
When we perform a quantitative test of goodwill for impairment, we compare the carrying value of a reporting unit with its fair value. If the fair value of the reporting unit exceeds its carrying amount, we do not consider goodwill to be impaired and no further analysis would be required. If the fair value is determined to be less than its carrying value, the amount of goodwill impairment equals the amount by which the reporting unit’s carrying value exceeds its fair value, not to exceed the carrying amount of goodwill.
If impairment indicators arise with respect to non-real estate intangible assets with finite useful lives, we evaluate impairment by comparing the carrying amount of the asset to the estimated future undiscounted cash flows expected to be generated by the asset. If estimated future undiscounted cash flows are less than the carrying amount of the asset, then we estimate the fair value of the asset and compare the estimated fair value to the intangible asset’s carrying value. We recognize anythe shortfall from carrying value as an impairment loss in the current period.
Estimates of fair value used in our evaluation of goodwill and intangible assets are based upon discounted future cash flow projections, relevant competitor multiples, or other acceptable valuation techniques. These techniques are based, in turn, upon all available evidence including level three inputs (see fair value measurement policy below), such as revenue and expense growth rates, estimates of future cash flows, capitalization rates, discount rates, general economic conditions and trends, or other available market data. Our ability to accurately predict future operating results and cash flows and to estimate and determine fair values impacts the timing and recognition of impairments. While we believe our assumptions are reasonable, changes in these assumptions may have a material impact on our financial results. Based on the results of our analysis, we concluded that goodwill was not impaired for the years ended December 31, 20202023 and 2019.2022.
Held for Sale Assets—We consider assets to be held for sale when management believes that a sale is probable within a year. This generally occurs when a sales contract is executed with no substantive contingencies, and the prospective buyer has significant funds at risk. Assets that are classified as held for sale are recorded at the lower of their carrying amount or fair value less cost to sell. For additional information regarding assetsAs of December 31, 2023 and 2022, there were no properties classified as held for sale, refer to Note 5.sale.
Deferred Financing Expenses—Deferred financing expenses are capitalized and amortized on a straight-line basis over the term of the related financing arrangement, which approximates the effective interest method. Deferred financing expenses related to our term loan facilities and mortgages are in Debt Obligations, Net, while deferred financing expenses related to our revolving credit facility are in Other Assets, Net, on our consolidated balance sheets. The accumulated amortization of deferred financing expenses in Debt Obligations, Net was $13.8$15.9 million and $10.8$14.7 million as of December 31, 20202023 and 2019,2022, respectively.
| | | | | | | | | | | |
| PHILLIPS EDISON & COMPANY DECEMBER 31, 2023 FORM 10-K | | | F-11 |
Fair Value Measurement—ASC Topic 820, Fair Value Measurement (“ASC 820”) defines fair value, establishes a framework for measuring fair value in accordance with GAAP, and expands disclosures about fair value measurements. ASC 820 emphasizes that fair value is intended to be a market-based measurement, as opposed to a transaction-specific measurement. Fair value is defined by ASC 820 as the price that would be received at sale for an asset or paid to transfer a liability in an orderly transaction between market participants at the measurement date. Depending on the nature of the asset or liability, various techniques and assumptions can be used to estimate the fair value. Assets and liabilities are measured using inputs from three levels of the fair value hierarchy, as follows:
Level 1—Inputs are quoted prices (unadjusted) in active markets for identical assets or liabilities that we have the ability to access at the measurement date. An active market is defined as a market in which transactions for the assets or liabilities occur with sufficient frequency and volume to provide pricing information on an ongoing basis.
Level 2—Inputs include quoted prices for similar assets and liabilities in active markets, quoted prices for identical or similar assets or liabilities in markets that are not active (markets with few transactions), inputs other than quoted prices that are observable for the asset or liability (i.e., interest rates, yield curves, etc.), and inputs that are derived principally from or corroborated by observable market data correlation or other means (market corroborated inputs).
Level 3—Unobservable inputs, only used to the extent that observable inputs are not available, reflect our assumptions about the pricing of an asset or liability.
Considerable judgment is necessary to develop estimated fair values of financial and non-financial assets and liabilities. Accordingly, the estimates presented herein are not necessarily indicative of the amounts we did or could actually realize upon disposition of the financial assets and liabilities previously sold or currently held.
On a quarterly basis, we employ a multi-step approach to assess our real estate assets for possible impairment and record any impairment charges identified. The first step is the identification of potential triggering events, such as significant decreases in occupancy or the presence of large unleaseddark or vacant spaces. If we observe any of these indicators for a shopping center, we then perform an additional screen test consisting of a years-to-recover analysis to determine if we will recover the net book value of the property over its remaining economic life based upon net operating income (“NOI”) as forecasted for the current year. In the event that the results of this first step indicate a triggering event for a center, we proceed to the second step, utilizing an undiscounted cash flow model for the center to identify potential impairment. If the undiscounted cash flows directly associated with the use and ultimate disposition of the center are less than the net book value of the center as of the balance sheet date, we record an impairment charge based on the fair value determined in the third step. In performing the third step, we utilize market data such as capitalization rates and sales price per square foot on comparable recent real estate transactions to estimate the fair value of the real estate assets. We also utilize expected net sales proceeds to estimate the fair value of any centers that are actively being marketed for sale.
In addition to these procedures, we also review undeveloped or unimproved land parcels that we own for evidence of impairment and record any impairment charges as necessary. Primary impairment triggers for these land parcels are changes to our plans or intentions with regards to such properties, or planned dispositions at prices that are less than the current carrying values.
Our quarterly impairment procedures have not been altered by the COVID-19 pandemic, as we believe key impairment indicators such as temporary store closings and large unleased or vacant spaces will continue to be identified in our review. We have utilized forecasts that incorporate estimated decreases in NOI and cash flows as a result of the COVID-19 pandemic in performing our impairment analysis for the year ended December 31, 2020. However, it is possible that we could experience unanticipated changes in assumptions that are employed in our impairment analysis which could impact our cash flows and fair value conclusions. Such unanticipated changes relative to our expectations may include but are not limited to: increases or decreases in the duration or permanence of tenant closures, increases or decreases in collectibility reserves and write-offs, additional capital required to fill vacancies, extended lease-up periods, future closings of large tenants, changes in macroeconomic assumptions such as rate of inflation and capitalization rates, and changes to the estimated timing of disposition of the properties under review.
Investments in Unconsolidated Joint Ventures—We account for our investments in unconsolidated joint ventures using the equity method of accounting as we exercise significant influence over, but do not control, these entities. These investments were initially recorded at cost and are subsequently adjusted for contributions made to and distributions received from the joint ventures. Earnings or losses from our investments are recognized in accordance with the terms of the applicable joint venture agreements, generally through a pro rata allocation. Under a pro rata allocation, net income or loss is allocated between the partners in the joint ventures based on their respective stated ownership percentages.
We utilize the cumulative-earnings approach for purposes of determining whether distributions should be classified as either a return on investment, which would be included in operating activities, or a return of investment, which would be included in investing activities on the consolidated statements of cash flows. Under this approach, distributions are presumed to be returns on investment unless cumulative returns on investment exceed our cumulative equity in earnings. When such an excess occurs, the current-period distribution up to this excess is considered a return of investment and classified as cash flows from investing activities.
On a periodic basis, management assesses whether there are indicators, including the operating performance of the underlying real estate and general market conditions, that the value of our investments in our unconsolidated joint ventures may be impaired. An investment’s value is impaired only if management’s estimate of the fair value of the investment is less than its carrying value and such difference is deemed to be other-than-temporary. To the extent impairment has occurred, the loss is measured as the excess of the carrying amount of the investment over its estimated fair value.
Management’s estimates of fair value are based upon a discounted cash flow model for each specific investment that includes all estimated cash inflows and outflows over a specified holding period. Where applicable, any estimated debt premiums, capitalization rates, discount rates, and credit spreads used in these models are based upon rates we believe to be within a reasonable range of current market rates.
Our joint venture investment in NRP was acquired as part of an acquisition and initially recorded at fair value. Basis differences arise when the fair value we record differs from our proportionate share of the entity’s underlying net assets. A basis difference for our joint venture is amortized starting at the date of acquisition and recorded as an offset to earnings from the related joint venture in Other Income (Expense), Net on our consolidated statements of operations. When a property is sold, the remaining basis difference related to that property is written off. Our investment in NRP differs from our proportionate share of the underlying net assets due to an initial basis difference of $6.2 million. For additional information regarding our unconsolidated joint ventures, refer to Note 7.
Leases—We are party to a number of lease agreements, both as a lessor as well as a lessee of various types of assets.
Lessor—The majority of our revenue is lease revenue derived from our real estate assets, which is accounted for under ASC Topic 842, Leases (“ASC 842”). We adopted the accounting guidance contained within ASC 842 on January 1, 2019, the effective date of the standard for public companies. We record lease and lease-related revenue as Rental Income on the consolidated statements of operations, in accordance with ASC 842.
We enter into leases primarily as a lessor as part of our real estate operations, and leases represent the majority of our revenue. We lease space in our properties generally in the form of operating leases. Our leases typically provide for reimbursements from tenants for common area maintenance, insurance, and real estate tax expenses. Common area maintenance reimbursements can be fixed, with revenue earned on a straight-line basis over the term of the lease, or variable, with revenue recognized as services are performed for which we will be reimbursed.
| | | | | | | | | | | |
| PHILLIPS EDISON & COMPANY DECEMBER 31, 2023 FORM 10-K | | | F-12 |
The lease agreements frequently contain fixed-price renewal options to extend the terms of leases and other terms and conditions as negotiated. In calculating the term of our leases, we consider whether these options are reasonably certain to be exercised. Our determination involves a combination of contract-, asset-, entity-, and market-based factors and involves considerable judgment. We retain substantially all of the risks and benefits of ownership of the real estate assets leased to tenants. Currently, our tenants have no options to purchase at the end of the lease term, although in a small number of leases, a tenant, usually the anchor tenant, may have the right of first refusal to purchase one of our properties if we elect to sell the center.
Beginning January 1, 2019, weWe evaluate whether a lease is an operating, sales-type, or direct financing lease using the criteria established in ASC 842. Leases will be considered either sales-type or direct financing leases if any of the following criteria are met:
•if the lease transfers ownership of the underlying asset to the lessee by the end of the term;
•if the lease grants the lessee an option to purchase the underlying asset that is reasonably certain to be exercised;
•if the lease term is for the major part of the remaining economic life of the underlying asset; or
•if the present value of the sum of the lease payments and any residual value guaranteed by the lessee equals or exceeds substantially all of the fair value of the underlying asset.
We utilize substantial judgment in determining the fair value of the leased asset, the economic life of the leased asset, and the relevant borrowing rate in performing our lease classification analysis. If none of the criteria listed above are met, the lease is classified as an operating lease. Currently, all of our leases are classified as operating leases, and we expect that the majority, if not all, of our leases will continue to be classified as operating leases based upon our typical lease terms.
We commence revenue recognition on our leases based on a number of factors. In most cases, revenue recognition under a lease begins when the lessee takes possession of or controls the physical use of the leased asset. The determination of when revenue recognition under a lease begins, as well as the nature of the leased asset, is dependent upon our assessment of who is the owner, for accounting purposes, of any related tenant improvements. If we are the owner, for accounting purposes, of the tenant improvements, then the leased asset is the finished space, and revenue recognition begins when the lessee takes possession of the finished space, typically when the improvements are substantially complete.
If we conclude that we are not the owner, for accounting purposes, of the tenant improvements (i.e., the lessee is the owner), then the leased asset is the unimproved space and any tenant allowances funded under the lease are treated as lease incentives, which reduce revenue recognized over the term of the lease. In these circumstances, we begin revenue recognition when the lessee takes possession of the unimproved space to construct their own improvements. We consider a number of different factors in evaluating whether the lessee or we are the owner of the tenant improvements for accounting purposes. These factors include:
•whether the lease stipulates how and on what a tenant improvement allowance may be spent;
•whether the tenant or landlord retains legal title to the improvements;
•the uniqueness of the improvements;
•the expected economic life of the tenant improvements relative to the length of the lease; and
•who constructs or directs the construction of the improvements.
The majority of our leases provide for fixed rental escalations, and we recognize rental income on a straight-line basis over the term of each lease in such instances. The difference between rental income earned on a straight-line basis and the cash rent due under the provisions of the lease agreements is recorded as deferred rent receivable and is included as a component of Other Assets, Net. Due to the impact of the straight-line adjustments, rental income generally will be greater than the cash collected in the early years and will be less than the cash collected in the later years of a lease.
Reimbursements from tenants for recoverable real estate taxes and operating expenses that are fixed per the terms of the applicable lease agreements are recorded on a straight-line basis, as described above. The majority of our lease agreements with tenants, however, provide for tenant reimbursements that are variable depending upon the applicable expenses incurred. These reimbursements are accrued as revenue in the period in which the applicable expenses are incurred. We make certain assumptions and judgments in estimating the reimbursements at the end of each reporting period. We do not expect the actual results to materially differ from the estimated reimbursements. Both fixed and variable tenant reimbursements are recorded as Rental Income in the consolidated statements of operations. In certain cases, the lease agreement may stipulate that a tenant make a direct payment for real estate taxes to the relevant taxing authorities. In these cases, beginning on January 1, 2019, we no longerdo not record any revenue or expense related to these tenant expenditures. Although we expect such cases to be rare, in the event that a direct-paying tenant failed to make their required payment to the taxing authorities, we would potentially be liable for such amounts, although they are not recorded as a liability in our consolidated balance sheets per the requirements of ASC 842. We have made a policy election to exclude amounts collected from customers for all sales
tax and other similar taxes from the transaction price in our recognition of lease revenue. We record such taxes on a net basis in our consolidated statements of operations.
Additionally, we record an immaterial amount of variable revenue in the form of percentage rental income. Our policy for percentage rental income is to defer recognition of contingent rental income until the specified target (i.e., breakpoint) that triggers the contingent rental income is achieved.
In some instances, as part of our negotiations, we may offer lease incentives to our tenants. These incentives usually take the form of payments made to or on behalf of the tenant, and such incentives will be deducted from the lease payment and recorded on a straight-line basis over the term of the new lease.
We record lease termination income if there is a signed termination agreement, all of the conditions of the agreement have been met, collectibility is reasonably assured, and the tenant is no longer occupying the property. Upon early lease termination, we provide for losses related to unrecovered tenant-specific intangibles and other assets. We record lease termination income as Rental Income in the consolidated statements of operations.
Historically, we periodically reviewed the collectibility of outstanding receivables. Following the adoption of ASC 842, lease | | | | | | | | | | | |
| PHILLIPS EDISON & COMPANY DECEMBER 31, 2023 FORM 10-K | | | F-13 |
Lease receivables are reviewed continually to determine whether or not it is probable that we will realize substantially all remaining lease payments for each of our tenants (i.e., whether a tenant is deemed to be a credit risk). Additionally, we record a general reserve based on our review of operating lease receivables at a company level to ensure they are properly valued based on analysis of historical bad debt, outstanding balances, and the current economic climate. If we determine it is not probable that we will collect substantially all of the remaining lease payments from a tenant, revenue for that tenant is recorded on a cash basis (“cash-basis tenant”), including any amounts relating to straight-line rent receivables and/or receivables for recoverable expenses. We will resume recording lease income on an accrual basis for cash-basis tenants once we believe the collection of rent for the remaining lease term is probable, which will generally be after a period of regular payments. The COVID-19 pandemic has increased the uncertainty of collecting rents from a number of our tenants. Under ASC 842, the aforementioned adjustments as well as any reserve for disputed charges are recorded as a reduction of Rental Income rather than in Property Operating, where our reserves were previously recorded, on the consolidated statements of operations. As of December 31, 20202023 and 2019,2022, the reserve in accounts receivable for uncollectible amounts was $8.9$1.9 million and $6.9$3.0 million, respectively. Receivables on our consolidated balance sheets exclude amounts removed forrelated to tenants considered to be non-creditworthy, which were $27.2$10.7 million and $6.9$10.4 million as of December 31, 20202023 and 2019,2022, respectively.
In our efforts to maximize collections in the near term while also supporting our tenants as they operate through this pandemic, we have begun negotiating rent relief primarily in the form of payment plans and deferrals on rent and recovery charges, which allow for changes in the timing of payments, but not the total amount of consideration due to us under the lease. In some instances, we may also agree to waive certain charges due to us under the lease; for additional details, please refer to Note 3.
Lessee—We enter into leases as a lessee as part of our real estate operations in the form of ground leases of land for certain properties, and as part of our corporate operations in the form of office space and office equipment leases. Ground leases typically contain one or more options to renew for additional terms and may include options that grant us, as the lessee, the right to terminate the lease, without penalty, in advance of the full lease term. Our office space leases generally have no renewal options. Office equipment leases typically have options to extend the term for a year or less, but contain minimal termination rights. In calculating the term of our leases, we consider whether we are reasonably certain to exercise renewal and/or termination options. Our determination involves a combination of contract-, asset-, entity-, and market-based factors and involves considerable judgment.
Currently, neither our operating leases nor our finance leases have residual value guarantees or other restrictions or covenants, but a small number may contain nonleasenon-lease components which have been deemed not material and are not separated from the leasing component. Beginning January 1, 2019, weWe evaluate whether a lease is a finance or operating lease using the criteria established in ASC 842. The criteria we use to determine whether a lease is a finance lease are the same as those we use to determine whether a lease is sales-type lease as a lessor. If none of the finance lease criteria is met, we classify the lease as an operating lease.
We record ROU assets and liabilities in the consolidated balance sheets based upon the terms and conditions of the applicable lease agreement. We use discount rates to calculate the present value of lease payments when determining lease classification and measuring our lease liability. We use the rate implicit in the lease as our discount rate unless that rate cannot be readily determined, in which case we consider various factors, including our incremental secured borrowing rate, in selecting an appropriate discount rate. This requires the application of judgment, and we consider the length of the lease as well as the length and securitization of our outstanding debt agreements in selecting an appropriate rate. Refer to Note 3 for further detail.
Revenue Recognition—In addition to our lease-related revenue, we also earn fee revenues by providing services to the Managed Funds. These fees are accounted for within the scope of ASC Topic 606, Revenue from Contracts with Customers (“ASC 606”), and are recorded as Fees and Management Income on the consolidated statements of operations. We provide services to the Managed Funds, all of which are considered related parties. These services primarily include asset acquisition and disposition services, asset management, operating and leasing of properties, construction management, and other general and administrative responsibilities. These services are currently provided under various combinations of advisory agreements, property management agreements, and other service agreements (the “Management Agreements”). The wide variety of duties within the Management Agreements makes determining the performance obligations within the contracts a matter of judgment. We have concluded that each of the separately disclosed fee types in the below table represents a separate performance obligation within the Management Agreements.
| | | | | | | | | | | | | | | | | | | | |
| Fee | | Performance Obligation Satisfied | | Form and Timing of Payment | | Description |
| Asset Management | | Over time | | In cash, monthly | | Because each increment of service is distinct, although substantially the same, revenue is recognized at the end of each reporting period based upon invested equity and the applicable rate. |
| Property Management | | Over time | | In cash, monthly | | Because each increment of service is distinct, although substantially the same, revenue is recognized at the end of each month based on a percentage of the properties’ cash receipts. |
| Leasing Commissions | | Point in time (upon close of a transaction) | | In cash, upon completion | | Revenue is recognized in an amount equal to the fees charged by unaffiliated persons rendering comparable services in the same geographic location. |
| Construction Management | | Point in time (upon close of a project) | | In cash, upon completion | | Revenue is recognized in an amount equal to the fees charged by unaffiliated persons rendering comparable services in the same geographic location. |
Acquisition/Disposition | | Point in time (upon close of a transaction) | | In cash, upon close of the transaction | | Revenue is recognized based on a percentage of the purchase price or disposition price of the property acquired or sold. |
Due to the nature of the services being provided under our Management Agreements, each performance obligation has a variable component. Therefore, when we determine the transaction price for the contracts, we are required to constrain our estimate to an amount that is not probable of significant revenue reversal. For most of these fee types, such as acquisition fees and leasing commissions, compensation only occurs if a transaction takes place and the amount of compensation is dependent upon the terms of the transaction. For our property and asset management fees, due to the large number and broad range of possible consideration amounts, we calculate the amount earned at the end of each month.
In addition to the fees listed above, certain of our Management Agreements include the potential for additional revenues if certain market conditions are in place or certain events take place. We have not recognized revenue related to these fees, nor will we until it is no longer highly probable that there would be a material reversal of revenue.
Sales or transfers to non-customers of non-financial assets or in substance non-financial assets that do not meet the definition of a business are accounted for within the scope of ASC Topic 610-20, Other Income—Gains and Losses from the Derecognition of Nonfinancial Assets (“ASC 610-20”). Generally, our sales of real estate would be considered a sale of a non-financialnon-
| | | | | | | | | | | |
| PHILLIPS EDISON & COMPANY DECEMBER 31, 2023 FORM 10-K | | | F-14 |
financial asset as defined by ASC 610-20. Under ASC 610-20, if we determine we do not have a controlling financial interest in the entity that holds the asset and the arrangement meets the criteria to be accounted for as a contract, we would de-recognizederecognize the asset and recognize a gain or loss on the sale of the real estate when control of the underlying asset transfers to the buyer. Further, we may defer a tax gain through a Section 1031 Exchange by purchasing another property within a specified time period. For additional information regarding gain on sale of assets, refer to Note 5.4.
Share-Based Compensation—We account for equity awards in accordance with ASC Topic 718, Compensation—Stock Compensation, which requires that all share basedshare-based payments to employees and non-employee directors be recognized in the consolidated statements of operations over the requisite service period based on their fair value. FairPrior to our underwritten IPO, fair value at issuance is determined usingwas based on the grant date estimated value per share (“EVPS”) of our stock. For those share-basedSubsequent to our underwritten IPO, fair value for certain of our equity awards that are settledis based on our Nasdaq closing stock price at the date of the grant. Beginning in cash and recorded as a liability,2022, fair value for our performance-based awards is calculated using the Monte Carlo method, which is intended to estimate the fair value of the awards using dividend yields, expected volatilities that are primarily based on available implied data and associated expense is adjusted when the published price of our stock changes. peer group companies’ historical data, and post-vesting restriction periods.
Share-based compensation expense for all awards is included in General and Administrative and Property Operating in our consolidated statements of operations.operations, excluding the expense related to RSUs awarded in connection with our underwritten IPO, which is included in Other Expense, Net. For more information about our stock basedstock-based compensation program, see Note 14.13.
Share Repurchase of Common StockPrograms—We offerShares repurchased pursuant to a share repurchase program (“SRP”) which may allow stockholders who participate to have their shares repurchased subject to approval and certain limitations and restrictions. Shares repurchased pursuant to our SRP are immediately retired upon purchase. Repurchased common stock is reflected as a reduction of stockholders’ equity. Our accounting policy related to share repurchases is to reduce common stock based on the par value of the shares and to reduce capital surplus for the excess of the repurchase price over the par value. Since the inception of the SRPStarting in August 2010, we offered a share repurchase program which allowed stockholders who participated to have their shares repurchased subject to approval and certain limitations and restrictions. Prior to its termination in August 2021, we had an accumulated deficit balance; therefore, the excess over the par value has historically been applied to additional paid-in capital. Once we
On August 3, 2022, our Board approved a new share repurchase program of up to $250 million of common stock. The program may be suspended or discontinued at any time, and does not obligate us to repurchase any dollar amount or particular number of shares. No share repurchases have retained earnings, the excess will be charged entirelybeen made to retained earnings.date under this program.
Segments—Our principal business is the ownership and operation of community and neighborhood shopping centers. We do not distinguish our principal business, or group our operations, by geography or size for purposes of measuring performance. Accordingly, we have presented our results as a single reportable segment.
Income Taxes—We have elected to be taxed as a REIT under the IRC. To qualify as a REIT, we must meet a number of organizationorganizational and operational requirements, including a requirement to annually distribute to our stockholders at least 90% of our REIT taxable income, determined without regard to the dividends paid deduction and excluding net capital gains. We intend to continue to adhere to these requirements and to maintain our REIT status. As a REIT, we are entitled to a deduction for some or all of the distributions we pay to our stockholders. Accordingly, we are generally subject to U.S. federal income taxes on any taxable income that is not currently distributed to our stockholders. If we fail to qualify as a REIT in any taxable year, we will be subject to U.S. federal income taxes and may not be able to qualify as a REIT until the fifth subsequent taxable year.
Notwithstanding our qualification as a REIT, we may be subject to certain state and local taxes on our income or properties. In addition, our consolidated financial statements include the operations of wholly-owned subsidiaries that have jointly elected to be treated as a Taxabletaxable REIT Subsidiarysubsidiary (“TRS”) entities and are subject to U.S. federal, state, and local income taxes at regular corporate tax rates. As a REIT, we may also be subject to certain U.S. federal excise taxes if we engage in certain types of transactions. We recognized an insignificant amount of federal, state, and local income tax expense for the years ended December 31, 20202023, 2022, and 2019, respectively,2021, and we retain a full valuation allowance for our net deferred tax asset. All income tax
amounts are included in Other Income (Expense),Expense, Net on theour consolidated statements of operations. For more information regarding our income taxes, see Note 11.10.
Newly AdoptedRecently Issued Accounting Pronouncements—The following table provides a brief description of newly-adopted accounting pronouncements and their effect on our consolidated financial statements:
| | | | | | | | | | | | | | | | | | | | |
Standard | | Description | | Date of Adoption | | Effect on the Financial Statements or Other Significant Matters |
Accounting Standards Update (“ASU”) 2016-13, Financial Instruments - Credit Losses (Topic 326):
Measurement of Credit Losses on Financial Instruments
ASU 2018-19, Financial Instruments - Credit Losses (Topic 326): Codification Improvements
ASU 2019-05, Financial Instruments - Credit Losses (Topic 326): Targeted Transition Relief
ASU 2019-11, Codification Improvements to Topic 326, Financial Instruments - Credit Losses
ASU 2020-02, Financial Instruments - Credit Losses (Topic 326) and Leases (Topic 842) | | The amendments in this update replaced the incurred loss impairment methodology in current GAAP with a methodology that reflects expected credit losses and requires consideration of a broader range of reasonable and supportable information to inform credit loss estimates. It clarified that receivables arising from operating leases are not within the scope of ASC Topic 326. Instead, impairment of receivables arising from operating leases will be accounted for in accordance with ASC 842. It also allowed election of the fair value option on certain financial instruments. | | January 1, 2020 | | The adoption of this standard did not have a material impact on our consolidated financial statements. The majority of our financial instruments result from operating lease transactions, which are not within the scope of this standard. |
ASU 2018-17, Consolidation (Topic 810): Targeted Improvements to Related Party Guidance for Variable Interest Entities | | This ASU amended two aspects of the
related-party guidance in Topic 810: (1) added an elective private-company scope exception to the variable interest entity guidance for entities under common control, and (2) provided that indirect interests held through related parties in common control arrangements will be considered on a proportional basis for determining whether fees paid to decision makers and service providers are variable interests. | | January 1, 2020 | | The adoption of this standard did not have a material impact on our consolidated financial statements. |
ASU 2019-04, Codification Improvements to Topic 326, Financial Instruments—Credit Losses, Topic 815, Derivatives and Hedging, and Topic 825, Financial Instruments | | This ASU amended a variety of topics,
improving certain aspects of previously issued ASUs, including ASU 2016-01, Financial Instruments-Overall (Subtopic 825-10): Recognition and Measurement of Financial Assets and Financial
Liabilities, ASU 2016-13, Financial
Instruments-Credit Losses (Topic 326): Measurement of Credit Losses on Financial Instruments, and ASU 2017-12, Derivatives and Hedging (Topic 815): Targeted Improvements to Accounting for Hedging Activities. | | January 1, 2020 | | The adoption of this standard did not have a material impact on our consolidated financial statements. |
ASU 2020-04, Reference Rate Reform (Topic 848): Facilitation of the Effects of Reference Rate Reform on Financial Reporting | | This ASU contains practical expedients for reference rate reform related activities that impact debt, leases, derivatives and other contracts. The guidance in ASU
2020-04 is optional and may be elected over time as reference rate reform activities occur. | | March 12, 2020 | | We have elected to apply the expedients related to probability and the assessments of effectiveness for future LIBOR-indexed cash flows to assume that the index upon which future hedged transactions will be based matches the index on the corresponding derivatives. Application of these expedients preserves the presentation of derivatives consistent with past presentation. We continue to evaluate the impact of the guidance and may apply other elections as applicable as changes occur. |
In response to the COVID-19 pandemic,November 2023, the Financial Accounting Standards Board (“FASB”) issued interpretive guidance addressing the accounting treatment for lease concessions attributableAccounting Standards Update ("ASU") 2023-07, Segment Reporting (Topic 280): Improvements to Reportable Segment Disclosures (“ASU 2023-07”). ASU 2023-07 requires, among other updates, enhanced disclosures about significant segment expenses that are regularly provided to the pandemic. Underchief operating decision maker. The ASU also clarifies that entities with a single reportable segment are subject to both new and existing reporting requirements under Topic 280. This guidance is effective for fiscal years beginning after December 15, 2023, and interim periods within fiscal years beginning after December 15, 2024, and requires retrospective adoption. Early adoption is permitted. We are evaluating the impact of this guidance entities may electon our consolidated financial statements and related disclosures.
In December 2023, the FASB issued ASU 2023-09, Income Taxes (Topic 740): Improvements to accountIncome Tax Disclosures (“ASU 2023-09”). ASU 2023-09 updates income tax disclosures related to the rate reconciliation and requires disclosure of income taxes paid by jurisdiction. The ASU also makes several other changes to income tax disclosure requirements. The guidance is effective for such lease concessions consistent with how they would be accounted for under ASC 842 if the enforceable rights and obligations for the lease concessions already existed within the lease agreement, regardless of whether such enforceable rights and obligations are explicitly outlined within the lease. This accounting treatment may onlyfiscal years beginning after December 15, 2024. The guidance should be applied if (1)prospectively; however, retrospective application is permitted. Early adoption is permitted. We are evaluating the lease concessions were granted as a direct resultimpact of the pandemic,this guidance on our consolidated financial statements and (2) the total cash flows under the modified lease are less than or substantially the same as the cash flows under the original lease agreement. As a result, entities that make this election will not have to analyze each lease to determine whether enforceable rights and obligations for concessions exist within the contract, and may elect not to account for these concessions as lease modifications within the scope of ASC 842.related disclosures.
Some concessions will provide a deferral of payments, which may affect the timing of cash receipts without substantively impacting the total consideration per the original lease agreement. The FASB has stated that there are multiple acceptable methods to account for deferrals under the interpretive guidance:
| | | | | | | | | | | |
| PHILLIPS EDISON & COMPANY DECEMBER 31, 2023 FORM 10-K | | | F-15 |
•Account for the concession as if no changes to the lease contract were made, increasing the lease receivable as payments accrue and continuing to recognize income; or
•Account for deferred lease payments as variable lease payments.
We have elected not to account for any qualifying lease concessions granted as a result of the COVID-19 pandemic as lease modifications and will account for any qualifying concessions granted as if no changes to the lease contract were made. This will result in an increase to the related lease receivable as payments accrue while we continue to recognize rental income. We will, however, assess the impact of any such concessions on estimated collectibility of the related lease payments and will reflect any adjustments as necessary as an offset to Rental Income on the consolidated statements of operations.
Reclassifications—The following line item on our consolidated balance sheet as of December 31, 2019 was reclassified to conform to current year presentation:
•Corporate Intangible Assets, Net was included in Other Assets, Net.
The following line items on our consolidated statements of cash flows for the years ended December 31, 2019 and 2018 were reclassified to conform to current year presentation:
•Return on Investment in Unconsolidated Joint Ventures was listed on a separate line from Other Assets, Net; and
•Net Change in Credit Facility was separated into two lines, Proceeds from Revolving Credit Facility and Payments on Revolving Credit Facility.
Lessor—The majority of our leases are largely similar in that the leased asset is retail space within our properties, and the lease agreements generally contain similar provisions and features, without substantial variations. All of our leases are currently classified as operating leases. Lease income related to our operating leases was as follows as offor the years ended December 31, 20202023, 2022, and 2019 (dollars in2021 (in thousands):
| | 2020 | | 2019 |
| 2023 | | | 2023 | | 2022 | | 2021 |
Rental income related to fixed lease payments(1) | Rental income related to fixed lease payments(1) | $ | 380,439 | | | $ | 385,948 | |
Rental income related to variable lease payments(1) | 125,256 | | | 127,790 | |
Straight-line rent amortization(2) | 3,258 | | | 9,003 | |
Rental income related to variable lease payments(1)(2) | |
Straight-line rent amortization(3) | |
| Amortization of lease assets | Amortization of lease assets | 3,138 | | | 4,138 | |
| Lease buyout income | Lease buyout income | 1,237 | | | 1,166 | |
Adjustments for collectibility(2)(3) | (27,845) | | | (5,775) | |
Adjustments for collectibility(4) | |
| Total rental income | Total rental income | $ | 485,483 | | | $ | 522,270 | |
(1)Includes rental income related to lease payments before assessing for collectibility.
(2)Includes revenue adjustments for non-creditworthy tenants.Variable payments are primarily related to tenant recovery income.
(3)Contains general reserves; excludes reserves forIncludes revenue adjustments to straight-line rent amortization.for tenants considered non-creditworthy.
(4)Includes general reserves as well as adjustments for tenants considered non-creditworthy for which we are recording revenue on a cash basis, per ASC 842.
Approximate future fixed contractual lease payments to be received under non-cancelable operating leases in effect as of December 31, 2020,2023, assuming no new or renegotiated leases or option extensions on lease agreements, and including the impact of rent abatements payment plans, and tenants who have been moved to the cash basis of accounting for revenue recognition purposes, are as follows (in thousands):
| | | | | |
| Year | Amount |
| 2021 | $ | 374,203 | |
| 2022 | 339,952 | |
| 2023 | 291,884 | |
| 2024 | 236,076 | |
| 2025 | 179,406 | |
| Thereafter | 430,799 | |
| Total | $ | 1,852,320 | |
In response to the COVID-19 pandemic, we executed payment plans with our tenants. For tenants active as of March 8, 2021, we had agreed to defer approximately $8.6 million in rent and related charges, and we had granted abatements totaling approximately $4.2 million. These payment plans and rent abatements represented approximately 2% and 1% of our wholly-owned portfolio’s annualized base rent (“ABR”), respectively. As of March 8, 2021, approximately 87% of payments are scheduled to be received through December 31, 2021 for all executed payment plans, and the weighted-average remaining term over which we expect to receive payment on executed payment plans is approximately 11 months. For the years ended December 31, 2020 and 2019, we had $28.1 million and $3.9 million, respectively, in monthly revenue that will not be recognized until cash is collected or the tenant resumes regular payments and/or is considered creditworthy. These amounts include the estimated impact of tenants who have filed for bankruptcy. | | | | | |
| Year | Amount |
| 2024 | $ | 458,756 | |
| 2025 | 410,401 | |
| 2026 | 344,405 | |
| 2027 | 277,629 | |
| 2028 | 206,567 | |
| Thereafter | 534,910 | |
| Total | $ | 2,232,668 | |
No single tenant comprised 10% or more of our ABRaggregate annualized base rent (“ABR”) as of December 31, 2020.2023. As of December 31, 2020,2023, our wholly-owned real estate investments in Florida and California represented 12.3%12.0% and 10.4%11.0% of our ABR, respectively. As a result, the geographic
concentration of our portfolio makes it particularly susceptible to adverse weather or economic events including the impact of the COVID-19 pandemic, in the Florida (see “Hurricane Ian” in Note 4) and California real estate markets.
Lessee—Lease assets and liabilities, grouped by balance sheet line where they are recorded, consisted of the following as of December 31, 20202023 and 20192022 (in thousands):
| | | | | | | | | | | | | | |
| Balance Sheet Information | Balance Sheet Location | 2020 | | 2019 |
| ROU assets, net - operating leases | Investment in Real Estate | $ | 3,867 | | | $ | 7,613 | |
| ROU assets, net - operating and finance leases | Other Assets, Net | 1,438 | | | 2,111 | |
| Operating lease liability | Accounts Payable and Other Liabilities | 5,731 | | | 9,453 | |
| Finance lease liability | Debt Obligations, Net | 164 | | | 443 | |
During the year ended December 31, 2020, one of our acquisitions was land upon which one of our shopping centers is situated. This land was previously subject to a ground lease in which the lessor controlled an option requiring us to purchase the land subject to the lease, and our valuation of the ROU asset and lease liability as of December 31, 2019 for this ground lease reflected the assumption that the lessor would exercise this option and that we would purchase the underlying land asset. | | | | | | | | | | | | | | |
| Balance Sheet Information | Balance Sheet Location | 2023 | | 2022 |
| ROU assets, net - operating leases | Investment in Real Estate | $ | 3,734 | | | $ | 3,832 | |
| ROU assets, net - operating and finance leases | Other Assets, Net | 1,323 | | | 1,022 | |
| Operating lease liability | Accounts Payable and Other Liabilities | 5,094 | | | 4,705 | |
| Finance lease liability | Debt Obligations, Net | 308 | | | 585 | |
As of December 31, 2020,2023, the weighted-average remaining lease term was approximately two1.2 years for finance leases and 2020.5 years for operating leases. The weighted-average discount rate was 3.5%3.6% for finance leases and 4.1%4.7% for operating leases.
| | | | | | | | | | | |
| PHILLIPS EDISON & COMPANY DECEMBER 31, 2023 FORM 10-K | | | F-16 |
Future undiscounted payments for fixed lease charges by lease type, inclusive of options reasonably certain to be exercised, are as follows as of December 31, 20202023 (in thousands):
| | Undiscounted |
| Undiscounted | | | Undiscounted |
| Year | Year | Operating | | Finance | Year | Operating | | Finance |
| 2021 | $ | 831 | | | $ | 102 | |
| 2022 | 805 | | | 29 | |
| 2023 | 654 | | | 24 | |
| 2024 | 2024 | 528 | | | 16 | |
| 2025 | 2025 | 297 | | | 0 | |
| 2026 | |
| 2027 | |
| 2028 | |
| Thereafter | Thereafter | 5,781 | | | 0 | |
| Total undiscounted cash flows from leases | Total undiscounted cash flows from leases | 8,896 | | | 171 | |
| Total lease liabilities recorded at present value | Total lease liabilities recorded at present value | 5,731 | | | 164 | |
| Difference between undiscounted cash flows and present value of lease liabilities | Difference between undiscounted cash flows and present value of lease liabilities | $ | 3,165 | | | $ | 7 | |
On November 16, 2018, we completed the Merger pursuant to the Agreement and Plan of Merger, dated July 17, 2018. We acquired 86 properties as part of this transaction. Under the terms of the Merger, at the time of closing, the following consideration was given in exchange for REIT II common stock (in thousands):
| | | | | |
| Amount |
Fair value of PECO common stock issued(1)
| $ | 1,054,745 | |
Fair value of REIT II debt: | |
Corporate debt | 719,181 | |
Mortgages and notes payable | 102,727 | |
Derecognition of REIT II management contracts, net(2)
| 30,428 | |
Transaction costs | 11,587 | |
Total consideration and debt activity | 1,918,668 | |
Less: debt assumed | 464,462 | |
Total consideration | $ | 1,454,206 | |
(1)The total number of shares of common stock issued was 95.5 million.
(2)Previously a component of Other Assets, Net.
To complete the Merger, we issued 2.04 shares of our common stock in exchange for each issued and outstanding share of REIT II common stock, which was equivalent to $22.54 based on our EVPS at the time of the Merger of $11.05. The exchange ratio was based on a thorough review of the relative valuation of each entity, including factoring in our investment management business as well as each company’s transaction costs.
Upon completion of the Merger, our continuing stockholders owned approximately 71% of the issued and outstanding shares of the Company on a fully diluted basis (determined as if each Operating Partnership unit or “OP unit”) was exchanged for one share of our common stock) and former REIT II stockholders owned approximately 29% of the issued and outstanding shares of the Company on a fully diluted basis (determined as if each OP unit was exchanged for one share of our common stock).
Assets Acquired and Liabilities Assumed—After consideration of all applicable factors pursuant to the business combination accounting rules under ASC 805, including the application of a screen test to evaluate if substantially all the fair value of the acquired properties is concentrated in a single asset or group of similar assets, we have concluded that the Merger qualifies as an asset acquisition.
Additionally, prior to the close of the Merger, all of REIT II’s real properties were managed and leased by us, under the terms of various management agreements. As we had contractual relationships with REIT II, we considered the provisions of ASC 805 regarding the settlement of pre-existing relationships. This guidance provides that a transaction that in effect settles pre-existing relationships between the acquirer and acquiree should be evaluated under the guidance set forth in ASC 805 for possible gain/loss recognition.
In applying the relevant guidance to the settlement of our contractual relationships with REIT II, we noted that the provisions of the various agreements provided both parties to each of the agreements with substantial termination rights. The agreements permitted either party to terminate without cause or penalty upon prior written notice within a specified number of days’ notice. Therefore, we determined that the termination of the agreements did not result in a settlement gain or loss under the relevant guidance, and thus no gain or loss was recorded in the consolidated financial statements.
Prior to the consummation of the Merger, we did, however, have an existing intangible asset related to our acquisition of certain management contracts between Phillips Edison Limited Partnership (“PELP”), REIT II’s former external manager, and REIT II during our acquisition of PELP in 2017. Because this relationship was internalized as part of the Merger, we derecognized the carrying value of these intangible assets upon completion of the Merger and have included the derecognized contract value of $30.4 million in our calculation of total consideration in the table above.
As of December 31, 2018, we capitalized approximately $11.6 million in costs related to the Merger. The following table summarizes the final purchase price allocation based on a valuation report prepared by a third-party valuation specialist that was subject to management’s review and approval (in thousands):
| | | | | |
| Amount |
Assets: | |
Land and improvements | $ | 561,100 | |
Building and improvements | 1,198,884 | |
Intangible lease assets | 197,384 | |
Fair value of unconsolidated joint venture | 16,470 | |
Cash and cash equivalents | 354 | |
Restricted cash | 5,159 | |
Accounts receivable and other assets | 33,045 | |
Total assets acquired | 2,012,396 | |
Liabilities: | |
Debt assumed | 464,462 | |
Intangible lease liabilities | 60,421 | |
Accounts payable and other liabilities | 33,307 | |
Total liabilities assumed | 558,190 | |
Net assets acquired | $ | 1,454,206 | |
The allocation of the purchase price is based on management’s assessment, which requires a significant amount of judgment and represents management’s best estimate of the fair value as of the acquisition date.
Intangible Assets and Liabilities—The fair value and weighted-average amortization periods for the intangible assets and liabilities acquired in the Merger are as follows (dollars in thousands, useful life in years):
| | | | | | | | | | | |
| Fair Value | | Weighted-Average Useful Life |
| In-place leases | $ | 181,916 | | | 13 |
| Above-market leases | 15,468 | | | 7 |
| Below-market leases | (60,421) | | | 17 |
Property Sales—The following table summarizes our real estate disposition activity, excluding properties contributed or sold to GRP I (see Note 7), for the years ended December 31, 2020, 2019, and 2018 (dollars in thousands):
| | | | | | | | | | | | | | | | | |
| 2020 | | 2019 | | 2018 |
Number of properties sold(1) | 7 | | | 21 | | | 8 | |
| Number of outparcels sold | 1 | | | 1 | | | 0 | |
| Proceeds from sale of real estate | $ | 57,902 | | | $ | 223,083 | | | $ | 82,145 | |
Gain on sale of properties, net(2) | 10,117 | | | 30,039 | | | 16,757 | |
(1)We retained certain outparcels of land associated with one of our property dispositions during the year ended December 31, 2020, and as a result, this property is still included in our total property count.
(2)The gain on sale of properties, net does not include miscellaneous write-off activity, which is also recorded in Gain on Sale or Contribution of Property, Net on the consolidated statements of operations.
Subsequent to December 31, 2020, we sold 5 properties and 1 outparcel for $44.4 million.
Acquisitions—The following table summarizes our real estate acquisition activity for the years ended December 31, 2020, 2019,2023, 2022, and 20182021 (dollars and square feet in thousands):
| | | | | | | | | | | | | | | | | |
| 2020 | | 2019 | | 2018 |
Number of properties purchased(1) | 2 | | | 2 | | | 5 | |
Number of outparcels purchased(2) | 2 | | | 2 | | | 2 | |
| Total price of acquisitions | $ | 41,482 | | | $ | 71,722 | | | $ | 98,941 | |
| Total square footage acquired | 216 | | | 213 | | | 543 | |
| | | | | | | | | | | | | | | | | |
| 2023 | | 2022 | | 2021 |
| Number of properties acquired | 11 | | | 7 | | | 9 | |
Number of outparcels acquired(1) | 3 | | | 4 | | | 5 | |
| Contract price | $ | 278,480 | | | $ | 280,515 | | | $ | 307,551 | |
Total price of acquisitions(2) | 270,262 | | | 282,000 | | | 308,358 | |
(1)Excludes 86propertiesOutparcels acquired in the Merger and 3 properties acquired in the merger with Phillips Edison Grocery Center REIT III, Inc. (“REIT III”).
(2)Outparcels purchased in 2020, 2019, and 2018 are parcels of land adjacent to shopping centers that we own.
Subsequent to December 31, 2020, we acquired 2 properties(2)Total price of acquisitions includes closing costs less credits and 2 outparcels for $39.6 million.assumed debt obligations.
In October 2019, we completed a merger with REIT III which resulted in the acquisition of 3 properties. As partThe aggregate purchase price of the merger with REIT III, we alsoassets acquired a 10% equity interest in GRP II valued at approximately $5.4 million (refer to Note 7 for further information) and a net working capital liability. GRP II was subsequently acquired by GRP I in October 2020. Consideration for the merger with REIT III primarily included (i) the issuance of 4.5 million shares of our common stock with a value of $49.9 million; (ii) $21.1 million in cash used to pay down REIT III debt and cash paid to REIT III stockholders; (iii) the partial derecognition of a management contract intangible asset in the amount of $1.1 million; (iv) transaction costs of $0.8 million that were capitalized as part of this asset acquisition; and (v) the settlement of net related party balances of $0.5 million.
Prior to the close of the merger with REIT III, all of REIT III’s real properties were managed and leased by us, under the terms of various management agreements. As we had contractual relationships with REIT III, we considered the provisions of ASC 805 regarding the settlement of pre-existing relationships. This guidance provides that a transaction that in effect settles pre-existing relationships between the acquirer and acquiree should be evaluated under the guidance set forth in ASC 805 for possible gain/loss recognition. In applying the relevant guidance to the settlement of our contractual relationships with REIT III, we noted that the provisions of the various agreements provided both parties to each of the agreements with substantial termination rights. The agreements permitted either party to terminate without cause or penalty upon prior written notice within a specified number of days’ notice. Therefore, we determined that the termination of the agreements did not result in a settlement gain or loss under the relevant guidance, and thus no gain or loss was recorded in the consolidated financial statements.
The fair value and weighted-average useful life at acquisition for lease intangibles acquired as part of the transactions above during the years ended December 31, 20202023 and 2019, are2022 were allocated as follows (dollars in thousands, weighted-average useful life in years)(in thousands):
| | | | | | | | | | | | | | | | | | | | | | | |
| 2020 | | 2019 |
| Fair Value | | Weighted-Average Useful Life | | Fair Value | | Weighted-Average Useful Life |
| In-place leases | $ | 3,360 | | | 10 | | $ | 11,907 | | | 9 |
| Above-market leases | 709 | | | 4 | | 2,017 | | | 9 |
| Below-market leases | (2,466) | | | 21 | | (3,385) | | | 15 |
| | | | | | | | | | | |
| 2023 | | 2022 |
| ASSETS | | | |
| Land and improvements | $ | 80,701 | | | $ | 87,762 | |
| Building and improvements | 180,155 | | | 180,365 | |
| In-place lease assets | 26,690 | | | 24,408 | |
| Above-market lease assets | 2,688 | | | 3,903 | |
| Below-market debt | 444 | | | — | |
| Total assets | 290,678 | | | 296,438 | |
| | | |
| LIABILITIES | | | |
| Debt obligations, net | 9,614 | | | — | |
| Below-market lease liabilities | 10,802 | | | 14,438 | |
| Total liabilities | 20,416 | | | 14,438 | |
| | | |
| Net assets acquired | $ | 270,262 | | | $ | 282,000 | |
| | | | | | | | | | | |
| PHILLIPS EDISON & COMPANY DECEMBER 31, 2023 FORM 10-K | | | F-17 |
Property HeldThe weighted-average amortization periods for Sale—As ofin-place, above-market, and below-market lease intangibles and below-market debt acquired during the years ended December 31, 2020, there were no properties held2023 and 2022 are as follows (in years):
| | | | | | | | | | | |
| 2023 | | 2022 |
| Acquired in-place leases | 12 | | 12 |
| Acquired above-market leases | 9 | | 8 |
| Acquired below-market leases | 18 | | 21 |
| Assumed below-market debt | 2 | | — |
Property Dispositions—The following table summarizes our real estate disposition activity for sale. As ofthe years ended December 31, 2019, 12023, 2022, and 2021 (dollars in thousands):
| | | | | | | | | | | | | | | | | |
| 2023 | | 2022 | | 2021 |
Number of properties sold(1) | 1 | | | 4 | | | 24 | |
Number of outparcels sold(2)(3) | 2 | | | 4 | | | 4 | |
| Contract price | $ | 6,250 | | | $ | 53,987 | | | $ | 216,052 | |
Proceeds from sale of real estate, net(4)(5) | 7,208 | | | 52,019 | | | 206,377 | |
Gain on sale of property, net(5)(6) | 1,110 | | | 7,517 | | | 34,309 | |
(1)We retained one outparcel related to a property was classified as held for sale as it was under contract to sell, with no substantive contingencies, and the prospective buyer had significant funds at risk. This property was disposed of during the year ended December 31, 2020. A summary2021 and therefore the sale did not result in a reduction in our total property count.
(2)During the year ended December 31, 2021, our outparcel sales included: (i) the only remaining portion of assetsone of our properties, which resulted in a reduction in our total property count; and liabilities(ii) an undeveloped parcel of land, as well as two outparcels adjacent to two of our centers, none of which resulted in a reduction in our total property count.
(3)In addition to the four outparcels sold during the year ended December 31, 2021, a tenant at one of our properties exercised a bargain purchase option to acquire a parcel of land that we previously owned. This generated minimal proceeds for us.
(4)Total proceeds from sale of real estate, net includes closing costs less credits.
(5)Activity for the year ended December 31, 2023 includes land acquired from us by local authorities.
(6)During the year ended December 31, 2021, Gain on Disposal of Property, Net on the consolidated statements of operations includes miscellaneous write-off activity, which is not included in gain on sale of property, heldnet, presented above.
Hurricane Ian - On September 28, 2022, Hurricane Ian struck the southeast United States and caused various amounts of damage to our properties located in the region. During 2022, we recorded gross cumulative accelerated depreciation of $2.7 million for sale asdamages sustained to the properties, which was reduced by insurance recoveries $1.0 million (net of deductibles and self-insurance of $1.7 million) collected in 2023. As of December 31, 2019 is presented below (in thousands):
| | | | | |
| 2019 |
ASSETS | |
Total investment in real estate assets, net | $ | 5,859 | |
Other assets, net | 179 | |
Total assets | $ | 6,038 | |
LIABILITIES(1)
| |
Below-market lease liabilities, net | $ | 316 | |
Accounts payable and other liabilities | 33 | |
Total liabilities | $ | 349 | |
(1)These amounts are included2022, we had a receivable balance of $1.0 million, which was recorded in Accounts Payable and Other LiabilitiesAssets, Net on theour consolidated balance sheet.sheets.
| | |
6.5. INTANGIBLE ASSETS AND LIABILITIES |
Goodwill—During the years ended December 31, 2020, 2019,2023, 2022, and 20182021, we did not record anyrecorded no impairments or re-allocations ofto goodwill.
Other Intangible Assets and Liabilities—Other intangible assets and liabilities consisted of the following as of December 31, 20202023 and 2019, excluding amounts related to other intangible assets and liabilities classified as held for sale2022 (in thousands):
| | | | 2020 | | 2019 | | 2023 | | 2022 |
| Gross Amount | | Accumulated Amortization | | Gross Amount | | Accumulated Amortization |
| Gross Amount | | | Gross Amount | | Accumulated Amortization | | Gross Amount | | Accumulated Amortization |
| Corporate intangible assets | Corporate intangible assets | $ | 6,804 | | | $ | (4,922) | | | $ | 4,883 | | | $ | (2,444) | |
| In-place leases | In-place leases | 441,683 | | | (204,698) | | | 442,729 | | | (170,272) | |
| Above-market leases | Above-market leases | 66,106 | | | (41,125) | | | 65,946 | | | (34,569) | |
| Below-market lease liabilities | Below-market lease liabilities | (150,579) | | | 48,834 | | | (151,585) | | | 39,266 | |
Above-market contract(1) | |
(1)Recorded in Accounts Payable and Other Liabilities on our consolidated balance sheets.
Summarized below is the amortization recorded on other intangible assets and liabilities for the years ended December 31, 2020, 2019,2023, 2022, and 20182021 (in thousands):
| | | | | | | | | | | | | | | | | |
| 2020 | | 2019 | | 2018 |
| Corporate intangible assets | $ | 2,478 | | | $ | 2,735 | | | $ | 10,618 | |
| In-place leases | 36,000 | | | 42,902 | | | 37,101 | |
| Above-market leases | 6,890 | | | 7,502 | | | 6,112 | |
| Below-market lease liabilities | (10,063) | | | (11,687) | | | (10,061) | |
| | | | | | | | | | | |
| PHILLIPS EDISON & COMPANY DECEMBER 31, 2023 FORM 10-K | | | F-18 |
During the year ended December 31, 2019, we recorded an impairment of $7.8 million related to the management contracts intangible asset; please refer to Note
17. In addition, the portion of this asset that was related to our contract with REIT III was internalized as part of the merger with REIT III. As a result, during the year ended December 31, 2019, we derecognized a net book value of $1.1 million of these intangible assets and included the amount within capitalized asset acquisition costs for that transaction. We evaluated the useful life of the remaining management contracts after this derecognition and concluded that the asset now has a remaining useful life of one year.
| | | | | | | | | | | | | | | | | |
| 2023 | | 2022 | | 2021 |
| Corporate intangible assets | $ | 361 | | | $ | 364 | | | $ | 372 | |
| In-place leases | 34,380 | | | 36,851 | | | 34,221 | |
| Above-market leases | 5,865 | | | 6,485 | | | 6,319 | |
| Below-market lease liabilities | (11,044) | | | (10,809) | | | (9,900) | |
| Above-market contract | (499) | | | — | | | — | |
Estimated future amortization of the respective other intangible assets and liabilities as of December 31, 2020,2023, excluding estimated amounts related to other intangible assets and liabilitiesproperties classified as held for sale, for each of the next five years is as follows (in thousands):
| | | | | | | | | | | | | | | | | | | | | | | |
| Corporate Intangible Assets | | In-Place Leases | | Above-Market Leases | | Below-Market Leases |
| 2021 | $ | 384 | | | $ | 32,877 | | | $ | 6,211 | | | $ | (9,556) | |
| 2022 | 384 | | | 30,293 | | | 5,329 | | | (9,094) | |
| 2023 | 384 | | | 26,541 | | | 4,573 | | | (8,420) | |
| 2024 | 384 | | | 23,439 | | | 3,284 | | | (7,839) | |
| 2025 | 346 | | | 20,435 | | | 2,131 | | | (7,341) | |
| | | | | | | | | | | | | | | | | | | | | | | | | | | | | |
| Corporate Intangible Assets | | In-Place Leases | | Above-Market Leases | | Below-Market Lease Liabilities | | Above-Market Contract |
| 2024 | $ | 360 | | | $ | 32,970 | | | $ | 4,928 | | | $ | (10,689) | | | $ | (499) | |
| 2025 | 325 | | | 28,281 | | | 3,561 | | | (9,873) | | | (499) | |
| 2026 | 5 | | | 23,959 | | | 2,418 | | | (9,122) | | | (499) | |
| 2027 | 1 | | | 20,805 | | | 1,691 | | | (8,699) | | | (499) | |
| 2028 | — | | | 17,473 | | | 1,160 | | | (8,227) | | | — | |
| | |
7.6. INVESTMENTS IN UNCONSOLIDATED JOINT VENTURES |
Grocery Retail Partners I and II—In November 2018, through our direct and indirect subsidiaries, we entered into a joint venture with Northwestern Mutual pursuant to which we contributed 14 and sold three grocery-anchored shopping centers withLife Insurance Company (“Northwestern Mutual”). We acquired a fair value of approximately $359 million to15% ownership interest in the new joint venture, GRP I, in exchange for a 15% ownership interest in GRP I.and Northwestern Mutual acquired anthe remaining 85% ownership interest in GRP I by contributing cash of $167.1 million.interest. The joint venture is set to expire ten years after the date of the agreement, unless otherwise extended by the members. As a part of the transaction, GRP I distributed or paid cash of $161.8 million to us as well as assumed an existing portfolio mortgage loan of $175 million with a fair value of $165 million to which we are the non-recourse carveout guarantor and environmental indemnitor (see Note 16 for more detail). We recognized a gain of $92.5 million on the transaction which is recorded as Gain on Sale or Contribution of Property, Net on the consolidated statements of operations.
In connection with thea 2019 merger, with REIT III, we assumed a 10% equity interest in Grocery Retail Partners II LLC (“GRP IIII”) with a fair value of $5.4 million at acquisition. GRP II was initially formed in November 2018 pursuant to the terms of a joint venture agreement between REIT III and Northwestern Mutual and wasis set to expire ten years after the date of the joint venture contribution agreement unless otherwise extended by the members.
In October 2020, GRP I acquired GRP II. As a part of the transaction, the carrying amount of our investment in GRP II was contributed to GRP I as consideration for an additional interest in GRP I. Our ownership interest in GRP I upon consummation of the transaction was adjusted to approximately 14% as a result of the acquisition.
Necessity Retail Partners—In connection with the Merger,As of December 31, 2023, we assumedowned a 20% equity interest in NRP.Necessity Retail Partners (“NRP”). NRP was initially formed in March 2016 pursuant to the terms of a joint venture agreement, as amended, between Phillips Edison Grocery Center REIT II, Inc. and an affiliate of TPG Real Estate and is set to expire seven years after the date of the joint venture contribution agreementin 2024 unless otherwise extended by the members. This joint venture agreement required a contribution of up to $50 million toIn May 2022, we sold the final property in the joint venture. OfWith the maximum $50 million contribution, approximately $17.5 million was previously contributed by REIT II prior tomonetization of the Merger. We are in the process of disposing and liquidating the assets of this joint venture, we exceeded the targeted return and as a resultsuch were paid compensation of $0.1 million, $2.7 million, and $0.7 million for the planned expiration.
Subsequent toyears ended December 31, 2020, the NRP joint venture sold 2 properties.2023, 2022, and 2021, respectively, which is recorded in Fees and Management Income on our consolidated statements of operations.
The following table summarizes balances on the consolidated balance sheets related to our unconsolidated joint ventures as of December 31, 20202023 and 20192022 (dollars in thousands):
| | 2020 | | 2019 |
| 2023 | | | 2023 | | 2022 |
| Joint Venture | Joint Venture | Ownership Percentage | | Number of Shopping Centers | | Investment Balance | | Unamortized Basis Difference | | Ownership Percentage | | Number of Shopping Centers | | Investment Balance | | Unamortized Basis Difference | Joint Venture | Ownership Percentage | | Number of Shopping Centers | | Investment Balance | | Ownership Percentage | | Number of Shopping Centers | | Investment Balance |
| GRP I | |
| NRP | NRP | 20 | % | | 5 | | $ | 6,304 | | | $ | 1,381 | | | 20 | % | | 8 | | $ | 10,183 | | | $ | 3,189 | |
| GRP I | 14 | % | | 20 | | 31,062 | | | 0 | | | 15 | % | | 17 | | 27,356 | | | 0 | |
| GRP II | N/A | | N/A | | N/A | | N/A | | 10 | % | | 3 | | 5,315 | | | 879 | |
| | | | | | | | | | | |
| PHILLIPS EDISON & COMPANY DECEMBER 31, 2023 FORM 10-K | | | F-19 |
The following table summarizes the activity on the consolidated statements of operations related to our unconsolidated joint ventures as of December 31, 2020, 2019,2023, 2022, and 20182021 (in thousands):
| | 2023 | | | 2023 | | 2022 | | 2021 |
| Distributions to PECO After Formation or Assumption | |
| GRP I | |
| GRP I | |
| GRP I | |
| NRP | |
| | 2020 | | 2019 | | 2018 |
| Distributions to PECO After Formation or Assumption | |
Gain (Loss) from Unconsolidated Joint Ventures(1) | |
Gain (Loss) from Unconsolidated Joint Ventures(1) | |
Gain (Loss) from Unconsolidated Joint Ventures(1) | |
| GRP I | |
| GRP I | |
| GRP I | |
| NRP | NRP | $ | 4,192 | | | $ | 7,167 | | | $ | 200 | |
| GRP I | 1,047 | | | 2,025 | | | 0 | |
| GRP II | 177 | | | 40 | | | N/A |
| | Gain (Loss) from Unconsolidated Joint Ventures | |
Amortization and Write-Off of Basis Differences(1) | |
Amortization and Write-Off of Basis Differences(1) | |
Amortization and Write-Off of Basis Differences(1) | |
| NRP | NRP | $ | 2,119 | | | $ | 3,989 | | | $ | (73) | |
| GRP I | (309) | | | (72) | | | (35) | |
| GRP II | 42 | | | 6 | | | N/A |
| | Amortization and Write-Off of Basis Differences | |
| NRP | NRP | $ | 1,808 | | | $ | 2,837 | | | $ | 177 | |
GRP II(1) | 879 | | | 17 | | | N/A |
| NRP | |
(1)As partRecorded in Other Expense, Net in the consolidated statements of the merger between GRP I and GRP II, the total remaining value of our GRP II investment of $5.1 million was contributed to GRP I, and the result of this transaction was an increase in our GRP I investment of $5.1 million.operations.
The following is a summary of Other Assets, Net outstanding as of December 31, 20202023 and 2019, excluding amounts related to assets classified as held for sale2022 (in thousands):
| | 2020 | | 2019 |
| 2023 | | | 2023 | | 2022 |
| Other assets, net: | Other assets, net: | |
| Deferred leasing commissions and costs | Deferred leasing commissions and costs | $ | 41,664 | | | $ | 38,738 | |
| Deferred leasing commissions and costs | |
| Deferred leasing commissions and costs | |
Deferred financing expenses(1) | Deferred financing expenses(1) | 13,971 | | | 13,971 | |
| Office equipment, ROU assets, and other | 21,578 | | | 19,430 | |
| Office equipment, including capital lease assets, and other | |
| Corporate intangible assets | Corporate intangible assets | 6,804 | | | 4,883 | |
| Total depreciable and amortizable assets | Total depreciable and amortizable assets | 84,017 | | | 77,022 | |
| Accumulated depreciation and amortization | Accumulated depreciation and amortization | (45,975) | | | (35,055) | |
| Net depreciable and amortizable assets | Net depreciable and amortizable assets | 38,042 | | | 41,967 | |
Accounts receivable, net(2) | Accounts receivable, net(2) | 46,893 | | | 46,125 | |
| Accounts receivable - affiliates | Accounts receivable - affiliates | 543 | | | 728 | |
Deferred rent receivable, net(3) | Deferred rent receivable, net(3) | 32,298 | | | 29,291 | |
| Derivative asset | 0 | | | 2,728 | |
| Prepaid expense and other | 8,694 | | | 7,851 | |
| Derivative assets | |
| Prepaid expenses and other | |
Investment in third parties(4) | |
| Investment in marketable securities | |
| Total other assets, net | Total other assets, net | $ | 126,470 | | | $ | 128,690 | |
(1)Deferred financing expenses per the above table are related to our revolving line of credit facility, and thusas such we have elected to classify them as an asset rather than as a contra-liability.
(2)Net of $8.9$1.9 million and $6.9$3.0 million of general reserves for uncollectible amounts as of December 31, 20202023 and 2019,2022, respectively. Receivables that were removed for tenants considered to be non-creditworthy were $22.8$6.0 million and $6.2 million as of December 31, 20202023 and 2019,2022, respectively.
(3)Net of $4.4$4.6 million and $0.7$4.2 million of adjustmentsreceivables removed as of December 31, 20202023 and 2019,2022, respectively, forrelated to straight-line rent removed for tenants previously or currently considered to be non-creditworthy.
(4)We recorded an impairment of our investment in a third-party company of $3.0 million in Other Expense, Net on our consolidated statement of operations for the year ended December 31, 2023 (see Note 15).
| | | | | | | | | | | |
| PHILLIPS EDISON & COMPANY DECEMBER 31, 2023 FORM 10-K | | | F-20 |
The following is a summary of the outstanding principal balances and interest rates, which includes the effect of derivative financial instruments, onfor our debt obligations as of December 31, 20202023 and 2019 (in2022 (dollars in thousands):
| | | | Interest Rate(1) | | 2020 | | 2019 | | Interest Rate(1) | | 2023 | | 2022 |
| Revolving credit facility | Revolving credit facility | LIBOR + 1.4% | | $ | 0 | | | $ | 0 | |
Term loans(2) | Term loans(2) | 1.4% - 4.6% | | 1,622,500 | | | 1,652,500 | |
| Senior unsecured notes due 2031 | |
| Secured loan facilities | Secured loan facilities | 3.4% - 3.5% | | 395,000 | | | 395,000 | |
| Mortgages | Mortgages | 3.5% - 7.2% | | 290,022 | | | 324,578 | |
| Finance lease liability | Finance lease liability | | 164 | | | 443 | |
| Discount on notes payable | |
| Assumed market debt adjustments, net | Assumed market debt adjustments, net | | (1,543) | | | (1,218) | |
| Deferred financing expenses, net | Deferred financing expenses, net | | (13,538) | | | (17,204) | |
| Total | Total | | $ | 2,292,605 | | | $ | 2,354,099 | |
| Weighted-average interest rate(3) | |
Weighted-average interest rate(3) | |
Weighted-average interest rate(3) | | | | 4.2 | % | | 3.6 | % |
(1)Interest rates are as of December 31, 2020.2023.
(2)Our term loans carry an interest rate of LIBORthe Secured Overnight Financing Rate (“SOFR”) plus a spread. While most of the rates are fixed through the use of swaps, there is a portion of these loans that are not subject to a swap, and thus are still indexed to LIBOR.SOFR.
(3)Includes the effects of derivative financial instruments (see Notes 9 and 16).
2023 Debt Activity—On July 31, 2023, we amended three senior unsecured term loans with a total notional amount of $475 million scheduled to mature during 2024. The three senior unsecured term loans, as amended, have a total notional amount of $484.8 million. The $161.8 million unsecured term loan is priced based on a leverage grid, which is currently at SOFR plus 1.35% and is scheduled to mature on January 31, 2026 extendable with two one-year options to 2028. The $158 million and $165 million unsecured term loans are priced based on a leverage grid, which is currently at SOFR plus 1.35% and mature on January 31, 2027.
During the year ended December 31, 2023, we repaid $47.3 million in mortgage debt.
2022 Debt Activity—In May 2022, we amended our credit facility agreement (the “Amendment”) to, among other things, increase the total amount available under our unsecured revolving credit facility from $500 million to $800 million. The unsecured revolving credit facility also includes an accordion feature that permits us to increase our aggregate borrowing capacity thereunder to up to $1 billion, subject to the satisfaction of certain conditions. The unsecured revolving credit facility is scheduled to mature in January 2026, extendable at our option to January 2027. In addition to expanding the borrowing capacity, the Amendment replaced the London Interbank Offered Rate (“LIBOR”) with SOFR as the benchmark interest rate for the unsecured revolving credit facility and the two $240 million senior unsecured term loan tranches, maturing in November 2025 and July 2026. In August 2022, we amended two of our interest rate swaps with a total notional amount of $430 million to replace LIBOR with SOFR as the benchmark interest rate in conjunction with the Amendment (see Note 9).
In November 2022, we amended our three remaining LIBOR term loans with a notional amount of $475 million to replace LIBOR with SOFR as the benchmark interest rate. In December 2022, our two remaining LIBOR swaps with a total notional amount of $325 million were amended to transition from LIBOR to SOFR as the benchmark interest rate (see Note 9).
During the year ended December 31, 2022, we repaid $80.1 million in mortgage debt.
Revolving Credit Facility—We have a $500an $800 million senior unsecured revolving credit facility with availability of $490.4$606.6 million, which is net of current issued letters of credit, as of December 31, 2020.2023. The maturity date is October 2021, with additional options to extend the maturity to October 2022. WeJanuary 2026, and we pay a facility fee of 0.25% on the unused portion oftotal amount under the facility if our borrowings are less than 50% of our capacity or a fee of 0.15% if our borrowings are greater than 50%, but less than 100%, of our capacity.facility.
In April 2020, we borrowed $200 million on our revolving credit facility to meet our operating needs for a sustained period due to the COVID-19 pandemic. Our rent and recovery collections during the second quarter, combined with other cost saving initiatives, sufficiently funded our short term operating needs and provided enough stability to allow us to repay in full the outstanding balance on our revolving credit facility in June 2020.
Term Loans—We have sixfive unsecured term loans with maturities ranging from 20222025 to 2025.2027. Our term loans have interest rates of LIBORSOFR plus interest rate spreads based on our leverage ratios.investment grade rating. We have utilized interest rate swaps to fix the rates on the majority of our term loans, with $580.5$264.8 million in term loans not fixed through such swaps.
In January 2020, we made the final $30 million payment on our term loan maturing in 2021.
In May 2019, we exercised a $60 million delayed draw feature on one of our term loans, and we used the proceeds from this draw to pay down our revolving credit facility. In September 2019, we repriced a $200 million term loan, lowering the interest rate spread from 1.75% over LIBOR to 1.25% over LIBOR, while maintaining the current maturity of September 2024. In October 2019, we repriced a $175 million term loan from a spread of 1.75% over LIBOR to 1.25% over LIBOR, while maintaining the current maturity of October 2024. Finally, in December 2019, we paid down $265.9 million in term loan debt primarily with the proceeds from a secured loan as well as the proceeds from property dispositions.
As of December 31, 20202023 and 2019,2022, the weighted-average interest rate, including the impact of swaps, on our term loans was 2.7%4.7% and 3.2%3.8%, respectively.
Secured Debt—Our secured debt includes two facilities secured by certain properties in our portfolio, mortgage loans secured by individual properties, and finance leases. The interest rates on our secured debt are fixed. At the closing of the Merger, we assumed $102.3 million in mortgage loans. We contributed $175.0 million of our secured debt to GRP I in November 2018. In connection with the debt contributed to GRP I, we wrote-off deferred financing expenses of $2.1 million. In December 2019, we executed a $200 million secured loan. The loan matures in 2030 and has a 3.35% interest rate. As of December 31, 20202023 and 20192022, our weighted average interest rate for our secured debt was 4.0%3.7% and 4.1%3.8%, respectively.
| | | | | | | | | | | |
| PHILLIPS EDISON & COMPANY DECEMBER 31, 2023 FORM 10-K | | | F-21 |
Debt Allocation—The allocation of total debt between fixed-rate and variable-rate as well as between secured and unsecured, excluding market debt adjustments, discount on senior notes, and deferred financing expenses, net, and including the effects of derivative financial instruments as of December 31, 20202023 and 2019,2022, is summarized below (in thousands):
| | | | 2020 | | 2019 | | 2023 | | 2022 |
As to interest rate:(1) | |
| Fixed-rate debt | $ | 1,727,186 | | | $ | 2,122,021 | |
| As to interest rate: | |
Fixed-rate debt(1) | |
Fixed-rate debt(1) | |
Fixed-rate debt(1) | |
| Variable-rate debt | Variable-rate debt | 580,500 | | | 250,500 | |
| Total | Total | $ | 2,307,686 | | | $ | 2,372,521 | |
| As to collateralization: | As to collateralization: | | | |
| Unsecured debt | Unsecured debt | $ | 1,622,500 | | | $ | 1,652,500 | |
| Unsecured debt | |
| Unsecured debt | |
| Secured debt | Secured debt | 685,186 | | | 720,021 | |
| Total | Total | $ | 2,307,686 | | | $ | 2,372,521 | |
| Weighted-average interest rate(1) | 3.1 | % | | 3.4 | % |
(1)IncludesFixed-rate debt includes, and variable-rate debt excludes, the effectsportion of derivative financial instrumentssuch debt that has been hedged by interest rate derivatives. As of December 31, 2023, $700 million in variable rate debt is hedged to a fixed rate for a weighted-average period of 1.5 years (see Notes 109 and 17)16).
Maturity Schedule—Below is our maturity schedule with the respective principal payment obligations, excluding finance lease liabilities, market debt adjustments, discount on senior notes, and deferred financing expenses, net (in thousands):
| | | | 2021 | | 2022 | | 2023 | | 2024 | | 2025 | | Thereafter | | Total | | 2024 | | 2025 | | 2026 | | 2027 | | 2028 | | Thereafter | | Total |
| | Term loans | $ | 0 | | | $ | 375,000 | | | $ | 300,000 | | | $ | 475,000 | | | $ | 472,500 | | | $ | 0 | | | $ | 1,622,500 | |
Unsecured debt(1) | |
Unsecured debt(1) | |
Unsecured debt(1) | |
| Secured debt | Secured debt | 62,589 | | | 61,898 | | | 79,569 | | | 28,162 | | | 27,881 | | | 424,923 | | | 685,022 | |
| Total | Total | $ | 62,589 | | | $ | 436,898 | | | $ | 379,569 | | | $ | 503,162 | | | $ | 500,381 | | | $ | 424,923 | | | $ | 2,307,522 | |
(1)Includes our revolving credit facility, term loans, and senior notes.
| | |
10.9. DERIVATIVES AND HEDGING ACTIVITIES |
Risk Management Objective of Using Derivatives—We are exposed to certain risks arising from both our business operations and economic conditions. We principally manage our exposure to a wide variety of business and operational risks through management of our core business activities. We manage economic risks, including interest rate, liquidity, and credit risk, primarily by managing the amount, sources, and duration of our debt funding, and through the use of derivative financial instruments. Specifically, we enter into interest rate swaps to manage exposures that arise from business activities that result in the receipt or payment of future known and uncertain cash amounts, the value of which are determined by interest rates. Our derivative financial instruments are used to manage differences in the amount, timing, and duration of our known or expected cash receipts and our known or expected cash payments principally related to our investments and borrowings.
Cash Flow Hedges of Interest Rate Risk—Interest rate swaps designated as cash flow hedges involve the receipt of variable amounts from a counterparty in exchange for our making fixed-rate payments over the life of the agreements without exchange of the underlying notional amount.
The changes in the fair value of derivatives designated, and that qualify, as cash flow hedges are recorded in AOCI and are subsequently reclassified into earnings in the period that the hedged forecasted transaction affects earnings. During the years ended December 31, 20202023 and 2019,2022, such derivatives were used to hedge the variable cash flows associated with certain variable-rate debt. Amounts reported in AOCI related to these derivatives will be reclassified to Interest Expense, Net as interest payments are made on the variable-rate debt. During the next twelve months, we estimate that an additional $19.1$11.5 million will be reclassified from AOCI as an increasea decrease to Interest Expense, Net.
In May 2022, we replaced LIBOR with SOFR as the benchmark interest rate for the two $240 million senior unsecured term loan tranches, maturing in November 2025 and July 2026. In November 2022, we replaced LIBOR with SOFR as the benchmark interest rate for our three remaining LIBOR term loans, which had a notional amount of $475 million. In accordance with ASC Topic 848, Reference Rate Reform (“ASC 848”), we elected not to dedesignate our LIBOR denominated interest rate swaps related to this hedged debt. As a result of these changes in the benchmark rate of the LIBOR term loans, we amended all of our interest rate swaps with a total notional amount of $755 million to change the benchmark interest rate from LIBOR to SOFR. As a result of these amendments, we elected to apply practical expedients in accordance with ASC 848 related to contract modifications, changes in critical terms, and updates to the designated hedged risks as qualifying changes have been made to applicable debt and derivative contracts.
In March 2023, we entered into an interest rate swap which has a notional amount of $200 million and swaps SOFR for a fixed rate of approximately 3.36% which became effective in September 2023 and matures in September 2026.
In January 2024, we entered into an interest rate swap which has a notional amount of $150 million and swaps SOFR for a fixed rate of approximately 3.45% effective September 2024 and maturing December 2025.
| | | | | | | | | | | |
| PHILLIPS EDISON & COMPANY DECEMBER 31, 2023 FORM 10-K | | | F-22 |
The following is a summary of our interest rate swaps that were designated as cash flow hedges of interest rate risk as of December 31, 20202023 and 20192022 (notional amounts in thousands):
| | | | | | | | | | | |
| 2020 | | 2019 |
| Count | 6 | | | 9 | |
| Notional amount | $ | 1,042,000 | | | $ | 1,402,000 | |
| Fixed LIBOR | 1.3% - 2.9% | | 0.8% - 2.9% |
| Maturity date | 2021 - 2025 | | 2020 - 2025 |
We assumed 5 hedges with a notional amount of $570 million as a part of the Merger. The fair value of the five hedges assumed was $14.7 million and is amortized over the remaining lives of the respective hedges and recorded in Interest Expense, Net in the consolidated statements of operations. The net unamortized amount remaining as of December 31, 2020 was $5.0 million. | | | | | | | | | | | |
| 2023 | | 2022 |
| Count | 4 | | | 4 | |
| Notional amount | $ | 700,000 | | | $ | 755,000 | |
| Fixed SOFR | 2.1% - 3.4% | | 1.2% - 2.8% |
| Maturity date | 2024 - 2026 | | 2023 - 2025 |
| Weighted-average term (in years) | 1.5 | | 1.6 |
The table below details the nature of the gain and loss recognized on interest rate derivatives designated as cash flow hedges in the consolidated statements of operations for the years ended December 31, 2020, 2019,2023, 2022, and 20182021 (in thousands):
| | | | | | | | | | | | | | | | | |
| | 2020 | | 2019 | | 2018 |
| Amount of loss recognized in Other Comprehensive (Loss) Income | $ | 50,552 | | | $ | 35,865 | | | $ | 895 | |
| Amount of loss reclassified from AOCI into interest expense | 16,732 | | | 2,409 | | | 3,261 | |
| | | | | | | | | | | | | | | | | |
| | 2023 | | 2022 | | 2021 |
| Amount of gain recognized in Other Comprehensive (Loss) Income | $ | 8,586 | | | $ | 46,839 | | | $ | 12,501 | |
| Amount of (gain) loss reclassified from AOCI into Interest Expense, Net | (20,402) | | | 4,446 | | | 19,499 | |
Credit-risk-related Contingent Features—We have agreements with our derivative counterparties that contain provisions where, if we default, or are capable of being declared in default, on any of our indebtedness, we could also be declared to be in default on our derivative obligations. As of December 31, 2020, the2023, there were no derivatives with a fair value of our derivatives in a net liability position, which includedwould include accrued interest but excludedexclude any adjustment for nonperformance risk related to these agreements, was approximately $54.8 million. As of December 31, 2020, we had not posted any collateral related to these agreements and were not in breach of any agreement provisions. If we had breached any of these provisions, we could have been required to settle our obligations under the agreements at their termination value of $54.8 million.agreements.
General—We have elected to be taxed as a REIT under the IRC. To qualify as a REIT, we must meet a number of organizationorganizational and operational requirements, including a requirement to annually distribute to our stockholders at least 90% of our REIT taxable income, determined without regard to the dividends paid deduction and excluding net capital gains. We intend to continue to adhere to these requirements and to maintain our REIT status. As a REIT, we are entitled to a deduction for some or all of the distributions we pay to our stockholders. Accordingly, we are generally subject to U.S. federal income taxes on any taxable income that is not currently distributed to our stockholders. If we fail to qualify as a REIT in any taxable year, we will be subject to U.S. federal income taxes and may not be able to qualify as a REIT until the fifth taxable year following the year of disqualification.
Notwithstanding our qualification as a REIT, we may be subject to certain state and local taxes on our income or properties. In addition, our consolidated financial statements include the operations of certain wholly ownedwholly-owned entities that have jointly elected to be treated as a TRS entities and are subject to U.S. federal, state, and local incomes taxes at regular corporate tax rates. As a REIT, we may also be subject to certain U.S. federal excise taxes if we engage in certain types of transactions.
Income tax benefits from uncertain tax positions are recognized in the consolidated financial statements only if we believe it is more likely than not that the uncertain tax position will be sustained based solely on the technical merits of the tax position and consideration of the relevant taxing authority's widely understood administrative practices and precedents. We do not believe that we have any uncertain tax positions at December 31, 20202023 and 2019.2022.
The statute of limitations for the federal income tax returns remain open for the 20172020 through 20192022 tax years. The statute of limitations for state income tax returns remain open in accordance with each state's statute.
Our accounting policy is to classify interest and penalties as a component of income tax expense. We accrued noan insignificant amount of interest orand penalties as of December 31, 20202023. We accrued an insignificant amount of interest and 2019.no penalties as of December 31, 2022.
Deferred Tax Assets and Liabilities—Deferred income taxes are accounted for under the asset and liability method. Deferred tax assets and liabilities are recognized for the estimated future tax consequences attributable to differences between the financial statement carrying amounts of existing assets and liabilities and their respective tax bases. Deferred tax assets and liabilities are measured using enacted income tax rates in effect for the year in which these temporary differences are expected to reverse. Deferred tax assets are recognized only to the extent that it is more likely than not that they will be realized based on consideration of available evidence, including future reversal of existing taxable temporary differences, the magnitude and timing of future projected taxable income, and tax planning strategies. We believe, based on available evidence, it is not more likely than not that our net deferred tax assetsasset will be realized in future periods and, therefore, have recorded a valuation allowance equal to the net deferred tax asset balance.
| | | | | | | | | | | |
| PHILLIPS EDISON & COMPANY DECEMBER 31, 2023 FORM 10-K | | | F-23 |
The following is a summary of our deferred tax assets and liabilities as of December 31, 20202023 and 20192022 (in thousands):
| | | | 2020 | | 2019 | | 2023 | | 2022 |
| Deferred tax assets: | Deferred tax assets: | |
| Equity compensation | |
| Equity compensation | |
| Equity compensation | |
| Accrued compensation | Accrued compensation | $ | 3,250 | | | $ | 3,912 | |
| Accrued expenses and reserves | 89 | | | 70 | |
| Net operating loss (“NOL”) carryforward | Net operating loss (“NOL”) carryforward | 2,787 | | | 2,885 | |
| Reserves | |
| Other | Other | 306 | | | 362 | |
| Gross deferred tax assets | 6,432 | | | 7,229 | |
| Gross deferred tax asset | |
| Less: valuation allowance | Less: valuation allowance | (3,183) | | | (3,661) | |
| Total deferred tax asset | Total deferred tax asset | 3,249 | | | 3,568 | |
| Deferred tax liabilities: | Deferred tax liabilities: | |
| Real estate assets and other capitalized assets | (3,236) | | | (3,546) | |
| Real estate and capitalized salaries | |
| Real estate and capitalized salaries | |
| Real estate and capitalized salaries | |
| Investment in third parties | |
| Other | Other | (13) | | | (22) | |
| Total deferred tax liabilities | Total deferred tax liabilities | (3,249) | | | (3,568) | |
| Net deferred tax asset | Net deferred tax asset | $ | 0 | | | $ | 0 | |
Our deferred tax assets and liabilities result from the activities of our TRS entities. The TRS entities have a federal NOL carryforward of $12.2approximately $4.0 million. Of this amount, $1.3 million was generated in 2017 and will expire in 2037 if the NOL is not utilized. The remainingfederal NOL carryforward can be carried forward indefinitely. As of December 31, 2020,2023, the TRS entities have state NOL carryforwards of $5.0approximately $4.1 million, which will expire as determined under each state's statute.
Differences between the net income or loss presented on the consolidated statements of operations and taxable income are primarily related to the timing of the recognition of gain on the sale of investment properties for financial reporting purposes and tax reporting, the recognition of impairment expense for financial reporting purposes which is not deductible for tax reporting purposes, and differences in the recognition of rental income and depreciation and amortization expense for both financial reporting and tax reporting.
Distributions—The following table reconciles Net Income (Loss) Attributable to Stockholders to REIT taxable income before the dividends paid deduction for the years ended December 31, 2020, 20192023, 2022, and 20182021 (in thousands):
| | | | | | | | | | | | | | | | | |
| | 2020 | | 2019 | | 2018 |
| Net income (loss) attributable to stockholders | $ | 4,772 | | | $ | (63,532) | | | $ | 39,138 | |
| Net (income) loss from TRS | (702) | | | 5,346 | | | (1,171) | |
| Net income (loss) attributable to REIT operations | 4,070 | | | (58,186) | | | 37,967 | |
| Book/tax differences | 63,846 | | | 153,047 | | | 33,858 | |
| REIT taxable income subject to 90% dividend requirement | $ | 67,916 | | | $ | 94,861 | | | $ | 71,825 | |
| | | | | | | | | | | | | | | | | |
| | 2023 | | 2022 | | 2021 |
| Net income attributable to stockholders | $ | 56,848 | | | $ | 48,323 | | | $ | 15,121 | |
| Net (income) loss from TRS entities | (9,768) | | | 968 | | | (533) | |
| Net income attributable to REIT operations | 47,080 | | | 49,291 | | | 14,588 | |
| Book/tax differences | 54,311 | | | 47,730 | | | 69,943 | |
| REIT taxable income | 101,391 | | | 97,021 | | | 84,531 | |
| Less: Capital gains | (96) | | | — | | | (19,765) | |
| REIT taxable income subject to 90% dividend requirement | $ | 101,295 | | | $ | 97,021 | | | $ | 64,766 | |
For tax purposes, totalTotal gross distributions to our stockholders for the year ended December 31, 2020 were approximately $64.7 million. As permitted under the IRC, we will utilize approximately $3.2 millionexceeded 100% of our January 2021 distribution to offset our 2020 REIT taxable income. Our distributions to stockholdersincome for the years ended December 31, 20192023, 2022, and 2018, respectively, have exceeded 100% of the REIT taxable income.2021.
The tax characterization of our distributions declared for the years ended December 31, 20202023, 2022, and 20192021 was as follows:
| | 2020 | | 2019 |
| 2023 | | | 2023 | | 2022 | | 2021 |
| Common stock: | Common stock: | |
| Ordinary dividends | Ordinary dividends | 100.0 | % | | 38.0 | % |
| Ordinary dividends | |
| Ordinary dividends | | 75.9 | % | | 77.4 | % | | 62.8 | % |
| Non-dividend distributions | Non-dividend distributions | 0 | % | | 53.4 | % | Non-dividend distributions | 24.0 | % | | 22.6 | % | | 18.1 | % |
| Capital gain distributions | 0 | % | | 8.6 | % |
| Total distributions per share | 100.0 | % | | 100.0 | % |
Capital gain distributions(1) | | Capital gain distributions(1) | 0.1 | % | | — | % | | 19.1 | % |
| Total distributions per share of common stock | | Total distributions per share of common stock | 100.0 | % | | 100.0 | % | | 100.0 | % |
(1)Pursuant to U.S. Treasury Regulation §1.1061-6(c) and §1061 of the IRC, the One Year Amounts and Three Year Amounts disclosures are both zero with respect to direct and indirect holders of “applicable partnership interests” for us and our subsidiary REIT, Phillips Edison Institutional REIT, LLC for all years presented.
| | | | | | | | | | | |
| PHILLIPS EDISON & COMPANY DECEMBER 31, 2023 FORM 10-K | | | F-24 |
| | |
12.11. COMMITMENTS AND CONTINGENCIES |
Litigation—We are involved in various claims and litigation matters arising in the ordinary course of business, some of which involve claims for damages. Many of these matters are covered by insurance, although they may nevertheless be subject to deductibles or retentions. Although the ultimate liability for these matters cannot be determined, based upon information currently available, we believe the resolution of such claims and litigation will not have a material adverse effect on our consolidated financial statements.
Environmental Matters—In connection with the ownership and operation of real estate, we may potentially be liable for costs and damages related to environmental matters. In addition, we may own or acquire certain properties that are subject to environmental remediation. Depending on the nature of the environmental matter, the seller of the property, a tenant of the property, and/or another third party may be responsible for environmental remediation costs related to a property. Additionally, in connection with the purchase of certain properties, the respective sellers and/or tenants may agree to indemnify us against future remediation costs. We also carry environmental liability insurance on our properties that provides limited coverage for any remediation liability and/or pollution liability for third-party bodily injury and/or property damage claims for which we may be liable. We are not currently aware of any environmental matters whichthat we believe are reasonably likely to have a material effect on our consolidated financial statements.
Captive Insurance—Our captive insurance company, Silver Rock Insurance, Inc. (“Silver Rock”), provides general liability insurance, wind, reinsurance, and other coverage to us and certain related-partyour GRP I joint ventures.venture. We capitalize Silver Rock in accordance with applicable regulatory requirements.
Silver Rock establishedestablishes annual premiums based on the past loss experience of the insured properties. An independent third party was engaged to perform an actuarial estimate of projected future claims, related deductibles, and projected future expenses necessary to fund associated risk management programs. Premiums paid to Silver Rock may be adjusted based on this estimate. Premiums paid to Silver Rock may be reimbursed by tenants pursuant to specific lease terms.
As of December 31, 2020,2023, we had four letters of credit outstanding totaling approximately $8.0$12.5 million to provide security for our obligations under ourSilver Rock’s insurance and reinsurance contracts.
The following is a summary of the activitiesactivity in the liability for unpaid losses, which is recorded in Accounts Payable and Other Liabilities on our consolidated balance sheets, for the years ended December 31, 20202023 and 20192022 (in thousands):
| | 2020 | | 2019 |
| 2023 | | | 2023 | | 2022 |
| Beginning balances | Beginning balances | $ | 6,021 | | | $ | 5,458 | |
| Incurred related to: | Incurred related to: | |
| Current year | |
| Current year | |
| Current year | Current year | 1,943 | | | 1,792 | |
| Prior years | Prior years | 2,249 | | | 1,248 | |
| Total incurred | Total incurred | 4,192 | | | 3,040 | |
| Paid related to: | Paid related to: | |
| Current year | Current year | 36 | | | 78 | |
| Current year | |
| Current year | |
| Prior years | Prior years | 2,791 | | | 2,399 | |
| Total paid | Total paid | 2,827 | | | 2,477 | |
| Liabilities for unpaid losses as of December 31 | Liabilities for unpaid losses as of December 31 | $ | 7,386 | | | $ | 6,021 | |
COVID-19—As of December 31, 2020, we were not aware of any significant liabilities or obligations to waive rent that we have incurred under force majeure or co-tenancy clauses in tenant leases.
Development and Redevelopment—As of December 31, 2020, we had approximately $7.6 million in an active anchor redevelopment project that we have agreed to perform, of which $6.1 million is expected to be funded in 2021.
| | | | | | | | | | | |
| PHILLIPS EDISON & COMPANY DECEMBER 31, 2023 FORM 10-K | | | F-25 |
General—The holders of common stock are entitled to one vote per share on all matters voted on by stockholders, including one vote per nominee in the election of the Board. Our charter does not provide for cumulative voting in the election of directors.
At-the-Market Offering (“ATM”)—On May 6, 2020, our Board decreased the EVPS of our common stock to $8.75 based substantially on the estimated market value of our portfolio of real estate properties and our third-party investment management business as of March 31, 2020. The decrease was primarily driven by the negative impact of the COVID-19 pandemic on our non-grocery tenants resulting from social distancing and “stay-at-home” guidelinesFebruary 10, 2022, we and the uncertaintyOperating Partnership entered into a sales agreement relating to the potential sale of the duration and full effect on the overall economy. We engaged a third-party valuation firm to provide a calculation of the range in EVPS of our common stock as of March 31, 2020, which reflected certain balance sheet assets and liabilities as of that date. Previously, the EVPS of our common stock was set at $11.10, based substantially on the estimated market value of our portfolio of real estate properties and our third-party investment management business as of March 31, 2019.
Distributions—On March 27, 2020, our Board suspended stockholder distributions, effective after the payment of the March 2020 distribution on April 1, 2020, as a result of the uncertainty surrounding the COVID-19 pandemic. On November 4, 2020,
our Board authorized distributions for the month of December 2020, for stockholders of record at the close of business on December 28, 2020, equal to a monthly amount of $0.02833333 per shareshares of common stock or $0.34 annualized. On December 14, 2020, our Board announced thatpursuant to a continuous offering program. In accordance with the dateterms of record for December distributions was moved to December 31, 2020. OP unit holders received distributions at the same rate as common stockholders. We paid this distribution on January 12, 2021.
Dividend Reinvestment Plan—The DRIP allows stockholders to invest distributions in additionalsales agreement, we may offer and sell shares of our common stock subjecthaving an aggregate offering price of up to certain limits. Stockholders who elect$250 million from time to participate intime through our sales agents, or, if applicable, as forward sellers. During the DRIP may choose to invest all or a portion of their cash distributions inthree months ended December 31, 2023, we issued 2.2 million shares of our common stock at a gross weighted average price equal to our most recent EVPS.
Stockholders who elect to participateof $35.92 per share under the ATM program for net proceeds of $77.5 million, after approximately $0.8 million in commissions. During the DRIP, and who are subject to U.S. federal income taxation laws, will incur a tax liability on an amount equal to the fair value on the relevant distribution date of theyear ended December 31, 2023, we issued 4.2 million shares of our common stock purchased with reinvested distributions, even though such stockholders have elected not to receiveat a gross weighted average price of $35.76 per share under the distributionsATM program for net proceeds of $147.6 million, after approximately $1.5 million in cash.
On March 27, 2020,commissions. During the DRIP was suspended, andthree months ended December 31, 2022, no shares were issued under the March 2020 distribution was paid in all cash on April 1, 2020. On November 4, 2020, our Board reinstatedATM program. During the DRIP, which became effective beginning with theyear ended December 2020 distribution paid in January 2021.
Tender Offer—On November 4, 2020, our Board approved a voluntary tender offer that commenced on November 10, 2020 (the “Tender Offer”) for up to 4.531, 2022, we issued 2.6 million shares of our outstanding common stock at a gross weighted average price of $5.75$34.23 per share under the ATM program for net proceeds of $89.2 million, after approximately $0.9 million in commissions. As of December 31, 2023, approximately $10.8 million of common stock remained available for issuance under the ATM program.
Subsequent to December 31, 2023, we issued approximately 46,000 additional shares of our common stock at a totalgross weighted average price of $37.05 per share under the ATM program for net proceeds of $1.7 million, after approximately $17,000 in commissions.
Class B Common Stock—On June 18, 2021, our stockholders approved the Articles of Amendment that effected the Recapitalization, wherein each share of our common stock outstanding at the time the amendment became effective was converted into one share of a newly created class of Class B common stock.
Our Class B common stock was identical to our common stock, except that it was not listed on a national securities exchange. Per the terms of the Recapitalization, on January 18, 2022, each share of our Class B common stock automatically converted into one share of our listed common stock.
On May 5, 2022, we filed Articles Supplementary to our charter with the Maryland State Department of Assessments and Taxation in order to reclassify and designate all of the 350 million authorized shares of our Class B common stock, $0.01 par value per share, all of which were unissued at such time, as shares of our common stock, $0.01 par value per share. We no longer have Class B common stock authorized for issue.
Reverse Stock Split—On July 2, 2021, we effected a one-for-three reverse stock split. Concurrent with the reverse split, the Operating Partnership enacted a one-for-three reverse split of its outstanding OP units. Neither the number of authorized shares nor the par value of approximately $26 million. On December 14, 2020, the Tender Offer was amended to extend the expiration date to December 29, 2020, and the offer to purchase shares was increased to approximately 17.4 million shares, forcommon stock were impacted. As a total value of approximately $100 million. Allresult of the other termsreverse split, every three shares of our common stock or OP units were automatically combined and conditionsconverted into one issued and outstanding share of common stock or OP unit rounded to the Tender Offer remained unchanged. nearest 1/100th share. The reverse stock split impacted all common stock and OP units proportionately and had no impact on any stockholder’s percentage ownership of common stock.
In connection with the Tender Offer,reverse stock split, the number of shares of common stock and OP units underlying the outstanding share-based awards was also proportionately reduced. All references to shares of common stock, number of OP units, and per share data for all periods presented in our consolidated financial statements and notes have been adjusted to reflect the reverse split on a retroactive basis.
Underwritten IPO—On July 19, 2021, we repurchased 13.5completed our underwritten IPO and issued 17.0 million shares of common stock at an offering price to the public of $28.00 per share. We used a portion of the net proceeds to reduce our leverage and used the remaining amount to fund external growth with property acquisitions and for a total valueother general corporate uses. As part of $77.6the underwritten IPO, underwriters were granted an option exercisable within 30 days from July 14, 2021 to purchase up to an additional 2.6 million which includes the issuance of 2.8 million common shares in redemption of 2.8 million OP units converted at the time of repurchase. The $77.6 million due to shareholders who tendered their shares was not yet paid as of December 31, 2020, and is recorded as Accounts Payable and Other Liabilities on our consolidated balance sheets. The amount was subsequently paid on January 5, 2021.
Share Repurchase Program—Our SRP provides an opportunity for stockholders to have shares of common stock repurchased, subject to certain restrictionsat the underwritten IPO price, less underwriting discounts and limitations. The Board reserves the right, in its sole discretion, at any time and from time to time, to reject any request for repurchase.
commissions. On August 7, 2019, the Board suspended the SRP with respect to standard repurchases. The SRP for death, qualifying disability, or determination of incompetence (“DDI”) was suspended effective March 27, 2020, in response to the uncertainty of COVID-19. Both the SRP with respect to standard repurchases and the SRP for DDI remains suspended as of December 31, 2020.
On January 8,July 29, 2021, the Board adoptedunderwriters exercised their option. The underwritten IPO, including the Fourth Amendedunderwriters’ overallotment election, resulted in gross proceeds of $547.4 million.
Distributions—In 2023, we declared and Restated Share Repurchase Program (“Fourth Amended SRP”), effective January 14, 2021. Under the Fourth Amended SRP, share repurchases for DDI have been reinstated at $5.75paid monthly distributions of $0.0933 per share and OP unit, or $1.12 annualized, for each month beginning January 2023 through August 2023. On September 1, 2023, the Board authorized a 4.5% increase of our monthly distribution rate to $0.0975 per common share and OP unit. We declared and paid monthly distributions of $0.0975 per share and OP unit, or $1.17 annualized, for each month beginning September 2023 through December 2023. Distributions paid to stockholders and OP unit holders of record subsequent to December 31, 2023 were as of March 1, 2021, we have repurchased 0.1 million shares for a total value of $0.4 million. The SRP with respect to standard repurchases remains suspended.follows (dollars in thousands, excluding per share amounts):
| | | | | | | | | | | | | | | | | |
| Month | Date of Record | Date Distribution Paid | Monthly Distribution Rate | | Cash Distribution |
| December | 12/15/2023 | 1/2/2024 | $ | 0.0975 | | | $ | 13,154 | |
| January | 1/16/2024 | 2/1/2024 | 0.0975 | | | 13,223 | |
Convertible Noncontrolling Interests—As of December 31, 20202023 and 2019,2022, we had approximately 39.813.8 million and 42.714.1 million outstanding non-voting OP units, respectively. Additionally, certain of our outstanding restricted share and performance share awards will result in the issuance of OP units upon vesting in future periods. These are included in the outstanding unvested award totals disclosed in Note 14.13.
Under the terms of the Fourth Amended and Restated Agreement of Limited Partnership, OP unit holders may elect to exchangecause the Operating Partnership to redeem their OP units. The Operating Partnership controls the form of the redemption, and may
| | | | | | | | | | | |
| PHILLIPS EDISON & COMPANY DECEMBER 31, 2023 FORM 10-K | | | F-26 |
elect to exchangeredeem OP units for shares of our common stock, provided that the OP units have been outstanding for at least one year, or for cash. As the form of redemption for OP units is within our control, the OP units outstanding as of December 31, 20202023 and 2019,2022 are classified as Noncontrolling Interests within permanent equity on our consolidated balance sheets.
DuringOn January 18, 2022, we issued approximately 1.6 million OP units in full settlement of the yearearn-out liability (see note 16).
The table below is a summary of our OP unit activity for the years ended December 31, 20202023 and 2019, 3.0 million2022 (dollars and 1.9 millionshares in thousands):
| | | | | | | | | | | |
| 2023 | | 2022 |
OP units converted into shares of common stock(1) | 517 | | | 1,169 | |
Distributions declared on OP units(2) | $ | 16,334 | | | $ | 16,241 | |
(1)Prior to the Recapitalization, OP units were converted to shares of common stock at a 1:1 ratio. From the Recapitalization through January 18, 2022, OP units were converted into shares of our Class B common stock at a 1:1 ratio. On January 18, 2022, each share of our Class B common stock automatically converted into one share of our listed common stock, and going forward, OP units will be converted into shares of our common stock at a 1:1 ratio, respectively. Of the OP units converted in 2020, 2.8 million were converted and repurchased as part of the Tender Offer. The $8.3 million and $30.4 million of distributions for the years ended December 31, 2020 and 2019, respectively, that have been paidratio.
(2)Distributions declared on OP units are included in Distributions to Noncontrolling Interests on the consolidated statements of equity.
Nonconvertible Noncontrolling InterestsDividend Reinvestment Plan and Share Repurchase Programs—In addition to partnership unitsOn August 4, 2021, as a result of our underwritten IPO, our Board approved the termination of the Operating Partnership, Noncontrolling Interests also includesDRIP and the original share repurchase program.
On August 3, 2022, our Board approved a 25% minority-owned interest held by a third party in a consolidated partnership, which wasnew share repurchase program of up to $250 million of common stock. The program may be suspended or discontinued at any time, and does not significantobligate us to our results in 2020repurchase any dollar amount or 2019 and ceased a majorityparticular number of its operations in 2019.shares. No share repurchases have been made to date under this program.
Employee Long Term Incentive Plan—We issue stock awards that vest based upon the completion of a service period (“service-based awards”), as well as awards that vest based upon the achievement of certain performance metrics (“performance-based awards”) under our 2020 Omnibus Incentive Plan (“2020 Incentive Plan”), which became effective in June 2020. The 2020 Incentive Plan replaces the Amended and Restated 2010 Long-Term Incentive Plan, which expired in August 2020. Awards to employees under our 2020 Incentive Plan are typically granted and vest during the first quarter of each year. Service-based awards typically follow a four-year graded vesting schedule and will vest in the form of common stock or OP units. For performance-based awards, the number of shares that vest depends on whether certain financial metrics are met, as calculated over a three-year performance period. For each annual performance-based award, 50% of the shares earned vest at the end of the three-year period and 50% of the shares earned vest following an additional year of service. As such, certain units classified as nonvested performance stock awards as of period-end may have met the performance-based requirements for vesting and are now only subject to an additional year of service-based vesting. Vesting of performance awards is in the form of common stock, or certain awards may vest in the form of OP units at the election of the recipient.
We recognize expense for awards with graded vesting under the accelerated recognition method, whereby each vesting is treated as a separate award with expense for each vesting recognized ratably over the requisite service period. We account for forfeitures as they occur. Expense amounts are recorded in General and Administrative or Property Operating on our consolidated statements of operations. ThePrior to our underwritten IPO, the awards arewere valued according to the EVPS for our common stock at the date of grant. Subsequent to our underwritten IPO, awards are valued according to the Nasdaq closing stock price at the date of the grant. Holders of unvested service-based and performance-based awards are entitled to dividend and distribution rights, but are not entitled to voting rights.
In March 2019,Additionally, we issue performance-based awards that are earned based on the achievement of specified performance metrics measured at the end of the three-year performance period. The maximum number of performance-based awards earned cannot exceed two times the target number. Half of the earned performance-based awards vest when earned at the end of the three-year performance period and the second half of the earned performance-based awards vest one year later, subject to continued employment.
Beginning in 2022, our Compensation Committee approved a change to our performance-based long-term incentive program such that the performance-based component of awards under the program will be based on a single metric, total shareholder return relative to the FTSE Nareit Equity Shopping Center Index. Prior to 2022, our performance-based equity grants were based on two separate, equally-weighted performance metrics: (i) three-year average Same-Center NOI growth measured against a peer group of public retail REITs; and (ii) three-year Core Funds From Operations (“FFO”) per share growth measured against the same peer group. Same-Center NOI and Core FFO are both non-GAAP measures.
| | | | | | | | | | | |
| PHILLIPS EDISON & COMPANY DECEMBER 31, 2023 FORM 10-K | | | F-27 |
The fair value of the Company’s Board2023 and 2022 performance-based awards on the date of Directors (the “Committee”grant was $6.0 million and $5.4 million, respectively, using a Monte Carlo simulation to estimate the fair value through a risk-neutral premise. The following is a summary of the significant assumptions used to value the performance-based awards granted during the years ended December 31, 2023 and 2022:
| | | | | | | | | | | |
| 2023 | | 2022 |
| Expected volatility | 38.0 | % | | 54.0 | % |
| Dividend yield | 3.20 | % | | 3.25 | % |
| Risk-free interest rate | 4.63 | % | | 1.52 | % |
In addition to the applicable performance metrics, a net asset value (“NAV”) approved a new form of award agreement under the Company’s Amended and Restated 2010 Long-Term Incentive Plan for performance-based long term incentive units (“Performance LTIP Units”) and made one-time grants of Performance LTIP Units to certain of our executives. Any amounts earned under the Performance LTIP Unit award agreementsmodifier will be applied to the calculation of earned performance-based awards if the NAV per share at the end of the performance period is less than the value at issuance. Subsequent to our underwritten IPO, the NAV per share is measured by the Nasdaq closing stock price at the end of the performance period. Specifically, to the extent performance above the target level is achieved at the end of the performance period, yet our NAV per share at the end of the performance period is less than the value at issuance, the amount of earned awards will be capped at the target amount. The remaining amount of awards (the difference between those that would have otherwise been earned based on actual performance and the target level) may become earned, and thereafter vested, if our NAV per share exceeds the NAV per share at the beginning of the performance period for 20 consecutive trading days up to five years following the completion of the performance period, assuming continued employment on such date.
The performance period for the performance-based awards granted in 2018 and 2019 ended on December 31, 2020 and 2021, respectively. Based on our performance through December 31, 2020 and 2021, these awards would have been earned at maximum, but because our NAV per share growth for that same performance period was negative, the amount of earned awards was capped at the target amount. Based on the performance of common stock closing prices throughout the fourth quarter of 2021, we believed it was more than probable that we would achieve positive NAV per share growth for 20 consecutive trading days prior to December 31, 2025 and 2026. As such, we recognized approximately $4.2 million of expense associated with achieving the maximum award for both of these grants during the year ended December 31, 2021, of which $3.2 million was recorded in General and Administrative and $1.0 million was recorded in Property Operating on our consolidated statements of operations. During the year ended December 31, 2022, the unearned portion in excess of target and up to the maximum vested as our NAV per share growth became positive.
Underwritten IPO Grants—In connection with our underwritten IPO, we issued a total of 0.5 million RSUs, inclusive of 0.3 million OP units, and restricted stock awards in the form of LTIP Units, which represent OP units that are structured as a profits interesttime-based stock compensation awards with expenses included within Other Expense, Net on our consolidated statements of operations. Included in the Operating Partnership. Dividends will accrue onrestricted stock awards were 24,000 RSUs granted to our independent directors. The shares have a grant price of $28.00 per share and, with the Performance LTIP Units until the measurement date,exception of one individual whose award is subject to a quarterly distribution of 10%accelerated vesting provisions, 50% of the regular quarterly distributions.shares vested after 18 months and the remaining 50% will vest after 36 months.
Independent Director Stock Plan—The Board approves restricted stock awards pursuant to our Amended and Restated 2010 Independent Director Stock Plan. The awards are granted to our independent directors as service-based awards. As of December 31, 20202023 and 2019,2022, there were approximately 50,00027,000 and 38,00024,000 outstanding unvested awards granted to independent directors, respectively.respectively, in connection with the 2010 Independent Director Stock Plan.
| | | | | | | | | | | |
| PHILLIPS EDISON & COMPANY DECEMBER 31, 2023 FORM 10-K | | | F-28 |
Share-Based Compensation Award Activity—As of December 31, 2023, the fair value for certain of our equity awards is based on our Nasdaq closing stock price at the date of the grant and the fair value for our 2023 and 2022 performance-based awards is calculated using the Monte Carlo method, as described above. All share-based compensation awards, regardless of the form of payout upon vesting, are presented in the following table, which summarizes our stock-based award activity. For performance-based awards, the number of shares deemed to be issued per the table below reflects the number of units at target performance. Performance-based awards contain terms which dictate that the number of award units to be issued will vary based upon actual performance compared to the respective plan’s performance metrics, with the potential for certain awards to earn additional shares beyond target performanceactivity (number of units in thousands):
| | Restricted Stock Awards(1) | | Performance Stock Awards(1) | | Phantom Stock Units | | Weighted-Average Grant-Date Fair Value(2) |
| Nonvested at January 1, 2018 | 18 | | | 0 | | | 2,446 | | | $ | 10.20 | |
| Restricted Stock Awards(1) | | | Restricted Stock Awards(1) | | Performance Stock Awards(1) | | Weighted-Average Grant-Date Fair Value |
| Nonvested at January 1, 2021 | |
| Granted | Granted | 811 | | | 199 | | | 0 | | | 11.00 | |
| Vested | Vested | (5) | | | 0 | | | (1,394) | | | 10.20 | |
| Forfeited | Forfeited | (16) | | | 0 | | | (54) | | | 10.38 | |
| Nonvested at December 31, 2018 | 808 | | | 199 | | | 998 | | | 10.60 | |
| Nonvested at December 31, 2021 | |
| Granted | Granted | 470 | | | 2,293 | | | 0 | | | 11.05 | |
| Vested | Vested | (196) | | | 0 | | | (769) | | | 10.36 | |
| Forfeited | Forfeited | (103) | | | (8) | | | (47) | | | 10.77 | |
| Nonvested at December 31, 2019 | 979 | | | 2,484 | | | 182 | | | 11.00 | |
| Nonvested at December 31, 2022 | |
| Granted | Granted | 437 | | | 259 | | | 0 | | | 10.94 | |
| Vested | Vested | (304) | | | 0 | | | (176) | | | 10.71 | |
| Forfeited | Forfeited | (70) | | | (25) | | | (6) | | | 11.00 | |
| Nonvested at December 31, 2020 | 1,042 | | | 2,718 | | | 0 | | | $ | 11.02 | |
| Nonvested at December 31, 2023 | |
(1)The maximum number of award units that could be issued under all outstanding grants was 4.41.8 million as of December 31, 2020.2023. The number of award units expected to vest was 2.31.1 million as of December 31, 2020.
(2)On an annual basis, we engage an independent third-party valuation advisory consulting firm to estimate the EVPS of our common stock. The weighted-average grant-date fair value calculated herein reflects the EVPS on the grant date.2023.
The expense for all stock-based awards during the years ended December 31, 2020, 2019,2023, 2022, and 20182021 was $6.3$9.4 million, $10.1$14.9 million, and $10.4$16.8 million, respectively. We had $11.8$11.5 million of unrecognized compensation costs related to these awards that we expect to recognize over a weighted average period of approximately threetwo years. The fair value at the vesting date for stock-based awards that vested during the year ended December 31, 20202023 was $5.0$19.5 million.
401(k) Plan—We sponsor a 401(k) plan that provides benefits for qualified employees. Our match of the employee contributions is discretionary and has a five-year vesting schedule. The cash contributions to the plan for the years ended December 31, 2020, 2019,2023, 2022, and 20182021 were approximately $0.9$1.1 million, $0.9$1.0 million, and $1.0 million, respectively. All employees who have attained the age of 21 are eligible to participate starting the first day of the month following their date of hire. Employees are vested immediately with respect to employee contributions.
| | |
15.14. EARNINGS PER SHARE |
We use the two-class method of computingBasic earnings per share (“EPS”), which is an earnings allocation formula that determines EPS for common stock and any participating securities according to dividends declared (whether paid or unpaid). Under the two-class method, basic EPS is computed by dividing Net Income (Loss) Attributable to Stockholders by the weighted-average number of shares of common stock outstanding for the period. Diluted EPS reflects the potential dilution that could occur from share equivalent activity.
OP units held by limited partners other than us are considered to be participating securities because they contain non-forfeitable rights to dividends or dividend equivalents, and have the potential to be exchanged for an equal number of shares of our common stock in accordance with the terms of the Fourth Amended and Restated Agreement of Limited Partnership of Phillips Edison Grocery Center Operating Partnership I, L.P.
The impact of these outstanding OP units on basic and diluted EPS has been calculated using the two-class method whereby earnings are allocated to the OP units based on dividends declared and the OP units’ participation rights in undistributed earnings. The effects of the two-class method on basic and diluted EPS were immaterial to the consolidated financial statements for the years ended December 31, 2020, 2019, and 2018.
The following table provides a reconciliation of the numerator and denominator of the earnings per share calculations for the years ended December 31, 2020, 2019,2023, 2022, and 20182021 (in thousands, except per share amounts):
| | | | | | | | | | | | | | | | | |
| 2020 | | 2019 | | 2018 |
| Numerator: | | | | | |
| Net income (loss) attributable to stockholders - basic | $ | 4,772 | | | $ | (63,532) | | | $ | 39,138 | |
Net income (loss) attributable to convertible OP units(1) | 690 | | | (9,583) | | | 8,136 | |
| Net income (loss) - diluted | $ | 5,462 | | | $ | (73,115) | | | $ | 47,274 | |
| Denominator: | | | | | |
| Weighted-average shares - basic | 290,280 | | | 283,909 | | | 196,602 | |
OP units(1) | 42,764 | | | 43,208 | | | 44,453 | |
| Dilutive restricted stock awards | 422 | | | 0 | | | 312 | |
| Adjusted weighted-average shares - diluted | 333,466 | | | 327,117 | | | 241,367 | |
| Earnings per common share: | | | | | |
| Basic and diluted income (loss) per share | $ | 0.02 | | | $ | (0.22) | | | $ | 0.20 | |
| | | | | |
| | | | | | | | | | | | | | | | | |
| 2023 | | 2022 | | 2021 |
| Numerator: | | | | | |
| Net income attributable to stockholders - basic | $ | 56,848 | | | $ | 48,323 | | | $ | 15,121 | |
Net income attributable to convertible OP units(1) | 6,914 | | | 6,206 | | | 2,112 | |
| Net income - diluted | $ | 63,762 | | | $ | 54,529 | | | $ | 17,233 | |
| Denominator: | | | | | |
Weighted-average shares - basic(2) | 118,278 | | | 115,403 | | | 102,403 | |
OP units(1)(3) | 14,096 | | | 14,355 | | | 14,071 | |
| Dilutive restricted stock awards | 596 | | | 574 | | | 198 | |
| Adjusted weighted-average shares - diluted | 132,970 | | | 130,332 | | | 116,672 | |
| Earnings per common share: | | | | | |
| Basic and diluted income per share | $ | 0.48 | | | $ | 0.42 | | | $ | 0.15 | |
| | | | | |
(1)OP units include units that are convertible into common stock or cash, at the Operating Partnership’s option. The Operating Partnership income or loss attributable to these OP units, which is included as a component of Net Income (Loss) Attributable to Noncontrolling Interests on the consolidated statements of operations, has been added back in the numerator as these OP units were included in the denominator for
| | | | | | | | | | | |
| PHILLIPS EDISON & COMPANY DECEMBER 31, 2023 FORM 10-K | | | F-29 |
all years presented. OP units are allocated income on a consistent basis with the common stockholder and therefore have no dilutive impact to earnings per share of common stock.
Approximately 1.0(2)Includes 4.4 million time-based and 2.593.6 million performance-based unvestedweighted-average shares of Class B common stock units were outstanding asand 111.0 million and 8.8 million weighted-average shares of common stock during the years ended December 31, 2019. These securities were anti-dilutive for2022 and 2021, respectively.
(3)For the year ended December 31, 2019, and2021, diluted weighted-average shares include 0.7 million OP units awarded as a result their impact was excluded fromof the weighted-average common shares used to calculate diluted EPS for that period. Outstanding restricted stock awards were dilutive forfull settlement of the years ended December 31, 2020 and 2018, and thus are includedearn-out in the calculation above.January 2022 (see Note 16).
| | |
16. REVENUE RECOGNITION AND15. RELATED PARTY TRANSACTIONS |
Revenue—We have entered into agreements with the Managed Funds related to certain advisory, management, and administrative services we provide to their real estate assets in exchange for fees and reimbursement of certain expenses. Summarized below are amounts included in FeeFees and Management Income. The revenue includes the fees and reimbursements earned by us from the Managed Funds during the years ended December 31, 2020, 2019, and 2018, and also includes other revenues that are not in the scope of ASC 606 but are included in this table for the purpose of disclosing all related party revenues during the years ended December 31, 2023, 2022, and 2021 (in thousands):
| | 2020 | | 2019 | | 2018 |
| 2023 | | | 2023 | | 2022 | | 2021 |
Recurring fees(1) | Recurring fees(1) | $ | 4,801 | | | $ | 6,362 | | | $ | 21,036 | |
Realized performance income(2) | |
Transactional revenue and reimbursements(2)(3) | Transactional revenue and reimbursements(2)(3) | 2,633 | | | 3,329 | | | 9,817 | |
Insurance premiums(3)(4) | Insurance premiums(3)(4) | 2,386 | | | 1,989 | | | 2,073 | |
| Total fees and management income | Total fees and management income | $ | 9,820 | | | $ | 11,680 | | | $ | 32,926 | |
(1)Recurring fees include asset management fees and property management fees.
(2)TransactionRealized performance income includes fees received related to the achievement of certain performance targets in our NRP joint venture.
(3)Transactional revenue includes items such as leasing commissions and construction management fees, and acquisition fees.
(3)(4)Insurance premium income includes amounts for reinsurance from third parties not affiliated with us.
DuringTax Protection Agreement—Through our Operating Partnership, we are currently party to a tax protection agreement (the “2017 TPA”) with certain partners that contributed property to our Operating Partnership on October 4, 2017, among them certain of our executive officers, including Jeffrey S. Edison, our Chairman and Chief Executive Officer, under which the year endedOperating Partnership agreed to indemnify such partners for tax liabilities that could accrue to them personally related to our potential disposition of certain properties within our portfolio. The 2017 TPA will expire on October 4, 2027. On July 19, 2021, we entered into an additional tax protection agreement (the “2021 TPA”) with certain of our executive officers, including Mr. Edison. The 2021 TPA carries a term of four years and will become effective upon the expiration of the 2017 TPA. As of December 31, 2019, we recognized a net charge2023, the potential “make-whole amount” on the estimated aggregate amount of $1.9 millionbuilt-in gain subject to protection under the agreements is approximately $122.7 million. The protection provided under the terms of the 2021 TPA will expire in Other Income (Expense), Net2031. We have not recorded any liability related to the 2017 TPA or the 2021 TPA on our consolidated statementbalance sheets for any periods presented, nor recognized any expense since the inception of operations. The charge was relatedthe 2017 TPA, owing to the fact that any potential liability under the agreements is controlled by us and we believe we will either (i) continue to own and operate the protected properties or (ii) be able to successfully complete Section 1031 Exchanges (unless there is a reductionchange in our related party accounts receivable and organization and offering costs payable for amounts incurred in connection withapplicable law) or complete other tax-efficient transactions to avoid any liability under the REIT III public offering. Remaining accounts receivable and organization and offering costs payable that were outstanding as of September 30, 2019 related to REIT III were settled when we merged with REIT III in October 2019.agreements.
Other Related Party Matters—We are the limited guarantor for up to $190 million, capped at $50 million in most instances, of debt for our NRP joint venture. As of December 31, 2020,2023, we were also the limited guarantor of a $175 million mortgage loan forsecured by GRP I.I properties. Our guaranty in both casesfor the GRP I debt is limited to being the non-recourse carveout guarantor and the environmental indemnitor. WeFurther, we are also party to a separatean agreement with Northwestern MutualGRP I in which any potential liability under our guaranty for GRP Isuch guarantee will be apportioned between us and Northwestern MutualGRP I based on our respective ownership percentages in GRP I.the joint venture. We have no liability recorded on our consolidated balance sheets for eitherthe guaranty as of December 31, 20202023 and 2019.2022.
In December 2022, we contributed certain assets to a third-party company in exchange for a warrant representing a 15% equity interest in the company, subject to certain conditions. This non-cash investment had a fair market value of $6.8 million, was accounted for as an equity method investment, and was recorded in Other Assets, Net. In connection with the transaction, we entered into a services contract for the use of these assets with the third-party company for a term of five years, with a required minimum annual payment by us of $1.2 million. For the year ended December 31, 2023, we paid service fees of $1.9 million and recorded equity income of $0.1 million.
During 2021, we made a cash investment of $3.0 million into a third-party company in exchange for preferred shares of their stock. As part of the investment agreement, the third-party company entered into leases at two of our properties. During 2023, we determined that the investment in the third-party company was fully impaired due to the value of the investment being significantly reduced, which is not deemed to be temporary, indicated by the company’s inability to pay rent. As a result, we recorded impairment expense of $3.0 million in Other Expense, Net on our consolidated statement of operations for the year ended December 31, 2023 and reserved tenant receivables of $0.2 million as of December 31, 2023 as the company is considered to be non-creditworthy.
PECO Air L.L.C. (“PECO Air”), an entity in which Mr. Edison, our Chairman and Chief Executive Officer, owns a 50% interest, owns an airplane that we use for business purposes in the course of our operations. We paid approximately $1.0$0.9 million, $0.9 million, and $0.8 million to PECO Air for use of its airplane and per the terms of our contractual agreements for the years ended December 31, 20202023, 2022, and 2019, and $0.8 million for the year ended December 31, 2018.2021, respectively.
| | | | | | | | | | | |
| PHILLIPS EDISON & COMPANY DECEMBER 31, 2023 FORM 10-K | | | F-30 |
| | |
17.16. FAIR VALUE MEASUREMENTS |
The following describes the methods we use to estimate the fair value of our financial and nonfinancial assets and liabilities:
Cash and Cash Equivalents, Restricted Cash, Accounts Receivable, and Accounts Payable—We consider the carrying values of these financial instruments to approximate fair value because of the short period of time between origination of the instruments and their expected realization.
Real Estate Investments—The purchase prices of the investment properties, including related lease intangible assets and liabilities, wereare allocated at estimated fair value based on Level 3 inputs, such as discount rates, capitalization rates, comparable sales, replacement costs, income and expense growth rates, and current market rents and allowances as determined by management.
Debt Obligations—We estimate the fair value of our debtrevolving credit facility, term loans, secured portfolio of loans, and mortgages by discounting the future cash flows of each instrument at rates currently offered for similar debt instruments of comparable maturities by our lenders using Level 3 inputs. The discount rates used approximate current lending rates for loans or groups of loans with similar maturities and credit quality, assuming the debt is outstanding through maturity and considering the debt’s collateral (if applicable). We have utilized market information, as available, or present value techniques to estimate the amounts required to be disclosed. We estimate the fair value of our senior unsecured notes by using quoted prices in active markets, which are considered Level 1 inputs.
The following is a summary of borrowings as of December 31, 20202023 and 20192022 (in thousands):
| | 2020 | | 2019 |
| Recorded Principal Balance(1) | | Fair Value | | Recorded Principal Balance(1) | | Fair Value |
| | | 2023 | | | | 2023 | | 2022 |
| | Recorded Principal Balance(1) | | | | Recorded Principal Balance(1) | | Fair Value | | Recorded Principal Balance(1) | | Fair Value |
| Revolving credit facility | |
| Term loans | Term loans | | 1,610,204 | | | 1,621,902 | | | 1,636,470 | | | 1,656,765 | |
| Senior unsecured notes due 2031 | |
| Secured portfolio loan facilities | Secured portfolio loan facilities | | 391,131 | | | 404,715 | | | 390,780 | | | 399,054 | |
Mortgages(2) | Mortgages(2) | | 291,270 | | | 303,647 | | | 326,849 | | | 337,614 | |
| Total | Total | | $ | 2,292,605 | | | $ | 2,330,264 | | | $ | 2,354,099 | | | $ | 2,393,433 | |
(1)RecordedAs of December 31, 2023 and 2022, respectively, recorded principal balances includeinclude: (i) net deferred financing expensesfees of $13.5$10.3 million and $17.2 million as of December 31, 2020 and 2019, respectively. Recorded principal balances also include$8.0 million; (ii) assumed market debt adjustments of $1.5$0.9 million and $1.2 million; and (iii) notes payable discounts of $6.3 million as of December 31, 2020 and 2019, respectively. We have recorded deferred financing expenses related to our revolving credit facility, which are not included in these balances, in Other Assets, Net on our consolidated balance sheets.$7.0 million.
(2)Our finance lease liability is included in the mortgages line item, as presented.
Recurring and Nonrecurring Fair Value Measurements—Our marketable securities, earn-out liability, and interest rate swaps are measured and recognized at fair value on a recurring basis, while certain real estate assets and liabilities are measured and recognized at fair value as needed. Fair value measurements that occurred as of and during the years ended December 31, 20202023 and 20192022 were as follows (in thousands):
| | | | | | | | | | | | | | | | | | | | | | | |
| 2020 | | 2019 |
| Level 1 | Level 2 | Level 3 | | Level 1 | Level 2 | Level 3 |
| Recurring | | | | | | | |
Derivative assets(1) | $ | — | | $ | 0 | | $ | — | | | $ | — | | $ | 2,728 | | $ | — | |
Derivative liability(1) | — | | (54,759) | | — | | | — | | (20,974) | | — | |
| Earn-out liability | — | | — | | (22,000) | | | — | | — | | (32,000) | |
| Nonrecurring | | | | | | | |
Impaired real estate assets, net(2) | — | | 19,350 | | — | | | — | | 280,593 | | — | |
Impaired corporate intangible asset, net(3) | — | | — | | 0 | | | — | | — | | 4,401 | |
| Impaired corporate ROU asset, net | — | | 537 | | — | | | — | | — | | — | |
| | | | | | | | | | | | | | | | | | | | | | | |
| 2023 | | 2022 |
| Level 1 | Level 2 | Level 3 | | Level 1 | Level 2 | Level 3 |
| Recurring | | | | | | | |
Marketable securities(1) | $ | 8,566 | | $ | — | | $ | — | | | $ | 7,792 | | $ | — | | $ | — | |
Derivative assets(1)(2) | — | | 12,669 | | — | | | — | | 25,853 | | — | |
| Nonrecurring | | | | | | | |
Impaired real estate assets, net(3) | $ | — | | $ | — | | $ | — | | | $ | — | | $ | 5,225 | | $ | — | |
(1)We record marketable securities and derivative assets in Other Assets, Net and derivative liabilities in Derivative Liability on our consolidated balance sheets.
(2)The fair values of the derivative assets exclude associated accrued interest receivable of $1.7 million and $1.4 million as of December 31, 2023 and 2022, respectively.
(3)The carrying value of impaired real estate assets may have subsequently increased or decreased after the measurement date due to capital improvements, depreciation, or sale.
(3)Marketable SecuritiesThe carrying—We estimate the fair value of our impaired in-place management contracts subsequently decreased aftermarketable securities using Level 1 inputs. We utilize unadjusted quoted prices for identical assets in active markets that we have the measurement date, attributableability to regular amortization as well as derecognition as part of the merger with REIT III.access.
Derivative Instruments—As of December 31, 20202023 and 2019,2022, we had interest rate swaps that fixed LIBORSOFR on portions of our unsecured term loan facilities.
All interest rate swap agreements are measured at fair value on a recurring basis. The valuation of these instruments is determined using widely accepted valuation techniques, including discounted cash flow analysis on the expected cash flows of each derivative. This analysis reflects the contractual terms of the derivatives, including the period to maturity, and uses observable market-based inputs, including interest rate curves and implied volatilities. The fair values of interest rate swaps are determined using the market standard methodology of netting the discounted future fixed cash receipts (or payments) and the discounted expected variable cash payments (or receipts). The variable cash payments (or receipts) are based on an expectation of future interest rates (forward curves) derived from observable market interest rate curves.
| | | | | | | | | | | |
| PHILLIPS EDISON & COMPANY DECEMBER 31, 2023 FORM 10-K | | | F-31 |
To comply with the provisions of ASC Topic 820,Fair Value Measurement, we incorporate credit valuation adjustments to appropriately reflect both our own nonperformance risk and the respective counterparty’s nonperformance risk in the fair value measurements. In adjusting the fair value of our derivative contracts for the effect of nonperformance risk, we have considered the impact of netting and any applicable credit enhancements, such as collateral postings, thresholds, mutual puts, and guarantees.
Although we determined that the significant inputs used to value our derivatives fell within Level 2 of the fair value hierarchy, the credit valuation adjustments associated with our counterparties and our own credit risk utilize Level 3 inputs, such as estimates of current credit spreads, to evaluate the likelihood of default by us and our counterparties. However, as of December 31, 20202023 and 2019,2022, we have assessed the significance of the impact of the credit valuation adjustments on the overall valuation of our derivative positions and have determined that the credit valuation adjustments are not significant to the overall valuation of our derivatives. As a result, we have determined that our derivative valuations in their entirety are classified in Level 2 of the fair value hierarchy.
Earn-out—As part of our acquisition of PELPPhillips Edison Limited Partnership (“PELP”) in 2017, an earn-out structure was established which gave PELP the opportunity to earn additional OP units based upon the potential achievement of certain performance targets subsequent to the acquisition. After the expiration of certain provisions in 2019, PELP is now eligible to earn between three million and five million OP units based on the timing and valuation of a liquidity event for PECO. The liquidity event can occur no later than December 31, 2021 for the maximum shares to be awarded, but can occur as late as December 31, 2023.
We estimateOn January 11, 2022, we finalized the fair value of thisthe earn-out liability based on a quarterly basis usingour share price and issued approximately 1.6 million OP units in full settlement of the Monte Carlo method. This method requires us to make assumptions about future dividend yields, volatility, and timing and pricing of liquidity events, which are unobservable and are considered Level 3 inputs in the fair value hierarchy. A change in these inputs toliability with a different amount might result in a significantly higher or lower fair value measurement at the reporting date. In calculating the fair value of this liability as of December 31, 2020, we have determined that the most likely range of potential outcomes includes a possibility of no additional OP units issued as well as up to a maximum of five million units being issued.
We recognized income of $10.0 million and $7.5 million related to changes$54.2 million. Changes in the fair value of the earn-out liability for the years ended December 31, 2020 and 2019, respectively. These changes in fair value have been and will continuewere recorded to be recognized in Other Income (Expense),Expense, Net in the consolidated statements of operations. We recorded no expense during the year ended December 31, 2023. We recorded expense of $1.8 million and $30.4 million for the years ended December 31, 2022 and 2021, respectively.
Real Estate Asset Impairment—Our real estate assets are measured and recognized at fair value, less costs to sell held-for-sale properties, on a nonrecurring basis dependent upon when we determine an impairment has occurred. During the years ended December 31, 2020, 2019, and 2018, we impairedWe impair assets that wereare under contract or actively marketed for sale at a disposition price that wasis less than carrying value, or that hadhave other operational impairment indicators. The valuation technique used for the fair value of all impaired real estate assets was the expected net sales proceeds, which we consider to be a Level 2 input in the fair value hierarchy.
We recorded the following expense upon impairment of real estate assets for the years ended December 31, 2020, 2019,2023, 2022, and 20182021 (in thousands):
| | | | | | | | | | | | | | | | | |
| 2020 | | 2019 | | 2018 |
| Impairment of real estate assets | $ | 2,423 | | | $ | 87,393 | | | $ | 40,782 | |
Corporate Intangible Asset Impairment—In connection with our acquisition of PELP, we acquired a corporate intangible asset consisting of in-place management contracts. We evaluate our corporate intangible asset for impairment when a triggering event occurs, or circumstances change, that indicate the carrying value may not be recoverable.
In June 2019, the suspension of the REIT III public offering constituted a triggering event for further review of the corporate intangible asset’s fair value compared to its carrying value. We estimated the fair value of the corporate intangible asset using a discounted cash flow model which leveraged certain Level 3 inputs. The evaluation of corporate intangible assets for potential impairment required management to exercise significant judgment and to make certain assumptions. The assumptions utilized in the evaluation included projected future cash flows and a discount rate of 19%. Based on this analysis, we concluded the carrying value exceeded the estimated fair value of the corporate intangible asset, and an impairment charge of $7.8 million was recorded in Other Income (Expense), Net on the consolidated statements of operations in the second quarter of 2019. | | | | | | | | | | | | | | | | | |
| 2023 | | 2022 | | 2021 |
| Impairment of real estate assets | $ | — | | | $ | 322 | | | $ | 6,754 | |
| | |
18. QUARTERLY FINANCIAL DATA (UNAUDITED) |
The following is a summary of the unaudited quarterly financial information for the years ended December 31, 2020 and 2019. We believe that all necessary adjustments, consisting only of normal recurring adjustments, have been included in the amounts stated below to present fairly, and in accordance with GAAP, the selected quarterly information (in thousands, except per share amounts):
| | | | | | | | | | | | | | | | | | | | | | | |
| | 2020 |
| First Quarter | | Second Quarter | | Third Quarter | | Fourth Quarter |
| Total revenue | $ | 131,523 | | | $ | 119,040 | | | $ | 126,695 | | | $ | 120,759 | |
| Net income (loss) attributable to stockholders | 9,769 | | | (5,588) | | | 11,784 | | | (11,193) | |
| Net income (loss) per share - basic and diluted | 0.03 | | | (0.02) | | | 0.04 | | | (0.04) | |
| | | | | | | | | | | | | | | | | | | | | | | |
| | 2019 |
| First Quarter | | Second Quarter | | Third Quarter | | Fourth Quarter |
| Total revenue | $ | 132,769 | | | $ | 132,581 | | | $ | 136,009 | | | $ | 135,347 | |
| Net (loss) income attributable to stockholders | (5,195) | | | (36,570) | | | (25,877) | | | 4,110 | |
| Net (loss) income per share - basic and diluted | (0.02) | | | (0.13) | | | (0.09) | | | 0.02 | |
Our decrease in revenue beginning in the second quarter of 2020 is mainly attributed to the effects of the COVID-19 pandemic.
Distributions—Distributions paid to stockholdersIn preparing the audited consolidated financial statements, we have evaluated subsequent events through the date of filing of this report on Form 10-K for recognition and/or disclosure purposes. Based on this evaluation, we have determined that there were no events that have occurred that require recognition or disclosure, other than certain events and OP unit holders of record subsequent to December 31, 2020 were as follows (in thousands):
| | | | | | | | | | | | | | | | | | | | | | | | | | | | | |
| Month | Date of Record | Monthly Distribution Rate | Date Distribution Paid | | Gross Amount of Distribution Paid | | Distribution Reinvested Through the DRIP | | Net Cash Distribution |
| December | 12/28/2020 | $0.02833333 | 1/12/2021 | | $ | 9,001 | | | $ | 2,461 | | | $ | 6,540 | |
| January | 1/15/2021 | $0.02833333 | 2/1/2021 | | 9,042 | | | 2,455 | | | 6,587 | |
| February | 2/15/2021 | $0.02833333 | 3/1/2021 | | 9,051 | | | 2,453 | | | 6,598 | |
On March 10, 2021, our Board authorized distributions for March 2021 to the stockholders of record at the close of business on March 19, 2021 equal to a monthly amount of $0.02833333 per share of common stock. OP unit holders will receive distributions at the same rate as common stockholders. We pay distributions to stockholders and OP unit holders based on monthly record dates, and we expect to pay the March 2021 distributions on April 1, 2021.transactions that have been disclosed elsewhere in these consolidated financial statements.
| | | | | | | | | | | |
| PHILLIPS EDISON & COMPANY DECEMBER 31, 2023 FORM 10-K | | | F-32 |
| | SCHEDULE III—REAL ESTATE ASSETS AND ACCUMULATED DEPRECIATION | SCHEDULE III—REAL ESTATE ASSETS AND ACCUMULATED DEPRECIATION | SCHEDULE III—REAL ESTATE ASSETS AND ACCUMULATED DEPRECIATION |
December 31, 2020 | | December 31, 2023 | | December 31, 2023 |
| (in thousands) | (in thousands) | (in thousands) |
| | | | Initial Cost | Costs Capitalized Subsequent to Acquisition(2) | | Gross Amount Carried at End of Period(3) | | | | | Initial Cost | Costs Capitalized Subsequent to Acquisition(2) | | Gross Amount Carried at End of Period(3) | |
| Property Name | Property Name | City, State | Encumbrances(1) | Land and Improvements | Buildings and Improvements | | Land and Improvements | Buildings and Improvements | Total | Accumulated Depreciation | Date Constructed/ Renovated | Date Acquired | Property Name | City, State | Encumbrances(1) | Land and Improvements | Buildings and Improvements | | Land and Improvements | Buildings and Improvements | Total | Accumulated Depreciation | Date Constructed/ Renovated | Date Acquired |
| Snow View Plaza | | Snow View Plaza | Parma, OH | $— | $4,104 | $6,432 | $1,449 | | $4,490 | $7,495 | $11,985 | $4,490 | 1981 | 12/15/2010 |
| Lakeside Plaza | Lakeside Plaza | Salem, VA | $0 | $3,344 | $5,247 | $732 | | $3,491 | $5,832 | $9,323 | $2,754 | 1988 | 11/23/2011 | Lakeside Plaza | Salem, VA | — | 3,344 | 5,247 | 1,066 | | 3,591 | 6,066 | 9,657 | 3,539 | 1988 | 11/23/2011 |
| Snow View Plaza | Parma, OH | 0 | 4,104 | 6,432 | 1,171 | | 4,326 | 7,381 | 11,707 | 3,767 | 1981 | 11/23/2011 |
| St. Charles Plaza | St. Charles Plaza | Davenport, FL | 0 | 4,090 | 4,399 | 571 | | 4,228 | 4,832 | 9,060 | 2,828 | 2007 | 11/23/2011 | St. Charles Plaza | Davenport, FL | — | 4,090 | 4,399 | 829 | | 4,437 | 4,881 | 9,318 | 3,622 | 2007 | 11/23/2011 |
| Burwood Village Center | Burwood Village Center | Glen Burnie, MD | 0 | 5,448 | 10,167 | 553 | | 5,737 | 10,431 | 16,169 | 4,956 | 1971 | 11/23/2011 | Burwood Village Center | Glen Burnie, MD | — | 5,448 | 10,167 | 714 | | 5,809 | 10,520 | 16,329 | 6,336 | 1971 | 11/23/2011 |
| Centerpoint | Centerpoint | Easley, SC | 0 | 2,404 | 4,361 | 1,426 | | 2,986 | 5,205 | 8,191 | 2,422 | 2002 | 11/23/2011 | Centerpoint | Easley, SC | — | 2,750 | 4,361 | 1,627 | | 3,441 | 5,297 | 8,738 | 3,162 | 2002 | 11/23/2011 |
| Southampton Village | Southampton Village | Tyrone, GA | 0 | 2,670 | 5,176 | 965 | | 2,901 | 5,910 | 8,811 | 2,669 | 2003 | 11/23/2011 | Southampton Village | Tyrone, GA | — | 3,046 | 5,788 | 1,559 | | 3,439 | 6,954 | 10,393 | 3,496 | 2003 | 11/23/2011 |
| Cureton Town Center | Cureton Town Center | Waxhaw, NC | 0 | 6,569 | 6,197 | 2,632 | | 5,926 | 9,472 | 15,398 | 4,188 | 2006 | 12/29/2011 | Cureton Town Center | Waxhaw, NC | — | 6,569 | 6,197 | 2,726 | | 5,954 | 9,538 | 15,492 | 5,640 | 2006/2018 | 12/29/2011 |
| Tramway Crossing | Tramway Crossing | Sanford, NC | 0 | 2,016 | 3,071 | 886 | | 2,492 | 3,481 | 5,973 | 1,944 | 1996 | 2/23/2012 | Tramway Crossing | Sanford, NC | — | 2,016 | 3,071 | 1,081 | | 2,650 | 3,518 | 6,168 | 2,555 | 1996 | 2/23/2012 |
| Westin Centre | Fayetteville, NC | 0 | 2,190 | 3,499 | 741 | | 2,449 | 3,981 | 6,430 | 2,029 | 1996/1999 | 2/23/2012 |
| Village At Glynn Place | Village At Glynn Place | Brunswick, GA | 0 | 5,202 | 6,095 | 625 | | 5,309 | 6,612 | 11,922 | 3,805 | 1992 | 4/27/2012 | Village At Glynn Place | Brunswick, GA | — | 5,812 | 7,368 | 1,878 | | 6,078 | 8,980 | 15,058 | 5,123 | 1992/2009 | 4/27/2012 |
| Meadowthorpe Manor Shoppes | Meadowthorpe Manor Shoppes | Lexington, KY | 0 | 4,093 | 4,185 | 613 | | 4,562 | 4,330 | 8,892 | 2,252 | 1989/2008 | 5/9/2012 | Meadowthorpe Manor Shoppes | Lexington, KY | — | 4,093 | 4,185 | 2,209 | | 4,636 | 5,851 | 10,487 | 2,953 | 1989/2022 | 5/9/2012 |
| Brentwood Commons | Brentwood Commons | Bensenville, IL | 0 | 6,105 | 8,024 | 2,366 | | 6,306 | 10,190 | 16,496 | 3,991 | 1981/2001 | 7/5/2012 | Brentwood Commons | Bensenville, IL | — | 6,105 | 8,024 | 2,525 | | 6,350 | 10,304 | 16,654 | 5,376 | 1981/2015 | 7/5/2012 |
| Sidney Towne Center | Sidney Towne Center | Sidney, OH | 0 | 1,429 | 3,802 | 1,353 | | 2,016 | 4,568 | 6,584 | 2,599 | 1981/2007 | 8/2/2012 | Sidney Towne Center | Sidney, OH | — | 1,429 | 3,802 | 1,748 | | 2,209 | 4,770 | 6,979 | 3,382 | 1981/2007 | 8/2/2012 |
| Broadway Plaza | Broadway Plaza | Tucson, AZ | 5,614 | 4,979 | 7,169 | 1,951 | | 5,808 | 8,290 | 14,099 | 3,770 | 1982/1995 | 8/13/2012 | Broadway Plaza | Tucson, AZ | — | 4,979 | 7,169 | 2,992 | | 6,187 | 8,953 | 15,140 | 5,196 | 1982/2003 | 8/13/2012 |
| Baker Hill | Baker Hill | Glen Ellyn, IL | 0 | 7,068 | 13,738 | 10,013 | | 7,664 | 23,154 | 30,818 | 7,287 | 1998 | 9/6/2012 | Baker Hill | Glen Ellyn, IL | — | 7,068 | 13,738 | 10,185 | | 7,731 | 23,260 | 30,991 | 11,588 | 1998/2018 | 9/6/2012 |
| New Prague Commons | New Prague Commons | New Prague, MN | 0 | 3,248 | 6,604 | 1,908 | | 3,395 | 8,366 | 11,761 | 3,447 | 2008 | 10/12/2012 | New Prague Commons | New Prague, MN | — | 3,248 | 6,604 | 3,149 | | 3,447 | 9,554 | 13,001 | 5,576 | 2008/2019 | 10/12/2012 |
| Brook Park Plaza | Brook Park, OH | 0 | 2,545 | 7,594 | 773 | | 2,813 | 8,099 | 10,912 | 3,377 | 2001 | 10/23/2012 |
| Heron Creek Towne Center | Heron Creek Towne Center | North Port, FL | 0 | 4,062 | 4,082 | 447 | | 4,163 | 4,429 | 8,591 | 2,181 | 2001 | 12/17/2012 | Heron Creek Towne Center | North Port, FL | — | 4,062 | 4,082 | 966 | | 4,359 | 4,751 | 9,110 | 2,719 | 2001 | 12/17/2012 |
| Quartz Hill Towne Centre | Quartz Hill Towne Centre | Lancaster, CA | 11,740 | 6,352 | 13,529 | 929 | | 6,663 | 14,147 | 20,810 | 5,091 | 1991/2012 | 12/27/2012 | Quartz Hill Towne Centre | Lancaster, CA | 11,740 | 6,689 | 13,529 | 1,285 | | 7,317 | 14,186 | 21,503 | 6,850 | 1991/2012 | 12/27/2012 |
| Village One Plaza | Village One Plaza | Modesto, CA | 17,700 | 5,166 | 18,752 | 633 | | 5,255 | 19,296 | 24,551 | 6,308 | 2007 | 12/28/2012 | Village One Plaza | Modesto, CA | 17,700 | 5,166 | 18,752 | 980 | | 5,533 | 19,365 | 24,898 | 8,736 | 2007 | 12/28/2012 |
| Hilfiker Shopping Center | Hilfiker Shopping Center | Salem, OR | 0 | 2,455 | 4,750 | 89 | | 2,523 | 4,771 | 7,294 | 1,753 | 1984/2011 | 12/28/2012 | Hilfiker Shopping Center | Salem, OR | — | 2,879 | 4,750 | 166 | | 3,004 | 4,791 | 7,795 | 2,311 | 1984/2011 | 12/28/2012 |
| Butler Creek | Butler Creek | Acworth, GA | 0 | 3,925 | 6,129 | 2,931 | | 4,287 | 8,698 | 12,985 | 2,928 | 1989 | 1/15/2013 | Butler Creek | Acworth, GA | — | 3,925 | 6,129 | 3,745 | | 4,377 | 9,422 | 13,799 | 4,251 | 1989 | 1/15/2013 |
| Fairview Oaks | Fairview Oaks | Ellenwood, GA | 6,430 | 3,563 | 5,266 | 857 | | 3,925 | 5,761 | 9,686 | 2,277 | 1996 | 1/15/2013 | Fairview Oaks | Ellenwood, GA | 6,430 | 3,563 | 5,266 | 1,408 | | 3,931 | 6,306 | 10,237 | 3,245 | 1996 | 1/15/2013 |
| Grassland Crossing | Grassland Crossing | Alpharetta, GA | 0 | 3,680 | 5,791 | 1,033 | | 3,936 | 6,568 | 10,504 | 2,790 | 1996 | 1/15/2013 | Grassland Crossing | Alpharetta, GA | — | 3,680 | 5,791 | 1,305 | | 3,864 | 6,912 | 10,776 | 3,477 | 1996 | 1/15/2013 |
| Hamilton Ridge | Hamilton Ridge | Buford, GA | 0 | 4,772 | 7,168 | 823 | | 5,035 | 7,728 | 12,763 | 3,384 | 2002 | 1/15/2013 | Hamilton Ridge | Buford, GA | — | 4,772 | 7,168 | 2,868 | | 5,122 | 9,686 | 14,808 | 4,498 | 2002 | 1/15/2013 |
| Mableton Crossing | Mableton Crossing | Mableton, GA | 0 | 4,426 | 6,413 | 1,458 | | 4,930 | 7,367 | 12,297 | 3,076 | 1997 | 1/15/2013 | Mableton Crossing | Mableton, GA | — | 4,426 | 6,413 | 1,481 | | 4,913 | 7,407 | 12,320 | 4,039 | 1997 | 1/15/2013 |
| Shops at Westridge | Shops at Westridge | McDonough, GA | 0 | 2,788 | 3,901 | 2,038 | | 2,835 | 5,892 | 8,727 | 2,104 | 2006 | 1/15/2013 | Shops at Westridge | McDonough, GA | — | 2,788 | 3,901 | 2,123 | | 2,973 | 5,839 | 8,812 | 2,903 | 2006/2020 | 1/15/2013 |
| Fairlawn Town Centre | Fairlawn Town Centre | Fairlawn, OH | 20,000 | 10,398 | 29,005 | 3,638 | | 11,611 | 31,430 | 43,041 | 12,819 | 1962/1996 | 1/30/2013 | Fairlawn Town Centre | Fairlawn, OH | 20,000 | 10,398 | 29,005 | 5,155 | | 11,658 | 32,900 | 44,558 | 16,684 | 1962/2012 | 1/30/2013 |
| Macland Pointe | Macland Pointe | Marietta, GA | 0 | 3,493 | 5,364 | 1,097 | | 3,878 | 6,075 | 9,953 | 2,649 | 1992 | 2/13/2013 | Macland Pointe | Marietta, GA | — | 3,493 | 5,364 | 1,470 | | 3,975 | 6,352 | 10,327 | 3,691 | 1992 | 2/13/2013 |
| Kleinwood Center | Kleinwood Center | Spring, TX | 0 | 11,478 | 18,954 | 1,267 | | 11,850 | 19,848 | 31,699 | 7,809 | 2003 | 3/21/2013 | Kleinwood Center | Spring, TX | — | 11,478 | 18,954 | 1,341 | | 11,797 | 19,976 | 31,773 | 10,386 | 2003 | 3/21/2013 |
| Murray Landing | Murray Landing | Columbia, SC | 6,750 | 3,221 | 6,856 | 1,640 | | 3,597 | 8,120 | 11,717 | 2,968 | 2003 | 3/21/2013 | Murray Landing | Columbia, SC | 6,750 | 3,221 | 6,856 | 2,335 | | 3,804 | 8,608 | 12,412 | 4,095 | 2003/2016 | 3/21/2013 |
| Vineyard Shopping Center | Vineyard Shopping Center | Tallahassee, FL | 0 | 2,761 | 4,221 | 561 | | 3,028 | 4,515 | 7,543 | 1,886 | 2002 | 3/21/2013 | Vineyard Shopping Center | Tallahassee, FL | — | 2,761 | 4,221 | 642 | | 3,062 | 4,562 | 7,624 | 2,618 | 2002 | 3/21/2013 |
| Lutz Lake Crossing | Lutz Lake Crossing | Lutz, FL | 0 | 2,636 | 6,600 | 819 | | 2,914 | 7,142 | 10,055 | 2,404 | 2002 | 4/4/2013 | Lutz Lake Crossing | Lutz, FL | — | 2,636 | 6,600 | 1,066 | | 3,031 | 7,271 | 10,302 | 3,358 | 2002 | 4/4/2013 |
| Publix at Seven Hills | Publix at Seven Hills | Spring Hill, FL | 0 | 2,171 | 5,642 | 1,055 | | 2,493 | 6,375 | 8,868 | 2,197 | 1991/2006 | 4/4/2013 | Publix at Seven Hills | Spring Hill, FL | — | 2,171 | 5,642 | 1,378 | | 2,518 | 6,673 | 9,191 | 3,110 | 1991/2006 | 4/4/2013 |
| Hartville Centre | Hartville Centre | Hartville, OH | 0 | 2,069 | 3,691 | 1,785 | | 2,391 | 5,155 | 7,546 | 2,048 | 1988/2008 | 4/23/2013 | Hartville Centre | Hartville, OH | — | 2,069 | 3,691 | 1,963 | | 2,493 | 5,230 | 7,723 | 2,770 | 1988/2008 | 4/23/2013 |
| Sunset Shopping Center | | Sunset Shopping Center | Corvallis, OR | 15,410 | 7,933 | 14,939 | 3,128 | | 8,246 | 17,754 | 26,000 | 7,583 | 1998/2023 | 5/31/2013 |
| Savage Town Square | | Savage Town Square | Savage, MN | 9,000 | 4,106 | 9,409 | 481 | | 4,422 | 9,574 | 13,996 | 4,910 | 2003 | 6/19/2013 |
| Glenwood Crossings | | Glenwood Crossings | Kenosha, WI | — | 1,872 | 9,914 | 1,289 | | 2,418 | 10,657 | 13,075 | 4,734 | 1992/2018 | 6/27/2013 |
| | | | | | | | | | | |
| PHILLIPS EDISON & COMPANY DECEMBER 31, 2023 FORM 10-K | | | F-33 |
| | SCHEDULE III—REAL ESTATE ASSETS AND ACCUMULATED DEPRECIATION | SCHEDULE III—REAL ESTATE ASSETS AND ACCUMULATED DEPRECIATION | SCHEDULE III—REAL ESTATE ASSETS AND ACCUMULATED DEPRECIATION |
December 31, 2020 | | December 31, 2023 | | December 31, 2023 |
| (in thousands) | (in thousands) | (in thousands) |
| | | | Initial Cost | Costs Capitalized Subsequent to Acquisition(2) | | Gross Amount Carried at End of Period(3) | | | | | Initial Cost | Costs Capitalized Subsequent to Acquisition(2) | | Gross Amount Carried at End of Period(3) | |
| Property Name | Property Name | City, State | Encumbrances(1) | Land and Improvements | Buildings and Improvements | | Land and Improvements | Buildings and Improvements | Total | Accumulated Depreciation | Date Constructed/ Renovated | Date Acquired | Property Name | City, State | Encumbrances(1) | Land and Improvements | Buildings and Improvements | | Land and Improvements | Buildings and Improvements | Total | Accumulated Depreciation | Date Constructed/ Renovated | Date Acquired |
| Sunset Shopping Center | Corvallis, OR | 15,410 | 7,933 | 14,939 | 839 | | 8,019 | 15,692 | 23,711 | 5,539 | 1998 | 5/31/2013 |
| Savage Town Square | Savage, MN | 9,000 | 4,106 | 9,409 | 300 | | 4,357 | 9,458 | 13,815 | 3,562 | 2003 | 6/19/2013 |
| Glenwood Crossings | Kenosha, WI | 0 | 1,872 | 9,914 | 1,051 | | 2,336 | 10,500 | 12,837 | 3,292 | 1992 | 6/27/2013 |
| Shiloh Square Shopping Center | Shiloh Square Shopping Center | Kennesaw, GA | 0 | 4,685 | 8,729 | 1,978 | | 4,834 | 10,558 | 15,392 | 3,419 | 1996/2003 | 6/27/2013 | Shiloh Square Shopping Center | Kennesaw, GA | — | 4,685 | 8,729 | 2,474 | | 4,864 | 11,024 | 15,888 | 4,835 | 1996/2003 | 6/27/2013 |
| Pavilions at San Mateo | Pavilions at San Mateo | Albuquerque, NM | 0 | 6,470 | 18,726 | 1,701 | | 6,746 | 20,152 | 26,897 | 6,597 | 1997 | 6/27/2013 | Pavilions at San Mateo | Albuquerque, NM | — | 6,470 | 18,726 | 2,486 | | 7,024 | 20,658 | 27,682 | 9,264 | 1997/2012 | 6/27/2013 |
| Boronda Plaza | Boronda Plaza | Salinas, CA | 14,750 | 9,027 | 11,870 | 623 | | 9,231 | 12,290 | 21,521 | 4,174 | 2003/2006 | 7/3/2013 | Boronda Plaza | Salinas, CA | 14,750 | 9,027 | 11,870 | 728 | | 9,374 | 12,251 | 21,625 | 5,744 | 2003/2021 | 7/3/2013 |
| Westwoods Shopping Center | Westwoods Shopping Center | Arvada, CO | 0 | 3,706 | 11,115 | 694 | | 4,186 | 11,328 | 15,514 | 3,914 | 2003 | 8/8/2013 | Westwoods Shopping Center | Arvada, CO | — | 3,706 | 11,115 | 1,340 | | 4,594 | 11,567 | 16,161 | 5,530 | 2003/2011 | 8/8/2013 |
| Paradise Crossing | Paradise Crossing | Lithia Springs, GA | 0 | 2,204 | 6,064 | 868 | | 2,490 | 6,647 | 9,136 | 2,253 | 2000 | 8/13/2013 | Paradise Crossing | Lithia Springs, GA | — | 2,204 | 6,064 | 1,044 | | 2,535 | 6,777 | 9,312 | 3,178 | 2000 | 8/13/2013 |
| Contra Loma Plaza | Contra Loma Plaza | Antioch, CA | 0 | 3,243 | 3,926 | 1,779 | | 3,845 | 5,103 | 8,948 | 1,633 | 1989 | 8/19/2013 | Contra Loma Plaza | Antioch, CA | — | 3,018 | 3,926 | 2,036 | | 3,758 | 5,222 | 8,980 | 2,269 | 1989/2022 | 8/19/2013 |
| South Oaks Plaza | South Oaks Plaza | St. Louis, MO | 0 | 1,938 | 6,634 | 464 | | 2,112 | 6,924 | 9,036 | 2,294 | 1969/1987 | 8/21/2013 | South Oaks Plaza | St. Louis, MO | — | 1,938 | 6,634 | 2,680 | | 2,186 | 9,066 | 11,252 | 3,483 | 1969/2021 | 8/21/2013 |
| Yorktown Centre | Yorktown Centre | Millcreek Township, PA | 0 | 3,736 | 15,396 | 2,173 | | 4,098 | 17,207 | 21,305 | 6,652 | 1989/2013 | 8/30/2013 | Yorktown Centre | Millcreek Township, PA | — | 3,736 | 15,396 | 2,995 | | 4,590 | 17,537 | 22,127 | 8,851 | 1989/2020 | 8/30/2013 |
| Dyer Town Center | Dyer Town Center | Dyer, IN | 9,023 | 6,017 | 10,214 | 586 | | 6,283 | 10,534 | 16,817 | 3,759 | 2004/2005 | 9/4/2013 | Dyer Town Center | Dyer, IN | 8,071 | 6,017 | 10,214 | 912 | | 6,499 | 10,644 | 17,143 | 5,354 | 2004/2005 | 9/4/2013 |
| East Burnside Plaza | East Burnside Plaza | Portland, OR | 0 | 2,484 | 5,422 | 137 | | 2,560 | 5,484 | 8,044 | 1,499 | 1955/1999 | 9/12/2013 | East Burnside Plaza | Portland, OR | — | 2,484 | 5,422 | 186 | | 2,601 | 5,491 | 8,092 | 2,068 | 1955/1999 | 9/12/2013 |
| Red Maple Village | Red Maple Village | Tracy, CA | 20,584 | 9,250 | 19,466 | 439 | | 9,408 | 19,747 | 29,155 | 5,542 | 2009 | 9/18/2013 | Red Maple Village | Tracy, CA | 20,584 | 9,250 | 19,466 | 783 | | 9,656 | 19,843 | 29,499 | 7,876 | 2009 | 9/18/2013 |
| Crystal Beach Plaza | Crystal Beach Plaza | Palm Harbor, FL | 6,360 | 2,334 | 7,918 | 661 | | 2,416 | 8,498 | 10,914 | 2,751 | 2010 | 9/25/2013 | Crystal Beach Plaza | Palm Harbor, FL | 6,360 | 2,334 | 7,918 | 794 | | 2,488 | 8,558 | 11,046 | 3,945 | 2010 | 9/25/2013 |
| CitiCentre Plaza | CitiCentre Plaza | Carroll, IA | 0 | 770 | 2,530 | 364 | | 1,031 | 2,633 | 3,664 | 954 | 1991/1995 | 10/2/2013 | CitiCentre Plaza | Carroll, IA | — | 770 | 2,530 | 605 | | 1,071 | 2,834 | 3,905 | 1,343 | 1991/2018 | 10/2/2013 |
| Duck Creek Plaza | Duck Creek Plaza | Bettendorf, IA | 0 | 4,612 | 13,007 | 1,683 | | 5,208 | 14,094 | 19,302 | 4,477 | 2005/2006 | 10/8/2013 | Duck Creek Plaza | Bettendorf, IA | — | 4,612 | 13,007 | 1,866 | | 5,239 | 14,246 | 19,485 | 5,860 | 2005/2022 | 10/8/2013 |
| Cahill Plaza | Cahill Plaza | Inver Grove Heights, MN | 0 | 2,587 | 5,114 | 683 | | 2,950 | 5,433 | 8,383 | 1,909 | 1995 | 10/9/2013 | Cahill Plaza | Inver Grove Heights, MN | — | 2,587 | 5,114 | 979 | | 2,990 | 5,690 | 8,680 | 2,824 | 1995/2020 | 10/9/2013 |
| College Plaza | College Plaza | Normal, IL | 0 | 4,460 | 17,772 | 3,325 | | 5,107 | 20,450 | 25,557 | 4,820 | 1983/1999 | 10/22/2013 | College Plaza | Normal, IL | — | 4,460 | 17,772 | 6,054 | | 5,151 | 23,135 | 28,286 | 8,049 | 1983/2018 | 10/22/2013 |
| Courthouse Marketplace | Courthouse Marketplace | Virginia Beach, VA | 11,650 | 6,130 | 8,061 | 1,147 | | 6,386 | 8,952 | 15,338 | 2,983 | 2005 | 10/25/2013 | Courthouse Marketplace | Virginia Beach, VA | 11,650 | 6,130 | 8,061 | 1,746 | | 6,403 | 9,534 | 15,937 | 4,368 | 2005 | 10/25/2013 |
| Hastings Marketplace | Hastings Marketplace | Hastings, MN | 0 | 3,980 | 10,045 | 777 | | 4,397 | 10,404 | 14,801 | 3,526 | 2002 | 11/6/2013 | Hastings Marketplace | Hastings, MN | — | 3,980 | 10,045 | 1,220 | | 4,532 | 10,713 | 15,245 | 5,026 | 2002 | 11/6/2013 |
| Coquina Plaza | Coquina Plaza | Southwest Ranches, FL | 6,192 | 9,458 | 11,770 | 1,117 | | 9,686 | 12,658 | 22,345 | 3,780 | 1998 | 11/7/2013 | Coquina Plaza | Southwest Ranches, FL | — | 9,458 | 11,770 | 1,359 | | 9,798 | 12,789 | 22,587 | 5,363 | 1998 | 11/7/2013 |
| Shoppes of Paradise Lakes | Shoppes of Paradise Lakes | Miami, FL | 5,057 | 5,811 | 6,020 | 968 | | 6,072 | 6,726 | 12,799 | 2,283 | 1999 | 11/7/2013 | Shoppes of Paradise Lakes | Miami, FL | — | 5,811 | 6,020 | 1,103 | | 6,156 | 6,778 | 12,934 | 3,182 | 1999 | 11/7/2013 |
| Collington Plaza | Collington Plaza | Bowie, MD | 0 | 12,207 | 15,142 | 905 | | 12,394 | 15,860 | 28,254 | 4,876 | 1996 | 11/21/2013 | Collington Plaza | Bowie, MD | — | 12,207 | 15,142 | 2,162 | | 12,605 | 16,906 | 29,511 | 7,123 | 1996 | 11/21/2013 |
| Golden Town Center | Golden Town Center | Golden, CO | 14,711 | 7,065 | 10,166 | 1,674 | | 7,460 | 11,446 | 18,905 | 3,914 | 1993/2003 | 11/22/2013 | Golden Town Center | Golden, CO | 14,711 | 7,065 | 10,166 | 2,016 | | 7,721 | 11,526 | 19,247 | 5,630 | 1993/2003 | 11/22/2013 |
| Northstar Marketplace | Northstar Marketplace | Ramsey, MN | 0 | 2,810 | 9,204 | 1,090 | | 2,923 | 10,182 | 13,105 | 3,318 | 2004 | 11/27/2013 | Northstar Marketplace | Ramsey, MN | — | 2,810 | 9,204 | 3,662 | | 3,023 | 12,653 | 15,676 | 4,487 | 2004/2023 | 11/27/2013 |
| Bear Creek Plaza | Bear Creek Plaza | Petoskey, MI | 0 | 5,677 | 17,611 | 1,614 | | 5,782 | 19,120 | 24,902 | 6,231 | 1998/2009 | 12/18/2013 | Bear Creek Plaza | Petoskey, MI | — | 5,677 | 17,611 | 1,737 | | 5,894 | 19,131 | 25,025 | 8,770 | 1998/2018 | 12/18/2013 |
| East Side Square | East Side Square | Springfield, OH | 0 | 394 | 963 | 120 | | 412 | 1,065 | 1,477 | 372 | 2007 | 12/18/2013 | East Side Square | Springfield, OH | — | 394 | 963 | 187 | | 412 | 1,132 | 1,544 | 540 | 2007 | 12/18/2013 |
| Flag City Station | Flag City Station | Findlay, OH | 0 | 4,685 | 9,630 | 3,124 | | 4,851 | 12,588 | 17,440 | 3,539 | 1992 | 12/18/2013 | Flag City Station | Findlay, OH | — | 4,685 | 9,630 | 3,699 | | 4,993 | 13,021 | 18,014 | 5,240 | 1992/2020 | 12/18/2013 |
| Hoke Crossing | Clayton, OH | 0 | 481 | 1,060 | 398 | | 509 | 1,430 | 1,939 | $458 | 2006 | 12/18/2013 |
| Southern Hills Crossing | Kettering, OH | 0 | 778 | 1,481 | 125 | | 807 | 1,577 | 2,384 | 623 | 2002 | 12/18/2013 |
| Town & Country Shopping Center | | Town & Country Shopping Center | Noblesville, IN | 13,480 | 7,361 | 16,269 | 505 | | 7,456 | 16,679 | 24,135 | 7,746 | 1998/2023 | 12/18/2013 |
| Sulphur Grove | | Sulphur Grove | Huber Heights, OH | — | 553 | 2,142 | 789 | | 611 | 2,873 | 3,484 | 1,145 | 2004 | 12/18/2013 |
| Southgate Shopping Center | | Southgate Shopping Center | Des Moines, IA | — | 2,434 | 8,358 | 1,795 | | 2,977 | 9,610 | 12,587 | $4,604 | 1972/2014 | 12/20/2013 |
| Sterling Pointe Center | | Sterling Pointe Center | Lincoln, CA | 24,073 | 7,039 | 20,822 | 2,196 | | 7,733 | 22,324 | 30,057 | 8,784 | 2004/2017 | 12/20/2013 |
| Arcadia Plaza | | Arcadia Plaza | Phoenix, AZ | — | 5,774 | 6,904 | 3,274 | | 6,118 | 9,834 | 15,952 | 4,312 | 1980/2018 | 12/30/2013 |
| Stop & Shop Plaza | | Stop & Shop Plaza | Enfield, CT | — | 8,892 | 15,028 | 1,448 | | 9,401 | 15,967 | 25,368 | 7,373 | 1988/1998 | 12/30/2013 |
| | | | | | | | | | | |
| PHILLIPS EDISON & COMPANY DECEMBER 31, 2023 FORM 10-K | | | F-34 |
| | SCHEDULE III—REAL ESTATE ASSETS AND ACCUMULATED DEPRECIATION | SCHEDULE III—REAL ESTATE ASSETS AND ACCUMULATED DEPRECIATION | SCHEDULE III—REAL ESTATE ASSETS AND ACCUMULATED DEPRECIATION |
December 31, 2020 | | December 31, 2023 | | December 31, 2023 |
| (in thousands) | (in thousands) | (in thousands) |
| | | | Initial Cost | Costs Capitalized Subsequent to Acquisition(2) | | Gross Amount Carried at End of Period(3) | | | | | Initial Cost | Costs Capitalized Subsequent to Acquisition(2) | | Gross Amount Carried at End of Period(3) | |
| Property Name | Property Name | City, State | Encumbrances(1) | Land and Improvements | Buildings and Improvements | | Land and Improvements | Buildings and Improvements | Total | Accumulated Depreciation | Date Constructed/ Renovated | Date Acquired | Property Name | City, State | Encumbrances(1) | Land and Improvements | Buildings and Improvements | | Land and Improvements | Buildings and Improvements | Total | Accumulated Depreciation | Date Constructed/ Renovated | Date Acquired |
| Town & Country Shopping Center | Noblesville, IN | 13,480 | 7,361 | 16,269 | 458 | | 7,454 | 16,634 | 24,088 | 5,707 | 1998 | 12/18/2013 |
| Sulphur Grove | Huber Heights, OH | 0 | 553 | 2,142 | 498 | | 611 | 2,581 | 3,192 | 682 | 2004 | 12/18/2013 |
| Southgate Shopping Center | Des Moines, IA | 0 | 2,434 | 8,358 | 892 | | 2,835 | 8,849 | 11,684 | 3,107 | 1972/2013 | 12/20/2013 |
| Sterling Pointe Center | Lincoln, CA | 24,073 | 7,039 | 20,822 | 1,573 | | 7,617 | 21,816 | 29,433 | 6,056 | 2004 | 12/20/2013 |
| Arcadia Plaza | Phoenix, AZ | 0 | 5,774 | 6,904 | 2,784 | | 5,946 | 9,516 | 15,462 | 2,821 | 1980 | 12/30/2013 |
| Stop & Shop Plaza | Enfield, CT | 0 | 8,892 | 15,028 | 1,157 | | 9,270 | 15,807 | 25,077 | 5,119 | 1988/1998 | 12/30/2013 |
| Fairacres Shopping Center | Fairacres Shopping Center | Oshkosh, WI | 0 | 3,543 | 5,189 | 786 | | 3,875 | 5,643 | 9,518 | 2,163 | 1992/2013 | 1/21/2014 | Fairacres Shopping Center | Oshkosh, WI | — | 3,543 | 5,189 | 1,315 | | 4,057 | 5,990 | 10,047 | 3,126 | 1992/2016 | 1/21/2014 |
| Savoy Plaza | Savoy Plaza | Savoy, IL | 0 | 4,304 | 10,895 | 857 | | 4,770 | 11,285 | 16,056 | 4,123 | 1999/2007 | 1/31/2014 | Savoy Plaza | Savoy, IL | — | 4,304 | 10,895 | 946 | | 4,789 | 11,356 | 16,145 | 5,742 | 1999/2015 | 1/31/2014 |
| The Shops of Uptown | The Shops of Uptown | Park Ridge, IL | 0 | 7,744 | 16,884 | 1,349 | | 7,934 | 18,043 | 25,977 | 4,830 | 2006 | 2/25/2014 | The Shops of Uptown | Park Ridge, IL | — | 7,744 | 16,884 | 2,135 | | 8,182 | 18,581 | 26,763 | 6,919 | 2006 | 2/25/2014 |
| Chapel Hill North Center | Chapel Hill North Center | Chapel Hill, NC | 6,538 | 4,776 | 10,189 | 1,338 | | 4,988 | 11,315 | 16,303 | 3,820 | 1998 | 2/28/2014 | Chapel Hill North Center | Chapel Hill, NC | 5,746 | 4,776 | 10,189 | 1,897 | | 5,173 | 11,689 | 16,862 | 5,537 | 1998 | 2/28/2014 |
| Coppell Market Center | Coppell Market Center | Coppell, TX | 11,594 | 4,870 | 12,236 | 246 | | 5,024 | 12,328 | 17,352 | 3,647 | 2008 | 3/5/2014 | Coppell Market Center | Coppell, TX | — | 4,870 | 12,236 | 511 | | 5,142 | 12,475 | 17,617 | 5,301 | 2008 | 3/5/2014 |
| Winchester Gateway | Winchester Gateway | Winchester, VA | 0 | 9,342 | 23,468 | 2,088 | | 9,585 | 25,313 | 34,898 | 7,399 | 2006 | 3/5/2014 | Winchester Gateway | Winchester, VA | — | 9,342 | 23,468 | 2,436 | | 9,658 | 25,588 | 35,246 | 10,856 | 2006 | 3/5/2014 |
| Stonewall Plaza | Stonewall Plaza | Winchester, VA | 0 | 7,929 | 16,642 | 962 | | 7,990 | 17,544 | 25,534 | 5,250 | 2007 | 3/5/2014 | Stonewall Plaza | Winchester, VA | — | 7,929 | 16,642 | 1,164 | | 8,137 | 17,598 | 25,735 | 7,675 | 2007 | 3/5/2014 |
| Town Fair Center | Town Fair Center | Louisville, KY | 0 | 8,108 | 14,411 | 5,435 | | 8,731 | 19,223 | 27,954 | 5,791 | 1988/1994 | 3/12/2014 | Town Fair Center | Louisville, KY | — | 8,108 | 14,411 | 5,576 | | 8,957 | 19,138 | 28,095 | 8,703 | 1988/2019 | 3/12/2014 |
| Villages at Eagles Landing | Villages at Eagles Landing | Stockbridge, GA | 1,173 | 2,824 | 5,515 | 1,114 | | 3,365 | 6,089 | 9,453 | 2,286 | 1995 | 3/13/2014 | Villages at Eagles Landing | Stockbridge, GA | — | 2,824 | 5,515 | 1,240 | | 3,365 | 6,214 | 9,579 | 3,368 | 1995 | 3/13/2014 |
| Champions Gate Village | Davenport, FL | 0 | 1,814 | 6,060 | 266 | | 1,916 | 6,224 | 8,140 | 2,147 | 2001 | 3/14/2014 |
| ChampionsGate Village | | ChampionsGate Village | Davenport, FL | — | 1,814 | 6,060 | 1,107 | | 2,075 | 6,906 | 8,981 | 2,995 | 2001 | 3/14/2014 |
| Towne Centre at Wesley Chapel | Towne Centre at Wesley Chapel | Wesley Chapel, FL | 0 | 2,466 | 5,553 | 566 | | 2,703 | 5,882 | 8,585 | 1,874 | 2000 | 3/14/2014 | Towne Centre at Wesley Chapel | Wesley Chapel, FL | — | 2,466 | 5,553 | 1,012 | | 2,776 | 6,255 | 9,031 | 2,623 | 2000 | 3/14/2014 |
| Statler Square | Statler Square | Staunton, VA | 7,096 | 4,108 | 9,072 | 901 | | 4,555 | 9,525 | 14,081 | 3,298 | 1989 | 3/21/2014 | Statler Square | Staunton, VA | — | 4,108 | 9,072 | 1,288 | | 4,695 | 9,773 | 14,468 | 4,566 | 1989/1997 | 3/21/2014 |
| Burbank Plaza | Burbank Plaza | Burbank, IL | 0 | 2,972 | 4,546 | 3,925 | | 3,580 | 7,863 | 11,443 | 2,352 | 1972/1995 | 3/25/2014 | Burbank Plaza | Burbank, IL | — | 2,972 | 4,546 | 3,965 | | 3,705 | 7,778 | 11,483 | 3,644 | 1972/2018 | 3/25/2014 |
| Hamilton Village | Hamilton Village | Chattanooga, TN | 0 | 12,682 | 19,103 | 2,305 | | 12,635 | 21,455 | 34,090 | 7,417 | 1989 | 4/3/2014 | Hamilton Village | Chattanooga, TN | — | 12,682 | 19,103 | 5,816 | | 13,293 | 24,308 | 37,601 | 10,968 | 1989/2021 | 4/3/2014 |
| Waynesboro Plaza | Waynesboro Plaza | Waynesboro, VA | 0 | 5,597 | 8,334 | 145 | | 5,670 | 8,406 | 14,076 | 2,903 | 2005 | 4/30/2014 | Waynesboro Plaza | Waynesboro, VA | — | 5,597 | 8,334 | 332 | | 5,814 | 8,449 | 14,263 | 4,243 | 2005 | 4/30/2014 |
| Southwest Marketplace | Southwest Marketplace | Las Vegas, NV | 0 | 16,019 | 11,270 | 2,920 | | 16,102 | 14,108 | 30,209 | 4,600 | 2008 | 5/5/2014 | Southwest Marketplace | Las Vegas, NV | — | 16,018 | 11,270 | 3,251 | | 16,337 | 14,202 | 30,539 | 6,660 | 2008/2017 | 5/5/2014 |
| Hampton Village | Hampton Village | Taylors, SC | 0 | 5,456 | 7,254 | 3,926 | | 5,949 | 10,688 | 16,636 | 3,539 | 1959/1998 | 5/21/2014 | Hampton Village | Taylors, SC | — | 5,456 | 7,254 | 4,432 | | 6,081 | 11,061 | 17,142 | 5,521 | 1959/2019 | 5/21/2014 |
| Central Station | Central Station | Louisville, KY | 12,095 | 6,143 | 6,932 | 2,394 | | 6,454 | 9,014 | 15,469 | 2,881 | 2005/2007 | 5/23/2014 | Central Station | Louisville, KY | 12,095 | 6,143 | 6,932 | 3,077 | | 6,723 | 9,429 | 16,152 | 4,282 | 2005/2018 | 5/23/2014 |
| Kirkwood Market Place | Kirkwood Market Place | Houston, TX | 0 | 5,786 | 9,697 | 997 | | 5,958 | 10,522 | 16,480 | 3,070 | 1979/2008 | 5/23/2014 | Kirkwood Market Place | Houston, TX | — | 5,786 | 9,697 | 1,760 | | 6,054 | 11,189 | 17,243 | 4,569 | 1979/2012 | 5/23/2014 |
| Fairview Plaza | Fairview Plaza | New Cumberland, PA | 0 | 2,786 | 8,500 | 306 | | 2,955 | 8,638 | 11,593 | 2,346 | 1992/1999 | 5/27/2014 | Fairview Plaza | New Cumberland, PA | — | 2,786 | 8,500 | 638 | | 3,174 | 8,750 | 11,924 | 3,380 | 1992/1999 | 5/27/2014 |
| Broadway Promenade | Broadway Promenade | Sarasota, FL | 0 | 3,831 | 6,795 | 339 | | 3,911 | 7,054 | 10,965 | 1,972 | 2007 | 5/28/2014 | Broadway Promenade | Sarasota, FL | — | 3,831 | 6,795 | 1,092 | | 4,239 | 7,479 | 11,718 | 2,853 | 2007 | 5/28/2014 |
| Townfair Center | Townfair Center | Indiana, PA | 0 | 7,007 | 13,233 | 1,246 | | 7,206 | 14,281 | 21,487 | 4,777 | 1995/2010 | 5/29/2014 | Townfair Center | Indiana, PA | — | 7,007 | 13,233 | 1,432 | | 7,357 | 14,315 | 21,672 | 7,026 | 1995/2016 | 5/29/2014 |
| St. Johns Commons | Jacksonville, FL | 0 | 1,599 | 10,387 | 643 | | 1,773 | 10,856 | 12,629 | 3,026 | 2003 | 5/30/2014 |
| Heath Brook Commons | Heath Brook Commons | Ocala, FL | 6,930 | 3,470 | 8,352 | 772 | | 3,690 | 8,905 | 12,595 | 2,625 | 2002 | 5/30/2014 | Heath Brook Commons | Ocala, FL | 6,930 | 3,470 | 8,352 | 1,140 | | 3,759 | 9,203 | 12,962 | 3,836 | 2002 | 5/30/2014 |
| Park View Square | Miramar, FL | 0 | 5,700 | 9,304 | 550 | | 5,819 | 9,735 | 15,554 | 2,876 | 2003 | 5/30/2014 |
| The Orchards | The Orchards | Yakima, WA | 0 | 5,425 | 8,743 | 511 | | 5,739 | 8,940 | 14,679 | 2,788 | 2002 | 6/3/2014 | The Orchards | Yakima, WA | — | 5,425 | 8,743 | 647 | | 5,819 | 8,996 | 14,815 | 4,111 | 2002 | 6/3/2014 |
| Shaw's Plaza Hanover | | Shaw's Plaza Hanover | Hanover, MA | — | 2,826 | 5,314 | 10 | | 2,826 | 5,324 | 8,150 | 2,200 | 1994/2000 | 6/23/2014 |
| Shaw's Plaza Easton | | Shaw's Plaza Easton | Easton, MA | — | 5,520 | 7,173 | 967 | | 5,897 | 7,763 | 13,660 | 3,481 | 1984/2004 | 6/23/2014 |
| Lynnwood Place | | Lynnwood Place | Jackson, TN | — | 3,341 | 4,826 | 1,150 | | 3,814 | 5,503 | 9,317 | 2,751 | 1986/2013 | 7/28/2014 |
| Thompson Valley Towne Center | | Thompson Valley Towne Center | Loveland, CO | — | 5,758 | 17,387 | 2,870 | | 6,432 | 19,583 | 26,015 | 7,826 | 1999 | 8/1/2014 |
| Lumina Commons | | Lumina Commons | Wilmington, NC | 5,812 | 2,008 | 11,249 | 1,647 | | 2,131 | 12,773 | 14,904 | 4,561 | 1974/2007 | 8/4/2014 |
| Driftwood Village | | Driftwood Village | Ontario, CA | — | 6,811 | 12,993 | 1,794 | | 7,617 | 13,981 | 21,598 | 5,632 | 1985 | 8/7/2014 |
| French Golden Gate | | French Golden Gate | Bartow, FL | — | 2,599 | 12,877 | 2,479 | | 2,923 | 15,032 | 17,955 | 5,209 | 1960/2011 | 8/28/2014 |
| Orchard Square | | Orchard Square | Washington Township, MI | — | 1,361 | 11,550 | 895 | | 1,638 | 12,168 | 13,806 | 4,748 | 1999/2011 | 9/8/2014 |
| Trader Joe's Center | | Trader Joe's Center | Dublin, OH | 6,745 | 2,338 | 7,922 | 3,558 | | 2,941 | 10,877 | 13,818 | 4,214 | 1986 | 9/11/2014 |
| Palmetto Pavilion | | Palmetto Pavilion | North Charleston, SC | — | 2,509 | 8,526 | 1,421 | | 3,583 | 8,873 | 12,456 | 3,546 | 2003 | 9/11/2014 |
| | | | | | | | | | | |
| PHILLIPS EDISON & COMPANY DECEMBER 31, 2023 FORM 10-K | | | F-35 |
| | SCHEDULE III—REAL ESTATE ASSETS AND ACCUMULATED DEPRECIATION | SCHEDULE III—REAL ESTATE ASSETS AND ACCUMULATED DEPRECIATION | SCHEDULE III—REAL ESTATE ASSETS AND ACCUMULATED DEPRECIATION |
December 31, 2020 | | December 31, 2023 | | December 31, 2023 |
| (in thousands) | (in thousands) | (in thousands) |
| | | | Initial Cost | Costs Capitalized Subsequent to Acquisition(2) | | Gross Amount Carried at End of Period(3) | | | | | Initial Cost | Costs Capitalized Subsequent to Acquisition(2) | | Gross Amount Carried at End of Period(3) | |
| Property Name | Property Name | City, State | Encumbrances(1) | Land and Improvements | Buildings and Improvements | | Land and Improvements | Buildings and Improvements | Total | Accumulated Depreciation | Date Constructed/ Renovated | Date Acquired | Property Name | City, State | Encumbrances(1) | Land and Improvements | Buildings and Improvements | | Land and Improvements | Buildings and Improvements | Total | Accumulated Depreciation | Date Constructed/ Renovated | Date Acquired |
| Shaw's Plaza Hanover | Hanover, MA | 0 | 2,826 | 5,314 | 10 | | 2,826 | 5,324 | 8,150 | 1,588 | 1994/2000 | 6/23/2014 |
| Shaw's Plaza Easton | Easton, MA | 0 | 5,520 | 7,173 | 621 | | 5,877 | 7,438 | 13,315 | 2,511 | 1984/2004 | 6/23/2014 |
| Lynnwood Place | Jackson, TN | 0 | 3,341 | 4,826 | 815 | | 3,620 | 5,362 | 8,982 | 1,881 | 1986/2013 | 7/28/2014 |
| Thompson Valley Towne Center | Loveland, CO | 0 | 5,758 | 17,387 | 1,499 | | 6,153 | 18,492 | 24,645 | 5,240 | 1999 | 8/1/2014 |
| Lumina Commons | Wilmington, NC | 7,165 | 2,008 | 11,249 | 1,171 | | 2,093 | 12,335 | 14,428 | 3,036 | 1974/2007 | 8/4/2014 |
| Driftwood Village | Ontario, CA | 0 | 6,811 | 12,993 | 1,590 | | 7,451 | 13,942 | 21,394 | 3,859 | 1985 | 8/7/2014 |
| French Golden Gate | Bartow, FL | 0 | 2,599 | 12,877 | 1,803 | | 2,856 | 14,422 | 17,279 | 3,771 | 1960/2011 | 8/28/2014 |
| Orchard Square | Washington Township, MI | 5,903 | 1,361 | 11,550 | 549 | | 1,609 | 11,851 | 13,460 | 3,306 | 1999 | 9/8/2014 |
| Trader Joe's Center | Dublin, OH | 6,745 | 2,338 | 7,922 | 1,806 | | 2,757 | 9,309 | 12,066 | 2,713 | 1986 | 9/11/2014 |
| Palmetto Pavilion | North Charleston, SC | 0 | 2,509 | 8,526 | 950 | | 3,208 | 8,777 | 11,985 | 2,353 | 2003 | 9/11/2014 |
| Five Town Plaza | Five Town Plaza | Springfield, MA | 0 | 8,912 | 19,635 | 6,344 | | 10,029 | 24,862 | 34,891 | 8,480 | 1970/2013 | 9/24/2014 | Five Town Plaza | Springfield, MA | — | 8,912 | 19,635 | 7,580 | | 10,497 | 25,630 | 36,127 | 12,429 | 1970/2019 | 9/24/2014 |
| Fairfield Crossing | Fairfield Crossing | Beavercreek, OH | 0 | 3,572 | 10,026 | 113 | | 3,612 | 10,099 | 13,711 | 2,909 | 1994 | 10/24/2014 | Fairfield Crossing | Beavercreek, OH | — | 3,572 | 10,026 | 283 | | 3,722 | 10,159 | 13,881 | 4,290 | 1994 | 10/24/2014 |
| Beavercreek Towne Center | Beavercreek Towne Center | Beavercreek, OH | 0 | 14,055 | 30,799 | 2,939 | | 14,911 | 32,883 | 47,794 | 9,886 | 1994 | 10/24/2014 | Beavercreek Towne Center | Beavercreek, OH | — | 14,055 | 30,799 | 4,853 | | 15,335 | 34,372 | 49,707 | 15,283 | 1994/2019 | 10/24/2014 |
| Grayson Village | Grayson Village | Loganville, GA | 0 | 3,952 | 5,620 | 2,052 | | 4,114 | 7,510 | 11,624 | 2,725 | 2002 | 10/24/2014 | Grayson Village | Loganville, GA | — | 3,952 | 5,620 | 2,482 | | 4,290 | 7,764 | 12,054 | 4,129 | 2002/2019 | 10/24/2014 |
| The Fresh Market Commons | The Fresh Market Commons | Pawleys Island, SC | 0 | 2,442 | 4,941 | 128 | | 2,457 | 5,054 | 7,511 | 1,518 | 2011 | 10/28/2014 | The Fresh Market Commons | Pawleys Island, SC | — | 2,442 | 4,941 | 228 | | 2,535 | 5,076 | 7,611 | 2,268 | 2011/2014 | 10/28/2014 |
| Claremont Village | Claremont Village | Everett, WA | 0 | 5,635 | 10,544 | 1,094 | | 5,854 | 11,420 | 17,273 | 3,189 | 1994/2012 | 11/6/2014 | Claremont Village | Everett, WA | — | 5,635 | 10,544 | 1,776 | | 6,344 | 11,611 | 17,955 | 4,815 | 1994/2012 | 11/6/2014 |
| Cherry Hill Marketplace | Cherry Hill Marketplace | Westland, MI | 0 | 4,641 | 10,137 | 2,740 | | 5,140 | 12,378 | 17,518 | 4,035 | 1992/2000 | 12/17/2014 | Cherry Hill Marketplace | Westland, MI | — | 4,641 | 10,137 | 3,068 | | 5,321 | 12,525 | 17,846 | 6,122 | 1992/2017 | 12/17/2014 |
| Nor'Wood Shopping Center | Nor'Wood Shopping Center | Colorado Springs, CO | 0 | 5,358 | 6,684 | 556 | | 5,446 | 7,152 | 12,598 | 2,561 | 2003 | 1/8/2015 | Nor'Wood Shopping Center | Colorado Springs, CO | — | 5,358 | 6,684 | 950 | | 5,607 | 7,385 | 12,992 | 3,857 | 2003/2007 | 1/8/2015 |
| Sunburst Plaza | Sunburst Plaza | Glendale, AZ | 0 | 3,435 | 6,041 | 1,176 | | 3,583 | 7,069 | 10,652 | 2,537 | 1970 | 2/11/2015 | Sunburst Plaza | Glendale, AZ | — | 3,435 | 6,041 | 3,095 | | 4,380 | 8,191 | 12,571 | 3,701 | 1970/2022 | 2/11/2015 |
| Rivermont Station | Rivermont Station | Johns Creek, GA | 0 | 6,876 | 8,916 | 1,888 | | 7,169 | 10,511 | 17,680 | 4,225 | 1996/2003 | 2/27/2015 | Rivermont Station | Johns Creek, GA | — | 6,876 | 8,916 | 5,098 | | 7,270 | 13,620 | 20,890 | 6,446 | 1996/2022 | 2/27/2015 |
| Breakfast Point Marketplace | Breakfast Point Marketplace | Panama City Beach, FL | 0 | 5,578 | 12,052 | 791 | | 6,010 | 12,411 | 18,421 | 3,497 | 2009/2010 | 3/13/2015 | Breakfast Point Marketplace | Panama City Beach, FL | — | 5,578 | 12,052 | 902 | | 6,112 | 12,420 | 18,532 | 5,369 | 2009/2010 | 3/13/2015 |
| Falcon Valley | Falcon Valley | Lenexa, KS | 0 | 3,131 | 6,873 | 278 | | 3,375 | 6,908 | 10,283 | 2,150 | 2008/2009 | 3/13/2015 | Falcon Valley | Lenexa, KS | — | 3,131 | 6,873 | 418 | | 3,495 | 6,927 | 10,422 | 3,287 | 2008/2009 | 3/13/2015 |
| Kohl's Onalaska | Kohl's Onalaska | Onalaska, WI | 0 | 2,670 | 5,648 | 0 | | 2,670 | 5,648 | 8,317 | 1,931 | 1992/1993 | 3/13/2015 | Kohl's Onalaska | Onalaska, WI | — | 2,670 | 5,648 | 300 | | 2,670 | 5,948 | 8,618 | 2,760 | 1992/2021 | 3/13/2015 |
| Coronado Center | Coronado Center | Santa Fe, NM | 11,560 | 4,396 | 16,460 | 3,765 | | 4,687 | 19,934 | 24,621 | 4,471 | 1964 | 5/1/2015 | Coronado Center | Santa Fe, NM | 11,560 | 4,396 | 16,460 | 5,230 | | 4,885 | 21,201 | 26,086 | 7,254 | 1964/2019 | 5/1/2015 |
| West Creek Plaza | West Creek Plaza | Coconut Creek, FL | 5,529 | 3,459 | 6,131 | 286 | | 3,513 | 6,362 | 9,876 | 1,605 | 2006/2013 | 7/10/2015 | West Creek Plaza | Coconut Creek, FL | — | 3,459 | 6,131 | 807 | | 3,654 | 6,743 | 10,397 | 2,469 | 2006/2013 | 7/10/2015 |
| Northwoods Crossing | Northwoods Crossing | Taunton, MA | 0 | 10,092 | 14,437 | 325 | | 10,278 | 14,576 | 24,854 | 5,306 | 2003/2010 | 5/24/2016 | Northwoods Crossing | Taunton, MA | — | 10,092 | 14,437 | 394 | | 10,194 | 14,729 | 24,923 | 8,735 | 2003/2022 | 5/24/2016 |
| Murphy Marketplace | Murphy Marketplace | Murphy, TX | 0 | 28,652 | 33,122 | 1,451 | | 28,988 | 34,237 | 63,225 | 7,281 | 2008/2015 | 6/24/2016 | Murphy Marketplace | Murphy, TX | — | 28,651 | 33,122 | 5,083 | | 29,449 | 37,407 | 66,856 | 12,284 | 2008/2021 | 6/24/2016 |
| Harbour Village | Harbour Village | Jacksonville, FL | 0 | 5,630 | 16,727 | 1,319 | | 6,032 | 17,644 | 23,676 | 3,602 | 2006 | 9/22/2016 | Harbour Village | Jacksonville, FL | — | 5,630 | 16,727 | 4,117 | | 6,146 | 20,328 | 26,474 | 6,548 | 2006/2021 | 9/22/2016 |
| Oak Mill Plaza | Oak Mill Plaza | Niles, IL | 1,059 | 6,843 | 13,692 | 1,192 | | 7,403 | 14,324 | 21,726 | 4,227 | 1977 | 10/3/2016 | Oak Mill Plaza | Niles, IL | — | 6,843 | 13,692 | 6,843 | | 7,617 | 19,761 | 27,378 | 7,344 | 1977/2023 | 10/3/2016 |
| Southern Palms | Southern Palms | Tempe, AZ | 23,207 | 10,025 | 24,346 | 2,078 | | 10,494 | 25,956 | 36,450 | 6,380 | 1982 | 10/26/2016 | Southern Palms | Tempe, AZ | 21,760 | 10,025 | 24,346 | 4,812 | | 10,495 | 28,688 | 39,183 | 11,201 | 1982/2018 | 10/26/2016 |
| Golden Eagle Village | Golden Eagle Village | Clermont, FL | 7,094 | 3,746 | 7,735 | 329 | | 3,822 | 7,988 | 11,810 | 1,744 | 2011 | 10/27/2016 | Golden Eagle Village | Clermont, FL | 6,678 | 3,746 | 7,735 | 911 | | 3,988 | 8,404 | 12,392 | 3,059 | 2011 | 10/27/2016 |
| Atwater Marketplace | Atwater, CA | 0 | 6,116 | 7,597 | 526 | | 6,299 | 7,941 | 14,240 | 1,939 | 2008 | 2/10/2017 |
Atwater Marketplace(4) | | Atwater Marketplace(4) | Atwater, CA | — | 6,116 | 7,597 | (11,465) | | 417 | 1,831 | 2,248 | 132 | 2023 | 2/10/2017 |
| Rocky Ridge Town Center | | Rocky Ridge Town Center | Roseville, CA | 19,098 | 5,449 | 29,207 | 1,105 | | 5,686 | 30,075 | 35,761 | 7,991 | 1996/2015 | 4/18/2017 |
| Greentree Centre | | Greentree Centre | Racine, WI | — | 2,955 | 8,718 | 510 | | 3,076 | 9,107 | 12,183 | 2,998 | 1989/2018 | 5/5/2017 |
| Sierra Del Oro Towne Centre | | Sierra Del Oro Towne Centre | Corona, CA | — | 9,011 | 17,989 | 2,365 | | 9,481 | 19,884 | 29,365 | 6,165 | 1991/2017 | 6/20/2017 |
| Birdneck Shopping Center | | Birdneck Shopping Center | Virginia Beach, VA | — | 1,900 | 3,253 | 1,023 | | 2,091 | 4,085 | 6,176 | 1,878 | 1987/2017 | 10/4/2017 |
| Crossroads Plaza | | Crossroads Plaza | Asheboro, NC | — | 1,722 | 2,720 | 815 | | 2,216 | 3,041 | 5,257 | 1,590 | 1984/2016 | 10/4/2017 |
| Dunlop Village | | Dunlop Village | Colonial Heights, VA | — | 2,420 | 4,892 | 2,386 | | 2,735 | 6,963 | 9,698 | 2,273 | 1987/2012 | 10/4/2017 |
| Edgecombe Square | | Edgecombe Square | Tarboro, NC | — | 1,412 | 2,258 | 515 | | 1,493 | 2,692 | 4,185 | 1,811 | 1990/2013 | 10/4/2017 |
| Forest Park Square | | Forest Park Square | Cincinnati, OH | — | 4,007 | 5,877 | 1,288 | | 4,501 | 6,671 | 11,172 | 3,066 | 1988/2018 | 10/4/2017 |
| Goshen Station | | Goshen Station | Goshen, OH | 3,605 | 1,555 | 4,621 | 181 | | 1,800 | 4,557 | 6,357 | 2,426 | 1973/2003 | 10/4/2017 |
| The Village Shopping Center | | The Village Shopping Center | Mooresville, IN | — | 2,059 | 8,325 | 944 | | 2,323 | 9,005 | 11,328 | 3,099 | 1965/2019 | 10/4/2017 |
| Hickory Plaza | | Hickory Plaza | Nashville, TN | — | 2,927 | 5,099 | 2,455 | | 3,008 | 7,473 | 10,481 | 2,208 | 1974/2020 | 10/4/2017 |
| | | | | | | | | | | |
| PHILLIPS EDISON & COMPANY DECEMBER 31, 2023 FORM 10-K | | | F-36 |
| | | | | | | | | | | | | | | | | | | | | | | | | | | | | | | | | | | | | | |
| SCHEDULE III—REAL ESTATE ASSETS AND ACCUMULATED DEPRECIATION |
| December 31, 2020 |
| (in thousands) |
| | | Initial Cost | Costs Capitalized Subsequent to Acquisition(2) | | Gross Amount Carried at End of Period(3) | | | |
| Property Name | City, State | Encumbrances(1) | Land and Improvements | Buildings and Improvements | | Land and Improvements | Buildings and Improvements | Total | Accumulated Depreciation | Date Constructed/ Renovated | Date Acquired |
| Rocky Ridge Town Center | Roseville, CA | 20,679 | 5,449 | 29,207 | 677 | | 5,618 | 29,714 | 35,333 | 4,373 | 1996 | 4/18/2017 |
| Greentree Centre | Racine, WI | 0 | 2,955 | 8,718 | 1,062 | | 3,444 | 9,291 | 12,735 | 1,680 | 1989/1994 | 5/5/2017 |
| Sierra Del Oro Towne Centre | Corona, CA | 6,849 | 9,011 | 17,989 | 1,382 | | 9,250 | 19,132 | 28,382 | 3,241 | 1991 | 6/20/2017 |
| Ashland Junction | Ashland, VA | 0 | 4,987 | 6,050 | (2,982) | | 3,741 | 4,313 | 8,055 | 3 | 1989 | 10/4/2017 |
| Barclay Place Shopping Center | Lakeland, FL | 0 | 1,984 | 7,174 | (2,272) | | 1,522 | 5,364 | 6,886 | 416 | 1989 | 10/4/2017 |
| Barnwell Plaza | Barnwell, SC | 0 | 1,190 | 1,883 | 18 | | 1,198 | 1,893 | 3,091 | 862 | 1985 | 10/4/2017 |
| Birdneck Shopping Center | Virginia Beach, VA | 0 | 1,900 | 3,253 | 602 | | 2,057 | 3,698 | 5,755 | 889 | 1987 | 10/4/2017 |
| Crossroads Plaza | Asheboro, NC | 0 | 1,722 | 2,720 | 658 | | 2,101 | 2,999 | 5,100 | 865 | 1984 | 10/4/2017 |
| Dunlop Village | Colonial Heights, VA | 0 | 2,420 | 4,892 | 829 | | 2,593 | 5,549 | 8,141 | 1,089 | 1987 | 10/4/2017 |
| Edgecombe Square | Tarboro, NC | 0 | 1,412 | 2,258 | 434 | | 1,485 | 2,620 | 4,104 | 1,122 | 1990 | 10/4/2017 |
| Emporia West Plaza | Emporia, KS | 0 | 872 | 3,409 | (415) | | 762 | 3,104 | 3,865 | 294 | 1980/2000 | 10/4/2017 |
| Forest Park Square | Cincinnati, OH | 0 | 4,007 | 5,877 | 736 | | 4,278 | 6,343 | 10,621 | 1,614 | 1988 | 10/4/2017 |
| Goshen Station | Goshen, OH | 3,605 | 1,555 | 4,621 | 130 | | 1,649 | 4,657 | 6,306 | 1,280 | 1973/2003 | 10/4/2017 |
| The Village Shopping Center | Mooresville, IN | 0 | 2,363 | 8,325 | 140 | | 2,098 | 8,731 | 10,829 | 1,262 | 1965/1997 | 10/4/2017 |
| Heritage Oaks | Gridley, CA | 4,839 | 2,390 | 7,404 | 837 | | 2,410 | 8,221 | 10,631 | 1,903 | 1979 | 10/4/2017 |
| Hickory Plaza | Nashville, TN | 4,780 | 2,927 | 5,099 | 1,940 | | 2,961 | 7,005 | 9,966 | 1,110 | 1974/1986 | 10/4/2017 |
| Highland Fair | Gresham, OR | 6,833 | 3,263 | 7,979 | 466 | | 3,350 | 8,358 | 11,709 | 1,334 | 1984/1999 | 10/4/2017 |
| High Point Village | Bellefontaine, OH | 0 | 3,386 | 7,485 | (2,392) | | 2,507 | 5,972 | 8,479 | 636 | 1988 | 10/4/2017 |
| Mayfair Village | Hurst, TX | 16,398 | 15,343 | 16,522 | 1,865 | | 15,527 | 18,202 | 33,729 | 3,314 | 1981/2004 | 10/4/2017 |
| LaPlata Plaza | La Plata, MD | 17,860 | 8,434 | 22,855 | 1,954 | | 8,657 | 24,586 | 33,243 | 3,494 | 2003 | 10/4/2017 |
| Lafayette Square | Lafayette, IN | 7,182 | 5,387 | 5,636 | 43 | | 5,373 | 5,692 | 11,065 | 3,062 | 1963/2001 | 10/4/2017 |
| Landen Square | Maineville, OH | 0 | 2,081 | 3,467 | 984 | | 2,314 | 4,218 | 6,532 | 1,184 | 1981/2003 | 10/4/2017 |
| Melbourne Village Plaza | Melbourne, FL | 0 | 5,418 | 7,280 | (1,343) | | 4,865 | 6,490 | 11,355 | 824 | 1987 | 10/4/2017 |
| Commerce Square | Brownwood, TX | 0 | 6,027 | 8,341 | 622 | | 6,287 | 8,703 | 14,990 | 2,141 | 1969/2007 | 10/4/2017 |
| Upper Deerfield Plaza | Bridgeton, NJ | 0 | 5,073 | 5,882 | (1,965) | | 3,956 | 5,034 | 8,990 | 834 | 1977/1994 | 10/4/2017 |
| Monfort Heights | Cincinnati, OH | 4,216 | 2,357 | 3,545 | 9 | | 2,357 | 3,554 | 5,911 | 771 | 1987 | 10/4/2017 |
| Mountain Park Plaza | Roswell, GA | 6,341 | 6,118 | 6,652 | 339 | | 6,152 | 6,957 | 13,109 | 1,227 | 1988/2003 | 10/4/2017 |
| Nordan Shopping Center | Danville, VA | 0 | 1,911 | 6,751 | 655 | | 2,018 | 7,299 | 9,316 | 1,600 | 1961/2002 | 10/4/2017 |
| Northside Plaza | Clinton, NC | 0 | 1,406 | 5,471 | 291 | | 1,416 | 5,751 | 7,168 | 1,218 | 1982 | 10/4/2017 |
| Park Place Plaza | Port Orange, FL | 0 | 2,347 | 8,458 | (2,398) | | 1,838 | 6,570 | 8,407 | 465 | 1984 | 10/4/2017 |
| Parkway Station | Warner Robins, GA | 0 | 3,416 | 5,309 | (1,395) | | 2,608 | 4,722 | 7,330 | 596 | 1982 | 10/4/2017 |
| Parsons Village | Seffner, FL | 4,744 | 3,465 | 10,864 | (4,186) | | 2,430 | 7,713 | 10,143 | 716 | 1983/1994 | 10/4/2017 |
| Portland Village | Portland, TN | 0 | 1,408 | 5,235 | 1,134 | | 1,474 | 6,303 | 7,777 | 1,150 | 1984 | 10/4/2017 |
| | | | | | | | | | | | | | | | | | | | | | | | | | | | | | | | | | | | | | |
| SCHEDULE III—REAL ESTATE ASSETS AND ACCUMULATED DEPRECIATION |
| December 31, 2023 |
| (in thousands) |
| | | Initial Cost | Costs Capitalized Subsequent to Acquisition(2) | | Gross Amount Carried at End of Period(3) | | | |
| Property Name | City, State | Encumbrances(1) | Land and Improvements | Buildings and Improvements | | Land and Improvements | Buildings and Improvements | Total | Accumulated Depreciation | Date Constructed/ Renovated | Date Acquired |
| Highland Fair | Gresham, OR | — | 3,263 | 7,979 | 693 | | 3,411 | 8,524 | 11,935 | 2,563 | 1984/2013 | 10/4/2017 |
| Mayfair Village | Hurst, TX | 16,398 | 15,343 | 16,522 | 4,103 | | 15,874 | 20,094 | 35,968 | 7,081 | 1981/2022 | 10/4/2017 |
| LaPlata Plaza | La Plata, MD | 17,860 | 8,434 | 22,855 | 2,397 | | 8,749 | 24,937 | 33,686 | 6,975 | 2003/2019 | 10/4/2017 |
| Lafayette Square | Lafayette, IN | — | 5,387 | 5,636 | 1,162 | | 5,422 | 6,763 | 12,185 | 4,896 | 1963/2022 | 10/4/2017 |
| Commerce Square | Brownwood, TX | — | 6,027 | 8,341 | 745 | | 5,844 | 9,269 | 15,113 | 1,926 | 1969/2022 | 10/4/2017 |
| Monfort Heights | Cincinnati, OH | 4,216 | 2,357 | 3,545 | 9 | | 2,357 | 3,554 | 5,911 | 1,481 | 1987/2015 | 10/4/2017 |
| Mountain Park Plaza | Roswell, GA | — | 6,118 | 6,652 | 945 | | 6,230 | 7,485 | 13,715 | 2,458 | 1988/2003 | 10/4/2017 |
| Nordan Shopping Center | Danville, VA | — | 1,911 | 6,751 | 975 | | 2,063 | 7,574 | 9,637 | 2,782 | 1961/2015 | 10/4/2017 |
| Northside Plaza | Clinton, NC | — | 1,406 | 5,471 | 789 | | 1,541 | 6,125 | 7,666 | 2,386 | 1982/2015 | 10/4/2017 |
| Park Place Plaza | Port Orange, FL | — | 2,347 | 8,458 | (2,201) | | 1,956 | 6,648 | 8,604 | 1,699 | 1984/2012 | 10/4/2017 |
| Parsons Village | Seffner, FL | — | 3,465 | 10,864 | (3,964) | | 2,481 | 7,884 | 10,365 | 2,141 | 1983/1994 | 10/4/2017 |
| Hillside - West | Hillside, UT | — | 691 | 1,739 | 3,870 | | 4,561 | 1,739 | 6,300 | 832 | 2006 | 10/4/2017 |
| South Oaks Shopping Center | Live Oak, FL | — | 1,742 | 5,119 | 1,864 | | 1,943 | 6,782 | 8,725 | 3,067 | 1976/2022 | 10/4/2017 |
| Summerville Galleria | Summerville, SC | — | 4,104 | 8,668 | 1,473 | | 4,651 | 9,594 | 14,245 | 3,302 | 1989/2014 | 10/4/2017 |
| The Oaks | Hudson, FL | — | 3,876 | 6,668 | 11,966 | | 4,726 | 17,784 | 22,510 | 3,106 | 1981/2022 | 10/4/2017 |
| Riverplace Centre | Noblesville, IN | 5,175 | 3,890 | 4,044 | 1,025 | | 4,008 | 4,951 | 8,959 | 2,609 | 1992/2020 | 10/4/2017 |
| Towne Crossing Shopping Center | Mesquite, TX | — | 5,358 | 15,584 | 2,595 | | 5,507 | 18,030 | 23,537 | 5,717 | 1984/2016 | 10/4/2017 |
| Village at Waterford | Midlothian, VA | — | 2,702 | 5,194 | 992 | | 3,019 | 5,869 | 8,888 | 2,119 | 1991/2016 | 10/4/2017 |
| Windsor Center | Dallas, NC | — | 2,488 | 5,186 | 639 | | 2,643 | 5,670 | 8,313 | 2,566 | 1974/2015 | 10/4/2017 |
| 12 West Marketplace | Litchfield, MN | — | 835 | 3,538 | 186 | | 1,007 | 3,552 | 4,559 | 1,931 | 1989/2010 | 10/4/2017 |
| Willowbrook Commons | Nashville, TN | — | 5,384 | 6,002 | 824 | | 5,767 | 6,443 | 12,210 | 2,450 | 2005 | 10/4/2017 |
| Edgewood Towne Center | Edgewood, PA | — | 10,029 | 22,535 | 3,359 | | 10,852 | 25,071 | 35,923 | 9,683 | 1990/2021 | 10/4/2017 |
| Everson Pointe | Snellville, GA | 7,734 | 4,222 | 8,421 | 537 | | 4,377 | 8,803 | 13,180 | 3,058 | 1999 | 10/4/2017 |
| Village Square of Delafield | Delafield, WI | 8,257 | 6,206 | 6,869 | 498 | | 6,526 | 7,047 | 13,573 | 2,941 | 2007/2017 | 10/4/2017 |
| Shoppes of Lake Village | Leesburg, FL | — | 7,193 | 3,795 | 7,108 | | 7,581 | 10,515 | 18,096 | 3,682 | 1987/2021 | 2/26/2018 |
| Sierra Vista Plaza | Murrieta, CA | — | 9,824 | 11,669 | 2,572 | | 10,472 | 13,593 | 24,065 | 3,665 | 1991/2021 | 9/28/2018 |
| Wheat Ridge Marketplace | Wheat Ridge, CO | — | 7,926 | 8,393 | 1,410 | | 8,490 | 9,239 | 17,729 | 3,024 | 1996/2019 | 10/3/2018 |
| Atlantic Plaza | North Reading, MA | — | 12,341 | 12,699 | 2,276 | | 12,667 | 14,649 | 27,316 | 4,674 | 1959/2014 | 11/9/2018 |
| Staunton Plaza | Staunton, VA | — | 4,818 | 14,380 | 102 | | 4,883 | 14,417 | 19,300 | 3,245 | 2006 | 11/16/2018 |
| Bethany Village | Alpharetta, GA | — | 6,138 | 8,355 | 837 | | 6,246 | 9,084 | 15,330 | 2,430 | 2001 | 11/16/2018 |
| Northpark Village | Lubbock, TX | — | 3,087 | 6,047 | 388 | | 3,242 | 6,280 | 9,522 | 1,540 | 1990 | 11/16/2018 |
| Kings Crossing | Sun City Center, FL | 10,467 | 5,654 | 11,225 | 571 | | 5,887 | 11,563 | 17,450 | 2,889 | 2000/2018 | 11/16/2018 |
| Lake Washington Crossing | Melbourne, FL | — | 4,222 | 13,553 | 3,192 | | 4,369 | 16,598 | 20,967 | 3,499 | 1987/2023 | 11/16/2018 |
| Kipling Marketplace | Littleton, CO | — | 4,020 | 10,405 | 622 | | 4,201 | 10,846 | 15,047 | 3,155 | 1983/2009 | 11/16/2018 |
| | | | | | | | | | | |
| PHILLIPS EDISON & COMPANY DECEMBER 31, 2023 FORM 10-K | | | F-37 |
| | | | | | | | | | | | | | | | | | | | | | | | | | | | | | | | | | | | | | |
| SCHEDULE III—REAL ESTATE ASSETS AND ACCUMULATED DEPRECIATION |
| December 31, 2020 |
| (in thousands) |
| | | Initial Cost | Costs Capitalized Subsequent to Acquisition(2) | | Gross Amount Carried at End of Period(3) | | | |
| Property Name | City, State | Encumbrances(1) | Land and Improvements | Buildings and Improvements | | Land and Improvements | Buildings and Improvements | Total | Accumulated Depreciation | Date Constructed/ Renovated | Date Acquired |
| Quail Valley Shopping Center | Missouri City, TX | 0 | 2,452 | 11,501 | (4,209) | | 1,595 | 8,148 | 9,743 | 550 | 1983 | 10/4/2017 |
| Hillside - West | Hillside, UT | 0 | 691 | 1,739 | 3,870 | | 4,561 | 1,739 | 6,300 | 389 | 2006 | 10/4/2017 |
| Rolling Hills Shopping Center | Tucson, AZ | 8,336 | 5,398 | 11,792 | (2,733) | | 4,600 | 9,857 | 14,458 | 609 | 1980/1997 | 10/4/2017 |
| South Oaks Shopping Center | Live Oak, FL | 3,220 | 1,742 | 5,119 | 104 | | 1,793 | 5,172 | 6,966 | 1,817 | 1976/2000 | 10/4/2017 |
| East Pointe Plaza | Columbia, SC | 0 | 7,496 | 11,752 | (10,072) | | 3,681 | 5,495 | 9,176 | 734 | 1990 | 10/4/2017 |
| Southgate Center | Heath, OH | 0 | 4,246 | 22,752 | 462 | | 4,272 | 23,188 | 27,460 | 4,020 | 1960/1997 | 10/4/2017 |
| Summerville Galleria | Summerville, SC | 0 | 4,104 | 8,668 | 618 | | 4,449 | 8,941 | 13,390 | 1,723 | 1989/2003 | 10/4/2017 |
| The Oaks | Hudson, FL | 0 | 3,876 | 6,668 | (1,192) | | 3,460 | 5,892 | 9,352 | 1,191 | 1981 | 10/4/2017 |
| Riverplace Centre | Noblesville, IN | 5,175 | 3,890 | 4,044 | 770 | | 4,001 | 4,703 | 8,704 | 1,341 | 1992 | 10/4/2017 |
| Town & Country Center | Hamilton, OH | 2,065 | 2,268 | 4,372 | 324 | | 2,345 | 4,618 | 6,963 | 1,051 | 1950 | 10/4/2017 |
| Powell Villa | Portland, OR | 0 | 3,364 | 7,318 | 2,768 | | 3,396 | 10,054 | 13,450 | 1,689 | 1959/1991 | 10/4/2017 |
| Towne Crossing Shopping Center | Mesquite, TX | 0 | 5,358 | 15,584 | 1,272 | | 5,410 | 16,803 | 22,213 | 2,966 | 1984 | 10/4/2017 |
| Village at Waterford | Midlothian, VA | 4,173 | 2,702 | 5,194 | 541 | | 2,820 | 5,617 | 8,437 | 1,041 | 1991 | 10/4/2017 |
| Buckingham Square | Richardson, TX | 0 | 2,087 | 6,392 | (551) | | 1,913 | 6,015 | 7,928 | 377 | 1978 | 10/4/2017 |
| Western Square Shopping Center | Laurens, SC | 0 | 1,013 | 3,333 | (2,726) | | 308 | 1,312 | 1,620 | 0 | 1978/1991 | 10/4/2017 |
| Windsor Center | Dallas, NC | 0 | 2,488 | 5,186 | 359 | | 2,488 | 5,545 | 8,032 | 1,401 | 1974/1996 | 10/4/2017 |
| 12 West Marketplace | Litchfield, MN | 0 | 835 | 3,538 | 110 | | 945 | 3,538 | 4,483 | 1,235 | 1989 | 10/4/2017 |
| Orchard Plaza | Altoona, PA | 788 | 2,537 | 5,366 | (3,766) | | 1,321 | 2,816 | 4,136 | 248 | 1987 | 10/4/2017 |
| Willowbrook Commons | Nashville, TN | 0 | 5,384 | 6,002 | 293 | | 5,470 | 6,209 | 11,678 | 1,321 | 2005 | 10/4/2017 |
| Edgewood Towne Center | Edgewood, PA | 0 | 10,029 | 22,535 | 4,071 | | 10,375 | 26,261 | 36,636 | 5,503 | 1990 | 10/4/2017 |
| Everson Pointe | Snellville, GA | 7,734 | 4,222 | 8,421 | 455 | | 4,360 | 8,737 | 13,098 | 1,727 | 1999 | 10/4/2017 |
Gleneagles Court(4) | Memphis, TN | 0 | 3,892 | 8,157 | (11,951) | | 98 | 0 | 98 | 0 | 1988 | 10/4/2017 |
| Village Square of Delafield | Delafield, WI | 8,257 | 6,206 | 6,869 | 443 | | 6,511 | 7,008 | 13,519 | 1,502 | 2007 | 10/4/2017 |
| Shoppes of Lake Village | Leesburg, FL | 0 | 4,065 | 3,795 | 1,375 | | 4,110 | 5,125 | 9,235 | 1,681 | 1987/1998 | 2/26/2018 |
| Sierra Vista Plaza | Murrieta, CA | 0 | 9,824 | 11,669 | 1,370 | | 10,328 | 12,535 | 22,863 | 1,404 | 1991 | 9/28/2018 |
| Wheat Ridge Marketplace | Wheat Ridge, CO | 11,399 | 7,926 | 8,393 | 799 | | 8,442 | 8,675 | 17,117 | 1,213 | 1996 | 10/3/2018 |
| Atlantic Plaza | North Reading, MA | 0 | 12,341 | 12,699 | 405 | | 12,607 | 12,839 | 25,446 | 1,831 | 1959/1973 | 11/9/2018 |
| Staunton Plaza | Staunton, VA | 0 | 4,818 | 14,380 | 31 | | 4,832 | 14,396 | 19,229 | 1,340 | 2006 | 11/16/2018 |
| Bethany Village | Alpharetta, GA | 0 | 6,138 | 8,355 | 321 | | 6,145 | 8,668 | 14,813 | 992 | 2001 | 11/16/2018 |
| Northpark Village | Lubbock, TX | 0 | 3,087 | 6,047 | 103 | | 3,102 | 6,135 | 9,237 | 683 | 1990 | 11/16/2018 |
| Kings Crossing | Sun City Center, FL | 10,467 | 5,654 | 11,225 | 152 | | 5,740 | 11,292 | 17,031 | 1,200 | 2000/2018 | 11/16/2018 |
| Lake Washington Crossing | Melbourne, FL | 0 | 4,222 | 13,553 | 790 | | 4,264 | 14,300 | 18,564 | 1,822 | 1987/2012 | 11/16/2018 |
| | | | | | | | | | | | | | | | | | | | | | | | | | | | | | | | | | | | | | |
| SCHEDULE III—REAL ESTATE ASSETS AND ACCUMULATED DEPRECIATION |
| December 31, 2023 |
| (in thousands) |
| | | Initial Cost | Costs Capitalized Subsequent to Acquisition(2) | | Gross Amount Carried at End of Period(3) | | | |
| Property Name | City, State | Encumbrances(1) | Land and Improvements | Buildings and Improvements | | Land and Improvements | Buildings and Improvements | Total | Accumulated Depreciation | Date Constructed/ Renovated | Date Acquired |
| MetroWest Village | Orlando, FL | — | 6,841 | 15,333 | 1,539 | | 7,164 | 16,549 | 23,713 | 4,087 | 1990 | 11/16/2018 |
| Spring Cypress Village | Houston, TX | — | 9,579 | 14,567 | 1,939 | | 9,792 | 16,293 | 26,085 | 3,972 | 1982/2012 | 11/16/2018 |
| Commonwealth Square | Folsom, CA | — | 9,955 | 12,586 | 1,432 | | 10,129 | 13,844 | 23,973 | 4,862 | 1987 | 11/16/2018 |
| Point Loomis | Milwaukee, WI | — | 4,171 | 4,901 | 2,183 | | 4,171 | 7,084 | 11,255 | 2,812 | 1965/2022 | 11/16/2018 |
| Shasta Crossroads | Redding, CA | — | 9,598 | 18,643 | (2,455) | | 8,462 | 17,324 | 25,786 | 3,498 | 1989/2016 | 11/16/2018 |
| Milan Plaza | Milan, MI | — | 925 | 1,974 | 329 | | 1,064 | 2,164 | 3,228 | 1,396 | 1960/2018 | 11/16/2018 |
| Hilander Village | Roscoe, IL | — | 2,571 | 7,461 | 2,329 | | 2,667 | 9,694 | 12,361 | 3,284 | 1994/2022 | 11/16/2018 |
| Laguna 99 Plaza | Elk Grove, CA | — | 5,422 | 16,952 | 247 | | 5,444 | 17,177 | 22,621 | 4,000 | 1992/2015 | 11/16/2018 |
| Southfield Center | St. Louis, MO | — | 5,612 | 13,643 | 1,929 | | 6,535 | 14,649 | 21,184 | 4,074 | 1987/2021 | 11/16/2018 |
| Waterford Park Plaza | Plymouth, MN | — | 4,935 | 19,543 | 417 | | 5,149 | 19,746 | 24,895 | 5,032 | 1989/2023 | 11/16/2018 |
| Colonial Promenade | Winter Haven, FL | — | 12,403 | 22,097 | 893 | | 12,464 | 22,929 | 35,393 | 6,858 | 1986/2008 | 11/16/2018 |
| Willimantic Plaza | Willimantic, CT | — | 3,596 | 8,859 | 388 | | 3,792 | 9,051 | 12,843 | 3,432 | 1968/2024 | 11/16/2018 |
| Quivira Crossings | Overland Park, KS | — | 7,512 | 10,729 | 1,684 | | 8,251 | 11,674 | 19,925 | 3,870 | 1996/2015 | 11/16/2018 |
| Spivey Junction | Stockbridge, GA | — | 4,083 | 10,414 | 238 | | 4,204 | 10,531 | 14,735 | 2,768 | 1998 | 11/16/2018 |
| Plaza Farmington | Farmington, NM | — | 6,322 | 9,619 | 485 | | 6,711 | 9,715 | 16,426 | 2,874 | 2004 | 11/16/2018 |
| Harvest Plaza | Akron, OH | — | 2,693 | 6,083 | 282 | | 2,865 | 6,193 | 9,058 | 1,803 | 1974/2015 | 11/16/2018 |
| Oakhurst Plaza | Seminole, FL | — | 2,782 | 4,506 | 540 | | 2,974 | 4,854 | 7,828 | 1,569 | 1974/2001 | 11/16/2018 |
| Old Alabama Square | Johns Creek, GA | — | 10,782 | 17,359 | 1,446 | | 10,885 | 18,702 | 29,587 | 4,503 | 2000 | 11/16/2018 |
| North Point Landing | Modesto, CA | 20,061 | 8,040 | 28,422 | 1,186 | | 8,230 | 29,418 | 37,648 | 6,453 | 1964/2008 | 11/16/2018 |
| Glenwood Crossing | Cincinnati, OH | — | 4,581 | 3,922 | 178 | | 4,607 | 4,074 | 8,681 | 1,803 | 1999/2015 | 11/16/2018 |
| Rosewick Crossing | La Plata, MD | — | 8,252 | 23,507 | 1,006 | | 8,360 | 24,405 | 32,765 | 5,742 | 2008 | 11/16/2018 |
| Vineyard Center | Templeton, CA | 4,943 | 1,753 | 6,406 | 202 | | 1,796 | 6,565 | 8,361 | 1,473 | 2007 | 11/16/2018 |
| Ocean Breeze Plaza | Ocean Breeze, FL | — | 6,416 | 9,986 | 951 | | 6,513 | 10,840 | 17,353 | 2,941 | 1993/2010 | 11/16/2018 |
| Central Valley Marketplace | Ceres, CA | 15,526 | 6,163 | 17,535 | 83 | | 6,180 | 17,601 | 23,781 | 4,019 | 2005 | 11/16/2018 |
| 51st & Olive Square | Glendale, AZ | — | 2,236 | 9,038 | 480 | | 2,593 | 9,161 | 11,754 | 2,448 | 1975/2007 | 11/16/2018 |
| West Acres Shopping Center | Fresno, CA | — | 4,866 | 5,627 | 635 | | 5,091 | 6,037 | 11,128 | 2,556 | 1990/2015 | 11/16/2018 |
| Meadows on the Parkway | Boulder, CO | — | 23,953 | 32,744 | 1,800 | | 24,340 | 34,157 | 58,497 | 7,840 | 1989 | 11/16/2018 |
| Wyandotte Plaza | Kansas City, KS | — | 5,204 | 17,566 | 774 | | 5,343 | 18,201 | 23,544 | 4,394 | 1961/2015 | 11/16/2018 |
| Broadlands Marketplace | Broomfield, CO | — | 7,434 | 9,459 | 1,125 | | 8,002 | 10,016 | 18,018 | 2,921 | 2002 | 11/16/2018 |
| Village Center | Racine, WI | — | 6,051 | 26,473 | 1,211 | | 6,253 | 27,482 | 33,735 | 7,205 | 2002/2021 | 11/16/2018 |
| Shoregate Town Center | Willowick, OH | — | 7,152 | 16,282 | 6,979 | | 7,386 | 23,027 | 30,413 | 7,508 | 1958/2022 | 11/16/2018 |
| Plano Market Street | Plano, TX | — | 14,837 | 33,178 | 1,973 | | 15,166 | 34,822 | 49,988 | 7,640 | 2009 | 11/16/2018 |
| Island Walk Shopping Center | Fernandina Beach, FL | — | 8,190 | 19,992 | 1,301 | | 8,297 | 21,186 | 29,483 | 5,758 | 1987/2012 | 11/16/2018 |
| Normandale Village | Bloomington, MN | 10,777 | 8,390 | 11,407 | 2,113 | | 8,977 | 12,933 | 21,910 | 4,996 | 1973/2017 | 11/16/2018 |
| | | | | | | | | | | |
| PHILLIPS EDISON & COMPANY DECEMBER 31, 2023 FORM 10-K | | | F-38 |
| | | | | | | | | | | | | | | | | | | | | | | | | | | | | | | | | | | | | | |
| SCHEDULE III—REAL ESTATE ASSETS AND ACCUMULATED DEPRECIATION |
| December 31, 2020 |
| (in thousands) |
| | | Initial Cost | Costs Capitalized Subsequent to Acquisition(2) | | Gross Amount Carried at End of Period(3) | | | |
| Property Name | City, State | Encumbrances(1) | Land and Improvements | Buildings and Improvements | | Land and Improvements | Buildings and Improvements | Total | Accumulated Depreciation | Date Constructed/ Renovated | Date Acquired |
| Kipling Marketplace | Littleton, CO | 0 | 4,020 | 10,405 | 215 | | 4,056 | 10,584 | 14,640 | 1,289 | 1983/2009 | 11/16/2018 |
| MetroWest Village | Orlando, FL | 0 | 6,841 | 15,333 | 321 | | 6,933 | 15,561 | 22,495 | 1,608 | 1990 | 11/16/2018 |
| Spring Cypress Village | Houston, TX | 0 | 9,579 | 14,567 | 465 | | 9,724 | 14,888 | 24,612 | 1,574 | 1982/2007 | 11/16/2018 |
| Commonwealth Square | Folsom, CA | 5,932 | 9,955 | 12,586 | 423 | | 9,973 | 12,991 | 22,964 | 2,000 | 1987 | 11/16/2018 |
| Point Loomis | Milwaukee, WI | 0 | 4,171 | 4,901 | 106 | | 4,171 | 5,007 | 9,177 | 1,183 | 1965/1991 | 11/16/2018 |
| Shasta Crossroads | Redding, CA | 0 | 9,598 | 18,643 | (3,907) | | 8,330 | 16,004 | 24,334 | 1,260 | 1989/2016 | 11/16/2018 |
| Milan Plaza | Milan, MI | 0 | 925 | 1,974 | 180 | | 930 | 2,149 | 3,079 | 762 | 1960/1975 | 11/16/2018 |
| Hilander Village | Roscoe, IL | 0 | 2,571 | 7,461 | 537 | | 2,638 | 7,931 | 10,568 | 1,377 | 1994 | 11/16/2018 |
| Laguna 99 Plaza | Elk Grove, CA | 0 | 5,422 | 16,952 | 136 | | 5,429 | 17,080 | 22,509 | 1,640 | 1992 | 11/16/2018 |
| Southfield Center | St. Louis, MO | 0 | 5,612 | 13,643 | 872 | | 5,866 | 14,261 | 20,127 | 1,614 | 1987 | 11/16/2018 |
| Waterford Park Plaza | Plymouth, MN | 0 | 4,935 | 19,543 | 150 | | 4,971 | 19,657 | 24,628 | 2,062 | 1989 | 11/16/2018 |
| Colonial Promenade | Winter Haven, FL | 0 | 12,403 | 22,097 | 286 | | 12,436 | 22,350 | 34,786 | 2,773 | 1986/2008 | 11/16/2018 |
| Willimantic Plaza | Willimantic, CT | 0 | 3,596 | 8,859 | 53 | | 3,613 | 8,895 | 12,508 | 1,426 | 1968/1990 | 11/16/2018 |
| Quivira Crossings | Overland Park, KS | 0 | 7,512 | 10,729 | 775 | | 7,679 | 11,336 | 19,016 | 1,514 | 1996 | 11/16/2018 |
| Spivey Junction | Stockbridge, GA | 0 | 4,083 | 10,414 | 64 | | 4,091 | 10,470 | 14,561 | 1,156 | 1998 | 11/16/2018 |
| Plaza Farmington | Farmington, NM | 0 | 6,322 | 9,619 | 59 | | 6,371 | 9,630 | 16,000 | 1,189 | 2004 | 11/16/2018 |
| Harvest Plaza | Akron, OH | 0 | 2,693 | 6,083 | 58 | | 2,741 | 6,093 | 8,835 | 737 | 1974/2000 | 11/16/2018 |
| Oakhurst Plaza | Seminole, FL | 0 | 2,782 | 4,506 | 268 | | 2,827 | 4,729 | 7,556 | 654 | 1974/2001 | 11/16/2018 |
| Old Alabama Square | Johns Creek, GA | 0 | 10,782 | 17,359 | 961 | | 10,790 | 18,313 | 29,103 | 1,809 | 2000 | 11/16/2018 |
| North Point Landing | Modesto, CA | 20,061 | 8,040 | 28,422 | 426 | | 8,152 | 28,735 | 36,887 | 2,616 | 1964/2008 | 11/16/2018 |
| Glenwood Crossing | Cincinnati, OH | 0 | 4,581 | 3,922 | 69 | | 4,594 | 3,978 | 8,571 | 743 | 1999 | 11/16/2018 |
| Rosewick Crossing | La Plata, MD | 0 | 8,252 | 23,507 | 392 | | 8,284 | 23,866 | 32,150 | 2,321 | 2008 | 11/16/2018 |
| Vineyard Center | Templeton, CA | 5,248 | 1,753 | 6,406 | 43 | | 1,767 | 6,435 | 8,202 | 608 | 2007 | 11/16/2018 |
| Ocean Breeze Plaza | Ocean Breeze, FL | 0 | 6,416 | 9,986 | 532 | | 6,452 | 10,482 | 16,934 | 1,177 | 1993/2010 | 11/16/2018 |
| Central Valley Marketplace | Ceres, CA | 15,526 | 6,163 | 17,535 | 41 | | 6,187 | 17,552 | 23,739 | 1,665 | 2005 | 11/16/2018 |
| 51st & Olive Square | Glendale, AZ | 0 | 2,236 | 9,038 | 80 | | 2,248 | 9,107 | 11,354 | 996 | 1975/2007 | 11/16/2018 |
| West Acres Shopping Center | Fresno, CA | 0 | 4,866 | 5,627 | 307 | | 4,980 | 5,820 | 10,800 | 1,022 | 1990 | 11/16/2018 |
| Meadows on the Parkway | Boulder, CO | 0 | 23,954 | 32,744 | 813 | | 24,072 | 33,440 | 57,512 | 3,141 | 1989 | 11/16/2018 |
| Wyandotte Plaza | Kansas City, KS | 0 | 5,204 | 17,566 | 127 | | 5,240 | 17,657 | 22,896 | 1,749 | 1961/2015 | 11/16/2018 |
| Broadlands Marketplace | Broomfield, CO | 0 | 7,434 | 9,459 | 183 | | 7,538 | 9,538 | 17,076 | 1,140 | 2002 | 11/16/2018 |
| Village Center | Racine, WI | 0 | 6,051 | 26,473 | 422 | | 6,114 | 26,832 | 32,946 | 2,921 | 2002/2003 | 11/16/2018 |
| Shoregate Town Center | Willowick, OH | 0 | 7,152 | 16,282 | 762 | | 7,174 | 17,022 | 24,196 | 3,278 | 1958/2005 | 11/16/2018 |
| Plano Market Street | Plano, TX | 0 | 14,837 | 33,178 | 566 | | 15,099 | 33,482 | 48,581 | 2,997 | 2009 | 11/16/2018 |
| | | | | | | | | | | | | | | | | | | | | | | | | | | | | | | | | | | | | | |
| SCHEDULE III—REAL ESTATE ASSETS AND ACCUMULATED DEPRECIATION |
| December 31, 2023 |
| (in thousands) |
| | | Initial Cost | Costs Capitalized Subsequent to Acquisition(2) | | Gross Amount Carried at End of Period(3) | | | |
| Property Name | City, State | Encumbrances(1) | Land and Improvements | Buildings and Improvements | | Land and Improvements | Buildings and Improvements | Total | Accumulated Depreciation | Date Constructed/ Renovated | Date Acquired |
| North Pointe Plaza | North Charleston, SC | — | 10,232 | 26,348 | 1,393 | | 10,817 | 27,156 | 37,973 | 8,129 | 1989/2022 | 11/16/2018 |
| Palmer Town Center | Easton, PA | — | 7,331 | 23,525 | 1,768 | | 7,390 | 25,234 | 32,624 | 6,113 | 2005 | 11/16/2018 |
| Alico Commons | Fort Myers, FL | — | 4,670 | 16,557 | 638 | | 4,965 | 16,900 | 21,865 | 4,008 | 2009/2020 | 11/16/2018 |
| Windover Square | Melbourne, FL | 11,048 | 4,115 | 13,309 | 472 | | 4,225 | 13,671 | 17,896 | 3,207 | 1984/2010 | 11/16/2018 |
| Rockledge Square | Rockledge, FL | — | 3,477 | 4,469 | 4,208 | | 3,761 | 8,393 | 12,154 | 1,651 | 1985/2022 | 11/16/2018 |
| Fairfield Commons | Lakewood, CO | — | 8,802 | 29,946 | 2,085 | | 8,924 | 31,909 | 40,833 | 6,878 | 1985/2014 | 11/16/2018 |
| Cocoa Commons | Cocoa, FL | — | 4,838 | 8,247 | 1,454 | | 4,915 | 9,624 | 14,539 | 3,177 | 1986/2000 | 11/16/2018 |
| Hamilton Mill Village | Dacula, GA | — | 7,059 | 9,734 | 550 | | 7,193 | 10,150 | 17,343 | 2,918 | 1996/2016 | 11/16/2018 |
| Sheffield Crossing | Sheffield Village, OH | — | 8,841 | 10,232 | 360 | | 9,051 | 10,382 | 19,433 | 3,469 | 1989/2013 | 11/16/2018 |
| The Shoppes at Windmill Place | Batavia, IL | — | 8,186 | 16,005 | 885 | | 8,344 | 16,732 | 25,076 | 4,317 | 1991/1997 | 11/16/2018 |
| Stone Gate Plaza | Crowley, TX | — | 5,261 | 7,007 | 1,260 | | 5,423 | 8,105 | 13,528 | 2,231 | 2003 | 11/16/2018 |
| Everybody's Plaza | Cheshire, CT | — | 2,520 | 10,096 | 683 | | 2,568 | 10,731 | 13,299 | 2,377 | 1960/2014 | 11/16/2018 |
| Lakewood City Center | Lakewood, OH | — | 1,593 | 10,308 | 406 | | 1,685 | 10,622 | 12,307 | 2,331 | 1991/2011 | 11/16/2018 |
| Carriagetown Marketplace | Amesbury, MA | — | 7,084 | 15,492 | 1,107 | | 7,171 | 16,512 | 23,683 | 4,499 | 2000 | 11/16/2018 |
| Crossroads of Shakopee | Shakopee, MN | — | 8,869 | 20,320 | 1,212 | | 9,062 | 21,339 | 30,401 | 6,252 | 1998 | 11/16/2018 |
| Broadway Pavilion | Santa Maria, CA | — | 8,512 | 20,427 | 788 | | 8,591 | 21,136 | 29,727 | 5,311 | 1987 | 11/16/2018 |
| Sanibel Beach Place | Fort Myers, FL | — | 3,918 | 7,043 | 2,441 | | 4,434 | 8,968 | 13,402 | 2,195 | 2003/2022 | 11/16/2018 |
| Shoppes at Glen Lakes | Weeki Wachee, FL | — | 4,662 | 7,473 | 618 | | 4,780 | 7,973 | 12,753 | 2,230 | 2008 | 11/16/2018 |
| Bartow Marketplace | Cartersville, GA | 19,305 | 11,944 | 24,610 | 841 | | 12,080 | 25,315 | 37,395 | 8,851 | 1995 | 11/16/2018 |
| Bloomingdale Hills | Riverview, FL | — | 4,384 | 5,179 | 429 | | 4,479 | 5,513 | 9,992 | 2,212 | 2002/2012 | 11/16/2018 |
| University Plaza | Amherst, NY | — | 6,402 | 9,800 | 1,056 | | 6,452 | 10,806 | 17,258 | 4,128 | 1980/2020 | 11/16/2018 |
| McKinney Market Street | McKinney, TX | 244 | 10,941 | 16,061 | 1,714 | | 11,085 | 17,631 | 28,716 | 5,044 | 2003/2017 | 11/16/2018 |
| Montville Commons | Montville, CT | — | 12,417 | 11,091 | 609 | | 12,549 | 11,568 | 24,117 | 4,183 | 2007 | 11/16/2018 |
| Shaw's Plaza Raynham | Raynham, MA | — | 8,378 | 26,829 | 1,103 | | 8,428 | 27,882 | 36,310 | 7,391 | 1965/2022 | 11/16/2018 |
| Suntree Square | Southlake, TX | — | 6,335 | 15,642 | 671 | | 6,424 | 16,224 | 22,648 | 3,667 | 2000 | 11/16/2018 |
| Green Valley Plaza | Henderson, NV | — | 7,284 | 16,879 | 605 | | 7,358 | 17,410 | 24,768 | 4,292 | 1978/1982 | 11/16/2018 |
| Crosscreek Village | St. Cloud, FL | — | 3,821 | 9,604 | 598 | | 3,984 | 10,039 | 14,023 | 2,731 | 2008 | 11/16/2018 |
| Market Walk | Savannah, GA | — | 20,678 | 31,836 | 3,827 | | 20,919 | 35,422 | 56,341 | 8,675 | 2014/2022 | 11/16/2018 |
| Livonia Plaza | Livonia, MI | — | 4,118 | 17,037 | 870 | | 4,288 | 17,737 | 22,025 | 4,570 | 1988/2014 | 11/16/2018 |
| Franklin Centre | Franklin, WI | — | 6,353 | 5,482 | 615 | | 6,480 | 5,970 | 12,450 | 3,517 | 1994/2018 | 11/16/2018 |
| Plaza 23 | Pompton Plains, NJ | — | 11,412 | 40,145 | 5,648 | | 11,907 | 45,298 | 57,205 | 9,386 | 1963/2021 | 11/16/2018 |
| Shorewood Crossing | Shorewood, IL | — | 9,468 | 20,993 | 2,882 | | 9,651 | 23,692 | 33,343 | 6,388 | 2001/2020 | 11/16/2018 |
| Herndon Place | Fresno, CA | — | 7,148 | 10,071 | (611) | | 6,881 | 9,727 | 16,608 | 2,729 | 2005 | 11/16/2018 |
| Windmill Marketplace | Clovis, CA | — | 2,775 | 7,299 | (170) | | 2,827 | 7,077 | 9,904 | 1,345 | 2001 | 11/16/2018 |
| Riverlakes Village | Bakersfield, CA | — | 8,567 | 15,242 | 2,897 | | 8,950 | 17,756 | 26,706 | 3,964 | 1997/2022 | 11/16/2018 |
| | | | | | | | | | | |
| PHILLIPS EDISON & COMPANY DECEMBER 31, 2023 FORM 10-K | | | F-39 |
| | | | | | | | | | | | | | | | | | | | | | | | | | | | | | | | | | | | | | |
| SCHEDULE III—REAL ESTATE ASSETS AND ACCUMULATED DEPRECIATION |
| December 31, 2020 |
| (in thousands) |
| | | Initial Cost | Costs Capitalized Subsequent to Acquisition(2) | | Gross Amount Carried at End of Period(3) | | | |
| Property Name | City, State | Encumbrances(1) | Land and Improvements | Buildings and Improvements | | Land and Improvements | Buildings and Improvements | Total | Accumulated Depreciation | Date Constructed/ Renovated | Date Acquired |
| Island Walk Shopping Center | Fernandina Beach, FL | 0 | 8,190 | 19,992 | 687 | | 8,267 | 20,602 | 28,869 | 2,358 | 1987/2012 | 11/16/2018 |
| Normandale Village | Bloomington, MN | 11,638 | 8,390 | 11,407 | 898 | | 8,668 | 12,028 | 20,695 | 1,947 | 1973 | 11/16/2018 |
| North Pointe Plaza | North Charleston, SC | 0 | 10,232 | 26,348 | 400 | | 10,474 | 26,506 | 36,980 | 3,377 | 1989 | 11/16/2018 |
| Palmer Town Center | Easton, PA | 0 | 7,331 | 23,525 | 375 | | 7,327 | 23,904 | 31,231 | 2,402 | 2005 | 11/16/2018 |
| Alico Commons | Fort Myers, FL | 0 | 4,670 | 16,557 | 491 | | 4,843 | 16,875 | 21,718 | 1,608 | 2009 | 11/16/2018 |
| Windover Square | Melbourne, FL | 11,048 | 4,115 | 13,309 | 264 | | 4,193 | 13,495 | 17,689 | 1,312 | 1984/2010 | 11/16/2018 |
| Rockledge Square | Rockledge, FL | 0 | 3,477 | 4,469 | 409 | | 3,496 | 4,859 | 8,355 | 918 | 1985 | 11/16/2018 |
| Port St. John Plaza | Port St. John, FL | 0 | 3,305 | 5,636 | (3,444) | | 1,962 | 3,535 | 5,497 | 289 | 1986 | 11/16/2018 |
| Fairfield Commons | Lakewood, CO | 0 | 8,802 | 29,946 | 1,052 | | 8,810 | 30,991 | 39,800 | 2,734 | 1985 | 11/16/2018 |
| Cocoa Commons | Cocoa, FL | 0 | 4,838 | 8,247 | 583 | | 4,851 | 8,817 | 13,668 | 1,271 | 1986 | 11/16/2018 |
| Hamilton Mill Village | Dacula, GA | 0 | 7,059 | 9,734 | 292 | | 7,087 | 9,998 | 17,085 | 1,186 | 1996 | 11/16/2018 |
| Sheffield Crossing | Sheffield Village, OH | 0 | 8,841 | 10,232 | 193 | | 9,026 | 10,240 | 19,266 | 1,411 | 1989 | 11/16/2018 |
| The Shoppes at Windmill Place | Batavia, IL | 0 | 8,186 | 16,005 | 352 | | 8,194 | 16,350 | 24,544 | 1,871 | 1991/1997 | 11/16/2018 |
| Stone Gate Plaza | Crowley, TX | 7,185 | 5,261 | 7,007 | 209 | | 5,269 | 7,207 | 12,477 | 825 | 2003 | 11/16/2018 |
| Everybody's Plaza | Cheshire, CT | 0 | 2,520 | 10,096 | 268 | | 2,539 | 10,345 | 12,884 | 978 | 1960/2005 | 11/16/2018 |
| Lakewood City Center | Lakewood, OH | 0 | 1,593 | 10,308 | 29 | | 1,599 | 10,332 | 11,931 | 923 | 1991 | 11/16/2018 |
| Carriagetown Marketplace | Amesbury, MA | 0 | 7,084 | 15,492 | 488 | | 7,092 | 15,971 | 23,064 | 1,782 | 2000 | 11/16/2018 |
| Crossroads of Shakopee | Shakopee, MN | 0 | 8,869 | 20,320 | 327 | | 8,933 | 20,582 | 29,515 | 2,517 | 1998 | 11/16/2018 |
| Broadway Pavilion | Santa Maria, CA | 0 | 8,512 | 20,427 | 360 | | 8,534 | 20,765 | 29,300 | 2,159 | 1987 | 11/16/2018 |
| Sanibel Beach Place | Fort Myers, FL | 0 | 3,918 | 7,043 | 647 | | 4,014 | 7,594 | 11,608 | 995 | 2003 | 11/16/2018 |
| Shoppes at Glen Lakes | Weeki Wachee, FL | 0 | 3,118 | 7,473 | 431 | | 3,156 | 7,866 | 11,022 | 892 | 2008 | 11/16/2018 |
| Bartow Marketplace | Cartersville, GA | 19,305 | 11,944 | 24,610 | 288 | | 11,968 | 24,874 | 36,841 | 3,706 | 1995 | 11/16/2018 |
| Bloomingdale Hills | Riverview, FL | 0 | 4,384 | 5,179 | 219 | | 4,389 | 5,393 | 9,783 | 867 | 2002/2012 | 11/16/2018 |
| University Plaza | Amherst, NY | 0 | 6,402 | 9,800 | 514 | | 6,410 | 10,306 | 16,716 | 2,336 | 1980/1999 | 11/16/2018 |
| McKinney Market Street | McKinney, TX | 2,236 | 10,941 | 16,061 | 1,467 | | 10,969 | 17,500 | 28,469 | 2,034 | 2003 | 11/16/2018 |
| Montville Commons | Montville, CT | 0 | 12,417 | 11,091 | 489 | | 12,443 | 11,554 | 23,997 | 1,745 | 2007 | 11/16/2018 |
| Shaw's Plaza Raynham | Raynham, MA | 0 | 7,769 | 26,829 | 914 | | 7,789 | 27,724 | 35,512 | 3,027 | 1965/1998 | 11/16/2018 |
| Suntree Square | Southlake, TX | 8,994 | 6,335 | 15,642 | 361 | | 6,350 | 15,988 | 22,338 | 1,625 | 2000 | 11/16/2018 |
| Green Valley Plaza | Henderson, NV | 0 | 7,284 | 16,879 | 221 | | 7,329 | 17,056 | 24,384 | 1,789 | 1978/1982 | 11/16/2018 |
| Crosscreek Village | St. Cloud, FL | 0 | 3,821 | 9,604 | 388 | | 3,859 | 9,953 | 13,813 | 1,099 | 2008 | 11/16/2018 |
| Market Walk | Savannah, GA | 0 | 20,679 | 31,836 | 1,626 | | 20,750 | 33,391 | 54,141 | 3,406 | 2014/2015 | 11/16/2018 |
| Livonia Plaza | Livonia, MI | 0 | 4,118 | 17,037 | 55 | | 4,151 | 17,059 | 21,210 | 1,867 | 1988 | 11/16/2018 |
| Franklin Centre | Franklin, WI | 7,255 | 6,353 | 5,482 | 370 | | 6,357 | 5,849 | 12,206 | 1,491 | 1994/2009 | 11/16/2018 |
| | | | | | | | | | | | | | | | | | | | | | | | | | | | | | | | | | | | | | |
| SCHEDULE III—REAL ESTATE ASSETS AND ACCUMULATED DEPRECIATION |
| December 31, 2023 |
| (in thousands) |
| | | Initial Cost | Costs Capitalized Subsequent to Acquisition(2) | | Gross Amount Carried at End of Period(3) | | | |
| Property Name | City, State | Encumbrances(1) | Land and Improvements | Buildings and Improvements | | Land and Improvements | Buildings and Improvements | Total | Accumulated Depreciation | Date Constructed/ Renovated | Date Acquired |
| Evans Towne Centre | Evans, GA | — | 4,018 | 7,013 | 389 | | 4,145 | 7,275 | 11,420 | 2,134 | 1995/2017 | 11/16/2018 |
| Mansfield Market Center | Mansfield, TX | — | 4,672 | 13,154 | 498 | | 4,851 | 13,473 | 18,324 | 3,074 | 2015 | 11/16/2018 |
| Ormond Beach Mall | Ormond Beach, FL | — | 4,954 | 7,006 | 1,054 | | 5,088 | 7,926 | 13,014 | 2,555 | 1967/2018 | 11/16/2018 |
| Heritage Plaza | Carol Stream, IL | — | 6,205 | 16,507 | 939 | | 6,320 | 17,331 | 23,651 | 4,320 | 1988/2018 | 11/16/2018 |
| Mountain Crossing | Dacula, GA | 2,794 | 6,602 | 6,835 | 37 | | 6,303 | 7,171 | 13,474 | 2,081 | 1997 | 11/16/2018 |
| Seville Commons | Arlington, TX | — | 4,689 | 12,602 | 1,025 | | 4,859 | 13,457 | 18,316 | 3,327 | 1987/2022 | 11/16/2018 |
| Cinco Ranch at Market Center | Katy, TX | — | 5,553 | 14,063 | 645 | | 5,711 | 14,550 | 20,261 | 3,299 | 2007/2023 | 12/12/2018 |
| Naperville Crossings | Naperville, IL | 25,380 | 15,765 | 30,881 | 4,474 | | 16,612 | 34,508 | 51,120 | 8,545 | 2007/2021 | 4/26/2019 |
| Orange Grove Shopping Center | North Fort Myers, FL | — | 2,637 | 7,340 | 571 | | 3,124 | 7,424 | 10,548 | 1,798 | 1999 | 10/31/2019 |
| Sudbury Crossing | Sudbury, MA | — | 6,483 | 12,933 | 5,931 | | 6,516 | 18,831 | 25,347 | 2,752 | 1984/2021 | 10/31/2019 |
| Ashburn Farm Market Center | Ashburn, VA | — | 14,035 | 16,648 | 555 | | 14,090 | 17,148 | 31,238 | 3,394 | 2000 | 10/31/2019 |
| Alameda Crossing | Avondale, AZ | — | 7,785 | 19,875 | 4,903 | | 8,074 | 24,489 | 32,563 | 6,155 | 2005/2021 | 11/16/2019 |
| Del Paso Marketplace | Sacramento, CA | — | 5,722 | 12,242 | 1,345 | | 6,102 | 13,207 | 19,309 | 2,562 | 2006/2016 | 12/12/2019 |
| Hickory Flat Commons | Canton, GA | — | 6,976 | 11,786 | 1,030 | | 7,389 | 12,403 | 19,792 | 2,677 | 2008/2020 | 8/17/2020 |
| Roxborough Marketplace | Littleton, CO | — | 4,105 | 12,668 | 2,193 | | 4,753 | 14,213 | 18,966 | 2,270 | 2005/2021 | 10/5/2020 |
| Cinco Ranch Station II | Katy, TX | — | 1,045 | — | 2,742 | | 1,051 | 2,736 | 3,787 | 109 | 2023 | 1/26/2021 |
| West Village Center | Chanhassen, MN | — | 10,860 | 11,281 | 1,552 | | 11,268 | 12,425 | 23,693 | 2,071 | 1994/2021 | 2/4/2021 |
| Hickory Creek Plaza | Denton, TX | — | 5,370 | 2,710 | 324 | | 5,542 | 2,862 | 8,404 | 561 | 2007 | 2/25/2021 |
| Foxridge Plaza | Centennial, CO | — | 3,740 | 11,636 | 1,664 | | 4,465 | 12,575 | 17,040 | 1,381 | 1983/2022 | 8/20/2021 |
| Valrico Commons | Valrico, FL | — | 7,522 | 26,480 | 896 | | 8,113 | 26,785 | 34,898 | 2,560 | 1986/2021 | 8/25/2021 |
| Market Place at Pabst Farms | Oconomowoc, WI | — | 6,204 | 17,199 | 421 | | 6,519 | 17,305 | 23,824 | 1,972 | 2005/2020 | 10/13/2021 |
| Arapahoe Marketplace | Greenwood Village, CO | — | 13,779 | 49,330 | 1,756 | | 14,870 | 49,995 | 64,865 | 4,428 | 1977/2022 | 10/19/2021 |
| Loganville Town Center | Loganville, GA | — | 5,309 | 7,920 | 2,170 | | 5,447 | 9,952 | 15,399 | 2,447 | 1997/2023 | 11/5/2021 |
| Town & Country Village | Sacramento, CA | — | 21,894 | 35,793 | 2,106 | | 22,199 | 37,594 | 59,793 | 3,468 | 1950/2022 | 11/12/2021 |
| Sprouts Plaza | Las Vegas, NV | — | 5,104 | 22,622 | 1,396 | | 5,472 | 23,650 | 29,122 | 1,951 | 1995/2022 | 12/3/2021 |
| Rainbow Plaza | Las Vegas, NV | — | 7,158 | 30,171 | 1,209 | | 7,897 | 30,641 | 38,538 | 2,574 | 1989/2022 | 12/3/2021 |
| Cascades Overlook | Sterling, VA | — | 16,241 | 41,449 | 1,930 | | 16,442 | 43,178 | 59,620 | 2,838 | 2016 | 1/14/2022 |
| Oak Meadows Marketplace | Georgetown, TX | — | 4,847 | 15,848 | 440 | | 5,047 | 16,088 | 21,135 | 1,038 | 2018 | 2/1/2022 |
| Shoppes at Avalon | Spring Hill, FL | — | 9,184 | 7,740 | 1,061 | | 9,805 | 8,180 | 17,985 | 810 | 2009/2022 | 2/14/2022 |
| Centennial Lakes Plaza | Edina, MN | — | 13,582 | 51,052 | 1,860 | | 13,943 | 52,551 | 66,494 | 2,934 | 1989/2022 | 5/13/2022 |
| Crossroads Towne Center | North Las Vegas, NV | — | 25,226 | 27,638 | 723 | | 25,665 | 27,922 | 53,587 | 3,130 | 2007/2021 | 8/15/2022 |
| Chinoe Center | Lexington, KY | — | 3,841 | 14,001 | 957 | | 4,111 | 14,688 | 18,799 | 1,026 | 1984/2023 | 11/21/2022 |
| | | | | | | | | | | |
| PHILLIPS EDISON & COMPANY DECEMBER 31, 2023 FORM 10-K | | | F-40 |
| | | | | | | | | | | | | | | | | | | | | | | | | | | | | | | | | | | | | | |
| SCHEDULE III—REAL ESTATE ASSETS AND ACCUMULATED DEPRECIATION |
| December 31, 2020 |
| (in thousands) |
| | | Initial Cost | Costs Capitalized Subsequent to Acquisition(2) | | Gross Amount Carried at End of Period(3) | | | |
| Property Name | City, State | Encumbrances(1) | Land and Improvements | Buildings and Improvements | | Land and Improvements | Buildings and Improvements | Total | Accumulated Depreciation | Date Constructed/ Renovated | Date Acquired |
| Plaza 23 | Pompton Plains, NJ | 0 | 11,412 | 40,144 | 868 | | 11,664 | 40,760 | 52,424 | 3,721 | 1963/1997 | 11/16/2018 |
| Shorewood Crossing | Shorewood, IL | 0 | 9,468 | 20,993 | 2,519 | | 9,569 | 23,411 | 32,980 | 2,477 | 2001 | 11/16/2018 |
| Herndon Place | Fresno, CA | 0 | 7,148 | 10,071 | (853) | | 6,808 | 9,559 | 16,367 | 668 | 2005 | 11/16/2018 |
| Windmill Marketplace | Clovis, CA | 0 | 2,775 | 7,299 | (485) | | 2,682 | 6,906 | 9,588 | 321 | 2001 | 11/16/2018 |
| Riverlakes Village | Bakersfield, CA | 13,219 | 8,567 | 15,242 | 523 | | 8,608 | 15,725 | 24,332 | 1,523 | 1997 | 11/16/2018 |
| Bells Fork | Greenville, NC | 0 | 2,846 | 6,455 | (875) | | 2,612 | 5,815 | 8,427 | 0 | 2006 | 11/16/2018 |
| Evans Towne Centre | Evans, GA | 0 | 4,018 | 7,013 | 191 | | 4,058 | 7,163 | 11,222 | 923 | 1995 | 11/16/2018 |
| Mansfield Market Center | Mansfield, TX | 0 | 4,672 | 13,154 | 145 | | 4,678 | 13,292 | 17,971 | 1,241 | 2015 | 11/16/2018 |
| Ormond Beach Mall | Ormond Beach, FL | 0 | 4,954 | 7,006 | 750 | | 5,008 | 7,702 | 12,710 | 1,004 | 1967/2010 | 11/16/2018 |
| Heritage Plaza | Carol Stream, IL | 9,105 | 6,205 | 16,507 | 309 | | 6,243 | 16,778 | 23,022 | 1,718 | 1988 | 11/16/2018 |
| Mountain Crossing | Dacula, GA | 3,736 | 6,602 | 6,835 | 147 | | 6,650 | 6,934 | 13,585 | 897 | 1997 | 11/16/2018 |
| Seville Commons | Arlington, TX | 0 | 4,689 | 12,602 | 858 | | 4,845 | 13,304 | 18,149 | 1,344 | 1987 | 11/16/2018 |
| Loganville Town Center | Loganville, GA | 0 | 4,922 | 6,625 | 299 | | 5,027 | 6,819 | 11,846 | 939 | 1997 | 11/16/2018 |
| Alameda Crossing | Avondale, AZ | 12,894 | 7,785 | 19,875 | 2,148 | | 7,834 | 21,974 | 29,807 | 2,245 | 2005 | 11/16/2018 |
| Cinco Ranch at Market Center | Katy, TX | 0 | 5,553 | 14,063 | 515 | | 5,679 | 14,452 | 20,131 | 1,342 | 2007/2008 | 12/12/2018 |
| Naperville Crossings | Naperville, IL | 25,380 | 15,242 | 30,881 | 2,303 | | 15,852 | 32,574 | 48,426 | 2,883 | 2007/2016 | 4/26/2019 |
| Orange Grove Shopping Center | North Fort Myers, FL | 0 | 2,637 | 7,340 | 269 | | 2,873 | 7,373 | 10,245 | 489 | 1999 | 10/31/2019 |
| Sudbury Crossing | Sudbury, MA | 0 | 6,483 | 12,933 | 129 | | 6,490 | 13,055 | 19,545 | 716 | 1984 | 10/31/2019 |
| Ashburn Farm Market Center | Ashburn, VA | 0 | 14,035 | 16,648 | 19 | | 14,029 | 16,673 | 30,702 | 919 | 2000 | 10/31/2019 |
| Del Paso Marketplace | Sacramento, CA | 0 | 5,722 | 12,242 | 141 | | 5,748 | 12,357 | 18,105 | 637 | 2006 | 12/12/2019 |
| Hickory Flat Commons | Canton, GA | 0 | 6,976 | 11,786 | 586 | | 7,173 | 12,176 | 19,348 | 314 | 2008 | 8/17/2020 |
| Roxborough Marketplace | Littleton, CO | 0 | 4,105 | 12,668 | 190 | | 4,105 | 12,858 | 16,963 | 155 | 2005 | 10/5/2020 |
Northlake Station LLC(5) | Cincinnati, OH | 8,108 | 2,327 | 11,806 | 554 | | 2,526 | 12,161 | 14,687 | 1,760 | 1985 | 10/6/2006 |
Corporate Adjustments(6) | | 0 | 6 | 2,734 | (6,311) | | (1,570) | (2,002) | (3,572) | (11) | | 0 |
| Totals | | $685,022 | $1,519,458 | $3,088,652 | $179,231 | | $1,549,362 | $3,237,986 | $4,787,348 | $695,591 | | |
| | | | | | | | | | | | | | | | | | | | | | | | | | | | | | | | | | | | | | |
| SCHEDULE III—REAL ESTATE ASSETS AND ACCUMULATED DEPRECIATION |
| December 31, 2023 |
| (in thousands) |
| | | Initial Cost | Costs Capitalized Subsequent to Acquisition(2) | | Gross Amount Carried at End of Period(3) | | | |
| Property Name | City, State | Encumbrances(1) | Land and Improvements | Buildings and Improvements | | Land and Improvements | Buildings and Improvements | Total | Accumulated Depreciation | Date Constructed/ Renovated | Date Acquired |
| Sunridge Plaza | Rancho Cordova, CA | — | 12,004 | 21,375 | 365 | | 12,261 | 21,483 | 33,744 | 1,080 | 2017 | 12/20/2022 |
| Providence Commons | Mt. Juliet, TN | — | 7,425 | 18,665 | 979 | | 7,652 | 19,417 | 27,069 | 822 | 2009 | 1/19/2023 |
| Village Shoppes at Windermere | Suwanee, GA | 9,754 | 5,747 | 12,698 | 355 | | 5,948 | 12,852 | 18,800 | 497 | 2008 | 3/16/2023 |
| Town Center at Jensen Beach | Jensen Beach, FL | — | 6,042 | 10,731 | 960 | | 6,372 | 11,361 | 17,733 | 636 | 2000 | 3/27/2023 |
| Shops at Sunset Lakes | Miramar, FL | — | 5,872 | 7,775 | 284 | | 6,056 | 7,875 | 13,931 | 467 | 1999 | 3/27/2023 |
| Lake Pointe Market | Rowlett, TX | — | 3,490 | 9,410 | 424 | | 3,764 | 9,560 | 13,324 | 180 | 2002 | 8/16/2023 |
| Contra Loma Station OP L.P. | Antioch, CA | — | 224 | — | 63 | | 224 | 63 | 287 | 21 | - | 8/29/2023 |
| Mansell Village | Roswell, GA | — | 4,470 | 11,624 | — | | 4,470 | 11,624 | 16,094 | 138 | 2003/2013 | 10/30/2023 |
| Riverpark Shopping Center | Sugar Land, TX | — | 24,270 | 49,449 | 5 | | 24,270 | 49,454 | 73,724 | 442 | 2003 | 11/13/2023 |
| Apache Shoppes | Rochester, MN | — | 1,807 | 3,709 | — | | 1,807 | 3,709 | 5,516 | 37 | 2005 | 12/4/2023 |
| Maple View | Grayslake, IL | — | 5,256 | 9,767 | — | | 5,256 | 9,767 | 15,023 | 55 | 1999 | 12/4/2023 |
| Maple View | Grayslake, IL | — | 1,621 | 3,307 | — | | 1,621 | 3,307 | 4,928 | 14 | 1999 | 12/4/2023 |
| Quail Pointe | Fair Oaks, CA | — | 7,492 | 33,594 | — | | 7,492 | 33,594 | 41,086 | 103 | 1987 | 12/5/2023 |
| Glenbrook Marketplace | Glenview, IL | — | 3,152 | 8,807 | — | | 3,152 | 8,807 | 11,959 | 34 | 1992/2014 | 12/11/2023 |
Northlake Station LLC(5) | Cincinnati, OH | — | 2,327 | 11,806 | 1,663 | | 2,763 | 13,033 | 15,796 | 3,264 | 1985 | 10/6/2006 |
Corporate Adjustments(6) | | — | 6 | 2,734 | (5,301) | | (3,580) | 1,019 | (2,561) | 1,143 | | |
| Totals | | $490,677 | $1,685,276 | $3,458,965 | $442,430 | | $1,768,487 | $3,818,184 | $5,586,671 | $1,186,630 | | |
(1)Encumbrances do not include our finance leases.
(2)Reductions to costs capitalized subsequent to acquisition are generally attributable to parcels/outparcels sold, impairments, and assets held-for-sale.
(3)The aggregate basis of properties for federal income tax purposes is approximately $4.8$5.5 billion at December 31, 2020.2023.
(4)The main shopping center at this location was sold and we currently only own an outparcel.
(5)Amounts consist of corporate building and land.
(6)Amounts consist of elimination of intercompany construction management fees charged by the property manager to the real estate assets.
| | | | | | | | | | | |
| PHILLIPS EDISON & COMPANY DECEMBER 31, 2023 FORM 10-K | | | F-41 |
Reconciliation of real estate assets at cost:
| | | | 2020 | | 2019 | | 2023 | | 2022 |
| Balance at January 1 | Balance at January 1 | $ | 4,749,324 | | | $ | 4,848,483 | |
| Additions during the year: | Additions during the year: | |
| Real estate acquisitions | Real estate acquisitions | 39,879 | | | 126,378 | |
| Real estate acquisitions | |
| Real estate acquisitions | |
| Net additions to/improvements of real estate | Net additions to/improvements of real estate | 57,700 | | | 79,396 | |
| Adoption of ASC 842 | 0 | | | 4,707 | |
| Deductions during the year: | Deductions during the year: | |
| Real estate dispositions | Real estate dispositions | (54,188) | | | (185,468) | |
| Real estate dispositions | |
| Real estate dispositions | |
| Impairment of real estate | Impairment of real estate | (5,367) | | | (118,725) | |
| Real estate held for sale | 0 | | | (5,447) | |
| Balance at December 31 | Balance at December 31 | $ | 4,787,348 | | | $ | 4,749,324 | |
Reconciliation of accumulated depreciation:
| | | | 2020 | | 2019 | | 2023 | | 2022 |
| Balance at January 1 | Balance at January 1 | $ | 526,309 | | | $ | 393,970 | |
| Additions during the year: | Additions during the year: | |
| Depreciation expense | Depreciation expense | 177,860 | | | 183,535 | |
| Depreciation expense | |
| Depreciation expense | |
| Deductions during the year: | Deductions during the year: | |
| Accumulated depreciation of real estate dispositions | Accumulated depreciation of real estate dispositions | (5,568) | | | (17,444) | |
| Accumulated depreciation of real estate dispositions | |
| Accumulated depreciation of real estate dispositions | |
| Impairment of real estate | Impairment of real estate | (3,010) | | | (33,126) | |
| Accumulated depreciation of real estate held for sale | 0 | | | (626) | |
| Balance at December 31 | Balance at December 31 | $ | 695,591 | | | $ | 526,309 | |
* * * * *
| | | | | | | | | | | |
| PHILLIPS EDISON & COMPANY DECEMBER 31, 2023 FORM 10-K | | | F-42 |
SIGNATURES
Pursuant to the requirements of Section 13 or 15(d) of the Securities Exchange Act of 1934, the registrant has duly caused this report to be signed on its behalf by the undersigned, thereunto duly authorized this 12th day of March 2021.February 2024.
| | | | | | | | |
| PHILLIPS EDISON & COMPANY, INC. |
| | |
| By: | /s/ JEFFREY S. EDISON |
| | Jeffrey S. Edison |
| | Chairman of the Board and Chief Executive Officer |
Pursuant to the requirements of the Securities Exchange Act of 1934, this report has been signed by the following persons on behalf of the registrant and in the capacities and on the dates indicated.
| | | | | | | | | | | | | | |
| Signature | | Title | | Date |
| | | | | |
/s/S/ JEFFREY S. EDISON | | Chairman of the Board and Chief Executive Officer (Principal Executive Officer) | | MarchFebruary 12, 20212024 |
| Jeffrey S. Edison | | | | |
| | | | |
/s/S/ JOHN P. CAULFIELD | | Executive Vice President, Chief Financial Officer, Senior Vice President, and Treasurer (Principal Financial Officer) | | MarchFebruary 12, 20212024 |
| John P. Caulfield | | | | |
| | | | |
/s/S/ JENNIFER L. ROBISON | | Senior Vice President and Chief Accounting Officer and Senior Vice President (Principal Accounting Officer) | | MarchFebruary 12, 20212024 |
| Jennifer L. Robison | | | | |
| | | | |
/s/S/ LESLIE T. CHAO | | Director | | MarchFebruary 12, 20212024 |
| Leslie T. Chao | | | | |
| | | | |
/s/S/ ELIZABETH FISCHER | | Director | | MarchFebruary 12, 20212024 |
| Elizabeth Fischer | | | | |
| | | | |
/s/ PAUL J. MASSEY, JR. | | Director | | March 12, 2021 |
Paul J. Massey, Jr. | | | | |
| | | | |
/s/S/ STEPHEN R. QUAZZO | | Director | | MarchFebruary 12, 20212024 |
| Stephen R. Quazzo | | | | |
| | | | |
/s/S/ JANE SILFEN | | Director | | MarchFebruary 12, 20212024 |
| Jane Silfen | | | | |
| | | | |
/s/S/ JOHN A. STRONG | | Director | | MarchFebruary 12, 20212024 |
| John A. Strong | | | | |
| | | | |
| /S/ ANTHONY TERRY | | Director | | | February 12, 2024 |
| Anthony Terry | | | | |
| | | | |
/s/S/ PARILEE EDISON WANG | | Director | | February 12, 2024 |
| Parilee Edison Wang | | | | |
| | | | |
| /S/ GREGORY S. WOOD | | Director | | MarchFebruary 12, 20212024 |
| Gregory S. Wood | | | | |
| | | | |